Attached files
| file | filename |
|---|---|
| EX-32 - EXHIBIT 32 CEO & CFO - Perma-Pipe International Holdings, Inc. | exhibit3210k2016.htm |
| EX-23 - EXHIBIT 23 CONSENT - Perma-Pipe International Holdings, Inc. | exhibit23consent10k2016.htm |
| EX-10.(N) - EXHIBIT 10.(N) 3RD AMENDMENT FOR BMO - Perma-Pipe International Holdings, Inc. | exhibit103rdamendmenttobmo.htm |
| EX-21 - EXHIBIT 21 SUBSIDIARIES - Perma-Pipe International Holdings, Inc. | exhibit21subsidiaries10k20.htm |
| EX-24 - EXHIBIT 24 POWER OF ATTORNEY - Perma-Pipe International Holdings, Inc. | exhibit24powerofattorney10.htm |
| EX-31.1 - EXHIBIT 31.1 CEO - Perma-Pipe International Holdings, Inc. | exhibit31110k2016.htm |
| EX-31.2 - EXHIBIT 31.2 CFO - Perma-Pipe International Holdings, Inc. | exhibit31210k2016.htm |
UNITED STATES
SECURITIES AND EXCHANGE COMMISSION
Washington, D.C. 20549
FORM 10-K
x | ANNUAL REPORT PURSUANT TO SECTION 13 OR 15(d) OF THE SECURITIES EXCHANGE ACT OF 1934 |
For the fiscal year ended January 31, 2016
Commission File No. 0-18370
MFRI, Inc.
(Exact name of registrant as specified in its charter)

Delaware | 36-3922969 |
(State or other jurisdiction of incorporation or organization) | (I.R.S. Employer Identification No.) |
7720 N. Lehigh Avenue, Niles, Illinois | 60714 |
(Address of principal executive offices) | (Zip Code) |
(847) 966-1000
(Registrant's telephone number, including area code)
Securities registered pursuant to Section 12(b) of the Act:
Title of each class | Name of each exchange on which registered |
Common Stock, $.01 per share | The NASDAQ Stock Market LLC |
Securities registered pursuant to Section 12(g) of the Act: None
Indicate by check mark if the registrant is a well-known seasoned issuer, as defined in Rule 405 of the Securities Act. Yes o No x
Indicate by check mark if the registrant is not required to file reports pursuant to Section 13 or Section 15(d) of the Act. Yes o No x
Indicate by check mark whether the registrant (1) has filed all reports required to be filed by Section 13 or 15(d) of the Securities Exchange Act of 1934 during the preceding 12 months (or for such shorter period that the registrant was required to file such reports) and (2) has been subject to such filing requirements for the past 90 days. Yes o No x
Indicate by check mark whether the registrant has submitted electronically and posted on its corporate website, if any, every Interactive Data File required to be submitted and posted pursuant to Rule 405 of Regulation S-T (§232.405 of this chapter) during the preceding 12 months (or for such shorter period that the registrant was required to submit and post such files).
Yes x No o
Indicate by check mark if disclosure of delinquent filers pursuant to Item 405 of Regulation S-K (§229.405) is not contained herein and will not be contained, to the best of registrant's knowledge, in definitive proxy or information statements incorporated by reference in Part III of this Form 10-K or any amendment to this Form 10-K. o
Indicate by check mark whether the registrant is a large accelerated filer, an accelerated filer, a non-accelerated filer, or a smaller reporting company. See the definitions of "large accelerated filer", "accelerated filer", and "smaller reporting company" in Rule 12b-2 of the Exchange Act. (Check one): Large accelerated filer o Accelerated filer o Non-accelerated filer o Smaller reporting company x
Indicate by check mark whether the Registrant is a shell company (as defined in Rule 12b-2 of the Act) Yes o No x
The aggregate market value of the voting and non-voting common equity held by non-affiliates of the registrant (the exclusion of the market value of the shares owned by any person shall not be deemed an admission by the registrant that such person is an affiliate of the registrant) was $35,417,613 based on the closing sale price of $5.61 per share as reported on the NASDAQ Global Market on July 31, 2015.
The number of shares of the registrant's common stock outstanding at April 22, 2016 was 7,403,958.
DOCUMENTS INCORPORATED BY REFERENCE
Portions of the definitive proxy statement for the 2016 Annual Meeting of Stockholders are incorporated by reference in Part III.
MFRI, Inc.
FORM 10-K
For the fiscal period ended January 31, 2016
TABLE OF CONTENTS
Item | Page | |
1. | 1 | |
2 | ||
Filtration Products | 4 | |
4 | ||
4 | ||
5 | ||
1A. | 5 | |
1B. | 8 | |
2. | 9 | |
3. | 9 | |
4. | 9 | |
5. | 10 | |
6. | 11 | |
7. | 11 | |
7A. | 18 | |
8. | 18 | |
9. | 18 | |
9A. | 18 | |
9B. | 20 | |
10. | Directors, Executive Officers and Corporate Governance | 20 |
11. | Executive Compensation | 20 |
12. | Security Ownership of Certain Beneficial Owners and Management and Related Stockholder Matters | 20 |
13. | Certain Relationships and Related Transactions, and Director Independence | 20 |
14. | Principal Accounting Fees and Services | 20 |
15. | 20 | |
21 | ||
54 | ||
PART I
Forward Looking Statements
Statements in this Form 10-K that are not historical facts, so-called "forward-looking statements," are made pursuant to the safe harbor provisions of the Private Securities Litigation Reform Act of 1995. Investors are cautioned that all forward-looking statements involve risks and uncertainties, including those detailed in MFRI's filings with the Securities and Exchange Commission ("SEC"). See "Risk Factors" in Item 1A.
Available Information
The Company files with and furnishes to the SEC, reports including annual meeting materials, Annual Reports on Form 10-K, quarterly reports on Form 10-Q and current reports on Form 8-K, as well as amendments thereto. The Company maintains a website, www.mfri.com, where these reports and related materials are available free of charge as soon as reasonably practicable after the Company electronically delivers such material to the SEC. The information on the Company's website is not part of this Annual Report on Form 10-K and is not incorporated into this or any other filings by the Company with the SEC.
Item 1. BUSINESS
As of January 31, 2016, MFRI, Inc., collectively with its subsidiaries ("MFRI", "Company" or "Registrant"), is engaged in the manufacture and sale of products in one reportable segment: Piping Systems. As described below, prior to January 29, 2016, the Company was also engaged in the manufacture and sale of products in the Filtration Products segment. The Company's fiscal year ends on January 31. Years and balances described as 2015 and 2014 are the fiscal years ended January 31, 2016 and 2015, respectively.
In January 2016, the Company took a series of actions designed to refocus its business portfolio and cost structure to enhance the Company’s overall performance. These actions included the sale of MFRI’s domestic and international filtration businesses, including TDC Filter Manufacturing, Inc., Nordic Air Filtration, A/S and related assets, and the planned sale of the domestic fabric filter business in Winchester, Virginia. The sales follow a competitive bidding process that MFRI initiated as part of this program.
In addition to paying down debt, the sale of the filtration business will give the Company the opportunity to focus resources on new Piping Systems growth opportunities such as the recent acquisition of 100% ownership of Bayou Perma-Pipe Canada, Ltd. ("BPPC"), which the Company believes creates a strong platform to diversify and expand Perma-Pipe Inc’s ("Perma-Pipe") business into new markets and geographies.
In connection with its strategic repositioning, the Company:
• | On January 29, 2016, sold certain assets and liabilities of its TDC Filter business based in Bolingbrook, Illinois for approximately $11 million, subject to certain post-closing adjustments, to the Industrial Air division of CLARCOR, a NYSE-listed company based in Franklin, Tennessee. CLARCOR is a leading diversified marketer and manufacturer of mobile, industrial and environmental filtration products. As a part of this program, MFRI plans to sell the 100,000 square foot TDC manufacturing and office facility in Bolingbrook, Illinois. |
• | On January 29, 2016, sold its Nordic Air Filtration, Denmark and Nordic Air Filtration, Middle East businesses, for approximately $11 million, on a debt/cash free basis, subject to certain post-closing adjustments, to Hengst Holding GmbH. Hengst is a leading specialist in filtration and filtration management and an international development partner and OEM supplier for all major automobile manufacturers. |
• | Is reorganizing the Company’s corporate staff and reducing expenses to reflect its new strategic focus and structure. The restructuring is expected to yield annualized savings of approximately $1.2 million. |
1
At January 31, 2016, one customer accounted for 10.3% of the Company's net sales. At January 31, 2015, one customer accounted for 17.2% of the Company's net sales.
Two customers accounted for 46.4% of accounts receivable at January 31, 2016, and one customer accounted for 37.4% of accounts receivable at January 31, 2015. As of April 1, 2016, these customers have paid 40.4% of their receivables outstanding at January 31, 2016.
MFRI, Inc.'s Operating Units
Perma-Pipe, Inc. | |
Niles, IL | |
New Iberia, LA | |
Lebanon, TN | |
Perma-Pipe Middle East FZC | |
Fujarah, United Arab Emirates | |
Perma-Pipe Saudi Arabia, LLC | |
Dammam, Kingdom of Saudi Arabia | |
Bayou Perma-Pipe Canada, Ltd. | |
Camrose, Alberta, Canada | |
Perma-Pipe India Pvt. Ltd | |
Gandidham, India | |
All operating units shown are, directly or indirectly, wholly owned by MFRI except BPPC, which was owned 49% by MFRI and 51% by an unrelated party until February 4, 2016 when MFRI purchased the remaining shares and became the sole owner.
Piping Systems
Products and services. The Company engineers, designs, manufactures and sells specialty piping and leak detection and location systems. Piping Systems include (i) industrial and secondary containment piping systems for transporting chemicals, hazardous fluids and petroleum products, (ii) insulated and jacketed district heating and cooling ("DHC") piping systems for efficient energy distribution to multiple locations from central energy plants, (iii) subsea oil and gas gathering flow and (iv) above ground long lines for oil and mineral transportation. The leak detection and location systems are sold with some of its piping systems and also on a stand-alone basis to monitor areas where fluid intrusion may contaminate the environment, endanger personal safety, cause a fire hazard, impair essential services or damage equipment or property.
Piping Systems frequently engineers and custom fabricates to job site dimensions and incorporates provisions for thermal expansion due to varying temperatures. This custom fabrication helps to minimize the amount of field labor required by the installation contractor. Most of the piping systems are produced for underground installations and, therefore, require trenching, which is the responsibility of the general contractor, and done by unaffiliated installation contractors.
The Piping Systems segment is based on large discrete projects, and domestic Piping Systems is seasonal. See "Management's Discussion and Analysis of Financial Condition and Results of Operations ("MD&A") - Piping Systems."
2
Recent developments. On December 31, 2015, MFRI entered into a purchase agreement with its joint venture partner Aegion Corporation to acquire 100% ownership of BPPC, a coating and insulation company in Camrose, Alberta, which acquisition closed on February 4, 2016. MFRI had owned a 49% interest in BPPC since 2009, when the joint venture was formed with Aegion to serve the oil and gas industry in Western Canada.
The purchase price was approximately $9.6 million in cash and debt at closing and is subject to certain post-closing adjustments.
Customers. The customer base is industrially and geographically diverse. In the United States of America ("U.S."), the Company employs national and regional sales managers who use and assist a network of independent manufacturers' representatives, none of whom sells products that are competitive with the Company's Piping Systems. The Company employs a direct sales force as well as an exclusive agent network for several countries in the Middle and Far East to market and sell products and services.
Intellectual property. The Company owns several patents covering its piping and electronic leak detection systems. The patents are not material either individually or in the aggregate overall, because the Company believes sales would not be materially reduced if patent protection were not available. The Company owns numerous trademarks connected with its piping and leak detection systems including the following U.S. trademarks: Perma-Pipe®, Chil-Gard®, Double Quik®, Escon-A®, FluidWatch®, Galva-Gard®, Polytherm®, Pal-AT®, Stereo-Heat®, LiquidWatch®, PalCom®, Xtru-therm®, Auto-Therm®, Pex-Gard®, Multi-Therm®, Ultra-Therm®, Cryo-Gard®, Sleeve-Gard®, Electro-Gard® and Sulphur-Therm™. The Company also owns a number of trademarks throughout the world. Some of the Company's more significant trademarks include: Auto-Therm®, Cryo-Gard®, Electro-Gard®, Sleeve-Gard®, Permalert®, Pal-AT®, Perma-Pipe®, Polytherm®, Ric-Wil®, and Xtru-therm®.
Raw materials. Basic raw materials used in production are pipes and tubes made of carbon steel, alloy, copper, ductile iron, plastics and various chemicals such as polyols, isocyanate, urethane resin, polyethylene and fiberglass, mostly purchased in bulk quantities. The Company believes there are currently adequate supplies and sources of availability of these needed raw materials.
The sensor cables used in the leak detection and location systems are manufactured to the Company's specifications by companies regularly engaged in manufacturing such cables. The Company owns patents for some of the features of its sensor cables. The Company assembles the monitoring component of the leak detection and location systems from components purchased from many sources.
Competition. Piping Systems is highly competitive and believes its principal competition consists of between ten and twenty major competitors and more small competitors. The Company believes quality, service, a comprehensive product line and price are key competitive factors. The Company also believes it has a more comprehensive line for DHC than any competitor. Some competitors have greater financial resources and cost advantages as a result of manufacturing a limited range of products.
Government regulation. The demand for the Company's leak detection and location systems and secondary containment piping systems, a small percentage of the total annual piping sales, is driven by federal and state environmental regulation with respect to hazardous waste. The Federal Resource Conservation and Recovery Act requires, in some cases, that the storage, handling and transportation of fluids through underground pipelines feature secondary containment and leak detection. The National Emission Standard for hydrocarbon airborne particulates requires reduction of airborne volatile organic compounds and fugitive emissions. Under this regulation, many major refineries are required to recover fugitive vapors and dispose of the recovered material in a process sewer system, which then becomes a hazardous secondary waste system that must be contained. Although there can be no assurances as to the ultimate effects of these governmental regulations, the Company believes such regulations may increase the demand for its Piping Systems products.
3
Filtration Products
Products and services. Prior to January 29, 2016, the Company manufactured and sold a wide variety of filter elements for cartridge collectors and baghouse air filtration and particulate collection systems. The principal types of industrial air filtration and particulate collection systems in use are baghouses, cartridge collectors, electrostatic precipitators, scrubbers and mechanical collectors. This equipment is used to eliminate particulates from the air by passing particulate laden gases through fabric filters (filter bags) or pleated media filter elements, in the case of baghouses or cartridge collectors, between electrically charged collector plates, in the case of electrostatic precipitators and contact with liquid reagents (scrubbers). The Company manufactured filter elements in standard industry sizes, shapes and filtration media and to custom specifications, maintaining manufacturing standards for more than 10,000 styles of filter elements to suit substantially all industrial applications. Filter elements were manufactured from industrial yarn, fabric and paper purchased in bulk. Most filter elements were produced from cellulose, acrylic, fiberglass, polyester, aramid, laminated membranes, or polypropylene fibers. The Company also manufactured filter elements from more specialized materials, sometimes using special finishes.
The Company marketed numerous filter related products and accessories used during the installation, operation and maintenance of cartridge collectors and baghouses, including wire cages used to support filter bags, spring assemblies for proper tensioning of filter bags and clamps and hanger assemblies for attaching filter elements. In addition, the Company marketed hardware items used in the operation and maintenance of cartridge collectors and baghouses. The Company also provided maintenance services, consisting primarily of air filtration system inspection and filter element replacement, using a network of independent contractors. The Company had particular expertise in supplying filter bags for use with electric arc furnaces in the steel industry. Over the past three years, Filtration Products supplied filter elements to more than 4,000 user locations.
Customers. The customer base was industrially and geographically diverse. These products and services are used primarily by operators of utility and industrial coal-fired boilers, incinerators and cogeneration plants and by producers of metals, cement, chemicals and other industrial products.
Filtration Products were marketed domestically under the names Midwesco Filter and TDC Filter Manufacturing. The Company marketed its U.S. manufactured Filtration Products internationally using domestically based sales resources to target major users in foreign countries. The Denmark filtration facility marketed pleated filter elements under the name Nordic Filtration throughout Europe, Asia and the Middle East, primarily to original equipment manufacturers.
Employees
As of January 31, 2016, the Company had 998 employees, of whom 51% worked outside the U.S.
International
The Company's international operations as of January 31, 2016 include subsidiaries and a joint venture in four foreign countries on two continents. The Company's international operations contributed approximately 48.4% of revenue in 2015 and 43.7% of revenue in 2014.
Refer to the Business descriptions on pages 1 through 4 above and Note 1 - Business and segment information in the Notes to Consolidated Financial Statements for additional information on international activities. International operations are subject to risks inherent in conducting business in foreign countries, including price controls, exchange controls, limitations on participation in local enterprises, nationalization, expropriation and other governmental action, and changes in currency exchange rates.
EXECUTIVE OFFICERS OF THE REGISTRANT
The following table sets forth information regarding the executive officers of the Company as of April 1, 2016:
Name | Offices and positions, if any, held with the Company; age | Executive officer of the Company or its predecessor since |
Bradley E. Mautner | Director, President and Chief Executive Officer; Age 60 | 1994 |
Karl J. Schmidt | Vice President and Chief Financial Officer; Age 62 | 2013 |
Wayne Bosch | Vice President, Chief Human Resources Officer; Age 59 | 2013 |
Fati A. Elgendy | President and Chief Operating Officer, Perma-Pipe; Age 67 | 1990 |
All of the executive officers serve at the discretion of the Board of Directors.
Bradley E. Mautner, Chief Executive Officer since February 2013. President since December 2004; Chief Operating Officer from December 2004 to January 2013; Executive Vice President from December 2002 to December 2004;Vice President from December 1996 through December 2002; Director since 1994.
Karl J. Schmidt, Appointed Vice President and Chief Financial Officer in January 2013. From 2010 to 2012, Mr. Schmidt served as the Chief Financial Officer of Atkore International (previously Tyco Electrical and Metal Products), a manufacturer of steel pipe and tube products, electrical conduits, cable, and cable management systems. From 2002 to 2009, Mr. Schmidt served as the Executive Vice President and Chief Financial Officer of Sauer-Danfoss, Inc., a global manufacturer of hydraulic, electrical, and electronic components and solutions for off-road vehicles.
Wayne Bosch, Appointed Vice President and Chief Human Resources Officer in December 2013. From 2010 to 2012, Mr. Bosch was Vice President of Human Resources at Pactiv, a $4 billion global manufacturer and distributor of food packaging products. Prior to Pactiv, he led the human resource activities at the North American segment of Barilla America, a $6.3 billion global pasta, sauces and bakery manufacturer and was the Chief Human Resources Officer for water filtration leader Culligan International.
Fati A. Elgendy, President and Chief Operating Officer of Perma-Pipe since March 1995.
Item 1A. RISK FACTORS
4
The Company's business, financial condition, results of operations and cash flows are subject to various risks, including, but not limited to those set forth below, which could cause actual results to vary materially from recent results or from anticipated future results. These risk factors should be considered together with information included elsewhere in this Annual Report on Form 10-K.
Economic factors. If the economy experienced a severe and prolonged downturn, it could adversely impact all of the Company's businesses, directly or indirectly. Downturns in such general economic conditions can significantly affect the business of our customers, which in turn affects demand, volume, pricing, and operating margin for our services and products. A downturn in one or more of our significant markets could have a material adverse effect on the Company's business, results of operations or financial condition. Because economic and market conditions vary within the Company's segment, the Company's performance will also vary. In addition, the Company is exposed to fluctuations in currency exchange rates and commodity prices. Failure to successfully manage any of these risks could have an adverse impact on the Company's financial position, results of operations and cash flow.
Project cycles. Since Piping Systems is based on large discrete projects, operating results could be negatively impacted in the future as a result of large variations in the level of market demand in both geographies and reporting periods.
Customer access to capital funds. Uncertainty about economic market conditions poses risks that the Company's customers may postpone spending for capital improvement and maintenance projects in response to tighter credit markets or negative financial news, which could have a material negative effect on the demand for the Company's products. The continuing decrease in federal and state spending on projects using the Company's products has significantly decelerated government funded construction activity in the U.S., negatively impacting sales volume at the Company's domestic facilities.
Crude oil and natural gas prices are volatile, and the substantial and extended decline in commodity prices has had, and may continue to have, a material and adverse effect on demand and pricing in the Company's business. Prices for crude oil and natural gas fluctuate widely. Among the factors that can or could cause these price fluctuations are:
• the level of consumer demand;
• domestic and worldwide supplies of crude oil and natural gas;
• domestic and international drilling activity;
• the actions of other crude oil exporting nations and the Organization of Petroleum Exporting Countries;
• worldwide economic and political conditions, including political instability or armed conflict in oil and gas producing regions; and
• the price and availability of, and demand for, competing energy sources, including alternative energy sources.
Beginning in the fourth quarter of 2014 and continuing through 2015 and into 2016, crude oil prices have substantially declined. In addition, natural gas prices began to decline substantially in the second quarter of 2014, and such declines continued during 2015 and into 2016. The above described factors and the volatility of commodity prices make it difficult to predict future crude oil and natural gas prices. As a result, the Company cannot predict how long these lower prices will continue, and there can be no assurance that the prices for crude oil and natural gas will not decline further. Additionally, the decline in oil prices has had budgetary impact on the governments of key Gulf Cooperation Council ("GCC") countries, delaying or canceling major planned infrastructure projects unrelated to oil and gas production. It is impossible to predict when and in what volume these planned projects will be implemented. The GCC is a political and economic alliance of six Middle Eastern countries—Saudi Arabia, Kuwait, the United Arab Emirates, Qatar, Bahrain, and Oman. Now that the Company's focus is only on Piping Systems, the Company is more concentrated, and these risk factors could potentially have a greater effect on the Company.
Risks related to international business. International sales represent a significant portion of the Company's total sales. During 2015, the Company's international sales increased from 43.7% to 48.4%. The Company's anticipated growth and profitability may require maintaining current international sales volume and may necessitate further
5
international expansion. The Company's financial results could be affected by changes in trade, monetary and fiscal policies, laws and regulations, or other activities of U.S. and non U.S. governments, agencies and similar organizations. These conditions include, but are not limited to, changes in a country's or region's economic or political conditions, trade regulations affecting production, pricing and marketing of products, local labor conditions and regulations, reduced protection of intellectual property rights in some countries, changes in the regulatory or legal environment, restrictions on currency exchange activities, burdensome taxes and tariffs and other trade barriers. International risks and uncertainties, including changing social and economic conditions as well as terrorism, political hostilities and war, could lead to reduced international sales and reduced profitability associated with such sales. In addition these risks can include extraordinarily delayed collections of accounts receivable. Because the Company conducts a significant portion of its business activities in the Middle East, the political and economic events of the countries that comprise the GCC can have a material effect on the Company’s business.
Financing. If there were an event of default under the Company's current revolving credit facilities, the holders of the defaulted debt could cause all amounts outstanding with respect to that debt to be due and payable immediately. The Company cannot assure that the assets or cash flow would be sufficient to fully repay amounts due under any of the financing arrangements, if accelerated upon an event of default, or, that the Company would be able to repay, refinance or restructure the payments under any such arrangements. Complying with the covenants under the Company's revolving credit facility may limit management's discretion by restricting options such as:
· | incurring additional debt; |
· | entering into transactions with affiliates; |
· | making investments or other restricted payments; |
· | paying dividends or making other distributions; and |
· | creating liens. |
Any additional financing the Company may obtain could contain similar or more restrictive covenants. The Company's ability to comply with any covenants may be adversely affected by general economic conditions, political decisions, industry conditions and other events beyond management's control.
Competition. The business in which the Company is engaged is highly competitive. Many of the competitors are larger and have more resources than the Company. Additionally, many of the Company's products are also subject to competition from alternative technologies and alternative products. In periods of declining demand, the Company's fixed cost structure may limit ability to cut costs, which may be a competitive disadvantage compared to firms with lower cost structures, or may result in reduced operating margins and operating losses.
Suppliers. To the extent the Company relies upon a single source for key components of several of its products, the Company believes there are alternate sources available for such components; however, there can be no assurance that the interruption of supplies of such components would not have an adverse effect on the financial condition of the Company and that the Company, if required to do so, would be able to negotiate agreements with alternative sources on acceptable terms.
Backlog. The Company defines backlog as the revenue value in dollars resulting from confirmed customer purchase orders that have not yet been recognized as revenue. However, by industry practice, orders may be canceled or modified at any time. If a customer cancels an order, the customer is normally responsible for all finished goods, all direct and indirect costs incurred and also for a reasonable allowance for anticipated profits. No assurance can be given that these amounts will be recovered after cancellation. Any cancellation or delay in orders may result in lower than expected revenue.
Attracting and retaining senior management and key personnel. The Company's ability to meet strategic and financial goals will depend to a significant extent on the continued contributions of senior management. Future success will also depend in large part on the ability to identify, attract, motivate, effectively utilize and retain highly qualified managerial, sales, marketing and technical personnel. The loss of senior management or other key personnel or the inability to identify, attract and retain qualified personnel in the future could make it more difficult to manage the business and could adversely affect operations and financial results.
6
Rapid growth of business. Expansion may result in unanticipated adverse consequences, including significant strain on management, operations and financial systems as well as on the Company's ability to attract and retain competent employees. In the future, the Company may seek to grow the business by investing in new or existing facilities, making acquisitions, entering into partnerships and joint ventures, or constructing new facilities, which could entail a number of additional risks, including:
• | strain on working capital; |
• | diversion of management from other activities, which could impair the operation of existing businesses; |
• | failure to successfully integrate the acquired businesses or facilities into existing operations; |
• | inability to maintain key pre-acquisition business relationships; |
• | loss of key personnel of the acquired business or facility; |
• | exposure to unanticipated liabilities; and |
• | failure to realize efficiencies, synergies and cost savings. |
As a result of these and other factors, including the general economic risk, the Company may not be able to realize the expected benefits from any recent or future acquisitions, new facility developments, partnerships, joint ventures or other investments.
Percentage-of-completion revenue recognition. All divisions recognize revenues under the stated revenue recognition policy except for sizable domestic complex contracts that require periodic recognition of income. For these contracts, the Company uses the "percentage of completion" accounting method. This methodology allows revenue and profits to be recognized proportionally over the life of a contract by comparing the amount of the cost incurred to date against the total amount of cost expected to be incurred. The effect of revisions to revenue and total estimated cost is recorded when the amounts are known or can be reasonably estimated. These revisions can occur at any time and could be material. On a historical basis, management believes that reasonably reliable estimates of the progress towards completion on long-term contracts have been made. However, given the uncertainties associated with these types of contracts, it is possible for actual cost to vary from estimates previously made, which may result in reductions or reversals of previously recorded revenue and profits.
Income Taxes. Changes in, or interpretations of, tax rules and regulations may adversely affect our effective tax rates. The Company is a United States-based multinational company subject to tax in multiple U.S. and foreign tax jurisdictions. A significant portion of earnings for the current fiscal year were earned by foreign subsidiaries. In addition to providing for U.S. income taxes on earnings from the U.S., the Company provides for U.S. income taxes on the earnings of foreign subsidiaries unless the subsidiaries’ earnings are considered permanently reinvested outside the U.S. If certain foreign earnings previously treated as permanently reinvested are repatriated, the related U.S. tax liability may be reduced by any foreign income taxes paid on these earnings.
Regulatory and legal requirements. As a public company, the Company is required to comply with the reporting obligations of the Securities Exchange Act of 1934, as amended ("Exchange Act"). Keeping informed of and in compliance with, changing laws, regulations and standards relating to corporate governance, public disclosure and accounting standards, including the Sarbanes-Oxley Act, Dodd-Frank Act, as well as new and proposed SEC regulations and accounting standards, has required an increased amount of management attention and external resources. Compliance with such requirements has resulted in increased general and administrative expenses and an increased allocation of management time and attention to compliance activities.
Effective internal control over financial reporting. As a public reporting company, the Company is in a continuing process of developing, establishing, and maintaining internal controls and procedures . Management is required to report on internal controls over financial reporting under Section 404 Sarbanes-Oxley Act of 2002. If the Company fails to achieve and maintain adequate internal controls, management would not be able to conclude on an ongoing basis that the Company has effective internal controls over financial reporting in accordance with Section 404. If the Company does not remediate the material weaknesses described in Item 9A, or if other material weaknesses are identified in the future , the reported financial results of the Company could be materially misstated or could subsequently require restatement, which would require additional financial and management resources, and the market
7
price of our stock could decline.
Item 1B. UNRESOLVED STAFF COMMENTS - None.
8
Item 2. PROPERTIES Principal properties at January 31, 2016:
Piping Systems
Illinois | Owned production facilities and office space | 16,800 square feet |
Louisiana | Owned production facilities and leased land | 30,000 square feet on approximately 6 acres |
Tennessee | Owned production facilities and office space | 131,800 square feet on approximately 23.5 acres |
Canada | Joint venture owned production facilities and office space | 87,160 square feet on approximately 128 acres |
India | Leased production facilities, office space and land | 33,700 square feet on approximately 1.2 acres |
Kingdom of Saudi Arabia | Owned production facilities on leased land | 91,000 square feet on approximately 11 acres |
United Arab Emirates | Leased office space and production facilities on leased land | 108,300 square feet on approximately 23 acres |
Filtration Products
Illinois | Bolingbrook - owned production facilities and office space, currently idle | 101,500 square feet on 5.5 acres |
Cicero - owned production facilities and office space, currently idle | 130,700 square feet on 2.8 acres | |
Virginia | Owned production facilities | 97,500 square feet on 5.0 acres |
Leased office space | 6,000 square feet | |
The Company's principal executive offices, which occupy approximately 23,400 square feet of space in Niles, Illinois, are owned by the Company. This property is currently held for sale. In anticipation of this sale, the Company signed a lease in September 2015 for new office space currently under construction. The Company anticipates that it will begin occupying the new headquarters in the second quarter of 2016. The Company believes its properties and equipment are well maintained and in good operating condition and that production capacities will be adequate for present and currently anticipated needs.
The Company has several significant operating lease agreements as follows:
• | Nine acres of land in the Kingdom of Saudi Arabia is leased through 2030. |
• | Land for production facilities in the United Arab Emirates, ("U.A.E.") of approximately 80,200 square feet is leased until June 30, 2030. Office space and land for production facilities of approximately 21,500 square feet in the U.A.E. is leased until July 2032. |
For further information, see Note 8 - Lease information, in the Notes to Consolidated Financial Statements.
Item 3. LEGAL PROCEEDINGS - The Company had no material pending litigation.
Item 4. MINE SAFETY DISCLOSURES - Not applicable.
9
PART II
Item 5. | MARKET FOR REGISTRANT'S COMMON EQUITY, RELATED STOCKHOLDER MATTERS AND ISSUER PURCHASES OF EQUITY SECURITIES |
The Company's fiscal year ends on January 31. Years and balances described as 2015 and 2014 are the fiscal years ended January 31, 2016 and 2015, respectively.
The Company's Common Stock is traded on the Nasdaq Global Market under the symbol "MFRI". The following table sets forth, for the periods indicated, the high and low Common Stock sale prices as reported by the Nasdaq Global Market for 2015 and 2014.
High | Low | |||
Fiscal 2015 | ||||
Fourth Quarter | $6.88 | $5.17 | ||
Third Quarter | 5.68 | 4.52 | ||
Second Quarter | 6.40 | 5.56 | ||
First Quarter | 6.83 | 5.60 | ||
Fiscal 2014 | ||||
Fourth Quarter | 9.03 | 5.46 | ||
Third Quarter | 13.40 | 8.62 | ||
Second Quarter | 12.57 | 9.62 | ||
First Quarter | 16.80 | 9.19 | ||
As of April 1, 2016, there were 69 stockholders of record and other additional stockholders for whom securities firms acted as nominees.
On February 5, 2015, the Company's Board of Directors approved a share repurchase program, which authorizes the Company to use up to $2 million for the purchase of its outstanding shares of common stock. Share repurchases were permitted to be executed through open market or privately negotiated transactions on or prior to December 31, 2015. There were no stock repurchases in the fourth quarter.
The following table sets forth information with respect to repurchases by the Company of its shares of common stock during 2015:
Period | Total number of shares purchased | Average price paid per share | Total Number of Shares Purchased as Part of Publicly Announced Plans or Programs | Maximum number (or approximate dollar value) of shares (or units) that may yet be purchased under the plans or programs | ||||
February | 28,066 | 6.64 | 28,066 | 1,813,632 | ||||
March | 16,500 | 6.27 | 16,500 | 1,710,342 | ||||
April - December | — | — | — | — | ||||
Total | 44,566 | 6.50 | 44,566 | |||||
The Company has never declared or paid a cash dividend and does not anticipate paying cash dividends on its Common Stock in the foreseeable future. Management presently intends to retain all available funds for the development of the business and for use as working capital. Future dividend policy will depend upon the Company's earnings, capital requirements, financial condition and other relevant factors. For further information, see "Financing" in Item 7 and Note 6 - Debt, in the Notes to Consolidated Financial Statements.
10
The Company has not made any sale of unregistered securities during the preceding three years.
The Transfer Agent and Registrar for the Common Shares is Continental Stock Transfer & Trust Company, 17 Battery Place, New York, New York 10004, (212) 509-4000.
Equity Compensation Plan Information
The following table provides information regarding the number of shares of Common Stock that may be issued upon exercise of outstanding options, warrants and rights under the Company's equity compensation plans and the weighted average exercise price and number of shares of Common Stock remaining available for issuance under those plans as of January 31, 2016.
Number of shares to be issued upon exercise of outstanding options, warrants and rights | Weighted-average exercise price of outstanding options, warrants and rights | Number of shares remaining available for future issuance under equity compensation plans (excluding shares reflected in column (a)) | |
Plan Category | (a)(1) | (b)(1) | (c) |
Equity compensation plans approved by stockholders | 719,650 | $11.38 | 205,576 |
(1) The amounts shown in columns (a) and (b) of the above table do not include 77,293 outstanding deferred stock units granted under the Company's Deferred Stock Purchase Plan and the 2013 Omnibus Stock Incentive Plan as amended June 14, 2013 ("Omnibus Plan").
ITEM 6. SELECTED FINANCIAL DATA - Not applicable.
Item 7. | MANAGEMENT'S DISCUSSION AND ANALYSIS OF FINANCIAL CONDITION AND RESULTS OF OPERATIONS |
The statements contained under the caption MD&A and other information contained elsewhere in this Annual Report on Form 10-K, which can be identified by the use of forward-looking terminology such as "may," "will," "expect," "continue," "remains," "intend," "aim," "should," "prospects," "could," "future," "potential," "believes," "plans," "likely" and "probable" or the negative thereof or other variations thereon or comparable terminology, constitute "forward-looking statements" within the meaning of Section 27A of the Securities Act of 1933, as amended, and Section 21E of the Exchange Act and are subject to the safe harbors created thereby. These statements should be considered as subject to the many risks and uncertainties that exist in the Company's operations and business environment. Such risks and uncertainties could cause actual results to differ materially from those projected as a result of many factors, including, but not limited to, those under the heading Item 1A. Risk Factors.
11
CONSOLIDATED RESULTS OF OPERATIONS
January 31, | ||
($ in thousands) | 2016 | 2015 |
Backlog | $47,937 | $30,715 |
As of January 31, 2016, MFRI, Inc. is engaged in the manufacture and sale of products in one reportable segment: Piping Systems. As described below, prior to January 29, 2016, the Company was also engaged in the manufacture and sale of products in the Filtration Products segment. Since Piping Systems is based on large discrete projects, operating results could be negatively impacted in the future as a result of large variations in the level of market demand in both geographies and reporting periods.
The analysis presented below and discussed in more detail throughout the MD&A was organized to provide instructive information for understanding the business going forward. However, this discussion should be read in conjunction with the Consolidated Financial Statements in Item 8 of this report, including the notes thereto and the risk factors contained herein. An overview of the segment results is provided in Note 1 - Business and segment information, in the Notes to Consolidated Financial Statements.
At January 31, 2016, one customer accounted for 10.3% of the Company's net sales. At January 31, 2015, one customer accounted for 17.2% of the Company's net sales.
Two customers accounted for 46.4% of accounts receivable at January 31, 2016, and one customer accounted for 37.4% of accounts receivable at January 31, 2015. As of April 1, 2016, these customers have paid 40.4% of their receivables outstanding at January 31, 2016.
In January 2016, the Company took a series of actions designed to refocus its business portfolio and cost structure to enhance the Company’s overall performance, including selling its filtration products business in Denmark and Illinois and intend to sell the domestic fabric filter business in Virginia. These businesses were previously reported as Filtration Products. These businesses are reported as discontinued operations in the consolidated financial statements, and the notes to consolidated financial statements have been restated to conform to the current year reporting of this business. The prior year financial statements have been revised to conform to the current year reporting. The Company sold its Illinois and international filtration businesses for $22.0 million, including cash proceeds of $18.4 million, of which $1.9 million is held in escrow until July 2017. Loss from discontinued operation net of tax was $6.0 million and $4.4 million for January 31, 2016 and 2015, respectively. For further information, see Note 4 - Discontinued operations, in the Notes to Consolidated Financial Statements.
12
2015 Compared to 2014
Piping Systems
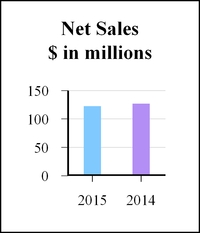
($ in thousands) | 2015 | 2014 | % Increase (Decrease) | |||
Net sales | $122,696 | $126,923 | (3.3 | )% | ||
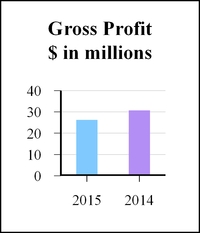
Gross profit | 26,741 | 30,774 | (13.1 | )% | ||
Percentage of net sales | 22 | % | 24 | % | ||
General and administrative expenses | 11,211 | 12,309 | (8.9 | )% | ||
Percentage of net sales | 9.1 | % | 9.7 | % | ||
Selling expense | 4,994 | 5,725 | (12.8 | )% | ||
Percentage of net sales | 4.1 | % | 4.5 | % | ||
Income from operations | 10,537 | 12,740 | (17.3 | )% | ||
Percentage of net sales | 8.6 | % | 10.0 | % | ||
Income from joint venture | 602 | 1,960 | (69.3 | )% | ||
Net sales were $122.7 million in 2015, a decrease of 3% from $126.9 million in 2014. This $4.2 million decrease compared to the prior year was due to lower volume in domestic oil and gas projects and lower volume in Saudi Arabia due to a slower pace of new projects based on the deterioration of the price of oil.
Gross profit decreased 13% to $26.7 million in 2015 from $30.8 million in 2014 due to lower volume. Gross margin decreased to 22% of net sales from 24% of net sales in the prior year. Gross profit decreased due to the lower volume. An excess inventory reserve adjustment of $0.4 million was recorded at January 31, 2016 due to market condition changes.
General and administrative expenses decreased to $11.2 million in 2015 from $12.3 million in 2014 due to lower management incentive compensation expense resulting from lower earnings in the period. General and administrative expenses as a percentage of net sales decreased to 9.1% in 2015 from 9.7% in the prior year.
Selling expenses decreased to $5.0 million from $5.7 million in the prior year due to reduced staffing and commission expenses due to lower sales. As a percentage of net sales, selling expenses decreased to 4.1% in 2015 from 4.5% in the prior year.
Income from the joint venture in 2015 was $0.6 million, a decrease of $1.4 million over prior year, driven by reduced sales volume.
Corporate
Corporate expenses include interest expense and general and administrative expenses that are not allocated to the segment. General and administrative expenses increased 11% to $7.7 million in 2015 from $6.9 million in 2014. As a percentage of sales, expenses increased to 6.2% from 5.4%. The spending rose due to an increase in stock compensation expense and professional service expenses. The prior year included a stock compensation benefit that related to the cancellation of stock options from former employees of discontinued operations. The increase in general and administrative expenses was also due to temporary staffing costs partially offset by lower management incentive compensation expense and lower deferred compensation expense.
Interest expense decreased to $1.0 million in 2015 from $1.0 million in 2014 due to a reduction in interest rates and lower borrowing volume on the domestic revolver relative to the prior year.
13
INCOME TAXES
The Company's worldwide effective tax rates ("ETR") were 45.7% and 41.9% in 2015 and 2014, respectively. The ETR in 2015 was higher than the statutory U.S. federal income tax rate, mainly due to the impact of the full valuation allowance maintained against domestic deferred tax assets and the recognition of foreign earnings resulting from the dispositions of certain foreign operations. The Company remains in an NOL carryforward position.
During the fourth quarter of 2015, the Company sold its foreign filtration operations, the gain from which was taxable in the U.S. As such, the Company no longer considers the earnings of the remaining Denmark subsidiary permanently reinvested. Therefore, the Company has recorded a deferred tax liability of $0.2 million related to the U.S. federal and state income taxes on approximately $0.7 million of undistributed earnings. The Company has not provided Federal tax on remaining unremitted earnings of its Middle East subsidiaries. The Company does not believe that it will be necessary to repatriate earnings from these subsidiaries. The Company intends and has the ability to reinvest these earnings for the foreseeable future outside the U.S. If these amounts were distributed to the U.S., in the form of dividends or otherwise, the Company could be subject to additional U.S. income taxes. Determination of the amount of unrecognized deferred income tax liabilities on these earnings is not practicable, because such liability, if any, is dependent on circumstances existing if and when remittance occurs.
During the fourth quarter of 2014, the Company concluded that not all of the undistributed earnings of Perma-Pipe India Ltd, will remain permanently reinvested outside the U.S. and are available for use in the U.S. or in entities in other foreign countries. As such, the Company recorded a deferred tax liability of $0.2 million and $0.9 million for the periods ending January 31, 2016 and 2015, respectively, related to the U.S. federal and state income taxes and foreign withholding taxes on approximately $2.8 million and $4.2 million of undistributed earnings. The decrease in deferred tax liability primarily relates to a $2.0 million dividend paid during January 2016 along with a decrease in accumulated earnings and profits. Future earnings related to this subsidiary are not deemed permanently reinvested. No U.S. cash tax payments will be made upon distribution of these foreign earnings as long as the Company has sufficient tax attributes in the U.S. to reduce the cash tax consequences of potential repatriation.
A reconciliation of the ETR to the U.S. Statutory tax rate is as follows:
2015 | 2014 | |||
Statutory tax rate | 34.0 | % | 34.0 | % |
Repatriation | 30.2 | % | 21.2 | % |
Valuation allowance for domestic deferred tax assets | 29.6 | % | — | % |
Permanent difference management fee allocation | 22.8 | % | 27.0 | % |
Permanent differences other | 7.9 | % | (7.5 | )% |
Foreign tax credit | (28.0 | )% | (11.0 | )% |
Differences in foreign tax rate | (29.9 | )% | (4.1 | )% |
Domestic deferred tax true ups | (12.7 | )% | — | % |
Nontaxable income from the Canadian joint venture | (7.5 | )% | (9.2 | )% |
Research tax credit | (2.0 | )% | (0.4 | )% |
Valuation allowance for state NOLs | 3.2 | % | (4.4 | )% |
Valuation allowance for foreign NOLs | 1.2 | % | 0.5 | % |
State taxes, net of federal benefit | (2.1 | )% | (1.8 | )% |
All other, net expense | (1.0 | )% | (2.4 | )% |
Effective income tax rate | 45.7 | % | 41.9 | % |
For further information, see Note 9 - Income taxes, in the Notes to Consolidated Financial Statements.
14
Net income from continuing operations was $1.6 million in 2015 compared to net income from continuing operations of $4.2 million in 2014.
LIQUIDITY AND CAPITAL RESOURCES
Cash and cash equivalents as of January 31, 2016 were $16.6 million, compared to $9.9 million at January 31, 2015. At January 31, 2016, $0.2 million was held in the U.S., and $16.4 million was held in the foreign subsidiaries. The Company's working capital was $30.3 million at January 31, 2016 compared to $41.0 million at January 31, 2015. Cash used in operations in 2015 was $2.9 million compared to cash provided by operations of $3.5 million in 2014.
In January 2016, the Company took a series of actions designed to refocus its business portfolio and cost structure to enhance the Company’s overall performance. These actions included the sale of MFRI’s domestic and international filtration businesses, including TDC Filter Manufacturing, Inc., Nordic Air Filtration, A/S and related assets, and the planned sale of the domestic fabric filter business in Virginia.
In addition to paying down debt, the sale of the filtration business will give the Company the opportunity to focus resources on new Piping Systems growth opportunities such as the recent acquisition of 100% ownership of BPPC, which the Company believes creates a strong platform to diversify and expand Perma-Pipe's business into new markets and geographies.
Foreign earnings from the remaining Denmark subsidiary are no longer considered to be indefinitely reinvested outside the U.S. As a result of that conclusion, the Company has provided deferred taxes on the unremitted earnings. Foreign earnings in the Middle East are considered to be indefinitely reinvested outside the U.S. The Company has not provided Federal tax on unremitted earnings of its Middle East subsidiaries. The Company does not believe that it will be necessary to repatriate investments from these subsidiaries.
Net cash provided by investing activities in 2015 was $13.9 million compared to $5.7 million used in 2014 as a result of the Filtration divestiture. The Company estimates that capital expenditures for 2016 could be $3.1 million, and the Company may finance capital expenditures through real estate mortgages, term loans, equipment financing loans, internally generated funds and its revolving line of credit. The majority of such expenditures relates to diversification and expansion of business in the Middle East.
On February 5, 2015, the Board of Directors authorized a $2 million share repurchase program. Share repurchases were executed through open market or privately negotiated transactions on or prior to December 31, 2015. The Company repurchased 45 thousand shares. For additional information, see Note 12 - Treasury stock/share repurchase program, in the Notes to Consolidated Financial Statements.
Debt totaled $15.5 million at January 31, 2016. Net cash used in financing activities was $3.0 million in 2015 compared to $0.5 million in 2014. The domestic revolver decreased $6.1 million mainly due to sales proceeds from the domestic sale of the Filtration business. The Denmark debt of $2.2 million was deducted from the sale price and paid at closing. The revolvers in the Middle East increased $5.4 million for their working capital needs. For additional information, see Note 7 - Debt, in the Notes to Consolidated Financial Statements. Other long-term liabilities of $0.2 million were composed primarily of deferred revenue.
15
The following table summarizes the Company's estimated contractual obligations at January 31, 2016.
($ in thousands) | Year Ending January 31, | |||||||||||||||||||
Contractual obligations | Total | 2017 | 2018 | 2019 | 2020 | 2021 | Thereafter | |||||||||||||
Revolving line domestic (1) | $5,237 | $5,237 | $— | $— | $— | $— | $— | |||||||||||||
Mortgages (2) | 1,822 | 162 | 162 | 162 | 162 | 162 | 1,012 | |||||||||||||
Revolving line foreign (3) | 8,348 | 8,348 | — | — | — | — | — | |||||||||||||
Term loans (2) | 261 | 175 | 86 | — | — | — | — | |||||||||||||
Subtotal | 15,668 | 13,922 | 248 | 162 | 162 | 162 | 1,012 | |||||||||||||
Capitalized lease obligations | 1,453 | 1,386 | 67 | — | — | — | — | |||||||||||||
Operating lease obligations (4) | 17,666 | 1,944 | 1,640 | 1,378 | 1,311 | 1,327 | 10,066 | |||||||||||||
Projected pension contributions (5) | 3,590 | 326 | 349 | 348 | 363 | 363 | 1,841 | |||||||||||||
Deferred compensation (6) | 6,167 | 6,167 | — | — | — | — | — | |||||||||||||
Employment agreements (7) | 101 | — | — | — | — | — | 101 | |||||||||||||
Contractual obligations of discontinued operations (8) | 3,439 | 3,439 | — | — | — | — | — | |||||||||||||
Uncertain tax position obligations (9) | 140 | — | — | — | — | — | 140 | |||||||||||||
Total | $48,224 | $27,184 | $2,304 | $1,888 | $1,836 | $1,852 | $13,160 | |||||||||||||
Notes to contractual obligations table
(1) | Interest obligations exclude floating rate interest on debt payable under the domestic revolving line of credit. Based on the amount of such debt at January 31, 2016, and the weighted average interest rate of 4.19% on that debt, such interest was being incurred at an annual rate of approximately $0.1 million. |
(2) | Scheduled maturities, including interest. |
(3) | Scheduled maturities of foreign revolver line, including interest. |
(4) | Minimum contractual amounts, assuming no changes in variable expenses. |
(5) | Includes estimated future benefit payments. |
(6) | Non-qualified deferred compensation plan - The Company had a Supplemental Retirement and Deferred Compensation Plan ("Supplemental Plan"), under which key employees deferred compensation. The Supplemental Plan was terminated on April 10, 2014. Refer to Note 9 - Retirement plans, in the Notes to Consolidated Financial Statements. |
(7) | Refer to the proxy statement for a description of compensation plans for Named Executive Officers. |
(8) Included payments for other liabilities and mortgages for properties held for sale.
(9) Refer to Note 8 - Income taxes, in the Notes to Consolidated Financial Statements for a description of the uncertain tax position obligations.
Financing
On September 24, 2014, the Company entered into a credit and security agreement with a financial institution (as amended, "Credit Agreement"). Under the terms of the Credit Agreement, which matures on September 24, 2019, the Company can borrow up to $25.0 million, subject to borrowing base and other requirements, under a revolving line of credit. The Credit Agreement covenants restrict debt, liens, and certain investments, and require attainment of specific levels of profitability and cash flows when reaching certain levels of availability. Interest rates are based on options selected by the Company as follows: (a) a margin in effect plus a base rate, if below certain availability limits; or (b) a margin in effect plus the Eurodollar rate for the corresponding interest period. At January 31, 2016, the Company was in compliance with all covenants under the Credit Agreement. The domestic revolving line balance as of January 31, 2015 and January 31, 2016 was included as a current liability on the consolidated balance sheets.
16
At January 31, 2016, the Company was in compliance with all covenants under the Credit Agreement. The domestic revolving line balance as of January 31, 2016 has been classified as a current liability in the accompanying financial statements.
As of January 31, 2016, the Company had borrowed $5.2 million at 3.25% and 1.5% and had $8.3 million available to it under the revolving line of credit. In addition, $0.3 million of availability was used under the Credit Agreement primarily to support letters of credit to guarantee amounts committed for inventory purchases. Cash required for operations is provided by draw-downs on the line of credit.
On February 29, 2016, the Company reduced the amount that can be borrowed under the Credit Agreement to $15.0 million.
Revolving lines foreign. The Company also has credit arrangements used by its Middle Eastern subsidiaries. These credit arrangements are in the form of overdraft facilities and project financing at rates competitive in the countries in which the Company operates. Some credit arrangement covenants requires a minimum tangible net worth to be maintained. At January 31, 2016, the Company was in compliance with the covenants under the credit arrangement. Interest rates are 4.0% per annum below National Bank of Fujairah Base Rate, minimum 3.5% per annum and Emirates Inter Bank Offered Rate (EIBOR) plus 3.50% per annum. The Company's interest rates range from 3.5% to 6.0%. At January 31, 2016, the Company can borrow $43.8 million under these credit arrangements. The Company borrowed $8.1 million and had $28.7 million available under these credit arrangements as of January 31, 2016. In addition, $7.0 million of availability was used to support letters of credit to guarantee amounts committed for inventory purchases. For further information, see Note 7 - Debt, in the Notes to Consolidated Financial Statements.
CRITICAL ACCOUNTING ESTIMATES AND POLICIES
The Company's significant accounting policies are discussed in the Notes to Consolidated Financial Statements included in Item 8 of this Annual Report on Form 10-K. The application of certain of these policies requires significant judgments or a historical based estimation process that can affect the results of operations and financial position of the Company as well as the related footnote disclosures. The Company bases its estimates on historical experience and other assumptions that it believes are reasonable. If actual amounts ultimately differ from previous estimates, the revisions are included in the Company's results of operations for the period in which the actual amounts become known.
Revenue recognition. The Company recognizes revenues, including shipping and handling charges billed to customers, when all the following criteria are met: (i) persuasive evidence of an arrangement exists, (ii) delivery has occurred or services have been rendered, (iii) the seller's price to the buyer is fixed or determinable, and (iv) collectability is reasonably assured. All subsidiaries of the Company, except as noted below, recognize revenues upon shipment or delivery of goods or services when title and risk of loss pass to customers.
Percentage of completion revenue recognition. All divisions recognize revenues under the above stated revenue recognition policy except for domestic complex contracts that require periodic recognition of income. For these contracts, the Company uses the "percentage of completion" accounting method. Under this approach, income is recognized in each reporting period based on the status of the uncompleted contracts and the current estimates of costs to complete. The choice of accounting method is made at the time the contract is received based on the expected length and complexity of the project. The percentage of completion is determined by the relationship of costs incurred to the total estimated costs of the contract. Provisions are made for estimated losses on uncompleted contracts in the period in which such losses are determined. Changes in job performance, job conditions, and estimated profitability, including those arising from contract penalty provisions and final contract settlements, may result in revisions to costs and income. Such revisions are recognized in the period in which they are determined. Claims for additional compensation due to the Company are recognized in contract revenues when realization is probable and the amount can be reliably estimated.
17
Inventories. Inventories are stated at the lower of cost or market. Cost is determined using the first-in, first-out method for all inventories.
Income taxes. Deferred income taxes have been provided for temporary differences arising from differences in the basis of assets and liabilities for tax and financial reporting purposes. Deferred income taxes on temporary differences have been recorded at the current tax rate. The Company assesses its deferred tax assets for realizability at each reporting period.
The Company recognizes the financial statement benefit of a tax position only after determining that the relevant tax authority would more likely than not sustain the position following an audit. For tax positions meeting the more likely than not threshold, the amount recognized in the financial statements is the largest benefit that has a greater than 50 percent likelihood of being realized upon ultimate settlement with the relevant tax authority.
Equity-based compensation. Stock compensation expense for employee equity awards is recognized ratably over the requisite service period of the award. The Black-Scholes option-pricing model is utilized to estimate the fair value of option awards. Determining the fair value of stock options using the Black-Scholes model requires judgment, including estimates for (1) risk-free interest rate - an estimate based on the yield of zero-coupon treasury securities with a maturity equal to the expected life of the option; (2) expected volatility - an estimate based on the historical volatility of the Company's Common Stock; and (3) expected life of the option - an estimate based on historical experience including the effect of employee terminations.
Fair value of financial instruments. The carrying values of cash and cash equivalents, accounts receivable and accounts payable are based upon reasonable estimates of their fair value due to their short-term nature. The carrying value of the cash surrender value of life insurance policies approximated fair value and was based on the market value of the underlying investments, which may increase or decrease due to fluctuations in the overall financial markets. The carrying amount of the Company's short-term debt, revolving line of credit and long-term debt approximate fair value because the majority of the amounts outstanding accrue interest at variable rates.
New accounting pronouncements. See Recent accounting pronouncements in Note 2 - Significant accounting policies, in the Notes to Consolidated Financial Statements.
Item 7A. | QUANTITATIVE AND QUALITATIVE DISCLOSURES ABOUT MARKET RISK - Not applicable. |
Item 8. FINANCIAL STATEMENTS AND SUPPLEMENTARY DATA
The consolidated financial statements of the Company for each of the two years in the periods ended as of January 31, 2016 and 2015 and the notes thereto are set forth as an exhibit hereto.
18
Item 9. | CHANGES IN AND DISAGREEMENTS WITH ACCOUNTANTS ON ACCOUNTING AND FINANCIAL DISCLOSURE - None. |
Item 9A. CONTROLS AND PROCEDURES
The Chief Executive Officer and Chief Financial Officer have evaluated the effectiveness of the Company's disclosure controls and procedures (as defined in Rule 13a-15(e) and 15d-15(e) under the Exchange Act as of January 31, 2016. Based on that evaluation, the Chief Executive Officer and Chief Financial Officer concluded that the Company's disclosure controls and procedures were not effective as of January 31, 2016 to ensure that information required to be disclosed in the reports that are filed or submitted under the Exchange Act is recorded, processed, summarized and reported, within the time periods specified in the SEC's rules and forms and is accumulated and communicated to the issuer's management, including the principal executive and financial officers, to allow timely decisions regarding required disclosure. This determination was based on the matters discussed below under Management's Report on Internal Control over Financial Reporting.
Management's Report on Internal Control Over Financial Reporting. The Company's management is responsible for establishing and maintaining adequate internal control over financial reporting, as such term is defined in Rule 13a-15(f) under the Exchange Act. As required by Rule 13a-15(c) under the Exchange Act, MFRI's management carried out an evaluation, with the participation of the Chief Executive Officer and Chief Financial Officer, of the effectiveness of its internal control over financial reporting as of the end of the last fiscal year. The framework on which such evaluation was based is contained in the report entitled "Internal Control-Integrated Framework" issued by the Committee of Sponsoring Organizations of the Treadway Commission (the "COSO 2013 Framework").
The Company's system of internal control over financial reporting is designed to provide reasonable assurance regarding the reliability of financial reporting and the preparation of financial statements for external purposes in accordance with generally accepted accounting principles. Because of its inherent limitations, internal control over financial reporting may not prevent or detect misstatements. Also, projections of any evaluation of effectiveness to future periods are subject to the risk that controls may become inadequate because of changes in conditions, or that the degree of compliance with the policies or procedures may deteriorate.
Based on its assessment, management has concluded that the Company has not maintained effective internal control over financial reporting as of January 31, 2016, based on criteria in the COSO 2013 Framework.
A material weakness is a deficiency, or a combination of deficiencies, in internal control over financial reporting, such that there is a reasonable possibility that a material misstatement of the company's annual or interim financial statements will not be prevented or detected on a timely basis.
The Company's processes, procedures and controls related to management’s period end review over certain calculations and estimates did not operate effectively. Management discovered that it did not properly perform all of the required calculations to determine whether a current report on Form 8-K for a planned acquisition agreement would be required. Although the requisite calculations were subsequently made, such calculation were not performed properly as of the January 31, 2016 financial statement date. As such the current report on Form 8-K was not made on a timely basis.
Management also found an error in estimating excess and obsolete inventory reserves. With respect to the excess and obsolete inventory reserve, management identified control deficiencies related to documentation and review. The Company did not appropriately factor in all pertinent information when estimating the excess and obsolete inventory reserve.
These material weaknesses did not result in any material adjustments to the Registrant's financial statements, notes thereto, or other disclosures in this Annual Report on Form 10-K.
19
Change in Internal Controls. Other than the material weaknesses noted above, there has been no change in internal control over financial reporting that occurred during the last fiscal quarter that has materially affected, or is reasonably likely to materially affect, internal control over financial reporting.
Remediation Plan for Material Weaknesses in Internal Control over Financial Reporting: To address the material weakness regarding timely filing of the current report on Form 8-K, the Company has adopted revised policies to ensure that management’s review process over complex estimates and calculations properly factors in all relevant assumptions and required inputs and include inputs from outside advisors as appropriate.
To address the material weakness regarding excess and obsolete inventory reserves, we have also implemented certain remedial measures. The Company will ensure excess and obsolete inventory reserve calculations and qualitative assessments are reviewed by appropriate operations management as well as the Chief Financial Officer on a quarterly basis. The excess and obsolete inventory reserve methodology will now be calculated using the demand, the age of the inventory and specific identification determined based on extended value of excess inventory.
Management will monitor the remediation progress of this material weakness against the revised policies that have been implemented.
We anticipate the actions described above and resulting improvements in controls will strengthen the Company's processes, procedures and controls related to review over certain calculations and estimates, and will address the related material weakness that we identified as of January 31, 2016. However, the material weaknesses cannot be remediated fully until the remediation processes have been in operation for a period of time and successfully tested.
Item 9B. OTHER INFORMATION - None.
PART III
Item 10. | DIRECTORS, EXECUTIVE OFFICERS AND CORPORATE GOVERNANCE |
Information with respect to this item is incorporated herein by reference to the Company's definitive proxy statement for the 2016 annual meeting of stockholders.
Information with respect to executive officers of the Company is included in Part I Item 1 hereof under the caption "Executive Officers of the Registrant".
Item 11. | EXECUTIVE COMPENSATION |
Information with respect to this item is incorporated herein by reference to the Company's definitive proxy statement for the 2016 annual meeting of stockholders.
Item 12. | SECURITY OWNERSHIP OF CERTAIN BENEFICIAL OWNERS AND MANAGEMENT |
AND RELATED STOCKHOLDER MATTERS
Information with respect to this item is incorporated herein by reference to the Company's definitive proxy statement for the 2016 annual meeting of stockholders.
20
Item 13. | CERTAIN RELATIONSHIPS AND RELATED TRANSACTIONS, AND DIRECTOR INDEPENDENCE |
Information with respect to this item is incorporated herein by reference to the Company's definitive proxy statement for the 2016 annual meeting of stockholders.
Item 14. PRINCIPAL ACCOUNTANTING FEES AND SERVICES
Information with respect to this item is incorporated herein by reference to the Company's definitive proxy statement for the 2016 annual meeting of stockholders.
PART IV
Item 15. | EXHIBITS AND FINANCIAL STATEMENT SCHEDULES |
a. List of documents filed as part of this report:
(1) | Financial Statements - Consolidated Financial Statements of the Company |
Refer to Part II, Item 8 of this report.
(2) | Financial Statement Schedules |
Schedule II - Valuation and Qualifying Accounts
b. | Exhibits: The exhibits, as listed in the Exhibit Index included herein, are submitted as a separate section of this report. |
c. The response to this portion of Item 15 is submitted under 15a(2) above.
REPORT OF INDEPENDENT REGISTERED PUBLIC ACCOUNTING FIRM
Board of Directors and Shareholders
MFRI Inc.
21
We have audited the accompanying consolidated balance sheets of MFRI, Inc. (a Delaware corporation) and subsidiaries (the “Company”) as of January 31, 2016 and 2015, and the related consolidated statements of operations, comprehensive loss, changes in stockholders’ equity, and cash flows for each of the two years in the period ended January 31, 2016. Our audits of the basic consolidated financial statements included the financial statement schedule listed in the index appearing under Item 15 (a)(2). These financial statements and financial statement schedule are the responsibility of the Company’s management. Our responsibility is to express an opinion on these financial statements and financial statement schedule based on our audits.
We conducted our audits in accordance with the standards of the Public Company Accounting Oversight Board (United States). Those standards require that we plan and perform the audit to obtain reasonable assurance about whether the financial statements are free of material misstatement. We were not engaged to perform an audit of the Company’s internal control over financial reporting. Our audits included consideration of internal control over financial reporting as a basis for designing audit procedures that are appropriate in the circumstances, but not for the purpose of expressing an opinion on the effectiveness of the Company’s internal control over financial reporting. Accordingly, we express no such opinion. An audit also includes examining, on a test basis, evidence supporting the amounts and disclosures in the financial statements, assessing the accounting principles used and significant estimates made by management, as well as evaluating the overall financial statement presentation. We believe that our audits provide a reasonable basis for our opinion.
In our opinion, the consolidated financial statements referred to above present fairly, in all material respects, the financial position of MFRI, Inc. and subsidiaries as of January 31, 2016 and 2015, and the results of their operations and their cash flows for each of the two years in the period ended January 31, 2016 in conformity with accounting principles generally accepted in the United States of America. Also in our opinion, the related financial statement schedule, when considered in relation to the basic consolidated financial statements taken as a whole, presents fairly, in all material respects, the information set forth therein.
/s/ GRANT THORNTON LLP
Chicago, Illinois
April 28, 2016
22
MFRI, INC. AND SUBSIDIARIES
CONSOLIDATED STATEMENTS OF OPERATIONS
Twelve months ended January 31, | ||||
(In thousands, except per share data) | 2016 | 2015 | ||
Net sales | $122,696 | $126,923 | ||
Cost of sales | 95,955 | 96,149 | ||
Gross profit | 26,741 | 30,774 | ||
Operating expenses: | ||||
General and administrative expense | 18,869 | 19,202 | ||
Selling expense | 4,994 | 5,725 | ||
Total operating expenses | 23,863 | 24,927 | ||
Income from operations | 2,878 | 5,847 | ||
Income from joint venture | 602 | 1,960 | ||
Interest expense, net | 470 | 519 | ||
Income from continuing operations before income taxes | 3,010 | 7,288 | ||
Income tax expense | 1,375 | 3,051 | ||
Income from continuing operations | 1,635 | 4,237 | ||
Loss from discontinued operations, net of tax | (6,044 | ) | (4,418 | ) |
Net loss | ($4,409) | ($181) | ||
Weighted average common shares outstanding | ||||
Basic | 7,280 | 7,251 | ||
Diluted | 7,371 | 7,324 | ||
Earnings per share from continuing operations | ||||
Basic and diluted | $0.22 | $0.58 | ||
Loss per share from discontinued operations | ||||
Basic and diluted | ($0.83) | ($0.61) | ||
Loss per share | ||||
Basic and diluted | ($0.61) | ($0.02) | ||
See accompanying Notes to Consolidated Financial Statements.
Note: Earnings per share calculations could be impacted by rounding.
23
MFRI, INC. AND SUBSIDIARIES
CONSOLIDATED STATEMENTS OF COMPREHENSIVE LOSS
(In thousands)
Twelve months ended January 31, | ||||
2016 | 2015 | |||
Net loss | ($4,409) | ($181) | ||
Other comprehensive income (loss) | ||||
Currency translation adjustments, net of tax | (481 | ) | (1,718 | ) |
Minimum pension liability adjustment, net of tax | 822 | (1,612 | ) | |
Unrealized gain on marketable security, net of tax | 118 | — | ||
Interest rate swap, net of tax | 91 | (40 | ) | |
Other comprehensive income (loss) | 550 | (3,370 | ) | |
Comprehensive loss | ($3,859) | ($3,551) | ||
See accompanying Notes to Consolidated Financial Statements.
24
MFRI, INC. AND SUBSIDIARIES
CONSOLIDATED BALANCE SHEETS
January 31, | ||||
(In thousands, except per share data) | 2016 | 2015 | ||
ASSETS | ||||
Current assets | ||||
Cash and cash equivalents | $16,631 | $9,900 | ||
Restricted cash | 2,324 | 428 | ||
Trade accounts receivable, less allowance for doubtful accounts of $33 at January 31, 2016 and $31 at January 31, 2015 | 36,090 | 34,332 | ||
Inventories, net | 15,625 | 13,685 | ||
Assets of discontinued operations | 15,733 | 41,476 | ||
Assets held for sale | 3,062 | 3,378 | ||
Cash surrender value on life insurance policies | 3,049 | 3,255 | ||
Prepaid expenses and other current assets | 1,744 | 2,550 | ||
Costs and estimated earnings in excess of billings on uncompleted contracts | 2,463 | 700 | ||
Income tax receivable | 327 | — | ||
Total current assets | 97,048 | 109,704 | ||
Property, plant and equipment, net of accumulated depreciation | 25,400 | 24,165 | ||
Other assets | ||||
Note receivable from joint venture | 1,905 | 3,931 | ||
Investment in joint venture | 9,112 | 8,514 | ||
Other assets | 4,658 | 1,760 | ||
Total other assets | 15,675 | 14,205 | ||
Total assets | $138,123 | $148,074 | ||
LIABILITIES AND STOCKHOLDERS' EQUITY | ||||
Current liabilities | ||||
Trade accounts payable | $11,026 | $6,933 | ||
Commissions and management incentives payable | 4,169 | 5,628 | ||
Deferred compensation liability | 6,167 | 213 | ||
Accrued compensation and payroll taxes | 4,274 | 4,021 | ||
Revolving line domestic | 5,237 | 11,353 | ||
Current maturities of long-term debt | 8,769 | 4,817 | ||
Customers' deposits | 3,690 | 4,271 | ||
Liabilities of discontinued operations | 15,465 | 21,379 | ||
Liabilities held for sale | 3,439 | 3,342 | ||
Other accrued liabilities | 965 | 1,100 | ||
Billings in excess of costs and estimated earnings on uncompleted contracts | 1,176 | 681 | ||
Income tax payable | 2,339 | 1,688 | ||
Total current liabilities | 66,716 | 65,426 | ||
Long-term liabilities | ||||
Long-term debt, less current maturities | 1,493 | 2,355 | ||
Deferred compensation liabilities | 495 | 6,560 | ||
Deferred tax liabilities - long-term | 160 | 734 | ||
Other long-term liabilities | 231 | 199 | ||
Total long-term liabilities | 2,379 | 9,848 | ||
Stockholders' equity | ||||
Common stock, $.01 par value, authorized 50,000 shares; 7,306 issued and outstanding January 31, 2016 and 7,291 issued and outstanding January 31, 2015 | 74 | 73 | ||
Additional paid-in capital | 53,031 | 52,655 | ||
Treasury Stock 45 shares at January 31, 2016 and none at January 31, 2015 | (290 | ) | — | |
Retained earnings | 20,193 | 24,602 | ||
Accumulated other comprehensive loss | (3,980 | ) | (4,530 | ) |
Total stockholders' equity | 69,028 | 72,800 | ||
Total liabilities and stockholders' equity | $138,123 | $148,074 | ||
See accompanying Notes to Consolidated Financial Statements.
25
MFRI, INC. AND SUBSIDIARIES
CONSOLIDATED STATEMENTS OF STOCKHOLDERS' EQUITY
($ in thousands, except share data) | Additional Paid-in Capital | Retained Earnings | Treasury Stock | Accumulated Other Comprehensive Income (Loss) | Total Stockholders' Equity | |||||||
Common Stock | ||||||||||||
Total stockholders' equity at January 31, 2014 | $72 | $52,144 | $24,783 | $0 | ($1,160) | $75,839 | ||||||
Net loss | (181 | ) | (181 | ) | ||||||||
Stock options exercised | — | 330 | 330 | |||||||||
Stock-based compensation expense | 124 | 124 | ||||||||||
Deferred shares converted to common stock | 1 | 57 | 58 | |||||||||
Interest rate swap | (51 | ) | (51 | ) | ||||||||
Pension liability adjustment | (1,611 | ) | (1,611 | ) | ||||||||
Foreign currency translation adjustment | (1,632 | ) | (1,632 | ) | ||||||||
Tax expense on above items | (76 | ) | (76 | ) | ||||||||
Total stockholders' equity at January 31, 2015 | $73 | $52,655 | $24,602 | $0 | ($4,530) | $72,800 | ||||||
Net loss | (4,409 | ) | (4,409 | ) | ||||||||
Stock options exercised | 1 | 116 | 117 | |||||||||
Repurchase of common stock | (290 | ) | (290 | ) | ||||||||
Stock-based compensation expense | 278 | 278 | ||||||||||
Shares issued less shares used for payroll taxes | (18 | ) | (18 | ) | ||||||||
Interest rate swap | 119 | 119 | ||||||||||
Pension liability adjustment | 821 | 821 | ||||||||||
Marketable security | 118 | 118 | ||||||||||
Foreign currency translation adjustment | (486 | ) | (486 | ) | ||||||||
Tax expense on above items | (22) | (22) | ||||||||||
Total stockholders' equity at January 31, 2016 | $74 | $53,031 | $20,193 | ($290) | ($3,980) | $69,028 | ||||||
Common stock shares | 2015 | 2014 | ||
Balance beginning of year | 7,290,576 | 7,168,537 | ||
Treasury stock purchased | (44,566 | ) | — | |
Shares issued | 59,915 | 122,039 | ||
Balance end of year | 7,305,925 | 7,290,576 | ||
See accompanying Notes to Consolidated Financial Statements.
26
MFRI, INC. AND SUBSIDIARIES
CONSOLIDATED STATEMENTS OF CASH FLOWS
Twelve months ended January 31, | ||||||
($ in thousands) | 2016 | 2015 | ||||
Operating activities | ||||||
Net loss | ($4,409) | ($181) | ||||
Adjustments to reconcile net loss to net cash flows (used in) provided by operating activities | ||||||
Depreciation and amortization | 5,929 | 5,897 | ||||
Gain on disposal of discontinued operations | (8,099 | ) | (188 | ) | ||
Impairment expense on discontinued operation | 6,480 | — | ||||
Deferred tax (benefit) expense | (249 | ) | 1,231 | |||
Income from joint venture | (602 | ) | (1,960 | ) | ||
Stock-based compensation expense | 278 | 124 | ||||
Cash surrender value on life insurance policies | 206 | (145 | ) | |||
Provision on uncollectible accounts | (59 | ) | (80 | ) | ||
Loss (gain) on disposal of fixed assets | 101 | (17 | ) | |||
Changes in operating assets and liabilities | ||||||
Accounts payable | 5,819 | (4,612 | ) | |||
Accrued compensation and payroll taxes | 299 | (3,055 | ) | |||
Inventories | 4,027 | 3,250 | ||||
Customers' deposits | (2,400 | ) | (28 | ) | ||
Income taxes receivable and payable | 620 | (687 | ) | |||
Prepaid expenses and other current assets | 1,914 | 1,000 | ||||
Accounts receivable | (2,809 | ) | 3,314 | |||
Costs and estimated earnings in excess of billings on uncompleted contracts | (1,268 | ) | (765 | ) | ||
Notes receivable | 273 | 849 | ||||
Other assets and liabilities | (8,948 | ) | (449 | ) | ||
Net cash (used in) provided by operating activities | (2,897 | ) | 3,498 | |||
Investing activities | ||||||
Net proceeds from sale of discontinued operations | 16,373 | 109 | ||||
Capital expenditures | (6,457 | ) | (5,878 | ) | ||
Payments on loan from joint venture | 1,890 | — | ||||
Proceeds from sales of property and equipment | 2,059 | 24 | ||||
Net cash provided by (used in) investing activities | 13,865 | (5,745 | ) | |||
Financing activities | ||||||
Proceeds from revolving lines | 105,636 | 85,270 | ||||
Proceeds from debt | 918 | 661 | ||||
Proceeds from borrowing against life insurance policies | 1,916 | — | ||||
Payments of debt on revolving lines | (105,378 | ) | (83,150 | ) | ||
Payments of other debt | (2,544 | ) | (3,641 | ) | ||
Payments of borrowing against life insurance policies | (1,916 | ) | — | |||
(Decrease) increase in drafts payable | (467 | ) | 629 | |||
Payments on capitalized lease obligations | (998 | ) | (704 | ) | ||
Repurchase of common stock | (290 | ) | — | |||
Stock options exercised and restricted shares issued | 98 | 389 | ||||
Net cash used in financing activities | (3,025 | ) | (546 | ) | ||
Effect of exchange rate changes on cash and cash equivalents | (1,212 | ) | (702 | ) | ||
Net increase (decrease) in cash and cash equivalents | 6,731 | (3,495 | ) | |||
Cash and cash equivalents - beginning of period | 9,900 | 13,395 | ||||
Cash and cash equivalents - end of period | $16,631 | $9,900 | ||||
Supplemental cash flow information | ||||||
Interest paid | $749 | $1,288 | ||||
Income taxes paid | 970 | 2,988 | ||||
Fixed assets acquired under capital leases | — | 680 | ||||
Funds held in escrow related to the sale of Filtration assets | 1,905 | — | ||||
See accompanying Notes to Consolidated Financial Statements.
27
MFRI, INC. AND SUBSIDIARIES
NOTES TO CONSOLIDATED FINANCIAL STATEMENTS
YEARS ENDED January 31, 2016 and 2015
(Tabular dollars in thousands, except per share data)
Note 1 - Business and segment information
MFRI, Inc. ("MFRI", the "Company", or the "Registrant") was incorporated in Delaware on October 12, 1993. As of January 31, 2016, MFRI is engaged in the manufacture and sale of products in one distinct segment: Piping Systems. As described below, prior to January 29, 2016, the Company was also engaged in the manufacture and sale of products in the Filtration Products segment.
Fiscal year. The Company's fiscal year ends on January 31. Years and balances described as 2015 and 2014 are the fiscal years ended January 31, 2016 and 2015, respectively.
Nature of business. Piping Systems engineers, designs, manufactures and sells specialty piping and leak detection and location systems. This segment's specialty piping systems include (i) industrial and secondary containment piping systems for transporting chemicals, hazardous fluids and petroleum products, (ii) insulated and jacketed district heating and cooling piping systems for efficient energy distribution to multiple locations from central energy plants, and (iii) oil and gas gathering flow and long lines for oil and mineral transportation. Piping Systems' leak detection and location systems are sold with many of its piping systems and on a stand-alone basis, to monitor areas where fluid intrusion may contaminate the environment, endanger personal safety, cause a fire hazard, impair essential services or damage equipment or property.
Prior to January 29, 2016, the Company had a Filtration Products segment. This business is reported as discontinued operations in the consolidated financial statements and the notes to consolidated financial statements have been restated to conform to the current year reporting of this business. For further information, see Note 4 - Discontinued operations, in the Notes to Consolidated Financial Statements.
28
Segment information was as follows:
2015 | 2014 | |
Net sales | ||
Piping Systems | $122,696 | $126,923 |
Gross profit | ||
Piping Systems | $26,741 | $30,774 |
Income (loss) from operations | ||
Piping Systems | $10,537 | $12,740 |
Corporate | (7,659) | (6,893) |
Total income from operations | $2,878 | $5,847 |
Segment assets | ||
Piping Systems | $112,161 | $99,065 |
Corporate | 10,229 | 7,533 |
Total segment assets | $122,390 | $106,598 |
Capital expenditures | ||
Piping Systems | $4,762 | $3,953 |
Corporate | 289 | 485 |
Total capital expenditures | $5,051 | $4,438 |
Depreciation and amortization | ||
Piping Systems | $3,735 | $3,635 |
Corporate | 469 | 552 |
Total depreciation and amortization | $4,204 | $4,187 |
Geographic information. Net sales are attributed to a geographic area based on the destination of the product shipment. Sales to foreign customers was 52% in 2015 compared to 50% in 2014. Long-lived assets are based on the physical location of the assets and consist of property, plant and equipment used in the generation of revenues in the geographic area.
2015 | 2014 | |
Net sales | ||
United States | $58,707 | $64,063 |
Middle East | 60,749 | 50,430 |
Europe | 73 | 372 |
Canada | 2,581 | 3,248 |
India | 372 | 5,099 |
Other Americas | 72 | 3,657 |
Other | 142 | 54 |
Total net sales | $122,696 | $126,923 |
Property, plant and equipment, net of accumulated depreciation | ||
United States | $13,822 | $12,166 |
Middle East | 11,211 | 11,608 |
India | 367 | 391 |
Total | $25,400 | $24,165 |
29
Note 2 - Significant accounting policies
Use of estimates. The preparation of financial statements in conformity with U.S. generally accepted accounting principles requires management to make estimates and assumptions that affect the reported amounts of assets and liabilities and disclosures of contingent assets and liabilities at the date of the financial statements, and the reported amounts of revenues and expenses during the reporting period. Actual results could differ from those estimates.
Revenue recognition. The Company recognizes revenues including shipping and handling charges billed to customers, when all the following criteria are met: (i) persuasive evidence of an arrangement exists, (ii) delivery has occurred or services have been rendered, (iii) the seller's price to the buyer is fixed or determinable, and (iv) collectability is reasonably assured. All subsidiaries of the Company, except as noted below, recognize revenues upon shipment or delivery of goods or services when title and risk of loss pass to customers.
Percentage of completion revenue recognition. All divisions recognize revenues under the above stated revenue recognition policy except for domestic complex contracts that require periodic recognition of income. For these contracts, the Company uses the "percentage of completion" accounting method. Under this approach, income is recognized in each reporting period based on the status of the uncompleted contracts and the current estimates of costs to complete. The choice of accounting method is made at the time the contract is received based on the expected length and complexity of the project. The percentage of completion is determined by the relationship of costs incurred to the total estimated costs of the contract. Provisions are made for estimated losses on uncompleted contracts in the period in which such losses are determined. Changes in job performance, job conditions, and estimated profitability, including those arising from contract penalty provisions and final contract settlements, may result in revisions to costs and income. Such revisions are recognized in the period in which they are determined. Claims for additional compensation due the Company are recognized in contract revenues when realization is probable and the amount can be reliably estimated.
Shipping and handling. Shipping and handling costs are included in cost of sales, and the amounts invoiced to customers relating to shipping and handling are included in net sales.
Sales tax. Sales tax is reported on a net basis in the consolidated financial statements.
Operating cycle. The length of piping systems contracts vary, but are typically less than one year. The Company includes in current assets and liabilities amounts realizable and payable in the normal course of contract completion unless completion of such contracts extends significantly beyond one year.
Consolidation. The consolidated financial statements include the accounts of the Company and its domestic and foreign subsidiaries, all of which are wholly owned. All significant intercompany balances and transactions have been eliminated. The Company accounts for the investment in joint venture using the equity method.
Translation of foreign currency. Assets and liabilities of consolidated foreign subsidiaries are translated into U.S. dollars at exchange rates in effect at year-end. Revenues and expenses are translated at average weighted exchange rates prevailing during the year. Gains or losses on foreign currency transactions and the related tax effects are reflected in net income. The resulting translation adjustments are included in stockholders' equity as part of accumulated other comprehensive income (loss).
Contingencies. The Company is subject to various legal proceedings and claims that arise in the ordinary course of business, including those involving environmental, tax, product liability and general liability claims. The Company accrues for such liabilities when it is probable that future costs will be incurred and such costs can be reasonably estimated. Such accruals are based on developments to date, the Company's estimates of the outcomes of these matters, and its experience in contesting, litigating and settling other similar matters. The Company does not currently anticipate the amount of any ultimate liability with respect to these matters will materially affect the Company's financial position, liquidity or future operations.
30
Cash and cash equivalents. All highly liquid investments with a maturity of three months or less when purchased are considered to be cash equivalents. Cash and cash equivalents were $16.6 million and $9.9 million as of January 31, 2016 and 2015, respectively. At January 31, 2016, $0.2 million was held in the U.S. and $16.4 million was held in the foreign subsidiaries.
Accounts payable included drafts payable of $0.3 million and $0.6 million as of January 31, 2016 and 2015, respectively.
Restricted cash. Restricted cash held by a foreign subsidiary were $2.3 million and $0.4 million as of January 31, 2016 and 2015, respectively.
Accounts receivable. The majority of the Company's accounts receivable are due from geographically dispersed contractors and manufacturing companies. Credit is extended based on an evaluation of a customer's financial condition, including the availability of credit insurance. In the U.S. collateral is not generally required. In the U.A.E. and Saudi Arabia, letters of credit are obtained for material orders. Accounts receivable are due within various time periods specified in the terms applicable to the specific customer and are stated at amounts due from customers net of an allowance for claims and doubtful accounts. The allowance for doubtful accounts is calculated using a percentage of sales method based upon collection history and an estimate of uncollectible accounts. Management may exercise its judgment in adjusting the provision as a consequence of known items, such as current economic factors and credit trends. Past due trade accounts receivable balances are written off when the Company's collection efforts have been unsuccessful in collecting the amount due. Accounts receivable adjustments are recorded against the allowance for doubtful accounts.
Concentration of credit risk. The Company maintains its U.S. cash in bank deposit accounts at financial institutions that are insured by the Federal Deposit Insurance Corporation ("FDIC"). Cash balances may exceed FDIC limits. The Company has not experienced any losses in such accounts. The Company has a broad customer base doing business in all regions of the U.S. as well as other areas in the world. At January 31, 2016, one customer accounted for 10.3% of the Company's net sales. At January 31, 2015, one customer accounted for 17.2% of the Company's net sales.
Two customers accounted for 46.4% of accounts receivable at January 31, 2016, and and one customer accounted for 37.4% of accounts receivable at January 31, 2015. As of April 1, 2016, these customers have paid 40.4% of their receivables outstanding at January 31, 2016.
Accumulated other comprehensive loss. Represents the change in equity from non-owner transactions and consisted of foreign currency translation, minimum pension liability and interest rate swaps.
2015 | 2014 | |||||
Equity adjustment foreign currency | ($2,208 | ) | ($1,722 | ) | ||
Minimum pension liability, gross | (2,303) | (3,124) | ||||
Marketable security, gross | 118 | 0 | ||||
Interest rate swap, gross | 0 | (119) | ||||
Subtotal excluding tax effect | (4,393) | (4,965) | ||||
Tax effect of foreign exchange | (69) | (74) | ||||
Tax effect of minimum pension liability | 482 | 481 | ||||
Tax effect of interest rate swap | 0 | 28 | ||||
Total other comprehensive loss | ($3,980) | ($4,530) | ||||
31
Inventories. Inventories are stated at the lower of cost or market. Cost is determined using the first-in, first-out method for all inventories.
2015 | 2014 | |
Raw materials | $15,291 | $13,150 |
Work in process | 1,168 | 887 |
Finished goods | 722 | 715 |
Subtotal | 17,181 | 14,752 |
Less allowances | 1,556 | 1,067 |
Inventories, net | $15,625 | $13,685 |
Long-lived assets. Property, plant and equipment are stated at cost. Interest is capitalized in connection with the construction of facilities and amortized over the asset's estimated useful life. Long-lived assets are reviewed for possible impairment whenever events indicate that the carrying amount of such assets may not be recoverable. If such a review indicates impairment, the carrying amount of such assets is reduced to an estimated fair value.
Depreciation is computed using the straight-line method over the estimated useful lives of the assets, which range from three to 30 years. Leasehold improvements are depreciated over the remaining life of the lease or its useful life, whichever is shorter. Amortization of assets under capital leases is included in depreciation and amortization. Depreciation expense was approximately $4.2 million in 2015 and in 2014.
2015 | 2014 | |
Land, buildings and improvements | $14,758 | $13,704 |
Machinery and equipment | 41,534 | 38,509 |
Furniture, office equipment and computer systems | 5,632 | 5,945 |
Transportation equipment | 40 | 43 |
Subtotal | 61,964 | 58,201 |
Less accumulated depreciation and amortization | 36,564 | 34,036 |
Property, plant and equipment, net | $25,400 | $24,165 |
Impairment of long-lived assets. The Company evaluates long-lived assets (including intangible assets) for impairment whenever events or changes in circumstances indicate that the carrying amount of a long-lived asset may not be recoverable. An asset is considered impaired if its carrying amount exceeds the undiscounted future net cash flow the asset is expected to generate. There was no impairment of long-lived assets in continuing operations as of January 31, 2016 and January 31, 2015.
The Company's headquarters' building in Niles, Illinois is reported as held for sale at January 31, 2016. There are no indications of impairment related to this asset.
Other intangible assets with definite lives. The Company owns several patents including those covering features of its piping and electronic leak detection systems. Patents are capitalized and amortized on a straight-line basis over a period not to exceed the legal lives of the patents. The Company expenses costs incurred to renew or extend the term of intangible assets. Gross patents were $2.6 million and $2.7 million as of January 31, 2016 and 2015, respectively. Accumulated amortization was approximately $2.3 million and $2.3 million as of January 31, 2016 and 2015, respectively. Future amortizations over the next five years ending January 31 will be $42,900 in 2016, $39,900 in 2017, $30,900 in 2018, $27,900 in 2019, $21,700 in 2020, and $88,207 thereafter.
Investment in joint venture. In October 2009, the Company invested $5.9 million, which consisted of $2.0 million for a 49% interest and $3.9 million for a note receivable, in a Canadian joint venture with The Bayou Companies, Inc., a subsidiary of Aegion Corporation. The joint venture operates in Camrose, Alberta, Canada. During the first six months of 2015, the Company received $1.9 million in principal repayments on the note receivable.
32
On December 31, 2015, MFRI entered into a purchase agreement with its joint venture partner Aegion Corporation to acquire 100% ownership of BPPC, which acquisition closed on February 4, 2016. The purchase price was approximately $9.6 million in cash and debt at closing and is subject to certain post-closing adjustments.
The Company accounts for the investment in joint venture using the equity method. The financial results are included in the Company's consolidated financial statements.
2015 | 2014 | |
Share of income from joint venture | $602 | $1,960 |
The following information summarizes the joint venture financial data:
2015 | 2014 | |
Current assets | $8,274 | $13,820 |
Noncurrent assets | 12,284 | 14,023 |
Current liabilities | 2,438 | 4,499 |
Noncurrent liabilities | 3,908 | 9,013 |
Equity | 14,212 | 14,331 |
Revenue | 22,228 | 40,397 |
Gross profit | 3,465 | 8,451 |
Income from continuing operations | 1,938 | 6,397 |
Net income | 1,228 | 4,000 |
Research and development. Research and development expenses consist of materials, salaries and related expenses of engineering personnel and outside services for product development projects. Research and development costs are expensed as incurred. Research and development expense was approximately $1.1 million in 2015 and $1.2 million in 2014.
Income taxes. Deferred income taxes have been provided for temporary differences arising from differences in the basis of assets and liabilities for tax and financial reporting purposes. Deferred income taxes on temporary differences have been recorded at the current tax rate. The Company assesses its deferred tax assets and liabilities for realizability at each reporting period.
The Company recognizes the financial statement benefit of a tax position only after determining that the relevant tax authority would more likely than not sustain the position following an audit. For tax positions meeting the more likely than not threshold, the amount recognized in the financial statements is the largest benefit that has a greater than 50 percent likelihood of being realized upon ultimate settlement with the relevant tax authority. For further information, see Note 9 - Income taxes in the Notes to Consolidated Financial Statements.
Net loss per common share. Earnings per share ("EPS") are computed by dividing net loss by the weighted average number of common shares outstanding (basic). The years 2014 and 2015 had net losses; therefore, the diluted loss per share was identical to the basic loss per share rather than assuming conversion, exercise, or contingent issuance of securities that would have an anti-dilutive effect on earnings per share. The years 2014 and 2015 had earnings from continuing operations. The EPS from continuing are computed by dividing income by the weighted average number of common shares outstanding (basic). The dilutive shares are in the following table:
33
Basic weighted average number of common shares outstanding | 2015 | 2014 | ||
Basic weighted average number of common shares outstanding | 7,280 | 7,251 | ||
Dilutive effect of stock options, deferred stock and restricted stock units | 91 | 73 | ||
Weighted average number of common shares outstanding assuming full dilution | 7,371 | 7,324 | ||
Weighted average number of stock options not included in the computation of diluted EPS of common stock because the option exercise prices exceeded the average market prices | 710 | 261 | ||
Canceled options during the year | (77 | ) | (64 | ) |
Stock options with an exercise price below the average stock price | 10 | 503 | ||
Equity-based compensation. The Company issues various types of stock-based awards to employees and directors: restricted stock, deferred stock and stock options. Compensation expense associated with restricted and deferred stock is based on the fair value of the common stock on the date of grant. Stock compensation expense for stock options is recognized ratably over the requisite service period of the award. The Black-Scholes option-pricing model is utilized to estimate the fair value of option awards. Determining the fair value of stock options using the Black-Scholes model requires judgment, including estimates for (1) risk-free interest rate - an estimate based on the yield of zero-coupon treasury securities with a maturity equal to the expected life of the option; (2) expected volatility - an estimate based on the historical volatility of the Company's common stock; and (3) expected life of the option - an estimate based on historical experience including the effect of employee terminations.
Fair value of financial instruments. The carrying values of cash and cash equivalents, accounts receivable and accounts payable are reasonable estimates of their fair value due to their short-term nature. The carrying amount of the Company's short-term debt, revolving line of credit and long-term debt approximate fair value because the majority of the amounts outstanding accrue interest at variable rates.
The Company holds a marketable equity security of approximately $0.1 million at January 31, 2016, which it classifies as available-for-sale and recorded in other non-current assets on the Consolidated Balance Sheet. This security is carried at estimated fair value with unrealized gains and losses reflected in Accumulated Other Comprehensive Income and classified as Level 1 in the fair value hierarchy. The assessment for impairment of marketable equity securities as available-for sale is based on established financial methodologies, including quoted market prices for publicly traded securities. If the Company determines that a loss in the value of the investment is other than temporary, any such losses are recorded in other expense (income), net.
Reclassifications. Reclassifications were made to prior-year financial statements to conform to the current-year presentations.
Recent accounting pronouncements. In 2016, the Financial Accounting Standards Board ("FASB") issued new guidance related accounting for equity investments, financial liabilities under the fair value option, and the presentation and disclosure requirements for financial instruments. In addition, the FASB clarified guidance related to the valuation allowance assessment when recognizing deferred tax assets resulting from unrealized losses on available-for-sale debt securities. The new standard is effective for fiscal years, and interim periods within those fiscal years, beginning after December 15, 2017. The Company is evaluating the impact of adopting this new accounting guidance on the consolidated financial statements.
In February 2016, the FASB issued Accounting Standards Update (“ASU”) 2016-02, Leases (Topic 842). This ASU requires entities to recognize assets and liabilities for most leases on their balance sheets. It also requires additional qualitative and quantitative disclosures to help investors and other financial statement users better understand the amount, timing, and uncertainty of cash flows arising from leases. ASU No. 2016-02 is effective for fiscal years, and interim periods within those fiscal years, beginning after December 15, 2018, with early adoption permitted. The Company is currently evaluating the effect that this standard will have on the consolidated financial statements and related disclosures.
34
In November 2015, the FASB issued ASU 2015-17, Balance Sheet Classification of Deferred Taxes. The ASU requires entities to classify deferred tax liabilities and assets as noncurrent in a classified statement of financial position. This ASU is effective for fiscal years beginning after December 15, 2016, and interim periods within those annual periods. Early adoption is permitted for all entities as of the beginning of an interim or annual reporting period. The adoption of this guidance by the Company did not have a material impact on the Company's consolidated financial statements.
In 2015, the FASB issued new guidance related to business combinations. The new guidance requires that adjustments made to provisional amounts recognized in a business combination be recorded in the period such adjustments are determined, rather than retrospectively adjusting previously reported amounts. The new standard is effective for fiscal years, and interim periods within those fiscal years, beginning after December 15, 2015. Early adoption is permitted. The Company is evaluating the impact, if any, of adopting this new accounting guidance on the consolidated financial statements.
In April 2015, the FASB issued authoritative guidance to simplify the balance sheet presentation of debt issuance costs. Under the new guidance, debt issuance costs will be presented as a reduction of the carrying amount of the debt liability. The guidance is effective for the Company beginning February 1, 2016 and will be applied retrospectively for all periods presented. As of January 31, 2016, the Company had $0.2 million of deferred debt issuance costs. The Company does not expect adoption of this guidance to have a material impact on the Company's financial statements.
In August 2014, the Financial Accounting Standards Board, ("FASB"), issued ASU No. 2014-15, Presentation of Financial Statements - Going Concern (Subtopic 205-40) - Disclosure of Uncertainties about an Entity’s Ability to Continue as a Going Concern (“ASU 2014-15”). ASU 2014-15 provides guidance about management’s responsibility to evaluate whether there is substantial doubt about an entity’s ability to continue as a going concern and to provide related footnote disclosures. ASU 2014-15 is effective for annual periods ending after December 15, 2016, and for annual periods and interim periods thereafter. Early adoption is permitted. The adoption of ASU 2014-15 is not expected to have an impact on the Company’s consolidated financial statements.
In May 2014, the FASB, issued Accounting Standards Update (“ASU”) 2014-09, Revenue from Contracts with Customers. This new standard provides for a single comprehensive model and supersedes most current revenue recognition guidance, including industry specific guidance, and provides for enhanced disclosure requirements. The objective of the new guidance is to improve the consistency, comparability and usefulness to users of financial statements. On April 1, 2015, FASB decided to defer the effective date of the new revenue standard by one year. As a result, public entities would apply the new revenue standard for fiscal years, and interim periods within those years, beginning after December 15, 2017. ASU 2014-09 provides for two implementation methods (1) full retrospective application to each prior period or (2) modified retrospective application with the cumulative effect as of the date of adoption. Early application is not permitted. The Company is evaluating the financial statement impacts of the guidance in this ASU and determining which transition method will be utilized.
The Company evaluated other recent accounting pronouncements and does not expect them to have a material impact on the consolidated financial statements.
Note 3 - Correction of immaterial errors. In the fourth quarter of 2015, management discovered prior period inventory errors relating to excess and obsolete inventory. The cumulative adjustment for the inventory errors covering the period from February 1, 2013 to January 31, 2015 was approximately $0.9 million. The adjustment applicable to the fourth quarter of 2013 was approximately $1.0 million, no adjustment to the first three quarters of 2013. The $0.1 million adjustment was applicable to the fourth quarter of 2014, and no adjustment was applicable to the first three quarters of 2015.
Pursuant to the guidance of Staff Accounting Bulletin ("SAB") No. 99, Materiality, the Company concluded that the errors were not material to any of its prior period financial statements. Although the errors were immaterial to prior
35
periods, the prior period financial statements were revised, in accordance with SAB No. 108, Considering the Effects of Prior Year Misstatements when Quantifying Misstatements in Current Year Financial Statements, due to the significance of the out-of-period correction.
A reconciliation of the effects of the adjustments to the previously reported balance sheet at January 31, 2015 follows:
As Reported | Adjustment | As Adjusted | ||||
Inventories, net | $14,613 | ($928) | $13,685 | |||
Prepaid expenses and other current assets | 2,345 | 205 | 2,550 | |||
Total current assets | 110,427 | (723 | ) | 109,704 | ||
Total assets | 148,797 | (723 | ) | 148,074 | ||
Retained earnings | 25,325 | (723 | ) | 24,602 | ||
Total stockholders' equity | 73,523 | (723 | ) | 72,800 | ||
Total liabilities and stockholders' equity | 148,797 | (723 | ) | 148,074 | ||
A reconciliation of the effects of the adjustments to the previously reported statement of operations for the year
ending January 31, 2015 follows:
As Reported | Adjustment | As Adjusted | ||||
Cost of sales | $96,247 | ($98) | $96,149 | |||
Gross profit | 30,676 | 98 | 30,774 | |||
General and administrative expense | 19,179 | 23 | 19,202 | |||
Total operating expenses | 24,904 | 23 | 24,927 | |||
Income from operations | 5,772 | 75 | 5,847 | |||
Income from continuing operations before income taxes | 7,213 | 75 | 7,288 | |||
Income from continuing operations | 4,162 | 75 | 4,237 | |||
Net loss | (256 | ) | 75 | (181 | ) | |
A reconciliation of the effects of the adjustments to the previously reported statement of cash flows for the year ending January 31, 2015 follows:
As Reported | Adjustment | As Adjusted | ||||
Net loss | ($256) | $75 | ($181) | |||
Inventories, net | 3,348 | (98 | ) | 3,250 | ||
Prepaid expenses and other current assets | 977 | 23 | 1,000 | |||
A reconciliation of the effects of the adjustments to the previously reported statement of stockholders' equity for the year ending January 31, 2015 follows:
As Reported | Adjustment | As Adjusted | ||||
Net loss | ($256) | $75 | ($181) | |||
Retained earnings | 25,325 | (723 | ) | 24,602 | ||
Total comprehensive loss | (3,626 | ) | 75 | (3,551 | ) | |
36
A reconciliation of the effects of the adjustments to the previously reported statement of stockholders' equity for the year ending January 31, 2014 follows:
As Reported | Adjustment | As Adjusted | ||||
Retained earnings | $25,580 | ($797) | $24,783 | |||
Stockholders' Equity | 76,636 | (797 | ) | 75,839 | ||
Note 4 - Discontinued operations
On January 29, 2016, the Company sold certain assets and liabilities of its TDC Filter business based in Bolingbrook, Illinois to the Industrial Air division of CLARCOR, a NYSE-listed company based in Franklin, Tennesse. On January 29, 2016, the Company also sold its Nordic Air Filtration, Denmark and Nordic Air Filtration, Middle East businesses to Hengst Holding GmbH. The purchase price of these Illinois and international filtration businesses was $22.0 million, including cash proceeds of $18.4 million, of which $1.9 million is held in escrow until July 2017. The remaining domestic fabric filter business, which is included in held for sale, is operational and selling product as of January 31, 2016. These businesses are reported as discontinued operations in the consolidated financial statements and the notes to consolidated financial statements have been revised to conform to the current year reporting. There was $0.1 million of tax expense for the period ended January 31, 2016 . Loss from discontinued operations net of tax was $6.0 million and $4.4 million for the years ended January 31, 2016 and 2015, respectively.
Impairment. The Company evaluates assets for impairment whenever events or changes in circumstances indicate that the carrying amount may not be recoverable. An asset is considered impaired if its carrying amount exceeds the undiscounted future net cash flow the asset is expected to generate. In the fourth quarter, Filtration Product's recorded a $6.5 million impairment expense relating to the Virginia facility
Results of the discontinued operations were as follows:
2015 | 2014 | |||||
Net sales | $64,975 | $68,110 | ||||
Gain on disposal of discontinued operations | $8,099 | $188 | ||||
Impairment expense from discontinued operations | (6,480 | ) | — | |||
Loss from discontinued operations | (7,569 | ) | (4,282 | ) | ||
Loss from discontinued operations before income taxes | (5,950 | ) | (4,094 | ) | ||
Income tax expense | 94 | 324 | ||||
Loss from discontinued operations, net of tax | ($6,044 | ) | ($4,418 | ) | ||
37
Components of assets, and liabilities from discontinued operations consist of the following:
January 31, | ||||||
2016 | 2015 | |||||
Current assets | ||||||
Cash and cash equivalents | $5 | $608 | ||||
Trade accounts receivable, net | 5,720 | 7,516 | ||||
Inventories, net | 2,000 | 15,157 | ||||
Other assets | 349 | 2,003 | ||||
Property, plant and equipment, net of accumulated depreciation | 6,456 | 14,477 | ||||
Non-current assets | 1,203 | 1,715 | ||||
Total assets from discontinued operations | $15,733 | $41,476 | ||||
Current liabilities | ||||||
Trade accounts payable, accrued expenses and other | $7,514 | $10,016 | ||||
Current maturities of long-term debt | 5,322 | 806 | ||||
Long-term liabilities | 2,629 | 10,557 | ||||
Total liabilities from discontinued operations | 15,465 | 21,379 | ||||
Cashflows from discontinued operations:
January 31, | ||||||
2016 | 2015 | |||||
Net cash used in discontinued operating activities | ($7,113 | ) | ($2,629 | ) | ||
Net cash provided by (used in) discontinued investing activities | 17,026 | (1,425 | ) | |||
Net cash (used in) provided by discontinued financing activities | (3,025 | ) | 4,219 | |||
Note 5 - Retention
Retention receivable is the amount withheld by a customer until a contract is completed. Retention receivables of $2.8 million and $5.7 million were included in the balance of trade accounts receivable as of January 31, 2016 and 2015, respectively. Retention receivable of $3.2 million was included in the balance of other long-term assets as of January 31, 2016 due to the long-term nature of the receivables.
Note 6 - Costs and estimated earnings on uncompleted contracts
2015 | 2014 | |
Costs incurred on uncompleted contracts | $78,843 | $66,547 |
Estimated earnings | 46,359 | 31,082 |
Earned revenue | 125,202 | 97,629 |
Less billings to date | 123,915 | 97,610 |
Costs in excess of billings, net | $1,287 | $19 |
Balance sheet classification | ||
Costs and estimated earnings in excess of billings on uncompleted contracts | $2,463 | $700 |
Billings in excess of costs and estimated earnings on uncompleted contracts | (1,176) | (681) |
Costs in excess of billings, net | $1,287 | $19 |
Note 7 - Debt
2015 | 2014 | |||
Revolving line domestic | $5,237 | $11,353 | ||
Mortgage notes | 1,443 | 1,530 | ||
Revolving lines foreign | 8,131 | 2,774 | ||
Term loans | 246 | 1,808 | ||
Capitalized lease obligations | 442 | 1,060 | ||
Total debt | 15,499 | 18,525 | ||
Less current maturities | 14,006 | 16,170 | ||
Total long-term debt | $1,493 | $2,355 | ||
The following table summarizes the Company's scheduled maturities at January 31:
Total | 2017 | 2018 | 2019 | 2020 | 2021 | Thereafter | |||||||||||||
Revolving line domestic | $5,237 | $5,237 | $— | $— | $— | $— | $— | ||||||||||||
Mortgages | 1,443 | 97 | 102 | 107 | 112 | 117 | 908 | ||||||||||||
Revolving line foreign | 8,131 | 8,131 | — | — | — | — | — | ||||||||||||
Term loans | 246 | 165 | 81 | — | — | — | — | ||||||||||||
Capitalized lease obligations | 442 | 376 | 66 | — | — | — | — | ||||||||||||
Total | $15,499 | $14,006 | $249 | $107 | $112 | $117 | $908 | ||||||||||||
On September 24, 2014, the Company entered into a credit and security agreement with a financial institution (as amended, "Credit Agreement"). Under the terms of the Credit Agreement, which matures on September 24, 2019, the Company can borrow up to $25.0 million, subject to borrowing base and other requirements, under a revolving line of credit. The Credit Agreement covenants restrict debt, liens, and certain investments, and require attainment of specific levels of profitability and cash flows when reaching certain levels of availability. Interest rates are based on options selected by the Company as follows: (a) a margin in effect plus a base rate, if below certain availability limits; or (b) a margin in effect plus the Eurodollar rate for the corresponding interest period. At January 31, 2016, the Company was in compliance with all covenants under the Credit Agreement. The domestic revolving line balance as of January 31, 2015 and January 31, 2016 was included as a current liability on the consolidated balance sheets.
At January 31, 2016, the Company had borrowed $5.2 million at 3.25% and 1.5% and had $8.3 million available to it under the revolving line of credit. In addition, $0.3 million of availability was used under the Credit Agreement primarily to support letters of credit to guarantee amounts committed for inventory purchases. Cash required for operations is provided by draw-downs on the line of credit.
On February 29, 2016, the Company reduced the amount that can be borrowed under the Credit Agreement to $15.0 million.
Revolving lines foreign. The Company also has credit arrangements used by its Middle Eastern subsidiaries. These credit arrangements are in the form of overdraft facilities and project financing at rates competitive in the countries in which the Company operates. The lines are secured by certain equipment, certain assets, such as accounts receivable and inventory, and a guarantee by the Company. Some credit arrangement covenants requires a minimum tangible net worth to be maintained. At January 31, 2016, the Company was in compliance with the covenant under the credit arrangement. Interest rates are 4.0% per annum below National Bank of Fujairah Base Rate, minimum 3.5% per annum and Emirates Inter Bank Offered Rate (EIBOR) plus 3.5% per annum. The Company's interest rates range from 3.5% to 6.0% at January 31, 2016. At January 31, 2016, the Company can borrow $43.8 million under these credit arrangements. The Company borrowed $8.1 million and had $28.7 million available under these credit arrangements as of January 31, 2016. In addition, $7.0 million of availability was used to support letters of credit to guarantee amounts committed for inventory purchases.
The Company has a revolving line for 50 million Saudi Riyal (approximately $13.3 million U.S. dollars at the prevailing exchange rate on the transaction date) from a Saudi Arabian bank. The loan has an interest rate of approximately 6% and matures September 2016.
The Company has a revolving line for 40 million Dirhams (approximately $10.9 million U.S. dollars at the prevailing exchange rate on the transaction date) from a bank in the U.A.E. The loan has an interest rate of approximately 6% and matures June 2016.
The Company has a revolving line for 71.6 million Dirhams (approximately $19.5 million U.S. dollars at the prevailing exchange rate on the transaction date) from a bank in the U.A.E. The loan has an interest rate of approximately 6% and matures November 2016.
The Company guarantees the subsidiaries' debt including all foreign debt.
Mortgages. On June 19, 2012, Perma-Pipe, Inc. borrowed $1.8 million under a mortgage note secured by its manufacturing facility in Lebanon, Tennessee. The proceeds were used for payment of amounts borrowed. The loan bears interest at 4.5% with monthly payments of $13 thousand for both principal and interest and matures July 1, 2027. On June 19, 2022, and on the same day of each year thereafter, the interest rate shall adjust to the prime rate, provided that the applicable interest rate shall not adjust more than 2.0% per annum and shall be subject to ceiling of 18.0% and a floor of 4.5%.
38
On March 4, 2008, the Company borrowed $5.4 million under a mortgage note secured by the Filtration Products manufacturing facility located in Bolingbrook, Illinois that matures March 2033. The 25 year mortgage resets its interest rate every five years based on a published index. The interest rate is 4.04% with monthly payments of $30 thousand for principal and interest combined. This mortgage is reported in liabilities of discontinued operations.
On January 18, 2008, the Company borrowed $3.7 million under a mortgage note secured by its manufacturing and office facility in Niles, Illinois. The loan bears interest at 6.3% with monthly payments of $23 thousand for both principal and interest based on an amortization schedule of thirty years with a balloon payment at maturity in January 2018. This mortgage is reported in current liabilities held for sale.
Term loans. Between March 2015 and September 2015, the Company obtained loans in the amount of 1.3 million Dirhams (approximately $341 thousand U.S. dollars at the exchange rate prevailing on the transaction dates). The loans bear interest at 5.0% and 6.0% with monthly payments of $17 thousand for both principal and interest and mature between April 1, 2017 and October 31, 2017.
Capital leases. On May 1, 2012, Piping Systems borrowed $0.4 million under an equipment loan secured by equipment. The loan bears interest at 6.5% with monthly payments of $8 thousand for both principal and interest and matures June 2017.
On January 31, 2012, Perma-Pipe, Inc. borrowed $1.2 million under an equipment loan secured by equipment. The loan bears interest at 6.7% with monthly payments of $24 thousand for both principal and interest and matures January 2017.
In 2013 and 2014, Piping Systems obtained two capital leases totaling 1.5 million Indian Rupees (approximately $24 thousand U.S. dollars at the prevailing exchange rate on the transaction date) to finance vehicle equipment. The interest rates for these capital leases range from 12.8% to 18.2% per annum with monthly principal and interest payments of $1 thousand, and the leases mature in 2016 and 2017.
Note 8 - Lease information
Property under capitalized leases | 2.015 | 2.014 | ||
Machinery and equipment | $1,747 | $1,803 | ||
Transportation equipment | 22 | 24 | ||
Computer equipment | — | 92 | ||
Subtotal | 1,769 | 1,919 | ||
Less accumulated amortization | 726 | 691 | ||
Total | $1,043 | $1,228 | ||
The Company has several significant operating lease agreements as follows:
• | Nine acres of land in the Kingdom of Saudi Arabia is leased through 2030. |
• | Land for production facilities in the U.A.E. of approximately 80,200 square feet is leased until June 30, 2030. Office space and land for production facilities of approximately 21,500 square feet in the U.A.E. is leased until July 2032. |
The Company leases its administrative offices in the U.A.E. from a partnership in which a Company employee is a partner. Total rent paid to the partnership was $0.3 million in 2015 and 2014, respectively.
39
At January 31, 2016, future minimum annual rental commitments under non-cancelable lease obligations were as follows:
Operating Leases | Capital Leases | |||
2016 | $1,944 | $1,386 | ||
2017 | 1,640 | 67 | ||
2018 | 1,378 | — | ||
2019 | 1,311 | — | ||
2020 | 1,327 | — | ||
Thereafter | 10,066 | — | ||
Subtotal | 17,666 | 1,453 | ||
Less Amount representing interest | 22 | |||
Future minimum lease payments | $17,666 | $1,431 | ||
Rental expense for operating leases was $0.7 million and $0.8 million in 2015 and 2014, respectively.
Note 9 - Income taxes
Income (loss) from continuing operations | 2015 | 2014 | ||
Domestic | ($2,066) | $1,968 | ||
Foreign | 5,076 | 5,320 | ||
Total | $3,010 | $7,288 | ||
Components of income tax expense (benefit) | 2015 | 2014 | ||
Current | ||||
Federal | $12 | $49 | ||
Foreign | 1,541 | 1,851 | ||
State and other | 71 | (80 | ) | |
Subtotal | 1,624 | 1,820 | ||
Deferred | ||||
Federal | — | — | ||
Foreign | (249 | ) | 1,231 | |
State and other | — | — | ||
Subtotal | (249 | ) | 1,231 | |
Total | $1,375 | $3,051 | ||
The determination of the consolidated provision for income taxes, deferred tax assets and liabilities, and the related valuation allowances requires management to make judgments and estimates. As a company with subsidiaries in foreign jurisdictions, the Company is required to calculate and provide for estimated income tax expense for each of the tax jurisdictions. The process of calculating income taxes involves estimating current tax obligations and exposures in each jurisdiction as well as making judgments regarding the future recoverability of deferred tax assets. Changes in the estimated level of annual pre-tax income, in tax laws, and resulting from tax audits can affect the overall effective tax rate ("ETR"), which impacts the level of income tax expense and net income. Judgments and estimates related to the Company's projections and assumptions are inherently uncertain; therefore, actual results could differ materially from projections.
ETR in 2015 was higher than the statutory U.S. federal income tax rate, mainly due to the impact of the full valuation allowance maintained against domestic deferred tax assets and the recognition of foreign earnings
40
resulting from the dispositions of certain foreign operations. The Company remains in an NOL carryforward position.
During the fourth quarter of 2015, the Company sold its foreign filtration operations, the gain from which was taxable in the U.S. As such, the Company no longer considers the earnings of the remaining Denmark subsidiary permanently reinvested. Therefore, the Company has recorded a deferred tax liability of $0.2 million related to the U.S. federal and state income taxes on approximately $0.7 million of undistributed earnings.
The Company has not provided Federal tax on remaining unremitted earnings of its Middle East subsidiaries. The Company does not believe that it will be necessary to repatriate earnings from these subsidiaries. The Company intends and has the ability to reinvest these earnings for the foreseeable future outside the U.S. If these amounts were distributed to the U.S., in the form of dividends or otherwise, the Company could be subject to additional U.S. income taxes. Determination of the amount of unrecognized deferred income tax liabilities on these earnings is not practicable, because such liability, if any, is dependent on circumstances existing if and when remittance occurs.
During the fourth quarter of 2014, the Company concluded that not all of the undistributed earnings of Perma-Pipe India Ltd, will remain permanently reinvested outside the U.S. and are available for use in the U.S. or in entities in other foreign countries. As such, the Company recorded a deferred tax liability of $0.2 million and $0.9 million for the periods ending January 31, 2016 and 2015, respectively, related to the U.S. federal and state income taxes and foreign withholding taxes on approximately $2.8 million and $4.2 million of undistributed earnings. The decrease in deferred tax liability primarily relates to a $2.0 million dividend paid during January 2016 along with a decrease in accumulated earnings and profits. Future earnings related to this subsidiary are not deemed permanently reinvested. No U.S. cash tax payments will be made upon distribution of these foreign earnings as long as the Company has sufficient tax attributes in the U.S. to reduce the cash tax consequences of potential repatriation.
The difference between the provision for income taxes and the amount computed by applying the Federal ETR of 34% was as follows:
2015 | 2014 | |||||
Tax benefit at federal statutory rate | $1,023 | $2,478 | ||||
Permanent differences management fee allocation | 619 | 1,946 | ||||
Domestic valuation allowance | 804 | — | ||||
Permanent differences other | 214 | (540 | ) | |||
Valuation allowance for state NOLs | 88 | (318 | ) | |||
Differences in foreign tax rate | (780 | ) | (291 | ) | ||
Foreign tax credit | (761 | ) | (793 | ) | ||
Domestic deferred tax true ups | (346 | ) | — | |||
Research tax credit | (54 | ) | (29 | ) | ||
Repatriation | 821 | 1,530 | ||||
Valuation allowance for foreign NOLs | 32 | 35 | ||||
Nontaxable income from the Canadian joint venture | (205 | ) | (666 | ) | ||
State taxes, net of federal benefit | (58 | ) | (131 | ) | ||
All other, net expense | (22 | ) | (170 | ) | ||
Total | $1,375 | $3,051 | ||||
The Company has a Federal operating loss carryforward of $11.5 million that will begin to expire in the year ending January 31, 2030. In addition, there are suspended excess tax benefits of $0.3 million.
The deferred tax asset ("DTA") for state NOL carryforwards of $1.4 million relates to amounts that expire at various times from 2016 to 2031. The amount that expired in 2015 is approximately $1 thousand.
41
The Company has a DTA foreign NOL carryforward of $0.1 million for its subsidiary in Saudi Arabia that can be carried forward indefinitely and does not have a valuation allowance recorded against it. The ultimate realization of this tax benefit is dependent upon the generation of sufficient operating income in the foreign tax jurisdictions.
The Company periodically reviews the adequacy of its valuation allowance in all of the tax jurisdictions in which it operates, evaluates future sources of taxable income and tax planning strategies and may make further adjustments based on management's outlook for continued profits in each jurisdiction
For the year ending January 31, 2016, the Company has determined that there is not a greater than 50% likelihood that all of the domestic DTAs will be realized based on the available evidence. The Company recorded a full valuation allowance against the remaining domestic net DTAs as of January 31, 2013 net of uncertain tax positions ("UTP"). The Company continues to have a valuation allowance on its domestic DTAs since domestic losses continue to be generated.
The Company has a deferred tax asset of $2.9 million for U.S. foreign tax credits attributed to repatriated foreign earnings. The excess foreign tax credits are subject to a ten-year carryforward and will expire in January 31, 2022. As of January 31, 2016, the Company has not made a provision for U.S. or additional foreign withholding taxes on approximately $40.4 million of undistributed earnings of foreign subsidiaries indefinitely reinvested outside of the U.S., mainly in the Middle East.
Components of deferred income tax assets | 2015 | 2014 | ||
U.S. Federal NOL carryforward | $3,044 | $3,156 | ||
Non-qualified deferred compensation | 2,382 | 2,363 | ||
Research tax credit | 2,057 | 2,032 | ||
Foreign NOL carryforward | 231 | 483 | ||
Foreign tax credit | 2,861 | 2,088 | ||
Stock compensation | 1,061 | 1,033 | ||
Other accruals not yet deducted | 438 | 901 | ||
State NOL carryforward | 1,419 | 1,291 | ||
Accrued commissions and incentives | 723 | 584 | ||
Accrued pension | — | 735 | ||
Inventory valuation allowance | 73 | 430 | ||
Other | 106 | 561 | ||
Inventory uniform capitalization | 10 | 94 | ||
Deferred tax assets, gross | 14,405 | 15,751 | ||
Valuation allowance | (13,333 | ) | (14,201 | ) |
Total deferred tax assets, net of valuation allowances | $1,072 | $1,550 | ||
Components of the deferred income tax liability | ||||
Depreciation | $633 | $851 | ||
Foreign subsidiaries unremitted earnings | 412 | 863 | ||
Prepaid | 88 | 310 | ||
Total deferred tax liabilities | $1,133 | $2,024 | ||
Deferred tax liability, net | $(61) | $(474) | ||
Balance sheet classification | ||||
Long-term assets | $99 | $260 | ||
Long-term liability | 160 | 734 | ||
Total deferred tax liabilities, net of valuation allowances | $(61) | $(474) | ||
42
The following table summarizes UTP activity, excluding the related accrual for interest and penalties:
2.015 | 2.014 | |||
Balance at beginning of the year | $1,288 | $1,358 | ||
Increases in positions taken in a prior period | 11 | 17 | ||
Increases in positions taken in a current period | 14 | — | ||
Decreases due to lapse of statute of limitations | — | (42 | ) | |
Decreases due to settlements | — | (45 | ) | |
Balance at end of the year | $1,313 | $1,288 | ||
Included in the total UTP liability at January 31, 2016 were estimated accrued interest of $28 thousand and penalties of $17 thousand and at January 31, 2015, accrued interest was $17 thousand and penalties were $15 thousand. These non-current income tax liabilities are recorded in other long-term liabilities in the consolidated balance sheet. The Company's policy is to include interest and penalties in income tax expense. At January 31, 2016, the Company did not anticipate any significant adjustments to its unrecognized tax benefits within the next twelve months. Included in the balance at January 31, 2016 were amounts offset by deferred taxes (i.e., temporary differences) or amounts that could be offset by refunds in other taxing jurisdictions (i.e., corollary adjustments). Thus, $1.3 million of the amount accrued at January 31, 2016 would impact the ETR, if reversed.
The Company is subject to income taxes in the U.S. federal jurisdiction, and various states and foreign jurisdictions. Tax regulations within each jurisdiction are subject to the interpretation of the related tax laws and regulations and require significant judgment to apply. In July 2014, the Company received a notice from the Internal Revenue Service that it had concluded the tax audit for the years ended January 31, 2012 and 2013. No changes were made to the reported tax. Tax years back to January 31, 2011 are open for federal and state tax purposes. In addition, federal and state tax years January 31, 2002 through January 31, 2009 are subject to adjustment on audit, up to the amount of research tax credit generated in those years.
The Company's management periodically estimates the probable tax obligations of the Company using historical experience in tax jurisdictions and informed judgments. There are inherent uncertainties related to the interpretation of tax regulations in the jurisdictions in which the Company transacts business. The judgments and estimates made at a point in time may change based on the outcome of tax audits, as well as changes to or further interpretations of regulations. If such changes take place, there is a risk that the tax rate may increase or decrease in any period. Tax accruals for tax liabilities related to potential changes in judgments and estimates for federal, foreign and state tax issues are included in current liabilities on the consolidated balance sheet.
Note 10 - Retirement plans
Pension plan
The defined benefit plan that covered Winchester filtration hourly rated employees was frozen on June 30, 2013 per the third Amendment to the Plan dated May 15, 2013. Per the third amendment, the accrued benefit of each participant was frozen as of the freeze date, and no further benefits shall accrue with respect to any service or hours of service after the freeze date. The benefits are based on fixed amounts multiplied by years of service of participants. The Company engages outside actuaries to calculate its obligations and costs. The funding policy is to contribute such amounts as are necessary to provide for benefits attributed to service to date. The amounts contributed to the plan are sufficient to meet the minimum funding requirements set forth in the Employee Retirement Income Security Act of 1974.
Asset allocation
The plans hold no securities of MFRI, Inc.; 100% of the assets are held for benefits under the plan. The fair value of the major categories of the pension plans' investments are presented below. The FASB has established a fair
43
value hierarchy that distinguishes between (1) market participant assumptions developed based on market data obtained from independent sources (observable inputs) and (2) an entity's own assumptions about market participant assumptions developed based on the best information available in the circumstances (unobservable inputs). The fair value hierarchy consists of three broad levels, which gives the highest priority to unadjusted quoted prices in active markets for identical assets and liabilities (Level 1) and the lowest priority to unobservable inputs (Level 3). The three levels of the fair value hierarchy are described below:
Level 1 - Unadjusted quoted prices in active markets that are accessible at the measurement date for identical, unrestricted assets or liabilities.
Level 2 - Inputs other than quoted prices included within Level 1 that are observable for the asset or liability, either directly or indirectly, including quoted prices for similar assets or liabilities in active markets; quoted prices for identical or similar assets or liabilities in markets that are not active; inputs other than quoted prices that are observable for the asset or liability (e.g., interest rates); and inputs that are derived principally from or corroborated by observable market data by correlation or other means.
Level 3 - Inputs that are both significant to the fair value measurement and unobservable.
Level 1 market value of plan assets | 2015 | 2014 | |
Equity securities | $3,062 | $3,795 | |
U.S. bond market | 2,168 | 2,033 | |
Subtotal | 5,230 | 5,828 | |
Level 2 significant other observable inputs | |||
Money market fund | $351 | $340 | |
Equity securities | 302 | 0 | |
Subtotal | 653 | 340 | |
Total | 5,883 | 6,168 | |
At January 31, 2016, plan assets were held 61% in equity, 31% in debt and 8% in other. The investment policy is to invest all funds not needed to pay benefits and investment expenses for the year, with target asset allocations of 52% equities (with a range of 40% - 65%), 30% fixed income (with a range of 20% - 35%) and 18% Alternative Investments (with a range of 15% - 25%), diversified across a variety of sub-asset classes and investment styles, following a flexible asset allocation approach that will allow the plan to participate in market opportunities as they become available. The expected long-term rate of return on assets is based on historical long-term rates of equity and fixed income investments and the asset mix objective of the funds.
Investment market conditions in 2015 resulted in $25 thousand actual return on plan assets as presented below, which increased the fair value of plan assets at year end. The Company did not change its 8% expected return on plan assets used in determining cost and benefit obligations, which is the return that the Company has assumed during every profitable and unprofitable investment year since 1991. The plan's investments are intended to earn long-term returns to fund long-term obligations, and investment portfolios with asset allocations similar to those of the plan's investment policy have attained such returns over several decades. Future contributions that may be necessary to maintain funding requirements are not expected to materially affect the Company's liquidity.
44
Reconciliation of benefit obligations, plan assets and funded status of plan | 2015 | 2014 | ||
Accumulated benefit obligations | ||||
Vested benefits | $6,587 | $7,626 | ||
Accumulated benefits | $7,020 | $8,129 | ||
Change in benefit obligation | ||||
Benefit obligation - beginning of year | $8,129 | $6,827 | ||
Service cost | — | — | ||
Interest cost | 266 | 299 | ||
Actuarial (gain) loss | (1,115 | ) | 1,249 | |
Benefits paid | (260 | ) | (246 | ) |
Benefit obligation - end of year | $7,020 | $8,129 | ||
Change in plan assets | ||||
Fair value of plan assets - beginning of year | $6,168 | $6,351 | ||
Actual (gain) loss on plan assets | (25 | ) | 63 | |
Benefits paid | (260 | ) | (246 | ) |
Fair value of plan assets - end of year | $5,883 | $6,168 | ||
Unfunded status | $(1,137) | $(1,961) | ||
Balance sheet classification | ||||
Current assets | $326 | $352 | ||
Other assets | 1,166 | 1,163 | ||
Other long-term liabilities | (2,629 | ) | (3,476 | ) |
Net amount recognized | $(1,137) | $(1,961) | ||
Amounts recognized in accumulated other comprehensive loss | ||||
Unrecognized actuarial loss | $2,303 | $3,124 | ||
Net amount recognized | $2,303 | $3,124 | ||
Weighted-average assumptions used to determine net cost and benefit obligations | 2015 | 2014 | ||
End of year benefit obligation | 4.05 | % | 3.35 | % |
Service cost discount rate | 4.50 | % | 4.50 | % |
Expected return on plan assets | 8.00 | % | 8.00 | % |
Rate of compensation increase | N/A | N/A | ||
The discount rate was based on a Citigroup pension discount curve of high quality fixed income investments with cash flows matching the plans' expected benefit payments. The Company determines the expected long-term rate of return on plan assets by performing a detailed analysis of historical and expected returns based on the strategic asset allocation approved by the Board of Directors and the underlying return fundamentals of each asset class. The Company's historical experience with the pension fund asset performance is also considered.
45
Components of net periodic benefit cost | 2015 | 2014 |
Service cost | $0 | $0 |
Interest cost | 266 | 299 |
Expected return on plan assets | (479) | (494) |
Recognized actuarial loss | 210 | 69 |
Net periodic benefit (income) cost | ($3) | ($126) |
Amounts recognized in other comprehensive income | ||||
Actuarial gain (loss) on obligation | $1,115 | $(1,249) | ||
Actual (loss) gain on plan assets | (294 | ) | (362 | ) |
Total in other comprehensive income (loss) | $821 | $(1,611) | ||
Other comprehensive income is also affected by the tax effect of the valuation allowance recorded on the domestic deferred tax assets. | ||||
Cash flows | ||||
Expected employer contributions for the fiscal year ending January 31, 2016 | $— | |||
Expected employee contributions for the fiscal year ending January 31, 2016 | — | |||
Estimated future benefit payments reflecting expected future service for the fiscal year(s) ending January 31,: | ||||
2017 | 326 | |||
2018 | 349 | |||
2019 | 348 | |||
2020 | 363 | |||
2021 | 363 | |||
2022 - 2026 | $1,841 | |||
401(k) plan
The domestic employees of the Company participate in the MFRI, Inc. Employee Savings and Protection Plan, which is applicable to all employees except employees covered by collective bargaining agreement benefits. The plan allows employee pretax payroll contributions of up to 16% of total compensation. The Company matches 50% of each participant's contribution, up to a maximum of 3.5% of each participant's salary.
Contributions to the 401(k) plan were $558 thousand and $439 thousand for the years ended January 31, 2016 and 2015, respectively.
Deferred compensation plan
The Company had a Supplemental Retirement and Deferred Compensation Plan ("Supplemental Plan"), pursuant to which key employees deferred compensation. Participants receive distributions from the plan at the later of age 65 or six months after separation from service. Life insurance contracts have been purchased and may be used to fund the Company's obligation under these agreements.
Deferred compensation liability | 2015 | 2014 | ||
Current | $6,167 | $213 | ||
Long-term | 495 | 6,560 | ||
Total | $6,662 | $6,773 | ||
Deferred compensation expense | $36 | $270 | ||
46
On April 10, 2014, the Company's Board of Directors terminated the Supplemental Plan and its Deferred Stock Purchase Plan, adopted on December 5, 2012 (collectively, the "Plans"), effective April 10, 2014 ("Termination Date"). No additional contributions will be made by the Company or participants under the Plans after the Termination Date. All funds and Company stock remaining in participant accounts will be distributed not later than 24 months after the Termination Date. The Company is obligated to deliver 9,991 shares of Company common stock under the Deferred Stock Purchase Plan.
Multi-employer plans
The Company contributes to a multi-employer plan for certain collective bargaining U.S. employees. The risks of participating in this multi-employer plan are different from a single employer plan in the following aspects:
• | Assets contributed to the multi-employer plans by one employer may be used to provide benefits to employees of other participating employers. |
• | If a participating employer ceases contributing to the plan, the unfunded obligations of the plan may be inherited by the remaining participating employers. |
• | If the Company chooses to stop participating in the multi-employer plan, the Company may be required to pay those plans an amount based on the underfunded status of the plan, referred to as a withdrawal liability. |
The Company has assessed and determined that the multi-employer plans to which it contributes are not significant to the Company's consolidated financial statements. The Company does not expect to incur a withdrawal liability or expect to significantly increase its contribution over the remainder of the contract period. The Company made contributions to the bargaining unit supported multi-employer pension plans.
Funded Zone Status | FIP/RP Status Pending/Implemented | Contribution | ||||||||
Plan Name | EIN | Plan # | 2015 | 2014 | Surcharge Imposed | Collective Bargaining Expiration Date | ||||
Plumbers & Pipefitters Local 572 Pension Fund | 626102837 | 001 | Green | No | 233 | 236 | No | 3/31/2019 | ||
Note 11 - Stock-based compensation
The Company has stock-based compensation awards that can be granted to eligible employees, officers or directors.
2015 | 2014 | |||||
Stock-based compensation expense (benefit) | $116 | ($114 | ) | |||
Restricted stock based compensation expense | $470 | $82 | ||||
Stock-based compensation was a benefit year-to-date due to cancellations. A majority of these cancellations related to former employees from the discontinued operations.
47
Stock options
On June 20, 2013, the stockholders approved the 2013 Omnibus Stock Incentive Plan ("Omnibus Plan"). Under the Omnibus Plan, 350,000 shares of common stock are reserved for issuance to employees, officers, and directors of, and other individuals providing bona fide services to or for, the Company and its affiliates. In addition, on January 31, 2014 and each January 31 thereafter until January 31, 2023, the aggregate number of shares that may be issued with respect to Awards pursuant to the terms of this Plan will be increased by the number equal to 2% of the aggregate amount of common stock outstanding as of such date, provided, however, the maximum number of additional shares that may be issued pursuant to this sentence will not exceed 400,000. The Omnibus Plan permits the granting of stock options (including incentive stock options qualifying under Code section 422 and nonstatutory stock options), stock appreciation rights, restricted or unrestricted stock awards, restricted stock units, performance awards, deferred stock awards, other stock-based awards, or any combination of the foregoing. Awards will be valued at the Company's closing stock price on the date of grant.
Options vest ratably over four years and are exercisable for up to ten years from the date of grant. To cover the exercise of vested options, the Company issues new shares from its authorized but unissued share pool. The Company calculates all stock compensation expense based on the grant date fair value of the option and recognizes expense on a straight-line basis over the four-year vesting period of the option.
The fair value of each option award was estimated on the date of grant using the Black-Scholes option-pricing model that used the assumptions noted in the following table. The principal variable assumptions utilized in valuing options and the methodology for estimating such model inputs include:
1. | risk-free interest rate - an estimate based on the "Market yield on U.S. Treasury securities at the rate for the period described in assumption 3 below, quoted on investment basis" for the end of week closest to the stock option grant date, from the Federal Reserve website; |
2. | expected volatility - an estimate based on the historical volatility of MFRI common stock's weekly closing stock price for the expected life ; and |
3. | expected life of the option - an estimate based on historical experience including the effect of employee terminations. |
2.015 | 2.014 | ||||
1. | Risk-free interest rate | .74%-1.77% | .74%-1.77% | ||
2. | Expected volatility | 40.88%-57.02% | 40.88%-59.39% | ||
3. | Expected life in years | 5.0 to 5.1 | 4.9 to 5.1 | ||
4. | Dividend yield | — | — | ||
48
The following summarizes the activity related to options outstanding under all plans for the years ended January 31, 2015 and 2016:
Options | Weighted average exercise price | Weighted average remaining contractual term | Aggregate intrinsic value | ||||
Outstanding at January 31, 2014 | 776 | $11.69 | 6.1 | $3,859 | |||
Granted | 97 | 12.41 | |||||
Exercised | (45 | ) | 7.27 | 194 | |||
Expired or forfeited | (64 | ) | 18.92 | ||||
Outstanding at January 31, 2015 | 764 | 11.45 | 5.7 | — | |||
Options exercisable at January 31, 2015 | 532 | $12.04 | 4.5 | — | |||
Granted | 51 | 6.38 | |||||
Exercised | (18 | ) | 6.48 | 3 | |||
Expired or forfeited | (77 | ) | 9.93 | ||||
Outstanding at January 31, 2016 | 720 | 11.38 | 5.1 | 34 | |||
Options exercisable at January 31, 2016 | 554 | $11.94 | 4.2 | $30 | |||
The weighted average fair value of options granted, net of options surrendered, during 2015 and 2014 are estimated at $2.54 and $4.73, per share, respectively, on the date of grant.
Unvested options outstanding | Options | Weighted-average grant date fair value | Aggregate intrinsic value | ||
Outstanding at January 31, 2015 | 232 | $10.11 | $0 | ||
Granted | 51 | 6.38 | |||
Vested | (92 | ) | |||
Expired or forfeited | (25 | ) | 9.65 | ||
Outstanding at January 31, 2016 | 166 | $9.51 | $3 | ||
Based on historical experience the Company expects 85% of these options to vest.
As of January 31, 2016, there was $0.5 million of unrecognized compensation cost related to unvested stock options granted under the plans. That cost is expected to be recognized over the weighted-average period of 2.1 years.
Deferred stock
On April 10, 2014, the Company's Board of Directors terminated the Deferred Stock Purchase Plan, adopted on December 5, 2012, effective April 10, 2014 ("Termination Date"). No additional contributions will be made by the Company or participants under the Plan after the Termination Date. All Company stock remaining in participant accounts was required to be distributed not later than 24 months after the Termination Date, accordingly the Company delivered 9,991 shares of Company common stock under this Plan in April 2016. Refer to "Deferred compensation plan" in Note 9 - Retirement plans, in the Notes to Consolidated Financial Statements
In June 2015 under the Omnibus Plan described above, the Company granted deferred stock units to each non-employee director at the time of the annual meeting of stockholders equal to the result of dividing $40,000 by the fair market value of the common stock on the date of grant. The stock will be distributed to the directors upon their separation from service.
49
As of January 31, 2016, there were approximately 77,293 deferred stock units outstanding included in restricted stock activity below.
Restricted stock
In June 2015 under the Omnibus Plan described above, the Company granted restricted stock to Tier I and Tier II executive officers. The restricted stock vest ratably over three years. Until restricted stock becomes vested and nonforfeitable, it may not be sold, assigned, transferred, pledged, hypothecated or disposed of in any way (whether by operation of law or otherwise), except by will or the laws of descent and distribution, and shall not be subject to execution, attachment or similar process. The Company issues new shares from its treasury stock or authorized but unissued share pool. The Company calculates restricted stock compensation expense based on the grant date fair value and recognizes expense on a straight-line basis over the vesting period. The following table summarizes restricted stock activity for the years ended January 31, 2016 and 2015, respectively:
Restricted shares | Weighted average grant price | Aggregate intrinsic value | ||||||
Outstanding at January 31, 2014 | 50 | $14.52 | $719 | |||||
Granted | 54 | 12.41 | ||||||
Issued | (15 | ) | ||||||
Forfeited | (3 | ) | 11.25 | |||||
Outstanding at January 31, 2015 | 86 | $14.52 | $1,242 | |||||
Granted | 108 | 6.38 | ||||||
Issued | (26 | ) | ||||||
Forfeited | (5 | ) | 6.38 | |||||
Outstanding at January 31, 2016 | 163 | $6.40 | $1,040 | |||||
As of January 31, 2016, there was $0.6 million of unrecognized compensation cost related to unvested restricted stock granted under the plans. That cost is expected to be recognized over the weighted-average period of 2.3 years.
Note 12 - Treasury stock / share repurchase program.
On February 5, 2015, the Company's Board of Directors approved a share repurchase program, which authorizes the Company to use up to $2 million for the purchase of its outstanding shares of common stock. Share repurchases were permitted to be executed through open market or privately negotiated transactions on or prior to December 31, 2015.
The following table sets forth information with respect to repurchases by the Company of its shares of common stock during 2015:
50
Period | Total number of shares purchased (in thousands) | Average price paid per share |
February | 28 | $6.64 |
March | 17 | 6.27 |
April to December | — | — |
Note 13 - Stock rights
On September 15, 2009, the Company entered into the Amendment ("Amendment") to Rights Agreement dated as of September 15, 1999. Among other things, the Amendment extends the term of the Rights Agreement until September 15, 2019 and amends definitions to include positions in derivative instruments related to the Company's common stock as constituting beneficial ownership of such stock.
On September 15, 1999, the Company's Board of Directors declared a dividend of one common stock purchase right (a "Right") for each share of MFRI's common stock outstanding at the close of business on September 22, 1999. The stock issued after September 22, 1999 and before the redemption or expiration of the Rights is also entitled to one Right for each such additional share. Each Right entitles the registered holders, under certain circumstances, to purchase from the Company one share of MFRI's common stock at $25, subject to adjustment. At no time will the Rights have any voting power.
The Rights may not be exercised until 10 days after a person or group acquires 15% or more of the Company's common stock, or announces a tender offer that, if consummated, would result in 15% or more ownership of the Company's common stock. Separate Rights certificates will not be issued, and the Rights will not be traded separately from the stock until then. Should an acquirer become the beneficial owner of 15% or more of the Company's common stock, Rights holders other than the acquirer would have the right to buy common stock in MFRI, or in the surviving enterprise if MFRI is acquired, having a value of two times the exercise price then in effect. Also, MFRI's Board of Directors may exchange the Rights (other than those of the acquirer, which will have become void), in whole or in part, at an exchange ratio of one share of MFRI common stock (and/or other securities, cash or other assets having equal value) per Right subject to adjustment. The Rights described in this paragraph and the preceding paragraph shall not apply to an acquisition, merger or consolidation approved by the Company's Board of Directors.
The Rights will expire on September 15, 2019, unless exchanged or redeemed prior to that date. The redemption price is $0.01 per Right. MFRI's Board of Directors may redeem the Rights by a majority vote at any time prior to the 20th day following public announcement that a person or group has acquired 15% of MFRI's common stock. Under certain circumstances, the decision to redeem requires the concurrence of a majority of the independent directors.
Note 14 - Interest expense, net
2015 | 2.014 | |||
Interest expense | $950 | $1,045 | ||
Interest income | (480 | ) | (526 | ) |
Interest expense, net | $470 | $519 | ||
Note 15 - Subsequent events
As previously discussed, MFRI, through its wholly owned subsidiary Perma-Pipe Canada, Inc., acquired 100% ownership of BPPC, a coating and insulation company located in Alberta, Canada. The Company had owned a 49% interest in BPPC since 2009. On February 4, 2016, the remaining 51% interest in BPPC was acquired from a subsidiary of Aegion Corporation for consideration of approximately $9.6 million in cash and debt.
51
Schedule II
MFRI, INC. AND SUBSIDIARIES
VALUATION AND QUALIFYING ACCOUNTS
For the Years Ended January 31, 2016 and 2015
Balance at beginning of period | Charged to costs and expenses | Deductions from reserves (1) | Charged to other accounts (2) | Balance at end of period | |
Year Ended January 31, 2016 | |||||
Allowance for possible losses in collection of trade receivables | $31 | $6 | $4 | $0 | $33 |
Year Ended January 31, 2015 | |||||
Allowance for possible losses in collection of trade receivables | $26 | $10 | $5 | $0 | $31 |
(1) Uncollectible accounts charged off
(2) Primarily related to recoveries from accounts previously charged off and currency translation
52
SIGNATURES
Pursuant to the requirements of Section 13 or 15(d) of the Securities Exchange Act of 1934, the Registrant has duly caused this report to be signed on its behalf by the undersigned thereunto duly authorized.
MFRI, INC.
Date: | April 28, 2016 | /s/ Bradley E. Mautner |
Bradley E. Mautner | ||
Director, President and Chief Executive Officer | ||
(Principal Executive Officer) | ||
Pursuant to the requirements of the Securities Exchange Act of 1934, this report has been signed below by the following persons on behalf of the Registrant and in the capacities and on the date indicated.
BRADLEY E. MAUTNER* | Director, President and Chief Executive Officer (Principal Executive Officer) | )) | ||
) | ||||
KARL J. SCHMIDT* | Vice President and Chief Financial Officer (Principal Financial and Accounting Officer) | ) ) | April 28, 2016 | |
) | ||||
DAVID UNGER* | Director | ) | ||
) | ||||
DAVID S. BARRIE* | Director and Chairman of the Board of Directors | |||
DENNIS KESSLER* | Director | ) | ||
) | ||||
MICHAEL J. GADE* | Director | ) | ||
) | ||||
MARK A. ZORKO* | Director | ) | ||
) | ||||
DAVID B. BROWN* | Director | ) | ||
) | ||||
JEROME T. WALKER* | Director | ) | ||
*By: | /s/ Bradley E. Mautner | Individually and as Attorney in Fact | ||
Bradley E. Mautner | ||||
53
EXHIBIT INDEX | |||
The exhibits listed below are filed herewith except the exhibits described below as incorporated by reference. Exhibits not filed herewith are incorporated by reference to such exhibits filed by the Company under the location set forth under the caption “Description and Location” below. The Commission file number for our Exchange Act filings referenced below is 0-18370. | |||
Exhibit No. | Description and Location | ||
3(i) | Certificate of Incorporation of MFRI, Inc. [Incorporated by reference to Exhibit 3.3 to Registration Statement No. 33-70298] | ||
3(ii) | Second Amended and Restated By-Laws of MFRI, Inc. [Incorporated by reference to Exhibit 3.1 to the Company's Current Report on Form 8-K filed on February 4, 2013] | ||
4(a) | Specimen Common Stock Certificate [Incorporated by reference to Exhibit 4 to Registration Statement No. 33-70794] | ||
4(b) | Rights Agreement [Incorporated by reference to Exhibit 4.1 of the Company's [Current Report on Form 8-K filed on September 24, 1999] | ||
4(c) | Amendment to Rights Agreement [Incorporated by reference to Exhibit 4.1 of the Company's Current Report on Form 8-K filed on September 17, 2009] | ||
10(a) | 2001 Independent Directors Stock Option Plan, [Incorporated by reference to Exhibit (d)(5) to the Company's Schedule TO filed on May 25, 2001] * | ||
10(b) | Form of Directors and Officers Indemnification Agreement [Incorporated by reference to Exhibit 10.1 to the Company's Annual Report on Form 10-K for the fiscal year ended January 31, 2006 filed on May 15, 2006] * | ||
10(c) | MFRI 2004 Stock Incentive Plan [Incorporated by reference to Exhibit 10(e) to the Company's Annual Report on Form 10-K/A for the fiscal year ended January 31, 2004 filed on June 1, 2004] * | ||
10(d) | Credit and Security Agreement between the Company and BMO Harris Bank, N.A. dated September 24, 2014 [Incorporated by reference to Exhibit 10(f) to the Company's Quarterly Report on Form 10-Q filed on December 9, 2014] | ||
10(e) | First Amendment to Credit and Security Agreement between the Company and BMO Harris Bank, N.A. dated February 5, 2015 | ||
10(f) | Code of Conduct [Incorporated by reference to Exhibit 14 of the Company's Annual Report on Form 10-K/A for the fiscal year ended January 31, 2004 filed on June 1, 2004] | ||
10(g) | Employment agreement with Fati Elgendy dated November 12, 2007 [Incorporated by reference to DEF14A filed on May 29, 2008] * | ||
10(h) | First Amendment to Employment Agreement with Fati Elgendy dated March 19, 2014 [Incorporated by reference to Exhibit 10(o) to the Company's Annual Report on Form 10-K for the fiscal year ended January 31, 2014 filed on April 15, 2014] * | ||
10(i) | Second Amendment to Employment Agreement with Fati Elgendy dated February 25, 2016 [Incorporated by reference to Exhibit 10.2 to the Company's Current Report on Form 8-K filed on March 2, 2016] * | ||
10(j) | 2009 Non-Employee Directors Stock Option Plan [Incorporated by reference to Exhibit 10(k) to the Company's Annual Report on Form 10-K for the fiscal year ended January 31, 2010 filed on April 19, 2010] * | ||
10(k) | Deferred Stock Purchase Plan [Incorporated by reference to Exhibit 4.1 to the Company's Registration Statement on Forms S-8 File No. 333-186055, effective January 16, 2013] * | ||
10(l) | 2013 Omnibus Stock Incentive Plan as Amended June 14, 2013 [Incorporated by reference to Exhibit 10.1 to the Company's Current Report on Form 8-K filed on June 14, 2013] * | ||
10(m) | Limited Waiver and Second Amendment to Credit and Security Agreement between the Company and BMO Harris Bank, N.A. dated April 30, 2015 [Incorporated by reference to Exhibit 10 to the Company's Quarterly Report on Form 10-Q filed on June 12, 2015] | ||
10(n) | Third Amendment to Credit and Security Agreement between the Company and BMO Harris Bank, N.A. dated January 29, 2016 | ||
10(o) | Fourth Amendment to Credit and Security Agreement between the Company and BMO Harris Bank, N.A. dated February 29, 2016 [Incorporated by reference to Exhibit 10.1 to the Company's Current Report on Form 8-K filed on March 2, 2016] | ||
10(p) | Asset Purchase Agreement dated as of January 29, 2016 by and among MFRI, Inc., TDC Filter Manufacturing Inc. and BHA Altair, LLC [Incorporated by reference to Exhibit 2.1 to the Company's Current Report on Form 8-K filed on February 4, 2016] | ||
10(q) | Share Purchase Agreement dated as of January 29, 2016 by and among MFRI, Inc., MFRI Holdings (B.V.I.) Ltd, Midwesco Filter Resources Denmark A/S and Hengst Holding GmbH [Incorporated by reference to Exhibit 2.2 to the Company's Current Report on Form 8-K filed on February 4, 2016] | ||
21 | Subsidiaries of MFRI, Inc. | ||
54
EXHIBIT INDEX | |||
23 | Consent of Independent Registered Public Accounting Firm - Grant Thornton LLP | ||
24 | Power of Attorney executed by directors and officers of the Company | ||
31 | Rule 13a - 14(a)/15d - 14(a) Certifications (1) Chief Executive Officer certification pursuant to Section 302 of the Sarbanes-Oxley Act of 2002 (2) Chief Financial Officer certification pursuant to Section 302 of the Sarbanes-Oxley Act of 2002 | ||
32 | Section 1350 Certifications (1) Chief Executive Officer certification pursuant to Section 906 of the Sarbanes-Oxley Act of 2002 (2) Chief Financial Officer certification pursuant to Section 906 of the Sarbanes-Oxley Act of 2002 | ||
101.INS | XBRL Instance | ||
101.SCH | XBRL Taxonomy Extension Schema | ||
101.CAL | XBRL Taxonomy Extension Calculation | ||
101.DEF | XBRL Taxonomy Extension Definition | ||
101.LAB | XBRL Taxonomy Extension Labels | ||
101.PRE | XBRL Taxonomy Extension Presentation | ||
*Management contracts and compensatory plans or agreements
55