Attached files
| file | filename |
|---|---|
| EX-21 - EX-21 - Clearday, Inc. | d20528dex21.htm |
| EX-32.2 - EX-32.2 - Clearday, Inc. | d20528dex322.htm |
| EX-31.2 - EX-31.2 - Clearday, Inc. | d20528dex312.htm |
| EX-32.1 - EX-32.1 - Clearday, Inc. | d20528dex321.htm |
| EX-23.1 - EX-23.1 - Clearday, Inc. | d20528dex231.htm |
| EX-31.1 - EX-31.1 - Clearday, Inc. | d20528dex311.htm |
Table of Contents
UNITED STATES
SECURITIES AND EXCHANGE COMMISSION
WASHINGTON, D.C. 20549
FORM 10-K
ANNUAL REPORT PURSUANT TO SECTIONS 13 OR 15(d)
OF THE SECURITIES EXCHANGE ACT OF 1934
(Mark One)
| x | ANNUAL REPORT PURSUANT TO SECTION 13 OR 15(d) OF THE SECURITIES EXCHANGE ACT OF 1934. |
For the fiscal year ended December 31, 2015
OR
| ¨ | TRANSITION REPORT PURSUANT TO SECTION 13 OR 15(d) OF THE SECURITIES EXCHANGE ACT OF 1934. |
For the transition period from to
Commission File Number 0-21074
SUPERCONDUCTOR TECHNOLOGIES INC.
(Exact name of registrant as specified in its charter)
| Delaware | 77-0158076 | |
| (State or other jurisdiction of incorporation or organization) |
(IRS Employer Identification No.) |
9101 Wall Street, Suite 1300, Austin, Texas 78754
(Address of principal executive offices) (Zip Code)
Registrant’s telephone number, including area code: (512) 334-8900
Securities registered pursuant to Section 12(b) of the Act:
| Title of each class |
Name of each exchange on which registered | |
| Common stock, $0.001 par value | The NASDAQ Stock Market, LLC |
Securities registered pursuant to Section 12(g) of the Act:
None
Indicate by check mark if the registrant is a well-known seasoned issuer, as defined in Rule 405 of the Securities Act. Yes ¨ or No x
Indicate by check mark if the registrant is not required to file reports pursuant to Section 13 or Section 15(d) of the Act. Yes ¨ or No x
Indicate by check mark whether the Registrant (1) has filed all reports required to be filed by Section 13 or 15(d) of the Securities Exchange Act of 1934 during the preceding 12 months (or for such shorter period that the registrant was required to file such reports), and (2) has been subject to such filing requirements for the past 90 days. Yes x or No ¨
Indicate by check mark whether the registrant has submitted electronically and posted on its corporate Web site, if any, every Interactive Data File required to be submitted and posted pursuant to Rule 405 of Regulation S-T (§232.405 of this chapter) during the preceding 12 months (or for such shorter period that the registrant was required to submit and post such files). Yes x or No ¨
Indicate by check mark if disclosure of delinquent filers pursuant to Item 405 of Regulation S-K is not contained herein, and will not be contained, to the best of Registrant’s knowledge, in definitive proxy or information statements incorporated by reference in Part III of this Form 10-K or any amendment to this Form 10-K. ¨
Indicate by check mark whether the registrant is a large accelerated filer, an accelerated filer, a non-accelerated filer, or a smaller reporting company. See definition of “large accelerated filer,” “accelerated filer,” and “smaller reporting company” in Rule 12b-2 of the Exchange Act.
| Large Accelerated Filer | ¨ | Accelerated Filer | ¨ | |||
| Non-accelerated Filer | ¨ (Do not check if smaller reporting company) | Smaller reporting company | x | |||
Indicate by check mark whether the registrant is a shell company (as defined in Rule 12b-2 of the Exchange Act). Yes ¨ or No x
The aggregate market value of the common stock held by non-affiliates was $15.4 million as of June 27, 2015 (the last business day of our most recently completed second fiscal quarter). The closing price of the common stock on that date was $1.05 as reported by the NASDAQ Capital Market. For purposes of this determination, we excluded the shares of common stock held by each officer and director and by each person who was known to us to own 10% or more of the outstanding common stock as of June 27, 2015. The exclusion of shares owned by the aforementioned individuals and entities from this calculation does not constitute an admission by any of such individuals or entities that he or it was or is an affiliate of ours.
We had 40,748,218 shares of common stock outstanding as of the close of business on March 15, 2016.
Table of Contents
SUPERCONDUCTOR TECHNOLOGIES INC.
FORM 10-K ANNUAL REPORT
Year Ended December 31, 2015
Unless otherwise noted, the terms “we,” “us,” “our” refer to the combined and ongoing business operations of Superconductor Technologies Inc. and its subsidiaries
i
Table of Contents
SPECIAL NOTE REGARDING FORWARD-LOOKING STATEMENTS
This Report contains forward-looking statements within the meaning of Section 27A of the Securities Act of 1933, as amended, and Section 21E of the Securities Exchange Act of 1934, as amended. We claim the protection of the safe harbor contained in the Private Securities Litigation Reform Act of 1995 for these forward looking statements. Our forward-looking statements relate to future events or our future performance and include, but are not limited to, statements concerning our business strategy, future commercial revenues, market growth, capital requirements, new product introductions, expansion plans and the adequacy of our funding. Other statements contained in this Report that are not historical facts are also forward-looking statements. We have tried, wherever possible, to identify forward-looking statements by terminology such as “may,” “will,” “could,” “should,” “expects,” “anticipates,” “intends,” “plans,” “believes,” “seeks,” “estimates” and other comparable terminology.
We caution investors that any forward-looking statements presented in this Report, or that we may make orally or in writing from time to time, are based on the beliefs of, assumptions made by, and information currently available to, us. Such statements are based on assumptions and the actual outcome will be affected by known and unknown risks, trends, uncertainties and factors that are beyond our control or ability to predict. Although we believe that our assumptions are reasonable, they are not guarantees of future performance and some will inevitably prove to be incorrect. As a result, our actual future results can be expected to differ from our expectations, and those differences may be material. Accordingly, investors should use caution in relying on past forward-looking statements, which are based on known results and trends at the time they are made, to anticipate future results or trends.
Some of the risks and uncertainties that may cause our actual results, performance or achievements to differ materially from those expressed or implied by forward-looking statements include the following:
| • | our limited cash and a history of losses; |
| • | our need to materially grow our revenues from commercial operations and/or to raise additional capital (which financing may not be available on acceptable terms or at all) over the next 12-months to implement our current business plan and maintain our viability; |
| • | the performance and use of our equipment to produce wire in accordance with our timetable; |
| • | overcoming technical challenges in attaining milestones to develop and manufacture commercial lengths of our HTS wire; |
| • | the possibility of delays in customer evaluation and acceptance of our HTS wire; |
| • | the limited number of potential customers and customer pressures on the selling prices of our products; |
| • | the limited number of suppliers for some of our components and our HTS wire; |
| • | there being no significant backlog from quarter to quarter; |
| • | our market being characterized by rapidly advancing technology; |
| • | the impact of competitive products, technologies and pricing; |
| • | manufacturing capacity constraints and difficulties; |
| • | the impact of any financing activity on the level of our stock price; |
| • | the dilutive impact of any issuances of securities to raise capital; |
| • | cost and uncertainty from compliance with environmental regulations; |
| • | local, regional, and national and international economic conditions and events, and the impact they may have on us and our customers, and; |
| • | if we fail to maintain the listing of our common stock with a U.S. national securities exchange, the liquidity of our common stock could be adversely affected. |
1
Table of Contents
For further discussion of these and other factors see, “Management’s Discussion and Analysis of Financial Condition and Results of Operations” and “Risk Factors” in this Report.
This Report and all subsequent written and oral forward-looking statements attributable to us or any person acting on our behalf are expressly qualified in their entirety by the cautionary statements contained or referred to in this section. We do not undertake any obligation to release publicly any revisions to our forward-looking statements to reflect events or circumstances after the date of this Report.
2
Table of Contents
General
We are a leading company in developing and commercializing high temperature superconductor (“HTS”) materials and related technologies. Superconductivity is the unique ability to conduct electricity with little or no resistance when cooled to “critical” temperatures. HTS materials are a family of elements that demonstrate superconducting properties at temperatures significantly warmer than previous superconducting materials. Electric currents that flow through conventional conductors encounter resistance that requires power to overcome and generates heat. HTS materials can substantially improve the performance characteristics of electrical systems, reduce power loss, and lowering heat generation providing extremely high current carrying density and zero resistance to direct current.
We were established in 1987 shortly after the discovery of HTS materials. Our stated objective was to develop products based on these materials for the commercial marketplace.
After analyzing the market opportunities available, we decided to develop products for the utility and telecommunications industries.
Our initial product was completed in 1998 and we began delivery to a number of wireless network providers. In the following 13 years, we continued to refine and improve the platform, with the primary focus on improving reliability, increasing performance and runtime, and most importantly, removing cost from the manufacturing process of the required subsystems. Our cost reducing efforts led to the invention of our proprietary, high-yield and high throughput HTS material deposition manufacturing process.
In late 2010, we transitioned our research and development efforts to adapting our proprietary HTS material deposition techniques to the production of our HTS Conductus® wire for next generation power applications, which is our primary opportunity to grow our future revenues. We continue to generate revenue from our legacy wireless communications products. This revenue has been declining and we expect this trend to continue until we completely abandon these products.
Our Proprietary Technology
Our development efforts over the last 28 years have yielded an extensive patent portfolio as well as critical trade secrets, unpatented technology and proprietary knowledge. We have an extensive patent portfolio in addition to critical trade secrets, unpatented technology and proprietary knowledge. Our current patents expire at various dates from 2016 to 2031. We enter into confidentiality and non-disclosure agreements with our employees, suppliers and consultants to protect our proprietary information.
Our strategic plan is to utilize our core proprietary technology in superconductivity and leverage our proprietary manufacturing processes to build Conductus wire for use in electrical power devices. As discussed above, we are adapting our unique HTS material deposition techniques to produce our energy efficient, cost-effective and high performance Conductus wire technology for next generation power applications. We have identified several large initial target markets for superconducting wire including energy (wind turbines, cables, fault current limiters), medical (NMR (nuclear magnetic resonance and MRI (magnetic resonance imaging)), science (high performance magnets) and industrial (motors, generators) applications. We are working with leading industry device manufactures to complete qualification and acceptance testing of Conductus wire. We expect significant commercial production of Conductus wire in the last half of 2016.
Our development efforts (including those described under “Our Future Business” below) can take a significant number of years to commercialize, and we must overcome significant technical barriers and deal with other significant risks, some of which are set out in our public filings, including in particular the “Risk Factors” included in Item 1A of this Report.
3
Table of Contents
Our Future Business
We have created several unique capabilities and HTS manufacturing systems related to our Conductus wire platform that we are seeking to produce by leveraging our leadership in superconducting technologies, extensive intellectual property and HTS manufacturing expertise.
HTS Wire Platform
Our Conductus wire product development is focused on large markets where the advantages of HTS wire are recognized by the industry. Our initial product roadmap targets three important applications: superconducting high power transmission cable, superconducting fault current limiters (SFCL) and high field magnets.
Superconducting High Power Transmission Cable:
Superconducting high power transmission and distribution cable transmit 5 to 10 times the electrical current of traditional copper or aluminum cables with significantly improved efficiency. HTS power cable systems consist of the cable, which is comprised of 100’s of strands of HTS wire wrapped around a copper core, and the cryogenic cooling system to maintain proper operating conditions. HTS power cables are particularly suited to high load areas such as the dense urban business districts of large cities, where purchases of easements and construction costs for traditional low capacity cables may be cost prohibitive. The primary application for HTS cables is medium voltage feeds to load pockets in dense urban areas. In these high demand zones the grid is often saturated with aging infrastructure. HTS technology brings a considerable amount of power to new locations where the construction of additional transmission to distribution substations, with major transformer assets, is not feasible. Another potential use of HTS power cable is to improve grid power transmission by connecting two existing substations. In dense urban environments many substations often reach capacity limits and require redundant transformer capacity to improve reliability HTS cables can tie these existing stations together, avoiding very costly transformer upgrades and construction costs.
Superconducting Fault Current Limiter (SFCL):
With power demand on the rise and new power generation sources being added, the grid has become overcrowded and vulnerable to catastrophic faults. Faults are abnormal flows of electrical current like a short circuit. As the grid is stressed, faults and power blackouts increase in frequency and severity. SFCLs act like powerful surge protectors, preventing harmful faults from taking down substation equipment by reducing the fault current to a safer level (20 – 50% reduction) so that the existing switchgear can still protect the grid. Currently, electrical-utilities use massive 80kA circuit breakers, oversized transformers and fuses to prevent faults from damaging their equipment and protecting against surges. However, once a fault has occurred, standard circuit breakers suffer destructive failure and need to be replaced before service can be restored. In addition, Smart Grid and embedded alternative energy generation enhancements will increase the need for SCFLs. Grid operators face a major challenge in moving power safely and efficiently, from generators to consumers, through several stages of voltage transformation step downs and step ups. At each stage, valuable energy is lost in the form of waste heat. Moreover, while demands are continually rising, space for transformers and substations—especially in dense urban areas—is severely limited. Conventional oil-cooled transformers pose a fire and environmental hazard. Compact, efficient superconducting transformers, by contrast, are cooled by safe, abundant and environmentally benign liquid nitrogen. As an additional benefit, these actively-cooled devices will offer the capability of operating in overload, to twice the nameplate rating, without any loss of life to meet occasional utility peak load demands.
Superconducting High Field magnets:
There are a variety of applications that utilize superconducting magnets in order to capitalize on their unique ability to create extremely high magnetic fields. The NMR and MRI machines of today utilize such superconducting magnets for this very reason. Currently, high-field superconducting magnets are manufactured using commercially available superconducting wire such as niobium-titanium (NbTi) or niobium-tin (Nb3Sn).
4
Table of Contents
NMR and MRI device manufacturers look towards advances in superconducting technologies to improve the overall performance of their systems by dramatically increasing the magnetic fields while reducing size. High demand for a robust, high performance and low cost superconducting wire has spurred rapid development of a next generation alternative. In the last 10 years, new second generation (2G) Rare Earth, Barium, Copper Oxide (ReBCO) superconducting materials have been proven to drastically increase magnetic field strengths, especially at low temperatures. These advanced ReBCO based superconductors now provide an excellent alternative to NbTi and Nb3Sn based materials.
Other Assets and Investments
In September 2014, STI and Robinson Research Institute entered a strategic agreement to jointly engage end customers and partners in the building of superconductor products utilizing our Conductus® superconducting wire and Robinson Research Institute’s superconducting device technology. The Robinson Research Institute, based at Victoria University of Wellington in New Zealand, has unique capabilities in the production of HTS Roebel cable used in superconducting machines and magnets, and in the development of HTS MRI and HTS transformers. The Robinson Research Institute has been a valuable ally as we prepare for the commercial launch of Conductus wire; Robinson’s performance characterization expertise and applications knowledge are truly impressive. As we move to full production, we are implementing a comprehensive plan to supply Conductus wire and support global leaders in the commercialization of superconducting devices. Robinson is an expert in the development of innovative superconducting products. Jointly, we have identified initial projects including applications such as rotating machines, transformers, scientific magnets and MRI systems. Additionally, Robinson and its partners have a strong focus on Asia and we believe our agreement will help us expand our reach into that fast-growing market. Working alongside many industry leaders, the Robinson Research Institute and its partners have built superconducting devices for the energy industry, recently completing a transformer for use in the electrical grid. In the healthcare market, Robinson has focused on applications of MRI systems where HTS wire gives a competitive advantage.
In July 2012, we contributed 14 issued and pending patents regarding our innovative Reconfigurable Resonance™ (RcR) technology in exchange for a minority investment in Resonant LLC. As of December 31, 2013 our interest in Resonant and the net value of the assets contributed, estimated to approximate fair value, was $185,000. In late September 2014 we entered into a private transaction to sell this minority interest to various buyers for gross proceeds to us of $3.6 million, and net proceeds to us of $3.3 million after offering expenses.
In 2007, we formed a joint venture with Hunchun BaoLi Communication Co. Ltd. (“BAOLI”) to manufacture and sell our SuperLink interference elimination solution in China. We use the equity method of accounting for our 45 percent joint venture interest. The joint venture agreement specified our joint venture partner to supply the capital and local expertise, and for us to provide a license of certain technology and supply key parts for manufacturing. Since 2007, there has been no significant progress to manufacture and sell our SuperLink interference elimination solution in China and the parties have not completed their contributions to the joint venture within the two year period specified by the agreement and Chinese law. We see our primary opportunity to grow future revenues with the production of our HTS Conductus® wire, and do not expect this joint venture to be a significant part of future revenues.
Licenses
We grant licenses for our technology to other companies. We have granted licenses to, among others, (1) Bruker for Nuclear Magnetic Resonance application, (2) General Dynamics for government applications, (3) Star Cryoelectronics for Superconducting Quantum Interference Device applications and (4) Theva for network infrastructure wireless electronic devices.
Government Contracts
We did not generate revenues from government contracts in the last three years.
5
Table of Contents
Manufacturing
Our manufacturing process involves the operation of sophisticated production equipment and material handling by production technicians. We purchase inventory components and manufacture inventory based on existing customer purchase requests, and to a lesser extent, on sales forecasts. Our primary facility is our advanced manufacturing center in Austin, Texas. This Texas facility addresses our growth expectations for our superconducting wire initiative. The opening of this facility coincided with the delivery of our first superconducting wire production equipment in early 2012. Sales of our Conductus wire are expected to increase as we reach production scale in the second half of 2016 and beyond. We currently assemble and test our wireless communications products at our facilities in Santa Barbara, California.
A number of components used in our products are available from only a limited number of outside suppliers due to unique designs, as well as certain quality and performance requirements. We do not have guaranteed supply arrangements with any of these suppliers, do not maintain an extensive inventory of parts or components and customarily purchase sole or limited source parts and components pursuant to purchase orders. Our reliance on sole or limited source suppliers involves certain risks and uncertainties, many of which are beyond our control, and some of which are set out in our public filings, including in particular the “Risk Factors” included in Item 1A of this Report.
Marketing and Sales
We utilize a direct selling model due to the concentrated customer base for superconducting wire.
Competition
We face competition in various aspects of our technology and product development. Our products compete on the basis of performance, functionality, reliability, pricing, quality and compliance with industry standards. Our primary competitors are American Superconductor (AMSC), SuperPower (Furukawa), SuNam, Fujikura, Sumitomo and THEVA, among others.
Research and Development
Our 2013 through 2015 research and development activities were focused entirely on developing our Conductus wire product. We spent a total of $4.1 million for 2015, and $6.0 million and $6.1 million for 2014 and 2013, respectively, on research and development.
Our Proprietary Technology
We have an extensive patent portfolio, in addition to critical trade secrets, unpatented technology and proprietary knowledge. Our current patents expire at various dates from 2016 to 2031. We enter into confidentiality and non-disclosure agreements with our employees, suppliers and consultants to protect our proprietary information.
Environmental Issues
We use certain hazardous materials in our research, development and manufacturing operations. As a result, we are subject to stringent federal, state and local regulations governing the storage, use and disposal of such materials. Current or future laws and regulations could require substantial expenditures for preventative or remedial action, reduction of chemical exposure, waste treatment or disposal. Although we believe that our safety procedures for the handling and disposing of hazardous materials comply with the standards prescribed by state and federal regulations, there is always the risk of accidental contamination or injury from these materials. To date, we have not incurred substantial expenditures for preventive action with respect to hazardous materials or for remedial action with respect to any hazardous materials accident. However, the use and disposal of hazardous
6
Table of Contents
materials involves the risk that we could incur substantial expenditures for such preventive or remedial actions. If such an accident were to occur, we could be held liable for resulting damages. The liability in the event of an accident or the costs of such remedial actions could exceed our resources or otherwise have a material adverse effect on our financial condition, results of operations or cash flows.
Corporate Information
Our facilities and principal executive offices are located at 9101 Wall Street, Suite 1300, Austin, Texas 78754. Our telephone number is (512) 334-8900. We were incorporated in Delaware on May 11, 1987. Additional information about us is available on our website at www.suptech.com. The information on our web site is not incorporated herein by reference.
Employees
As of December 31, 2015, we had a total of 25 full time employees. None of our employees are represented by a labor union, and we believe that our employee relations are good.
Backlog
Our commercial backlog consists of accepted product purchase orders with scheduled delivery dates during the next twelve months. We had commercial backlog of $58,000 at December 31, 2015, compared to $63,000 at December 31, 2014.
7
Table of Contents
| ITEM 1A. | RISK FACTORS |
The following section includes some of the material factors that may adversely affect our business and operations. This is not an exhaustive list, and additional factors could adversely affect our business and financial performance. Moreover, we operate in a very competitive and rapidly changing environment. New risk factors emerge from time to time and it is not possible for us to predict all such risk factors, nor can we assess the impact of all such risk factors on our business or the extent to which any factor, or combination of factors, may cause actual results to differ materially from those contained in any forward-looking statements. This discussion of risk factors includes many forward-looking statements. For cautions about relying on such forward looking statements, please refer to the section entitled “Forward Looking Statements” at the beginning of this Report immediately prior to Item 1.
Risks Related to Our Business
We have a history of losses and may never become profitable.
In each of our last five years, we have experienced significant net losses and negative cash flows from operations. In 2015, we incurred a net loss of $8.6 million and had negative cash flows from operations of $8.5 million. In 2014, we incurred a net loss of $8.3 million and had negative cash flows from operations of $10 million. Our independent registered public accounting firm has included in its audit reports an explanatory paragraph expressing substantial doubt about our ability to continue as a going concern. If we fail to increase our revenues, we may not achieve and may not maintain profitability, we may not realize our investment in infrastructure, and may not meet our expectations or the expectations of financial analysts who report on our stock.
We need to raise additional capital. If we are unable to raise capital our ability to implement our current business plan and ultimately our viability as a company could be adversely affected
At December 31, 2015, we had $7.5 million in cash and cash equivalents. Our current forecast is that our cash resources will be sufficient to fund our planned operations into the fourth quarter of 2016. Our cash resources will not be sufficient to fund our business for the next twelve months. Therefore, unless we can materially grow our revenues from commercial operations during such period, we will need to raise additional capital during the next 12-months to implement our current business plan and maintain the viability of the Company.
We believe the key factors to our future liquidity will be our ability to successfully use our expertise and our technology to generate revenues in various ways, including commercial operations, joint ventures and licenses. Because of the expected timing and uncertainty of these factors, we will need to raise funds to meet our working capital needs.
Additional financing may not be available on acceptable terms or at all. If we issue additional equity securities to raise funds, the ownership percentage of our existing stockholders would be reduced. New investors may demand rights, preferences or privileges senior to those of existing holders of common stock and could also require that we issue warrants in connection with sales of our stock. If we cannot raise any needed funds to grow our commercial resources, we might be forced to make changes to, or delay aspects of, our business plan which could adversely affect our ability to implement our current business plan and ultimately our viability as a company.
Our strategic initiative to develop a new wire platform may not prove to be successful.
We have spent a considerable amount of resources in developing a new wire platform for power applications. Substantial technical and business challenges remain before we can have a commercially successful product introduction. We may not be able to overcome these challenges in a timely or cost effective manner, if at all. Such a failure could adversely impact our prospects, liquidity, stock price and carrying value of our fixed assets.
8
Table of Contents
There are numerous technological challenges that must be overcome in order for our Conductus wire to become commercially successful and our ability to address such technological challenges may adversely affect our ability to gain customers.
We expect to begin commercial Conductus wire production in 2016. Conductus® wire is uniquely positioned to address three key technical challenges in the market: high performance, improved economics and commercial-scale capacity. To date, we, along with existing HTS wire manufacturers, have not overcome these challenges to allow for broad commercialization of HTS wire. Customers cannot purchase long-length wire with any reasonable confidence or guaranteed volume; and electric utilities lack confidence in product availability which leads to delays in their deployment roadmap. HTS wire performance is currently below what many customers require. Many power applications require high performance wire with high current carrying capacity, mechanical durability, electrical integrity with low AC losses and minimal splices. Producing high performance HTS wire has proven difficult, especially at volumes required for large scale deployment. The high demand for high performance wire available in very low volume results in a high wire price that narrows the market and limits commercial viability. Delays in our Conductus wire development, as a result of technological challenges or other factors, may result in the introduction or commercial acceptance of our Conductus wire products later than expected.
The commercial uses of superconducting wire and superconducting wire related products are limited today, and a broad commercial market may not develop.
Even if the technological hurdles are overcome, there is no certainty that a robust commercial market for unproven HTS wire products will come to fruition. To date, commercial use of HTS wire has been limited to small feasibility demonstrations, and these projects are largely subsidized by government authorities. While customer demand is high and market forecasts project large revenue opportunity for superconducting wire in power applications, the market may not develop and superconducting wire might never achieve long term, broad commercialization. In such an event, we would not be able to commercialize our Conductus wire initiative and our business could be adversely impacted.
We have limited experience marketing and selling superconducting wire products, and our failure to effectively market and sell our superconducting wire solutions would lower our revenue and cash flow.
We have limited experience marketing and selling our Conductus wire. Once our Conductus wire is ready for commercial use, we will have to hire and develop a marketing and sales team to effectively demonstrate the advantages of our product over both more traditional products and competing superconducting products or other adjacent technologies. We may not be successful in our efforts to market this new technology.
We expect continued customer pressures to reduce our product pricing which may adversely affect our ability to operate on a commercially viable basis.
We expect to face pressure to reduce prices and accordingly, the average selling price of our Conductus wire. We anticipate customer pressure on our product pricing will continue for the foreseeable future. HTS wire is currently being sold at $250/kiloampere-meter (kA-m). At this price, HTS wire represents more than half the cost of the end device. A price reduction is required for long term commercialization. Cryogenic systems, including cryocoolers and cryostats, have been developed but will also need to be cost optimized as HTS wire becomes available in volume. We have plans to further reduce the manufacturing cost of our products, but there is no assurance that our future cost reduction efforts will keep pace with price erosion. We will need to further reduce our manufacturing costs through engineering improvements and economies of scale in production and purchasing in order to achieve adequate gross margins. We may not be able to achieve the required product cost savings at a rate needed to keep pace with competitive pricing pressure. Additionally, we may be forced to discount future orders or may never reach commercial viability. If we fail to reach our cost saving objectives or we are required to offer future discounts, our business may be harmed.
9
Table of Contents
We face competition with respect to various aspects of our technology and product development.
Our current wireless products compete on the basis of performance, functionality, reliability, pricing, quality, and compliance with industry standards. With respect to our Conductus wire materials, we compete with American Superconductor (AMSC), SuperPower (Furukawa), SuNam, Fujikura, Sumitomo and THEVA, among others. In addition, we currently supply components and license technology to several companies that may eventually decide to manufacture or design their own HTS components, rather than purchasing or licensing our technology. If we are unable to compete successfully against our current or future competitors, then our business and results of operations will be adversely affected.
We may not be able to compete effectively against alternative technologies.
Our products also compete with a number of alternative approaches and technologies. Some of these alternatives may be more cost effective or offer better performance than our products and we may not succeed in competing against these alternatives.
We currently rely on specific technologies and may not successfully adapt to rapidly changing market environments.
We must overcome technical challenges to commercialize our Conductus wire. If we are able to do so, we will need to attain customer acceptance of our Conductus wire, and we cannot ensure that such acceptance will occur. We will have to continue to develop and integrate advances to our core technologies. We will also need to continue to develop and integrate advances in complementary technologies. We cannot guarantee that our development efforts will not be rendered obsolete by research efforts and technological advances made by others. Our business success depends upon our ability to keep pace with advancing technology, including materials, processes and industry standards.
We may experience significant fluctuations in sales and operating results from quarter to quarter.
Our quarterly results may fluctuate due to a number of factors, including:
| • | the lack of any contractual obligation by our customers to purchase their forecasted demand for our products; |
| • | variations in the timing, cancellation, or rescheduling of customer orders and shipments; and |
| • | high fixed expenses that may disproportionately impact operating expenses, especially during a quarter with a sales shortfall. |
Order deferrals and cancellations by our customers, declining average sales prices, changes in the mix of products sold, increases in inventory and finished goods, delays in the introduction of new products and longer than anticipated sales cycles for our products have, in the past, adversely affected our results of operations. If our customers desire to purchase products in excess of the forecasted amounts or in a different product mix, there may not be enough inventory or manufacturing capacity to fill their orders.
Due to these and other factors, our past results have limited predictive value as to our Conductus wire initiative. Future revenues and operating results may not meet the expectations of stock analysts and investors. In either case, the price of our common stock could be materially adversely affected.
Worldwide economic uncertainty may adversely affect our business, operating results and financial condition.
The United States and global economies continue to experience a period of economic and financial uncertainty, which could result in economic volatility having direct and indirect adverse effects on our business, operating results and financial condition in a number of ways. For example, current or potential customers may
10
Table of Contents
delay or decrease spending with us may delay paying us for previously purchased products, or may not pay us at all. In addition, this recent downturn has had, and may continue to have, an unprecedented negative impact on the global credit markets. If we are required to obtain financing in the near term to meet our working capital or other business needs, we may not be able to obtain that financing. Further, even if we are able to obtain the financing we need, it may be on terms that are not favorable to us, with increased financing costs and restrictive covenants.
Our reliance on a limited number of suppliers and the long lead time of components for our products could impair our ability to manufacture and deliver our systems on a timely basis.
A number of components used in our products are available from a limited number of outside suppliers due to unique designs as well as certain quality and performance requirements. Our reliance on sole or limited source suppliers involves certain risks and uncertainties, many of which are beyond our control. These include the possibility of a shortage or the discontinuation of certain key components. Any reduced availability of these parts or components when required could impair our ability to manufacture and deliver our systems on a timely basis and result in the delay or cancellation of orders, which could harm our business.
In addition, the purchase of some of our key components involves long lead times and, in the event of unanticipated increases in demand for our solutions, we may be unable to obtain these components in sufficient quantities to meet our customers’ requirements. We do not have guaranteed supply arrangements with any of these suppliers, do not maintain an extensive inventory of parts or components and customarily purchase sole or limited source parts and components pursuant to purchase orders. Business disruptions, quality issues, production shortfalls or financial difficulties of a sole or limited source supplier could materially and adversely affect us by increasing product costs, or eliminating or delaying the availability of such parts or components. In such events, our inability to develop alternative sources of supply quickly and on a cost-effective basis could impair our ability to manufacture and deliver our systems on a timely basis and could harm our business.
Our reliance on a limited number of suppliers exposes us to quality control issues.
Our reliance on certain single-source and limited-source components exposes us to quality control issues if these suppliers experience a failure in their production process or otherwise fail to meet our quality requirements. A failure in single-source or limited-source components or products could force us to repair or replace a product utilizing replacement components. If we cannot obtain comparable replacements or effectively return or redesign our products, we could lose customer orders or incur additional costs, which could have a material adverse effect on our gross margins and results of operations.
Our ability to protect our patents and other proprietary rights is uncertain, exposing us to possible losses of competitive advantage.
Our efforts to protect our proprietary rights may not succeed in preventing infringement by others or ensure that these rights will provide us with a competitive advantage. Pending patent applications may not result in issued patents and the validity of issued patents may be subject to challenge. Third parties may also be able to design around the patented aspects of the products. Additionally, certain of the issued patents and patent applications are owned jointly with third parties. Because any owner or co-owner of a patent can license its rights under jointly-owned patents or applications, inventions made by us jointly with others are not subject to our exclusive control. Any of these possible events could result in losses of competitive advantage.
We depend on specific patents and licenses to technologies, and we will likely need additional technologies in the future that we may not be able to obtain.
We utilize technologies under licenses of patents from others for our products. These patents may be subject to challenge, which may result in significant litigation expense (which may or may not be recoverable against future royalty obligations). Additionally, we continually try to develop new products, and, in the course of doing
11
Table of Contents
so, we may be required to utilize intellectual property rights owned by others and may seek licenses to do so. Such licenses may not be obtainable on commercially reasonable terms, or at all. It is also possible that we may inadvertently utilize intellectual property rights held by others, which could result in substantial claims.
Intellectual property infringement claims against us could materially harm results of operations.
Our products incorporate a number of technologies, including high-temperature superconductor technology, technology related to other materials, and electronics technologies. Our patent positions, and that of other companies using high-temperature superconductor technology, is uncertain and there is significant risk that others, including our competitors or potential competitors, have obtained or will obtain patents relating to our products or technologies or products or technologies planned to be introduced by us.
We believe that patents may be or have been issued, or applications may be pending, claiming various compositions of matter used in our products. We may need to secure one or more licenses of these patents. There can be no assurances that such licenses could be obtained on commercially reasonable terms, or at all. We may be required to expend significant resources to develop alternatives that would not infringe such patents or to obtain licenses to the related technology. We may not be able to successfully design around these patents or obtain licenses to them and may have to defend ourselves at substantial cost against allegations of infringement of third party patents or other rights to intellectual property. In those circumstances, we could face significant liabilities and also be forced to cease the use of key technology.
Other parties may have the right to utilize technology important to our business.
We utilize certain intellectual property rights under non-exclusive licenses or have granted to others the right to utilize certain intellectual property rights licensed from a third party. Because we may not have the exclusive rights to utilize such intellectual property, other parties may be able to compete with us, which may harm our business.
Because competition for target employees is intense, we may be subject to claims of unfair hiring practices, trade secret misappropriation or other related claims.
Companies in HTS wire industries whose employees accept positions with competitors frequently claim that competitors have engaged in unfair hiring practices, trade secret misappropriation or other related claims. We may be subject to such claims in the future as we seek to hire qualified personnel, and such claims may result in material litigation. If this should occur, we could incur substantial costs in defending against these claims, regardless of their merits.
Our success depends on the attraction and retention of senior management and technical personnel with relevant expertise.
As a competitor in a highly technical market, we depend heavily upon the efforts of our existing senior management and technical teams. The loss of the services of one or more members of these teams could slow product development and commercialization objectives. Due to the specialized nature of our products, we also depend upon our ability to attract and retain qualified technical personnel with substantial industry knowledge and expertise. Competition for qualified personnel is intense, and we may not be able to continue to attract and retain qualified personnel necessary for the development of our business.
Regulatory changes could substantially harm our business.
Certain regulatory agencies in the United States and other countries set standards for operations within their territories. HTS wire is subject to a regulatory regime, which may become more strictly regulated if the market grows. Any failure or delay in obtaining necessary approvals could harm our business.
12
Table of Contents
We may acquire or make investments in companies or technologies that could cause loss of value to stockholders and disruption of business.
We may explore opportunities to acquire companies or technologies in the future. Other than the acquisition of Conductus, Inc. in 2002, we have not made any such acquisitions or investments to date and, therefore, our ability as an organization to make acquisitions or investments is unproven. An acquisition entails many risks, any of which could adversely affect our business, including:
| • | failure to integrate operations, services and personnel; |
| • | the price paid may exceed the value eventually realized; |
| • | loss of share value to existing stockholders as a result of issuing equity securities to finance an acquisition; |
| • | potential loss of key employees from either our then current business or any acquired business; |
| • | entering into markets in which we have little or no prior experience; |
| • | diversion of financial resources and management’s attention from other business concerns; |
| • | assumption of unanticipated liabilities related to the acquired assets; and |
| • | the business or technologies acquired or invested in may have limited operating histories and may be subjected to many of the same risks to which we are exposed. |
In addition, future acquisitions may result in potentially dilutive issuances of equity securities, or the incurrence of debt, contingent liabilities or amortization expenses or charges related to goodwill or other intangible assets, any of which could harm our business. As a result, if we fail to properly evaluate and execute acquisitions or investments, our business and prospects may be seriously harmed.
If we are unable to implement appropriate controls and procedures to manage our potential growth, we may not be able to successfully offer our products and implement our business plan.
Our ability to successfully offer our products and implement our business plan in a rapidly evolving market requires an effective planning and management process. Growth in future operations would place a significant strain on management systems and resources. We expect that we would need to improve our financial and managerial controls, reporting systems and procedures, and would need to expand, train and manage our work force worldwide. Furthermore, we expect that we would be required to manage multiple relationships with various customers and other third parties.
Compliance with environmental regulations could be especially costly due to the hazardous materials used in the manufacturing process. In addition, we could incur expenditures related to hazardous material accidents.
We are subject to a number of federal, state and local governmental regulations related to the use, storage, discharge and disposal of toxic, volatile or otherwise hazardous chemicals used in our business. Current or future laws and regulations could require substantial expenditures for preventative or remedial action, reduction of chemical exposure, waste treatment or disposal. Any failure to comply with present or future regulations could result in the imposition of fines, suspension of production or interruption of operations. In addition, these regulations could restrict our ability to expand or could require us to acquire costly equipment or incur other significant expense to comply with environmental regulations or to clean up prior discharges.
In addition, although we believe that our safety procedures for the handling and disposing of hazardous materials comply with the standards prescribed by state and federal regulations, there is always the risk of accidental contamination or injury from these materials. To date, we have not incurred substantial expenditures for preventive action with respect to hazardous materials or for remedial action with respect to any hazardous materials accident, but the use and disposal of hazardous materials involves risk that we could incur substantial
13
Table of Contents
expenditures for such preventive or remedial actions. If such an accident were to occur, we could be held liable for resulting damages. The liability in the event of an accident or the costs of such remedial actions could exceed our resources or otherwise have a material adverse effect on our financial condition, results of operations or cash flows.
The reliability of market data included in our public filings is uncertain.
Since we operate in a rapidly changing market, we have in the past, and may from time to time in the future, include market data from industry publications and our own internal estimates in some of the documents we file with the Securities and Exchange Commission. The reliability of this data cannot be assured. Industry publications generally state that the information contained in these publications has been obtained from sources believed to be reliable, but that its accuracy and completeness is not guaranteed. Although we believe that the market data used in our filings with the Securities and Exchange Commission is and will be reliable, it has not been independently verified. Similarly, internal company estimates, while believed by us to be reliable, have not been verified by any independent sources.
Our international operations expose us to certain risks.
In 2007, we formed a joint venture with BAOLI to manufacture and sell our SuperLink interference elimination solution in China. In addition to facing many of the risks faced by our domestic business, if that joint venture or any other international operation we may have is to be successful, we (together with any joint venture partner) must recruit the necessary personnel and develop the facilities needed to manufacture and sell the products involved, learn about the local market (which may be significantly different from our domestic market), build brand awareness among potential customers and compete successfully with local organizations with greater market knowledge and potentially greater resources than we have. We must also obtain a number of critical governmental approvals from both the United States and the local country governments on a timely basis, including those related to any transfers of our technology. We must establish sufficient controls on any foreign operations to ensure that those operations are operated in accordance with our interests, that our intellectual property is protected and that our involvement does not inadvertently create potential competitors. There can be no assurance that these conditions will be met. Even if they are met, the process of building our international operations could divert financial resources and management attention from other business concerns. Finally, our international operations will also be subject to the general risks of international operations, such as:
| • | changes in exchange rates; |
| • | international political and economic conditions; |
| • | changes in government regulation in various countries; |
| • | trade barriers; |
| • | adverse tax consequences; and |
Risks Related to Our Common Stock
Our stock price is volatile.
The market price of our common stock has been, and is expected to be, subject to significant volatility. The value of our common stock may decline regardless of our operating performance or prospects. Factors affecting our market price include:
| • | our perceived prospects and liquidity; |
| • | progress or any lack of progress (or perceptions related to progress) in timely overcoming the remaining substantial technical and commercial challenges related to our Conductus wire initiative; |
| • | variations in our operating results and whether we have achieved key business targets; |
14
Table of Contents
| • | changes in, or our failure to meet, earnings estimates; |
| • | changes in securities analysts’ buy/sell recommendations; |
| • | differences between our reported results and those expected by investors and securities analysts; |
| • | announcements of new contracts by us or our competitors; |
| • | market reaction to any acquisitions, joint ventures or strategic investments announced by us or our competitors; and |
| • | general economic, political or stock market conditions. |
Recent events have caused stock prices for many companies, including ours, to fluctuate in ways unrelated or disproportionate to their operating performance. The general economic, political and stock market conditions that may affect the market price of our common stock are beyond our control. The market price of our common stock at any particular time may not remain the market price in the future.
If we fail to maintain the listing of our common stock with a U.S. national securities exchange, the liquidity of our common stock could be adversely affected.
On October 30, 2015, we received a letter from the Listing Qualifications Department of The Nasdaq Stock Market notifying us that the minimum bid price per share for our common stock fell below $1.00 for a period of 30 consecutive business days and that therefore we did not meet the minimum bid price requirement set forth in Nasdaq Listing Rule 5550(a)(2).
We have been provided 180 calendar days, or until April 27, 2016, to regain compliance with the minimum bid price requirement. In accordance with Rule 5810(c)(3)(A), we can regain compliance if at any time during the 180-day period the closing bid price of our common stock is at least $1.00 for a minimum of 10 consecutive business days. If by April 27, 2016, we cannot demonstrate compliance with the Rule 5550(a)(2), we may be eligible for additional time. To qualify for additional time, we will be required to meet the continued listing requirement for market value of publicly held shares and all other initial listing standards for The Nasdaq Capital Market, with the exception of the bid price requirement, and will need to provide written notice of our intention to cure the deficiency during the second compliance period. If we are not eligible for the second compliance period, then the Nasdaq Staff will provide notice that our securities will be subject to delisting. At such time, we may appeal the delisting determination to a Hearings Panel.
We continue to monitor the closing bid price of our common stock and may, if appropriate, consider implementing available options to regain compliance with the minimum bid price requirement. If our common stock is delisted by The Nasdaq Stock Market, our common stock may be eligible to trade in an over-the-counter market. Any such alternative would likely result in it being more difficult for us to raise additional capital through the public or private sale of equity securities and for investors to dispose of, or obtain accurate quotations as to the market value of, our common stock. In addition, there can be no assurance that our common stock would be eligible for trading on any such alternative exchange or markets.
We have a significant number of outstanding warrants and options, and future sales of the shares obtained upon exercise of these options or warrants could adversely affect the market price of our common stock.
As of December 31, 2015, we had outstanding options exercisable for an aggregate of 1,973,606 shares of common stock at a weighted average exercise price of $2.54 per share and warrants to purchase up to 57,451,915 shares of our common stock at a weighted average exercise price of $0.55 per share. We have registered the issuance of all the shares issuable upon exercise of the options and warrants, and they will be freely tradable by the exercising party upon issuance. The holders may sell these shares in the public markets from time to time, without limitations on the timing, amount or method of sale. As our stock price rises, the holders may exercise their warrants and options and sell a large number of shares. This could cause the market price of our common stock to decline.
15
Table of Contents
Our corporate governance structure may prevent our acquisition by another company at a premium over the public trading price of our shares.
It is possible that the acquisition of a majority of our outstanding voting stock by another company could result in our stockholders receiving a premium over the public trading price for our shares. Provisions of our restated certificate of incorporation, as amended our bylaws and of Delaware corporate law could delay or make more difficult an acquisition of our company by merger, tender offer or proxy contest, even if it would create an immediate benefit to our stockholders. For example, our restated certificate of incorporation does not permit stockholders to act by written consent, and our bylaws generally require ninety days advance notice of any matters to be brought before the stockholders at an annual or special meeting.
In addition, our board of directors has the authority to issue up to 2,000,000 shares of preferred stock and to determine the terms, rights and preferences of this preferred stock, including voting rights of those shares, without any further vote or action by the stockholders. At March 15, 2016, 1,383,727 shares of preferred stock remained unissued. The rights of the holders of common stock may be subordinate to, and adversely affected by, the rights of holders of preferred stock that may be issued in the future. The issuance of preferred stock could also make it more difficult for a third party to acquire a majority of our outstanding voting stock, even at a premium over our public trading price.
Furthermore, our certificate of incorporation also provides for a classified board of directors with directors divided into three classes serving staggered terms. These provisions may have the effect of delaying or preventing a change in control of us without action by our stockholders and, therefore, could adversely affect the price of our stock or the possibility of sale of shares to an acquiring person.
We do not anticipate declaring any cash dividends on our common stock.
We have never declared or paid cash dividends on our common stock and do not plan to pay any cash dividends in the near future. Our current policy is to retain all funds and earnings for use in the operation and expansion of our business.
| ITEM 1B. | UNRESOLVED STAFF COMMENTS |
Not applicable.
| ITEM 2. | PROPERTIES |
We lease all of our properties. All of our operations, including our manufacturing facilities, are located in industrial complexes in Santa Barbara, California and Austin, Texas. We occupy approximately 14,000 square feet in Santa Barbara, California and 94,000 square feet in Austin, Texas under long-term leases that expire in November 2016 and April 2017, respectively. Although we currently have excess capacity, we believe these facilities can be managed in a flexible and cost effective manner and are adequate to meet current and reasonably anticipated needs for approximately the next two years. Both leases contain renewal options.
| ITEM 3. | LEGAL PROCEEDINGS |
From time to time, we are party to various lawsuits, claims and other legal proceedings that arise in the ordinary course of our business. Excluding ordinary, routine litigation incidental to our business, we are not currently a party to any legal proceedings that we believe would reasonably be expected to have a material adverse effect on our business, financial condition or results of operation or cash flow.
| ITEM 4. | MINE SAFETY DISCLOSURES |
Not applicable.
16
Table of Contents
| ITEM 5. | MARKET FOR REGISTRANT’S COMMON EQUITY, RELATED STOCKHOLDER MATTERS AND ISSUER PURCHASES OF EQUITY SECURITIES |
Market for Common Stock
Our common stock is traded on the NASDAQ Capital Market under the symbol “SCON.” The following table shows the high and low sales prices for our common stock as reported by NASDAQ for each calendar quarter in the last two fiscal years:
| High | Low | |||||||
| 2015 | ||||||||
| Quarter ended December 31, 2015 |
$ | 0.78 | $ | 0.15 | ||||
| Quarter ended September 26, 2015 |
$ | 1.43 | $ | 0.76 | ||||
| Quarter ended June 27, 2015 |
$ | 1.44 | $ | 0.82 | ||||
| Quarter ended March 28, 2015 |
$ | 2.90 | $ | 1.31 | ||||
| 2014 | ||||||||
| Quarter ended December 31, 2014 |
$ | 3.10 | $ | 2.54 | ||||
| Quarter ended September 27, 2014 |
$ | 3.23 | $ | 2.42 | ||||
| Quarter ended June 28, 2014 |
$ | 3.23 | $ | 2.16 | ||||
| Quarter ended March 29, 2014 |
$ | 3.82 | $ | 2.15 | ||||
Holders of Record
We had 34 holders of record of our common stock on March 15, 2016. This number does not include stockholders for whom shares were held in a “nominee” or “street” name. We estimate that there are more than 5,000 beneficial owners of our common stock.
Dividends
We have never paid cash dividends and intend to employ all available funds in the development of our business. We have no plans to pay cash dividends in the near future.
Our ability to declare or pay dividends on shares of our common stock is subject to the requirement that we pay an equivalent dividend on each outstanding share of our Series A and Series B Preferred Stock (on an as-converted basis).
Sales of Unregistered Securities
We did not conduct any offerings of equity securities during the fourth quarter of 2015 that were not registered under the Securities Act of 1933.
Repurchases of Equity Securities
The following table summarizes repurchases of our common stock in the quarter ended December 31, 2015:
| Period |
Total Number of Shares Purchased(1) |
Average Price Paid Per Share |
||||||
| September 27, 2015—October 24, 2015 |
— | $ | — | |||||
| October 25, 2015—November 21, 2015 |
133,894 | 0.22 | ||||||
| November 22, 2015—December 31, 2015 |
— | — | ||||||
|
|
|
|
|
|||||
| Total |
133,894 | $ | 0.22 | |||||
|
|
|
|
|
|||||
17
Table of Contents
| (1) | Shares surrendered to us by employees to satisfy tax withholding obligations that arose upon the vesting of restricted stock awards. These repurchases were not made pursuant to publicly announced plans or programs. |
Securities Authorized for Issuance Under Equity Compensation Plans
Equity Compensation Plan Information
| Plan Category |
Number of securities to be issued upon exercise of outstanding options, warrants and rights |
Weighted-average exercise price of outstanding options, warrants and rights |
Number of securities remaining available for future issuance under equity compensation plans (excluding securities reflected in column (a)) |
|||||||||
| Equity compensation plans approved by security holders |
1,973,606 | $ | 2.54 | 1,442,880 | ||||||||
| Equity compensation plans not approved by security holders |
— | — | — | |||||||||
|
|
|
|
|
|
|
|||||||
| Total |
1,973,606 | $ | 2.54 | 1,442,880 | ||||||||
|
|
|
|
|
|
|
|||||||
Stock Performance Graph
The stock performance graph and related information presented below shall not be deemed “soliciting material” or “filed” with the Securities and Exchange Commission or subject to Regulation 14A or 14C under the Securities Exchange Act of 1934, as amended (the “Exchange Act”), or to the liabilities of Section 18 of the Exchange Act, and shall not be deemed incorporated by reference into any filing under the Securities Act of 1933, as amended (the “Securities Act”), or the Exchange Act, except to the extent that we specifically request that such information be treated as soliciting material or specifically incorporate it by reference into such a filing.
18
Table of Contents
The graph and table below compare the cumulative total stockholders’ return on our common stock since December 31, 2010 with the Nasdaq Composite Index, and the Nasdaq Telecommunications Index over the same period (assuming the investment of $100 in our common stock and in the two other indices, and reinvestment of all dividends).
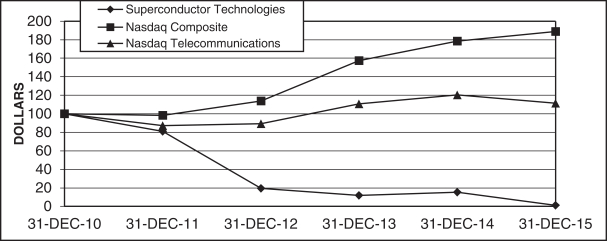
| 31-Dec-10 | 31-Dec-11 | 31-Dec-12 | 31-Dec-13 | 31-Dec-14 | 31-Dec-15 | |||||||||||||||||||
| Superconductor Technologies |
$ | 100.00 | $ | 80.92 | $ | 19.52 | $ | 11.79 | $ | 15.19 | $ | 1.15 | ||||||||||||
| Nasdaq Composite |
100.00 | 98.20 | 113.82 | 157.44 | 178.53 | 188.75 | ||||||||||||||||||
| Nasdaq-Telecommunications |
100.00 | 87.38 | 89.13 | 110.55 | 120.38 | 111.36 | ||||||||||||||||||
19
Table of Contents
| ITEM 6. | SELECTED FINANCIAL DATA |
The information set forth below is not necessarily indicative of results of future operations and should be read in conjunction with our Financial Statements and Notes thereto appearing in Item 15 of Part IV of this Report and “Management’s Discussion and Analysis of Financial Condition and Results of Operations”.
| Years Ended December 31, | ||||||||||||||||||||
| 2015 | 2014 | 2013 | 2012 | 2011 | ||||||||||||||||
| (In thousands, except per share data) | ||||||||||||||||||||
| Statement of Operations Data: |
||||||||||||||||||||
| Net revenues: |
||||||||||||||||||||
| Net commercial product revenues |
$ | 244 | $ | 632 | $ | 1,710 | $ | 3,237 | $ | 3,416 | ||||||||||
| Government and other contract revenues |
— | — | — | 222 | 83 | |||||||||||||||
|
|
|
|
|
|
|
|
|
|
|
|||||||||||
| Total net revenues |
244 | 632 | 1,710 | 3,459 | 3,499 | |||||||||||||||
|
|
|
|
|
|
|
|
|
|
|
|||||||||||
| Costs and expenses: |
||||||||||||||||||||
| Cost of commercial product revenues |
3,004 | 1,558 | 1,051 | 3,850 | 5,434 | |||||||||||||||
| Cost of government and other contract revenues |
— | — | — | 165 | 79 | |||||||||||||||
| Other research and development |
4,125 | 5,992 | 6,073 | 5,030 | 5,325 | |||||||||||||||
| Selling, general and administrative |
5,838 | 5,389 | 5,068 | 5,440 | 6,322 | |||||||||||||||
|
|
|
|
|
|
|
|
|
|
|
|||||||||||
| Total costs and expenses |
12,967 | 12,939 | 12,192 | 14,485 | 17,160 | |||||||||||||||
|
|
|
|
|
|
|
|
|
|
|
|||||||||||
| Loss from operations |
(12,723 | ) | (12,307 | ) | (10,482 | ) | (11,026 | ) | (13,661 | ) | ||||||||||
| Other income (expense), net |
4,121 | 4,056 | (1,691 | ) | 98 | 278 | ||||||||||||||
|
|
|
|
|
|
|
|
|
|
|
|||||||||||
| Net loss |
$ | (8,602 | ) | $ | (8,251 | ) | $ | (12,173 | ) | $ | (10,928 | ) | $ | (13,383 | ) | |||||
|
|
|
|
|
|
|
|
|
|
|
|||||||||||
| Basic and diluted net loss per common share |
$ | (0.44 | ) | $ | (0.64 | ) | $ | (1.71 | ) | $ | (3.34 | ) | $ | (5.05 | ) | |||||
|
|
|
|
|
|
|
|
|
|
|
|||||||||||
| Weighted average number of shares |
||||||||||||||||||||
| Outstanding |
19,706 | 12,794 | 7,124 | 3,269 | 2,652 | |||||||||||||||
| Years Ended December 31, | ||||||||||||||||||||
| 2015 | 2014 | 2013 | 2012 | 2011 | ||||||||||||||||
| Balance Sheet Data: |
||||||||||||||||||||
| Cash and cash equivalents |
$ | 7,469 | $ | 1,238 | $ | 7,459 | $ | 3,634 | $ | 6,165 | ||||||||||
| Working capital |
6,900 | (407 | ) | 6,638 | 3,059 | 7,161 | ||||||||||||||
| Total assets |
14,365 | 10,799 | 14,840 | 12,029 | 12,949 | |||||||||||||||
| Long-term debt, including current portion |
400 | 5,624 | 6,263 | 674 | 628 | |||||||||||||||
| Total stockholders’ equity |
13,122 | 4,002 | 7,306 | 10,292 | 11,175 | |||||||||||||||
20
Table of Contents
| ITEM 7. | MANAGEMENT’S DISCUSSION AND ANALYSIS OF FINANCIAL CONDITION AND RESULTS OF OPERATIONS |
This Management’s Discussion and Analysis of Financial Condition and Results of Operations includes many forward-looking statements. For cautions about relying on such forward looking statements, please refer to the section entitled “Forward Looking Statements” at the beginning of this Report immediately prior to Item 1.
General
We are a leading company in developing and commercializing high temperature superconductor (“HTS”) materials and related technologies. HTS materials can substantially improve the performance characteristics of electrical systems, reducing power loss, lowering heat generation, and decreasing electrical noise.
Results of Operations
2015 Compared to 2014
Net revenues consist primarily of commercial product revenues. Net revenues decreased by $388,000 or 61%, to $244,000 in 2015 from $632,000 in 2014. Sales of our new Conductus wire were equal to $47,000, or 19%, of our total revenue in 2015. Sales of our Conductus wire are expected to increase as we reach production scale in the second half of 2016 and beyond.
The decrease is the result of lower sales volume for our wireless communications products as we grow sales of our Conductus wire. We sell this legacy product to large North American wireless operators whose spending on 3G data networks, where our products are deployed, has become a secondary priority. Sales prices for wireless products were essentially unchanged in 2015 from 2014. Our two largest customers accounted for 80% of our net commercial revenues in 2015 and 83% of our net commercial revenues in 2014. These customers generally purchase products through non-binding commitments with minimal lead-times. Consequently, our commercial product revenues can fluctuate dramatically from quarter to quarter based on changes in our customers’ capital spending patterns. We do not anticipate that the revenues for our legacy products will be significant in the future.
Cost of commercial product revenues includes all direct costs, manufacturing overhead and provision for excess and obsolete inventories. The cost of commercial product revenues totaled $3.0 million for 2015 compared to $1.6 million for 2014, an increase of $1.4 million, or 88%. The higher costs resulted principally from increased manufacturing operating expenses and early low capacity operation and efforts to improve yields from our new large Conductus wire production equipment.
Our cost of revenues includes both variable and fixed cost components. The variable component consists primarily of materials, assembly and test labor, overhead, which includes equipment and facility depreciation, transportation costs and warranty costs. The fixed component includes test equipment and facility depreciation, purchasing and procurement expenses and quality assurance costs. Given the fixed nature of such costs, the absorption of our production overhead costs into inventory decreases and the amount of production overhead variances charged to cost of sales increases as production volumes decline since we have fewer units to absorb our overhead costs against. Conversely, the absorption of our production overhead costs into inventory increases and the amount of production overhead variances expensed to cost of sales decreases as production volumes increase since we have more units to absorb our overhead costs against. As a result, our gross profit margins generally decrease as revenue and production volumes decline due to lower sales volume and higher amounts of production overhead variances expensed to cost of sales; and our gross profit margins generally increase as our revenue and production volumes increase due to higher sales volume and lower amounts of production overhead variances expensed to cost of sales.
21
Table of Contents
The following is an analysis of our commercial product gross profit margins for 2015 and 2014:
| Years Ended December 31, | ||||||||||||||||
| Dollars in Thousands | 2015 | 2014 | ||||||||||||||
| Net commercial product sales |
$ | 244 | 100 | % | $ | 632 | 100 | % | ||||||||
| Cost of commercial product sales |
3,004 | 1,231 | % | 1,558 | 246 | % | ||||||||||
|
|
|
|
|
|
|
|
|
|||||||||
| Gross loss |
$ | (2,760 | ) | 1,131 | % | $ | (926 | ) | 146 | % | ||||||
|
|
|
|
|
|
|
|
|
|||||||||
We had a gross loss of $2.8 million in 2015 from the sale of our commercial products compared to a gross loss of $0.9 million in 2014. We experienced a gross loss in 2015 due to: increases in equipment depreciation, as we bring new Conductus wire equipment into service; our increased manufacturing efforts to bring our Conductus wire production to market and; our sales being insufficient to cover our overhead. To reduce our costs, in February 2015, we reduced our workforce and implemented certain other cost cutting measures. We also increased our legacy wireless inventory reserve by $58,000 during 2015, thus reducing this legacy inventory value to zero. As we emphasize improving manufacturing processes and increasing our yields at lower than optimal capacity, we expect gross losses to continue in the first half of 2016.
Research and development expenses relate to development of new wire products and new wire product manufacturing processes. In 2015, there were no new research and development efforts for our wireless commercial products. Research and development expenses totaled $4.1 million in 2015 compared to $6.0 million in 2014, a decrease of $1.9 million, or 32%. Our 2015 expenses were lower compared to 2014 as a result of our efforts moving from research and development to manufacturing of our new Conductus wire products.
Selling, general and administrative expenses totaled $5.8 million in 2015 compared to $5.4 million in 2014, an increase of $0.4 million or 7%. The higher expenses in 2015 were primarily the result of higher non-cash stock award expenses and were only partially offset by other cost saving efforts.
We had a gain from the adjustment to the fair value of warrant derivatives of $4.8 million in 2015 compared to a gain of $0.5 million in 2014. The primary reason for the gains was the drop in our stock price offset by the resulting effect of the reduction in the exercise price of certain warrants. This warrant liability is adjusted to fair value each reporting period, and any change in value is recognized in the statement of operations. In 2015, we also had a $0.5 million warrant revaluation expense from: (1) the revaluation of warrants just prior to their exercise due to the decrease in their exercise price; and (2) the revaluation of warrants due to our October 14, 2015 financing. See Note 5—Stockholders’ Equity: Warrants.
Interest income decreased to less than a $1,000 in both 2015 and 2014, primarily because of lower cash levels earning less interest.
Other income in 2015 and 2014 of $13,000 and $434,000, respectively, consisted of proceeds from the sale of equipment and expensed tooling related to our legacy wireless products.
Other expense in 2015 of $207,000 consisted of charges associated with the early termination of part of our Santa Barbara facilities lease.
Net loss totaled $8.6 million in 2015, compared to $8.3 million in 2014, an increase of $0.3 million, or 4%. The increase in net loss was principally the result of our Conductus wire revenue being insufficient to cover our increased cost of commercial product revenues as we ramp production.
The net loss available to common stockholders totaled $0.44 per common share in 2015, compared to $0.64 per common share in 2014, a decrease of $0.21, or 31%.
22
Table of Contents
2014 Compared to 2013
Net revenues consist primarily of commercial product revenues. Net revenues decreased by $1,078,000 or 63%, to $632,000 in 2014 from $1,710,000 in 2013. Sales of our Conductus wire were not a significant source of revenue in 2014.
The decrease is the result of lower sales volume for our wireless communications products. We sell this legacy product to large North American wireless operators whose spending on 3G data networks, where our products are deployed, has become a secondary priority. Sales prices for wireless products were essentially unchanged in 2014 from 2013. Our two largest customers accounted for 83% of our net commercial revenues in 2014 and 96% of our net commercial revenues in 2013. These customers generally purchase products through non-binding commitments with minimal lead-times. Consequently, our commercial product revenues can fluctuate dramatically from quarter to quarter based on changes in our customers’ capital spending patterns.
Cost of commercial product revenues includes all direct costs, manufacturing overhead and provision for excess and obsolete inventories. The cost of commercial product revenues totaled $1.6 million for 2014 compared to $1.1 million for 2013, an increase of $0.5 million, or 45%. The higher costs resulted principally from increased manufacturing operating expenses and early low capacity operation of our new large Conductus wire production equipment.
Our cost of sales includes variable and fixed cost components. The variable component consists primarily of materials, assembly and test labor, and overhead, which includes equipment and facility depreciation, transportation costs and warranty costs. The fixed component includes test equipment and facility depreciation, purchasing and procurement expenses and quality assurance costs. Given the fixed nature of such costs, the absorption of our production overhead costs into inventory decreases, and the amount of production overhead variances charged to cost of sales increases, as production volumes decline since we have fewer units to absorb our overhead costs against. Conversely, the absorption of our production overhead costs into inventory increases, and the amount of production overhead variances charged to cost of sales decreases, as production volumes increase since we have more units to absorb our overhead costs against. As a result, our gross profit margins generally decrease as revenue and production volumes decline due to lower sales volume and higher amounts of production overhead variances expensed to cost of sales; and our gross profit margins generally increase as our revenue and production volumes increase due to higher sales volume and lower amounts of production overhead variances charged to cost of sales. Our inventory is valued at the lower of its actual cost or the current estimated market value of the inventory. We review inventory quantities on hand and on order and record, on a quarterly basis, a provision for excess and obsolete inventory and/or vendor cancellation charges related to purchase commitments. If the results of the review determine that a write-down is necessary, we recognize a loss in the period in which the loss is identified, whether or not the inventory is retained.
The following is an analysis of our commercial product gross profit margins for 2014 and 2013:
| Years Ended December 31, | ||||||||||||||||
| Dollars in Thousands | 2014 | 2013 | ||||||||||||||
| Net commercial product sales |
$ | 632 | 100 | % | $ | 1,710 | 100 | % | ||||||||
| Cost of commercial product sales |
1,558 | 246 | % | 1,051 | 61 | % | ||||||||||
|
|
|
|
|
|
|
|
|
|||||||||
| Gross profit (loss) |
$ | (926 | ) | 146 | % | $ | 659 | 39 | % | |||||||
|
|
|
|
|
|
|
|
|
|||||||||
We had a gross loss of $926,000 in 2014 from the sale of our commercial products compared to a gross margin of $659,000 in 2013. The gross loss in 2014 was primarily the result of increased manufacturing process and equipment operating costs as we begin initial operation this equipment well below capacity.
Research and development expenses relate to development of our new wire product and new wire product manufacturing processes. In 2014, there were no new research and development efforts for our wireless
23
Table of Contents
commercial products. Research and development expenses totaled $6.0 million in 2014 compared to $6.1 million in 2013, a decrease of $0.1 million, or 2%. Our 2014 expenses were lower compared to 2013 as a result of a transition of our efforts from research and development to manufacturing of our new Conductus wire products. Our 2013 expenses also included a $337,000 capital equipment obsolescence write-off.
Selling, general and administrative expenses totaled $5.4 million in 2014 compared to $5.1 million in 2013, an increase of $0.3 million or 6%. The lower expenses in 2013 resulted primarily from a refund of legal expenses associated with our Resonant LLC spin-out.
In 2014 we had a net gain of $3.1 million from the sale of our Resonant securities compared to a loss of $238,000 in 2013 from the fair value adjustment of our investment in Resonant.
In 2014 we had a gain of $480,000 from the fair value adjustment of our derivative warrants compared to a 2013 loss of $1,551,000. This warrant liability is adjusted to fair value each reporting period, and any change in value is recognized in the statement of operations.
Interest income decreased to less than a $1,000 in both 2014 and 2013, primarily because of lower cash levels earning less interest.
Other income in 2014 and 2013 of $434,000 and $140,000, respectively, consisted of proceeds from the sale of property and equipment.
Other expense in 2013 of $42,000 consisted of charges associated with the obsolescence of part of our Santa Barbara facility.
We had no interest expense in 2014 and 2013.
Our net loss totaled $8.3 million in 2014, compared to $12.2 million in 2013, a decrease of $3.9 million, or 32%. The decrease in net loss was principally the result of our $3.1 million gain realized from the sale of our investment in Resonant.
The net loss available to common stockholders totaled $0.64 per common share in 2014, compared to $1.71 per common share in 2013, a decrease of $1.07, or 62%.
Liquidity and Capital Resources
Cash Flow Analysis
As of December 31, 2015, we had working capital of $6.9 million, including $7.5 million in cash and cash equivalents, compared to negative working capital of $0.4 million at December 31, 2014, which included $1.2 million in cash and cash equivalents. We currently invest our excess cash in short-term, investment-grade, money-market instruments with maturities of three months or less. Our investments have no exposure to the auction rate securities market.
Cash and cash equivalents increased by $6.3 million from $1.2 million at December 31, 2014 to $7.5 million at December 31, 2015. In 2015, $8.5 million cash was used in operations. This use was offset by net cash proceeds of $14.9 million from the sale of our common shares and warrants.
In 2015 and 2014, net cash used in investing activities was $140,000 and $281,000, respectively. Our 2015 purchases of property and equipment of $141,000 was offset by $1,000 in sales, compared to our 2014 purchases of equipment for our Conductus wire initiative of $3.7 million offset by the sale of property and equipment of $96,000 and the $3.3 million net proceeds from the sale of our Resonant shares.
24
Table of Contents
Net cash was provided by three financing activities in 2015: (1) the February 2015 exercise of 916,858 outstanding warrants issued in connection with our August 2013 underwritten public offering provided net proceeds of $1.7 million; (2) the March 2015 direct sale of 3,062,790 shares of our common stock and 1,531,395 warrants provided net proceeds of $4.6 million; and (3) the October 2015, registered direct offering of 13,531,994 Class A Units of common stock and warrants and 4,750.0005 Class B Units (convertible, subject to certain limitations, into an aggregate of 13,571,430 shares of our common stock), raised net proceeds to us of $8.6 million. Net cash was used for the repurchase of 133,894 common shares from employees to satisfy $26,000 in tax withholding obligations.
Financing Activities
We have historically financed our operations through a combination of cash on hand, equipment lease financings, available borrowings under bank lines of credit and both private and public equity offerings.
Net cash was provided by three financing activities in 2015: (1) the exercise of 916,858 outstanding warrants issued in connection with our August 2013 underwritten public offering provided gross proceeds of $1.8 million and net proceeds of $1.7 million in the first quarter of 2015; (2) the March 2015 direct sale of 3,062,790 shares of our common stock and 1,531,395 warrants provided net proceeds of $4.6 million; and (3) the October 2015, registered direct offering of 13,531,994 Class A Units (consisting of one share of our common stock, a Series A warrant to purchase one share of our common stock at an exercise price equal to $0.35 (“Series A warrant”), and a Series B warrant to purchase 0.75 of a share of our common stock at an exercise price equal to $0.40 per share (“Series B warrant”)). The shares of common stock, Series A warrants and Series B warrants part of a Class A Unit were immediately separable and were issued separately in this offering. The sale of 13,531,994 Class A Units and 4,750.0005 Class B Units (convertible, subject to certain limitations, into an aggregate of 13,571,430 shares of our common stock), Series A warrants to purchase 27,103,424 shares of our common stock and Series B warrants to purchase 20,327,567 shares of our common stock raised gross proceeds to us of $9.5 million. The net proceeds to us from this offering, after deducting the placement agent fees and our offering expenses, were $8.6 million.
During 2014, financing activities totaled $4.1 million from the exercise of 1,589,471 outstanding warrants issued in connection with the above mentioned August 2013 offering.
We currently intend to use the net proceeds of these offerings for working capital and general corporate purposes. General corporate purposes may include repayment of debt and capital expenditures. In addition, we may use a portion of any net proceeds to acquire complementary products, technologies, or businesses.
Contractual Obligations and Commercial Commitments
We incur various contractual obligations and commercial commitments in our normal course of business. They consist of the following:
Operating Lease Obligations. Our operating lease obligations consist of facilities leases in Santa Barbara, California and Austin, Texas, as well as several smaller equipment leases.
Patents and Licenses. We have entered into a licensing agreement requiring royalty payments ranging from 0.5% to 1.0% of specified product sales. The agreement contains a provision for the payment of guaranteed or minimum royalty amounts. Typically, the licensor can terminate our license if we fail to pay minimum annual royalties.
Purchase Commitments. In the normal course of business, we incur purchase obligations with vendors and suppliers for the purchase of inventory, as well as other goods and services. These obligations are generally evidenced by purchase orders that contain the terms and conditions associated with the purchase arrangements. We are committed to accept delivery of such material pursuant to the purchase orders subject to
25
Table of Contents
various contract provisions that allow us to delay receipt of such orders or cancel orders beyond certain agreed upon lead times. Cancellations may result in cancellation costs payable by us.
Tabular Disclosure of Contractual Obligations. At December 31, 2015, we had the following contractual obligations and commercial commitments:
| Contractual Obligations |
Payments Due by Period | |||||||||||||||||||
| Total | 2016 | 2017 and 2018 |
2019 and 2020 |
2021 and beyond |
||||||||||||||||
| Operating leases |
$ | 1,734,000 | $ | 1,374,000 | $ | 333,000 | $ | 27,000 | $ | — | ||||||||||
| Minimum license commitment |
135,000 | 45,000 | 90,000 | — | — | |||||||||||||||
| Fixed asset and inventory purchase commitments |
87,000 | 87,000 | — | — | — | |||||||||||||||
|
|
|
|
|
|
|
|
|
|
|
|||||||||||
| Total contractual cash obligations |
$ | 1,956,000 | $ | 1,506,000 | $ | 423,000 | $ | 27,000 | $ | — | ||||||||||
|
|
|
|
|
|
|
|
|
|
|
|||||||||||
Capital Expenditures
We plan to invest in fixed assets during 2016 on an as-needed basis to enhance manufacturing our Conductus wire products. These expenditures are expected to not exceed $0.8 million.
Future Liquidity
In 2015, we incurred a net loss of $8.6 million and had negative cash flows from operations of $8.5 million. In 2014, we incurred a net loss of $8.3 million and had negative cash flows from operations of $10 million. Our independent registered public accounting firm has included in their audit reports for 2013 through 2015 an explanatory paragraph expressing substantial doubt about our ability to continue as a going concern.
At December 31, 2015 we had $7.5 million in cash. Our cash resources will not be sufficient to fund our business for the next twelve months. We believe the key factors to our future liquidity will be our ability to successfully use our expertise and our technology to generate revenues in various ways, including commercial operations, joint ventures, and licenses and we plan to leverage our leadership in superconducting technologies, extensive intellectual property, and HTS manufacturing expertise to develop and produce our Conductus wire.
We forecast that, after giving effect to the receipt of the proceeds from our 2015 financing activities and steps we have undertaken to reduce our ongoing operating costs through headcount reductions and other cost saving efforts, our cash resources will be sufficient to fund our planned operations into the fourth quarter of 2016. Unless we materially grow our revenues from commercial opportunities during 2016, we will need to raise additional capital to implement our current business plan and maintain our viability.
Net Operating Loss Carryforward
As of December 31, 2015, we had net operating loss carryforwards for federal and state income tax purposes of approximately $334.7 million and $150.5 million, respectively, which expire in the years 2018 through 2035. Of these amounts, $77.5 million and $5.1 million, respectively, resulted from the acquisition of Conductus. Under the Internal Revenue Code change of control limitations, a maximum of $38.3 million and $37.7 million, respectively, will be available for reduction of taxable income. In addition, we had research and development and other tax credits for federal and state income tax purposes of approximately $384,000 and $288,000, respectively, which expire in the years 2030 through 2035.
Due to the uncertainty surrounding their realization, we have recorded a full valuation allowance against our net deferred tax assets. Accordingly, no deferred tax asset has been recorded in the accompanying consolidated balance sheets.
26
Table of Contents
Section 382 of the Internal Revenue Code imposes an annual limitation on the utilization of net operating loss carryforwards based on a statutory rate of return (usually the “applicable federal funds rate”, as defined in the Internal Revenue Code) and the value of the corporation at the time of a “change of ownership” as defined by Section 382. We had changes in ownership in August 1999, December 2002, June 2009, and August 2013. In addition, we acquired the right to Conductus’ net operating losses, which are also subject to the limitations imposed by Section 382. Conductus underwent five ownership changes, which occurred in February 1999, February 2001, December 2002, June 2009, and August 2013. Therefore, the ability to utilize Conductus’ and our net operating loss carryforwards of $77.5 million and $232 million, respectively, which were incurred prior to the 2013 ownership changes, will be subject in future periods to annual limitations of $655,000. Net operating losses released from this limitation and/or incurred by us subsequent to the ownership changes and therefore not subject to this limitation totaled $27.1 million. An additional $655,000 in losses was released from limitation during the year under Section 382.
Market Risk
We are exposed to various market risks, including changes in interest rates. Market risk is the potential loss arising from adverse changes in market rates and prices. We do not enter into derivatives or other financial instruments for trading or speculation purposes. Our money market investments have no exposure to the auction rate securities market.
At December 31, 2015, we had approximately $7.0 million invested in a money market account yielding approximately 0.04%. Assuming no yield on this money market account and no liquidation of principal for the year, our total interest income would decrease by less than $3,000 per annum.
Inflation
We do not foresee any material impact on our operations from inflation.
Critical Accounting Policies and Estimates
Our discussion and analysis of our financial condition and results of operations are based upon our consolidated financial statements, which have been prepared in accordance with accounting principles generally accepted in the United States of America. The preparation of these consolidated financial statements requires us to make estimates and judgments that affect the reported amounts of assets, liabilities, revenues and expenses, and related disclosure of contingent assets and liabilities. We continually evaluate our estimates, including those related to bad debts, inventories, recovery of long-lived assets, income taxes, warranty obligations, contract revenue and contingencies. We base our estimates on historical experience and on various other assumptions that we believed to be reasonable under the circumstances, the results of which form the basis for making judgments about the carrying values of assets and liabilities that are not readily apparent from other sources. Any future changes to these estimates and assumptions could cause a material change to our reported amounts of revenues, expenses, assets and liabilities. Actual results may differ from these estimates under different assumptions or conditions.
On March 11, 2013, we effected a 1-for-12 reverse stock split of our common stock, or the Reverse Stock Split. As a result of the Reverse Stock Split, every twelve shares of our pre-Reverse Stock Split common stock were combined and reclassified into one share of our common stock. The Reverse Stock Split did not change the authorized number of shares or the par value of our common stock. Certain of the information contained in the documents incorporated by reference herein and therein present information on our common stock on a pre-Reverse Split basis. Share and per share data included herein has been retroactively restated for the effect of the reverse stock split. In addition, we identified certain critical accounting policies which affect certain of our more significant estimates and assumptions used in preparing our consolidated financial statements in this Annual Report on Form 10-K for 2015. We have not made any material changes to these policies.
27
Table of Contents
We believe the following critical accounting policies affect our more significant judgments and estimates used in the preparation of the consolidated financial statements. We maintain allowances for doubtful accounts for estimated losses resulting from the inability of our customers to make required payments. If the financial condition of our customers were to deteriorate, resulting in an impairment of their ability to make payments, additional allowances may be required. We write down our inventory for estimated obsolescence or unmarketable inventory equal to the difference between the cost of inventory and the estimated market value based upon assumptions about future demand and market conditions. If actual market conditions are less favorable than those projected by management, additional inventory write-downs may be required.
Our inventory is valued at the lower of its actual cost or the current estimated market value of the inventory. We review inventory quantities on hand and on order and record, on a quarterly basis, a provision for excess and obsolete inventory and/or vendor cancellation charges related to purchase commitments. If the results of the review determine that a write-down is necessary, we recognize a loss in the period in which the loss is identified, whether or not the inventory is retained. Our inventory reserves establish a new cost basis for inventory and are not reversed until we sell or dispose of the related inventory. Such provisions are established based on historical usage, adjusted for known changes in demands for such products, or the estimated forecast of product demand and production requirements. Our business is characterized by rapid technological change, frequent new product development and rapid product obsolescence that could result in an increase in the amount of obsolete inventory quantities on hand. Demand for our products can fluctuate significantly. Our estimates of future product demand may prove to be inaccurate, and we may understate or overstate the provision required for excess and obsolete inventory.
Our net sales consist of revenue from sales of products, net of trade discounts and allowances. We recognize revenue when evidence of an arrangement exists, contractual obligations have been satisfied, title and risk of loss have been transferred to the customer and collection of the resulting receivable is reasonably assured. At the time revenue is recognized, we provide for the estimated cost of product warranties if allowed for under contractual arrangements and return products. Our warranty obligation is affected by product failure rates and service delivery costs incurred in correcting a product failure. Should such failure rates or costs differ from these estimates, accrued warranty costs would be adjusted.
We indemnify, without limit or term, our customers against all claims, suits, demands, damages, liabilities, expenses, judgments, settlements and penalties arising from actual or alleged infringement or misappropriation of any intellectual property relating to our products or other claims arising from our products. We have no known losses and we cannot reasonably develop an estimate of the maximum potential amount of payments that might be made under our indemnities because of the uncertainty as to whether a claim might arise and how much it might total.
Contract revenues are principally generated under research and development contracts. Contract revenues are recognized utilizing the percentage-of-completion method measured by the relationship of costs incurred to total estimated contract costs. If the current contract estimate were to indicate a loss, utilizing the funded amount of the contract, a provision would be made for the total anticipated loss. Contract revenues are derived primarily from research contracts with agencies of the United States Government. Credit risk related to accounts receivable arising from such contracts is considered minimal. These contracts include cost-plus, fixed price and cost sharing arrangements and are generally short-term in nature.
All payments to us for work performed on contracts with agencies of the U.S. Government are subject to adjustment upon audit by the Defense Contract Audit Agency. Based on historical experience and review of current projects in process, we believe that the audits will not have a significant effect on our financial position, results of operations or cash flows. The Defense Contract Audit Agency has audited us through 2006.
We periodically evaluate the realizability of long-lived assets as events or circumstances indicate a possible inability to recover the carrying amount. Long-lived assets that will no longer be used in our business are written off in the period identified since they will no longer generate any positive cash flows for us. Such evaluation is
28
Table of Contents
based on various analyses, including cash flow and profitability projections. The analyses necessarily involve significant management judgment. In the event the projected undiscounted cash flows are less than net book value of the assets, the carrying value of the assets will be written down to their estimated fair value. Our future cash flows may vary from estimates.
Stock-based employee compensation cost is recognized using the fair-value based method for all awards granted. We issue stock option awards and restricted share awards to employees and to non-employee directors under our stock-based incentive plans. The fair value of each option grant is estimated on the date of grant using the Black-Scholes option pricing model. Compensation cost related to restricted share awards is recorded based on the market price of our common stock on the grant date. We recognize compensation expense over the expected service period, generally the vesting period on a straight-line basis from the grant date.
Our valuation allowance against the deferred tax assets is based on our assessments of historical losses and projected operating results in future periods. If and when we generate future taxable income in the U.S. against which these tax assets may be applied, some portion or all of the valuation allowance would be reversed and an increase in net income would consequently be reported in future years.
| ITEM 7A. | QUANTITATIVE AND QUALITATIVE DISCLOSURES ABOUT MARKET RISK |
See “Management’s Discussion and Analysis of Financial Condition and Results of Operations—Market Risk.”
| ITEM 8. | FINANCIAL STATEMENTS AND SUPPLEMENTARY DATA |
All information required by this item is listed in the Index to Financial Statements in Part IV, Item 15(a)1 of this Report.
| ITEM 9. | CHANGES IN AND DISAGREEMENTS WITH ACCOUNTANTS ON ACCOUNTING AND FINANCIAL DISCLOSURE |
Not applicable.
| ITEM 9A. | CONTROLS AND PROCEDURES |
Disclosure Controls and Procedures; Changes in Internal Control Over Financial Reporting
We have established disclosure controls and procedures (as defined in Rules 13a-15(e) and 15d-15(e) under the Securities Exchange Act of 1934, as amended). As of the end of the period covered by this report we carried out an evaluation under the supervision and with the participation of our management, including our Chief Executive Officer and Chief Financial Officer, of the effectiveness of the design and operation of our disclosure controls and procedures pursuant to Rule 13a-15 of the Securities and Exchange Act of 1934, as amended. Based upon that evaluation, the Chief Executive Officer and Chief Financial Officer concluded, as of that time, that our disclosure controls and procedures are effective.
There were no changes in our internal controls over financial reporting during the fourth quarter of the year ended December 31, 2015 that have materially affected, or are reasonably likely to materially affect, our internal control over financial reporting.
We do not expect that our disclosure controls and procedures or our internal controls will prevent all error and all fraud. A control system, no matter how well conceived and operated, can provide only reasonable, not absolute, assurance that the objectives of the control system are met. Further, the design of a control system must reflect the fact that there are resource constraints, and the benefits of controls must be considered relative to their costs. Because of the inherent limitations in all control systems, no evaluation of controls can provide absolute assurance that all control issues and instances of fraud, if any, have been detected.
29
Table of Contents
Management’s Report on Internal Control Over Financial Reporting
Our management is responsible for establishing and maintaining adequate internal control over our financial reporting (as defined in Rule 13a-15(f) under the Securities Exchange Act of 1934, as amended). Our management assessed the effectiveness of our internal controls over financial reporting as of December 31, 2015. In making its assessment of the effectiveness of our internal controls over financial reporting, our management used the criteria set forth by the Committee of Sponsoring Organizations of the Treadway Commission in Internal Control-Integrated Framework (2013). Based on these criteria, our management has concluded that, as of December 31, 2015, our internal control over financial reporting is effective.
This Report does not include an attestation report of our registered public accounting firm regarding internal control over financial reporting. This Report was not subject to attestation by our registered public accounting firm pursuant to the rules of the Securities and Exchange Commission.
| ITEM 9B. | OTHER INFORMATION |
None.
30
Table of Contents
| ITEM 10. | DIRECTORS, EXECUTIVE OFFICERS AND CORPORATE GOVERNANCE |
Directors and Executive Officers
The following table sets forth certain information regarding those individuals currently serving as our directors (or nominated to serve as a director) and executive officers as of March 15, 2016:
| Name |
Age | Position | ||||
| Martin A. Kaplan(1)(2)(3) |
78 | Chairman of the Board | ||||
| Lynn J. Davis(1)(2)(3)(4) |
69 | Director | ||||
| Dan L. Halvorson(1)(2)(3) |
50 | Director | ||||
| Jeffrey A. Quiram(4) |
55 | President, Chief Executive Officer and Director | ||||
| William J. Buchanan |
67 | Chief Financial Officer (Principal Financial and Accounting Officer) | ||||
| Kenneth E. Pfeiffer |
48 | Vice President, Engineering | ||||
| Robert L. Johnson |
65 | Senior Vice President, Operations | ||||
| Adam L. Shelton |
49 | Vice President, Product Management and Marketing | ||||
| (1) | Member of our Audit Committee |
| (2) | Member of our Compensation Committee. |
| (3) | Member of our Governance and Nominating Committee. |
| (4) | Member of our Stock Option Committee. |
Each of our directors, including each of our current nominees, was nominated based on the assessment of our Nominating Committee and our Board that he has demonstrated: an ability to make meaningful contributions to our Board; independence; strong communication and analytical skills; and a reputation for honesty and ethical conduct. Our Board consists of, and seeks to continue to include, persons whose diversity of skills, experience and background are complementary to those of our other directors.
Martin A. Kaplan has served on our board since 2002 and was named Chairman of the Board in October 2010. From 2000 through 2012, Mr. Kaplan was Chairman of the Board of JDS Uniphase, Inc. (“JDSU”), a telecommunications equipment company, where he remained a director until August 2015. In August 2015, JDSU spun off its communications and commercial optical products business into the publicly-traded company Lumentum Holdings Inc., at which time Mr. Kaplan resigned from the JDSU Board and became Chairman of the Board of Lumentum Holdings Inc. In a career spanning 40 years, Mr. Kaplan last served as Executive Vice-President of the Pacific Telesis Group, which became a subsidiary of SBC Communications in 1997. Mr. Kaplan has served as a director of a number of other public and private companies. Mr. Kaplan earned a B.S. in engineering from California Institute of Technology. Our Board has determined that Mr. Kaplan is qualified to serve as a director because he has extensive business leadership and board experience.
Lynn J. Davis has served on our Board since 2005. He served as President, Chief Operating Officer and director of August Technology, a manufacturer of inspection equipment for the semiconductor fabrication industry from 2005 to 2006. From 2002 to 2004, he was a partner at Tate Capital Partners Fund, LLC, a private investment firm he co-founded. Prior to Tate, Mr. Davis was an employee of ADC Telecommunications for 28 years, serving in 14 management positions, including Corporate President, Group President and Chief Operating Officer. He is also Chairman of the Board of Directors of Flexsteel Industries Inc., a furniture manufacturer. Mr. Davis holds a B.S. in electrical engineering from Iowa State University and an M.B.A. from the University of Minnesota. Our Board has determined that Mr. Davis is qualified to serve as a director because he has extensive knowledge in various management roles in the telecommunications industry, including manufacturing, sales and marketing. In addition, as a venture capitalist, Mr. Davis has worked with smaller companies and brings a valuable entrepreneurial approach to management and compensation issues.
31
Table of Contents
Dan L. Halvorson joined our Board in March 2014. Mr. Halvorson is currently the Executive Vice President and Chief Financial Officer for OneRoof Energy, Inc., a technology finance provider for residential solar systems. Mr. Halvorson previously served as the Executive Vice President and Chief Financial Officer of Mandalay Digital Group, Inc. from September 2012 through December 2012 and Executive Vice President-Operations and Chief Financial Officer for DivX, Inc. from 2007 until its acquisition by Sonic Solutions in October 2010. Prior to joining DivX, he served at Novatel Wireless, Inc., from 2000 to 2007, most recently as its Chief Financial Officer. He was Director of Finance for Dura Pharmaceuticals, Inc. from 1988 to 2000, when the company was acquired by Elan Corporation, and Director of Finance for Alliance Pharmaceutical Corp. from 1996 to 1998. From 1988 to 1994, Mr. Halvorson was with Deloitte & Touche LLC, and subsequently, with PriceWaterhouseCoopers LLP from 1994 until he joined Alliance Pharmaceutical Corp. in 1996. Mr. Halvorson is a certified public accountant (inactive) and holds a Bachelor of Science in Business Administration and Accounting from San Diego State University. Our Board has determined that Mr. Halvorson is qualified to serve as a director because he has extensive knowledge about public and financial accounting matters.
Jeffrey A. Quiram has served on our Board, and has been our President and Chief Executive Officer, since 2005. From 1991 to 2004, Mr. Quiram served ADC Telecommunications in a variety of management roles, including Vice President of its wireless business unit. Mr. Quiram has a B.S. in Quantitative Methods and Computer Science from College of St. Thomas, and an M.B.A. from University of Minnesota. Our Board has determined that Mr. Quiram is qualified to serve as a director because he has extensive knowledge about product development, business planning, and complex manufacturing. In addition, he has extensive knowledge about our corporate operations and market activities from serving as our Chief Executive Officer.
William J. Buchanan has been our Chief Financial Officer since May 2010. Mr. Buchanan joined us in 1998 and served as our Controller from 2000 to May 2010. For 16 years prior to joining us, he was a self-employed private investor and investment advisor. For the nine years prior to that, he served in various executive and accounting positions with Applied Magnetics Corp and Raytheon Co. Mr. Buchanan holds a B.A. in Economics from California State University, Fresno.
Robert L. Johnson has been our Senior Vice President, Operations since 2004. Mr. Johnson joined us in 2000 as Vice President of Wireless Manufacturing. From 1996 to 2000, Mr. Johnson was the Director and General Manager of Schlumberger ATE. From 1990 to 1996, he served as Vice President and General Manager of Harman International Industries. Mr. Johnson studied industrial engineering at Arizona State University.
Adam L. Shelton has been our Vice President, Product Management and Marketing since 2006. From 2005 to 2006, Mr. Shelton was the Senior Director of Marketing for Motorola. From 2003 to 2005, he was the Senior Director of Marketing for Advanced Fibre Communications (AFC), now Tellabs. Mr. Shelton also held various management and executive management positions with Mahi Networks, ATU Communications and Bell Canada. Mr. Shelton graduated with dean’s honors as a Civil Engineering Technologist from Seneca College in Toronto, Canada.
Kenneth E. Pfeiffer has been our Vice President, Engineering since 2012. From 2009 to 2011, Mr. Pfeiffer was Vice President, Engineering at Veeco Instruments Inc. From 2006 to 2009, Mr. Pfeiffer was the Director of Equipment Engineering for HelioVolt Corporation. Prior to that, Mr. Pfeiffer held various engineering and management positions at Active Power, Inc. and Applied Materials, Inc. Mr. Pfeiffer obtained a B.S. Mechanical Engineering degree from Texas A&M University in 1990 and a M.S. Mechanical Engineering from the University of Texas in 1994. He also holds a Master’s in Business Administration degree from the University of Texas at Austin.
Corporate Governance Policies and Practices
The following is a summary of our corporate governance policies and practices:
| • | Our Board has determined that all of our directors, other than Mr. Quiram, are independent as defined by the rules of the SEC and The NASDAQ Stock Market (“NASDAQ”). Our Audit Committee, |
32
Table of Contents
| Compensation Committee and Governance and Nominating Committee each consists entirely of independent directors under the rules of the SEC and NASDAQ. |
| • | We have a Code of Business Conduct and Ethics for all of our employees, including our Chief Executive Officer and Chief Financial Officer. If we amend any provision of our Code of Business Conduct and Ethics that applies to our Chief Executive Officer or Chief Financial Officer (or any persons performing similar functions), or if we grant any waiver (including an implicit waiver) from any provision of our Code of Business Conduct and Ethics to our Chief Executive Officer or Chief Financial Officer (or any persons performing similar functions), we will disclose those amendments or waivers on our website at www.suptech.com/Investors/Corporate Governance/Amendments and Waivers to the Code of Conduct within four business days following the date of the amendment or waiver. |
| • | Our Audit Committee reviews and approves all related-party transactions. |
| • | As part of our Code of Business Conduct and Ethics, we have made a “whistleblower” hotline available to all employees for anonymous reporting of financial or other concerns. Our Audit Committee receives directly, without management participation, all hotline activity reports concerning accounting, internal controls or auditing matters. |
Board Leadership Structure and Role in Risk Oversight
Our Board’s current policy is to separate the role of Chairman of our Board and Chief Executive Officer. Our Board believes that this structure combines accountability with effective oversight. This structure also allows us to benefit from the experience and knowledge of our Chairman, who has been on our board since 2002, while reflecting the responsibilities and contributions of our Chief Executive Officer. In addition, we believe that the independence of our Chairman provides additional oversight over the decisions of our management and places additional control in the hands of our independent directors.
Our Board is actively involved in overseeing our risk management through our Audit Committee. Under its charter, our Audit Committee is responsible for inquiring of management and our independent auditors about significant areas of risk or exposure and assessing the steps management has taken to minimize such risks. Our Board’s role in risk oversight has not affected our Board’s determination that the separation of roles of Chairman and Chief Executive Officer is most appropriate for our company.
Stockholder Communications with Directors
Stockholders who want to communicate with our Board or with a particular director or committee may send a letter to our Secretary at Superconductor Technologies Inc., 9101 Wall Street, Suite 1300, Austin, Texas 78754. The mailing envelope should contain a clear notation indicating that the enclosed letter is a “Board Communication” or “Director Communication.” All such letters should state whether the intended recipients are all members of our Board or just certain specified individual directors or a specified committee. The Secretary will circulate the communications (with the exception of commercial solicitations) to the appropriate director or directors. Communications marked “Confidential” will be forwarded unopened.
Attendance at Annual Meetings of Stockholders
We expect that all of our Board members attend our Annual Meetings of Stockholders in the absence of a showing of good cause for failure to do so. All of the members of our Board attended our 2015 Annual Meeting of Stockholders.
Board Meetings and Committees
During 2015, each of our directors attended at least 75% of the aggregate of (i) the total number of Board meetings and (ii) the total number of meetings of the committees on which the director served.
33
Table of Contents
Board of Directors
Our Board held a total of five meetings during 2015. Our Board has three standing committees—an Audit Committee established in accordance with section 3(a)(58)(A) of the Securities Exchange Act of 1934 (our “Audit Committee”), a Compensation Committee (our “Compensation Committee”) and a Governance and Nominating Committee (our “Nominating Committee”). Our Audit Committee, Compensation Committee and Nominating Committee each have a charter, which is available at the “Corporate Governance” section under the “Investors” tab on our website at www.suptech.com.
Audit Committee
The principal functions of our Audit Committee are to hire our independent public auditors, to review the scope and results of the year-end audit with management and the independent auditors, to review our accounting principles and our system of internal accounting controls and to review our annual and quarterly reports before filing them with the SEC. Our Audit Committee met eight times during 2015. The current members of our Audit Committee are Messrs. Halvorson (Chairman), Kaplan and Davis.
Our Board has determined that all members of our Audit Committee are “independent” as defined under the rules of the SEC and the listing standards of NASDAQ. Our Board has determined that Mr. Halvorson is an “audit committee financial expert.”
Compensation Committee
Our Compensation Committee reviews and approves salaries, bonuses and other benefits payable to the executive officers and administers our management incentive plan. Our Compensation Committee makes all compensation decisions with respect to our Chief Executive Officer and then recommends these decisions to our Board for approval. Our Compensation Committee also makes recommendations to our Board regarding non-equity compensation and equity awards to our other named executive officers (set forth below under “Executive Compensation—Summary Compensation Table”) and all other elected officers. In doing so, with respect to named executive officers other than the Chief Executive Officer, our Compensation Committee generally receives a recommendation from our Chief Executive Officer and other officers as appropriate. Our Chief Executive Officer also generally recommends the number of options or other equity awards to be granted to executive officers, within a range associated with the individual executive’s salary level, and presents this to our Compensation Committee for its review and approval.
Our Compensation Committee uses available data to review and compare our compensation levels to market compensation levels, taking into consideration the other companies’ size, the industry, and the individual executive’s level of responsibility, as well as anecdotal data regarding the compensation practices of other employers. We periodically benchmark our executive and director compensation against publically available peer data. Our Compensation Committee does not generally hire an outside consulting firm to assist with compensation, as we believe that the value of doing so is exceeded by the costs. No compensation consultant was engaged to provide advice or recommendations on our executive or director compensation for 2015.
Our Compensation Committee also reviews the compensation of directors and recommends to our Board the amounts and types of cash to be paid and equity awards to be made to our directors.
Our Compensation Committee met four times during 2015. The current members of our Compensation Committee are Messrs. Davis (Chairman), Kaplan and Halvorson. Our Board has determined that all members of our Compensation Committee are “independent” as defined under the rules of the SEC and the listing standards of NASDAQ. Our Compensation Committee will only delegate its authority to the extent consistent with our certificate of incorporation and bylaws and applicable laws, regulations and listing standards.
34
Table of Contents
Our Compensation Committee created the Stock Option Committee (our “Stock Option Committee”) consisting of two members—our Compensation Committee Chairman and the Chief Executive Officer. The purpose of our Stock Option Committee is to facilitate the timely granting of stock options in connection with hiring, promotions and other special situations, and therefore our Stock Option Committee meets only periodically as certain events occur. Our Stock Option Committee is empowered to grant options to non-executive employees up to a preset annual aggregate limit (120,000 shares for 2015). The Stock Option Committee met once during 2015. Our Compensation Committee supervises these grants and retains exclusive authority for all executive officer grants and the annual employee grants. The current members of our Stock Option Committee are Messrs. Davis (Chairman) and Quiram.
Governance and Nominating Committee
Our Nominating Committee is responsible for overseeing and, as appropriate, making recommendations to our Board regarding, membership and constitution of our Board and its role in overseeing our affairs. Our Nominating Committee is responsible for proposing a slate of directors for election by the stockholders at each annual meeting and for proposing candidates to fill any vacancies. Our Nominating Committee is also responsible for the corporate governance practices and policies of our Board and its committees. The current members of our Nominating Committee are Messrs. Kaplan (Chairman), Davis, and Halvorson. Our Nominating Committee met four times in 2015. Our Board has determined that all members of our Nominating Committee are “independent” as defined under the rules of the SEC and the listing standards of NASDAQ.
Our Nominating Committee manages the process for evaluating current Board members at the time they are considered for re-nomination. After considering the appropriate skills and characteristics required on our Board, the current makeup of our Board, the results of the evaluations, and the wishes of our Board members to be re-nominated, our Nominating Committee recommends to our Board whether those individuals should be re-nominated.
Our Nominating Committee periodically reviews with our Board whether it believes our Board would benefit from adding a new member(s), and if so, the appropriate skills and characteristics required for the new member(s). If our Board determines that a new member would be beneficial, our Nominating Committee solicits and receives recommendations for candidates and manages the process for evaluating candidates. All potential candidates, regardless of their source (including candidates recommended by security holders), are reviewed under the same process. Our Nominating Committee (or its chair) screens the available information about the potential candidates. Based on the results of the initial screening, interviews with viable candidates are scheduled with Nominating Committee members, other members of our Board and senior members of management. Upon completion of these interviews and other due diligence, our Nominating Committee may recommend to our Board the election or nomination of a candidate.
Candidates for independent Board members have typically been found through recommendations from directors or others associated with us. Our stockholders may also recommend candidates by sending the candidate’s name and resume to our Nominating Committee under the provisions set forth above for communication with our Board. No such suggestions from our stockholders were received in time for our 2015 Annual Meeting.
Our Nominating Committee has no predefined minimum criteria for selecting Board nominees, although it believes that (i) all directors should share qualities such as: an ability to make meaningful contributions to our board; independence; strong communication and analytical skills; and a reputation for honesty and ethical conduct; and (ii) independent directors should share qualities such as: experience at the corporate, rather than divisional level, in multi-national organizations as large as or larger than us; and relevant, non-competitive experience. Our Nominating Committee does not have a formal policy with respect to diversity. However, our Nominating Committee and our Board believe that it is important that we have Board members whose diversity of skills, experience and background are complementary to those of our other Board members. In considering
35
Table of Contents
candidates for our Board, our Nominating Committee considers the entirety of each candidate’s credentials. In any given search, our Nominating Committee may also define particular characteristics for candidates to balance the overall skills and characteristics of our Board and our perceived needs. However, during any search, our Nominating Committee reserves the right to modify its stated search criteria for exceptional candidates.
SECTION 16(a) BENEFICIAL OWNERSHIP REPORTING COMPLIANCE
Section 16(a) of the Securities Exchange Act of 1934 requires our directors, executive officers and significant stockholders (defined by statute as stockholders beneficially owning more than 10% of our common stock) to file with the SEC initial reports of beneficial ownership, and reports of changes in beneficial ownership, of our common stock. Directors, executive officers and significant stockholders are required by SEC regulations to furnish us with copies of all Section 16(a) forms they file. Based solely on a review of the copies of Forms 3, 4 and 5 (and amendments thereto) filed with the SEC and submitted to us, and on written representations by certain directors and executive officers received by us, we believe that all of our executive officers, directors and significant stockholders complied with all applicable filing requirements under Section 16(a) during 2015, except Jeffrey A. Quiram, Martin A. Kaplan, Lynn J. Davis, Dan L. Halvorson, William J. Buchanan, Robert L. Johnson, Adam L. Shelton, Kenneth E. Pfeiffer each filed one late Form 4 on November 12, 2015 reporting a transaction on November 9, 2015.
36
Table of Contents
AUDIT COMMITTEE REPORT
The information contained in this Audit Committee Report shall not be deemed incorporated by reference in any filing under the Securities Act of 1933 or the Securities Exchange Act of 1934, whether made before or after the date hereof and irrespective of any general incorporation language in any such filing (except to the extent that we specifically incorporate this information by reference) and shall not otherwise be deemed “soliciting material” or “filed” with the SEC or subject to Regulation 14A or 14C, or to the liabilities of Section 18 of the Securities Exchange Act of 1934 (except to the extent that we specifically request that this information be treated as soliciting material or specifically incorporate this information by reference).
Our Audit Committee reviews our financial reporting process on behalf of our Board. Management has the primary responsibility for the financial statements and the reporting process, including the system of internal controls. Our Audit Committee has reviewed and discussed the audited financial statements with management. In addition, our Audit Committee has discussed with our independent registered public accounting firm the matters required to be discussed by Statements on Public Company Accounting Oversight Board Auditing Standard No. 16 “Communications with Audit Committees”.
Our Audit Committee has also received the written disclosures and the letter from our independent registered public accounting firm required by applicable requirements of the Public Company Accounting Oversight Board regarding their communications with the audit committee concerning independence, and has discussed with them their independence, including whether their provision of other non-audit services to us is compatible with maintaining their independence.
Our Audit Committee discussed with our independent registered public accounting firm the overall scope and plans for the audit. Our Audit Committee meets with them, with and without management present to discuss the results of their examinations, the evaluation of our internal controls and the overall quality of our reporting.
Based upon the review and discussions referred to in the foregoing paragraphs, our Audit Committee recommended to our Board that the audited financial statements be included in our Annual Report on Form 10-K for 2015 for filing with the Securities and Exchange Commission.
AUDIT COMMITTEE
Dan L. Halvorson (Chairman)
Martin A. Kaplan
Lynn J. Davis
37
Table of Contents
| ITEM 11. | EXECUTIVE COMPENSATION |
Summary Compensation Table
The following table sets forth for 2015, 2014 and 2013 the base salary and other compensation of our (i) President and Chief Executive Officer and (ii) our other two most highly compensated officers for 2015 (our “named executive officers”):
| Name and Principal Position |
Year | Salary ($) |
Stock Awards ($)(1) |
Option Awards ($)(1) |
Non-equity Incentive Plan Compensation ($) |
All Other Compensation ($)(2) |
Total ($) | |||||||||||||||||||||
| Jeffrey A. Quiram |
2015 | 324,450 | — | 30,177 | — | 35,754 | 390,381 | |||||||||||||||||||||
| President, Chief |
2014 | 324,450 | 743,211 | — | — | 42,814 | 1,110,475 | |||||||||||||||||||||
| Executive Officer, Director |
2013 | 324,450 | 23,387 | 408,732 | — | 50,830 | 807,399 | |||||||||||||||||||||
| Robert L. Johnson |
2015 | 242,462 | — | 16,597 | — | 15,799 | 274,858 | |||||||||||||||||||||
| Senior Vice President, |
2014 | 242,462 | 416,554 | — | — | 15,274 | 674,290 | |||||||||||||||||||||
| Operations |
2013 | 242,462 | 13,108 | 227,148 | — | 14,262 | 496,980 | |||||||||||||||||||||
| Adam L. Shelton |
2015 | 247,200 | — | 16,597 | — | 4,850 | 268,647 | |||||||||||||||||||||
| Vice President Product |
2014 | 247,200 | 424,692 | — | — | 4,850 | 676,742 | |||||||||||||||||||||
| Management and Marketing |
2013 | 247,200 | 13,364 | 227,316 | — | 1,971 | 489,851 | |||||||||||||||||||||
| (1) | The Option Awards and Stock Awards amounts represent the aggregate grant date fair value of the options to purchase common stock or shares of restricted common stock (as applicable) calculated in accordance with ASC 718, under the assumptions included in Note 5 to our audited financial statements for the year ended December 31, 2015 included in this Annual Report on Form 10-K. |
| (2) | The All Other Compensation amounts shown reflect the value attributable to term life insurance premiums and company 401(k) matching for each named executive officer as well as other perquisites described below. Each named executive officer is responsible for paying income tax on such amounts. The aggregate dollar amount of perquisites or other personal benefits for Mr. Johnson is less than $10,000. Pursuant to the terms of his employment agreement, Mr. Quiram received $30,213, $37,724 and $45,740 in 2015, 2014 and 2013, respectively, for travel expenses from his home in Minnesota, temporary housing near our Santa Barbara and Austin facilities, the use of an automobile, and special indemnity payments to cover the taxes resulting from the payment or reimbursement of such travel and housing expenses. |
Narrative Disclosure to Summary Compensation Table
Employment Agreement
We entered into an employment agreement with Mr. Quiram in 2005, which was amended in 2007. The employment agreement provides for the following:
| • | Appointment as our President, Chief Executive Officer and a member of our Board; |
| • | A base salary, which was $315,000 per year for 2008-2009 and increased to $324,450 during 2010; |
| • | A bonus of up to 100% of his base salary based upon achievement of annual performance goals to be developed by our Compensation Committee and Mr. Quiram; |
| • | Accelerated vesting of all his equity grants in the event of an Involuntary Termination or Change of Control (both as defined in his employment agreement); |
| • | A severance payment equal to one year’s salary and continued benefits for one year in the event of Involuntary Termination; |
| • | In the event of a Change of Control, whether or not he is terminated, Mr. Quiram is entitled to (i) payment of two times his annual base salary, (ii) 24 months of benefits coverage, and (iii) accelerated vesting of all of his outstanding equity grants; |
38
Table of Contents
| • | Payment or reimbursement of travel expenses from his present home in Minnesota and the lease of an apartment for Mr. Quiram near our headquarters; and a special indemnity payment for any taxes resulting from the payment or reimbursement of such expenses; and |
| • | Lease of an automobile. |
Change of Control Agreements
We also have a “change of control” agreement with Mr. Shelton. The change of control agreement generally provide that, if the employee’s employment is terminated within twenty-four months of a “Change of Control” (as defined in the change of control agreement) either (i) by us for any reason other than death, “Cause” or “Disability” (as both terms are defined in the change of control agreement) or (ii) by the employee for “Good Reason” (as defined in the change of control agreements), then the terminated employee will be entitled to severance benefits, salary continuation payments and continuation of health/life insurance benefits for 18 months, and accelerated vesting for all outstanding unvested stock options and other equity securities held by the employee. Any payments or distributions made to or for the benefit of the named employee under the change of control agreement will be reduced, if necessary, to an amount that would result in no excise taxes being imposed under Internal Revenue Code Section 4999.
Non-Equity Incentive Compensation
We maintain a bonus plan for executive officers and selected other members of senior management. Under the plan, our Compensation Committee establishes financial and other pertinent objectives for the period and assigns each executive officer an annual target bonus amount based on a percentage of his or her base salary, which ranges from 20% to 100%. Our Compensation Committee also retains the authority to award discretionary bonuses for performance in other aspects of the business not covered by the established goals. In December 2014, our Compensation Committee decided, based on then-current economic conditions, to not establish financial performance targets under this plan for 2015 and to not award cash bonuses based on financial objectives in 2015. Our Compensation Committee did reserve its right to award discretionary bonuses if appropriate; however no bonuses were awarded for 2015.
Equity Grants
For 2015, we made the following grants of restricted stock awards and options to our named executive officers:
| Name |
Grant Date | Stock Awards: Number of Shares (#) |
Option Awards: Number of Shares underlying options (#) |
Exercise price of option awards ($/Share) |
Grant date Fair Value of Stock & Option Awards ($)(1) |
|||||||||||||||
| Jeffrey A. Quiram |
11/09/2015 | — | 200,000 | 0.22 | 30,177 | |||||||||||||||
| Robert L. Johnson |
11/09/2015 | — | 110,000 | 0.22 | 16,597 | |||||||||||||||
| Adam L. Shelton |
11/09/2015 | — | 110,000 | 0.22 | 16,597 | |||||||||||||||
| (1) | The value of a stock award or stock option award is based on the fair market value as of the grant date of such award determined pursuant to ASC 718. Stock awards consist of restricted stock awards. The price for all awards granted to the named executive officers is 100% of the fair market value of the shares on the grant date. |
39
Table of Contents
Outstanding Equity Awards at Fiscal Year End
The following table sets forth certain information with respect to outstanding options and unvested shares of restricted stock on December 31, 2015:
| Option Awards | Stock Awards | |||||||||||||||||||||||
| Name |
Number of Securities Underlying Unexercised Options(#) Exerciseable (1) |
Number of Securities Underlying Unexercised Options(#) Unexerciseable |
Option Exercise Price ($) |
Option Expiration Date |
Number of Shares or Units of Stock That Have Not Vested |
Market Value of Shares or Units of Stock That Have Not Vested ($)(4) |
||||||||||||||||||
| Jeffrey A. Quiram |
4,167 | — | 61.44 | 2/20/2018 | — | — | ||||||||||||||||||
| 3,061 | — | 61.44 | 2/20/2018 | — | — | |||||||||||||||||||
| 2,752 | — | 31.44 | 5/6/2020 | — | — | |||||||||||||||||||
| 8,811 | — | 18.96 | 1/25/2021 | — | — | |||||||||||||||||||
| 3,798 | — | 17.52 | 2/9/2022 | — | — | |||||||||||||||||||
| 9,280 | — | 2.52 | 3/7/2023 | — | — | |||||||||||||||||||
| 270,000 | — | 2.12 | 12/5/2023 | — | — | |||||||||||||||||||
| — | 200,000 | (2) | 0.22 | 11/9/2025 | ||||||||||||||||||||
| — | — | — | — | 132,244 | (3) | 27,771 | ||||||||||||||||||
| Robert L Johnson |
1,500 | — | 61.44 | 2/20/2018 | — | — | ||||||||||||||||||
| 1,716 | — | 61.44 | 2/20/2018 | — | — | |||||||||||||||||||
| 1,543 | — | 31.44 | 5/6/2020 | — | — | |||||||||||||||||||
| 4,934 | 18.96 | 1/25/2021 | — | — | ||||||||||||||||||||
| 2,129 | — | 17.52 | 2/9/2022 | — | — | |||||||||||||||||||
| 5,202 | — | 2.52 | 3/7/2023 | — | — | |||||||||||||||||||
| 150,000 | — | 2.12 | 12/5/2023 | — | — | |||||||||||||||||||
| — | 110,000 | (2) | 0.22 | 11/9/2025 | ||||||||||||||||||||
| — | — | — | — | 74,120 | (3) | 15,565 | ||||||||||||||||||
| Adam L. Shelton |
4,583 | — | 48.36 | 4/24/2016 | — | — | ||||||||||||||||||
| 2,000 | — | 61.44 | 2/20/2018 | — | — | |||||||||||||||||||
| 1,749 | — | 61.44 | 2/20/2018 | — | — | |||||||||||||||||||
| 1,573 | — | 31.44 | 5/6/2020 | — | — | |||||||||||||||||||
| 4,934 | — | 18.96 | 1/25/2021 | — | — | |||||||||||||||||||
| 2,170 | — | 17.52 | 2/9/2022 | — | — | |||||||||||||||||||
| 5,303 | — | 2.52 | 3/7/2023 | — | — | |||||||||||||||||||
| 150,000 | — | 2.12 | 12/5/2023 | — | — | |||||||||||||||||||
| — | 110,000 | (2) | 0.22 | 11/9/2025 | ||||||||||||||||||||
| — | — | — | — | 75,568 | (3) | 15,872 | ||||||||||||||||||
| (1) | These options are fully vested. |
| (2) | These shares will vest 50% on November 9, 2016 and the remaining 50% will vest on November 9, 2017. |
| (3) | These shares will vest on December 4, 2016. |
| (4) | The market value is calculated using the closing share price of our common stock of $0.21 on December 31, 2015. |
Non-employee Director Compensation
Summary of Compensation
Our directors who are also our employees do not receive additional compensation for their service on our Board. Our Board maintains a written compensation policy for our non-employee directors. Each director other
40
Table of Contents
than our Chairman of the Board receives an annual cash retainer of $20,000, and our Chairman of the Board receives an annual cash retainer of $40,000. The annual cash retainer is paid bi-annually and requires that the director attend at least 75% of our Board meetings. Each director receives a $5,000 annual retainer for service as a member of our three standing committees. In addition, on the date of each annual meeting of stockholders, each director other than our Chairman of the Board receives an equity grant of 10,000 shares of our common stock, and our Chairman of the Board receives a grant of 15,000 shares. In addition to the foregoing equity grants, new directors receive an initial grant of 25,000 shares of our common stock on the date that they join our Board. Initial equity grants vest in three equal installments, on each anniversary of the grant date, and annual grants vest in two equal installments, on each anniversary of the grant date. Our Board provides an additional $15,000 annual retainer (which is paid bi-annually) as compensation for service as chairman of our Audit Committee and an additional $10,000 annual retainer for service as chairman of each of our Compensation Committee and Nominating Committee.
Non-employee directors do not receive compensation from us other than as a director or as committee member. There are no family relationships among our directors and executive officers.
The following table summarizes the compensation paid to our non-employee directors for 2015:
| Name |
Fees earned or paid in cash ($) |
Stock Awards ($)(1) |
Option Awards ($)(1) |
Total ($) |
||||||||||||
| Martin A. Kaplan |
60,000 | — | 9,053 | 69,053 | ||||||||||||
| Lynn J. Davis |
40,000 | — | 6,035 | 46,035 | ||||||||||||
| Dan L. Halvorson |
45,000 | — | 6,035 | 51,035 | ||||||||||||
| (1) | The amounts in this column represent the aggregate grant date fair value of the shares of restricted common stock calculated in accordance with Accounting Standards Codification (“ASC”) 718, under the assumptions included in Note 5 to our audited financial statements for the year ended December 31, 2015 included in this Annual Report on Form 10-K. As of December 31, 2015: (i) Mr. Kaplan had 86,508 options to purchase common stock and 12,500 unvested shares of restricted common stock; (ii) Mr. Davis had 66,542 options to purchase common stock and 8,333 unvested shares of restricted common stock; (iii) Mr. Halvorson had 40,000 options to purchase common stock and 21,666 unvested shares of restricted common stock. |
41
Table of Contents
| ITEM 12. | SECURITIES OWNERSHIP OF CERTAIN BENEFICIAL OWNERS AND MANAGEMENT AND RELATED STOCKHOLDER MATTERS |
The following table sets forth the beneficial ownership of our common stock as of March 15, 2016 by (i) each person known by us to be the beneficial owner of more than 5% of our outstanding common stock, (ii) each of our directors, (iii) each of our executive officers named in the table under “Executive Compensation — Summary Compensation Table,” and (iv) all of our directors and executive officers as a group. Except as otherwise indicated in the footnotes to the table, (i) the persons and entities named in the table have sole voting and investment power with respect to all shares beneficially owned, subject to community property laws where applicable, and (ii) the address of each person is c/o Superconductor Technologies Inc., 9101 Wall Street, Suite 1300, Austin, Texas 78754.
| Name |
Number of Shares(1) | Percentage Ownership | ||||||
| Kopp Investment Advisors, LLC |
6,283,491 | (2) | 15.4 | |||||
| 7701 France Avenue South, #500 |
||||||||
| Edina, MN 55435 |
||||||||
| Sabby Management, LLC |
2,349,992 | (3) | 5.8 | |||||
| 10 Mountainview Rd Suite 205 |
||||||||
| Upper Saddle River, NJ 07458 |
||||||||
| Jeffrey A. Quiram |
559,791 | 1.4 | ||||||
| William J. Buchanan |
265,602 | * | ||||||
| Robert L. Johnson |
313,874 | * | ||||||
| Adam L. Shelton |
315,044 | * | ||||||
| Kenneth E. Pfeiffer |
282,117 | * | ||||||
| Lynn J. Davis |
42,303 | * | ||||||
| Martin A. Kaplan |
55,385 | * | ||||||
| Dan L. Halvorson |
35,000 | * | ||||||
| All executive officers and directors as a group (8 persons) |
1,869,116 | 4.5 | ||||||
| * | Less than 1%. |
| (1) | Includes shares issuable upon the exercise of stock options that are exercisable within 60 days of March 15, 2016 as follows: Mr. Quiram, 301,868 shares; Mr. Buchanan 145,850 shares; Mr. Johnson 167,021 shares; Mr. Shelton, 167,728 shares; Mr. Pfeiffer, 156,373 shares; Mr. Davis, 18,137 shares; Mr. Kaplan, 18,059 shares; Mr. Halvorson, 0 shares; and all executive officers and directors as a group, 975,036 shares. |
| (2) | Based solely on information reported in a Schedule 13D/A filed with the SEC on March 11, 2016 by Kopp Investment Advisors, LLC (“KIA”), Kopp Holding Company, LLC (“KHCLLC”), and LeRoy C. Kopp (“Mr. Kopp”). KIA, KHCLLC and Mr. Kopp are the beneficial owners of and have shared voting authority with respect to 6,283,491 shares. |
| (3) | Based solely on information reported in a Schedule 13G/A filed with the SEC on January 12, 2016, Sabby Management, LLC, Sabby Healthcare Master Fund, Ltd., Sabby Volatility Warrant Master Fund, Ltd., and Hal Mintz are the beneficial owners of and have shared voting authority with respect to 2,349,992 shares. |
| ITEM 13. | CERTAIN RELATIONSHIPS AND RELATED TRANSACTIONS, AND DIRECTOR INDEPENDENCE |
None.
| ITEM 14. | PRINCIPAL ACCOUNTING FEES AND SERVICES |
Our Audit Committee regularly reviews and determines whether specific non-audit projects or expenditures with our independent registered public accounting firm, Marcum LLP, potentially affects its independence. Our Audit Committee’s policy is to pre-approve all audit and permissible non-audit services provided by Marcum
42
Table of Contents
LLP. Pre-approval is generally provided by our Audit Committee for up to one year, as detailed as to the particular service or category of services to be rendered, and is generally subject to a specific budget. Our Audit Committee may also pre-approve additional services of specific engagements on a case-by-case basis.
The following table sets forth the aggregate fees billed to us by Marcum LLP for 2015 and 2014, all of which were pre-approved by our Audit Committee:
| Year Ended December 31, | ||||||||
| 2015 | 2014 | |||||||
| Audit fees(1) |
$ | 204,000 | $ | 190,350 | ||||
| All other fees(2) |
$ | 32,000 | $ | 10,000 | ||||
|
|
|
|
|
|||||
| Total |
$ | 236,000 | $ | 200,350 | ||||
|
|
|
|
|
|||||
| (1) | Includes fees for professional services rendered for the audit of our annual consolidated financial statements and review of our annual report on Form 10-K and for reviews of the condensed consolidated financial statements included in our quarterly reports on Form 10-Q for the first three quarters of 2015 and 2014. |
| (2) | These fees related to services rendered for our S-3 and S-1 registration statements. |
43
Table of Contents
| ITEM 15. | EXHIBITS AND FINANCIAL STATEMENT SCHEDULES |
(a) The following documents are filed as part of this Report:
1. Index to Financial Statements. Our consolidated financial statements and the Report of Marcum LLP, Independent Registered Public Accounting Firm are included in Part IV of this Report on the pages indicated:
2. Financial Statement Schedule Covered by the Foregoing Report of Independent Registered Public Accounting Firm.
| F-25 |
All other schedules are omitted because they are not applicable or the required information is shown in the financial statements or the notes thereto.
3. Exhibits
| Number |
Description of Document | |
| 3.1 | Restated Certificate of Incorporation of Registrant as amended through March 1, 2006.(13) | |
| 3.2 | Certificate of Amendment of Restated Certificate of Incorporation of Registrant, filed March 11, 2013.(21) | |
| 3.3 | Amended and Restated Bylaws of Registrant.(13) | |
| 3.4 | Amendment adopted March 29, 2010 to Amended and Restated Bylaws of Registrant.(14) | |
| 3.5 | Amendment adopted October 28, 2013 to Amended and Restated Bylaws of Registrant.(24) | |
| 4.1 | Form of Common Stock Certificate.(26) | |
| 4.2 | Form of Preferred Stock Certificate.(28) | |
| 4.3 | Certificate of Designation of Registrant of Series A Convertible Preferred Stock of Registrant, filed November 13, 2007.(12) | |
| 4.4 | Certificate of Designation of Registrant of Series B Convertible Preferred Stock of Registrant, filed October 9, 2015.(28) | |
| 4.5 | Form of Warrant to Purchase Common Stock issued by Registrant on February 22, 2012(15) | |
| 4.6 | Form of Warrant to Purchase Common Stock issued by Registrant on February 22, 2012(16) | |
| 4.7 | Form of Warrant to Purchase Common Stock issued by Registrant on November 26, 2012(19) | |
| 4.8 | Form of Warrant to Purchase Common Stock issued by Registrant on December 18, 2012(20) | |
| 4.9 | Form of Warrant to Purchase Common Stock issued by Registrant on April 26, 2013(22) | |
44
Table of Contents
| Number |
Description of Document | |
| 4.10 | Form of Warrant to Purchase Common Stock issued by Registrant on August 9, 2013(23) | |
| 4.11 | Form of Warrant to Purchase Common Stock issued by Registrant on March 25, 2015, pursuant to the Purchase Agreement.(27) | |
| 4.12 | Form of Warrant to Purchase Common Stock issued by Registrant on March 25, 2015, pursuant to the Engagement Agreement.(27) | |
| 4.13 | Form of Series A Common Stock Purchase Warrant issued by Registrant on October 14, 2015.(29) | |
| 4.14 | Form of Series B Common Stock Purchase Warrant issued by Registrant on October 14, 2015.(29) | |
| 4.15 | Form of Common Stock Purchase Warrant issued by Registrant on October 14, 2015.(29) | |
| 10.1 | Form of Change in Control Agreement dated March 28, 2003.(1)*** | |
| 10.2 | Form of Amendment No. 1 to Change in Control Agreement dated as of May 24, 2005.(7)*** | |
| 10.3 | Form of Amendment No. 2 to Change in Control Agreement dated as of December 31, 2006.(9)*** | |
| 10.4 | Patent License Agreement by and between Registrant and Lucent Technologies GRL LLC.(2)** | |
| 10.5 | License Agreement between Registrant and Sunpower, Inc. dated May 2, 2005.(3)** | |
| 10.6 | Employment Agreement between Registrant and Jeffrey Quiram dated as of February 14, 2005.(4)*** | |
| 10.7 | Amendment to Employment Agreement between Registrant and Jeffrey Quiram dated as of December 31, 2006.(9)*** | |
| 10.8 | 2003 Equity Incentive Plan As Amended May 25, 2005.(6)*** | |
| 10.9 | Form of Notice of Grant of Stock Options and Option Agreement for 2003 Equity Incentive Plan.(4)*** | |
| 10.10 | Management Incentive Plan (July 24, 2006).(8)*** | |
| 10.11 | Compensation Policy for Non-Employee Directors dated March 18, 2005.(5)*** | |
| 10.12 | Lease Agreement between the Registrant and Prologis Texas III LLC dated December 5, 2011.(17) | |
| 10.13 | First Amendment Lease Agreement between the Registrant and Prologis Texas III LLC dated August 23, 2012.(18) | |
| 10.14 | Second Amendment Lease Agreement between the Registrant and Prologis Texas III LLC dated July 18, 2014.(28) | |
| 10.15 | Agreement between Registrant and Hunchun BaoLi Communication Co., Ltd. (“BAOLI”) dated August 17, 2007.(10) | |
| 10.16 | First Amendment to Agreement between Registrant and BAOLI dated November 1, 2007(11) | |
| 10.17 | Second Amendment to Agreement between Registrant and BAOLI dated January 7, 2008.(11) | |
| 10.18 | Framework Agreement between Registrant and BAOLI dated November 8, 2007.(11) | |
| 10.19 | Sino-Foreign Equity Joint Venture Contract between Superconductor Investments (Mauritius) Limited and BAOLI dated December 8, 2007 (Exhibit A to Framework Agreement with BAOLI).(11) | |
| 10.20 | Form of Technology and Trademark License Agreement between Superconductor Investments (Mauritius) Limited, Registrant and BAOLI Superconductor Technology Co, Ltd (Exhibit B to Framework Agreement).(11) | |
45
Table of Contents
| Number |
Description of Document | |
| 10.21 | 2013 Equity Incentive Plan adopted October 25, 2013, and forms of Award Agreements.(25) | |
| 10.22 | Form of Indemnification Agreement for directors and officers.(28) | |
| 14 | Code of Business Conduct and Ethics.(7) | |
| 21 | List of Subsidiaries.(30) | |
| 23.1 | Consent of Marcum, LLP, Independent Registered Public Accounting Firm.(30) | |
| 31.1 | Statement of CEO Pursuant to 302 of the Sarbanes-Oxley Act of 2002.(30) | |
| 31.2 | Statement of CFO Pursuant to 302 of the Sarbanes-Oxley Act of 2002.(30) | |
| 32.1 | Statement of CEO Pursuant to 906 of the Sarbanes-Oxley Act of 2002.(30) | |
| 32.2 | Statement of CFO Pursuant to 906 of the Sarbanes-Oxley Act of 2002.(30) | |
| 101 | Financials provided in XBRL format | |
| *** | This exhibit is a management contract or compensatory plan or arrangement. |
| (1) | Incorporated by reference from Registrant’s Quarterly Report on Form 10-Q for the quarter ended March 30, 2002, filed May 6, 2002. |
| (2) | Incorporated by reference from Registrant’s Quarterly Report on Form 10-Q for the quarter ended March 29, 2003, filed May 13, 2003. |
| (3) | Incorporated by reference from Registrant’s Annual Report on Form 10-K for the year ended December 31, 2003, filed March 11, 2004. |
| (4) | Incorporated by reference from Registrant’s Quarterly Report on Form 10-Q for the quarter ended October 2, 2004, filed November 10, 2004. |
| (5) | Incorporated by reference from Registrant’s Annual Report on Form 10-K for the year ended December 31, 2004, filed March 16, 2005. |
| (6) | Incorporated by reference from Registrant’s Quarterly Report on Form 10-Q for the quarter ended April 2, 2005, filed May 6, 2005. |
| (7) | Incorporated by reference from Registrant’s Current Report on Form 8-K filed May 27, 2005. |
| (8) | Incorporated by reference from Registrant’s Annual Report on Form 10-K for the year ended December 31, 2005, filed March 8, 2006. |
| (9) | Incorporated by reference from Registrant’s Current Report on Form 8-K filed July 28, 2006. |
| (10) | Incorporated by reference from Registrant’s Annual Report on Form 10-K for the year ended December 31, 2006, filed April 2, 2007. |
| (11) | Incorporated by reference from Registrant’s Quarterly Report on Form 10-Q for the quarter ended September 29, 2007, filed November 13, 2007. |
| (12) | Incorporated by reference from Registrant’s Annual Report on Form 10-K for the year ended December 31, 2007, filed March 27, 2008. |
| (13) | Incorporated by reference from Registrant’s Current Report on Form 8-K/A filed February 25, 2008. |
| (14) | Incorporated by reference from Registrant’s Annual Report on Form 10-K for the year ended December 31, 2009, filed March 17, 2010. |
| (15) | Incorporated by reference from Registrant’s Current Report on Form 8-K filed April 2, 2010. |
| (16) | Incorporated by reference from Registrant’s Annual Report on Form 10-K for the year ended December 31, 2010, filed March 21, 2011. |
| (17) | Incorporated by reference from Registrant’s Current Report on Form 8-K filed February 22, 2012. |
| (18) | Incorporated by reference from Registrant’s Current Report on Form 8-K/A filed February 22, 2012. |
| (19) | Incorporated by reference from Registrant’s Annual Report on Form 10-K for the year ended December 31, 2011, filed March 30, 2012. |
| (20) | Incorporated by reference from Registrant’s Quarterly Report on Form 10-Q for the quarter ended September 29, 2012, filed November 9, 2012. |
46
Table of Contents
| (21) | Incorporated by reference from Registrant’s Current Report on Form 8-K filed November 27, 2012. |
| (22) | Incorporated by reference from Registrant’s Current Report on Form 8-K filed December 19, 2012. |
| (23) | Incorporated by reference from Registrant’s Current Report on Form 8-K filed March 14, 2013. |
| (24) | Incorporated by reference from Registrant’s Current Report on Form 8-K filed April 30, 2013. |
| (25) | Incorporated by reference as Exhibit 4.8/9 to Registrant’s Form S-1A filed August 2, 2013. |
| (26) | Incorporated by reference from Registrant’s Current Report on Form 8-K filed October 31, 2013. |
| (27) | Incorporated by reference as Exhibit A to Registrant’s Form DEF 14A filed October 31, 2013. |
| (28) | Incorporated by reference as Exhibit 4.1 to Registrant’s Form 10-K filed March 28, 2014. |
| (29) | Incorporated by reference from Registrant’s Current Report on Form 8-K filed February 17, 2015. |
| (30) | Filed herewith. |
(b) Exhibits. See Item 15(a) above.
47
Table of Contents
REPORT OF INDEPENDENT REGISTERED PUBLIC ACCOUNTING FIRM
To the Board of Directors and Stockholders of
Superconductor Technologies Inc.
We have audited the accompanying consolidated balance sheets of Superconductor Technologies Inc. (the “Company”) as of December 31, 2015 and 2014, and the related consolidated statements of operations, stockholders’ equity and cash flows for each of the three years in the period ended December 31, 2015. Our audits also included the consolidated financial statement schedule listed in the Index at Item 15(a)(2). These financial statements and schedule are the responsibility of the Company’s management. Our responsibility is to express an opinion on these financial statements and schedule based on our audits.
We conducted our audits in accordance with the standards of the Public Company Accounting Oversight Board (United States). Those standards require that we plan and perform the audits to obtain reasonable assurance about whether the financial statements are free of material misstatement. The Company is not required to have, nor were we engaged to perform, an audit of its internal control over financial reporting. Our audits included consideration of internal control over financial reporting as a basis for designing audit procedures that are appropriate in the circumstances, but not for the purpose of expressing an opinion on the effectiveness of the Company’s internal control over financial reporting. Accordingly, we express no such opinion. An audit also includes examining, on a test basis, evidence supporting the amounts and disclosures in the financial statements, assessing the accounting principles used and significant estimates made by management, as well as evaluating the overall financial statement presentation. We believe that our audits provide a reasonable basis for our opinion.
In our opinion, the financial statements referred to above present fairly, in all material respects, the consolidated financial position of Superconductor Technologies Inc. as of December 31, 2015 and 2014, and the consolidated results of their operations and their cash flows for each of the three years in the period ended December 31, 2015 in conformity with accounting principles generally accepted in the United States of America. Also, in our opinion, the related consolidated financial statement schedule, when considered in relation to the basic financial statements taken as a whole, presents fairly in all material respects the information set forth herein.
The accompanying consolidated financial statements have been prepared in conformity with accounting principles generally accepted in the United States of America, which contemplate continuation of the company as a going concern. As discussed in Note 2 to the financial statements, the Company has incurred significant net losses since its inception, has an accumulated deficit of $290,970,000 and working capital deficit as of December 31, 2015, and expects to incur substantial additional losses and costs to sustain operations. Further, the Company’s ability to realize its investment in its infrastructure is dependent on market acceptance and realization of significant revenues from its new products. The foregoing matters raise substantial doubt about the Company’s ability to continue as a going concern. Management’s plans in regard to these matters are also described in Note 2. These financial statements do not include any adjustments that might result from the outcome of this uncertainty.
/s/ Marcum LLP
Los Angeles, CA
March 30, 2016
F-1
Table of Contents
SUPERCONDUCTOR TECHNOLOGIES INC.
CONSOLIDATED BALANCE SHEETS
| December 31, 2015 |
December 31, 2014 |
|||||||
| ASSETS | ||||||||
| Current Assets: |
||||||||
| Cash and cash equivalents |
$ | 7,469,000 | $ | 1,238,000 | ||||
| Accounts receivable, net |
38,000 | 86,000 | ||||||
| Inventory, net |
121,000 | 74,000 | ||||||
| Prepaid expenses and other current assets |
122,000 | 358,000 | ||||||
|
|
|
|
|
|||||
| Total Current Assets |
7,750,000 | 1,756,000 | ||||||
| Property and equipment, net of accumulated depreciation of $7,290,000 and $4,908,000, respectively |
5,551,000 | 7,902,000 | ||||||
| Patents, licenses and purchased technology, net of accumulated amortization of $869,000 and $795,000, respectively |
938,000 | 886,000 | ||||||
| Other assets |
126,000 | 255,000 | ||||||
|
|
|
|
|
|||||
| Total Assets |
$ | 14,365,000 | $ | 10,799,000 | ||||
|
|
|
|
|
|||||
| LIABILITIES AND STOCKHOLDERS’ EQUITY | ||||||||
| Current Liabilities: |
||||||||
| Accounts payable |
$ | 432,000 | $ | 762,000 | ||||
| Accrued expenses |
418,000 | 455,000 | ||||||
| Current portion of derivative fair value—warrants |
— | 946,000 | ||||||
|
|
|
|
|
|||||
| Total Current Liabilities |
850,000 | 2,163,000 | ||||||
| Other long term liabilities |
393,000 | 4,634,000 | ||||||
|
|
|
|
|
|||||
| Total Liabilities |
1,243,000 | 6,797,000 | ||||||
|
|
|
|
|
|||||
| Commitments and contingencies (Notes 7 and 8) |
||||||||
| Stockholders’ Equity: |
||||||||
| Preferred stock, $.001 par value, 2,000,000 shares authorized, 330,873 and 328,925 issued and outstanding, respectively |
— | — | ||||||
| Common stock, $.001 par value, 250,000,000 shares authorized, 39,608,218 and 14,264,141 shares issued and outstanding, respectively |
39,000 | 14,000 | ||||||
| Capital in excess of par value |
304,053,000 | 286,356,000 | ||||||
| Accumulated deficit |
(290,970,000 | ) | (282,368,000 | ) | ||||
|
|
|
|
|
|||||
| Total Stockholders’ Equity |
13,122,000 | 4,002,000 | ||||||
|
|
|
|
|
|||||
| Total Liabilities and Stockholders’ Equity |
$ | 14,365,000 | $ | 10,799,000 | ||||
|
|
|
|
|
|||||
See accompanying notes to the consolidated financial statements.
F-2
Table of Contents
SUPERCONDUCTOR TECHNOLOGIES INC.
CONSOLIDATED STATEMENTS OF OPERATIONS
| Years Ended December 31 | ||||||||||||
| 2015 | 2014 | 2013 | ||||||||||
| Net revenues: |
||||||||||||
| Net commercial product revenues |
$ | 244,000 | $ | 632,000 | $ | 1,710,000 | ||||||
|
|
|
|
|
|
|
|||||||
| Total net revenues |
244,000 | 632,000 | 1,710,000 | |||||||||
|
|
|
|
|
|
|
|||||||
| Costs and expenses: |
||||||||||||
| Cost of commercial product revenues |
3,004,000 | 1,558,000 | 1,051,000 | |||||||||
| Research and development |
4,125,000 | 5,992,000 | 6,073,000 | |||||||||
| Selling, general and administrative |
5,838,000 | 5,389,000 | 5,068,000 | |||||||||
|
|
|
|
|
|
|
|||||||
| Total costs and expenses |
12,967,000 | 12,939,000 | 12,192,000 | |||||||||
|
|
|
|
|
|
|
|||||||
| Loss from operations |
(12,723,000 | ) | (12,307,000 | ) | (10,482,000 | ) | ||||||
| Other Income and Expense |
||||||||||||
| Gain (loss) from investment in Resonant LLC joint venture |
— | 3,142,000 | (238,000 | ) | ||||||||
| Adjustments to fair value of warrant derivatives |
4,852,000 | 480,000 | (1,551,000 | ) | ||||||||
| Adjustment to warrant exercise price |
(537,000 | ) | — | — | ||||||||
| Other income |
13,000 | 434,000 | 140,000 | |||||||||
| Other expense |
(207,000 | ) | — | (42,000 | ) | |||||||
|
|
|
|
|
|
|
|||||||
| Net loss |
$ | (8,602,000 | ) | $ | (8,251,000 | ) | $ | (12,173,000 | ) | |||
|
|
|
|
|
|
|
|||||||
| Basic and diluted net loss per common share |
$ | (0.44 | ) | $ | (0.64 | ) | $ | (1.71 | ) | |||
|
|
|
|
|
|
|
|||||||
| Basic and diluted weighted average number of common shares outstanding |
19,706,292 | 12,793,929 | 7,123,817 | |||||||||
|
|
|
|
|
|
|
|||||||
See accompanying notes to the consolidated financial statements.
F-3
Table of Contents
SUPERCONDUCTOR TECHNOLOGIES INC.
CONSOLIDATED STATEMENTS OF STOCKHOLDERS’ EQUITY
| Convertible Preferred Stock |
Common Stock | Capital in Excess of Par Value |
Accumulated Deficit |
Total | ||||||||||||||||||||||||
| Shares | Amount | Shares | Amount | |||||||||||||||||||||||||
| Balance at December 31, 2012 |
564,642 | 1,000 | 4,193,690 | 4,000 | 272,231,000 | (261,944,000 | ) | 10,292,000 | ||||||||||||||||||||
| Issuance of common stock (net of costs) |
7,189,503 | 7,000 | 8,688,000 | 8,695,000 | ||||||||||||||||||||||||
| Conversion of Series A preferred stock to common stock |
(235,717 | ) | (1,000 | ) | 196,422 | 1,000 | ||||||||||||||||||||||
| Cancellation of shares from reverse stock split |
(2,865 | ) | ||||||||||||||||||||||||||
| Stock—based compensation |
58,200 | 492,000 | 492,000 | |||||||||||||||||||||||||
| Net loss |
(12,173,000 | ) | (12,173,000 | ) | ||||||||||||||||||||||||
|
|
|
|
|
|
|
|
|
|
|
|
|
|
|
|||||||||||||||
| Balance at December 31, 2013 |
328,925 | — | 11,634,950 | 12,000 | 281,411,000 | (274,117,000 | ) | 7,306,000 | ||||||||||||||||||||
| Issuance of common stock (net of costs) from exercise of outstanding warrants |
1,589,471 | 2,000 | 4,083,000 | 4,085,000 | ||||||||||||||||||||||||
| Stock—based compensation |
1,039,620 | 862,000 | 862,000 | |||||||||||||||||||||||||
| Net loss |
(8,251,000 | ) | (8,251,000 | ) | ||||||||||||||||||||||||
|
|
|
|
|
|
|
|
|
|
|
|
|
|
|
|||||||||||||||
| Balance at December 31, 2014 |
328,925 | — | 14,264,041 | 14,000 | 286,356,000 | (282,368,000 | ) | 4,002,000 | ||||||||||||||||||||
| Issuance of common stock (net of costs) |
16,594,784 | 17,000 | 8,873,000 | 8,890,000 | ||||||||||||||||||||||||
| Issuance of Series B preferred stock |
4,750 | — | 4,305,000 | 4,305,000 | ||||||||||||||||||||||||
| Issuance of common stock (net of costs) from exercise of outstanding warrants |
916,858 | 1,000 | 1,686,000 | 1,687,000 | ||||||||||||||||||||||||
| Reclassification of warrant liability upon exercise |
669,000 | 669,000 | ||||||||||||||||||||||||||
| Conversion of Series B preferred stock to common stock |
(2,802 | ) | — | 8,006,429 | 8,000 | (8,000 | ) | 0 | ||||||||||||||||||||
| Repurchase of common shares to satisfy withholding obligations |
(133,894 | ) | (1,000 | ) | (26,000 | ) | (27,000 | ) | ||||||||||||||||||||
| Stock—based compensation |
(40,000 | ) | 2,198,000 | 2,198,000 | ||||||||||||||||||||||||
| Net loss |
(8,602,000 | ) | (8,602,000 | ) | ||||||||||||||||||||||||
|
|
|
|
|
|
|
|
|
|
|
|
|
|
|
|||||||||||||||
| Balance at December 31, 2015 |
330,873 | $ | — | 39,608,218 | $ | 39,000 | $ | 304,053,000 | $ | (290,970,000 | ) | $ | 13,122,000 | |||||||||||||||
|
|
|
|
|
|
|
|
|
|
|
|
|
|
|
|||||||||||||||
See accompanying notes to the consolidated financial statements.
F-4
Table of Contents
SUPERCONDUCTOR TECHNOLOGIES INC.
CONSOLIDATED STATEMENTS OF CASH FLOWS
| Years Ended December 31, | ||||||||||||
| 2015 | 2014 | 2013 | ||||||||||
| CASH FLOWS FROM OPERATING ACTIVITIES: |
||||||||||||
| Net loss |
$ | (8,602,000 | ) | $ | (8,251,000 | ) | $ | (12,173,000 | ) | |||
| Adjustments to reconcile net loss to net cash used in operating activities: |
||||||||||||
| Depreciation and amortization |
2,458,000 | 1,332,000 | 1,276,000 | |||||||||
| Stock-based compensation expense |
2,198,000 | 862,000 | 492,000 | |||||||||
| Provision for excess and obsolete inventories |
58,000 | — | — | |||||||||
| Write off of intangibles |
— | — | 93,000 | |||||||||
| Adjustments to fair value of warrant derivatives |
(4,852,000 | ) | (480,000 | ) | 1,551,000 | |||||||
| Adjustments to warrant exercise price |
537,000 | — | — | |||||||||
| (Gain) loss on disposal of property and equipment |
(1,000 | ) | (114,000 | ) | 239,000 | |||||||
| (Gain) loss from investment in Resonant LLC joint venture |
— | (3,142,000 | ) | 238,000 | ||||||||
| Changes in assets and liabilities: |
||||||||||||
| Accounts receivable |
45,000 | (80,000 | ) | 116,000 | ||||||||
| Inventory |
(105,000 | ) | 2,000 | (25,000 | ) | |||||||
| Prepaid expenses and other current assets |
236,000 | 79,000 | (122,000 | ) | ||||||||
| Patents and licenses |
(128,000 | ) | (70,000 | ) | (160,000 | ) | ||||||
| Other assets |
128,000 | 62,000 | (148,000 | ) | ||||||||
| Accounts payable, accrued expenses and other liabilities |
(456,000 | ) | (225,000 | ) | 324,000 | |||||||
|
|
|
|
|
|
|
|||||||
| Net cash used in operating activities |
(8,484,000 | ) | (10,025,000 | ) | (8,299,000 | ) | ||||||
|
|
|
|
|
|
|
|||||||
| CASH FLOWS FROM INVESTING ACTIVITIES: |
||||||||||||
| Net proceeds from sale of Resonant Shares |
— | 3,327,000 | — | |||||||||
| Purchase of property and equipment |
(141,000 | ) | (3,704,000 | ) | (818,000 | ) | ||||||
| Net proceeds from sale of property and equipment |
1,000 | 96,000 | 98,000 | |||||||||
|
|
|
|
|
|
|
|||||||
| Net cash used in investing activities |
(140,000 | ) | (281,000 | ) | (720,000 | ) | ||||||
|
|
|
|
|
|
|
|||||||
| CASH FLOWS FROM FINANCING ACTIVITIES: |
||||||||||||
| Repurchase of common shares for withholding obligations |
(27,000 | ) | — | — | ||||||||
| Net proceeds from sale of common stock |
13,195,000 | — | 12,844,000 | |||||||||
| Net proceeds from sale of warrants |
1,687,000 | 4,085,000 | — | |||||||||
|
|
|
|
|
|
|
|||||||
| Net cash provided by financing activities |
14,855,000 | 4,085,000 | 12,844,000 | |||||||||
|
|
|
|
|
|
|
|||||||
| Net increase (decrease) in cash and cash equivalents |
6,231,000 | (6,221,000 | ) | 3,825,000 | ||||||||
| Cash and cash equivalents at beginning of year |
1,238,000 | 7,459,000 | 3,634,000 | |||||||||
|
|
|
|
|
|
|
|||||||
| Cash and cash equivalents at end of year |
$ | 7,469,000 | $ | 1,238,000 | $ | 7,459,000 | ||||||
|
|
|
|
|
|
|
|||||||
See accompanying notes to the consolidated financial statements.
F-5
Table of Contents
SUPERCONDUCTOR TECHNOLOGIES INC.
NOTES TO CONSOLIDATED FINANCIAL STATEMENTS
Note 1—The Company
Superconductor Technologies Inc. (together with our subsidiaries, “we” or “us”) was incorporated in Delaware on May 11, 1987. We develop and produce high temperature superconducting (HTS) materials and associated technologies. We have generated more than 100 patents as well as proprietary trade secrets and manufacturing expertise. We are now leveraging our key enabling technologies in HTS materials and cryogenics, to pursue emerging opportunities in the electrical grid and in equipment platforms that utilize electrical circuits. In January 2012, we took possession of a facility in Austin, Texas and have moved our HTS wire processes and our research and development to Austin. We continue to maintain a presence in Santa Barbara, CA for certain business operations and our legacy wireless business.
Our initial superconducting products were completed in 1998, and we began delivery to a number of wireless network providers. In the following 13 years, our cost reducing efforts led to the invention of our proprietary, high-yield and high throughput HTS material deposition manufacturing process.
In the last several years we have focused our research and development efforts on adapting our successful HTS materials deposition techniques to the production of our HTS Conductus® wire for next generation power applications. While most of our current commercial product revenues come from the sale of high performance wireless communications infrastructure products, production of our Conductus wire is our principal opportunity to grow our future revenue.
Historically, we used research and development contracts as a source of funds for our commercial technology development. We are not currently involved as either a contractor or subcontractor on contracts with the U.S. government.
Note 2—Summary of Significant Accounting Policies
Basis of Presentation
We have incurred significant net losses since our inception and have an accumulated deficit of $291 million. In 2015, we incurred a net loss of $8.6 million and had negative cash flows from operations of $8.5 million. In 2014, we had an accumulated deficit of $282 million, a net loss of $8.3 million and negative cash flows from operations of $10 million. At December 31, 2015, we had $7.5 million in cash. Our cash resources will not be sufficient to fund our business for the next 12 months. We will need to grow our revenues from commercial operations and/or raise additional funds over the next 12-months to meet our working capital needs. Additional financing may not be available on acceptable terms or at all. If we issue additional equity securities to raise funds, the ownership percentage of our existing stockholders would be reduced. New investors may demand rights, preferences or privileges senior to those of existing holders of common stock. If we cannot raise any needed funds, we might be forced to make changes to, or delay aspects of, our business plan, which could adversely affect our ability to implement our current business plan and ultimately our viability as a company. These factors raise substantial doubt about our ability to continue as a going concern.
Our plans regarding improving our future liquidity will require us to successfully use our expertise and our technology to generate revenues in various ways, including commercial operations, joint ventures and licenses. We have invested and will continue to invest significant capital in our Austin, Texas manufacturing facility to enable us to produce our Conductus wire products. However, delays in the timing of our ability to, including but not limited to, raise additional capital, unexpected production delays, and our ability to sell our Conductus wire products in large scale could substantially impact our estimates used in the determination of expected future cash flows and/or expected future profitability. The accompanying consolidated financial statements do not include any adjustments that may result from the outcome of the uncertainties set forth above.
F-6
Table of Contents
In 2015, we undertook steps to reduce our ongoing operating costs through headcount reductions and other cost saving efforts and we raised net cash proceeds of $14.9 million from the sale of our common shares and warrants.
On March 11, 2013, we effected a 1-for-12 reverse stock split of our common stock, or the Reverse Stock Split. As a result of the Reverse Stock Split, every twelve shares of our pre-Reverse Stock Split common stock were combined and reclassified into one share of our common stock. The Reverse Stock Split did not change the authorized number of shares or the par value of our common stock. Certain of the information contained in the documents incorporated by reference herein and therein present information on our common stock on a pre-Reverse Split basis. Share and per share data included herein has been retroactively restated for the effect of the reverse stock split. In addition, we identified certain critical accounting policies which affect certain of our more significant estimates and assumptions used in preparing our consolidated financial statements in this Annual Report on Form 10-K for 2015. We have not made any material changes to these policies.
We have reviewed recently issued Financial Accounting Standards Board pronouncements and do not believe they will have a material impact on our consolidated financial statements as of and for the year ended December 31, 2015.
Recent Accounting Pronouncements
In May 2014, the FASB issued ASU No. 2014-09, “Revenue from Contracts with Customers (Topic 606).” The amendments to this update supersede nearly all existing revenue recognition guidance under GAAP. The standard was originally set to become effective in annual periods beginning after December 15, 2016 and for interim and annual reporting periods thereafter. In August 2015, the FASB issued ASU 2015-14 Revenue from Contracts with Customers; Deferral of the Effective Date, which defers the effective date of ASU 2014-09 for all entities by one year, thereby delaying the effective date of the standard to January 1, 2018, with an option that would permit companies to adopt the standard as early as the original effective date. Early adoption prior to the original effective date is not permitted. The core principle of this Topic is to recognize revenues when promised goods or services are transferred to customers in an amount that reflects the consideration that is expected to be received for those goods or services. This Topic defines a five-step process to achieve this core principle and, in doing so, it is possible more judgment and estimates may be required within the revenue recognition process than required under existing GAAP including identifying performance obligations in the contract, estimating the amount of variable consideration to include in the transaction price and allocating the transaction price to each separate performance obligation. We have not yet assessed the impact of ASU 2014-09.
In August 2014, the FASB issued ASU No. 2014-15, “Presentation of Financial Statements—Going Concern (Sub-Topic 205-40)”, which provides guidance in GAAP about management’s responsibility to evaluate whether there is substantial doubt about an entity’s ability to continue as a going concern and to provide related footnote disclosures. This update is effective for annual periods ending after December 15, 2016 and for annual periods and interim periods thereafter. We have early adopted this guidance.
In July 2015, the FASB issued ASU 2015-11, “Simplifying the Measurement of Inventory,” which provides new guidance regarding the measurement of inventory. The new guidance requires most inventory to be measured at the lower of cost or net realizable value. The standard defines net realizable value as estimated selling prices in the ordinary course of business, less reasonably predictable costs of completion, disposal and transportation. The standard applies to companies other than those that measure inventory using last-in, first-out (“LIFO”) or the retail inventory method. The standard will be effective for annual reporting periods beginning after December 15, 2016, including interim periods within those reporting periods. Early application is permitted. We have not yet evaluated the impact of the adoption of this accounting standard on our consolidated financial statements.
In February 2016, the FASB issued ASU No. 2016-02, “Leases,” which replaces the existing guidance in ASC 840, Leases. The new standard establishes a right-of-use (ROU) model that requires a lessee to record a
F-7
Table of Contents
ROU asset and a lease liability on the balance sheet for all leases with terms longer than 12 months. Leases will be classified as either finance or operating, with classification affecting the pattern of expense recognition in the income statement. The guidance is effective for fiscal years beginning after December 15, 2018, including interim periods within those fiscal years and requires retrospective application. We will adopt in Fiscal 2019 and are currently evaluating the impact of ASU 2016-02 to our consolidated financial statements.
Principles of Consolidation
The consolidated financial statements include the accounts of Superconductor Technologies Inc. and its wholly owned subsidiaries. All significant intercompany transactions have been eliminated from the consolidated financial statements.
Cash and Cash Equivalents
Cash and cash equivalents consist of highly liquid investments with original maturities of three months or less. Cash and cash equivalents are maintained with what management believes to be quality financial institutions and from time to time exceed FDIC limits. Historically, we have not experienced any losses due to such concentration of credit risk.
Accounts Receivable
We grant uncollateralized credit to our customers. We perform usual and customary credit evaluations of our customers before granting credit. Trade accounts receivable are recorded at the invoiced amount and do not bear interest. The allowance for doubtful accounts is our best estimate of the amount of probable credit losses in our existing accounts receivable. We determine the allowance based on historical write-off experience. Past due balances are reviewed for collectability. Account balances are charged off against the allowance when we deem it is probable the receivable will not be recovered. We do not have any off-balance-sheet credit exposure related to our customers.
Revenue Recognition
Commercial revenues are principally derived from the sale of our SuperLink, AmpLink and SuperPlex family of products and are recognized once all of the following conditions have been met: a) an authorized purchase order has been received in writing, b) the customer’s credit worthiness has been established, c) shipment of the product has occurred, d) title has transferred, and e) if stipulated by the contract, customer acceptance has occurred and all significant vendor obligations, if any, have been satisfied.
We currently have no contract revenues. Historically, contract revenues were principally generated under research and development contracts. Contract revenues were recognized utilizing the percentage-of-completion method measured by the relationship of costs incurred to total estimated contract costs. If the current contract estimate were to indicate a loss, utilizing the funded amount of the contract, a provision would be made for the total anticipated loss. Revenues from research related activities were derived primarily from contracts with agencies of the U.S. Government. Credit risk related to accounts receivable arising from such contracts was considered minimal. These contracts included cost-plus, fixed price and cost sharing arrangements and were generally short-term in nature.
All payments to us for work performed on contracts with agencies of the U.S. Government are subject to adjustment upon audit by the Defense Contract Audit Agency. Contract audits through 2006 are closed. Based on historical experience and review of current projects in process, we believe that any future audits will not have a significant effect on our consolidated financial position, results of operations or cash flows.
F-8
Table of Contents
Shipping and Handling Fees and Costs
Shipping and handling fees billed to customers are included in net commercial product revenues. Shipping and handling fees associated with freight are generally included in cost of commercial product revenues.
Warranties
We offer warranties generally ranging from one to five years, depending on the product and negotiated terms of purchase agreements with our customers. Such warranties require us to repair or replace defective product returned to us during such warranty period at no cost to the customer. Our estimate for warranty related costs is recorded at the time of sale based on our actual historical product return rates and expected repair costs. Such costs have been within our expectations.
Indemnities
In connection with the sales and manufacturing of our commercial products, we indemnify, without limit or term, our customers and contract manufacturers against all claims, suits, demands, damages, liabilities, expenses, judgments, settlements and penalties arising from actual or alleged infringement or misappropriation of any intellectual property relating to our products or other claims arising from our products. We cannot reasonably develop an estimate of the maximum potential amount of payments that might be made under our indemnities because of the uncertainty as to whether a claim might arise and how much it might total. Historically, we have not incurred any expenses related to these indemnities.
Research and Development Costs
Research and development costs are charged to expense as incurred and include salary, facility, depreciation and material expenses. Research and development costs are charged to research and development expense. Research and development costs incurred solely in connection with research and development contracts were charged to government and other contract expense.
Inventories
Inventories are stated at the lower of cost or market, with costs primarily determined using standard costs, which approximate actual costs utilizing the first-in, first-out method. We review inventory quantities on hand and on order and record, on a quarterly basis, a provision for excess and obsolete inventory and/or vendor cancellation charges related to purchase commitments. If the results of the review determine that a write-down is necessary, we recognize a loss in the period in which the loss is identified, whether or not the inventory is retained. Our inventory reserves establish a new cost basis for inventory and are not reversed until we sell or dispose of the related inventory. Such provisions are established based on historical usage, adjusted for known changes in demands for such products, or the estimated forecast of product demand and production requirements. Costs associated with idle capacity are charged to operations immediately.
Property and Equipment
Property and equipment are recorded at cost. Equipment is depreciated using the straight-line method over their estimated useful lives ranging from three to five years. Leasehold improvements and assets financed under capital leases are amortized over the shorter of their useful lives or the lease term. Furniture and fixtures are depreciated over seven years. Expenditures for additions and major improvements are capitalized. Expenditures for minor tooling, repairs and maintenance and minor improvements are charged to operations as incurred. When property or equipment is retired or otherwise disposed of, the related cost and accumulated depreciation are removed from the accounts. Gains or losses from retirements and disposals are generally recorded in other income or expense. In 2015 and 2014 there were disposals totaling $99,000 and $8 million, respectively, and gains of $1,000 and $96,000, respectively, from these disposals.
F-9
Table of Contents
Patents, Licenses and Purchased Technology
Patents and licenses are recorded at cost and are amortized using the straight-line method over the shorter of their estimated useful lives or approximately seventeen years.
Long-Lived Assets
The realizability of long-lived assets is evaluated periodically as events or circumstances indicate a possible inability to recover the carrying amount. Long-lived assets that will no longer be used in the business are written off in the period identified since they will no longer be used in operations and generate any positive cash flows for us. Periodically, long-lived assets that will continue to be used by us will need to be evaluated for recoverability. Such evaluation is based on various analyses, including cash flow and profitability projections. The analyses necessarily involve significant management judgment. Market acceptance and significant revenues from our new Conductus wire is a key assumption in realization of our investment in long-lived assets. In the event the projected undiscounted cash flows are less than net book value of the assets, the carrying value of the assets will be written down to their estimated fair value. We tested our long lived assets for recoverability in each of the last three years and did not believe there was any impairment; however, for the year ended December 31, 2013 we charged $93,000 of patents pending to operations.
In July 2012, we contributed 14 issued and pending patents regarding our innovative Reconfigurable Resonance™ (RcR) technology, limited use of our Santa Barbara facility, experienced executive leadership and technical expertise as our minority investment in Resonant LLC. As of June 2013, our interest in Resonant was 30%, and the net value of the assets contributed, estimated to approximate fair value was $185,000. We had accounted for this investment using the equity method and included it in Other assets for both periods. At June 2013 we exchanged our equity interest in Resonant LLC, a wholly owned subsidiary of Resonant Inc., for a $2.4 million subordinated convertible note receivable from the new Resonant Inc. No gain was recognized for the exchange of our net equity interest on the date of issuance for the note receivable due to uncertainties in connection with the collectability of this subordinated note receivable. Our note was subordinated to a third party lender and was only convertible in the event Resonant, Inc. conducted an initial public offering and certain other conditions were met. We determined that our net equity interest of $185,000 approximated the fair value of the note receivable at December 31, 2013.
At May 29, 2014, the note receivable was converted into 700,000 common shares of Resonant. These common shares represented 10.2% of Resonant’s outstanding shares (including over-allotment) and could not be traded without the consent of the underwriter of the initial public offering for a period of twelve months after the initial public offering date of May 29, 2014. In late September 2014 we entered into a private transaction to sell this minority interest to various buyers for gross proceeds to us of $3.6 million, and net proceeds to us of $3.3 million after offering expenses.
We have invested and will continue to invest significant capital in our Austin, Texas manufacturing facility to enable us to produce our Conductus wire products. Delays in the timing of our ability to, including but not limited to, raise additional capital, unexpected production delays, our ability to sell our Conductus wire products in large scale could substantially impact our estimates used in the determination of expected future cash flows and/or expected profitability, and our ability to realize our investment in these assets. The accompanying consolidated financial statements do not include any adjustments that may result from the outcome of these uncertainties.
Loss Contingencies
In the normal course of our business, we are subject to claims and litigation, including allegations of patent infringement. Liabilities relating to these claims are recorded when it is determined that a loss is probable and the amount of the loss can be reasonably estimated. Legal fees are recorded as services are provided. The costs of our defense in such matters are charged to operations as incurred. Insurance proceeds recoverable are recorded when deemed probable.
F-10
Table of Contents
Income Taxes
We recognize deferred tax liabilities and assets based on the differences between the consolidated financial statement carrying amounts and the tax bases of assets and liabilities, using enacted tax rates in effect in the years the differences are expected to reverse. Deferred income tax benefit (expense) results from the change in net deferred tax assets or deferred tax liabilities. A valuation allowance is recorded when it is more likely than not that some or all deferred tax assets will not be realized.
The guidance further clarifies the accounting for uncertainty in income taxes and sets a consistent framework to determine the appropriate level of tax reserve to maintain for uncertain tax positions. This interpretation uses a two-step approach wherein a tax benefit is recognized if a position is more-likely-than-not to be sustained. The amount of the benefit is then measured to be the highest tax benefit that is greater than 50% likely to be realized and sets out disclosure requirements to enhance transparency of our tax reserves.
Unrecognized tax positions, if ever recognized in the consolidated financial statements, are recorded in the consolidated statement of operations as part of the income tax provision. Our policy is to recognize interest and penalties accrued on uncertain tax positions, if any, as part of the income tax provision.
No liabilities for uncertain tax positions were recognized in the current year. No interest or penalties on uncertain tax positions have been charged to operations to date. We are not under examination by any taxing authorities. The California and federal statute of limitations for examination of us is open for 2011 and 2012, respectively, and subsequent filings.
Marketing Costs
All costs related to marketing and advertising our products are charged to operations as incurred or at the time the advertising takes place. Advertising costs were not material in each of the three years in the period ended December 31, 2015.
Net Loss Per Share
Basic and diluted net loss per share is computed by dividing net loss available to common stockholders by the weighted average number of common shares outstanding in each year. Net loss available to common stockholders is computed after deducting accumulated dividends on cumulative preferred stock, deemed dividends and accretion of redemption value on redeemable preferred stock for the period and beneficial conversion features on issuance of convertible preferred stock. Potential common shares are not included in the calculation of diluted loss per share because their effect is anti-dilutive.
Stock-based Compensation Expense
We have in effect several equity incentive plans under which stock options and awards have been granted to employees and non-employee members of the Board of Directors. We are required to estimate the fair value of share-based awards on the date of grant. The value of the award is principally recognized as expense ratably over the requisite service periods. We have estimated the fair value of stock options as of the date of grant using the Black-Scholes option pricing model. The Black-Scholes option pricing model considers, among other factors, the expected life of the award and the expected volatility of our stock price. We evaluate the assumptions used to value stock options on a quarterly basis. The fair values generated by the Black-Scholes model may not be indicative of the actual fair values of our equity awards, as they do not consider other factors important to those awards to employees, such as continued employment and periodic vesting.
F-11
Table of Contents
The following table presents details of total stock-based compensation expense that is included in each functional line item on our consolidated statements of operations:
| 2015 | 2014 | 2013 | ||||||||||
| Cost of revenue |
$ | 10,000 | $ | — | $ | 1,000 | ||||||
| Research and development |
332,000 | 204,000 | 169,000 | |||||||||
| Selling, general and administrative |
1,856,000 | 658,000 | 322,000 | |||||||||
|
|
|
|
|
|
|
|||||||
| $ | 2,198,000 | $ | 862,000 | $ | 492,000 | |||||||
|
|
|
|
|
|
|
|||||||
The impact to the consolidated statements of operations for 2015, 2014 and 2013 on basic and diluted earnings per share was $0.11, $0.07 and $0.07, respectively. No stock compensation cost was capitalized during the three year period ended December 31, 2015.
Use of Estimates
The preparation of consolidated financial statements in conformity with accounting principles generally accepted in the United States of America requires us to make estimates and assumptions that affect the reported amounts of assets and liabilities and disclosure of contingent assets and liabilities at the date of the consolidated financial statements and the reported amounts of revenues and expenses during the reporting periods. The significant estimates in the preparation of the consolidated financial statements relate to the assessment of the carrying amount of accounts receivable, inventory, fixed assets, intangibles, goodwill, estimated provisions for warranty costs, accruals for restructuring and lease abandonment costs, contract revenues, income taxes and disclosures related to the litigation. Actual results could differ from those estimates and such differences may be material to the consolidated financial statements.
Fair Value of Financial Instruments
We have estimated the fair value amounts of our financial instruments using the available market information and valuation methodologies considered appropriate. We determined the book value of our cash and cash equivalents, accounts receivable, and other current liabilities as of December 31, 2015 and December 31, 2014 approximate fair value.
The fair value of our warrant derivative liability was estimated using the Binomial Lattice option valuation model.
Fair value for financial reporting purposes is defined as the exchange price that would be received for an asset or paid to transfer a liability (an exit price) in the principal or most advantageous market for the asset or liability in an orderly transaction between market participants on the measurement date, ASC 820, “Fair Value Measurement and Disclosures”, also establishes a fair value hierarchy which requires an entity to maximize the use of observable inputs and minimize the use of unobservable inputs when measuring fair value. ASC 820 describes three levels of inputs that may be used to measure fair value:
Level 1 —quoted prices in active markets for identical assets or liabilities
Level 2 —quoted prices for similar assets and liabilities in active markets or inputs that are observable
Level 3 —inputs that are unobservable (for example cash flow modeling inputs based on assumptions)
The fair value of our warrant liabilities was determined based on level 3 inputs. These derivative liabilities are adjusted to reflect fair value at each period end, with any increase or decrease in the fair value being recorded in results of operations as Adjustment to Fair Value of Derivatives. See Note 5 – Stockholders Equity - Warrants.
F-12
Table of Contents
Comprehensive Income
We have no items of other comprehensive income in any period and consequently have not included a Statement of Comprehensive Income.
Segment Information
We have historically operated in a single business segment: the research, development, manufacture and marketing of high performance products used in cellular base stations. We derived net commercial product revenues primarily from the sales of our AmpLink and SuperPlex products which we sold directly to wireless network operators in the United States. Net revenues derived principally from government contracts are presented separately on the consolidated statements of operations for all periods presented. As discussed in this Report, we are adapting our unique HTS material deposition techniques to produce our energy efficient, cost-effective and high performance Conductus wire. We expect commercial level sales of our Conductus wire products later this year.
Certain Risks and Uncertainties
Our long-term prospects are dependent upon the successful commercialization and market acceptance of our Conductus wire products.
We currently sell most of our products directly to wireless network operators in the United States and our product sales have historically been concentrated in a small number of customers. In 2015, we had two customers that represented 70% and 10% of total net revenues and 40% of our accounts receivable. In 2014, these two customers represented 52% and 31% of total net revenues and 95% of our accounts receivable. The loss of or reduction in sales, or the inability to collect outstanding accounts receivable, from any of these customers could have a material adverse effect on our business, financial condition, results of operations and cash flows.
We currently rely on a limited number of suppliers for key components of our products. The loss of any of these suppliers could have material adverse effect on our business, financial condition, results of operations and cash flows.
In connection with the sales of our commercial products, we indemnify, without limit or term, our customers against all claims, suits, demands, damages, liabilities, expenses, judgments, settlements and penalties arising from actual or alleged infringement or misappropriation of any intellectual property relating to our products or other claims arising from our products. We cannot reasonably develop an estimate of the maximum potential amount of payments that might be made under our indemnities because of the uncertainty as to whether a claim might arise and how much it might total.
For more risks of our business, see Item 1A, “Risk Factors” in this Report and other filings with the Securities and Exchange Commission.
Note 3—Short Term Borrowings
None
Note 4—Income Taxes
We incurred a net loss in each year of operation since inception resulting in no current or deferred tax expense for 2015, 2014 or 2013.
F-13
Table of Contents
The benefit for income taxes differs from the amount obtained by applying the federal statutory income tax rate to loss before benefit for income taxes for 2015, 2014 and 2013 as follows:
| 2015 | 2014 | 2013 | ||||||||||
| Tax benefit computed at federal statutory rate |
34.0 | % | 34.0 | % | 34.0 | % | ||||||
| Increase (decrease) in taxes due to: |
||||||||||||
| Change in valuation allowance |
(30.0 | ) | (39.8 | ) | (39.8 | ) | ||||||
| Permanent differences (stock options, warrant fair value, other) |
(9.8 | ) | — | — | ||||||||
| State taxes, net of federal benefit |
5.8 | 5.8 | 5.8 | |||||||||
|
|
|
|
|
|
|
|||||||
| — | % | — | % | — | % | |||||||
|
|
|
|
|
|
|
|||||||
The significant components of deferred tax assets (liabilities) at December 31 are as follows:
| 2015 | 2014 | |||||||
| Loss carryforwards |
$ | 15,208,000 | $ | 11,490,000 | ||||
| Depreciation |
1,084,000 | 1,490,000 | ||||||
| Tax credits |
574,000 | 388,000 | ||||||
| Inventory |
308,000 | 292,000 | ||||||
| Other |
101,000 | 280,000 | ||||||
| Less: valuation allowance |
(17,275,000 | ) | (13,940,000 | ) | ||||
|
|
|
|
|
|||||
| $ | — | $ | — | |||||
|
|
|
|
|
|||||
As of December 31, 2015, we had net operating loss carryforwards for federal and state income tax purposes of approximately $334.7 million and $150.5 million, respectively, which expire in the years 2018 through 2035. Of these amounts, $77.5 million and $5.1 million, respectively, resulted from the acquisition of Conductus. Under the Internal Revenue Code change of control limitations, a maximum of $38.3 million and $37.7 million, respectively, will be available for reduction of taxable income. In addition, we had research and development and other tax credits for federal and state income tax purposes of approximately $384,000 and $288,000, respectively, which expire in the years 2031 through 2035.
Due to the uncertainty surrounding their realization, we have recorded a full valuation allowance against our net deferred tax assets. Accordingly, no deferred tax asset has been recorded in the accompanying balance sheets. The valuation allowance increased by $3,335,000 and $4,391,500 in 2015 and 2014, respectively.
Section 382 of the Internal Revenue Code imposes an annual limitation on the utilization of net operating loss carryforwards based on a statutory rate of return (usually the “applicable federal funds rate,” as defined in the Internal Revenue Code) and the value of the corporation at the time of a “change of ownership” as defined by Section 382. We had changes in ownership in August 1999, December 2002, June 2009, and August 2013. In addition, we acquired the right to Conductus’ net operating losses, which are also subject to the limitations imposed by Section 382. Conductus underwent five ownership changes, which occurred in February 1999, February 2001, December 2002, June 2009, and August 2013. Therefore, the ability to utilize Conductus’ and our net operating loss carryforwards of $77.5 million and $232 million, respectively, which were incurred prior to the 2013 ownership changes, will be subject in future periods to annual limitations of $655,000. Net operating losses incurred by us subsequent to the ownership changes totaled $27.1 million and are not subject to this limitation. An additional $655,000 in losses was released from limitation during the year under Section 382.
Note 5—Stockholders’ Equity
Preferred Stock
Pursuant to our Certificate of Incorporation, the Board of Directors is authorized to issue up to 2,000,000 shares of preferred stock (par value $.001 per share) in one or more series and to fix the rights, preferences,
F-14
Table of Contents
privileges, and restrictions, including the dividend rights, conversion rights, voting rights, redemption price or prices, liquidation preferences, and the number of shares constituting any series or the designation of such series.
In February 2008, we issued to Hunchun BaoLi Communication Co. Ltd. (“BAOLI”) and two related purchasers a total of (a) 3,101,361 shares of our common stock and (b) 611,523 shares of our Series A Preferred Stock (convertible into 6,115,230 shares of our common stock) in exchange for net proceeds of $14.9 million in cash after offering costs of $89,000, of which $4.0 million was received in 2007. Subject to the terms and conditions of our Series A Preferred Stock and to customary adjustments to the conversion rate, each share of our Series A Preferred Stock is convertible into ten shares of our common stock so long as the number of shares of our common stock beneficially owned by BAOLI and affiliates following such conversion does not exceed 9.9% of our outstanding common stock. In 2013, 235,717 of these preferred shares were converted into 196,422 shares of our common stock. There was no conversion of these preferred shares into common stock in 2015 or 2014. At December 31, 2015, the 328,925 preferred shares issued and outstanding could be converted into 274,104 shares of common stock. Except for a preference on liquidation of $.01 per share, each share of Series A Preferred Stock is the economic equivalent of the ten shares of common stock into which it is convertible. There is no beneficial conversion feature related to the conversion of the preferred shares, as the value of the common shares into which the preferred shares convert does not exceed the recorded amount of the preferred shares at the date of issuance. Except as required by law, the Series A Preferred Stock does not have any voting rights.
October 2015 Public Offering
In October 2015, in a registered direct offering, we sold 13,531,994 Class A Units (consisting of one share of our common stock, a six-month Series A warrant to purchase one share of our common stock at an exercise price equal to $0.35 (“Series A warrant”), and a five-year Series B warrant to purchase 0.75 of a share of our common stock at an exercise price equal to $0.40 per share (“Series B warrant”)). The shares of common stock, Series A warrants and Series B warrants which are part of a Class A Unit were immediately separable and were issued separately in this offering.
We also sold to purchasers, whose purchase of Class A Units in this offering would otherwise result in the purchaser, together with its affiliates and certain related parties, beneficially owning more than 4.99% of our outstanding common stock immediately following the consummation of this offering, 4,750.0005 Class B Units. Each Class B Unit consisted of one share of our Class B Convertible Preferred Stock, or the Series B Preferred, with a stated value of $1,000 and convertible into 13,571,430 shares of our common stock at $0.35 per share, the public offering price of the Class A Units, together with the equivalent number of Series A warrants and Series B warrants as would have been issued to such purchaser if they had purchased Class A Units based on the public offering price. The Series B Preferred do not generally have any voting rights but are convertible into shares of common stock. The shares of Series B Preferred, Series A warrants and Series B warrants part of a Class B Unit were immediately separable and were issued separately in this offering.
At the closing of the October 2015 offering, we raised aggregate net proceeds of $8.6 million.
As of December 31, 2015, 2,802 of the 4,750.0005 Series B Preferred shares had been converted to 8,006,429 shares of our common stock and 1,948.0005 Series B preferred (convertible into 5,565,001 common shares) remained issued and outstanding.
Common Stock
On October 14, 2015 we completed a registered direct offering including shares of our common stock (see “—Preferred Stock—October 2015 Public Offering).
On March 25, 2015, in a registered direct offering, we sold 3,062,790 shares of our common stock, and 1,531,395 warrants to purchase additional shares over the next 5.5 years, at a price of $1.6325 per share, providing us with aggregate net proceeds of $4.6 million.
F-15
Table of Contents
On February 14, 2015, we entered into warrant exercise agreements with certain holders of our outstanding warrants to purchase an aggregate of 916,858 shares of our common stock. The warrants were originally issued as part of an underwritten public offering that we closed on August 9, 2013. Pursuant to the terms of the agreements, the exercise price of the warrants being exercised was adjusted, immediately prior to their exercise, to $2.00 per share down from the previously agreed $2.57, providing us with aggregate net proceeds from such exercises of $1.7 million.
At various times during 2014, a total of 1,589,471 of the below mentioned warrants were exercised at $2.57 each, providing us with net proceeds of $4.1 million.
On August 9, 2013, we consummated an underwritten public offering (Registration No. 333-189006) of units of our common stock and warrants for gross proceeds of $12 million, and net proceeds to us of approximately $10.9 million after deducting underwriting discounts and commissions and offering expenses. In the offering, a total of 5,721,675 shares of common stock were issued, plus an additional 954,001 shares subject to pre-funded warrants with an exercise price of $0.01 per pre-funded warrant. In addition, a total of 6,675,676 five year warrants and 3,337,838 two year warrants were issued, each with an exercise price of $2.57. The units consisted of either (at the option of the investors): (i) one share of common stock, one five year warrant and one two year warrant sold at a price to the public of $1.799, or (ii) (for those investors whose acquisition of our common stock through purchase of new units would cause them to own more than 9.9% of our outstanding common stock), a unit which consisted of one pre-funded warrant (in lieu of the share of common stock), one five year warrant and one two year warrant. Because the pre-funded warrants had an exercise price of $0.01 per share, the price for a unit having a pre-funded warrant was one penny less, or $1.789 per unit. At September 28, 2013 all of the pre-funded warrants had been exercised. Additionally, the underwriter of this offering received 117,670 warrants, each with an exercise price of $2.25, and exercisable for a period of three years commencing August 5, 2013. These warrants to our underwriter may not be exercised for a period of 180 days following August 5, 2013.
In a registered direct offering completed April 26, 2013 we raised proceeds of $1.95 million, net of offering costs of $236,000, from the sale of 513,827 shares of common stock and an equal number of warrants.
Equity Awards
At December 31, 2015, we had two equity award option plans, the 2003 Equity Incentive Plan and the 2013 Equity Incentive Plan (collectively, the “Stock Option Plans”) although we can only grant new options under the 2013 Equity Incentive Plan. Under the Stock Option Plans, stock awards may be made to our directors, key employees, consultants, and non-employee directors and may consist of stock options, stock appreciation rights, restricted stock awards, performance awards, and performance share awards. Stock options must be granted at prices no less than the market value on the date of grant.
There were no stock option exercises in the last three years.
We granted stock options in each of the last three years. The weighted average fair value of options has been estimated at the date of the grant using the Black-Scholes option-pricing model. The following are the significant weighted average assumptions used for estimating the fair value under our stock option plans:
| 2015 | 2014 | 2013 | ||||||||||
| Per share fair value at grant date |
$ | 0.15 | $ | 1.97 | $ | 1.46 | ||||||
| Risk free interest rate |
1.4 | % | 1.1 | % | 1.04 | % | ||||||
| Expected volatility |
98.8 | % | 100.2 | % | 99.4 | % | ||||||
| Dividend yield |
0 | % | 0 | % | 0 | % | ||||||
| Expected life in years |
4.0 | 4.0 | 4.0 | |||||||||
F-16
Table of Contents
The expected life was based on the contractual term of the options and the expected employee exercise behavior. Typically, options to our employees and Board Members have a 2 year vesting term and a 10 year contractual term and vest at 50% after one year and 50% after two years. The risk-free interest rate is based on the U. S. Treasury zero-coupon issues with a remaining term equal to the expected option life assumed at the grant date. The future volatility is based on our 4 year historical volatility. We used an expected dividend yield of 0% because we have never paid a dividend and do not anticipate paying dividends. We assumed aggregate forfeiture rates of 10% to 20% based on historical stock option cancellation rates over the last 4 years.
At December 31, 2015, 1,442,880 shares of common stock were available for future grants and options covering 1,973,606 shares were outstanding but not yet exercised. Option activity during the three years ended December 31, 2015 was as follows:
| Number of Shares |
Weighted Average Exercise Price |
|||||||
| Outstanding at December 31, 2012 |
105,383 | $ | 46.08 | |||||
| Granted |
1,053,333 | 2.13 | ||||||
| Canceled |
(6,642 | ) | 100.84 | |||||
| Exercised |
— | — | ||||||
|
|
|
|
|
|||||
| Outstanding at December 31, 2013 |
1,152,074 | 5.58 | ||||||
| Granted |
50,000 | 2.85 | ||||||
| Canceled |
(1,126 | ) | 158.13 | |||||
| Exercised |
— | — | ||||||
|
|
|
|
|
|||||
| Outstanding at December 31, 2014 |
1,200,948 | 5.32 | ||||||
| Granted |
870,000 | 0.22 | ||||||
| Canceled |
(97,342 | ) | 16.22 | |||||
| Exercised |
— | — | ||||||
|
|
|
|
|
|||||
| Outstanding at December 31, 2015 |
1,973,606 | $ | 2.54 | |||||
|
|
|
|
|
|||||
The following table summarizes information concerning currently outstanding and exercisable stock options at December 31, 2015:
| Exercisable | ||||||||||||||||||||||
| Range of Exercise Prices |
Number Outstanding |
Weighted Average Remaining Contractual Life in Years |
Weighted Average Exercise Price |
Number Exercisable |
Weighted Average Exercise Price |
|||||||||||||||||
| $0.22 - $0.22 | 870,000 | 9.9 | $ | 0.22 | — | $ | — | |||||||||||||||
| 2.12 - 2.12 | 947,500 | 7.9 | 2.12 | 947,500 | 2.12 | |||||||||||||||||
| 2.52 - 2.85 | 81,073 | 7.8 | 2.72 | 47,741 | 2.64 | |||||||||||||||||
| 8.14 - 18.96 | 35,816 | 5.4 | 17.93 | 35,816 | 17.93 | |||||||||||||||||
| $19.32 - $62.40 | 39,217 | 2.4 | 49.52 | 39,217 | 49.52 | |||||||||||||||||
|
|
|
|
|
|
|
|
|
|
|
|||||||||||||
| 1,973,606 | 8.6 | $ | 2.54 | 1,070,274 | $ | 4.41 | ||||||||||||||||
|
|
|
|
|
|||||||||||||||||||
Our outstanding options expire on various dates through November 2025. The weighted-average contractual term of outstanding options was 8.6 years and the weighted-average contractual term of currently exercisable stock options was 7.6 years. There were no exercisable options at December 31, 2015 with a price less than the then market value. At December 31, 2014, outstanding options covering 1,053,334 shares, with an intrinsic value of $672,000, had an exercise price less than the current market value and 526,667 of these options were exercisable, with an intrinsic value of $336,000. There were no exercisable options at December 31, 2013 with a price less than the then market value.
F-17
Table of Contents
The grant date fair value of each share of our restricted stock awards is equal to the fair value of our common stock at the grant date. Shares of restricted stock under awards all have service conditions and vest over one to four years. Some of our grants also have performance conditions. The following is a summary of our restricted stock award transactions for the year ended December 31, 2015:
| Number of Shares |
Weighted Average Grant Date Fair Value |
|||||||
| Balance nonvested at December 31, 2014 |
1,057,535 | $ | 2.80 | |||||
| Granted |
15,000 | 1.08 | ||||||
| Vested |
(505,226 | ) | 2.81 | |||||
| Forfeited |
(55,000 | ) | 2.81 | |||||
|
|
|
|
|
|||||
| Balance nonvested at December 31, 2015 |
512,309 | $ | 2.77 | |||||
|
|
|
|
|
|||||
The weighted-average grant date fair value of our restricted stock awards, their total fair value and the fair value of all shares that have vested during each of the past three years is as follows:
| Year ended December 31 | ||||||||||||
| 2015 | 2014 | 2013 | ||||||||||
| Weighted-average grant date fair value |
$ | 1.08 | $ | 2.81 | $ | 2.30 | ||||||
| Fair value of restricted stock awards granted |
$ | 16,000 | $ | 2,990,000 | $ | 148,000 | ||||||
| Fair value of restricted stock awards vested |
$ | 1,420,000 | $ | 143,000 | $ | 535,000 | ||||||
For the majority of restricted stock awards granted, the number of shares issued on the date the restricted stock awards vest may be net of the minimum statutory withholding requirements that we pay in cash to the appropriate taxing authorities on behalf of our employees. For the year ended December 31, 2015 we withheld 133,894 shares to satisfy $26,000 of employees’ tax obligations. There was no such withholding for the years ended December 31, 2014 or December 31, 2013.
No stock compensation cost was capitalized during the periods. At December 31, 2015, the total compensation cost related to non-vested option awards not yet recognized was $738,000 and the weighted-average period over which the cost is expected to be recognized is 1.2 years. The total compensation cost related to non-vested stock awards not yet recognized was $0.6 million, and the weighted-average period over which the cost is expected to be recognized is 0.6 years.
Warrants
The following is a summary of outstanding warrants at December 31, 2015:
| Common Shares | ||||||||||||||||||
| Total | Currently Exercisable |
Price per Share |
Expiration Date | |||||||||||||||
| (1) |
Warrants related to February 2012 financing |
419,451 | 419,451 | $ | 16.20 | February 22, 2017 | ||||||||||||
| (2) |
Warrants related to November 2012 financing |
8,333 | 8,333 | 4.50 | November 26, 2016 | |||||||||||||
| (3) |
Warrants related to December 2012 financing |
15,625 | 15,625 | 4.50 | December 18, 2016 | |||||||||||||
| (4) |
Warrants related to April 2013 financing |
256,913 | 256913 | 5.45 | April 26, 2019 | |||||||||||||
| (5) |
Warrants related to August 2013 financing |
117,670 | 117,670 | 2.25 | August 5, 2016 | |||||||||||||
| (6) |
Warrants related to August 2013 financing |
6,117,383 | 6,117,383 | 0.35 | August 9, 2018 | |||||||||||||
| (7) |
Warrants related to February 2015 agreement |
45,843 | 45,843 | 3.00 | February 13, 2020 | |||||||||||||
| (8) |
Warrants related to March 2015 financing |
1,531,395 | 1,531,395 | 1.63 | September 24, 2020 | |||||||||||||
| (9) |
Warrants related to March 2015 financing |
153,140 | 0 | 2.04 | March 20, 2020 | |||||||||||||
| (10) |
Warrants related to October 2015 financing |
27,103,424 | 27,103,424 | 0.35 | April 14, 2016 | |||||||||||||
| (11) |
Warrants related to October 2015 financing |
20,327,567 | 20,327,567 | 0.40 | October 14, 2020 | |||||||||||||
| (12) |
Warrants related to October 2015 financing |
1,355,171 | 0 | 0.4375 | October 14, 2020 | |||||||||||||
F-18
Table of Contents
On October 14, 2015, in a registered direct offering, we sold 13,531,994 Class A Units (consisting of one share of our common stock, a six-month Series A warrant to purchase one share of our common stock at an exercise price equal to $0.35, (“Series A warrant”), and a five-year Series B warrant to purchase 0.75 of a share of our common stock at an exercise price equal to $0.40 per share, (“Series B warrant”)). We also sold to purchasers, whose purchase of Class A Units in this offering would otherwise result in the purchaser, together with its affiliates and certain related parties, beneficially owning more than 4.99% of our outstanding common stock immediately following the consummation of this offering, 4,750.0005 Class B Units. Each Class B Unit consisted of one share of our Class B Convertible Preferred Stock, or the Series B Preferred, with a stated value of $1,000 and convertible into shares of our common stock at $0.35 per share, the public offering price of the Class A Units, together with the equivalent number of Series A warrants and Series B warrants as would have been issued to such purchaser if they had purchased Class A Units based on the public offering price. As a result, Series A warrants to purchase 27,103,424 shares of our common stock and Series B warrants to purchase 20,327,567 shares of our common stock were issued with the sale of these Class A and Class B Units. In addition, we granted the placement agent 1,355,171 five-year warrants to purchase our common shares at $0.4375. The shares of common stock, Series B Preferred, Series A warrants and Series B warrants were immediately separable and were issued separately in this offering.
On March 25, 2015, in a registered direct offering, we sold 3,062,790 shares of our common stock, and 1,531,395 warrants to purchase additional shares over the next 5.5 years, at a price of $1.6325 per share. The sale of these shares reset the exercise price of warrants (6) to $1.6325. The placement agent received 153,140 five-year warrants at an exercise price of $2.0406.
On February 14, 2015, we entered into Warrant Exercise Agreements with certain holders of our outstanding warrants to purchase an aggregate of 916,858 shares of our common stock. The warrants were originally issued as part of an underwritten public offering that we closed on August 9, 2013. Pursuant to the terms of the Warrant Exercise Agreements, the exercise price of the warrants being exercised was adjusted, immediately prior to their exercise, to $2.00 per share down from the previously agreed $2.57. In connection with the adjustment to the warrant exercise price, we charged to expense $0.4 million under the following fair value assumptions: expected life of six months; risk free interest rates of 0.07%; expected volatility of 33.6% and; dividend yield of 0%. In connection with the warrants exercised, we reclassified $669,000 relating to the fair value of the warrant derivative liability to capital in excess of par. Additionally, the underwriter received a five-year warrant to purchase 45,843 shares at a per share exercise price of $3.003.
Warrants (1)-(5) and (7)-(12) are exercisable by paying cash or, solely in the absence of an effective registration statement or prospectus, by cashless exercise for unregistered shares of common stock. The exercise price of the warrants is subject to standard antidilutive provision adjustment in the case of stock dividends or other distributions on shares of common stock or any other equity or equity equivalent securities payable in shares of common stock, stock splits, stock combinations, reclassifications or similar events affecting our common stock, and also, subject to limitations, upon any distribution of assets, including cash, stock or other property to our stockholders. The exercise price of the warrants is not subject to “price-based” anti-dilution adjustment. We have determined that these warrants related to issuance of common stock are subject to equity treatment because the warrant holder has no right to demand cash settlement and there are no unusual anti-dilution rights.
We have determined that warrants (6) are not considered indexed to our common shares under ASC 815-40, and require separate accounting as derivative instruments with changes in fair value recognized in earnings each period. The warrants contain a provision whereby the warrant exercise price would be decreased in the event that future common stock issuances are made at a price less than the then exercise price. Due to the potential variability of their exercise price, these warrants do not qualify for equity treatment, and therefore are recognized as a liability. The warrant liability is adjusted to fair value each reporting period, and any change in value is recognized in the statement of operations. Their initial August 9, 2013 valuation was determined using the binomial lattice valuation model, including an equal probabilities tree and early exercise factor of 30%, the significant weighted average assumptions for estimating the fair value of these warrants were, respectively, as
F-19
Table of Contents
follows: expected life of five years and two years (these two year warrants expired on August 9, 2015 and are no longer listed in the table of outstanding warrants above); risk free interest rates of 1.36% and 0.32%; expected volatility of 111% and 116% and; dividend yield of 0% and 0%. The initial fair value at August 9, 2013 was estimated to be approximately $4.2 million.
Using the binomial lattice valuation model, including an equal probabilities tree and early exercise factor of 30%, the fair value of these warrant liabilities at December 31, 2013 and December 31, 2014 were, respectively, were $5.7 million and $5.2 million.
Using the binomial lattice valuation model, including an equal probabilities tree and early exercise factor of 30%, the significant weighted average assumptions for estimating the fair value of these warrant liabilities at December 31, 2015 as follows: expected life of 2.6; risk free interest rates of 1.24%; expected volatility of 88% and; dividend yield of 0%. The December 31, 2015 fair value of these warrants was estimated to be $245,000. These warrants were also subject to a price adjustment as the result of our October 14, 2015, which increased their value by $170,000 in the quarter ended December 31, 2015. The fair value of these warrants was reduced by $966,000 during the quarter ended December 31, 2015 and the fair value was reduced by $4.8 million from December 31, 2014 to December 31, 2015 principally due to our reduced market stock price and expiration of unvested warrants.
Note 6—Employee Savings Plan
In December 1989, the Board of Directors approved a 401(k) savings plan (the “401(k) Plan”) for our employees that became effective in 1990. Eligible employees may elect to make contributions under the terms of the 401(k) Plan; however, contributions by us are made at the discretion of management. We made a contribution of $85,000 to the 401(k) plan in 2015, and $104,000 and $96,000 in 2014 and 2013, respectively.
Note 7—Commitments and Contingencies
Operating Leases
We lease our offices and production facilities under non-cancelable operating leases in Santa Barbara, CA and Austin, TX that expire in November 2016 and March 2017, respectively. The leases contain minimum rent escalation clauses that require additional rental amounts after the first year. Rent expense for these leases with minimum annual rent escalation is recognized on a straight-line basis over the minimum lease term. These leases also require us to pay utilities, insurance, taxes and other operating expenses and contain one five-year renewal option.
For 2015, 2014 and 2013, rent expense was $514,000, $815,000, and $868,000, respectively.
Patents and Licenses
We have entered into various licensing agreements requiring royalty payments ranging from 0.13% to 2.5% of specified product sales. Certain of these agreements contain provisions for the payment of guaranteed or minimum royalty amounts. In the event that we fail to pay any minimum annual royalties, these licenses may automatically be terminated. These royalty obligations terminate in 2016 to 2020. Royalty expenses totaled $45,000 in 2015, $30,000 in 2014 and $25,000 in 2013. Under the terms of certain royalty agreements, royalty payments made may be subject to audit. There have been no audits to date and we do not expect any possible future audit adjustments to be significant.
F-20
Table of Contents
The minimum lease payments under operating leases and license obligations are as follows:
| Years Ended December 31, |
Licenses | Operating Leases |
||||||
| 2016 |
$ | 45,000 | $ | 1,374,000 | ||||
| 2017 |
45,000 | 292,000 | ||||||
| 2018 |
45,000 | 41,000 | ||||||
| 2019 |
— | 27,000 | ||||||
| 2020 |
— | — | ||||||
| Thereafter |
— | — | ||||||
|
|
|
|
|
|||||
| Total payments |
$ | 135,000 | $ | 1,734,000 | ||||
|
|
|
|
|
|||||
Note 8—Contractual Guarantees and Indemnities
During our normal course of business, we make certain contractual guarantees and indemnities pursuant to which we may be required to make future payments under specific circumstances. We have disclosed the contractual guarantees and indemnities in the accompanying consolidated financial statements as follows:
Warranties
We establish reserves for future product warranty costs that are expected to be incurred pursuant to specific warranty provisions with our customers. Our warranty reserves are established at the time of sale and updated throughout the warranty period based upon numerous factors including historical warranty return rates and expenses over various warranty periods.
Intellectual Property Indemnities
We indemnify certain customers and our contract manufacturers against liability arising from third-party claims of intellectual property rights infringement related to our products. These indemnities appear in development and supply agreements with our customers as well as manufacturing service agreements with our contract manufacturers, are not limited in amount or duration and generally survive the expiration of the contract. Given that the amount of any potential liabilities related to such indemnities cannot be determined until an infringement claim has been made, we are unable to determine the maximum amount of losses that we could incur related to such indemnifications.
Director and Officer Indemnities and Contractual Guarantees
We have entered into indemnification agreements with our directors and executive officers, which require us to indemnify such individuals to the fullest extent permitted by Delaware law. Our indemnification obligations under such agreements are not limited in amount or duration. Certain costs incurred in connection with such indemnifications may be recovered under certain circumstances under various insurance policies. Given that the amount of any potential liabilities related to such indemnities cannot be determined until a lawsuit has been filed against a director or executive officer, we are unable to determine the maximum amount of losses that we could incur relating to such indemnities. Historically, any amounts payable pursuant to such director and officer indemnities have not had a material negative effect on our business, financial condition or results of operations.
We have also entered into severance and change in control agreements with certain of our executives. These agreements provide for the payment of specific compensation benefits to such executives upon the termination of their employment with us.
General Contractual Indemnities/Products Liability
During the normal course of business, we enter into contracts with customers where we agree to indemnify the other party for personal injury or property damage caused by our products. Our indemnification obligations
F-21
Table of Contents
under such agreements are not generally limited in amount or duration. Given that the amount of any potential liabilities related to such indemnities cannot be determined until a lawsuit has been filed, we are unable to determine the maximum amount of losses that we could incur relating to such indemnities. Historically, any amounts payable pursuant to such indemnities have not had a material negative effect our business, financial condition or results of operations. We maintain general and product liability insurance as well as errors and omissions insurance, which may provide a source of recovery to us in the event of an indemnification claim.
Note 9—Legal Proceedings
From time to time, we are party to various lawsuits, claims and other legal proceedings that arise in the ordinary course of our business. We are not currently a party to any legal proceedings that we believe would reasonably be expected to have a material adverse effect on our business, financial position or results of operations or cash flows.
Note 10—Earnings Per Share
Basic earnings (loss) per share is based on the weighted-average number of common shares outstanding and diluted earnings (loss) per share was based on the weighted-average number of common shares outstanding plus all potentially dilutive common shares outstanding.
Since their impact would be anti-dilutive, our loss per common share does not include the effect of the assumed exercise or vesting of any of the following shares:
| 2015 | 2014 | 2013 | ||||||||||
| Outstanding stock options |
1,973,606 | 1,200,948 | 1,152,074 | |||||||||
| Unvested restricted stock awards |
512,309 | 1,057,535 | 43,195 | |||||||||
| Outstanding warrants |
57,451,915 | 9,498,949 | 11,088,420 | |||||||||
|
|
|
|
|
|
|
|||||||
| Total |
59,937,830 | 11,757,432 | 12,283,659 | |||||||||
|
|
|
|
|
|
|
|||||||
Also, the preferred stock convertible into 5,839,105, 274,104 and 274,104 shares of common stock at December 31, 2015, 2014 and 2013, respectively, was not included since their impact would be anti-dilutive.
F-22
Table of Contents
Note 11—Details of Certain Financial Statement Components and Supplemental Disclosures of Cash Flow Information and Non-Cash Activities
Balance Sheet Data:
| December 31, 2015 |
December 31, 2014 |
|||||||
| Accounts receivable: |
||||||||
| Accounts receivable-trade |
$ | 43,000 | $ | 87,000 | ||||
| Less: allowance for doubtful accounts |
(5,000 | ) | (1,000 | ) | ||||
|
|
|
|
|
|||||
| $ | 38,000 | $ | 86,000 | |||||
|
|
|
|
|
|||||
| December 31, 2015 |
December 31, 2014 |
|||||||
| Inventories: |
||||||||
| Raw materials |
$ | 651,000 | $ | 580,000 | ||||
| Reserve for raw materials |
(578,000 | ) | (540,000 | ) | ||||
| Work-in-process |
28,000 | 31,000 | ||||||
| Reserve for work-in-process |
(28,000 | ) | (25,000 | ) | ||||
| Finished goods |
216,000 | 196,000 | ||||||
| Reserve for finished goods |
(168,000 | ) | (168,000 | ) | ||||
|
|
|
|
|
|||||
| $ | 121,000 | $ | 74,000 | |||||
|
|
|
|
|
|||||
| December 31, 2015 |
December 31, 2014 |
|||||||
| Property and Equipment: |
||||||||
| Equipment |
$ | 11,571,000 | $ | 11,853,000 | ||||
| Leasehold improvements |
1,065,000 | 734,000 | ||||||
| Furniture and fixtures |
205,000 | 223,000 | ||||||
|
|
|
|
|
|||||
| 12,841,000 | 12,810,000 | |||||||
| Less: accumulated depreciation and amortization |
(7,290,000 | ) | (4,908,000 | ) | ||||
|
|
|
|
|
|||||
| $ | 5,551,000 | $ | 7,902,000 | |||||
|
|
|
|
|
|||||
Depreciation and amortization expense amounted to $2,402,000, $1,259,000, and $1,205,000 in 2015, 2014, 2013, respectively. In 2015, 2014 and 2013 we disposed of older, fully depreciated equipment with an acquisition value of $52,000, $8,000,000 and $9,405,000, respectively.
| December 31, 2015 |
December 31, 2014 |
|||||||
| Patents, Licenses and Purchased Technology: |
||||||||
| Patents pending |
$ | 555,000 | $ | 454,000 | ||||
|
|
|
|
|
|||||
| Patents issued |
1,252,000 | 1,226,000 | ||||||
| Less accumulated amortization |
(869,000 | ) | (794,000 | ) | ||||
|
|
|
|
|
|||||
| Net patents issued |
383,000 | 432,000 | ||||||
|
|
|
|
|
|||||
| $ | 938,000 | $ | 886,000 | |||||
|
|
|
|
|
|||||
F-23
Table of Contents
Amortization expense related to these items totaled $75,000, $73,000 and, $65,000 in 2015, 2014, and 2013, respectively. Amortization expenses related to these items are expected to total $73,000 in 2016 and $73,000 in 2017.
| December 31, 2015 |
December 31, 2014 |
|||||||
| Accrued Expenses and Other Long Term Liabilities: |
||||||||
| Salaries payable |
$ | 98,000 | $ | 130,000 | ||||
| Compensated absences |
197,000 | 231,000 | ||||||
| Compensation related |
38,000 | 19,000 | ||||||
| Warranty reserve |
23,000 | 38,000 | ||||||
| Deferred rent |
132,000 | 368,000 | ||||||
| Other |
78,000 | 21,000 | ||||||
| Fair value of warrant derivatives |
245,000 | 5,228,000 | ||||||
|
|
|
|
|
|||||
| Total |
811,000 | 6,035,000 | ||||||
| Less current portion |
(418,000 | ) | (1,401,000 | ) | ||||
|
|
|
|
|
|||||
| Long-term portion |
$ | 393,000 | $ | 4,634,000 | ||||
|
|
|
|
|
|||||
| 2015 | 2014 | 2013 | ||||||||||
| Warranty Reserve Activity: |
||||||||||||
| Beginning balance |
$ | 38,000 | $ | 151,000 | $ | 227,000 | ||||||
| Additions |
— | — | 19,000 | |||||||||
| Deductions |
(15,000 | ) | (113,000 | ) | (95,000 | ) | ||||||
|
|
|
|
|
|
|
|||||||
| Ending balance |
$ | 23,000 | $ | 38,000 | $ | 151,000 | ||||||
|
|
|
|
|
|
|
|||||||
Note 12—Subsequent Event
On March 9, 2016, 399 of our Series B Preferred shares were converted into 1,140,000 shares of common stock.
Quarterly Financial Data (Unaudited)
| First Quarter | Second Quarter | Third Quarter | Fourth Quarter | |||||||||||||
| 2015 |
||||||||||||||||
| Net revenues (1) |
$ | 55,000 | $ | 71,000 | $ | 91,000 | $ | 27,000 | ||||||||
| Loss from operations |
3,685,000 | 2,953,000 | 2,886,000 | 3,199,000 | ||||||||||||
| Net loss |
1,418,000 | 2,409,000 | 2,373,000 | 2,402,000 | ||||||||||||
| Basic and diluted loss per common share |
$ | (0.10 | ) | $ | (0.14 | ) | $ | (0.14 | ) | $ | (0.08 | ) | ||||
| Weighted average number of shares outstanding |
13,712,906 | 17,047,082 | 17,147,823 | 29,388,932 | ||||||||||||
| 2014 |
||||||||||||||||
| Net revenues (1) |
$ | 389,000 | $ | 75,000 | $ | 86,000 | $ | 82,000 | ||||||||
| Loss from operations |
2,799,000 | 3,158,000 | 3,116,000 | 3,234,000 | ||||||||||||
| Net loss |
2,935,000 | 55,000 | 2,412,000 | 2,849,000 | ||||||||||||
| Basic and diluted loss per common share |
$ | (0.25 | ) | $ | (0.00 | ) | $ | (0.19 | ) | $ | (0.22 | ) | ||||
| Weighted average number of shares outstanding |
11,880,889 | 13,026,636 | 12,917,653 | 13,158,592 | ||||||||||||
| (1) | Our revenues vary from quarter to quarter as our customers provide minimal lead-time prior to the release of their purchase orders and have non-binding commitments to purchase from us. |
F-24
Table of Contents
SUPERCONDUCTOR TECHNOLOGIES INC.
Schedule II—Valuation and Qualifying Accounts
| Additions | ||||||||||||||||||||
| Beginning Balance |
Charged to Costs & Expenses |
Charged to Other Accounts |
Deductions | Ending Balance |
||||||||||||||||
| 2015 |
||||||||||||||||||||
| Allowance for Uncollectible Accounts |
$ | 1,000 | $ | 4,000 | $ | — | $ | — | $ | 5,000 | ||||||||||
| Reserve for Inventory Obsolescence |
733,000 | 41,000 | — | — | 774,000 | |||||||||||||||
| Reserve for Warranty |
38,000 | — | — | (15,000 | ) | 23,000 | ||||||||||||||
| Deferred Tax Asset Valuation Allowance |
13,940,000 | 3,335,000 | — | — | 17,275,000 | |||||||||||||||
| 2014 |
||||||||||||||||||||
| Allowance for Uncollectible Accounts |
$ | 1,000 | $ | — | $ | — | $ | — | $ | 1,000 | ||||||||||
| Reserve for Inventory Obsolescence |
722,000 | 11,000 | — | — | 733,000 | |||||||||||||||
| Reserve for Warranty |
151,000 | — | — | (113,000 | ) | 38,000 | ||||||||||||||
| Deferred Tax Asset Valuation Allowance |
9,548,500 | 4,391,500 | — | — | 13,940,000 | |||||||||||||||
| 2013 |
||||||||||||||||||||
| Allowance for Uncollectible Accounts |
2,000 | — | — | (1,000 | ) | 1,000 | ||||||||||||||
| Reserve for Inventory Obsolescence |
1,991,000 | 478,000 | — | (1,747,000 | ) | 722,000 | ||||||||||||||
| Reserve for Warranty |
227,000 | 19,000 | — | (95,000 | ) | 151,000 | ||||||||||||||
| Deferred Tax Asset Valuation Allowance (1) |
44,607,000 | — | — | (35,058,500 | ) | 9,548,500 | ||||||||||||||
| (1) | The deferred tax asset valuation allowance decreased by $35.1 million in 2013 due to the revaluation of the deferred tax asset from loss carryforwards under the change in control provisions in the Internal Revenue Code. |
F-25
Table of Contents
SIGNATURES
Pursuant to the requirements of Section 13 or 15(d) of the Securities Exchange Act of 1934, the Registrant has duly caused this Report to be signed on its behalf by the undersigned, thereunto duly authorized, on this 30th day of March 2016.
| SUPERCONDUCTOR TECHNOLOGIES INC. | ||
| By: | /s/ Jeffrey A. Quiram | |
| Jeffrey A. Quiram | ||
| President and Chief Executive Officer | ||
POWER OF ATTORNEY
KNOW ALL THESE PERSONS BY THESE PRESENTS, that each person whose signature appears below constitutes and appoints William J. Buchanan, his attorney-in-fact, with full power of substitution, for him in any and all capacities, to sign any and all amendments to this Report on Form 10-K, and to file the same, with exhibits thereto and other documents in connection therewith, with the Securities and Exchange Commission, hereby ratifying and confirming all that said attorney-in-fact or his substitute or substitutes, may do or cause to be done by virtue hereof.
Pursuant to the requirements of the Securities Exchange Act of 1934, this Report on Form 10-K has been signed below by the following persons on behalf of the Registrant and in the capacities and on the dates indicated:
| Signature |
Title |
Date | ||
| /s/ Jeffrey A. Quiram | President, Chief Executive Officer and Director (Principal Executive Officer) |
March 30, 2016 | ||
| Jeffrey A. Quiram | ||||
| /s/ William J. Buchanan | Chief Financial Officer (Principal Financial and Accounting Officer) |
March 30, 2016 | ||
| William J. Buchanan | ||||
| /s/ Dan L. Halvorson | Director | March 30, 2016 | ||
| Dan L. Halvorson | ||||
| /s/ Lynn J. Davis | Director | March 30, 2016 | ||
| Lynn J. Davis | ||||
| /s/ Martin A. Kaplan | Chairman of the Board | March 30, 2016 | ||
| Martin A. Kaplan | ||||