Attached files
| file | filename |
|---|---|
| EX-32.2 - EX-32.2 - ADVANCED DRAINAGE SYSTEMS, INC. | d914892dex322.htm |
| EX-21.1 - EX-21.1 - ADVANCED DRAINAGE SYSTEMS, INC. | d914892dex211.htm |
| EX-31.2 - EX-31.2 - ADVANCED DRAINAGE SYSTEMS, INC. | d914892dex312.htm |
| EX-32.1 - EX-32.1 - ADVANCED DRAINAGE SYSTEMS, INC. | d914892dex321.htm |
| EX-23.1 - EX-23.1 - ADVANCED DRAINAGE SYSTEMS, INC. | d914892dex231.htm |
| EX-31.1 - EX-31.1 - ADVANCED DRAINAGE SYSTEMS, INC. | d914892dex311.htm |
| EX-10.18A - EX-10.18A - ADVANCED DRAINAGE SYSTEMS, INC. | d914892dex1018a.htm |
Table of Contents
UNITED STATES
SECURITIES AND EXCHANGE COMMISSION
Washington, D.C. 20549
Form 10-K
| x | ANNUAL REPORT PURSUANT TO SECTION 13 OR 15(d) OF THE SECURITIES EXCHANGE ACT OF 1934 |
For the fiscal year ended March 31, 2015
OR
| ¨ | TRANSITION REPORT PURSUANT TO SECTION 13 OR 15(d) OF THE SECURITIES EXCHANGE ACT OF 1934 |
For the transition period from to
COMMISSION FILE NO.: 001-36557
ADVANCED DRAINAGE SYSTEMS, INC.
(Exact name of registrant as specified in its charter)
| Delaware | 51-0105665 | |
| (State or other jurisdiction of incorporation or organization) |
(I.R.S. Employer Identification Number) |
4640 Trueman Boulevard, Hilliard, Ohio 43026
(Address of principal executive offices and zip code)
(614) 658-0050
(Registrant’s telephone number, including area code)
Securities registered pursuant to Section 12(b) of the Act: Common Stock, $0.01 par value per share
| Title of Each Class |
Name of Each Exchange On Which Registered | |
| Common Stock, $0.01 par value per share | New York Stock Exchange |
Securities registered pursuant to Section 12(g) of the Act: None
Indicate by check mark if the registrant is a well-known seasoned issuer, as defined in Rule 405 of the Securities Act. Yes ¨ No x
Indicate by check mark if the registrant is not required to file reports pursuant to Section 13 or Section 15(d) of the Act. Yes ¨ No x
Indicate by check mark whether the registrant (1) has filed all reports required to be filed by Section 13 or 15(d) of the Securities Exchange Act of 1934 during the preceding 12 months (or for such shorter period that the registrant was required to file such reports), and (2) has been subject to such filing requirements for the past 90 days. Yes ¨ No x
Indicate by check mark whether the registrant has submitted electronically and posted on its corporate Web site, if any, every Interactive Data File required to be submitted and posted pursuant to Rule 405 of Regulation S-T (§ 232.405 of this chapter) during the preceding 12 months (or for such shorter period that the registrant was required to submit and post such files). Yes x No ¨
Indicate by check mark if disclosure of delinquent filers pursuant to Item 405 of Regulation S-K is not contained herein, and will not be contained, to the best of registrant’s knowledge, in definitive proxy or information statements incorporated by reference in Part III of this Form 10-K or any amendment to this Form 10-K. x
Indicate by check mark whether the registrant is a large accelerated filer, an accelerated filer, a non-accelerated filer, or a smaller reporting company. See the definitions of “large accelerated filer,” “accelerated filer,” and “smaller reporting company” in Rule 12b-2 of the Exchange Act. (Check one)
| Large Accelerated Filer | ¨ | Accelerated Filer | ¨ | |||
| Non-Accelerated Filer | x | Smaller Reporting Company | ¨ |
Indicate by check mark whether the registrant is a shell company (as defined in Rule 12b-2 of the Exchange Act). Yes ¨ No x
The aggregate market value of the shares of common stock held by non-affiliates of the registrant (treating all executive officers and directors of the registrant, for this purpose, as affiliates of the registrant) was $388.2 million as of September 30, 2014, the last business day of the registrant’s most recently completed second fiscal quarter, based on the reported closing price of the shares of common stock as reported on the New York Stock Exchange on September 30, 2014.
As of February 29, 2016, the registrant had 54,236,999 shares of common stock outstanding. The shares of common stock trade on the New York Stock Exchange under the ticker symbol “WMS”. In addition, as of February 29, 2016, 112,766 shares of unvested restricted common stock were outstanding and 24,900,252 shares of ESOP, preferred stock, convertible into 19,153,275 shares of common stock, were outstanding. As of February 29, 2016, 73,503,792 shares of common stock were outstanding, inclusive of outstanding shares of unvested restricted common stock and on an as-converted basis with respect to the outstanding shares of ESOP preferred stock.
DOCUMENTS INCORPORATED BY REFERENCE
None.
Table of Contents
| Page | ||||||
| 1 | ||||||
| 1 | ||||||
| PART I | ||||||
| Item 1. |
3 | |||||
| Item 1A. |
18 | |||||
| Item 1B. |
41 | |||||
| Item 2. |
42 | |||||
| Item 3. |
43 | |||||
| Item 4. |
43 | |||||
| PART II | ||||||
| Item 5. |
Market for Registrant’s Common Equity, Related Stockholder Matters and Issuer Purchases of Equity Securities | 44 | ||||
| Item 6. |
46 | |||||
| Item 7. |
Management’s Discussion and Analysis of Financial Condition and Results of Operations |
54 | ||||
| Item 7A. |
81 | |||||
| Item 8. |
84 | |||||
| Item 9. |
Changes in and Disagreements with Accountant on Accounting and Financial Disclosure |
84 | ||||
| Item 9A. |
84 | |||||
| Item 9B. |
94 | |||||
| PART III | ||||||
| Item 10. |
95 | |||||
| Item 11. |
100 | |||||
| Item 12. |
Security Ownership of Certain Beneficial Owners and Management and Related Stockholder Matters | 125 | ||||
| Item 13. |
Certain Relationships and Related Transactions, and Director Independence |
127 | ||||
| Item 14. |
128 | |||||
| PART IV | ||||||
| Item 15. |
130 | |||||
i
Table of Contents
This Annual Report on Form 10-K of Advanced Drainage Systems, Inc. for the year ended March 31, 2015 incorporates certain revisions to historical financial data and related descriptions. The historical financial statements included have been restated to correct errors in our accounting for leases, inventory, long-lived assets, ADS Mexicana, S.A. de C.V. (“ADS Mexicana”), income taxes, and other items. See “Item 7. Management’s Discussion and Analysis of Financial Condition and Results of Operations” and “Note 2. Restatement of Previously Issued Financial Statements” to our audited consolidated financial statements included in “Item 8. Financial Statements and Supplementary Data” of this Form 10-K. Additionally, see “Item 6. Selected Financial and Operating Data” for a summary of the effects of the restatement adjustments on fiscal years 2012 and 2011, and “Note 25. Quarterly Financial Information (Unaudited)” to the consolidated financial statements included in this Annual Report presents historical unaudited consolidated quarterly financial information for each of the quarters during the years ended March 31, 2015 and March 31, 2014. This Form 10-K is being filed concurrently with Forms 10-Q/A for the periods ended June 30, 2014, September 30, 2014 and December 31, 2014.
CAUTIONARY STATEMENT ABOUT FORWARD-LOOKING STATEMENTS
This Annual Report on Form 10-K includes forward-looking statements within the meaning of the Private Securities Litigation Reform Act of 1995. Some of the forward-looking statements can be identified by the use of terms such as “believes,” “expects,” “may,” “will,” “should,” “could,” “seeks,” “intends,” “plans,” “estimates,” “anticipates” or other comparable terms. These forward-looking statements include all matters that are not related to present facts or current conditions or that are not historical facts. They appear in a number of places throughout this Annual Report on Form 10-K and include statements regarding our intentions, beliefs or current expectations concerning, among other things, our consolidated results of operations, financial condition, liquidity, prospects, growth strategies, and the industries in which we operate and include, without limitation, statements relating to our future performance.
Forward-looking statements are subject to known and unknown risks and uncertainties, many of which are beyond our control. We caution you that forward-looking statements are not guarantees of future performance and that our actual consolidated results of operations, financial condition, liquidity, and industry development may differ materially from those made in or suggested by the forward-looking statements contained in this Annual Report on Form 10-K. In addition, even if our actual consolidated results of operations, financial condition, liquidity, and industry development are consistent with the forward-looking statements contained in this Annual Report on Form 10-K, those results or developments may not be indicative of results or developments in subsequent periods. A number of important factors could cause actual results to differ materially from those contained in or implied by the forward-looking statements, including those reflected in forward-looking statements relating to our operations and business, the risks and uncertainties discussed in this Annual Report on Form 10-K (including under the heading “Item 1A. Risk Factors”) and those described from time to time in our other filings with the SEC. Factors that could cause actual results to differ from those reflected in forward-looking statements relating to our operations and business include:
| • | our ability to remediate the material weaknesses in our internal controls over financial reporting described in “Item 9A. Controls and Procedures” of this Annual Report; |
| • | the effect of any claims, litigation, investigations or proceedings resulting from the restatement or the matters related to the restatement, including those described below under “Item 3. Legal Proceedings” of this Annual Report; |
| • | our ability to regain compliance with the New York Stock Exchange’s (“NYSE”) continued listing requirements under the timely filing criteria outlined in Section 802.01E of the NYSE Listed Company Manual; |
1
Table of Contents
| • | fluctuations in the price and availability of resins and other raw materials and our ability to pass any increased costs of raw materials on to our customers in a timely manner; |
| • | volatility in general business and economic conditions in the markets in which we operate, including without limitation factors relating to availability of credit, interest rates, fluctuations in capital and business and consumer confidence; |
| • | cyclicality and seasonality of the non-residential and residential construction markets and infrastructure spending; |
| • | the risks of increasing competition in our existing and future markets, including competition from both manufacturers of high performance thermoplastic corrugated pipe and manufacturers of products using alternative materials; |
| • | our ability to continue to convert current demand for concrete, steel and polyvinyl chloride (“PVC”) pipe products into demand for our high performance thermoplastic corrugated pipe and Allied Products; |
| • | the effect of weather or seasonality; |
| • | the loss of any of our significant customers; |
| • | the risks of doing business internationally; |
| • | the risks of conducting a portion of our operations through joint ventures; |
| • | our ability to expand into new geographic or product markets; |
| • | our ability to achieve the acquisition component of our growth strategy; |
| • | the risk associated with manufacturing processes; |
| • | our ability to manage our assets; |
| • | the risks associated with our product warranties; |
| • | our ability to manage our supply purchasing and customer credit policies; |
| • | the risks associated with our self-insured programs; |
| • | our ability to control labor costs and to attract, train and retain highly-qualified employees and key personnel; |
| • | our ability to protect our intellectual property rights; |
| • | changes in laws and regulations, including environmental laws and regulations; |
| • | our ability to project product mix; |
| • | the risks associated with our current levels of indebtedness; |
| • | our ability to meet future capital requirements and fund our liquidity needs; and |
| • | other risks and uncertainties, including those listed under “Item 1A. Risk Factors.” |
You should read this Annual Report on Form 10-K completely and with the understanding that actual future results may be materially different from expectations. All forward-looking statements made in this Annual Report on Form 10-K are qualified by these cautionary statements. All forward-looking statements are made only as of the date of this Annual Report on Form 10-K, and we do not undertake any obligation, other than as may be required by law, to update or revise any forward-looking statements to reflect future events or developments. Comparisons of results for current and any prior periods are not intended to express any future trends, or indications of future performance, unless expressed as such, and should only be viewed as historical data.
2
Table of Contents
PART I
Restatement of Previously Issued Financial Statements
On August 14, 2015, the Audit Committee of the Company’s Board of Directors, after consultation with management, determined that the Company’s consolidated historical financial statements should no longer be relied upon. Consequently, we have restated our financial results for fiscal years ended March 31, 2014 and 2013. See “Note 2. Restatement of Previously Issued Financial Statements” to the Consolidated Financial Statements in “Item 8. Financial Statements and Supplementary Data” of this Form 10-K for further discussion. The restatement also affects periods prior to fiscal year 2013, with the cumulative effect of the errors reflected as an adjustment to the fiscal year 2013 opening balance of retained earnings and other equity accounts. We have also included a summary of the restated unaudited financial information for the years ended December 31, 2012 and 2011 in “Item 6. Selected Financial and Operating Data.”
COMPANY OVERVIEW
Unless the context otherwise indicates or requires, as used in this Annual Report on Form 10-K, the terms “we,” “our,” “us,” “ADS” and the “Company” refer to Advanced Drainage Systems, Inc. and its directly- and indirectly-owned subsidiaries as a combined entity, except where it is clear that the terms mean only Advanced Drainage Systems, Inc. exclusive of its subsidiaries.
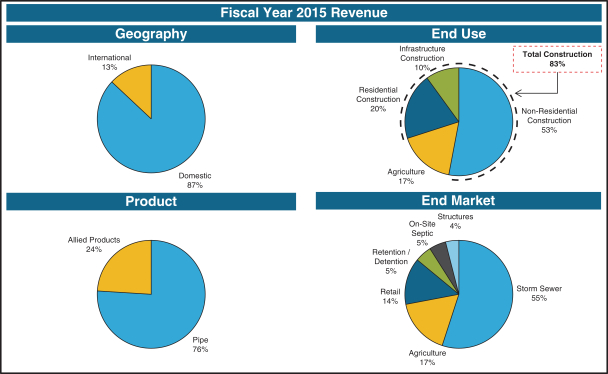
We are the leading manufacturer of high performance thermoplastic corrugated pipe, providing a comprehensive suite of water management products and superior drainage solutions for use in the underground construction and infrastructure marketplace. Our innovative products are used across a broad range of end markets and applications, including non-residential, residential, agriculture and infrastructure applications. We have established a leading position in many of these end markets by leveraging our national sales and distribution platform, our overall product breadth and scale and our manufacturing excellence. In the United States, our national footprint combined with our strong local presence and broad product offering make us the leader in an otherwise highly fragmented sector comprised of many smaller competitors. We believe the markets we serve in the United States represent approximately $10.5 billion of annual revenue opportunity. In addition, we believe the increasing acceptance of thermoplastic pipe products in international markets represents an attractive growth opportunity. For fiscal year 2015, we generated net sales of $1,180.1 million, net income of $12.8 million and adjusted earnings before interest, taxes, depreciation and amortization (“Adjusted EBITDA”) of $143.8 million and, as of March 31, 2015, we had $ 399.9 million of total outstanding debt. For a reconciliation of Adjusted EBITDA to the most directly comparable measure calculated in accordance with generally accepted accounting principles (“GAAP”), see “Item 6. Selected Financial and Operating Data.”
Our products are generally lighter, more durable, more cost effective and easier to install than comparable alternatives made with traditional materials. Following our entrance into the non-residential construction market with the introduction of N-12 corrugated polyethylene pipe in the late 1980s, our pipe has been displacing traditional materials, such as reinforced concrete, corrugated steel and PVC, across an ever expanding range of end markets. This has allowed us to consistently gain share and achieve above market growth throughout economic cycles. We expect to continue to drive conversion to our products from traditional materials as contractors, civil design engineers and municipal agencies increasingly acknowledge the superior physical attributes and compelling value proposition of our thermoplastic products. In addition, we believe that overall demand for our products will increase as the regulatory environment continues to evolve.
Our broad product line includes corrugated high density polyethylene (or “HDPE”) pipe, polypropylene (or “PP”) pipe and related water management products. Building on our core drainage businesses, we have aggressively pursued attractive ancillary product categories such as storm and septic chambers, PVC drainage structures, fittings, and water quality filters and separators. We refer to these ancillary product categories as
3
Table of Contents
Allied Products. Given the scope of our overall sales and distribution platform, we have been able to drive growth within our Allied Products and believe there are significant growth opportunities going forward.
We have an extensive network of 61 manufacturing plants and 31 distribution centers, including the facilities owned or leased by our joint ventures, located across the United States, Puerto Rico, Canada, Mexico, South America and Europe. In the U.S., our network of 47 manufacturing plants and 20 distribution centers allows us to effectively serve all major markets in the United States, which we define as the largest 100 metropolitan statistical areas based on population. The effective shipping radius for our pipe products is approximately 200 miles, thus competition in our industry tends to be on a regional and local basis with minimal competition from distant markets and imports. We are the only supplier of high performance thermoplastic corrugated pipe in our industry with a national footprint in the United States, thereby allowing us to efficiently service those customers that value having one source of supply throughout their entire distribution network. We believe our extensive national footprint in the United States creates a cost and service advantage versus our HDPE pipe producing competitors, the largest of which has only 11 domestic HDPE pipe manufacturing plants and, according to the December 28, 2015 ranking by Plastics News of Pipe, Profile & Tubing Extruders, recently had estimated sales of $145 million, or approximately eight times less than our net sales in fiscal year 2015. Our International segment consists of 14 manufacturing plants in Canada, Mexico, South America and Puerto Rico and 11 distribution centers located in Canada, South America, and Europe.
The majority of our sales are made through long-standing distribution relationships with many of the largest national and independent waterworks distributors, including Ferguson, HD Supply and WinWholesale, who sell primarily to the storm sewer and sanitary sewer markets. We also utilize a network of hundreds of small to medium-sized independent distributors across the United States. We have strong relationships with major national retailers that carry drainage products, including The Home Depot, Lowe’s, Ace Hardware, Carter Lumber and Do it Best, and also sell to buying groups and co-ops in the United States that serve the plumbing, hardware, irrigation and landscaping markets. The combination of our large sales force, long-standing retail and contractor customer relationships and extensive network of manufacturing and distribution facilities complements and strengthens our broad customer and market coverage.
We believe the ADS brand has long been associated with quality products and market-leading performance. Our trademarked green stripe, which is prominently displayed on many of our products, serves as clear identification of our commitment to the customers and markets we serve.
4
Table of Contents
As illustrated in the charts below, we provide a broad range of high performance thermoplastic corrugated pipe and related water management products to a highly diversified set of end markets and geographies.
RECENT DEVELOPMENTS
In July 2014, we completed an initial public offering of our common stock. In December 2014, a certain selling stockholder sold 10 million shares of our common stock in a secondary public offering. See “Item 7. Management’s Discussion and Analysis of Financial Condition and Results of Operations—Recent Developments.” Our common stock is listed on the NYSE under the symbol “WMS.”
On January 30, 2015, Hancor of Canada, Inc., a wholly-owned subsidiary of the Company, acquired all issued and outstanding shares of Ideal Drain Tile Limited and Wave Plastics Inc., the sole partners of Ideal Pipe, which we collectively refer to as Ideal Pipe. Ideal Pipe designs, manufactures and markets high performance thermoplastic corrugated pipe and related water management products used across a broad range of Canadian end markets and applications, including nonresidential, residential, agriculture, and infrastructure applications. The acquisition further strengthens our positions in Canada by increasing our size and scale in the market, as well as enhancing our manufacturing, marketing and distribution capabilities. The purchase price of Ideal Pipe was $43.8 million, financed through our existing line of credit facility.
On July 17, 2015, we acquired an additional 10% of the issued and outstanding membership interests in BaySaver Technologies, LLC (“BaySaver”) for a combined purchase price of $3.2 million, subject to certain additional post-closing purchase price payments specified in the Purchase Agreement. Concurrent with the acquisition, we also entered into an amendment to the BaySaver joint venture agreement to change the voting rights for the joint venture from an equal vote for each member to a vote based upon the respective ownership interest. As a result of the acquisition and the amendment, the Company increased its ownership interest to 65% of the issued and outstanding membership interests in BaySaver and obtained the majority of the voting rights. See “Note 4. Acquisitions” to our consolidated financial statements included in “Item 8. Financial Statements and Supplementary Data” of this Form 10-K.
5
Table of Contents
From July 2015 through February 2016, the Company obtained various consents from the lenders and amended the Bank Term Loans and Senior Notes. These consents and the additional amendments had the effect of: i) extending the time for delivery of our fiscal 2015 audited financial statements and the first, second, and third quarter fiscal 2016 quarterly financial statements to April 1, 2016, whereby an event of default was waived as long as those financial statements were delivered by that date, ii) modified certain definitions applicable to the Company’s affirmative and negative financial covenants, including the negative covenant on indebtedness, to accommodate the Company’s treatment of its transportation and equipment leases as capital leases rather than operating leases and to accommodate the treatment of the costs related to the Company’s restatement, and iii) permitted the Company’s payment of quarterly dividends on common shares in June, August and December 2015, as well as an annual dividend for preferred shares in March 2016. See “Note 13. Debt” to our consolidated financial statements included in “Item 8. Financial Statements and Supplementary Data” of this Form 10-K.
SEGMENT INFORMATION
For a discussion of segment and geographic information, see “Note 23. Business Segment Information” to our audited consolidated financial statements included in “Item 8. Financial Statements and Supplementary Data” of this Form 10-K.
OUR MANUFACTURING AND DISTRIBUTION PLATFORM
We have a leading domestic and international manufacturing and distribution infrastructure, serving customers in all 50 U.S. states as well as approximately 80 other countries through 61 manufacturing plants and 31 distribution centers including the facilities owned or leased by our joint ventures. We also operate an in-house fleet of approximately 650 tractor-trailers. Our effective shipping radius is approximately 200 miles from one of our manufacturing plants or distribution centers. Our scale and extensive network of facilities provide a critical cost advantage versus our competitors, as we are able to more efficiently transport products to our customers and end users and to promote faster product shipments due to our proximity to the delivery location.
The combination of a dedicated fleet and team of company drivers allows greater flexibility and responsiveness in meeting dynamic customer jobsite delivery expectations. We strive to achieve less than three-day lead-time on deliveries, and have the added benefit of redeploying fleet and driver assets to respond to short-term regional spikes in sales activity. For deliveries that are outside an economic delivery radius of our truck fleet, common carrier deliveries are tendered using a customized software platform to ensure that lowest delivered freight costs are achieved. In addition, in the United States and Canada, more than 12% of our pipe volume is sold on a pick-up or walk-in basis at our plant and yard locations, further leveraging our footprint and lowering freight cost per pound and per revenue dollar.
Our North American truck fleet incorporates approximately 1,150 trailers that are specially designed to haul our lightweight pipe and fittings products. These designs maximize payload versus conventional over the road trailers and facilitate unassisted unloading of our products at the jobsites by our drivers. The scope of fleet operations also includes backhaul of purchased raw materials providing a lower delivered cost to our plant locations.
We have expanded internationally primarily through joint ventures with best-in-class local partners. This joint venture strategy has provided us with local and regional access to markets such as Brazil, Chile, Argentina, Mexico, Peru and Colombia. These international facilities produce pipe and related products to be sold in their respective regional markets. Combining a local partner’s customer relationships, brand recognition and local management talent, with our world-class manufacturing and process expertise, broad product portfolio and innovation, creates a powerful platform and exciting opportunities for continued international expansion.
6
Table of Contents
OUR MANUFACTURING PROCESS
We manufacture our corrugated pipe products in 17 different diameters ranging from 2” to 60” using a continuous extrusion process, where molten polyethylene or polypropylene is pushed through a die into a moving series of corrugated U-shaped molds. Blown air and vacuum are used to form the corrugations of the pipe which is pulled through a corrugator and then cut to length. We utilize customized and proprietary production equipment, which we believe is faster and more cost efficient than other pipe making equipment generally available in the market.
Domestically, we operate approximately 121 pipe production lines that collectively are capable of producing more than one billion pounds of pipe annually on a standard five-day per week schedule. Additional capacity is in place to support seasonal production needs and growth in our N-12 pipe sales volume requiring minimal additional capital for molds. Our normal production capacity utilization as a percentage of total capacity was 68%, 64% and 65% for fiscal years 2015, 2014 and 2013, respectively. To produce our broad range of pipe sizes, we own and utilize approximately 330 mold and die setups, which had an original capital cost of approximately $131 million and most of which are moved between manufacturing plants. Our production equipment is built to accept transportable molds and die tooling over a certain range of sizes so each plant is not required to house the full range of tooling at any given time. This transportability provides us with the flexibility to optimize our capacity through centrally-coordinated production planning, which helps to adapt to shifting sales demand patterns while reducing the capital needed for tooling. With our large manufacturing footprint in place, we can support rapid seasonal growth in demand, focusing on customer service while minimizing transportation costs.
The standard fittings products (tees, wyes, elbows, etc.) that we produce and sell to connect our pipe on jobsites are blow molded or injection molded at four domestic plants. In addition, customized fabricated fittings (e.g., more complex dual wall pipe reducers, bends or structures) are produced in 20 of our North American plants. In addition to the extrusion of pipe, and blow molding and injection molding of fittings, we also use a variety of other processes in our manufacturing facilities. These processes include thermoforming, compression molding, and custom plastic welding and fabrication. The wide variety of production processes and expertise allow us to provide cost-effective finished goods at competitive prices delivered in a timely fashion to our customers.
Our manufacturing plants have no process related by-products released into the atmosphere, waterways, or solid waste discharge. During pipe production start-ups and size change-overs, non-compliant scrap and any damaged finished goods pipe are recycled through a grinder for internal re-use.
We have two internal quality control laboratory facilities equipped and staffed to evaluate and confirm incoming raw material and finished goods quality in addition to the quality testing that is done at our manufacturing facilities. We conduct annual safety, product and process quality audits at each of our facilities, using centralized internal resources in combination with external third-party services. In the quality area, various national agencies such as National Transportation Product Evaluation Program (“NTPEP”), International Association of Plumbing and Mechanical Officials (“IAPMO”), Bureau de normalisation du Québec (“BNQ”), Intertek for Canadian Standards Association (“CSA”) , Entidad Mexicana de Acreditacion A.C. (“EMA”) and NSF International and numerous state Departments of Transportation (“DOT”) (e.g., Illinois, Michigan) and municipal authorities (e.g., City of Columbus) conduct both scheduled and unscheduled inspections of our plants to verify product quality and compliance to applicable standards.
Core to our commitment and enablement of a safe and productive manufacturing environment are our operational and management training programs. Through our ADS Academy, we deliver targeted role-specific training to our operations team members through a blended curriculum of on-line and hands-on training experiences covering safety, quality, product knowledge and manufacturing process. Our learning management system, which hosts over 400 custom modules, serves as the foundation of our operational training programs and provides us with appropriate scale, efficiency, and governance to support our growth. We have a strong commitment to the training of our manufacturing supervisors and managers in technical, management, and leadership subjects through intense role-based assimilation plans, e-learning and classroom-based development experiences.
7
Table of Contents
OUR PRODUCTS
We design, manufacture and market a complete line of high performance thermoplastic corrugated pipe and related water management products for use in a wide range of end markets. Our product line includes: single, double and triple wall corrugated polypropylene and polyethylene pipe, or Pipe, and a variety of Allied Products including: storm retention/detention and septic chambers, or Chambers; PVC drainage structures, or Structures; fittings, or Fittings; and water quality filters and separators, or Water Quality. We also sell various complementary products distributed through resale agreements, including geotextile products and drainage grates and other, or Other Resale.
An overview of our product offerings is provided below:
| Product Offering |
Description |
Brands/Offerings |
Images | |||
| Pipe (76% of Total Net Sales in Fiscal Year 2015) |
||||||
| High density polyethylene and polypropylene pipe | Dual Wall Corrugated Pipe, HP Storm Pipe, SaniTite HP Pipe, Single Wall Corrugated Pipe, Triple Wall Corrugated Pipe, Smoothwall HDPE Pipe |

| ||||
| Allied Products (24% of Total Net Sales in Fiscal Year 2015) |
||||||
| Chambers | Underground chambers made from polypropylene or HDPE that can function as stormwater detention, retention, and/or “first flush” storage systems | StormTech, ARC (Septic Chambers), BioDiffuser (Septic Chambers) |

| |||
| Structures | Drainage structures consisting of inline drains, drain basins, curb inlet structures, and drop-in grates in diameters ranging from 8” to 30” | Nyloplast, Inserta Tee |


| |||
| Fittings | Standard and fabricated joining systems | Fittings |

| |||
| Water Quality | Water quality structures and filters | BaySeparator, BayFilter, Water Quality Units, FleXstorm |

| |||
| Other Resale | Complementary products providing services adjacent to core expertise | Geotextiles |

| |||
8
Table of Contents
Pipe
Dual Wall Corrugated Pipe
Our N-12 pipe is a dual wall HDPE pipe with a corrugated exterior for strength and a smooth interior wall for hydraulics and flow capacity. Our N-12 pipe competes in the storm sewer and drainage markets that are also served by concrete pipe.
Our N-12 pipe is available in 17 different diameters ranging from 2” to 60” and in sections ranging from 10’ to 30’ in length. N-12 provides joint integrity, with integral bell and spigot joints for fast push-together installation, and is sold either with watertight or soil-tight coupling and fitting systems.
Our corrugated polyethylene pipe offers many benefits including ease of installation, job-site handling and resistance to corrosion and abrasion. Corrugated pipe can easily be cut or coupled together, providing precise laying lengths while minimizing installation waste and difficulty.
HP Storm Pipe and SaniTite HP Pipe
Our HP Storm pipe utilizes polypropylene resin, which provides (i) increased pipe stiffness relative to HDPE; (ii) higher Environmental Stress Crack Resistance (“ESCR”); and (iii) improved thermal properties, which improves joint performance. These improved physical characteristics result in a reduced need for select backfill, which creates installation savings for customers and expands the range of possible product applications.
Our SaniTite HP pipe utilizes the same polypropylene resins as our HP Storm pipe but includes a smooth third exterior wall in 30” to 60” pipe. The highly engineered polypropylene resin along with the triple wall design enables SaniTite HP to surpass the 46 pounds per square inch (“psi”), stiffness requirement for sanitary sewer applications. SaniTite HP offers cost and performance advantages relative to reinforced concrete pipe (such as improved hydraulics and better joint integrity) and PVC pipe (such as impact resistance).
Single Wall Corrugated Pipe
Our single wall corrugated HDPE pipe is ideal for drainage projects where flexibility, light weight and low cost are important. Single wall HDPE pipe products have been used for decades in agricultural drainage, highway edge drains, septic systems and other construction applications. In the agricultural market, improved technology has highlighted the favorable impact of drainage on crop yields. For homeowners, it is an economical and easily-installed solution for downspout run-off, foundation drains, driveway culverts and general lawn drainage. Single wall pipe is also used for golf courses, parks and athletic fields to keep surfaces dry by channeling away excess underground moisture.
Standard single wall products are available in 2” to 24” diameters and sold in varying lengths. Pipe with 2” to 6” diameters is typically sold in coils ranging from 25’ to over 3,000’ in length, while larger diameter pipe is typically sold in 20’ lengths. Pipe can be either perforated or non-perforated depending on the particular drainage application.
Triple Wall Corrugated Pipe and Smoothwall HDPE Pipe
Our ADS-3000 Triple Wall pipe, small diameter triple wall corrugated pipe, consists of a corrugated polyethylene core molded between a smooth white outer wall and a smooth black inner wall. This combination of the three wall design adds strength and stiffness, while reducing weight as compared to PVC 2729. Triple Wall is produced in two sizes, 3” and 4”, and sold through our distribution network.
We also manufacture smoothwall HDPE pipe in 3”, 4”, and 6” diameters that are sold into the residential drainage and on-site septic systems markets.
9
Table of Contents
Allied Products
We produce a range of additional water management products that are complementary to our pipe products (“Allied Products”). Our Allied Products offer adjacent technologies to our core pipe offering, presenting a complete drainage solution for our clients and customers. This combination of pipe and Allied Products is a key strategy in our sales growth, profitability and market share penetration. The practice of selling a drainage system is attractive to both distributors and end users, by providing a broad package of products that can be sold on individual projects, and strengthens our competitive advantage in the marketplace. We aggressively seek and evaluate new products, technologies and regulatory changes that impact our customers’ needs for Allied Products.
Using the strength of our overall sales and distribution platform, our Allied Product strategy allows us to more deeply penetrate our end markets and anticipate the evolving needs of our customers. The underground construction industry has historically been project (not product) driven, creating the impetus for owners, engineers and contractors to seek manufacturers that deliver solution-based product portfolios. Many of the components of underground construction are related and require linear compatibility of function, regulatory approval and technology.
Storm and Septic Chambers
Our StormTech chambers are used for stormwater retention, detention and “first flush” underground water storage on non-residential site development and public projects. These highly engineered chambers are injection molded from high density polyethylene and polypropylene resins into a proprietary design which provides strength, durability, and resistance to corrosion. The chambers allow for the efficient storage of stormwater volume, reducing the underground construction footprint and costs to the contractors, developers, and property owners. Our StormTech chambers offer great flexibility in design and layout of underground water storage systems. They are an attractive alternative to open ponds by reducing ongoing maintenance and liability and providing more useable land for development. Stormwater runoff is collected and stored in rows of chambers and gradually reenters the water system base, reducing erosion and protecting waterways. The chambers are open bottom, which allows for high density stacking in both storage and shipment. This freight-efficient feature drives favorable cost-competitiveness in serving long-distance export markets. These chamber systems typically incorporate our other product lines such as corrugated pipe, fabricated fittings, water quality units and geotextiles.
Our ARC and BioDiffuser products are chambers that are used in on-site septic systems for residential and small volume non-residential wastewater treatment and disposal. Rural homes and communities that do not have access to central sewer lines require an on-site septic solution. Our ARC and BioDiffuser chamber products are installed and perform their septic treatment function without gravel, reducing costs to the contractor and homeowner over traditional pipe and stone systems. States and municipalities have different sizing criteria for on-site septic treatment systems based on soil and site conditions. The innovative design of our ARC chamber is generally approved for a footprint reduction, further reducing the cost of the septic system. Injection-molded from high density polyethylene, these products are strong, durable, and chemical-resistant. These interconnecting chambers are favored by septic contractors because they are lightweight, easy to install and offer articulating features which increase site-specific design flexibility.
Structures
Our Nyloplast PVC drainage structures are used in non-residential, residential and municipal site development, road and highway construction, as well as landscaping, recreational, industrial and mechanical applications. The product family includes inline drains, drain basins, curb inlets and water control structures which move surface-collected stormwater vertically down to pipe conveyance systems. These custom structures are fabricated from sections of PVC pipe using a thermo-forming process to achieve exact site-specific hydraulic
10
Table of Contents
design requirements. Our Nyloplast products are a preferred alternative to heavier and larger concrete structures, by offering greater design flexibility and improved ease of installation which reduces overall project costs and timelines. The structures incorporate rubber gaskets to ensure watertight connections, preventing soil infiltration which plagues competitive products.
Our Inserta Tee product line consists of a PVC hub, rubber sleeve and stainless steel band. Inserta Tee is compression fit into the cored wall of a mainline pipe and can be used with all pipe material types and profiles. This product offers an easy tap-in to existing sanitary and storm sewers by limiting the excavation needed for installation compared to competitive materials.
Fittings
We produce fittings and couplings utilizing blow molding, injection molding and custom fabrication on our pipe products. Our innovative coupling and fitting products are highly complementary to our broader product suite, and include both soil-tight and water-tight capabilities across the full pipe diameter spectrum. Our fittings are sold in all end markets where we sell our current pipe products.
Water Quality
Our BaySaver product line targets the removal of sediment, debris, oils and suspended solids throughout a stormwater rain event by separating and/or filtering unwanted pollutants. Our BaySeparators can be fabricated into multiple sizing combinations to fit a variety of applications and customer requirements. These products assist owners, developers and design engineers in remaining compliant with discharge requirements set forth by the Environmental Protection Agency (“EPA”) as well as state and local regulatory agencies. Our BaySaver product line coupled with our pipe, StormTech chambers, fabricated fittings, Nyloplast structures, FleXstorm inlet protection systems and geotextiles make up a comprehensive stormwater management solution.
Construction Fabrics & Geotextiles
We purchase and distribute construction fabrics and other geosynthetic products for soil stabilization, reinforcement, filtration, separation, erosion control, and sub-surface drainage. Constructed of woven and non-woven polypropylene, geotextile products provide permanent, cost-efficient site-development solutions. Construction fabrics and geotextiles have applications in all of our end markets.
RAW MATERIALS
Virgin high density polyethylene (“HDPE”) and polypropylene (“PP”) resins are derivatives of ethylene and propylene, respectively. Ethylene and propylene are derived from natural gas liquids or crude oil derivatives in the U.S. We currently purchase in excess of 700 million pounds of virgin and recycled resin annually from over 450 suppliers in North America. As a high-volume buyer of resin, we are able to achieve economies of scale to negotiate favorable terms and pricing. Our purchasing strategies differ based on the material (virgin resin v. recycled material) ordered for delivery to our production locations. The price movements of the different materials also vary, resulting in the need to use a number of strategies to reduce volatility and successfully pass on cost increases to our customer through timely selling price increases when needed.
In 2008 we began to further augment our raw material blending and processing technologies to produce an HDPE pipe that incorporates recycled resin. This product, which meets an ASTM International (“ASTM”) standard, replaces a majority of the virgin resin that is used in the American Association of State Highway and Transportation Officials (“AASHTO”) product with recycled materials. To further develop our recycled material strategies, we established Green Line Polymers, Inc. (“GLP”), as our wholly-owned recycling subsidiary in 2012. GLP procures and processes recycled raw materials that can be used in products we produce and sell. Our first production facilities were established in Ohio and Georgia and are focused on processing post-industrial HDPE
11
Table of Contents
recycled materials. Based on the success of this strategy, we expanded our efforts toward post-consumer material processing by acquiring the business of a vendor who was supplying clean, post-consumer recycled HDPE to our upper Midwest plants and established a second post-consumer processing plant, in Pennsylvania, to support our plants in Ohio, Michigan and the eastern and southern United States. In fiscal year 2015, 66% of our non-virgin HDPE raw material needs were internally processed (enhanced) through our GLP operations.
We believe that we are well positioned for future growth as we add additional recycled material processing facilities, add capacity to existing facilities, and expand our supplier base for virgin resin. With the significant activity in U.S. shale gas and oil extraction expected to continue, we anticipate continued growth in the availability of ethylene and propylene which are used to manufacture high density polyethylene and polypropylene, respectively.
We have managed a formal resin price risk management program since early in 2010 that entails both physical fixed price and volume contracts along with financial hedges which are designed to apply to a significant portion of our annual virgin resin purchases. In conjunction with our resin price risk management program, we also maintain supply agreements with our major resin suppliers that provide multi-year terms and volumes that are in excess of our projected consumption. For our polypropylene virgin resin price exposure, we utilize financial hedges of propylene as a proxy for polypropylene. Historically, there has been high correlation in month to month change in market based pricing between propylene and polypropylene.
We also began a diesel hedging program in 2008 which is executed through several financial swaps covering future months demand for diesel fuel and are designed to decrease our exposure to changing fuel costs. These hedges cover a significant portion of the diesel fuel consumed by the truck fleet that we operate to deliver products to our customers. Our objective is to hedge roughly 50% of our overall monthly fuel costs over the next 12 months.
SUPPLIERS
We have developed relationships with all of the North American producers of virgin high density polyethylene and impact copolymer polypropylene producers that produce the grades we need to produce our products. , including Braskem Americas, Inc., Chevron Phillips Chemical Co. LP, The Dow Chemical Company, Equistar Chemicals, LP, ExxonMobil Chemical Company, Formosa Plastics Corporation, U.S.A., Ineos Olefins & Polyolefins, USA and Phillips 66 Company.
We also maintain relationships with several of the largest environmental companies such as Waste Management, Inc., Republic Services, Inc., Rumpke, Inc. and QRS, Inc., which provide us with post-consumer HDPE recycled materials. We also maintain relationships with several key post-industrial HDPE suppliers, including E.I. du Pont de Nemours and Company, Silgan Plastics, Consolidated Container Company and Alpla, Inc. which provide us with materials that cannot otherwise be utilized in their respective production processes.
The North American capacity for ethylene derivatives is being expanded primarily as a result of the new supplies of natural gas liquids being produced through shale gas exploration and production. This low-cost stream of feedstocks (ethane and propane) has positioned several companies such as Lyondell Basell, ExxonMobil Chemical Company, Chevron Phillips Chemical Co. LP and The Dow Chemical Company to begin the permitting and engineering phases for significant amounts of additional ethylene or propylene capacity. We anticipate that the previously announced projects for ethylene derivative capacity associated with HDPE will begin coming on stream during 2016, extending through 2018. The polypropylene capacity expansion projects to utilize the increased supply of propylene are projected to begin coming on-stream in 2018.
12
Table of Contents
CUSTOMERS
We have a large, active customer base of over 18,000 customers, with one customer representing more than 10% of fiscal year 2015 net sales. Ferguson Enterprises accounted for 10.7% of fiscal year 2015 net sales. Our customer base is diversified across the range of end markets that we serve.
A majority of our sales are made through distributors, including many of the largest national and independent waterworks distributors, with whom we have long-standing distribution relationships. These include Ferguson, HD Supply and WinWholesale, who sell primarily to the storm sewer and sanitary sewer markets. We also utilize a network of hundreds of small to medium-sized independent distributors across the United States. We have strong relationships with major national retailers that carry drainage products, including The Home Depot, Lowe’s, Ace Hardware, Carter Lumber and Do it Best. We offer the most complete line of HDPE products in the industry and are the only national manufacturer that can service the “Big-Box” retailers from coast-to-coast. We also sell to buying groups and co-ops in the United States that serve the plumbing, hardware, irrigation and landscaping markets. Selling to buying groups and co-ops provides us a further presence on a national, regional and local basis for the distribution of our products. Our preferred vendor status with these groups allows us to reach thousands of locations in an effective manner. Members of these groups and co-ops generally are independent businesses with strong relationships and brand recognition with smaller contractors and homeowners in their local markets. The combination of our large sales force, long-standing retail and contractor customer relationships and extensive network of manufacturing and distribution facilities complements and strengthens our broad customer and market coverage.
An important element of our growth strategy has been our focus on industry education efforts to drive regulatory approvals for our core HDPE products at national, state and local levels. We employ a team of approximately 50 field-based engineers who work closely with government agencies to obtain regulatory approvals for our products, and also with civil engineering firms to specify our products on non-residential construction and road-building projects. We consistently maintain an active dialogue with customers, civil engineers and municipal authorities, continuously educating them on new product innovations and their advantages relative to traditional products. With the introduction of our HP storm and sanitary pipe, we have refocused our efforts calling on state departments of transportation to enhance their approval of our pipe products. Additional state and local regulatory approvals will continue to present new growth opportunities in new and existing geographic markets for us.
Our customer service organization of more than 100 employees is supplemented by the employees of our 61 manufacturing plants, 31 distribution centers and drivers of our approximately 650 tractor-trailers. In conjunction with our field sales and engineering team, this highly-trained and competent staff allows us to maintain more customer touch points and interaction than any of our competitors.
We staff and operate four regional customer service call centers located in three time zones where orders are processed. With some of our larger customers, we process orders electronically via electronic data interchange (EDI). Additionally, we send advance shipment notifications and invoices electronically to these customers. These capabilities strengthen the supply chain integration with large customers such as The Home Depot, Lowes, Ferguson and HD Supply. New orders are entered into our Oracle system, assigned to our closest manufacturing plant or distribution center in that geography, and then consolidated to optimize freight efficiency, payload and lead-time performance to meet customer requirements.
SALES AND MARKETING
We believe we have the largest and most experienced sales force in the industry, with approximately 250 dedicated direct sales professionals that call on engineers, contractors, distributors and developers. Offering the broadest product line in the industry enables our sales force to source the greatest number of new opportunities and more effectively cross-sell products than any of our competitors. We consistently maintain
13
Table of Contents
thousands of touch-points with customers, civil engineers and municipal authorities, continuously educating them on new product innovations and their advantages relative to traditional products. We believe we are the industry leader in these efforts and we view this work as an important part of our marketing strategy, particularly in promoting N-12 and SaniTite HP for storm and sanitary sewer systems, as regulatory approvals are essential to the specification and acceptance of these product lines.
Our sales and marketing strategy is divided into four components — comprehensive market coverage, diverse product offerings, readily-available local inventory and specification efforts. Our goal is to provide the distributor/owner with the most complete, readily-available product line in our industry. We strive to use our manufacturing footprint, product portfolio and market expertise to efficiently service our customers.
Our sales and engineering objective is to influence, track and quote all selling opportunities as early in the project life cycle as possible. Conceptual project visibility allows sales and engineering professionals the ability to influence design specifications and increase the probability of inclusion of our products in bid documents. We strive to be meaningfully involved in all phases of the project cycle, including design, bidding, award and installation. In addition to direct channel customers, we also maintain and develop relationships with federal agencies, municipal agencies, national standard regulators, private consulting engineers and architects. Our consistent interaction with these market participants enables us to continue our market penetration. This ongoing dialogue has positioned us as an industry resource for design guidance and product development and as a respected expert in water management solutions.
SEASONALITY
Historically, sales of our products have been higher in the first and second quarters of each fiscal year due to favorable weather and longer daylight conditions accelerating construction activity during these periods. Seasonal variations in operating results may also be impacted by inclement weather conditions, such as cold or wet weather, which can delay projects.
In the non-residential, residential and infrastructure markets in the northern United States and Canada, construction activity typically begins to increase in late March and is slower in December, January and February. In the southern and western United States, Mexico, Central America and South America, the construction markets are less seasonal. The agricultural drainage market is concentrated in the early spring just prior to planting and in the fall just after crops are harvested prior to freezing of the ground in winter.
PRACTICES RELATED TO WORKING CAPITAL ITEMS
Information about the Company’s working capital practices is incorporated herein by reference to “Item 7. Management’s Discussion and Analysis of Financial Condition and Results of Operations — Results of Operations — Working Capital and Cash Flows” of this Form 10-K.
COMPETITION
We operate in a highly fragmented industry and hold leading positions in multiple market sectors. Competition, including our competitors and specific competitive factors, varies for each market sector.
We believe the principal competitive factors for our market sectors include local selling coverage, product availability, breadth and cost of products, technical knowledge and expertise, customer and supplier relationships, reliability and accuracy of service, effective use of technology, delivery capabilities and timeliness, pricing of products, and the provision of credit. We believe that our competitive strengths and strategy allow us to compete effectively in our market sectors.
The stormwater drainage industry, in particular, is highly fragmented with many smaller specialty and regional competitors providing a variety of product technologies and solutions. We compete against concrete
14
Table of Contents
pipe, corrugated steel pipe and PVC pipe producers on a national, regional and local basis. In addition, there are several HDPE pipe producers in the United States.
In the United States, our primary competitors are concrete pipe producers, including Cemex, Hanson and Oldcastle CRH Precast, as well as smaller, regional competitors. In the corrugated steel pipe sector, our primary national competitor is Contech Engineered Solutions, and we compete with Lane Enterprises, Pacific Corrugated and Southeast Culvert on a regional level, as well as other smaller competitors. In the PVC pipe sector, we compete primarily with JM Eagle, Diamond Plastics and North American Pipe. We believe we are the only corrugated HDPE pipe producer with a national footprint, and our competitors operate primarily on a regional and local level. In the corrugated HDPE pipe sector in the United States, our primary competitors on a regional basis are JM Eagle, Lane Enterprises and Prinsco.
The superior attributes of HDPE and PP and ongoing product innovation have allowed thermoplastic pipe manufacturers generally, and us in particular, to capture market share across all end market categories. This substitution trend is expected to continue as more states and municipalities recognize the benefits of our HDPE N-12 pipe and our polypropylene HP pipe by approving it for use in a broader range of applications.
INTELLECTUAL PROPERTY
Intellectual property is an important aspect of our business. We rely upon a combination of patents, trademarks, trade names, licensing arrangements, trade secrets, know-how and proprietary technology in order to secure and protect our intellectual property rights, both in the United States and in foreign countries.
We seek to protect our new technologies with patents and trademarks and defend against patent infringement allegations. We hold a significant amount of intellectual property rights pertaining to product patents, process patents and trademarks. We continually seek to expand and improve our existing product offerings through product development and acquisitions. Although our intellectual property is important to our business operations and in the aggregate constitutes a valuable asset, we do not believe that any single patent, trademark or trade secret is critical to the success of our business as a whole. We cannot be certain that our patent applications will be issued or that any issued patents will provide us with any competitive advantages or will not be challenged by third parties.
In addition to the foregoing protections, we generally control access to and use of our proprietary and other confidential information through the use of internal and external controls, including contractual protections with employees, distributors and others. Despite these protections, we may be unable to prevent third parties from using our intellectual property without our authorization, breaching any nondisclosure agreements with us, or independently developing products that are similar to ours, particularly in those countries where the laws do not protect our proprietary rights as fully as in the United States.
See “Item 1A. Risk Factors — Risks Relating to Our Business — If we are unable to protect our intellectual property rights, or we infringe on the intellectual property rights of others, our ability to compete could be negatively impacted.”
EMPLOYEES
As of March 31, 2015, in our domestic and international operations the Company and its consolidated and unconsolidated joint ventures had approximately 3,950 employees, consisting of approximately 2,800 hourly personnel and approximately 1,150 salaried employees. As of March 31, 2015, approximately 300 hourly personnel in our Mexican and South American operations were covered by collective bargaining agreements.
15
Table of Contents
REGULATION
Our operations are affected by various statutes, regulations and laws in the markets in which we operate, which historically have not had a material effect on our business. We are subject to various laws applicable to businesses generally, including laws affecting land usage, zoning, the environment, health and safety, transportation, labor and employment practices, competition, immigration and other matters. Additionally, building codes may affect the products our customers are allowed to use, and, consequently, changes in building codes may affect the salability of our products. The transportation and disposal of many of our products are also subject to federal regulations. The U.S. DOT regulates our operations in domestic interstate commerce. We are subject to safety requirements governing interstate operations prescribed by the U.S. DOT. Vehicle dimensions and driver hours of service also remain subject to both federal and state regulation.
We have been able to consistently capitalize on changes in both local and federal regulatory statutes relating to storm and sanitary sewer construction, repair and replacement. Most noteworthy is the Federal Clean Water Act of 1972 and the subsequent EPA Phase I, II and sustainable infrastructure regulations relating to storm sewer construction, storm water quantity, storm water quality, and combined sewer separation. Our diversity of products offering a solution-based selling approach coupled with detailed market knowledge makes us an integral industry resource in both regulatory changes and compliance.
ENVIRONMENTAL, HEALTH AND SAFETY MATTERS
We are subject to a broad range of foreign, federal, state and local environmental, health and safety laws and regulations, including those pertaining to air emissions, water discharges, the handling, disposal and transport of solid and hazardous materials and wastes, the investigation and remediation of contamination and otherwise relating to health and safety and the protection of the environment and natural resources. As our operations, and those of many of the companies we have acquired, to a limited extent involve and have involved the handling, transport and distribution of materials that are, or could be classified as, toxic or hazardous, there is some risk of contamination and environmental damage inherent in our operations and the products we handle, transport and distribute. Our environmental, health and safety liabilities and obligations may result in significant capital expenditures and other costs, which could negatively impact our business, financial condition and results of operations. We may be fined or penalized by regulators for failing to comply with environmental, health and safety laws and regulations, or we may be held responsible for such failures by companies we have acquired. In addition, contamination resulting from our current or past operations, and those of many of the companies we have acquired, may trigger investigation or remediation obligations, which may have a material adverse effect on our business, financial condition and results of operations.
CORPORATE AND AVAILABLE INFORMATION
We were founded in 1966 and are a Delaware corporation. Our principal executive offices are located at 4640 Trueman Boulevard, Hilliard, Ohio 43026, and our telephone number at that address is (614) 658-0050. Our corporate website is www.ads-pipe.com.
Our Annual Report on Form 10-K, Quarterly Reports on Form 10-Q, Current Reports on Form 8-K, and amendments to reports filed pursuant to Sections 13(a) and 15(d) of the Securities Exchange Act of 1934, as amended, (“Exchange Act”) are filed with the U.S. Securities and Exchange Commission (“SEC”). We are subject to the informational requirements of the Exchange Act and file or furnish reports, proxy statements, and other information with the SEC. Such reports and other information filed by the Company with the SEC are available free of charge on our website at www.ads-pipe.com when such reports are available on the SEC’s website. We use our www.ads-pipe.com website as a means of disclosing material non-public information and for complying with our disclosure obligations under Regulation FD. Accordingly, investors should monitor such portions of www.ads-pipe.com in addition to following press releases, SEC filings and public conference calls and webcasts.
16
Table of Contents
The public may read and copy any materials filed by the Company with the SEC at the SEC’s Public Reference Room at 100 F Street, NE, Room 1580, Washington, DC 20549. The public may obtain information on the operation of the Public Reference Room by calling the SEC at 1-800-SEC-0330. The SEC maintains an Internet site that contains reports, proxy and information statements and other information regarding issuers that file electronically with the SEC at www.sec.gov.
The contents of the websites referred to above are not incorporated into this filing. Further, our references to the URLs for these websites are intended to be inactive textual references only.
17
Table of Contents
You should carefully consider the risks described below, together with all other information included or incorporated by reference in this Annual Report on Form 10-K. If any of the following risks actually occur, our business, financial condition, results of operations and cash flows could be materially adversely affected. In these circumstances, the market price of our common stock could decline significantly.
Risks Relating to the Restatement and Our Financial Reporting Process
The restatement of our previously issued financial statements has been time-consuming and expensive and could expose us to additional risks that would adversely affect our financial position, results of operations and cash flows.
As described in the section entitled “Explanatory Note” and in “Note 2. Restatement of Previously Issued Financial Statements,” to our audited consolidated financial statements included in “Item 8. Financial Statements and Supplementary Data” of this Form 10-K, we have restated our previously issued consolidated financial statements for the fiscal years ended March 31, 2014 and 2013, as well as each of the first three quarters in fiscal year 2015 and 2014. We have also restated our financial results for the fiscal years ended March 31, 2012 and 2011, as summarized in “Item 6. Selected Financial and Operating Data.” The restatement has been time-consuming and expensive and could expose us to a number of additional risks that would adversely affect our financial position, results of operations and cash flows.
In particular, we have incurred significant expense, including audit, legal, consulting and other professional fees as well as fees related to the amendment of our credit agreements and private shelf agreements, in connection with the restatement of our previously issued consolidated financial statements and the ongoing remediation of weaknesses in our internal control over financial reporting. We have taken a number of steps, including both adding internal personnel and hiring outside consultants, and intend to continue to take appropriate and reasonable steps to strengthen our accounting function and reduce the risk of additional misstatements in our financial statements. For more details about our remediation plan, see “Item 9A. Controls and Procedures” of this Form 10-K. To the extent these steps are not successful, we may have to incur additional time and expense. Our management’s attention has also been, and may further be, diverted from the operation of our business in connection with the restatement and ongoing remediation of material weaknesses in our internal controls.
We are also subject to claims, investigations and proceedings arising out of the errors in our previously issued financial statements, including securities class action litigation against us. See “The restatement of our previously issued financial results has resulted in private litigation, investigation by the SEC and could result in additional government investigations and enforcement actions.”
We have identified material weaknesses in our internal control over financial reporting which could, if not remediated, adversely affect our ability to report our financial condition and results of operations in a timely and accurate manner, investor confidence in our company and, as a result, the value of our common stock.
We are required to evaluate the effectiveness of our disclosure controls on a periodic basis and publicly disclose the results of these evaluations and related matters in accordance with the requirements of Section 404 of the Sarbanes-Oxley Act of 2002. While we are not yet required to comply with the internal control reporting requirements mandated by Section 404 due to the transition period established for newly public companies, we have identified certain material weaknesses in internal control over financial reporting in the areas of (i) the Company’s control environment, (ii) accounting for leases, (iii) accounting for inventory, (iv) journal entry and account reconciliation, (v) ADS Mexicana control environment, and (vi) ADS Mexicana revenue recognition cut-off practices as described in “Item 9A. Controls and Procedures” of this Form 10-K. As a result of such material weaknesses, our management concluded that our disclosure controls and procedures were not effective as of March 31, 2015.
18
Table of Contents
A “material weakness” is a deficiency, or a combination of deficiencies, in internal control over financial reporting, such that there is a reasonable possibility that a material misstatement of our annual or interim consolidated financial statements will not be prevented or detected on a timely basis. We are actively engaged in developing and implementing a remediation plan designed to address these material weaknesses, but our remediation efforts are not complete and are ongoing. Although we are working to remedy the ineffectiveness of the Company’s internal control over financial reporting, there can be no assurance as to when the remediation plan will be fully developed, when it will be fully implemented or the aggregate cost of implementation. Until our remediation plan is fully implemented, our management will continue to devote significant time and attention to these efforts. If we do not complete our remediation in a timely fashion, or at all, or if our remediation plan is inadequate, there will continue to be an increased risk that we will be unable to timely file future periodic reports with the SEC and that our future consolidated financial statements could contain errors that will be undetected. If we are unable to report our results in a timely and accurate manner, we may not be able to comply with the applicable covenants in our financing arrangements, and may be required to seek additional amendments or waivers under these financing arrangements, which could adversely impact our liquidity and financial condition. Further and continued determinations that there are material weaknesses in the effectiveness of the Company’s internal control over financial reporting could reduce our ability to obtain financing or could increase the cost of any financing we obtain and require additional expenditures of both money and our management’s time to comply with applicable requirements.
Any failure to implement or maintain required new or improved controls, or any difficulties we encounter in their implementation, could result in additional material weaknesses or material misstatement in our consolidated financial statements. Any new misstatement could result in a further restatement of our consolidated financial statements, cause us to fail to meet our reporting obligations, reduce our ability to obtain financing or cause investors to lose confidence in our reported financial information, leading to a decline in our stock price. We cannot assure you that we will not discover additional weaknesses in our internal control over financial reporting.
Further, we may be the subject of negative publicity focusing on the restatement of our previously issued financial results and related matters, and may be adversely impacted by negative reactions from our stockholders, creditors or others with which we do business. This negative publicity may impact our ability to attract and retain customers, employees and vendors. The occurrence of any of the foregoing could harm our business and reputation and cause the price of our securities to decline.
In addition, beginning with our Annual Report on Form 10-K for the fiscal year ending March 31, 2016, we will be required to furnish a report by management, and our independent registered public accounting firm will be required to provide an attestation report, on the effectiveness of our internal control over financial reporting pursuant to Section 404 of the Sarbanes-Oxley Act of 2002. At such time, if we are unable to comply with the requirements of Section 404 in a timely manner or assert that our internal control over financial reporting is effective, or if our independent registered public accounting firm is unable to provide us with an unqualified report regarding the effectiveness of our internal control over financial reporting, investors could lose confidence in the reliability of our financial statements. This could result in a decrease in the value of our common stock. Failure to comply with the Sarbanes-Oxley Act of 2002 could potentially subject us to sanctions or investigations by the SEC, NYSE, or other regulatory authorities.
Furthermore, as we grow our business, our disclosure controls and internal controls will become more complex, and we may require significantly more resources to ensure the effectiveness of these controls. If we are unable to continue upgrading our financial and management controls, reporting systems, information technology and procedures in a timely and effective fashion, additional management and other resources may need to be devoted to assist in compliance with the disclosure and financial reporting requirements and other rules that apply to reporting companies, which could adversely affect our business, financial position and results of operations.
19
Table of Contents
The restatement of our previously issued financial results has resulted in private litigation as well as investigation by the SEC, and could result in additional litigation, government investigations and enforcement actions.
We are subject to a securities class action litigation suit currently pending in the United States District Court for the Southern District of New York as a result of the restatement of our previously issued financial statements. In addition, the Company has received document subpoenas from the SEC’s Division of Enforcement pursuant to a formal investigation. Both the securities class action litigation suit and SEC investigation are further described below under “Item 3 Legal Proceedings.” We could also become subject to additional litigation or government investigations and enforcement actions arising out of our restated financial statements and delinquent Exchange Act filings.
To date our management has devoted significant time and attention related to these matters, and we may be required to devote even more time and attention to such matters in the future, and these and any additional matters that arise could have a material adverse impact on our results of operations, financial condition, liquidity and cash flows. While we cannot estimate our potential exposure in these matters at this time, we have already expended significant amounts investigating the claims underlying the class action litigation and SEC document production and expect to continue to need to expend significant amounts to defend such litigation and respond to the SEC investigation. Although we maintain insurance that may provide coverage for some or all of these expenses, and we have given notice to our insurers of the claims, there is risk that the insurers will rescind the policies, that some or all of the claims will not be covered by such policies, or that, even if covered, our ultimate liability will exceed the available insurance. For additional discussion of these matters, see “Note 15. Commitments and Contingencies — Litigation” to our audited consolidated financial statements included in “Item 8. Financial Statements and Supplementary Data” of this Form 10-K.
The New York Stock Exchange could commence procedures to delist our common stock.
As a result of our failure to timely file this Annual Report on Form 10-K with the SEC, as previously disclosed, on July 15, 2015, we received a notice from the NYSE informing us that we were not in compliance with the NYSE’s continued listing requirements under the timely filing criteria outlined in Section 802.01E of the NYSE Listed Company Manual and that we were subject to the procedures set forth in the NYSE’s listing standards related to late filings. Under the NYSE rules the Company had six months from July 14, 2015 to file its delinquent Exchange Act reports with the SEC, including this Annual Report on Form 10-K, subject to up to an additional six-month extension in the discretion of the NYSE. On January 14, 2016, the NYSE granted us an extension until April 15, 2016 to file our delinquent reports, including this Annual Report on Form 10-K.
The listing standards of the NYSE provide the NYSE with broad discretion regarding delisting matters. One of the factors described in the NYSE’s listing standards that could lead to a company’s delisting is the failure of the company to make timely, adequate and accurate disclosures of information to its stockholders and the investing public. While we have filed this Annual Report on Form 10-K including the restatement of our previously issued consolidated financial statements for the fiscal years ended March 31, 2014 and 2013, as well as including restated information regarding first three quarters of fiscal year 2015 and each quarter in fiscal year 2014, we are also required to file our currently delinquent Quarterly Reports on Form 10-Qs for the quarters ended June 30, 2015, September 30, 2015 and December 31, 2015, (collectively, the “Fiscal 2016 Quarterly Reports”), and therefore we will continue to be subject to the procedures set forth in the NYSE’s listing standards related to late filings and subject to the risk of delisting. We cannot assure you that the NYSE will grant us a further extension, if necessary, or otherwise not commence delisting procedures with respect to our common stock as a result of those and other factors related to delinquent reports.
If our common stock were delisted, there could be no assurance whether or when it would again be listed for trading on NYSE or any other exchange. Further, the market price of our shares might decline and become more volatile, and our shareholders may find that their ability to trade in our stock would be adversely affected.
20
Table of Contents
Furthermore, institutions whose charters do not allow them to hold securities in unlisted companies might sell our shares, which could have a further adverse effect on the price of our stock.
Our failure to prepare and timely file our periodic reports with the SEC limits our access to the public markets to raise debt or equity capital, and could have negative consequences related to our financing agreements.
We did not file this Annual Report on Form 10-K within the timeframe required by the SEC. We also have not yet filed our Fiscal 2016 Quarterly Reports and therefore those filings are delinquent. As a result of our late filings, we may be limited in our ability to access the public markets to raise debt or equity capital, which could prevent us from pursuing transactions or implementing business strategies that we believe would be beneficial to our business. We are ineligible to use shorter and less costly filings, such as Form S-3, to register our securities for sale for a period of 12 months following the month in which we regain compliance with our SEC reporting obligations. We may be able to use Form S-1 to register a sale of our stock to raise capital or complete acquisitions, but doing so would likely increase transaction costs and adversely impact our ability to raise capital or complete acquisitions of other companies in a timely manner.
In addition, from July 2015 through February 2016, the Company obtained various consents from the lenders and further amended the Bank Term Loans and Senior Notes. These consents and the additional amendments had the effect of: i) extending the time for delivery of our fiscal year 2015 audited financial statements and the fiscal year end 2016 quarterly financial statements to April 1, 2016, whereby an event of default was waived as long as those financial statements were delivered by that date, ii) further modified certain definitions applicable to the Company’s affirmative and negative financial covenants, including with respect to the treatment of the costs related to the Company’s restatement for purposes of the calculation of the minimum fixed charge coverage ratio and the maximum leverage ratio, and iii) permitted the Company’s payment of quarterly dividends in June, August and December 2015 as well as a dividend for preferred shares held in the ESOP.
Risks Relating to Our Business
Fluctuations in the price and availability of resins, our principal raw materials, and our inability to obtain adequate supplies of resins from suppliers and pass on resin price increases to customers could adversely affect our business, financial condition, results of operations and cash flows.
The principal raw materials that we use in our high performance thermoplastic corrugated pipe and Allied Products are virgin and recycled resins. Our ability to operate profitably depends, to a large extent, on the markets for these resins. In particular, as resins are derived either directly or indirectly from crude oil derivatives and natural gas liquids, resin prices fluctuate substantially as a result of changes in crude oil and natural gas prices, changes in existing processing capabilities and the capacity of resin suppliers. The petrochemical industry historically has been cyclical and volatile. The cycles are generally characterized by periods of tight supply, followed by periods of oversupply, primarily resulting from significant capacity additions. For example, resin prices have increased since 2010 due to increased demand in the broader economy. Unanticipated changes in and disruptions to existing petrochemical capacities could also significantly increase resin prices, often within a short period of time, even if crude oil and natural gas prices remain low.
Our ability to offer our core products depends on our ability to obtain adequate resins, which we purchase directly from major petrochemical and chemical suppliers. We have managed a formal resin price risk management program since early in 2010 that entails both physical fixed price and volume contracts along with financial hedges which are designed to apply to a significant portion of our annual virgin resin purchases. In conjunction with our resin price risk management program, we maintain supply agreements with our major resin suppliers that provide multi-year terms and volumes that are in excess of our projected consumption. For our polypropylene virgin resin price exposure, we utilize financial hedges of propylene as a proxy for polypropylene. Historically, the month to month change in market based pricing has been very similar between propylene and
21
Table of Contents
polypropylene. The loss of, or substantial decrease in the availability of, raw materials from our suppliers, or the failure by our suppliers to continue to provide us with raw materials on commercially reasonable terms, or at all, could adversely affect our business, financial condition, results of operations and cash flows. In addition, supply interruptions could arise from labor disputes or weather conditions affecting supplies or shipments, transportation disruptions or other factors beyond our control. An extended disruption in the timely availability of raw materials from our key suppliers would result in a decrease in our revenues and profitability.
Our ability to maintain profitability heavily depends on our ability to pass through to our customers the full amount of any increase in raw material costs, which are a large portion of our overall product costs. We may be unable to do so in a timely manner, or at all, due to competition in the markets in which we operate. In addition, certain of our largest customers historically have exerted significant pressure on their outside suppliers to keep prices low because of their market share. If increases in the cost of raw materials cannot be passed on to our customers, or the duration of time associated with a pass through becomes extended, our business, financial condition, results of operations and cash flows will be adversely affected.
Any disruption or volatility in general business and economic conditions in the markets in which we operate could have a material adverse effect on the demand for our products and services.
The markets in which we operate are sensitive to general business and economic conditions in the United States and worldwide, including availability of credit, interest rates, fluctuation in capital and business and consumer confidence. The capital and credit markets have in recent years been experiencing significant volatility and disruption. These conditions, combined with price fluctuations in crude oil derivatives and natural gas liquids, declining business and consumer confidence and increased unemployment, precipitated an economic slowdown and severe recession in recent years. The difficult conditions in these markets and the overall economy affect our business in a number of ways. For example:
| • | The slowdown and volatility of the United States economy in general is having an adverse effect on our sales that are dependent on the non-residential construction market. According to the U.S. Census Bureau, actual non-residential construction put-in-place in the United States during 2014 remained 14.7% lower than 2008 levels. Continued uncertainty about current economic conditions will continue to pose a risk to our business units that serve the non-residential construction market, as participants in this industry may postpone spending in response to tighter credit, negative financial news and/or declines in income or asset values, which could have a continued material adverse effect on the demand for our products and services. |
| • | The homebuilding industry has undergone a significant decline from its peak in 2005. While new housing starts demonstrated an annual growth rate of 13.8% from 2010 to 2014, current levels remain substantially below the long-term average of 1.5 million starts since the U.S. Census Bureau began reporting the data in 1959. The mortgage markets continue to experience disruption and reduced availability of mortgages for potential homebuyers due to more restrictive standards to qualify for mortgages, including with respect to new home construction loans. The multi-year downturn in the homebuilding industry resulted in a substantial reduction in demand for our products and services in this market, which in turn had a significant adverse effect on our financial condition and results of operations during the period from 2008 to 2014, as compared to peak levels. |
| • | Our business depends to a great extent upon general activity levels in the agriculture market. Changes in corn production, soybean production, farm income, farmland value and the level of farm output in the geographic locations in which we operate are all material factors that could adversely affect the agriculture market and result in a decrease in the amount of products that our customers purchase. The nature of the agriculture market is such that a downturn in demand can occur suddenly, resulting in excess inventories, un-utilized production capacity and reduced prices for pipe products. These downturns may be prolonged and our revenue and profitability would be harmed. |
| • | Demand for our products and services depend to a significant degree on spending on infrastructure, which is inherently cyclical. Infrastructure spending is affected by a variety of factors beyond our |
22
Table of Contents
| control, including interest rates, availability and commitment of public funds for municipal spending and highway spending and general economic conditions. Our products sales may be adversely impacted by budget cuts by governments, including as a result of lower than anticipated tax revenues. |
All of our markets are sensitive to changes in the broader economy. Downturns or lack of substantial improvement in the economy in any region in which we operate have adversely affected and could continue to adversely affect our business, financial condition and results of operations. While we operate in many markets, our business is particularly impacted by changes in the economies of the United States, Canada and Mexico, which represented approximately 87.1%, 5.4% and 6.2%, respectively, of our net sales for fiscal year 2015 and collectively represented approximately 98.7% of our net sales for fiscal year 2015.
We cannot predict the duration of current economic conditions, or the timing or strength of any future recovery of activities in our markets. Continued weakness in the market in which we operate could have a material adverse effect on our business, financial condition, results of operations and cash flows. We may have to close under-performing facilities from time to time as warranted by general economic conditions and/or weakness in the markets in which we operate. In addition to a reduction in demand for our products, these factors may also reduce the price we are able to charge for our products and restrict our ability to pass raw material cost increases to our customers. This, combined with an increase in excess capacity, will negatively impact our profitability, cash flows and our financial condition, generally.
Demand for our products and services could decrease if we are unable to compete effectively, and our success depends largely on our ability to convert current demand for competitive products into demand for our products.
We compete with both manufacturers of high performance thermoplastic corrugated pipe and manufacturers of alternative products, such as concrete, steel and PVC pipe products, on the basis of a number of considerations, including product characteristics such as durability, design, ease of installation, price on a price-to-value basis and service. In particular, we compete on a global, national and local basis with pipe products made of traditional materials which our high performance thermoplastic corrugated pipe products are designed to replace. For example, our N-12 and SaniTite HP products face competition from concrete, steel and PVC pipe products in the small- and large-diameter size segments of the market.
Our ability to successfully compete and grow depends largely on our ability to continue to convert the current demand for concrete, steel and PVC pipe products into demand for our high performance thermoplastic corrugated pipe and Allied Products. Our thermoplastic pipe typically has an installed cost advantage of approximately 20% over concrete pipe. However, depending upon certain factors such as the size of the pipe, the geography of a particular location and then-existing raw material costs, the initial cost of our thermoplastic pipe may be higher than the initial cost of alternative products such as concrete, steel and PVC pipe products. To increase our market share, we will need to increase material conversion by educating our customers about the value of our products in comparison to existing alternatives, particularly on an installed cost basis, working with government agencies to expand approvals for our products and working with civil engineering firms which may influence the specification of our products on construction projects. No assurance can be given that our efforts to increase or maintain the current rate of material conversion will be successful, and our failure to do so would have a material adverse effect on our business, financial condition, results of operations and cash flows.
We also expect that new competitors may develop over time. No assurance can be given that we will be able to respond effectively to such competitive pressures. Increased competition by existing and future competitors could result in reductions in sales, prices, volumes and gross margins that would materially adversely affect our business, financial condition, results of operations and cash flows. Furthermore, our success will depend, in part, on our ability to maintain our market share and gain market share from competitors.
Certain of our competitors have financial and other resources that are greater than ours and may be better able to withstand price competition, especially with respect to traditional products. In addition, consolidation by
23
Table of Contents
industry participants could result in competitors with increased market share, larger customer bases, greater diversified product offerings and greater technological and marketing expertise, which would allow them to compete more effectively against us. Moreover, our competitors may develop products that are superior to our products or may adapt more quickly to new technologies or evolving customer requirements. Technological advances by our competitors may lead to new manufacturing techniques and make it more difficult for us to compete. In many markets in which we operate there are no significant entry barriers that would prevent new competitors from entering the market, especially on the local level, or existing competitors from expanding in the market. In addition, because we do not have long-term arrangements with many of our customers, these competitive factors could cause our customers to cease purchasing our products.
In addition, our contracts with municipalities are often awarded and renewed through periodic competitive bidding. We may not be successful in obtaining or renewing these contracts on financially attractive terms or at all, which could adversely affect our business, financial condition, results of operations and cash flows.
Our results of operations could be adversely affected by the effects of weather.
Although weather patterns affect our operating results throughout the year, adverse weather historically has reduced construction activity in our third and fourth fiscal quarters. In contrast, our highest volume of net sales historically has occurred in our first and second fiscal quarters.
Most of our business units experience seasonal variation as a result of the dependence of our customers on suitable weather to engage in construction projects. Generally, during the winter months, construction activity declines due to inclement weather, frozen ground and shorter daylight hours. For example, during the spring of 2013 and 2014, the extremely cold weather significantly reduced the level of construction activities in the United States, thereby impacting our revenues. In addition, to the extent that hurricanes, severe storms, floods, other natural disasters or similar events occur in the geographic regions in which we operate, our results of operations may be adversely affected. For example, Hurricane Andrew in Florida in 1992 and the extensive flooding of the Mississippi River in 2011 resulted in temporary interruption in business activity in these areas. We anticipate that fluctuations of our operations results from period to period due to seasonality will continue in the future.
The loss of any of our significant customers could adversely affect our business, financial condition, results of operations and cash flows.
Our 10 largest customers in the United States generated approximately 36.8% of our domestic net sales in fiscal year 2015. We cannot guarantee that we will maintain or improve our relationships with these customers or that we will continue to supply these customers at historical levels. Because we do not have long-term arrangements with many of our customers, such customers may cease purchasing our products without notice or upon short notice to us. During the economic downturn, some of our customers reduced their operations. For example, some homebuilder customers exited or severely curtailed building activity in certain of our markets. There is no assurance that our customers will increase their activity level or return it to historic levels. A slow economic recovery could continue to have material adverse effect on our business, financial condition, results of operations and cash flows.
In addition, consolidation among customers could also result in a loss of some of our present customers to our competitors. The loss of one or more of our significant customers, a significant customer’s decision to purchase our products in significantly lower quantities than they have in the past, or deterioration in our relationship with any of them could have a material adverse effect on our business, financial condition, results of operations and cash flows.
24
Table of Contents
The majority of our net sales are credit sales which are made primarily to customers whose ability to pay is dependent, in part, upon the economic strength of the industry and geographic areas in which they operate, and the failure to collect monies owed from customers could adversely affect our financial condition.
The majority of our net sales volume is facilitated through the extension of credit to our customers whose ability to pay is dependent, in part, upon the economic strength of the industry in the areas where they operate. Our business units offer credit to customers, either through unsecured credit that is based solely upon the creditworthiness of the customer, or secured credit for materials sold for a specific job where the security lies in lien rights associated with the material going into the job. The type of credit offered depends both on the financial strength of the customer and the nature of the business in which the customer is involved. End users, resellers and other non-contractor customers generally purchase more on unsecured credit than secured credit. The inability of our customers to pay off their credit lines in a timely manner, or at all, would adversely affect our business, financial condition, results of operations and cash flows. Furthermore, our collections efforts with respect to non-paying or slow-paying customers could negatively impact our customer relations going forward.
Because we depend on the creditworthiness of certain of our customers, if the financial condition of our customers declines, our credit risk could increase. Significant contraction in our markets, coupled with tightened credit availability and financial institution underwriting standards, could adversely affect certain of our customers. Should one or more of our larger customers declare bankruptcy, it could adversely affect the collectability of our accounts receivable, bad debt reserves and net income.
Our international operations expose us to political, economic and regulatory risks not normally faced by businesses that operate only in the United States.
International operations are exposed to different political, economic and regulatory risks that are not faced by businesses that operate solely in the United States. Some of our operations are outside the United States, with manufacturing and distribution facilities in Canada and several Latin American countries. Our international operations are subject to risks similar to those affecting our operations in the United States in addition to a number of other risks, including:
| • | difficulties in enforcing contractual and intellectual property rights; |
| • | impositions or increases of withholding and other taxes on remittances and other payments by subsidiaries and affiliates; |
| • | exposure to different legal standards; |
| • | fluctuations in currency exchange rates; |
| • | impositions or increases of investment and other restrictions by foreign governments; |
| • | the requirements of a wide variety of foreign laws; |
| • | political and economic instability; |
| • | war; and |
| • | difficulties in staffing and managing operations, particularly in remote locations. |
As a result of our international operations we could be adversely affected by violations of the U.S. Foreign Corrupt Practices Act and similar foreign anti-corruption laws.
The U.S. Foreign Corrupt Practices Act (“FCPA”) and similar foreign anti-corruption laws generally prohibit companies and their intermediaries from making improper payments or providing anything of value to influence foreign government officials for the purpose of obtaining or retaining business or obtaining an unfair advantage, and generally require companies to maintain accurate books and records and internal controls, including at foreign controlled subsidiaries. Recent years have seen a substantial increase in the global
25
Table of Contents
enforcement of anti-corruption laws, with more frequent voluntary self-disclosures by companies, aggressive investigations and enforcement proceedings by both the U.S. Department of Justice and the SEC resulting in record fines and penalties, increased enforcement activity by non-U.S. regulators, and increases in criminal and civil proceedings brought against companies and individuals.
We have operations in Canada as well as existing joint ventures in Mexico, Central America and South America. Our internal policies provide for compliance with all applicable anti-corruption laws for both us and for our joint venture operations. Our continued operation and expansion outside the United States, including in developing countries, could increase the risk of such violations in the future. Despite our training and compliance programs, we cannot assure you that our internal control policies and procedures will always protect us from unauthorized reckless or criminal acts committed by our employees, agents or joint venture partners.
Furthermore, as described below under “Item 9A. Controls and Procedures,” management has identified certain weaknesses in the Company’s internal control over financial reporting, which weaknesses included certain control deficiencies related to the ADS Mexicana control environment, as well as the ADS Mexicana revenue recognition cut-off practices. Certain of the matters related to the ADS Mexicana control environment were already the subject of investigation by third party advisors to the Audit Committee, as described in Item 9A below. Although such matters have resulted in a determination of material weakness, neither the Audit Committee’s advisors in the course of their investigation nor management have concluded whether the weaknesses in the ADS Mexicana control environment, the ADS Mexicana revenue recognition cut-off practices, or any other material weaknesses of the Company as described in Item 9A, would result in an ultimate determination by the SEC or any other applicable regulatory agency that the Company has not complied with the books and records and internal control provisions of the FCPA as set forth in sections 13(b)(2)(A) and 13(b)(2)(B) of the Exchange Act. In the event that we believe or have reason to believe that our employees, agents or joint venture partners have or may have violated applicable anti-corruption laws, including the FCPA, we may be required to investigate or have outside counsel investigate the relevant facts and circumstances, which can be expensive and require significant time and attention from senior management. A finding that the Company or its affiliates have violated any of these laws may result in severe criminal or civil sanctions, which could disrupt our business and result in a material adverse effect on our reputation, financial condition, results of operations and cash flows.
Conducting a portion of our operations through joint ventures exposes us to risks and uncertainties, many of which are outside of our control.
With respect to our existing joint ventures in Mexico, Central America, North America and South America, any differences in views among the joint venture participants may result in delayed decisions or in failures to agree on major issues. We also cannot control the actions of our joint venture partners, including any nonperformance, default or bankruptcy of our joint venture partners. As a result, we may be unable to control the quality of products produced by the joint ventures or achieve consistency of product quality as compared with our other operations. In addition to net sales and market share, this may have a material negative impact on our brand and how it is perceived thereafter. Moreover, if our partners also fail to invest in the joint venture in the manner that is anticipated or otherwise fail to meet their contractual obligations, the joint ventures may be unable to adequately perform and conduct their respective operations, requiring us to make additional investments or perform additional services to ensure the adequate performance and delivery of products and/or services to the joint ventures’ customers, which could have a material adverse effect on our business, financial condition, results of operations and cash flows.
We may not be able to successfully expand into new product markets.
We may expand into new product markets based on our existing manufacturing, design and engineering capabilities and services. Our business depends in part on our ability to identify future products and product lines that complement existing products and product lines and that respond to our customers’ needs. We may not be
26
Table of Contents
able to compete effectively unless our product selection keeps up with trends in the markets in which we compete or trends in new products. In addition, our ability to integrate new products and product lines into our distribution network could impact our ability to compete. Furthermore, the success of new products and new product lines will depend on market demand and there is a risk that new products and new product lines will not deliver expected results, which could negatively impact our future sales and results of operations.
We may not be able to successfully expand into new geographic markets.
Our expansion into new geographic markets may present competitive, distribution and regulatory challenges that differ from current ones. We may be less familiar with the target customers and may face different or additional risks, as well as increased or unexpected costs, compared to existing operations. Expansion into new geographic markets may also bring us into direct competition with companies with whom we have little or no past experience as competitors. To the extent we rely upon expansion into new geographic markets for growth and do not meet the new challenges posed by such expansion, our future sales growth could be negatively impacted, our operating costs could increase, and our business operations and financial results could be adversely affected.
We may not achieve the acquisition component of our growth strategy.
Acquisitions may continue to be an important component of our growth strategy; however, there can be no assurance that we will be able to continue to grow our business through acquisitions as we have done historically or that any businesses acquired will perform in accordance with expectations or that business judgments concerning the value, strengths and weaknesses of businesses acquired will prove to be correct. Future acquisitions may result in the incurrence of debt and contingent liabilities, an increase in interest expense and amortization expense and significant charges relative to integration costs. Our strategy could be impeded if we do not identify suitable acquisition candidates and our financial condition and results of operations will be adversely affected if we are unable to properly evaluate acquisition targets.
Acquisitions involve a number of special risks, including:
| • | problems implementing disclosure controls and procedures for the newly acquired business; |
| • | unforeseen difficulties extending internal control over financial reporting and performing the required assessment at the newly acquired business; |
| • | potential adverse short-term effects on operating results through increased costs or otherwise; |
| • | diversion of management’s attention and failure to recruit new, and retain existing, key personnel of the acquired business; |
| • | failure to successfully implement infrastructure, logistics and systems integration; |
| • | our business growth could outpace the capability of our systems; and |
| • | the risks inherent in the systems of the acquired business and risks associated with unanticipated events or liabilities, any of which could have a material adverse effect on our business, financial condition and results of operations. |
In addition, we may not be able to obtain financing necessary to complete acquisitions on attractive terms or at all.
Increased fuel and energy prices, and our inability to obtain sufficient quantities of fuel to operate our in-house delivery fleet, could adversely affect our business, financial condition, results of operations and cash flows.
Energy and petroleum prices have fluctuated significantly in recent years. Prices and availability of petroleum products are subject to political, economic and market factors that are outside our control. Political events in petroleum-producing regions as well as hurricanes and other weather-related events may cause the price of fuel to increase.
27
Table of Contents
We consume a large amount of energy and petroleum products in our operations, including the manufacturing process and delivering a significant volume of products to our customers by our in-house fleet. While we have implemented a diesel hedging program covering approximately 60% of the projected diesel fuel consumption associated with our in-house fleet to mitigate against higher fuel prices, our operating profit will be adversely affected if we are unable to obtain the energy and fuel we require or to fully offset the anticipated impact of higher energy and fuel prices through increased prices or surcharges to our customers or through other hedging strategies. If shortages occur in the supply of energy or necessary petroleum products and we are not able to pass along the full impact of increased energy or petroleum prices to our customers, our business, financial condition, results of operations and cash flows would be adversely affected.
We have substantial fixed costs and, as a result, our income from operations is sensitive to changes in our net sales.
A significant portion of our expenses are fixed costs (including personnel). For fiscal years 2015, 2014 and 2013, domestic fixed costs were 25.5%, 25.8% and 27.0%, respectively, as a percentage of domestic net sales. Fixed costs do not fluctuate with net sales. Consequently, a percentage decline in our net sales could have a greater percentage effect on our income from operations if we do not act to reduce personnel or take other cost reduction actions. Any decline in our net sales would cause our profitability to be adversely affected. Moreover, a key element of our strategy is managing our assets, including our substantial fixed assets, more effectively, including through sales or other disposals of excess assets. Our failure to rationalize our fixed assets in the time, and within the costs, we expect could have a material adverse effect on our business, financial condition, results of operations and cash flows.
Our business is subject to risks associated with manufacturing processes.
We internally manufacture our own products at our facilities. While we maintain insurance covering our manufacturing and production facilities and have significant flexibility to manufacture and ship our own products from various facilities, a catastrophic loss of the use of certain of our facilities due to accident, fire, explosion, labor issues, weather conditions, other natural disaster or otherwise, whether short or long-term, could have a material adverse effect on our business, financial condition, results of operations and cash flows.
Unexpected failures of our equipment and machinery may result in production delays, revenue loss and significant repair costs, injuries to our employees, and customer claims. Any interruption in production capability may limit our ability to supply enough products to customers and may require us to make large capital expenditures to remedy the situation, which could have a negative impact on our profitability and cash flows. Our business interruption insurance may not be sufficient to offset the lost revenues or increased costs that we may experience during a disruption of our operations.
We provide product warranties that could expose us to claims, which could in turn damage our reputation and adversely affect our business, financial condition, results of operations and cash flows.
We generally provide limited product warranties on our products against defects in materials and workmanship in normal use and service. Most of our pipe products have a warranty that is not limited in duration. The warranty period for other products such as our StormTech chambers, our Inserta Tee product line, our BaySaver product line and our FleXstorm inlet protection systems is generally one year. Estimating the required warranty reserves requires a high level of judgment. Management estimates warranty reserves, based in part upon historical warranty costs, as a proportion of sales by product line. Management also considers various relevant factors, including its stated warranty policies and procedures, as part of its evaluation of its liability. Because warranty issues may surface later in the product life cycle, management continues to review these estimates on a regular basis and considers adjustments to these estimates based on actual experience compared to historical estimates. Although management believes that our warranty reserves as of March 31, 2015 are adequate, actual results may vary from these estimates.
28
Table of Contents
The nature of our business exposes us to construction defect and product liability claims as well as other legal proceedings.
We are exposed to construction defect and product liability claims relating to our various products if our products do not meet customer expectations. Such liabilities may arise out of the quality of raw materials we purchase from third-party suppliers, over which we do not have direct control. We also operate a large fleet of trucks and other vehicles and therefore face the risk of traffic accidents.
While we currently maintain insurance coverage to address a portion of these types of liabilities, we cannot make assurances that we will be able to obtain such insurance on acceptable terms in the future, if at all, or that any such insurance will provide adequate coverage against potential claims. Further, while we intend to seek indemnification against potential liability for products liability claims from relevant parties, we cannot guarantee that we will be able to recover under any such indemnification agreements. Product liability claims can be expensive to defend and can divert the attention of management and other personnel for significant time periods, regardless of the ultimate outcome. An unsuccessful product liability defense could be highly costly and accordingly result in a decline in revenues and profitability. In addition, even if we are successful in defending any claim relating to the products we distribute, claims of this nature could negatively impact customer confidence in us and our products.
From time to time, we are also involved in government inquiries and investigations, as well as consumer, employment, tort proceedings and other litigation. We cannot predict with certainty the outcomes of these legal proceedings and other contingencies, including potential environmental remediation and other proceedings commenced by government authorities. The outcome of some of these legal proceedings and other contingencies could require us to take actions which would adversely affect our operations or could require us to pay substantial amounts of money. Additionally, defending against these lawsuits and proceedings may involve significant expense and diversion of management’s attention and resources from other matters.
Because our business is working capital intensive, we rely on our ability to manage our supply purchasing and customer credit policies.
Our operations are working capital intensive, and our inventories, accounts receivable and accounts payable are significant components of our net asset base. We manage our inventories and accounts payable through our purchasing policies and our accounts receivable through our customer credit policies. If we fail to adequately manage our supply purchasing or customer credit policies, our working capital and financial condition may be adversely affected.
Our operations are affected by various laws and regulations in the markets in which we operate, and our failure to obtain or maintain approvals by municipalities, state departments of transportation, engineers and developers may affect our results of operations.
Our operations are principally affected by various statutes, regulations and laws in the United States, Canada and Latin America. While we are not engaged in a regulated industry, we are subject to various laws applicable to businesses generally, including laws affecting land usage, zoning, the environment, health and safety, transportation, labor and employment practices (including pensions), competition, immigration and other matters. Additionally, approvals by municipalities, state departments of transportation, engineers and developers may affect the products our customers are allowed to use, and, consequently, failure to obtain or maintain such approvals may affect the saleability of our products. Building codes may also affect the products our customers are allowed to use, and, consequently, changes in building codes may also affect the saleability of our products. Changes in applicable regulations governing the sale of some of our products could increase our costs of doing business. In addition, changes to applicable tax laws and regulations could increase our costs of doing business. We cannot provide assurance that we will not incur material costs or liabilities in connection with regulatory requirements.
29
Table of Contents
We deliver products to many of our customers through our own fleet of vehicles. The U.S. DOT regulates our operations in domestic interstate commerce. We are subject to safety requirements governing interstate operations prescribed by the U.S. DOT. Vehicle dimensions and driver hours of service also remain subject to both federal and state regulation. More restrictive limitations on vehicle weight and size, trailer length and configuration, or driver hours of service could increase our costs, which, if we are unable to pass these cost increases on to our customers, would reduce our gross margins and net income (loss) and increase our selling, general and administrative expenses.
We cannot predict whether future developments in law and regulations concerning our business units will affect our business, financial condition and results of operations in a negative manner. Similarly, we cannot assess whether our business units will be successful in meeting future demands of regulatory agencies in a manner which will not materially adversely affect our business, financial condition, results of operations and cash flows.
Interruptions in the proper functioning of information technology systems could disrupt operations and cause unanticipated increases in costs, decreases in revenues, or both.
Because we use our information technology (“IT”) systems to, among other things, manage inventories and accounts receivable, make purchasing decisions and monitor our results of operations, the proper functioning of our IT systems is important to the successful operation of our business. Although our IT systems are protected through physical and software safeguards and remote processing capabilities exist, IT systems are still vulnerable to natural disasters, power losses, unauthorized access, telecommunication failures and other problems. If critical IT systems fail, or are otherwise unavailable, our ability to process orders, track credit risk, identify business opportunities, maintain proper levels of inventories, collect accounts receivable and pay expenses and otherwise manage our business units would be adversely affected.
Management uses IT systems to support decision making and to monitor business performance. We may fail to generate accurate financial and operational reports essential for making decisions at various levels of management. Failure to adopt systematic procedures to maintain quality IT general controls could disrupt our business. In addition, if we do not maintain adequate controls such as reconciliations, segregation of duties and verification to prevent errors or incomplete information, our ability to operate our business could be limited.
Third-party service providers are responsible for managing a significant portion of our IT systems. Our business and results of operations may be adversely affected if the third-party service provider does not perform satisfactorily. Additionally, there is no guarantee that we will continue to have access to these third-party IT systems after our current license agreements expire, and, if we do not obtain licenses to use effective replacement IT systems, our financial condition and operating results could be adversely affected.
The implementation of our technology initiatives could disrupt our operations in the near term, and our technology initiatives might not provide the anticipated benefits or might fail.
We have made, and will continue to make, significant technology investments in each of our business units and in our administrative functions. Our technology initiatives are designed to streamline our operations to allow our associates to continue to provide high quality service to our customers and to provide our customers a better experience, while improving the quality of our internal control environment. The cost and potential problems and interruptions associated with the implementation of our technology initiatives could disrupt or reduce the efficiency of our operations in the near term. In addition, our new or upgraded technology might not provide the anticipated benefits, it might take longer than expected to realize the anticipated benefits or the technology might fail altogether.
30
Table of Contents
We may experience a failure in or breach of our operational or information security systems, or those of our third-party service providers, as a result of cyber-attacks or information security breaches.
Information security risks have generally increased in recent years because of the proliferation of new technologies and the increased sophistication and activities of perpetrators of cyber-attacks. A failure in or breach of our operational or information security systems, or those of our third-party service providers, as a result of cyber-attacks or information security breaches could disrupt our business, result in the disclosure or misuse of confidential or proprietary information, damage our reputation, increase our costs and/or cause losses. As a result, cyber security and the continued development and enhancement of the controls and processes designed to protect our systems, computers, software, data and networks from attack, damage or unauthorized access remain a priority for us. As cyber threats continue to evolve, we may be required to expend additional significant resources to continue to enhance our information security measures and/or to investigate and remediate any information security vulnerabilities.
If we become subject to material liabilities under our self-insured programs, our financial results may be adversely affected.
We provide workers’ compensation, automobile and product/general liability coverage through a high deductible insurance program. In addition, we provide medical coverage to some of our employees through a self-insured preferred provider organization. Though we believe that we have adequate insurance coverage in excess of self-insured retention levels, our business, financial condition, results of operations and cash flows may be adversely affected if the number and severity of insurance claims increases.
We may see increased costs arising from health care reform.
In March 2010, the United States government enacted comprehensive health care reform legislation which, among other things, includes guaranteed coverage requirements, eliminates pre-existing condition exclusions and annual and lifetime maximum limits, restricts the extent to which policies can be rescinded and imposes new and significant taxes on health insurers and health care benefits. The legislation imposes implementation effective dates which began in 2010 and extend through 2020, and many of the changes require additional guidance from government agencies or federal regulations. Therefore, due to the phased-in nature of the implementation and the lack of interpretive guidance, it is difficult to determine at this time what impact the health care reform legislation will have on our financial results. Possible adverse effects of the health care reform legislation include increased costs, exposure to expanded liability and requirements for us to revise ways in which we provide healthcare and other benefits to our employees. As a result, our business, financial condition, results of operations and cash flows could be materially adversely affected.
Our success depends upon our ability to control labor costs and to attract, train and retain highly-qualified employees and key personnel.
To be successful, we must attract, train and retain a large number of highly qualified employees while controlling related labor costs. Our ability to control labor costs is subject to numerous external factors, including prevailing wage rates and health and other insurance costs. We compete with other businesses for these employees and invest significant resources in training and motivating them. There is no assurance that we will be able to attract or retain highly-qualified employees in the future, including, in particular, those employed by companies we acquire. None of our domestic employees are currently covered by collective bargaining or other similar labor agreements. However, if a number of our employees were to unionize, including in the wake of any future legislation that makes it easier for employees to unionize, the effect on us may be negative. Any inability by us to negotiate acceptable new contracts under any collective bargaining arrangements could cause strikes or other work stoppages, and new contracts could result in increased operating costs. If any such strikes or other work stoppages occur, or if employees become represented by a union, we could experience a disruption of our operations and higher labor costs. Labor relations matters affecting our suppliers of products and services could also adversely affect our business from time to time.
31
Table of Contents
In addition, our business results of operations depend largely upon our chief executive officer and senior management team as well as our plant managers and sales personnel, including those of companies recently acquired, and their experience, knowledge of local market dynamics and specifications and long-standing customer relationships. We customarily sign executive responsibility agreements with certain key personnel who are granted restricted stock or stock options under our employee incentive compensation programs, which contain confidentiality and non-competition provisions. However, in certain jurisdictions, non-competition provisions may not be enforceable or may not be enforceable to their full extent. Our inability to retain or hire qualified plant managers or sales personnel at economically reasonable compensation levels would restrict our ability to grow our business, limit our ability to continue to successfully operate our business and result in lower operating results and profitability.
If we are unable to protect our intellectual property rights, or we infringe on the intellectual property rights of others, our ability to compete could be negatively impacted.
Our ability to compete effectively depends, in part, upon our ability to protect and preserve proprietary aspects of our intellectual property, which we attempt to do, both in the United States and in foreign countries, through a combination of patent, trademark, copyright and trade secret laws, as well as licensing agreements and third-party nondisclosure and assignment agreements. Because of the differences in foreign trademark, patent and other laws concerning proprietary rights, our intellectual property rights may not receive the same degree of protection in foreign countries as they would in the United States. Our failure to obtain or maintain adequate protection of our intellectual property rights for any reason could have a material adverse effect on our business, results of operations and financial condition.
We have applied for patent protection relating to certain existing and proposed products, processes and services. While we generally apply for patents in those countries where we primarily intend to make, have made, use, or sell patented products, we may not accurately predict all of the countries where patent protection will ultimately be desirable. If we fail to timely file a patent application in any such country, we may be precluded from doing so at a later date. Furthermore, we cannot assure you that any of our patent applications will be approved. We also cannot assure you that the patents issuing as a result of our foreign patent applications will have the same scope of coverage as our United States patents. The patents we own could be challenged, invalidated or circumvented by others and may not be of sufficient scope or strength to provide us with any meaningful protection or commercial advantage. Further, we cannot assure you that competitors will not infringe our patents, or that we will have adequate resources to enforce our patents.
We also rely on unpatented proprietary technology. It is possible that others will independently develop the same or similar technology or otherwise obtain access to our unpatented technology. To protect our trade secrets and other proprietary information, we generally require applicable employees, consultants, advisors and collaborators to enter into confidentiality agreements. We cannot assure you that these agreements will provide meaningful protection for our trade secrets, know-how or other proprietary information in the event of any unauthorized use, misappropriation or disclosure of such trade secrets, know-how or other proprietary information. If we are unable to maintain the proprietary nature of our technologies, we could be materially adversely affected.
We rely on our trademarks, trade names and brand names to distinguish our products from the products of our competitors, and have registered or applied to register many of these trademarks. We cannot assure you that our trademark applications will be approved. Third parties may also oppose our trademark applications or otherwise challenge our use of the trademarks. In the event that our trademarks are successfully challenged, we could be forced to rebrand our products, which could result in loss of brand recognition, and could require us to devote resources to advertising and marketing new brands. Further, we cannot assure you that competitors will not infringe our trademarks or that we will have adequate resources to enforce our trademarks. We also license third parties to use certain of our trademarks. In an effort to preserve our trademark rights, we enter into license agreements with these third parties which govern the use of our trademarks and which require our licensees to abide by quality control standards with respect to the goods and services that they provide under our trademarks.
32
Table of Contents
Although we make efforts to police the use of our trademarks by our licensees, we cannot assure you that these efforts will be sufficient to ensure that our licensees abide by the terms of their licenses. In the event that our licensees fail to do so, our trademark rights could be diluted.
Although we rely on copyright laws to protect the works of authorship (including software) created by us, we generally do not register the copyrights in any of our copyrightable works. Copyrights of United States origin must be registered before the copyright owner may bring an infringement suit in the United States. Furthermore, if a copyright of United States origin is not registered within three months of publication of the underlying work, the copyright owner is precluded from seeking statutory damages or attorneys’ fees in any United States enforcement action, and is limited to seeking actual damages and lost profits. Accordingly, if one of our unregistered copyrights of United States origin is infringed by a third party, we will need to register the copyright before we can file an infringement suit in the United States, and our remedies in any such infringement suit may be limited.
The misuse of our intellectual property rights by others could adversely impact our ability to compete, cause our net sales to decrease or otherwise harm our business. If it became necessary for us to resort to litigation to protect our intellectual property rights, any proceedings could be burdensome and costly, and we may not prevail.
Also, we cannot be certain that the products that we sell do not and will not infringe issued patents or other intellectual property rights of others. Further, we are subject to legal proceedings and claims in the ordinary course of our business, including claims of alleged infringement of the patents, trademarks and other intellectual property rights of third parties by us or our customers, whom we generally indemnify in connection with their use of the products that we manufacture. These claims could divert management’s attention and resources and may require us to initiate or defend protracted and costly litigation on behalf of ourselves or our customers, regardless of the merits of the claims. Should we be found liable for infringement, we may be required to enter into licensing agreements (if available on acceptable terms or at all) or pay damages and cease making or selling certain products. Moreover, we may need to redesign or sell different products to avoid future infringement liability. Any of the foregoing could cause us to incur significant costs, prevent us from selling our products or negatively impact our ability to compete.
Income tax payments may ultimately differ from amounts currently recorded by us. Future tax law changes may materially increase our prospective income tax expense.
We are subject to income taxation in many jurisdictions in the United States as well as foreign jurisdictions. Judgment is required in determining our worldwide income tax provision and, accordingly, there are many transactions and computations for which our final income tax determination is uncertain. We are routinely audited by income tax authorities in many tax jurisdictions. Although we believe the recorded tax estimates are reasonable, the ultimate outcome from any audit (or related litigation) could be materially different from amounts reflected in our income tax provisions and accruals. Future settlements of income tax audits may have a material effect on earnings between the period of initial recognition of tax estimates in the financial statements and the point of ultimate tax audit settlement. Additionally, it is possible that future income tax legislation in any jurisdiction to which we are subject may be enacted that could have a material impact on our worldwide income tax provision beginning with the period that such legislation becomes effective.
We could incur significant costs in complying with environmental, health and safety laws or permits or as a result of satisfying any liability or obligation imposed under such laws or permits.
Our operations are subject to various federal, state, local and foreign environmental, health and safety laws and regulations. Among other things, these laws regulate the emission or discharge of materials into the environment, govern the use, storage, treatment, disposal and management of hazardous substances and wastes, protect the health and safety of our employees and the end users of our products, regulate the materials used in and the recycling of products and impose liability for the costs of investigating and remediating, and damages resulting from, present and past releases of hazardous substances. Violations of these laws and regulations,
33
Table of Contents
failure to obtain or maintain required environmental permits or non-compliance with any conditions contained in any environmental permit can result in substantial fines or penalties, injunctive relief, requirements to install pollution or other controls or equipment, civil and criminal sanctions, permit revocations and/or facility shutdowns. We could be held liable for the costs to address contamination of any real property we have ever owned, leased, operated or used, including as a disposal site. We could also incur fines, penalties, sanctions or be subject to third-party claims for property damage, personal injury or nuisance or otherwise as a result of violations of or liabilities under environmental laws in connection with releases of hazardous or other materials.
In addition, changes in, or new interpretations of, existing laws, regulations or enforcement policies, the discovery of previously unknown contamination, or the imposition of other environmental liabilities or obligations in the future, including additional investigation or other obligations with respect to any potential health hazards of our products or business activities or the imposition of new permit requirements, may lead to additional compliance or other costs that could have material adverse effect on our business, financial condition, results of operations and cash flows.
A change in our product mix could adversely affect our results of operations.
Our results may be affected by a change in our product mix on which our gross margin depends. Our Allied Products typically provide higher gross margin than our pipe products. Changes in our product mix may result from marketing activities to existing customers and needs communicated to us from existing and prospective customers. Our outlook, budgeting and strategic planning assume a certain product mix of sales. If actual results vary from this projected product mix of sales, our financial results could be negatively impacted.
We may be affected by global climate change or by legal, regulatory or market responses to such potential change.
Concern over climate change, including the impact of global warming, has led to significant federal, state, and international legislative and regulatory efforts to limit greenhouse gas (“GHG”), emissions. For example, in the past several years, the U.S. Congress has considered various bills that would regulate GHG emissions. While these bills have not yet received sufficient Congressional support for enactment, some form of federal climate change legislation is possible in the future. Even in the absence of such legislation, the EPA, spurred by judicial interpretation of the Clean Air Act, has begun regulating GHG emissions following its issuance of the “Tailoring Rule” that determines which stationary sources require permits for greenhouse emissions. The EPA has issued rules that require monitoring and reporting of annual GHG emissions, as well as performance standards for carbon dioxide (“CO2”) emissions from new fossil-fuel electric utility generating units. Thus far, the EPA has addressed vehicle and mobile source emissions by implementing Renewable Fuel Standard regulations and by working with manufacturers to improve fuel efficiency in new vehicles. However, the EPA has been directed by President Obama to develop and issue new fuel efficiency standards for medium- and heavy-duty vehicles by March 2016, especially diesel engine emissions, and this could impose substantial costs on us. These costs include an increase in the cost of the fuel and other energy we purchase and capital costs associated with updating or replacing our internal fleet of trucks and other vehicles in order to comply with application regulations. In addition, new laws or future regulation could directly and indirectly affect our customers and suppliers (through an increase in the cost of production or their ability to produce satisfactory products) and our business (through the impact on our inventory availability, cost of sales, operations or demands for the products we sell). Until the timing, scope and extent of any future regulation becomes known, we cannot predict its effect on our cost structure or our operating results. Notwithstanding our dedication to being a responsible corporate citizen, it is possible that such legislation or regulation could impose material costs on us.
Anti-terrorism measures and other disruptions to the raw material supply network could impact our operations.
Our ability to provide efficient distribution of products to our customers is an integral component of our overall business strategy. In the aftermath of terrorist attacks in the United States, federal, state and local
34
Table of Contents
authorities have implemented and continue to implement various security measures that affect the raw material supply network in the United States and abroad. If security measures disrupt or impede the receipt of sufficient raw materials, we may fail to meet the needs of our customers or may incur increased expenses to do so.
Risks Relating to Our Indebtedness
We have substantial debt and may incur substantial additional debt, which could adversely affect our financial health, reduce our profitability, limit our ability to obtain financing in the future and pursue certain business opportunities and reduce the value of your investment.
As of March 31, 2015, we had an aggregate principal amount of $399.9 million of outstanding debt. In fiscal year 2015, we incurred $17.1 million of interest expense related to this debt.
The amount of our debt or such other obligations could have important consequences for holders of our common stock, including, but not limited to:
| • | a substantial portion of our cash flow from operations must be dedicated to the payment of principal and interest on our indebtedness, thereby reducing the funds available to us for other purposes; |
| • | our ability to obtain additional financing for working capital, capital expenditures, acquisitions, debt service requirements or general corporate purposes and other purposes may be impaired in the future; |
| • | we are exposed to the risk of increased interest rates because a portion of our borrowings is at variable rates of interest; |
| • | we may be at a competitive disadvantage compared to our competitors with less debt or with comparable debt at more favorable interest rates and that, as a result, may be better positioned to withstand economic downturns; |
| • | our ability to refinance indebtedness may be limited or the associated costs may increase; |
| • | our ability to engage in acquisitions without raising additional equity or obtaining additional debt financing may be impaired in the future; |
| • | it may be more difficult for us to satisfy our obligations to our creditors, resulting in possible defaults on and acceleration of such indebtedness; |
| • | we may be more vulnerable to general adverse economic and industry conditions; and |
| • | our flexibility to adjust to changing market conditions and our ability to withstand competitive pressures could be limited, or we may be prevented from making capital investments that are necessary or important to our operations in general, growth strategy and efforts to improve operating margins of our business units. |
If our cash flow and capital resources are insufficient to fund our debt service obligations, we may be forced to reduce or delay capital expenditures, sell assets, seek to obtain additional equity capital or refinance our debt. We cannot make assurances that we will be able to refinance our debt on terms acceptable to us, or at all. In the future, our cash flow and capital resources may not be sufficient for payments of interest on and principal of our debt, and such alternative measures may not be successful and may not permit us to meet our scheduled debt service obligations.
We cannot make assurances that we will be able to refinance any of our indebtedness, or obtain additional financing, particularly because of our high levels of debt and the debt incurrence restrictions imposed by the agreements governing our debt, as well as prevailing market conditions. We could face substantial liquidity problems and might be required to dispose of material assets or operations to meet our debt service and other obligations. Subject to certain exceptions, our Bank Term Loans and our Senior Notes, which we have defined in “Item 7. Management’s Discussion and Analysis of Financial Condition and Results of Operations — Financing Transactions,” restrict our ability to dispose of assets and how we use the proceeds from any such dispositions.
35
Table of Contents
We cannot make assurances that we will be able to consummate those dispositions, or if we do, what the timing of the dispositions will be or whether the proceeds that we realize will be adequate to meet our debt service obligations, when due.
Despite our current level of indebtedness, we may still be able to incur substantially more debt. This could further exacerbate the risks to our financial condition described above.
We may be able to incur significant additional indebtedness in the future. Although the agreements governing our indebtedness contain restrictions on the incurrence of additional indebtedness, these restrictions are subject to a number of qualifications and exceptions, and the additional indebtedness incurred in compliance with these restrictions could be substantial. These restrictions also will not prevent us from incurring obligations that do not constitute indebtedness, including obligations under lease arrangements that are currently recorded as operating leases. In addition, our Revolving Credit Facility provides an aggregate commitment of up to $325.0 million. As of March 31, 2015, we had an additional $111.9 million of availability under the Revolving Credit Facility plus $12.0 million in availability outstanding under a separate revolving credit facility with our subsidiary, ADS Mexicana. If new debt is added to our current debt levels, the related risks that we now face could intensify. See “Item 7. Management’s Discussion and Analysis of Financial Condition and Results of Operations — Financing Transactions.”
The agreements and instruments governing our debt contain restrictions and limitations that could significantly impact our ability to operate our business and adversely affect the holders of our common stock.
The covenants contained in our Bank Term Loans and our Senior Notes, which we refer to collectively as our Credit Facilities, are consistent. These covenants, among other things, restrict or limit our ability to:
| • | dispose of assets; |
| • | incur additional indebtedness (including guarantees of additional indebtedness); |
| • | prepay or amend our various debt instruments; |
| • | pay dividends and make certain payments; |
| • | redeem stock or make other distributions; |
| • | create liens on assets; |
| • | make certain investments; |
| • | engage in certain asset sales, mergers, acquisitions, consolidations or sales of all, or substantially all, of our assets; and |
| • | engage in certain transactions with affiliates. |
Our ability to comply with the covenants and restrictions contained in the Credit Facilities may be affected by economic, financial and industry conditions beyond our control. The breach of any of these covenants or restrictions could result in a default under the Credit Facilities that would permit the applicable lenders or noteholders, as the case may be, to declare all amounts outstanding thereunder to be due and payable, together with accrued and unpaid interest. If we are unable to repay indebtedness, secured parties having secured obligations, such as the lenders under the Credit Facilities, could proceed against the collateral securing the secured obligations. This could have serious consequences to our financial condition and results of operations and could cause us to become bankrupt or insolvent.
We may have future capital needs and may not be able to obtain additional financing on acceptable terms.
Although we believe that our current cash position and the additional committed funding available under our Credit Facilities is sufficient for our current operations, any reductions in our available borrowing capacity, or our inability to renew or replace our debt facilities, when required or when business conditions warrant, could
36
Table of Contents
have a material adverse effect on our business, financial condition and results of operations. The economic conditions, credit market conditions, and economic climate affecting our industry, as well as other factors, may constrain our financing abilities. Our ability to secure additional financing, if available, and to satisfy our financial obligations under indebtedness outstanding from time to time will depend upon our future operating performance, the availability of credit generally, economic conditions and financial, business and other factors, many of which are beyond our control. The market conditions and the macroeconomic conditions that affect our industry could have a material adverse effect on our ability to secure financing on favorable terms, if at all.
If financing is not available when needed, or is available on unfavorable terms, we may be unable to take advantage of business opportunities or respond to competitive pressures, any of which could have a material adverse effect on our business, financial condition and results of operations. If we raise additional funds through further issuances of equity, convertible debt securities or other securities convertible into equity, our existing stockholders could suffer significant dilution in their percentage ownership, and any new securities we issue could have rights, preferences and privileges senior to those of holders of our common stock.
Increases in interest rates would increase the cost of servicing our debt and could reduce our profitability.
A significant portion of our outstanding debt, including the debt under our Bank Term Loans, bears interest at variable rates. As a result, increases in interest rates would increase the cost of servicing our debt and could materially reduce our profitability and cash flows. Each 1.0% increase in interest rates on our variable-rate debt would increase our annual forecasted interest expense by approximately $1.9 million based on balances as of March 31, 2015. Assuming all revolving loans were fully drawn, each 1.0% increase in interest rates would result in a $3.1 million increase in annual cash interest expense on our Credit Facilities.
With respect to the indebtedness outstanding under our Credit Facilities that bear interest at variable rates, such variable rates are determined based upon specified pricing terms. As a result, if our leverage ratios increase, then such variable rates could also increase. See “Item 7. Management’s Discussion and Analysis of Financial Condition and Results of Operations — Financing Transactions.”
We may not be able to satisfy our outstanding obligations upon a change of control.
Under the Bank Term Loans, a change of control (as defined therein) constitutes an event of default that permits the lenders to accelerate the maturity of borrowings under the agreement and terminate their commitments to lend. Additionally, under the Senior Notes, a change of control (as defined therein) constitutes an event of default that permits the noteholders to declare all of their notes to be immediately due and payable. In order to avoid events of default under each of our Credit Facilities, we may therefore have to avoid certain change of control transactions that would otherwise be beneficial to us.
Risks Relating to Our Common Stock
Our ability to make future dividend payments, if any, may be restricted.
We have a history of paying dividends to our stockholders when sufficient cash is available, and we currently intend to pay dividends in the future. Any determination to pay dividends on our capital stock in the future will be at the discretion of our board of directors, subject to applicable laws and the provisions of our amended and restated certificate of incorporation (including those relating to the payment of dividends on our convertible preferred stock), and will depend on our financial condition, results of operations, capital requirements, general business conditions and other factors that our board of directors considers relevant. In addition, the terms of our Credit Facilities contain restrictions on our ability to pay dividends. Also, Delaware law may impose requirements that may restrict our ability to pay dividends to holders of our common stock.
The market price of our common stock may be volatile and could decline in the future.
We cannot assure you that an active public market for our common stock will be sustained. In the absence of a public trading market, you may not be able to liquidate your investment in our common stock. In addition,
37
Table of Contents
the market price of our common stock may fluctuate significantly. Among the factors that could affect our stock price are:
| • | industry or general market conditions; |
| • | domestic and international economic factors unrelated to our performance; |
| • | changes in our customers’ preferences; |
| • | new regulatory pronouncements and changes in regulatory guidelines; |
| • | actual or anticipated fluctuations in our quarterly operating results; |
| • | changes in securities analysts’ estimates of our financial performance or lack of research and reports by industry analysts; |
| • | action by institutional stockholders or other large stockholders, including future sales; |
| • | speculation in the press or investment community; |
| • | investor perception of us and our industry; |
| • | changes in market valuations or earnings of similar companies; |
| • | announcements by us or our competitors of significant products, contracts, acquisitions or strategic partnerships; |
| • | developments or disputes concerning patents or proprietary rights, including increases or decreases in litigation expenses associated with intellectual property lawsuits we may initiate, or in which we may be named as defendants; |
| • | failure to complete significant sales; |
| • | any future sales of our common stock or other securities; and |
| • | additions or departures of key personnel. |
The stock markets have experienced extreme volatility in recent years that has been unrelated to the operating performance of particular companies. These broad market fluctuations may adversely affect the trading price of our common stock. In the past, following periods of volatility in the market price of a company’s securities, class action litigation has often been instituted against such company. Any litigation of this type brought against us could result in substantial costs and a diversion of our management’s attention and resources, which would harm our business, operating results and financial condition.
Future sales of shares by existing stockholders, including our Employee Stock Ownership Plan, could cause our stock price to decline.
Sales of substantial amounts of our common stock in the public market, or the perception that these sales could occur, could cause the market price of our common stock to decline. Based on shares outstanding as of March 31, 2015, we have 53.7 million outstanding shares of common stock, including 0.2 million outstanding shares of our restricted stock, a significant portion of which are freely tradeable without restriction under the Securities Act of 1933, as amended, (“Securities Act”) unless held by “affiliates,” as that term is defined in Rule 144 under the Securities Act. The remaining shares of common stock outstanding are restricted securities within the meaning of Rule 144 under the Securities Act. Restricted securities may be sold in the public market only if their offer and sale is registered under the Securities Act or if the offer and sale of those securities qualify for an exemption from registration, including exemptions provided by Rules 144 and 701 under the Securities Act. In connection with our initial public offering, we filed one or more registration statements on Form S-8 under the Securities Act to register the shares of common stock to be issued under our equity compensation plans and, as a result, all shares of common stock acquired upon exercise of stock options granted under our plans are
38
Table of Contents
also freely tradable under the Securities Act, unless purchased by our affiliates. As of March 31, 2015, there were stock options outstanding to purchase a total of approximately 2.7 million shares of our common stock. In addition, approximately 1.4 million shares of common stock are reserved for future issuance under our 2013 Stock Option Plan.
Certain of our significant stockholders may distribute shares that they hold to their investors who themselves may then sell into the public market. Such sales may not be subject to the volume, manner of sale, holding period and other limitations of Rule 144 of the Securities Act (“Rule 144”). As resale restrictions end, the market price of our common stock could decline if the holders of those shares sell them or are perceived by the market as intending to sell them.
All of the shares of our convertible preferred stock held by our Employee Stock Ownership Plan (“ESOP”) may be converted into our common stock at any time by action of the ESOP trustee, and will be automatically converted into our common stock upon distributions of such shares allocated to the ESOP accounts of ESOP participants upon a distribution event such as retirement or other termination of employment. Such distributed common stock will not be subject to any lock-up agreement and will be eligible for future sale, subject to the applicable volume, manner of sale, holding period and other limitations of Rule 144. As of March 31, 2015, there were approximately 25.6 million shares of convertible preferred stock held by our ESOP, which in aggregate could be converted into approximately 19.7 million shares of our common stock. All of these shares will be eligible for future sale, either by the ESOP trustee or by ESOP participants, subject to the limitations of Rule 144.
In the future, we may issue additional shares of common stock or other equity or debt securities convertible into common stock in connection with a financing, acquisition, litigation settlement or employee arrangement or otherwise. Any of these issuances could result in substantial dilution to our existing stockholders and could cause the trading price of our common stock to decline.
If securities or industry analysts do not publish research or publish misleading or unfavorable research about our business, our stock price and trading volume could decline.
The trading market for our common stock depends in part on the research and reports that securities or industry analysts publish about us or our business. If one or more of these analysts downgrades our stock or publishes misleading or unfavorable research about our business, our stock price would likely decline. If one or more of these analysts ceases coverage of us or fails to publish reports on us regularly, demand for our stock could decrease, which could cause our stock price or trading volume to decline.
Our directors, officers and principal stockholders have significant voting power and may take actions that may not be in the best interests of our other stockholders.
As of February 29, 2016, our directors, officers and principal stockholders and their affiliates collectively own approximately 64.3% of our outstanding shares of common stock. Additionally, our ESOP holds convertible preferred stock that converts into a substantial number of shares of our common stock and, prior to conversion, is entitled to vote on a one-for-one basis on any matter requiring the vote or consent of our stockholders, voting together with our common stock as a single class unless otherwise required by law. Thus, the collective voting power of our directors, officers and principal stockholders and their affiliates as of February 29, 2016 is approximately 75.5%, inclusive of the outstanding shares of convertible preferred stock held by the ESOP. As a result, these stockholders, if they act together, may be able to control our management and affairs and most matters requiring stockholder approval, including the election of directors and approval of significant corporate transactions. This concentration of ownership may have the effect of delaying or preventing a change of control and might adversely affect the market price of our common stock. This concentration of ownership may not be in the best interests of our other stockholders.
39
Table of Contents
The trustee of our ESOP has certain limited powers to vote a large block of shares on matters presented to stockholders for approval.
In general, the trustee of the ESOP votes the shares of convertible preferred stock held by the ESOP as directed by the ESOP’s participants. Consequently, the trustee of the ESOP has the ability to vote a significant block of shares on certain matters presented to stockholders for approval. Each participant in the ESOP may direct the trustee of the ESOP on how to vote the shares of convertible preferred stock allocated to the participant’s ESOP accounts; and the trustee must vote any unallocated stock and allocated stock for which no participant instructions were received in the same proportion as the allocated stock for which participants’ voting instructions have been received is voted.
Fulfilling the obligations incident to being a public company is expensive and time-consuming, and any delays or difficulties in satisfying these obligations could have a material adverse effect on our future results of operations and our stock price.
We completed our initial public offering in fiscal year 2015. As such, we are now subject to the reporting and corporate governance requirements, the listing standards of the NYSE, and the Sarbanes-Oxley Act of 2002 that apply to issuers of listed equity, which impose certain compliance costs and obligations upon us. The changes necessitated by publicly listing our equity require a significant commitment of additional resources and management oversight, which increases our operating costs. These requirements also place significant demands on our finance and accounting staff and on our financial accounting and information systems. Other expenses associated with being a public company include increases in auditing, accounting and legal fees and expenses, investor relations expenses, increased directors’ fees and director and officer liability insurance costs, registrar and transfer agent fees and listing fees, as well as other expenses. As a public company, we are required, among other things, to:
| • | define and expand the roles and the duties of our board of directors and its committees; and |
| • | institute more comprehensive compliance, investor relations and internal audit functions. |
In addition, complying with public disclosure rules makes our business more visible, which we believe may result in threatened or actual litigation, including by competitors and other third parties. If such claims are successful, our business and operating results could be harmed, and even if the claims do not result in litigation or are resolved in our favor, these claims, and the time and resources necessary to resolve them, could divert the resources of our management and harm our business and operating results.
Anti-takeover provisions in our charter documents and Delaware law could discourage, delay or prevent a change in control of us and may affect the trading price of our common stock.
Our amended and restated certificate of incorporation and amended and restated bylaws include a number of provisions that may discourage, delay or prevent a change in our management or control over us that stockholders may consider favorable. For example, our amended and restated certificate of incorporation and amended and restated bylaws:
| • | authorize the issuance of “blank check” preferred stock that could be issued by our board of directors to thwart a takeover attempt; |
| • | maintain a classified board of directors, as a result of which our board will continue to be divided into three classes, with each class serving for staggered three-year terms, which prevents stockholders from electing an entirely new board of directors at an annual meeting; |
| • | limit the ability of stockholders to remove directors; |
| • | provide that vacancies on our board of directors, including newly-created directorships, may be filled only by a majority vote of directors then in office; |
40
Table of Contents
| • | prohibit stockholders from calling special meetings of stockholders; |
| • | prohibit stockholder action by written consent, thereby requiring all actions to be taken at a meeting of the stockholders; |
| • | do not give the holders of our common stock cumulative voting rights with respect to the election of directors, which means that the holders of a majority of our outstanding shares of common stock can elect all directors standing for election; |
| • | establish advance notice requirements for nominations for election to our board of directors or for proposing matters that can be acted upon by stockholders at stockholder meetings; |
| • | require a super-majority stockholders vote of 75% to approve any reorganization, recapitalization, share exchange, share reclassification, consolidation, merger, conversion or sale of all or substantially all assets to which we are a party that is not approved by the affirmative vote of at least 75% of the members of our board of directors; and |
| • | require the approval of holders of at least 75% of the outstanding shares of our voting common stock to amend the bylaws and certain provisions of the certificate of incorporation. |
Any provision of our amended and restated certificate of incorporation, amended and restated bylaws or Delaware General Corporation Law that has the effect of delaying or deterring a change in control could limit the opportunity for our stockholders to receive a premium for their shares of our common stock, and could also affect the price that some investors are willing to pay for our common stock.
Our amended and restated certificate of incorporation and amended and restated bylaws may also make it difficult for stockholders to replace or remove our management. These provisions may facilitate management entrenchment that may delay, deter, render more difficult or prevent a change in our control, which may not be in the best interests of our stockholders.
Our amended and restated certificate of incorporation provides that the Court of Chancery of the State of Delaware is the exclusive forum for substantially all disputes between us and our stockholders, which could limit our stockholders’ ability to obtain a favorable judicial forum for disputes with us or our directors, officers, employees or agents.
Our amended and restated certificate of incorporation provides that the Court of Chancery of the State of Delaware is the exclusive forum for any derivative action or proceeding brought on our behalf; any action asserting a claim of breach of a fiduciary duty owed to us or our stockholders by our directors, officers, employees or agents; any action asserting a claim against us arising under the Delaware General Corporation Law, our amended and restated certificate of incorporation or our amended and restated bylaws; or any action asserting a claim against us that is governed by the internal affairs doctrine. Any person or entity purchasing or otherwise acquiring any interest in shares of our common stock shall be deemed to have notice of and to have consented to the provisions of our amended and restated certificate of incorporation described above. The choice of forum provision may limit a stockholder’s ability to bring a claim in a judicial forum that it finds favorable for disputes with us or our directors, officers, employees or agents, which may discourage such lawsuits against us or our directors, officers, employees or agents. If a court were to find the choice of forum provision contained in our amended and restated certificate of incorporation to be inapplicable or unenforceable in an action, we may incur additional costs associated with resolving such action in other jurisdictions, which could adversely affect our business and financial condition.
ITEM 1B. UNRESOLVED STAFF COMMENTS
None.
41
Table of Contents
Real Property
We have a network of 61 manufacturing plant locations and 31 distribution centers, including the facilities owned or leased by our joint ventures. We operate across all 50 U.S. states and 10 Canadian provinces through 77 locations in the United States and Canada, consisting of 52 manufacturing plants and 25 distribution centers. We have 9 manufacturing plants and 5 distribution centers operated through joint ventures in Mexico and South America, as well as one distribution center in Europe.
We currently own approximately 36,000 square feet of office space in Hilliard, Ohio for our corporate headquarters.
Our network of 61 manufacturing plants consisted of 49 that were owned and 12 that were leased. We generally prefer to own our manufacturing plant locations, with a typical pipe manufacturing facility consisting of approximately 40,000 square feet and 15-20 acres of land for storage of pipe and related products. Our network of 31 distribution centers consisted of 2 that were owned and 29 that were leased. We believe that our properties have been adequately maintained and are generally in good condition. The extent to which we use our properties varies by property and from time to time but we believe the capacity of our facilities is adequate for the level of production and distribution activities necessary in our business as presently conducted. Each distribution center carries single wall and dual wall pipe and fittings and Allied Products per needs of the local market.
Our manufacturing plants and distribution centers, including those operated through our joint ventures, are shown in the map below.1
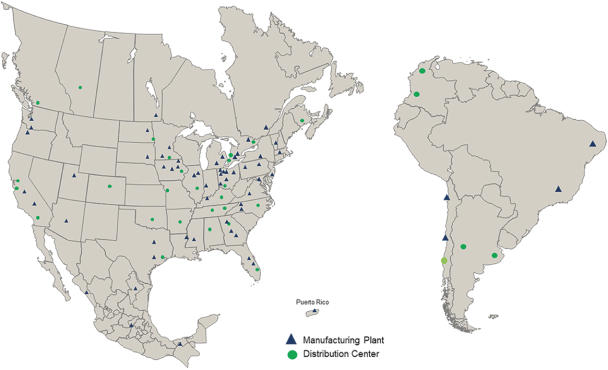
| 1 | Additionally, we have a distribution center in Rotterdam, The Netherlands. |
42
Table of Contents
In-house Fleet
As of March 31, 2015, our in-house fleet consisted of approximately 650 tractor-trailers and approximately 1,150 trailers that are specially designed to haul our lightweight pipe and fittings products.
On July 29, 2015, a putative stockholder class action, Christopher Wyche, individually and on behalf of all others similarly situated v. Advanced Drainage Systems, Inc., et al. (Case No. 1:15-cv-05955-KPF), was commenced in the U.S. District Court for the Southern District of New York, naming the Company, along with Joseph A. Chlapaty, the Company’s Chief Executive Officer, and Mark B. Sturgeon, the Company’s former Chief Financial Officer, as defendants and alleging violations of the federal securities laws. The complaint alleges that the Company made material misrepresentations and/or omissions of material fact in its public disclosures during the period from September 5, 2014 through July 14, 2015, in violation of Section 10(b) and 20(a) of the Securities Exchange Act of 1934, as amended, and Rule 10b-5 promulgated thereunder. Plaintiffs seek an unspecified amount of monetary damages on behalf of the putative class and an award of costs and expenses, including counsel fees and expert fees. The Company believes that it has valid and meritorious defenses and will vigorously defend against these allegations, but litigation is subject to many uncertainties and the outcome of this matter is not predictable with assurance. While it is reasonably possible that this matter ultimately could be decided unfavorably to the Company, the Company is currently unable to estimate the range of the possible losses, but they could be material.
On August 12, 2015, the SEC Division of Enforcement (“Enforcement Division”) informed the Company that it was conducting an informal inquiry with respect to the Company. As part of this inquiry, the Enforcement Division requested the voluntary production of certain documents generally related to the Company’s accounting practices. Subsequent to the initial voluntary production request, the Company received document subpoenas from the Enforcement Division pursuant to a formal order of investigation. The Company has from the outset cooperated with the Enforcement Division’s investigation and intends to continue to do so. While it is reasonably possible that this investigation ultimately could be resolved unfavorably to the Company, the Company is currently unable to estimate the range of possible losses, but they could be material.
We are involved from time-to-time in various legal proceedings that arise in the ordinary course of our business including, but not limited to commercial disputes, environmental matters, employee related claims, intellectual property disputes and litigation in connection with transactions including acquisitions and divestitures. We believe that such litigation, claims, and administrative proceedings will not have a material adverse impact on our financial position or our results of operations. We record a liability when a loss is considered probable, and the amount can be reasonably estimated. In management’s opinion, none of these proceedings are material in relation to our consolidated operations, cash flows, or financial position, and we have adequate accrued liabilities to cover our estimated probable loss exposure.
ITEM 4. MINE SAFETY DISCLOSURES
Not applicable.
43
Table of Contents
PART II
ITEM 5. MARKET FOR REGISTRANT’S COMMON EQUITY, RELATED STOCKHOLDER MATTERS AND ISSUER PURCHASES OF EQUITY SECURITIES
Market Information for Common Stock
Our common stock began trading on the NYSE under the symbol “WMS” on July 25, 2014. Prior to that date, there was no public trading market for our common stock. The following table sets forth the high and low sales prices per share of our common stock as reported on the NYSE and the dividends paid for each quarter of fiscal year 2015:
| Stock Prices | Dividends Paid Per Share |
|||||||||||
| High | Low | |||||||||||
| 2015 |
||||||||||||
| First Quarter |
$ | — | $ | — | $ | — | ||||||
| Second Quarter |
$ | 22.21 | $ | 14.74 | $ | — | ||||||
| Third Quarter |
$ | 24.26 | $ | 19.35 | $ | 0.04 | ||||||
| Fourth Quarter |
$ | 30.00 | $ | 21.94 | $ | 0.04 | ||||||
|
|
|
|||||||||||
| Year |
$ | 0.08 | ||||||||||
|
|
|
|||||||||||
The Board of Directors approved quarterly per share cash dividends of $0.029 during the first three quarters of the fiscal year ended March 31, 2014. The Board of Directors also approved a per share cash dividend of $1.59 during the fourth quarter of fiscal year 2014 to all common stockholders of record (the “Special Dividend”). The Board of Directors approved a dividend of $0.04 per share to all common stockholders of record during the quarters ending December 31, 2014 and March 31, 2015. No dividends were declared in the quarters ended June 30, 2014 and September 30, 2014.
During each of the first three quarters of 2016, the Board of Directors approved a quarterly cash dividend of $0.05 per share to all common stockholders. Any future determination relating to dividends will be made at the discretion of our board of directors and will depend on a number of factors, including our future earnings, capital requirements, financial condition, future prospects, contractual restrictions, legal requirements and other factors our board of directors may deem relevant.
Holders of Record
As of June 30, 2015, we had 211 holders of record of our common stock. The number of holders of record is based upon the actual number of holders registered as of such date and does not include holders of shares in “street name” or persons, partnerships, associates, corporations or other entities in security position listings maintained by depositories.
44
Table of Contents
Stock Performance Graph
The following graph presents a comparison from July 25, 2014 (the date our common stock commenced trading on the NYSE) through March 31, 2015 of the cumulative return of our common stock, the Standard and Poor’s Index (“S&P 500”) and the Russell 2000 Index (“Russell 2000”). The graph assumes investments of $100 on July 25, 2014 in our common stock and in each of the two indices and the reinvestment of dividends.
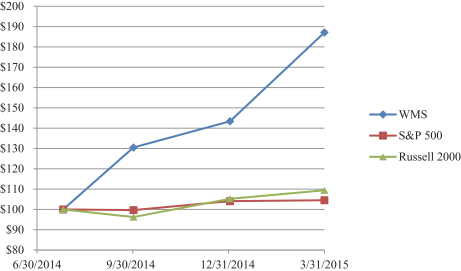
Recent Sales of Unregistered Securities
Between April 1, 2014 and the completion of our initial public offering (“IPO”), we sold securities without registration under the Securities Act of 1933, as amended, to certain officers, directors and employees upon the exercise of stock options. Such sales included 56,464 shares of common stock in exchange for an aggregate of $432,170.
These transactions did not involve any underwriters or any public offerings. These transactions were exempt from registration under the Securities Act, pursuant to Section 4(a)(2) of the Securities Act or Rule 701 promulgated thereunder, as transactions by an issuer not involving a public offering. No general solicitation was made either by us or any person acting on our behalf; the recipients of our common stock agreed that the securities would be subject to the standard restrictions applicable to a private placement of securities under applicable state and federal securities laws; and appropriate legends were affixed to the certificates issued.
Since the completion of our IPO, we have not sold any securities without registration under the Securities Act of 1933, as amended.
Issuer Purchases of Equity Securities
We did not make any repurchases of shares of our common stock during the three months ended March 31, 2015.
Equity Compensation Plan Information
For equity compensation plan information, refer to “Part III, Item. 12 Security Ownership of Certain Beneficial Owners and Management and Related Stockholder Matters,” of this Annual Report on Form 10-K.
45
Table of Contents
ITEM 6. SELECTED FINANCIAL AND OPERATING DATA
The following tables set forth selected historical consolidated financial data, for the periods and as of the dates indicated, that should be read in conjunction with “Item 7. Management’s Discussion and Analysis of Financial Condition and Results of Operations,” and our consolidated financial statements and notes thereto included in “Item 8. Financial Statements and Supplementary Data,” of this Form 10-K. We derived the consolidated statements of operations and cash flow data for the years ended March 31, 2015, 2014 and 2013 and our consolidated balance sheet data as of March 31, 2015 and 2014 from our audited financial statements included in “Item 8. Financial Statements and Supplementary Data,” of this Form 10-K. The consolidated balance sheet as of March 31, 2014 and the consolidated statements of operations and cash flows for the years ended March 31, 2014 and 2013 have been restated as noted in “Note 2. Restatement of Previously Issued Financial Statements” to our audited financial statements. The consolidated statements of operations and cash flow data for the years ended March 31, 2012 and 2011 and the balance sheet data as of March 31, 2013, 2012 and 2011 have been restated to reflect the impact of the adjustments resulting from the restatement, but such restated data has not been audited. Our historical results are not necessarily indicative of future results.
| Fiscal Year Ended March 31, | ||||||||||||||||||||
| (Amounts in thousands) | 2015 | 2014 | 2013 | 2012 (10) | 2011 (2)(10) | |||||||||||||||
| (As Restated) (1) | (As Restated) (1) | (As Restated) (1) | (As Restated) (1) | |||||||||||||||||
| Consolidated statement of income data: |
||||||||||||||||||||
| Net sales |
$ | 1,180,073 | $ | 1,067,780 | $ | 1,017,102 | $ | 1,015,667 | $ | 863,246 | ||||||||||
| Cost of goods sold |
973,960 | 873,810 | 829,141 | 839,637 | 712,691 | |||||||||||||||
|
|
|
|
|
|
|
|
|
|
|
|||||||||||
| Gross profit |
206,113 | 193,970 | 187,961 | 176,030 | 150,555 | |||||||||||||||
| Selling expenses |
78,981 | 74,042 | 71,805 | 70,542 | 65,387 | |||||||||||||||
| General and administrative expenses |
58,749 | 59,761 | 49,601 | 56,018 | 47,709 | |||||||||||||||
| Loss (gain) on disposal of assets or businesses (3) |
362 | (2,863 | ) | (951 | ) | (44,204 | ) | 472 | ||||||||||||
| Intangibles amortization |
9,754 | 10,145 | 10,028 | 8,074 | 7,294 | |||||||||||||||
|
|
|
|
|
|
|
|
|
|
|
|||||||||||
| Income from operations |
58,267 | 52,885 | 57,478 | 85,600 | 29,693 | |||||||||||||||
| Interest expense |
19,368 | 18,807 | 18,526 | 22,994 | 27,953 | |||||||||||||||
| Other miscellaneous expense (income), net (4) |
14,370 | (1,177 | ) | 103 | 1,487 | (1,369 | ) | |||||||||||||
|
|
|
|
|
|
|
|
|
|
|
|||||||||||
| Income before income taxes |
24,529 | 35,255 | 38,849 | 61,119 | 3,109 | |||||||||||||||
| Income tax expense |
9,443 | 19,949 | 15,935 | 26,184 | 5,963 | |||||||||||||||
| Equity in net loss (income) of unconsolidated affiliates |
2,335 | 3,086 | (266 | ) | (631 | ) | (788 | ) | ||||||||||||
|
|
|
|
|
|
|
|
|
|
|
|||||||||||
| Net income (loss) |
12,751 | 12,220 | 23,180 | 35,566 | (2,066 | ) | ||||||||||||||
| Less net income attributable to noncontrolling interest |
4,131 | 3,593 | 2,520 | 968 | 1,771 | |||||||||||||||
|
|
|
|
|
|
|
|
|
|
|
|||||||||||
| Net income (loss) attributable to ADS |
8,620 | 8,627 | 20,660 | 34,598 | (3,837 | ) | ||||||||||||||
|
|
|
|
|
|
|
|
|
|
|
|||||||||||
| Change in fair value of redeemable convertible preferred stock |
(11,054 | ) | (3,979 | ) | (5,869 | ) | (10,257 | ) | (3,541 | ) | ||||||||||
| Dividends to redeemable convertible preferred stockholders |
(661 | ) | (10,139 | ) | (735 | ) | (668 | ) | (844 | ) | ||||||||||
| Dividends paid to unvested restricted stockholders |
(11 | ) | (418 | ) | (52 | ) | (34 | ) | (104 | ) | ||||||||||
|
|
|
|
|
|
|
|
|
|
|
|||||||||||
| Net (loss) income available to common stockholders and participating securities |
(3,106 | ) | (5,909 | ) | 14,004 | 23,639 | (8,326 | ) | ||||||||||||
| Undistributed loss allocated to participating securities |
— | — | (1,127 | ) | (2,237 | ) | — | |||||||||||||
|
|
|
|
|
|
|
|
|
|
|
|||||||||||
| Net (loss) income available to common stockholders |
$ | (3,106 | ) | $ | (5,909 | ) | $ | 12,877 | $ | 21,402 | $ | (8,326 | ) | |||||||
|
|
|
|
|
|
|
|
|
|
|
|||||||||||
46
Table of Contents
| Fiscal Year Ended March 31, | ||||||||||||||||||||
| 2015 | 2014 | 2013 (10) | 2012 (10) | 2011 (2)(10) | ||||||||||||||||
| (Amounts in thousands, except per share data) | (As Restated) (1) | (As Restated) (1) | (As Restated) (1) | (As Restated) (1) | ||||||||||||||||
| Weighted average common shares outstanding: |
||||||||||||||||||||
| Basic |
51,344 | 47,277 | 46,698 | 46,293 | 47,668 | |||||||||||||||
| Diluted |
51,344 | 47,277 | 47,249 | 47,051 | 47,668 | |||||||||||||||
| Fully Converted (5) |
71,601 | 67,877 | 67,545 | 67,337 | 71,019 | |||||||||||||||
| Net (loss) income per share |
||||||||||||||||||||
| Basic |
$ | (0.06 | ) | $ | (0.12 | ) | $ | 0.28 | $ | 0.46 | $ | (0.17 | ) | |||||||
| Diluted |
(0.06 | ) | (0.12 | ) | 0.27 | 0.45 | (0.17 | ) | ||||||||||||
| Fully Converted (5) |
0.29 | 0.58 | 0.41 | 0.59 | 0.01 | |||||||||||||||
| Cash dividends declared per share |
0.08 | 1.68 | 0.10 | 0.09 | 0.09 | |||||||||||||||
| Other financial data: |
||||||||||||||||||||
| Capital expenditures |
$ | 31,479 | $ | 39,621 | $ | 38,756 | $ | 24,953 | $ | 29,422 | ||||||||||
| Adjusted EBITDA (6) |
143,777 | 152,755 | 132,299 | 119,601 | 103,974 | |||||||||||||||
| Adjusted EBITDA margin (7) |
12.2 | % | 14.3 | % | 13.0 | % | 11.8 | % | 12.0 | % | ||||||||||
| Consolidated balance sheet data: |
||||||||||||||||||||
| Cash |
$ | 3,623 | $ | 3,931 | $ | 1,361 | $ | 2,082 | $ | 2,151 | ||||||||||
| Working capital (8) |
249,137 | 241,004 | 204,034 | 197,718 | 198,019 | |||||||||||||||
| Total assets |
1,041,699 | 989,567 | 950,765 | 938,831 | 902,862 | |||||||||||||||
| Long-term debt |
390,315 | 442,895 | 338,048 | 358,790 | 362,624 | |||||||||||||||
| Long-term capital lease obligations |
45,503 | 34,366 | 28,851 | 23,529 | 10,179 | |||||||||||||||
| Total liabilities |
727,102 | 761,318 | 642,342 | 656,953 | 653,112 | |||||||||||||||
| Total mezzanine equity (9) |
108,021 | 642,951 | 608,346 | 557,563 | 493,674 | |||||||||||||||
| Total stockholders’ equity (deficit) |
206,576 | (414,702 | ) | (299,923 | ) | (275,685 | ) | (243,924 | ) | |||||||||||
| Statement of cash flow data: |
||||||||||||||||||||
| Net cash provided by operating activities |
$ | 74,379 | $ | 72,410 | $ | 75,353 | $ | 62,507 | $ | 46,037 | ||||||||||
| Net cash used in investing activities |
(76,093 | ) | (38,712 | ) | (44,796 | ) | (33,838 | ) | (52,164 | ) | ||||||||||
| Net cash provided by (used in) financing activities |
1,791 | (31,109 | ) | (31,338 | ) | (28,784 | ) | 5,281 | ||||||||||||
| (1) | See “Note 2. Restatement of Previously Issued Financial Statements” to our consolidated financial statements. |
| (2) | The presentation of our selected historical consolidated financial data as of March 31, 2011 has been adjusted to comply with the retrospective application of our inventory accounting principle change. In April 2011, the Company changed the method of valuing raw materials from the last-in, first-out (“LIFO”) method to the first-in, first-out (“FIFO”) method. The Company believes the FIFO method of inventory valuation is preferable for the raw materials valuation because FIFO provides a better matching of inventory costs of its products with the sales due to a lag in the pass-through of changes in resin costs to customers and enhances the comparability of results to our peers. As a result of this change, all prior period amounts have been retrospectively adjusted as of the beginning of the earliest period presented. |
| (3) | During fiscal 2012, we sold our Septic Chamber business and recognized a gain of $44.6 million. |
| (4) | Other miscellaneous (income) expense, net for fiscal year ended March 31, 2015 includes unfavorable mark-to-market adjustments of $7.7 million for changes in fair value on diesel fuel and raw material derivative contracts and a loss on a currency hedge tied to our Ideal Pipe acquisition of $5.6 million. |
| (5) | Adjusted Earnings per Fully Converted Share, Adjusted Net Income and Weighted Average Fully Converted Common Shares Outstanding, which are non-GAAP measures, are supplemental measures of financial performance that are not required by, or presented in accordance with GAAP. We calculate Adjusted earnings per fully converted share (Non-GAAP), Adjusted Net Income (Non-GAAP), and Weighted average fully converted common shares outstanding (Non-GAAP), by adjusting our Net income per share — Basic |
47
Table of Contents
| and Weighted average common shares outstanding – Basic, the most comparable GAAP measures. To effect this adjustment, we have (1) removed the adjustment for the change in fair value of Redeemable convertible preferred stock classified as mezzanine equity from the numerator of the Net income per share — Basic computation, (2) added back the dividends to Redeemable convertible preferred stockholders and dividends paid to unvested restricted stockholders, (3) made corresponding adjustments to the amount allocated to participating securities under the two-class earnings per share computation method, (4) added back ESOP deferred compensation attributable to the shares of Redeemable convertible preferred stock allocated to employee ESOP accounts during the applicable period, which is a non-cash charge to our earnings and not deductible for income tax purposes and (5) added back compensation expense recorded as a result of the January 2014 Special Dividend. |
We have also made adjustments to the Weighted average common shares outstanding — Basic to assume, (1) share conversion of the Redeemable convertible preferred stock to outstanding shares of common stock and (2) add shares of outstanding unvested restricted stock.
Adjusted Earnings Per Fully Converted Share (Non-GAAP) is included in this report because it is a key metric used by management and our board of directors to assess our financial performance on a per share basis assuming all shares held by the ESOP and all shares of redeemable common stock are converted to common stock. Adjusted Earnings Per Fully Converted Share (Non-GAAP) is not necessarily comparable to other similarly titled captions of other companies due to different methods of calculation.
The following table presents a reconciliation of Adjusted Earnings Per Fully Converted Share (Non-GAAP), Adjusted Net Income (Non-GAAP), and the Weighted Average Fully Converted Common Shares Outstanding (Non-GAAP) to our Net Income attributable to ADS, Net income per share and corresponding Weighted average common shares outstanding amounts, the most comparable GAAP measures, for each of the periods indicated.
| Fiscal Year Ended March 31, | ||||||||||||||||||||
| (Amounts in thousands, except per share data) | 2015 | 2014 | 2013 | 2012 | 2011 | |||||||||||||||
| (As Restated) (a) | (As Restated) (a) | (As Restated) (a) | (As Restated) (a) | |||||||||||||||||
| Net (loss) income available to common shareholders |
$ | (3,106 | ) | $ | (5,909 | ) | $ | 12,877 | $ | 21,402 | $ | (8,326 | ) | |||||||
| Weighted Average Common Shares Outstanding — Basic |
51,344 | 47,277 | 46,698 | 46,293 | 47,668 | |||||||||||||||
| Net (loss) income per share — Basic |
$ | (0.06 | ) | $ | (0.12 | ) | $ | 0.28 | $ | 0.46 | $ | (0.17 | ) | |||||||
| Adjustments to net (loss) income available to common shareholders: |
||||||||||||||||||||
| Change in fair value of redeemable convertible preferred stock |
11,054 | 3,979 | 5,869 | 10,257 | 3,541 | |||||||||||||||
| Dividends to redeemable convertible preferred stockholders |
661 | 10,139 | 735 | 668 | 844 | |||||||||||||||
| Dividends paid to unvested restricted stockholders |
11 | 418 | 52 | 34 | 104 | |||||||||||||||
| Undistributed income allocated to participating securities |
— | — | 1,127 | 2,237 | — | |||||||||||||||
|
|
|
|
|
|
|
|
|
|
|
|||||||||||
| Total adjustments to net (loss) income available to common shareholders |
11,726 | 14,536 | 7,783 | 13,196 | 4,489 | |||||||||||||||
|
|
|
|
|
|
|
|
|
|
|
|||||||||||
| Net income (loss) attributable to ADS |
$ | 8,620 | $ | 8,627 | $ | 20,660 | $ | 34,598 | $ | (3,837 | ) | |||||||||
|
|
|
|
|
|
|
|
|
|
|
|||||||||||
48
Table of Contents
| Fiscal Year Ended March 31, | ||||||||||||||||||||
| (Amounts in thousands, except per share data) | 2015 | 2014 | 2013 | 2012 | 2011 | |||||||||||||||
| (As Restated) (a) | (As Restated) (a) | (As Restated) (a) | (As Restated) (a) | |||||||||||||||||
| Adjustments to net income (loss) attributable to ADS: |
||||||||||||||||||||
| Fair value of ESOP compensation related to redeemable convertible preferred stock |
$ | 12,144 | $ | 7,891 | $ | 7,283 | $ | 4,957 | $ | 4,564 | ||||||||||
| Special dividend compensation |
— | 22,624 | — | — | — | |||||||||||||||
|
|
|
|
|
|
|
|
|
|
|
|||||||||||
| Adjusted net income — (Non-GAAP) |
$ | 20,764 | $ | 39,142 | $ | 27,943 | $ | 39,555 | $ | 727 | ||||||||||
|
|
|
|
|
|
|
|
|
|
|
|||||||||||
| Adjustments to Weighted Average Common Shares Outstanding — Basic: |
||||||||||||||||||||
| Unvested restricted shares |
228 | 336 | 292 | 208 | 183 | |||||||||||||||
| Redeemable convertible preferred shares |
20,029 | 20,264 | 20,555 | 20,836 | 23,168 | |||||||||||||||
|
|
|
|
|
|
|
|
|
|
|
|||||||||||
| Total Weighted Average Fully Converted Common Shares Outstanding (Non-GAAP) |
71,601 | 67,877 | 67,545 | 67,337 | 71,019 | |||||||||||||||
|
|
|
|
|
|
|
|
|
|
|
|||||||||||
| Adjusted Earnings per Fully Converted Share (Non-GAAP) |
$ | 0.29 | $ | 0.58 | $ | 0.41 | $ | 0.59 | $ | 0.01 | ||||||||||
|
|
|
|
|
|
|
|
|
|
|
|||||||||||
| (a) | See “Note 2. Restatement of Previously Issued Financial Statements” to our consolidated financial statements. |
| (6) | EBITDA and Adjusted EBITDA, which are non-GAAP financial measures, have been presented in this Annual Report on Form 10-K as supplemental measures of financial performance that are not required by, or presented in accordance with GAAP. We calculate EBITDA as net income before interest, income taxes, depreciation and amortization. We calculate Adjusted EBITDA as EBITDA before stock-based compensation expense, non-cash charges and certain other expenses. |
EBITDA and Adjusted EBITDA are included in this Annual Report on Form 10-K because they are key metrics used by management and our board of directors to assess our financial performance. EBITDA and Adjusted EBITDA are frequently used by analysts, investors and other interested parties to evaluate companies in our industry. In addition to covenant compliance and executive performance evaluations, we use Adjusted EBITDA to supplement GAAP measures of performance to evaluate the effectiveness of our business strategies, to make budgeting decisions and to compare our performance against that of other peer companies using similar measures.
EBITDA and Adjusted EBITDA are not GAAP measures of our financial performance and should not be considered as alternatives to net income as a measure of financial performance or cash flows from operations or any other performance measure derived in accordance with GAAP and they should not be construed as an inference that our future results will be unaffected by unusual or non-recurring items. EBITDA and Adjusted EBITDA contain certain other limitations, including the failure to reflect our cash expenditures, cash requirements for working capital needs and cash costs to replace assets being depreciated and amortized. In evaluating Adjusted EBITDA, you should be aware that in the future we will incur expenses that are the same as or similar to some of the adjustments in this presentation, such as stock-based compensation expense, derivative fair value adjustments, and foreign currency transaction losses. Our presentation of Adjusted EBITDA should not be construed to imply that our future results will be unaffected by any such adjustments. Management compensates for these limitations by relying on our GAAP results in addition to using EBITDA and Adjusted EBITDA supplementally. Our measures of EBITDA and Adjusted EBITDA are not necessarily comparable to other similarly titled captions of other companies due to different methods of calculation.
49
Table of Contents
The following table presents a reconciliation of EBITDA and Adjusted EBITDA to Net income, the most comparable GAAP measure, for each of the periods indicated.
| Fiscal Year Ended March 31, | ||||||||||||||||||||
| (Amounts in thousands) | 2015 | 2014 | 2013 | 2012 | 2011 | |||||||||||||||
| (As Restated) (a) | (As Restated) (a) | (As Restated) (a) | (As Restated) (a) | |||||||||||||||||
| Net income (loss) |
$ | 12,751 | $ | 12,220 | $ | 23,180 | $ | 35,566 | $ | (2,066 | ) | |||||||||
| Depreciation and amortization |
65,472 | 63,674 | 63,102 | 63,264 | 63,931 | |||||||||||||||
| Interest expense |
19,368 | 18,807 | 18,526 | 22,994 | 27,953 | |||||||||||||||
| Income tax expense |
9,443 | 19,949 | 15,935 | 26,184 | 5,963 | |||||||||||||||
|
|
|
|
|
|
|
|
|
|
|
|||||||||||
| EBITDA |
107,034 | 114,650 | 120,743 | 148,008 | 95,781 | |||||||||||||||
| Derivative fair value adjustments (b) |
7,746 | (53 | ) | (4 | ) | 2,315 | (1,365 | ) | ||||||||||||
| Foreign currency transaction losses (c) |
5,404 | 845 | 1,085 | 378 | 332 | |||||||||||||||
| Loss (gain) on disposal of assets or businesses (d) |
362 | (2,863 | ) | (951 | ) | (44,204 | ) | 472 | ||||||||||||
| Unconsolidated affiliates interest, taxes, depreciation and amortization (e) |
3,585 | 2,845 | 2,137 | 1,920 | 1,176 | |||||||||||||||
| Special dividend compensation (f) |
— | 22,624 | — | — | — | |||||||||||||||
| Contingent consideration remeasurement |
174 | 738 | (74 | ) | 63 | 154 | ||||||||||||||
| Stock-based compensation (g) |
5,880 | 4,518 | 2,080 | 1,264 | 2,457 | |||||||||||||||
| ESOP deferred stock-based compensation (h) |
12,144 | 7,891 | 7,283 | 4,957 | 4,564 | |||||||||||||||
| Asset impairment |
— | — | — | 4,900 | — | |||||||||||||||
| Transaction costs (i) |
1,448 | 1,560 | — | — | 403 | |||||||||||||||
|
|
|
|
|
|
|
|
|
|
|
|||||||||||
| Adjusted EBITDA |
$ | 143,777 | $ | 152,755 | $ | 132,299 | $ | 119,601 | $ | 103,974 | ||||||||||
|
|
|
|
|
|
|
|
|
|
|
|||||||||||
| (a) | See “Note 2. Restatement of Previously Issued Financial Statements” to our consolidated financial statements. |
| (b) | Represents the non-cash gains and losses arising from changes in mark-to-market values for derivative contracts related to diesel fuel, interest rate and propylene swaps. The impact of resin physical and financial derivatives is included in cost of goods sold. |
| (c) | Represents the gains and losses incurred on purchases, sales and intercompany loans and dividends denominated in non-functional currencies. Fiscal year 2015 includes a $5.6 million loss on Canadian currency derivative contract related to the Ideal Pipe acquisition. |
| (d) | Represents a gain recognized on the sale of our septic chamber business in January 2012. |
| (e) | Represents our proportional share of interest, income taxes, depreciation and amortization related to our South American joint venture, our BaySaver joint venture and our Tigre-ADS USA joint venture, which are accounted for under the equity method of accounting. Fiscal year 2014 includes our proportionate share of an asset impairment of $1.0 million recorded by our South American joint venture. |
| (f) | Represents compensation recorded as a result of the January 2014 Special Dividend on shares of Redeemable convertible preferred stock held by the ESOP. |
| (g) | Represents the non-cash stock-based compensation cost related to our stock options and restricted stock awards. |
| (h) | Represents the non-cash stock-based compensation expense attributable to the shares of convertible preferred stock allocated to employee ESOP accounts during the applicable period. |
| (i) | Represents expenses recorded related to legal, accounting and other professional fees incurred in connection with our debt refinancing, completion of the IPO and secondary public offering and asset acquisitions and dispositions. |
| (7) | Adjusted EBITDA margin for any period represents Adjusted EBITDA as a percentage of net sales for that period. |
50
Table of Contents
| (8) | Working capital is the difference between our current assets and current liabilities. Working capital is an indication of liquidity and potential need for short-term funding. |
| (9) | Our mezzanine equity consists of the Redeemable convertible preferred stock held by our ESOP and Redeemable common stock held by certain stockholders who have certain rights associated with such shares, which rights are considered to be a redemption right, which is beyond our control. See “Note 19. Mezzanine Equity,” within our consolidated financial statements included in “Item 8. Financial Statements and Supplementary Data,” of this Form 10-K for further information regarding the accounting treatment for our mezzanine equity. Upon the effective date of our IPO (July 25, 2014), the redemption feature of our Redeemable common stock was terminated. As a result, the Redeemable common stock was recorded at fair value through the effective date of the IPO and was subsequently reclassified at that fair value to permanent equity. In addition, upon the effective date of the IPO, the redemption feature of our Redeemable convertible preferred stock was no longer applicable. However, if our common stock is no longer a “registration-type class of security” (e.g., in the event of a delisting), the option held by the Trustee, which granted it the ability to put the shares of our Redeemable convertible preferred stock to us, would then become applicable. As such, the Redeemable convertible preferred stock was recorded to fair value at the effective date of the IPO on July 25, 2014 and will remain in mezzanine equity without further adjustment to carrying value unless it becomes probable that the redemption feature will become applicable. See Note 9, “Fair Value Measurements,” within our consolidated financial statements included in “Item 8. Financial Statements and Supplementary Data,” of this Form 10-K for further information regarding the accounting treatment for our mezzanine equity post-IPO. |
| (10) | The net effect of the restatement on the Company’s previously reported consolidated financial statements for the years ended March 31, 2012 and 2011, as well as the Company’s previously reported consolidated balance sheet as of March 31, 2013, is summarized below. |
The net effect of the restatement on the Company’s previously reported consolidated statements of operations for the years ended March 31, 2012 and 2011 is as follows:
| For the Year Ended March 31, 2012 | ||||||||||||||||||||||||||||
| As |
Adjustments | |||||||||||||||||||||||||||
| Leases | Inventory | Long-Lived Assets |
ADS Mexicana |
Income Taxes and Other |
As Restated | |||||||||||||||||||||||
| (Amounts in thousands, except per share data) |
||||||||||||||||||||||||||||
| Net sales |
$ | 1,013,756 | $ | — | $ | — | $ | — | $ | 1,321 | $ | 590 | $ | 1,015,667 | ||||||||||||||
|
|
|
|
|
|
|
|
|
|
|
|
|
|
|
|||||||||||||||
| Gross profit |
195,358 | (2,284 | ) | (16,501 | ) | (222 | ) | 371 | (692 | ) | 176,030 | |||||||||||||||||
| Income from operations |
95,053 | (2,049 | ) | (2,613 | ) | (2,159 | ) | (574 | ) | (2,058 | ) | 85,600 | ||||||||||||||||
| Income before income taxes |
70,791 | (3,206 | ) | (2,613 | ) | (2,136 | ) | (574 | ) | (1,143 | ) | 61,119 | ||||||||||||||||
| Net income |
44,431 | (3,206 | ) | (2,613 | ) | (2,136 | ) | (574 | ) | (336 | ) | 35,566 | ||||||||||||||||
|
|
|
|
|
|
|
|
|
|
|
|
|
|
|
|||||||||||||||
| Net income attributable to ADS |
43,260 | (3,206 | ) | (2,613 | ) | (2,136 | ) | (287 | ) | (420 | ) | 34,598 | ||||||||||||||||
|
|
|
|
|
|
|
|
|
|
|
|
|
|
|
|||||||||||||||
| Net income available to common stockholders |
$ | 29,060 | $ | (2,834 | ) | $ | (2,310 | ) | $ | (1,888 | ) | $ | (254 | ) | $ | (372 | ) | $ | 21,402 | |||||||||
|
|
|
|
|
|
|
|
|
|
|
|
|
|
|
|||||||||||||||
| Weighted average common shares outstanding: |
||||||||||||||||||||||||||||
| Basic |
46,293 | 46,293 | ||||||||||||||||||||||||||
| Diluted |
47,051 | 47,051 | ||||||||||||||||||||||||||
| Net income per share: |
||||||||||||||||||||||||||||
| Basic |
$ | 0.63 | $ | 0.46 | ||||||||||||||||||||||||
| Diluted |
$ | 0.62 | $ | 0.45 | ||||||||||||||||||||||||
| Cash dividends declared per share |
$ | 0.09 | $ | 0.09 | ||||||||||||||||||||||||
51
Table of Contents
| For the Year Ended March 31, 2011 | ||||||||||||||||||||||||||||
| As |
Adjustments | |||||||||||||||||||||||||||
| Leases | Inventory | Long-Lived Assets |
ADS Mexicana |
Income Taxes and Other |
As Restated |
|||||||||||||||||||||||
| (Amounts in thousands, except per share data) | ||||||||||||||||||||||||||||
| Net sales |
$ | 863,138 | $ | — | $ | — | $ | — | $ | (1,595 | ) | $ | 1,703 | $ | 863,246 | |||||||||||||
|
|
|
|
|
|
|
|
|
|
|
|
|
|
|
|||||||||||||||
| Gross profit |
170,974 | (85 | ) | (19,272 | ) | (949 | ) | (923 | ) | 810 | 150,555 | |||||||||||||||||
| Income from operations |
38,929 | (127 | ) | (6,042 | ) | (1,743 | ) | (1,168 | ) | (156 | ) | 29,693 | ||||||||||||||||
| Income before income taxes |
12,655 | (959 | ) | (6,042 | ) | (1,743 | ) | (687 | ) | (115 | ) | 3,109 | ||||||||||||||||
| Net income |
9,338 | (959 | ) | (6,042 | ) | (1,743 | ) | (687 | ) | (1,973 | ) | (2,066 | ) | |||||||||||||||
|
|
|
|
|
|
|
|
|
|
|
|
|
|
|
|||||||||||||||
| Net income (loss) attributable to ADS |
5,996 | (959 | ) | (6,042 | ) | (1,743 | ) | (609 | ) | (480 | ) | (3,837 | ) | |||||||||||||||
|
|
|
|
|
|
|
|
|
|
|
|
|
|
|
|||||||||||||||
| Net income (loss) available to common stockholders |
$ | 1,507 | $ | (959 | ) | $ | (6,042 | ) | $ | (1,743 | ) | $ | (609 | ) | $ | (480 | ) | $ | (8,326 | ) | ||||||||
|
|
|
|
|
|
|
|
|
|
|
|
|
|
|
|||||||||||||||
| Weighted average common shares outstanding: |
||||||||||||||||||||||||||||
| Basic |
47,668 | 47,668 | ||||||||||||||||||||||||||
| Diluted (a) |
48,699 | 47,668 | ||||||||||||||||||||||||||
| Net income (loss) per share: |
||||||||||||||||||||||||||||
| Basic |
$ | 0.03 | $ | (0.17 | ) | |||||||||||||||||||||||
| Diluted |
$ | 0.03 | $ | (0.17 | ) | |||||||||||||||||||||||
| Cash dividends declared per share |
$ | 0.09 | $ | 0.09 | ||||||||||||||||||||||||
| (a) | As restated amount excludes shares which became anti-dilutive as a result of the restatement. |
The net effect of the restatement on the Company’s previously reported consolidated balance sheet as of March 31, 2013, 2012 and 2011 is as follows:
| March 31, 2013 | ||||||||||||||||||||||||||||
| Adjustments | ||||||||||||||||||||||||||||
| As Previously Reported |
Leases | Inventory | Long-Lived Assets |
ADS Mexicana |
Income Taxes and Other |
As Restated | ||||||||||||||||||||||
| (Amounts in thousands) | ||||||||||||||||||||||||||||
| Cash |
$ | 1,361 | $ | — | $ | — | $ | — | $ | — | $ | — | $ | 1,361 | ||||||||||||||
| Working capital |
220,276 | (9,640 | ) | (3,490 | ) | (35 | ) | (1,731 | ) | (1,346 | ) | 204,034 | ||||||||||||||||
| Property, plant and equipment, net |
294,901 | 56,498 | — | (3,546 | ) | — | 28 | 347,881 | ||||||||||||||||||||
| Total assets |
907,739 | 56,306 | (8,257 | ) | (15,695 | ) | (1,731 | ) | 12,403 | 950,765 | ||||||||||||||||||
| Long-term debt obligation |
338,048 | — | — | — | — | — | 338,048 | |||||||||||||||||||||
| Long-term capital lease obligation |
— | 28,851 | — | — | — | — | 28,851 | |||||||||||||||||||||
| Total liabilities |
585,115 | 38,424 | (4,767 | ) | 84 | — | 23,486 | 642,342 | ||||||||||||||||||||
| Mezzanine equity |
608,346 | — | — | — | — | — | 608,346 | |||||||||||||||||||||
| Stockholders’ equity (deficit) |
(285,722 | ) | 17,882 | (3,490 | ) | (15,779 | ) | (1,731 | ) | (11,083 | ) | (299,923 | ) | |||||||||||||||
| March 31, 2012 | ||||||||||||||||||||||||||||
| Adjustments | ||||||||||||||||||||||||||||
| As Previously Reported |
Leases | Inventory | Long-Lived Assets |
ADS Mexicana |
Income Taxes and Other |
As Restated | ||||||||||||||||||||||
| (Amounts in thousands) | ||||||||||||||||||||||||||||
| Cash |
$ | 2,082 | $ | — | $ | — | $ | — | $ | — | $ | — | $ | 2,082 | ||||||||||||||
| Working capital |
208,268 | (6,701 | ) | (349 | ) | 97 | (1,275 | ) | (2,322 | ) | 197,718 | |||||||||||||||||
| Property, plant and equipment, net |
284,731 | 51,401 | — | (2,097 | ) | — | 96 | 334,131 | ||||||||||||||||||||
| Total assets |
905,028 | 52,196 | (6,456 | ) | (14,460 | ) | (1,275 | ) | 3,798 | 938,831 | ||||||||||||||||||
| Long-term debt obligation |
358,790 | — | — | — | — | — | 358,790 | |||||||||||||||||||||
| Long-term capital lease obligation |
— | 23,529 | — | — | — | — | 23,529 | |||||||||||||||||||||
| Total liabilities |
615,314 | 31,172 | (6,107 | ) | 88 | — | 16,486 | 656,953 | ||||||||||||||||||||
| Mezzanine equity |
557,563 | — | — | — | — | — | 557,563 | |||||||||||||||||||||
| Stockholders’ equity (deficit) |
(267,849 | ) | 21,024 | (349 | ) | (14,548 | ) | (1,275 | ) | (12,688 | ) | (275,685 | ) | |||||||||||||||
52
Table of Contents
| March 31, 2011 | ||||||||||||||||||||||||||||
| Adjustments | ||||||||||||||||||||||||||||
| As Previously Reported |
Leases | Inventory | Long-Lived Assets |
ADS Mexicana |
Income Taxes and Other |
As Restated | ||||||||||||||||||||||
| (Amounts in thousands) | ||||||||||||||||||||||||||||
| Cash |
$ | 2,151 | $ | — | $ | — | $ | — | $ | — | $ | — | $ | 2,151 | ||||||||||||||
| Working capital |
204,061 | (6,186 | ) | 2,265 | 231 | (719 | ) | (1,633 | ) | 198,019 | ||||||||||||||||||
| Property, plant and equipment, net |
297,827 | 40,717 | — | (1,869 | ) | — | 63 | 336,738 | ||||||||||||||||||||
| Total assets |
866,798 | 40,610 | (1,668 | ) | (12,361 | ) | (719 | ) | 10,202 | 902,862 | ||||||||||||||||||
| Long-term debt obligation |
362,624 | — | — | — | — | — | 362,624 | |||||||||||||||||||||
| Long-term capital lease obligation |
— | 10,179 | — | — | — | — | 10,179 | |||||||||||||||||||||
| Total liabilities |
618,351 | 16,381 | (3,933 | ) | 50 | — | 22,263 | 653,112 | ||||||||||||||||||||
| Mezzanine equity |
493,674 | — | — | — | — | — | 493,674 | |||||||||||||||||||||
| Stockholders’ equity (deficit) |
(245,227 | ) | 24,229 | 2,265 | (12,411 | ) | (719 | ) | (12,061 | ) | (243,924 | ) | ||||||||||||||||
The net effect of the restatement on the Company’s previously reported consolidated statements of cash flows for the years ended March 31, 2012 and 2011 is as follows:
| For the Year Ended March 31, 2012 | ||||||||||||
| (Amounts in thousands) | As Previously Reported |
Adjustments | As Restated | |||||||||
| Net cash provided by operating activities |
$ | 56,997 | $ | 5,510 | $ | 62,507 | ||||||
| Net cash used in investing activities |
(35,833 | ) | 1,995 | (33,838 | ) | |||||||
| Net cash used in financing activities |
(21,233 | ) | (7,551 | ) | (28,784 | ) | ||||||
| For the Year Ended March 31, 2011 | ||||||||||||
| (Amounts in thousands) | As Previously Reported |
Adjustments | As Restated | |||||||||
| Net cash provided by operating activities |
$ | 37,233 | $ | 8,804 | $ | 46,037 | ||||||
| Net cash used in investing activities |
(53,237 | ) | 1,073 | (52,164 | ) | |||||||
| Net cash provided by financing activities |
15,134 | (9,853 | ) | 5,281 | ||||||||
53
Table of Contents
ITEM 7. MANAGEMENT’S DISCUSSION AND ANALYSIS OF FINANCIAL CONDITION AND RESULTS OF OPERATIONS
Our fiscal year begins on April 1 and ends on March 31. Unless otherwise noted, references to “year” pertain to our fiscal year. For example, 2015 refers to fiscal 2015, which is the period from April 1, 2014 to March 31, 2015.
The following discussion and analysis of our financial condition and results of our operations should be read in conjunction with the consolidated financial statements and related footnotes included elsewhere in this Annual Report on Form 10-K. This discussion contains forward-looking statements that are based on the beliefs of our management, as well as assumptions made by, and information currently available to, our management. Our actual results could differ materially from those discussed below. Factors that could cause or contribute to such differences include, but are not limited to, those identified below, and those discussed in the sections titled “Item 1A. Risk Factors” and “Cautionary Statement About Forward-Looking Statements” included elsewhere in this Annual Report on Form 10-K. You should read the following discussion together with the sections titled “Item 1A. Risk Factors,” “Item 6. Selected Financial and Operating Data” and our consolidated financial statements, including the related notes, included in “Item 8. Financial Statements and Supplementary Data” of this Form 10-K.
We consolidate all of our joint ventures for purposes of GAAP, except for our South American Joint Venture, our BaySaver Joint Venture and our Tigre-ADS USA Joint Venture.
Overview
We are the leading manufacturer of high performance thermoplastic corrugated pipe, providing a comprehensive suite of water management products and superior drainage solutions for use in the underground construction and infrastructure marketplace. Our innovative products are used across a broad range of end markets and applications, including non-residential, residential, agriculture and infrastructure applications. We have established a leading position in many of these end markets by leveraging our national sales and distribution platform, our overall product breadth and scale and our manufacturing excellence. In the United States, our national footprint combined with our strong local presence and broad product offering make us the leader in an otherwise highly fragmented sector comprised of many smaller competitors. We believe the markets we serve in the United States represent approximately $10.5 billion of annual revenue opportunity. In addition, we believe the increasing acceptance of thermoplastic pipe products in international markets represents an attractive growth opportunity.
Our products are generally lighter, more durable, more cost effective and easier to install than comparable alternatives made with traditional materials. Following our entrance into the non-residential construction market with the introduction of N-12 corrugated polyethylene pipe in the late 1980s, our pipe has been displacing traditional materials, such as reinforced concrete, corrugated steel and PVC, across an ever expanding range of end markets. This has allowed us to consistently gain share and achieve above market growth throughout economic cycles. We expect to continue to drive conversion to our products from traditional materials as contractors, civil design engineers and municipal agencies increasingly acknowledge the superior physical attributes and compelling value proposition of our thermoplastic products. In addition, we believe that overall demand for our products will benefit as the regulatory environment continues to evolve.
Our broad product line includes HDPE pipe, PP pipe and related water management products. Building on our core drainage businesses, we have aggressively pursued attractive ancillary product categories such as storm and septic chambers, PVC drainage structures, fittings and filters, and water quality filters and separators. We refer to these ancillary product categories as Allied Products. Given the scope of our overall sales and distribution platform, we have been able to drive growth within our Allied Products and believe there are significant growth opportunities going forward.
54
Table of Contents
Key Factors Affecting Our Results of Operations
Product Demand
There are numerous factors that influence demand for our products. Our businesses are cyclical in nature and sensitive to general economic conditions, primarily in the United States, Canada, Mexico and South America. The non-residential, residential, agricultural and infrastructure markets we serve are affected by the availability of credit, lending practices, interest rates and unemployment rates. Demand for new homes, farm income, commercial development and highway infrastructure spending have a direct impact on our financial condition and results of operations. Accordingly, the following factors may have a direct impact on our business in the markets in which our products are sold:
| • | the strength of the economy; |
| • | the amount and type of non-residential and residential construction; |
| • | funding for infrastructure spending; |
| • | farm income and agricultural land values; |
| • | inventory of improved housing lots; |
| • | changes in raw material prices; |
| • | the availability and cost of credit; |
| • | non-residential occupancy rates; |
| • | commodity prices; and |
| • | demographic factors such as population growth and household formation. |
Product Pricing
The price of our products is impacted by competitive pricing dynamics in our industry as well as by raw material input costs. Our industry is highly competitive and the sales prices for our products may vary based on the sales policies of our competitors. Raw material costs represent a significant portion of the cost of goods sold for our pipe products, or Pipe. We aim to increase our product selling prices in order to cover raw material price increases, but the inability to do so could impact our profitability. Movements in raw material costs and resulting changes in the selling prices may also impact changes in period-to-period comparisons of net sales.
Material Conversion
Our HDPE and PP pipe and related water management product lines compete with other manufacturers of corrugated polyethylene pipe as well as manufacturers of alternative products made with traditional materials, such as concrete, steel and PVC. Our net sales are driven by market trends, including the continued increase in adoption of thermoplastic corrugated pipe products as a replacement for traditional materials. Thermoplastic corrugated pipe is generally lighter, more durable, more cost effective and easier to install than comparable products made from traditional materials. High performance thermoplastic corrugated pipe represented approximately 26% of the total storm sewer market in 2014; up from what we believe was less than 10% ten years ago and less than 1% twenty years ago. We believe this trend will continue as customers continue to acknowledge the superior attributes and compelling value proposition of our thermoplastic products and expanded regulatory approvals allow for their use in new markets and geographies. In addition, we believe that the recent introduction of PP pipe products will also help accelerate conversion given the additional applications for which our PP pipe products can be used.
We believe the adoption of HDPE and PP pipe outside of the United States is still in its early stages and represents a significant opportunity for us to continue to increase the conversion to our products from traditional products in these markets, including Canada, Mexico and South America where we operate.
55
Table of Contents
Growth in Allied Products
Our Allied Products include storm and septic chambers, PVC drainage structures, fittings, stormwater filters and water separators. These products complement our pipe product lines and allow us to offer a comprehensive water management solution to our customers and drive organic growth. Our leading market position in pipe products allows us to cross-sell Allied Products effectively. Our comprehensive offering of Allied Products also helps us increase pipe sales in certain markets. Our Allied Products typically carry higher gross margins as compared to our pipe product lines and are less sensitive to increases in resin prices since resin prices represent a smaller percentage of the cost for Allied Products.
Our leading position in the pipe market has allowed us to increase organic growth of our Allied Products. We also expect to expand our Allied Product offerings through acquisitions. For fiscal years 2015, 2014 and 2013, we generated sales of Allied Products of $283.5 million, $260.4 million and $248.6 million, respectively.
Raw Material Costs
Our raw material cost and product selling prices fluctuate with changes in the price of resins utilized in production. Virgin and recycled resins, which are derived either directly or indirectly from crude oil derivatives and natural gas liquids, currently account for approximately 60% of our cost for pipe products. Raw materials account for a similar percentage of the cost of our Allied Products. We actively manage our resin purchases and typically pass fluctuations in the cost of resin through to our customers in order to maximize our profitability. Fluctuations in the price of crude oil and natural gas prices may impact the cost of resin. In addition, changes in and disruptions to existing ethylene or polyethylene capacities could also significantly increase resin prices (such as the aftermath of Hurricanes Katrina and Rita), often within a short period of time, even if crude oil and natural gas prices remain low. Our ability to pass through raw material price increases to our customers may, in some cases, lag the increase in our costs of goods sold. Sharp rises in raw material prices over a short period of time have historically occurred with a significant supply disruption (hurricanes or fires at petrochemical facilities), which may increase prices to levels that cannot be fully passed through to customers due to pricing of competing products made from different raw materials or the anticipated length of time the raw material pricing will stay elevated. For more information regarding risks relating to our raw material costs, see “Item 1A. Risk Factors — Risks Relating to Our Business.”
We currently purchase in excess of 700 million pounds of virgin and recycled resin annually from over 450 suppliers in North America. As a high-volume buyer of resin, we are able to achieve economies of scale to negotiate favorable terms and pricing. Our purchasing strategies differ based on the material (virgin resin versus recycled material) ordered for delivery to our production locations. The price movements of the different materials also vary, resulting in the need to use a number of strategies to reduce volatility and successfully pass on cost increases to our customers through timely selling price increases when needed.
In order to reduce the volatility of raw material costs in the future, our raw material strategies for managing our costs include the following:
| • | increasing the use of less price-volatile recycled HDPE resin in our pipe products in place of virgin resin; |
| • | internally processing an increasing percentage of our recycled HDPE resin in order to closely monitor quality and minimize costs (approximately 66% of our recycled HDPE resin was internally processed in fiscal year 2015); |
| • | managing a resin price risk program that entails both physical fixed price and volume contracts along with financial hedges which are designed to apply to a significant portion of our annual virgin resin purchases . For our polypropylene virgin resin price exposure, we utilize financial hedges of propylene as a proxy for the polypropylene. Historically, the month to month change in market based pricing has been very similar between propylene and polypropylene |
| • | maintaining supply agreements with our major resin suppliers that provide multi-year terms and volumes that are in excess of our projected consumption. |
56
Table of Contents
We also consume a large amount of energy and other petroleum products in our operations, including the electricity we use in our manufacturing process as well as the diesel fuel consumed in delivering a significant volume of products to our customers through our in-house fleet. As a result, our operating profit also depends upon our ability to manage the cost of the energy and fuel we require, as well as our ability to pass through increased prices or surcharges to our customers.
Seasonality
Our operating results are impacted by seasonality. Historically, sales of our products have been higher in the first and second quarters of each fiscal year due to favorable weather and longer daylight conditions accelerating construction project activity during these periods while fourth quarter results are impacted by the timing of spring in the northern United States and Canada. Seasonal variations in operating results may also be significantly impacted by inclement weather conditions, such as cold or wet weather, which can delay projects, resulting in decreased net sales for one or more quarters, but we believe that these delayed projects generally result in increased net sales during subsequent quarters.
In the non-residential, residential and infrastructure markets in the northern United States and Canada, the construction season typically begins to gain momentum in late March and lasts through November, before winter sets in, significantly slowing the construction markets. In the southern and western United States, Mexico, Central America and South America, the construction markets are less seasonal. The agricultural drainage market is concentrated in the early spring just prior to planting and in the fall just after crops are harvested prior to freezing of the ground in winter.
Currency Exchange Rates
Although we sell and manufacture our products in many countries, our sales and production costs are primarily denominated in U.S. dollars. We have wholly–owned facilities in Canada, the Netherlands, and Puerto Rico and joint venture facilities in Mexico, Chile, Brazil, Argentina, Colombia and Peru. The functional currencies in the areas in which we have wholly–owned facilities and joint venture facilities other than the U.S. dollar are the Canadian dollar, Euro, Mexican peso, Chilean peso, Brazilian real, Argentine peso and Colombian peso. From time to time, we use derivatives to reduce our exposure to currency fluctuations. In 2013, we entered into Euro-denominated forward contracts to hedge transactions related to the procurement of new equipment, which expired prior to March 31, 2014. Also in 2013, our South American Joint Venture entered into multiple non-deliverable forward contracts to reduce its exposure to fluctuations in the U.S. dollar relative to the Chilean peso, Argentine peso, Colombian peso and Brazilian real. During fiscal 2015, we began to implement hedging strategies to manage exposure to the Canadian dollar and, to a lesser extent, the Mexican peso.
Description of our Segments
We operate a geographically diverse business, serving customers in approximately 80 countries. For fiscal year 2015, approximately 87% ($1,027.9 million) of net sales were attributable to customers located in the United States and approximately 13% ($152.1 million) of net sales were attributable to customers outside of the United States.
Our operations are organized into two reportable segments based on the markets we serve: Domestic and International. We generate a greater proportion of our net sales and gross profit in our Domestic segment, which consists of all regions of the United States. We expect the percentage of total net sales and gross profit derived from our International segment to continue to increase in future periods as we continue to expand globally. See “Note 23. Business Segment Information,” to our audited consolidated financial statements included in “Item 8. Financial Statements and Supplementary Data” of this Form 10-K.
57
Table of Contents
Domestic
In the United States, the markets we serve were strong through 2007, but slowed significantly beginning in 2008 in tandem with the decline in general economic conditions in the United States associated with the global financial crisis. Since 2011, a modest recovery in the markets in the United States has had a favorable impact on our product sales. Our operating results have been, and will continue to be, impacted by macroeconomic trends in the United States. For fiscal years 2015, 2014, and 2013, we generated net sales attributable to our Domestic segment of $1,027.9 million, $935.3 million, and $879.0 million, respectively. Unconsolidated sales for our two domestic unconsolidated joint ventures, BaySaver and Tigre-ADS USA, were $24.9 million and $5.2 million in fiscal years 2015 and 2014, respectively (there were no applicable sales amounts in fiscal year 2013 as the Company’s investments in these two domestic unconsolidated joint ventures did not occur until fiscal years 2014 and 2015, respectively).
International
Our International segment manufactures and markets products in regions outside of the United States, with a growth strategy focused on our owned facilities in Canada and those markets serviced through our joint ventures in Mexico, Central America and South America. Pipe manufactured in these countries is primarily sold into the same region. Our joint venture strategy has provided us with local and regional access to new markets. The outlook for our International segment has improved. Since 2011, a modest recovery in the international markets has had a favorable impact on our product sales, which grew 14.8% in fiscal 2015 after a decline in fiscal 2014. For fiscal years 2015, 2014, and 2013, we generated net sales attributable to our International segment of $152.1 million, $132.5 million, and $138.1 million, respectively. Net sales of our South American Joint Venture are accounted for under the equity method and not consolidated for financial reporting purposes. These unconsolidated sales were $58.5 million, $61.2 million, and $64.8 million in fiscal years 2015, 2014, and 2013, respectively.
Recent Developments
2014 Initial Public Offering (“IPO”)
On July 11, 2014, in anticipation of the IPO, we executed a 4.707-for-one split of our common and our preferred stock. The effect of the stock split on outstanding shares and earnings per share has been retroactively applied to all periods presented.
On July 25, 2014, we completed the IPO of our common stock, which resulted in the sale by the Company of 5,289,474 shares of common stock. We received total proceeds from the IPO of $79.1 million after excluding underwriter discounts and commissions of $5.5 million, based upon the price to the public of $16.00 per share. After deducting other offering expenses of $6.9 million, we used the net proceeds of $72.2 million to reduce the outstanding indebtedness under the revolving portion of our credit facility. The common stock is listed on the NYSE under the symbol “WMS.”
On August 22, 2014, an additional 600,000 shares of common stock were sold by certain selling stockholders of the Company as a result of the partial exercise by the underwriters of the over-allotment option granted by the selling stockholders to the underwriters in connection with the IPO. The shares were sold at the public offering price of $16.00 per share. The Company did not receive any proceeds from the sale of such additional shares.
2014 Secondary Public Offering (“Secondary Public Offering”)
On December 9, 2014, we completed a Secondary Public Offering of our common stock, which resulted in the sale of 10,000,000 shares of common stock by a certain selling stockholder of the Company at a public offering price of $21.25 per share. We did not receive any proceeds from the sale of shares by the selling stockholder.
58
Table of Contents
On December 15, 2014, an additional 1,500,000 shares of common stock were sold by a certain selling stockholder of the Company as a result of the full exercise by the underwriters of the over-allotment option granted by the selling stockholder to the underwriters in connection with the Secondary Public Offering. The shares were sold at the public offering price of $21.25 per share. The Company did not receive any proceeds from the sale of such additional shares.
Acquisition of Ideal Pipe
On January 30, 2015, Hancor of Canada, Inc., a wholly-owned subsidiary of the Company, acquired all issued and outstanding shares of Ideal Drain Tile Limited and Wave Plastics Inc., the sole partners of Ideal Pipe (together “Ideal Pipe”) for a contractual purchase price of $55.7 million Canadian dollars, financed through our existing line of credit facility. Ideal Pipe designs, manufactures and markets high performance thermoplastic corrugated pipe and related water management products used across a broad range of Canadian end markets and applications, including nonresidential, residential, agriculture, and infrastructure applications. The acquisition further strengthens our positions in Canada by increasing our size and scale in the market, as well as enhancing our manufacturing, marketing and distribution capabilities. The results of operations of Ideal Pipe are included in our Consolidated Statements of Operations after January 30, 2015.
In connection with the agreement to acquire Ideal Pipe, we entered into a Canadian dollar foreign exchange contract to hedge our exposure to changes to the Canadian dollar-denominated purchase price, which had the effect of fixing the purchase price at $49 million U.S. dollars net of the working capital true up payment expected to be received by ADS. As the result of foreign currency exchange rate changes between the agreement date and the date the purchase price was paid, the Company ultimately paid $36.4 million U.S. dollars for the acquisition (net of $7.4 million of cash acquired), and recorded a purchase price of $43.8 million U.S. dollars. The Canadian dollar weakened during the period of time covered by the derivative, which resulted in a $5.6 million loss. The loss on the derivative is recorded in Other miscellaneous expense (income), net in our Consolidated Statements of Operations.
Restatement of Previously Issued Financial Statements
The accompanying Management’s Discussion and Analysis of Financial Condition and Results of Operations gives effect to the restatement adjustments made to the previously reported Consolidated Financial Statements for the years ended March 31, 2014 and March 31, 2013. For additional information and a detailed discussion of the restatement, see “Note 2. Restatement of Previously Issued Financial Statements” included in “Item 8. Financial Statements and Supplementary Data,” of this Form 10-K.
Components of Results of Operations
Net Sales
Net sales consist of the consideration received or receivable for the sale of products in the ordinary course of our business and is presented net of sales tax and allowances for returns, rebates and discounts. We derive our net sales from selling Pipe and Allied Products. We ship products to customers primarily by our internal fleet of trucks with a much smaller portion being shipped by third-party carriers. Net sales are recognized when persuasive evidence of an arrangement exists, delivery has occurred, the price to the buyer is fixed or determinable, and collectability is reasonably assured. In fiscal year 2015, we served approximately 18,000 customers with one customer generating more than 10% of our total net sales. Ferguson Enterprises accounted for 10.7%, 10.6% and 9.7% of fiscal year 2015, 2014 and 2013 net sales, respectively.
Cost of Goods Sold and Gross Margin
Cost of goods sold consists of the direct cost of raw material and labor used in the manufacture of our products as well as indirect costs such as labor, depreciation, insurance, supplies, tools, repairs and shipping and handling. Our principal products are manufactured primarily from polyethylene and polypropylene resins that
59
Table of Contents
enable the end products to better resist weathering, ultraviolet degradation and chemical exposure. For Pipe, the majority of the costs to manufacture and deliver the products are variable in nature including raw materials, processing (including direct labor) and delivery (freight). For Allied Products, cost of goods sold varies by product line and consists of raw material/purchase costs, processing costs and delivery costs.
Selling Expenses
Selling expenses consist of personnel costs (salaries, benefits and variable sales commissions), travel and entertainment expenses, marketing, promotion and advertising expenses, as well as bad debt provisions.
General and Administrative Expenses
General and administrative expenses consist of personnel costs (salaries, benefits and other personnel-related expenses, including stock-based compensation), recruitment and relocation expenses, accounting and legal fees, business travel expenses, rent, depreciation and utilities for the administrative offices, director fees, investor relations, membership fees, office supplies, insurance and other miscellaneous expenses.
Intangibles Amortization
Intangibles amortization consists of the amortization of intangibles purchased as part of business combinations, acquired technology, patents and technology licenses, which are amortized using the straight-line method over their estimated useful lives.
Interest Expense
Interest expense consists of interest payments on our Credit Facilities, including our Bank Term Loans, Senior Notes, the amortization of deferred financing costs related to debt borrowings and interest on our capital lease obligations. See “Note 6. Leases” and “Note 13. Debt” to our consolidated financial statements included in “Item 8. Financial Statements and Supplementary Data” of this Form 10-K.
Income Tax Expense
Income tax expense consists of federal, state, local and foreign taxes based on income in multiple jurisdictions, including the United States, Canada, Mexico, Chile, Brazil and Puerto Rico. We expect our effective tax rate to decrease over time as our earnings grow reducing the impact of non-deductible items in our Domestic tax calculations.
EBITDA and Adjusted EBITDA
EBITDA and Adjusted EBITDA, including Segment EBITDA and Segment Adjusted EBITDA, which are non-GAAP financial measures, have been presented in this Annual Report on Form 10-K as supplemental measures of financial performance that are not required by, or presented in accordance with generally accepted accounting principles or GAAP. We calculate EBITDA as net income before interest, income taxes, depreciation and amortization. We calculate Adjusted EBITDA as EBITDA before stock-based compensation expense, non-cash charges and certain other expenses.
EBITDA and Adjusted EBITDA are included in this Annual Report on Form 10-K because they are key metrics used by management and our board of directors to assess our financial performance. EBITDA and Adjusted EBITDA are frequently used by analysts, investors and other interested parties to evaluate companies in our industry. In addition to covenant compliance and executive performance evaluations, we use Adjusted EBITDA to supplement GAAP measures of performance to evaluate the effectiveness of our business strategies, to make budgeting decisions and to compare our performance against that of other peer companies using similar measures.
60
Table of Contents
EBITDA and Adjusted EBITDA are not GAAP measures of our financial performance and should not be considered as an alternative to net income as a measure of financial performance , or any other performance measure derived in accordance with GAAP and they should not be construed as an inference that our future results will be unaffected by unusual or non-recurring items. Additionally, EBITDA and Adjusted EBITDA are not intended to be measures of free cash flow for management’s discretionary use, as they do not reflect certain cash requirements such as tax payments, debt service requirements, capital expenditures and certain other cash costs that may recur in the future. EBITDA and Adjusted EBITDA contain certain other limitations, including the failure to reflect our cash expenditures, cash requirements for working capital needs and cash costs to replace assets being depreciated and amortized. In evaluating Adjusted EBITDA, you should be aware that in the future we will incur expenses that are the same as or similar to some of the adjustments in this presentation, such as stock based compensation expense, derivative fair value adjustments, and foreign currency transaction losses. Our presentation of Adjusted EBITDA should not be construed to imply that our future results will be unaffected by any such adjustments. Management compensates for these limitations by relying on our GAAP results in addition to using EBITDA and Adjusted EBITDA. Our measures of EBITDA and Adjusted EBITDA are not necessarily comparable to other similarly titled captions of other companies due to different methods of calculation.
The following table presents a reconciliation of EBITDA and Adjusted EBITDA to Net income, the most comparable GAAP measure, for each of the periods indicated:
| Fiscal Year Ended March 31, | ||||||||||||
| (Amounts in thousands) | 2015 | 2014 | 2013 | |||||||||
| (As Restated) (a) | (As Restated) (a) | |||||||||||
| Net income |
$ | 12,751 | $ | 12,220 | $ | 23,180 | ||||||
| Depreciation and amortization |
65,472 | 63,674 | 63,102 | |||||||||
| Interest expense |
19,368 | 18,807 | 18,526 | |||||||||
| Income tax expense |
9,443 | 19,949 | 15,935 | |||||||||
|
|
|
|
|
|
|
|||||||
| EBITDA |
107,034 | 114,650 | 120,743 | |||||||||
| Derivative fair value adjustments (b) |
7,746 | (53 | ) | (4 | ) | |||||||
| Foreign currency transaction losses (c) |
5,404 | 845 | 1,085 | |||||||||
| Loss (gain) on disposal of assets or businesses |
362 | (2,863 | ) | (951 | ) | |||||||
| Unconsolidated affiliates interest, taxes, depreciation and amortization (d) |
3,585 | 2,845 | 2,137 | |||||||||
| Special dividend compensation (e) |
— | 22,624 | — | |||||||||
| Contingent consideration remeasurement |
174 | 738 | (74 | ) | ||||||||
| Stock-based compensation (f) |
5,880 | 4,518 | 2,080 | |||||||||
| ESOP deferred stock-based compensation (g) |
12,144 | 7,891 | 7,283 | |||||||||
| Transaction costs (h) |
1,448 | 1,560 | — | |||||||||
|
|
|
|
|
|
|
|||||||
| Adjusted EBITDA |
$ | 143,777 | $ | 152,755 | $ | 132,299 | ||||||
|
|
|
|
|
|
|
|||||||
| (a) | See “Note 2. Restatement of Previously Issued Financial Statements” to our consolidated financial statements. |
| (b) | Represents the non-cash gains and losses arising from changes in mark-to-market values for derivative contracts related to propylene, diesel fuel and interest rate swaps. The impact of resin physical fixed price contracts is included in cost of goods sold. |
| (c) | Represents the gains and losses incurred on purchases, sales and intercompany loans and dividends denominated in non-functional currencies. Fiscal year 2015 includes a $5.6 million loss on the Ideal Pipe acquisition Canadian currency derivative contract. |
| (d) | Represents our proportional share of interest, income taxes, depreciation and amortization related to our South American joint venture, our BaySaver joint venture and our Tigre-ADS USA joint venture, which are accounted for under the equity method of accounting. Fiscal year 2014 includes our proportionate share of an asset impairment of $1.0 million recorded by our South American joint venture. |
61
Table of Contents
| (e) | Represents compensation recorded as a result of the January 2014 Special Dividend on shares of Redeemable convertible preferred stock held by the ESOP. |
| (f) | Represents the non-cash stock-based compensation cost related to our stock options and restricted stock awards. |
| (g) | Represents the non-cash stock-based compensation expense attributable to the shares of Redeemable convertible preferred stock allocated to employee ESOP accounts during the applicable period. |
| (h) | Represents expenses recorded related to legal, accounting and other professional fees incurred in connection with our debt refinancing, completion of the IPO and secondary public offering and asset acquisitions and dispositions. |
The following table presents a reconciliation of Segment EBITDA and Segment Adjusted EBITDA to Net income, the most comparable GAAP measure, for each of the periods indicated:
| 2015 | 2014 | 2013 | ||||||||||||||||||||||
| (Amounts in thousands) | Domestic | International | Domestic | International | Domestic | International | ||||||||||||||||||
| (As Restated) (a) | (As Restated) (a) | (As Restated) (a) | (As Restated) (a) | |||||||||||||||||||||
| Net income |
$ | 7,198 | $ | 5,553 | $ | 4,962 | $ | 7,258 | $ | 11,180 | $ | 12,000 | ||||||||||||
| Depreciation and amortization |
59,397 | 6,075 | 57,834 | 5,840 | 57,728 | 5,374 | ||||||||||||||||||
| Interest expense |
19,308 | 60 | 18,659 | 148 | 18,390 | 136 | ||||||||||||||||||
| Income tax expense |
8,510 | 933 | 17,924 | 2,025 | 13,949 | 1,986 | ||||||||||||||||||
|
|
|
|
|
|
|
|
|
|
|
|
|
|||||||||||||
| Segment EBITDA |
94,413 | 12,621 | 99,379 | 15,271 | 101,247 | 19,496 | ||||||||||||||||||
| Derivative fair value adjustments (b) |
7,774 | (28 | ) | (53 | ) | — | (4 | ) | — | |||||||||||||||
| Foreign currency transaction losses (gains) (c) |
5,636 | (232 | ) | — | 845 | — | 1,085 | |||||||||||||||||
| Loss (gain) on sale of disposal or businesses |
257 | 105 | (2,817 | ) | (46 | ) | (880 | ) | (71 | ) | ||||||||||||||
| Unconsolidated affiliates interest, taxes, depreciation and amortization (d) |
1,341 | 2,244 | 156 | 2,689 | — | 2,137 | ||||||||||||||||||
| Special dividend compensation (e) |
— | — | 22,624 | — | — | — | ||||||||||||||||||
| Contingent consideration remeasurement |
174 | — | 738 | — | (74 | ) | — | |||||||||||||||||
| Stock-based compensation (f) |
5,880 | — | 4,518 | — | 2,080 | — | ||||||||||||||||||
| ESOP deferred stock-based compensation (g) |
12,144 | — | 7,891 | — | 7,283 | — | ||||||||||||||||||
| Transaction costs (h) |
1,448 | — | 1,560 | — | — | — | ||||||||||||||||||
|
|
|
|
|
|
|
|
|
|
|
|
|
|||||||||||||
| Segment Adjusted EBITDA |
$ | 129,067 | $ | 14,710 | $ | 133,996 | $ | 18,759 | $ | 109,652 | $ | 22,647 | ||||||||||||
|
|
|
|
|
|
|
|
|
|
|
|
|
|||||||||||||
| (a) | See “Note 2. Restatement of Previously Issued Financial Statements” to our consolidated financial statements. |
| (b) | Represents the non-cash gains and losses arising from changes in mark-to-market values for derivative contracts related to propylene, diesel fuel and interest rate swaps. |
| (c) | Represents the gains and losses incurred on purchases, sales and intercompany loans and dividends denominated in non-functional currencies. Fiscal year 2015 includes a $5.6 million loss on Canadian currency derivative contract related to the Ideal Pipe acquisition. |
62
Table of Contents
| (d) | Represents our proportional share of interest, income taxes, depreciation and amortization related to our South American joint venture, our BaySaver joint venture and our Tigre-ADS USA joint venture, which are accounted for under the equity method of accounting. Fiscal year 2014 includes our proportionate share of an asset impairment of $1.0 million recorded by our South American joint venture. |
| (e) | Represents compensation recorded as a result of the January 2014 Special Dividend of Redeemable convertible preferred shares held by the ESOP. |
| (f) | Represents the non-cash stock-based compensation cost related to our stock options and restricted stock awards. |
| (g) | Represents the non-cash stock-based compensation expense attributable to the shares of Redeemable convertible preferred stock allocated to employee ESOP accounts during the applicable period. |
| (h) | Represents expenses recorded related to legal, accounting and other professional fees incurred in connection with our debt refinancing, completion of the IPO and secondary public offering and asset acquisitions and dispositions. |
System-Wide Net Sales
System-Wide Net Sales is a non-GAAP measure which equals the sum of the net sales of our Domestic and International segments plus all net sales from our unconsolidated joint ventures (our South American Joint Venture, our BaySaver Joint Venture and our Tigre-ADS USA Joint Venture). We use this metric to measure the overall performance of our business across all of our geographies and markets we serve.
Our South American Joint Venture is managed as an integral part of our International segment and our BaySaver and Tigre-ADS USA Joint Ventures are managed as an integral part of our Domestic segment. However, they are not consolidated under GAAP. System-Wide Net Sales is prepared as if our South American Joint Venture, our BaySaver Joint Venture and our Tigre-ADS USA Joint Venture were accounted for as consolidated subsidiaries for management and segment reporting purposes.
The reconciliation of our System-Wide Net Sales to net sales is as follows:
| Fiscal Year Ended March 31, | ||||||||||||
| (Amounts in thousands) | 2015 | 2014 | 2013 | |||||||||
| (As Restated) (a) | (As Restated) (a) | |||||||||||
| Reconciliation of System-Wide Net Sales to Net Sales: |
||||||||||||
| Net sales |
$ | 1,180,073 | $ | 1,067,780 | $ | 1,017,102 | ||||||
| Net sales associated with our unconsolidated affiliates |
||||||||||||
| South American joint venture (b) |
58,454 | 61,243 | 64,834 | |||||||||
| BaySaver joint venture (c) |
10,623 | 5,195 | — | |||||||||
| Tigre-ADS USA joint venture (d) |
14,264 | — | — | |||||||||
|
|
|
|
|
|
|
|||||||
| System-Wide Net Sales |
$ | 1,263,414 | $ | 1,134,218 | $ | 1,081,936 | ||||||
|
|
|
|
|
|
|
|||||||
| (a) | See “Note 2. Restatement of Previously Issued Financial Statements” to our consolidated financial statements. |
| (b) | On July 31, 2009, we entered into an arrangement to form our South American joint venture. |
| (c) | On July 15, 2013, we entered into an arrangement to form our BaySaver joint venture. |
| (d) | On April 7, 2014, we entered into an arrangement to form our Tigre-ADS USA joint venture. |
Adjusted Earnings per Fully Converted Share, Adjusted Net Income and Weighted Average Fully Converted Common Shares Outstanding
Adjusted Earnings per Fully Converted Share, Adjusted Net Income and Weighted Average Fully Converted Common Shares Outstanding, which are non-GAAP measures, are supplemental measures of financial
63
Table of Contents
performance that are not required by, or presented in accordance with GAAP. We calculate Adjusted Earnings Per Fully Converted Share (Non-GAAP), Adjusted Net Income (Non-GAAP), and Weighted Average Fully Converted Common Shares Outstanding (Non-GAAP), by adjusting our Net income per share — Basic and Weighted average common shares outstanding — Basic, the most comparable GAAP measures. To effect this adjustment, we have (1) removed the adjustment for the change in fair value of Redeemable convertible preferred stock classified as mezzanine equity from the numerator of the Net income per share — Basic computation, (2) added back the dividends to Redeemable convertible preferred stockholders and dividends paid to unvested restricted stockholders, (3) made corresponding adjustments to the amount allocated to participating securities under the two-class earnings per share computation method, and (4) added back ESOP deferred compensation attributable to the shares of Redeemable convertible preferred stock allocated to employee ESOP accounts during the applicable period, which is a non-cash charge to our earnings and not deductible for income tax purposes and (5) added back compensation expense recorded as a result of the January 2014 Special Dividend. We have also made adjustments to the Weighted average common shares outstanding — Basic to assume, (1) share conversion of the Redeemable convertible preferred stock to outstanding shares of common stock and (2) add shares of outstanding unvested restricted stock.
Adjusted Earnings Per Fully Converted Share (Non-GAAP) is included in this report because it is a key metric used by management and our board of directors to assess our financial performance as if all shares held by the ESOP and all redeemable common shares were to be converted to common shares. Adjusted Earnings Per Fully Converted Share (Non-GAAP) is not necessarily comparable to other similarly titled captions of other companies due to different methods of calculation.
The following table presents a reconciliation of Adjusted Earnings Per Fully Converted Share (Non-GAAP), Adjusted Net Income (Non-GAAP), and the Weighted Average Fully Converted Common Shares Outstanding (Non-GAAP) to our Net Income attributable to ADS, Net income per share and corresponding Weighted average common shares outstanding amounts, the most comparable GAAP measures, for each of the periods indicated.
| Fiscal Year Ended March 31, | ||||||||||||
| (Amounts in thousands, except per share data) | 2015 | 2014 | 2013 | |||||||||
| (As Restated) (a) | (As Restated) (a) | |||||||||||
| Net (loss) income available to common shareholders |
$ | (3,106 | ) | $ | (5,909 | ) | $ | 12,877 | ||||
| Adjustments to net loss (income) available to common shareholders: |
||||||||||||
| Change in fair value of Redeemable convertible preferred stock |
11,054 | 3,979 | 5,869 | |||||||||
| Dividends to Redeemable convertible preferred stockholders |
661 | 10,139 | 735 | |||||||||
| Dividends paid to unvested restricted stockholders |
11 | 418 | 52 | |||||||||
| Undistributed income allocated to participating securities |
— | — | 1,127 | |||||||||
|
|
|
|
|
|
|
|||||||
| Total adjustments to net (loss) income available to common shareholders |
11,726 | 14,536 | 7,783 | |||||||||
|
|
|
|
|
|
|
|||||||
| Net income attributable to ADS |
$ | 8,620 | $ | 8,627 | $ | 20,660 | ||||||
|
|
|
|
|
|
|
|||||||
| Adjustments to net income attributable to ADS: |
||||||||||||
| Fair value of ESOP compensation related to Redeemable convertible preferred stock |
12,144 | 7,891 | 7,283 | |||||||||
| Special dividend compensation |
— | 22,624 | — | |||||||||
|
|
|
|
|
|
|
|||||||
| Adjusted net income — (Non-GAAP) |
$ | 20,764 | $ | 39,142 | $ | 27,943 | ||||||
|
|
|
|
|
|
|
|||||||
| Weighted Average Common Shares Outstanding — Basic |
51,344 | 47,277 | 46,698 | |||||||||
| Adjustments to Weighted Average Common Shares Outstanding — Basic |
||||||||||||
| Unvested restricted shares |
228 | 336 | 292 | |||||||||
| Redeemable convertible preferred shares |
20,029 | 20,264 | 20,555 | |||||||||
|
|
|
|
|
|
|
|||||||
| Total Weighted Average Fully Converted Common Shares (Non-GAAP) |
71,601 | 67,877 | 67,545 | |||||||||
| Adjusted Earnings per Fully Converted Share (Non-GAAP) |
$ | 0.29 | $ | 0.58 | $ | 0.41 | ||||||
|
|
|
|
|
|
|
|||||||
64
Table of Contents
| (a) | See “Note 2. Restatement of Previously Issued Financial Statements” to our consolidated financial statements. |
Results of Operations by Segment
The following table presents our net sales, net sales as a percentage of total net sales, Segment Adjusted EBITDA and Segment Adjusted EBITDA as a percentage of total Adjusted EBITDA by segment for the periods presented.
| Fiscal Year Ended March 31, | ||||||||||||||||||||||||
| (Amounts in thousands) | 2015 | 2014 | 2013 | |||||||||||||||||||||
| (As Restated) (a) | (As Restated) (a) | |||||||||||||||||||||||
| Net Sales by Segment |
||||||||||||||||||||||||
| Domestic: |
||||||||||||||||||||||||
| Pipe |
$ | 771,214 | 65.3 | % | $ | 700,270 | 65.6 | % | $ | 655,288 | 64.4 | % | ||||||||||||
| Allied Products |
256,719 | 21.8 | % | 235,022 | 22.0 | % | 223,676 | 22.0 | % | |||||||||||||||
|
|
|
|
|
|
|
|
|
|
|
|
|
|||||||||||||
| Total domestic |
1,027,933 | 87.1 | % | 935,292 | 87.6 | % | 878,964 | 86.4 | % | |||||||||||||||
|
|
|
|
|
|
|
|
|
|
|
|
|
|||||||||||||
| International |
||||||||||||||||||||||||
| Pipe |
125,407 | 10.6 | % | 107,078 | 10.0 | % | 113,236 | 11.1 | % | |||||||||||||||
| Allied Products |
26,733 | 2.3 | % | 25,410 | 2.4 | % | 24,902 | 2.5 | % | |||||||||||||||
|
|
|
|
|
|
|
|
|
|
|
|
|
|||||||||||||
| Total international |
152,140 | 12.9 | % | 132,488 | 12.4 | % | 138,138 | 13.6 | % | |||||||||||||||
|
|
|
|
|
|
|
|
|
|
|
|
|
|||||||||||||
| Total net sales |
$ | 1,180,073 | 100.0 | % | $ | 1,067,780 | 100.0 | % | $ | 1,017,102 | 100.0 | % | ||||||||||||
|
|
|
|
|
|
|
|
|
|
|
|
|
|||||||||||||
| Segment Adjusted EBITDA |
||||||||||||||||||||||||
| Domestic |
$ | 129,067 | 89.8 | % | $ | 133,996 | 87.7 | % | $ | 109,652 | 82.9 | % | ||||||||||||
| International |
14,710 | 10.2 | % | 18,759 | 12.3 | % | 22,647 | 17.1 | % | |||||||||||||||
|
|
|
|
|
|
|
|
|
|
|
|
|
|||||||||||||
| Total adjusted EBITDA |
$ | 143,777 | 100.0 | % | $ | 152,755 | 100.0 | % | $ | 132,299 | 100.0 | % | ||||||||||||
|
|
|
|
|
|
|
|
|
|
|
|
|
|||||||||||||
| (a) | See “Note 2. Restatement of Previously Issued Financial Statements” to the consolidated financial statements. |
65
Table of Contents
Results of Operations
Fiscal Year Ended March 31, 2015 Compared with Fiscal Year Ended March 31, 2014
The following table summarizes certain financial information relating to our operating results that have been derived from our consolidated financial statements for the fiscal years ended March 31, 2015 and 2014. Also included is certain information relating to the operating results as a percentage of net sales. We believe this presentation is useful to investors in comparing historical results.
| (Amounts in thousands, except per share data) | Fiscal Year Ended March 31, 2015 |
% of Net Sales |
Fiscal Year Ended March 31, 2014 |
% of Net Sales |
% Variance |
|||||||||||||||
| (As Restated) (a) | ||||||||||||||||||||
| Consolidated Statements of Operations data: |
||||||||||||||||||||
| Net sales |
$ | 1,180,073 | 100.0 | % | $ | 1,067,780 | 100.0 | % | 10.5 | % | ||||||||||
| Cost of goods sold |
973,960 | 82.5 | 873,810 | 81.8 | 11.5 | |||||||||||||||
|
|
|
|
|
|
|
|
|
|||||||||||||
| Gross profit |
206,113 | 17.5 | 193,970 | 18.2 | 6.3 | |||||||||||||||
| Selling expenses |
78,981 | 6.7 | 74,042 | 6.9 | 6.7 | |||||||||||||||
| General and administrative expenses |
58,749 | 5.0 | 59,761 | 5.6 | (1.7 | ) | ||||||||||||||
| Loss (gain) on sale of disposal or businesses |
362 | — | (2,863 | ) | (0.3 | ) | (112.6 | ) | ||||||||||||
| Intangible amortization |
9,754 | 0.8 | 10,145 | 1.0 | (3.9 | ) | ||||||||||||||
|
|
|
|
|
|
|
|
|
|||||||||||||
| Income from operations |
58,267 | 4.9 | 52,885 | 5.0 | 10.2 | |||||||||||||||
| Interest expense |
19,368 | 1.6 | 18,807 | 1.8 | 3.0 | |||||||||||||||
| Other miscellaneous expense, net |
14,370 | 1.2 | (1,177 | ) | (0.1 | ) | (1,320.9 | ) | ||||||||||||
|
|
|
|
|
|
|
|
|
|||||||||||||
| Income before income taxes |
24,529 | 2.1 | 35,255 | 3.3 | (30.4 | ) | ||||||||||||||
| Income tax expense |
9,443 | 0.8 | 19,949 | 1.9 | (52.7 | ) | ||||||||||||||
| Equity in net loss of unconsolidated affiliates |
2,335 | 0.2 | 3,086 | 0.3 | (24.3 | ) | ||||||||||||||
|
|
|
|
|
|
|
|
|
|||||||||||||
| Net income |
12,751 | 1.1 | 12,220 | 1.1 | 4.3 | |||||||||||||||
| Less net income attributable to the non-controlling interest |
4,131 | 0.4 | 3,593 | 0.3 | 15.0 | |||||||||||||||
|
|
|
|
|
|
|
|
|
|||||||||||||
| Net income attributable to ADS |
$ | 8,620 | 0.7 | % | $ | 8,627 | 0.8 | % | (0.1 | )% | ||||||||||
|
|
|
|
|
|
|
|
|
|||||||||||||
| Other financial data: |
||||||||||||||||||||
| Adjusted EBITDA |
$ | 143,777 | 12.2 | % | $ | 152,755 | 14.3 | % | (5.9 | )% | ||||||||||
| System-Wide Net Sales |
$ | 1,263,414 | 107.1 | % | $ | 1,134,218 | 106.2 | % | 11.4 | % | ||||||||||
| Adjusted Earnings Per Fully Converted Share |
$ | 0.29 | — | $ | 0.58 | — | (50.0 | )% | ||||||||||||
| (a) | See “Note 2. Restatement of Previously Issued Financial Statements” to the consolidated financial statements. |
Net sales
Net sales totaled $1,180.1 million in fiscal year 2015, increasing $112.3 million, or 10.5%, as compared to fiscal year 2014. Our Domestic sales increased $92.7 million, or 9.9%, as compared to fiscal year 2014 due to increases in Pipe and Allied Product sales of $70.9 million, or 10.1%, and $21.8 million, or 9.2%, respectively. Continued strong recovery in our markets, impacted by an increase in residential construction, solid increases in nonresidential construction and further gains from conversion to our products from traditional products, were the primary drivers of the increase in the volume of Domestic Pipe and Allied Product sales. Domestic Pipe selling prices increased 5.2% as compared to the prior year. International sales increased $19.6 million, or 14.8%, to $152.1 million in fiscal year 2015, as compared to $132.5 million in the prior year. International Pipe sales strengthened in the last 6 months of the fiscal year led by stronger markets in Mexico and solid growth in Canada despite the impact of a lower Canadian dollar.
66
Table of Contents
Cost of goods sold and Gross profit
Gross profit increased $12.1 million, or 6.3%, to $206.1 million during fiscal year 2015 as compared to $194.0 million during fiscal year 2014. Compensation expense relating to a one-time special dividend paid in January 2014 (the “Special Dividend”) resulted in a one-time expense to Costs of goods sold of $13.9 million, reducing our gross profit in fiscal year 2014. Excluding this compensation expense charge in fiscal year 2014, gross profit decreased $1.8 million or 0.8% as compared to fiscal year 2014.
Gross profit as a percentage of net sales decreased from 18.2% in fiscal year 2014 to 17.5% in fiscal year 2015. Excluding the impact of the Special Dividend of $13.9 million in 2014, gross profit as a percentage of net sales declined from 19.5% to 17.5% primarily due to the negative impact of Pipe raw material cost increases.
Pipe sales grew 11.1% in fiscal year 2015 while Allied Products sales grew 8.8% over the same period. The positive impact of higher Pipe and Allied Product sales was significantly offset by increased Pipe raw material prices of approximately 11.8% in fiscal year 2015 as compared to fiscal year 2014. We were not able to immediately pass through the impact of these higher raw material prices to customers during the period due to the sharp fall in commodity prices in the late fall of calendar 2014. Domestic freight costs declined to 9.8% of Domestic net sales in fiscal year 2015 as compared to 10.1% of Domestic net sales in fiscal year 2014 primarily as a result of lower diesel fuel prices, particularly in the last half of fiscal year 2015.
The change in Domestic gross profit was primarily driven by the negative impact of sharply higher raw material costs offsetting the positive impact of the growth in Domestic Pipe and Allied Product sales which resulted in an increase in Domestic gross profit of $0.6 million, or 0.3%, in fiscal year 2015 compared to fiscal year 2014 excluding the compensation expense related to the Special Dividend in fiscal year 2014. Gross profit from our International segment declined by $2.3 million as the positive impact of higher volume in Mexico and Canada was adversely impacted by tighter margins and the negative impact of the softening of the Canadian dollar during fiscal year 2015.
Selling expenses
Selling expenses increased $5.0 million, or 6.7%, to $79.0 million during fiscal year 2015 compared to $74.0 million in fiscal year 2014. Selling expenses in fiscal year 2014 were impacted by compensation expense related to the Special Dividend of $4.6 million paid in January 2014. Excluding the impact of the Special Dividend, selling expense increased $9.6 million or 13.7%. As a percentage of net sales, selling expenses (excluding the impact of the Special Dividend) totaled 6.7% of net sales in fiscal year 2015 compared to 6.5% of net sales in fiscal year 2014. Higher sales volumes resulted in selling expenses tied to commissions to increase by $2.6 million and field selling and customer service costs to increase by $9.1 million in fiscal year 2015 as compared to fiscal year 2014 excluding the impact of the Special Dividend.
General and administrative expenses
General and administrative (“G&A”) expenses decreased $1.1 million, or 1.7%, to $58.7 million in fiscal year 2015 compared to $59.8 million in fiscal year 2014. G&A expenses in fiscal year 2014 were impacted by $4.2 million of compensation expense relating to the Special Dividend paid in January 2014. Excluding the impact of the compensation expense related to the Special Dividend, G&A expenses increased $3.1 million, or 5.7%. The increase resulted from an increase of $1.6 million of costs related to our IPO and secondary offerings and $1.7 million of costs related to becoming a public company offset by lower bonus compensation expense of $0.2 million. Excluding the impact of the Special Dividend, as a percentage of net sales, G&A expenses totaled 5.0% of net sales in fiscal year 2015 compared to 5.2% of net sales in fiscal year 2014.
Gain (loss) on disposal of assets or businesses
Gain on the sale of business totaled $0.8 million in fiscal year 2015 compared to of $5.3 million in fiscal year 2014, a net reduction of $4.5 million in fiscal year 2015 as compared to fiscal year 2014. Businesses sold in
67
Table of Contents
fiscal year 2015 related to our GEO-flow product line and in 2014 they included our Draintech product line, a precast concrete facility in Pennsylvania and an idled pipe plant in North Carolina. Dispositions of machinery and equipment resulted in a loss of $1.1 million and $2.5 million in fiscal years 2015 and 2014, respectively, and related to the replacement of assets in the normal course of business.
Intangibles amortization
Intangibles amortization decreased $0.4 million or 3.9% in fiscal year 2015 compared to fiscal year 2014. The decrease is mainly due to a customer relationship intangible asset related to a 2008 acquisition becoming fully amortized during fiscal year 2015 resulting in lower amortization in fiscal year 2015.
Interest expense
Interest expense from our debt and capital lease obligations increased $0.6 million or 3.0% in fiscal year 2015 as compared to fiscal year 2014.
Other miscellaneous expense (income), net
Other miscellaneous expense (income), net, decreased $15.6 million in fiscal year 2015 to an expense of $14.4 million compared to income of $1.2 million in fiscal year 2014. The expense in 2015 was primarily due to net unfavorable mark-to-market adjustments of $7.7 million for changes in fair value on derivative contracts, a loss on a currency hedge tied to our Ideal Pipe acquisition of $5.6 million, a loss on Diesel fuel option collars and Propylene swaps of $0.7 million and $1.3 million, respectively, and other net miscellaneous expense.
Income tax expense
The provision for income taxes totaled $9.4 million in fiscal year 2015 compared to $19.9 million in fiscal year 2014, a decrease of $10.5 million or 52.7%. Our effective tax rate was 38.5% in fiscal year 2015 compared to 56.6% in fiscal year 2014. The decrease in our effective tax rate was primarily driven by the special dividend payment to participants in the ESOP in 2014, which we treated as non-deductible for income tax expense purposes and as a result increased our effective tax rate by 22.5%.
Income attributable to non-controlling interest
Income attributable to non-controlling interest increased $0.5 million, or 15.0%, to $4.1 million in fiscal year 2015 compared to $3.6 million in fiscal year 2014. Net sales of our domestic joint ventures for BaySaver and Tigre-ADS USA showed solid growth while our South American Joint Venture realized a modest decline in Net sales impacted by soft commodity prices and the economic slowdown in Brazil.
Net income attributable to ADS
Net income attributable to ADS was $8.6 million for both fiscal year 2015 and fiscal year 2014. Net loss per share for fiscal year 2015 totaled $0.06 per basic and diluted share, as compared to $0.12 per basic and diluted share recorded in the comparable prior year period. Net loss per share for the fiscal years ended March 31, 2015 and 2014 is impacted by changes in fair value appreciation on convertible preferred stock classified in mezzanine equity which reduced income available to common shareholders by $11.1 million, or $0.22 per share for common shareholders and $4.0 million, or $0.08 per share for common shareholders, respectively.
Other comprehensive loss
Total other comprehensive loss increased $4.9 million, or 70.7%, to $11.9 million during fiscal year 2015 compared to $7.0 million in fiscal year 2014. Besides an insignificant amount in fiscal year 2014, the entire amounts related to currency translation losses. The increase in currency translation losses was the result of the
68
Table of Contents
continued strengthening of the U.S. dollar against the functional currencies of our primary international subsidiaries and equity method investments. The $11.9 million of currency translation losses in fiscal year 2015 were primarily due to our accounting for our Canadian subsidiary (loss of $2.4 million), ADS Mexicana (loss of $7.6 million), and the South American Joint Venture (loss of $2.3 million), whereas the $7.0 million of currency translation losses in fiscal year 2014 were primarily due to our accounting for our Canadian subsidiary (loss of $1.3 million), ADS Mexicana (loss of $3.3 million), and the South American Joint Venture (loss of $2.3 million).
Adjusted EBITDA
Adjusted EBITDA totaled $143.8 million in fiscal year 2015, a decrease of $9.0 million, or 5.9%, compared to $152.8 million in fiscal year 2014.
Domestic Adjusted EBITDA decreased $4.9 million, or 3.7%, to $129.1 million in fiscal year 2015 compared to $134.0 million in fiscal year 2014. International Adjusted EBITDA decreased $4.1 million in fiscal year 2015 to $14.7 million compared to $18.8 million in fiscal year 2014.
Adjusted EBITDA as a percentage of net sales decreased to 12.2% in fiscal year 2015 compared to 14.3% in fiscal year 2014.
Fiscal Year Ended March 31, 2014 Compared with Fiscal Year Ended March 31, 2013
The following table summarizes certain financial information relating to our operating results that have been derived from our consolidated financial statements for the fiscal years ended March 31, 2014 and 2013. Also included is certain information relating to the operating results as a percentage of net sales. We believe this presentation is useful to investors in comparing historical results.
| (Amounts in thousands) | Fiscal Year Ended March 31, 2014 |
% of Net Sales |
Fiscal Year Ended March 31, 2013 |
% of Net Sales |
% Variance |
|||||||||||||||
| (As Restated) (a) | (As Restated) (a) | |||||||||||||||||||
| Consolidated Statements of Income data: |
||||||||||||||||||||
| Net sales |
$ | 1,067,780 | 100.0 | % | $ | 1,017,102 | 100.0 | % | 5.0 | % | ||||||||||
| Cost of goods sold |
873,810 | 81.8 | 829,141 | 81.5 | 5.4 | |||||||||||||||
|
|
|
|
|
|
|
|
|
|||||||||||||
| Gross profit |
193,970 | 18.2 | 187,961 | 18.5 | 3.2 | |||||||||||||||
| Selling expenses |
74,042 | 6.9 | 71,805 | 7.1 | 3.1 | |||||||||||||||
| General and administrative expenses |
59,761 | 5.6 | 49,601 | 4.9 | 20.5 | |||||||||||||||
| (Gain) loss on disposal of assets or businesses |
(2,863 | ) | (0.3 | ) | (951 | ) | (0.1 | ) | 201.1 | |||||||||||
| Intangible amortization |
10,145 | 1.0 | 10,028 | 1.0 | 1.2 | |||||||||||||||
|
|
|
|
|
|
|
|
|
|||||||||||||
| Income from operations |
52,885 | 5.0 | 57,478 | 5.7 | (8.0 | ) | ||||||||||||||
| Interest expense |
18,807 | 1.8 | 18,526 | 1.8 | 1.5 | |||||||||||||||
| Other miscellaneous expense, net |
(1,177 | ) | (0.1 | ) | 103 | — | (1,242.7 | ) | ||||||||||||
|
|
|
|
|
|
|
|
|
|||||||||||||
| Income before income taxes |
35,255 | 3.3 | 38,849 | 3.8 | (9.3 | ) | ||||||||||||||
| Income tax expense |
19,949 | 1.9 | 15,935 | 1.6 | 25.2 | |||||||||||||||
| Equity in net loss of unconsolidated affiliates |
3,086 | 0.3 | (266 | ) | — | (1,260.2 | ) | |||||||||||||
|
|
|
|
|
|
|
|
|
|||||||||||||
| Net income |
12,220 | 1.1 | 23,180 | 2.3 | (47.3 | ) | ||||||||||||||
| Less net income attributable to the non-controlling interest |
3,593 | 0.3 | 2,520 | 0.2 | 42.6 | |||||||||||||||
|
|
|
|
|
|
|
|
|
|||||||||||||
| Net income attributable to ADS |
$ | 8,627 | 0.8 | % | $ | 20,660 | 2.0 | % | (58.2 | )% | ||||||||||
|
|
|
|
|
|
|
|
|
|||||||||||||
| Other financial data: |
||||||||||||||||||||
| Adjusted EBITDA |
$ | 152,755 | 14.3 | % | $ | 132,299 | 13.0 | % | 15.5 | % | ||||||||||
| System-Wide Net Sales |
$ | 1,134,218 | 106.2 | % | $ | 1,081,936 | 106.4 | % | 4.8 | % | ||||||||||
| Adjusted Earnings Per Fully Converted Share |
$ | 0.58 | — | $ | 0.41 | — | 41.5 | % | ||||||||||||
| (a) | See “Note 2. Restatement of Previously Issued Financial Statements” to the consolidated financial statements. |
69
Table of Contents
Net sales
Net sales totaled $1,067.8 million in fiscal year 2014, increasing $50.7 million, or 5.0%, as compared to fiscal year 2013. Our Domestic sales increased $56.3 million, or 6.4%, as compared to fiscal year 2013 due to increases in Pipe and Allied Product sales of $45.0 million, or 6.9%, and $11.3 million, or 5.1%, respectively. Continued strong recovery in our markets, impacted by an increase in residential construction, modest increases in nonresidential construction and further gains from conversion to our products from traditional products, were the primary drivers of the increase in the volume of Domestic Pipe and Allied Product sales. Pipe selling prices increased 0.7% as compared to the prior year. The increase in Domestic Pipe and Allied Product sales was partially offset by lower International sales, which declined $5.6 million, or 4.1%, to $132.5 million in fiscal year 2014 as compared to $138.1 million in the prior year. International Pipe sales were primarily lower in Mexico due to the impact of the loss of a national certification (which has since been regained in December 2013) and in Canada due to weather conditions and slower construction markets. System-Wide Net Sales were $1,134.2 million in fiscal year 2014, an increase of $52.3 million, or 4.8%, over System-Wide Net Sales of $1,081.9 million in fiscal year 2013. Net sales at our South American Joint Venture were relatively flat in fiscal year 2014.
Cost of goods sold and Gross profit
Gross profit increased $6.0 million, or 3.2%, to $194.0 million during fiscal year 2014 as compared to $188.0 million during fiscal year 2013. Compensation expense relating to the Special Dividend paid in January 2014 resulted in expense of $13.9 million, reducing our gross profit in fiscal year 2014. Excluding the impact of the Special Dividend in fiscal year 2014, gross profit increased $19.9 million or 10.6% as compared to fiscal year 2013. The increase in gross profit was primarily driven by growth in Domestic Pipe and Allied Product sales which resulted in an increase in Domestic gross profit of $22.3 million, or 14.1%, in fiscal year 2014 compared to fiscal year 2013 excluding the impact of the Special Dividend in fiscal year 2014. Gross profit from our International segment decreased $2.4 million, or 7.8%, due to lower sales volume in Canada and Mexico. Gross profit as a percentage of net sales increased to 19.5% from 18.5% (excluding the 1.3% negative impact of the Special Dividend) due primarily to increased gross profit margins for Allied Product sales resulting from a higher mix in sales of more profitable new and existing Allied Products, and to a lesser degree due to a slight increase in Pipe gross profit margins and lower Domestic freight costs as a percentage of net sales. Domestic freight costs declined to 10.1% of Domestic net sales in fiscal year 2014 as compared to 10.3% of Domestic net sales in fiscal year 2013. The decrease in Domestic freight costs was partially offset by a slight increase in Domestic Pipe raw material prices.
Selling expenses
Selling expenses increased $2.2 million, or 3.1%, to $74.0 million during fiscal year 2014 compared to $71.8 million in fiscal year 2013. Selling expenses included a one-time charge of $4.6 million for compensation expense relating to the Special Dividend paid in January 2014. Excluding the impact of the Special Dividend, selling expenses decreased $2.4 million during fiscal year 2014 compared to fiscal year 2013. As a percentage of net sales, selling expenses, excluding the impact of the Special Dividend, declined to 6.5% of net sales in fiscal year 2014 compared to 7.1% in fiscal year 2013.
General and administrative expenses
General and administrative expenses increased $10.2 million, or 20.5%, to $59.8 million in fiscal year 2014 compared to $49.6 million in fiscal year 2013. G&A expenses included $4.2 million of compensation expense relating to the Special Dividend paid in January 2014. Excluding the impact of the Special Dividend, G&A expenses increased $6.0 million. Excluding the impact of the Special Dividend, G&A expenses, as a percentage of net sales, totaled 5.2% of net sales in fiscal year 2014 compared to 4.9% of net sales in fiscal year 2013. This increase was due to non-cash stock-based compensation expense which increased by $2.4 million, $1.4 million for audit fees related to our IPO, increases in personnel costs of $1.5 million due to additional headcount and
70
Table of Contents
compensation tied to company performance, and higher legal and consulting fees of $1.1 million, partially offset by decreases in other G&A expenses.
Gain on disposal of assets and businesses
Gain on the sale of business totaled $5.3 million in fiscal year 2014 compared to $2.2 million in fiscal year 2013. Assets sold in fiscal year 2014 included our Draintech product line, a precast facility in Pennsylvania, and an idled pipe plant in North Carolina.
Dispositions of machinery and equipment resulted in a loss of $2.5 million and $1.3 million in fiscal years 2014 and 2013, respectively, and related to the replacement of assets in the normal course of business.
Intangibles amortization
Intangibles amortization increased by $0.1 million, or 1.2% between fiscal year 2014 and fiscal year 2013, due to the amortization of intangibles from recent acquisitions.
Interest expense
Interest expense increased $0.3 million, or 1.5% to $18.8 million in fiscal year 2014, compared to $18.5 million in fiscal year 2013.
Other miscellaneous (income) expenses, net
Other miscellaneous (income) expense, net increased $1.3 million in fiscal year 2014 to income of $1.2 million compared to an expense of $0.1 million in fiscal year 2013.
Income tax expense
The provision for income taxes totaled $19.9 million in fiscal year 2014 compared to $15.9 million in fiscal year 2013, an increase of $4.0 million or 25.2%. Our effective tax rate was 56.6% in fiscal year 2014 compared to 41.0% in fiscal year 2013. The increase in our effective tax rate was primarily driven by the Special Dividend payment to participants in the ESOP, which we treated as non-deductible and, as a result, increased our effective tax rate by 22.5%.
Income attributable to non-controlling interest
Income attributable to non-controlling interest increased $1.1 million, or 42.6%, to $3.6 million in fiscal year 2014 compared to $2.5 million in fiscal year 2013.
Net income attributable to ADS
Net income attributable to ADS was $8.6 million in fiscal year 2014, a decrease of $12.0 million, or 58.2%, compared to fiscal year 2013. The impact of the compensation expense relating to the one-time Special Dividend paid in January 2014 had a negative impact of $22.6 million in fiscal year 2014.
Other comprehensive income (loss)
Total other comprehensive income (loss) decreased $9.6 million, or 370.2%, to a loss of ($7.0) million during fiscal year 2014 compared to income of $2.6 million in fiscal year 2013. Besides an insignificant amount in each year, the entire amounts related to currency translation gains (losses). The increase in currency translation losses was the result of the strengthening of the U.S. dollar against the functional currencies of our primary
71
Table of Contents
international subsidiaries and unconsolidated affiliates. The ($7.0) million of currency translation losses in fiscal year 2014 were primarily due to our accounting for our Canadian subsidiary (loss of $1.3 million), ADS Mexicana (loss of $3.3 million), and the South American Joint Venture (loss of $2.3 million), whereas the $2.6 million of currency translation gains in fiscal year 2013 were primarily due to our accounting for our Canadian subsidiary (loss of $0.1 million), ADS Mexicana (gain of $3.3 million), and the South American Joint Venture (loss of $0.6 million).
Adjusted EBITDA
Adjusted EBITDA totaled $152.8 million in fiscal year 2014, an increase of $20.5 million, or 15.5%, compared to $132.3 million in fiscal year 2013. Domestic Adjusted EBITDA increased $24.3 million, or 22.2%, to $134.0 million in fiscal year 2014 compared to $109.7 million in fiscal year 2013. International Adjusted EBITDA declined $3.8 million in fiscal year 2014 to $18.8 million compared to $22.6 million in fiscal year 2013. Adjusted EBITDA as a percentage of net sales increased to 14.3% in fiscal year 2014 compared to 13.0% in fiscal year 2013.
Liquidity and Capital Resources
Our primary liquidity requirements are working capital, capital expenditures, debt service, and dividend payments for our convertible preferred stock and common stock. We have historically funded, and expect to continue to fund, our operations primarily through equity issuance, internally generated cash flow and debt financings. From time to time we may explore additional financing methods and other means to raise capital. There can be no assurance that any additional financing will be available to us on acceptable terms or at all.
As of March 31, 2015, we had $3.0 million in cash that was held by our foreign subsidiaries and undistributed earnings of approximately $30.2 million. Our intent is to indefinitely reinvest our earnings in foreign subsidiaries with the exception of cash dividends paid by our ADS Mexicana joint venture. In the event that foreign earnings are repatriated, these amounts will be subject to income tax liabilities in the appropriate tax jurisdiction.
At March 31, 2015, we had $2.6 million of undistributed earnings of our unconsolidated subsidiaries included in retained earnings (deficit).
Working Capital and Cash Flows
During the fiscal year 2015, our net decrease in cash amounted to $0.3 million compared to a net increase of $2.6 million during fiscal year 2014. Our source of funds in fiscal 2015 was primarily driven by higher operating earnings, net proceeds of $72.2 million from shares sold during our IPO after deduction of deferred offering costs, and the impact of non-cash charges (depreciation, amortization, compensation expense and shared based compensation expense). For the same period ending March 31, 2015, our use of cash was primarily driven by increased inventory balances (up $10.0 million), the settlement of a Canadian dollar currency hedge related to the Ideal Pipe acquisition ($5.6 million), spending for acquisitions ($36.4 million), net repayment of $54.2 million of debt and payment of $9.3 million of capital lease obligations. During fiscal year 2014, our source of funds was primarily driven by an increase in borrowings on our Revolving Credit Facility. During fiscal year 2014, our use of cash was primarily driven by payment of dividends and continued investment in capital expenditures. During fiscal year 2013, our use of cash was primarily driven by increased capital expenditures.
As of March 31, 2015, we had $127.5 million in liquidity, including $3.6 million of cash and $123.9 million in borrowings available under our Revolving Credit Facilities, described below. We believe that our cash on hand, together with the availability of borrowings under our Revolving Credit Facility and other financing arrangements and cash generated from operations, will be sufficient to meet our working capital requirements, anticipated capital expenditures, scheduled interest payments on our indebtedness and dividend payment requirement for our convertible preferred stock for at least the next twelve months.
72
Table of Contents
As of March 31, 2015, we had consolidated indebtedness (excluding capital lease obligations) of approximately $399.9 million, down $54.2 million compared to March 31, 2014. We repaid a portion of our outstanding indebtedness with the $72.2 million of net proceeds from our IPO, which closed on July 25, 2014.
The following table sets forth the major sources and uses of cash for each of the periods presented:
| (Amounts in thousands) | 2015 | 2014 | 2013 | |||||||||
| (As Restated) (a) | (As Restated) (a) | |||||||||||
| Statement of Cash Flows data: |
||||||||||||
| Net cash provided by operating activities |
$ | 74,379 | $ | 72,410 | $ | 75,353 | ||||||
| Net cash used in investing activities |
(76,093 | ) | (38,712 | ) | (44,796 | ) | ||||||
| Net cash provided by (used in) financing activities |
1,791 | (31,109 | ) | (31,338 | ) | |||||||
| (a) | See “Note 2. Restatement of Previously Issued Financial Statements” to our Consolidated Financial Statements. |
Working Capital
Working capital is an indication of liquidity and potential need for short-term funding. We define working capital as the difference between our current assets and current liabilities.
Net working capital increased to $249.1 million as of March 31, 2015, from $241.0 million as of March 31, 2014, primarily due to the growth in inventories resulting from increased quantities and material prices, which grew $10.0 million, and an increase in accounts receivable of $6.0 million. These were offset by an increase of $10.2 million in accounts payable and accrued expenses including accrued income taxes. The remaining increase primarily related to an increase in deferred income taxes and other current assets of $4.5 million.
Working capital increased to $241.0 million as of March 31, 2014, from $204.0 million as of March 31, 2013, primarily due to higher inventories ($33.5 million increase) and accounts receivable ($4.4 million increase), while accounts payable and accrued expenses including accrued income taxes increased by $5.7 million.
Operating Cash Flows
During the fiscal year 2015, cash provided by operating activities was $74.4 million as compared with cash provided by operating activities of $72.4 million for fiscal year 2014. Cash flow from operating activities during fiscal year 2015 was impacted by a $20.5 million reduction in the use of cash related to changes in working capital and a $7.8 million increase in fair market value adjustments to derivatives, partially offset by a $17.0 million reduction in ESOP and stock-based compensation and an $7.6 million increase in deferred income taxes.
Cash provided by operating activities for fiscal year 2014 was $72.4 million as compared with cash provided by operating activities of $75.4 million for fiscal year 2013. The primary factors impacting operating cash flow during fiscal year 2014 was a $24.1 million increase in use of cash related to changes in working capital and a $11.0 million reduction in net income, partially offset by a $25.7 million increase in ESOP and stock-based compensation and an $8.9 million increase in cash provided by other operating activities.
Investing Cash Flows
During fiscal year 2015, cash used for investing activities was $76.1 million, primarily due to $32.1 million for capital expenditures and additions to capitalized software, a $36.4 million investment in Ideal Pipe, a $3.6 million investment in a domestic joint venture operation created in the first quarter fiscal 2015, and a $4.0 million investment in our international joint venture operation to support growth initiatives.
73
Table of Contents
During fiscal year 2014, cash used for investing activities was $38.7 million, primarily due to capital expenditures and additions to capitalized software of $40.9 million and investments in BaySaver and Tigre-ADS USA unconsolidated joint ventures of $6.4 million, partially offset by proceeds of $9.3 million from the sale of Draintech and other assets.
During fiscal year 2013, cash used in investing activities was $44.8 million, primarily driven by capital expenditures and additions to capitalized software of $39.8 million.
Financing Cash Flows
During fiscal 2015, cash provided by financing activities was a net $1.8 million, with net proceeds of $72.2 million from the IPO of our common stock after deducting deferred offering costs, largely offset by net debt payments, payments on our capital lease obligation, IPO offering costs and dividend payments.
During fiscal year 2014, cash used by financing activities was $31.1 million, primarily from dividend payments, payments on capital lease obligations and the redemption of convertible preferred stock in connection with the ESOP.
During fiscal year 2013, cash used by financing activities was $31.3 million, primarily from net payments on term debt, capital lease obligations, dividends, and redemption of our convertible preferred stock in connection with the ESOP.
Capital Expenditures
Capital expenditures totaled $31.5 million for fiscal 2015. Our capital expenditures were used primarily to support facility expansions, new equipment to provide capacity additions, equipment replacements, and our recycled resin initiatives.
We had capital expenditures of $39.6 million and $38.8 million in fiscal years 2014 and 2013, respectively. Our capital expenditures in fiscal year 2014 were used primarily to support the growth of HP N-12 pipe production capacity, expansion of our recycled resin initiatives and other capital projects.
We currently anticipate that we will make capital expenditures of approximately $45.0 million in fiscal year 2016. Such capital expenditures are expected to be financed using funds generated by operations.
Financing Transactions
Bank Term Loans
On September 24, 2010, we entered into a credit agreement with PNC Bank, National Association, or PNC, as administrative agent, and the other lender parties thereto. The credit agreement, as amended and restated on June 12, 2013 and subsequently further amended, provides for our Bank Term Loans consisting of (i) the Revolving Credit Facility providing for revolving loans and letters of credit of up to a maximum aggregate principal amount of $325.0 million and (ii) the Term Note in an aggregate original principal amount of $100.0 million and (iii) the ADS Mexicana Revolving Credit Facility, described below. The Bank Term Loans also permit us to add additional commitments to the Revolving Credit Facility or the Term Note not to exceed $50 million in the aggregate. The proceeds of the Revolving Credit Facility are primarily used to provide for our ongoing working capital and capital expenditure needs, to finance acquisitions and distributions, and for our other general corporate purposes. The proceeds of the Term Note were primarily used for our general corporate purposes. The interest rates on the Bank Term Loans are determined by certain base rates or LIBOR rates, plus an applicable margin. The obligations under the Bank Term Loans are guaranteed by certain of our subsidiaries and secured by substantially all of our personal property assets. On December 20, 2013, we amended the
74
Table of Contents
Revolving Credit Facility to, among other terms, permit the payment of a cash dividend. As of March 31, 2015, the outstanding principal drawn on the Revolving Credit Facility was $205.1 million, with $111.9 million available to be drawn. As of March 31, 2015, the outstanding principal balance of the Term Note was $91.3 million.
We used the net proceeds of $72.2 million from our IPO, which closed on July 25, 2014, to repay a portion of our outstanding indebtedness under the Revolving Credit Facility.
ADS Mexicana Revolving Credit Facility
On September 24, 2010, our joint venture ADS Mexicana entered into a credit agreement with PNC, as administrative agent, and the other lenders parties thereto. The credit agreement, as amended and restated on June 12, 2013 and subsequently further amended, provides for revolving loans and letters of credit of up to a maximum aggregate principal amount of $12.0 million. The proceeds of the revolving credit facility are primarily used to cover working capital needs. The interest rates of the revolving credit facilities are determined by certain base rates or LIBOR rates, plus an applicable margin. The obligations under the revolving credit facility are guaranteed by us and certain of our subsidiaries and secured by substantially all of our assets. As of March 31, 2015, there was no outstanding principal balance on the revolving credit facility, with $12.0 million available to be drawn.
Senior Notes
On December 11, 2009, we entered into a private shelf agreement with Prudential Investment Management Inc., or Prudential, which agreement, as amended and restated on September 24, 2010 and subsequently further amended, provides for the issuance by us of senior secured promissory notes to Prudential or its affiliates from time to time in the aggregate principal amount up to $100.0 million. Pursuant to the private shelf agreement, on September 27, 2010, we issued $75.0 million in aggregate principal amount of the 5.60% Senior Series A Notes due September 24, 2018 to repurchase outstanding shares of common stock from certain of our stockholders and to repurchase outstanding shares of convertible preferred stock from the ESOP. On July 24, 2013, we issued $25.0 million in aggregate principal amount of the 4.05% Senior Series B Notes due September 24, 2019 for our general corporate purposes. The Senior Notes are guaranteed by certain of our subsidiaries and secured by substantially all of our assets. We have no further amount available for issuance of senior notes under the private shelf agreement. On December 20, 2013, we amended the private shelf agreement to, among other terms, make certain amendments in order to permit the payment of a cash dividend. We have no further amount available for issuance of senior notes under the private shelf agreement. At March 31, 2015 the outstanding principal balance on these notes was $100.0 million.
Amended Debt Agreements
On August 21, 2015, the Company entered into amended agreements related to the Bank Term Loans and Senior Notes in connection with the Company’s determination that a substantial portion of its transportation and equipment leases should be treated as capital leases rather than as operating leases, as discussed in “Note 2, Restatement of Previously Issued Financial Statements”. The material terms of each amended agreement modify certain definitions applicable to the Company’s affirmative and negative financial covenants, including the negative covenant on indebtedness, to accommodate the Company’s treatment of its transportation and equipment leases as capital leases rather than operating leases, along with corresponding changes to the provisions outlining the application of generally accepted accounting principles in the definition of accounting terms used in various financial covenants. The amendments also waive any potential event of default that may exist under any of the respective agreements as a result of the Company’s change in lease accounting treatment, and do not require the Company to deliver financial statements or compliance certificates for any annual or quarterly period prior to the fiscal year ended March 31, 2015.
75
Table of Contents
In addition, from July 2015 through February 2016, the Company obtained various consents from the lenders and further amended the Bank Term Loans and Senior Notes. These consents and the additional amendments had the effect of: i) extending the time for delivery of our fiscal 2015 audited financial statements and the first, second and third quarter fiscal 2016 quarterly financial statements to April 1, 2016, whereby an event of default was waived as long as those financial statements were delivered by that date, ii) further modified certain definitions applicable to the Company’s affirmative and negative financial covenants, including with respect to the treatment of the costs related to the Company’s restatement for purposes of the calculation of the minimum fixed charge coverage ratio and the maximum leverage ratio, and iii) permitted the Company’s payment of quarterly dividends on common shares in June, August and December 2015, as well as an annual dividend for preferred shares in March 2016.
Covenant Compliance
Our outstanding debt agreements and instruments contain various restrictive covenants including, but not limited to, limitations on additional indebtedness and capital distributions, including dividend payments. The two primary debt covenants include a Leverage Ratio and a Fixed Charge Coverage Ratio maintenance covenant. For any relevant period of determination, the Leverage Ratio is calculated by dividing Total Consolidated Indebtedness (funded debt plus guarantees) by Consolidated EBITDA. The current upper limit is 4.0 times. The Fixed Charge Coverage Ratio is calculated by dividing the sum of Consolidated EBITDA minus Capital Expenditures minus cash Income Taxes paid, by the sum of Fixed Charges. Fixed Charges include cash interest expense, scheduled principal payments on indebtedness, and ESOP capital distributions in excess of $10 million in a given fiscal year. The current minimum ratio is 1.25 times. We were in compliance with our debt covenants as of March 31, 2015.
Contractual Obligation as of March 31, 2015
| Payments Due by Period | ||||||||||||||||||||
| (Amounts in thousands) | Total | Less than 1 Year |
1-3 Years | 3-5 Years | More than 5 Years |
|||||||||||||||
| Contractual obligations: |
||||||||||||||||||||
| Long-term debt (1) |
$ | 399,895 | $ | 9,580 | $ | 71,775 | $ | 318,540 | $ | — | ||||||||||
| Interest payments (2) |
40,022 | 13,649 | 22,499 | 3,874 | — | |||||||||||||||
| Operating leases |
8,855 | 2,793 | 2,871 | 969 | 2,222 | |||||||||||||||
| Capital leases |
68,795 | 18,373 | 27,426 | 15,790 | 7,206 | |||||||||||||||
| Contractual purchase obligations (3) |
11,790 | 11,790 | — | — | — | |||||||||||||||
|
|
|
|
|
|
|
|
|
|
|
|||||||||||
| Total |
$ | 529,357 | $ | 56,185 | $ | 124,571 | $ | 339,173 | $ | 9,428 | ||||||||||
|
|
|
|
|
|
|
|
|
|
|
|||||||||||
| (1) | The Bank Term Loans mature in June, 2018. |
| (2) | Based on applicable rates and pricing margins as of March 31, 2015, including interest rate swaps. |
| (3) | Purchase obligations include commitments with vendors to purchase raw material. |
Off-Balance Sheet Arrangements
We do not have any off-balance sheet arrangements, with the exception of the guarantee of 50% of certain debt of our unconsolidated South American Joint Venture, as further discussed in “Note 12. Related Party Transactions” of our Consolidated Financial Statements included in “Item 8 Financial Statements and Supplementary Data,” of this Form 10-K. As of March 31, 2015, our South American Joint Venture had approximately $13.6 million of outstanding debt subject to our guarantee, resulting in our guarantee of 50%, or $6.8 million, of that amount. We do not believe that this guarantee will have a current or future effect on our financial condition, results of operations, liquidity, or capital resources.
76
Table of Contents
Critical Accounting Policies and Estimates
Our discussion and analysis of financial condition and results of operations are based on our consolidated financial statements, which have been prepared in accordance with accounting principles generally accepted in the United States of America. The preparation of the consolidated financial statements requires management to make estimates and judgments that affect the reported amounts in our consolidated financial statements and accompanying notes.
Certain of our accounting policies involve a higher degree of judgment and complexity in their application, and therefore, represent the critical accounting policies used in the preparation of our financial statements. If different assumptions or conditions were to prevail, the results could be materially different from our reported results. We believe the following accounting policies may involve a higher degree of judgment and complexity in their application and represent the critical accounting policies used in the preparation of our financial statements. For additional discussion of our significant accounting policies, see “Note 1. Background and Significant Accounting Policies” to our consolidated financial statements included in “Item 8. Financial Statements and Supplementary Data” included in this Form 10-K.
Consolidation and Investments
Our consolidated financial statements include our wholly-owned subsidiaries and VIEs of which we are the primary beneficiary. Significant judgment may be necessary to determine if we are the primary beneficiary of a VIE. The non-controlling interests in our subsidiaries that are consolidated but not wholly owned by us are included in the accompanying financial statements. We use the equity method of accounting for equity investments where we exercise significant influence but do not hold a controlling financial interest, including our South American Joint Venture, our BaySaver joint venture and our Tigre-ADS USA joint venture. Such investments are recorded in Other assets on the Consolidated Balance Sheets and equity earnings are included in Equity in net (income) loss of unconsolidated affiliates on the Consolidated Statements of Operations. All intercompany balances and transactions have been eliminated in consolidation.
Allowance for Doubtful Accounts
We hold receivables from customers in various countries. Credit is extended to customers based on an evaluation of their financial condition and collateral is generally not required. The evaluation of the customer’s financial condition is performed to reduce the risk of loss. Accounts receivable are evaluated for collectability based on numerous factors, including the length of time individual receivables are past due, past transaction history with customers, their credit worthiness and the economic environment. An allowance for doubtful accounts is estimated as a percentage of aged receivables. This estimate is periodically adjusted when management becomes aware of a specific customer’s inability to meet its financial obligations (e.g., bankruptcy filing) or as a result of changes in historical collection patterns.
Inventory
Inventories are stated at the lower of cost or market value. Cost is determined using the FIFO method, which is based on analyses that are highly complex due to the significant number of materials purchased by the company. The complexity of the FIFO analysis is further increased in periods of volatile raw material pricing. Market value is based on estimated net realizable value, which is based on assumptions related to deterioration, obsolescence and other judgmental factors. The valuation of inventory also involves estimates and assumptions relate to which overhead costs qualify for capitalization and in what amounts.
Accounting for Leases
We enter into leases for buildings, transportation and other equipment, and airplanes. Judgment is required in applying the criteria necessary to determine if a lease should be classified as a capital lease. Specifically,
77
Table of Contents
judgment is required in applying the criteria to determine if a lease should be capitalized including whether to include certain lease renewal periods in the lease term, the present value of minimum lease payments, the fair value of leased assets, and the useful lives of assets.
Goodwill
We account for costs of acquired assets in excess of fair value, or Goodwill, and other intangible assets not subject to amortization in accordance with FASB Accounting Standards Codification, or ASC, Topic 350, “Intangibles — Goodwill and Other.” Goodwill is reviewed annually for impairment as of March 31 or whenever events or changes in circumstances indicate the carrying value may not be recoverable. The goodwill impairment analysis is comprised of two steps. The first step requires the comparison of the fair value of the applicable reporting unit to its respective carrying value. If the fair value of the reporting unit exceeds the carrying value of the net assets assigned to that unit, goodwill is not considered impaired and we would not be required to perform further testing. If the carrying value of the net assets assigned to the reporting unit exceeds the fair value of the reporting unit, then we must perform the second step of the impairment test in order to determine the implied fair value of the reporting unit’s goodwill. If the carrying value of a reporting unit’s goodwill exceeds its implied fair value, then we would record an impairment loss equal to the difference. With respect to this testing, our reporting units are generally one level below our operating segments for which discrete financial information is available and reviewed by segment management. However, components of an operating segment can be aggregated as one reporting unit if the components have similar economic characteristics. Our reporting units include Domestic, Mexico, Puerto Rico, Canada, Chile and Europe. Implied fair value of goodwill is determined by considering both the income and market approach. Determining the fair value of a reporting unit is judgmental in nature and involves the use of significant estimates and assumptions. These estimates and assumptions include revenue growth rates and operating margins used to calculate projected future cash flows, risk-adjusted discount rates, future economic and market conditions, and determination of appropriate market comparables. The fair value estimates are based on assumptions management believes to be reasonable, but are inherently uncertain.
We performed our annual impairment test for goodwill as of March 31, 2015 and we determined that the fair value exceeded the carrying value for each of our reporting units by a substantial margin. Accordingly, we did not incur any impairment expense for goodwill in the years ended 2015, 2014 and 2013. Future events and unanticipated changes to assumptions could require a provision for impairment in a future period.
Intangible Assets
Definite-lived intangible assets are tested for recoverability whenever events or changes in circumstances indicate that carrying amounts of the asset group may not be recoverable. Asset groups are established primarily by determining the lowest level of cash flows available. If the estimated undiscounted future cash flows are less than the carrying amounts of such assets, an impairment loss is recognized to the extent the fair value of the asset less any costs of disposition is less than the carrying amount of the asset. Determining the fair value of these assets is judgmental in nature and involves the use of significant estimates and assumptions. Future events and unanticipated changes to assumptions could require a provision for impairment in a future period.
Indefinite-lived intangible assets are tested for impairment annually as of March 31 or whenever events or changes in circumstances indicate the carrying value may be greater than fair value. Determining the fair value of these assets is judgmental in nature and involves the use of significant estimates and assumptions. We base our fair value estimates on assumptions we believe to be reasonable, but that are inherently uncertain. To estimate the fair value of these indefinite-lived intangible assets, we use an income approach, which utilizes a market derived rate of return to discount anticipated performance. An impairment loss is recognized when the estimated fair value of the intangible asset is less than the carrying value.
We did not record any impairment in fiscal years 2015, 2014 or 2013. Future events and unanticipated changes to assumptions could require a provision for impairment in a future period.
78
Table of Contents
Revenue Recognition
The Company sells pipe products and related water management products. ADS ships products to customers predominantly by internal fleet and to a lesser extent by third-party carriers. The Company does not provide any additional revenue generating services after product delivery.
Sales, net of sales tax and allowances for returns, rebates and discounts are recognized from product sales when persuasive evidence of an arrangement exists, delivery has occurred, the price to the buyer is fixed or determinable and collectability is reasonably assured. ADS does not ship an order until a customer purchase order or sales order has been received that includes the pricing and quantity of the products in the order, which establishes both persuasive evidence of an arrangement and that the price is fixed or determinable. Title to the products and risk of loss generally passes to the customer upon delivery. ADS performs credit check procedures on all new customers, establishes credit limits accordingly, and monitors the creditworthiness of existing customers, which is the basis for concluding that collectability is reasonably assured.
Employee Benefit Plans
Employee Stock Ownership Plan (ESOP)
Unallocated shares of convertible preferred stock held by our ESOP in the ESOP’s loan suspense account are allocated each year to employee-participants’ ESOP stock accounts upon the ESOP making its annual ESOP loan payment. The annual allocation of convertible preferred stock to the ESOP stock accounts of ESOP participants is accounted for as stock-based compensation expense as part of our overall employee benefits expense. Such shares of convertible preferred stock are valued based on an annual valuation by the ESOP’s independent third-party appraisal firm. When shares of convertible preferred stock are allocated to the ESOP stock accounts of ESOP participants, we reduce the amount of deferred compensation reflected in Deferred compensation — unearned ESOP shares in mezzanine equity. The amount of deferred compensation is reduced by the number of allocated shares of convertible preferred stock, multiplied by the value of the convertible preferred stock when originally issued to the ESOP. The difference between the current share value and the original value is credited to the equity account paid in capital.
Stock-Based Compensation Plans
We have several programs for stock-based payments to employees and directors in accordance with FASB ASC Topic 718, “Compensation — Stock Compensation” (ASC Topic 718). Equity-classified awards are measured based on the grant-date estimated fair value of each award, net of estimated forfeitures, and liability-classified awards are re-measured at their fair value, net of estimated forfeitures, at each reporting date for accounting purposes. Compensation expense is recognized over the employee’s requisite service period, which is generally the vesting period of the grant. Compensation expense is recorded for new awards and existing awards that are modified, repurchased or forfeited.
The fair value of each stock option granted is estimated, as of the date of the grant, using the Black-Scholes option pricing model. Determining the fair value of stock options under the Black-Scholes option-pricing model requires judgment, including estimating the fair value per share of our common stock as a private company prior to our IPO, volatility, expected term of the awards, dividend yield and the risk-free interest rate. The assumptions used in calculating the fair value of stock options represent our best estimates, based on management’s judgment and subjective future expectations. These estimates involve inherent uncertainties. If any of the assumptions used in the model change significantly, stock-based compensation recorded for future awards may differ materially from that recorded for awards granted previously.
We developed our assumptions as follows:
| • | Fair value of common stock. Prior to our IPO, when our common stock was not publicly traded, we estimate the fair value of common stock as discussed in “— Valuation of Redeemable Common Stock |
79
Table of Contents
| and Redeemable Convertible Preferred Stock — Valuation of Redeemable Common Stock.” Subsequent to the IPO we use the market price of our common stock as of the grant date. |
| • | Volatility. The expected price volatility for our common stock is estimated by taking the median historic price volatility for industry peers based on daily prices over a period equivalent to the expected term of the stock option grants. |
| • | Expected term. The expected term represents the period of time that options granted are expected to be outstanding based on historical experience. |
| • | Risk-free interest rate. The risk-free interest rate is based on the yields of United States Treasury securities with maturities similar to the expected term of the options. |
| • | Dividend yield. The dividend yield is based on our anticipated dividend payments over the remaining expected holding period. |
We estimate potential forfeitures of grants and adjust stock-based compensation expense accordingly. The estimate of forfeitures is adjusted over the requisite service period to the extent that actual forfeitures differ from the prior estimates. We estimate forfeitures based upon our historical experience and, at each period, review the estimated forfeiture rate and make changes as factors affecting the forfeiture rate calculations and assumptions change.
Valuation of Redeemable Common Stock and Redeemable Convertible Preferred Stock
Valuation of Redeemable Common Stock
Prior to the IPO in fiscal year 2015, the Company had certain shares of common stock outstanding that are subject to agreements that permit the holder of those shares to put its shares to us for cash. This Redeemable Common Stock is recorded at its fair value in the mezzanine section of our Consolidated Balance Sheets and changes in fair value are recorded in Retained earnings. The fair value of our common stock is based on the most recent contemporaneous third-party valuation report, which historically applied industry-appropriate multiples to EBITDA and performed a discounted cash flow analysis. Under the industry-appropriate multiples approach, to arrive at concluded multiples, we considered differences between the risk and return characteristics of us and the guideline companies. Under the discounted cash flow analysis, the cash flows expected to be generated by us are discounted to their present value equivalent using a rate of return that reflects the relative risk of an investment in us, as well as the time value of money. This return is an overall rate based upon the individual rates of return for invested capital (equity and interest-bearing debt). The return, known as the weighted average cost of capital, or WACC, is calculated by weighting the required returns on interest-bearing debt and common stock in proportion to their estimated percentages in an expected capital structure. The categorization of the framework used to price this temporary equity is considered a Level 3, due to the subjective nature of the unobservable inputs used to determine the fair value.
The redemption feature of our Redeemable common stock allowing the holder to put its shares to us for cash, as discussed in the previous paragraph, became unenforceable upon effectiveness of the IPO on July 25, 2014. As a result, the Redeemable common stock was recorded at fair value through the effective date of the IPO and was subsequently reclassified at that fair value to permanent equity.
Valuation of Redeemable Convertible Preferred Stock
Prior to the effective date of the IPO, the trustee of our ESOP had the ability to put the shares of our Redeemable convertible preferred stock to us. Our Redeemable convertible preferred stock is recorded at its fair value in the mezzanine section of our Consolidated Balance Sheets and changes in fair value are recorded in retained earnings. Accordingly, we estimated the fair value of the Redeemable convertible preferred stock through estimating the fair value of our common stock and applying certain adjustments including for the fair
80
Table of Contents
value of the total dividends to be received and assuming conversion of the preferred stock to common stock at the stated conversion ratio per our certificate of incorporation. The categorization of the framework used to price this temporary equity is considered a Level 3, due to the subjective nature of the unobservable inputs used to determine the fair value.
Upon the effective date of the IPO, the redemption feature of our Redeemable convertible preferred stock allowing the Trustee of the Company’s ESOP to put shares to us for cash was no longer applicable. However, if our common stock, which our Redeemable convertible preferred stock may convert to, is no longer a “registration-type class of security” (e.g., in the event of a delisting), the option held by the Trustee, which granted it the ability to put the shares of our Redeemable convertible preferred stock to us, would then become applicable. Preferred securities that become redeemable upon a contingent event that is not solely within the control of the Company should be classified outside of permanent equity. As of March 31, 2015, the Company has determined that it is not probable that the redemption feature will become applicable. Since the Redeemable convertible preferred stock is not currently redeemable and it is not probable that the instrument will become redeemable, subsequent adjustment to fair value is not required. As such, the Redeemable convertible preferred stock was recorded to fair value at the effective date of the IPO on July 25, 2014 and will remain in mezzanine equity without further adjustment to carrying value unless it becomes probable that the redemption feature will become applicable.
Income Taxes
Income taxes are accounted for under the asset and liability method. Deferred tax assets and liabilities are recognized and represent the future tax consequences attributable to differences between the financial statement carrying amounts of existing assets and liabilities and their respective tax bases. They are measured using the enacted tax rates expected to apply to taxable income in the years in which the related temporary differences are expected to be recovered or settled. The effect on deferred tax assets and liabilities of a change in tax rates is recognized in income in the period that includes the enactment date. The deferred income tax provision represents the change during the reporting period in the deferred tax assets and deferred tax liabilities. Penalties and interest recorded on income taxes payable are recorded as part of income taxes.
We follow the GAAP guidance for uncertain tax positions within FASB ASC 740, “Income Taxes” which provides guidance related to the financial statement recognition and measurement of tax positions taken or expected to be taken in a tax return. The standard prescribes the minimum recognition threshold that a tax position is required to meet before being recognized in the financial statements. ASC 740, “Income Taxes” also provides guidance on derecognition, classification, interest and penalties, accounting in interim periods and disclosure. Initial recognition, derecognition and measurement is based on management’s judgment given the facts, circumstances and information available at the reporting date. If these judgments are not accurate then future income tax expense or benefit could be different.
Recent Accounting Pronouncements
For a discussion of recent accounting pronouncements, see “Note 1. Background and Summary of Significant Accounting Policies” to our consolidated financial statements included in “Item 8. Financial Statements and Supplementary Data.”
ITEM 7A. QUANTITATIVE AND QUALITATIVE DISCLOSURES ABOUT MARKET RISK
We are subject to various market risks, primarily related to changes in interest rates, raw material supply prices, and to a lesser extent, foreign currency exchange rates. Our financial position, results of operations or cash flows may be negatively impacted in the event of adverse movements in the respective market rates or prices in each of these risk categories. Our exposure in each category is limited to those risks that arise in the normal course of business, as we do not engage in speculative, non-operating transactions.
81
Table of Contents
Interest Rate Risk
We are subject to interest rate risk associated with our debt. Changes in interest rates impact the fair value of our fixed-rate debt, but there is no impact to earnings and cash flow. Alternatively, changes in interest rates do not affect the fair value of our variable-rate debt, but they do affect future earnings and cash flow. The Revolving Credit Facility, the Term Note, and our industrial development revenue bond, or IDRB, notes bear variable interest rates. The Revolving Credit Facility and Term Note bear interest either at LIBOR or the Prime Rate, at our option, plus applicable pricing margins. The IDRB notes bear interest at weekly commercial paper rates, plus applicable pricing margins. A 1.0% increase in interest rates on our variable-rate debt would increase our annual forecasted interest expense by approximately $1.9 million and $2.4 million based on our borrowings as of March 31, 2015 and 2014, respectively. Assuming the Revolving Credit Facility is fully drawn, each 1.0% increase or decrease in the applicable interest rate would change our interest expense by approximately $3.1 million and $3.2 million, as of March 31, 2015 and 2014, respectively. To mitigate the impact of interest rate volatility, we had two interest rate swaps in effect as of March 31, 2015. The first swap is a $50 million notional value, non-amortizing swap at a LIBOR rate of 0.86% which expires in September, 2016. A second $50 million notional value swap took effect on September 2, 2014 and expires on September 1, 2016. The rate is at a fixed LIBOR of 1.08%.
Credit Risk
Financial instruments that potentially subject us to a concentration of credit risk consist principally of accounts receivable. We provide our products to customers based on an evaluation of the customers’ financial condition, generally without requiring collateral. Exposure to losses on receivables is principally dependent on each customer’s financial condition. We monitor the exposure for credit losses and maintain allowances for anticipated losses. Concentrations of credit risk with respect to our accounts receivable are limited due to the large number of customers comprising our customer base and their dispersion among many different geographies. One customer has a balance of accounts receivable equal to 14% of our Accounts receivable, net balance as of March 31, 2015.
Raw Material and Commodity Risk
Our primary raw materials used in the production of our products are high density polyethylene and polypropylene resins. As these resins are hydrocarbon-based materials, changes in the price of feedstocks, such as crude oil derivatives and natural gas liquids, as well as changes in the market supply and demand may cause the cost of these resins to fluctuate significantly. Raw materials account for the majority of our cost of goods sold. Given the significance of these costs and the inherent volatility in supplier pricing, our ability to reflect these changes in the cost of resins in our product selling prices in an efficient manner contributes to the management of our overall risk and the potential impact on our results of operations.
We have a resin price risk management program with physical fixed price contracts and financial hedge contracts which are designed to apply to a significant portion of our annual virgin resin purchases. We also maintain supply agreements with our major resin suppliers that provide multi-year terms and volumes that are in excess of our projected consumption. These supply agreements generally do not contain minimum purchase volumes or fixed prices. Accordingly, our suppliers may change their selling prices or other relevant terms on a monthly basis, exposing us to pricing risk. To manage this risk for our polypropylene virgin resin price exposure, we utilize financial hedges of propylene as a proxy for polypropylene. Historically, the month to month change in market based pricing has been very similar between propylene and polypropylene.
Our use of forward fixed price contracts, financial hedges and the incorporation of vertical integration for recycled material have increased our focus on efficiency and resulted in lower overall supply costs. If the price of HDPE and PP virgin resin increased or decreased by 5%, it would result in a change to our annual cost of goods sold of approximately $25 million.
82
Table of Contents
We began a diesel hedging program in 2008 which is executed through several financial swaps covering future months demand for diesel fuel and are designed to decrease our exposure to changing fuel costs. These hedges cover a significant portion of the diesel fuel consumed by the truck fleet that we operate to deliver products to our customers. Our objective is to hedge roughly 50% of our overall monthly fuel costs.
Inflation
Our cost of goods sold is subject to inflationary pressures and price fluctuations of the raw materials we use, primarily high density polyethylene and polypropylene resins. Historically, we have generally been able, over time, to recover the effects of inflation and price fluctuations through sales price increases and production efficiencies related to technological enhancements and improvements. However, we cannot reasonably estimate our ability to successfully recover any price increases.
Financial Instruments
We have operations in countries outside of the United States, all of which use the respective local foreign currency as their functional currency. Each of these operations may enter into contractual arrangements with customers or vendors that are denominated in currencies other than its respective functional currency. Consequently, our results of operations may be affected by exposure to changes in foreign currency exchange rates and economic conditions in the regions in which we sell or distribute our products. Exposure to variability in foreign currency exchange rates from these transactions is managed, to the extent possible, by natural hedges which result from purchases and sales occurring in the same foreign currency within a similar period of time, thereby offsetting each other to varying degrees.
In addition, to the transaction-related gains and losses that are reflected within the results of operations, we are subject to foreign currency translation risk, as the financial statements for our foreign subsidiaries are measured and recorded in the respective subsidiary’s functional currency and translated into U.S. dollars for consolidated financial reporting purposes. The resulting translation adjustments are recorded net of tax impact in the Consolidated Statements of Operations.
83
Table of Contents
ITEM 8. FINANCIAL STATEMENTS AND SUPPLEMENTARY DATA
The Report of Independent Registered Public Accounting Firm, Consolidated Financial Statements and supplementary financial data required for this Item are set forth on pages F-1 through F-62 of this Annual Report on Form 10-K and are incorporated herein by reference.
ITEM 9. CHANGES IN AND DISAGREEMENTS WITH ACCOUNTANT ON ACCOUNTING AND FINANCIAL DISCLOSURE
None.
ITEM 9A. CONTROLS AND PROCEDURES
Background
In connection with the preparation of the Company’s consolidated annual financial statements for the fiscal year ended March 31, 2015, certain errors related to the Company’s accounting treatment for its transportation, aircraft, equipment and real estate leases and inventory were identified. The Company subsequently completed additional accounting review procedures and identified other errors discussed further below. See the discussion in this Item 9A under “Evaluation of Disclosure Controls and Procedures” as well as “Note 2. Restatement of Previously Issued Financial Statements” to the Company’s audited financial statements included in “Item 8. Financial Statements and Supplementary Data,” in this Annual Report on Form 10-K.
The accounting errors referenced above resulted from certain material weaknesses in our internal control over financial reporting. These material weaknesses were identified after the Company’s initial public offering during its fiscal year 2015 audit. Management determined these material weaknesses and other control deficiencies were primarily the result of an ineffective control environment. As a result, the Company lacked effective control activities necessary to prepare accurate financial statements and ensure compliance with regulatory filing requirements applicable to public companies. These material weaknesses are further described in this Item 9A under “Evaluation of Disclosure Controls and Procedures — Internal Control Weaknesses.”
In addition to the foregoing, beginning in June 2015, the Audit Committee of the Company’s Board of Directors (the “Audit Committee”) authorized two investigative reviews by its independent counsel and a third-party forensic consulting firm acting at the direction of independent counsel. The need for these investigations arose from allegations brought to the attention of management and the Audit Committee. The investigations related to potential override of the Company’s journal entry and account reconciliation controls, intra company reconciliations involving the Company’s South American joint venture affiliate and certain accounting misstatements and control deficiencies involving the Company’s Mexican joint venture affiliate. These investigations and the related findings are further described in this Item 9A under “Evaluation of Disclosure Controls and Procedures — Audit Committee Oversight.” The errors and misstatements identified as part of these investigations were corrected, as appropriate, in the Company’s prior period financial statements.
Restatement of Prior Period Financial Statements
Due to the accounting errors known at the time, principally arising out of the Company’s accounting for leases, inventory and property, plant and equipment, as more fully described below, and based upon the recommendation of management, the Audit Committee determined on August 14, 2015 that the Company’s previously reported audited financial statements for the fiscal years ended March 31, 2014, 2013, 2012, 2011 and 2010 (and related reports of the Company’s independent registered public accounting firm on the consolidated financial statements as of March 31, 2014 and 2013, and for each of the three years in the period ended March 31, 2014) and quarterly unaudited interim financial statements for the first three quarters of the fiscal year ended March 31, 2015, as well as each of the quarterly periods for the fiscal years ended March 31, 2014 and 2013, should no longer be relied upon.
84
Table of Contents
As a result, the Company has restated its consolidated financial statements for the fiscal years ended March 31, 2014 and 2013, each of the quarters in fiscal year 2014 and the first three quarters of fiscal year 2015. The restatement also affects periods prior to fiscal year 2013, with the cumulative effect of the restatement being reflected as prior period corrections to the fiscal year 2013 opening balance of retained earnings. The restated consolidated financial statements for the fiscal years ended March 31, 2014 and 2013 are included in this Annual Report on Form 10-K. The unaudited selected data for fiscal years 2011 and 2012 included in “Item 6. Selected Financial and Operating Data,” in this Annual Report on Form 10-K has been restated for the effects of these errors and misstatements as well.
Evaluation of Disclosure Controls and Procedures
Under the supervision and with the participation of our management, including our Chief Executive Officer and our Chief Financial Officer, we evaluated the effectiveness of our disclosure controls and procedures as defined in Rules 13a-15(e) and 15d-15(e) under the Securities Exchange Act of 1934, as amended (the “Exchange Act”), as of March 31, 2015. Disclosure controls and procedures are controls and other procedures that are designed to ensure that information required to be disclosed in our reports filed or submitted under the Exchange Act is recorded, processed, summarized and reported, within the time periods specified under Securities Exchange Commission (“SEC”) rules and forms. Management recognizes that any controls and procedures, no matter how well designed and operated, can provide only reasonable assurance of achieving their objectives, and management necessarily applies its judgment in evaluating the cost-benefit relationship of possible controls and procedures. Based on the evaluation of our disclosure controls and procedures, our Chief Executive Officer and Chief Financial Officer concluded that our disclosure controls and procedures were not effective as of March 31, 2015 because of the material weaknesses in our internal control over financial reporting as further described below. Although we are not yet required to comply with the internal control reporting requirements mandated by Section 404 of the Sarbanes-Oxley Act of 2002 due to the transition period established by rules of the SEC for newly-public companies, our internal control over financial reporting is an integral part of our disclosure controls and procedures.
Audit Committee Oversight
In addition to periodic meetings with management and the Company’s independent registered public accounting firm in connection with the completion of the fiscal year 2015 audit and restatement of prior period financial statements, beginning in June 2015 the Audit Committee authorized investigative reviews by its independent counsel and a third-party forensic consulting firm acting at the direction of independent counsel. These investigations and related findings are further described below.
Review of Potential Override of Journal Entry and Account Reconciliation Controls
In June 2015, certain members of the Company’s finance staff responded affirmatively to questions presented to them by the independent registered public accounting firm in accordance with Public Company Accounting Oversight Board Interim Auditing Standard AU 316, Consideration of Fraud in a Financial Statement Audit (commonly referred to as “SAS 99”). The SAS 99 questions asked members of the finance staff (i) whether they or anyone known to them had ever been asked to record a journal entry or other adjustment without proper authorization or support, (ii) whether they or anyone known to them had ever been asked or coerced to record a journal entry or other adjustment with which they were uncomfortable, or (iii) were they aware of any inappropriate journal entry or other adjustment in the entity’s financial records.
As a result of the responses provided to the SAS 99 questions, the Audit Committee engaged independent counsel and authorized such independent counsel to conduct an investigative review. The Audit Committee’s independent counsel in turn engaged the assistance of a third-party forensic consulting firm to assist in the investigation. The investigation involved the interview of members of the finance staff, including those who responded to the SAS 99 questions, as well as members of the Company’s senior management. The forensic
85
Table of Contents
consulting firm also conducted an extensive review of Company financial and accounting records. The Audit Committee’s independent counsel and forensic consultant completed its investigation and reported its findings to the Audit Committee. While the investigation found no evidence of fraud, it determined that the concerns reflected in the responses to the SAS 99 questions were well founded and resulted in restatement of prior period financial statements.
The Audit Committee’s investigation also identified deficiencies in the Company’s process for reconciling certain intra-company transactions with the Company’s unconsolidated South American joint venture, Tuberías Tigre-ADS Limitada (the “South American Joint Venture”). Specifically, requests by our independent registered public accounting firm for confirmation on certain trade receivables balances between the Company and the South American Joint Venture lacked sufficient documentation when signed and were, in certain instances, completed and signed by the South American Joint Venture at the direction of a former Company employee without reconciling the differences in account balances between the Company and the South American Joint Venture. Following further investigation, the Audit Committee’s independent counsel found that the Company’s intra-company reconciliation process lacked sufficient support. Based on the findings of the investigation, management concluded that the discrepancies in trade confirmations as identified were, once corrected, immaterial to the Company’s consolidated results of operations and financial condition. The findings of the Audit Committee’s investigation resulted in management’s assessment of control deficiencies related to journal entries and account reconciliations, as described more fully below, that constitute a material weakness.
Review of Certain ADS Mexicana Transactions
In October 2015, members of the Company’s management became aware of transactions involving the Company’s consolidated Mexican joint venture, ADS Mexicana, that ADS Mexicana personnel initially brought to the attention of the Company for further review to confirm whether these transactions were appropriately characterized. The ADS Mexicana transactions in question included an aircraft leasing arrangement, a real estate leasing arrangement and several services arrangements that involved ADS Mexicana related parties. Once brought to the attention of the Company, management promptly undertook a review to determine whether such transactions were properly recorded and/or characterized and to ensure that such transactions and their financial impact were appropriately reflected in the Company’s consolidated financial statements.
After receiving a preliminary report from management on the breadth and scope of the issues, the Audit Committee in November of 2015 authorized independent counsel and its forensic consulting firm to conduct an independent investigation. The investigation involved the interview of members of the Company’s finance staff as well as finance and non-finance staff of ADS Mexicana, in addition to a review of the financial and accounting records of the Company and ADS Mexicana related to the transactions in question. Upon concluding the investigation, it was determined by management, upon consultation with the Audit Committee’s advisors, that the various lease and services arrangements described above, as well as certain additional services arrangements with related parties identified during the course of the investigation, lacked commercial and economic substance or proper supporting documentation as to the services performed, and therefore were not appropriately reflected in the Company’s consolidated financial statements and that certain of those transactions should be re-characterized by ADS Mexicana as dividends as opposed to expenses. As a result of re-characterizing the related party transactions, the Company will cause ADS Mexicana to amend its tax returns filed in Mexico for the open tax periods affected as soon as practicable in order to reflect the appropriate tax treatment for the transactions as re-characterized.
The scope of the investigation also included consideration of other ADS Mexicana matters that were identified during the course of the investigation to determine whether such matters involved any unlawful payments in violation of the FCPA. The Audit Committee’s advisors did not find such matters to have been mischaracterized, inappropriately recorded or otherwise contrary to applicable law, including the FCPA. It was, however, determined that such matters were a further indication of weaknesses in the ADS Mexicana control environment.
Management also identified potential accounting errors related to ADS Mexicana’s revenue recognition cut-off practices which were reported by management to the Audit Committee and also investigated by the Audit Committee’s advisors. Specifically, the Company identified instances where ADS Mexicana would recognize
86
Table of Contents
revenue prior to the date of shipment or transfer of title/ownership, which is not in accordance with accounting principles generally accepted in the United States (“GAAP”). The investigation also found that the timing for when such errors occurred was irregular and in certain instances attributable to requests from ADS Mexicana customers that were not properly accounted for, resulting in timing differences between invoicing date and shipment date. It was determined that these errors with respect to revenue recognition occurred due to ineffective controls and not due to an intent to commit fraud.
Management has concluded that the control deficiencies noted above related to the ADS Mexicana control environment, as well as the ADS Mexicana revenue recognition cut-off practices, each constituted a material weakness. Although such matters have resulted in a determination of material weakness, neither the Audit Committee’s advisors in the course of its investigation nor management have concluded whether the weaknesses in the ADS Mexicana control environment, the ADS Mexicana revenue recognition cut-off practices, or any other material weaknesses of the Company as described below, would result in an ultimate determination by the SEC or any other applicable regulatory agency that the Company has not complied with the books and records and internal control provisions of the FCPA as set forth in sections 13(b)(2)(A) and 13(b)(2)(B) of the Exchange Act. See above under “Item 1A. Risk Factors — As a result of our international operations we could be adversely affected by violations of the U.S. Foreign Corrupt Practices Act and similar foreign anti-corruption laws.” The various matters described above with respect to ADS Mexicana (as well as the matters related to the Company’s other material weaknesses) have been voluntarily disclosed by the Company’s representatives to the Enforcement Division in connection with its ongoing investigation as described above in “Item 3. Legal Proceedings.”
For additional discussion regarding the financial impact of the foregoing, as well as a description of ADS Mexicana matters, see below under “Internal Control Material Weaknesses — ADS Mexicana Control Environment” and “Internal Control Material Weaknesses — ADS Mexicana Revenue Recognition Cut-off Practices,” as well as “Note 10. ADS Mexicana” and “Note 12. Related Party Transactions” to the Company’s audited financial statements included in “Item 8. Financial Statements and Supplementary Data,” in this Annual Report on Form 10-K.
Internal Control Material Weaknesses
A material weakness in internal controls is a deficiency, or a combination of deficiencies, in internal control over financial reporting, such that there is a reasonable possibility that a material misstatement of our annual or interim financial statements will not be prevented or detected on a timely basis. Because of its inherent limitations, even appropriate internal control over financial reporting may not prevent or detect misstatements
We have identified certain material weaknesses in our internal control over financial reporting in the areas of (i) Company control environment, (ii) accounting for leases, (iii) accounting for inventory, (iv) journal entry and account reconciliation, (v) ADS Mexicana control environment and (vi) ADS Mexicana revenue recognition cut-off practices, as further described below. Management determined these material weaknesses and other control deficiencies were primarily the result of an ineffective control environment. As a result, the Company lacked effective control activities necessary to prepare accurate financial statements and ensure compliance with regulatory filing requirements applicable to public companies. The lack of a sufficient number of finance personnel with an appropriate level of knowledge, experience and training as well as the Company’s approach to accounting assumptions, estimates and judgments, including documentation and support therefor, were contributing factors to each of these material weaknesses and other control deficiencies described below.
Control Environment
We did not maintain an effective control environment, which is the foundation for the discipline and structure necessary for effective internal control over financial reporting, as evidenced by: (i) an insufficient number of personnel appropriately qualified to perform control design, execution and monitoring activities, (ii) an insufficient number of personnel with an appropriate level of GAAP knowledge and experience and ongoing training in the application of GAAP commensurate with our external financial reporting requirements,
87
Table of Contents
which resulted in erroneous judgments regarding the proper application of GAAP, and (iii) in certain instances, insufficient documentation or basis to support account balances and accounting estimates.
A contributing factor to the material weakness in the control environment was certain aspects of the Company’s “tone at the top” set by senior management, which is the atmosphere and culture created by the Company’s leadership and establishes the environment within which the Company’s financial reporting process occurs. The following areas related to tone at the top were identified as contributing factors to the weaknesses described in the control environment that require remediation:
| • | channels for raising and communicating concerns were not effective to provide for the escalation and resolution of questions or issues known by Company finance staff or management in a timely or appropriate manner; |
| • | Company positions with respect to certain accounting policies, estimates and judgments were not sufficiently established and documented, resulting in enhanced risk tolerance for the application of certain accounting principles; |
| • | management expectations regarding the level of documentation necessary to support account balances, journal entries, accrual calculations and cutoff processes and management estimates were not adequate; |
| • | management’s understanding of its responsibility for the Company’s financial statements (as opposed to the Company’s independent registered public accounting firm) in connection with completing the Company’s fiscal year 2015 audit was not adequate; |
| • | management’s style and temperament created a pressurized environment for finance personnel that was not conducive towards the expression and appropriate resolution of differing viewpoints regarding the Company’s accounting practices; and |
| • | inappropriate emphasis by senior management on meeting aggressive timelines for financial reporting and establishing reasonable timelines, in light of the resources available to the Company’s finance staff. |
Accounting for Leases
We did not design and maintain effective control over the accounting for leases, resulting in a material weakness. The Company’s control over the application of the proper accounting treatment for leases related to fleet tractors, trailers, forklifts, automobiles, aircraft, and buildings was not effective, as the historical accounting analysis failed to consider all criteria necessary for purposes of the assessment of whether the leases should be classified as operating leases or capital leases. We have also re-examined our historic assumptions, estimates and judgments with respect to the accounting for real estate, equipment and aircraft leases that were previously classified as operating leases. We have now determined that a significant number of such leases should instead be classified as capital leases and included in property, plant and equipment.
Accounting for Inventory
We did not design and maintain effective control over the accounting for inventory, resulting in a material weakness. The errors primarily related to the Company’s incorrect historical calculation of inventory cost based on the first-in-first-out (“FIFO”) method, the excess capitalization of certain inter-plant freight expense and other overhead costs, as well as the misclassification of certain overhead costs between general and administrative expense and cost of goods sold.
With respect to inventory costing adjustments related to the application of the FIFO method, the Company had historically utilized a simplified method of calculating inventory cost based on an overall average price near period end for all products, particularly with respect to the resin material cost component of inventory. However, this simplified method for establishing inventory cost became less precise over time as a result of the significant increase in the number of products sold by the Company. The imprecision in this simplified method became even
88
Table of Contents
greater during periods of volatile raw material pricing, which occurred during the fourth quarter of fiscal year 2015.
Multiple contributing factors were identified related to the misclassification of certain overhead costs. First, the Company historically applied a simplified method of capitalizing general and administrative overhead costs to inventory by using a consistent capitalization rate across all general and administrative functions, such as the purchasing, human resources and information technology functions, regardless of the actual percentage of each function’s efforts that were related to the inventory procurement and production process. Additionally, certain capitalized overhead costs were determined to be overstated as the result of either the inclusion of certain types of costs that were unrelated to the inventory production process or the use of estimates that did not accurately reflect actual costs.
Journal Entry and Account Reconciliation
We did not design and maintain effective control over access within our information technology (“IT”) systems to control the ability of key accounting personnel to initiate, modify and record transactions in our financial systems. Specifically, it was determined that certain key accounting personnel had the ability to both prepare and post manual journal entries without appropriate independent review and approval. As these key accounting personnel are also reviewers of certain account reconciliations, we also did not maintain appropriate segregation of duties. Also, management expectations regarding the level of documentation necessary to support account balances, journal entries, accrual calculations and cutoff processes and management estimates were not adequate. Accordingly, we concluded that these journal entry and account reconciliation control deficiencies constitute a material weakness.
In addition, as discussed above, in June 2015 certain members of the Company’s finance staff provided affirmative responses to certain SAS 99 questions presented by the Company’s auditor concerning the Company’s process for recording journal entries and other adjustments without proper authorization or support. Although the Audit Committee’s independent counsel and forensic consultant found no evidence of fraud, it was determined that the concerns reflected in the responses to the SAS 99 questions were well founded and that the Company’s journal entry controls and account reconciliation process were deficient and contributed to the material weakness in the Company’s control environment discussed previously.
ADS Mexicana Control Environment
We did not maintain an effective control environment with respect to certain aspects of the financial reporting of our consolidated joint venture affiliate, ADS Mexicana, resulting in certain mischaracterized transactions. These transactions were the subject of the investigation authorized by the Audit Committee and conducted by its independent advisors as described above.
Based upon the errors identified with respect to ADS Mexicana and the findings of the investigation conducted by the Audit Committee’s independent advisors, management concluded that such deficiencies resulted in a material weakness in ADS Mexicana’s control environment.
For additional discussion regarding the financial impact of the foregoing items as well as a description of ADS Mexicana, see “Note 10. ADS Mexicana” and “Note 12. Related Party Transactions” to the Company’s audited financial statements included in “Item 8. Financial Statements and Supplementary Data,” in this Annual Report on Form 10-K.
ADS Mexicana Revenue Recognition Cut-Off Practices
We did not design and maintain effective control with respect to ADS Mexicana’s revenue recognition cut-off practices. Specifically, the Company identified instances where ADS Mexicana would recognize revenue, prior to the date of shipment or transfer of title/ownership, which is not in accordance with GAAP. Based upon
89
Table of Contents
the errors identified and the findings of the investigation conducted by the Audit Committee’s independent advisors, management concluded that such revenue recognition cut-off practices resulted in a material weakness.
For additional discussion regarding the financial impact of the foregoing items as well as a description of ADS Mexicana, see “Note 10. ADS Mexicana” and “Note 12. Related Parties” to the Company’s audited financial statements included in “Item 8. Financial Statements and Supplementary Data,” in this Annual Report on Form 10-K.
Remediation Process
Following the identification of the material weaknesses described above, and with the oversight of the Audit Committee, we have commenced a process to remediate the underlying causes of the material weaknesses described above, enhance the control environment and strengthen our internal control over financial reporting. The steps that have been taken or that the Company intends to take with respect to remediation are as follows:
Finance Organization Assessment. Management, with approval from the Audit Committee, engaged a nationally recognized accounting firm to perform a comprehensive assessment of the finance organization structure and roles and responsibilities. The Audit Committee approved the findings that resulted from this assessment and directed management to begin implementation of such, as further described below, with continuing Audit Committee oversight.
CEO Communications to Reinforce Compliance. The Company’s Chief Executive Officer, at the direction of the Company’s Board of Directors, has reinforced the importance of adherence to the Company’s policies and procedures regarding ethics and compliance and the importance of identifying misconduct and raising and communicating concerns. This reinforcement has occurred through email and employee newsletter communications, staff meetings, remarks given to senior management during strategic planning sessions, as well as other employee forums. The Company’s Chief Executive Officer has also expressed to the Company’s Board of Directors his commitment to an enhanced control environment.
Change in CFO and Other Finance Personnel. On November 9, 2015 the Company announced the retirement of the Company’s former Chief Financial Officer, who immediately relinquished his title as Chief Financial Officer, Secretary and Treasurer (although remaining employed as an executive vice president until his ultimate retirement date of March 31, 2016) and the appointment of a new Chief Financial Officer, Secretary and Treasurer, effective as of that date. In addition, the Company’s assistant controller resigned in October of 2015. Since March 31, 2015 the Company has also added a Director of SEC Reporting and Technical Accounting, a Senior Manager – Financial Accounting as well as created other staff accounting positions. As part of the Company’s effort to continue to hire additional accounting personnel with appropriate levels of knowledge and expertise, the Company further intends to reorganize its finance organization by separating the chief accounting officer duties currently held by the Company’s Chief Financial Officer. The Company also intends to strengthen its oversight of the financial operations of its consolidated and unconsolidated international joint venture affiliates and in February of 2016 hired an international controller to oversee such activities as part of a broader effort to enhance the Company’s oversight with respect to its joint venture affiliates. Additional new positions are planned and are expected to be filled over the next six to twelve months.
Use of Third-Party Consultants. The Company has augmented its personnel with qualified third-party consulting resources, including in the following areas:
| • | organizational structure and resource assessments related to governance, along with SEC reporting and corporate compliance obligations; |
| • | internal audit out-sourcing including assistance with SOX Section 404 readiness and other internal audit activities; |
| • | financial statement and external reporting support; |
| • | out-sourced staffing for financial reporting, accounting and tax technical support; and |
90
Table of Contents
| • | global anti-corruption, ethics and compliance hotline assessment. |
Assessment of Journal Entry Control Software. A third-party consultant performed a user roles and responsibilities assessment for the Company’s planned Oracle R12 upgrade. The assessment was part of a broader IT evaluation, but focused on remediating user access weaknesses and improving automated controls.
Journal Entry and Account Reconciliation Enhancement. The Company is currently reviewing the IT access key accounting personnel have within our financial systems, and establishing limitations that we believe will address the risks of key accounting personnel having the ability to initiate, modify and record transactions. These limitations will include removing the access for key accounting personnel who have the ability to prepare and post manual journal entries. Additionally, the Company is currently reviewing and modifying the design and implementation of its internal controls relating to the review and approval of manual journal entries and account reconciliation controls.
Implementation and Enhancement of Entity Level Controls: The Company intends to implement the following entity level controls around the quarterly/annual financial reporting process:
| • | Sub-certification Process: Key process owners each quarter (as part of the Form 10-Q preparation) will complete a sub-certification questionnaire and checklist to support how the process owner reached the conclusion that controls are operating effectively in their respective areas and an opportunity to highlight any concerns they have related to internal control over financial reporting. In addition, this will require the process owner to indicate any changes in processes, controls or key personnel during the period. |
| • | Establishment of Disclosure Committee: A formal disclosure committee will be established that includes key members of management (excluding the Company’s CEO and CFO, but including any separately appointed Chief Accounting Officer) that have responsibility for disclosure information necessary for periodic reports filed with the SEC. This committee will meet on an as-needed basis as well as prior to the Audit Committee meeting in which the Form 10-K, Form 10-Q or other relevant Exchange Act document will be approved and will conduct follow-up meetings as necessary. The meeting will cover all significant events from the period being reported upon and supporting information. A charter will be developed governing the conduct of this committee and a formal agenda will be distributed prior to each meeting and minutes will be maintained and published for each meeting. |
| • | Disclosure Committee Certification Process: A formal certification process by the members of the disclosure committee will occur focused on full disclosure of information requiring disclosure to the CEO and CFO, disclosure of any and all control deficiencies or material weaknesses, any knowledge of or instances of fraud, and any other known violations to laws, regulations or Company policies. |
| • | Financial Information Systems Steering Committee. The Company will establish a committee comprised of members of senior finance management, co-chaired by the Company’s Chief Information Officer and an appropriate member of the Company’s finance department (e.g. Controller or Chief Accounting Officer) to monitor activities and developments associated with the Company’s financial information systems. The committee will appoint an information security officer to monitor activities related to information protection, including a comprehensive identity and access management program to enhance the quality and timeliness of reported results. Within our IT organization, we will also appoint a technology integration officer that will be dedicated to the finance and accounting departments to ensure that all information technology projects are appropriately prioritized. |
| • | Financial Software Systems Training. To address any lack of training related to financial systems (Oracle, etc.), the Company intends to ensure regular training for the Company’s finance staff with respect to the Company’s financial applications and other financial reporting tools, including live training for Oracle users and implementing enhanced knowledge management tools and protocols around the Company’s financial software. |
| • | ICFR Survey Analysis. Annually, Company employees will complete a control environment and fraud assessment survey, administered by an independent third party. The survey will be anonymous, and |
91
Table of Contents
| consolidated results will be reported to internal audit for review and reporting to the CFO and the Audit Committee. |
| • | SOX 404 Internal Control Implementation and Training. The Company will continue to implement an action plan during fiscal year 2016 and first quarter of fiscal 2017 to develop the Company’s control environment for purposes of SOX 404 compliance, which will include further identifying, implementing and documenting appropriate controls, and training staff on SOX 404 compliance. A SOX Steering Committee has been established among the Company’s executives to oversee the implementation of the SOX 404 compliance plan, which compliance plan efforts have been regularly reported on to the Company’s Audit Committee. |
| • | Enhanced Training for Finance Staff and Communication. The Company will implement a training program in the first fiscal quarter of each year to ensure there is a thorough understanding of the Company’s accounting policies and methodologies applicable for the year as well as periodic training on key areas related to accounting and public company reporting and SEC matters, which training programs will be formalized and reported to the Chair of the Audit Committee. The Company’s CFO further plans to institute a formal communications protocol around regular finance staff meetings during which information related to financial reporting and other topics will be addressed. |
Enhanced Reporting Line Procedures. The Company intends to establish procedures for ensuring clear reporting structures, reporting lines and decisional authority responsibilities and to ensure communication with operational departments, accounting, the Board and the Audit Committee. This includes within the finance organization, which will report to the CFO, establishing documented procedures for meetings and interactions among key departments (finance, accounting, treasury etc.).
Process Level Control Remediation. The Company intends to utilize processes and controls created and documented as part of the completion of the fiscal year 2015 audit and related restatement on an ongoing basis, specifically around areas such as inventory, leases, software capitalization, property, plant and equipment, rebates, trademark adjustments, tax adjustments, central parts, trademark impairment adjustments and journal entries. See “Note 2. Restatement of Previously Issued Financial Statements,” to the Company’s audited financial statements included in “Item 8. Financial Statements and Supplementary Data,” in this Annual Report on Form 10-K for additional information on the areas for which process level control remediation have been developed.
Senior Executive Organizational Assessment. The Company’s Chief Executive Officer, with the assistance of appropriate third-party advisors, will undertake over the next six to twelve months an assessment of the current senior leadership organizational structure and present to the Compensation Committee and the Board recommendations for reorganization to ensure proper lines of reporting and communication consistent with a public company.
Enhanced Employee Outreach and Training on Public Company Culture. The Company will engage a qualified expert to establish a formal training program for the Company’s senior executive management team and other relevant personnel on building and maintaining a strong public company structure and culture. This training will supplement prior training efforts undertaken prior to and immediately following the initial public offering, and will be intended to enhance the officers’ knowledge of the regulatory obligations, Company policies, ethics and compliance and other recommended cultural enhancements necessary to achieve the expected public company culture.
Additional Training on Ethics, Compliance and Anti-Corruption. The Company will develop a formal training program Company-wide for purposes of implementing any additional ethics, compliance and global anti-corruption policies adopted as a result of the efforts undertaken by the Company and its third-party advisors with respect to ethics and compliance.
Establishment of Foreign Operations Committee. The Company intends to form a management foreign operations committee to exercise oversight with respect to all of the Company’s international operations, including ADS Mexicana. This committee will provide oversight with respect to governance, accounting
92
Table of Contents
policies, training, ethics and compliance, dividends, tax and cash repatriation issues, and be comprised of representatives of the Company’s legal, treasury, accounting, tax operations and human resources departments as considered appropriate.
Enhancement of ADS Mexicana Control Environment. The Company intends to implement entity level controls, as well as cause ADS Mexicana to enhance its control environment, through a comprehensive remediation plan aimed specifically at the control issues identified as part of the ADS Mexicana investigation described above. The remediation steps will include the following:
| • | Disciplinary Actions. The Company has begun to undertake steps to cause ADS Mexicana to take appropriate remediation action, including disciplinary action, for employees within ADS Mexicana who were aware of and participated in the conduct described above. |
| • | Establishment of New Dividend/Fee Payment Structure. The Company intends to evaluate potential alternative structures for the future payment by ADS Mexicana of dividends and/or fees to related parties to ensure all such payments are appropriately supported. |
| • | Global Ethics and Anti-Corruption Program Enhancement. As further described above, the Company will develop a formal training program for purposes of implementing any additional ethics, compliance and global anti-corruption policies adopted as a result of the efforts undertaken by the Company and its third-party advisors with respect to ethics and compliance, which will include ADS Mexicana and its personnel. |
| • | Enhanced Company Oversight. The Company intends to enhance its oversight and day-to-day involvement in the financial and operational activities of ADS Mexicana. The Company’s Senior Vice President for International Operations will work with the Company’s new international controller, as well as a newly created foreign operations committee comprised of Company personnel across business lines, who will focus on areas such as governance, training, legal structure, dividends, cash repatriation and other functions relevant to the Company’s international joint ventures, including ADS Mexicana. |
| • | Establishment of an International Controller. As referenced above under “Change in CFO and Other Finance Personnel,” the Company has hired an international controller as part of a broader effort to enhance the Company’s oversight with respect to its joint venture affiliates, including ADS Mexicana. |
| • | Board Governance and Structure Changes. The Company has evaluated the existing structure and composition of the ADS Mexicana board of directors, as well as the governance provisions of the existing joint venture agreement, and intends to reorganize the ADS Mexicana board and institute additional governance measures to provide the Company with additional oversight for ADS Mexicana and its activities, including the participation of Company legal advisors in attendance at all ADS Mexicana board meetings and other experts when necessary. |
| • | Enhanced Accounting Policies and Procedures. The Company intends to enhance its accounting policies and procedures that are applicable to ADS Mexicana through the implementation of the following: |
| (1) | establishment of a review control for all management fee accounting and related journal entries; |
| (2) | enhanced revenue recognition policies, in-depth cut-off procedures, and controls for sales transactions; |
| (3) | enhanced period-end policies, procedures and controls for expense cut-offs and accruals; |
| (4) | alignment of inventory costing methodology, policies and procedures to Company policies and procedures; and |
| (5) | enhanced related-party transaction policies, procedures and controls, particularly with respect to the identification and disclosure of related-party transactions. |
| • | Establishment of a New Policy and Enhanced Internal Controls related to Cut-off / Revenue Recognition Practices. The Company intends to implement written policies regarding revenue recognition related to the sale of inventory to ensure appropriate cut-off procedures for recognizing revenue in the correct period. The |
93
Table of Contents
| Company will also enhance training for sales, accounting, and inventory personnel related to the new revenue recognition practices to ensure all appropriate personnel are informed. Additionally, management will be enhancing the existing internal controls to require a more comprehensive review of sales near period-end. |
We believe the foregoing efforts will effectively remediate the material weaknesses described above. As we continue to evaluate and work to improve our internal control over financial reporting, we may take additional measures to address these control deficiencies or modify the remediation plan described above. We cannot assure you, however, when we will remediate such weakness, nor can we be certain of whether additional actions will be required. See above under Item 1A, “Risk Factors — Our failure to maintain effective disclosure controls and internal control over financial reporting could adversely affect our business, financial position and results of operations.”
Changes in Internal Control over Financial Reporting
Other than the changes described above under “Evaluation of Disclosure Controls and Procedures,” there were no changes in our internal control over financial reporting (as defined in Rules 13a-15(f) and 15d-15(f) of the Exchange Act) that occurred during the three months ended March 31, 2015 that have materially affected, or are reasonably likely to materially affect, our internal control over financial reporting.
Management’s Report on Internal Control over Financial Reporting for 2015
This Annual Report on Form 10-K does not include a report of management’s assessment regarding internal control over financial reporting or an attestation report of the Company’s registered public accounting firm due to a transition period established by rules of the SEC for newly-public companies.
None.
94
Table of Contents
PART III
| ITEM 10. | DIRECTORS, EXECUTIVE OFFICERS AND CORPORATE GOVERNANCE |
Directors and Board Structure
Our business and affairs are managed under the direction of our board of directors. We currently have nine directors. Our directors hold office until their successors have been elected and qualified or until the earlier of their resignation or removal.
Our board of directors is divided into three classes of directors serving staggered terms of three years each. At each annual meeting of stockholders, a class of directors will be elected for a three-year term to succeed the class whose term is then expiring. The terms of our current directors will expire upon the election and qualification of successor directors at the annual meeting of stockholders to be held during fiscal year 2018 for the Class I directors, fiscal year 2016 for the Class II directors and fiscal year 2017 for the Class III directors:
Our Class I directors are Joseph A. Chlapaty, Tanya Fratto and David L. Horing;
Our Class II directors are Robert M. Eversole, Alexander R. Fischer and M.A. (Mark) Haney; and
Our Class III directors are C. Robert Kidder, Richard A. Rosenthal and Abigail S. Wexner.
Any vacancies in our classified board of directors will be filled by the remaining directors and the elected person will serve the remainder of the term of the class to which he or she is appointed. Any additional directorships resulting from an increase in the number of directors will be distributed among the three classes so that, as nearly as possible, each class will consist of one-third of the directors.
The following paragraphs describe the business experience and education of our directors.
Joseph A. Chlapaty. Mr. Chlapaty joined us in 1980 and has served as Chairman of our board of directors since 2008, a director since 1988, President since 1994 and Chief Executive Officer since 2004. From 1980 to 1994, Mr. Chlapaty served as our Vice President and Chief Financial Officer. Before joining us, Mr. Chlapaty served as Corporate Accounting Manager, Assistant Treasurer, and Treasurer for Lindberg Corporation and prior to that was with Arthur Andersen LLP. Mr. Chlapaty serves on the advisory board to Fifth Third Bank of Columbus, and is also a member or former member of several not-for-profit boards, including Nationwide Children’s Hospital, KIPP Journey Academy, The Columbus Foundation, Ohio Foundation of Independent Colleges, the University of Dubuque and Marietta College. Mr. Chlapaty holds a bachelor’s degree in Business Administration from the University of Dubuque and an MBA from DePaul University. We believe that Mr. Chlapaty’s leadership capabilities, his thorough knowledge of all facets of our business and operations and his deep understanding of our history, culture and the markets in which we operate make him qualified to serve as a member of our board of directors.
Robert M. Eversole. Mr. Eversole became a director in 2008. Mr. Eversole is a Principal of Stonehenge Partners, Inc., a private investment capital firm and has been continuously employed as such since 2007. Prior to joining Stonehenge Partners, Mr. Eversole spent 22 years with Fifth Third Bank, most recently as President and Chief Executive Officer of Central Ohio, and additionally served as Regional President for Fifth Third Bancorp affiliate banks in Western Ohio, Central Florida and Ohio Valley. He also served as a member of the Fifth Third Bancorp Operating Committee. Mr. Eversole currently serves on the boards of directors for certain privately-held companies. Mr. Eversole is a graduate of The Ohio State University and has completed a number of executive education programs. We believe that Mr. Eversole’s extensive background in private equity and commercial banking, his expertise on financial matters and his extensive leadership and management experience make him qualified to serve as a member of our board of directors.
95
Table of Contents
Alexander R. Fischer. Mr. Fischer became a director in 2014. Mr. Fischer has been the President and CEO of the Columbus Partnership, an organization of CEOs focused on civic, philanthropic, education and economic development opportunities in Columbus, Ohio, since 2009. Prior to his role at the Columbus Partnership, Mr. Fischer worked at Battelle Memorial Institute, a science and technology company, from 2002 to 2009, where he served as Senior Vice President for Business and Economic Development, Vice President of Commercialization, and Director of Technology Transfer and Economic Development. Mr. Fischer has also worked in the public sector, as Commissioner of Economic Development, Deputy Governor and the Chief of Staff for the State of Tennessee from 1997 to 2002. In the past, he has served on the boards of directors for a variety of for-profit and not-for-profit organizations, and currently serves on the boards of Nationwide Children’s Hospital, The Ohio State University, Columbus 2020, and The Ohio State Innovation Foundation. Mr. Fischer graduated from the University of Tennessee with a B.S. in Economics and Public Administration and also received a Master’s of Science in Urban Planning and Economic Development from the University of Tennessee. We believe that Mr. Fischer’s executive management experience, his knowledge of economic development and commercialization and the knowledge he has gained from his extensive involvement in the public policy sectors make him qualified to serve as a member of our board of directors.
Tanya Fratto. Ms. Fratto became a director in 2013. Prior to that, Ms. Fratto spent over 30 years with global industrial companies and private equity. She was Chief Executive Officer of Diamond Innovations, Inc., a world-leading manufacturer of industrial diamonds and cubic boron nitride used in oil and gas, infrastructure, automotive, aerospace, and electronics industries. In addition, she enjoyed a successful 20-year career with General Electric. Her experience has ranged from profit and loss ownership, product management and operations, to Six Sigma and supply chain management, spending time in GE Aerospace, GE Plastics, Corporate Sourcing, GE Appliances, and GE Consumer Service. Ms. Fratto holds a BS in Electrical Engineering from the University of South Alabama. She currently sits on the board of Smiths Global Plc, a global technology company. We believe that Ms. Fratto’s extensive executive and management experience as well as her experience managing global operations and the insights gained from those experiences make her qualified to serve as a member of our board of directors.
M.A. (Mark) Haney. Mr. Haney became a director in 2014. Mr. Haney retired in December 2011 from Chevron Phillips Chemical Company LP, a chemical producer, where he served as Executive Vice President of Olefins and Polyolefins from January 2011 until his retirement. From 2008 to 2011, Mr. Haney served as Senior Vice President, Specialties, Aromatics and Styrenics. He also served as Vice President of Polyethylene and President of Performance Pipe. Prior to joining Chevron Phillips Chemical Company, Mr. Haney held numerous management positions with Phillips Petroleum Company. Mr. Haney currently serves on the board of directors of Phillips 66 Partners LP. Mr. Haney attended West Texas University and majored in chemistry. We believe that Mr. Haney’s extensive executive and management experience and his understanding of the petro-chemicals industry and the raw materials used in our products make him qualified to serve as a member of our board of directors.
David L. Horing. Mr. Horing became a director in 2010 and was appointed to our board of directors by ASP ADS Investco, LLC, an affiliate of American Securities. Mr. Horing is a Managing Director of American Securities, an investment firm, and is a Managing Member of the general partner of certain funds managed by American Securities. Before joining American Securities in 1995, he spent seven years at The Dyson-Kissner-Moran Corporation, a middle-market private equity investment firm and previously worked in Solomon Brothers’ Investment Banking division and with The Boston Consulting Group. He currently is a director of Royal Adhesives and Sealants, Inc., Tekni-Plex, Inc., and Aspen Dental. Mr. Horing holds a bachelor’s degree in Engineering and a bachelor’s degree in Economics from the University of Pennsylvania and an M.B.A. from the Harvard Business School. We believe that Mr. Horing’s business education, extensive private equity experience, his industry and financial expertise and his years of experience providing strategic advisory services to complex organizations, as well as his understanding of American Securities, make him qualified to serve as a member of our board of directors.
96
Table of Contents
C. Robert Kidder. Mr. Kidder became a director in 2014. Mr. Kidder also serves as the Lead Independent Director on our board of directors. Mr. Kidder served as Chairman and Chief Executive Officer of 3Stone Advisors LLC, a private investment firm, from 2006 to 2011, and as non-executive Chairman of the Board of Chrysler Group LLC from 2009 to 2011. He was a Principal at Stonehenge Partners, Inc., a private investment firm, from 2004 to 2006. Mr. Kidder served as President of Borden Capital, Inc., a company that provided financial and strategic advice to the Borden family of companies, from 2001 to 2003. He was Chairman of the Board from 1995 to 2004 and Chief Executive Officer from 1995 to 2002 of Borden Chemical, Inc. (formerly Borden, Inc.), a forest products and industrial chemicals company. Mr. Kidder was Chairman and Chief Executive Officer and President and Chief Executive Officer of Duracell International Inc. Prior to joining Duracell International Inc., Mr. Kidder worked in planning and development at Dart Industries as well as a management consultant with McKinsey & Co. Mr. Kidder currently serves on the boards of directors of Merck & Co., Inc. and Microvi Biotech Inc. and previously served on the board of directors of Morgan Stanley from 1997 to 2015. Mr. Kidder earned a B.S. in industrial engineering from the University of Michigan and a graduate degree in industrial economics from Iowa State University. We believe Mr. Kidder’s extensive financial and senior executive experience, including in business development, operations and strategic planning, as well as knowledge he has gained through his directorship service at other public companies, make him qualified to serve as a member of our board of directors.
Richard A. Rosenthal. Mr. Rosenthal became a director in 1988. Mr. Rosenthal retired from the University of Notre Dame du Lac in 1995 after successfully serving as Athletic Director for eight years. Prior to his service as athletic director and following a professional basketball career, Mr. Rosenthal held several leadership roles in banking, including as Executive Vice President of Indiana Bank & Trust as well as serving over 25 years as Chairman and CEO of St. Joseph Bancorp. He formerly served on the boards of directors of LaCrosse Footwear, St. Joseph Capital Bank, Beck Corp., and two advisory boards of venture capital funds. Mr. Rosenthal holds a bachelor’s degree in Finance from the University of Notre Dame du Lac and is a former Chairman and current member of the Business Advisory Council of the University of Notre Dame du Lac Mendoza College of Business. We believe that Mr. Rosenthal’s extensive financial and senior executive experience, as well as knowledge he has gained through his directorship service with other companies, make him qualified to serve as a member of our board of directors.
Abigail S. Wexner. Mrs. Wexner became a director in 2014. Mrs. Wexner is the Chairman and CEO of Whitebarn Associates, a private investment company. She is a member and former Chair of the board of directors of Nationwide Children’s Hospital. She is Founder and Chair of the boards of The Center for Family Safety & Healing (f/k/a Columbus Coalition Against Family Violence) and KidsOhio.org, Vice Chair of the board of KIPP Columbus, and a Trustee of The Ohio State University, The Columbus Downtown Development Corporation, The Columbus Partnership, Pelotonia, The Wexner Medical Center, The Wexner Foundation, The Columbus Jewish Federation, The Wexner Center Foundation and the United States Equestrian Team Foundation. Mrs. Wexner also serves as a director of L Brands (formerly Limited Brands, Inc.). Mrs. Wexner graduated from Columbia University and New York University School of Law. We believe Mrs. Wexner’s executive and legal experience, as well as her expertise with respect to a wide range of organizational, philanthropic and public policy issues make her qualified to serve as a member of our board of directors.
97
Table of Contents
Certain Information Regarding our Directors and Executive Officers
The name and age of each director, nominee and executive officer and the positions held by each of them as of the date of this Annual Report on Form 10-K are as follows:
| Name |
Age | Director Class |
Position(s) | |||||
| Joseph A. Chlapaty |
70 | Class I | Chairman of the Board of Directors, Director, President and Chief Executive Officer | |||||
| Scott A. Cottrill |
50 | — | Executive Vice President, Chief Financial Officer, Secretary and Treasurer (1) | |||||
| Mark B. Sturgeon |
61 | — | Executive Vice President (1) | |||||
| Thomas M. Fussner |
59 | — | Executive Vice President and Co-Chief Operating Officer | |||||
| Ronald R. Vitarelli |
49 | — | Executive Vice President and Co-Chief Operating Officer | |||||
| Robert M. Klein |
53 | — | Executive Vice President, Sales | |||||
| Ewout Leeuwenburg |
49 | — | Senior Vice President, International | |||||
| Robert M. Eversole |
53 | Class II(2) | Director | |||||
| Alexander R. Fischer |
48 | Class II | Director | |||||
| Tanya Fratto |
55 | Class I | Director | |||||
| M.A. (Mark) Haney |
60 | Class II | Director | |||||
| David L. Horing |
53 | Class I | Director | |||||
| C. Robert Kidder |
71 | Class III | Lead Independent Director | |||||
| Richard A. Rosenthal |
83 | Class III | Director | |||||
| Abigail S. Wexner |
54 | Class III | Director | |||||
| (1) | On November 3, 2015, Mark B. Sturgeon, the Chief Financial Officer, Executive Vice President, Secretary and Treasurer of the Company notified the Company of his intention to retire from the Company effective March 31, 2016 and that effective November 9, 2015 he would step down as the Company’s Chief Financial Officer, Secretary and Treasurer. Mr. Sturgeon will remain employed as an Executive Vice President of the Company until his retirement on March 31, 2016. On November 9, 2015, the board of directors appointed Scott A. Cottrill to serve as Executive Vice President, Chief Financial Officer, Secretary and Treasurer of the Company. |
| (2) | On February 4, 2015, the board of directors reassigned Mr. Eversole as a Class II director to fill the vacancy resulting from the previously-announced resignation of Mark A. Lovett. After giving effect to the foregoing, the three classes of directors of the Company are as nearly equal in number as possible, in accordance with the Company’s Amended and Restated Certificate of Incorporation. |
Executive Officers who are not Directors
Scott A. Cottrill joined us in November 2015 as Executive Vice President, Chief Financial Officer, Secretary and Treasurer. Mr. Cottrill comes to the Company with extensive financial reporting, accounting and corporate finance experience. From 2012 to November 2014 Mr. Cottrill served as Executive Vice President and Chief Financial Officer of Jeld-Wen, Inc., a leading global manufacturer of windows, doors and treated composite trim and panels, and from November 2014 to February 2015 as an Executive Vice President. From 1998 to 2012, Mr. Cottrill held various finance and accounting positions with Goodrich Corporation, including from 2005 to 2012 the position of Vice President, Controller and Chief Accounting Officer and from 2002 to 2005 the position of Vice President, Internal Audit. Prior to joining Goodrich, Mr. Cottrill worked at PricewaterhouseCoopers LLP from 1987 to 1998 Mr. Cottrill holds a Bachelor of Science degree in Accounting from The Pennsylvania State University and is also a Certified Public Accountant.
Mark B. Sturgeon joined us in March 1981 and served as Executive Vice President and Chief Financial Officer from February 1994 to November 2015. His responsibilities encompassed the Company’s entire financial organization, including the treasury, tax, credit functions, risk management, investor relations and legal and he
98
Table of Contents
also coordinated the Company’s strategic planning efforts. On November 3, 2015, Mr. Sturgeon notified the Company of his intention to retire from the Company effective March 31, 2016 and that effective November 9, 2015 he would step down as the Company’s Chief Financial Officer, Secretary and Treasurer. Mr. Sturgeon will remain employed as an Executive Vice President of the Company until his retirement on March 31, 2016. Mr. Sturgeon has held the positions of Corporate Cost and Budget Manager and Market Planning Manager and was named Corporate Controller in October 1988. Prior to joining us he spent three years as a Budget & Financial Analyst for Borden Company and a year with Touche Ross & Company. Mr. Sturgeon is a Certified Public Accountant, a Certified Management Accountant, and graduated from Pennsylvania State University with a B.S. Degree in Business Administration and an M.S. in Accounting.
Thomas M. Fussner joined us in October 1989 and has served as Executive Vice President since February 2006 and Co-Chief Operating Officer since November 2009. Mr. Fussner joined us as Director, Supplier Relations and has held advancing leadership roles in our manufacturing and operations functions, including being named Vice President, Manufacturing Operations in July 1995 and Senior Vice President, Manufacturing Operations in January 2009. He currently oversees our manufacturing, logistics, procurement, manufacturing engineering, operational services, human resources, and information technology functions. Prior to joining us, he spent seven years at the lighting division of General Electric in plant, product, and customer service management positions. Mr. Fussner holds a bachelor’s degree in Chemistry from Colgate University and an M.B.A. with a concentration in Operations Management from the University of Michigan.
Ronald R. Vitarelli joined us in November 1988 and has served as Executive Vice President & Co-Chief Operating Officer since November 2011. Mr. Vitarelli joined us as a Sales Representative and was promoted to Regional Sales Manager in December 1995. In July 2003, he was named General Manager of StormTech LLC, a manufacturer of underground storm water retention and detention systems that was a 50/50 joint venture of ours with Infiltrator Systems, Inc. Upon our acquisition of the remaining 50% interest in StormTech from Infiltrator in November 2009, Mr. Vitarelli rejoined us and continued to lead the StormTech business until March 2010, when he was named Vice President, Storm & Sanitary Markets. He currently oversees our sales, product development, market management, and engineering functions. Mr. Vitarelli holds a bachelor’s degree in Marketing from Providence College.
Robert M. Klein joined us in June 1992 and has served as Executive Vice President, Sales since February 2006. Upon joining us, Mr. Klein held several leadership positions in operations including Manager, Regional Manufacturing, Manager, Distribution Yards, Director, Purchasing and was named Vice President, Manufacturing Services in January 1999. In July 2001, he was named Vice President, Sales and Marketing and began providing leadership to our field sales, corporate account sales, marketing, customer service, and market analysis functions. Prior to joining us, he spent seven years at The Gerstenslager Company in manufacturing management positions. Mr. Klein holds a bachelor’s degree in Business Administration from Ashland College.
Ewout Leeuwenburg joined us in April 2001 and has served as Senior Vice President, International since November 2011. He began leading our international operations in December 2007 and was named Vice President, International in July 2008. Mr. Leeuwenburg joined us upon the completion of our acquisition of the Inline Drain & Drain Basin division of Nyloplast, USA in 2001. At the time of the acquisition, Mr. Leeuwenburg had been with Nyloplast, USA Inc. since July 1988 in various business development, operations, sales, and marketing manager positions, and had served as President, United States since July 1996. Upon joining us, he served as General Manager, Nyloplast and expanded his responsibilities to Director, Allied Products in September 2002. Mr. Leeuwenburg holds a bachelor’s degree in Mechanical Engineering from Hogeschool Rotterdam in the Netherlands.
Section 16(a) Beneficial Ownership Reporting Compliance
Section 16(a) of the Securities Exchange Act of 1934 requires our officers and directors, and persons who own more than 10% of a registered class of our equity securities, to file reports of ownership and changes in
99
Table of Contents
ownership with the SEC. Officers, directors and greater than ten percent stockholders are required by SEC regulation to furnish the Company with copies of all Section 16(a) forms they file. To the Company’s knowledge, based solely on review of the copies of such reports furnished to the Company, during the fiscal year ended March 31, 2015, or with respect to such fiscal year, all Section 16(a) filing requirements were met.
Codes of Business Conduct and Ethics
Our board of directors has established a Code of Ethics for Senior Executive and Financial Officers that applies to our senior executive and financial officers, including our principal executive officer, principal financial officer, principal accounting officer, or persons performing similar functions. We also maintain a Code of Business Conduct and Ethics that governs all of our directors, officers and employees. A copy of the Code of Ethics for Senior Executive and Financial Officers and the Code of Business Conduct and Ethics are available on our website at www.ads-pipe.com. We will promptly disclose any future amendments to these codes on our website, as well as any waivers from these codes for executive officers and directors. Copies of these codes will also be available in print from our Corporate Secretary, without charge, upon request.
Audit Committee
Our board of directors has established an audit committee and our audit committee is comprised of Messrs. Eversole, Fischer, Haney and Ms. Fratto, with Mr. Eversole serving as the chairperson of the audit committee. Mark L. Lovett also served on the audit committee until his resignation as a director effective as of December 10, 2014. With respect to Mr. Lovett’s service on the audit committee, our board of directors determined that Mr. Lovett was not independent for the purposes of audit committee membership, due to his employment with American Securities. American Securities is a significant stockholder through its affiliate, ASP ADS Investco, LLC. Accordingly, solely for the purpose of Rule 10A-3 of the Securities Exchange Act of 1934, as amended, our board of directors has concluded that Mr. Lovett was an affiliated person by virtue of his relationship with American Securities and thus not considered independent for purposes of Exchange Act Rule 10A-3, although he was considered to be independent for purposes of the rules of the NYSE. All of the members of the audit committee are financially literate and have accounting or related financial management expertise within the meaning of the rules of the NYSE. Our board of directors has determined that Mr. Eversole qualifies as an “audit committee financial expert,” as that term is defined under the SEC rules implementing Section 407 of the Sarbanes-Oxley Act of 2002.
| ITEM 11. | EXECUTIVE COMPENSATION |
Compensation Discussion and Analysis
The following Compensation Discussion and Analysis provides information regarding the material elements of our fiscal year 2015 compensation program for our “named executive officers,” also referred to as the “NEOs.” Our NEOs for fiscal year 2015 were:
| • | Joseph A. Chlapaty, our President and Chief Executive Officer; |
| • | Mark B. Sturgeon, who served as our Executive Vice President, Chief Financial Officer, Secretary and Treasurer until he stepped down as Chief Financial Officer, Secretary and Treasurer on November 9, 2015; |
| • | Thomas M. Fussner, our Executive Vice President and Co-Chief Operating Officer; |
| • | Ronald R. Vitarelli, our Executive Vice President and Co-Chief Operating Officer; and |
| • | Robert M. Klein, our Executive Vice President of Sales. |
The compensation and management development committee of our board of directors, or the Committee, pursuant to its charter, is responsible for establishing, implementing and reviewing on an annual basis our
100
Table of Contents
compensation programs and actual compensation paid to our NEOs, except for our Chief Executive Officer, with respect to whom the Committee’s decisions are subject to review and final approval by our board of directors.
Executive Summary
We believe our compensation practices and the overall level of executive compensation are competitive when compared to the marketplace and reflect our commitment to performance-based pay. Our compensation programs are intended to align our NEOs’ interests with those of our stockholders by rewarding performance that meets or exceeds the goals the Committee establishes, with the objective of increasing long-term stockholder value. Further, our executive compensation programs are designed to align with our financial performance.
In the year prior to fiscal year 2015, the Committee requested and management completed a review of our executive compensation programs compared to market practices and in light of our business model, growth strategy, and planned transition to public ownership. Following review and discussion, the Committee approved changes to components of our executive compensation programs to establish a sustainable and competitive framework to motivate and retain the leadership talent necessary to drive achievement of planned business results as well as successfully guide the Company through its transition to being publically owned. Consistent with those objectives, base salary adjustments were made for each NEO, the annual cash incentive plan design was modified to contain specific performance thresholds and corresponding awards, and non-qualified stock option grants were made to each NEO which were intended to be multi-year awards. These changes resulted in a shift of the total compensation mix of the NEOs from short to long-term compensation, which the Committee believes further aligns the interests of our executives with those of our stockholders.
As a result, in fiscal year 2015 there were no substantive changes made to the components of compensation for our NEOs. Specifically for our NEOs, there were no base salary adjustments, no material changes to the design of the annual cash incentive plan, and no grants were made from any of our equity programs with the exception of certain reload options. Further, consistent with our commitment to align our executive compensation design with our stockholders’ interests and coinciding with our transition to a public company, we developed a custom peer group for benchmarking our compensation practices.
For fiscal year 2015, the Committee recommended and approved, and the Board ratified and approved, incentive awards under the Cash Incentive Plan for each NEO, and the Company paid such incentive awards to the NEOs, based on the Company’s preliminary financial performance for fiscal year 2015. However, in light of the subsequent uncertainty regarding the Company’s financial performance for fiscal year 2015 until the completion of the audit, management recommended, and the Committee approved the recommendation, to rescind the fiscal year 2015 awards and request that the NEOs voluntarily return all previously-paid amounts, as described in the Company’s Current Report on Form 8-K filed with the SEC on May 11, 2015. On August 17, 2015, our NEOs voluntarily agreed to return to the Company the previously-paid cash bonuses awarded under the annual cash incentive plan for fiscal year 2015.
The summary below reflects our belief in having executive pay linked to stockholder value creation and alignment between our fiscal year 2015 executive compensation and our financial performance.
Our Compensation Philosophy and Principles
Our culture is based on delivering sustainable results; a philosophy we believe is best embodied by our core values of:
| • | focusing on long-term growth and profitability; |
| • | creating an environment that promotes loyalty among employees, customers, and suppliers; |
| • | being sales and marketing driven; |
| • | being committed to innovation in product, process, and technology; and |
| • | ensuring quality throughout our products and organization. |
101
Table of Contents
Compensation Philosophy
The Committee and our management believe that fostering the core values referenced above requires a strong performance culture and compensation programs that align our executives’ interests with those of all of our stockholders by rewarding performance that meets or exceeds the goals established by the Committee and our board of directors.
Compensation Principles
Our executive compensation programs are designed according to the following principles:
| • | emphasizing pay-for-performance to motivate both short and long-term performance; |
| • | structuring total compensation levels within the competitive market range for similar executive roles, which is generally viewed as the pay range between +/- 15% of the median of the Compensation Peer Group; |
| • | placing greater emphasis on variable pay versus fixed pay; |
| • | linking the total compensation of our executives to the sustained value they create for our stockholders through the use of equity-based compensation; |
| • | structuring total compensation levels within competitive range for similar executive roles; and |
| • | attracting, retaining and motivating top executive talent. |
Setting Pay Levels
When setting pay levels the Committee exercises its discretion to position individual pay levels higher or lower in the competitive market range based on a subjective assessment of individual facts and circumstances, including the:
| • | strategic importance of the position to our growth objectives; |
| • | individual experience, competency, skill, performance, and potential; |
| • | overall performance and contribution of the individual to the business performance; and |
| • | elapsed time since the last compensation adjustment. |
Determining Executive Compensation
Role of our Compensation and Management Development Committee. Pursuant to authority delegated by our board of directors, the Committee is responsible for the design and implementation of our executive compensation policies and programs and determines the compensation for each of our executive officers other than the Chief Executive Officer consistent with the terms of the employment agreement for each NEO. In fiscal year 2015, our board of directors determined the compensation of Mr. Chlapaty, our Chief Executive Officer, based on the Committee’s recommendations and in accordance with Mr. Chlapaty’s employment agreement. A summary of the employment agreements currently in effect with each of our NEOs is described below under “— Employment Agreements.”
Role of Management. Our human resources department, in partnership with the Committee, supports the design and implementation of all executive compensation programs. Our finance department supports this process by providing financial analysis as part of the review of program design. Except with respect to his own compensation, our Chief Executive Officer has final management-level review of any compensation program before it is sent to the Committee for consideration and approval. The Committee has responsibility for approving our material compensation programs, including our equity compensation program. Management
102
Table of Contents
frequently consults with the Committee during the design process to obtain their direction and feedback on how the design of our executive compensation programs supports our overall strategy.
Compensation Peer Group. To enable the Company to benchmark our compensation programs, the Company uses a customized compensation peer group, developed with support from Towers Watson. The Committee has determined that these companies reflect the compensation practices of companies with comparable lines of business, size, and operating characteristics.
| Apogee Enterprises, Inc. | Eagle Materials Inc. | Gibraltar Industries, Inc. | ||
| Griffon Corporation | Lindsay Corporation | Martin Marietta Materials Inc. | ||
| Masonite International Corporation | Mueller Water Products, Inc. | NCI Building Systems Inc. | ||
| Ply Gem Holdings, Inc. | Quanex Building Products Corporation | Simpson Manufacturing Co., Inc. | ||
| Watts Water Technologies, Inc. |
In general, these companies come from the building products, machinery, or construction materials industry that are likely to be attracting and retaining talent with similar experience and skills to that of our Company. The median annual revenue of these companies approximates our annual revenue and reflects a range of $600 million to $2.3 billion.
Role of Compensation Consultants. In establishing the compensation peer group and custom analysis, management utilized the services of Towers Watson, a third-party executive compensation consultant, to assist management in connection with this process. Towers Watson did not provide any services to us, or receive any payments from us, other than in their capacity described above.
Components of Compensation
For fiscal year 2015, the principal components of compensation for the named executive officers were:
| • | base salary; |
| • | annual cash incentive compensation; |
| • | long-term equity-based compensation; and |
| • | benefits and executive perquisites. |
The Committee has responsibility for determining all elements of compensation granted to the NEOs and reviews each element of compensation, as well as the relative mix or weighting of elements, on an annual basis.
Base Salary
Base salary is the primary fixed element of total compensation and serves as the foundation for the executive’s compensation structure, since the annual cash incentive program is directly linked to base salary levels. Our NEOs are covered by employment agreements and, accordingly, we pay annual base salaries initially as set forth in these agreements as thereby adjusted, which are determined based on the Committee’s discretion on each NEOs position and responsibility and on the custom peer group analysis. Base salaries for each NEO are reviewed on an annual basis and compared against the competitive range for similar positions based on the custom peer group analysis. Each year, the Chief Executive Officer, with input from the human resources department, proposes base salary increases, if any, for all NEOs, excluding himself, based on the aforementioned criteria. His proposal is subject to review and approval (with or without modifications) by the Committee. Changes to Mr. Chlapaty’s base salary are initiated and approved by the Committee directly, subject to the review and final approval of our board of directors.
103
Table of Contents
There were no adjustments in base salary initiated or approved for the NEOs in fiscal year 2015. The table below shows the base salaries for the NEOs in fiscal year 2015.
| Named Executive Officer |
Base Salary | |||
| Joseph A. Chlapaty |
$ | 475,000 | ||
| Mark B. Sturgeon |
$ | 285,000 | ||
| Thomas M. Fussner |
$ | 315,000 | ||
| Ronald R. Vitarelli |
$ | 275,000 | ||
| Robert M. Klein |
$ | 270,000 | ||
Annual Cash Incentive Compensation
The fiscal year 2015 ADS Annual Cash Incentive Plan, or the Cash Incentive Plan, provides annual cash incentive compensation opportunities based on three performance measures related to our financial performance, as well as an individual performance measure based upon the performance of the NEO as compared to their annual performance objectives. By tying a significant portion of the executive’s total annual cash compensation to annual variable pay, the Committee believes it further reinforces our pay for performance culture and focuses our executives on critical short-term financial and operational objectives, which also support our long-term financial goals.
As discussed below under “— Payout Awards for Fiscal Year 2015,” our NEOs voluntarily agreed to return to the Company the previously-paid cash bonuses awarded under the annual cash incentive plan for fiscal year 2015.
Establishing Target Payouts
Under the Cash Incentive Plan, target payouts for each NEO are reviewed on an annual basis and compared against the custom peer group analysis. The Chief Executive Officer, with input from the human resources department, proposes annual target payout adjustments, if any, for all NEOs, excluding himself, based on the aforementioned performance measures. His proposal is subject to review and approval (with or without modifications) by the Committee. Changes to Mr. Chlapaty’s targeted payout from the Cash Incentive Plan are initiated and approved by the Committee directly, subject to the review and final approval of our board of directors.
Consistent with our compensation principles, the target payouts from the Cash Incentive Program are a significant portion of the target annual cash compensation for our NEOs. The Committee believes the established targets enhance the alignment to our pay-for-performance and stakeholder alignment principles. The target annual cash incentive payouts for fiscal year 2015 as a percentage of salary were as follows:
| Target Payout (as a percent of salary) | ||||
| Joseph A. Chlapaty |
140 | % | ||
| Mark B. Sturgeon |
75 | % | ||
| Thomas M. Fussner |
75 | % | ||
| Ronald R. Vitarelli |
75 | % | ||
| Robert M. Klein |
65 | % | ||
Minimum Threshold Performance Level
Consistent with our pay-for-performance compensation principle, the Cash Incentive Plan includes a funding trigger that requires the achievement of the established minimum threshold performance level for Adjusted EBITDA in order for any potential payout based on the Total Net Sales, Average Quarterly Debt
104
Table of Contents
Balance or Individual Goal Achievement measures. For fiscal year 2015, the Adjusted EBITDA funding trigger was set at $147,009,000, the minimum Adjusted EBITDA threshold required to receive a threshold payout of 40% as described below.
Performance Measures
The Committee believes that the following measures reflect key value drivers for purposes of establishing payouts under the Cash Incentive Plan:
| • | Total Net Sales — sales after cash discounts, product returns, and freight rebills. |
| • | Adjusted EBITDA — EBITDA before stock-based compensation expense, non-cash charges and certain other expenses. |
| • | Average Quarterly Debt Balance — average quarter end long-term debt. |
| • | Individual Goal Achievement — performance of the executives versus their annual performance objectives. |
Minimum, target, and maximum performance thresholds are established based on the Committee’s assessment of performance targets that appropriately drive and reward the achievement of growth versus our prior year performance levels.
For fiscal year 2015, 55% of the incentive award is based upon the achievement of certain levels of adjusted EBITDA, 15% is based upon certain levels of Total Net Sales, 10% is based upon certain levels of quarterly average debt, while 20% is based upon attainment of certain personal performance goals. The foregoing percentages are then multiplied by the NEO’s target percentage of annual base salary as of March 31, 2015 to arrive at the target amounts.
The minimum performance goals required to receive a threshold payout of 40% of target for Total Net Sales, Adjusted EBITDA, and Average Quarterly Debt were $1,069,009,000, $147,009,000, and $425,340,000, respectively. Those performance goals represent our prior year actual performance levels for Total Net Sales and Adjusted EBITDA, and represent an 11% or $41,384,000 increase versus the prior year for Average Quarterly Debt. The performance goals required to receive a threshold payout of 100% of target for Total Net Sales, Adjusted EBITDA, and Average Quarterly Debt were $1,252,038,000, $171,544,000, and $404,648,000, respectively. Those performance goals reflect a 17% or $183,029,000 growth versus the prior year for Total Net Sales, a 17% or $24,535,000 growth versus the prior year for Adjusted EBITDA, and a 5% or $20,692,000 increase versus the prior year for Average Quarterly Debt Balance. The maximum performance goals required to achieve a threshold payout of 250% of target for Total Net Sales, Adjusted EBITDA, and Average Quarterly Debt were $1,435,067,000, $196,079,000, and $383,956,000, respectively. Those performance goals reflect a 34% or $366,058,000 growth versus the prior year for Total Net Sales, a 33% or $49,070,000 growth versus the prior year for Adjusted EBITDA, and the prior year actual performance level for Average Quarterly Debt. Payout percentages for performance between the minimum performance goal and the maximum performance goal are determined by using linear interpolation.
The Cash Incentive Plan also includes an individual goal achievement measure, weighted at 20% of the plan, to provide the Chief Executive Officer, the Committee, and our board of directors the opportunity to distinguish individual performance. The same range of payout percentages for the non-individual metrics in the plan can be awarded to each participant. For each NEO, at the beginning of the fiscal year the Committee approved individual annual performance objectives supportive of key business and operational strategies. The individual objectives were based on objective and subjective criteria. Payments based upon this measure in the Cash Incentive Plan are recommended by the Chief Executive Officer, excluding himself, based on his assessment of the performance of the NEOs versus the established annual performance objectives approved for the fiscal year. The recommendations are subject to the review and final approval of the Committee. Similarly,
105
Table of Contents
the Committee assesses the performance of the Chief Executive Officer versus his established annual performance objectives and recommends a payout percentage for the measure that is subject to the review and final approval of our board of directors.
The annual performance objectives for Mr. Chlapaty for fiscal year 2015 included (i) leading the completion of the initial public offering, (ii) leading the achievement of annual revenue and earnings targets, (iii) developing an operational and financial contingency plan, (iv) leading the on-going development of the senior management development and succession plan, (v) updating the long-term strategic plan, and (vi) driving new product development initiatives.
The annual performance objectives for Mr. Sturgeon for fiscal year 2015 included (i) leading the completion of the initial public offering, (ii) developing and implementing an effective investor relations operation, (iii) leading the public company transition with the audit committee and outside auditors, (iv) preparing the organization for Sarbanes Oxley compliance, (v) developing a strategic acquisition strategy, and (vi) building relationships with equity analysts.
The annual performance objectives for Mr. Fussner for fiscal year 2015 included (i) driving achievement of planned conversion costs (ii) leading the performance of Green Line Polymers, (iii) driving improvement in fleet utilization and freight costs, (iv) driving improvement in HP pipe production performance, and (v) building leadership and talent in the operations organization.
The annual performance objectives for Mr. Vitarelli for fiscal year 2015 included (i) driving achievement of planned sales revenue in the U.S. and Canada, (ii) leading the re-focusing of the field engineering team, (iii) leading new product development, (iv) leading market expansion in Canada, and (v) building leadership and talent in the sales and technical services organizations.
The annual performance objectives for Mr. Klein for fiscal year 2015 included (i) driving achievement of planned sales revenue in the U.S., (ii) managing pricing strategies to deliver planned performance levels, (iii) developing and implementing strategies to maintain corporate account relationships, (iv) managing selling expenses, and (v) building leadership and talent in the sales organization.
No specific weightings are attached to any of the foregoing factors, which serve as a general guide for the Committee in determining whether the individual goals for each NEO have been achieved.
Payout Awards for Fiscal Year 2015
For fiscal year 2015, the Committee recommended and approved, and the Board ratified and approved, incentive awards under the Cash Incentive Plan for each NEO, and the Company paid such incentive awards to the NEOs, based on the Company’s preliminary financial performance for fiscal year 2015. However, in light of the subsequent uncertainty regarding the Company’s financial performance for fiscal year 2015 until the completion of the audit, management recommended, and the Committee approved the recommendation, to rescind the fiscal year 2015 awards and request that the NEOs voluntarily return all previously-paid amounts, as described in the Company’s Current Report on Form 8-K filed with the SEC on May 11, 2015. On August 17, 2015, our NEOs voluntarily agreed to return to the Company the previously-paid cash bonuses awarded under the annual cash incentive plan for fiscal year 2015.
106
Table of Contents
As a result, final approved payouts under the Cash Incentive Plan were zero for each NEO in fiscal year 2015. The target incentive awards under the Cash Incentive Plan, as well as the final approved payouts for fiscal year 2015 were as follows:
| Named Executive Officer |
Target Incentive Award ($) |
Approved Payout (1) |
||||||
| Joseph A. Chlapaty |
$ | 665,000 | $ | 0 | ||||
| Mark B. Sturgeon |
$ | 213,750 | $ | 0 | ||||
| Thomas M. Fussner |
$ | 236,250 | $ | 0 | ||||
| Ronald R. Vitarelli |
$ | 206,250 | $ | 0 | ||||
| Robert M. Klein |
$ | 175,500 | $ | 0 | ||||
| (1) | As discussed above under “— Payout Awards for Fiscal Year 2015,” our NEOs voluntarily agreed to return to the Company the previously-paid cash bonuses awarded under the annual cash incentive plan for fiscal year 2015. |
Long-Term Equity-Based Compensation
We maintain several equity-based incentive plans as described below under “—Equity-Base Incentive Plans,” including:
| • | the ADS Amended 2000 Incentive Stock Option Plan (or the 2000 Plan), |
| • | the ADS 2008 Restricted Stock Plan (or the 2008 Plan), and |
| • | the ADS 2013 Stock Option Plan (or the 2013 Plan). |
Our NEOs participate in all of the aforementioned plans (except that Mr. Chlapaty received no award grants under the 2000 Plan). We no longer make awards under the 2000 Plan, although additional options were issued in fiscal year 2015 pursuant to the reload feature of the 2000 Plan. On August 12, 2014, our board of directors amended the 2000 Plan to terminate the reload option feature under the 2000 Plan.
Long-term incentive compensation is an integral part of the total compensation for Company executives. The long-term equity-based incentives of the NEOs are reviewed on an annual basis. Each year, the Chief Executive Officer, with input from human resources, proposes long-term equity-based incentive grants, if any, for all NEOs, excluding himself, based on the aforementioned criteria. His proposal is subject to review and approval (with or without modifications) by the Committee. The long-term equity-based incentive grant, if any, for Mr. Chlapaty is initiated and approved by the Committee directly, subject to the review and final approval of our board of directors.
Based on the scale of the stock option and restricted stock awards approved by the Committee and board of directors in fiscal year 2014, no long-term incentive grants were initiated or approved in fiscal year 2015.
Benefits and Executive Perquisites
The benefits provided to our NEOs are generally the same as those provided to our other salaried associates and include medical, vision and dental insurance, basic life insurance and accidental death and dismemberment insurance, short- and long-term disability insurance.
All of the NEOs, with the exception of Mr. Chlapaty, participate in our tax-qualified ESOP that covers employees who meet certain service requirements. See “— Equity-Based Incentive Plans — Employee Stock Ownership Plan” below for additional information regarding the ESOP.
107
Table of Contents
All of the NEOs, with the exception of Mr. Chlapaty, participated in a fully-insured executive medical reimbursement plan for a portion of fiscal year 2015. This plan was terminated on December 31, 2014. In consideration of this benefit, the NEOs participating in the plan contributed $6,000 in calendar year 2014 for dual participation in this plan as well as our medical, dental and vision plans.
All of the NEOs are provided with an individually owned life insurance policy providing $200,000 of permanent whole life coverage with a term rider providing an initial death benefit of $200,000. This benefit is in recognition of the carve-out under our group term life insurance program that reduces the maximum benefit available from $450,000 to $50,000 for executives, including NEOs. The death benefit under the term rider is gradually replaced by paid-up additional permanent life insurance provided by the dividends on the policies. The policies also accrue cash values which are owned by the executive, or their designee, and may be available to them while the policies are in effect. Premiums for each policy are paid for by us and the premium is considered taxable income to the NEO.
We also provide our NEOs with certain perquisites. These perquisites include use of Company-owned or leased cars and reimbursement of car-related expenses, payment of automobile insurance premiums for Company provided and personal vehicles, and reimbursement of country club or fitness membership dues. In determining the total compensation payable to our NEOs, the Committee considers perquisites in the context of the total compensation which our NEOs are eligible to receive. However, given the fact that perquisites represent a relatively small portion of the NEO’s total compensation, the availability of these perquisites does not materially influence the decisions made by the Committee with respect to other elements of the total compensation to which our NEOs are entitled or to which they are awarded.
Pursuant to the terms of his employment agreement, Mr. Chlapaty is entitled to the use of any Company-owned or leased aircraft at our expense for travel related to the performance of his duties on behalf of us and/or charitable uses and purposes. Mr. Chlapaty and certain other NEOs are also permitted to make personal use of Company aircraft. In fiscal year 2015, Mr. Chlapaty and Mr. Sturgeon made personal use of Company aircraft. The incremental cost of personal use of Company aircraft is calculated based on the average variable operating cost per hour flown, which includes fuel costs, aircraft maintenance and supplies, landing fees and trip related hanger and parking costs. Fixed costs that do not change based on usage such as hanger rental, aircraft lease payments, insurance and certain administrative expenses are excluded from the incremental cost calculation. If an aircraft flies empty before picking up or after dropping off a passenger flying for personal reasons, this “deadhead” segment is included in the incremental cost of the personal use. If an NEO is traveling on business utilizing Company aircraft and there is otherwise room available on the aircraft for the NEO’s spouse to accompany the NEO, the spouse is permitted to do so.
For a description of the perquisites received by our NEOs during fiscal year 2015, see the “All Other Compensation” column of our Summary Compensation Table below.
Other Executive Compensation Policies and Practices
Risk in Relation to Compensation Programs
Management has assessed our compensation programs and has concluded that there are no plans that provide meaningful incentives for employees, including our NEOs and additional executive officers, to take risks that would be reasonably likely to have a material adverse effect on us. The Company based its assessment on a review of the material compensation plans and arrangements, most notably the long-term equity based compensation programs and the annual cash incentive compensation plan. The Company reached its conclusion in part due to the balance of fixed and variable compensation, balance of short and long-term incentives, design features of the plans, and the oversight and administration of the Committee.
108
Table of Contents
Recoupment of Incentive Compensation Policy
On June 30, 2014 the board of directors adopted the Recoupment of Incentive Compensation policy to further protect the interests of the stockholders and Company. Under this policy, if, in the opinion of the independent directors of the board of directors, financial results are materially mis-stated due in whole or in part to intentional fraud or misconduct by one of more of the Company’s executive officers, the independent directors have the discretion to use their best efforts to remedy the fraud or misconduct and prevent its recurrence. The independent directors may, for up to five years following such mis-statement, direct that the Company recover all or a portion of any bonus or incentive compensation paid, or cancel the stock-based awards granted, to the executive officer(s). In addition, the independent directors may, for up to five years following such mis-statement, also seek to recoup any gains realized with respect to equity-based awards, including stock options and restricted stock units.
The independent directors are entitled to exercise remedies pursuant to this policy if each of the following conditions have been met: (1) the bonus or incentive compensation to be recouped was calculated based upon the financial results that were restated, (2) one or more executive officers engaged in the intentional misconduct, and (3) the bonus or incentive compensation calculated under the restated financial results is less than the amount actually paid or awarded.
The independent directors did not exercise the remedies pursuant to this policy in connection with the voluntary return of the payout awards for fiscal year 2015, which payouts were rescinded at the recommendation of management in light of the uncertainty regarding the Company’s financial performance for fiscal year 2015 until the completion of the audit, which recommendations the compensation and management development committee approved.
Tax and Accounting Considerations
While the accounting and tax treatment of compensation generally has not been a consideration in determining the amounts of compensation for our executive officers, the Committee and management have taken into account the accounting and tax impact of various program designs to balance the potential cost to us with the value to the executive.
The expenses associated with executive compensation issued to our executive officers and other key associates are reflected in our financial statements. We account for stock-based programs in accordance with the requirements of ASC Topic 718, which requires us to recognize in the income statement the grant date fair value of equity-based compensation issued to associates over the vesting period of such awards.
Compensation and Management Development Committee Report
The Compensation and Management Development Committee has reviewed and discussed with the Company’s management the Compensation Discussion & Analysis set forth above. Based on such review and discussions, the Compensation and Management Development Committee has recommended to the Board of Directors that the Compensation Discussion & Analysis be included in this Annual Report on Form 10-K for the year ended March 31, 2015.
Respectfully submitted,
C. Robert Kidder (Chair)
David L. Horing
Richard A. Rosenthal
Abigail S. Wexner
109
Table of Contents
Summary Compensation Table for Fiscal Year 2015
The following table summarizes the total compensation earned in each of the fiscal years noted by our NEOs:
| Name and Principal Position |
Fiscal Year |
Salary $(1) |
Bonus $ |
Stock Awards $(2) |
Option Awards $(3) |
Non-Equity Incentive Plan Compensation $ (4) |
All Other Compensation $ (5) |
Total $ |
||||||||||||||||||||||||
| Joseph A. Chlapaty |
2015 | 475,000 | — | — | — | — | 189,355 | 664,355 | ||||||||||||||||||||||||
| President & Chief Executive Officer |
2014 | 454,167 | — | 385,200 | 3,221,680 | 300,000 | 136,588 | 4,497,635 | ||||||||||||||||||||||||
| Mark B. Sturgeon |
2015 | 285,000 | — | — | 83,506 | — | 36,755 | 405,621 | ||||||||||||||||||||||||
| Executive Vice President and Former Chief Financial Officer, Secretary and Treasurer(6) |
2014 | 270,417 | — | 128,400 | 1,075,871 | 115,000 | 44,806 | 1,634,494 | ||||||||||||||||||||||||
| Thomas M. Fussner |
2015 | 315,000 | — | — | — | — | 6,054 | 321,054 | ||||||||||||||||||||||||
| Executive Vice President and Co-Chief Operating Officer |
2014 | 308,750 | — | 160,500 | 1,025,080 | 105,000 | 26,654 | 1,625,984 | ||||||||||||||||||||||||
| Ronald R. Vitarelli |
2015 | 275,000 | — | — | — | — | 5,682 | 280,682 | ||||||||||||||||||||||||
| Executive Vice President and Co-Chief Operating Officer |
2014 | 264,583 | — | 160,500 | 1,025,080 | 100,000 | 23,094 | 1,573,257 | ||||||||||||||||||||||||
| Robert M. Klein |
2015 | 270,000 | — | — | 187,272 | — | 4,133 | 461,405 | ||||||||||||||||||||||||
| Executive Vice President of Sales |
2014 | 261,667 | — | 96,300 | 878,640 | 85,000 | 18,122 | 1,339,729 | ||||||||||||||||||||||||
| (1) | For fiscal year 2014, reflects adjustment to NEO salaries that went into effect as of September 1, 2013. |
| (2) | There were no restricted stock awards in fiscal year 2015. For fiscal 2014, the amounts reported in this column are based on the aggregate grant date fair value of restricted stock awarded, computed in accordance with ASC Topic 718. We calculated the estimated fair value of each share of restricted stock on the date of grant as described in “Note 20. Stock-Based Compensation” in the audited financial statements included in the Company’s Annual Report on Form 10-K for the fiscal year ended March 31, 2015. |
| (3) | The amounts reported in this column are based on the aggregate grant date fair value of stock options awarded, computed in accordance with the ASC Topic 718. We calculated the estimated fair value of each option award on the date of grant using a Black-Scholes option pricing model as described in “Note 20. Stock-Based Compensation” in the audited financial statements included in the Company’s Annual Report on Form 10-K for the fiscal year ended March 31, 2015. The amounts in this column for Mr. Sturgeon and Mr. Klein also includes the grant date fair value of reload options issued in connection with the exercise of previously granted options under the 2000 Plan. The dollar amount of the option awards in fiscal year 2014 and 2015 related to reload options for Mr. Sturgeon is $50,791 and $83,506, respectively. The dollar amount of the option awards in fiscal year 2015 related to reload options for Mr. Klein is $187,272. |
| (4) | The amounts reported in this column consist of amounts to be paid under the Cash Incentive Plan for services rendered in fiscal years 2014 and 2015, as discussed above under “— Compensation Discussion and Analysis — Components of Compensation — Annual Cash Incentive Compensation.” Our NEOs voluntarily agreed to return to the Company the previously-paid cash bonuses awarded under the annual cash incentive plan for fiscal year 2015, as discussed above under “— Compensation Discussion and Analysis — Components of Compensation — Annual Cash Incentive Compensation — Payout Awards for Fiscal Year 2015.” |
110
Table of Contents
| (5) | The All Other Compensation column is made up of the following amounts for fiscal year 2015: |
| Name |
Medical Reimbursement Plan Premiums |
Life Insurance Premiums |
Dividends on Unvested Restricted Stock (a) |
Perquisites(b) | Total $ | |||||||||||||||
| Joseph A. Chlapaty |
$ | — | $ | 4,204 | $ | 4,067 | $ | 181,084 | $ | 189,355 | ||||||||||
| Mark B. Sturgeon |
$ | 187 | $ | 3,664 | $ | 1,356 | $ | 31,568 | $ | 36,775 | ||||||||||
| Thomas M. Fussner |
$ | 187 | $ | 3,834 | $ | 2,033 | $ | — | $ | 6,054 | ||||||||||
| Ronald R. Vitarelli |
$ | 187 | $ | 4,094 | $ | 1,401 | $ | — | $ | 5,682 | ||||||||||
| Robert M. Klein |
$ | 187 | $ | 2,854 | $ | 1,092 | $ | — | $ | 4,133 | ||||||||||
| (a) | On December 10, 2014, we paid a cash dividend of $.04 per share to all stockholders of record on December 1, 2014 and on March 16, 2015, we paid a cash dividend of $.04 per share to all stockholders of record on March 2, 2014. In connection with these dividends and based on their respective equity holdings, our NEOs received such dividend payments with respect to unvested shares of restricted common stock. |
| (b) | The amounts shown include the value of perquisites and other personal benefits to an NEO only if the aggregate value exceeded $10,000. Where we do report perquisites and other personal benefits for an NEO, we quantify each perquisite or personal benefit only if it exceeds the greater of $25,000 or 10% of the total amount of perquisites and personal benefits for that individual. The amount reported for Mr. Chlapaty and Mr. Sturgeon for fiscal 2015 comprised the incremental cost to us of their personal use of Company aircraft ($164,437 for Mr. Chlapaty, $105,084 of which was for philanthropic purposes), personal use of automobile and related automobile liability insurance expense, and social membership dues. The incremental cost of personal use of Company aircraft is calculated based on the average variable operating cost per hour flown, which includes fuel costs, aircraft maintenance and supplies, landing fees and trip related hanger and parking costs. Fixed costs that do not change based on usage such as hanger rental, aircraft lease payments, insurance and certain administrative expenses are excluded from the incremental cost calculation. If an aircraft flies empty before picking up or after dropping off a passenger flying for personal reasons, this “deadhead” segment is included in the incremental cost of the personal use. If an NEO is traveling on business utilizing Company aircraft and there is otherwise room available on the aircraft for the NEO’s spouse to accompany the NEO, the spouse is permitted to do so. As there is no incremental cost to us for the spouse accompanying the executive on such flight, no amount has been included in the Summary Compensation Table with respect to such usage. |
| (6) | On November 3, 2015, Mr. Sturgeon notified the Company of his intention to retire from the Company effective March 31, 2016 and that effective November 9, 2015 he would step down as the Company’s Chief Financial Officer, Secretary and Treasurer. Mr. Sturgeon will remain employed as an Executive Vice President of the Company until his retirement on March 31, 2016. |
111
Table of Contents
Grants of Plan-Based Awards for Fiscal Year 2015
The following table provides information concerning awards granted to the NEOs in the last fiscal year under any plan:
| Name |
Grant Date | Estimated Possible Payouts Under Non-Equity Incentive Plan Awards (1) |
All Other Stock Awards: Number of Shares of Stock (#) |
All Other Option Awards: Number of Securities Underlying Options (#) |
Exercise or Base Price of Option Awards ($/Sh) |
Grant Date Fair Value of Stock and Option Awards ($) (3) |
||||||||||||||||||||||||||
| Threshold $ |
Target $ |
Maximum $ |
||||||||||||||||||||||||||||||
| Joseph A. Chlapaty |
N/A | 266,000 | 665,000 | 1,662,500 | — | — | — | — | ||||||||||||||||||||||||
| Mark B. Sturgeon |
N/A | 85,500 | 213,750 | 534,375 | — | — | — | — | ||||||||||||||||||||||||
| 8/12/2014 | (2) | — | — | — | — | 12,353 | 15.74 | 83,506 | ||||||||||||||||||||||||
| Thomas M. Fussner |
N/A | 94,500 | 236,250 | 590,625 | — | — | — | — | ||||||||||||||||||||||||
| Ronald R. Vitarelli |
N/A | 82,500 | 206,250 | 515,625 | — | — | — | — | ||||||||||||||||||||||||
| Robert M. Klein |
N/A | 70,200 | 175,500 | 438,750 | — | — | — | — | ||||||||||||||||||||||||
| 8/12/2014 | (2) | — | — | — | — | 27,703 | 15.74 | 187,272 | ||||||||||||||||||||||||
| (1) | The amounts shown reflect the estimated payouts for fiscal year 2015 under the Cash Incentive Plan that the respective NEO would be eligible for assuming no use of discretion by the Committee in authorizing such payments. Our NEOs voluntarily agreed to return to the Company the previously-paid cash bonuses awarded under the annual cash incentive plan for fiscal year 2015, as discussed above under “— Compensation Discussion and Analysis — Components of Compensation — Annual Cash Incentive Compensation — Payout Awards for Fiscal Year 2015.” Actual amounts awarded are reflected in the Non-Equity Incentive Plan Compensation column of the Summary Compensation Table above. For additional information, see discussion above under “— Compensation Discussion and Analysis — Components of Compensation — Annual Cash Incentive Compensation.” |
| (2) | Represents option awards granted pursuant to the reload option provisions of outstanding option agreements under the 2000 Plan. For more information regarding reload options under the 2000 Plan, see “— Equity Based Incentive Plans — 2000 Incentive Stock Option Plan.” The reload option awards granted to Mr. Sturgeon and Mr. Klein vested in full upon issuance. |
| (3) | The amounts shown are based on the aggregate grant date fair value of restricted stock and stock options awarded, computed in accordance with FASB ASC Topic 718. We calculated the estimated fair value of each option award on the date of grant using a Black-Scholes option pricing model, as described under “Management’s Discussion and Analysis of Financial Condition and Results of Operations — Critical Accounting Policies and Estimates — Employee Benefit Plans — Stock-Based Compensation Plans.” |
112
Table of Contents
Outstanding Equity Awards at Fiscal Year Ended March 31, 2015
The following table sets forth the unexercised and unvested stock options and restricted stock held by NEOs at fiscal year-end. Each equity grant is shown separately for each NEO.
| Option Awards | Stock Awards | |||||||||||||||||||||||||||||||
| Option Grant Date |
Number of Securities Underlying Unexercised Options That Are Exercisable |
Number of Securities Underlying Unexercised Options That Are Not Exercisable |
Option Exercise Price |
Option Expiration Date |
Stock Award Grant Date |
Number of Shares or Units of Stock That Have Not Vested |
Market Value of Shares or Units of Stock That Have Not Vested (4) |
|||||||||||||||||||||||||
| Shares | Shares | $ | Shares | $ | ||||||||||||||||||||||||||||
| Joseph A. Chlapaty |
||||||||||||||||||||||||||||||||
| Stock Options (1) |
9/01/13 | 129,443 | 388,328 | 13.64 | 3/31/23 | |||||||||||||||||||||||||||
| Restricted Stock (3) |
4/10 | 5,648 | 169,101 | |||||||||||||||||||||||||||||
| Restricted Stock (3) |
5/11 | 5,648 | 169,101 | |||||||||||||||||||||||||||||
| Restricted Stock (3) |
5/12 | 16,945 | 507,333 | |||||||||||||||||||||||||||||
| Restricted Stock (3) |
5/13 | 22,594 | 676,464 | |||||||||||||||||||||||||||||
| Mark B. Sturgeon |
||||||||||||||||||||||||||||||||
| Stock Options (2) |
4/27/05 | — | — | 4.54 | 3/31/15 | |||||||||||||||||||||||||||
| Stock Options (2) |
4/26/06 | 54,601 | — | 7.68 | 3/31/16 | |||||||||||||||||||||||||||
| Stock Options (2) |
4/25/07 | 44,436 | — | 10.77 | 3/31/17 | |||||||||||||||||||||||||||
| Stock Options (2) |
7/22/09 | 28,679 | — | 9.43 | 3/31/19 | |||||||||||||||||||||||||||
| Stock Options (2) |
7/21/10 | 14,460 | — | 10.75 | 3/31/20 | |||||||||||||||||||||||||||
| Stock Options (2) |
8/01/12 | 9,045 | — | 12.59 | 3/31/22 | |||||||||||||||||||||||||||
| Stock Options (2) |
9/01/13 | 8,162 | — | 13.64 | 3/31/23 | |||||||||||||||||||||||||||
| Stock Options (1) |
9/01/13 | 32,949 | 131,796 | 13.64 | 3/31/23 | |||||||||||||||||||||||||||
| Stock Options (2) |
8/12/14 | 12,353 | — | 15.74 | 3/31/24 | |||||||||||||||||||||||||||
| Restricted Stock (3) |
4/10 | 1,883 | 56,377 | |||||||||||||||||||||||||||||
| Restricted Stock (3) |
10/10 | 2,824 | 84,551 | |||||||||||||||||||||||||||||
| Restricted Stock (3) |
5/11 | 1,883 | 56,377 | |||||||||||||||||||||||||||||
| Restricted Stock (3) |
5/12 | 5,648 | 169,101 | |||||||||||||||||||||||||||||
| Restricted Stock (3) |
5/13 | 7,531 | 225,478 | |||||||||||||||||||||||||||||
| Thomas M. Fussner |
||||||||||||||||||||||||||||||||
| Stock Options (2) |
7/22/09 | 29,341 | — | 9.43 | 3/31/19 | |||||||||||||||||||||||||||
| Stock Options (2) |
7/21/10 | 16,216 | — | 10.75 | 3/31/20 | |||||||||||||||||||||||||||
| Stock Options (2) |
5/03/11 | 13,477 | — | 10.70 | 3/31/21 | |||||||||||||||||||||||||||
| Stock Options (2) |
8/01/12 | 18,522 | — | 12.59 | 3/31/22 | |||||||||||||||||||||||||||
| Stock Options (1) |
9/01/13 | 32,949 | 131,796 | 13.64 | 3/31/23 | |||||||||||||||||||||||||||
| Restricted Stock (3) |
4/10 | 3,766 | 112,754 | |||||||||||||||||||||||||||||
| Restricted Stock (3) |
5/11 | 3,766 | 112,754 | |||||||||||||||||||||||||||||
| Restricted Stock (3) |
5/12 | 8,473 | 253,682 | |||||||||||||||||||||||||||||
| Restricted Stock (3) |
5/13 | 9,414 | 281,855 | |||||||||||||||||||||||||||||
| Robert M. Klein |
||||||||||||||||||||||||||||||||
| Stock Options (2) |
4/26/06 | 56,484 | — | 7.68 | 3/31/16 | |||||||||||||||||||||||||||
| Stock Options (2) |
4/25/07 | 42,363 | — | 10.77 | 3/31/17 | |||||||||||||||||||||||||||
| Stock Options (2) |
8/01/12 | 32,242 | — | 12.59 | 3/31/22 | |||||||||||||||||||||||||||
| Stock Options (1) |
9/01/13 | 28,242 | 112,968 | 13.64 | 3/31/23 | |||||||||||||||||||||||||||
| Stock Options (2) |
8/12/14 | 27,703 | — | 15.74 | 3/31/22 | |||||||||||||||||||||||||||
| Restricted Stock (3) |
4/10 | 1,883 | 56,377 | |||||||||||||||||||||||||||||
| Restricted Stock (3) |
5/11 | 1,883 | 56,377 | |||||||||||||||||||||||||||||
| Restricted Stock (3) |
5/12 | 4,236 | 126,826 | |||||||||||||||||||||||||||||
| Restricted Stock (3) |
5/13 | 5,648 | 169,101 | |||||||||||||||||||||||||||||
| Ronald R. Vitarelli |
||||||||||||||||||||||||||||||||
| Stock Options (1) |
9/01/13 | 32,949 | 131,796 | 13.64 | 3/31/23 | |||||||||||||||||||||||||||
| Restricted Stock (3) |
4/10 | 565 | 16,916 | |||||||||||||||||||||||||||||
| Restricted Stock (3) |
5/11 | 1,883 | 56,377 | |||||||||||||||||||||||||||||
| Restricted Stock (3) |
5/12 | 5,648 | 169,101 | |||||||||||||||||||||||||||||
| Restricted Stock (3) |
5/13 | 9,414 | 281,855 | |||||||||||||||||||||||||||||
| (1) | Stock options issued pursuant to the 2013 Plan, which vest over a five-year period in 20% installments each year, beginning with the first anniversary following the grant date (except for Mr. Chlapaty’s option award, which vest over a four-year period in 25% installments each year). The vesting terms of these options did not accelerate upon completion of our IPO. |
113
Table of Contents
| (2) | Stock options issued pursuant to the 2000 Plan, which vest over a three-year period in one-third installments each year, beginning with the fifth anniversary following the grant date, provided however that all remaining unvested options vested in full upon completion of our IPO. |
| (3) | Restricted stock issued pursuant to the 2008 Plan, which vest over a five-year period in 20% installments each year, beginning with the first anniversary following the grant date. |
| (4) | The market value is the product of $29.94, the closing price of our common shares on the NYSE on March 31, 2015, and the number of unvested stock awards |
Option Exercises and Stock Vested for Fiscal Year 2015
The following table sets forth for each NEO the exercises of stock options and the vesting of stock awards during fiscal year 2015:
Option Exercises and Stock Vested
| Option Awards | Stock Awards | |||||||||||||||
| Name |
Number of Shares Acquired on Exercise |
Value Realized on Exercise (1) |
Number of Shares Acquired on Vesting (2) |
Value Realized on Vesting (1) |
||||||||||||
| # | $ | # | $ | |||||||||||||
| Joseph A. Chlapaty |
— | — | 25,418 | 360,029 | ||||||||||||
| Mark B. Sturgeon |
15,631 | 312,464 | 10,826 | 171,616 | ||||||||||||
| Thomas M. Fussner |
58,154 | 554,764 | 12,709 | 177,791 | ||||||||||||
| Robert M. Klein |
33,607 | 761,871 | 7,531 | 107,166 | ||||||||||||
| Ronald R. Vitarelli |
— | — | 5,742 | 78,326 | ||||||||||||
| (1) | Amounts shown represent (i) with respect to option awards exercised prior to the Company’s IPO, the difference between the fair market value of our common stock and the option exercise price at the time of the options’ exercise, (ii) with respect to option awards exercised after the Company’s IPO, the difference between the closing price of our common shares on the NYSE on the date of the options’ exercise and the option exercise price, (iii) with respect to stock awards prior to the Company’s IPO, the value of the restricted shares that vest based on the fair market value of our common stock as determined prior to the IPO, and (iv) with respect to stock awards after the IPO, the value of the restricted shares that vest based on the closing price of our common shares on the NYSE on the date (or the closing price of our common shares on the NYSE on the next business day in the event the NYSE was closed on the vesting date) the shares vested. The foregoing values do not necessarily equate to cash realized from the sale of shares acquired upon the exercise of options or vesting of restricted stock as shares were not sold on exercise or upon vesting, but continue to be held by the NEO. |
| (2) | Restricted stock vests over a five year period in 20% installments each year, beginning with the first anniversary following the grant date. The number of shares listed in this column reflects the total number of shares of restricted stock that vested during fiscal year 2015. |
Pension Benefits and Nonqualified Deferred Compensation for Fiscal Year 2015
We do not provide any defined benefit plans or nonqualified deferred compensation plans to our NEOs.
Employment Agreements
Our NEOs have each entered into an amended and restated employment agreement with us, which were negotiated between each NEO and us at arms-length. Certain elements of the compensation payable to our NEOs are set forth in these employment agreements, including initial base salary (subject to periodic adjustment) and scope of incentive compensation and benefits. These employment agreements also require us to make certain payments upon termination or change in control, as set forth below in “— Potential Payments upon Termination or Change in Control.”
114
Table of Contents
Joseph A. Chlapaty. On June 20, 2014, we entered into an amended and restated employment agreement with Mr. Chlapaty, our Chief Executive Officer. The employment agreement provides for an initial employment period ending March 31, 2015. Beginning on January 1, 2015 and each January 1 thereafter, the then remaining term of the employment agreement will be extended automatically for an additional one-year period until termination pursuant to its terms, including termination by either party through notice prior to the January 1 renewal date. Mr. Chlapaty’s current annual base salary is $475,000 and he is entitled to receive annual incentive compensation. The employment agreement also contains customary non-competition and non-solicitation covenants of Mr. Chlapaty that apply during his employment and within a period of two years following the termination of his employment with us and a confidentiality covenant of indefinite duration.
Scott A. Cottrill. On November 9, 2015, we entered into an employment agreement with Mr. Cottrill, our Chief Financial Officer. The employment agreement provides for an initial employment period ending March 31, 2018. Beginning on January 1, 2018 and each January 1 thereafter, the then remaining term of the employment agreement will be extended automatically for an additional one-year period until termination pursuant to its terms, including termination by either party through notice prior to the January 1 renewal date. Mr. Cottrill’s current annual base salary is $455,000 and he is entitled to receive annual incentive compensation. The employment agreement also contains customary non-competition and non-solicitation covenants of Mr. Cottrill that apply during his employment and within a period of two years following the termination of his employment with us. It also includes a confidentiality covenant of indefinite duration.
Mark B. Sturgeon. On June 20, 2014, we entered into an amended and restated employment agreement with Mr. Sturgeon, our Executive Vice President. The employment agreement provides for an initial employment period ending March 31, 2015. Beginning on January 1, 2015 and each January 1 thereafter, the then remaining term of the employment agreement will be extended automatically for an additional one-year period until termination pursuant to its terms, including termination by either party through notice prior to the January 1 renewal date. Mr. Sturgeon’s current annual base salary is $285,000 and he is entitled to receive annual incentive compensation. The employment agreement also contains customary non-competition and non-solicitation covenants of Mr. Sturgeon that apply during his employment and within a period of two years following the termination of his employment with us. It also includes a confidentiality covenant of indefinite duration. On November 3, 2015, Mr. Sturgeon notified the Company of his intention to retire from the Company effective March 31, 2016 and that effective November 9, 2015 he would step down as the Company’s Chief Financial Officer, Secretary and Treasurer. Mr. Sturgeon will remain employed as an Executive Vice President of the Company until his retirement on March 31, 2016.
Thomas M. Fussner. On June 20, 2014, we entered into an amended and restated employment agreement with Mr. Fussner, our Co-Chief Operating Officer. The employment agreement provides for an initial employment period ending March 31, 2015. Beginning on January 1, 2015 and each January 1 thereafter, the then remaining term of the employment agreement will be extended automatically for an additional one-year period until termination pursuant to its terms, including termination by either party through notice prior to the January 1 renewal date. Mr. Fussner’s current annual base salary is $315,000 and he is entitled to receive annual incentive compensation. The employment agreement also contains customary non-competition and non-solicitation covenants of Mr. Fussner that apply during his employment and within a period of two years following the termination of his employment with us. It also includes a confidentiality covenant of indefinite duration.
Ronald R. Vitarelli. On June 20, 2014, we entered into an amended and restated employment agreement with Mr. Vitarelli, our Co-Chief Operating Officer. The employment agreement provides for an initial employment period ending March 31, 2017. Beginning on January 1, 2017 and each January 1 thereafter, the then remaining term of the employment agreement will be extended automatically for an additional one-year period until termination pursuant to its terms, including termination by either party through notice prior to the January 1 renewal date. Mr. Vitarelli’s current annual base salary is $275,000 and he is entitled to receive annual incentive compensation. The employment agreement also contains customary non-competition and non-solicitation covenants of Mr. Vitarelli that apply during his employment and within a period of two years
115
Table of Contents
following the termination of his employment with us. It also includes a confidentiality covenant of indefinite duration.
Robert M. Klein. On June 20, 2014, we entered into an amended and restated employment agreement with Mr. Klein, our Executive Vice President. The employment agreement provides for an initial employment period ending March 31, 2015. Beginning on January 1, 2015 and each January 1 thereafter, the then remaining term of the employment agreement will be extended automatically for an additional one-year period until termination pursuant to its terms, including termination by either party through notice prior to the January 1 renewal date. Mr. Klein’s current annual base salary is $270,000 and he is entitled to receive annual incentive compensation. The employment agreement also contains customary non-competition and non-solicitation covenants of Mr. Klein that apply during his employment and within a period of two years following the termination of his employment with us. It also includes a confidentiality covenant of indefinite duration.
Potential Payments upon Termination or Change in Control
We have outstanding employment agreements with each of our NEOs as described above under “— Employment Agreements” which require the payment of certain benefits to each NEO under certain specified circumstances, which we refer to as Specified Circumstances. Our employment agreements with each NEO identify the following as Specified Circumstances that would require the payment of certain benefits:
| • | termination by us at the end of the executive’s initial employment period or renewal period by giving three-month notice, |
| • | death or disability, |
| • | termination by the executive at the end of the executive’s initial employment period or renewal period by giving three-month notice, if the executive will have attained the age of 65 years (or 68 years in the case of Mr. Chlapaty) on the employment termination date, |
| • | termination by the executive upon our breach of material covenant in the employment agreement and failure to cure after receiving notice of such breach, |
| • | termination by the executive for good reason, which includes the following without the executive’s consent: (i) a reduction in base salary; (ii) our action which would adversely affect the executive’s participation in, or materially reduce his benefits under, any material benefit plan or equity incentive plan; (iii) our action which would adversely affect or reduce the executive’s participation in, or materially reduces the maximum potential incentive compensation available to the executive under any of our material incentive compensation plan or program; (iv) the assignment of the executive to a position of a materially lesser status or degree of responsibility; or (v) the assignment of the executive to a primary work location (A) outside the United States or (B) at which (I) neither we nor our affiliates maintain a significant manufacturing facility or significant office or (II) by virtue of such location, the ability of the executive to perform his duties is materially impaired, and |
| • | termination by us for no reason or for any reason other than mutual agreement for termination or termination for cause. “Cause” includes the executive’s non-performance of duties, failure to adhere to our policies, misappropriation of our property, conviction of felony or equivalent, or other crimes subject to possible imprisonment or involving theft, misappropriation, embezzlement, fraud or dishonesty. |
In the event of termination as a result of the Specified Circumstances described above, each NEO shall be entitled to receive payments and benefits as follows:
| • | for the 24 months (or 18 months in the case of Mr. Vitarelli) following the termination date, we will continue to pay the executive’s base salary, subject to reduction by the proceeds actually paid to the executive under any disability insurance policies maintained by us if the termination is due to the executive’s disability, |
116
Table of Contents
| • | after the conclusion of our fiscal year in which the termination occurs, we will make a lump sum cash payment in an amount equal to the executive’s accrued bonus for the prior fiscal year, |
| • | after the conclusion of our first full fiscal year immediately following the conclusion of our fiscal year in which the termination occurs, we will pay the executive (except for Mr. Vitarelli) a lump sum cash payment, which we refer to as the Termination Bonus I, as calculated under the applicable employment agreement, and |
| • | after the conclusion of our second full fiscal year immediately following the conclusion of our fiscal year in which the termination occurs, we will pay the executive (except for Mr. Vitarelli) a lump sum cash payment, which we refer to as the Termination Bonus II, as calculated under the applicable employment agreement. |
The payment of the above 24 months base salary, Termination Bonus I and Termination Bonus II is conditioned upon the executive’s release of claims against us.
If the executive terminates employment with us at the end of his initial employment period or renewal period by giving three-month notice, but the executive will not have attained the age of 65 years (or 68 years in the case of Mr. Chlapaty) on the employment termination date, then after the conclusion of the fiscal year in which the termination occurs, we will pay to the executive a lump sum cash payment in an amount equal to the accrued bonus for this fiscal year.
The employment agreements also provide that, notwithstanding anything to the contrary in any equity incentive plan or related agreements, if the executive’s employment is terminated by us for any reason other than for cause, all unvested restricted shares under the 2008 Plan and all unvested options under the 2000 Plan or the 2013 Plan (or only the restricted shares under the 2008 Plan or the options under the 2013 Plan in the case of Mr. Chlapaty) awarded to the executive will fully vest at the employment termination date. Such vested options will be exercisable during the 90 consecutive day period immediately following the employment termination date.
Our stock option agreements with each NEO under the 2000 Plan and the 2013 Plan provide that (i) upon death or disability of the executive, all the options may be exercised during the one-year period commencing on the date of the executive’s death or disability and (ii) upon termination of employment of the executive for any reason other than for death, disability or for cause, all the options may be exercised during the three-month period commencing on the employment termination date.
Change in Control. Under the 2000 Plan, our stock option agreements with the executives provide that all the options may be exercised by the executives commencing at the time of a “change in control.” A “change in control” for this purpose refers to: (i) our entry into an agreement to merge, consolidate or reorganize into or with another corporation or other legal person, and as a result less than 51% of the combined voting power of the then-outstanding securities of such corporation or person immediately after such transaction will be held in the aggregate by officers, directors and holders of a beneficial interest in our voting securities immediately prior to such transaction; (ii) our entry into an agreement to sell or otherwise transfer all or substantially all of its assets to any other corporation or other legal person, and as a result a beneficial interest in less than 51% of the combined voting power of the then-outstanding securities of such corporation or person immediately after such sale or transfer is held in the aggregate by officers, directors and holders of a beneficial interest in our voting securities immediately prior to such sale or transfer; or (iii) during any continuous 12-month period our stockholders’ sale of or entry into an agreement or agreements to sell to anyone other than us our securities representing 50% or more of our combined voting power at the beginning of such 12-month period.
Under the 2008 Plan, our restricted stock agreements with the executives provide that the restricted shares will vest effective at the time of a “change in control.” A “change in control” for this purpose refers to the occurrence of a transaction or series of transactions following which less than a majority of the voting power of a
117
Table of Contents
successor entity is held by the persons who hold the same with respect to us immediately prior to such transaction or series of transactions.
Under the 2013 Plan, our stock option agreements with the executives provide that all the options may be exercised by the executives commencing at the time of a “change in control.” A “change in control” for this purpose refers to the occurrence of a transaction or series of transactions following which less than a majority of the voting power of a successor entity is held by the persons who hold the same with respect to us immediately prior to such transaction or series of transactions.
Potential Payment. The following table sets forth the payments and benefits that would be received by each NEO in the event a termination of employment or a change-in-control of the Company had occurred on March 31, 2015, over and above any payments or benefits he otherwise would already have been entitled to or vested in on such date under any employment contract or other plan of the Company. The NEO would receive other payments and benefits as well upon termination of employment to which they were already entitled or vested in on such date. The actual amounts to be paid can only be determined at the time of such NEO’s separation from us and could therefore be more or less than the amounts set forth below. For the purposes of the calculations in the table, payments that would be made over time have been presented as a lump sum value.
| Name |
Severance Payment $ |
Bonus Payment (4) $ |
Value of Accelerated Equity (5) $ |
Total $ |
||||||||||||
| Joseph A. Chlapaty |
||||||||||||||||
| Specified Circumstances (1) |
$ | 950,000 | $ | — | $ | 7,851,776 | $ | 8,801,776 | ||||||||
| Other Terminations (2) |
$ | 950,000 | $ | — | $ | — | $ | 950,000 | ||||||||
| Change in Control (3) |
$ | — | $ | — | $ | 7,851,776 | $ | 7,851,776 | ||||||||
| Mark B. Sturgeon |
||||||||||||||||
| Specified Circumstances (1) |
$ | 570,000 | $ | — | $ | 2,740,159 | $ | 3,310,159 | ||||||||
| Other Terminations (2) |
$ | 570,000 | $ | — | $ | — | $ | 570,000 | ||||||||
| Change in Control (3) |
$ | — | $ | — | $ | 2,740,159 | $ | 2,740,159 | ||||||||
| Thomas M. Fussner |
||||||||||||||||
| Specified Circumstances (1) |
$ | 630,000 | $ | — | $ | 2,909,320 | $ | 3,539,320 | ||||||||
| Other Terminations (2) |
$ | 630,000 | $ | — | $ | — | $ | 630,000 | ||||||||
| Change in Control (3) |
$ | — | $ | — | $ | 2,909,320 | $ | 2,909,320 | ||||||||
| Ronald R. Vitarelli |
||||||||||||||||
| Specified Circumstances (1) |
$ | 412,500 | $ | — | $ | 2,672,524 | $ | 3,085,024 | ||||||||
| Other Terminations (2) |
$ | 412,500 | $ | — | $ | — | $ | 412,500 | ||||||||
| Change in Control (3) |
$ | — | $ | — | $ | 2,672,524 | $ | 2,672,524 | ||||||||
| Robert M. Klein |
||||||||||||||||
| Specified Circumstances (1) |
$ | 540,000 | $ | — | $ | 2,250,059 | $ | 2,790,059 | ||||||||
| Other Terminations (2) |
$ | 540,000 | $ | — | $ | — | $ | 540,000 | ||||||||
| Change in Control (3) |
$ | — | $ | — | $ | 2,250,059 | $ | 2,250,059 | ||||||||
| (1) | Specified Circumstances include termination (i) by the Company and the end of the respective employment period, (ii) the death of the respective NEO, (iii) the disability of the respective NEO, and (iv) by the Company for no reason or other reason. |
| (2) | Other Terminations include termination (i) by the NEO at the end of the respective employment period if such NEO has obtained the age of sixty-five (65) (and with respect to Mr. Chlapaty, 68), (ii) by the NEO following a breach by the Company of any of its material covenants or agreements contained in the NEO’s employment agreement not otherwise cured and (iii) by the NEO for Good Reason (as such term is described above). |
| (3) | The Company does not provide special change-in-control benefits to NEOs. The Company’s only change-in-control arrangement is accelerated vesting of certain equity awards. No NEO is entitled to any payment |
118
Table of Contents
| or accelerated benefit in connection with a change-in-control of the Company, except for accelerated vesting of stock options granted and restricted stock units granted under the (i) 2000 Stock Option Plan, (ii) the 2008 Restricted Stock Plan or (iii) the 2013 Stock Option Plan. Change-in-Control is defined above. |
| (4) | 2015 bonus amounts were assumed, although actual bonus would depend on performance of the Company in the relevant two years following termination. Bonus payments for subsequent years, if any, upon termination for each NEO (except for Mr. Vitarelli) are based on a formula equal to the lesser of the bonus paid (i) for the full year immediately prior to termination and (ii) certain bonus calculations earned for the two years following termination. Based on such formula, the bonus payments in the presented table are capped at 2xs the bonus paid for fiscal year 2015 (the amount shown on such table) but may be less based on the productivity of the Company for subsequent years. |
| (5) | Amounts include the acceleration of stock options, calculated by multiplying the number of shares underlying each stock option whose vesting would be accelerated or that would vest during the notice period, as the case may be, by the difference between $29.94, the closing price of our common shares on the NYSE on March 31, 2015, and the exercise price of the in-the-money accelerated stock options. Acceleration of restricted stock units are also included and were calculated by multiplying the number of shares underlying each restricted stock unit whose vesting would be accelerated by $29.94. |
Equity-Based Incentive Plans
2000 Incentive Stock Option Plan
Options granted pursuant to the 2000 Plan constitute incentive stock options for federal income tax purposes. Any option granted pursuant to the 2000 Plan must be granted within 10 years from the effective date of its adoption. As of September 2008, further grants under the 2000 Plan were discontinued, although existing stock option grants continue to vest and grant recipients continued to receive reload options under the 2000 Plan during fiscal year 2015 prior to the board of director’s termination of the reload feature on August 12, 2014.
Shares Under the Plan. The maximum aggregate number of shares available to be issued under the 2000 Plan is 4,707,000, subject to adjustment in the event of changes in our capitalization. As of March 31, 2015, options to purchase 746,465 shares of our common stock were still outstanding and 1,106,376 shares of our common stock were available for future grant under the 2000 Plan. The maximum aggregate fair market value (determined as of the time the option is granted) of all stock with respect to which incentive stock options may be exercisable by an optionee for the first time in any calendar year under the 2000 Plan and any of our other incentive stock option plans cannot exceed $100,000. Shares issued under the 2000 Plan may be authorized and unissued shares or shares held by us in our treasury.
Terms and Conditions of Options. Each option will be evidenced by a written option agreement in such form as approved by our board of directors. The option agreement may contain conditions for grant of options (such as an employee’s entry into an employment agreement with us or such employee’s agreement on continued employment with us) and adjustment of the underlying shares upon changes in our capitalization. The option agreement shall set forth the number of underlying shares, option price no less than 100% of the fair market value of the underlying share as of the date of grant, period of exercise no longer than 10 years after the date of grant, and dates and conditions for exercise of the option. The option price may be paid in cash, shares of our common stock, a combination of cash and shares or such other consideration as determined by our board. Prior to August 12, 2014, when our board of directors terminated the reload feature of the 2000 Plan, if an optionee exercised an option and paid some or all of the option price with shares of our common stock, such optionee was granted a reload option to purchase the number of shares equal to the number of shares used as payment of the option price, subject to adjustment made pursuant to the limitations on the number of shares available for grant under the 2000 Plan. Pursuant to the terms of each incentive stock option award agreement, the vesting for all option awards accelerated and became fully vested upon completion of our IPO.
Reload Options. In the event that an option holder exercises an option and pays some or all of the option price with shares of common stock, such option holder will receive a reload option to purchase the same number
119
Table of Contents
of shares as used to pay the exercise price, with the grant date for any reload option being the next date during the month of July during which our board of directors holds a meeting or, if no such meeting is held, the next date thereafter on which our board of directors holds a meeting. Such reload options shall have the same terms and conditions associated with grants under the 2000 Plan, including applicable vesting requirements. The exercise price for any new reload option shall equal to the then current fair market value for common stock. Given the discontinuation of the 2000 Plan, the only additional options that are issued under the 2000 Plan are those associated with reload options. On August 12, 2014, our board of directors amended the 2000 Plan to terminate the reload option feature under the 2000 Plan.
2008 Restricted Stock Plan
The purpose of the 2008 Plan is to afford an incentive to, and encourage stock ownership by, our key employees so that such employees may acquire or increase their proprietary interest in our success and be encouraged to remain in our employ. Awards under the 2008 Plan must be made before September 15, 2018.
Administration. Our board of directors supervises the administration of the 2008 Plan. Subject to the provisions of the 2008 Plan, the board has conclusive authority to construe the 2008 Plan and any restricted stock agreement entered thereunder, and to establish and amend the administrative policies for the administration of the 2008 Plan.
Eligibility. Any of our or our subsidiaries’ directors or employees is eligible to participate in the 2008 Plan.
Shares Available. The maximum aggregate number of shares available to be issued under the 2008 Plan is 1,012,005, subject to adjustment in the event of changes in our capitalization. Such shares must be made available solely from our treasury shares. As of March 31, 2015, 334,527 restricted shares of our common stock were available for future grant under the 2008 Plan.
Participation. Our board of directors will select participants and determine the terms of the awards under the 2008 Plan, which will be set forth in a restricted stock agreement.
Terms of Awards. The awards of restricted stock will be subject to the terms and restrictions as determined by our board of directors, which may also modify, or accelerate the termination of, such restrictions. During the period in which any shares are subject to restrictions, the board may grant to the recipient of the award all or any of the rights of a stockholder with respect to such shares, including the right to vote and to receive dividends. The 2008 Plan authorizes our board of directors (i) to grant awards to any participant calculated as a percentage of such participant’s base pay and (ii) to determine the amount of such award based on achievement of a target. In addition, the board may choose, at the time of the grant of an award, to include as part of such award an entitlement to receive dividends or dividend equivalents, subject to such terms and restrictions as the board may establish. The grant of awards is contingent upon the participant’s execution of an executive responsibility agreement, or such other non-competition, non-solicitation and/or nondisclosure agreement as we may require.
Amendment. We may, by action of our board of directors, amend or terminate the 2008 Plan at any time, or, by action of the board with the consent of the anticipant, to amend or terminate any outstanding award of restricted stock.
2013 Stock Option Plan
The purpose of the 2013 Plan is to afford an incentive to, and encourage stock ownership by, our officers and other key employees so that such employees may acquire or increase their proprietary interest in our success and be encouraged to remain in our employ. Options granted pursuant to the 2013 Plan will not constitute incentive stock options for federal income tax purposes unless expressly designated by our board of directors. Any option granted pursuant to the 2013 Plan must be granted within 10 years from the effective date of its adoption.
120
Table of Contents
Shares Under the Plan. The maximum aggregate number of shares available to be issued under the 2013 Plan is 3,323,142, subject to adjustment in the event of changes in our capitalization. As of March 31, 2014, options to purchase 1,911,042 shares of our common stock were still outstanding and 442,458 shares of our common stock were available for future grant under the 2013 Plan. On May 7, 2014, our board of directors authorized an amendment to the 2013 Plan that increased the maximum aggregate number of shares available to be issued under the 2013 Plan by 969,642 shares from 2,353,500 shares to 3,323,142 shares. As a result, as of March 31, 2015, options to purchase 1,911,042 shares of our common stock were still outstanding and 1,412,100 shares of our common stock were available for future grant under the 2013 Plan. The maximum aggregate fair market value (determined as of the time the option is granted) of all stock with respect to which incentive stock options may be exercisable by an optionee for the first time in any calendar year under the 2013 Plan and any of our other incentive stock option plans cannot exceed $100,000. Shares issued under the 2013 Plan may be authorized and unissued shares or shares held by us in our treasury.
Administration. Our board of directors administers the 2013 Plan. Subject to the provisions of the 2013 Plan, the board has the discretion to determine the employees to be granted options and the number of shares subject to each option (except that options granted to members of the board are subject to the approval of a majority of the our disinterested directors), the time to grant options, the option price, the time and duration to exercise the options. Subject to the terms of the 2013 Plan, the board also has the discretion to specify additional conditions to the grant and exercise of any option as well as interpret the provisions of, and any option granted under, the 2013 Plan.
Eligible Employees. Options will be granted to our officers and other key employees as our board of directors select from time to time. However, for any incentive stock options, (i) no employee can be granted an option if such employee owns stock possessing more than 10% of the total combined voting power of all classes of stock of ours or of any of our subsidiaries unless the option price is at least 110% of the fair market value of the underlying shares and such option is not exercisable after the expiration of five years from the date such option is granted, and (ii) such employees must execute a non-competition and non-disclosure agreement in order to receive grant of the options.
Terms and Conditions of Options. Each option will be evidenced by a written option agreement in such form as approved by our board of directors. The option agreement may contain conditions for grant of options (such as an employee’s entry into an employment agreement with us or such employee’s agreement on continued employment with us) and adjustment of the underlying shares upon changes in our capitalization. The option agreement shall set forth the number of underlying shares, option price no less than 100% of the fair market value of the underlying share as of the date of grant, period of exercise no longer than 10 years after the date of grant, and dates and conditions for exercise of the option. The option price may be paid in cash, shares of our common stock, a combination of cash and shares or such other consideration as determined by our board. Prior to August 12, 2014, when our board of directors terminated the reload feature of the 2013 Plan, if an optionee exercised an option and paid some or all of the option price with shares of our common stock, such optionee was granted a reload option to purchase the number of shares equal to the number of shares used as payment of the option price, subject to adjustment made pursuant to the limitations on the number of shares available for grant under the 2013 Plan. Option awards under the 2013 Plan did not fully vest or further accelerate upon completion of our IPO.
Amendment. Our board of directors may, with respect to any shares of our common stock not subject to options at such time, discontinue or amend the 2013 Plan in any respect as it deems advisable. However, without the approval of our stockholders, the board cannot increase the aggregate number of shares subject to the 2013 Plan, change the eligibility of employees for participation in the 2013 Plan, issue options with an option price of less than 100% of the fair market value of the shares, or make other amendments which will cause options issued to fail to qualify as incentive stock options for the federal income tax purposes.
Reload Options. In the event that an option holder exercises an option and pays some or all of the option price with shares of common stock, such option holder will receive a reload option to purchase the same number
121
Table of Contents
of shares as used to pay the exercise price, with the grant date for any reload option being the next date during the month of July during which our board of directors holds a meeting or, if no such meeting is held, the next date thereafter on which our board of directors holds a meeting. Such reload options shall have the same terms and conditions associated with grants under the 2000 Plan, including applicable vesting requirements. The exercise price for any new reload option shall equal to the then current fair market value for common stock. On August 12, 2014, our board of directors amended the 2013 Plan to terminate the reload option feature under the 2013 Plan.
Employee Stock Ownership Plan
We sponsor a tax-qualified employee stock ownership plan and trust, or the ESOP, that covers our employees who meet certain service requirements, including all of our NEOs except for Mr. Chlapaty, who does not participate in the ESOP. The ESOP was established effective April 1, 1993, and was originally funded with a 30-year term loan from us as well as a transfer of assets from our profit sharing retirement plan, both of which were used to purchase shares of our convertible preferred stock. The loan is secured by a pledge of unallocated convertible preferred stock purchased by the ESOP with such loan proceeds that has not yet been released from the pledge (as a result of ESOP payments on the loan) and allocated to participants’ ESOP accounts. The ESOP operates as a leveraged ESOP and was designed to enable eligible employees to acquire stock ownership interests in us by virtue of their accounts under the ESOP.
Director Compensation
Effective February 27, 2014, prior to the start of fiscal year 2015, we performed a review of the compensation structure and levels for non-employee directors in connection with the planning process for our IPO and in connection with changes to the composition of our board of directors implemented prior to our IPO. We engaged Towers Watson to assist in the review and development of recommended changes to non-employee director compensation structure and levels.
Under our policy that was in effect for all of fiscal year 2015, each non-employee director received an annual cash retainer of $75,000. Each member of a committee of our board of directors receives an additional cash retainer as follows: $8,000 for a member of the audit committee, $6,000 for a member of the compensation and management development committee and $4,000 for a member of the nominating and corporate governance committee. The chairman of each committee of our board of directors also receives an additional cash retainer as follows: $10,000 for the chairman of the audit committee, $8,000 for the chairman of the compensation and management development committee and $6,000 for the chairman of the nominating and corporate governance committee. None of our directors receive meeting fees in addition to these retainers.
The non-employee director compensation policy further provided that upon completion of our IPO, which occurred on July 25, 2014 and continuing each fiscal year thereafter until changed, each non-employee director who is not affiliated with American Securities would be granted restricted stock in an amount equal to $75,000 at the date of grant that will vest on the one year anniversary of the grant date (provided that the initial grant made to directors under the new compensation policy for fiscal year 2015 vested on February 27, 2015), subject to cancellation and forfeiture of unvested shares upon termination of service with our board of directors.
Under our policy, each non-employee director who is not affiliated with American Securities was provided the option to receive their annual cash retainer of $75,000 in the form of restricted stock in an amount equal to $75,000 upon completion of our IPO subject to the same vesting parameters as the portion of the director fee paid in restricted stock under the policy. Messrs. Rosenthal, Kidder, Fischer, Eversole, and Ms. Wexner elected to receive restricted stock in lieu of their annual cash retainer.
Non-employee directors will also continue to receive reimbursement of all reasonable travel and other expenses for attending meetings of our board of directors or other Company-related functions. Non-employee
122
Table of Contents
directors who are affiliated with American Securities are awarded an annual fee of $150,000 in cash, along with fees for service on the various committees as described above, which fees are paid directly to American Securities and not to the director individually.
Mr. Kidder did not receive compensation for serving as lead independent director in fiscal year 2015.
Fiscal Year 2015 Director Compensation
The following table summarizes the total compensation earned by each of our directors for fiscal year 2015.
| Name |
Fees Earned or Paid in Cash($) |
Stock Awards ($) |
All Other Compensation ($) |
Total ($) |
||||||||||||
| Joseph A. Chlapaty (1) |
— | — | — | — | ||||||||||||
| Robert M. Eversole (2)(11) |
18,000 | 150,000 | — | 168,000 | ||||||||||||
| David L. Horing (3) |
156,000 | — | — | 156,000 | ||||||||||||
| Tanya Fratto (4) |
83,000 | 75,000 | — | 158,000 | ||||||||||||
| Scott M. Wolff (5) |
51,333 | — | — | 51,333 | ||||||||||||
| Richard A. Rosenthal (6)(11) |
6,000 | 150,000 | — | 156,000 | ||||||||||||
| Mark A. Lovett (7) |
118,500 | — | — | 118,500 | ||||||||||||
| Alexander R. Fischer (8)(11) |
12,000 | 150,000 | — | 162,000 | ||||||||||||
| M.A. (Mark) Haney (4) |
83,000 | 75,000 | — | 158,000 | ||||||||||||
| C. Robert Kidder (9)(11) |
18,000 | 150,000 | — | 168,000 | ||||||||||||
| Abigail S. Wexner (10)(11) |
16,000 | 150,000 | — | 166,000 | ||||||||||||
| (1) | Mr. Chlapaty serves as our Chief Executive Officer and therefore receives no compensation for his service as a director. |
| (2) | Represents quarterly payments of annual retainer for membership on our board of directors as well as chairperson and member of the audit Committee. |
| (3) | Represents quarterly payments of annual retainer for membership on our board of directors and compensation and management development committee. During fiscal year 2015, Mr. Horing served as a Managing Director at American Securities. Such fees are paid directly to American Securities and not to the director individually. |
| (4) | Represents quarterly payments of annual retainer for membership on our board of directors and audit committee. |
| (5) | Represents quarterly payments of annual retainer for membership on our board of directors and nominating and corporate governance committee. During fiscal year 2015, Mr. Wolff served as a Managing Director at American Securities. Such fees are paid directly to American Securities and not to the director individually. Mr. Wolff resigned from our board of directors effective as of July 30, 2014. |
| (6) | Represents quarterly payments of annual retainer for membership on our board of directors and compensation and management development committee. |
| (7) | Represents quarterly payments of annual retainer for membership on our board of directors and audit committee. During fiscal year 2015, Mr. Lovett served as a Vice President at American Securities. Such fees are paid directly to American Securities and not to the director individually. Mr. Lovett resigned from the board of directors effective as of December 10, 2014. |
| (8) | Represents quarterly payment of annual retainer for membership on our board of directors, audit committee, and nominating and corporate governance committee. |
| (9) | Represents quarterly payment of annual retainer for membership on our board of directors, chairperson and member of the compensation and management development committee, and member of nominating and corporate governance committee. |
| (10) | Represents quarterly payment of annual retainer for membership on our board of directors and compensation and management development committee, and chairperson and member of the nominating and corporate governance committee. |
123
Table of Contents
| (11) | Each of Messrs. Rosenthal, Kidder, Fischer, Eversole and Ms. Wexner elected to receive shares of common stock in lieu of their $75,000 annual retainer paid in cash for membership on our board of directors. The number of shares of common stock granted in lieu of cash compensation was based on the aggregate grant date fair value of our common stock computed in accordance with ASC Topic 718. We calculated the estimated fair value of the shares of common stock issued in lieu of cash compensation on the date of grant as described in “Note 20. Stock-Based Compensation” in the audited financial statements included in the Company’s Annual Report on Form 10-K for the fiscal year ended March 31, 2015. |
Compensation Committee Interlocks and Insider Participation
There are no interlocking relationships between any member of our compensation and management development committee and any of our executive officers that require disclosure under the applicable rules promulgated under the federal securities laws.
124
Table of Contents
ITEM 12. SECURITY OWNERSHIP OF CERTAIN BENEFICIAL OWNERS AND MANAGEMENT AND RELATED STOCKHOLDER MATTERS
Stock Ownership by Directors and Executive Officers
The following table shows beneficial ownership of the Company’s common stock by (i) persons believed by us to own beneficially more than 5% of the Company’s outstanding shares, based on our review of SEC filings, (ii) all directors and nominees, (iii) the named executive officers included in the Summary Compensation Table on page 95 of this Annual Report on Form 10-K, and (iv) all directors, nominees, and executive officers (as of February 29, 2016) as a group.
| Name of Beneficial Owner |
Number of Shares Beneficially Owned |
Percentage of Shares Beneficially Owned |
||||||
| Greater than 5% Stockholders |
||||||||
| 12 West Capital Management LP (1) |
4,681,333 | 8.61 | % | |||||
| ASP ADS Investco, LLC (2) |
7,546,908 | 13.89 | % | |||||
| ESOP (3) |
19,153,274 | 26.06 | % | |||||
| Stockbridge Partners LLC (4) |
3,483,614 | 6.41 | % | |||||
| Waddell & Reed Financial, Inc. (5) |
3,010,600 | 5.54 | % | |||||
| Wellington Management Group LLP (6) |
4,714,406 | 8.67 | % | |||||
| Joseph A. Chlapaty (7) |
10,230,241 | 18.73 | % | |||||
| Directors and Named Executive Officers (not listed above): |
||||||||
| Scott A. Cottrill |
— | — | ||||||
| Mark B. Sturgeon (8) |
631,449 | 1.16 | % | |||||
| Thomas M. Fussner (9) |
673,411 | 1.24 | % | |||||
| Ronald R. Vitarelli (10) |
127,265 | * | ||||||
| Robert M. Klein (11) |
385,629 | * | ||||||
| Robert M. Eversole |
25,483 | * | ||||||
| Alexander R. Fischer |
7,945 | * | ||||||
| Tanya Fratto |
3,973 | * | ||||||
| M.A. (Mark) Haney |
13,973 | * | ||||||
| David L. Horing (12) |
— | — | ||||||
| C. Robert Kidder |
11,945 | * | ||||||
| Richard A. Rosenthal |
19,998 | * | ||||||
| Abigail S. Wexner |
82,945 | * | ||||||
| All current directors and executive officers as a group (15 persons) |
12,371,320 | 22.41 | % | |||||
| * | Less than 1% |
125
Table of Contents
| (1) | We obtained the information regarding share ownership from the Schedule 13G/A filed February 16, 2016, by 12 West Capital Management LP and related entities, which reported sole voting power and sole dispositive power as to 4,681,333 shares of common stock as of December 31, 2015. |
| (2) | We obtained the information regarding share ownership from the Schedule 13G filed February 17, 2015, by ASP ADS Investco, LLC and related entities, which reported shared voting power and shared dispositive power as to 7,546,908 shares of common stock as of December 31, 2014. As referenced in footnote (12) below, Mr. Horing may be deemed to have shared voting and investment power over the shares held by ASP ADS Investco, LLC. Mr. Horing disclaims beneficial ownership of the shares of common stock held by ASP ADS Investco, LLC, except to the extent of his pecuniary interests therein. |
| (3) | Consists of shares of common stock issuable upon the exercise of the conversion option for all of the 24,900,253 shares of ESOP Preferred Stock held by the ESOP at a ratio of 1-to-0.7692. |
| (4) | We obtained the information regarding share ownership from the Schedule 13G/A filed February 16, 2016, by Stockbridge Partners LLC and related entities, which reported shared voting power and shared dispositive power as to 3,483,614 shares of common stock as of December 31, 2015. |
| (5) | We obtained the information regarding share ownership from the Schedule 13G/A filed February 12, 2016, by Waddell & Reed Financial, Inc. and related entities, which reported sole voting power and sole dispositive power as to 3,010,600 shares of common stock as of December 31, 2015. |
| (6) | We obtained the information regarding share ownership from the Schedule 13G filed February 11, 2016, by Wellington Management Group LLP and related entities, which reported shared voting power as to 3,287,138 shares of common stock and shared dispositive power as to 4,714,406 shares of common stock as of December 31, 2015. |
| (7) | Includes, with respect to Joseph A. Chlapaty, 151,265 shares of common stock directly owned by Mr. Chlapaty, 31,066 restricted shares of common stock owned by Mr. Chlapaty as to which Mr. Chlapaty has sole voting power, 9,789,025 shares of common stock owned of record by the Joseph A. Chlapaty Trust, as to which Mr. Chlapaty, as trustee, has voting and investment power, and 258,885 shares of common stock issuable upon the exercise of vested stock options (or vesting within 60 days of February 29, 2016), but excludes 94,140 shares of common stock directly owned by Mr. Chlapaty’s children and 847,824 shares of common stock beneficially owned by Mr. Chlapaty’s children through irrevocable trusts of which Mr. Chlapaty is not a trustee. Mr. Chlapaty disclaims beneficial ownership of the above excluded shares except to the extent of any pecuniary interest (as defined in Rule 16a–1(a)(2) promulgated under the Exchange Act) that he may have as to such excluded shares. |
| (8) | Includes, with respect to Mark B. Sturgeon, 433,697 shares of common stock directly owned by Mr. Sturgeon, 10,355 restricted shares of common stock owned by Mr. Sturgeon as to which Mr. Sturgeon has sole voting power, and 187,397 shares of common stock issuable upon the exercise of vested stock options (or vesting within 60 days of February 29, 2016). |
| (9) | Includes, with respect to Thomas M. Fussner, 523,553 shares of common stock directly owned by Mr. Fussner, 14,591 restricted shares of common stock owned by Mr. Fussner as to which Mr. Fussner has sole voting power, and 135,267 shares of common stock issuable upon the exercise of vested stock options (or vesting within 60 days of February 29,2016). |
| (10) | Includes, with respect to Ronald R. Vitarelli, 49,600 shares of common stock directly owned by Mr. Vitarelli, 11,767 restricted shares of common stock owned by Mr. Vitarelli as to which Mr. Vitarelli has sole voting power, and 65,898 shares of common stock issuable upon the exercise of vested stock options (or vesting within 60 days of February 29, 2016). |
| (11) | Includes, with respect to Robert M. Klein, 246,539 shares of common stock directly owned by Mr. Klein, 8,001 restricted shares of common stock owned by Mr. Klein as to which Mr. Klein has sole voting power, and 131,089 shares of common stock issuable upon the exercise of vested stock options (or vesting within 60 days of February 29,2016). |
| (12) | Mr. Horing may be deemed to have shared voting and investment power of the shares held by ASP ADS Investco, LLC in his capacity as a Managing Director of American Securities and as a managing member of certain funds managed by American Securities as referenced in footnote (2) above. Mr. Horing disclaims beneficial ownership of the shares of common stock owned by ASP ADS Investco, LLC, except to the |
126
Table of Contents
| extent of his pecuniary interest therein, as such shares are owned and held by the ASP Sponsors referenced in footnote (2) above. |
The following table sets forth information as of February 29, 2016 with respect to the beneficial ownership of our convertible preferred stock, all of which is owned by the ESOP. None of our current directors or executive officers owns any of the outstanding shares of our convertible preferred stock.
| Title of Class |
Shares Beneficially Owned |
Percentage of Class | ||
| ESOP Preferred Stock | 24,900,253 | 100% |
ITEM 13. CERTAIN RELATIONSHIPS AND RELATED TRANSACTIONS AND DIRECTOR INDEPENDENCE
Registration Rights Agreement
We have entered into a registration rights agreement (the “Registration Rights Agreement”) with certain of our stockholders, including ASP ADS Investco, LLC. The Registration Rights Agreement grants to certain of our stockholders the right to cause us, generally at our own expense, to use our reasonable best efforts to register certain of our securities held by such stockholders for public resale, subject to certain limitations. In the event we register any of our common stock, certain of our stockholders also have the right to require us to use our reasonable best efforts to include in such registration statement shares of our common stock held by them, subject to certain limitations, including as determined by the underwriters. The Registration Rights Agreement also provides for us to indemnify certain of our stockholders and their affiliates in connection with the registration of our common stock.
Indemnification Agreements
We have entered into indemnification agreements with our directors and senior officers. The indemnification agreements provide the directors and senior officers with contractual rights to the indemnification and expense advancement rights provided under our amended and restated bylaws, as well as contractual rights to additional indemnification as provided in the indemnification agreements.
Transactions with Other Related Parties
In connection with our business, we procure services from thousands of suppliers, some of which may be affiliated with American Securities. We estimate that we purchased services from a consulting firm deriving a meaningful percentage of its business from its work for American Securities and its affiliates for approximately $37,641 for fiscal 2015. Management believes such services were purchased on an arm’s-length basis at prices that an unrelated third party would pay.
Policies and Procedures for Related Party Transactions
Our board of directors has adopted a written related person transaction policy to set forth the policies and procedures for the review and approval or ratification of related person transactions. This policy covers, with certain exceptions set forth in Item 404 of Regulation S-K under the Securities Act, any transaction, arrangement or relationship, or any series of similar transactions, arrangements or relationships, in which we were or are to be a participant, the amount involved exceeds $120,000, and a related person had or will have a direct or indirect material interest, including, without limitation, purchases of goods or services by or from the related person or entities in which the related person has a material interest, indebtedness, guarantees of indebtedness, and employment by us of a related person. The nominating and corporate governance committee of our board of directors will review related party transactions.
127
Table of Contents
Director Independence
Our common stock has been listed on the NYSE under the symbol “WMS” since July 25, 2014. Under the rules of the NYSE, independent directors must comprise a majority of our board of directors within a specified period after the completion of our IPO. In addition, the rules of the NYSE require that, subject to specified exceptions, each member of a listed company’s audit, compensation, and nominating and governance committees be independent. Audit committee members must also satisfy the independence criteria set forth in Rule 10A-3 under the Securities Exchange Act of 1934, as amended. Under the rules of the NYSE, a director will only qualify as an “independent director” if, in the opinion of that company’s board of directors, that person does not have a relationship that would interfere with the exercise of independent judgment in carrying out the responsibilities of a director.
In order to be considered independent for purposes of Rule 10A-3, a member of an audit committee of a listed company may not, other than in his or her capacity as a member of the audit committee, our board of directors, or any other board committee: (i) accept, directly or indirectly, any consulting, advisory, or other compensatory fee from the listed company or any of its subsidiaries or (ii) be an affiliated person of the listed company or any of its subsidiaries.
In fiscal year 2015, our board of directors undertook a review of its composition, the composition of its committees, and the independence of each director. Based upon information requested from and provided by each director concerning his or her background, employment, and affiliations, including family relationships, our board of directors has determined that none of our directors except for Mr. Chlapaty has a relationship that would interfere with the exercise of independent judgment in carrying out the responsibilities of a director and that each of these directors, other than Mr. Chlapaty, is “independent” as that term is defined under the rules of the NYSE.
Except as otherwise described herein, our board of directors has determined that those directors who serve on our audit committee, compensation and management development committee and nominating and corporate governance committee satisfy the independence standards for those committees established by the rules of the NYSE and (in the case of the audit committee) the applicable SEC rules. In making this determination, our board of directors considered the relationships that each non-employee director has with us and all other facts and circumstances our board of directors deemed relevant in determining their independence, including the beneficial ownership of our capital stock by each non-employee director.
ITEM 14. PRINCIPAL ACCOUNTING FEES AND SERVICES
The Audit Committee has sole responsibility, in consultation with management, for approving the terms and fees for the engagement of the independent registered public accounting firm for audits of the Company’s financial statements and internal control over financial reporting. In addition, the Audit Committee must preapprove all audit, audit-related and permitted non-audit services (including the fees and terms thereof) to be performed for the Company by its independent auditor, subject to the de minimis exceptions for non-audit services described in the Exchange Act which are approved by the Audit Committee prior to the completion of the audit. The Audit Committee may form and delegate authority to subcommittees consisting of one or more members when appropriate, including the authority to grant preapprovals of audit, audit-related and permitted non-audit services, provided that decisions of such subcommittee to grant preapprovals shall be presented to the full Audit Committee at its next scheduled meeting.
For the fiscal years ended March 31, 2015 and 2014, Deloitte & Touche LLP (“Deloitte”), the member firms of Deloitte Touche Tohmatsu Limited, and their respective affiliates billed or will bill the Company fees as follows:
| Fiscal Year |
Audit Fees | Audit-Related Fees | Tax Fees | All Other Services | ||||||||||||
| 2015 |
$ | 8,053,180 | $ | 652,000 | $ | 0 | $ | 2,150 | ||||||||
| 2014 |
$ | 1,991,000 | $ | 54,275 | $ | 0 | $ | 2,135 | ||||||||
128
Table of Contents
Fees noted in “Audit Fees” in fiscal years 2015 and 2014 represent fees for the audits of the annual consolidated financial statements as of and for the years ending March 31, 2015 and 2014; and reviews of the interim financial statements included in quarterly reports and services normally provided by the independent registered public accounting firm in connection with statutory filings.
Fees noted in “Audit-Related Fees” in fiscal year 2015 represent fees for the annual audit of the ESOP, public offering and related comfort letter activities, and M&A transactions. “Audit-Related Fees” in fiscal year 2014 represent services for the annual audit of the ESOP and accounting guidance on computing Earnings Per Share.
There were no fees incurred by the Company from Deloitte related to “Tax Fees” in either fiscal year 2015 or fiscal year 2014.
Fees noted in “All Other Services” represent an annual subscription for access to the on-line accounting research tool of Deloitte for both fiscal year 2015 and 2014.
The Audit Committee has approved all non-audit services described above and has concluded that the provision of these non-audit services is compatible with maintaining Deloitte & Touche LLP’s independence.
The Company’s independent registered public accounting firm, Deloitte & Touche LLP (“Deloitte”), recently advised the Company’s Audit Committee that they had identified a matter that raised concerns in relation to the SEC’s auditor independence rules. A member of the Deloitte audit engagement team acquired personal financial interests in the Company in January 2016, which was not permissible under the SEC’s auditor independence rules. Deloitte identified the Transactions within two days of the acquisitions, and advised the Covered Person to dispose of the shares and to cease providing services to the Company immediately. The financial interests were disposed of promptly. Deloitte also removed the Covered Person from the audit engagement team and replaced the Covered Person with another qualified professional who re-performed the work performed by the Covered Person for the period in question to ensure a lack of bias in Deloitte’s audit procedures. Accordingly, for the reasons noted above, Deloitte advised the Audit Committee that the Covered Person’s financial interests in the Company did not impact the objectivity, integrity and impartiality of Deloitte and the individuals responsible for the planning and execution of the Company’s audit for the year ended March 31, 2015 and the audits of the Company’s restated financial statements for the years ended March 31, 2014 and 2013.
The Audit Committee also separately reviewed and considered the impact that these matters may have had on Deloitte’s independence with respect to it under the applicable SEC and PCAOB independence rules. After considering all of the facts and circumstances, including those noted above, the Audit Committee determined that the matter would not impair Deloitte’s ability to exercise objective and impartial judgment or Deloitte’s independence on all issues encompassed with their audit engagement for the Company’s financial statements for the year ended March 31, 2015 and for the Company’s restated financial statements for the years ended March 31, 2014 and 2013.
129
Table of Contents
PART IV
ITEM 15. EXHIBITS AND FINANCIAL STATEMENT SCHEDULES
| (a)1. | Financial Statements. See “Table of Contents” on page F-1. |
| (a)2. | Financial Statement Schedules. Schedule II — Consolidated Valuation and Qualifying Accounts. |
Other schedules are omitted because they are not required or applicable, or the required information is included in our consolidated financial statements or related notes.
| (a)3. | Exhibits. See “Index to Exhibits.” |
130
Table of Contents
SIGNATURES
Pursuant to the requirements of Section 13 or 15(d) of the Securities Exchange Act of 1934, the registrant has duly caused this report to be signed on its behalf by the undersigned thereunto duly authorized.
Date: March 29, 2016
| ADVANCED DRAINAGE SYSTEMS, INC. | ||
| By: | /s/ Joseph A. Chlapaty | |
| Name: Title: |
Joseph A. Chlapaty President and Chief Executive Officer (Principal Executive Officer) | |
| By: | /s/ Scott A. Cottrill | |
| Name: Title: |
Scott A. Cottrill Chief Financial Officer (Principal Financial Officer) | |
Pursuant to the requirements of the Securities Exchange Act of 1934, this report has been signed below by the following persons in their indicated capacities, on March 29, 2016.
| Signature |
Title | |
| /s/ Joseph A. Chlapaty Joseph A. Chlapaty |
Chairman of the Board of Directors, Director, President and Chief Executive Officer (Principal Executive Officer) | |
| /s/ Scott A. Cottrill Scott A. Cottrill |
Chief Financial Officer, (Principal Financial Officer and Principal Accounting Officer) | |
| /s/ Robert M. Eversole** Robert M. Eversole |
Director | |
| /s/ Alexander R. Fischer** Alexander R. Fischer |
Director | |
| /s/ Tanya Fratto** Tanya Fratto |
Director | |
| /s/ M.A. (Mark) Haney** M.A. (Mark) Haney |
Director | |
| /s/ David L. Horing** David L. Horing |
Director | |
| /s/ C. Robert Kidder** C. Robert Kidder |
Director | |
| /s/ Richard A. Rosenthal** Richard A. Rosenthal |
Director | |
| /s/ Abigail S. Wexner** Abigail S. Wexner |
Director | |
| ** | The undersigned, by signing his name hereto, does hereby sign this report on behalf of each of the above-indicated directors of the registrant pursuant to powers of attorney executed by such directors. |
| By: | /s/ Scott A. Cottrill Scott A. Cottrill, Attorney-in-fact |
131
Table of Contents
POWER OF ATTORNEY
OFFICERS AND DIRECTORS OF
ADVANCED DRAINAGE SYSTEMS, INC.
Each of the undersigned officers and/or directors of Advanced Drainage Systems, Inc., a Delaware corporation, hereby constitutes and appoints Joseph A. Chlapaty and Scott A. Cottrill, and each of them, his or her true and lawful attorney-in-fact and agent, with full power of substitution and resubstitution, for him or her and in his or her name, place and stead in any and all capacities, to sign for the undersigned in any and all capacities the Company’s Annual Report on Form 10-K for the fiscal year ended March 31, 2015 under the Securities Exchange Act of 1934, as amended, any amendments thereto, and all additional amendments thereto, each in such form as they or any one of them may approve, and to file the same with all exhibits thereto and other documents in connection therewith with the Securities and Exchange Commission, granting unto said attorneys-in-fact and agents, and each of them, full power and authority to do and perform each and every act and thing requisite and necessary to be done so that such Annual Report on Form 10-K shall comply with the Securities Exchange Act of 1934, as amended, and the applicable rules and regulations adopted or issued pursuant thereto, as fully and to all intents and purposes as he or she might or could do in person, hereby ratifying and confirming all that said attorneys-in-fact and agents, or any of them or their substitute or resubstitute, may lawfully do or cause to be done by virtue hereof.
IN WITNESS WHEREOF, this instrument has been duly executed as of the 24th day of March, 2016.
| Signature |
Title | |
| /s/ Joseph A. Chlapaty Joseph A. Chlapaty |
Chairman of the Board of Directors, Director, President and Chief Executive Officer | |
| /s/ Scott A. Cottrill Scott A. Cottrill |
Executive Vice President and Chief Financial Officer | |
| /s/ Robert M. Eversole Robert M. Eversole |
Director | |
| /s/ Alexander R. Fischer Alexander R. Fischer |
Director | |
| /s/ Tanya Fratto Tanya Fratto |
Director | |
| /s/ M.A. (Mark) Haney M.A. (Mark) Haney |
Director | |
| /s/ David L. Horing David L. Horing |
Director | |
| /s/ C. Robert Kidder C. Robert Kidder |
Director | |
| /s/ Richard A. Rosenthal Richard A. Rosenthal |
Director | |
| /s/ Abigail S. Wexner Abigail S. Wexner |
Director | |
132
Table of Contents
| Page | ||||
| Audited Consolidated Financial Statements |
||||
| F-2 | ||||
| Consolidated Balance Sheets as of March 31, 2015 and 2014 (Restated) |
F-3 | |||
| F-4 | ||||
| Consolidated Statements of Comprehensive (Loss) Income for the fiscal years ended March 31, 2015, 2014 (Restated) and 2013 (Restated) |
F-5 | |||
| F-6 | ||||
| F-7 | ||||
| F-11 | ||||
| F-62 | ||||
F-1
Table of Contents
REPORT OF INDEPENDENT REGISTERED PUBLIC ACCOUNTING FIRM
To the Board of Directors of
Advanced Drainage Systems, Inc. and subsidiaries
Hilliard, Ohio
We have audited the accompanying consolidated balance sheets of Advanced Drainage Systems, Inc. and subsidiaries (the “Company”) as of March 31, 2015 and 2014, and the related consolidated statements of operations, comprehensive income (loss), stockholders’ equity (deficit) and mezzanine equity, and cash flows for each of the three years in the period ended March 31, 2015. Our audits also included the financial statement schedule listed in the Index. These consolidated financial statements and consolidated financial statement schedule are the responsibility of the Company’s management. Our responsibility is to express an opinion on the consolidated financial statements and financial statement schedule based on our audits.
We conducted our audits in accordance with the standards of the Public Company Accounting Oversight Board (United States). Those standards require that we plan and perform the audit to obtain reasonable assurance about whether the consolidated financial statements are free of material misstatement. The Company is not required to have, nor were we engaged to perform, an audit of its internal control over financial reporting. Our audits included consideration of internal control over financial reporting as a basis for designing audit procedures that are appropriate in the circumstances, but not for the purpose of expressing an opinion on the effectiveness of the Company’s internal control over financial reporting. Accordingly, we express no such opinion. An audit also includes examining, on a test basis, evidence supporting the amounts and disclosures in the consolidated financial statements, assessing the accounting principles used and significant estimates made by management, as well as evaluating the overall financial statement presentation. We believe that our audits provide a reasonable basis for our opinion.
As discussed in Note 2 to the consolidated financial statements, the accompanying 2014 and 2013 consolidated financial statements have been restated to correct misstatements.
In our opinion, such consolidated financial statements present fairly, in all material respects, the financial position of Advanced Drainage Systems, Inc. and subsidiaries as of March 31, 2015 and 2014, and the results of their operations and their cash flows for each of the three years in the period ended March 31, 2015, in conformity with accounting principles generally accepted in the United States of America. Also, in our opinion, such financial statement schedule, when considered in relation to the basic consolidated financial statements taken as a whole, presents fairly, in all material respects, the information set forth therein.
/s/ Deloitte & Touche LLP
Columbus, Ohio
March 29, 2016
F-2
Table of Contents
ADVANCED DRAINAGE SYSTEMS, INC. AND SUBSIDIARIES
| As of March 31, | ||||||||
| (Amounts in thousands, except par value) | 2015 | 2014 | ||||||
| ASSETS |
(As Restated)(1) | |||||||
| Current assets: |
||||||||
| Cash |
$ | 3,623 | $ | 3,931 | ||||
| Receivables (less allowance for doubtful accounts of $5,423 and $4,490, respectively) |
154,294 | 148,271 | ||||||
| Inventories |
269,842 | 259,891 | ||||||
| Deferred income taxes and other current assets |
18,972 | 14,465 | ||||||
|
|
|
|
|
|||||
| Total current assets |
446,731 | 426,558 | ||||||
| Property, plant and equipment, net |
377,067 | 350,351 | ||||||
| Other assets: |
||||||||
| Goodwill |
98,679 | 88,017 | ||||||
| Intangible assets, net |
58,055 | 59,194 | ||||||
| Other assets |
61,167 | 65,447 | ||||||
|
|
|
|
|
|||||
| Total assets |
$ | 1,041,699 | $ | 989,567 | ||||
|
|
|
|
|
|||||
| LIABILITIES, MEZZANINE EQUITY AND STOCKHOLDERS’ EQUITY (DEFICIT) |
||||||||
| Current liabilities: |
||||||||
| Current maturities of debt obligations |
$ | 9,580 | $ | 11,153 | ||||
| Current maturities of capital lease obligations |
15,731 | 12,364 | ||||||
| Accounts payable |
111,893 | 110,972 | ||||||
| Other accrued liabilities |
54,349 | 43,085 | ||||||
| Accrued income taxes |
6,041 | 7,980 | ||||||
|
|
|
|
|
|||||
| Total current liabilities |
197,594 | 185,554 | ||||||
| Long-term debt obligation |
390,315 | 442,895 | ||||||
| Long-term capital lease obligations |
45,503 | 34,366 | ||||||
| Deferred tax liabilities |
65,088 | 66,333 | ||||||
| Other liabilities |
28,602 | 32,170 | ||||||
|
|
|
|
|
|||||
| Total liabilities |
727,102 | 761,318 | ||||||
| Commitments and contingencies (see Note 15) |
||||||||
| Mezzanine equity: |
||||||||
| Redeemable common stock: $0.01 par value; 0 and 38,320 shares issued and outstanding, respectively |
— | 549,119 | ||||||
| Redeemable convertible preferred stock: $0.01 par value; 47,070 shares authorized; |
||||||||
| 44,170 shares issued; 25,639 and 26,129 shares outstanding, respectively |
320,490 | 291,720 | ||||||
| Deferred compensation — unearned ESOP shares |
(212,469 | ) | (197,888 | ) | ||||
|
|
|
|
|
|||||
| Total mezzanine equity |
108,021 | 642,951 | ||||||
| Stockholders’ equity (deficit): |
||||||||
| Common stock: $0.01 par value; 1,000,000 and 148,271 shares authorized; 153,560 and 109,951 shares issued; 53,522 and 9,141 shares outstanding, respectively |
12,393 | 11,957 | ||||||
| Paid-in capital |
700,977 | 12,438 | ||||||
| Common stock in treasury, at cost |
(445,065 | ) | (448,439 | ) | ||||
| Accumulated other comprehensive loss |
(15,521 | ) | (6,830 | ) | ||||
| Retained deficit |
(62,621 | ) | (2,412 | ) | ||||
|
|
|
|
|
|||||
| Total ADS stockholders’ equity (deficit) |
190,163 | (433,286 | ) | |||||
| Noncontrolling interest in subsidiaries |
16,413 | 18,584 | ||||||
|
|
|
|
|
|||||
| Total stockholders’ equity (deficit) |
206,576 | (414,702 | ) | |||||
|
|
|
|
|
|||||
| Total liabilities, mezzanine equity and stockholders’ equity (deficit) |
$ | 1,041,699 | $ | 989,567 | ||||
|
|
|
|
|
|||||
| (1) | See Note 2. Restatement of Previously Issued Financial Statements. |
See accompanying notes to consolidated financial statements.
F-3
Table of Contents
ADVANCED DRAINAGE SYSTEMS, INC. AND SUBSIDIARIES
CONSOLIDATED STATEMENTS OF OPERATIONS
| Fiscal Year Ended March 31, | ||||||||||||
| (Amounts in thousands, except per share data) | 2015 | 2014 | 2013 | |||||||||
| (As Restated)(1) | (As Restated)(1) | |||||||||||
| Net sales |
$ | 1,180,073 | $ | 1,067,780 | $ | 1,017,102 | ||||||
| Cost of goods sold |
973,960 | 873,810 | 829,141 | |||||||||
|
|
|
|
|
|
|
|||||||
| Gross profit |
206,113 | 193,970 | 187,961 | |||||||||
| Operating expenses: |
||||||||||||
| Selling |
78,981 | 74,042 | 71,805 | |||||||||
| General and administrative |
58,749 | 59,761 | 49,601 | |||||||||
| Loss (gain) on disposal of assets or businesses |
362 | (2,863 | ) | (951 | ) | |||||||
| Intangible amortization |
9,754 | 10,145 | 10,028 | |||||||||
|
|
|
|
|
|
|
|||||||
| Income from operations |
58,267 | 52,885 | 57,478 | |||||||||
| Other expense: |
||||||||||||
| Interest expense |
19,368 | 18,807 | 18,526 | |||||||||
| Other miscellaneous expense (income), net |
14,370 | (1,177 | ) | 103 | ||||||||
|
|
|
|
|
|
|
|||||||
| Income before income taxes |
24,529 | 35,255 | 38,849 | |||||||||
| Income tax expense |
9,443 | 19,949 | 15,935 | |||||||||
| Equity in net loss (income) of unconsolidated affiliates |
2,335 | 3,086 | (266 | ) | ||||||||
|
|
|
|
|
|
|
|||||||
| Net income |
12,751 | 12,220 | 23,180 | |||||||||
| Less net income attributable to noncontrolling interest |
4,131 | 3,593 | 2,520 | |||||||||
|
|
|
|
|
|
|
|||||||
| Net income attributable to ADS |
8,620 | 8,627 | 20,660 | |||||||||
|
|
|
|
|
|
|
|||||||
| Change in fair value of Redeemable convertible preferred stock |
(11,054 | ) | (3,979 | ) | (5,869 | ) | ||||||
| Dividends to Redeemable convertible preferred stockholders |
(661 | ) | (10,139 | ) | (735 | ) | ||||||
| Dividends paid to unvested restricted stockholders |
(11 | ) | (418 | ) | (52 | ) | ||||||
|
|
|
|
|
|
|
|||||||
| Net (loss) income available to common stockholders and participating securities |
(3,106 | ) | (5,909 | ) | 14,004 | |||||||
| Undistributed income allocated to participating securities |
— | — | (1,127 | ) | ||||||||
|
|
|
|
|
|
|
|||||||
| Net (loss) income available to common stockholders |
$ | (3,106 | ) | $ | (5,909 | ) | $ | 12,877 | ||||
|
|
|
|
|
|
|
|||||||
| Weighted average common shares outstanding: |
||||||||||||
| Basic |
51,344 | 47,277 | 46,698 | |||||||||
| Diluted |
51,344 | 47,277 | 47,249 | |||||||||
| Net (loss) income per share available to common stockholders: |
||||||||||||
| Basic |
$ | (0.06 | ) | $ | (0.12 | ) | $ | 0.28 | ||||
| Diluted |
$ | (0.06 | ) | $ | (0.12 | ) | $ | 0.27 | ||||
| Cash dividends declared per share |
$ | 0.08 | $ | 1.68 | $ | 0.10 | ||||||
| (1) | See Note 2. Restatement of Previously Issued Financial Statements. |
See accompanying notes to consolidated financial statements.
F-4
Table of Contents
ADVANCED DRAINAGE SYSTEMS, INC. AND SUBSIDIARIES
CONSOLIDATED STATEMENTS OF COMPREHENSIVE (LOSS) INCOME
| Fiscal Year Ended March 31, | ||||||||||||
| (Amounts in thousands) | 2015 | 2014 | 2013 | |||||||||
| (As Restated)(1) | (As Restated)(1) | |||||||||||
| Net income |
$ | 12,751 | $ | 12,220 | $ | 23,180 | ||||||
| Other comprehensive (loss) income: |
||||||||||||
| Currency translation, before tax |
(11,928 | ) | (6,995 | ) | 2,628 | |||||||
| Other, before tax |
— | 6 | (41 | ) | ||||||||
|
|
|
|
|
|
|
|||||||
| Total other comprehensive (loss) income, before tax |
(11,928 | ) | (6,989 | ) | 2,587 | |||||||
|
|
|
|
|
|
|
|||||||
| Tax attributes of items in other comprehensive (loss) income: |
||||||||||||
| Other |
— | (2 | ) | 16 | ||||||||
|
|
|
|
|
|
|
|||||||
| Total tax (expense) benefit |
— | (2 | ) | 16 | ||||||||
|
|
|
|
|
|
|
|||||||
| Comprehensive income |
823 | 5,229 | 25,783 | |||||||||
| Less other comprehensive (loss) income attributable to noncontrolling interest, net of tax |
(3,237 | ) | (1,242 | ) | 1,159 | |||||||
| Less net income attributable to noncontrolling interest |
4,131 | 3,593 | 2,520 | |||||||||
|
|
|
|
|
|
|
|||||||
| Total comprehensive (loss) income attributable to ADS |
$ | (71 | ) | $ | 2,878 | $ | 22,104 | |||||
|
|
|
|
|
|
|
|||||||
| (1) | See Note 2. Restatement of Previously Issued Financial Statements. |
See accompanying notes to consolidated financial statements.
F-5
Table of Contents
ADVANCED DRAINAGE SYSTEMS, INC. AND SUBSIDIARIES
CONSOLIDATED STATEMENTS OF CASH FLOWS
| Fiscal Year Ended March 31, | ||||||||||||
| (Amounts in thousands) | 2015 | 2014 | 2013 | |||||||||
| (As Restated)(1) | (As Restated)(1) | |||||||||||
| Cash Flows from Operating Activities |
||||||||||||
| Net income |
$ | 12,751 | $ | 12,220 | $ | 23,180 | ||||||
| Adjustments to reconcile net income to net cash provided by operating activities: |
||||||||||||
| Depreciation and amortization |
65,472 | 63,674 | 63,102 | |||||||||
| Deferred income taxes |
(15,367 | ) | (7,750 | ) | (7,152 | ) | ||||||
| Loss (gain) on disposal of assets or businesses |
362 | (2,863 | ) | (951 | ) | |||||||
| ESOP and stock-based compensation |
18,024 | 35,033 | 9,363 | |||||||||
| Amortization of deferred financing charges |
1,410 | 1,591 | 2,008 | |||||||||
| Fair market value adjustments to derivatives |
7,746 | (53 | ) | (4 | ) | |||||||
| Other operating activities |
937 | 7,978 | (876 | ) | ||||||||
| Changes in working capital (see Note 24) |
(16,956 | ) | (37,420 | ) | (13,317 | ) | ||||||
|
|
|
|
|
|
|
|||||||
| Net cash provided by operating activities |
74,379 | 72,410 | 75,353 | |||||||||
|
|
|
|
|
|
|
|||||||
| Cash Flows from Investing Activities |
||||||||||||
| Capital expenditures |
(31,479 | ) | (39,621 | ) | (38,756 | ) | ||||||
| Proceeds from disposition of assets or businesses |
538 | 9,302 | 1,044 | |||||||||
| Cash paid for acquisitions, net of cash acquired |
(36,385 | ) | — | (4,839 | ) | |||||||
| Investment in unconsolidated affiliate |
(7,566 | ) | (6,375 | ) | (200 | ) | ||||||
| Additions to capitalized software |
(601 | ) | (1,312 | ) | (1,079 | ) | ||||||
| Other investing activities |
(600 | ) | (706 | ) | (966 | ) | ||||||
|
|
|
|
|
|
|
|||||||
| Net cash used in investing activities |
(76,093 | ) | (38,712 | ) | (44,796 | ) | ||||||
|
|
|
|
|
|
|
|||||||
| Cash Flows from Financing Activities |
||||||||||||
| Proceeds from Revolving Credit Facility |
389,200 | 490,703 | 331,200 | |||||||||
| Payments on Revolving Credit Facility |
(432,200 | ) | (429,660 | ) | (340,000 | ) | ||||||
| Proceeds from Term Loan |
— | 100,000 | — | |||||||||
| Payments on Term Loan |
(6,250 | ) | (80,000 | ) | (10,000 | ) | ||||||
| Proceeds from Senior Notes |
— | 25,000 | — | |||||||||
| Payments of notes, mortgages, and other debt |
(4,903 | ) | (1,942 | ) | (1,882 | ) | ||||||
| (Payments) loan on CSV life insurance policies |
(872 | ) | — | 7,693 | ||||||||
| Payments on capital lease obligation |
(9,278 | ) | (12,240 | ) | (9,342 | ) | ||||||
| Payments for deferred initial public offering costs |
(6,479 | ) | — | — | ||||||||
| Debt issuance costs |
— | (2,311 | ) | — | ||||||||
| Proceeds from initial public offering of common stock, net of underwriter discounts and commissions |
79,131 | — | — | |||||||||
| Cash dividends paid |
(7,869 | ) | (115,058 | ) | (6,155 | ) | ||||||
| Redemption of Redeemable convertible preferred stock |
— | (4,428 | ) | (3,031 | ) | |||||||
| Purchase of treasury stock — common |
(3 | ) | (1,063 | ) | (249 | ) | ||||||
| Other financing activities |
1,314 | (110 | ) | 428 | ||||||||
|
|
|
|
|
|
|
|||||||
| Net cash provided by (used in) financing activities |
1,791 | (31,109 | ) | (31,338 | ) | |||||||
|
|
|
|
|
|
|
|||||||
| Effect of exchange rate changes on cash |
(385 | ) | (19 | ) | 60 | |||||||
|
|
|
|
|
|
|
|||||||
| Net change in cash |
(308 | ) | 2,570 | (721 | ) | |||||||
| Cash at beginning of year |
3,931 | 1,361 | 2,082 | |||||||||
|
|
|
|
|
|
|
|||||||
| Cash at end of year |
$ | 3,623 | $ | 3,931 | $ | 1,361 | ||||||
|
|
|
|
|
|
|
|||||||
| (1) | See Note 2. Restatement of Previously Issued Financial Statements. |
See accompanying notes to consolidated financial statements.
F-6
Table of Contents
ADVANCED DRAINAGE SYSTEMS, INC. AND SUBSIDIARIES
CONSOLIDATED STATEMENTS OF STOCKHOLDERS’ EQUITY (DEFICIT) AND MEZZANINE EQUITY
| (Amounts in
|
Common Stock | Paid-In Capital |
Common Stock in Treasury |
Accumulated Other Comprehensive Loss |
Retained Earnings (Deficit) |
Total ADS Stockholders’ (Deficit) Equity |
Non- controlling Interest in Subsidiaries |
Total Stockholders’ (Deficit) Equity |
Redeemable Common Stock |
Redeemable Convertible Preferred Stock |
Deferred Compensation - Unearned ESOP Shares |
Total Mezzanine Equity |
||||||||||||||||||||||||||||||||||||||||||||||||||||||||||
| Shares | Amount | Shares | Amount | Shares | Amount | Shares | Amount | Shares | Amount | |||||||||||||||||||||||||||||||||||||||||||||||||||||||||||||
| Balance at April 1, 2012, as previously reported |
109,979 | $ | 11,957 | $ | 39,661 | 101,572 | $ | (449,583 | ) | $ | (1,375 | ) | $ | 110,863 | $ | (288,477 | ) | $ | 20,628 | $ | (267,849 | ) | 38,292 | $ | 482,006 | 26,853 | $ | 264,429 | 19,181 | $ | (188,872 | ) | $ | 557,563 | ||||||||||||||||||||||||||||||||||||
|
|
|
|
|
|
|
|
|
|
|
|
|
|
|
|
|
|
|
|
|
|
|
|
|
|
|
|
|
|
|
|
|
|
|
|
||||||||||||||||||||||||||||||||||||
| Cumulative restatement adjustments |
— | — | (1,006 | ) | — | — | (1,150 | ) | (630 | ) | (2,786 | ) | (5,050 | ) | (7,836 | ) | — | — | — | — | — | — | — | |||||||||||||||||||||||||||||||||||||||||||||||
|
|
|
|
|
|
|
|
|
|
|
|
|
|
|
|
|
|
|
|
|
|
|
|
|
|
|
|
|
|
|
|
|
|
|
|
||||||||||||||||||||||||||||||||||||
| Balance at April 1, 2012 (As Restated)(1) |
109,979 | $ | 11,957 | $ | 38,655 | 101,572 | $ | (449,583 | ) | $ | (2,525 | ) | $ | 110,233 | $ | (291,263 | ) | $ | 15,578 | $ | (275,685 | ) | 38,292 | $ | 482,006 | 26,853 | $ | 264,429 | 19,181 | $ | (188,872 | ) | $ | 557,563 | ||||||||||||||||||||||||||||||||||||
|
|
|
|
|
|
|
|
|
|
|
|
|
|
|
|
|
|
|
|
|
|
|
|
|
|
|
|
|
|
|
|
|
|
|
|
||||||||||||||||||||||||||||||||||||
| Net income |
— | — | — | — | — | — | 20,660 | 20,660 | 2,520 | 23,180 | — | — | — | — | — | — | — | |||||||||||||||||||||||||||||||||||||||||||||||||||||
| Other comprehensive income |
— | — | — | — | — | 1,444 | — | 1,444 | 1,159 | 2,603 | — | — | — | — | — | — | — | |||||||||||||||||||||||||||||||||||||||||||||||||||||
| Redeemable convertible preferred stock dividends |
— | — | — | — | — | — | (625 | ) | (625 | ) | — | (625 | ) | — | — | — | — | — | — | — | ||||||||||||||||||||||||||||||||||||||||||||||||||
| Common stock dividend ($ 0.10 per share) |
— | — | — | — | — | — | (4,817 | ) | (4,817 | ) | — | (4,817 | ) | — | — | — | — | — | — | — | ||||||||||||||||||||||||||||||||||||||||||||||||||
| Dividend paid to noncontrolling interest holder |
— | — | — | — | — | — | — | — | (713 | ) | (713 | ) | — | — | — | — | — | — | — | |||||||||||||||||||||||||||||||||||||||||||||||||||
| Allocation of ESOP shares to participants for: |
||||||||||||||||||||||||||||||||||||||||||||||||||||||||||||||||||||||
| Compensation |
— | — | (282 | ) | — | — | — | — | (282 | ) | — | (282 | ) | — | — | — | — | (711 | ) | 7,565 | 7,565 | |||||||||||||||||||||||||||||||||||||||||||||||||
| Dividend |
— | — | — | — | — | — | (110 | ) | (110 | ) | — | (110 | ) | — | — | — | — | (9 | ) | 110 | 110 | |||||||||||||||||||||||||||||||||||||||||||||||||
| Exercise of common stock options |
— | — | (403 | ) | (325 | ) | 1,436 | — | — | 1,033 | — | 1,033 | — | — | — | — | — | — | — | |||||||||||||||||||||||||||||||||||||||||||||||||||
| Redemption of common shares to exercise stock options |
— | — | 805 | 66 | (805 | ) | — | — | — | — | — | — | — | — | — | — | — | — | ||||||||||||||||||||||||||||||||||||||||||||||||||||
| Stock-based compensation |
— | — | 419 | — | — | — | — | 419 | — | 419 | — | — | — | — | — | — | — | |||||||||||||||||||||||||||||||||||||||||||||||||||||
| Restricted stock awards |
— | — | 832 | (141 | ) | 630 | — | — | 1,462 | — | 1,462 | — | — | — | — | — | — | — | ||||||||||||||||||||||||||||||||||||||||||||||||||||
| Redemption of redeemable convertible preferred stock |
— | — | — | — | — | — | — | — | — | — | — | — | (306 | ) | (3,031 | ) | — | — | (3,031 | ) | ||||||||||||||||||||||||||||||||||||||||||||||||||
| Purchase of common stock |
— | — | — | 19 | (249 | ) | — | — | (249 | ) | — | (249 | ) | — | — | — | — | — | — | — | ||||||||||||||||||||||||||||||||||||||||||||||||||
| Adjustments to redeemable convertible preferred stock fair value measurement |
— | — | — | — | — | — | (5,869 | ) | (5,869 | ) | — | (5,869 | ) | — | — | — | 21,149 | — | (15,280 | ) | 5,869 | |||||||||||||||||||||||||||||||||||||||||||||||||
| Adjustments to redeemable common stock fair value measurement |
— | — | — | — | — | — | (40,270 | ) | (40,270 | ) | — | (40,270 | ) | — | 40,270 | — | — | — | — | 40,270 | ||||||||||||||||||||||||||||||||||||||||||||||||||
|
|
|
|
|
|
|
|
|
|
|
|
|
|
|
|
|
|
|
|
|
|
|
|
|
|
|
|
|
|
|
|
|
|
|
|
||||||||||||||||||||||||||||||||||||
F-7
Table of Contents
| (Amounts in
|
Common Stock | Paid-In Capital |
Common Stock in Treasury |
Accumulated Other Comprehensive Loss |
Retained Earnings (Deficit) |
Total ADS Stockholders’ (Deficit) Equity |
Non- controlling Interest in Subsidiaries |
Total Stockholders’ (Deficit) Equity |
Redeemable Common Stock |
Redeemable Convertible Preferred Stock |
Deferred Compensation - Unearned ESOP Shares |
Total Mezzanine Equity |
||||||||||||||||||||||||||||||||||||||||||||||||||||||||||
| Shares | Amount | Shares | Amount | Shares | Amount | Shares | Amount | Shares | Amount | |||||||||||||||||||||||||||||||||||||||||||||||||||||||||||||
| Balance March 31, 2013 (As Restated)(1) |
109,979 | $ | 11,957 | $ | 40,026 | $ | 101,191 | $ | (448,571 | ) | $ | (1,081 | ) | $ | 79,202 | $ | (318,467 | ) | $ | 18,544 | $ | (299,923 | ) | 38,292 | $ | 522,276 | 26,547 | $ | 282,547 | 18,461 | $ | (196,477 | )$ | 608,346 | ||||||||||||||||||||||||||||||||||||
|
|
|
|
|
|
|
|
|
|
|
|
|
|
|
|
|
|
|
|
|
|
|
|
|
|
|
|
|
|
|
|
|
|
|
|||||||||||||||||||||||||||||||||||||
| Net income |
— | — | — | — | — | — | 8,627 | 8,627 | 3,593 | 12,220 | — | — | — | — | — | — | — | |||||||||||||||||||||||||||||||||||||||||||||||||||||
| Other comprehensive loss |
— | — | — | — | — | (5,749 | ) | — | (5,749 | ) | (1,242 | ) | (6,991 | ) | — | — | — | — | — | — | — | |||||||||||||||||||||||||||||||||||||||||||||||||
| Redeemable convertible preferred stock dividends |
— | — | — | — | — | — | (10,021 | ) | (10,021 | ) | — | (10,021 | ) | — | — | — | — | — | — | — | ||||||||||||||||||||||||||||||||||||||||||||||||||
| Common stock dividend ($ 1.68 per share) |
— | — | — | — | — | — | (80,102 | ) | (80,102 | ) | — | (80,102 | ) | — | — | — | — | — | — | — | ||||||||||||||||||||||||||||||||||||||||||||||||||
| Dividend paid to noncontrolling interest holder |
— | — | — | — | — | — | — | — | (2,311 | ) | (2,311 | ) | — | — | — | — | — | — | — | |||||||||||||||||||||||||||||||||||||||||||||||||||
| Allocation of ESOP shares to participants for: |
||||||||||||||||||||||||||||||||||||||||||||||||||||||||||||||||||||||
| Compensation |
— | — | (203 | ) | — | — | — | — | (203 | ) | — | (203 | ) | — | — | — | — | (725 | ) | 8,093 | 8,093 | |||||||||||||||||||||||||||||||||||||||||||||||||
| Dividend |
— | — | — | — | — | — | (118 | ) | (118 | ) | — | (118 | ) | — | — | — | — | (9 | ) | 118 | 118 | |||||||||||||||||||||||||||||||||||||||||||||||||
| Exercise of common stock options |
— | — | (861 | ) | (428 | ) | 1,896 | — | — | 1,035 | — | 1,035 | — | — | — | — | — | — | — | |||||||||||||||||||||||||||||||||||||||||||||||||||
| Redemption of common shares to exercise stock options |
— | — | 1,187 | 85 | (1,187 | ) | — | — | — | — | — | — | — | — | — | — | — | — | ||||||||||||||||||||||||||||||||||||||||||||||||||||
| Stock-based compensation |
— | — | 1,748 | — | — | — | — | 1,748 | — | 1,748 | — | — | — | — | — | — | — | |||||||||||||||||||||||||||||||||||||||||||||||||||||
| Restricted stock awards |
— | — | 1,363 | (118 | ) | 486 | — | — | 1,849 | — | 1,849 | — | — | — | — | — | — | — | ||||||||||||||||||||||||||||||||||||||||||||||||||||
| Redemption of redeemable convertible preferred stock |
— | — | — | — | — | — | — | — | — | — | — | — | (418 | ) | (4,428 | ) | — | — | (4,428 | ) | ||||||||||||||||||||||||||||||||||||||||||||||||||
| Purchase of common stock |
— | — | — | 80 | (1,063 | ) | — | — | (1,063 | ) | — | (1,063 | ) | — | — | — | — | — | — | — | ||||||||||||||||||||||||||||||||||||||||||||||||||
| Reclassification of common stock to redeemable common stock |
(28 | ) | — | (385 | ) | — | — | — | — | (385 | ) | — | (385 | ) | 28 | 385 | — | — | — | — | 385 | |||||||||||||||||||||||||||||||||||||||||||||||||
| Adjustments to redeemable convertible preferred stock fair value measurement |
— | — | (3,979 | ) | — | — | — | — | (3,979 | ) | — | (3,979 | ) | — | — | — | 13,601 | — | (9,622 | ) | 3,979 | |||||||||||||||||||||||||||||||||||||||||||||||||
| Adjustments to redeemable common stock fair value measurement |
— | — | (26,458 | ) | — | — | — | — | (26,458 | ) | — | (26,458 | ) | — | 26,458 | — | — | — | — | 26,458 | ||||||||||||||||||||||||||||||||||||||||||||||||||
|
|
|
|
|
|
|
|
|
|
|
|
|
|
|
|
|
|
|
|
|
|
|
|
|
|
|
|
|
|
|
|
|
|
|
|||||||||||||||||||||||||||||||||||||
| Balance March 31, 2014 (As Restated)(1) |
109,951 | $ | 11,957 | $ | 12,438 | 100,810 | $ | (448,439 | ) | $ | (6,830 | ) | $ | (2,412 | ) | $ | (433,286 | ) | $ | 18,584 | $ | (414,702 | ) | 38,320 | $ | 549,119 | 26,129 | $ | 291,720 | 17,727 | $ | (197,888 | ) | $ | 642,951 | |||||||||||||||||||||||||||||||||||
|
|
|
|
|
|
|
|
|
|
|
|
|
|
|
|
|
|
|
|
|
|
|
|
|
|
|
|
|
|
|
|
|
|
|
|
||||||||||||||||||||||||||||||||||||
| (1) | See Note 2. Restatement of Previously Issued Financial Statements. |
See accompanying notes to consolidated financial statements.
F-8
Table of Contents
ADVANCED DRAINAGE SYSTEMS, INC. AND SUBSIDIARIES
CONSOLIDATED STATEMENTS OF STOCKHOLDERS’ EQUITY (DEFICIT) AND MEZZANINE EQUITY
| (Amounts in
|
Common Stock | Paid-In Capital |
Common Stock in Treasury |
Accumulated Other Comprehensive Loss |
Retained Earnings |
Total ADS Stockholders’ (Deficit) Equity |
Non- controlling Interest in Subsidiaries |
Total Stockholders’ (Deficit) Equity |
Redeemable Common Stock |
Redeemable Convertible Preferred Stock |
Deferred Compensation - Unearned ESOP Shares |
Total Mezzanine Equity |
||||||||||||||||||||||||||||||||||||||||||||||||||||||||||
| Shares | Amount | Shares | Amount | Shares | Amount | Shares | Amount | Shares | Amount | |||||||||||||||||||||||||||||||||||||||||||||||||||||||||||||
| Balance April 1, 2014 (As Restated)(1) |
109,951 | $ | 11,957 | $ | 12,438 | 100,810 | $ | (448,439 | ) | $ | (6,830 | ) | $ | (2,412 | ) | $ | (433,286 | ) | $ | 18,584 | $ | (414,702 | ) | 38,320 | $ | 549,119 | 26,129 | $ | 291,720 | 17,727 | $ | (197,888 | ) | $ | 642,951 | |||||||||||||||||||||||||||||||||||
| Net income |
— | — | — | — | — | — | 8,620 | 8,620 | 4,131 | 12,751 | — | — | — | — | — | — | — | |||||||||||||||||||||||||||||||||||||||||||||||||||||
| Other comprehensive income |
— | — | — | — | — | (8,691 | ) | — | (8,691 | ) | (3,237 | ) | (11,928 | ) | — | — | — | — | — | — | — | |||||||||||||||||||||||||||||||||||||||||||||||||
| Redeemable convertible preferred stock dividends |
— | — | — | — | — | — | (534 | ) | (534 | ) | — | (534 | ) | — | — | — | — | — | — | — | ||||||||||||||||||||||||||||||||||||||||||||||||||
| Common stock dividend ($.08 per share) |
— | — | — | — | — | — | (4,270 | ) | (4,270 | ) | — | (4,270 | ) | — | — | — | — | — | — | — | ||||||||||||||||||||||||||||||||||||||||||||||||||
| Dividend paid to noncontrolling interest holder |
— | — | — | — | — | — | — | — | (3,065 | ) | (3,065 | ) | — | — | — | — | — | — | — | |||||||||||||||||||||||||||||||||||||||||||||||||||
| Allocation of ESOP shares to participants for: |
||||||||||||||||||||||||||||||||||||||||||||||||||||||||||||||||||||||
| Compensation |
— | — | 3,003 | — | — | — | — | 3,003 | — | 3,003 | — | — | — | — | (731 | ) | 9,141 | 9,141 | ||||||||||||||||||||||||||||||||||||||||||||||||||||
| Dividend |
— | — | — | — | — | — | (127 | ) | (127 | ) | — | (127 | ) | — | — | — | — | (6 | ) | 127 | 127 | |||||||||||||||||||||||||||||||||||||||||||||||||
| Exercise of common stock options |
— | — | 938 | (235 | ) | 1,048 | — | — | 1,986 | — | 1,986 | — | — | — | — | — | — | — | ||||||||||||||||||||||||||||||||||||||||||||||||||||
| Redemption of common shares to exercise stock options |
— | — | 93 | 7 | (93 | ) | — | — | — | — | — | — | — | — | — | — | — | — | ||||||||||||||||||||||||||||||||||||||||||||||||||||
| Stock-based compensation |
— | — | 3,757 | — | — | — | — | 3,757 | — | 3,757 | — | — | — | — | — | — | — | |||||||||||||||||||||||||||||||||||||||||||||||||||||
| Tax benefit resulting from exercise of certain stock-based compensation awards |
— | — | 330 | — | — | — | — | 330 | — | 330 | — | — | — | — | — | — | — | |||||||||||||||||||||||||||||||||||||||||||||||||||||
| Restricted stock awards |
— | — | 719 | (167 | ) | 743 | — | — | 1,462 | — | 1,462 | — | — | — | — | — | — | — | ||||||||||||||||||||||||||||||||||||||||||||||||||||
| Initial Public Offering (IPO) |
5,289 | 53 | 72,143 | — | — | — | — | 72,196 | — | 72,196 | — | — | — | — | — | — | — | |||||||||||||||||||||||||||||||||||||||||||||||||||||
| Reclassification of liability classified stock options upon IPO |
— | — | 1,522 | — | — | — | — | 1,522 | — | 1,522 | — | — | — | — | — | — | — | |||||||||||||||||||||||||||||||||||||||||||||||||||||
| Purchase of common stock |
— | — | — | — | (3 | ) | — | — | (3 | ) | — | (3 | ) | — | — | — | — | — | — | — | ||||||||||||||||||||||||||||||||||||||||||||||||||
| ESOP distributions in common stock |
— | — | 4,454 | (377 | ) | 1,679 | — | — | 6,133 | — | 6,133 | — | — | (490 | ) | (6,133 | ) | — | — | (6,133 | ) | |||||||||||||||||||||||||||||||||||||||||||||||||
F-9
Table of Contents
| (Amounts in
|
Common Stock | Paid-In Capital |
Common Stock in Treasury |
Accumulated Other Comprehensive Loss |
Retained Earnings |
Total ADS Stockholders’ (Deficit) Equity |
Non- controlling Interest in Subsidiaries |
Total Stockholders’ (Deficit) Equity |
Redeemable Common Stock |
Redeemable Convertible Preferred Stock |
Deferred Compensation - Unearned ESOP Shares |
Total Mezzanine Equity |
||||||||||||||||||||||||||||||||||||||||||||||||||||||||||
| Shares | Amount | Shares | Amount | Shares | Amount | Shares | Amount | Shares | Amount | |||||||||||||||||||||||||||||||||||||||||||||||||||||||||||||
| Adjustments to redeemable convertible preferred stock fair value measurement |
— | — | (13,077 | ) | — | — | — | 2,023 | (11,054 | ) | — | (11,054 | ) | — | — | — | 34,903 | — | (23,849 | ) | 11,054 | |||||||||||||||||||||||||||||||||||||||||||||||||
| Adjustments to redeemable common stock fair value measurement |
— | — | — | — | — | — | (65,921 | ) | (65,921 | ) | — | (65,921 | ) | — | 65,921 | — | — | — | — | 65,921 | ||||||||||||||||||||||||||||||||||||||||||||||||||
| Termination of redemption feature upon IPO |
38,320 | 383 | 614,657 | — | — | — | — | 615,040 | — | 615,040 | (38,320 | ) | (615,040 | ) | — | — | — | — | (615,040 | ) | ||||||||||||||||||||||||||||||||||||||||||||||||||
|
|
|
|
|
|
|
|
|
|
|
|
|
|
|
|
|
|
|
|
|
|
|
|
|
|
|
|
|
|
|
|
|
|
|
|||||||||||||||||||||||||||||||||||||
| Balance March 31, 2015 |
153,560 | $ | 12,393 | $ | 700,977 | 100,038 | $ | (445,065 | ) | $ | (15,521 | ) | $ | (62,621 | ) | $ | 190,163 | $ | 16,413 | $ | 206,576 | — | $ | — | 25,639 | $ | 320,490 | 16,990 | $ | (212,469 | ) | $ | 108,021 | |||||||||||||||||||||||||||||||||||||
|
|
|
|
|
|
|
|
|
|
|
|
|
|
|
|
|
|
|
|
|
|
|
|
|
|
|
|
|
|
|
|
|
|
|
|||||||||||||||||||||||||||||||||||||
| (1) | See Note 2. Restatement of Previously Issued Financial Statements. |
See accompanying notes to consolidated financial statements.
F-10
Table of Contents
ADVANCED DRAINAGE SYSTEMS, INC. AND SUBSIDIARIES
NOTES TO CONSOLIDATED FINANCIAL STATEMENTS
(Amounts in thousands, except per share data)
| 1. | BACKGROUND AND SUMMARY OF SIGNIFICANT ACCOUNTING POLICIES |
Organization
Advanced Drainage Systems, Inc. and subsidiaries (collectively referred to as “ADS,” the “Company,” “we,” “us” and “our”), incorporated in Delaware, designs, manufactures and markets high performance thermoplastic corrugated pipe and related water management products, primarily in North and South America and Europe. Our broad product line includes corrugated high density polyethylene (or “HDPE”) pipe, polypropylene (or “PP”) pipe and related water management products.
Our fiscal year begins on April 1 and ends on March 31. Unless otherwise noted, references to “year” pertain to our fiscal year. For example, 2015 refers to fiscal 2015, which is the period from April 1, 2014 to March 31, 2015.
The Company is managed based primarily on the geographies in which it operates and reports results of operations in two reportable segments. The reportable segments are Domestic and International.
2014 Initial Public Offering (“IPO”)
On July 11, 2014, in anticipation of the IPO, we executed a 4.707-for-one split of our common and our preferred stock. The effect of the stock split on outstanding shares and earnings per share has been retroactively applied to all periods presented.
On July 25, 2014, we completed the IPO of our common stock, which resulted in the sale by the Company of 5,289 shares of common stock. We received total proceeds from the IPO of $79,131 after excluding underwriter discounts and commissions of $5,501, based upon the price to the public of $16.00 per share. After deducting other offering expenses of $6,935, we used the net proceeds of $72,196 to reduce the outstanding indebtedness under the revolving portion of our credit facility. The common stock is listed on the New York Stock Exchange under the symbol “WMS.”
On August 22, 2014, an additional 600 shares of common stock were sold by certain selling stockholders of the Company as a result of the partial exercise by the underwriters of the over-allotment option granted by the selling stockholders to the underwriters in connection with the IPO. The shares were sold at the public offering price of $16.00 per share. The Company did not receive any proceeds from the sale of such additional shares.
2014 Secondary Public Offering (“Secondary Public Offering”)
On December 9, 2014, we completed a Secondary Public Offering of our common stock, which resulted in the sale of 10,000 shares of common stock by a certain selling stockholder of the Company at a public offering price of $21.25. We did not receive any proceeds from the sale of shares by the selling stockholder.
On December 15, 2014, an additional 1,500 shares of common stock were sold by a certain selling stockholder of the Company as a result of the full exercise by the underwriters of the over-allotment option granted by the selling stockholder to the underwriters in connection with the Secondary Public Offering. The shares were sold at the public offering price of $21.25 per share. The Company did not receive any proceeds from the sale of such additional shares.
Principles of Consolidation
Our consolidated financial statements include the Company, our wholly owned subsidiaries, our majority owned subsidiaries, including ADS Mexicana, S.A. de C.V. (“ADS Mexicana”), and variable interest
F-11
Table of Contents
entities (“VIEs”) of which we are the primary beneficiary. We use the equity method of accounting for equity investments where we exercise significant influence but do not hold a controlling financial interest. Such investments are recorded in Other assets in our Consolidated Balance Sheets and the related equity in earnings from these investments are included in Equity in net loss (income) of unconsolidated affiliates in our Consolidated Statements of Operations. All intercompany balances and transactions have been eliminated in consolidation.
Estimates
The preparation of our consolidated financial statements in conformity with accounting principles generally accepted in the United States of America (“GAAP”) requires management to make estimates and assumptions that affect the reported amounts of assets and liabilities, the disclosure of contingencies and liabilities at the balance sheet date and the reported amounts of revenues and expenses during the reporting period. Significant estimates include, but are not limited to, our allowance for doubtful accounts, inventory, useful lives of our property, plant and equipment and amortizing intangible assets, determination of the proper accounting for leases, accounting for investments, evaluation of goodwill, intangible assets and other long-lived assets for impairment, accounting for stock-based compensation and our ESOP, valuation of our Redeemable common stock and Redeemable convertible preferred stock, determination of allowances for sales returns, rebates and discounts, determination of the valuation allowance, if any, on deferred tax assets, and reserves for uncertain tax positions. Management’s estimates and assumptions are evaluated on an ongoing basis and are based on historical experience, current conditions and available information. Management believes the accounting estimates are appropriate and reasonably determined; however, due to the inherent uncertainties in making these estimates, actual results could differ from those estimates.
Allowance for Doubtful Accounts
Credit is extended to customers based on an evaluation of their financial condition and collateral is generally not required. The evaluation of the customer’s financial condition is performed to reduce the risk of loss. Accounts receivable are evaluated for collectability based on numerous factors, including the length of time individual receivables are past due, past transaction history with customers, their credit worthiness and the economic environment. An allowance for doubtful accounts is estimated as a percentage of aged receivables. This estimate is periodically adjusted when management becomes aware of a specific customer’s inability to meet its financial obligations (e.g., bankruptcy filing) or as a result of changes in historical collection patterns.
Inventories
Inventories are stated at the lower of cost or market value. The Company’s inventories are maintained on the first-in, first-out (“FIFO”) method. Costs include the cost of acquiring materials, including in-bound freight from vendors and freight incurred for the transportation of raw materials or finished goods between the Company’s manufacturing plants and its distribution centers, direct and indirect labor, factory overhead and certain corporate overhead costs related to the production of inventory. The portion of fixed manufacturing overhead that relates to capacity in excess of our normal capacity is expensed in the period in which it is incurred and is not included in inventory.
Market value of inventory is established based on the lower of cost or estimated net realizable value, with consideration given to deterioration, obsolescence, and other factors. The Company periodically evaluates the carrying value of inventories and adjustments are made whenever necessary to reduce the carrying value to net realizable value.
Property, Plant and Equipment and Depreciation Method
Property, plant and equipment are recorded at cost less accumulated depreciation, with the exception of assets acquired through acquisitions, which are initially recorded at fair value. Equipment acquired under
F-12
Table of Contents
capital lease is recorded at the lower of fair market value or the present value of the future minimum lease payments. Depreciation is computed for financial reporting purposes using the straight-line method over the estimated useful lives of the related assets or the lease term, if shorter, as follows:
| Years | ||
| Buildings |
40 | |
| Machinery and equipment |
3 — 15 | |
| Leasehold improvements |
Shorter of useful life or life of lease |
Costs of additions and major improvements are capitalized, whereas maintenance and repairs that do not improve or extend the life of the asset are charged to expense as incurred. When assets are retired or disposed, the cost and related accumulated depreciation are removed from the asset accounts and any resulting gain or loss is reflected in Loss (gain) on disposal of assets or businesses in our Consolidated Statements of Operations. Construction in progress is also recorded at cost and includes capitalized interest, capitalized payroll costs and related costs such as taxes and other fringe benefits. Interest capitalized was $518, $611, and $1,036 during the fiscal years ended March 31, 2015, 2014 and 2013, respectively.
Goodwill
The Company records acquisitions resulting in the consolidation of an enterprise using the acquisition method of accounting. Under this method, we record the assets acquired, including intangible assets that can be identified, and liabilities assumed based on their estimated fair values at the date of acquisition. The purchase price in excess of the fair value of the identifiable assets acquired and liabilities assumed is recorded as goodwill.
Goodwill is reviewed annually for impairment as of March 31 or whenever events or changes in circumstances indicate the carrying value may be greater than fair value. The goodwill impairment analysis is comprised of two steps. The first step requires the comparison of the fair value of the applicable reporting unit to its respective carrying value. If the fair value of the reporting unit exceeds the carrying value of the net assets assigned to that unit, goodwill is not considered impaired and the Company is not required to perform further testing. If the carrying value of the net assets assigned to the reporting unit exceeds the fair value of the reporting unit, then the Company must perform the second step of the impairment test in order to determine the implied fair value of the reporting unit’s goodwill. If the carrying value of a reporting unit’s goodwill exceeds its implied fair value, then we would record an impairment loss equal to the difference. With respect to this testing, a reporting unit is a component of the Company for which discrete financial information is available and regularly reviewed by management. Implied fair value of goodwill is determined by considering both the income and market approach. Determining the fair value of a reporting unit is judgmental in nature and involves the use of significant estimates and assumptions. These estimates and assumptions include revenue growth rates and operating margins used to calculate projected future cash flows, risk-adjusted discount rates, future economic and market conditions, and determination of appropriate market comparables. The fair value estimates are based on assumptions management believes to be reasonable, but are inherently uncertain.
The Company did not incur any impairment charges for Goodwill in the fiscal years ended March 31, 2015, 2014 or 2013.
Intangible Assets
Intangible Assets — Definite-Lived
Definite-lived intangible assets are amortized using the straight-line method over their estimated useful lives, and are tested for recoverability whenever events or changes in circumstances indicate that carrying amounts of the asset group may not be recoverable. Asset groups are established primarily by determining
F-13
Table of Contents
the lowest level of cash flows available. If the estimated undiscounted future cash flows are less than the carrying amounts of such assets, an impairment loss is recognized to the extent the fair value of the asset less any costs of disposition is less than the carrying amount of the asset. Determining the fair value of these assets is judgmental in nature and involves the use of significant estimates and assumptions.
Intangible Assets — Indefinite-Lived
Indefinite-lived intangible assets are tested for impairment annually as of March 31 or whenever events or changes in circumstances indicate the carrying value may be greater than fair value. Determining the fair value of these assets is judgmental in nature and involves the use of significant estimates and assumptions. The Company bases its fair value estimates on assumptions it believes to be reasonable, but that are inherently uncertain. To estimate the fair value of these indefinite-lived intangible assets, the Company uses an income approach, which utilizes a market derived rate of return to discount anticipated performance. An impairment loss is recognized when the estimated fair value of the intangible asset is less than the carrying value.
The Company did not incur any impairment charges for Intangible assets in the fiscal years ended March 31, 2015, 2014 or 2013.
Other Assets
Other assets include investments in unconsolidated affiliates accounted for under the equity method, capitalized software development costs, deposits, deferred financing costs, cash surrender value of officer life insurance on key senior management executives, Central parts, and other. The Company capitalizes development costs for internal use software. Capitalization of software development costs begins in the application development stage and ends when the asset is placed into service. The Company amortizes such costs using the straight-line method over estimated useful lives of 2 to 10 years, which is included in General and administrative expense, Selling expense or Cost of goods sold within our Consolidated Statements of Operations depending on the nature of the asset and its intended use. Amortization expense related to deferred financing costs is included in Interest expense within our Consolidated Statements of Operations. Central parts represent spare production equipment items which are used to replace worn or broken production equipment parts and help reduce the risk of prolonged equipment outages. The cost of Central parts is amortized on a straight line basis over estimated useful lives of 8 to 30 years.
Other assets as of the fiscal years ended March 31 consisted of the following:
| (Amounts in thousands) | 2015 | 2014 | ||||||
| Investments in unconsolidated affiliates |
$ | 25,038 | $ | 23,624 | ||||
| Capitalized software development costs, net |
7,276 | 10,511 | ||||||
| Deposits |
4,947 | 5,192 | ||||||
| Deferred financing costs |
4,543 | 5,953 | ||||||
| Cash surrender value of officer life insurance |
9,953 | 8,893 | ||||||
| Central parts |
2,108 | 1,910 | ||||||
| Other |
7,302 | 9,364 | ||||||
|
|
|
|
|
|||||
| Total other assets |
$ | 61,167 | $ | 65,447 | ||||
|
|
|
|
|
|||||
The following table sets forth amortization expense related to Other assets in each of the fiscal years ending March 31:
| (Amounts in thousands) | 2015 | 2014 | 2013 | |||||||||
| Capitalized software development costs |
$ | 3,550 | $ | 3,270 | $ | 3,539 | ||||||
| Deferred financing costs |
1,410 | 1,591 | 2,008 | |||||||||
| Central Parts |
55 | 43 | 41 | |||||||||
| Other |
1,977 | 1,986 | 1,970 | |||||||||
F-14
Table of Contents
Leases
Leases are reviewed for capital or operating classification at their inception. The Company uses the lower of the rate implicit in the lease or its incremental borrowing rate in the assessment of lease classification and assumes the initial lease term includes cancellable and renewal periods that are reasonably assured. For leases classified as capital leases at lease inception, we record a capital lease asset and lease financing obligation equal to the lesser of the present value of the minimum lease payments or the fair market value of the leased asset. The capital lease asset is recorded in Property, plant and equipment, net and amortized to its expected residual value at the end of the lease term using the straight-line method, and the lease financing obligation is amortized using the interest method over the lease term with the rental payments being allocated to principal and interest. For leases classified as operating leases, we record rent expense over the lease term using the straight-line method.
Foreign Currency Translation
Assets and liabilities of foreign subsidiaries with a functional currency other than the U.S. dollar are translated into U.S. dollars at the current rate of exchange on the last day of the reporting period. Revenues and expenses are translated at a monthly average exchange rate and equity transactions are translated using either the actual exchange rate on the day of the transaction or a monthly average historical exchange rate.
Net Sales
The Company sells pipe products and related water management products. ADS ships products to customers predominantly by internal fleet and to a lesser extent by third-party carriers. The Company does not provide any additional revenue generating services after product delivery.
Sales, net of sales tax and allowances for returns, rebates and discounts are recognized from product sales when persuasive evidence of an arrangement exists, delivery has occurred, the price to the buyer is fixed or determinable and collectability is reasonably assured. ADS does not ship an order until a customer purchase order or sales order has been received that includes the pricing and quantity of the products in the order, which establishes both persuasive evidence of an arrangement and that the price is fixed or determinable. Title to the products and risk of loss generally passes to the customer upon delivery. ADS performs credit check procedures on all new customers, establishes credit limits accordingly, and monitors the creditworthiness of existing customers, which is the basis for concluding that collectability is reasonably assured.
Shipping Costs
Shipping costs are incurred to physically move our raw materials, tooling and products between manufacturing and distribution facilities and from our production or distribution facilities to our customers. Shipping costs for the fiscal years ended March 31, 2015, 2014 and 2013 were $120,993, $111,862 and $110,402, respectively, and are included in Cost of goods sold. In certain instances, we bill shipping costs to our customers. Shipping costs billed to customers were $9,282, $8,864 and $9,133 during 2015, 2014 and 2013, respectively, and are included in Net sales.
Stock-Based Compensation
ADS has several programs for stock-based payments to employees and directors. Equity-classified awards are measured based on the grant-date estimated fair value of each award, net of estimated forfeitures, and liability-classified awards are re-measured at fair value, net of estimated forfeitures, at each reporting date. Compensation expense is recognized over the employee’s requisite service period, which is generally the vesting period of the grant. The fair value of each stock option granted is estimated using the Black-Scholes option pricing model. Compensation expense is recorded for new awards and existing awards that are modified, repurchased, or forfeited. For details of our stock-based compensation award programs, see Note 20. Stock-Based Compensation.
F-15
Table of Contents
Advertising
We expense advertising costs as incurred. Advertising costs are recorded in Selling expenses in the Consolidated Statements of Operations. The total advertising costs were $2,477, $2,335 and $2,731 for the fiscal years ended March 31, 2015, 2014 and 2013, respectively.
Self-Insurance
The Company is self-insured for short term disability and medical coverage it provides for substantially all eligible employees. The Company is self-insured for medical claims up to the individual and aggregate stop-loss coverage limits. Management accrues for claims incurred but not reported based on our estimate of future claims related to events that occurred prior to our fiscal year end if we have not met the aggregate stop-loss coverage limit. Amounts contributed totaled $32,002, $29,484, and $30,775 for the fiscal years ended March 31, 2015, 2014 and 2013, respectively, of which employees contributed $4,067, $4,032 and $806, respectively.
ADS is also self-insured for various other general insurance programs to the extent of the applicable deductible limits on the Company’s insurance coverage. These programs include primarily automobile, general liability and employment practices coverage with deductibles ranging from $250 to $500 per occurrence or claim incurred. Amounts expensed during the period, including an estimate for claims incurred but not reported at year end, were $569, $447 and $934, for the years ended March 31, 2015, 2014 and 2013, respectively.
ADS is also self-insured for workers’ compensation insurance with stop-loss coverage for claims that exceed $250 per incident up to the respective state statutory limits. Amounts expensed, including an estimate for claims incurred but not reported, were $1,369, $1,395 and $1,184 for the fiscal years ended March 31, 2015, 2014 and 2013, respectively.
Income Taxes
Income taxes are accounted for under the asset and liability method. Deferred tax assets and liabilities are recognized and represent the future tax consequences attributable to differences between the financial statement carrying amounts of existing assets and liabilities and their respective tax bases. They are measured using the enacted tax rates expected to apply to taxable income in the years in which the related temporary differences are expected to be recovered or settled. The effect on deferred tax assets and liabilities of a change in tax rates is recognized in income in the period that includes the enactment date. The deferred income tax provision represents the change during the reporting period in the deferred tax assets and deferred tax liabilities. Penalties and interest recorded on income taxes payable are recorded as part of Income tax expense.
The Company determines whether an uncertain tax position of the Company is more likely than not to be sustained upon examination, including resolution of any related appeals or litigation process, based upon the technical merits of the position. For tax positions meeting the more likely than not threshold, the tax amount recognized in the financial statements is the amount that has a greater than 50% likelihood of being realized upon ultimate settlement with the relevant taxing authority.
Fair Values
The fair value framework requires the categorization of assets and liabilities into three levels based upon assumptions (inputs) used to price the assets or liabilities. Level 1 provides the most reliable measure of fair value, whereas Level 3 generally requires significant management judgment. The three levels are defined as follows:
Level 1 — Unadjusted quoted prices in active markets for identical assets and liabilities.
F-16
Table of Contents
Level 2 — Observable inputs other than those included in Level 1. For example, quoted prices for similar assets or liabilities in active markets or quoted prices for identical assets or liabilities in inactive markets.
Level 3 — Unobservable inputs reflecting management’s own assumptions about the inputs used in pricing the asset or liability.
The carrying amounts of current financial assets and liabilities approximate fair value because of the immediate or short-term maturity of these items. The carrying and fair values of the Company’s Senior Notes (discussed in Note 13. Debt) were $100,000 and $103,590, respectively, as of March 31, 2015 and $100,000 and $104,511, respectively, at March 31, 2014. The fair value of the Senior Notes was determined based on a comparison of the interest rate and terms of such borrowings to the rates and terms of similar debt available for the period. Management believes the carrying amount on the remaining long-term debt is not materially different from its fair value as the interest rates and terms of the borrowings are similar to currently available borrowings. The categorization of the framework used to evaluate this debt is considered Level 2. See also Note 9. Fair Value Measurement to these financial statements.
Concentrations of Risk
We have a large, active customer base of over 18,000 customers with one customer representing more than 10% of annual net sales. Such customer accounted for 10.7%, 10.6% and 9.7% of fiscal year 2015, 2014 and 2013 net sales, respectively. Our customer base is diversified across the range of end markets that we serve.
Financial instruments that potentially subject the Company to a concentration of credit risk consist principally of Receivables. The Company provides its products to customers based on an evaluation of the customers’ financial condition, generally without requiring collateral. Exposure to losses on Receivables is principally dependent on each customer’s financial condition. The Company performs ongoing credit evaluations of its customers. The Company monitors the exposure for credit losses and maintains allowances for anticipated losses. Concentrations of credit risk with respect to Receivables are limited due to the large number of customers comprising the Company’s customer base and their dispersion across many different geographies although one customer accounts for approximately 14% of our receivables at March 31, 2015.
Derivatives
We recognize derivative instruments as either assets or liabilities and measure those instruments at fair value. We use interest rate swaps, commodity options in the form of collars and swaps, and foreign currency forward contracts to manage our various exposures to interest rate, commodity price, and exchange rate fluctuations. These instruments do not qualify for hedge accounting treatment and therefore, gains and losses from contract settlements and changes in fair value of the derivative instruments are recognized in Other miscellaneous expense (income), net in the Consolidated Statements of Operations. Our policy is to present all derivative balances on a gross basis.
The Company also has forward purchase agreements in place with certain resin suppliers for virgin polyethylene resin. The agreements specify a fixed amount of virgin resin material to be purchased at a fixed price for a given period of time in quantities the Company will use in the normal course of business, and therefore, are not subject to the guidance provided in ASC 810-15. The cost of such resin is recognized in Cost of goods sold in the Consolidated Statements of Operations.
Recent Accounting Pronouncements
Revenue Recognition — In May 2014, the FASB issued an accounting standards update which amends the guidance for revenue recognition. This amendment contains principles that will require an entity to recognize revenue to depict the transfer of goods and services to customers at an amount that an entity
F-17
Table of Contents
expects to be entitled to in exchange for goods or services. The amendment sets forth a new revenue recognition model that requires identifying the contract, identifying the performance obligations and recognizing the revenue upon satisfaction of performance obligations. In August 2015, the FASB issued an additional accounting standards update that deferred the effective date of the new revenue standard for public entities to periods beginning after December 15, 2017, with early adoption permitted but not earlier than the original effective date of periods beginning after December 15, 2016. The updated standard permits the use of either the retrospective or cumulative effect transition method. We expect to adopt this standard effective April 1, 2018. We have not yet selected a transition method and are currently evaluating the impact of this amendment on our consolidated financial statements.
Consolidation — In February 2015, the FASB issued an accounting standards update to make changes to consolidation guidance to address concerns of stakeholders that current accounting for certain legal entities might require a reporting entity to consolidate another legal entity in situations in which the reporting entity’s contractual rights do not give it the ability to act primarily on its own behalf, the reporting entity does not hold a majority of the legal entity’s voting rights, or the reporting entity is not exposed to a majority of the legal entity’s economic benefits or obligations. This update is effective for annual periods beginning on or after December 15, 2015, and interim periods within those years, with early adoption permitted. We expect to adopt this standard effective April 1, 2016. We are currently evaluating the impact of this new standard on our consolidated financial statements.
Debt Issuance Costs — In April 2015, the FASB issued an accounting standards update that requires debt issuance costs related to a recognized debt liability be presented in the balance sheet as a direct deduction from the carrying amount of the related debt liability instead of being presented as an asset. Debt disclosures will include the face amount of the debt liability and the effective interest rate. The update requires retrospective application and represents a change in accounting principle. In August 2015, the FASB issued an additional accounting standards update that provided supplemental guidance that the SEC would not object to an entity deferring and presenting debt issuance costs as an asset and subsequently amortizing the deferred debt issuance costs ratably over the term of the line-of-credit arrangement, regardless of whether there are any outstanding borrowings on the line-of-credit arrangement. These updates are effective for annual periods beginning after December 15, 2015, and interim periods within those years. Early adoption is permitted for financial statements that have not been previously issued. We expect to adopt this standard effective April 1, 2016 and do not believe the effect of the balance sheet reclassification will have a material impact on our consolidated financial statements.
Measurement of Inventory — In July 2015, the FASB issued an accounting standards update which requires entities to measure most inventory at the lower of cost and net realizable value, simplifying current guidance under which an entity must measure inventory at the lower of cost or market. The determination of market value, under current guidance, is considered unnecessarily complex as there are several potential outcomes based on its definition as replacement cost, net realizable value, or net realizable value less an approximate normal profit margin. Whereas net realizable value, under the update, is the estimated selling prices in the ordinary course of business, less reasonably predictable costs of completion, disposal and transportation. This update is effective for annual periods beginning on or after December 15, 2016, and interim periods within those years, with early adoption permitted. We expect to adopt this standard effective April 1, 2017. We will evaluate the impact of this new standard on our consolidated financial statements during 2016.
Business Combinations — In September 2015, the FASB issued new accounting guidance which allows entities to prospectively reflect adjustments made to provisional amounts recognized for a business combination during the measurement period. Under the current guidance these adjustments need to be reflected retrospectively as if the accounting had been completed at the acquisition date. The guidance will be effective for fiscal years, and interim periods within those years, beginning after December 15, 2015 but can be adopted early if financial statements have not been issued. We adopted this guidance effective July 1, 2015, and it did not have a material impact on our consolidated financial statements.
Deferred Tax Assets and Liabilities — In November 2015, the FASB issued an accounting standards update which requires entities to classify all deferred tax assets and liabilities, as well as any related valuation
F-18
Table of Contents
allowance, as non-current, rather than separately record the current and non-current portions. This update is effective for annual periods beginning on or after December 15, 2016, and interim periods within those years, with early adoption permitted. We expect to early adopt this standard effective April 1, 2016.
Equity Investments and Financial Liabilities — In January 2016, the FASB issued an accounting standards update that changes the measurement and recognition guidance for certain equity investments, financial liabilities and deferred tax assets. The standard does not apply to equity method investments or investments in consolidated subsidiaries. For other types of equity investments, the standard requires that the equity investments be measured at fair value with changes recognized in net income, although the standard does provide a practicability exception for equity investments without readily determinable fair values. Under the practicability exception, entities would report these equity investments at cost adjusted for changes in observable prices minus impairment. In addition, the standard requires that for entities that elect the fair value option for financial liabilities, that the change in fair value that is attributable to instrument-specific credit risk be recognized in other comprehensive income rather than net income. The standard also requires that entities assess the need for a valuation allowance on a deferred tax asset related to available-for-sale debt securities in combination with their other deferred tax assets. This update is effective for annual periods beginning after December 15, 2017, including interim periods within those years. Public business entities are permitted to early adopt the provisions related to the recognition of changes in fair value of financial liabilities. We expect to adopt this standard effective April 1, 2018 and are currently evaluating the impact of this new standard on our consolidated financial statements.
Leases — In February 2016, the FASB issued an accounting standards update which amends the guidance for leases. This amendment contains principles that will require an entity to recognize most leases on the balance sheet by recording a right-of-use asset and a lease liability, unless the lease is a short-term lease that has an accounting lease term of twelve months or less. The amendment also contains other changes to the current lease guidance that may result in changes to how entities determine which contractual arrangements qualify as a lease, the accounting for executory costs such as property taxes and insurance, as well as which lease origination costs will be capitalizable. The new standard also requires expanded quantitative and qualitative disclosures. This update is effective for fiscal years beginning after December 15, 2018, including interim periods within those years, and early adoption is permitted. The updated standard requires the use of the modified retrospective transition method, whereby the new guidance will be applied at the beginning of the earliest period presented in the financial statements of the period of adoption. The modified retrospective transition approach includes certain practical expedients that entities may elect to apply in transition. We expect to adopt this standard effective April 1, 2019. We have not yet determined whether we will elect to apply any of the available practical expedients and are currently evaluating the impact of this amendment on our consolidated financial statements.
With the exception of pronouncements described above, there have been no new accounting pronouncements that have significance, or potential significance, to our consolidated financial statements.
| 2. | RESTATEMENT OF PREVIOUSLY ISSUED FINANCIAL STATEMENTS |
Background
In June of 2015, in connection with the preparation of the Company’s consolidated annual financial statements for the fiscal year ended March 31, 2015, certain errors related to the Company’s accounting treatment for its transportation and equipment leases and inventory methodology were identified. As the Company completed additional accounting review procedures, it identified additional errors related to long-lived assets, ADS Mexicana and certain other miscellaneous items.
Due to these errors, as further described below, and based upon the recommendation of management, the Audit Committee of the Company’s Board of Directors (the “Audit Committee”) determined on August 14, 2015 that the Company’s previously issued audited financial statements should no longer be relied upon. As a result of the foregoing the Company has restated its consolidated financial statements for the fiscal years
F-19
Table of Contents
ended March 31, 2014 and 2013, as well as the quarterly periods for the first three quarters of the fiscal year ended March 31, 2015 and for all of the quarterly periods in the fiscal year ended March 31, 2014. The restatement also affects periods prior to fiscal year 2013, with the cumulative effect of the errors reflected as an adjustment to the fiscal year 2013 opening stockholders’ equity (deficit) balance.
Accounting Adjustments
The following is a discussion of the significant accounting adjustments that were made to the Company’s historical consolidated financial statements.
Lease Accounting Adjustments
The Company leases real estate and equipment under various lease agreements. Historically, assets leased under the Company’s transportation and equipment leasing program (“Fleet Leases”) have been classified as operating leases. However, based upon a reexamination of the Company’s historic assumptions, estimates and judgments with respect to lease accounting, as further described below, the Company has determined that a substantial portion of the Fleet Leases should instead be classified as capital leases.
As part of the Company’s recent review of its Fleet Leases, the Company reexamined the minimum lease payment classification test (the “MLP Test”) set forth in ASC Topic 840, which is one of four criteria used to determine lease classification. The MLP Test requires a lease to be capitalized when the present value of the minimum lease payments is greater than or equal to 90% of the fair market value of leased property at lease inception.
The Company had historically included in the minimum lease payments used for purposes of the MLP Test only those payments related to the non-cancellable period identified in the lease agreement. However, the Company has now determined that the minimum lease payments should also include payments related to certain reasonably assured renewal periods included in the lease agreement. Under that revised analysis of significant lease arrangements, the Company has concluded that the present value of the minimum lease payments exceeded 90% of the fair market value for certain leased assets, requiring a modification of treatment from operating to capital leases.
The Company has also reexamined its historic assumptions, estimates and judgments with respect to the accounting for real estate and aircraft leases that were previously classified as operating leases. In many cases, the Company has determined that the leases should instead be classified as capital leases due to the inclusion of contingent penalty amounts in the minimum lease payments used for purposes of the MLP Test.
The errors in lease classification have been corrected in the restated consolidated financial statements, whereby at lease inception the Company has recorded a capital lease asset and lease financing obligation equal to the lesser of the present value of the minimum lease payments or the fair market value of the leased asset. The capital lease asset is recorded in Property, plant and equipment, net and amortized to its expected residual value at the end of the lease term using the straight-line method, and the lease financing obligation is amortized using the effective interest method over the lease term with the rental payments being allocated to principal and interest.
Inventory Accounting Adjustments
The Company identified and corrected certain errors related to its accounting for inventory. The errors primarily related to the Company’s incorrect historical calculation of inventory costing based on the FIFO method, the inappropriate capitalization of certain inter-plant freight expense and other overhead costs, as well as the misclassification of certain overhead costs between general and administrative expense and cost of goods sold. The Company also identified and corrected certain errors related to ADS Mexicana’s accounting for inventory.
F-20
Table of Contents
With respect to inventory costing errors related to the application of the FIFO method, the Company had historically utilized a simplified method of calculating inventory cost based on an overall average price near period end for all products, particularly with respect to the resin material cost component of inventory. However, this simplified method for establishing inventory cost became less precise over time primarily as a result of the significant increase in the number of raw materials purchased by the Company. The imprecision in this simplified method became even greater during fiscal 2015 when raw material pricing became particularly volatile. In response, the Company has developed a more precise model to value the resin component of ending inventory on hand under the FIFO method.
There were multiple contributing factors related to the errors in the capitalization of overhead costs. First, the Company historically applied a simplified method of capitalizing general and administrative overhead costs to inventory by using a consistent capitalization rate across all general and administrative functions, such as the purchasing, human resources and information technology functions, regardless of the actual amount of each function’s efforts that were related to the inventory production process. In addition, certain amounts were capitalized from Cost of goods sold into inventory without a corresponding reclassification entry from general and administrative expenses. In response, the Company developed an appropriate allocation of general and administrative overhead costs to inventory based on the specific amount of each function’s efforts that were related to the inventory production process. Finally, certain capitalized overhead costs were determined to be inappropriate as they were unrelated to the inventory production process or the use of estimates that did not accurately reflect actual costs.
The loss on the financial fuel hedge was determined to be Other miscellaneous expense (income), net rather than Cost of goods sold, and therefore was not capitalized as an inventoriable cost. Minor corrections were made to the related inventory turn calculation to be more consistent with other costs capitalized into ending inventory.
Long-Lived Assets Accounting Adjustments
The Company identified and corrected certain errors related to the accounting for long-lived assets included in Property, plant and equipment, Goodwill, Intangible assets and Other assets in the Consolidated Balance Sheets. These errors primarily related to either the initial capitalization, subsequent depreciation or amortization, or the timing or amount of impairment charges. The specific nature of each item in this category of adjustments is described as follows:
| • | The adjustments to Property, plant and equipment primarily related to the write-off of certain components of equipment that had been replaced, fully or partially, by fixed asset additions, and the write-off of certain amounts that were determined to not qualify for initial capitalization. In addition, it was determined that the depreciable lives should be revised for certain equipment. |
| • | The Hancor trademark intangible asset adjustment represents an increase in the impairment charge originally recorded in the fiscal year ended March 31, 2012, as well as the resulting decrease in the subsequent amortization expense for the asset. |
| • | The adjustments to Other assets related to capitalized software development costs are primarily related to the write-off of certain amounts that were determined to not qualify for initial capitalization, corrections of in-service dates, and revised amortization lives on some assets. |
| • | The adjustments to Other assets related to Central parts are necessary to properly value the assets on hand at historic cost, and once placed into service, amortize the assets over their respective useful lives. |
| • | The adjustments also include the reclassification from Intangible assets to Other assets of an asset recorded at the time of the disposal of a business in fiscal year 2012 related to a favorable supply contract, as well as the reclassification from Intangible Assets to Goodwill of certain purchase price recorded at the time of the Quality Culvert, Inc. acquisition in fiscal year 2012, and the resulting impact on amortization expense. |
F-21
Table of Contents
ADS Mexicana Accounting Adjustments
In October 2015, members of the Company’s management became aware of transactions involving ADS Mexicana that ADS Mexicana personnel initially brought to the attention of the Company for further review to confirm whether these transactions were appropriately characterized. The ADS Mexicana transactions in question included an aircraft leasing arrangement, a real estate leasing arrangement and several services arrangements that involved ADS Mexicana related parties. Once brought to the attention of the Company, management promptly undertook a review to determine whether such transactions were properly recorded and/or characterized and to ensure that such transactions and their financial impact was appropriately reflected in the Company’s consolidated financial statements.
After receiving a preliminary report from management on the breadth and scope of the issues, the Audit Committee in November 2015 authorized independent counsel and its forensic consulting firm to conduct an independent investigation. The investigation involved the interview of members of the Company’s finance staff as well as finance and non-finance staff of ADS Mexicana, in addition to a review of the financial and accounting records of the Company and ADS Mexicana related to the transactions in question. Upon concluding the investigation, it was determined by management, upon consultation with the Audit Committee’s advisors, that the various lease and services arrangements described above, as well as certain additional services arrangements with related parties identified during the course of the investigation, lacked commercial and economic substance or proper supporting documentation as to the services performed, and therefore were not appropriately reflected in the Company’s consolidated financial statements and that certain of those transactions should be either re-characterized by ADS Mexicana as dividends as opposed to expenses, or eliminated. These errors have been corrected in the restated consolidated financial statements, with these adjustments primarily impacting Other miscellaneous expense (income), net, Net income attributable to noncontrolling interest and Noncontrolling interest in subsidiaries.
Management also identified potential accounting errors related to ADS Mexicana’s revenue recognition cut-off practices which were reported by management to the Audit Committee and also investigated by the Audit Committee’s advisors. Specifically, the Company identified instances where ADS Mexicana recognized revenue prior to the date of shipment or transfer of title/ownership, which is not in accordance with GAAP. The investigation also found that the timing for when such errors occurred was irregular and in certain instances attributable to requests from ADS Mexicana customers that were not properly accounted for, resulting in timing differences between invoicing date and shipment date.
The Company also identified and corrected certain other errors related to the accounting for ADS Mexicana. These adjustments related to the increase of the allowance for doubtful accounts, errors related to the inventory costing methodology that were similar to the errors in the U.S. described above, and certain other miscellaneous items. The inventory errors related to the incorrect historical calculation of inventory costing based on the FIFO method and overhead costs.
Income Taxes and Other Accounting Adjustments
The Company recorded adjustments to income taxes to reflect the impact of the restatement adjustments, as well as discrete tax adjustments related to transfer pricing. See Note 21. Income Taxes for discussion of the related impact to our effective tax rate. The Company also identified and corrected certain other errors, all of which are insignificant individually and in the aggregate. The nature of the primary items besides income taxes in this category of adjustments is described as follows:
| • | The adjustments to the accrued liability for customer rebates are the result of the Company’s prior methodology not properly capturing all rebates due at period end. |
| • | The adjustments related to the Tuberias Tigre — ADS Limitada joint venture (“South American Joint Venture”) were primarily the result of an impairment of equipment in the fiscal year ended March 31, 2014 that was not identified until the time of a subsequent-year statutory audit. As a result, the Company has corrected its equity method accounting to properly reflect the impairment charge. |
F-22
Table of Contents
Impact on Consolidated Statements of Operations
The net effect of the restatement described above on the Company’s previously reported consolidated statements of operations for the years ended March 31, 2014 and 2013 is as follows:
| For the Year Ended March 31, 2014 | ||||||||||||||||||||||||||||
| Adjustments | ||||||||||||||||||||||||||||
| (Amounts in thousands, except per share data) |
As Previously Reported |
Leases | Inventory | Long-Lived Assets |
ADS Mexicana |
Income Taxes and Other |
As Restated | |||||||||||||||||||||
| Net sales |
$ | 1,069,009 | $ | — | $ | — | $ | — | $ | (1,129 | ) | $ | (100 | ) | $ | 1,067,780 | ||||||||||||
| Cost of goods sold |
856,118 | (1,223 | ) | 17,949 | (336 | ) | 830 | 472 | 873,810 | |||||||||||||||||||
|
|
|
|
|
|
|
|
|
|
|
|
|
|
|
|||||||||||||||
| Gross profit |
212,891 | 1,223 | (17,949 | ) | 336 | (1,959 | ) | (572 | ) | 193,970 | ||||||||||||||||||
| Operating expenses: |
||||||||||||||||||||||||||||
| Selling |
75,024 | (479 | ) | (344 | ) | 415 | (943 | ) | 369 | 74,042 | ||||||||||||||||||
| General and administrative |
78,478 | (393 | ) | (16,122 | ) | 284 | (1,820 | ) | (666 | ) | 59,761 | |||||||||||||||||
| Gain on disposal of assets or businesses |
(5,338 | ) | 1,852 | — | 623 | — | — | (2,863 | ) | |||||||||||||||||||
| Intangible amortization |
11,412 | — | — | (1,267 | ) | — | — | 10,145 | ||||||||||||||||||||
|
|
|
|
|
|
|
|
|
|
|
|
|
|
|
|||||||||||||||
| Income from operations |
53,315 | 243 | (1,483 | ) | 281 | 804 | (275 | ) | 52,885 | |||||||||||||||||||
| Other expense: |
||||||||||||||||||||||||||||
| Interest expense |
16,141 | 2,666 | — | — | — | — | 18,807 | |||||||||||||||||||||
| Other miscellaneous expense (income), net |
133 | — | — | (25 | ) | (1,200 | ) | (85 | ) | (1,177 | ) | |||||||||||||||||
|
|
|
|
|
|
|
|
|
|
|
|
|
|
|
|||||||||||||||
| Income before income taxes |
37,041 | (2,423 | ) | (1,483 | ) | 306 | 2,004 | (190 | ) | 35,255 | ||||||||||||||||||
| Income tax expense |
22,575 | — | — | — | — | (2,626 | ) | 19,949 | ||||||||||||||||||||
| Equity in net loss of unconsolidated affiliates |
1,592 | — | — | — | — | 1,494 | 3,086 | |||||||||||||||||||||
|
|
|
|
|
|
|
|
|
|
|
|
|
|
|
|||||||||||||||
| Net income |
12,874 | (2,423 | ) | (1,483 | ) | 306 | 2,004 | 942 | 12,220 | |||||||||||||||||||
| Less net income attributable to noncontrolling interest |
1,750 | — | — | — | 1,527 | 316 | 3,593 | |||||||||||||||||||||
|
|
|
|
|
|
|
|
|
|
|
|
|
|
|
|||||||||||||||
| Net income attributable to ADS |
11,124 | (2,423 | ) | (1,483 | ) | 306 | 477 | 626 | 8,627 | |||||||||||||||||||
|
|
|
|
|
|
|
|
|
|
|
|
|
|
|
|||||||||||||||
| Change in fair value of redeemable convertible preferred stock |
(3,979 | ) | — | — | — | — | — | (3,979 | ) | |||||||||||||||||||
| Dividends to redeemable convertible preferred stockholders |
(10,139 | ) | — | — | — | — | — | (10,139 | ) | |||||||||||||||||||
| Dividends paid to unvested restricted stockholders |
(418 | ) | — | — | — | — | — | (418 | ) | |||||||||||||||||||
|
|
|
|
|
|
|
|
|
|
|
|
|
|
|
|||||||||||||||
| Net loss available to common stockholders and participating securities |
(3,412 | ) | (2,423 | ) | (1,483 | ) | 306 | 477 | 626 | (5,909 | ) | |||||||||||||||||
| Undistributed income allocated to participating securities |
— | — | — | — | — | — | — | |||||||||||||||||||||
|
|
|
|
|
|
|
|
|
|
|
|
|
|
|
|||||||||||||||
| Net loss available to common stockholders |
$ | (3,412 | ) | $ | (2,423 | ) | $ | (1,483 | ) | $ | 306 | $ | 477 | $ | 626 | $ | (5,909 | ) | ||||||||||
|
|
|
|
|
|
|
|
|
|
|
|
|
|
|
|||||||||||||||
| Weighted average common shares outstanding: |
||||||||||||||||||||||||||||
| Basic |
47,277 | 47,277 | ||||||||||||||||||||||||||
| Diluted |
47,277 | 47,277 | ||||||||||||||||||||||||||
| Net loss per share: |
||||||||||||||||||||||||||||
| Basic |
$ | (0.07 | ) | $ | (0.12 | ) | ||||||||||||||||||||||
| Diluted |
$ | (0.07 | ) | $ | (0.12 | ) | ||||||||||||||||||||||
| Cash dividends declared per share |
$ | 1.68 | $ | 1.68 | ||||||||||||||||||||||||
F-23
Table of Contents
| For the Year Ended March 31, 2013 | ||||||||||||||||||||||||||||
| Adjustments | ||||||||||||||||||||||||||||
| (Amounts in thousands, except per share data) |
As Previously Reported |
Leases | Inventory | Long-Lived Assets |
ADS Mexicana |
Income Taxes and Other |
As Restated | |||||||||||||||||||||
| Net sales |
$ | 1,017,041 | $ | — | $ | — | $ | — | $ | (1,455 | ) | $ | 1,516 | $ | 1,017,102 | |||||||||||||
| Cost of goods sold |
807,730 | 1,522 | 18,089 | 1,292 | 452 | 56 | 829,141 | |||||||||||||||||||||
|
|
|
|
|
|
|
|
|
|
|
|
|
|
|
|||||||||||||||
| Gross profit |
209,311 | (1,522 | ) | (18,089 | ) | (1,292 | ) | (1,907 | ) | 1,460 | 187,961 | |||||||||||||||||
| Operating expenses: |
||||||||||||||||||||||||||||
| Selling |
69,451 | (548 | ) | (23 | ) | 99 | 266 | 2,560 | 71,805 | |||||||||||||||||||
| General and administrative |
67,712 | (504 | ) | (14,925 | ) | 87 | (1,728 | ) | (1,041 | ) | 49,601 | |||||||||||||||||
| Gain on disposal of assets or businesses |
(2,210 | ) | 240 | — | 1,019 | — | — | (951 | ) | |||||||||||||||||||
| Intangible amortization |
11,295 | — | — | (1,267 | ) | — | — | 10,028 | ||||||||||||||||||||
|
|
|
|
|
|
|
|
|
|
|
|
|
|
|
|||||||||||||||
| Income from operations |
63,063 | (710 | ) | (3,141 | ) | (1,230 | ) | (445 | ) | (59 | ) | 57,478 | ||||||||||||||||
| Other expense: |
||||||||||||||||||||||||||||
| Interest expense |
16,095 | 2,431 | — | — | — | — | 18,526 | |||||||||||||||||||||
| Other miscellaneous expense, net |
283 | — | — | — | (124 | ) | (56 | ) | 103 | |||||||||||||||||||
|
|
|
|
|
|
|
|
|
|
|
|
|
|
|
|||||||||||||||
| Income before income taxes |
46,685 | (3,141 | ) | (3,141 | ) | (1,230 | ) | (321 | ) | (3 | ) | 38,849 | ||||||||||||||||
| Income tax expense |
16,894 | — | — | — | — | (959 | ) | 15,935 | ||||||||||||||||||||
| Equity in net income of unconsolidated affiliates |
(387 | ) | — | — | — | — | 121 | (266 | ) | |||||||||||||||||||
|
|
|
|
|
|
|
|
|
|
|
|
|
|
|
|||||||||||||||
| Net income |
30,178 | (3,141 | ) | (3,141 | ) | (1,230 | ) | (321 | ) | 835 | 23,180 | |||||||||||||||||
| Less net income attributable to noncontrolling interest |
2,019 | — | — | — | (123 | ) | 624 | 2,520 | ||||||||||||||||||||
|
|
|
|
|
|
|
|
|
|
|
|
|
|
|
|||||||||||||||
| Net income attributable to ADS |
28,159 | (3,141 | ) | (3,141 | ) | (1,230 | ) | (198 | ) | 211 | 20,660 | |||||||||||||||||
|
|
|
|
|
|
|
|
|
|
|
|
|
|
|
|||||||||||||||
| Change in fair value of redeemable convertible preferred stock |
(5,869 | ) | — | — | — | — | — | (5,869 | ) | |||||||||||||||||||
| Dividends to redeemable convertible preferred stockholders |
(736 | ) | — | — | — | — | 1 | (735 | ) | |||||||||||||||||||
| Dividends paid to unvested restricted stockholders |
(52 | ) | — | — | — | — | — | (52 | ) | |||||||||||||||||||
|
|
|
|
|
|
|
|
|
|
|
|
|
|
|
|||||||||||||||
| Net income available to common stockholders and participating securities |
21,502 | (3,141 | ) | (3,141 | ) | (1,230 | ) | (198 | ) | 212 | 14,004 | |||||||||||||||||
| Undistributed income allocated to participating securities |
(2,042 | ) | 383 | 383 | 150 | 24 | (25 | ) | (1,127 | ) | ||||||||||||||||||
|
|
|
|
|
|
|
|
|
|
|
|
|
|
|
|||||||||||||||
| Net income available to common stockholders |
$ | 19,460 | $ | (2,758 | ) | $ | (2,758 | ) | $ | (1,080 | ) | $ | (174 | ) | $ | 187 | $ | 12,877 | ||||||||||
|
|
|
|
|
|
|
|
|
|
|
|
|
|
|
|||||||||||||||
| Weighted average common shares outstanding: |
||||||||||||||||||||||||||||
| Basic |
46,698 | 46,698 | ||||||||||||||||||||||||||
| Diluted |
47,249 | 47,249 | ||||||||||||||||||||||||||
| Net income per share: |
||||||||||||||||||||||||||||
| Basic |
$ | 0.42 | $ | 0.28 | ||||||||||||||||||||||||
| Diluted |
$ | 0.41 | $ | 0.27 | ||||||||||||||||||||||||
| Cash dividends declared per share |
$ | 0.10 | $ | 0.10 | ||||||||||||||||||||||||
F-24
Table of Contents
Impact on Consolidated Statements of Comprehensive Income
The net effect of the restatement described above on the Company’s previously reported consolidated statements of comprehensive income for the years ended March 31, 2014 and 2013 is as follows:
| For the Year Ended March 31, 2014 | ||||||||||||||||||||||||||||
| Adjustments | ||||||||||||||||||||||||||||
| (Amounts in thousands) | As Previously Reported |
Leases | Inventory | Long-Lived Assets |
ADS Mexicana |
Income Taxes and Other |
As Restated | |||||||||||||||||||||
| Net income |
$ | 12,874 | $ | (2,423 | ) | $ | (1,483 | ) | $ | 306 | $ | 2,004 | $ | 942 | $ | 12,220 | ||||||||||||
|
|
|
|
|
|
|
|
|
|
|
|
|
|
|
|||||||||||||||
| Comprehensive income |
6,468 | (2,423 | ) | (1,483 | ) | 296 | 1,959 | 412 | 5,229 | |||||||||||||||||||
|
|
|
|
|
|
|
|
|
|
|
|
|
|
|
|||||||||||||||
| Less other comprehensive loss attributable to noncontrolling interest, net of tax |
(1,285 | ) | — | — | — | (1 | ) | 44 | (1,242 | ) | ||||||||||||||||||
| Less net income attributable to noncontrolling interest |
1,750 | — | — | — | 1,527 | 316 | 3,593 | |||||||||||||||||||||
|
|
|
|
|
|
|
|
|
|
|
|
|
|
|
|||||||||||||||
| Total comprehensive income attributable to ADS |
$ | 6,003 | $ | (2,423 | ) | $ | (1,483 | ) | $ | 296 | $ | 433 | $ | 52 | $ | 2,878 | ||||||||||||
|
|
|
|
|
|
|
|
|
|
|
|
|
|
|
|||||||||||||||
| For the Year Ended March 31, 2013 | ||||||||||||||||||||||||||||
| Adjustments | ||||||||||||||||||||||||||||
| (Amounts in thousands) | As Previously Reported |
Leases | Inventory | Long-Lived Assets |
ADS Mexicana |
Income Taxes and Other |
As Restated | |||||||||||||||||||||
| Net income |
$ | 30,178 | $ | (3,141 | ) | $ | (3,141 | ) | $ | (1,230 | ) | $ | (321 | ) | $ | 835 | $ | 23,180 | ||||||||||
|
|
|
|
|
|
|
|
|
|
|
|
|
|
|
|||||||||||||||
| Comprehensive income |
31,895 | (3,141 | ) | (3,141 | ) | (1,232 | ) | (323 | ) | 1,725 | 25,783 | |||||||||||||||||
|
|
|
|
|
|
|
|
|
|
|
|
|
|
|
|||||||||||||||
| Less other comprehensive income attributable to noncontrolling interest, net of tax |
1,198 | — | — | — | (6 | ) | (33 | ) | 1,159 | |||||||||||||||||||
| Less net income attributable to noncontrolling interest |
2,019 | — | — | — | (123 | ) | 624 | 2,520 | ||||||||||||||||||||
|
|
|
|
|
|
|
|
|
|
|
|
|
|
|
|||||||||||||||
| Total comprehensive income attributable to ADS |
$ | 28,678 | $ | (3,141 | ) | $ | (3,141 | ) | $ | (1,232 | ) | $ | (194 | ) | $ | 1,134 | $ | 22,104 | ||||||||||
|
|
|
|
|
|
|
|
|
|
|
|
|
|
|
|||||||||||||||
F-25
Table of Contents
Impact on Consolidated Balance Sheet
The net effect of the restatement described above on the Company’s previously reported consolidated balance sheet as of March 31, 2014 is as follows:
| March 31, 2014 | ||||||||||||||||||||||||||||
| Adjustments | ||||||||||||||||||||||||||||
| (Amounts in thousands) | As Previously Reported |
Leases | Inventory | Long-Lived Assets |
ADS Mexicana |
Income Taxes and Other |
As Restated | |||||||||||||||||||||
| ASSETS |
||||||||||||||||||||||||||||
| Cash |
$ | 3,931 | $ | — | $ | — | $ | — | $ | — | $ | — | $ | 3,931 | ||||||||||||||
| Receivables, net |
150,713 | — | — | — | (3,404 | ) | 962 | 148,271 | ||||||||||||||||||||
| Inventories |
260,300 | (86 | ) | (4,270 | ) | (130 | ) | 2,475 | 1,602 | 259,891 | ||||||||||||||||||
| Deferred income taxes and other current assets |
13,555 | — | — | 343 | — | 567 | 14,465 | |||||||||||||||||||||
| Property, plant and equipment, net |
292,082 | 62,903 | — | (4,663 | ) | — | 29 | 350,351 | ||||||||||||||||||||
| Goodwill |
86,297 | — | — | 1,805 | — | (85 | ) | 88,017 | ||||||||||||||||||||
| Intangible assets, net |
66,184 | — | — | (6,991 | ) | — | 1 | 59,194 | ||||||||||||||||||||
| Other assets |
64,533 | (15 | ) | — | (5,759 | ) | — | 6,688 | 65,447 | |||||||||||||||||||
|
|
|
|
|
|
|
|
|
|
|
|
|
|
|
|||||||||||||||
| Total assets |
$ | 937,595 | $ | 62,802 | $ | (4,270 | ) | $ | (15,395 | ) | $ | (929 | ) | $ | 9,764 | $ | 989,567 | |||||||||||
|
|
|
|
|
|
|
|
|
|
|
|
|
|
|
|||||||||||||||
| LIABILITIES, MEZZANINE EQUITY AND STOCKHOLDERS’ DEFICIT |
|
|||||||||||||||||||||||||||
| Current maturities of debt obligations |
$ | 11,153 | $ | — | $ | — | $ | — | $ | — | $ | — | $ | 11,153 | ||||||||||||||
| Current maturities of capital lease obligations |
— | 12,364 | — | — | — | — | 12,364 | |||||||||||||||||||||
| Accounts payable |
108,111 | — | 704 | 88 | — | 2,069 | 110,972 | |||||||||||||||||||||
| Other accrued liabilities |
37,956 | 530 | — | — | — | 4,599 | 43,085 | |||||||||||||||||||||
| Accrued income taxes |
7,372 | — | — | — | — | 608 | 7,980 | |||||||||||||||||||||
| Long-term debt obligation |
442,895 | — | — | — | — | — | 442,895 | |||||||||||||||||||||
| Long-term capital lease obligation |
— | 34,366 | — | — | — | — | 34,366 | |||||||||||||||||||||
| Deferred tax liabilities |
69,169 | — | — | — | — | (2,836 | ) | 66,333 | ||||||||||||||||||||
| Other liabilities |
15,324 | 82 | — | — | — | 16,764 | 32,170 | |||||||||||||||||||||
|
|
|
|
|
|
|
|
|
|
|
|
|
|
|
|||||||||||||||
| Total liabilities |
691,980 | 47,342 | 704 | 88 | — | 21,204 | 761,318 | |||||||||||||||||||||
| Mezzanine equity |
642,951 | — | — | — | — | — | 642,951 | |||||||||||||||||||||
| Common stock |
11,957 | — | — | — | — | — | 11,957 | |||||||||||||||||||||
| Paid-in capital |
22,547 | — | — | — | — | (10,109 | ) | 12,438 | ||||||||||||||||||||
| Common stock in treasury, at cost |
(448,439 | ) | — | — | — | — | — | (448,439 | ) | |||||||||||||||||||
| Accumulated other comprehensive loss |
(5,977 | ) | — | — | (9 | ) | (541 | ) | (303 | ) | (6,830 | ) | ||||||||||||||||
| Retained earnings (deficit) |
— | 15,460 | (4,974 | ) | (15,474 | ) | (108 | ) | 2,684 | (2,412 | ) | |||||||||||||||||
| Noncontrolling interest in subsidiaries |
22,576 | — | — | — | (280 | ) | (3,712 | ) | 18,584 | |||||||||||||||||||
|
|
|
|
|
|
|
|
|
|
|
|
|
|
|
|||||||||||||||
| Total liabilities, mezzanine equity and stockholders’ deficit |
$ | 937,595 | $ | 62,802 | $ | (4,270 | ) | $ | (15,395 | ) | $ | (929 | ) | $ | 9,764 | $ | 989,567 | |||||||||||
|
|
|
|
|
|
|
|
|
|
|
|
|
|
|
|||||||||||||||
F-26
Table of Contents
Cumulative Effect of Prior Period Adjustments
The following table presents the impact of the restatement to the Company’s beginning retained earnings and other stockholders’ equity (deficit) balances, cumulatively to reflect adjustments booked to all periods prior to April 1, 2012:
| (Amounts in thousands) | Common Stock |
Paid in Capital |
Common stock in treasury |
Accumulated Other Comprehensive Income (Loss) |
Retained Earnings |
Total ADS Stockholders’ Equity (Deficit) |
Non-controlling interest in subsidiaries |
Total Stockholders’ Equity (Deficit) |
||||||||||||||||||||||||
| Stockholders’ equity (deficit), March 31, 2012 (as previously reported) |
$ | 11,957 | $ | 39,661 | $ | (449,583 | ) | $ | (1,375 | ) | $ | 110,863 | $ | (288,477 | ) | $ | 20,628 | $ | (267,849 | ) | ||||||||||||
| Adjustments from: |
||||||||||||||||||||||||||||||||
| Lease Accounting, before income tax effect |
— | — | — | — | 21,025 | 21,025 | — | 21,025 | ||||||||||||||||||||||||
| Inventory, before income tax effect |
— | — | — | — | (349 | ) | (349 | ) | — | (349 | ) | |||||||||||||||||||||
| Long-Lived Assets, before income tax effect |
— | — | — | 3 | (14,551 | ) | (14,548 | ) | — | (14,548 | ) | |||||||||||||||||||||
| ADS Mexicana, before income tax effect |
— | — | — | (500 | ) | (388 | ) | (888 | ) | (387 | ) | (1,275 | ) | |||||||||||||||||||
| All other non-income tax adjustments |
— | (1,006 | ) | — | (653 | ) | 1,061 | (598 | ) | (4,663 | ) | (5,261 | ) | |||||||||||||||||||
| Income tax adjustments |
— | — | — | — | (7,428 | ) | (7,428 | ) | — | (7,428 | ) | |||||||||||||||||||||
|
|
|
|
|
|
|
|
|
|
|
|
|
|
|
|
|
|||||||||||||||||
| Total adjustments |
— | (1,006 | ) | — | (1,150 | ) | (630 | ) | (2,786 | ) | (5,050 | ) | (7,836 | ) | ||||||||||||||||||
|
|
|
|
|
|
|
|
|
|
|
|
|
|
|
|
|
|||||||||||||||||
| Stockholders’ equity (deficit), March 31, 2012 (As Restated) |
$ | 11,957 | $ | 38,655 | $ | (449,583 | ) | $ | (2,525 | ) | $ | 110,233 | $ | (291,263 | ) | $ | 15,578 | $ | (275,685 | ) | ||||||||||||
|
|
|
|
|
|
|
|
|
|
|
|
|
|
|
|
|
|||||||||||||||||
F-27
Table of Contents
Impact on Consolidated Statements of Cash Flows
The net effect of the restatement on the Company’s previously reported consolidated statements of cash flows for the years ended March 31, 2014 and 2013 is as follows:
| For the Year Ended March 31, 2014 | ||||||||||||
| (Amounts in thousands) | As Previously Reported |
Adjustments | As Restated |
|||||||||
| Cash Flows from Operating Activities |
||||||||||||
| Net income |
$ | 12,874 | $ | (654 | ) | $ | 12,220 | |||||
| Depreciation and amortization |
55,898 | 7,776 | 63,674 | |||||||||
| Changes in working capital |
(36,037 | ) | (1,383 | ) | (37,420 | ) | ||||||
| All other adjustments to reconcile net income to net cash provided by operating activities |
29,387 | 4,549 | 33,936 | |||||||||
|
|
|
|
|
|
|
|||||||
| Net cash provided by operating activities |
62,122 | 10,288 | 72,410 | |||||||||
| Cash Flows from Investing Activities |
||||||||||||
| Net cash used in investing activities |
(41,767 | ) | 3,055 | (38,712 | ) | |||||||
|
|
|
|
|
|
|
|||||||
| Cash Flows from Financing Activities |
||||||||||||
| Payments on capital lease obligation |
— | (12,240 | ) | (12,240 | ) | |||||||
| All other financing activities |
(17,712 | ) | (1,157 | ) | (18,869 | ) | ||||||
|
|
|
|
|
|
|
|||||||
| Net cash used in financing activities |
(17,712 | ) | (13,397 | ) | (31,109 | ) | ||||||
|
|
|
|
|
|
|
|||||||
| Effect of exchange rate changes on cash |
(73 | ) | 54 | (19 | ) | |||||||
|
|
|
|
|
|
|
|||||||
| Net change in cash |
2,570 | — | 2,570 | |||||||||
| Cash at beginning of year |
1,361 | — | 1,361 | |||||||||
|
|
|
|
|
|
|
|||||||
| Cash at end of year |
$ | 3,931 | $ | — | $ | 3,931 | ||||||
|
|
|
|
|
|
|
|||||||
|
For the Year Ended March 31, 2013 |
||||||||||||
| (Amounts in thousands) | As Previously Reported |
Adjustments | As Restated |
|||||||||
| Cash Flows from Operating Activities |
||||||||||||
| Net income |
$ | 30,178 | $ | (6,998 | ) | $ | 23,180 | |||||
| Depreciation and amortization |
55,605 | 7,497 | 63,102 | |||||||||
| Changes in working capital |
(23,212 | ) | 9,895 | (13,317 | ) | |||||||
| All other adjustments to reconcile net income to net cash provided by operating activities |
5,644 | (3,256 | ) | 2,388 | ||||||||
|
|
|
|
|
|
|
|||||||
| Net cash provided by operating activities |
68,215 | 7,138 | 75,353 | |||||||||
| Cash Flows from Investing Activities |
||||||||||||
| Net cash used in investing activities |
(47,199 | ) | 2,403 | (44,796 | ) | |||||||
|
|
|
|
|
|
|
|||||||
| Cash Flows from Financing Activities |
||||||||||||
| Payments on capital lease obligation |
— | (9,342 | ) | (9,342 | ) | |||||||
| All other financing activities |
(21,737 | ) | (259 | ) | (21,996 | ) | ||||||
|
|
|
|
|
|
|
|||||||
| Net used in financing activities |
(21,737 | ) | (9,601 | ) | (31,338 | ) | ||||||
|
|
|
|
|
|
|
|||||||
| Effect of exchange rate changes on cash |
— | 60 | 60 | |||||||||
|
|
|
|
|
|
|
|||||||
| Net change in cash |
(721 | ) | — | (721 | ) | |||||||
| Cash at beginning of year |
2,082 | — | 2,082 | |||||||||
|
|
|
|
|
|
|
|||||||
| Cash at end of year |
$ | 1,361 | $ | — | $ | 1,361 | ||||||
|
|
|
|
|
|
|
|||||||
F-28
Table of Contents
Quarterly Financial Information
The net effect of the restatement on the Company’s previously reported consolidated financial statements as of and for the for the quarters ended June 30, September 30 and December 31, 2014 and 2013 (unaudited) can be found at Note 25. Quarterly Financial Information (Unaudited) to these financial statements and in the Forms 10-Q/A for the quarters ended June 30, 2014, September 30, 2014, and December 31, 2014 filed with the SEC concurrently with this Annual Report on Form 10-K.
| 3. | DISPOSAL OF ASSETS OR BUSINESSES |
On December 21, 2012, we entered into an agreement (the “Basalite Agreement”) to sell substantially all of the assets used in connection with our plastic edging product line to Basalite Concrete Products, LLC (“Basalite”) in exchange for cash and a note receivable. The Basalite Agreement defined the purchase price to consist of a cash payment of $600, plus other consideration in the form of an executed promissory note for $1,800. Under terms of the note, Basalite will pay ADS $600 cash on each of the first three one-year anniversaries of the closing date. The net book value for the related assets, consisting of inventory and property and equipment, was $190, resulting in a net gain recognized of $2,210. The sale transaction closed on December 28, 2012.
On June 28, 2013, we entered into an agreement (the “NDS Agreement”) to sell substantially all of the assets used in connection with our Draintech product line to National Diversified Sales, Inc. (“NDS”) in exchange for cash. The NDS Agreement defined the purchase price to consist of a cash payment of $5,877. The net book value for the related assets, consisting of inventory and property and equipment, was $1,029, resulting in a net gain recognized of $4,848. The sale transaction closed on June 28, 2013. The product line sold consisted of minor niche fittings which were manufactured by a third party producer and resold by the Company primarily in the retail market.
In the fourth quarter of fiscal year 2014, we completed the sale of two businesses that individually and in the aggregate were not significant. The aggregate sales price of these two transactions was $3,030, plus other consideration in the form of a note receivable for $1,241. The net book value of these businesses was $3,781, resulting in a net gain recognized of $490.
In the fourth quarter of fiscal year 2015, we completed the sale of product-related intellectual property rights that were not significant. The sales price was $750, consisting of a cash payment of $150 plus other consideration in the form of a note receivable for $600. The sale did not involve any tangible assets, and the related intellectual property rights had no net book value, resulting in a net gain recognized of $750.
Periodically, we will dispose of equipment, including equipment that we have accounted for as capital leases. The net loss on the disposition of the equipment was $1,112, $2,475 and $1,259 during the fiscal years 2015, 2014 and 2013, respectively.
| 4. | ACQUISITIONS |
In fiscal year 2013, we completed the acquisition of two businesses that individually and in the aggregate were not significant. The aggregate purchase price of these acquisitions was $5,239, which included a note payable of $400 plus additional contingent consideration with an initial estimated fair value of $1,271.
Ideal Pipe
The purchase price for business combinations is allocated to the estimated fair values of acquired tangible and intangible assets, assumed liabilities and goodwill, where applicable. We generally recognize customer relationships, trade names and non-competition agreements as identifiable intangible assets. The fair value of these intangible assets is determined primarily using the income approach, which involves significant unobservable inputs (Level 3 inputs). These inputs include projected sales, margin, required rate of return and tax rate. Trade name intangibles are valued utilizing a relief from royalty method.
F-29
Table of Contents
On January 30, 2015, Hancor of Canada, Inc., a wholly-owned subsidiary of the Company, acquired all issued and outstanding shares of Ideal Drain Tile Limited and Wave Plastics Inc., the sole partners of Ideal Pipe (together “Ideal Pipe”). Ideal Pipe designs, manufactures and markets high performance thermoplastic corrugated pipe and related water management products used across a broad range of Canadian end markets and applications, including nonresidential, residential, agriculture, and infrastructure applications. The acquisition further strengthens our position in Canada by increasing our size and scale in the market, as well as enhancing our manufacturing, marketing and distribution capabilities. The purchase price of Ideal Pipe was $43,828, financed through cash acquired and our existing line of credit facility. The results of operations of Ideal Pipe are included in our Consolidated Statements of Operations after January 30, 2015. The revenue and net income of Ideal Pipe since the acquisition date included in our Consolidated Statements of Operations for the fiscal year ended March 31, 2015 were immaterial.
The excess of the purchase price over the fair value of the net assets acquired of $10,660 was allocated to goodwill, assigned to the International segment, and consists primarily of the acquired workforce and synergies the two companies anticipate realizing as a combined company. None of the goodwill is deductible for tax purposes. The purchase price allocation is as follows:
| (Amounts in thousands) | ||||
| Cash |
$ | 7,443 | ||
| Other current assets |
9,036 | |||
| Property, plant and equipment |
27,258 | |||
| Goodwill and intangible assets |
18,890 | |||
| Current liabilities |
(12,721 | ) | ||
| Non-current liabilities |
(6,078 | ) | ||
|
|
|
|||
| Total purchase price |
$ | 43,828 | ||
|
|
|
|||
Transaction costs were immaterial. However, the Company did incur a loss on a currency hedge related to the purchase of Ideal Pipe in the amount of $5,636 which was recorded in Other miscellaneous expense (income), net in the Consolidated Statements of Operations. The Company used this currency hedge to fix the purchase price which was denominated in Canadian dollars from the agreement date until the transaction ultimately closed on January 30, 2015.
The acquired identifiable intangible assets represent customer relationships of $4,881 (seven-year useful life), trade name of $3,073 (10-year useful life), and non-compete agreements of $276 (three-year useful life).
The following table contains unaudited pro forma Consolidated Statements of Operations information assuming the acquisition occurred on April 1, 2013 and includes adjustments for amortization of intangibles, depreciation of fixed assets and interest expense. This pro forma information is presented for illustrative purposes only and is not indicative of what actual results would have been if the acquisitions had taken place on April 1, 2013 or of future results. In addition, the unaudited pro forma consolidated results are not projections of future results of operations of the combined company nor do they reflect the expected realization of any cost savings or synergies associated with the acquisition.
| Proforma | ||||||||
| (Amounts in thousands) | 2015 | 2014 | ||||||
| Net sales |
$ | 1,217,431 | $ | 1,102,477 | ||||
| Net income attributable to ADS |
$ | 10,329 | $ | 9,029 | ||||
Unaudited pro forma net income attributable to ADS has been calculated after adjusting the combined results of the Company to reflect additional intangible asset amortization expense, net of related income taxes, of $749 and $951, (reduced) additional depreciation expense, net of related income taxes, of ($7) and $354 and additional interest expense, net of related income taxes, of $513 and $521 for the fiscal years ended March 31, 2015 and 2014, respectively.
F-30
Table of Contents
Subsequent Event Related to the Acquisition of an Additional Interest in BaySaver
On July 17, 2015, ADS Ventures, Inc. (“ADS/V”), a wholly-owned subsidiary of the Company, acquired an additional 10% of the issued and outstanding membership interests in BaySaver Technologies, LLC (“BaySaver”), for a combined purchase price of $3,200, subject to certain additional post-closing purchase price payments. Concurrent with the acquisition, we also entered into an amendment to the BaySaver joint venture agreement to change the voting rights for the joint venture from an equal vote for each member to a vote based upon the ownership interest. As a result, the Company increased its ownership interest to 65% of the issued and outstanding membership interests in BaySaver and obtained the majority of the voting rights. BaySaver will be consolidated with our financial statements beginning in the second quarter of fiscal year 2016. See also Note 11. Investment in Unconsolidated Affiliates.
| 5. | PROPERTY, PLANT AND EQUIPMENT |
Property, plant and equipment, net as of the fiscal years ended March 31 consisted of the following:
| (Amounts in thousands) | 2015 | 2014 | ||||||
| Land, buildings and improvements |
$ | 177,073 | $ | 158,588 | ||||
| Machinery and equipment |
690,079 | 640,529 | ||||||
| Construction in progress |
5,991 | 11,003 | ||||||
|
|
|
|
|
|||||
| Total cost |
873,143 | 810,120 | ||||||
| Less accumulated depreciation |
(496,076 | ) | (459,769 | ) | ||||
|
|
|
|
|
|||||
| Property, plant and equipment, net |
$ | 377,067 | $ | 350,351 | ||||
|
|
|
|
|
|||||
The following table sets forth depreciation expense related to Property, plant and equipment in each of the fiscal years ending March 31:
| (Amounts in thousands) | 2015 | 2014 | 2013 | |||||||||
| Depreciation expense |
$ | 50,136 | $ | 48,230 | $ | 47,524 | ||||||
| 6. | LEASES |
Capital Leases
The Company leases certain buildings and transportation equipment including its fleet of trucks and trailers, under capital lease agreements.
Leased assets accounted for as capital leases and included in Property, plant and equipment consisted of the following:
| 2015 | 2014 | |||||||
| (Amounts in thousands) | ||||||||
| Buildings and improvements |
$ | 7,163 | $ | 7,716 | ||||
| Machinery and equipment |
168,437 | 145,980 | ||||||
|
|
|
|
|
|||||
| Total cost |
175,600 | 153,696 | ||||||
| Less accumulated depreciation |
(102,263 | ) | (89,599 | ) | ||||
|
|
|
|
|
|||||
| Leased assets in Property, plant and equipment, net |
$ | 73,337 | $ | 64,097 | ||||
|
|
|
|
|
|||||
The following sets forth the interest and depreciation expense related to capital leases recorded in each fiscal year ended March 31:
| 2015 | 2014 | 2013 | ||||||||||
| (Amounts in thousands) | ||||||||||||
| Lease interest expense |
$ | 2,249 | $ | 2,666 | $ | 2,431 | ||||||
| Depreciation of leased assets |
13,943 | 12,644 | 11,252 | |||||||||
F-31
Table of Contents
The following is a schedule by year of future minimum lease payments under capital leases and the present value of the net minimum lease payments as of March 31, 2015:
| (Amounts in thousands) | ||||
| 2016 |
$ | 18,373 | ||
| 2017 |
15,333 | |||
| 2018 |
12,093 | |||
| 2019 |
9,190 | |||
| 2020 |
6,600 | |||
| Thereafter |
7,206 | |||
|
|
|
|||
| Total minimum lease payments(a) |
$ | 68,795 | ||
| Less: amount representing interest(b) |
7,561 | |||
|
|
|
|||
| Present value of net minimum lease payments |
$ | 61,234 | ||
|
|
|
|||
| Lease obligation — Current |
15,731 | |||
| Lease obligation — Long-term |
45,503 | |||
|
|
|
|||
| Total lease obligation |
$ | 61,234 | ||
|
|
|
|||
| (a) | Excludes contingent rentals which may be paid. Contingent rentals amounted to $844 and $335 for the years ended March 31, 2015 and 2014, respectively. |
| (b) | Amount necessary to reduce minimum lease payments to present value calculated at the lower of the rate implicit in the lease or the Company’s incremental borrowing rate at lease inception. |
Certain leases contain residual value guarantees that create a contingent obligation on the part of the Company to compensate the lessor if the leased asset cannot be sold for an amount in excess of a specified minimum value at the conclusion of the lease term. The calculation is based on the original cost of the transportation equipment, less lease payments made, compared to a percentage of the transportation equipment’s fair market value at the time of sale. All leased units covered by this guarantee have been classified as capital leases and a corresponding capital lease obligation was recorded. Therefore, no further contingent obligation is needed.
Operating leases
We lease certain real estate and office equipment under various cancelable and non-cancelable operating lease agreements that expire at various dates through fiscal year 2037.
Future minimum rental commitments under operating leases as of March 31, 2015, are summarized below (amounts in thousands):
| 2016 | 2017 | 2018 | 2019 | 2020 | Thereafter | |||||||||||||||||||
| Future operating lease payments |
$ | 2,793 | $ | 1,857 | $ | 1,014 | $ | 614 | $ | 355 | $ | 2,222 | ||||||||||||
Total rent expense was $3,953, $3,836 and $4,968 in the fiscal years ended March 31, 2015, 2014 and 2013, respectively.
| 7. | INVENTORIES |
Inventories as of the fiscal years ended March 31 consisted of the following:
| (Amounts in thousands) | 2015 | 2014 | ||||||
| Raw materials |
$ | 50,198 | $ | 51,785 | ||||
| Finished goods |
219,644 | 208,106 | ||||||
|
|
|
|
|
|||||
| Total Inventories |
$ | 269,842 | $ | 259,891 | ||||
|
|
|
|
|
|||||
F-32
Table of Contents
We had no work-in-process inventories as of March 31, 2015 and 2014.
General and administrative costs related to the production process are capitalized in the cost of finished goods inventory. During fiscal years ended March 31, 2015 and 2014, we incurred production-related general and administrative costs of $17,257 and $15,617, respectively, of which $4,400 and $3,819 remained in inventory at March 31, 2015 and 2014, respectively.
| 8. | GOODWILL AND INTANGIBLE ASSETS |
Goodwill
The carrying amount of goodwill by reportable segment is as follows:
| (Amounts in thousands) | Domestic | International | Total | |||||||||
| Balance at April 1, 2013 |
$ | 87,507 | $ | 467 | $ | 87,974 | ||||||
| Currency translation |
— | 43 | 43 | |||||||||
|
|
|
|
|
|
|
|||||||
| Balance at March 31, 2014 |
$ | 87,507 | $ | 510 | $ | 88,017 | ||||||
|
|
|
|
|
|
|
|||||||
| Acquisition |
— | 10,660 | 10,660 | |||||||||
| Currency translation |
— | 2 | 2 | |||||||||
|
|
|
|
|
|
|
|||||||
| Balance at March 31, 2015 |
$ | 87,507 | $ | 11,172 | $ | 98,679 | ||||||
|
|
|
|
|
|
|
|||||||
Intangible Assets
Intangible assets as of the fiscal years ended March 31, 2015 and 2014 consisted of the following:
| 2015 | 2014 | |||||||||||||||||||||||
| (Amounts in thousands) | Gross Intangible |
Accumulated Amortization |
Net Intangible |
Gross Intangible |
Accumulated Amortization |
Net Intangible |
||||||||||||||||||
| Definite-lived intangible assets |
||||||||||||||||||||||||
| Developed technology |
$ | 40,579 | $ | (26,405 | ) | $ | 14,174 | $ | 40,579 | $ | (22,588 | ) | $ | 17,991 | ||||||||||
| Customer relationships |
43,167 | (26,113 | ) | 17,054 | 38,252 | (21,793 | ) | 16,459 | ||||||||||||||||
| Patents |
6,547 | (3,550 | ) | 2,997 | 6,175 | (2,921 | ) | 3,254 | ||||||||||||||||
| Non-compete and other contractual agreements |
1,365 | (691 | ) | 674 | 1,088 | (491 | ) | 597 | ||||||||||||||||
| Trademarks and tradenames |
14,248 | (3,051 | ) | 11,197 | 11,157 | (2,254 | ) | 8,903 | ||||||||||||||||
|
|
|
|
|
|
|
|
|
|
|
|
|
|||||||||||||
| Total definite-lived intangible assets |
105,906 | (59,810 | ) | 46,096 | 97,251 | (50,047 | ) | 47,204 | ||||||||||||||||
| Indefinite-lived intangible assets |
||||||||||||||||||||||||
| Trademarks |
11,959 | — | 11,959 | 11,990 | — | 11,990 | ||||||||||||||||||
|
|
|
|
|
|
|
|
|
|
|
|
|
|||||||||||||
| Total Intangible assets |
$ | 117,865 | $ | (59,810 | ) | $ | 58,055 | $ | 109,241 | $ | (50,047 | ) | $ | 59,194 | ||||||||||
|
|
|
|
|
|
|
|
|
|
|
|
|
|||||||||||||
The following table presents the weighted average amortization period for definite-lived intangible assets at March 31, 2015:
| Weighted Average Amortization Period (in years) |
||||
| Developed technology |
10.7 | |||
| Customer relationships |
8.3 | |||
| Patents |
8.3 | |||
| Non-compete and other contractual agreements |
5.1 | |||
| Trademarks and tradenames |
13.9 | |||
F-33
Table of Contents
The following table presents the future intangible asset amortization expense based on existing intangible assets at March 31, 2015:
| Fiscal Year | ||||||||||||||||||||||||||||
| (Amounts in thousands) | 2016 | 2017 | 2018 | 2019 | 2020 | Thereafter | Total | |||||||||||||||||||||
| Amortization expense |
$ | 8,249 | $ | 7,273 | $ | 6,745 | $ | 6,585 | $ | 4,899 | $ | 12,345 | $ | 46,096 | ||||||||||||||
| 9. | FAIR VALUE MEASUREMENT |
When applying fair value principles in the valuation of assets and liabilities, we are required to maximize the use of quoted market prices and minimize the use of unobservable inputs. The Company has not changed its valuation techniques used in measuring the fair value of any financial assets or liabilities during the fiscal years presented. Our fair value estimates take into consideration the credit risk of both the Company and our counterparties.
When active market quotes are not available for financial assets and liabilities, we use industry standard valuation models. Where applicable, these models project future cash flows and discount the future amounts to a present value using market-based observable inputs including credit risk, interest rate curves, foreign currency rates and forward and spot prices for currencies. In circumstances where market-based observable inputs are not available, management judgment is used to develop assumptions to estimate fair value. Generally, the fair value of our Level 3 instruments is estimated as the net present value of expected future cash flows based on internal and external inputs.
Recurring Fair Value Measurements
The assets, liabilities and mezzanine equity carried at fair value as of the fiscal years ended March 31 were as follows:
| March 31, 2015 | ||||||||||||||||
| (Amounts in thousands) | Total | Level 1 | Level 2 | Level 3 | ||||||||||||
| Assets: |
||||||||||||||||
| Derivative assets — currency forward contracts |
$ | 28 | $ | — | $ | 28 | $ | — | ||||||||
|
|
|
|
|
|
|
|
|
|||||||||
| Total assets at fair value on a recurring basis |
$ | 28 | $ | — | $ | 28 | $ | — | ||||||||
|
|
|
|
|
|
|
|
|
|||||||||
| Liabilities: |
||||||||||||||||
| Derivative liability — interest rate swaps |
$ | 765 | $ | — | $ | 765 | $ | — | ||||||||
| Derivative liability — diesel fuel contracts |
2,841 | — | 2,841 | — | ||||||||||||
| Derivative liability — propylene swaps |
5,142 | — | 5,142 | — | ||||||||||||
| Contingent consideration for acquisitions |
2,444 | — | — | 2,444 | ||||||||||||
|
|
|
|
|
|
|
|
|
|||||||||
| Total liabilities at fair value on a recurring basis |
$ | 11,192 | $ | — | $ | 8,748 | $ | 2,444 | ||||||||
|
|
|
|
|
|
|
|
|
|||||||||
F-34
Table of Contents
| March 31, 2014 | ||||||||||||||||
| (Amounts in thousands) | Total | Level 1 | Level 2 | Level 3 | ||||||||||||
| Assets: |
||||||||||||||||
| Derivative assets — propylene swaps |
$ | 27 | $ | — | $ | 27 | $ | — | ||||||||
|
|
|
|
|
|
|
|
|
|||||||||
| Total assets at fair value on a recurring basis |
$ | 27 | $ | — | $ | 27 | $ | — | ||||||||
|
|
|
|
|
|
|
|
|
|||||||||
| Liabilities & Mezzanine Equity: |
||||||||||||||||
| Derivative liability — interest rate swaps |
$ | 1,001 | $ | — | $ | 1,001 | $ | — | ||||||||
| Contingent consideration for acquisitions |
2,898 | — | — | 2,898 | ||||||||||||
| Redeemable common stock |
549,119 | — | — | 549,119 | ||||||||||||
| Redeemable convertible preferred stock |
291,720 | — | — | 291,720 | ||||||||||||
| Deferred compensation — unearned ESOP shares |
(197,888 | ) | — | — | (197,888 | ) | ||||||||||
|
|
|
|
|
|
|
|
|
|||||||||
| Total liabilities & mezzanine equity at fair value on a recurring basis |
$ | 646,850 | $ | — | $ | 1,001 | $ | 645,849 | ||||||||
|
|
|
|
|
|
|
|
|
|||||||||
Amounts recorded in the Consolidated Statements of Operations for Level 3 items amounted to $283 and $8,963 during 2015 and 2014, respectively.
| Quantitative Information about Level 3 Fair Value Measurements |
||||||||||||
| (Amounts in thousands) | ||||||||||||
| Liabilities & Mezzanine Equity |
Fair Value at 3/31/15 |
Valuation |
Unobservable Input | Quantifiable Input |
||||||||
| Contingent consideration for acquisitions |
$ | 2,444 | Discounted cash flow | Weighted Average Cost of Capital (“WACC”)(a) |
10 | % | ||||||
| Liabilities & Mezzanine Equity |
Fair Value at 3/31/14 |
Valuation |
Unobservable Input | Quantifiable Input |
||||||||
| Contingent consideration for acquisitions |
$ | 2,898 | Discounted cash flow | WACC(a) | 11 | % | ||||||
| Redeemable common stock |
$ | 549,119 | Guideline company method and Discounted cash flow | Implied pricing multiples (b) |
10.5x | |||||||
| Guideline public company group (c) |
n/a | |||||||||||
| WACC(a) | 11 | % | ||||||||||
| Redeemable convertible preferred stock |
$ | 291,720 | Guideline company method and Discounted cash flow | Implied pricing multiples (b) |
10.5x | |||||||
| Guideline public company group (c) |
n/a | |||||||||||
| WACC (a) | 11 | % | ||||||||||
| Deferred compensation — unearned ESOP shares |
$ | (197,888 | ) | Guideline company method and Discounted cash flow | Implied pricing multiples (b) |
10.5x | ||||||
| Guideline public company group (c) |
n/a | |||||||||||
| WACC (a) | 11 | % | ||||||||||
| (a) | Represents discount rates or rates of return estimates and assumptions that we believe would be used by market participants when valuing these liabilities and mezzanine equity. |
F-35
Table of Contents
| (b) | Represents financial metrics used to estimate the value of comparable companies including EBIT and EBITDA. |
| (c) | Represents a group of public companies deemed similar from a risk and return prospective and reflect economic conditions and business risk for the Company’s industry in general. |
Changes in the fair value of recurring fair value measurements using significant unobservable inputs (Level 3) for the fiscal years ended March 31, 2015 and 2014 were as follows:
| (Amounts in thousands) | Contingent consideration |
Redeemable common stock |
Redeemable convertible preferred stock |
Deferred compensation - unearned ESOP shares |
Total | |||||||||||||||
| Balance at March 31, 2013 |
$ | 2,679 | $ | 522,276 | $ | 282,547 | $ | (196,477 | ) | $ | 611,025 | |||||||||
| Allocation of ESOP shares to participants |
— | — | — | 8,211 | 8,211 | |||||||||||||||
| Change in fair value |
738 | 26,458 | 13,601 | (9,622 | ) | 31,175 | ||||||||||||||
| Payments of contingent consideration liability |
(519 | ) | — | — | — | (519 | ) | |||||||||||||
| Redemption of Redeemable convertible preferred stock |
— | — | (4,428 | ) | — | (4,428 | ) | |||||||||||||
| Transfer to Level 3 |
— | 385 | — | — | 385 | |||||||||||||||
|
|
|
|
|
|
|
|
|
|
|
|||||||||||
| Balance at March 31, 2014 |
$ | 2,898 | $ | 549,119 | $ | 291,720 | $ | (197,888 | ) | $ | 645,849 | |||||||||
| Allocation of ESOP shares to participants |
— | — | — | 4,391 | 4,391 | |||||||||||||||
| Change in fair value |
174 | 65,921 | 34,903 | (23,849 | ) | 77,149 | ||||||||||||||
| Payments of contingent consideration liability |
(628 | ) | — | — | — | (628 | ) | |||||||||||||
| Transfer out of Level 3 |
— | (615,040 | ) | (326,623 | ) | 217,346 | (724,317 | ) | ||||||||||||
|
|
|
|
|
|
|
|
|
|
|
|||||||||||
| Balance at March 31, 2015 |
$ | 2,444 | $ | — | $ | — | $ | — | $ | 2,444 | ||||||||||
|
|
|
|
|
|
|
|
|
|
|
|||||||||||
During fiscal year 2015 our Redeemable common stock transferred out of Level 3, as these securities started actively trading on the NYSE during the second quarter of fiscal 2015. In addition, our Redeemable convertible preferred stock and Deferred compensation – unearned ESOP shares were reclassified from a recurring Level 3 fair value measurement to a non-recurring Level 3 fair value measurement as a result of the IPO. See Note 1. Background and Summary of Significant Accounting Policies for further information on the IPO. There were no further transfers in or out of Levels 1, 2 and 3 for the fiscal year ended March 31, 2015 and 2014.
Valuation of our Contingent Consideration for Acquisitions
The fair values of the contingent consideration payables were calculated with reference to the estimated future value of the Inserta Tee and FleXstorm businesses, which are based on a discounted cash flow model. The undiscounted value is discounted to the present value using a market discount rate. The method used to price this liability is considered Level 3, due to the subjective nature of the unobservable inputs used to determine the fair value.
Valuation of our Redeemable Common Stock
Prior to the IPO in fiscal 2015, the Company had certain shares of common stock outstanding allowing the holder to put its shares to us for cash. This Redeemable common stock was historically recorded at its fair value in the mezzanine equity section of our Consolidated Balance Sheets and changes in fair value were recorded in Retained earnings. Historically, the fair value of a share of common stock was determined by management by applying industry appropriate multiples to EBITDA and performing a discounted cash flow analysis. Under the industry-appropriate multiples approach, to arrive at concluded multiples, we considered differences between the risk and return characteristics of ADS and the guideline companies. Under the discounted cash flow analysis, the cash flows expected to be generated by the Company are discounted to
F-36
Table of Contents
their present value equivalent using a rate of return that reflects the relative risk of an investment in ADS, as well as the time value of money. This return is an overall rate based upon the individual rates of return for invested capital (equity and interest-bearing debt). The return, known as the WACC, is calculated by weighting the required returns on interest-bearing debt and common stock in proportion to their estimated percentages in an expected capital structure. An increase in the WACC would decrease the fair value of the Redeemable common stock. The categorization of the framework used to price this mezzanine equity is considered Level 3, due to the subjective nature of the unobservable inputs used to determine the fair value.
The redemption feature of our Redeemable common stock allowing the holder to put its shares to us for cash, as discussed in the previous paragraph, became unenforceable upon effectiveness of the IPO on July 25, 2014. As a result, the Redeemable common stock was recorded at fair value through the effective date of the IPO and was subsequently reclassified at that fair value to stockholders’ equity. See Note 1 for more information on the IPO.
Non-recurring Fair Value Measurements
Valuation of our Redeemable Convertible Preferred Stock
Prior to the effective date of the IPO, the Trustee of the Company’s ESOP had the ability to put the shares of our Redeemable convertible preferred stock to the Company. Our Redeemable convertible preferred stock is recorded at its fair value in the mezzanine equity section of our Consolidated Balance Sheets and changes in fair value are recorded in Retained earnings or as a reduction of Paid in capital to the extent there is not sufficient Retained earnings. Accordingly, we estimated the fair value of the Redeemable convertible preferred stock through estimating the fair value of the Company’s common stock and applying certain adjustments including for the fair value of the total dividends to be received and assuming conversion of the Redeemable convertible preferred stock to common stock at the stated conversion ratio per our Certificate of Incorporation. The categorization of the framework used to price this temporary equity is considered Level 3, due to the subjective nature of the unobservable inputs used to determine the fair value.
Upon the effective date of the IPO, the redemption feature of our Redeemable convertible preferred stock allowing the Trustee of the Company’s ESOP to put shares to us for cash was no longer applicable. However, if our common stock, which our Redeemable convertible preferred stock may convert to, is no longer a “registration-type class of security” (e.g., in the event of a delisting), the option held by the Trustee, which granted it the ability to put the shares of our Redeemable convertible preferred stock to us, would then become applicable. Preferred securities that become redeemable upon a contingent event that is not solely within the control of the Company should be classified outside of permanent equity. As of March 31, 2015, the Company has determined that it is not probable that the redemption feature will become applicable. Since the Redeemable convertible preferred stock is not currently redeemable and it is not probable that the instrument will become redeemable, subsequent adjustment to fair value is not required. As such, the Redeemable convertible preferred stock was recorded to fair value at the effective date of the IPO on July 25, 2014 and will remain in mezzanine equity without further adjustment to carrying value unless it becomes probable that the redemption feature will become applicable. See Note 1. Background and Summary of Significant Accounting Policies for more information on the IPO and Note 19. Mezzanine Equity for additional information on the Redeemable common stock and Redeemable convertible preferred stock.
| 10. | ADS MEXICANA |
We participate in joint ventures from time to time for the purpose of expanding upon our growth of manufacturing and selling HDPE corrugated pipe in emerging markets. We invested in ADS Mexicana for the purpose of expanding upon our growth of manufacturing and selling ADS licensed HDPE corrugated pipe and related products in the Mexican and Central American markets via the joint venture partner’s local
F-37
Table of Contents
presence and expertise throughout the region. In April 2013, ADS Worldwide acquired an additional 1% equity interest in its consolidated subsidiary ADS Mexicana stock for $520, increasing the Company’s ownership percentage to 51% from 50%. We have executed a Technology, Patents and Trademarks Sub-License Agreement and a Distribution Agreement with ADS Mexicana that provides ADS Mexicana with the rights to manufacture and sell ADS licensed products in Mexico and Central America. We have concluded that we hold a variable interest in and are the primary beneficiary of ADS Mexicana based on our power to direct the most significant activities of ADS Mexicana and our obligation to absorb losses and our right to receive benefits that could be significant to ADS Mexicana. As the primary beneficiary, we are required to consolidate the assets and liabilities of ADS Mexicana. The equity owned by our joint venture partner is shown as Noncontrolling interest in subsidiaries in our Consolidated Balance Sheets and our joint venture partner’s portion of net income is shown as Net income attributable to noncontrolling interest in our Consolidated Statements of Operations.
The table below includes the assets and liabilities of ADS Mexicana that are consolidated as of March 31, 2015 and 2014. The balances exclude intercompany transactions that are eliminated upon consolidation.
| (Amounts in thousands) | 2015 | 2014 | ||||||
| Assets |
||||||||
| Current assets |
$ | 24,822 | $ | 32,877 | ||||
| Property, plant and equipment, net |
18,556 | 21,633 | ||||||
| Other noncurrent assets |
2,523 | 3,378 | ||||||
|
|
|
|
|
|||||
| Total assets |
$ | 45,901 | $ | 57,888 | ||||
|
|
|
|
|
|||||
| Liabilities |
||||||||
| Current liabilities |
$ | 11,134 | $ | 11,595 | ||||
| Noncurrent liabilities |
5,259 | 7,020 | ||||||
|
|
|
|
|
|||||
| Total liabilities |
$ | 16,393 | $ | 18,615 | ||||
|
|
|
|
|
|||||
| 11. | INVESTMENT IN UNCONSOLIDATED AFFILIATES |
We participate in three unconsolidated joint ventures, South American Joint Venture, which is 50% owned by our wholly-owned subsidiary ADS Chile; BaySaver, which is 55% owned by our wholly-owned subsidiary ADS Ventures, Inc.; and Tigre-ADS USA, Inc. (“Tigre-ADS USA”), which is 49% owned by our wholly-owned subsidiary ADS Ventures, Inc. In each case, the Company has concluded that it is appropriate to account for these investments using the equity method, whereby our share of the income or loss of the joint venture is reported in the Consolidated Statements of Operations under Equity in net loss (income) of unconsolidated affiliates and our investment in the joint venture is included in Other assets in the Consolidated Balance Sheets.
South American Joint Venture
Our investment in this unconsolidated joint venture was formed for the purpose of expanding upon our growth of manufacturing and selling HDPE corrugated pipe in the South American market via the joint venture partner’s local presence and expertise throughout the region. We are not required to consolidate the South American Joint Venture as we are not the primary beneficiary, although we do hold a significant variable interest in the South American Joint Venture through our equity investment and debt guarantee. Summarized financial data, which includes capital contributions of $4,000 and $2,875 during 2015 and 2014, respectively, as of the fiscal years ended March 31 for the South American Joint Venture is as follows:
| (Amounts in thousands) | 2015 | 2014 | ||||||
| Investment in the South American Joint Venture |
$ | 17,081 | $ | 18,422 | ||||
| Receivable from the South American Joint Venture |
5,607 | 8,313 | ||||||
F-38
Table of Contents
BaySaver
On July 15, 2013, ADS Ventures, Inc., a wholly-owned subsidiary of the Company, BaySaver Technologies, Inc. (“BTI”) and Mid Atlantic Storm Water Research Center, Inc. (“MASWRC”) entered into an LLC agreement to form a new joint venture, BaySaver. The joint venture was established to design, engineer, manufacture, market and sell water quality filters and separators used in the removal of sediment and pollution from storm water anywhere in the world except New Zealand, Australia and South Africa. The Company contributed $3,500 in cash, $1,285 in inventory, and other intangible assets with no carrying value, in exchange for a 55% equity interest and a 50% voting interest in BaySaver. We are not required to consolidate BaySaver under ASC 810-10 as we are not the primary beneficiary, although we do hold a significant variable interest in BaySaver through our equity investment. In connection with this investment, the Company acquired a call option to purchase the remaining 45% interest in BaySaver. Also, in connection with the investment, the Company granted a put option enabling the other equity holder to sell his remaining shares in BaySaver to the Company upon the passage of time or the occurrence of certain events.
Summarized financial data as of the fiscal years ended March 31 for the BaySaver joint venture is as follows:
| (Amounts in thousands) | 2015 | 2014 | ||||||
| Investment in BaySaver |
$ | 4,906 | $ | 5,202 | ||||
| Receivable from BaySaver |
59 | 6 | ||||||
Our share of the income of this joint venture is decreased by amortization expense relating to the basis difference between our cost basis in the investment and the basis reflected at the joint venture level. This basis difference is being recorded over the lives of the underlying assets which gave rise to the basis difference, which is 10 years. The unamortized basis difference as of March 31, 2015 is $1,639.
As noted in Note 4, in July 2015, we acquired an additional 10% interest in BaySaver and entered into Amendment No. 1 to BaySaver Technologies, LLC Limited Liability Company Agreement dated as of July 17, 2015 by and among ADS Ventures, Inc., BaySaver Technologies, Inc. and Mid-Atlantic Storm Water Research Center, Inc. (“BaySaver amendment”) which revised the voting rights for BaySaver. As a result, we now have more than 50% of the voting rights, in addition to owning 65% of the equity in BaySaver, and will be required to consolidate the assets and liabilities of BaySaver subsequent to the date of our additional investment and BaySaver amendment in July 2015.
Tigre-ADS USA
On April 7, 2014, ADS Ventures, Inc., a wholly-owned subsidiary of the Company, and Tigre S.A. — Tubos e Conexoes entered into a stock purchase agreement to form a joint venture, Tigre-ADS USA. The joint venture was established to manufacture and sell PVC fittings for waterworks, plumbing, and HVAC applications primarily in the United States and Canadian markets. The Company acquired 49% of the outstanding shares of capital stock of Tigre-ADS USA for $3,566. The joint venture represents a continuation of the existing activities of Tigre-ADS USA through its Janesville, Wisconsin manufacturing facility. We are not required to consolidate Tigre-ADS USA under ASC 810-10 as we are not the primary beneficiary, although we do hold a significant variable interest in Tigre-ADS USA through our equity investment.
Summarized financial data as of the fiscal year ended March 31 for the Tigre-ADS USA joint venture is as follows:
| (Amounts in thousands) | 2015 | |||
| Investment in Tigre-ADS USA |
$ | 3,051 | ||
| Receivable from Tigre-ADS USA |
27 | |||
F-39
Table of Contents
| 12. | RELATED PARTY TRANSACTIONS |
ADS Mexicana
ADS conducts business in Mexico and Central America through its joint venture ADS Mexicana. ADS owns 51% of the outstanding stock of ADS Mexicana and consolidates its interest in ADS Mexicana for financial reporting purposes. During the year ended March 31, 2015 and 2014, ADS Mexicana compensated certain owners and former owners of Grupo Altima, the JV partner of ADS Mexicana, for consulting services related to the operations of the business and a noncompete arrangement, respectively. These cash payments totaled $459, $817, and $0 for the fiscal years ended March 31, 2015, 2014 and 2013, respectively.
Occasionally, ADS and ADS Mexicana jointly enter into agreements for pipe sales with their related parties which totaled $3,783, $6,687, $3,370 in the years ended March 31, 2015, 2014 and 2013, respectively. Outstanding receivables related to these sales were $1,005 and $2,480 at March 31, 2015 and 2014, respectively. In February 2015, ADS Mexicana loaned $5,000 to an entity owned by a Grupo Altima owner and such loan was repaid the same month. The applicable interest rate for the loan was 2.35%.
We are the guarantor of 100% of ADS Mexicana’s credit facility and our maximum potential payment under this guarantee totals $12,000. See Note 13. Debt.
South American Joint Venture
Our South American Joint Venture manufactures and sells HDPE corrugated pipe in the South American market. We are the guarantor for 50% of the South American Joint Venture’s credit facility, and the debt guarantee is shared equally with the joint venture partner. Our maximum potential obligation under this guarantee totals $11,000 as of March 31, 2015. The maximum borrowing permitted under the South American Joint Venture’s credit facility is $19,000. This credit facility allows borrowings in either Chilean pesos or US dollars at a fixed interest rate determined at inception of each draw on the facility. The guarantee of South American Joint Venture’s debt is for the life of the credit facility which matures on February 5, 2017. ADS does not anticipate any required contributions related to the balance of this credit facility. As of March 31, 2015 and 2014, the outstanding principal balance of the credit facility including letters of credit was $13.6 million and $11.1 million, respectively. The weighted average interest rate as of March 31, 2015 was 3.33% on U.S. dollar denominated loans and 7.54% on Chilean peso denominated loans.
ADS and the South American Joint Venture have entered into shared services arrangements in order to execute the joint venture services. Included within these arrangements are the lease of an office and plant location used to conduct business and operating expenses related to these leased facilities. Occasionally, ADS and the South American Joint Venture jointly enter into agreements for pipe sales with their related parties in immaterial amounts.
BaySaver
At March 31, 2015, ADS holds an equity method investment in BaySaver of approximately 55%. BaySaver may at times provide short-term financing to ADS to enhance liquidity. As of March 31, 2015 and 2014, BaySaver held unsecured, interest-free, notes receivable from ADS in the amounts of $500 and $400, which were fully paid subsequent to year end.
During 2015, ADS received dividends of $1,100 from BaySaver.
ADS and BaySaver have entered into shared services arrangements in order to execute the joint venture services. Included within these arrangements are the lease of a plant and adjacent yard used to conduct business and operating expenses related to the leased facility. Occasionally, ADS and BaySaver jointly enter into agreements for sales of pipe and Allied Products with their related parties in immaterial amounts.
F-40
Table of Contents
| 13. | DEBT |
Long-term debt as of the fiscal years ended March 31 consisted of the following:
| (Amounts in thousands) | 2015 | 2014 | ||||||
| Bank Term Loans |
||||||||
| Revolving Credit Facility — ADS |
$ | 205,100 | $ | 248,100 | ||||
| Revolving Credit Facility — ADS Mexicana |
— | — | ||||||
| Term Note |
91,250 | 97,500 | ||||||
| Senior Notes payable |
100,000 | 100,000 | ||||||
| Mortgage notes payable |
— | 3,733 | ||||||
| Industrial revenue bonds |
3,545 | 4,715 | ||||||
| Total |
399,895 | 454,048 | ||||||
| Current maturities |
(9,580 | ) | (11,153 | ) | ||||
|
|
|
|
|
|||||
| Long-term debt obligation |
$ | 390,315 | $ | 442,895 | ||||
|
|
|
|
|
|||||
Bank Term Loans
The Bank Term Loans include a Revolving Credit Facility with borrowing capacity of $325,000 for ADS, Inc., a Revolving Credit Facility for ADS Mexicana with borrowing capacity of $12,000 (“the Revolving Credit Facilities”) and a $100,000 term note (“Term Note”). The Revolving Credit Facilities expire and the Term Note is due in June 2018. The Revolving Credit Facilities and the Term Note have a variable interest rate that depends upon the Company’s “pricing ratio” as defined in the agreements for the Revolving Credit Facilities. The interest rate is derived from the London Inter-Bank Offered Rate (“LIBOR”) or alternate base rate (“Prime Rate”) at the Company’s option. The average rates were 2.64%, 2.30% and 3.01% at March 31, 2015, 2014 and 2013, respectively. Letters of credit outstanding at March 31, 2015 amounted to $8,005 and reduce the availability of the Revolving Credit Facilities. The amount available for borrowing for ADS, Inc. and ADS Mexicana was $111,895 and $12,000, respectively at March 31, 2015.
Per the terms of the agreements for the Revolving Credit Facilities, ADS is not required to hedge its interest exposure using interest rate swaps; however, it is currently the objective of ADS to manage its exposure to variable rate debt. On July 18, 2013, ADS executed two Forward Interest Rate Swaps on the 30-Day LIBOR interest rate. One swap was for $50,000 and has a fixed rate of 0.86% for a period of three years beginning on September 3, 2013 and expiring on September 1, 2016. The second swap executed on July 18, 2013 was for $50,000 and has a fixed rate of 1.08% for a period of two years beginning on September 2, 2014 and expiring on September 1, 2016.
Senior Notes Payable
In December 2009, we signed an agreement with Prudential Investment Management, Inc. for the issuance of senior promissory notes (“Senior Notes”), for an aggregate amount of up to $100,000. During fiscal 2010, we issued $75,000 of Senior Notes with interest fixed at 5.6% and payable quarterly. The rate is subject to an additional 200 basis point excess leverage fee if our calculated leverage ratio exceeds 3 to 1 at the end of a fiscal quarter. A principal payment of $25,000 is due in each of fiscal years 2017, 2018, and 2019.
In July 2013, ADS issued an additional $25,000 of Senior Notes. Interest for the additional $25,000 is payable quarterly and is fixed at 4.05%. The rate is subject to an additional 200 basis point excess leverage fee if calculated leverage ratio exceeds 3 to 1 at the end of a fiscal quarter. A principal payment of $25,000 is due in September of fiscal year 2020.
At March 31, 2015, our calculated leverage ratio exceeded 3 to 1, and we have accrued the excess leverage fee of $500.
F-41
Table of Contents
Mortgage Notes Payable
Two mortgage notes outstanding at March 31, 2014 were fully paid during 2015 through scheduled monthly installments. As of March 31, 2014, one note had a variable interest rate of 2.903% (New Miami, Ohio), and the other note had a fixed rate of 5.1% (Hilliard, Ohio). Land and buildings with a net book value of approximately $8,637 at March 31, 2014, collateralized the two mortgage notes.
Industrial Revenue Bonds
Between 1996 and 2007, ADS issued industrial revenue bonds for the construction of four production facilities. Two of the bonds were retired during fiscal 2011 and one of the bonds was retired in fiscal 2015. The remaining bond has a variable interest rate based on the Securities Industry and Financial Markets Association (SIFMA) municipal swap index rate which is computed weekly. The rate on this bond at March 31, 2015, was 3.32%, including a letter of credit fee of 3.25%. Land and buildings with a net book value of approximately $9,997 at March 31, 2015, collateralize the bonds. These bonds are not considered auction rate securities.
ADS Mexicana Short Term Credit Facility
On December 11, 2014, ADS Mexicana entered into a short-term credit facility arrangement with Scotiabank Inverlat, S.A. (“Scotiabank”). The facility matures in 12 months and has a borrowing capacity of $5 million or an equivalent amount in Mexican pesos, not to exceed 72.5 million pesos. The interest rate for the dollar borrowings is variable and is derived from the LIBOR. The interest rate for peso borrowings is also variable and is derived from the Interbank Equilibrium Interest Rate (“T.I.I.E.”). There were no outstanding borrowings on this facility at March 31, 2015.
Debt Covenants and Dividend Restrictions
The Bank Term Loans and the Senior Notes require, among other provisions, that we (1) maintain a 1.25 to 1 minimum fixed charge coverage ratio; (2) maintain a maximum leverage ratio of 4 to 1; and (3) establish certain limits on permitted transactions, principally related to indebtedness, capital distributions, loans and investments, and acquisitions and dispositions of assets. Capital distributions, including dividends, are prohibited if we are not in compliance with our debt covenants. In any fiscal year, if we are in compliance with all debt covenants and the pro-forma leverage ratio exceeds 3 to 1, capital distributions are permitted up to a limit of $50,000.
Principal Maturities
Maturities of long-term debt (excluding interest) as of March 31, 2015 are summarized below:
| Fiscal Years Ending March 31, | ||||||||||||||||||||||||||||
| (Amounts in thousands) | 2016 | 2017 | 2018 | 2019 | 2020 | Thereafter | Total | |||||||||||||||||||||
| Principal maturities |
$ | 9,580 | $ | 35,870 | $ | 35,905 | $ | 293,540 | $ | 25,000 | $ | — | $ | 399,895 | ||||||||||||||
Subsequent Events Related to the Bank Term Loans and Senior Notes
In July 2015, the Company obtained consents from the requisite holders of its Bank Term Loans and its Senior Notes to waive certain actual and potential covenant violations. Specifically, the covenant violations were the result of the fact that the Company had not delivered its fiscal 2015 audited financial statements within 90 days of March 31, 2015, and did not expect to be able to file its first quarter fiscal 2016 quarterly financial statements within 45 days of June 30, 2015. The consents extended the time for delivery of the fiscal 2015 audited financial statements and the first quarter fiscal 2016 quarterly financial statements to
F-42
Table of Contents
September 30, 2015, whereby an event of default was waived as long as those financial statements were delivered within the thirty day grace period after September 30, 2015.
In August 2015, the Company entered into amended agreements related to the Bank Term Loans and Senior Notes in connection with the Company’s determination that a substantial portion of its transportation and equipment leases should be treated as capital leases rather than as operating leases, as discussed in Note 2. Restatement of Previously Issued Financial Statements. The material terms of each amended agreement modify certain definitions applicable to the Company’s affirmative and negative financial covenants, including the minimum fixed charge coverage ratio, the maximum leverage ratio, and the limits on indebtedness, to accommodate the Company’s treatment of its transportation and equipment leases as capital leases rather than operating leases, along with corresponding changes to the provisions outlining the application of GAAP in the definition of accounting terms used in various financial covenants. The amendments also waive any potential event of default that may exist under any of the respective agreements as a result of changes to the Company’s financial statements related to lease accounting, and do not require the Company to deliver restated financial statements or compliance certificates for any annual or quarterly period prior to the fiscal year ended March 31, 2015.
In October 2015, the Company obtained additional consents from the requisite holders of its Bank Term Loans and its Senior Notes to further extend the time for delivery of its fiscal 2015 audited financial statements and the first quarter fiscal 2016 quarterly financial statements, as well as to extend the time for delivery of its second quarter fiscal 2016 quarterly financial statements. The consents extended the time for delivery of the fiscal 2015 audited financial statements and the first quarter fiscal 2016 quarterly financial statements to November 30, 2015, as well as extended the time for delivery of the second quarter fiscal 2016 quarterly financial statements to December 31, 2015, whereby an event of default was waived as long as those financial statements were delivered within the thirty day grace period after those dates.
In December 2015, the Company entered into additional amended agreements related to the Bank Term Loans and Senior Notes that further extend the time for delivery of its fiscal 2015 audited financial statements and the first and second quarter fiscal 2016 quarterly financial statements. The December 2015 amended agreements extended the time for delivery of the fiscal 2015 audited financial statements and the first and second quarter fiscal 2016 quarterly financial statements to January 31, 2016, whereby an event of default was waived as long as those financial statements were delivered within the thirty day grace period after that date. The December 2015 amended agreements also modify certain definitions applicable to the Company’s affirmative and negative financial covenants, including with respect to the treatment of the costs related to the Company’s restatement for purposes of the calculation of the minimum fixed charge coverage ratio and the maximum leverage ratio. As part of the December 2015 amended agreements, the lenders also consented to the Company’s payment of a $0.05 per share common stock dividend in December 2015.
In February 2016, the Company entered into additional amended agreements related to the Bank Term Loans and Senior Notes that further extend the time for delivery of its fiscal 2015 audited financial statements and the first and second quarter fiscal 2016 quarterly financial statements, as well as to extend the time for delivery of its third quarter fiscal 2016 quarterly financial statements. The February 2016 amended agreements extended the time for delivery of the fiscal 2015 audited financial statements and the first, second and third quarter fiscal 2016 quarterly financial statements to April 1, 2016, whereby an event of default was waived as long as those financial statements were delivered by that date without regard to any grace period. As part of the February 2016 amended agreements, the lenders also consented to the Company’s payment of the previously declared annual dividend of $0.0195 per share to be paid on shares of preferred stock in March 2016.
| 14. | DERIVATIVE TRANSACTIONS |
The Company uses interest rate swaps, commodity options in the form of collars and swaps, and foreign currency forward contracts to manage its various exposures to interest rate, commodity price, and foreign currency exchange rate fluctuations. For interest rate swaps, gains and losses resulting from the difference
F-43
Table of Contents
between the spot rate and applicable base rate is recorded in interest expense. For collars, commodity swaps and foreign exchange forward contracts, contract settlement gains and losses are recorded in the Consolidated Statements of Operations in Other miscellaneous expense (income), net. Gains and losses related to mark-to-market adjustments for changes in fair value of the derivative contracts are also recorded in the Consolidated Statements of Operations as Other miscellaneous expense (income), net.
A summary of the fair values for the various derivatives at March 31, 2015 and 2014 is presented below:
| 2015 | 2014 | |||||||||||||||
| Asset | Liability | Asset | Liability | |||||||||||||
| Interest rate swaps |
$ | — | $ | (765 | ) | $ | — | $ | (1,001 | ) | ||||||
| Foreign exchange forward contracts |
28 | — | — | — | ||||||||||||
| Diesel fuel option collars |
— | (2,841 | ) | — | — | |||||||||||
| Propylene swaps |
— | (5,142 | ) | 27 | — | |||||||||||
The Company recorded losses and (gains) on mark-to-market adjustments for changes in the fair value of derivative contracts as well as losses and (gains) on the settlement of derivative contracts as follows:
| Unrealized Mark to Market Losses (Gains) | ||||||||||||
| (Amounts in thousands) | 2015 | 2014 | 2013 | |||||||||
| Interest rate swaps |
$ | (236 | ) | $ | (81 | ) | $ | (221 | ) | |||
| Foreign exchange forward contracts |
(28 | ) | — | — | ||||||||
| Diesel fuel option collars |
2,841 | 55 | 217 | |||||||||
| Propylene swaps |
5,169 | (27 | ) | — | ||||||||
|
|
|
|
|
|
|
|||||||
| $ | 7,746 | $ | (53 | ) | $ | (4 | ) | |||||
|
|
|
|
|
|
|
|||||||
| Realized Losses (Gains) | ||||||||||||
| (Amounts in thousands) | 2015 | 2014 | 2013 | |||||||||
| Foreign exchange forward contracts |
$ | 5,636 | $ | — | $ | — | ||||||
| Diesel fuel option collars |
736 | — | (57 | ) | ||||||||
| Propylene swaps |
1,333 | (84 | ) | — | ||||||||
|
|
|
|
|
|
|
|||||||
| $ | 7,705 | $ | (84 | ) | $ | (57 | ) | |||||
|
|
|
|
|
|
|
|||||||
| Total realized and unrealized losses (gains) included in Other miscellaneous expense (income), net(1) |
$ | 15,451 | $ | (137 | ) | $ | (61 | ) | ||||
|
|
|
|
|
|
|
|||||||
| (1) | The total balance in Other miscellaneous expense (income), net in the Consolidated Statements of Operations also includes other (income) expense items of ($1,081), ($1,040) and $164 at March 31, 2015, 2014 and 2013, respectively. |
| 15. | COMMITMENTS AND CONTINGENCIES |
Purchase Commitments
We secure supplies of resin raw material by agreeing to purchase quantities during a future given period at a fixed price. These purchase contracts range from 1 to 12 months and occur in the ordinary course of business. Under such purchase contracts in place at March 31, 2015, we have agreed to purchase 18,000 pounds of resin over the period April 2015 through December 2015 at a committed purchase cost of $11,790.
Litigation
On July 29, 2015, a putative stockholder class action, Christopher Wyche, individually and on behalf of all others similarly situated v. Advanced Drainage Systems, Inc., et al. (Case No. 1:15-cv-05955-KPF), was
F-44
Table of Contents
commenced in the U.S. District Court for the Southern District of New York. The complaint alleges that the Company made material misrepresentations and/or omissions of material fact in its public disclosures during the period from September 5, 2014 through July 14, 2015, in violation of Section 10(b) and 20(a) of the Securities Exchange Act of 1934, as amended, and Rule 10b-5 promulgated thereunder. Plaintiffs seek an unspecified amount of monetary damages on behalf of the putative class and an award of costs and expenses, including counsel fees and expert fees. The Company believes that it has valid and meritorious defenses and will vigorously defend against these allegations. While it is reasonably possible that this matter ultimately could be decided unfavorably to the Company, the Company is currently unable to estimate the range of the possible losses, but they could be material.
On August 12, 2015, the SEC’s Division of Enforcement informed the Company that it was conducting an informal inquiry with respect to the Company. As part of this inquiry, the SEC requested the voluntary production of certain documents generally related to the Company’s accounting practices. Subsequently, the Company received a subpoena from the SEC on December 3, 2015 pursuant to a formal order of investigation, which subpoena repeated in substantial part a previous voluntary document production request. The Company has cooperated with the SEC in connection with this investigation and the production of documents, which remains ongoing, and will continue to fully cooperate with the SEC with respect to its investigation. While it is reasonably possible that this investigation ultimately could be resolved unfavorably to the Company, the Company is currently unable to estimate the range of the possible losses, but they could be material.
We are involved from time-to-time in various legal proceedings that arise in the ordinary course of our business including, but not limited to commercial disputes, environmental matters, employee related claims, intellectual property disputes and litigation in connection with transactions including acquisitions and divestitures. We believe that such litigation, claims, and administrative proceedings will not have a material adverse impact on our financial position or our results of operations. We record a liability when a loss is considered probable, and the amount can be reasonably estimated. In management’s opinion, none of these proceedings will materially affect our consolidated operations, cash flows, or financial position, and we have recorded adequate accrued liabilities to cover our estimated probable loss exposure.
| 16. | EMPLOYEE BENEFIT PLANS |
Employee Stock Ownership Plan (ESOP)
We established the Advanced Drainage Systems, Inc. ESOP (the “ESOP” or the “Plan”) effective April 1, 1993. The Plan was funded through a transfer of assets from our tax-qualified profit-sharing retirement plan, as well as a 30-year term loan from ADS. The Plan operates as a tax-qualified leveraged ESOP and was designed to enable eligible employees to acquire stock ownership interest in ADS. Employees of ADS who have reached the age of 18 are generally eligible to participate in the Plan on March 31 after six months of service. Upon retirement, disability, death, or vested terminations, (i) a participant or designated beneficiary may elect to receive the amount in their account attributable to the 1993 transfer of assets from our tax-qualified profit sharing retirement plan in the form of cash or ADS stock with any fractional shares paid in cash; (ii) stock credited to the participants’ ESOP stock account resulting from the ESOP’s loan repayments are distributed in the form of ADS stock, and (iii) amounts credited to the participants’ ESOP cash account are distributed in the form of cash. Upon attainment of age 50 and seven years of participation in the Plan, a participant may elect to diversify specified percentages of the number of shares of ADS stock credited to the participant’s ESOP stock account in compliance with applicable law.
We are obligated to make contributions to the Plan, which, when aggregated with the Plan’s dividends, equal the amount necessary to enable the Plan to make its regularly scheduled payments of principal and interest due on its term loan to ADS. As the Plan makes annual payments of principal and interest, an appropriate percentage of preferred stock is allocated to ESOP participants’ accounts in accordance with plan terms that are compliant with applicable Internal Revenue Code and regulatory provisions.
F-45
Table of Contents
Required dividends on allocated shares are generally passed through and paid in cash to the participants and required dividends on unallocated shares are paid in cash to the Plan and generally used to service the Plan’s debt.
On January 6, 2014, the Board of Directors declared a cash dividend of $1.59 (the “Special Dividend”) per share for a total amount of approximately $108,101, on all outstanding shares of our common stock and Redeemable convertible preferred stock. We paid the Special Dividend on January 15, 2014 to all stockholders of record on January 2, 2014. The payment of the Special Dividend was financed through the Company’s Revolving Credit Facilities. For additional details on the Revolving Credit Facilities, please refer to Note 13. Debt.
The Special Dividend on the ESOP’s allocated shares was paid in cash (i.e., passed through) to participants, and the Special Dividend on the ESOP’s unallocated shares was retained by the ESOP and allocated among the participants’ ESOP cash accounts. The allocation of cash among the participants’ ESOP cash accounts related to dividends paid on unallocated shares resulted in additional compensation expense for the fiscal year ended March 31, 2014 of $22,624, of which $13,896 was included in Cost of goods sold, $4,550 was included in Selling expenses, and $4,178 was included in General and administrative expenses in the Consolidated Statements of Operations.
In the fiscal years ended March 31, 2015 and 2014, the ESOP committee directed the Plan trustee to retain $824 and $23,614, respectively, in dividends on unallocated ADS shares rather than to service the Plan’s debt. These dividends were allocated to participants based on the total shares in their account in relation to total shares allocated at March 31, 2015 and 2014.
In the fiscal years ended March 31, 2015 and 2014, 737 and 734 shares of Redeemable convertible preferred stock, respectively, were allocated to the ESOP participants, including, in addition to the cash dividends, 6 and 11 preferred shares allocated as dividends, respectively. See Note 19. Mezzanine Equity for further details on the shares of Redeemable convertible preferred stock held by our ESOP.
Profit-Sharing Plan
We have a tax-qualified profit-sharing retirement plan with a 401(k) feature covering substantially all eligible employees. We did not make employer contributions in the fiscal years ended March 31, 2015, 2014 and 2013 to the tax-qualified profit-sharing retirement plan.
| 17. | ACCUMULATED OTHER COMPREHENSIVE LOSS |
The following table presents the changes in the balances of each component of Accumulated other comprehensive loss (“AOCL”) for the fiscal years ended March 31:
| (Amounts in thousands) | Currency Translation |
Other | Accumulated Other Comprehensive Loss |
|||||||||
| Balance at April 1, 2012 |
$ | (2,554 | ) | $ | 29 | $ | (2,525 | ) | ||||
|
|
|
|
|
|
|
|||||||
| Other comprehensive income (loss) |
1,469 | (41 | ) | 1,428 | ||||||||
| Income tax expense |
— | 16 | 16 | |||||||||
|
|
|
|
|
|
|
|||||||
| Balance at March 31, 2013 |
$ | (1,085 | ) | $ | 4 | $ | (1,081 | ) | ||||
|
|
|
|
|
|
|
|||||||
| Other comprehensive (loss) income |
(5,753 | ) | 6 | (5,747 | ) | |||||||
| Income tax benefit |
— | (2 | ) | (2 | ) | |||||||
|
|
|
|
|
|
|
|||||||
| Balance at March 31, 2014 |
$ | (6,838 | ) | $ | 8 | $ | (6,830 | ) | ||||
|
|
|
|
|
|
|
|||||||
| Other comprehensive loss |
(8,691 | ) | — | (8,691 | ) | |||||||
|
|
|
|
|
|
|
|||||||
| Balance at March 31, 2015 |
$ | (15,529 | ) | $ | 8 | $ | (15,521 | ) | ||||
|
|
|
|
|
|
|
|||||||
F-46
Table of Contents
| 18. | STOCKHOLDERS’ EQUITY (DEFICIT) |
The common stockholders have entered into an agreement that grants ADS the right of first refusal to purchase shares in the event of death, disability, or termination of certain management stockholders.
In addition to the Special Dividend, the Board of Directors approved a dividend of $0.04 per share to all common stockholders of record in each of the quarters ending March 31, 2015 and December 31, 2014. No dividends were declared in the quarters ended June 30, 2014 and September 30, 2014. The Board of Directors approved quarterly cash dividends of $0.029 per share during each of the first three quarters of the fiscal year ended March 31, 2014. The Board of Directors approved a quarterly cash dividend of $0.026 per share to all common stockholders of record during the fiscal year ended March 31, 2013.
Total cash dividends paid on common stock during the fiscal years ended March 31, 2015, 2014 and 2013 were $4,270, $80,102 and $4,817, respectively.
During the fiscal year ended March 31, 2015, we purchased a negligible amount of fractional shares subsequent to the IPO at a price of $17.21 per share. In fiscal year ended March 31, 2014, we purchased 80 shares from certain stockholders at a purchase price of $13.64 per share.
See Note 13. Debt for a description of restrictions on the payment of dividends imposed under our Bank Term Loans and Senior Notes agreements.
Subsequent Events Related to Stockholders’ Equity (Deficit)
During each of the first three quarters of fiscal 2016, the Company declared a cash dividend of $0.05 per share of common stock.
| 19. | MEZZANINE EQUITY |
Redeemable Common Stock
Prior to the July 2014 IPO , one of our minority equity owners along with other shareholders who hold ownership in ADS of at least 15% (referred to as “Major Shareholders”) entered into an agreement which provided the Major Shareholders the right to put their common stock to the Company at fair value if, following the fifth anniversary of the recapitalization that occurred during 2010, a Major Shareholder demands that the Company effect an IPO covering the registration of at least $50,000 of securities, and either the Company advises the Major Shareholder that ADS will not begin preparations for an IPO within 180 days after delivery, or after such preparations have begun they are discontinued (the “Major Shareholders’ Put Right”). As the Major Shareholders’ Put Right was a redemption right which prior to the IPO was outside the control of ADS, we classified common stock held by the Major Shareholders in the mezzanine equity section of our Consolidated Balance Sheets at its fair value, and changes in fair value were recorded in Retained earnings. As of March 31, 2014, there were 38,320 shares of common stock held by Major Shareholders.
The redemption feature of our Redeemable common stock allowing the holder to put its shares to us for cash, as discussed in the previous paragraph, became unenforceable upon effectiveness of the IPO on July 25, 2014. As a result, the Redeemable common stock was recorded at fair value through the effective date of the IPO and was subsequently reclassified at that fair value to stockholders’ equity. See Note 1. Background and Summary of Significant Accounting Policies for more information on the IPO. As of March 31, 2015, there were 10,101 shares of common stock held by Major Shareholders, which are now classified in stockholders’ equity as a result of the IPO.
Redeemable Convertible Preferred Stock
The Trustee of the Company’s ESOP has the ability to put shares of our Redeemable convertible preferred stock to the Company. The Redeemable convertible preferred stock has a required cumulative 2.5%
F-47
Table of Contents
dividend (based on the issue price of $0.781 per share) and is convertible at a rate of 0.7692 shares of common stock for each share of Redeemable convertible preferred stock. We guarantee the value of the Redeemable convertible preferred stock at $0.781 per share. The put option requirements of the Internal Revenue Code apply in the event that the Company’s common stock is not a registration type class of security or its trading has been restricted. Therefore, the holders of Redeemable convertible preferred stock have a put right to require us to repurchase such shares in the event that our common stock is not listed for trading or otherwise quoted on the NYSE, AMEX, NASDAQ, or any other market more senior than the OTC Bulletin Board.
Given that the event that may trigger redemption of the Redeemable convertible preferred stock (the listing or quotation on a market more senior than the OTC Bulletin Board) is not solely within our control, our Redeemable convertible preferred stock is presented in the mezzanine equity section of our Consolidated Balance Sheets.
As of March 31, 2015, we did not adjust the carrying value of the Redeemable convertible preferred stock to its redemption value or recognize any changes in fair value as we did not consider it probable that the Redeemable convertible preferred stock would become redeemable.
The Board of Directors approved the 2.5% annual dividend to be paid March 31 of each fiscal year to the stockholders of record as of March 15, 2015, 2014 and 2013. The annual dividend was paid in cash and stock on the allocated shares. During the first quarter of 2016, the Board of Directors approved the 2.5% annual dividend to be paid on March 31, 2016 to stockholders of record as of March 15, 2016.
In addition, the Board of Directors approved a quarterly discretionary cash dividend of $0.0196 per share to all preferred stockholders of record during the fiscal year ended March 31, 2013 and quarterly discretionary cash dividends of $0.0221 per share during the first three quarters of the fiscal year ended March 31, 2014. As noted above, the Redeemable convertible preferred stockholders also received the Special Dividend during the fourth quarter of fiscal 2014. The Special Dividend and the discretionary dividends on unallocated shares of Redeemable convertible preferred stock were allocated to participants rather than being used to service the Plan’s debt as described in Note 16. Employee Benefit Plans.
Cash and stock dividends on allocated Redeemable convertible preferred stock for the fiscal years ended March 31, 2015 and 2014, respectively, are summarized in the following table. For additional information on dividends paid to the unallocated Redeemable convertible preferred stock, please refer to Note 16. Employee Benefit Plans.
| (Amounts in thousands) | 2015 | 2014 | ||||||
| Quarterly cash dividends |
$ | 507 | $ | 526 | ||||
| Annual cash dividends |
27 | 32 | ||||||
| Special Dividend |
— | 9,463 | ||||||
|
|
|
|
|
|||||
| Total cash dividends |
$ | 534 | $ | 10,021 | ||||
|
|
|
|
|
|||||
| Annual stock dividend |
127 | 118 | ||||||
| Annual cash dividend |
27 | 32 | ||||||
|
|
|
|
|
|||||
| Total ESOP required dividends |
$ | 154 | $ | 150 | ||||
|
|
|
|
|
|||||
| Allocated shares |
7,914 | 7,668 | ||||||
| Required dividend per share |
0.0195 | 0.0195 | ||||||
|
|
|
|
|
|||||
| Required dividends |
$ | 154 | $ | 150 | ||||
|
|
|
|
|
|||||
F-48
Table of Contents
| 20. | STOCK-BASED COMPENSATION |
Deferred Compensation — Unearned ESOP Shares
The fair value of Redeemable convertible preferred stock held by the ESOP trust, but not yet earned by the ESOP participants or used for dividends, is reported as Deferred compensation — unearned ESOP shares within the mezzanine equity section of our Consolidated Balance Sheets.
Compensation expense and related dividends paid with ESOP shares are recognized based upon the average annual fair value of the shares allocated. The shares allocated are for services rendered throughout the period and, therefore, a simple average is used to calculate average annual fair value. Deferred compensation — unearned ESOP shares is relieved at fair value, with any difference between the annual average fair value and the fair value of shares when allocated being added to Additional paid in capital. The fair value of the shares allocated was $22.05, $11.16 and $10.64 per share of Redeemable convertible preferred stock at March 31, 2015, 2014 and 2013, respectively, resulting in an average annual fair value per share of $16.61, $10.90 and $10.25 for the fiscal years ended March 31, 2015, 2014 and 2013, respectively. During the fiscal years ended March 31, 2015, 2014 and 2013, we recognized compensation expense of $12,144, $7,891 and $7,283, respectively, related to allocation of ESOP shares to participants.
Stock Options
Our 2000 stock option plan (“2000 Plan”) provides for the issuance of non-statutory stock options to management based upon the discretion of the Board of Directors. The plan generally provides for grants with the exercise price equal to fair value on the date of grant, which vest in three equal annual amounts beginning in year five and expire after 10 years from issuance.
In August 2013, a new stock option plan (“2013 Plan”) was approved by the Board of Directors and provides for the issuance of up to 3,323 non-statutory common stock options to management subject to the Board’s discretion. The plan generally provides for grants with the exercise price equal to fair value on the date of grant. The grants generally vest in five equal annual amounts beginning in year one and expire after 10 years from issuance. Options issued to the Chief Executive Officer vest equally over four years and expire after 10 years from issuance.
For both stock option plans, management determines the fair value of the options based on the Black-Scholes option pricing model. This methodology requires significant inputs including the fair value of our common stock, risk-free interest rate, dividend yield and expiration date. During the fiscal years ended March 31, 2015, 2014 and 2013, we recognized total stock-based compensation expense under both plans of $4,418, $2,669 and $545, respectively, which was included in General and administrative expense in our Consolidated Statements of Operations. As of March 31, 2015 and 2014, there was a total of $3,269 and $6,884, respectively, of unrecognized compensation expense related to unvested stock option awards that will be recognized as an expense as the awards vest over the remaining service period. Of this amount, $0 and $2,383 relate to liability classified awards and $3,269 and $4,501 relate to equity classified awards as of March 31, 2015 and 2014, respectively.
We estimate the fair value of stock options granted after April 1, 2006 using a Black-Scholes option-pricing model, with assumptions as follows:
| 2015 | 2014 | 2013 | ||||||||||
| Expected stock price volatility |
40 | % | 44 | % | 48 | % | ||||||
| Risk-free interest rate |
2.1 | % | 2.3 | % | 1.2 | % | ||||||
| Weighted-average expected option life (years) |
8 | 8 | 8 | |||||||||
| Dividend yield |
0.86 | % | 0.84 | % | 0.81 | % | ||||||
In May 2014, the Board of Directors approved the increase of shares available for granting under the 2013 plan to 1,412 shares. We had approximately 1,106 and 1,412 shares available for granting under the 2000 and 2013 plans, respectively, as of March 31, 2015.
F-49
Table of Contents
2000 Plan
The stock option activity for the fiscal years ended March 31 is summarized as follows:
| 2015 | 2014 | 2013 | ||||||||||||||||||||||||||||||||||
| Number of Shares |
Weighted Average Exercise Price |
Weighted Average Remaining Contractual Term |
Number of Shares |
Weighted Average Exercise Price |
Weighted Average Remaining Contractual Term |
Number of Shares |
Weighted Average Exercise Price |
Weighted Average Remaining Contractual Term |
||||||||||||||||||||||||||||
| Outstanding at beginning of year |
913 | $ | 9.48 | 4.1 | 1,333 | $ | 8.10 | 4.0 | 1,524 | $ | 7.03 | 3.9 | ||||||||||||||||||||||||
| Issued |
78 | 15.74 | — | 25 | 13.64 | — | 134 | 12.59 | — | |||||||||||||||||||||||||||
| Exercised |
(235 | ) | 7.50 | — | (427 | ) | 5.19 | — | (325 | ) | 4.89 | — | ||||||||||||||||||||||||
| Forfeited |
(10 | ) | 10.48 | — | (18 | ) | 10.77 | — | — | — | — | |||||||||||||||||||||||||
|
|
|
|
|
|
|
|||||||||||||||||||||||||||||||
| Outstanding at end of year |
746 | 10.75 | 4.1 | 913 | 9.48 | 4.1 | 1,333 | 8.10 | 4.0 | |||||||||||||||||||||||||||
|
|
|
|
|
|
|
|||||||||||||||||||||||||||||||
| Vested at end of year |
668 | 10.16 | 3.5 | 485 | 8.01 | 2.2 | 654 | 5.75 | 2.2 | |||||||||||||||||||||||||||
|
|
|
|
|
|
|
|||||||||||||||||||||||||||||||
| Unvested at end of year |
78 | 15.74 | 9.4 | 428 | 11.14 | 6.3 | 679 | 10.37 | 5.7 | |||||||||||||||||||||||||||
|
|
|
|
|
|
|
|||||||||||||||||||||||||||||||
| Vested and expected to vest at end of year (a) |
640 | 10.73 | 7.6 | 800 | 9.36 | 5.2 | 1,204 | 7.90 | 4.6 | |||||||||||||||||||||||||||
|
|
|
|
|
|
|
|||||||||||||||||||||||||||||||
| Fair value of options granted during the year |
$ | 6.76 | $ | 6.38 | $ | 6.01 | ||||||||||||||||||||||||||||||
| a) | Vested and expected to vest at end of year assumes the forfeiture of approximately 15% of options outstanding at the end of each period. |
The following table summarizes information about the unvested stock option grants as of the fiscal years ended March 31:
| 2015 | 2014 | |||||||||||||||
| Number of Shares |
Weighted Average Grant Date Fair Value |
Number of Shares |
Weighted Average Grant Date Fair Value |
|||||||||||||
| Unvested at beginning of year |
428 | $ | 5.82 | 679 | $ | 5.73 | ||||||||||
| Granted |
78 | 6.76 | 25 | 6.38 | ||||||||||||
| Vested |
(428 | ) | 5.82 | (276 | ) | 5.49 | ||||||||||
|
|
|
|
|
|
|
|
|
|||||||||
| Unvested at end of year |
78 | $ | 6.76 | 428 | $ | 5.82 | ||||||||||
|
|
|
|
|
|
|
|
|
|||||||||
F-50
Table of Contents
2013 Plan
The stock option transactions for the fiscal years ended March 31 are summarized as follows:
| 2015 | 2014 | |||||||||||||||||||||||
| Number of Shares |
Weighted Average Exercise Price |
Weighted Average Remaining Contractual Term |
Number of Shares |
Weighted Average Exercise Price |
Weighted Average Remaining Contractual Term |
|||||||||||||||||||
| Outstanding at beginning of period |
1,911 | $ | 13.64 | 9.42 | — | $ | — | — | ||||||||||||||||
| Issued — equity classified |
— | — | — | 1,440 | 13.64 | — | ||||||||||||||||||
| Issued — liability classified |
— | — | — | 518 | 13.64 | — | ||||||||||||||||||
| Forfeited |
— | — | — | (47 | ) | 13.64 | — | |||||||||||||||||
|
|
|
|
|
|||||||||||||||||||||
| Outstanding at end of year |
1,911 | 13.64 | 8.42 | 1,911 | 13.64 | 9.42 | ||||||||||||||||||
|
|
|
|
|
|||||||||||||||||||||
| Vested at end of year |
408 | 13.64 | 8.42 | — | — | — | ||||||||||||||||||
|
|
|
|
|
|||||||||||||||||||||
| Unvested at end of year |
1,503 | 13.64 | 8.42 | 1,911 | 13.64 | 9.42 | ||||||||||||||||||
|
|
|
|
|
|||||||||||||||||||||
| Vested and expected to vest at end of year(a) |
1,702 | 13.64 | 8.42 | 1,704 | 13.64 | 9.42 | ||||||||||||||||||
|
|
|
|
|
|||||||||||||||||||||
| Fair value of options granted during the year |
$ | — | $ | 6.22 | ||||||||||||||||||||
| (a) | Vested and expected to vest at end period assumes the forfeiture of approximately 15% of options granted (except those to the CEO). |
The following table summarizes information about the unvested stock option grants as of the fiscal years ended March 31:
| 2015 | 2014 | |||||||||||||||
| Number of Shares |
Weighted Average Grant Date Fair Value |
Number of Shares |
Weighted Average Grant Date Fair Value |
|||||||||||||
| Unvested at beginning of year |
1,911 | $ | 6.22 | — | $ | — | ||||||||||
| Granted |
— | — | 1,958 | 6.22 | ||||||||||||
| Vested |
(408 | ) | 6.22 | — | — | |||||||||||
| Forfeited |
— | — | (47 | ) | 6.22 | |||||||||||
|
|
|
|
|
|
|
|
|
|||||||||
| Unvested at end of year |
1,503 | $ | 6.22 | 1,911 | $ | 6.22 | ||||||||||
|
|
|
|
|
|
|
|
|
|||||||||
Restricted Stock
On September 16, 2008, the Board of Directors adopted the restricted stock plan, which provides for the issuance of restricted stock awards to certain key employees. The restricted stock generally vest ratably over a five-year period from the original restricted stock grant date, contingent on the employee’s continuous employment by ADS. In certain instances, however, a portion of the grants vested immediately or for accounting purposes were deemed to have vested immediately, including the grants to the Chief Executive Officer, which do not have a substantial risk of forfeiture as a result of different vesting provisions. Under the restricted stock plan, vested shares are considered issued and outstanding. Employees with restricted stock have the right to dividends on the shares awarded (vested and unvested) in addition to voting rights on non-forfeited shares. The Company recognized compensation expense of $562, $1,849 and $1,535 in the fiscal years ended March 31, 2015, 2014 and 2013, respectively, relating to the issuance of these shares; of this amount, $0, $385 and $533 relates to the restricted shares that vested immediately during the fiscal years ended March 31, 2015, 2014 and 2013, respectively. We had approximately 335 shares available for grant under this plan as of March 31, 2015.
F-51
Table of Contents
The information about the unvested restricted stock grants as of March 31 is as follows:
| 2015 | 2014 | 2013 | ||||||||||||||||||||||
| Number of Shares |
Weighted Average Grant Date Fair Value |
Number of Shares |
Weighted Average Grant Date Fair Value |
Number of Shares |
Weighted Average Grant Date Fair Value |
|||||||||||||||||||
| Unvested at beginning of year |
311 | $ | 12.40 | 273 | $ | 11.63 | 179 | $ | 10.39 | |||||||||||||||
| Granted |
— | — | 155 | 13.64 | 151 | 12.59 | ||||||||||||||||||
| Vested |
(126 | ) | 12.01 | (104 | ) | 11.78 | (47 | ) | 10.29 | |||||||||||||||
| Forfeited |
(2 | ) | 11.98 | (13 | ) | 12.12 | (10 | ) | 10.42 | |||||||||||||||
|
|
|
|
|
|
|
|||||||||||||||||||
| Unvested at end of year |
183 | $ | 12.65 | 311 | $ | 12.40 | 273 | $ | 11.63 | |||||||||||||||
|
|
|
|
|
|
|
|||||||||||||||||||
We expect most, if not all, restricted stock grants to vest.
At March 31, 2015 and 2014, there was approximately $2,301 and $2,812, respectively, of unrecognized compensation expense related to the restricted stock that will be recognized over the weighted average service period remaining of 2.2 and 3.0 years, respectively.
Non-Employee Director Compensation Plan
On June 18, 2014, the Company amended its then-existing Stockholders’ Agreement to authorize 282 shares of restricted stock to be granted to non-employee members of its Board of Directors. The shares typically will vest one year from the date of issuance. Under this stock plan, the vested shares granted are considered issued and outstanding. Non-employee directors with this stock have the right to dividends on the shares awarded (vested and unvested) in addition to voting rights. On September 6, 2014, a total of 48 shares were granted to seven directors at a fair value of $18.88 per share. These shares vested on February 27, 2015. The Company recognized compensation expense of $900 for the fiscal year ended March 31, 2015, relating to the issuance of these shares. We had approximately 234 shares available for grant under this plan as of March 31, 2015.
The following table summarizes information about the unvested Non-Employee Director Compensation stock grants as of March 31, 2015:
| Number of Shares |
Weighted Average Grant Date Fair Value |
|||||||
| Unvested at beginning of year |
— | $ | — | |||||
| Granted |
48 | 18.88 | ||||||
| Vested |
(48 | ) | 18.88 | |||||
|
|
|
|
|
|||||
| Unvested at end of year |
— | $ | — | |||||
|
|
|
|
|
|||||
As of March 31, 2015, there was no unrecognized compensation expense related to this restricted stock.
| 21. | INCOME TAXES |
The components of Income before income taxes for the fiscal years ended March 31 are as follows:
| (Amounts in thousands) | 2015 | 2014 | 2013 | |||||||||
| United States |
17,312 | 25,497 | 25,116 | |||||||||
| Foreign |
7,217 | 9,758 | 13,733 | |||||||||
|
|
|
|
|
|
|
|||||||
| Total |
$ | 24,529 | $ | 35,255 | $ | 38,849 | ||||||
|
|
|
|
|
|
|
|||||||
F-52
Table of Contents
The components of the provision for income taxes for the fiscal years ended March 31 consisted of the following:
| (Amounts in thousands) | 2015 | 2014 | 2013 | |||||||||
| Current: |
||||||||||||
| Federal |
$ | 20,462 | $ | 21,774 | $ | 17,282 | ||||||
| State and local |
3,659 | 3,859 | 3,664 | |||||||||
| Foreign |
830 | 1,126 | 2,391 | |||||||||
|
|
|
|
|
|
|
|||||||
| Total current tax provision |
24,951 | 26,759 | 23,337 | |||||||||
|
|
|
|
|
|
|
|||||||
| Deferred: |
||||||||||||
| Federal |
(13,437 | ) | (4,985 | ) | (5,344 | ) | ||||||
| State and local |
(2,173 | ) | (2,724 | ) | (1,653 | ) | ||||||
| Foreign |
102 | 899 | (405 | ) | ||||||||
|
|
|
|
|
|
|
|||||||
| Total deferred tax benefit |
(15,508 | ) | (6,810 | ) | (7,402 | ) | ||||||
|
|
|
|
|
|
|
|||||||
| Total income tax provision |
$ | 9,443 | $ | 19,949 | $ | 15,935 | ||||||
|
|
|
|
|
|
|
|||||||
For the fiscal years ended March 31, our effective tax rate varied from the statutory Federal income tax rate as a result of the following factors:
| 2015 | 2014 | 2013 | ||||||||||
| Federal statutory rate |
35.0 | % | 35.0 | % | 35.0 | % | ||||||
| Redeemable convertible preferred stock dividend |
(0.8 | ) | (9.9 | ) | 0.6 | |||||||
| ESOP stock appreciation |
16.5 | 7.3 | 6.1 | |||||||||
| ESOP compensation for Special Dividend on unallocated shares |
— | 22.5 | — | |||||||||
| Effect of tax rate of foreign subsidiaries |
2.5 | 3.7 | (5.1 | ) | ||||||||
| State and local taxes—net of federal income tax benefit |
1.1 | 2.4 | 3.1 | |||||||||
| Noncontrolling interest |
(1.9 | ) | (5.5 | ) | (3.3 | ) | ||||||
| Uncertain tax position change |
(7.1 | ) | 5.9 | 0.5 | ||||||||
| Qualified production activity credit |
(7.6 | ) | (5.0 | ) | (1.7 | ) | ||||||
| Cumulative adjustments to deferred taxes |
0.2 | 0.5 | 5.1 | |||||||||
| Other |
0.6 | (0.3 | ) | 0.7 | ||||||||
|
|
|
|
|
|
|
|||||||
| Effective rate |
38.5 | % | 56.6 | % | 41.0 | % | ||||||
|
|
|
|
|
|
|
|||||||
The Company’s effective tax rate will vary based on factors, including but not limited to, overall profitability, the geographical mix of income before taxes and discrete events. The decrease in the effective tax rate for 2015 was primarily driven by the absence of the Special Dividend payment to participants in the ESOP which increased the effective tax rate by 22.5% in 2014. For 2015, the ESOP stock appreciation impacted the rate by 16.5% due to the increase in stock value compared to original cost. Please refer to Notes 16. Employee Benefit Plans for additional information on the Special Dividend.
F-53
Table of Contents
The tax effect of temporary differences that give rise to significant portions of the deferred tax assets and deferred tax liabilities at March 31 were comprised of:
| (Amounts in thousands) | 2015 | 2014 | ||||||
| Deferred tax assets: |
||||||||
| State income taxes |
$ | 1,885 | $ | 2,684 | ||||
| ESOP loan repayment |
1,421 | 1,473 | ||||||
| Receivable and other allowances |
2,534 | 1,189 | ||||||
| Fuel hedge |
3,534 | 471 | ||||||
| Inventory |
7,564 | 1,173 | ||||||
| Non-Qualified stock options |
2,855 | 1,099 | ||||||
| Accrued rebates |
1,378 | 1,626 | ||||||
| Worker’s compensation |
667 | 754 | ||||||
| Contingent consideration |
247 | 252 | ||||||
| Purchase card accrual |
232 | 240 | ||||||
| Other |
1,041 | 620 | ||||||
| Foreign NOL’s |
1,504 | 1,119 | ||||||
| Valuation allowance |
(1,504 | ) | (1,119 | ) | ||||
|
|
|
|
|
|||||
| Total deferred tax assets |
23,358 | 11,581 | ||||||
|
|
|
|
|
|||||
| Deferred tax liabilities: |
||||||||
| Intangible assets |
10,984 | 11,208 | ||||||
| Property, plant and equipment |
51,958 | 47,021 | ||||||
| Leases |
4,036 | 6,282 | ||||||
| Deferred system costs |
3,160 | 4,432 | ||||||
| Goodwill |
2,736 | 2,061 | ||||||
| Other |
1,487 | 716 | ||||||
|
|
|
|
|
|||||
| Total deferred tax liabilities |
74,361 | 71,720 | ||||||
|
|
|
|
|
|||||
| Net deferred tax liability |
$ | 51,003 | $ | 60,139 | ||||
|
|
|
|
|
|||||
Net deferred tax assets are included in Deferred income taxes and other current assets and Other assets on the Consolidated Balance Sheets. The related balances at March 31 were as follows:
| (Amounts in thousands) | 2015 | 2014 | ||||||
| Net current deferred tax assets |
$ | 14,085 | $ | 6,194 | ||||
| Net non-current deferred tax liabilities |
$ | 65,088 | $ | 66,333 | ||||
The Company has not provided for U.S. federal income taxes or foreign withholding taxes on approximately $30,218 of undistributed earnings of its foreign subsidiaries at March 31, 2015 because such earnings are intended to be reinvested indefinitely with the exception of cash dividends paid by our ADS Mexicana joint venture. It is not practicable to estimate the amount of U.S. tax that might be payable on the eventual remittance of such earnings.
F-54
Table of Contents
Accounting for uncertain tax positions
As of March 31, 2015, the Company had unrecognized tax benefit of $10,496, which if resolved favorably, would reduce income tax expense by $10,151. A reconciliation of the beginning and ending amounts of unrecognized tax benefits for the years ended March 31, 2013, March 31, 2014 and 2015 is as follows:
| (Amounts in thousands) | ||||
| Balance as of March 31, 2012 |
$ | 1,615 | ||
| Increases in tax positions for prior years |
10,969 | |||
| Decreases in tax positions for prior years |
(8 | ) | ||
| Settlements |
— | |||
| Lapse of statute of limitations |
(1,875 | ) | ||
|
|
|
|||
| Balance as of March 31, 2013 |
10,701 | |||
|
|
|
|||
| Tax positions taken in current year |
2,954 | |||
| Decreases in tax positions for prior years |
(47 | ) | ||
| Increases in tax positions for prior years |
844 | |||
| Settlements |
— | |||
| Lapse of statute of limitations |
(1,545 | ) | ||
|
|
|
|||
| Balance as of March 31, 2014 |
12,907 | |||
|
|
|
|||
| Decreases in tax positions for prior years |
(680 | ) | ||
| Increases in tax positions for prior years |
336 | |||
| Settlements |
— | |||
| Lapse of statute of limitations |
(2,067 | ) | ||
|
|
|
|||
| Balance as of March 31, 2015 |
$ | 10,496 | ||
|
|
|
|||
The Company recognized in its Consolidated Statements of Operations potential accrued interest and penalties related to unrecognized tax benefits of $460 at March 31, 2015.
It is reasonably possible that there could be a change in the amount of unrecognized tax benefits within the next twelve months due to activities of the IRS or other taxing authorities, including proposed assessments of additional tax, possible settlement of audit issues, or the expiration of applicable statutes of limitation.
The Company is currently open to audit under the statute of limitations by the IRS for the fiscal years ended March 31, 2013 through March 31, 2015. The majority of the Company’s state income tax returns are open to audit under the statute of limitations for the years ended March 31, 2012 through March 31, 2015. The foreign income tax returns are open to audit under the statute of limitations for the years ended March 31, 2010 through March 31, 2015.
| 22. | NET INCOME (LOSS) PER SHARE |
Basic net income (loss) per share is calculated by dividing the Net income (loss) available to common stockholders by the weighted-average number of common shares outstanding during the period, without consideration for common stock equivalents. Diluted net income (loss) per share is computed by dividing the Net income (loss) available to common stockholders by the weighted-average number of common stock equivalents outstanding for the period.
Holders of unvested restricted stock have non-forfeitable rights to dividends when declared on common stock, and holders of Redeemable convertible preferred stock participate in dividends on an as-converted basis when declared on common stock. As a result, unvested restricted stock and Redeemable convertible preferred stock meet the definition of participating securities, which requires us to apply the two-class method to compute both basic and diluted net income (loss) per share. The two-class method is an earnings allocation formula that treats participating securities as having rights to earnings that would otherwise have been available to common stockholders.
F-55
Table of Contents
The dilutive effect of stock options and unvested restricted stock is based on the more dilutive of the treasury stock method or the diluted two-class method. In computing diluted net income per share, income available to common stockholders used in the basic net income per share calculation (numerator) is adjusted, subject to sequencing rules, for certain adjustments that would result from the assumed issuance of potential common shares. Diluted net income per share assumes the Redeemable convertible preferred stock would be cash settled through the effective date of the IPO on July 25, 2014, as we have the choice of settling in cash or shares and we have demonstrated past practice and intent of cash settlement. Therefore these shares are excluded from the calculation through the effective date of the IPO. After the effective date of the IPO, management’s intent is to share settle; therefore, these shares are included in the calculation from July 26, 2014 through March 31, 2015, if dilutive. For purposes of the calculation of diluted net income per share, stock options and unvested restricted stock are considered to be potential common stock and are only included in the calculations when their effect is dilutive.
The Company’s Redeemable common stock is included in the weighted-average number of common shares outstanding for calculating basic and diluted net income per share.
The following table presents information necessary to calculate net (loss) income per share for the fiscal years ended March 31, 2015, 2014 and 2013, as well as potentially dilutive securities excluded from the weighted average number of diluted common shares outstanding because their inclusion would have been anti-dilutive:
| (Amounts in thousands, except per share data) | 2015 | 2014 | 2013 | |||||||||
| NET (LOSS) INCOME PER SHARE — BASIC: |
||||||||||||
| Net income attributable to ADS |
$ | 8,620 | $ | 8,627 | $ | 20,660 | ||||||
| Adjustment for: |
||||||||||||
| Change in fair value of Redeemable convertible preferred stock |
(11,054 | ) | (3,979 | ) | (5,869 | ) | ||||||
| Dividends paid to Redeemable convertible preferred stockholders |
(661 | ) | (10,139 | ) | (735 | ) | ||||||
| Dividends paid to unvested restricted stockholders |
(11 | ) | (418 | ) | (52 | ) | ||||||
|
|
|
|
|
|
|
|||||||
| Net (loss) income available to common stockholders and participating securities |
(3,106 | ) | (5,909 | ) | 14,004 | |||||||
| Undistributed income allocated to participating securities |
— | — | (1,127 | ) | ||||||||
|
|
|
|
|
|
|
|||||||
| Net (loss) income available to common stockholders — Basic |
(3,106 | ) | (5,909 | ) | 12,877 | |||||||
| Weighted average number of common shares outstanding — Basic |
51,344 | 47,277 | 46,698 | |||||||||
|
|
|
|
|
|
|
|||||||
| Net (loss) income per common share — Basic |
$ | (0.06 | ) | $ | (0.12 | ) | $ | 0.28 | ||||
|
|
|
|
|
|
|
|||||||
| NET (LOSS) INCOME PER SHARE — DILUTED: |
||||||||||||
| Net (loss) income available to common stockholders — Basic |
(3,106 | ) | (5,909 | ) | $ | 12,877 | ||||||
|
|
|
|
|
|
|
|||||||
| Weighted average number of common shares outstanding — Basic |
51,344 | 47,277 | 46,698 | |||||||||
| Assumed exercise of stock options |
— | — | 551 | |||||||||
|
|
|
|
|
|
|
|||||||
| Weighted average number of common shares outstanding — Diluted |
51,344 | 47,277 | 47,249 | |||||||||
|
|
|
|
|
|
|
|||||||
| Net (loss) income per common share — Diluted |
$ | (0.06 | ) | $ | (0.12 | ) | $ | 0.27 | ||||
|
|
|
|
|
|
|
|||||||
| Potentially dilutive securities excluded as ant-dilutive |
4,454 | 535 | 78 | |||||||||
| 23. | BUSINESS SEGMENT INFORMATION |
We operate our business in two distinct operating and reportable segments based on the markets we serve: “Domestic” and “International.” The Chief Operating Decision Maker (“CODM”) evaluates segment reporting based on Net sales and Segment Adjusted EBITDA (a non-GAAP measure). We calculate Segment Adjusted EBITDA as net income or loss before interest, income taxes, depreciation and amortization, stock-based compensation expense, non-cash charges and certain other expenses.
F-56
Table of Contents
Domestic
Our Domestic segment manufactures and markets products throughout the United States. We maintain and serve these markets through product distribution relationships with many of the largest national and independent waterworks distributors, major national retailers as well as an extensive network of hundreds of small to medium-sized distributors across the U.S. We also sell through a broad variety of buying groups and co-ops in the United States. Products include single wall pipe, N-12 HDPE pipe sold into the Storm sewer and Infrastructure markets, High Performance PP pipe sold into the Storm sewer and sanitary sewer markets, and our broad line of Allied Products including StormTech, Nyloplast, ARC Septic Chambers, Inserta Tee, BaySaver filters and water quality structures, Fittings, and FleXstorm. Our Domestic segment sales are diversified across all regions of the country.
International
Our International segment manufactures and markets products in certain regions outside of the United States, with a growth strategy focused on our owned facilities in Canada and through our joint-ventures with local partners in Mexico, Central America and South America. Our joint venture strategy provides us with local and regional access to new markets such as Brazil, Chile, Argentina, Peru and Colombia. Our Mexican joint venture (ADS Mexicana) primarily serves the Mexican markets, while our South American Joint Venture (Tigre-ADS) is our primary channel to serve the South American markets. Our International product line includes single wall pipe, N-12 HDPE pipe, and High Performance PP pipe. The Canadian market also sells our broad line of Allied Products, while sales in Latin America are currently concentrated in fittings and Nyloplast.
The following table sets forth reportable segment information with respect to the amount of Net sales contributed by each class of similar products in each of the fiscal years ended March 31:
| (Amounts in thousands) | 2015 | 2014 | 2013 | |||||||||
| Domestic |
||||||||||||
| Pipe |
$ | 771,214 | $ | 700,270 | $ | 655,288 | ||||||
| Allied Products |
256,719 | 235,022 | 223,676 | |||||||||
|
|
|
|
|
|
|
|||||||
| Total domestic |
1,027,933 | 935,292 | 878,964 | |||||||||
|
|
|
|
|
|
|
|||||||
| International |
||||||||||||
| Pipe |
125,407 | 107,078 | 113,236 | |||||||||
| Allied Products |
26,733 | 25,410 | 24,902 | |||||||||
|
|
|
|
|
|
|
|||||||
| Total international |
152,140 | 132,488 | 138,138 | |||||||||
|
|
|
|
|
|
|
|||||||
| Total Net sales |
$ | 1,180,073 | $ | 1,067,780 | $ | 1,017,102 | ||||||
|
|
|
|
|
|
|
|||||||
F-57
Table of Contents
The following sets forth certain additional financial information attributable to our reportable segments for the fiscal years ended March 31:
| (Amounts in thousands) | 2015 | 2014 | 2013 | |||||||||
| Net Sales |
||||||||||||
| Domestic |
$ | 1,027,933 | $ | 935,292 | $ | 878,964 | ||||||
| International |
152,140 | 132,488 | 138,138 | |||||||||
|
|
|
|
|
|
|
|||||||
| Total |
$ | 1,180,073 | $ | 1,067,780 | $ | 1,017,102 | ||||||
|
|
|
|
|
|
|
|||||||
| Gross Profit |
||||||||||||
| Domestic |
$ | 180,664 | $ | 166,185 | $ | 157,820 | ||||||
| International |
25,449 | 27,785 | 30,141 | |||||||||
|
|
|
|
|
|
|
|||||||
| Total |
$ | 206,113 | $ | 193,970 | $ | 187,961 | ||||||
|
|
|
|
|
|
|
|||||||
| Segment Adjusted EBITDA |
||||||||||||
| Domestic |
$ | 129,067 | $ | 133,996 | $ | 109,652 | ||||||
| International |
14,710 | 18,759 | 22,647 | |||||||||
|
|
|
|
|
|
|
|||||||
| Total |
$ | 143,777 | $ | 152,755 | $ | 132,299 | ||||||
|
|
|
|
|
|
|
|||||||
| Interest expense |
||||||||||||
| Domestic |
$ | 19,308 | $ | 18,659 | $ | 18,390 | ||||||
| International |
60 | 148 | 136 | |||||||||
|
|
|
|
|
|
|
|||||||
| Total |
$ | 19,368 | $ | 18,807 | $ | 18,526 | ||||||
|
|
|
|
|
|
|
|||||||
| Depreciation and amortization |
||||||||||||
| Domestic |
$ | 59,397 | $ | 57,834 | $ | 57,728 | ||||||
| International |
6,075 | 5,840 | 5,374 | |||||||||
|
|
|
|
|
|
|
|||||||
| Total |
$ | 65,472 | $ | 63,674 | $ | 63,102 | ||||||
|
|
|
|
|
|
|
|||||||
| Equity in net (loss) income of unconsolidated affiliates |
||||||||||||
| Domestic |
$ | 289 | $ | 417 | $ | — | ||||||
| International |
(2,624 | ) | (3,503 | ) | 266 | |||||||
|
|
|
|
|
|
|
|||||||
| Total |
$ | (2,335 | ) | $ | (3,086 | ) | $ | 266 | ||||
|
|
|
|
|
|
|
|||||||
| Capital expenditures |
||||||||||||
| Domestic |
$ | 28,744 | $ | 35,783 | $ | 36,527 | ||||||
| International |
2,735 | 3,838 | 2,229 | |||||||||
|
|
|
|
|
|
|
|||||||
| Total |
$ | 31,479 | $ | 39,621 | $ | 38,756 | ||||||
|
|
|
|
|
|
|
|||||||
The following sets forth certain additional financial information attributable to our reporting segments as of March 31:
| 2015 | 2014 | 2013 | ||||||||||
| Investments in unconsolidated affiliates |
||||||||||||
| Domestic |
$ | 7,957 | $ | 5,202 | $ | — | ||||||
| International |
17,081 | 18,422 | 21,899 | |||||||||
|
|
|
|
|
|
|
|||||||
| Total |
$ | 25,038 | $ | 23,624 | $ | 21,899 | ||||||
|
|
|
|
|
|
|
|||||||
| Total identifiable assets |
||||||||||||
| Domestic |
$ | 942,267 | $ | 889,263 | $ | 838,489 | ||||||
| International |
168,624 | 113,612 | 114,243 | |||||||||
| Eliminations |
(69,193 | ) | (13,308 | ) | (1,967 | ) | ||||||
|
|
|
|
|
|
|
|||||||
| Total |
$ | 1,041,699 | $ | 989,567 | $ | 950,765 | ||||||
|
|
|
|
|
|
|
|||||||
F-58
Table of Contents
Reconciliation of Segment EBITDA and Segment Adjusted EBITDA to Net income
| 2015 | 2014 | 2013 | ||||||||||||||||||||||
| (Amounts in thousands) | Domestic | International | Domestic | International | Domestic | International | ||||||||||||||||||
| Net income |
$ | 7,198 | $ | 5,553 | $ | 4,962 | $ | 7,258 | $ | 11,180 | $ | 12,000 | ||||||||||||
| Depreciation and amortization |
59,397 | 6,075 | 57,834 | 5,840 | 57,728 | 5,374 | ||||||||||||||||||
| Interest expense |
19,308 | 60 | 18,659 | 148 | 18,390 | 136 | ||||||||||||||||||
| Income tax expense |
8,510 | 933 | 17,924 | 2,025 | 13,949 | 1,986 | ||||||||||||||||||
|
|
|
|
|
|
|
|
|
|
|
|
|
|||||||||||||
| Segment EBITDA |
94,413 | 12,621 | 99,379 | 15,271 | 101,247 | 19,496 | ||||||||||||||||||
| Derivative fair value adjustments |
7,774 | (28 | ) | (53 | ) | — | (4 | ) | — | |||||||||||||||
| Foreign currency transaction losses (gains) |
5,636 | (232 | ) | — | 845 | — | 1,085 | |||||||||||||||||
| Loss (gain) on sale of disposal or businesses |
257 | 105 | (2,817 | ) | (46 | ) | (880 | ) | (71 | ) | ||||||||||||||
| Unconsolidated affiliates interest, taxes, depreciation and amortization (a) |
1,341 | 2,244 | 156 | 2,689 | — | 2,137 | ||||||||||||||||||
| Special Dividend compensation |
— | — | 22,624 | — | — | — | ||||||||||||||||||
| Contingent consideration remeasurement |
174 | — | 738 | — | (74 | ) | — | |||||||||||||||||
| Stock-based compensation |
5,880 | — | 4,518 | — | 2,080 | — | ||||||||||||||||||
| ESOP deferred stock-based compensation |
12,144 | — | 7,891 | — | 7,283 | — | ||||||||||||||||||
| Transaction costs (b) |
1,448 | — | 1,560 | — | — | — | ||||||||||||||||||
|
|
|
|
|
|
|
|
|
|
|
|
|
|||||||||||||
| Segment Adjusted EBITDA |
$ | 129,067 | $ | 14,710 | $ | 133,996 | $ | 18,759 | $ | 109,652 | $ | 22,647 | ||||||||||||
|
|
|
|
|
|
|
|
|
|
|
|
|
|||||||||||||
| (a) | Includes our proportional share of interest, income taxes, depreciation and amortization related to our South American Joint Venture, our BaySaver Joint Venture and our Tigre-ADS USA Joint Venture, which are accounted for under the equity method of accounting. Fiscal year 2014 includes our proportional share of an asset impairment of $1,022 recorded by our South American Joint Venture. |
| (b) | Represents expenses recorded related to legal, accounting and other professional fees incurred in connection with our debt refinancing, completion of the IPO and secondary public offering and asset acquisitions and dispositions. |
Geographic Sales and Assets Information
Net sales are attributed to the geographic location based on the location of the customer. The table below represents the Net sales and long-lived asset information by geographic location for each of the fiscal years ended March 31:
| (Amounts in thousands) | 2015 | 2014 | 2013 | |||||||||
| Net Sales |
||||||||||||
| North America |
$ | 1,161,909 | $ | 1,046,595 | $ | 996,935 | ||||||
| Other |
18,164 | 21,185 | 20,167 | |||||||||
|
|
|
|
|
|
|
|||||||
| Total |
$ | 1,180,073 | $ | 1,067,780 | $ | 1,017,102 | ||||||
|
|
|
|
|
|
|
|||||||
| (Amounts in thousands) | 2015 | 2014 | ||||||||||
| Long-Lived Assets* |
||||||||||||
| North America |
$ | 387,132 | $ | 357,463 | ||||||||
| Other |
17,081 | 18,422 | ||||||||||
|
|
|
|
|
|||||||||
| Total |
$ | 404,213 | $ | 375,885 | ||||||||
|
|
|
|
|
|||||||||
| * | For segment reporting purposes, long-lived assets include Investments in unconsolidated affiliates, Central parts and Property, plant and equipment. |
F-59
Table of Contents
| 24. | SUPPLEMENTAL DISCLOSURES OF CASH FLOW INFORMATION |
The increase (decrease) in cash due to the changes in working capital accounts for the fiscal years ended March 31, were as follows:
| (Amounts in thousands) | 2015 | 2014 | 2013 | |||||||||
| Changes in working capital: |
||||||||||||
| Receivables |
$ | (10,351 | ) | $ | (5,876 | ) | $ | 24,755 | ||||
| Inventories |
(7,563 | ) | (39,017 | ) | (32,163 | ) | ||||||
| Prepaid expenses and other current assets |
1,953 | (3,298 | ) | 367 | ||||||||
| Accounts payable, accrued expenses, and other liabilities |
(995 | ) | 10,771 | (6,276 | ) | |||||||
|
|
|
|
|
|
|
|||||||
| Total |
$ | (16,956 | ) | $ | (37,420 | ) | $ | (13,317 | ) | |||
|
|
|
|
|
|
|
|||||||
Supplemental disclosures of cash flow information for the fiscal years ended March 31 were as follows:
| (Amounts in thousands) | 2015 | 2014 | 2013 | |||||||||
| Supplemental disclosures of cash flow information — cash paid during years: |
||||||||||||
| Interest |
$ | 18,709 | $ | 17,267 | $ | 18,392 | ||||||
| Income taxes |
$ | 28,503 | $ | 23,701 | $ | 23,924 | ||||||
| (Amounts in thousands) | 2015 | 2014 | 2013 | |||||||||
| Supplemental schedule of noncash investing and financing activities: |
||||||||||||
| Redeemable convertible preferred stock dividend |
$ | 127 | $ | 118 | $ | 110 | ||||||
| Redemption of common stock to exercise stock options |
93 | 1,187 | 805 | |||||||||
| Receivable recorded to exercise stock options |
— | 76 | 142 | |||||||||
| Purchases of plant, property, and equipment included in accounts payable |
124 | 682 | 3,769 | |||||||||
| Receivable recorded for sale of businesses |
600 | 1,241 | 1,800 | |||||||||
| ESOP distributions in common stock |
6,133 | — | — | |||||||||
| Inventory contributed for Investment in unconsolidated affiliate |
— | 1,285 | — | |||||||||
| Assets acquired and obligation incurred under capital lease |
24,047 | 24,902 | 16,715 | |||||||||
| Lease obligation retired upon disposition of leased assets |
779 | 3,708 | 109 | |||||||||
| Reclassification of liability classified stock options upon initial public offering |
1,522 | — | — | |||||||||
| Reclassification of deferred public offering cost asset upon initial public offering |
$ | 456 | $ | — | $ | — | ||||||
F-60
Table of Contents
| 25. | QUARTERLY FINANCIAL INFORMATION (UNAUDITED) |
The following tables set forth certain historical unaudited consolidated condensed quarterly financial information for each of the quarters during the years ended March 31, 2015 and March 31, 2014. This unaudited information has been restated for the effects of the misstatements more fully described in Note 2. Restatement of Previously Issued Financial Statements, has been prepared on a basis consistent with our annual financial statements and includes all adjustments necessary for the fair presentation of the unaudited quarterly data. Additional information about the effects of the restatement on the historical unaudited consolidated condensed quarterly financial information can be found in the Forms 10-Q/A for the quarters ended June 30, 2014, September 30, 2014 and December 31, 2014, which are being filed concurrently with this Form 10-K. The results of operations for any quarter are not necessarily indicative of results that we may achieve for any subsequent periods.
| Fiscal Year 2015 | ||||||||||||||||||||||||||||
| For the Three Months Ended | ||||||||||||||||||||||||||||
| March 31, 2015 | December 31, 2014 | September 30, 2014 | June 30, 2014 | |||||||||||||||||||||||||
| (in thousands, except per share amounts) |
(As Reported) | (As Restated) | (As Reported) | (As Restated) | (As Reported) | (As Restated) | ||||||||||||||||||||||
| Net sales |
$ | 207,054 | $ | 278,176 | $ | 279,871 | $ | 364,724 | $ | 366,714 | $ | 328,297 | $ | 326,434 | ||||||||||||||
| Gross profit |
26,314 | 50,117 | 49,178 | 82,442 | 69,763 | 72,033 | 60,858 | |||||||||||||||||||||
| Net (loss) income |
(13,734 | ) | 499 | (1,953 | ) | 22,768 | 18,997 | 14,669 | 9,441 | |||||||||||||||||||
| Net (loss) income attributable to ADS |
(13,465 | ) | (367 | ) | (3,325 | ) | 22,390 | 16,844 | 14,241 | 8,566 | ||||||||||||||||||
| Net (loss) income per share |
||||||||||||||||||||||||||||
| Basic |
$ | (0.26 | ) | $ | (0.01 | ) | $ | (0.07 | ) | $ | 0.51 | $ | 0.41 | $ | (0.09 | ) | $ | (0.21 | ) | |||||||||
| Diluted |
$ | (0.26 | ) | $ | (0.01 | ) | $ | (0.07 | ) | $ | 0.51 | $ | 0.41 | $ | (0.09 | ) | $ | (0.21 | ) | |||||||||
| Fiscal Year 2014 | ||||||||||||||||||||||||||||||||
| For the Three Months Ended | ||||||||||||||||||||||||||||||||
| March 31, 2014 | December 31, 2013 | September 30, 2013 | June 30, 2013 | |||||||||||||||||||||||||||||
| (in thousands, except per share amounts) |
(As Reported) |
(As Restated) |
(As Reported) |
(As Restated) |
(As Reported) |
(As Restated) |
(As Reported) |
(As Restated) |
||||||||||||||||||||||||
| Net sales |
$ | 181,232 | $ | 181,830 | $ | 261,435 | $ | 260,644 | $ | 333,240 | $ | 332,727 | $ | 293,102 | $ | 292,579 | ||||||||||||||||
| Gross profit |
23,905 | 12,690 | 49,764 | 59,342 | 73,219 | 65,588 | 66,003 | 56,350 | ||||||||||||||||||||||||
| Net (loss) income |
(11,780 | ) | (16,168 | ) | (9,839 | ) | (2,818 | ) | 17,783 | 16,657 | 16,710 | 14,549 | ||||||||||||||||||||
| Net (loss) income attributable to ADS |
(12,170 | ) | (14,210 | ) | (10,324 | ) | (4,877 | ) | 17,322 | 14,740 | 16,296 | 12,974 | ||||||||||||||||||||
| Net (loss) income per share |
||||||||||||||||||||||||||||||||
| Basic |
$ | (0.32 | ) | $ | (0.41 | ) | $ | (0.32 | ) | $ | (0.21 | ) | $ | 0.26 | $ | 0.21 | $ | 0.27 | $ | 0.21 | ||||||||||||
| Diluted |
$ | (0.32 | ) | $ | (0.41 | ) | $ | (0.32 | ) | $ | (0.21 | ) | $ | 0.26 | $ | 0.21 | $ | 0.27 | $ | 0.21 | ||||||||||||
* * * * * *
F-61
Table of Contents
ADVANCED DRAINAGE SYSTEMS, INC. AND SUBSIDIARIES
Consolidated Valuation and Qualifying Accounts for the Fiscal Years Ended March 31, 2015,
2014 and 2013 (in thousands):
Allowance for Doubtful Accounts:
| Year ended March 31, |
Balance at beginning of period |
Charged to costs and expenses |
Charged to other accounts (1) |
Deductions | Balance at end of period |
|||||||||||||||
| 2015 |
$ | 4,490 | $ | 1,914 | $ | (291 | ) | $ | (690 | ) | $ | 5,423 | ||||||||
| 2014 |
6,145 | (71 | ) | (67 | ) | (1,517 | ) | 4,490 | (2) | |||||||||||
| 2013 |
5,359 | 1,687 | (2 | ) | (899 | ) | 6,145 | (2) | ||||||||||||
| (1) | Amounts represent the impact of foreign currency translation. |
| (2) | The allowance for doubtful accounts as previously reported at March 31, 2014 and 2013 was $3,977 and $4,689, respectively. |
F-62
Table of Contents
INDEX TO EXHIBITS
| Exhibit Number |
Description | |
| 3.1 | Amended and Restated Certificate of Incorporation of Advanced Drainage Systems, Inc. (incorporated by reference to Exhibit 3.1 to the Registrant’s Current Report on Form 8-K (File No. 001-36557) filed with the Securities and Exchange Commission on July 30, 2014). | |
| 3.2 | Second Amended and Restated Bylaws of Advanced Drainage Systems, Inc. (incorporated by reference to Exhibit 3.2 to the Registrant’s Current Report on Form 8-K (File No. 001-36557) filed with the Securities and Exchange Commission on July 30, 2014). | |
| 4.1 | Form of Preferred Stock Certificate (incorporated by reference to Exhibit 4.1 to Amendment No. 5 to the Registrant’s Registration Statement on Form S-1 (File No. 333-194980) filed with the Securities and Exchange Commission on July 14, 2014). | |
| 4.2 | Form of Common Stock Certificate (incorporated by reference to Exhibit 4.2 to Amendment No. 5 to the Registrant’s Registration Statement on Form S-1 (File No. 333-194980) filed with the Securities and Exchange Commission on July 14, 2014). | |
| 4.3 | Registration Rights Agreement, dated as of July 30, 2014, by and among Advanced Drainage Systems, Inc. and the stockholders from time to time party thereto (incorporated by reference to Exhibit 4.1 to the Registrant’s Current Report on Form 8-K (File No. 001-36557) filed with the Securities and Exchange Commission on July 30, 2014). | |
| 4.4 | Form of 5.60% Senior Series A Secured Notes due September 24, 2018 (incorporated by reference to Exhibit 4.5 to Amendment No. 3 to the Registrant’s Registration Statement on Form S-1 (File No. 333-194980) filed with the Securities and Exchange Commission on June 20, 2014). | |
| 4.5 | Form of 4.05% Senior Series B Secured Notes due September 24, 2019 (incorporated by reference to Exhibit 4.6 to Amendment No. 3 to the Registrant’s Registration Statement on Form S-1 (File No. 333-194980) filed with the Securities and Exchange Commission on June 20, 2014). | |
| 10.1 | Amended and Restated Credit Agreement, dated as of June 12, 2013, by and among Advanced Drainage Systems, Inc., as borrower, the guarantors from time to time party thereto, the lenders from time to time party thereto, PNC Bank, National Association, as administrative agent for the lenders party thereto, and the other parties thereto (incorporated by reference to Exhibit 10.1 to Amendment No. 2 to the Registrant’s Registration Statement on Form S-1 (File No. 333-194980) filed with the Securities and Exchange Commission on June 6, 2014). | |
| 10.1A | First Amendment to Amended and Restated Credit Agreement, dated as of December 20, 2013 (incorporated by reference to Exhibit 10.1A to Amendment No. 2 to the Registrant’s Registration Statement on Form S-1 (File No. 333-194980) filed with the Securities and Exchange Commission on June 6, 2014). | |
| 10.1B | Second Amendment to Amended and Restated Credit Agreement, dated as of August 21, 2015 (incorporated by reference to Exhibit 10.1 of Form 8-K filed August 26, 2015). | |
| 10.1C | Third Amendment to Amended and Restated Credit Agreement, dated as of December 28, 2015 (incorporated by reference to Exhibit 10.1 of Form 8-K filed December 31, 2015). | |
| 10.1D | Fourth Amendment to Amended and Restated Credit Agreement dated February 17, 2016 (incorporated by reference to Exhibit 10.1 of Form 8-K filed December 31, 2015). | |
| 10.2 | Second Amended and Restated Credit Agreement, dated as of June 12, 2013, by and among ADS Mexicana, S.A. de C.V., as borrower, the lenders party thereto, PNC Bank, National Association, as administrative agent for the lenders party thereto, and the other parties thereto (incorporated by reference to Exhibit 10.2 to Amendment No. 2 to the Registrant’s Registration Statement on Form S-1 (File No. 333-194980) filed with the Securities and Exchange Commission on June 6, 2014). | |
Table of Contents
| Exhibit Number |
Description | |
| 10.2A | First Amendment to Second Amended and Restated Credit Agreement, dated as of December 20, 2013 (incorporated by reference to Exhibit 10.2A to Amendment No. 2 to the Registrant’s Registration Statement on Form S-1 (File No. 333-194980) filed with the Securities and Exchange Commission on June 6, 2014). | |
| 10.2B | Second Amendment to Second Amended and Restated Credit Agreement, dated as of August 21, 2015 (incorporated by reference to Exhibit 10.2 of Form 8-K filed August 26, 2015) | |
| 10.2C | Third Amendment to Second Amended and Restated Credit Agreement, dated as of November 30, 2015 (incorporated by reference to Exhibit 10.1 of Form 8-K filed December 4, 2015. | |
| 10.2D | Fourth Amendment to Second Amended and Restated Credit Agreement, dated as of December 28, 2015 (incorporated by reference to Exhibit 10.2 of Form 8-K filed December 31, 2015). | |
| 10.2E | Fifth Amendment to Second Amended and Restated Credit Agreement, dated as of February 17, 2016 (incorporated by reference to Exhibit 10.2 of Form 8-K filed February 17, 2016). | |
| 10.3 | Amended and Restated Private Shelf Agreement, dated as of September 24, 2010, by and among Advanced Drainage Systems, Inc., as seller, the guarantors from time to time party thereto, Prudential Investment Management, Inc., as a purchaser, and the other purchasers from time to time party thereto (incorporated by reference to Exhibit 10.3 to Amendment No. 2 to the Registrant’s Registration Statement on Form S-1 (File No. 333-194980) filed with the Securities and Exchange Commission on June 6, 2014). | |
| 10.3A | Amendment No. 1 to Amended and Restated Private Shelf Agreement, dated as of December 12, 2011 (incorporated by reference to Exhibit 10.3A to Amendment No. 2 to the Registrant’s Registration Statement on Form S-1 (File No. 333-194980) filed with the Securities and Exchange Commission on June 6, 2014). | |
| 10.3B | Amendment No. 2 to Amended and Restated Private Shelf Agreement, dated as of March 9, 2012 (incorporated by reference to Exhibit 10.3B to Amendment No. 2 to the Registrant’s Registration Statement on Form S-1 (File No. 333-194980) filed with the Securities and Exchange Commission on June 6, 2014). | |
| 10.3C | Amendment No. 3 to Amended and Restated Private Shelf Agreement, dated as of March 30, 2012 (incorporated by reference to Exhibit 10.3C to Amendment No. 2 to the Registrant’s Registration Statement on Form S-1 (File No. 333-194980) filed with the Securities and Exchange Commission on June 6, 2014). | |
| 10.3D | Amendment No. 4 to Amended and Restated Private Shelf Agreement, dated as of April 26, 2013 (incorporated by reference to Exhibit 10.3D to Amendment No. 2 to the Registrant’s Registration Statement on Form S-1 (File No. 333-194980) filed with the Securities and Exchange Commission on June 6, 2014). | |
| 10.3E | Amendment No. 5 to Amended and Restated Private Shelf Agreement, dated as of June 16, 2013 (incorporated by reference to Exhibit 10.3E to Amendment No. 2 to the Registrant’s Registration Statement on Form S-1 (File No. 333-194980) filed with the Securities and Exchange Commission on June 6, 2014). | |
| 10.3F | Supplement to Amendment No. 5 to Amended and Restated Private Shelf Agreement, dated as of June 24, 2013 (incorporated by reference to Exhibit 10.3F to Amendment No. 2 to the Registrant’s Registration Statement on Form S-1 (File No. 333-194980) filed with the Securities and Exchange Commission on June 6, 2014). | |
| 10.3G | Amendment No. 6 to Amended and Restated Private Shelf Agreement, dated as of September 23, 2013 (incorporated by reference to Exhibit 10.3G to Amendment No. 2 to the Registrant’s Registration Statement on Form S-1 (File No. 333-194980) filed with the Securities and Exchange Commission on June 6, 2014). | |
Table of Contents
| Exhibit Number |
Description | |
| 10.3H | Amendment No. 7 to Amended and Restated Private Shelf Agreement, dated as of December 31, 2013 (incorporated by reference to Exhibit 10.3H to Amendment No. 2 to the Registrant’s Registration Statement on Form S-1 (File No. 333-194980) filed with the Securities and Exchange Commission on June 6, 2014). | |
| 10.3I | Amendment No. 8 to Amended and Restated Private Shelf Agreement, dated as of August 21, 2015 (incorporated by reference to Exhibit 10.3 to Form 8-K filed August 26, 2015). | |
| 10.3J | Amendment No. 9 and Consent to Amended and Restated Private Shelf Agreement, dated as of December 28, 2015 (incorporated by reference to Exhibit 10.3 to Form 8-K filed December 31, 2015). | |
| 10.3K | Amendment No. 10 and Consent to Amended and Restated Private Shelf Agreement, dated as of February 17, 2016 (incorporated by reference to Exhibit 10.3 to Form 8-K filed February 17, 2016). | |
| 10.4 | Amended and Restated Security Agreement, dated as of June 12, 2013, by and among Advanced Drainage Systems, Inc., as borrower, the guarantors from time to time party thereto, and PNC Bank, National Association, as collateral agent for certain secured parties (incorporated by reference to Exhibit 10.1A to Amendment No. 2 to the Registrant’s Registration Statement on Form S-1 (File No. 333-194980) filed with the Securities and Exchange Commission on June 6, 2014). | |
| 10.5 | Amended and Restated Pledge Agreement, dated as of June 12, 2013, by Advanced Drainage Systems, Inc. and certain other parties thereto, as pledgors, in favor of PNC Bank, National Association, as collateral agent for certain secured parties (incorporated by reference to Exhibit 10.5 to Amendment No. 2 to the Registrant’s Registration Statement on Form S-1 (File No. 333-194980) filed with the Securities and Exchange Commission on June 6, 2014). | |
| 10.6 | Amended and Restated Intercompany Subordination Agreement, dated as of June 12, 2013, by and among Advanced Drainage Systems, Inc., the guarantors from time to time party thereto, and PNC Bank, National Association, as administrative agent for certain lenders (incorporated by reference to Exhibit 10.6 to Amendment No. 2 to the Registrant’s Registration Statement on Form S-1 (File No. 333-194980) filed with the Securities and Exchange Commission on June 6, 2014). | |
| 10.7 | Amended and Restated Inter-creditor and Collateral Agency Agreement, dated as of June 12, 2013, by and among PNC Bank, National Association, as collateral agent for certain secured parties, PNC Bank, National Association, as administrative agent for certain lenders, and certain noteholders (incorporated by reference to Exhibit 10.7 to Amendment No. 2 to the Registrant’s Registration Statement on Form S-1 (File No. 333-194980) filed with the Securities and Exchange Commission on June 6, 2014). | |
| 10.8† | Advanced Drainage Systems, Inc. Non-Employee Director Compensation Plan (incorporated by reference to Exhibit 10.8 to Amendment No. 4 to the Registrant’s Registration Statement on Form S-1 (File No. 333-194980) filed with the Securities and Exchange Commission on July 2, 2014). | |
| 10.9† | Advanced Drainage Systems, Inc. Amended 2000 Incentive Stock Option Plan (incorporated by reference to Exhibit 10.9 to Amendment No. 3 to the Registrant’s Registration Statement on Form S-1 (File No. 333-194980) filed with the Securities and Exchange Commission on June 20, 2014). | |
| 10.9A† | First Amendment to Amended 2000 Incentive Stock Option Plan (incorporated by reference to Exhibit 10.1 to the Registrant’s Current Report on Form 8-K (File No. 001-36557) filed with the Securities and Exchange Commission on August 15, 2014). | |
| 10.10† | Advanced Drainage Systems, Inc. 2008 Restricted Stock Plan. (incorporated by reference to Exhibit 10.10 to Amendment No. 3 to the Registrant’s Registration Statement on Form S-1 (File No. 333-194980) filed with the Securities and Exchange Commission on June 20, 2014). | |
| 10.11† | Advanced Drainage Systems, Inc. 2013 Stock Option Plan (incorporated by reference to Exhibit 10.11 to Amendment No. 3 to the Registrant’s Registration Statement on Form S-1 (File No. 333-194980) filed with the Securities and Exchange Commission on June 20, 2014). | |
Table of Contents
| Exhibit Number |
Description | |
| 10.11A† | First Amendment to 2013 Stock Option Plan (incorporated by reference to Exhibit 10.2 to the Registrant’s Current Report on Form 8-K (File No. 001-36557) filed with the Securities and Exchange Commission on August 15, 2014). | |
| 10.12† | Amended and Restated Executive Employment Agreement, dated as of June 20, 2014, by and between Advanced Drainage Systems, Inc. and Joseph A. Chlapaty (incorporated by reference to Exhibit 10.12 to Amendment No. 3 to the Registrant’s Registration Statement on Form S-1 (File No. 333-194980) filed with the Securities and Exchange Commission on June 20, 2014). | |
| 10.13† | Amended and Restated Executive Employment Agreement, dated as of June 20, 2014, by and between Advanced Drainage Systems, Inc. and Mark B. Sturgeon (incorporated by reference to Exhibit 10.13 to Amendment No. 3 to the Registrant’s Registration Statement on Form S-1 (File No. 333-194980) filed with the Securities and Exchange Commission on June 20, 2014). | |
| 10.14† | Amended and Restated Executive Employment Agreement, dated as of June 20, 2014, by and between Advanced Drainage Systems, Inc. and Thomas M. Fussner (incorporated by reference to Exhibit 10.14 to Amendment No. 3 to the Registrant’s Registration Statement on Form S-1 (File No. 333-194980) filed with the Securities and Exchange Commission on June 20, 2014). | |
| 10.15† | Amended and Restated Executive Employment Agreement, dated as of June 20, 2014, by and between Advanced Drainage Systems, Inc. and Ronald R. Vitarelli (incorporated by reference to Exhibit 10.15 to Amendment No. 3 to the Registrant’s Registration Statement on Form S-1 (File No. 333-194980) filed with the Securities and Exchange Commission on June 20, 2014). | |
| 10.16† | Amended and Restated Executive Employment Agreement, dated as of June 20, 2014, by and between Advanced Drainage Systems, Inc. and Robert M. Klein (incorporated by reference to Exhibit 10.16 to Amendment No. 3 to the Registrant’s Registration Statement on Form S-1 (File No. 333-194980) filed with the Securities and Exchange Commission on June 20, 2014). | |
| 10.17† | Form of Indemnification Agreement. (incorporated by reference to Exhibit 10.6 to Amendment No. 2 to the Registrant’s Registration Statement on Form S-1 (File No. 333-194980) filed with the Securities and Exchange Commission on June 6, 2014). | |
| 10.18† | Form of Incentive Stock Option Agreement pursuant to 2000 Incentive Stock Option Plan (incorporated by reference to Exhibit 10.18 to Amendment No. 3 to the Registrant’s Registration Statement on Form S-1 (File No. 333-194980) filed with the Securities and Exchange Commission on June 20, 2014). | |
| 10.18A† | Form of Incentive Stock Option Agreement (post-IPO) pursuant to 2000 Incentive Stock Option Plan. # | |
| 10.19† | Form of Non-Qualified Stock Option Agreement (other than for Joseph A. Chlapaty) pursuant to 2013 Stock Option Plan (incorporated by reference to Exhibit 10.19 to Amendment No. 3 to the Registrant’s Registration Statement on Form S-1 (File No. 333-194980) filed with the Securities and Exchange Commission on June 20, 2014). | |
| 10.19A† | Form of Non-Qualified Stock Option Agreement (for Joseph A. Chlapaty) pursuant to 2013 Stock Option Plan (incorporated by reference to Exhibit 10.19A to Amendment No. 3 to the Registrant’s Registration Statement on Form S-1 (File No. 333-194980) filed with the Securities and Exchange Commission on June 20, 2014). | |
| 10.20† | Form of Restricted Stock Agreement (other than for Joseph A. Chlapaty) pursuant to 2008 Restricted Stock Plan (incorporated by reference to Exhibit 10.20 to Amendment No. 3 to the Registrant’s Registration Statement on Form S-1 (File No. 333-194980) filed with the Securities and Exchange Commission on June 20, 2014). | |
| 10.20A† | Form of Restricted Stock Agreement (for Joseph A. Chlapaty) pursuant to 2008 Restricted Stock Plan (incorporated by reference to Exhibit 10.20A to Amendment No. 3 to the Registrant’s Registration Statement on Form S-1 (File No. 333-194980) filed with the Securities and Exchange Commission on June 20, 2014). | |
Table of Contents
| Exhibit Number |
Description | |
| 10.21† | Form of Director Stock Agreement (incorporated by reference to Exhibit 10.21 to Amendment No. 4 to the Registrant’s Registration Statement on Form S-1 (File No. 333-194980) filed with the Securities and Exchange Commission on July 2, 2014). | |
| 10.22 | Participation Agreement, dated as of July 17, 2000, by and between ADS Worldwide, Inc., Grupo Altima S.A. de C.V., and ADS Mexicana, S.A. de C.V. (formerly known as Sistemas Ecologicos de Drenaje, S.A. de C.V.), as amended on April 19, 2010, May 19, 2011, May 24, 2011, April 26, 2013 and January 31, 2014 (incorporated by reference to Exhibit 10.22 to Amendment No. 2 to the Registrant’s Registration Statement on Form S-1 (File No. 333-194980) filed with the Securities and Exchange Commission on June 6, 2014). | |
| 10.23 | Interestholders Agreement, dated as of June 5, 2009, by and among Tubos y Plasticos ADS Chile Limitada, Tigre Chile S.A., and Tuberias T-A Limitada, joined by Advanced Drainage Systems, Inc. and Tigre S.A. — Tubos e Conexoes, as amended on July 31, 2009, October 2009, December 15, 2009, May 18, 2010, August 10, 2010, April 1, 2011 and January 25, 2012, with First Addendum to Interestholders Agreement, dated as of June 27, 2011 (incorporated by reference to Exhibit 10.23 to Amendment No. 3 to the Registrant’s Registration Statement on Form S-1 (File No. 333-194980) filed with the Securities and Exchange Commission on June 20, 2014). | |
| 10.23A | Second Addendum to Interestholders Agreement, dated as of December 1, 2013 but entered into on September 30, 2014, by and among Tubos y Plasticos ADS Chile Limitada, Tigre Chile S.A., Tuberias Tigre-ADS Limitada, Advanced Drainage Systems, Inc. and Tigre S.A. — Tubos e Conexoes (incorporated by reference to Exhibit 10.3 to the Registrant’s Quarterly Report on Form 10-Q (File No. 001-36557) filed with the Securities and Exchange Commission on November 10, 2014). | |
| 10.24 | Limited Liability Company Agreement, dated July 15, 2013, by and among ADS Ventures, Inc., BaySaver Technologies, Inc. and Mid-Atlantic Storm Water Research Center, Inc. formerly known as Sistemas Ecologicos de Drenaje, S.A. de C.V.), as amended on April 19, 2010, May 19, 2011, May 24, 2011, April 26, 2013 and January 31, 2014 (incorporated by reference to Exhibit 10.24 to Amendment No. 2 to the Registrant’s Registration Statement on Form S-1 (File No. 333-194980) filed with the Securities and Exchange Commission on June 6, 2014). | |
| 10.24A | Amendment No. 1 to BaySaver Technologies, LLC Limited Liability Company Agreement dated as of July 17, 2015 by and among ADS Ventures, Inc., BaySaver Technologies, Inc. and Mid-Atlantic Storm Water Research Center, Inc. (incorporated by reference to Exhibit 10.2 to Form 8-K filed July 20, 2015) | |
| 10.24B | Sale and Assignment of Ownership Interest dated as of July 17, 2015 by and among ADS Ventures, Inc., BaySaver Technologies, Inc. and Mid-Atlantic Storm Water Research Center, Inc. (incorporated by reference to Exhibit 10.1 to Form 8-K filed July 20, 2015) | |
| 10.25 | USA Shareholders Agreement, dated as of April 7, 2014, by and among Tigre-ADS USA Inc., ADS Ventures, Inc. and Tigre S.A. — Tubos e Conexoes (incorporated by reference to Exhibit 10.25 to Amendment No. 4 to the Registrant’s Registration Statement on Form S-1 (File No. 333-194980) filed with the Securities and Exchange Commission on July 2, 2014). | |
| 10.26† | Executive Employment Agreement dated November 9, 2015, by and between the Company and Scott A. Cottrill (incorporated by reference to Exhibit 10.1 to Form 8-K filed November 9, 2015). | |
| 21.1 | List of Subsidiaries. # | |
| 23.1 | Consent of Deloitte & Touche LLP. # | |
| 24.1 | Power of Attorney (contained on signature pages hereto) | |
Table of Contents
| Exhibit Number |
Description | |
| 31.1 | Certification of President and Chief Executive Officer of Advanced Drainage Systems, Inc. pursuant to Section 302 of the Sarbanes-Oxley Act of 2002. # | |
| 31.2 | Certification of Executive Vice President and Chief Financial Officer of Advanced Drainage Systems, Inc. pursuant to Section 302 of the Sarbanes-Oxley Act of 2002. # | |
| 32.1 | Certification of Principal Executive Officer of Advanced Drainage Systems, Inc. pursuant to 18 U.S.C. Section 1350, as adopted pursuant to Section 906 of the Sarbanes-Oxley Act of 2002. # | |
| 32.2 | Certification of Principal Financial Officer of Advanced Drainage Systems, Inc. pursuant to 18 U.S.C. Section 1350, as adopted pursuant to Section 906 of the Sarbanes-Oxley Act of 2002. # | |
| 101.INS | XBRL Instance Document. # | |
| 101.SCH | XBRL Taxonomy Extension Schema. # | |
| 101.CAL | XBRL Taxonomy Extension Calculation Linkbase. # | |
| 101.DEF | XBRL Taxonomy Extension Definition Linkbase. # | |
| 101.LAB | XBRL Taxonomy Extension Label Linkbase. # | |
| 101.PRE | XBRL Taxonomy Extension Presentation Linkbase. # | |
| † | Management contract or compensatory plan. |
| # | Filed herewith. |