Attached files
| file | filename |
|---|---|
| EX-23.1 - EXHIBIT 23.1 - STONEGATE MORTGAGE CORP | a201510-kexhibit231.htm |
| EX-21.1 - EXHIBIT 21.1 - STONEGATE MORTGAGE CORP | a201510-kexhibit211.htm |
| EX-32.1 - EXHIBIT 32.1 - STONEGATE MORTGAGE CORP | a201510k-exhibit321.htm |
| EX-31.1 - EXHIBIT 31.1 - STONEGATE MORTGAGE CORP | a201510k-exhibit311.htm |
| EX-31.2 - EXHIBIT 31.2 - STONEGATE MORTGAGE CORP | a201510k-exhibit312.htm |
| EX-10.38 - EXHIBIT 10.38 - STONEGATE MORTGAGE CORP | a201510-kexhibit1038.htm |
| EX-10.26 - EXHIBIT 10.26 - STONEGATE MORTGAGE CORP | a201510-kxexhibit1026.htm |
| EX-10.25 - EXHIBIT 10.25 - STONEGATE MORTGAGE CORP | a201510-kxexhibit1025.htm |
| EX-10.20 - EXHIBIT 10.20 - STONEGATE MORTGAGE CORP | a201510-kxexhibit1020.htm |
| EX-10.37 - EXHIBIT 10.37 - STONEGATE MORTGAGE CORP | a201510-kexhibiteverbank.htm |
| EX-32.2 - EXHIBIT 32.2 - STONEGATE MORTGAGE CORP | a201510k-exhibit322.htm |
UNITED STATES
SECURITIES AND EXCHANGE COMMISSION
Washington, D. C. 20549
____________________
FORM 10-K
____________________
(Mark One) | |
ý | ANNUAL REPORT PURSUANT TO SECTION 13 OR 15(d) OF THE SECURITIES EXCHANGE ACT OF 1934 |
For the fiscal year ended December 31, 2015
OR
¨ | TRANSITION REPORT PURSUANT TO SECTION 13 OR 15(d) OF THE SECURITIES EXCHANGE ACT OF 1934 |
For the transition period from to
Commission file number: 001-36116
____________________
Stonegate Mortgage Corporation
(Exact name of registrant as specified in its charter)
____________________
Ohio | 34-1194858 |
(State or other jurisdiction of incorporation or organization) | (I.R.S. Employer Identification Number) |
9190 Priority Way West Drive, Suite 300 Indianapolis, Indiana | 46240 |
(Address of principal executive offices) | (Zip Code) |
Registrant’s telephone number, including area code: (317) 663-5100
Securities registered pursuant to Section 12(b) of the Act:
Title of Each Class | Name of each exchange on which registered | |
Common Stock, $0.01 par value | New York Stock Exchange | |
Securities registered pursuant to Section 12(g) of the Act: NONE
Indicate by check mark if the registrant is a well-known seasoned issuer, as defined in Rule 405 of the Securities Act. Yes ¨ No ý
Indicate by check mark if the registrant is not required to file reports pursuant to Section 13 or Section 15(d) of the Exchange Act. Yes ¨ No ý
Indicate by check mark whether the registrant (1) has filed all reports required to be filed by Section 13 or 15(d) of the Securities Exchange Act of 1934 during the preceding 12 months (or for such shorter period that the registrant was required to file such reports), and (2) has been subject to such filing requirements for at least the past 90 days. Yes ý No ¨
Indicate by check mark whether the registrant has submitted electronically and posted on its corporate Web site, if any, every Interactive Data File required to be submitted and posted pursuant to Rule 405 of Regulation S-T (§232.405 of this chapter) during the preceding 12 months (or for such shorter period that the registrant was required to submit and post such files). Yes ý No ¨
Indicate by check mark if disclosure of delinquent filers pursuant to Item 405 of Regulation S-K (§229.405 of this chapter) is not contained herein, and will not be contained, to the best of the registrant's knowledge, in definitive proxy or information statements incorporated by reference in Part III of this Form 10-K or any amendment to this Form 10-K. ý
Indicate by check mark whether the registrant is a large accelerated filer, an accelerated filer, a non-accelerated filer, or a smaller reporting company. See the definitions of “large accelerated filer”, “accelerated filer”, and “smaller reporting company” in Rule 12b-2 of the Exchange Act (Check one):
Large accelerated filer | ¨ | Accelerated filer | ý | |
Non-accelerated filer | ¨ | (Do not check if a smaller reporting company) | Smaller reporting company | ¨ |
Indicate by check mark whether the registrant is a shell company (as defined in Rule 12b-2 of the Exchange Act). Yes ¨ No ý
As of June 30, 2015, the last business day of the registrant’s most recently completed second fiscal quarter, the aggregate market value of the registrant's common stock held by non-affiliates of the registrant was approximately $153,146,161 based on the closing sale price of $10.07, as reported on the New York Stock Exchange.
As of February 29, 2016, 25,797,744 shares of the registrant's common stock, $0.01 par value, were outstanding.
DOCUMENTS INCORPORATED BY REFERENCE
Part III of this Annual Report on Form 10-K incorporates by reference information from the registrant's Definitive Proxy Statement for the 2015 Annual Meeting of Shareholders.
Stonegate Mortgage Corporation
Annual Report on Form 10-K
For the Year Ended December 31, 2015
Table of Contents
2
CAUTIONARY NOTE CONCERNING FORWARD-LOOKING STATEMENTS
Various statements contained in this Annual Report on Form 10-K, including those that express a belief, expectation or intention, as well as those that are not statements of historical fact, are forward-looking statements. These forward-looking statements may include projections and estimates concerning the timing and success of specific projects and our future production, revenues, income and capital spending. Our forward- looking statements are generally accompanied by words such as “estimate,” “project,” “predict,” “believe,” “expect,” “intend,” “anticipate,” “potential,” “plan,” “goal” or other words that convey the uncertainty of future events or outcomes. The forward-looking statements in this Annual Report on Form 10-K speak only as of the date of this Annual Report on Form 10-K; we disclaim any obligation to update these statements unless required by law, and we caution you not to rely on them unduly. We have based these forward-looking statements on our current expectations and assumptions about future events. While our management considers these expectations and assumptions to be reasonable, they are inherently subject to significant business, economic, competitive, regulatory and other risks, contingencies and uncertainties, most of which are difficult to predict and many of which are beyond our control. These and other important factors, including those discussed under “Risk Factors” may cause our actual results, performance or achievements to differ materially from any future results, performance or achievements expressed or implied by these forward-looking statements. These risks, contingencies and uncertainties include, but are not limited to, the following:
• | our ability to compete successfully in the highly competitive mortgage loan origination, mortgage loan servicing and mortgage loan financing industries; |
• | experiencing financial difficulties like some originators and mortgage servicers have experienced; |
• | adverse changes in the residential mortgage market; |
• | our ability to obtain sufficient capital to meet our operating requirements; |
• | our ability to sustain profitable loan origination volumes; |
• | the possible geographic concentration of our servicing portfolio may result in a higher rate of delinquencies and/or defaults; |
• | our mortgage financing business is subject to risks, including the risk of default and competitive risks; |
• | our estimates may prove to be imprecise and result in significant changes in financial performance, including fair value measurements; |
• | the impact on our business of federal, state and local laws and regulations concerning loan servicing, loan origination, loan modification or the licensing of individuals and entities that engage in these activities; |
• | changes in existing U.S. government-sponsored mortgage programs; |
• | changes in laws and regulations affecting the relationship between Fannie Mae and Freddie Mac and the U.S. federal government, along with the conservatorship of Fannie Mae and Freddie Mac and related efforts; |
• | substantial compliance costs arising from state licensing and state and federal operational requirements, including the Truth In Lending Act ("TILA") and Real Estate Settlement Procedures Act ("RESPA") Integrated Disclosure rule; |
• | loss of our licenses; |
• | our ability to originate and/or acquire mortgage servicing rights; |
• | our ability to recover our significant investments in personnel and our technology platform; |
• | the accuracy and completeness of information we receive about borrowers and counterparties; |
• | increases in delinquencies and defaults may adversely affect our business, financial condition and results of operations; |
• | our ability to recapture mortgage loans from borrowers who refinance; |
• | changes in prevailing interest rates and any corresponding effects on origination volumes or the value of our assets; |
• | our growth may be difficult to sustain and manage and may place significant demands on our administrative, operational and financial resources; |
• | our ability to realize all of the anticipated benefits of our acquisitions; |
3
• | the change of control rules under Section 382 of the Internal Revenue Code of 1986, as amended (the "Code"), may limit our ability to use net operating loss carryforwards to reduce future taxable income; |
• | failure to establish and maintain an effective system of internal controls; |
• | errors in our financial models or changes in assumptions; |
• | our ability to adapt to and implement technological changes; |
• | the impact of the ongoing implementation of the Dodd-Frank Wall Street Reform and Consumer Act of 2010 (the "Dodd-Frank Act") on our business activities and practices, costs of operations and overall results of operations; |
• | state or federal governmental examinations, legal proceedings or enforcement actions and related costs; |
• | increased costs and related losses if a borrower challenges the validity of a foreclosure action, if a court overturns a foreclosure or if a foreclosure subjects us to environmental liabilities; |
• | the impact of the termination of our servicing rights by counterparties; |
• | federal and state legislative and agency initiatives in mortgage-backed securities and securitization; |
• | we may be required to indemnify purchasers of the loans we originate or of the MBS backed by such loans or repurchase the related loans, if the loans fail to meet certain criteria or characteristics or under other circumstances; |
• | our inability to negotiate our fees with Fannie Mae, Freddie Mac, Ginnie Mae or other investors for the purchase of our loans; |
• | delays in our ability to collect or be reimbursed for servicing advances; |
• | our ability to successfully mitigate our risks through hedging strategies; |
• | our ability to obtain servicer ratings in a timely manner, or at all; |
• | failure of our internal security measures or breach of our privacy protections; |
• | losses due to fraudulent and negligent acts on the part of loan applicants, brokers, other vendors, existing customers, our employees and other third parties; |
• | failure of our vendors to comply with servicing criteria; |
• | the loss of the services of one or more of the members of our executive management team; |
• | failure to attract and retain a highly skilled work force; |
• | an active trading market for our stock may not be sustained; |
• | future sales of our common stock or other securities convertible into our common stock could cause the market value of our common stock to decline and could result in dilution; and |
• | future offerings of debt securities or preferred stock and future offerings of equity securities that may be senior to our common stock for the purposes of dividend and liquidating distributions, may adversely affect the market price of our common stock. |
References in this Annual Report on Form 10-K to the terms "we," "our," "us," "Stonegate" or the "Company" refer to Stonegate Mortgage Corporation and its consolidated subsidiaries, as the context requires.
4
PART I
ITEM 1. BUSINESS
Overview
We are a leading, non-bank mortgage company focused on originating, financing and servicing U.S. residential mortgage loans. We operate as an intermediary between residential mortgage borrowers and the ultimate investors of mortgages through originating, financing, and servicing U.S. residential mortgages. We were initially incorporated in the State of Indiana in January 2005. As a result of an acquisition and subsequent merger with Swain Mortgage Company in 2009, we are now an Ohio corporation. Our integrated and scalable residential mortgage banking platform includes a diversified origination business which includes a network of third party originators consisting of mortgage brokers, mortgage bankers and financial institutions (banks and credit unions), a retail branch network and a direct to consumer call center. We are committed to delivering consistent and sustainable value to our shareholders by constantly improving our overall quality and compliance, maximizing our overall efficiency, productivity, and effectiveness and enhancing our customer and associate satisfaction levels.
We predominantly transfer mortgage loans into pools of Government National Mortgage Association ("Ginnie Mae" or "GNMA") mortgage backed securities ("MBS") and sell mortgage loans to the Federal National Mortgage Association ("Fannie Mae" or "FNMA") and the Federal Home Loan Mortgage Corporation ("Freddie Mac" or "FHLMC"). Both FNMA and FHLMC are considered government-sponsored enterprises ("GSEs"). We typically retain the right to service the mortgage for GNMA, FNMA and FHLMC. We also sell mortgage loans to over a dozen other third-party investors in the secondary market and provide short-term financing through our NattyMac, LLC ("NattyMac") subsidiary to third party correspondent lenders. As of December 31, 2015, we were licensed to originate and service residential mortgage loans in 48 states and the District of Columbia, and we are an approved Seller/Servicer of FNMA, FHLMC and GNMA.
We operate three identifiable business segments: Originations, Servicing and Financing. This determination is based on our current organizational structure, which reflects how our chief operating decision maker evaluates the performance of our business. Our mortgage origination business generates income primarily through origination fees and gains upon the sale of mortgage loans sourced through our correspondent, wholesale and retail channels. We also provide financing to our correspondent customers and others while they are accumulating loans prior to selling them to aggregators, including ourselves, through our mortgage financing business and we earn interest and fee income for these services. We also have the ability to retain the mortgage servicing rights ("MSRs") on the loans we sell and to create a recurring servicing income stream in our mortgage servicing business. We believe our three segments are complementary and provide us with the ability to effectively and efficiently source, finance, sell and service mortgage loans.
Mortgage Originations
Our mortgage origination business primarily originates and sells residential mortgage loans, which conform to the underwriting guidelines of the GSEs and government agencies. We also originate and sell loans to third-party investors in the secondary market ("non-agency"), which generally conform to the underwriting guidelines of the GSEs, but may exceed the maximum loan size allowed for single unit properties.
We are committed to providing our customers with the tools and resources they need to be successful in today's marketplace. During 2015, we invested in our technology platform in a dedicated effort to increase efficiencies throughout our origination business and to deliver a superior mortgage product, with exceptional customer service, which distinguishes us from our competitors. We plan to continue to grow our mortgage origination business through this exceptional customer service within our existing portfolio and markets.
We offer the following mortgage loan products:
◦ | Government Mortgage Loans: First-lien mortgage loans secured by single-family residences that are insured by the Federal Housing Administration ("FHA") or guaranteed by the Veterans Administration ("VA") or guaranteed by the United States Department of Agriculture ("USDA") and are securitized into Ginnie Mae securities. |
◦ | Prime1 Conforming Mortgage Loans: Prime credit quality first-lien mortgage loans (i.e., mortgage loans that, in the event of default, have priority over all other liens or claims) secured by single-family residences that meet or “conform” to the underwriting standards established by Fannie Mae or Freddie Mac for inclusion in their guaranteed mortgage securities programs. |
5
◦ | Prime1 Non-Conforming Mortgage Loans: Prime credit quality first-lien mortgage loans secured by single-family residences that do not conform to the underwriting standards established by Fannie Mae or Freddie Mac, because they have original principal amounts exceeding Fannie Mae and Freddie Mac limits, which are commonly referred to as jumbo mortgage loans. |
◦ | Non-agency Loans: Loans that meet the underwriting standards of our third-party investors in the secondary market. |
1 We generally consider prime mortgage loans to be those with Fair Isaac Corporation ("FICO") scores greater than 620.
We originate residential mortgage loans through three channels: correspondent, wholesale and retail. We have continued to diversify our origination business in order to be successful in multiple market scenarios. While the channels are diverse, we constantly focus on quality control and maintaining high underwriting standards. We perform diligence on and underwrite loans through our proprietary technology platform, Stonegate Connect, an integrated, automated risk-based due diligence engine that automates the review process by applying business rules specific to the loan and the seller. We analyze credit, collateral and compliance risk on every loan on a pre-funding or a pre-purchase basis in order to ensure that each loan meets our investors’ standards and any applicable regulatory rules. We also capture loan data and documents associated with the loan from application through sale/securitization and servicing, giving us the ability to run additional business rules that provide indication of loan performance. We believe that the ability to offer greater transparency and data to institutional investors that purchase our loans or securities backed by our loans will provide us with a substantial advantage over our competitors in our sales executions as the mortgage market continues to evolve and we begin to securitize our own non-agency mortgage loans or grow our whole loan sales to non-agency investors.
Our three mortgage loan originations channels are discussed in more detail below.
Correspondent Channel
We acquire newly originated loans conforming to the underwriting standards of the GSEs or government agencies as well as non-agency mortgage loans conforming to the standards of our investors from our network of correspondents across 48 states plus the District of Columbia. We identify our correspondent customers through a team of relationship managers who are responsible for building and maintaining customer relationships and ensuring that we receive an adequate share of their origination volume. We offer our correspondents access to a state-of-the-art technology platform (Stonegate Connect), and warehouse funding through our financing platform NattyMac, through a separate approval process, that offers benefits when selling loans to Stonegate Mortgage. In return, our correspondents provide us with high quality products that meet our underwriting standards. We track the performance of our correspondents on a score-card and terminate relationships where quality and other requirements are not met. We believe that our programs offer correspondents an attractive value proposition, including greater access to capital and liquidity, as they seek to maintain and grow their businesses.
We conduct financial, operational and risk reviews of each correspondent prior to initially approving them as a customer and on an annual basis to ensure compliance with our guidelines and those of the various agencies that regulate our business. In addition, we conduct background and financial reviews of the principals and their mortgage loan officers. Our growth has been driven by adding new correspondents as well as deepening relationships with existing correspondents. Our correspondent channel represented 64%, 66% and 74% of our mortgage originations for the years ended December 31, 2015, 2014 and 2013, respectively. Originations for this channel were $7.2 billion in 2015, $7.9 billion in 2014 and $6.4 billion in 2013. To offset the impact of increased competitive pricing within this channel, we will focus our future efforts on re-engaging established dormant customers to further increase our origination volume with them. The decrease in percentage of our overall portfolio partially arises from increased pricing competition within the channel. We believe that as we continue to increase our coverage of correspondents, and mature in existing as well as enter new markets, we will continue to increase our correspondent loan volume.
Wholesale Channel
We provide a variety of agency, government insured and non-agency mortgage loan products to approved brokers to allow them to better service their borrowers. Before approving a mortgage broker for business, we focus on several attributes including origination volume, quality of originations and tangible net worth. We also conduct financial and background checks on the principals and their mortgage loan officers through various third-party sources. Once we begin acquiring loans from our mortgage brokers, we track the performance of the loans on an on-going basis and terminate business relationships if the loans consistently do not perform or if there is evidence of misrepresentation. During the year ended December 31, 2015, we did not terminate any significant relationships due to our continued focus on underwriting loans and ensuring compliance with policies. We expect to see a continued increase in our non-agency mortgage loan originations, which provide innovative products that
6
meet borrowers' demands and investors' return thresholds. Accordingly, we expect we will expand our settlements of non-agency loans through sales to the whole loan market or private label securitizations to third party investors at a future date.
Through our wholesale channel, we originate loans through a network of approximately 1,379 non-exclusive relationships with various approved mortgage companies and mortgage brokers. This channel accounted for 23%, 24% and 19% of our originations for the years ended December 31, 2015, 2014 and 2013, respectively. Originations for this channel were $2.6 billion in 2015, $2.8 billion in 2014 and $1.6 billion in 2013. Mortgage brokers identify applicants, help them complete a loan application, gather required information and documents and act as our liaison with the borrower during the lending process. We review and underwrite an application submitted by a broker, accept or reject the application, determine the range of interest rates and other loan terms, and fund the loan upon acceptance by the borrower and satisfaction of all conditions to the loan in much the same manner as our retail channel. By relying on brokers to market our products and assist the borrower throughout the loan application process, we can increase loan volume through our wholesale channel with proportionately lower investment in overhead costs compared with the costs of increasing loan volume through loan originations in our distributed retail channels.
Retail Channel
In this channel, mortgage advisors, as employees of Stonegate, either originate loans through their relationships with local real estate agents, builders, telemarketing and other local contacts in one of our retail branch offices, or work in our Stonegate Direct division, a call center that purchases leads for mortgage loans and works directly with consumers over the phone. During the year ended December 31, 2015, we decreased our retail branch footprint, to better manage the expenses associated with retail originations. As of December 31, 2015, our retail channel primarily operated through 21 retail offices across 11 states. This channel accounted for 13%, 10% and 7% of our originations from continuing operations for the years ended December 31, 2015, 2014 and 2013, respectively. Originations from continuing operations for this channel were $1.5 billion in 2015, $1.2 billion in 2014 and $0.6 billion in 2013. With our remaining physical branch locations, we will focus on increasing our profitability through the hiring of additional advisors and leveraging within existing markets. Stonegate Direct provides consumers across the United States with direct access to mortgage advisors to facilitate 24 hour, seven days a week, access to our mortgage products and services. The creation of this division greatly enhances and simplifies the customer experience and home loan application process for qualified customers by providing quick, secure, online access for homebuyers and those looking to refinance. Stonegate Direct was formed through the integration of the call center operations of Crossline, which was acquired in December 2013. The creation of this division is part of our initiative to deliver a superior mortgage product and exceptional customer service that are our points of distinction from competitors in the marketplace.
Mortgage Servicing
Our mortgage servicing business is organized to maintain a high quality servicing portfolio and keep delinquency rates below the industry average. We perform loan administration, collection and default activities, including the collection and remittance of loan payments, responding to customer inquiries, accounting for principal and interest, holding custodial (impound) funds for the payment of property taxes and insurance premiums, counseling delinquent mortgagors, modifying loans and supervising foreclosures and our property dispositions. We focus on optimizing our operating platform technology, external interfaces related to the support of our default areas and continuous review of our internal processes to increase efficiencies, improve our performance quality and support our ability for continued growth.
Our servicing model, along with the newly created Stonegate Direct, is very focused on “recapture,” which involves actively working with existing borrowers to refinance their mortgage loans with Stonegate if it is advantageous for the borrower. When a loan is paid off or refinanced with a different lender, we lose the servicing fees on the loan, so our ability to recapture loans successfully is important to the longevity of our servicing cash flows. Because the refinanced loans typically have lower interest rates or lower monthly payments, and, in general, subsequently refinance more slowly and default less frequently, these refinancings also typically improve the overall quality of our servicing portfolio.
Our servicing business produces strong recurring, contractual fee-based revenue with minimal credit risk. Servicing fees are primarily based on the aggregate unpaid principal balance ("UPB") of the loans serviced and the payment structure varies by loan source and type. These include differences in rate of servicing fees as a percentage of UPB and in the structure of advances. We believe our origination business gives us a distinct advantage in building a high-quality portfolio of MSRs over those who rely heavily on purchasing MSRs from others to build their portfolios as originated portfolios generally perform better given the extensive diligence and underwriting procedures that we apply to each loan. In addition, there is a tax benefit associated with originated MSRs in that no MSRs asset is created and tax income is derived from the servicing revenue as opposed to an asset being created and amortized over a set period of time for purchased MSRs.
7
We service loans using a model designed to improve loan performance and reduce loan defaults and foreclosures. Our servicing portfolio consists of MSRs we retain from loans that we originate and MSRs we acquire from third party originators, including in transactions facilitated by GSEs. The loans we service are typically securitized by us, i.e., the loans have been pooled together with multiple other loans and interests have been sold to third party investors that are secured by loans in the securitization pool. We are prepared to act either as a buyer or a seller, and/or subservicer, of MSRs, depending on existing market conditions and our liquidity needs. We successfully executed on this strategy by selling nearly $8.8 billion and $3.8 billion in MSRs during the years ended December 31, 2015 and 2014, respectively. We did not sell any of our MSRs during the year ended December 31, 2013.
The table below contains information related to the mortgage loans in our servicing portfolio as of December 31, 2015 and 2014:
December 31, | |||||||
2015 | 2014 | ||||||
Servicing portfolio ($UPB in thousands) | $ | 17,520,731 | 18,336,745 | ||||
Weighted average coupon | 4.02 | % | 4.10 | % | |||
Weighted average age (in months) | 16 | 12 | |||||
90+ day delinquency rate | 0.60 | % | 0.63 | % | |||
Weighted average FICO score | 725 | 720 | |||||
Gross constant prepayment rate 1 | 18.00 | % | 9.45 | % | |||
1 Represents the rate at which a pool of mortgage loans' remaining balance is prepaid each month. The rate is calculated on an annualized basis and expressed as a percentage of the outstanding principal balance.
Mortgage Financing
In June 2013, we consolidated our fully integrated financing platform, known as NattyMac, into a wholly-owned subsidiary to focus on providing warehouse financing to Stonegate Mortgage correspondent customers and other approved mortgage bankers. The fully integrated financing platform, acquired in August 2012, allows us to leverage our proprietary technology and our existing due diligence and underwriting processes to efficiently underwrite the warehouse lines of credit it provides for its customers. We believe that NattyMac is highly scalable with little additional fixed cost investment needed to grow our customer base. This also creates an additional source of funding for our correspondents to originate mortgage loans that meet our underwriting requirements and are eligible for purchase by Stonegate Mortgage as well as other investors. We are currently financing NattyMac’s warehouse lending operations by selling a participating interest in the warehouse line of credit to an approved third party institution.
Our financing platform features a centralized custodian and disbursement agent allowing us to enter into participation arrangements with financial institutions, such as regional banks, for an interest in our newly originated warehouse lines of credit. By offering regional banks an opportunity to invest in a liquid high-quality asset, we are able to earn net interest income. By partnering with regional banks and other investors, we believe it allows us to compete with other bank-owned warehouse lenders who have traditionally dominated this market. We are also able to share in the interest income with the regional banks and other investors to increase revenue. On April 15, 2014, we entered into an agreement whereby we invested in the subordinate debt of Merchants Bancorp, which, in turn, agreed to capitalize NattyMac Funding, Inc. (“NMF”) to invest in participation interests in warehouse lines of credit originated by us. We participate in the earnings of NMF alongside Merchants Bancorp. On April 23, 2015, we entered into an agreement to sell a participating interest in our warehouse lines of credit to Citizens Bank & Trust Company, as an additional source of liquidity.
As of December 31, 2015, NattyMac had 114 approved warehouse customers, resulting in commitments of $571.5 million.
Significant Transactions and Recent Developments
(Dollar Amounts In Thousands or As Otherwise Stated Herein)
Sale/Disposal of Retail Branches
During the third quarter of 2015, we initiated a plan to decrease our retail branch footprint, to better manage the expenses associated with retail originations. On October 29, 2015, we sold to an unrelated third party certain assets associated with 14 retail branches within our Originations segment. The sale consisted primarily of property and equipment and security deposits related to the branches. Additionally, we began to close a number of strategically identified retail branch locations. By
8
the end of the fourth quarter of 2015, we had disposed of seventy-six retail branches, inclusive of the 14 branches sold. We have presented these retail branch disposal activities as discontinued operations in our 2015 year-end financial statements.
MSR Sales
Our MSRs are primarily created through our originations channels. We are prepared to act as either a buyer or a seller of MSRs, depending on market conditions and our liquidity needs. We successfully executed on this strategy throughout 2015 in four separate bulk sales of MSRs, to unrelated third parties, with an approximate underlying UPB of $8.1 billion. Also, on September 30, 2015, we entered into a flow agreement for the sale of MSRs in GNMA loans to an unrelated party. The flow sales, with a total underlying UPB of $0.7 billion, occurred monthly during the covered period, from September 2015 through December 2015. Generally, these pools of sold MSRs did not represent the characteristics of our MSRs portfolio as a whole. We performed temporary sub-serving activities for a fee with respect to the underlying loans through the established loan file transfer dates, during which time we were also entitled to certain other ancillary income amounts. We have re-deployed the proceeds from these sales back into our originations platform to create newly originated MSRs with the intent of improving our returns.
Employees
As of December 31, 2015 and 2014, we had 927 and 1,294 employees, respectively, all of whom are based in the United States. The reduction in employees was primarily due to the disposal of our retail branches. We are not aware that any of our employees is a member of any labor union, we are not subject to any collective bargaining agreement, and we have never experienced any business interruption as a result of any labor dispute.
Regulation
Our business is subject to extensive federal, state and local regulation. Our loan originations, loan servicing and debt collection operations are primarily regulated at the state level by state licensing authorities and administrative agencies. Because we do business in 48 states and the District of Columbia, we, along with certain of our employees who engage in regulated activities, must apply for licensing as a mortgage banker or lender, loan servicer, mortgage loan originator and/or debt default specialist, pursuant to applicable state law. These laws typically require that we file applications and pay certain processing fees to be approved to operate in a particular state, and that our principals and loan originators be subject to background checks, administrative review and continuing education requirements. Our mortgage servicing business is licensed (or maintains an appropriate statutory exemption) to service mortgage loans in 48 states and the District of Columbia. Our retail loan origination channel is licensed to originate loans in the states in which it operates, and our direct origination channel is licensed to originate loans in 48 states and the District of Columbia. From time to time, we receive requests from states and other agencies for records, documents and information regarding our policies, procedures and practices regarding our loan originations, loan servicing and debt collection business activities, and we are subject to periodic examinations by state regulatory agencies. We incur ongoing costs to comply with these licensing requirements.
The federal Secure and Fair Enforcement for Mortgage Licensing Act of 2008 also requires all states to enact laws requiring each individual who takes mortgage loan applications, or who offers or negotiates terms of a residential mortgage loan, to be individually licensed or registered as a mortgage loan originator. These laws require each mortgage loan originator to enroll in the Nationwide Mortgage Licensing System, apply for individual licenses with the state where they operate, complete a minimum of 20 hours of pre-licensing education and an annual minimum of eight hours of continuing education, and to successfully complete both national and state exams.
In addition to licensing requirements, we must comply with a number of federal consumer protection laws, including, among others:
◦ | the Gramm-Leach-Bliley Act, which requires us to maintain privacy with respect to certain consumer data in our possession and to periodically communicate with consumers on privacy matters; |
◦ | the Fair Debt Collection Practices Act, which regulates the timing and content of debt collection communications; |
◦ | the Truth in Lending Act ("TILA") and Regulation Z thereunder, which require certain disclosures to mortgagors regarding the terms of their mortgage loans; |
◦ | the Fair Credit Reporting Act, which regulates the use and reporting of information related to the credit history of consumers; |
9
◦ | the Equal Credit Opportunity Act and Regulation B thereunder, which prohibit discrimination on the basis of age, race and certain other characteristics, in the extension of credit; |
◦ | the Homeowners Equity Protection Act, which requires, among other things, the cancellation of mortgage insurance once certain equity levels are reached; |
◦ | the Home Mortgage Disclosure Act and Regulation C thereunder, which require mortgage lenders to report certain public loan data; |
◦ | the Fair Housing Act, which prohibits discrimination in housing on the basis of race, sex, national origin, and certain other characteristics; |
◦ | the Real Estate Settlement Procedures Act ("RESPA") and Regulation X, which governs certain mortgage loan origination activities and practices and the actions of servicers related to escrow accounts, transfers, lender-placed insurance, loss mitigation, error resolution and other customer communications; and |
◦ | certain provisions of the Dodd-Frank Act, including the Consumer Financial Protection Act, which among other things, created the Consumer Financial Protection Bureau ("CFPB") and prohibits unfair, deceptive or abusive acts or practices, as further described below. |
Dodd-Frank Act
On July 21, 2010, President Obama signed into law the Dodd-Frank Act which regulates the financial services industry, including securitizations, mortgage originations and mortgage sales. The Dodd-Frank Act also established the CFPB to enforce laws involving consumer financial products and services, including mortgage finance. The CFPB directly influences the regulation of residential mortgage loan originations and servicing in a number of ways. First, the CFPB has rulemaking authority with respect to many of the federal consumer protection laws applicable to mortgage servicers, including TILA, RESPA and the FDCPA. Second, the CFPB has supervision, examination and enforcement authority over consumer financial products and services offered by certain non-depository institutions and large insured depository institutions. The CFPB’s jurisdiction includes those persons originating, brokering or servicing residential mortgage loans and those persons performing loan modification or foreclosure relief services in connection with such loans.
The Dodd-Frank Act also directs the federal banking agencies and the Securities and Exchange Commission to adopt rules requiring an issuer or other entity creating an asset-backed security (including a mortgage-backed security) to retain an economic interest in a portion of the credit risk for the assets underlying the security. In 2014, the agencies approved a credit risk retention rule that requires sponsors of securitizations retain not less than 5% of the credit risk of the assets. The approved rule provides sponsors with various options for meeting this requirement, including retaining risk equal to at least 5% of each class of asset-backed security, 5% of par value of all asset-backed security interests issued, 5% of a representative pool of assets, or a combination of these options. Under this rule, asset-backed securities that are collateralized exclusively by qualified residential mortgages would not be subject to these requirements. The rule defines qualified residential mortgages to have the same meaning as the term “qualified mortgage” as defined by TILA. The rule also recognizes that the sponsor of a FNMA or FHLMC securitization will satisfy the rule’s risk-retention provisions, at least while those agencies remain in conservatorship or receivership with capital support from the U.S. government, because of their 100% guarantee of principal and interest payable on the sponsored securities. Because substantially all of our loans are sold to, or pursuant to programs sponsored by, FNMA, FHLMC, or GNMA, the approved rule would exempt us from the risk-retention requirements with regard to securities backed by such loans.
In addition, on August 1, 2014 the CFPB promulgated the TILA-RESPA Integrated Disclosure rule that integrates the mortgage loan disclosures required under TILA and sections 4 and 5 of RESPA. The TILA-RESPA rule contains new requirements and two disclosure forms that borrowers will receive in the process of applying for and consummating a mortgage loan. The first new disclosure form, the Loan Estimate, combines two existing forms, the good faith estimate and the initial truth-in lending disclosure, into one form. The loan estimate must be provided to consumers no later than the third business day after they submit a loan application. The rule defines a loan application as having six of the seven elements that RESPA required: consumer’s name, consumer’s income, consumer’s social security number to obtain a credit report, property address, estimate of the value of the property and mortgage loan amount sought. The second new disclosure form, the Closing Disclosure, also combines two existing forms, the settlement statement or HUD-1 and the final truth-in-lending disclosures, into one form. The Closing Disclosure must be provided to consumers at least three business days before consummation of the loan. There are also new tolerance levels for disclosed estimates and restrictions on fees and actions taken before the consumer has received the loan estimate and indicated an intent to proceed with the mortgage loan origination. These forms are designed to use clear language to make it easier for consumers to locate key information, such as interest rate, monthly payments, and costs
10
to close the loan. They also provide more information to assist consumers in deciding whether they can afford the loan and to facilitate comparison of the cost of different loan offers. The implementation of these new forms and related requirements has necessitated significant operational and technological expenses and changes for the entire mortgage origination industry, and for our mortgage origination business in particular. The rule became effective October 3, 2015.
We continue to evaluate all aspects of the Dodd-Frank Act and the regulations issued thereunder. The burden associated with monitoring and complying with these regulations has increased our compliance costs and may restrict our origination and servicing operations, all of which could adversely affect our business, financial condition or results of operations.
Mortgage Origination
On January 10, 2014, the CFPB implemented final rules for the “ability to repay” requirement in the Dodd-Frank Act. The rules, among other things, require lenders to consider a consumer’s ability to repay a mortgage loan before extending credit to the consumer, and limit prepayment penalties. The rules also establish certain protections from liability for mortgage lenders with regard to the “qualified mortgages” they originate. For this purpose, the rules define a “qualified mortgage” to include a loan with a borrower debt-to-income ratio of less than or equal to 43% or, alternatively, a loan eligible for purchase by Fannie Mae or Freddie Mac while they operate under Federal conservatorship or receivership, and loans eligible for insurance or guarantee by the FHA, VA or USDA. Additionally, a qualified mortgage may not: (i) contain excess upfront points and fees; (ii) have a term greater than 30 years; or (iii) include interest-only or negative amortization payments. These rules have not significantly impacted our mortgage production operations since most of the loans we currently originate are “qualified mortgages” under the rules, and we have made, and continue to make, assessments of each consumer’s ability to repay a mortgage loan before extending credit to that consumer. Nonetheless, to the extent we originate non-“qualified mortgages”, either inadvertently or purposefully, and we are found to have failed to make a reasonable and good faith determination of a borrower’s ability to repay any such loan, we could be subject to additional civil or criminal penalties including substantial fines, imprisonment for individual responsible parties, and statutory penalties payable to the borrower equal to the sum the borrower’s actual damages, twice the amount of the related finance charges up to $4,000, the actual amount of finance charges or fees paid by the borrower (unless we show our failure to comply is not material), and the borrower’s attorney’s fees and other costs in connection with the related litigation.
Mortgage Servicing
Title XIV of the Dodd-Frank Act imposes a number of additional requirements on servicers of residential mortgage loans by amending certain existing provisions and adding new sections to TILA and RESPA. The penalties for noncompliance with TILA and RESPA are also significantly increased by the Dodd-Frank Act and could lead to an increase in lawsuits against mortgage servicers. To that end, on January 10, 2014, the CFPB implemented final rules creating uniform standards for the mortgage servicing industry. The rules increase requirements for communications with borrowers, address requirements around the maintenance of customer account records, govern procedural requirements for responding to written borrower requests and complaints of errors, and provide guidance around servicing of delinquent loans, foreclosure proceedings and loss mitigation efforts, among other measures. Since becoming effective, these rules have increased costs to service loans across the mortgage industry.
Several state agencies overseeing the mortgage industry have entered into settlements and enforcement consent orders with mortgage servicers regarding certain foreclosure practices. These settlements and orders generally require servicers, among other things, to: (i) modify their servicing and foreclosure practices, for example, by improving communications with borrowers and prohibiting dual-tracking, which occurs when servicers continue to pursue foreclosure during the loan modification process; (ii) establish a single point of contact for borrowers throughout the loan modification and foreclosure processes; and (iii) establish robust oversight and controls of third party vendors, including outside legal counsel, that provide default management or foreclosure services on their behalf. Many of these practices are considered by regulators, investors and consumer advocates as industry "best practices." As such, we will be challenged to review and adapt many of these practices as well.
Competition
In our originations, servicing and financing businesses, we compete with large financial institutions and with other independent residential mortgage loan producers and servicers. These originators and servicers, however, are experiencing higher operating costs and increased capital requirements, thus allowing an opportunity for us to successfully compete and take advantage of growth opportunities in the mortgage sector.
Our mortgage loan origination business faces competition in mortgage loan offerings, rates, fees and level of customer service and technological innovation and efficiency. Our ability to differentiate the value of our financial products
11
primarily through our mortgage loan offerings, technology platforms, rates, fees and customer service determines our competitive position within the mortgage loan originations industry.
Our servicing business faces competition in areas such as fees, service and technological innovation and efficiency. Our ability to differentiate ourselves from other loan servicers through our innovative technology platforms largely determines our competitive position within the mortgage loan servicing industry.
In our financing business, we primarily compete with depository institutions that use deposit funds to finance loans. These institutions, however, typically only focus on larger mortgage originations leaving the small- and mid-sized originators to sell mortgage loans to aggregators (a depository institution or non-bank originator), such as ourselves. Thus, our financing platform allows us to compete with bank-owned mortgage lenders, who have access to cheaper deposit funding.
Reportable Segments
We operate three reportable business segments: Originations, Servicing and Financing. These reportable segments are based on our organizational structure, and reflect how the chief operating decision maker manages and evaluates the performance of the business, with a focus on the services performed. Our chief operating decision maker evaluates the performance of each segment based on their individual measurements of income before income taxes. See Part II, Item 7, "Management’s Discussion and Analysis of Financial Condition and Results of Operations - Segment Results from Continuing Operations” and Item 8, Note 22, "Segment Information" of this Annual Report on Form 10-K for details related to the asset components, operating revenues, income before income taxes, depreciation and amortization by segment from continuing operations for the years ended December 31, 2015, 2014 and 2013.
We do not have any foreign operations.
Seasonality
Our Originations segment is subject to seasonal fluctuations, and activity tends to diminish somewhat in the months of December, January and February, when home sales volume and loan origination volumes are at their lowest. This typically causes seasonal fluctuations in our origination business revenue, as well as our financing business revenue in our Financing segment, as such revenue is mostly interest income and directly correlates to originations. Levels of delinquency are also subject to seasonal fluctuations, with higher levels occurring December through March, which can negatively affect the profitability of our Servicing segment due to larger amounts of servicing advances and increased expenses from operational efforts dedicated to servicing delinquent loans.
Intellectual Property
We hold registered trademarks with respect to the name Stonegate Mortgage Corporation, our logos and various additional designs and word marks relating to the Stonegate Mortgage Corporation name. Additionally, we own registered trademarks with respect to the name of NattyMac, its logo and various additional designs and word marks relating to NattyMac that we acquired. We use a variety of methods, such as trademarks, patents, copyrights and trade secrets, to protect our intellectual property. We also place appropriate restrictions on our proprietary information to control access and prevent unauthorized disclosures.
Available Information
We are an accelerated filer (as defined in Rule 12b-2 of the Securities Exchange Act of 1934, as amended ("Exchange Act")), and are required, pursuant to Item 101 of Regulation S-K, to provide certain information regarding our website and the availability of certain documents filed with or furnished to the U.S. Securities and Exchange Commission (the "SEC"). Our Internet website is www.stonegatemtg.com. We have included our Internet website address throughout this Annual Report on Form 10-K as textual reference only. The information contained on our Internet website is not incorporated into this Annual Report on Form 10-K. We make available, free of charge, through our Internet website, our Annual Report on Form 10-K, Quarterly Reports on Form 10-Q, Current Reports on Form 8-K, and amendments to those reports filed or furnished pursuant to Section 13(a) or 15(d) of the Exchange Act as soon as reasonably practicable after we electronically file such material with or furnish it to the SEC. Our Internet website also provides access to reports filed by our directors, executive officers and certain significant stockholders pursuant to Section 16 of the Exchange Act. We also include on our Internet website our Corporate Governance Guidelines, our Standards of Ethical Business Conduct and the charter of each standing committee of our Board of Directors. In addition, we intend to disclose on our Internet website any amendments to, or waivers from, our Standards of Ethical Business Conduct that are required to be publicly disclosed pursuant to rules of the SEC and the New York Stock Exchange ("NYSE"). The SEC also maintains a website, www.sec.gov, that contains reports, proxy and information statements and other information that we file electronically with the SEC.
ITEM 1A. RISK FACTORS
12
The following factors, among others, could cause actual results to differ materially from those contained in the forward-looking statements made in this Annual Report on Form 10-K and presented elsewhere by management from time to time. Such factors, among others, may have a material adverse effect on our business, financial condition, and results of operations and you should carefully consider them. It is not possible to predict or identify all such factors. Consequently, you should not consider such list to be a complete statement of all potential risks or uncertainties. Because of these and other factors, past performance should not be considered an indication of future performance.
The industry in which we operate is highly competitive and our inability to compete successfully could adversely affect our business, financial condition and results of operations.
We operate in a highly competitive industry that could become even more competitive as a result of economic, technological and regulatory changes. Our mortgage loan origination business faces competition in mortgage loan offerings, rates, fees and levels of customer service. Competition to originate mortgage loans comes primarily from large commercial banks and savings institutions, but we also compete with a growing number of national and regional mortgage companies. Financial institutions generally have significantly greater resources and access to capital than we do, which gives them the benefit of a lower cost of funds and the ability to originate more mortgage loans. Our servicing business faces competition in areas such as fees and service. Competition to service mortgage loans comes from large commercial banks, large savings institutions and large independent servicers. Additionally, our servicing competitors may decide to modify their servicing model to compete more directly with our servicing model, or our servicing model may generate lower margins as a result of competition or as overall economic conditions improve.
In addition, technological advances and heightened e-commerce activities have increased consumers’ accessibility to products and services. This has intensified competition among banks and non-banks in offering mortgage loans and servicing them. We may be unable to compete successfully in our origination and servicing businesses, and this could materially and adversely affect our business, financial condition and results of operations.
We may experience financial difficulties as some originators and mortgage servicers have experienced, which could adversely affect our business, financial condition and results of operations.
Since 2006, a number of originators and servicers of residential mortgage loans experienced serious financial difficulties and, in some cases, ceased operations. These difficulties have resulted, in part, from declining markets for mortgage loans as well as from claims for repurchases of mortgage loans previously sold under provisions requiring repurchase in the event of early payment defaults or breaches of representations and warranties regarding loan quality, compliance and certain other loan characteristics. Origination volumes may decrease significantly in the current economic environment. Higher delinquencies and defaults may contribute to these difficulties by reducing the value of mortgage loans and requiring originators to sell their portfolios at greater discounts to par. In addition, servicing an increasingly delinquent mortgage loan portfolio increases servicing costs without a corresponding increase in servicing compensation. Any of the foregoing adverse developments could materially and adversely affect our business, financial condition and results of operations.
Adverse changes in the residential mortgage market would adversely affect our business, financial condition and results of operations.
Since 2007, adverse economic conditions, including high unemployment, stagnant or declining incomes and higher taxes, have impacted the residential mortgage market, resulting in unprecedented delinquency, default and foreclosure rates, all of which have led to increased losses on all types of residential mortgage loans due to sharp declines in residential real estate values. Falling home prices have resulted in higher LTVs, lower recoveries in foreclosure and an increase in losses above those that would have been realized had property values remained the same or continued to increase. As LTVs increase, borrowers sometimes have insufficient equity in their homes, which prohibits them from refinancing their existing loans. This may also provide borrowers an incentive to default on their mortgage loans even if they have the ability to make principal and interest payments, which we refer to as strategic defaults. Increased mortgage defaults negatively impact our servicing business because they increase the costs to service the underlying loans and may ultimately reduce the number of mortgages we service.
Adverse economic conditions also adversely impact our originations business. Declining home prices and increasing LTVs may preclude many potential borrowers, including borrowers whose existing loans we service, from refinancing their existing loans.
Adverse changes in the residential mortgage market may reduce the number of mortgages we service or new mortgages we originate, reduce the profitability of mortgages currently serviced by us, adversely affect our ability to sell mortgage loans originated by us or increase delinquency rates. Any of the foregoing adverse developments could materially and adversely affect our business, financial condition and results of operations.
13
We may be unable to obtain sufficient capital to meet the financing requirements of our business.
Our financing strategy consists primarily of using repurchase facilities, participation agreements, warehouse lines of credit and MSRs financings with major financial institutions and regional and community banks. As we continue to grow, we will likely need to borrow additional money. Our ability to renew or replace our existing facilities or warehouse lines of credit as they expire and borrow the additional funds we will need to accomplish our growth strategy is affected by a variety of factors including:
• | the level of liquidity in the mortgage related credit markets; |
• | prevailing interest rates; |
• | the strength of the lenders that provide us financing; |
• | limitations on borrowings on repurchase facilities, participation agreements, warehouse lines of credit and MSRs financings imposed by the amount of eligible collateral pledged; |
• | limitations imposed on us under financing agreements that contain restrictive covenants and borrowing conditions that may limit our ability to raise or borrow additional funds; and |
• | accounting changes that may impact calculations of covenants in our financing agreements. |
We cannot assure you we will be able to renew, replace or refinance our existing financing arrangements or enter into additional financing arrangements on terms that are commercially reasonable or at all.
In the ordinary course of our business, we periodically borrow money or sell newly-originated loans or MSRs to fund our mortgage loan origination and servicing operations. See “Management’s Discussion and Analysis of Financial Condition and Results of Operations-Liquidity and Capital Resources.” Our ability to fund current operations and make advances required under our mortgage loan servicing agreements depends on our ability to secure these types of financings on acceptable terms and to renew or replace existing financings as they expire. Such financings may not be available on acceptable terms or at all.
An event of default, a negative ratings action by a rating agency, an adverse action by a regulatory authority or a general deterioration in the economy that constricts the availability of credit-similar to the market conditions that we have experienced during the last five years-may increase our cost of funds and make it difficult for us to renew existing facilities or obtain new financing facilities. We will analyze opportunities to acquire mortgage loan servicing portfolios and/or businesses that engage in mortgage loan servicing and/or mortgage loan originations. Our liquidity and capital resources may be diminished by any such transactions. Additionally, we believe that a significant acquisition may require us to raise additional capital to facilitate such a transaction, which may not be available on acceptable terms or at all.
In January 2014, the final capital requirements of the Basel Committee on Banking Supervision of the Bank of International Settlements, known as Basel III, became effective for U.S. banking organizations. These requirements should increase the cost of funding on financial institutions that we rely on for financing. Such Basel III requirements could reduce our sources of funding and increase the costs of originating and servicing mortgage loans. If we are unable to obtain sufficient capital on acceptable terms for any of the foregoing reasons, this could materially and adversely affect our business, financial condition and results of operations.
We may not be able to continue to grow our loan origination volume, which could adversely affect our business, financial condition and results of operations.
Our mortgage loan origination business consists of providing purchase money loans to homebuyers and refinancing existing loans. The origination of purchase money mortgage loans is greatly influenced by traditional business clients in the home buying process such as realtors and builders. As a result, our ability to secure relationships with such traditional business clients will influence our ability to grow our purchase money mortgage loan volume and, thus, our loan origination business.
Our loan origination business operates largely through third party mortgage brokers who do business with us on a best efforts basis, i.e., they are not obligated to do business with us. Further, our competitors also have relationships with these brokers and actively compete with us in our efforts to expand our broker networks. Accordingly, we may not be successful in maintaining our existing relationships or expanding our broker networks. If we are unable to continue to grow our loan origination business, this could adversely affect our business, financial condition and results of operations.
The geographic concentration of our servicing portfolio may result in a higher rate of delinquencies and/or defaults, which could adversely affect our business, financial condition and results of operations.
The following is a summary of the loans we serviced as of December 31, 2015 by geographic concentration as measured by the total unpaid principal balance as of December 31, 2015:
14
(dollars in millions) | $ UPB | % of Total $UPB | ||||
California | $ | 3,704 | 21% | |||
Texas | 1,579 | 9% | ||||
Illinois | 1,043 | 6% | ||||
Florida | 972 | 6% | ||||
Indiana | 854 | 5% | ||||
New Jersey | 798 | 5% | ||||
Ohio | 749 | 4% | ||||
Missouri | 744 | 4% | ||||
North Carolina | 704 | 4% | ||||
Georgia | 673 | 4% | ||||
All other states | 5,701 | 32% | ||||
Total | $ | 17,521 | 100% | |||
To the extent the states where we have a higher concentration of loans experience weaker economic conditions, greater rates of decline in single-family residential real estate values or reduced demand within the residential mortgage sector relative to the United States generally, the concentration of loans we service in those regions may increase the effect of the risks described in this “Risk Factors” section. Additionally, if states in which we have greater concentrations of mortgage loans were to change their licensing or other regulatory requirements to make our business cost-prohibitive, we may be required to stop doing business in those states or may be subject to higher costs of doing business in those states, which could adversely affect our business, financial condition and results of operations.
As our origination volume increases in the states where we have only recently become licensed and have not yet expanded our operations and in the additional states where we become licensed, we expect our geographic concentration to change and our origination and servicing of loans could be impacted by geographic concentrations in different states. To the extent those states experience weaker economic conditions or greater rates of decline in single-family residential real estate values, the concentration of loans we originate and service in those regions may increase the effect of the risks to our business.
We use financial models and estimates in determining the fair value of certain assets, such as MSRs, commitments to originate loans, mortgage loans held for sale and related hedging instruments. If our estimates or assumptions prove to be incorrect, we may be required to record negative fair value adjustments, which would adversely affect our earnings.
Our ability to measure and report our financial position and operating results is influenced by the need to estimate the impact or outcome of future events on the basis of information available at the time of the financial statements. An accounting estimate is considered critical if it requires that management make assumptions about matters that were highly uncertain at the time the accounting estimate was made. If actual results differ from our judgments and assumptions, then it may have an adverse impact on the results of operations and cash flows. Management has processes in place to monitor these judgments and assumptions, including with the Audit Committee of the Board of Directors.
Fair value is estimated based on a hierarchy that maximizes the use of observable inputs and minimizes the use of unobservable inputs. Observable inputs are inputs that reflect the assumptions that market participants would use in pricing the asset or liability developed based on market data obtained from sources independent of the reporting entity. Unobservable inputs are inputs that reflect the reporting entity’s own assumptions about the assumptions market participants would use in pricing the asset or liability developed based on the best information available in the circumstances. The fair value hierarchy prioritizes the inputs to valuation techniques into three broad levels whereby the highest priority is given to Level 1 inputs and the lowest to Level 3 inputs.
We use internal financial models that utilize, wherever possible, market participant data to value certain of our assets and liabilities. Valuations are highly dependent upon the reasonableness of our assumptions and the predictability of the relationships that drive the results of our valuation methodologies.
For additional information on the key areas for which assumptions and estimate are used preparing our financial statements, see “Part II - Item 7. Management’s Discussion and Analysis of Financial Condition and Results of Operations - Critical Accounting Policies.”
We may incur losses due to changes in prepayment rates.
Our MSRs carry interest rate risk because the total amount of servicing fees earned, as well as changes in fair-market value, fluctuate based on expected loan prepayments (affecting the expected average life of a portfolio of residential MSRs). The rate of prepayment of residential mortgage loans may be influenced by a variety of factors, including, but not limited to,
15
changing national and regional economic trends (such as recessions or depressed real estate markets), the difference between interest rates on existing residential mortgage loans relative to prevailing residential mortgage rates, or other terms that can affect the amount of payments borrowers make on mortgage loans, such as the rates or fees applicable to private or government-provided mortgage insurance. Changes in prepayment rates are therefore difficult for us to predict. An increase in the general level of interest rates may adversely affect the ability of some borrowers to pay the interest and principal of their obligations. During periods of declining interest rates, many residential borrowers refinance their mortgage loans. The loan administration fee income (related to the residential mortgage loan servicing rights corresponding to a mortgage loan) decreases as mortgage loans are prepaid. Consequently, the fair value of portfolios of residential mortgage loan servicing rights tend to decrease during periods of declining interest rates, because greater prepayments can be expected and, as a result, the amount of loan administration income received also decreases.
Our investments in mortgage loans and MSRs may become illiquid, and we may not be able to vary our portfolio in response to changes in economic and other conditions.
Our investments in mortgage loans and MSRs may become illiquid. If that were to occur, it may be difficult or impossible to obtain or validate third party pricing on the investments we purchase. Illiquid investments also typically experience greater price volatility, as a ready market does not exist, and can be more difficult to value. We cannot predict if our mortgage loans or MSRs may become illiquid, or when such event may occur, though some factors that have contributed to periods of illiquidity for these assets generally in the past have been weak economic conditions, rates of decline in single-family residential real estate values and volatile interest rates. Any illiquidity of our investments may make it difficult for us to sell such investments if the need or desire arises. In addition, if we are required to liquidate all or a portion of our portfolio quickly, we may realize significantly less than the recorded value.
Federal, state and local laws and regulations, and related litigation, could materially adversely affect our business, financial condition and results of operations.
Due to the highly regulated nature of the residential mortgage industry, we are required to comply with a wide array of federal, state and local laws and regulations that regulate, among other things, the manner in which we conduct our origination and servicing businesses, the fees we may charge, and the services we provide. These regulations directly impact our business and require constant compliance, monitoring and internal and external audits. In particular, the CFPB and applicable state agencies have the power to levy fines or file suits against us or compel settlements with monetary penalties and operation requirements, and a material failure to comply with any state laws or regulations could result in the loss or suspension of our licenses in the applicable jurisdictions where such violations occur. Additionally, recent actions by regulators and government agencies indicate that, on an industry basis, they may increasingly pursue claims against financial services providers and mortgage originators and servicers in particular (including claims under the False Claims Act, where treble damages are potentially available). Any of these outcomes could materially and adversely affect our business, financial condition and results of operations.
In addition, there continue to be changes in legislation and licensing requirements that are intended to improve the consumer mortgage loan experience, which require technological changes and additional implementation costs for mortgage loan originators and servicers, such as the implementation of the TILA-RESPA Integrated Disclosure rule. The implementation of these new forms and related requirements has necessitated significant operational and technological expenses and changes for the entire mortgage origination industry, and for our mortgage origination business in particular. The rule became effective October 3, 2015. We expect legislative and licensing changes will continue in the foreseeable future, which will likely increase our operating expenses. Furthermore, there continue to be changes in state and federal laws and regulations that are adverse to mortgage originators and servicers that increase costs and operational complexity of our business and impose significant penalties for violation. Any of these changes in the law could materially and adversely affect our business, financial condition and results of operations.
Federal, state and local governments have recently proposed or enacted numerous laws, regulations and rules related to mortgage loans generally and foreclosure actions in particular. These laws, regulations and rules may result in significant delays in the foreclosure process, reduced payments by borrowers, modification of the original terms of mortgage loans, permanent forgiveness of debt and increased servicing advances. In some cases, local governments have ordered moratoriums on foreclosure activity, which prevent a servicer or trustee, as applicable, from exercising any remedies they might have in respect of liquidating a severely delinquent mortgage loan. Several courts also have taken unprecedented steps to slow the foreclosure process or prevent foreclosure altogether. See "Regulation" in Item 1 of this Form 10-K.
Certain proposed federal and state legislation would permit borrowers in bankruptcy to restructure mortgage loans secured by primary residences. Bankruptcy courts could, if this legislation is enacted, reduce the principal balance of a mortgage loan that is secured by a lien on mortgaged property, reduce the mortgage interest rate, extend the term to maturity or otherwise modify the terms of a bankrupt borrower’s mortgage loan.
16
We originate and sell FHA, VA and USDA loans. The origination of FHA, VA and USDA loans represented approximately 54%, 43% and 40% of the dollar value of loans originated, including originations resulting from discontinued operations, during the years ended December 31, 2015, 2014 and 2013, respectively. The housing finance reform contemplated by the Obama administration may impact the lending qualification and limits of these programs, which may adversely impact our volume of FHA, VA and USDA loan originations in the future and may increase the price of our mortgage insurance premiums or otherwise adversely affect our business, financial conditions and results of operations.
On January 30, 2015, the FHFA proposed new minimum financial eligibility requirements that apply to Fannie Mae and Freddie Mac seller/servicers, including non-bank seller/servicers. As proposed, these new requirements include a minimum net worth of $2.5 million plus 25 basis points of the UPB of the total mortgage loans serviced, a capital ratio of tangible net worth to total assets of greater than 6%, and a minimum liquidity amount of 3.5 basis points of total agency servicing (Fannie Mae, Freddie Mac, and Ginnie Mae) plus an incremental 200 basis of total non-performing agency servicing in excess of the 6% of total agency servicing UPB, with restrictions on the types of assets that will be eligible to be counted as liquidity. While we currently meet these requirements as proposed, the FHFA could enact more stringent financial eligibility requirements, or other federal or state agencies may enact additional requirements that are more stringent. Failure to comply with any of these requirements could adversely affect our business, financial condition and results of operations.
We may be subject to liability for potential violations of predatory lending laws, which could adversely impact our results of operations, financial condition and business.
Various U.S. federal, state and local laws have been enacted that are designed to discourage predatory lending practices. The U.S. federal Home Ownership and Equity Protection Act of 1994 ("HOEPA") prohibits inclusion of certain provisions in residential mortgage loans that have mortgage rates or origination costs in excess of prescribed levels and requires that borrowers be given certain disclosures prior to origination. Some states have enacted, or may enact, similar laws or regulations, which in some cases impose restrictions and requirements greater than those in HOEPA. In addition, under the anti-predatory lending laws of some states, the origination of certain residential mortgage loans, including loans that are not classified as “high-cost” loans under applicable law, must satisfy a net tangible benefits test with respect to the related borrower. This test may be highly subjective and open to interpretation. As a result, a court may determine that a residential mortgage loan, for example, does not meet the test even if the related originator reasonably believed that the test was satisfied. If any of our production loans are found to have been originated in violation of predatory or abusive lending laws, we could incur losses, which could adversely impact our results of operations, financial condition and business.
We are highly dependent upon programs administered by GSEs, such as Fannie Mae and Freddie Mac, and by Ginnie Mae, to generate revenues through mortgage loan sales to institutional investors. Any changes in existing U.S. government-sponsored mortgage programs could materially and adversely affect our business, financial position and results of operations.
On February 2011, the Obama administration presented Congress with a report titled "Reforming America's Housing Finance Market, A Report to Congress," outlining its proposals for reforming the housing finance markets in the United States. The report, among other things, outlined various potential proposals to wind down the GSEs and reduce or eliminate over time the role of the GSEs in guaranteeing mortgages and providing funding for mortgage loans, as well as proposals to implement reforms relating to borrowers, lenders and investors in the mortgage market, including reducing the maximum size of loans that the GSEs can guarantee, phasing in a minimum down payment requirement for borrowers, improving underwriting standards and increasing accountability and transparency in the securitization process. There are also proposals to reduce the maximum size of loans insured by FHA (which comprise the majority of loans in the Ginnie Mae program) or otherwise reform FHA lending. In addition, various bills have been proposed by members of Congress to eliminate the GSEs and replace them with private but federally-subsidized guaranties for qualifying loans, to combine them into a single entity that will provide guaranties to a smaller number of qualified loans, or to continue their operations but in a more limited form and with greater capital requirements. Thus, the long-term future of the GSEs is still unclear.
Our ability to generate revenues through mortgage loan sales to institutional investors depends, to a significant degree, on programs administered by the GSEs, such as Fannie Mae and Freddie Mac and by Ginnie Mae. These GSEs and Ginnie Mae play a critical role in the residential mortgage industry, and we have significant business relationships with many of them. Most of the conforming loans we originate qualify under existing standards for inclusion in mortgage securities guaranteed by GSEs and Ginnie Mae. We also derive other material financial benefits from these relationships, including the assumption of credit risk by these GSEs and Ginnie Mae on loans included in such mortgage securities in exchange for our payment of guarantee fees and the ability to avoid certain loan inventory finance costs through streamlined loan funding and sale procedures.
17
Any discontinuation of, or significant reduction in, the operation of these GSEs and Ginnie Mae or any significant adverse change in the level of activity in the secondary mortgage market or the underwriting criteria of these GSEs or Ginnie Mae could materially and adversely affect our business, financial position and results of operations.
The conservatorship of Fannie Mae and Freddie Mac and related efforts, along with any changes in laws and regulations affecting the relationship between Fannie Mae and Freddie Mac and the U.S. federal government, could adversely affect our business and prospects.
Due to increased market concerns about the ability of Fannie Mae and Freddie Mac to withstand future credit losses associated with securities held in their investment portfolios, in July 2008, the U.S. government passed the Housing and Economic Recovery Act of 2008. In September 2008, the Federal Housing Finance Agency (“FHFA”) placed Fannie Mae and Freddie Mac into conservatorship and, together with the U.S. Treasury, established a program designed to boost investor confidence in their respective debt and MBS. As the conservator of Fannie Mae and Freddie Mac, the FHFA controls and directs the operations of Fannie Mae and Freddie Mac and may (i) take over the assets and operations of Fannie Mae and Freddie Mac with all the powers of the shareholders, the directors and the officers of Fannie Mae and Freddie Mac and conduct all business of Fannie Mae and Freddie Mac; (ii) collect all obligations and money due to Fannie Mae and Freddie Mac; (iii) perform all functions of Fannie Mae and Freddie Mac that are consistent with the conservator’s appointment; (iv) preserve and conserve the assets and property of Fannie Mae and Freddie Mac; and (v) contract for assistance in fulfilling any function, activity, action or duty of the conservator. In addition, a number of GSE reform proposals have been advanced by the FHFA and other governmental authorities and industry groups, some of which advocate material changes to the business of the GSEs or the elimination of the GSEs altogether. The future of the GSEs, therefore, is uncertain. Certain changes to the mortgage financing programs of the GSEs could have a material adverse effect on the operations of the residential mortgage markets and our business, financial position and results of operations.
Although the U.S. Treasury has committed capital to Fannie Mae and Freddie Mac, these actions may not be adequate for their needs. If these actions are inadequate, Fannie Mae and Freddie Mac could continue to suffer losses and could fail to honor their guarantees and other obligations. The future roles of Fannie Mae and Freddie Mac could be significantly reduced and the nature of their guarantees could be considerably limited relative to historical measurements. Any changes to the nature of the guarantees provided by Fannie Mae and Freddie Mac could redefine what constitute agency and government conforming MBS and could have broad adverse market implications. Such market implications could materially and adversely affect our business, financial condition and results of operations.
If we are unable to sell or securitize our non-agency mortgage loans, our business will be adversely affected and even if we are successful in securitizing our non-agency mortgage loans, we may bear a portion of the risk of loss associated with these loans.
We originate and acquire mortgage loans that are not eligible for sale to or securitization with the GSEs or Ginnie Mae. Because we do not want to hold these non-agency mortgage loans to maturity, we either must sell them to third parties or securitize them in non-agency securitizations. The non-agency securitization market has been dormant in the last few years because of a number of factors, including regulatory uncertainty. If we originate non-agency mortgage loans and cannot sell or securitize them, we may be forced to hold them in portfolio with little access to financing on favorable terms. This would adversely affect our business, financial condition and results of operations.
In addition, if we sponsor the securitization of non-agency mortgage loans, we would be required to retain an interest in the securitized loans and would thus bear some of the risk of loss associated with the loans, such as default risk.
Unlike banks and similar financial institutions with which we compete, we are subject to state licensing and operational requirements that result in substantial compliance costs.
Because we are not a depository institution, we do not benefit from an exemption to state mortgage banking, loan servicing or debt collection licensing and regulatory requirements that are generally given to a depository institution under state law. We must comply with state licensing requirements and varying compliance requirements in each of the 48 states and the District of Columbia, in which we do business. Future regulatory changes may increase our costs through stricter licensing laws, disclosure laws or increased fees, or may impose conditions to licensing that we are unable to meet. In addition, we are subject to periodic examinations by state regulators, which can result in refunds to borrowers of certain fees earned by us, and we may be required to pay substantial penalties imposed by state regulators due to compliance errors. In particular, Benjamin Lawsky, then superintendent of New York's Department of Financial Services, indicated in 2014 that the agency had "significant concerns" that the growth of non-bank mortgage servicers may "create capacity issues that put homeowners at risk." Future state legislation and changes in existing regulation may significantly increase our compliance costs or reduce the amount of ancillary fees, including late fees, that we may charge to borrowers. This could make our business cost-prohibitive in the affected state or states and could materially and adversely affect our business, financial condition and results of operations.
18
Our business would be adversely affected if we lose our licenses or if we are unable to obtain licenses in new markets.
Our operations are subject to regulation, supervision and licensing under various federal, state and local statutes, ordinances and regulations. In most states in which we operate, a regulatory agency regulates and enforces laws relating to mortgage loan servicing companies and mortgage loan origination companies such as us. These rules and regulations generally provide for licensing as a mortgage servicing company, mortgage origination company or third party debt default specialist, requirements as to the form and content of contracts and other documentation, licensing of our employees and employee hiring background checks, licensing of independent contractors with which we contract, restrictions on collection practices, disclosure and record-keeping requirements and enforcement of borrowers’ rights. In certain states, we are subject to periodic examination by state regulatory authorities. Some states in which we operate require special licensing or provide extensive regulation of our business.
We believe that we maintain all material licenses and permits required for our current operations and are in substantial compliance with all applicable federal, state and local laws. But we may not be able to maintain all requisite licenses and permits, and the failure to satisfy those and other regulatory requirements could result in a default under our servicing agreements and have a material adverse effect on our business, financial condition or results of operations. The states that currently do not provide extensive regulation of our business may later choose to do so, and if such states so act, we may not be able to obtain or maintain all requisite licenses and permits. The failure to satisfy those and other regulatory requirements could result in a default under our servicing agreements and have a material and adverse effect on our business, financial condition or results of operations. Furthermore, the adoption of additional, or the revision of existing, rules and regulations could materially and adversely affect our business, financial condition and results of operations.
Challenges to the MERS® System could materially and adversely affect our business, results of operations and financial condition.
MERSCORP, Inc. is a privately held company that maintains an electronic registry, referred to as the MERS System, that tracks servicing rights and ownership of loans in the United States. Mortgage Electronic Registration Systems, Inc. ("MERS"), a wholly-owned subsidiary of MERSCORP, Inc., can serve as a nominee for the owner of a mortgage loan and in that role initiate foreclosures or become the mortgagee of record for the loan in local land records. We may choose to use MERS as a nominee. The MERS System is widely used by participants in the mortgage finance industry.
Several legal challenges in the courts and by governmental authorities have been made disputing MERS’s legal standing to initiate foreclosures or act as nominee for lenders in mortgages and deeds of trust recorded in local land records. These challenges have focused public attention on MERS and on how loans are recorded in local land records. Although most legal decisions have accepted MERS as mortgagee, these challenges could result in delays and additional costs in commencing, prosecuting and completing foreclosure proceedings, conducting foreclosure sales of mortgaged properties and submitting proofs of claim in borrower bankruptcy cases.
We may not be able to maintain or grow our business if we cannot originate and/or acquire MSRs.
Our servicing portfolio is subject to “run off,” meaning that mortgage loans we service may be prepaid prior to maturity, refinanced with a mortgage not serviced by us or liquidated through foreclosure, deed-in-lieu of foreclosure or other liquidation process or repaid through standard amortization of principal. As a result, our ability to maintain and grow the size of our servicing portfolio depends on our ability to originate additional mortgages, to recapture the servicing rights on loans that are refinanced, and to acquire the right to service additional residential mortgage loans. We may not be able to originate a sufficient volume of mortgage loans, recapture a sufficient volume of refinanced loans or acquire MSRs on additional pools of mortgage loans with sufficient volume or on terms that are favorable to us or at all, which could materially and adversely affect our business, financial condition and results of operations.
We may not be able to recapture loans from borrowers who refinance.
One of the focuses of our origination efforts is “recapture,” which involves actively working with existing borrowers to refinance their mortgage loans with us instead of another originator of mortgage loans. Borrowers who refinance have no obligation to refinance their loans with us and may choose to refinance with a different originator. If borrowers refinance with a different originator, this decreases the profitability of our primary servicing portfolio because the original loan will be repaid, and we will not have an opportunity to earn further servicing fees after the original loan is repaid. Moreover, recapture allows us to generate additional loan servicing more cost-effectively than MSRs acquired on the open market. If we are not successful in recapturing our existing loans that are refinanced, our servicing portfolio will become increasingly subject to run-off, and we may need to purchase additional MSRs on the open market to add to our servicing portfolio, which would increase ours costs and risks and decrease the profitability of our servicing business.
19
We may not be able to recover our significant investments in personnel and our technology platform if we cannot originate and acquire MSRs on favorable terms, which could adversely affect our business, financial condition and results of operations.
We have made, and expect to continue to make, significant investments in personnel and our technology platform to allow us to service additional loans. In particular, we invest significant resources in recruiting, training, technology and systems. We may not realize the expected benefits of these investments to the extent we are unable to increase the pool of residential mortgage loans we service, we are delayed in obtaining the right to service such loans or we do not appropriately value the MSRs that we do purchase. Any of the foregoing could adversely affect our business, financial condition and results of operations.
We depend on the accuracy and completeness of information about borrowers and counterparties and any misrepresented information could adversely affect our business, financial condition and results of operations.
In deciding whether to extend credit or to enter into other transactions with borrowers and counterparties, we may rely on information furnished to us by or on behalf of borrowers and counterparties, including financial statements and other financial information. We also may rely on representations of borrowers and counterparties as to the accuracy and completeness of that information and, with respect to financial statements, on reports of independent auditors. We additionally rely on representations from public officials concerning the licensing and good standing of the third party mortgage brokers through which we do business. While we have a practice of independently verifying the borrower information that we use in deciding whether to extend credit or to agree to a loan modification, including employment, assets, income and credit score, if any of this information is intentionally or negligently misrepresented and such misrepresentation is not detected prior to loan funding, the value of the loan may be significantly lower than expected. Whether a misrepresentation is made by the loan applicant, the mortgage broker, another third party or one of our employees, we generally bear the risk of loss associated with the misrepresentation. We have controls and processes designed to help us identify misrepresented information in our loan originations operations; however, we may not have detected or may not detect all misrepresented information in our loan originations or from our business clients. Any such misrepresented information could materially and adversely affect our business, financial condition and results of operations.
In addition, when we originate loans, we rely heavily upon information supplied by third parties, including the information contained in the loan application, appraisal, title information and employment and income documentation. If any of this information is intentionally or negligently misrepresented and such misrepresentation is not detected prior to the loan funding, the value of the loan may be significantly lower than expected, and we may be subject to repurchase or indemnification obligations under loan sales agreements. Whether a misrepresentation is made by the loan applicant, the broker, another third party or one of our own employees, we generally bear the risk of loss associated with the misrepresentation. A loan subject to a material misrepresentation is not typically saleable or is subject to repurchase if it is sold prior to detection of the misrepresentation. Even though we may have rights against persons and entities who made or knew about the misrepresentation, such persons and entities are often difficult to locate and it is often difficult to collect any monetary losses that we have suffered as a result of their actions.
Increases in delinquencies and defaults may adversely affect our business, financial condition and results of operations.
Falling home prices across the United States have resulted in higher LTVs, lower recoveries in foreclosure and an increase in loss severities above those that would have been realized had property values remained the same or continued to increase. Though housing values have stabilized in some markets, many borrowers do not have sufficient equity in their homes to permit them to refinance their existing loans, which may reduce the volume or growth of our loan production business. This may also provide borrowers with an incentive to default on their mortgage loans even if they have the ability to make principal and interest payments. Further, interest rates have remained at historical lows for an extended period of time. Borrowers with adjustable rate mortgage loans must make larger monthly payments when the interest rates on those mortgage loans adjust upward from their initial fixed rates or low introductory rates to the rates computed in accordance with the applicable index and margin. Increases in monthly payments may increase the delinquencies, defaults and foreclosures on a significant number of the loans that we service.
Increased mortgage delinquencies, defaults and foreclosures may result in lower revenue for loans that we service for the GSEs, including Fannie Mae or Freddie Mac, because we only collect servicing fees from GSEs for performing loans. Additionally, while increased delinquencies generate higher ancillary fees, including late fees, these fees are not likely to be recoverable in the event that the related loan is liquidated. In addition, an increase in delinquencies lowers the interest income that we receive on cash held in collection and other accounts because there is less cash in those accounts. Also, increased mortgage defaults may ultimately reduce the number of mortgages that we service.
Increased mortgage delinquencies, defaults and foreclosures will also result in a higher cost to service those loans due to the increased time and effort required to collect payments from delinquent borrowers and to liquidate properties or
20
otherwise resolve loan defaults if payment collection is unsuccessful, and only a portion of these increased costs are recoverable under our servicing agreements. Increased mortgage delinquencies, defaults and foreclosures may also result in an increase in our interest expense and affect our liquidity as a result of borrowing under our credit facilities to fund an increase in our advancing obligations.
In addition, we are subject to risks of borrower defaults and bankruptcies in cases where we might be required to repurchase loans sold with recourse or under representations and warranties. A borrower filing for bankruptcy during foreclosure would have the effect of staying the foreclosure and thereby delaying the foreclosure process, which may potentially result in a reduction or discharge of a borrower’s mortgage debt. Even if we are successful in foreclosing on a loan, the liquidation proceeds upon sale of the underlying real estate may not be sufficient to recover our cost basis in the loan, resulting in a loss to us. For example, foreclosure may create a negative public perception of the related mortgaged property, resulting in a diminution of its value. Furthermore, any costs or delays involved in the foreclosure of the loan or a liquidation of the underlying property will further reduce the net proceeds and, thus, increase the loss. If these risks materialize, they could have a material adverse effect on our business, financial condition and results of operations.
GSE actions may negatively impact our MSRs and business.
On January 18, 2011, the FHFA announced that it has instructed the GSEs to study possible alternatives to the current residential mortgage servicing and compensation system used for single-family mortgage loans. There can be no certainty regarding what the GSEs may propose as alternatives to current servicing compensation practices, or when any such alternatives would become effective. Although MSRs that have already been created may not be subject to any changes implemented by the GSEs, it is possible that, because of the significant role of GSEs in the secondary mortgage market, any changes they implement could become prevalent in the mortgage servicing industry generally. Other industry stakeholders or regulators may also implement or require changes in response to the perception that the current mortgage servicing practices and compensation do not appropriately serve broader housing policy objectives. Changes to the residential mortgage servicing and compensation system would have a significant negative impact on our business, financial condition and results of operations.
The FHFA has released progress reports on the implementation of these efforts and outlined (i) the development of a new Contractual and Disclosure Framework that will align the contracts and data disclosures that support the mortgage-backed securities and set uniform contracts and standards for MBS that carry no or only a partial federal guarantee; (ii) the development of a common securitization platform that will perform major elements of the securitization process and eventually act as the agent of an issuer; and (iii) the initiation of a Uniform Mortgage Data Program to implement uniform data standards for single-family mortgages.
Our earnings may decrease because of changes in prevailing interest rates and any corresponding effects on origination volumes or the value of our assets.
Our profitability is directly affected by changes in prevailing interest rates. The following are the material risks we face related to changes in prevailing interest rates:
• | an increase in prevailing interest rates could adversely affect our loan originations volume because refinancing an existing loan would be less attractive for homeowners and qualifying for a loan may be more difficult for prospective borrowers; |
• | an increase in prevailing interest rates would increase the cost of financing servicing advances and loan originations; |
• | a decrease in prevailing interest rates may require us to record a decrease in the value of our MSRs; and |
• | because certain of the mortgage loans we service have adjustable rates, an increase in prevailing interest rates could cause an increase in delinquency, default and foreclosure rates resulting in increases in both operating expenses and interest expense and could cause a reduction in the value of our assets. |
We have experienced rapid growth, which may be difficult to sustain and which may place significant demands on our administrative, operational and financial resources. Our servicing portfolio, measured in unpaid principal balance, has grown from approximately $1.3 billion at December 31, 2011 to approximately $17.5 billion at December 31, 2015. Our rapid growth has caused, and if it continues will continue to cause, significant demands on our legal, accounting and operational infrastructure, and increased expenses. In addition, we are required to continuously develop our systems and infrastructure in response to the increasing sophistication of the mortgage lending market and legal, accounting and regulatory developments relating to all of our business activities. Our future growth will depend, among other things, on our ability to maintain an operating platform and management system sufficient to address our growth and will require us to incur significant additional expenses and to commit additional senior management and operational resources. As a result, we face significant challenges in:
21
• | maintaining adequate financial and business controls; |
• | implementing new or updated information and financial systems and procedures; and |
• | training, managing and appropriately sizing our work force and other components of our business on a timely and cost-effective basis. |
There can be no assurance that we will be able to manage our expanding operations effectively or that we will be able to continue to grow, and any failure to do so could materially and adversely affect our business, financial condition and results of operations.
We have acquired and may acquire additional loan origination platforms or businesses, servicing assets and businesses and other businesses that we believe complement our existing business and will contribute to our growth, and the failure to do so on attractive terms or at all or to integrate acquisitions into our operations or otherwise manage our planned growth may adversely affect us.
In 2014, we acquired Crossline, certain assets of Nationstar and an MSRs portfolio from an independent third party, and, in February 2014, we acquired certain assets of Medallion. We can provide no assurances that the acquired businesses or MSRs portfolio may achieve anticipated revenues, earnings or cash flow, business opportunities, synergies, growth prospects or other anticipated benefits. In addition, goodwill or other intangible assets established as a result of our business combinations may be incorrectly valued or become non-recoverable, which could result in impairment charges that would adversely affect our earnings.
Further, we can provide no assurances that we will be successful in identifying future origination platforms or businesses, servicing assets and businesses or other businesses that meet our acquisition criteria or that, once identified, we will be successful in completing an acquisition. We face significant competition for attractive acquisition opportunities from other well-capitalized investors, some of which have greater financial resources and a greater access to debt and equity capital to secure and complete acquisitions than we do. As a result of such competition, we may be unable to acquire certain assets or businesses that we deem attractive or the purchase price may be significantly elevated or other terms may be substantially more onerous. In addition, we may seek to finance future acquisitions through a combination of borrowings, the use of retained cash flows, and offerings of equity and debt securities, which may not be available on advantageous terms, or at all. Any delay or failure on our part to identify, negotiate, finance on favorable terms, consummate and integrate such acquisitions could impede our growth.
We may not realize all of the anticipated benefits of our acquisitions, which could adversely affect our business, financial condition and results of operations.
We have expanded our business through acquisitions. Our ability to realize the anticipated benefits of these acquisitions and businesses and acquisitions of servicing portfolios, as well as future acquisitions of businesses, servicing portfolios and origination platforms will depend, in part, on our ability to integrate those portfolios, platforms and businesses with our business. The process of acquiring assets or companies may disrupt our business and may not result in the full benefits expected. The risks associated with acquisitions include, among others:
• | unanticipated issues in integrating information, communications and other systems; |
• | unanticipated incompatibility of purchasing, logistics, marketing and administration methods; |
• | direct and indirect costs and liabilities; |
• | not retaining key employees; and |
• | the diversion of management’s attention from ongoing business concerns. |
Moreover, the acquired portfolios, platforms or businesses may not contribute to our revenues or earnings to any material extent, and cost savings and synergies we expect at the time of an acquisition may not be realized once the acquisition has been completed. If we inappropriately value the assets or businesses we acquire or the value of the assets or businesses we acquire declines after we acquire them, the resulting charges may negatively affect the carrying value of the assets on our balance sheet and our earnings. See the risk factor titled, “We use financial models and estimates in determining the fair value of certain assets, such as MSRs, commitments to originate loans, mortgage loans held for sale and related hedging instruments. If our estimates or assumptions prove to be incorrect, we may be required to record impairment charges, which could adversely affect our earnings.” Furthermore, if we incur additional indebtedness to finance an acquisition, the acquired business may not be able to generate sufficient cash flow to service that additional indebtedness. Unsuitable or unsuccessful acquisitions could materially and adversely affect our business, financial condition and results of operations.
Our mortgage financing business is subject to risks, including the risk of default and competitive risks, which could adversely affect our results of operations.
22
Through NattyMac, we provide financing to correspondents and other third party residential mortgage originators with respect to the loans they originate, and these customers may default on their obligations to us, including their obligations to pay the line of credit or transfer the relevant loan under such financing arrangements. If our financing customers default on their obligations to us, we could incur losses. In addition, competition in warehouse lending has increased on a national level as new lenders, including national, community and regional banks that use deposit funds to finance loans, have begun entering the mortgage warehouse business. If increased competition negatively affects our mortgage financing business, our earnings could decrease.
The change of control rules under Section 382 of the Code may limit our ability to use net operating loss carryforwards to reduce future taxable income.
We have net operating loss (“NOL”) carryforwards for federal and state income tax purposes. Generally, NOL carryforwards can be used to reduce future taxable income. Our use of our NOL carryforwards will be limited, however, under Section 382 of the Code, if we undergo a change in ownership of more than 50% of our capital stock over a three-year period as measured under Section 382 of the Code. These complex change of ownership rules generally focus on ownership changes involving shareholders owning directly or indirectly 5% or more of our stock, including certain public “groups” of shareholders as set forth under Section 382 of the Code, including those arising from new stock issuances and other equity transactions. We believe we experienced an ownership change for these purposes in October 2013 as a result of our initial public offering and in March 2012 as a result of a significant investment in preferred stock. In connection with any future public or private offerings, it is likely that we will experience another ownership change within the meaning of Section 382 of the Code, measured for this purpose by including transfers and issuances of stock that took place after the ownership change that we believe occurred in March 2012 and October 2013. If we experience another ownership change, the resulting annual limit on the use of our NOL carryforwards (which would generally equal the product of the applicable federal long-term tax-exempt rate, multiplied by the value of our capital stock immediately before the ownership change, and potentially increased by certain existing gains, if any, recognized within five years after the ownership change if we have a net built-in gain in our assets at the time of the ownership change) could result in a meaningful increase in our federal and state income tax liability in future years. Whether an ownership change occurs by reason of trading in our stock is not within our control and the determination of whether an ownership change has occurred is complex. No assurance can be given that we will not in the future undergo another ownership change that would have a significant adverse effect on the use of our NOL carryforwards. In addition, the possibility of causing an ownership change may reduce our willingness to issue new common stock to raise capital.
As a public reporting company, we are subject to rules and regulations established from time to time by the SEC and the NYSE regarding our internal control over financial reporting. We may not complete needed improvements to our internal control over financial reporting in a timely manner, or these internal controls may not be determined to be effective, which may adversely affect investor confidence in our company and, as a result, the market price of our common stock and your investment.
Upon completion of our IPO, we became a public reporting company subject to the rules and regulations established from time to time by the SEC and the NYSE. These rules and regulations require, among other things, that we establish and periodically evaluate procedures with respect to our internal controls over financial reporting. Reporting obligations as a public company are likely to place a considerable strain on our financial and management systems, processes and controls, as well as on our personnel. In addition, as a public company we are required to document and test our internal controls over financial reporting pursuant to Section 404 of the Sarbanes-Oxley Act of 2002 (“Sarbanes-Oxley Act”) so that our management can certify as to the effectiveness of our internal controls over financial reporting. Likewise, our independent registered public accounting firm will be required to provide an attestation report on the effectiveness of our internal controls over financial reporting when we cease to be an “emerging growth company,” as defined in the JOBS Act, although we could potentially qualify as an “emerging growth company” until December 31, 2018. As a result, we are in the process of improving our financial and managerial controls, reporting systems and procedures, incurring substantial expenses in making such improvements and testing our systems and hiring additional personnel. However, if we are unable to remediate any material weaknesses that may be identified in the future, if our management is unable to certify the effectiveness of our internal controls (at the time they are required to do so), if our independent registered public accounting firm cannot deliver (at such time as it is requested to do so by us) a report attesting to the effectiveness of our internal control over financial reporting or if we in the future identify and fail to remediate material weaknesses in our internal controls identified in the future, we could be subject to regulatory scrutiny and a loss of public confidence, which could harm our reputation and the market price of our common stock. In addition, if we do not maintain adequate financial and management personnel, processes and controls, we may not be able to manage our business effectively or accurately report our financial performance on a timely basis, which could cause a decline in our common stock price and adversely affect our results of operations and financial condition.
The success and growth of our business will depend upon our ability to adapt to and implement technological changes.
23
Our mortgage loan origination business is dependent upon our ability to effectively interface with our brokers, borrowers and other third parties and to efficiently process loan applications and closings. The origination process is becoming more dependent upon technological advancement. Any technologies we develop may not meet our expectations or maintain our needs for technological advancement. Further, the development of such technologies and maintaining and improving new technologies will require significant capital expenditures and maintaining the technological proficiency of our personnel will require significant expense.
As technological requirements increase in the future, we will have to fully develop these capabilities to remain competitive, and any failure to do so could adversely affect our business, financial condition and results of operations.
The ongoing implementation of the Dodd-Frank Act will increase our regulatory compliance burden and associated costs and place restrictions on certain originations and servicing operations, all of which could adversely affect our business, financial condition and results of operations.
The Dodd-Frank Act represents a comprehensive overhaul of the financial services industry in the United States. The Dodd-Frank Act includes, among other things: (i) the creation of a Financial Stability Oversight Council to identify emerging systemic risks posed by financial firms, activities and practices, and to improve cooperation among federal agencies; (ii) the creation of CFPB authorized to promulgate and enforce consumer protection regulations relating to financial products; (iii) the establishment of strengthened capital and prudential standards for banks and bank holding companies; (iv) enhanced regulation of financial markets, including the derivatives and securitization markets; and (v) amendments to the Truth in Lending Act aimed at improving consumer protections with respect to mortgage originations, including originator compensation, minimum repayment standards and prepayment considerations.
On January 10, 2014, the CFPB implemented certain provisions of the Dodd-Frank Act relating to mortgage originations. Under the new originations rule, before originating a mortgage loan, lenders must determine on the basis of certain information and according to specified criteria that the prospective borrower has the ability to repay the loan. Lenders that issue loans meeting certain requirements will be presumed to comply with the new rule with respect to these loans. On January 10, 2014, the CFPB also implemented final rules for certain provisions of the Dodd-Frank Act relating to mortgage servicing. The new servicing rules require servicers to meet certain benchmarks for customer service. Servicers must provide periodic billing statements and certain required notices and acknowledgments, promptly credit borrowers’ accounts for payments received and promptly investigate complaints by borrowers and are required to take additional steps before purchasing insurance to protect the lender’s interest in the property. The new servicing rules also call for additional notice, review and timing requirements with respect to delinquent borrowers, including early intervention, ongoing access to servicer personnel and specific loss mitigation and foreclosure procedures. On August 1, 2014, the CFPB announced the TILA-RESPA Integrated Disclosure rule that integrates the mortgage loan disclosures required under TILA and sections 4 and 5 of RESPA. The TILA-RESPA rule contains new requirements and two disclosure forms that borrowers will receive in the process of applying for and consummating a mortgage loan. The rule became effective October 3, 2015. The CFPB also issued guidelines on October 13, 2011 and January 11, 2012 indicating that it would send examiners to banks and other institutions that service and/or originate mortgage loans to assess whether consumers’ interests are protected.
The ongoing implementation of the Dodd-Frank Act, including the implementation of the new origination and servicing rules by the CFPB and the CFPB’s continuing examination of our industry, will increase our regulatory compliance burden and associated costs and place restrictions on our originations, servicing and financing operations, which could in turn adversely affect our business, financial condition and results of operations. See "Regulation" in Item 1 of this Form 10-K.
State or federal governmental examinations, legal proceedings or enforcement actions and related costs could have a material adverse effect on our liquidity, financial position and results of operations.
We are routinely involved in regulatory reviews and legal proceedings concerning matters that arise in the ordinary course of our business. An adverse result in regulatory actions or examinations or private lawsuits may adversely affect our financial results. In addition, a number of participants in our industry have been the subject of purported class action lawsuits and regulatory actions by state regulators and other industry participants have been the subject of actions by state Attorneys General. Regulatory investigations, both state and federal, can be either formal or informal. The costs of responding to the investigations can be substantial. In addition, government-mandated changes to servicing practices could lead to higher costs and additional administrative burdens, in particular regarding record retention and informational obligations.
The enforcement consent orders by, agreements with, and settlements of, certain federal and state agencies against other mortgage servicers related to foreclosure practices could impose additional compliance costs on our servicing business, which could adversely affect our business, financial condition and results of operations.
The federal and state agencies overseeing certain aspects of the mortgage market have entered into settlements and enforcement consent orders with other mortgage servicers regarding foreclosure practices that primarily relate to mortgage
24
loans originated during the credit crisis. The enforcement consent orders require the servicers, among other things, to: (i) make significant modifications in practices for residential mortgage loan servicing and foreclosure processing, including communications with borrowers and limitations on dual-tracking, which occurs when servicers continue to pursue foreclosure during the loan modification process; (ii) establish a single point of contact for borrowers throughout the loan modification and foreclosure processes; and (iii) establish robust oversight and controls pertaining to their third party vendors, including outside legal counsel, that provide default management or foreclosure services.
Although we are not a party to any of these settlements and enforcement consent orders and lack the legacy loans that gave rise to these settlements and enforcement consent orders, the practices set forth in those settlements and consent orders are being adopted by the industry as a whole, forcing us to comply with them in order to follow standard industry practices. We may also become required to comply with these practices by our servicing agreements. While we have made and continue to make changes to our operating policies and procedures in light of these settlements and consent orders, further changes could be required, and changes to our servicing practices will increase compliance costs for our servicing business, which could adversely affect our business, financial condition and results of operations.
Our foreclosure proceedings in certain states may be delayed due to inquiries by certain state Attorneys General, court administrators and state and federal government agencies, the outcome of which could have an adverse effect on business, financial condition and results of operations.
Allegations of irregularities in foreclosure processes, including so-called “robo-signing” by mortgage loan servicers, have gained the attention of the Department of Justice, regulatory agencies, state Attorneys General and the media, among other parties. Certain state Attorneys General, court administrators and government agencies, as well as representatives of the federal government, have issued letters of inquiry to mortgage servicers requesting written responses to questions regarding policies and procedures, especially with respect to notarization and affidavit procedures. Even though we have not received any letters of inquiry and we do not have the legacy loans that have been examined for irregularities in the foreclosure process, our operations may be affected by regulatory actions or court decisions that are taken in connection with these inquiries. In addition to these inquiries, several state Attorneys General have requested that certain mortgage servicers suspend foreclosure proceedings pending internal review to ensure compliance with applicable law.
The current legislative and regulatory climate could lead borrowers to contest foreclosures that they would not otherwise have contested under ordinary circumstances, and we may incur increased litigation costs if the validity of a foreclosure action is challenged by a borrower. Delays in foreclosure proceedings could also require us to make additional servicing advances by drawing on our financing facilities, delay the recovery of advances, or result in compensatory fees being imposed against us by a GSE or the FHFA for delaying the foreclosure process, all or any of which could adversely affect our business, financial condition and results of operations.
Court cases in Oregon and Washington have challenged whether MERS meets the statutory definition of deed of trust beneficiary under applicable state laws. Based on decisions handed down by courts in Oregon, we and other servicers of MERS-related loans have elected to foreclose through judicial procedures in Oregon, resulting in increased foreclosure costs, longer foreclosure timelines and additional delays. If the Oregon case law is upheld on appeal, and/or if the Washington or other state courts where we do significant business issue a similar decision in the cases pending before them, our foreclosure costs and foreclosure timelines may continue to increase, which in turn, could increase our single family loan delinquencies, servicing costs, and adversely affect our cost of doing business and results of operations.
We may incur increased costs and related losses if a borrower challenges the validity of a foreclosure action, if a court overturns a foreclosure or if a foreclosure subjects us to environmental liabilities, which could adversely affect our business, financial condition and results of operations.
We may incur costs if we are required to, or if we elect to, execute or re-file documents or take other action in our capacity as a servicer in connection with pending or completed foreclosures. We may incur litigation costs if the validity of a foreclosure action is challenged by a borrower. If a court overturns a foreclosure because of errors or deficiencies in the foreclosure process, we may have liability to a title insurer or the purchaser of the property sold in foreclosure. These costs and liabilities may not be legally or otherwise reimbursable to us, particularly to the extent they relate to securitized mortgage loans. In addition, if certain documents required for a foreclosure action are missing or defective, we could be obligated to cure the defect or repurchase the loan. A significant increase in litigation costs could adversely affect our liquidity, and our inability to be reimbursed for an advance could adversely affect our business, financial condition and results of operations.
In addition, in the course of our business, it is necessary to foreclose and take title to real estate, which could subject us to environmental liabilities with respect to these properties. Hazardous substances or waste, contaminants, pollutants or sources thereof may be discovered on properties during our ownership or after a sale to a third party. We could be held liable to a governmental entity or to third parties for property damage, personal injury, investigation and clean-up costs incurred by these
25
parties in connection with environmental contamination, or may be required to investigate or clean up hazardous or toxic substances or chemical releases at such properties. The costs associated with investigation or remediation activities could be substantial and could substantially exceed the value of the real property. In addition, as the owner or former owner of a contaminated site, we may be subject to common law claims by third parties based on damages and costs resulting from environmental contamination emanating from the property. We may be unable to recover costs from any third party. These occurrences may materially reduce the value of the affected property, and we may find it difficult or impossible to use or sell the property prior to or following any environmental remediation. If we ever become subject to significant environmental liabilities, our business, financial condition and results of operations could be materially and adversely affected.
Insurance on real estate securing mortgage loans and real estate securities collateral may not cover all losses.
There are certain types of losses, generally of a catastrophic nature, that result from such events as earthquakes, hurricanes, floods, acts of war or terrorism, and that may be uninsurable or not economically insurable. Inflation, changes in building codes and ordinances, environmental considerations and other factors, including terrorism or acts of war, also might make the insurance proceeds insufficient to repair or replace a property if it is damaged or destroyed. Under these circumstances, the insurance proceeds received might not be adequate to restore our economic position with respect to the affected real property. Any uninsured loss could result in the loss of cash flow from, and the asset value of, the affected property.
Borrowers with adjustable rate mortgage loans are especially exposed to increases in monthly payments and they may not be able to refinance their loans, which could cause delinquency, default and foreclosure and therefore adversely affect our business.
At December 31, 2015, we serviced adjustable rate mortgage loans that represented 1.42% of our total servicing portfolio. Borrowers with adjustable rate mortgage loans are exposed to increased monthly payments when the related mortgage loan’s interest rate adjusts upward from an initial fixed rate or a low introductory rate, as applicable, to the rate computed in accordance with the applicable index and margin. Borrowers with adjustable rate mortgage loans seeking to refinance their mortgage loans to avoid increased monthly payments as a result of an upwards adjustment of the mortgage loan’s interest rate may no longer be able to find available replacement loans at comparably low interest rates. This increase in borrowers’ monthly payments, together with any increase in prevailing market interest rates, may result in significantly increased monthly payments for borrowers with adjustable rate mortgage loans, which may cause delinquency, default and foreclosure. Increased mortgage defaults and foreclosures may adversely affect our business as they increase the cost of servicing the mortgage loans we service and reduce the number of mortgage loans we service.
Our counterparties may terminate our MSRs, which could materially and adversely affect our business, financial condition and results of operations.
The owners of the loans we service may, under certain circumstances, terminate our MSRs. Ginnie Mae may terminate our status as an issuer if we fail to comply with servicing standards or otherwise breach our agreement with Ginnie Mae. If this were to happen, Ginnie Mae would seize our MSRs and not compensate us for our MSRs. As is standard in the industry, under the terms of our master servicing agreement with GSEs, GSEs have the right to terminate us as servicer of the loans we service on their behalf at any time and the GSEs also have the right to cause us to sell the MSRs to a third party. In addition, failure to comply with servicing standards could result in termination of our agreements with GSEs. See the risk factor titled, “Because we are required to follow the guidelines of the GSEs with which we do business and are not able to negotiate our fees with these entities for the purchase of our loans, our competitors may be able to sell their loans to GSEs on more favorable terms.” Some GSEs may also have the right to require us to assign the MSRs to a subsidiary and sell our equity interest in the subsidiary to a third party. If we were to have our servicing rights terminated on a material portion of our servicing portfolio, this could materially and adversely affect our business, financial condition and results of operations.
Federal and state legislative and agency initiatives in mortgage-backed securities and securitization may adversely affect our financial condition and results of operations.
There are federal and state legislative and agency initiatives that could, once fully implemented, adversely affect our business. For instance, the risk retention requirement under the Dodd-Frank Act requires securitizers to retain a minimum beneficial interest in MBS they sell through a securitization, absent certain qualified residential mortgage (“QRM”) exemptions. Once implemented, the risk retention requirement may result in higher costs of certain origination operations and impose on us additional compliance requirements to meet servicing and origination criteria for QRMs. Additionally, the amendments to Regulation AB relating to the registration statement required to be filed by asset-backed securities (“ABS”) issuers adopted in March 2011 by the SEC pursuant to the Dodd-Frank Act would increase compliance costs for ABS issuers, which could in turn increase our cost of funding and operations. Any of the foregoing could adversely affect our business, financial condition and results of operations.
26
We may be required to indemnify purchasers of the mortgage loans we originate or of the MBS backed by such loans or to repurchase the related loans if the loans fail to meet certain criteria or characteristics.
The indentures governing our securitized pools of mortgage loans and our contracts with purchasers of our whole loans contain provisions that require us to indemnify purchasers of the loans we originate or of the MBS backed by such loans or to repurchase the related loans under certain circumstances. While our contracts vary, they contain provisions that require us to repurchase loans if:
• | our representations and warranties concerning loan quality and loan circumstances are inaccurate; |
• | we fail to secure adequate mortgage insurance within a certain period after closing; |
• | a mortgage insurance provider denies coverage; or |
• | we fail to comply, at the individual loan level or otherwise, with regulatory requirements, including but not limited to the provisions of the Dodd-Frank Act and the TILA-RESPA Integrated Disclosure rule. |
We believe that, as a result of the current market environment, many purchasers of residential mortgage loans are particularly aware of the conditions under which originators must indemnify them or repurchase loans they have purchased and would benefit from enforcing any repurchase remedies they may have. We believe that our exposure to repurchases under our representations and warranties includes the current unpaid balance of all loans we have sold. If we are required to indemnify or repurchase loans that we originate and sell or securitize that result in losses that exceed our reserve, this could adversely affect our business, financial condition and results of operations.
Because we are required to follow the guidelines of Ginnie Mae and the GSEs and are not able to negotiate our fees with these entities for the purchase of our loans, our competitors may be able to sell their loans to Ginnie Mae or the GSEs on more favorable terms.
In our transactions with Ginnie Mae and the GSEs, we are required to follow specific guidelines that impact the way we service and originate mortgage loans including:
• | our staffing levels and other servicing practices; |
• | the servicing and ancillary fees that we may charge; |
• | our modification standards and procedures; and |
• | the amount of non-reimbursable advances. |
In particular, the FHFA has directed GSEs to align their guidelines for servicing delinquent mortgages they own or guarantee, which can result in monetary incentives for servicers that perform well and penalties for those that do not. In addition, FHFA has directed Fannie Mae to assess compensatory fees against servicers in connection with delinquent loans, foreclosure delays, and other breaches of servicing obligations.
We cannot negotiate these terms with the GSEs, and they are subject to change at any time. A significant change in these guidelines that has the effect of decreasing our fees or requires us to expend additional resources in providing mortgage services could decrease our revenues or increase our costs, which could adversely affect our business, financial condition and results of operations.
We are required to make servicing advances that can be subject to delays in recovery or may not be recoverable in certain circumstances, which could adversely affect our cash flows, liquidity, business, financial condition and results of operations.
During any period in which a borrower is not making payments, we are required under most of our servicing agreements to advance our own funds to meet contractual principal and interest remittance requirements for investors, pay property taxes and insurance premiums, pay legal expenses and fund other protective advances. We also advance funds to maintain, repair and market real estate properties that we service. Fannie Mae and Freddie Mac currently permit us to stop advancing delinquent principal and interest when a loan is 120 days delinquent, but this policy could change at any time. As home values change, we may have to reconsider certain of the assumptions underlying our decisions to make advances and, in certain situations, our contractual obligations may require us to make certain advances for which we may not be reimbursed. In addition, in the event a mortgage loan serviced by us defaults or becomes delinquent, the repayment to us of the advance may be delayed until the mortgage loan is repaid or refinanced or a liquidation occurs. With respect to loans in Ginnie Mae pools, advances are not recovered until the loan becomes current or we make a claim with the FHA or other insurer, and our right to reimbursement is capped. They are typically recovered upon weekly or monthly reimbursement or from sale in the market. In the event we receive requests for advances in excess of amounts we are able to fund, we may not be able to fund these advance requests, which could materially and adversely affect our cash flows and liquidity. An increase in delinquency and default rates on the loans that we service will increase the need for us to make advances. If delinquencies were to increase at the same time that Fannie Mae and Freddie Mac were to change their policies about reimbursing advances at 120 days delinquent, this combination would adversely affect our liquidity. These actions could take place in a distressed economic environment, and
27
thus, we may find it difficult to retain our warehouse financing, which finances our business. If so, then we could find it extremely difficult to continue operations. Even if this combination of risks does not occur at the same time, any increase in delinquency or delay in our ability to collect an advance may adversely affect our cash flows and liquidity, and our inability to be reimbursed for an advance could adversely affect our business, financial condition and results of operations. Additionally, as we continue to grow our originations to increase our loan servicing portfolio, the negative operating cash flows we have experienced will likely continue in the future. See “Management’s Discussion and Analysis of Financial Condition and Results of Operations-Liquidity and Capital Resources” in Part II, Item 7 of this Annual Report on Form 10-K.
Our hedging strategies may not be successful in mitigating our risks associated with interest rates.
From time to time, we have used various derivative financial instruments to provide a level of protection against interest rate risks, including the commitments we make to prospective borrowers, but no hedging strategy can protect us completely. The derivative financial instruments that we select may not have the effect of reducing our interest rate risks. In addition, the nature and timing of hedging transactions may influence the effectiveness of these strategies. Poorly designed strategies, improperly executed and documented transactions or inaccurate assumptions could actually increase our risks and losses. In addition, hedging strategies involve transaction and other costs. Our hedging strategies and the derivatives that we use may not be able to adequately offset the risks of interest rate volatility, and our hedging transactions may result in or magnify losses. Furthermore, interest rate derivatives may not be available on favorable terms or at all, particularly during economic downturns. Any of the foregoing risks could adversely affect our business, financial condition, cash flows and results of operations.
Technology failures or terrorist attacks could damage our business operations and increase our costs, which could adversely affect our business, financial condition and results of operations.
The financial services industry as a whole is characterized by rapidly changing technologies, and system disruptions and failures caused by fire, power loss, telecommunications failures, unauthorized intrusion, computer viruses and disabling devices, natural disasters and other similar events may interrupt or delay our ability to provide services to our borrowers and other business partners. Security breaches, acts of vandalism and developments in computer capabilities could result in a compromise or breach of the technology that we use to protect our borrowers’ personal information and transaction data. Despite our efforts to ensure the integrity of our systems, it is possible that we may not be able to anticipate or implement effective preventive measures against all security breaches, especially because the techniques used change frequently or are not recognized until launched, and because security attacks can originate from a wide variety of sources, including third parties such as persons involved with organized crime or associated with external service providers. Those parties may also attempt to fraudulently induce employees, customers or other users of our systems to disclose sensitive information in order to gain access to our data or that of our customers or clients. These risks may increase in the future as we continue to increase our reliance on the internet and use of web-based product offerings and on the use of cybersecurity.
A successful penetration or circumvention of the security of our systems or a defect in the integrity of our systems or cybersecurity could cause serious negative consequences for our business, including significant disruption of our operations, misappropriation of our confidential information or that of our customers, or damage to our computers or operating systems and to those of our customers and counterparties. Any of the foregoing events could result in violations of applicable privacy and other laws, financial loss to us or to our customers, loss of confidence in our security measures, customer dissatisfaction, significant litigation exposure and harm to our reputation, all of which could adversely affect our business, financial condition and results of operations.
In addition, the terrorist attacks on September 11, 2001 disrupted the U.S. financial markets, including the real estate capital markets, and negatively impacted the U.S. economy in general. Any future terrorist attacks, the anticipation of any such attacks, the consequences of any military or other response by the United States and its allies, and other armed conflicts could cause consumer confidence and spending to decrease or result in increased volatility in the United States and worldwide financial markets and economy. The economic impact of these events could also adversely affect the credit quality of some of our loans and investments and the properties underlying our interests.
We may suffer losses as a result of the adverse impact of any future attacks and these losses may adversely impact our performance and may cause the market value of our shares of common stock to decline or be more volatile. A prolonged economic slowdown, recession or declining real estate values could impair the performance of our investments and harm our financial condition and results of operations, increase our funding costs, limit our access to the capital markets or result in a decision by lenders not to extend credit to us. We cannot predict the severity of the effect that potential future armed conflicts and terrorist attacks would have on us. Losses resulting from these types of events may not be fully insurable.
We have purchased certain refinancing loans where the correspondent originating the refinancing loan failed to obtain a satisfaction and release of the prior mortgage loan.
28
During 2013, we became aware that we purchased certain refinancing loans with original principal amounts totaling approximately $5.2 million in cases where the prior mortgage on the property securing the mortgage loan that we purchased from the correspondent was not satisfied and released by the correspondent’s title company at the time the loan from the correspondent was made. As part of our process in purchasing a mortgage loan from a correspondent, we generally require that a closing protection letter be issued by the title insurer in favor of the borrower. A closing protection letter was obtained with respect to each of these loans. As a result, the borrower should be insured against any liens prior to ours that were not identified in connection with the issuance of that closing protection letter. We believe that our procedures, including conducting a post-purchase audit, were effective in identifying the failure by the correspondent to obtain a release of the prior mortgage and that our practice of obtaining closing protection letters is appropriate to protect us in these situations. We have notified the affected borrowers and the relevant insurance carriers, and we expect that the title insurance obtained in connection with the refinancings will result in our loan having a first priority status. However, there can be no assurances that the prior mortgages will be fully satisfied from the title insurance claims or that instances like this will not occur in the future.
Any failure of our internal security measures or breach of our privacy protections could cause harm to our reputation and subject us to liability, any of which could adversely affect our business, financial condition and results of operations.
In the ordinary course of our business, we receive and store certain confidential information concerning borrowers. Additionally, we enter into third party relationships to assist with various aspects of our business, some of which require the exchange of confidential borrower information. If a third party were to compromise or breach our security measures or those of the vendors, through electronic, physical or other means, and misappropriate such information, it could cause interruptions in our operations and expose us to significant liabilities, reporting obligations, remediation costs and damage to our reputation. Any of the foregoing risks could adversely affect our business, financial condition and results of operations. In addition, some of our third party service providers may be subject to enhanced regulatory scrutiny due to regulatory findings during examinations of such service provider(s) conducted by federal regulators. While we intend to subject such vendor(s) to higher scrutiny and monitor any corrective measures that the vendor(s) are or would undertake if applicable, we are not able to fully mitigate any risk which could result from a breach or other operational failure caused by this, or any other vendor’s breach. See also risk factor titled, “Technology failures or terrorist attacks could damage our business operations and increase our costs, which could adversely affect our business, financial condition and results of operations.”
Our vendor relationships subject us to a variety of risks.
We have significant vendors that, among other things, provide us with financial, technology and other services to support our mortgage loan servicing and origination businesses. With respect to vendors engaged to perform activities required by servicing criteria, we have elected to take responsibility for assessing compliance with the applicable servicing criteria for the applicable vendor and are required to have procedures in place to provide reasonable assurance that the vendor’s activities comply in all material respects with servicing criteria applicable to the vendor, including but not limited to, monitoring compliance with our predetermined policies and procedures and monitoring the status of payment processing operations. In the event that a vendor’s activities do not comply with the servicing criteria, it could negatively impact our servicing agreements. In addition, if our current vendors were to stop providing services to us on acceptable terms, including as a result of one or more vendor bankruptcies due to poor economic conditions, we may be unable to procure alternatives from other vendors in a timely and efficient manner and on acceptable terms, or at all. Further, we may incur significant costs to resolve any such disruptions in service and this could adversely affect our business, financial condition and results of operations. Additionally, in April 2012 the CFPB issued CFPB Bulletin 2012-03 which states that supervised banks and non-banks could be held liable for actions of their service providers. As a result, we could be exposed to liability, CFPB enforcement actions or other administrative penalties if the vendors with whom we do business violate consumer protection laws.
The loss of the services of our senior executives could adversely affect our business, financial condition and results of operations.
The experience of our senior executives is a valuable asset to us. Our management team has significant experience in the residential mortgage origination and servicing industry. Changes to our senior executive team may occur, which could have an adverse effect on our business, financial condition and results of operations. We do not maintain and do not currently plan to obtain key life insurance policies on any of our senior managers.
We recently restructured our executive team, and our new management team’s ability to execute our business strategy may not prove successful.
Many members of our executive team are new to the Company. These are significant changes implemented over a relatively short period of time. Some of our executive team members are in new positions or come from different companies and backgrounds, so it may take time for our new executive team to develop a coordinated management style. New executive teams also are generally more likely to experience turnover and may take more time to develop effective teamwork. Our
29
restructured executive team has devoted substantial efforts to significantly change our business strategy and operational activities, yet there is no assurance that these efforts will prove successful or that the executive team will be able to successfully execute upon our business strategy and operational activities.
Our business could suffer if we fail to attract and retain a highly skilled workforce.
Our future success will depend on our ability to identify, hire, develop, motivate and retain highly qualified personnel for all areas of our organization, in particular skilled managers, loan servicers, debt default specialists, loan officers and underwriters. Trained and experienced personnel are in high demand and may be in short supply in some areas. Many of the companies with which we compete for experienced employees have greater resources than we have and may be able to offer more attractive terms of employment. In addition, we invest significant time and expense in training our employees, which increases their value to competitors who may seek to recruit them. We may not be able to attract, develop and maintain an adequate skilled workforce necessary to operate our businesses, and labor expenses may increase as a result of a shortage in the supply of qualified personnel. If we are unable to attract and retain such personnel, we may not be able to take advantage of acquisitions and other growth opportunities that may be presented to us, and this could materially affect our business, financial condition and results of operations.
Negative public opinion could damage our reputation and adversely affect our earnings.
Reputation risk, or the risk to our business, earnings and capital from negative public opinion, is inherent in our business. Negative public opinion can result from our actual or alleged conduct in any number of activities, including lending and debt collection practices, corporate governance, and actions taken by government regulators and community organizations in response to those activities. Negative public opinion can also result from media coverage, whether accurate or not. Negative public opinion can adversely affect our ability to attract and retain customers and employees and can expose us to litigation and regulatory action. Although we take steps to minimize reputation risk in dealing with our customers, business partners and communities, this risk will always be present in our organization.
ITEM 1B. UNRESOLVED SEC STAFF COMMENTS
None.
ITEM 2. PROPERTIES
The following table sets forth information related to our primary operating facilities at December 31, 2015. In addition to the facilities listed in the table below, we also lease small offices (retail branches and executive suites) throughout the United States.
Location | Owned/Leased | Square Footage | |||
Principal executive office: | |||||
Indianapolis, Indiana -- Corporate Headquarters | Leased | 77,421 | |||
Business operations and support offices: | |||||
Lake Forest, California | Leased | 39,870 | |||
Clearwater, Florida | Leased | 32,533 | |||
Dallas, Texas | Leased | 22,470 | |||
Indianapolis, Indiana | Leased | 21,000 | |||
Overland Park, Kansas | Leased | 16,019 | |||
Creve Coeur, Missouri | Leased | 14,364 | |||
Scottsdale, Arizona | Leased | 12,717 | |||
Oak Brook, Illinois | Leased | 9,192 | |||
Greenwood, Indiana | Leased | 7,548 | |||
Mansfield, Ohio | Leased | 6,300 | |||
Of the above locations, Mansfield, Ohio and Dallas, Texas house our Servicing business, while our Financing business is based in Clearwater, Florida which also includes some of our Originations business. All other locations, with the exception of our Indianapolis, Indiana locations which are devoted to corporate operations and risk compliance, support our Originations business.
ITEM 3. LEGAL PROCEEDINGS
30
For information regarding legal proceedings at December 31, 2015, see the "Litigation" section of Note 18, "Commitments and Contingencies" to our audited consolidated financial statements included in Part II, Item 8 of this Annual Report on Form 10-K.
ITEM 4. MINE SAFETY DISCLOSURES
Not applicable.
31
PART II
ITEM 5. MARKET FOR REGISTRANT'S COMMON EQUITY, RELATED STOCKHOLDER MATTERS AND ISSUER PURCHASES OF EQUITY SECURITIES
Market Prices
Our common stock, par value $0.01 per share, has been listed on the NYSE under the symbol "SGM" since October 10, 2013. Our initial public offering was priced at $16.00 on October 9, 2013. The following table presents the high and low sales prices for our common stock on the NYSE for the years ended December 31, 2015 and 2014:
High | Low | |||||||
2015 | ||||||||
First Quarter | $ | 11.92 | $ | 9.50 | ||||
Second Quarter | $ | 11.56 | $ | 9.76 | ||||
Third Quarter | $ | 10.17 | $ | 6.28 | ||||
Fourth Quarter | $ | 7.53 | $ | 4.63 | ||||
2014 | ||||||||
First Quarter | $ | 17.00 | $ | 14.15 | ||||
Second Quarter | $ | 15.37 | $ | 11.99 | ||||
Third Quarter | $ | 15.26 | $ | 12.55 | ||||
Fourth Quarter | $ | 14.46 | $ | 11.55 | ||||
As of February 29, 2016, there were 25,797,744 shares outstanding and 881 stockholders of record of our common stock. A substantially greater number of holders of our common stock are “street name” or beneficial holders, whose shares are held by banks, brokers and other financial institutions.
Dividends
We have never declared or paid dividends on our common stock and we currently do not expect to declare or pay any dividends in the foreseeable future. Instead, we anticipate that all of our earnings in the foreseeable future will be used for the operation and growth of our business.
Any future determination to pay dividends on our common stock will be at the discretion of our Board of Directors and will depend upon many factors, including our financial position, results of operations, liquidity, legal requirements, restrictions that may be imposed by the terms in current and future financing instruments to which we are a party, and other factors deemed relevant by our Board of Directors.
Securities Authorized for Issuance Under Equity Compensation Plans
The information required by this Item concerning securities authorized for issuance under our equity compensation plans is set forth in or incorporated by reference into Part III, Item 12 "Security Ownership of Certain Beneficial Owners and Management and Related Stockholder Matters" in this Annual Report on Form 10-K.
Performance Graph
The following graph shows a comparison of the cumulative total stockholder return for our common stock, the Russell 2000 Market Index and the S&P Diversified Financials Market Index from October 10, 2013 (the date our common stock began trading on the NYSE) through December 31, 2015. This graph assumes an initial investment of $100 on October 10, 2013 in each of our common stock, the Russell 2000 Market Index and the S&P Diversified Financials Market Index (and the reinvestment of all dividends).
The comparisons shown in the graph below are based on historical data and we caution that the stock price performance shown in the graph is not indicative of, and is not intended to forecast, the potential future performance of our commons stock. The following graph and related information shall not be deemed "soliciting materials" or to be "filed" with the SEC, nor shall such information be incorporated by reference into any future filings under the Securities Act of 1933, as amended, or the Exchange Act, except to the extent that we specifically incorporate it by reference into such filing.
32
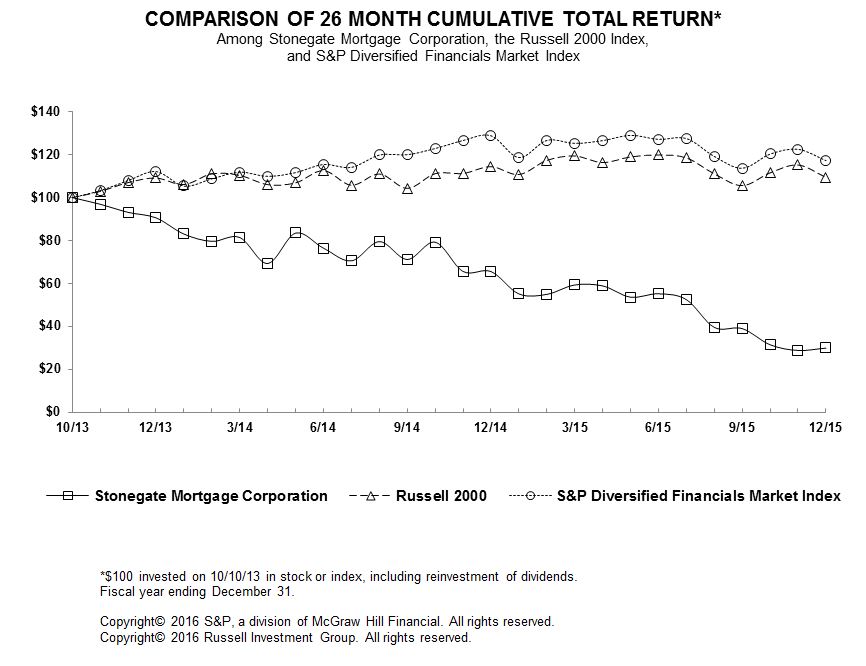
33
ITEM 6. SELECTED FINANCIAL DATA
The following table presents selected financial information of Stonegate. The selected historical consolidated financial data as of December 31, 2015, 2014 and 2013, and for each of the years ended December 31, 2015, 2014 and 2013, has been derived from, and should be read together with, our audited consolidated financial statements and related notes included in Item 8 of this Annual Report on Form 10-K. The selected historical consolidated financial data as of December 31, 2012 and 2011 and for the year ended December 31, 2012 and 2011 have been derived from our audited consolidated financial statements for those years, which are not included in this Form 10-K. Results for all periods consider discontinued operations presentation. There were no results of discontinued operations for the years ended December 31, 2013, 2012 and 2011, as the retail branches sold or disposed of were not established until 2014 and beyond. Amounts presented for basic and diluted earnings per share reflect the impact of our stock dividend of 12.861519 additional shares of our common stock for each share of our common stock that was outstanding on May 14, 2013.
You should read this selected financial data along with Part II, Item 7 “Management’s Discussion and Analysis of Financial Condition and Results of Operations” and Part II, Item 8 "Financial Statements and Supplementary Data" included in this Annual Report on Form 10-K.
(In thousands, except per share data) | As of and for the Years ended December 31, | |||||||||||||||||||
2015 | 2014 | 2013 | 2012 | 2011 | ||||||||||||||||
Income Statement Data | ||||||||||||||||||||
Revenues: | ||||||||||||||||||||
Gains on mortgage loans held for sale, net | $ | 141,819 | $ | 133,390 | $ | 83,327 | $ | 71,420 | $ | 16,735 | ||||||||||
Change in MSRs valuation | $ | (30,395 | ) | $ | (55,842 | ) | $ | 22,967 | $ | — | $ | — | ||||||||
Payoff and principal amortization of MSRs portfolio | $ | (41,529 | ) | $ | (23,735 | ) | $ | (8,545 | ) | $ | — | $ | — | |||||||
Loan origination and other loan fees | $ | 23,956 | $ | 24,581 | $ | 21,227 | $ | 9,871 | $ | 4,288 | ||||||||||
Loan servicing fees | $ | 54,772 | $ | 44,407 | $ | 22,204 | $ | 5,908 | $ | 2,628 | ||||||||||
Interest income | $ | 34,117 | $ | 35,236 | $ | 16,767 | $ | 5,257 | $ | 2,371 | ||||||||||
Expenses: | ||||||||||||||||||||
Salaries, commissions and benefits | $ | 116,341 | $ | 116,200 | $ | 72,475 | $ | 32,737 | $ | 13,085 | ||||||||||
General and administrative expense | $ | 32,260 | $ | 34,545 | $ | 22,773 | $ | 7,717 | $ | 3,249 | ||||||||||
Interest expense | $ | 31,063 | $ | 26,007 | $ | 14,426 | $ | 6,239 | $ | 2,728 | ||||||||||
Impairment of MSRs | $ | — | $ | — | $ | — | $ | 11,698 | $ | 2 | ||||||||||
Amortization of MSRs | $ | — | $ | — | $ | — | $ | 3,679 | $ | 960 | ||||||||||
(Loss) income from continuing operations, net of tax | $ | (16,241 | ) | $ | (25,428 | ) | $ | 22,598 | $ | 17,085 | $ | 2,335 | ||||||||
(Loss) income from discontinued operations, net of tax | $ | (6,029 | ) | $ | (5,251 | ) | $ | — | $ | — | $ | — | ||||||||
Net (loss) income | $ | (22,270 | ) | $ | (30,679 | ) | $ | 22,598 | $ | 17,085 | $ | 2,335 | ||||||||
Basic (loss) earnings per share from continuing operations | $ | (0.63 | ) | $ | (0.99 | ) | $ | 1.61 | $ | 5.31 | $ | 0.70 | ||||||||
Diluted (loss) earnings per share from continuing operations | $ | (0.63 | ) | $ | (0.99 | ) | $ | 1.32 | $ | 2.26 | $ | 0.59 | ||||||||
Balance Sheet Data | ||||||||||||||||||||
Cash and cash equivalents | $ | 32,463 | $ | 45,382 | $ | 43,104 | $ | 15,056 | $ | 403 | ||||||||||
Mortgage loans held for sale, at fair value | $ | 645,696 | $ | 1,048,347 | $ | 683,080 | $ | 218,624 | $ | 61,729 | ||||||||||
MSRs, at fair value | $ | 199,637 | $ | 204,216 | $ | 170,294 | $ | — | $ | — | ||||||||||
MSRs, at lower of amortized cost or fair value | $ | — | $ | — | $ | — | $ | 42,202 | $ | 17,679 | ||||||||||
Total assets | $ | 1,280,626 | $ | 1,596,551 | $ | 989,889 | $ | 309,606 | $ | 89,108 | ||||||||||
Secured borrowings - mortgage loans | $ | 492,799 | $ | 592,798 | $ | 342,393 | $ | 102,675 | $ | 57,894 | ||||||||||
Secured borrowings - MSRs | $ | 77,069 | $ | 75,970 | $ | — | $ | — | $ | — | ||||||||||
Secured borrowings - eligible GNMA loan repurchases | $ | 37,615 | $ | — | $ | — | $ | — | $ | — | ||||||||||
Mortgage repurchase borrowings | $ | 279,421 | $ | 472,045 | $ | 223,113 | $ | 100,301 | $ | — | ||||||||||
Warehouse lines of credit | $ | 1,306 | $ | 1,374 | $ | 7,056 | $ | — | $ | — | ||||||||||
Total liabilities | $ | 1,018,998 | $ | 1,316,476 | $ | 682,388 | $ | 254,357 | $ | 78,692 | ||||||||||
Total stockholders' equity | $ | 261,628 | $ | 280,075 | $ | 307,501 | $ | 55,249 | $ | 10,416 | ||||||||||
Other Data | ||||||||||||||||||||
Origination volume | $ | 11,238,041 | $ | 11,975,133 | $ | 8,706,887 | $ | 3,449,407 | $ | 1,050,434 | ||||||||||
Servicing portfolio ($UPB) | $ | 17,520,731 | $ | 18,336,745 | $ | 11,923,510 | $ | 4,145,340 | $ | 1,315,888 | ||||||||||
34
ITEM 7. MANAGEMENT’S DISCUSSION AND ANALYSIS OF FINANCIAL CONDITION AND RESULTS
OF OPERATIONS
OF OPERATIONS
(Dollars In Thousands, Except Per Share Data or As Otherwise Stated Herein)
The following Management’s Discussion and Analysis of Financial Condition and Results of Operations (“MD&A”) should be read in conjunction with our audited consolidated financial statements and related notes as of and for the years ended December 31, 2015, 2014 and 2013, included in Part II, Item 8 of this Annual Report on Form 10-K. This MD&A contains forward-looking statements that involve risk, uncertainties and assumptions. Our actual results could differ materially from those anticipated in the forward-looking statements as a result of many factors, including those discussed in “Risk Factors” in Part I, Item 1A of this Annual Report on Form 10-K. As used in this discussion and analysis, unless the context otherwise requires or indicates, references to “the Company,” “our company,” “we,” “our” and “us” refer to Stonegate Mortgage Corporation and its consolidated subsidiaries.
Overview
We are a leading, non-bank mortgage company focused on originating, financing and servicing U.S. residential
mortgage loans that operates as an intermediary between residential mortgage borrowers and the ultimate investors of these
mortgages. We predominantly transfer mortgage loans into pools of Government National Mortgage Association ("Ginnie
Mae" or "GNMA") mortgage backed securities ("MBS") and sell mortgage loans to the Federal National Mortgage Association
(“Fannie Mae” or “FNMA”) and the Federal Home Loan Mortgage Corporation ("Freddie Mac" or "FHLMC"). Both FNMA
and FHLMC are considered government-sponsored enterprises ("GSEs"), for which we may perform servicing of U.S.
residential mortgage loans. We also sell mortgage loans to other third-party investors in the secondary market and provide
short-term financing to other residential mortgage loan originators. Our principal sources of revenue include (i) gain on sale of
mortgage loans from loan originations and whole loan sales, and fee income from originations, (ii) fee income from loan
servicing and (iii) fee and net interest and other income from its financing facilities. We operate in three segments:
Originations, Servicing and Financing. This segment determination is based on our current organizational structure, which
reflects how our chief operating decision maker evaluates the performance of our business.
Market Considerations, Recent Industry Trends and Our Outlook
Mortgage Originations and Financing
Today’s U.S. residential mortgage loan origination sector primarily offers conventional agency and government conforming mortgage loans. Residential mortgage origination volume is impacted by changes in interest rates and housing market dynamics. Origination volume in 2014 was estimated at $1.35 trillion, according to the 2014 Home Mortgage Disclosure Act (HMDA) Data recently released. An average of estimates from industry sources (Fannie Mae, Freddie Mac, and the MBA) indicate that 2015 origination volume was $1.64 trillion, an increase of 21% over 2014, as the market continued to benefit from the low prevailing interest rates. Refinance volume was estimated at 46% of total origination volume in 2015. Throughout 2015, the 30-year fixed mortgage rates were relatively flat and remained below 4.00% for the majority of the year, ending the year at 3.96%, resulting in higher industry-wide refinance volume. Additionally, reductions in Federal Housing Administration ("FHA") mortgage insurance premiums in the first quarter 2015 increased refinance volume; the effect impacted the first and second quarters of 2015, but began to subside during the remainder of 2015.
Despite the increase in mortgage origination volume year-over-year, 2015 volume remained depressed compared to historical levels as homeownership rates continue to remain low. In the fourth quarter of 2015, the homeownership rate was 64% compared to a high of 69% in 2005. However, household formation continues to trend up as the younger generation “comes of age”; many of these potential first-time homebuyers could drive additional purchase demand in the future. A more robust purchase market would help alleviate the volatility of the mortgage market associated with refinance volume.
The U.S. residential mortgage industry continues to experience mixed trends in loan applications and activity in recent months. During 2015, the MBA Weekly Refinance Application Index increased from 1162.9 on December 26, 2014 to 1272.9 on December 25, 2015, but fluctuated significantly throughout the year. The MBA Weekly Purchase Application Index increased from 152.4 on December 26, 2014 to 196.2 on December 25, 2015. Applications serve as a leading indicator for mortgage originations as applications turn into originations within a couple months.
Reports issued by Fannie Mae, Freddie Mac and the MBA indicate an average forecast of $1.44 trillion for 2016 origination volume. All three industry sources estimate that interest rates will continue to increase in 2016, resulting in decreased refinance activity. Additionally, according to Fannie Mae, affordability could be negatively impacted and could
35
potentially constrain the housing market in 2016 if home price appreciation continues to outpace income growth, especially if mortgage rates trend up meaningfully. However, all three industry sources are forecasting an increase in purchase volume in 2016, so the projected reduction in refinances accounts for the projected drop in mortgage originations.
Finally, there continues to be changes in legislation and licensing in an effort to simplify and protect the consumer mortgage loan experience, which have required, and will continue to require, technological changes and additional implementation costs for mortgage loan originators. Specifically, the implementation of new forms and related requirements to comply with the Truth In Lending Act ("TILA") and Real Estate Settlement Procedures Act ("RESPA") Integrated Disclosure rule ("TRID") has necessitated significant operational and technological expenses and changes for the entire mortgage origination industry, and for our mortgage origination business in particular. We expect legislative changes and enforcement of recently effective legislation will continue in the foreseeable future, which may increase related expenses for originators in the industry. For additional information, see “Regulation” within Part I, Item 1 "Business" of this Annual Report on Form 10-K.
Mortgage Servicing
The mortgage servicing industry is impacted by borrower delinquencies and foreclosure activity, and servicers require a high level of expertise to comply with ongoing mortgage servicing reform and standardization of servicing and foreclosure practices within the industry. The modification of processes to adopt any new servicing or foreclosure standards may cause an increase in servicing costs for servicers in the industry. For additional information, see “Regulation” within Part I, Item 1 "Business" of this Annual Report on Form 10-K.
In the past several years, the mortgage servicing industry has transformed in several ways, primarily as a result of the economic crisis. Regulatory and counterparty oversight has increased, which led to increased servicing costs. According to Freddie Mac, between 2008 and 2013, the average cost to service a performing loan increased 2.6 times and the cost to service a nonperforming loan increased 4.9 times. Additionally, the cost to hold mortgage servicing right assets (“MSRs”) increased in the wake of new capital requirements for banks and increased regulatory scrutiny. These factors have led to an increase in special servicers focused on nonperforming loans, as well as industry deconsolidation, specifically as it pertains to nonbanks accounting for a larger share of servicing than in the past. Among the top twenty servicers in 2009, nonbanks accounted for 9% of the servicing. By 2014, that share had increased 2.1 times to 19%.
Interest Rate Impacts
An increase in interest rates generally could lead to the following, which may in the aggregate have an adverse effect on our results:
• | a reduction in origination volume and interest rate lock commitments; |
• | a shift from loan refinancing volume to purchase loan volume; |
• | a reduction of gains on mortgage loans held for sale; due to a more competitive originations market; |
• | an increase in net interest income from financing (assuming a steeper forward yield curve); |
• | an increase in the value of mortgage servicing rights due to a decline in prepayment expectations; and |
• | a decrease in actual prepayment speeds and activity, resulting in lower amortization expense. |
Performance Summary and Outlook
The following highlights our performance from continuing operations for the years ended December 31, 2015 and 2014.
Years Ended December 31, | Change | |||||||||||||
2015 | 2014 | $ | % | |||||||||||
Mortgage loan originations | $ | 11,238,041 | $ | 11,975,133 | $ | (737,092 | ) | (6 | )% | |||||
Gain on sale revenue | $ | 141,819 | $ | 133,390 | $ | 8,429 | 6 | % | ||||||
Gain on sale revenue, bps1 | 126 | 112 | 14 | 13 | % | |||||||||
Total Expenses related to Originations segment, bps1 | 134 | 127 | 7 | 6 | % | |||||||||
Total Expenses related to Servicing segment, bps2 | 13 | 10 | 3 | 30 | % | |||||||||
As of | Change | |||||||||||||
December 31, 2015 | December 31, 2014 | $ | % | |||||||||||
Mortgage Service Portfolio ("UPB") | $ | 17,520,731 | $ | 18,336,745 | $ | (816,014 | ) | (4 | )% | |||||
36
1Bps as a percentage of origination volume for applicable period.
2Bps as a percentage of our average servicing portfolio for applicable period.
We operate a diversified originations business, consisting of retail, wholesale and correspondent channels. These
channels each offer varying risk and return characteristics. Our retail channel operates via a distributed network of branches
and direct-to-consumer call centers (our "retail direct" or "Stonegate Direct" division), which we created in October 2014 to
allow us to reach customers directly through the Internet and call centers using a lower cost platform. While our origination volume has decreased in the current year, our gain on sale revenue, in dollars and as a percentage of origination volume, continues to increase given shifts in our product mix towards government-insured loan production. Government-insured loan originations generally produce higher revenues than originations from our other loan products.
During the third quarter, the composition of our executive team changed. Jim Cutillo resigned as CEO, effective
September 10, 2015. Our Chairman, Richard A. Kraemer was appointed Interim CEO and is overseeing the day-to-day management of Stonegate. In addition, James V. Smith was appointed as President and COO, and he will be responsible for overseeing all of our operations. Secondly, to better manage the expenses associated with retail originations, we have decided to decrease our retail branch footprint, either by sale or closure of branches. We sold 14 retail branches to an unrelated third party buyer in the fourth quarter. By the end of the fourth quarter of 2015, we had disposed of seventy-six retail branches, inclusive of the 14 branches sold.
Our servicing revenues have continued to grow as the volume of MSRs generated from our originations platform has
increased, resulting in an increase in the average number of loans in our servicing portfolio. We are prepared to act as either a buyer or a seller of MSRs, depending on market conditions and our liquidity needs. As we monitor these market conditions, we may choose to sell in bulk a portion of our servicing rights to third parties, continue our involvement as a subservicer to certain sold servicing rights, sell a portion of our servicing rights on a monthly flow basis or retain other beneficial interests (such as interest-only strips) as we determine to create the best economic value in the current market. Subservicing fee revenue is earned over the life of the associated loan and is generally lower than the servicing fee received by the owner of the MSRs; however, there are lower risks in subservicing loans as opposed to owning the MSRs, such as prepayment risk, and subservicing is less capital intensive than owning MSRs as there is no asset recorded on the balance sheet for subservicing of mortgage loans. Also, selling MSRs on a monthly flow basis results in immediate additional liquidity, allowing us to deploy capital resources into potential higher return assets and generate higher levels of profitability. As we sell MSRs, we lessen the negative impact that high prepayment speeds and lower interest rates have on our Servicing segment results, as the segment would no longer be subject to the fair value adjustments for the sold MSRs. Additionally, we have entered into MSRs financing facilities that allow us to leverage the MSRs assets we hold.
We continue to grow our financing segment as we focus on providing warehouse financing to our correspondent
customers and other institutions. Our financing subsidiary, NattyMac, allows us to leverage our proprietary technology and our
existing due diligence and underwriting processes to efficiently underwrite the warehouse lines of credit it provides for both our
origination segment correspondent originators and customers who may not sell loans to our origination segments. We believe
that NattyMac is highly scalable with little additional fixed cost investment needed to grow our customer base. We believe our
focus on growth in NattyMac creates access to efficient sources of capital and strengthens relationships with small to mid-size
correspondents to originate mortgage loans that meet our underwriting requirements and are eligible for us and other investors
to purchase.
We have experienced increased expenses associated with our investments in technology and the growth of headcount
necessary to support our originations volume and MSRs average servicing portfolio growth. We expect expenses to
decrease given the disposal of portions of our retail channel, but expect more profitable retail originations from the remaining
operations. Any retail expansion and strategic growth going forward is focused on the retail direct side of the retail channel. We
plan to maximize our potential return by focusing on lowering expenses through creating system automation efficiencies
through information technology investments and process enhancements and through managing expenses. We will invest in additional information technology infrastructure to manage our growth and to increase automation within our systems surrounding both critical operational areas and corporate support areas, as well as to address the technological complexities in complying with various regulations. We believe these investments will eventually lead to a decrease in expenses over the long-term.
We have also experienced increased expenses related to industry regulatory compliance. We are monitoring a number
of developments in regulations that are expected to impact us, and there has been a heightened focus of regulators on the
practices of the mortgage industry. The full impact of regulatory developments remains uncertain, although we expect the
higher level of legislative and regulatory focus on mortgage origination and servicing practices will result in higher legal,
compliance, and servicing related costs, heightened risk of potential regulatory fines and penalties, or an increase in mortgage
origination or servicing related litigation. In particular, we have devoted significant operational and technological resources to
37
comply with the TILA-RESPA Integrated Disclosure rule that integrates the mortgage loan disclosures required under TILA and
sections 4 and 5 of RESPA. This rule became effective for nearly all mortgage applications received on or after October 3,
2015.
For a discussion of the significant regulations and regulatory oversight initiatives that have affected or may affect our business, please see the discussion in the Regulations section of Part 1, Item I "Business" and Part I, Item 1A "Risk Factors" of this Annual Report on Form 10-K.
Financial Condition Summary
Total assets decreased $315,925, or 20% during the year ended December 31, 2015. Total liabilities decreased $297,478, or 23%, during the year ended December 31, 2015. Changes in the composition and balance of our assets and liabilities during the year ended December 31, 2015 are attributable to lower volume of loans originated during the current period, compared to the prior period, the disposal of certain retail branches and sales within our MSRs portfolio.
Non-GAAP Financial Measures
Our results of operations discussed throughout this MD&A are determined in accordance with U.S. generally accepted accounting principles (“GAAP”). We also calculate adjusted net income (loss) from continuing operations and adjusted diluted EPS from continuing operations as performance measures, which are considered non-GAAP financial measures under Regulation G and Item 10(e) of Regulation S-K, to further aid our investors in understanding and analyzing our core operating results and comparing them among periods. Adjusted net income (loss) from continuing operations and adjusted diluted EPS from continuing operations exclude certain items that we do not consider part of our core operating results, including changes in valuation inputs and assumptions on our MSRs, stock-based compensation expenses, severance expenses, other non-routine costs and acquisition related costs. Other non-routine expenses consist primarily of costs associated with the write down of certain assets in the third quarter of 2015, guarantees and other compensation expense prior to the period of meaningful origination production during the first quarter of 2014 and costs related to our equity offerings that occurred in the second and fourth quarters of 2013. These non-GAAP financial measures are not intended to be considered in isolation or as a substitute for (loss) income from continuing operations before income taxes, net (loss) income from continuing operations or diluted (LPS) EPS from continuing operations prepared in accordance with GAAP.
In addition, adjusted net income from continuing operations has limitations as an analytical tool, including but not limited to the following:
• | adjusted net income does not reflect our cash expenditures or future requirements for capital expenditures or contractual commitments; |
• | adjusted net income does not reflect changes in, or cash requirements for, our working capital needs; |
• | adjusted net income does not reflect the cash requirements necessary to service principal payments related to the financing of the business; |
• | peer companies in our industry may calculate adjusted net income differently, thereby limiting its usefulness as a comparative measure. |
Because of these and other limitations, adjusted net (loss) income from continuing operations should not be considered solely as a measure of discretionary cash available to us to invest in the growth of our business. Adjusted net (loss) income from continuing operations is a performance measure and is presented to provide additional information about our core operations.
The table below reconciles net (loss) income from continuing operations, net of tax, to adjusted net income from continuing operations and diluted (LPS) EPS from continuing operations to adjusted diluted EPS from continuing operations (which are the most directly comparable GAAP measures) for the years ended December 31, 2015, 2014 and 2013.
Years Ended December 31, | 2015 vs 2014 Change | 2014 vs 2013 Change | |||||||||||||||||||||||
2015 | 2014 | 2013 | $ | % | $ | % | |||||||||||||||||||
Net (loss) income from continuing operations, net of tax | $ | (16,241 | ) | $ | (25,428 | ) | $ | 22,598 | $ | 9,187 | (36 | )% | $ | (48,026 | ) | (213 | )% | ||||||||
Adjustments: | |||||||||||||||||||||||||
Interest expense associated with term loan | — | — | 1,587 | — | — | % | (1,587 | ) | (100 | )% | |||||||||||||||
Changes in valuation inputs and assumptions on MSRs1 | 30,395 | 55,842 | (22,967 | ) | (25,447 | ) | (46 | )% | 78,809 | (343 | )% | ||||||||||||||
38
Stock-based compensation expense | 3,823 | 3,253 | 2,579 | 570 | 18 | % | 674 | 26 | % | ||||||||||||||||
Acquisition related expenses | — | — | 146 | — | — | % | (146 | ) | (100 | )% | |||||||||||||||
Severance expense | 1,735 | — | — | 1,735 | 100 | % | — | — | % | ||||||||||||||||
Other non-routine expenses 2 | 221 | 5,483 | 7,386 | (5,262 | ) | (96 | )% | (1,903 | ) | (26 | )% | ||||||||||||||
Tax effect of adjustments | (9,192 | ) | (21,775 | ) | 4,238 | 12,583 | (58 | )% | (26,013 | ) | (614 | )% | |||||||||||||
Adjusted net income from continuing operations | $ | 10,741 | $ | 17,375 | $ | 15,567 | $ | (6,634 | ) | (38 | )% | $ | 1,808 | 12 | % | ||||||||||
Diluted (LPS) EPS from continuing operations | $ | (0.63 | ) | $ | (0.99 | ) | $ | 1.32 | $ | 0.36 | (36 | )% | $ | (2.31 | ) | (175 | )% | ||||||||
Adjustments: | |||||||||||||||||||||||||
Interest expense associated with term loan | — | — | 0.09 | — | — | % | (0.09 | ) | (100 | )% | |||||||||||||||
Changes in valuation inputs and assumptions on MSRs | 1.18 | 2.17 | (1.34 | ) | (0.99 | ) | (46 | )% | 3.51 | (262 | )% | ||||||||||||||
Stock-based compensation expense | 0.15 | 0.13 | 0.15 | 0.02 | 15 | % | (0.02 | ) | (13 | )% | |||||||||||||||
Acquisition related expenses | — | — | 0.01 | — | — | % | (0.01 | ) | (100 | )% | |||||||||||||||
Severance expense | 0.07 | — | — | 0.07 | 100 | % | — | — | % | ||||||||||||||||
Other non-routine expenses | 0.01 | 0.21 | 0.43 | (0.20 | ) | (95 | )% | (0.22 | ) | (51 | )% | ||||||||||||||
Tax effect of adjustments | (0.36 | ) | (0.85 | ) | 0.25 | 0.49 | (58 | )% | (1.10 | ) | (440 | )% | |||||||||||||
Adjusted diluted EPS from continuing operations | $ | 0.42 | $ | 0.67 | $ | 0.91 | $ | (0.25 | ) | (37 | )% | $ | (0.24 | ) | (26 | )% | |||||||||
1 Changes in valuation inputs and assumptions on MSRs includes a realized loss of $7,034 and a realized gain of $1,082 on the sale of MSRs for the years ended December 31, 2015 and 2014, respectively.
2 For the year ended December 31, 2015, amount consists primarily of expenses associated with the one-time write down of certain assets unrelated to our retail branch disposals. For the year ended December 31, 2014, amount consists primarily of guarantees and other compensation expense prior to the period of meaningful origination production. For the year ended December 31, 2013, amount consists primarily of costs related to our equity offerings that occurred in the second and fourth quarters of 2013.
Adjusted net income decreased $6,634, or 38%, during the year ended December 31, 2015, as compared to the year ended December 31, 2014. Adjusted diluted EPS decreased $0.25, or 37%, during the year ended December 31, 2015, as compared to the year ended December 31, 2014. The decrease was primarily attributable to increased amortization of MSRs expense related to payoffs and principal reductions experienced during the current period due to the lower interest rate environment present throughout the year ended December 31, 2015, during which refinance activity and prepayment speeds increased. This decrease was partially offset by increased gains on mortgage loans held for sale, net, from continuing operations, primarily due to shifts in our product mix toward government insured loan production.
Recent Developments and Significant Transactions
We continue to execute our strategies in each segment through development of new investor and product offerings, a
focus on higher margin volume and selling MSRs when the market conditions are favorable. Our MSRs are primarily created through our originations channels. We sold nearly $8.1 billion of MSRs in four separate bulk sales, to unrelated third parties, throughout 2015, freeing up capital to reinvest in originations, which we believe has higher return potential over the course of an interest rate cycle. The composition of our executive team also changed during 2015, as discussed in the Performance Summary and Outlook section. In addition, we decreased our retail branch footprint, to better manage the expenses associated with retail originations. We have presented these retail branch disposal activities as discontinued operations in our 2015 year-end financial statements.
In terms of MSRs sale activity in 2015, the sales consisted of an underlying UPB of $2.7 billion in FNMA and FHLMC loans and $5.4 billion in GNMA loans. Generally, these pools of MSRs did not represent the characteristics of our MSRs portfolio as a whole. We performed temporary sub-serving activities for a fee with respect to the underlying loans through the established loan file transfer dates, during which time we were also entitled to certain other ancillary income amounts. We have re-deployed the proceeds from these sales back into our originations platform to create newly originated MSRs with the intent of improving our returns.
Also on September 30, 2015, we entered into a flow agreement for the sale of MSRs in $0.7 billion in GNMA loans to an unrelated party. The flow sales occurred monthly during the covered period, from September 2015 through December 2015. The characteristics of the pools sold are similar to those associated with the GNMA MSRs sales described above.
We continue to enter into strategic financing arrangements and actively amend our existing arrangements to execute
39
our liquidity and financing strategies. The addition of new facilities during the year ended December 31, 2015 has further diversified our financing portfolio and has allowed us to right-size our financing sources within the period. The following financing-related transactions occurred throughout 2015:
• | On January 29, 2015, we signed a Mortgage Repurchase Agreement with Wells Fargo with a maximum borrowing |
capacity of $200,000, which was subsequently amended to $140,000. The borrowing facility is comparable to the repurchase facilities that we have in place with other financial institutions, and is designed to finance newly originated conventional, government and jumbo residential mortgages originated or purchased by us. The facility is uncommitted and matures on January 30, 2017.
• | On April 23, 2015, we, through our NattyMac subsidiary, entered into a Participation Agreement with Citizens Bank & |
Trust Company ("Citizens"), in which we will sell participation interests in certain of our warehouse lines of credit in
an amount not to exceed $100,000 and on an individual warehouse lender basis not to exceed $7,500.
• | On June 10, 2015, we amended our master repurchase financing facility with Bank of America to extend the maturity date to June 2016. |
• | On July 30, 2015, we amended our master participation agreement, warehouse and security agreement and operating |
line of credit facilities with Merchants to extend their maturity dates through July 2016.
• | On September 11, 2015, we entered into a Master Loan Purchase and Servicing Agreement with Guaranty Bank, which has an operating line of credit secured by certain FHA mortgage loans repurchased from GNMA pools. These loans have actually been repurchased by us from GNMA pools in connection with our unilateral right, as servicer, to repurchase such GNMA loans we have previously sold (generally loans that are more than 90 days past due). The maximum borrowing capacity is $50,000, but can be expanded upon with the addition of FHA loans purchased from the GNMA pools. The borrowing matures no later than four years from the date of purchase from GNMA pools and carries an interest rate of coupon rate of the mortgage loans, less the debenture rate funded by Guaranty Bank. |
• | On November 10, 2015, we signed a Mortgage Repurchase Agreement with EverBank with a maximum borrowing capacity of $150,000 and related GNMA MSR financing of $70,000. The borrowing facility is comparable to the repurchase facilities that we have in place with other financial institutions, and is designed to finance newly originated conventional, government and jumbo residential mortgages originated or purchased by us, in addition to financing GNMA MSRs created and retained by us. The facility is uncommitted and matures on November 8, 2016. |
• | On December 22, 2015, we amended our mortgage repurchase financing facility with Barclays to decrease the maximum borrowing capacity from $400,000 to $300,000 as well as decrease the MSR sublimit from $100,000 to $60,000. These decreases were to right-size our financing portfolio, given the diversification resulting from the addition of new financing partners throughout the year. |
Other Factors Influencing Our Results
Prepayment Speeds. A significant driver of our servicing business is prepayment speed, which is the measurement of how quickly unpaid principal balance on mortgage loans is reduced by borrower payments. Prepayment speeds, as reflected by the constant prepayment rate, vary according to interest rates, the type of loan, conditions in the housing and financial markets, competition, change in GSEs' fee structures and other factors, none of which can be predicted with any certainty. Prepayment spread impacts future servicing fees, value of MSRs, float income, interest expense on advances and interest expense. In general, when interest rates rise, it is relatively less attractive for borrowers to refinance their mortgage loans and, as a result, prepayment speeds tend to decrease. This can extend the period over which we earn servicing income but reduce the demand for new mortgage loans. When interest rates fall, prepayment speeds tend to increase, thereby decreasing the value of MSRs and shortening the period over which we earn servicing income but increasing the demand for new mortgage loans.
Changing Interest Rate Environment. Generally, when interest rates rise, the value of mortgage loans and interest rate lock commitments decrease while the value of hedging instruments related to such loans and commitments increases. When interest rates fall, the value of mortgage loans and interest rate lock commitments increases and the value of hedging instruments related to such loans and commitments decrease. Decreasing interest rates also precipitate increased loan refinancing activity by borrowers seeking to benefit from lower mortgage interest rates.
Risk Management Effectiveness-Credit Risk. We are subject to the risk of potential credit losses on all of the residential mortgage loans that we hold for sale or investment as well as for losses incurred by investors in mortgage loans that we sell to them as a result of breaches of representations and warranties we make as part of the loan sales. The representations
40
and warranties require adherence to investor or guarantor origination and underwriting guidelines, including but not limited to the validity of the lien securing the loan, property eligibility, borrower credit, income and asset requirements, and compliance with applicable federal, state and local law. The level of mortgage loan repurchase losses is dependent on economic factors, investor repurchase demand strategies, and other external conditions that may change over the lives of the underlying loans.
Risk Management Effectiveness-Interest Rate Risk. Because changes in interest rates may significantly affect our activities, our operating results will depend, in large part, upon our ability to effectively manage interest rate risks and prepayment risks, including risk arising from the change in value of our inventory of mortgage loans held for sale and commitments to fund mortgage loans and related hedging derivative instruments, as well the effects of changes in interest rates on the value of our investment in MSRs. See “Quantitative and Qualitative Disclosures about Market Risk” included in this MD&A for a discussion on the effects of changes in interest rates on the recorded value of our MSRs.
Liquidity. Our ability to operate profitably is dependent on both our access to capital to finance our assets and our ability to profitably sell and service mortgage loans. An important source of capital for the residential mortgage industry is warehouse financing facilities. These facilities provide funding to mortgage loan producers until the loans are sold to investors or securitized in the secondary mortgage loan market. Our ability to hold loans pending sale or securitization depends, in part, on the availability to us of adequate financing lines of credit at suitable interest rates. During any period in which a borrower is not making payments, if we own the MSRs then we may be required to advance our own funds to meet contractual principal and interest remittance requirements for investors and advance costs of protecting the property securing the investors’ loan and the investors’ interest in the property. The ability to obtain capital to finance our servicing advances influences our ability to profitably service delinquent loans. See “Liquidity and Capital Resources” for additional information.
Servicing Effectiveness. Our servicing fee rates for loans serviced for non-affiliates are generally at specified servicing rates that do not change with a loan’s performance status. As a mortgage loan becomes delinquent and moves through the delinquency process to settlement through acquisition of the property or partial payoff, the loan requires greater effort on our part to service. Increased mortgage delinquencies, defaults and foreclosures will therefore result in a higher cost to service those loans due to the increased time and effort required to collect payments from delinquent borrowers. Therefore, how effectively we are able to maintain the credit quality of our portfolio of serviced mortgage loans and service the mortgage loans where the borrower has defaulted influences the level of expenses that we incur in the mortgage loan servicing process.
Results of Operations
Year Ended December 31, 2015 Compared to Year Ended December 31, 2014
Our consolidated results of operations for the years ended December 31, 2015 and 2014 are presented below. We will then discuss the results of continuing operations separately from the results of discontinued operations for each respective period.
Years Ended December 31, | |||||||||||||
2015 | 2014 | $ Change | % Change | ||||||||||
Gains on mortgage loans held for sale, net | $ | 141,819 | $ | 133,390 | $ | 8,429 | 6% | ||||||
Changes in mortgage servicing rights valuation | (30,395 | ) | (55,842 | ) | 25,447 | (46)% | |||||||
Payoffs and principal amortization of mortgage servicing rights | (41,529 | ) | (23,735 | ) | (17,794 | ) | 75% | ||||||
Loan origination and other loan fees | 23,956 | 24,581 | (625 | ) | (3)% | ||||||||
Loan servicing fees | 54,772 | 44,407 | 10,365 | 23% | |||||||||
Interest and other income | 34,117 | 35,236 | (1,119 | ) | (3)% | ||||||||
Total revenues | 182,740 | 158,037 | 24,703 | 16% | |||||||||
Salaries, commissions and benefits | 116,341 | 116,200 | 141 | —% | |||||||||
General and administrative expense | 32,260 | 34,545 | (2,285 | ) | (7)% | ||||||||
Interest expense | 31,063 | 26,007 | 5,056 | 19% | |||||||||
Occupancy, equipment and communications | 16,870 | 14,601 | 2,269 | 16% | |||||||||
Depreciation and amortization expense | 7,980 | 5,048 | 2,932 | 58% | |||||||||
Total expenses | 204,514 | 196,401 | 8,113 | 4% | |||||||||
(Loss) income from continuing operations before income tax (benefit) expense | (21,774 | ) | (38,364 | ) | 16,590 | (43)% | |||||||
Income tax (benefit) expense | (5,533 | ) | (12,936 | ) | 7,403 | (57)% | |||||||
(Loss) income from continuing operations, net of tax | (16,241 | ) | (25,428 | ) | 9,187 | (36)% | |||||||
(Loss) income from discontinued operations, net of tax | (6,029 | ) | (5,251 | ) | (778 | ) | 15% | ||||||
Net (loss) income attributable to common stockholders | $ | (22,270 | ) | $ | (30,679 | ) | $ | 8,409 | (27)% | ||||
41
Weighted average diluted shares outstanding (in thousands) | 25,783 | 25,770 | 13 | —% | |||||||||
Basic (loss) earnings per share: | |||||||||||||
From continuing operations | $ | (0.63 | ) | $ | (0.99 | ) | 0.36 | (36)% | |||||
From discontinued operations | $ | (0.23 | ) | $ | (0.20 | ) | (0.03 | ) | 15% | ||||
Total basic (loss) earnings per share | $ | (0.86 | ) | $ | (1.19 | ) | 0.33 | (28)% | |||||
Diluted (loss) earnings per share: | |||||||||||||
From continuing operations | $ | (0.63 | ) | $ | (0.99 | ) | 0.36 | (36)% | |||||
From discontinued operations | $ | (0.23 | ) | $ | (0.20 | ) | (0.03 | ) | 15% | ||||
Total diluted (loss) earnings per share | $ | (0.86 | ) | $ | (1.19 | ) | 0.33 | (28)% | |||||
Continuing Operations
Revenues
During the year ended December 31, 2015, total revenues from continuing operations increased $24,703, or 16%, as compared to the year ended December 31, 2014. The increase in revenues resulted from a smaller decline in the fair value of our MSRs, increased loan servicing fees and increases in gains on mortgage loans held for sale, net, offset by increased loan payoffs and principal amortization of MSRs and decreases in interest and other income and loan origination and other loan fees.
The value of our MSRs declined during the year ended December 31, 2015, driven primarily by the decrease in market interest rates and flattening of the yield curve during the year. Decreasing interest rates generally result in decreased
MSRs values, as the assumption for prepayment speeds of the underlying mortgage loans tends to increase (mortgage loans
prepay faster) and a flattening yield curve decreases the expected value of interest and other income from the escrow balances
we maintain. These factors also drove the decrease in the fair value of our MSRs during the year ended December 31, 2014, but to a greater extent. The decrease in the current year was also driven by realized losses related to sales of mortgage servicing rights during the year ended December 31, 2015 of $7,034, primarily related to 1) the change in fair value of the underlying MSRs from the time of the transaction bid to the date the assets are derecognized; 2) estimated prepayment protection provisions; and 3) costs associated with the sales. During the year ended December 31, 2014, we realized a gain on sale of MSRs of $1,082, net of such provisions and transaction costs.
The increase in our loan servicing fees was a direct result of our higher average servicing portfolio of $18.0 billion during the year ended December 31, 2015, compared to an average servicing portfolio of $15.8 billion during the year ended December 31, 2014. Our average loan servicing fees, as a percentage of our average servicing portfolio, were 30 bps for the year ended December 31, 2015, compared to 28 bps for the year ended December 31, 2014. The increase in servicing fees in basis points is due to the increase in the percentage of the portfolio that is government-backed loans, which have a higher servicing fee than conventional mortgages, as well as increased late fees resulting from delinquencies.
Our gains on mortgage loans held for sale, net, from continuing operations, increased $8,429, or 6%, during the year ended December 31, 2015, as compared to the year ended December 31, 2014, primarily due to shifts in our product and channel mix. Our gains on mortgage loans held for sale, net, from continuing operations during the year ended December 31, 2015 were 126 basis points of loan originations, compared to 112 basis points for the comparable period in 2014. The increase in basis point gain on sale was due primarily to increases in our government insured loan production, which generate higher revenue margins than our other loan products.
The increase in payoffs and principal amortization of our MSRs was also driven primarily by the decrease in market
interest rates during the first part of the year ended December 31, 2015, as well as the higher refinancing activity
discussed in the Market Considerations, Recent Industry Trends and Our Outlook section.
The decrease in interest and other income from continuing operations was primarily a result of the 6% decrease in mortgage loan originations during the year ended December 31, 2015 as compared to December 31, 2014, as there is a direct correlation between interest and other income and mortgage loan origination activity.
Loan origination and other loan fees from continuing operations decreased primarily as a result of the decrease in the amount of loans originated during the year ended December 31, 2015 compared to the year ended December 31, 2014, offset by the shifts in our product and channel mix. Government insured loans provide higher fees than our other products.
Expenses
42
Total expenses from continuing operations increased $8,113, or 4%, for the year ended December 31, 2015, compared to the same period ended December 31, 2014. Total expenses have increased due to 1) a 14% increase in our average servicing portfolio and the related costs during the year ended December 31, 2015, compared to the year ended December 31, 2014, including increased specialized servicing expertise required to manage the increased age of our servicing, which increases delinquencies and defaults; 2) higher regulatory compliance costs; 3) increased information technology costs and 4) executive severance expense.
Interest expense from continuing operations increased $5,056, or 19%, during the year ended December 31, 2015, compared to the year ended December 31, 2014, primarily due to interest costs associated with increased borrowings related to financing our MSRs portfolio and increased borrowings as a result of the increase in the volume of mortgage loans originated and funded through our Financing segment in the current period. We expect that interest expense will generally move in direct correlation to changes in our origination and servicing portfolio trends in future periods.
Depreciation and amortization expense from continuing operations increased $2,932, or 58%, during the year ended December 31, 2015, compared to the year ended December 31, 2014, primarily due to increased property and equipment expenditures resulting from our overall growth and investments in technology.
Occupancy, equipment and communication expenses from continuing operations increased $2,269, or 16%, during the year ended December 31, 2015, compared to the year ended December 31, 2014, primarily due to increased information technology costs resulting from our investment in additional infrastructure to increase efficiencies and effectiveness within our systems. We expect expenses will decrease in future periods, now that we have substantially completed this investment in additional infrastructure to manage our growth and increase automation within our systems.
Salaries, commissions and benefits expense from continuing operations increased $141 during the year ended December 31, 2015 compared to the year ended December 31, 2014, primarily as a result of increased headcount in segment and corporate support areas, as well as the payment of executive severance. This increase was partially offset by cost savings recognized during the fourth quarter of 2015, as part of our personnel changes to refine our strategy.
General and administrative expenses from continuing operations decreased $2,285, or 7%, during the year ended December 31, 2015 compared to the year ended December 31, 2014. The year ended December 31, 2014 included increased expenses related to our full transition to a publicly-traded company, such as outside consulting fees and travel, for the development of policies and procedures, enhancement of internal controls and testing procedures related to these controls. Additionally, we experienced an increase in expenses related to the integration of our acquisitions during that time. During the year ended December 31, 2015, we did not experience the same types of expenses and were able to focus on the management of expenses.
We reported an income tax benefit from continuing operations of $5,533 for the year ended December 31, 2015, compared to $12,936 for the year ended December 31, 2014, with an effective tax rate of 25.4% and 33.7%, respectively. The decrease in income tax benefit is due primarily to a decrease in our loss before taxes for the year ended December 31, 2015, compared to the year ended December 31, 2014. The income tax benefit of $5,533 for the year ended December 31, 2015 includes the net impact of establishing a $1,554 valuation allowance to offset our deferred tax assets, as we determined that it is more likely than not that a portion of our deferred tax assets will not be realized. The decrease in effective tax rate was due primarily to equity compensation forfeitures, the establishment of a valuation allowance and an adjustment to state net deferred tax liabilities recognized during the year ended December 31, 2015.
Discontinued Operations
Year Ended December 31, 2015 Compared to Year Ended December 31, 2014
In September 2015, we made the decision to dispose of certain retail branches, or components of our Originations segment, either by sale or closure. We completed the closure of 62 of our retail branches as of December 31, 2015. Additionally, on October 29, 2015, we sold to an unrelated third party certain assets associated with 14 retail branches. Under the new guidance of Accounting Standards Update ("ASU") No. 2014-08, we determined that the disposal of these retail branches represented a major strategic shift in our operations and, therefore, should be presented and disclosed as discontinued operations.
Our consolidated results of discontinued operations for the years ended December 31, 2015 and 2014 are as follows:
Years Ended December 31, | |||||||||||||
2015 | 2014 | $ Change | % Change | ||||||||||
43
Gains on mortgage loans held for sale, net | $ | 28,117 | $ | 23,535 | $ | 4,582 | 19% | ||||||
Loan origination and other loan fees | 4,091 | 2,236 | 1,855 | 83% | |||||||||
Interest and other income | 2,163 | 1,809 | 354 | 20% | |||||||||
Total revenues | 34,371 | 27,580 | 6,791 | 25% | |||||||||
Salaries, commissions and benefits | 30,294 | 26,425 | 3,869 | 15% | |||||||||
General and administrative expense | 4,874 | 4,467 | 407 | 9% | |||||||||
Interest expense | 1,555 | 1,218 | 337 | 28% | |||||||||
Occupancy, equipment and communications | 6,491 | 4,065 | 2,426 | 60% | |||||||||
Depreciation and amortization expense | 855 | 153 | 702 | 459% | |||||||||
Total expenses | 44,069 | 36,328 | 7,741 | 21% | |||||||||
(Loss) income from discontinued operations before income tax (benefit) expense | (9,698 | ) | (8,748 | ) | (950 | ) | 11% | ||||||
Income tax (benefit) expense | (3,669 | ) | (3,497 | ) | (172 | ) | 5% | ||||||
(Loss) income from discontinued operations, net of tax | $ | (6,029 | ) | $ | (5,251 | ) | $ | (778 | ) | 15% | |||
During the year ended December 31, 2015, our net loss from discontinued operations increased $778, or 15%, compared to the year ended December 31, 2014, primarily due to increased expenses related to salaries, commissions and benefits and occupancy, equipment and communications. These increased expenses were partially offset by increases in our gains on mortgage loans held for sale, net. Salaries, commissions and benefits included severance expenses related to our personnel changes to refine our strategy, as well as increased incentive compensation resulting from the increased revenue-producing positions added during the latter half of 2014. Occupancy, equipment and communication expenses includes early termination contractual charges of $1,144. Gains on mortgage loans held for sale, net increased due to increased mortgage loan origination volume. We originated loans of $918 million during the year ended December 31, 2015, compared to $660 million during year ended December 31, 2014.
Segment Results from Continuing Operations
Total Assets | |||||||
December 31, 2015 | December 31, 2014 | ||||||
Originations | $ | 647,287 | $ | 1,199,727 | |||
Servicing | 353,097 | 223,058 | |||||
Financing | 232,061 | 118,593 | |||||
Other1 | 48,181 | 55,173 | |||||
Total | $ | 1,280,626 | $ | 1,596,551 | |||
1 Includes intersegment eliminations and assets not allocated to the three reportable segments.
Year Ended December 31, 2015 | |||||||||||||||||||
Originations | Servicing | Financing | Other/Eliminations1 | Consolidated | |||||||||||||||
Revenues | |||||||||||||||||||
Gains on mortgage loans held for sale, net | $ | 142,772 | $ | (1,088 | ) | $ | — | $ | 135 | $ | 141,819 | ||||||||
Changes in mortgage servicing rights valuation | — | (30,395 | ) | — | — | (30,395 | ) | ||||||||||||
Payoffs and principal amortization of mortgage servicing rights | — | (41,529 | ) | — | — | (41,529 | ) | ||||||||||||
Loan origination and other loan fees | 22,751 | — | 1,205 | — | 23,956 | ||||||||||||||
Loan servicing fees | — | 54,772 | — | — | 54,772 | ||||||||||||||
Interest income | 26,729 | 124 | 7,111 | 153 | 34,117 | ||||||||||||||
Total revenues | 192,252 | (18,116 | ) | 8,316 | 288 | 182,740 | |||||||||||||
Expenses | |||||||||||||||||||
Salaries, commissions and benefits | 78,885 | 8,200 | 1,962 | 27,294 | 116,341 | ||||||||||||||
General and administrative expense | 13,851 | 2,063 | 866 | 15,480 | 32,260 | ||||||||||||||
Interest expense | 19,347 | 7,904 | 3,259 | 553 | 31,063 | ||||||||||||||
Occupancy, equipment and communication | 7,422 | 1,976 | 250 | 7,222 | 16,870 | ||||||||||||||
Depreciation and amortization | 5,581 | 455 | 411 | 1,533 | 7,980 | ||||||||||||||
44
Corporate allocations | 25,313 | 3,571 | 361 | (29,246 | ) | — | |||||||||||||
Total expenses | 150,399 | 24,169 | 7,109 | 22,836 | 204,514 | ||||||||||||||
Income (loss) from continuing operations before taxes | $ | 41,853 | $ | (42,285 | ) | $ | 1,207 | $ | (22,548 | ) | $ | (21,774 | ) | ||||||
1 Includes intersegment eliminations and certain corporate income and expenses not allocated to the three reportable segments, such as those related to our accounting, executive administration, finance, internal audit, investor relations and legal departments.
Year Ended December 31, 2014 | |||||||||||||||||||
Originations | Servicing | Financing | Other/Eliminations1 | Consolidated | |||||||||||||||
Revenues | |||||||||||||||||||
Gains on mortgage loans held for sale, net | $ | 133,405 | $ | — | $ | — | $ | (15 | ) | $ | 133,390 | ||||||||
Changes in mortgage servicing rights valuation | — | (55,842 | ) | — | — | (55,842 | ) | ||||||||||||
Payoffs and principal amortization of mortgage servicing rights | — | (23,735 | ) | — | — | (23,735 | ) | ||||||||||||
Loan origination and other loan fees | 24,193 | — | 455 | (67 | ) | 24,581 | |||||||||||||
Loan servicing fees | — | 44,407 | — | — | 44,407 | ||||||||||||||
Interest income | 32,271 | — | 3,280 | (315 | ) | 35,236 | |||||||||||||
Total revenues | 189,869 | (35,170 | ) | 3,735 | (397 | ) | 158,037 | ||||||||||||
Expenses | |||||||||||||||||||
Salaries, commissions and benefits | 84,722 | 5,972 | 1,726 | 23,780 | 116,200 | ||||||||||||||
General and administrative expense | 10,593 | 1,378 | 596 | 21,978 | 34,545 | ||||||||||||||
Interest expense | 21,904 | 3,251 | 1,049 | (197 | ) | 26,007 | |||||||||||||
Occupancy, equipment and communication | 6,793 | 1,794 | 231 | 5,783 | 14,601 | ||||||||||||||
Depreciation and amortization | 1,093 | 84 | 479 | 3,392 | 5,048 | ||||||||||||||
Corporate allocations | 26,619 | 3,279 | 160 | (30,058 | ) | — | |||||||||||||
Total expenses | 151,724 | 15,758 | 4,241 | 24,678 | 196,401 | ||||||||||||||
Income (loss) from continuing operations before taxes | $ | 38,145 | $ | (50,928 | ) | $ | (506 | ) | $ | (25,075 | ) | $ | (38,364 | ) | |||||
1 Includes intersegment eliminations and certain corporate income and expenses not allocated to the three reportable segments, such as those related to our accounting, executive administration, finance, internal audit, investor relations and legal departments.
Originations
The Originations segment reported income from continuing operations before taxes of $41,853 during the year ended December 31, 2015, compared to $38,145 for the year ended December 31, 2014. This increase was the result of higher revenue margins from a strategic change in mix of originations to government insured loans, offset by decreased mortgage loan originations. Our mortgage loan originations decreased 6% period over period. Given the actions taken in the fourth quarter of 2015 to reduce our retail branch footprint and manage the expenses associated with the retail channels, we expect operational results from our Originations segment to improve in future periods.
Gains on Mortgage Loans Held for Sale, Net
Our gains on mortgage loans held for sale, net, from continuing operations, during the year ended December 31, 2015 increased $8,429 or 6% as compared to the year ended December 31, 2014 primarily due to the mix shift toward more government insured loan production, which generate higher revenue margins than our other loan products. Our gains on mortgage loans held for sale, net during the year ended December 31, 2015 were 126 bps of loan originations compared to 112 bps for the year ended December 31, 2014. Gains on mortgage loans held for sale, net consisted of the following components for the years ended December 31, 2015 and 2014:
45
Years Ended December 31, | |||||||||||||||||
2015 | 2014 | Variance | |||||||||||||||
$ | bps2 | $ | bps2 | ||||||||||||||
Realized gains (losses) on sales of loans | $ | 15,979 | 15 | $ | (1,780 | ) | (1 | ) | $ | 17,759 | |||||||
Capitalized servicing rights | 146,696 | 131 | 150,520 | 126 | (3,824 | ) | |||||||||||
Economic hedge results | (2,233 | ) | (2 | ) | 8,341 | 7 | (10,574 | ) | |||||||||
Provision for repurchases | (3,007 | ) | (3 | ) | (2,724 | ) | (2 | ) | (283 | ) | |||||||
Direct loan origination costs1 | (15,616 | ) | (14 | ) | (20,967 | ) | (18 | ) | 5,351 | ||||||||
Gains on mortgage loans held for sale, net | $ | 141,819 | 126 | $ | 133,390 | 112 | $ | 8,429 | |||||||||
1 Includes costs directly related to specified activities performed for a particular loan to facilitate the sale of such loan and the creation of the capitalized servicing right.
2 Shown as a percentage of originations.
The components of Gains on mortgage loans held for sale, net are described below.
Realized gains on sales of loans - Realized gains on sales of loans represent the difference between the actual sales proceeds received upon sale of the loans and Stonegate’s cost basis in acquiring/producing those loans, including loan discount fees, lender credits, yield spread premiums and servicing release premiums paid to correspondents. These items represent the components that factor into the pricing of the loans to our borrowers and represent the core “margin” elements of the loan sales. The increase in our realized gains on sales of loans during the year ended December 31, 2015, compared to the year ended December 31, 2014, was primarily due to the mix shift toward more government insured production. These increases were partially offset by increases in the cost basis in acquiring/producing the higher loan volume.
Capitalized servicing rights - An originated mortgage loan inherently includes both the value of the coupon to the borrower as well as the servicing fee component to compensate the servicer for its activities. A key element of Stonegate’s strategy is to retain the servicing of its loans upon sale to investors in order to take advantage of the value of the servicing component. When Stonegate sells its loans “servicing retained”, a contractual separation of the servicing component occurs from the underlying mortgage loan. This results in the creation of an MSRs asset. As such, a component of the gain on mortgage loans held for sale is attributable to the creation of this MSRs asset and is based on the fair value of such MSRs asset at the time of its creation (i.e. upon separation from the underlying loan during the loan sale). The Company utilizes a third-party analytic tool to derive/estimate this initial MSRs fair value at the time of sale. The increase in our capitalized servicing rights component for year ended December 31, 2015, as compared to the year ended December 31, 2014, relates to an increase in the rate at which we capitalize these servicing rights at the time of separation from the underlying loan during the loan sale, which represents the initial fair value of the MSRs at the time of sale. The rate at which we capitalize these servicing rights increased based on current market conditions.
Economic hedge results - Unrealized gains/losses on loans not yet sold and accounted for under the fair value option are included as a component of Gains on mortgage loans held for sale, net. This includes the impact of recording such loans at fair value and the change from period to period based on market conditions. In addition, the change in value of Stonegate’s interest rate lock commitments ("IRLCs") and other loan-related derivatives are recorded in this financial statement line item. The Company also enters into forward sales of MBS securities linked to security issuances of GSEs (FNMA, FHLMC, GNMA)
for economic hedging purposes, as these instruments have similar characteristics to the loans held for sale by Stonegate. The
decrease in our economic hedge results for the year ended December 31, 2015, as compared to the year ended December 31, 2014, primarily relates to the decrease attributed to the net volume change period over period of IRLCs and loans held for sale.
Provision for repurchase/indemnification obligation - Stonegate makes certain representations and warranties to its
investors and insurers on all loans sold. In the event of a breach of these reps and warranties, the Company may incur losses
and/or be required to repurchase loans from the investor. A provision is made at the time of sale for an estimate of such expected losses, the amount of which is offset against this gain line item. We expect that the provision for mortgage repurchases and indemnifications may fluctuate in relation to changes in our origination volume and mix of loan products originated; however, changing market conditions will also influence any trends in our provision. The increase in our provision for repurchase/indemnification obligation for the year ended December 31, 2015, as compared to the year ended December 31, 2014, relates to a 3.07% increase in loan sales period over period and an increase in the rate at which we reserve upon loan sale.
Direct loan origination costs - Stonegate offsets its gains/losses on mortgage loans held for sale, as described by the various categories above, with certain direct loan origination costs. These direct costs primarily relate to the following two circumstances:
46
i) | Costs directly associated with the origination of the mortgage loans that are paid to/incurred with a third party and are largely mandated by the investors as requirements for the loans to be sold. Such costs include net appraisal fees, credit report fees, document preparation and imaging, risk management and loan file review and certain FNMA/FHLMC/GNMA specific fees. |
ii) | Costs directly associated with the contractual creation of the separate servicing component of the loans upon sale to the investors on a “servicing retained” basis. Such costs include the one-time upfront setup fees for life of loan tax services (including tracking and paying of tax payments to jurisdictions), fees paid to an outsource provider for valuation of initial MSRs created upon sale of the loan, and upfront recording fees at initial servicing setup. |
The decrease in direct loan origination costs for the year ended December 31, 2015, as compared to the year ended December 31, 2014, relates to our decrease in mortgage loan originations and a change in FNMA fee structure in the current period.
Loan Origination and Other Loan Fees
Our loan origination and other loan fees from continuing operations during the year ended December 31, 2015 decreased $1,442, or 6%, compared to the year ended December 31, 2014, due to a 6% decrease in mortgage loan originations. Our loan origination and other loan fees as a percentage of total originations remained flat at 20 bps for both the years ended December 31, 2015 and 2014. This was due to a higher mix of government insured loans, which have higher fees than conventional mortgages, and an increase in retail direct (Stonegate Direct), which have higher fees than correspondent originations, which partially offset the decrease in loan originations. The following table illustrates mortgage loan originations by type for the years ended December 31, 2015 and 2014:
Years Ended December 31, | |||||||||||||
2015 | 2014 | ||||||||||||
$ | % Total | $ | % Total | ||||||||||
Conventional | $ | 4,591,744 | 41 | % | $ | 6,360,792 | 53 | % | |||||
Government insured | 6,178,541 | 55 | % | 5,281,709 | 44 | % | |||||||
Non-agency/Other | 467,756 | 4 | % | 332,632 | 3 | % | |||||||
Total mortgage loan originations | $ | 11,238,041 | 100 | % | $ | 11,975,133 | 100 | % | |||||
The following is a summary of mortgage loan origination volume by channel for the years ended December 31, 2015 and 2014:
Years Ended December 31, | |||||||||||||||||||
2015 | 2014 | ||||||||||||||||||
# of Loans | $ | % Total | # of Loans | $ | % Total | ||||||||||||||
Retail | 7,302 | $ | 1,533,254 | 13 | % | 5,474 | $ | 1,209,325 | 10 | % | |||||||||
Wholesale | 9,027 | 2,550,580 | 23 | % | 11,510 | 2,841,700 | 24 | % | |||||||||||
Correspondent | 32,405 | 7,154,207 | 64 | % | 39,530 | 7,924,108 | 66 | % | |||||||||||
Total mortgage loan originations | 48,734 | $ | 11,238,041 | 100 | % | 56,514 | $ | 11,975,133 | 100 | % | |||||||||
The increased volume in the retail channel, particularly Stonegate Direct, during the year ended December 31, 2015, is reflective of our strategy to grow this type of origination volume. We believe Stonegate Direct offers us a lower cost basis of generating MSRs due to the higher cash gain on sale and fee income. Our Stonegate Direct division continues to grow, as we believe our customers have a growing demand for online business.
We seek to manage asset quality and control credit risk by diversifying our loan portfolio and by applying policies designed to promote sound underwriting and loan monitoring practices. We perform various levels of analysis in order to monitor the overall risk profile of our mortgage originations and servicing portfolio. This analysis includes review of the LTV, FICO scores, delinquencies, defaults and historical loan losses. Monthly risk meetings are conducted where portfolio risk analysis, such as FICO and LTV combination migration, is studied to ensure that the population distributions are in accordance with acceptable risk parameters. In addition, default activity is evaluated in the context of credit spectrum to identify any emerging credit quality trends.
A summary of the mortgage loan origination volume by FICO score and LTV for the years ended December 31, 2015 and 2014 is as follows:
47
Year Ended December 31, 2015 | ||||||||||||||||||||||||||
LTV Range | ||||||||||||||||||||||||||
<70% | 70%-80% | 81%-90% | 91%-100% | >100% | Total | % Total | ||||||||||||||||||||
FICO Score | ||||||||||||||||||||||||||
<620 | $ | 6,739 | $ | 10,112 | $ | 13,115 | $ | 95,008 | $ | 4,092 | $ | 129,066 | 1 | % | ||||||||||||
620-680 | 157,707 | 290,009 | 362,534 | 2,026,922 | 21,876 | 2,859,048 | 25 | % | ||||||||||||||||||
681-719 | 239,606 | 410,834 | 363,524 | 1,415,444 | 22,035 | 2,451,443 | 22 | % | ||||||||||||||||||
>719 | 1,283,478 | 1,787,783 | 786,908 | 1,907,774 | 32,541 | 5,798,484 | 52 | % | ||||||||||||||||||
Total mortgage loan originations | $ | 1,687,530 | $ | 2,498,738 | $ | 1,526,081 | $ | 5,445,148 | $ | 80,544 | $ | 11,238,041 | 100 | % | ||||||||||||
% Total | 15 | % | 22 | % | 14 | % | 48 | % | 1 | % | 100 | % | ||||||||||||||
Year Ended December 31, 2014 | ||||||||||||||||||||||||||
LTV Range | ||||||||||||||||||||||||||
<70% | 70%-80% | 81%-90% | 91%-100% | >100% | Total | % Total | ||||||||||||||||||||
FICO Score | ||||||||||||||||||||||||||
<620 | $ | 8,052 | $ | 11,205 | $ | 6,866 | $ | 31,690 | $ | 1,493 | $ | 59,306 | — | % | ||||||||||||
620-680 | 267,238 | 514,821 | 354,672 | 1,914,891 | 32,456 | 3,084,078 | 26 | % | ||||||||||||||||||
681-719 | 329,907 | 583,585 | 332,680 | 1,367,567 | 25,634 | 2,639,373 | 22 | % | ||||||||||||||||||
>719 | 1,241,960 | 2,010,780 | 768,422 | 2,130,698 | 40,516 | 6,192,376 | 52 | % | ||||||||||||||||||
Total mortgage loan originations | $ | 1,847,157 | $ | 3,120,391 | $ | 1,462,640 | $ | 5,444,846 | $ | 100,099 | $ | 11,975,133 | 100 | % | ||||||||||||
% Total | 15 | % | 26 | % | 12 | % | 46 | % | 1 | % | 100 | % | ||||||||||||||
Interest and Other Income
Interest and other income from continuing operations related to our Originations segment decreased $5,542, or 17%, during the year ended December 31, 2015 compared to the year ended December 31, 2014. The decrease in interest and other income was primarily a result of lower average coupon rates during the year ended December 31, 2015, compared to the year ended December 31, 2014, and decreased mortgage loan originations, as there is a direct correlation between interest and other income and mortgage loan origination. The average coupon rate related to our Originations segment was 3.84% during the year ended December 31, 2015, compared to 4.04% during the year ended December 31, 2014.
Salaries, Commissions and Benefits Expense
Salaries, commissions and benefits expense from continuing operations related to our Originations segment decreased $5,837, or 7%, during the year ended December 31, 2015, compared to the year ended December 31, 2014, primarily as a result of personnel changes to refine our strategy in the latter half of 2015, as well as increased revenue-producing positions during the latter half of 2014, resulting in higher incentive compensation in that period. Headcount related to our originations segment decreased from 696 employees at December 31, 2014 to 592 employees at December 31, 2015, due to the changes made to our retail distributed strategy.
General and Administrative Expenses
General and administrative expenses from continuing operations related to our Originations segment increased $3,258, or 31%, during the year ended December 31, 2015, compared to the year ended December 31, 2014, primarily due to an increase in sales support expenses related to Stonegate Direct, which was created in October 2014, and higher regulatory compliance expenses. We expect that general and administrative costs will decrease in future quarters, especially as we carry out our strategy refinements, due to management's focus on cost reductions and increased operational efficiencies.
Interest Expense
Interest expense from continuing operations related to our Originations segment decreased $2,557, or 12% during the year ended December 31, 2015, compared to the year ended December 31, 2014, primarily as a result of the decrease in the volume of mortgage loans originated and funded in the current period. We expect that interest expense will move in direct correlation to changes in our origination trends and borrowings in future periods.
Occupancy, Equipment and Communication Expenses
48
Occupancy, equipment and communication expenses from continuing operations related to our Originations segment increased $629, or 9%, during the year ended December 31, 2015 compared to the year ended December 31, 2014, primarily due to increased information technology costs resulting from our investment in additional infrastructure to increase efficiencies within our systems, both in our core operations and corporate support areas.
Depreciation and Amortization Expense
Depreciation and amortization expense from continuing operations related to our Originations segment increased $4,488 during the year ended December 31, 2015, compared to the year ended December 31, 2014, primarily due to increased amortization of software placed into use during the year ended December 31, 2015 as part of our investment in our infrastructure to increase efficiencies.
Servicing
The Servicing segment incurred a loss before taxes of $42,285 during the year ended December 31, 2015, compared to $50,928 during the year ended December 31, 2014, due primarily to the change in our MSRs valuation, as discussed below, and increased loan servicing fees driven by our increased servicing portfolio, partially offset by increased amortization of MSRs expense related to payoffs and principal reductions experienced during the current period. The increase in principal runoff was due to the lower interest environment present throughout the year ended December 31, 2015, during which refinance activity and prepayment speeds increased. Additionally, we experienced higher loan servicing revenues and expenses resulting from the growth in the UPB amount of our average mortgage servicing portfolio.
The following is a summary of certain metrics specific to the Servicing segment for the years ended December 31, 2015 and 2014:
As of December 31, | |||||||
2015 | 2014 | ||||||
Servicing Portfolio UPB | $ | 17,520,731 | $ | 18,336,745 | |||
Number of Loans Serviced (units) | 90,408 | 99,711 | |||||
Weighted Average Coupon | 4.02 | % | 4.10 | % | |||
Weighted Average Age (in months) | 16 | 12 | |||||
90+ day Delinquency Rate | 0.60 | % | 0.63 | % | |||
Weighted Average FICO score | 725 | 720 | |||||
Weighted Average Servicing Fee (in basis points) | 30 | 28 | |||||
Capitalized Loan Servicing Portfolio | $ | 199,637 | $ | 204,217 | |||
Capitalized Servicing Rate | 1.14 | % | 1.11 | % | |||
Capitalized Servicing Multiple | 3.92 | 3.91 | |||||
Years Ended December 31, | |||||||
2015 | 2014 | ||||||
Gross Constant Prepayment Rate1 | 18.00 | % | 9.45 | % | |||
Average Total Loan Servicing Portfolio | $ | 18,001,777 | $ | 15,752,085 | |||
Average Capitalized Loan Servicing Portfolio | $ | 199,510 | $ | 201,341 | |||
Payoffs and Principal Curtailments of Capitalized Portfolio | $ | 3,594,722 | $ | 1,528,740 | |||
Sales of Capitalized Portfolio | $ | 8,731,001 | $ | 3,791,007 | |||
1Represents the rate at which a pool of mortgage loans' remaining balance is prepaid each month. The rate is calculated on an
annualized basis and expressed as a percentage of the outstanding principal balance.
Changes in Mortgage Servicing Rights Valuation
The decrease in the fair value of our MSRs during the year ended December 31, 2015 was driven primarily
by the decrease in market interest rates and flattening of the yield curve during the year. The key assumptions used in the estimation of the fair value of MSRs include prepayment speeds, discount rates, default rates, cost to service, contractual servicing fees, escrow earnings and ancillary income. The shape of the forward yield curve also has an impact on the asset
49
valuation. We believe that the use of the forward yield curve better presents fair value of MSRs because the forward yield curve is the market’s expectation of future interest rates based on its expectation of inflation and other economic conditions.
The spread between the weighted average coupon and current market rates determines modeled prepayment speed.
During the year ended December 31, 2015, the weighted average coupon of our MSRs portfolio remained flat in
comparison to December 31, 2014 and, at December 31, 2015, mortgage rates were lower during the year ended December 31, 2015 than they were at during the year ended December 31, 2014. The combination of these factors increased current prepayment estimates and prepayment estimates in the interest rate shifts. The weighted average coupon of our MSRs portfolio also remained flat during the year ended December 31, 2014 and mortgage rates were lower in comparison to rates at December 31, 2013. Please see our disclosures in the "Quantitative and Qualitative Disclosure About Market Risk" section of this Management's Discussion and Analysis for further details on how interest rate fluctuations impact our MSRs valuation and the sensitivity of the yield curve.
The decrease was also driven by realized losses related to sales of mortgage servicing rights during the year ended December 31, 2015 of $7,034, primarily related to 1) the change in fair value of the underlying MSRs from the time of the transaction bid to the date the assets are derecognized; 2) estimated prepayment protection provisions; and 3) costs associated with the sales. During the year ended December 31, 2014, we realized a gain on sale of MSRs of $1,082, net of protection provisions and transaction costs.
Payoffs and Principal Amortization of Mortgage Servicing Rights Portfolio
Payoffs and principal amortization of our MSRs portfolio related to our Servicing segment represents the value of our portfolio run-off, including paid off loans. During the year ended December 31, 2015, this amount decreased the value of our MSRs by $41,529, compared to $23,735 during the year ended December 31, 2014, a difference of 75%. The increase in run-off and paid off loans correlates with a 90% increase in prepayment speeds from December 31, 2014 to December 31, 2015 as well as a 14% increase in our average servicing portfolio.
Loan Servicing Fees
The following is a summary of loan servicing fee income by component for the years ended December 31, 2015 and 2014:
Years Ended December 31, | |||||||
2015 | 2014 | ||||||
Contractual servicing fees | $ | 51,775 | $ | 42,429 | |||
Late fees | 2,997 | 1,978 | |||||
Loan servicing fees | $ | 54,772 | $ | 44,407 | |||
Servicing fees as a percentage of average portfolio | 0.30 | % | 0.28 | % | |||
Our loan servicing fees increased to $54,772 during the year ended December 31, 2015 from $44,407 during the year ended December 31, 2014. The 23% increase in our loan servicing fees was primarily the result of our higher average servicing portfolio of $18.0 billion during the year ended December 31, 2015, compared to an average servicing portfolio of $15.8 billion during the year ended December 31, 2014. Our loan servicing fees, as a percentage of our average servicing portfolio, were 30 bps for the year ended December 31, 2015, compared to 28 bps for the year ended December 31, 2014. The increase in servicing fees in basis points is due to the increase in the percentage of the portfolio that are government backed loans, which have a higher servicing fee than conventional mortgages, as well as increased late fees resulting from delinquencies.
Gains (Losses) on Mortgage Loans Held for Sale and Interest Income
The losses on mortgage loans held for sale of $1,088 and interest income of $124, attributable to our Servicing segment, relates to the loans we repurchased out of GNMA pools in connection with our unilateral right, as servicer, to repurchase such GNMA loans we have previously sold. Our right to repurchase such loans arises as the result of the borrower's failure to make payments for at least 90 days preceding the month of repurchase by us and provides an alternative to our obligation to continue advancing principal and interest at the coupon rate of the related GNMA security. As we make the underlying GNMA loan re-salable, by the loan becoming current either through the borrower's performance or through completion of a modification of the loan's terms, we expect to be able to resell the loan in the future.
Salaries, Commissions and Benefits Expense
50
Salaries, commissions and benefits expense related to our Servicing segment increased $2,228, or 37%, during the year ended December 31, 2015, compared to the year ended December 31, 2014, primarily as a result of increased headcount due to the growth in our average servicing portfolio and the increased age of the portfolio, which increases delinquencies and defaults on the portfolio. In addition, the shift toward more government insured origination volume may require more specialized servicing expertise. We also incurred executive severance related to our personnel changes to refine our strategy during the year ended December 31, 2015. Headcount related to our Servicing segment increased from 84 employees at December 31, 2014 to 96 employees at December 31, 2015, as we continued to add support staff in the quality control and default management areas.
Interest Expense
Interest expense related to our Servicing segment increased $4,653 during the year ended December 31, 2015, compared to the year ended December 31, 2014, primarily due to interest associated with our MSRs secured borrowings entered into during June and December of 2014, as well as increased loans paid off by customers during the period, for which we are responsible for remitting to the investors the interest accrued between the payoff date and month end.
General and Administrative Expense
General and administrative expenses related to our Servicing segment increased $685, or 50%, during the year ended December 31, 2015, compared to the year ended December 31, 2014, primarily as a result of losses related to foreclosed properties resulting from the seasoning of our MSRs portfolio and the shift to government-backed loans, which result in higher delinquencies and default costs, as well as increased expenses attributable to our growth, such as those related to increased professional fees, printing of statements required to service the loans and quality control.
Depreciation and Amortization Expense
Depreciation and amortization expenses increased $371 during the year ended December 31, 2015, compared to the year ended December 31, 2014, primarily as a result of amortization of software attributable to our increased investment in information technology to support our servicing portfolio growth and the related increase in staffing.
Financing
The Financing segment provides warehouse lending activities to correspondent customers through our NattyMac subsidiary. The Financing segment reported income before income taxes of $1,207 and a loss before income taxes of $506 during the years ended December 31, 2015 and 2014, respectively. The income in the current period is primarily due to increased interest and other income resulting from higher volume of warehouse loan originations as we continue to grow with new customer applications and increased warehouse line commitments within our existing customer base. Originations funded by our NattyMac subsidiary increased to $3.2 billion during the year ended December 31, 2015 from $1.7 billion during
the year ended December 31, 2014. The loss in the prior period is due to the increased expenses associated with growing the business, including indirect costs allocated to the segment in 2014 as a result of increased headcount to support the fulfillment services needed to generate revenues we are seeing in the current year. As operations continue to grow, we expect revenues to increase in line with originations that are funded by NattyMac and the related expenses, on a per loan basis, to decrease due to the anticipated continued increase in volume.
Total Revenues
Total revenues related to our Financing segment increased $4,581 during the year ended December 31, 2015
compared to the year ended December 31, 2014, due to overall lending activity growth. The following details the
increases in total revenues:
• | The increase in interest and other income was primarily a result of the increase in warehouse loan originations funded during the year ended December 31, 2015 as compared to December 31, 2014, as there is a direct correlation between interest and other income and warehouse loan origination activity. |
• | Our loan origination and other loan fees during the year ended December 31, 2015 increased $750, compared to the comparable period in 2014, due to higher origination volume, as discussed above. |
Total Expenses
51
Total expenses related to our Financing segment increased $2,667 during the year ended December 31, 2015 compared to the year ended December 31, 2014, due to our overall lending activity growth and directly allocating headcount to support the growth of the business. The following details the increases in total expenses:
• | The interest expense of $3,259 attributable to our Financing segment is related to the utilization of our NattyMac Funding ("NMF") line with Merchants Bancorp. |
• | Salaries, commissions and benefits expense related to our Financing segment increased $236. Headcount related to our Financing segment increased to 21 employees at December 31, 2015 from 20 employees at December 31, 2014. |
• | General and administrative expenses related to our Financing segment increased $270. |
Year Ended December 31, 2014 Compared to Year Ended December 31, 2013
Our consolidated results of operations for the years ended December 31, 2014 and 2013 are presented below. We will then discuss the results of continuing operations separately from the results of discontinued operations for each respective period.
Years Ended December 31, | |||||||||||||
2014 | 2013 | $ Change | % Change | ||||||||||
Gains on mortgage loans held for sale, net | $ | 133,390 | $ | 83,327 | $ | 50,063 | 60% | ||||||
Changes in mortgage servicing rights valuation | (55,842 | ) | 22,967 | (78,809 | ) | (343)% | |||||||
Payoffs and principal amortization of mortgage servicing rights | (23,735 | ) | (8,545 | ) | (15,190 | ) | 178% | ||||||
Loan origination and other loan fees | 24,581 | 21,227 | 3,354 | 16% | |||||||||
Loan servicing fees | 44,407 | 22,204 | 22,203 | 100% | |||||||||
Interest income | 35,236 | 16,767 | 18,469 | 110% | |||||||||
Total revenues | 158,037 | 157,947 | 90 | —% | |||||||||
Salaries, commissions and benefits | 116,200 | 72,475 | 43,725 | 60% | |||||||||
General and administrative expense | 34,545 | 22,773 | 11,772 | 52% | |||||||||
Interest expense | 26,007 | 14,426 | 11,581 | 80% | |||||||||
Occupancy, equipment and communications | 14,601 | 9,843 | 4,758 | 48% | |||||||||
Depreciation and amortization expense | 5,048 | 2,209 | 2,839 | 129% | |||||||||
Total expenses | 196,401 | 121,726 | 74,675 | 61% | |||||||||
(Loss) income from continuing operations before income tax (benefit) expense | (38,364 | ) | 36,221 | (74,585 | ) | (206)% | |||||||
Income tax (benefit) expense | (12,936 | ) | 13,623 | (26,559 | ) | (195)% | |||||||
(Loss) income from continuing operations, net of tax | $ | (25,428 | ) | $ | 22,598 | $ | (48,026 | ) | (213)% | ||||
Less: Preferred stock dividends | — | (27 | ) | 27 | (100)% | ||||||||
(Loss) income from continuing operations attributable to common stockholders | (25,428 | ) | 22,571 | (47,999 | ) | (213)% | |||||||
(Loss) income from discontinued operations, net of tax | (5,251 | ) | — | (5,251 | ) | 100% | |||||||
Net (loss) income attributable to common stockholders | $ | (30,679 | ) | $ | 22,571 | $ | (53,250 | ) | (236)% | ||||
Weighted average diluted shares outstanding (in thousands) | 25,770 | 17,113 | 8,657 | 51% | |||||||||
Basic (loss) earnings per share: | |||||||||||||
From continuing operations | $ | (0.99 | ) | $ | 1.61 | (2.6 | ) | (161)% | |||||
From discontinued operations | $ | (0.20 | ) | $ | — | (0.2 | ) | 100% | |||||
Total basic (loss) earnings per share | $ | (1.19 | ) | $ | 1.61 | (2.8 | ) | (174)% | |||||
Diluted (loss) earnings per share: | |||||||||||||
From continuing operations | $ | (0.99 | ) | $ | 1.32 | (2.31 | ) | (175)% | |||||
From discontinued operations | $ | (0.20 | ) | $ | — | (0.2 | ) | 100% | |||||
Total diluted (loss) earnings per share | $ | (1.19 | ) | $ | 1.32 | (2.51 | ) | (190)% | |||||
Continuing Operations
Revenues
During the year ended December 31, 2014, total revenues from continuing operations increased $90, as compared to the year ended December 31, 2013. The increase in revenues resulted from increases in gains on mortgage loans held for sale,
52
net, loan servicing fees, interest income, loan origination and other loan fees and gain on sale of mortgage servicing rights, partially offset by a decrease in the fair value of our MSRs and an increase in amortization of MSRs due to higher loan payoffs.
Our gains on mortgage loans held for sale, net, from continuing operations during the year ended December 31, 2014 were 112 basis points of loan originations compared to 96 basis points for the year ended December 31, 2013. The increase in basis point gain on sale was due primarily to an increase in our government insured loan production and in our retail originations, as presented in the Segment Results section. Government insured loans and loans originated in our retail channel generate higher revenue margins than our other loan products or loans originated through our other channels.
The increase in our loan servicing fees from continuing operations was primarily the result of our higher average servicing portfolio of $15.8 billion during the year ended December 31, 2014, compared to an average servicing portfolio of $7.8 billion during the year ended December 31, 2013. Our average loan servicing fees, as a percentage of our average servicing portfolio, was 28 bps for the year ended December 31, 2014, compared to 27 bps for the year ended December 31, 2013.
The increase in interest and other income from continuing operations was primarily a result of the 38% increase in mortgage loan originations during the year ended December 31, 2014 as compared to December 31, 2013, as there is a direct correlation between interest income and mortgage loan origination activity, as well as higher average coupon rates during the year ended December 31, 2014.
Loan origination and other loan fees from continuing operations increased primarily as a result of the increase in the amount of loans originated during the year ended December 31, 2014 compared to year ended December 31, 2013, offset by decreased allowable fees resulting from qualified mortgage rules effective January 2014.
The decrease in the fair value of our MSRs was driven primarily by the decrease in market interest rates and flattening of the yield curve during the latter part of 2014. Decreasing interest rates generally result in decreased MSRs values as the assumption for prepayment speeds of the underlying mortgage loans tends to increase (mortgage loans prepay faster) and a flattening yield curve decreases the expected value of interest income from the escrow balances held by us.
Expenses
Total expenses from continuing operations increased $74,675, or 61%, for the year ended December 31, 2014 compared to the same period ended December 31, 2013. Total expenses have increased due to 1) a 38% increase in total originations and the related costs associated with higher originations; 2) a 54% increase in our servicing portfolio from December 31, 2013 to December 31, 2014; 3) a strategic change in mix of originations to retail and wholesale, which are higher cost origination channels with higher revenue as compared to our correspondent channel; 4) the transition from a privately-held company to a publicly-traded company; 5) expenses associated with a full year of results from, and the integration of, our 2013 and early 2014 acquisitions and 6) higher regulatory compliance costs.
Salaries, commissions and benefits expense from continuing operations increased $43,725, or 60%, during the year ended December 31, 2014 compared to the year ended December 31, 2013, primarily as a result of increased headcount in revenue producing positions and in segment and corporate support areas related to the growth in both the origination and servicing segments.
General and administrative expenses from continuing operations increased $11,772, or 52%, during the year ended December 31, 2014 compared to the year ended December 31, 2013 due to our growth and expansion, as well as an increased need for expense related to corporate governance, such as legal and audit fees, insurance and other outside consulting fees which reflect our full transition to a publicly-traded company. This transition also resulted in higher expenses related to regulatory compliance. These costs included development of policies and procedures, enhancement of internal controls and testing procedures related to these controls. We also experienced an increase in travel-related expenses due to the acquisition and integration of retail operations and the management of the expansion of our origination platform throughout the United States. Additionally, we recognized a $1,290 impairment charge for the Crossline tradename resulting from the anticipated significant change in future use of the asset given the formation of Stonegate Direct.
Interest expense from continuing operations increased $11,581, or 80%, during the year ended December 31, 2014 compared to the year ended December 31, 2013, primarily due to increased borrowings as a result of the increase in the volume of mortgage loans originated and funded in the current period and interest associated with increased borrowings in the current period. The increase in interest expense was offset by the increase in interest income during the same period due to favorable interest spreads.
53
Occupancy, equipment and communication expenses from continuing operations increased $4,758, or 48%, during the year ended December 31, 2014 compared to the year ended December 31, 2013 primarily due to our retail branch expansion during the year ended December 31, 2014 and increased expenses attributable to our servicing portfolio growth and the related increase in staffing.
Depreciation and amortization expense from continuing operations increased $2,839 during the year ended December 31, 2014 compared to the year ended December 31, 2013, primarily due to increased property and equipment expenditures resulting from our overall growth and expansion, including acquisitions, and the amortization expense related to our mortgage banking technology platform and the other Crossline intangible assets acquired in December 2013.
We reported an income tax benefit from continuing operations of $12,936 for the year ended December 31, 2014, compared to income tax expense of $13,623 for the year ended December 31, 2013, with an effective tax rate of 33.7% and 37.6%, respectively. The decrease in income tax expense is due to a net operating loss before taxes for the year ended December 31, 2014 compared to net operating income for the year ended December 31, 2013. The decrease in effective tax rate was due primarily to business shifts between states with varying tax rates as well as discrete tax provision to tax return entries in the year ended December 31, 2014.
Discontinued Operations
Year Ended December 31, 2014 Compared to Year Ended December 31, 2013
In September 2015, we made the decision to dispose of certain retail branches, or components of our Originations segment, either by sale or closure. We completed the closure of 62 of our retail branches as of December 31, 2015. Additionally, on October 29, 2015, we sold to an unrelated third party certain assets associated with 14 retail branches. We determined that the disposal of these retail branches met the criteria for presentation and disclosure as discontinued operations. Our consolidated results of operation for the year ended December 31, 2013 were not impacted by these discontinued operations.
Our consolidated results of discontinued operations for the year ended December 31, 2014 were as follows:
Gains on mortgage loans held for sale, net | $ | 23,535 | |
Loan origination and other loan fees | 2,236 | ||
Interest and other income | 1,809 | ||
Total revenues | 27,580 | ||
Salaries, commissions and benefits | 26,425 | ||
General and administrative expense | 4,467 | ||
Interest expense | 1,218 | ||
Occupancy, equipment and communications | 4,065 | ||
Depreciation and amortization expense | 153 | ||
Total expenses | 36,328 | ||
(Loss) income from discontinued operations before income tax (benefit) expense | (8,748 | ) | |
Income tax (benefit) expense | (3,497 | ) | |
(Loss) income from discontinued operations, net of tax | $ | (5,251 | ) |
Segment Results from Continuing Operations
Total Assets | |||||||
December 31, 2014 | December 31, 2013 | ||||||
Originations | $ | 1,199,727 | $ | 743,365 | |||
Servicing | 223,058 | 176,023 | |||||
Financing | 118,593 | 17,749 | |||||
Other1 | 55,173 | 52,752 | |||||
Total | $ | 1,596,551 | $ | 989,889 | |||
1 Includes intersegment eliminations and assets not allocated to the three reportable segments.
54
Year Ended December 31, 2014 | |||||||||||||||||||
Originations | Servicing | Financing | Other/Eliminations1 | Consolidated | |||||||||||||||
Revenues | |||||||||||||||||||
Gains on mortgage loans held for sale, net | $ | 133,405 | $ | — | $ | — | $ | (15 | ) | $ | 133,390 | ||||||||
Changes in mortgage servicing rights valuation | — | (55,842 | ) | — | — | (55,842 | ) | ||||||||||||
Payoffs and principal amortization of mortgage servicing rights | — | (23,735 | ) | — | — | (23,735 | ) | ||||||||||||
Loan origination and other loan fees | 24,193 | — | 455 | (67 | ) | 24,581 | |||||||||||||
Loan servicing fees | — | 44,407 | — | — | 44,407 | ||||||||||||||
Interest income | 32,271 | — | 3,280 | (315 | ) | 35,236 | |||||||||||||
Total revenues | 189,869 | (35,170 | ) | 3,735 | (397 | ) | 158,037 | ||||||||||||
Expenses | |||||||||||||||||||
Salaries, commissions and benefits | 84,722 | 5,972 | 1,726 | 23,780 | 116,200 | ||||||||||||||
General and administrative expense | 10,593 | 1,378 | 596 | 21,978 | 34,545 | ||||||||||||||
Interest expense | 21,904 | 3,251 | 1,049 | (197 | ) | 26,007 | |||||||||||||
Occupancy, equipment and communication | 6,793 | 1,794 | 231 | 5,783 | 14,601 | ||||||||||||||
Depreciation and amortization | 1,093 | 84 | 479 | 3,392 | 5,048 | ||||||||||||||
Corporate allocations | 26,619 | 3,279 | 160 | (30,058 | ) | — | |||||||||||||
Total expenses | 151,724 | 15,758 | 4,241 | 24,678 | 196,401 | ||||||||||||||
Income (loss) from continuing operations before taxes | $ | 38,145 | $ | (50,928 | ) | $ | (506 | ) | $ | (25,075 | ) | $ | (38,364 | ) | |||||
1 Includes intersegment eliminations and certain corporate income and expenses not allocated to the three reportable segments, such as those related to our accounting, executive administration, finance, internal audit, investor relations and legal departments.
Year Ended December 31, 2013 | |||||||||||||||||||
Originations | Servicing | Financing | Other/Eliminations1 | Consolidated | |||||||||||||||
Revenues | |||||||||||||||||||
Gains on mortgage loans held for sale, net | $ | 83,312 | $ | — | $ | — | $ | 15 | $ | 83,327 | |||||||||
Changes in mortgage servicing rights valuation | — | 22,967 | — | — | 22,967 | ||||||||||||||
Payoffs and principal amortization of mortgage servicing rights | — | (8,545 | ) | — | — | (8,545 | ) | ||||||||||||
Loan origination and other loan fees | 21,196 | — | 31 | — | 21,227 | ||||||||||||||
Loan servicing fees | — | 22,204 | — | — | 22,204 | ||||||||||||||
Interest income | 16,612 | — | 125 | 30 | 16,767 | ||||||||||||||
Total revenues | 121,120 | 36,626 | 156 | 45 | 157,947 | ||||||||||||||
Expenses | |||||||||||||||||||
Salaries, commissions and benefits | 50,242 | 2,562 | — | 19,671 | 72,475 | ||||||||||||||
General and administrative expense | 8,344 | 942 | 19 | 13,468 | 22,773 | ||||||||||||||
Interest expense | 12,449 | 260 | — | 1,717 | 14,426 | ||||||||||||||
Occupancy, equipment and communication | 3,999 | 723 | — | 5,121 | 9,843 | ||||||||||||||
Depreciation and amortization | 360 | — | — | 1,849 | 2,209 | ||||||||||||||
Corporate allocations | 14,401 | 1,689 | — | (16,090 | ) | — | |||||||||||||
Total expenses | 89,795 | 6,176 | 19 | 25,736 | 121,726 | ||||||||||||||
Income (loss) from continuing operations before taxes | $ | 31,325 | $ | 30,450 | $ | 137 | $ | (25,691 | ) | $ | 36,221 | ||||||||
1 Includes intersegment eliminations and certain corporate income and expenses not allocated to the three reportable segments, such as those related to our accounting, executive administration, finance, internal audit, investor relations and legal departments.
55
Originations
The Originations segment reported income from continuing operations before taxes of $38,145 during the year ended December 31, 2014, compared to $31,325 during the year ended December 31, 2013. This increase was primarily due to mortgage loan originations increasing 38% period over period and higher revenue margins from a strategic change in mix of originations to retail and wholesale. This increase was offset by the result of costs associated with managing higher originations volume and our loan portfolio growth. In addition, we received decreased fees resulting from qualified mortgage rules effective January 2014.
Gains on Mortgage Loans Held for Sale, Net
Our gains on mortgage loans held for sale, net during the year ended December 31, 2014 were 112 bps of loan
originations compared to 96 bps for the comparable period in 2013. The increased gain on sale in basis points was due
primarily to an increase in our government insured loans and in our retail originations as seen in the tables below. Government
insured loans and loans originated in our retail channel generate higher revenue margins than our other loan products or loans
originated in other channels. Net gains on mortgage loans held for sale, net consisted of the following for the years ended
December 31, 2014 and 2013:
Years Ended December 31, | |||||||||||||||||
2014 | 2013 | Variance | |||||||||||||||
$ | bps2 | $ | bps2 | ||||||||||||||
Realized gains (losses) on sales of loans | $ | (1,780 | ) | (1 | ) | $ | (6,167 | ) | (7 | ) | $ | 4,387 | |||||
Capitalized servicing rights | 150,520 | 126 | 111,554 | 128 | 38,966 | ||||||||||||
Economic hedge results | 8,341 | 7 | (2,413 | ) | (3 | ) | 10,754 | ||||||||||
Provision for repurchases | (2,724 | ) | (2 | ) | (2,899 | ) | (3 | ) | 175 | ||||||||
Direct loan origination costs1 | (20,967 | ) | (18 | ) | (16,748 | ) | (19 | ) | (4,219 | ) | |||||||
Gains on mortgage loans held for sale, net | 133,390 | 112 | $ | 83,327 | 96 | $ | 50,063 | ||||||||||
1 Includes costs directly related to specified activities performed for a particular loan to facilitate the sale of such loan and the creation of the
capitalized servicing right.
2 Shown as a percentage of originations.
Material components presented in gains on mortgage loans held for sale, net are listed below.
Realized gains on sales of loans - Realized gains on sales of loans represent the difference between the actual sales
proceeds received upon sale of the loans and Stonegate’s cost basis in acquiring/producing those loans, including loan discount
fees, lender credits, yield spread premiums and servicing release premiums paid to correspondents. These items represent the
components that factor into the pricing of the loans to borrowers and represent the core “margin” elements of the loan sales.
Capitalized servicing rights - An originated mortgage loan inherently includes both the value of the coupon to the
borrower as well as the servicing fee component to compensate the servicer for its activities. A key element of Stonegate’s
strategy is to retain the servicing of its loans upon sale to investors in order to take advantage of the value of the servicing
component. When Stonegate sells its loans “servicing retained”, a contractual separation of the servicing component occurs
from the underlying mortgage loan. This results in the creation of an MSRs asset. As such, a component of the gain on
mortgage loans held for sale is attributable to the creation of this MSRs asset and is based on the fair value of such MSRs asset
at the time of its creation (i.e. upon separation from the underlying loan during the loan sale). The Company utilizes a third-party analytic tool to derive/estimate this initial MSRs fair value at the time of sale.
Economic hedge results - Unrealized gains/losses on loans not yet sold and accounted for under the fair value option
are included as a component of Gains on mortgage loans held for sale, net. This includes the impact of recording such loans at
fair value and the change from period to period based on market conditions. In addition, the change in value of Stonegate’s
interest rate lock commitments ("IRLCs") and other loan-related derivatives are recorded in this financial statement line item. We also enter into forward sales of MBS securities linked to security issuances of GSEs (FNMA, FHLMC, GNMA) for economic hedging purposes, as these instruments have similar characteristics to the loans held for sale by Stonegate.
Provision for repurchase/indemnification obligation - Stonegate makes certain representations and warranties to its
investors and insurers on loans sold. In the event of a breach of these reps and warranties, the Company may incur losses and/
or be required to repurchase loans from the investor. A provision is made at the time of sale for an estimate of such expected
56
losses, the amount of which is offset against this gain line item.
Direct loan origination costs - Stonegate offsets its gains/losses on mortgage loans held for sale, as described by the
various categories above, with certain direct loan origination costs. These direct costs primarily relate to the following two
circumstances:
i) Costs directly associated with the origination of the mortgage loans that are paid to/incurred with a third party
and are largely mandated by the investors as requirements for the loans to be sold. Such costs include net
appraisal fees, credit report fees, document preparation and imaging, risk management and loan file review
and certain FNMA/FHLMC/GNMA specific fees.
ii) Costs directly associated with the contractual creation of the separate servicing component of the loans upon
sale to the investors on a “servicing retained” basis. Such costs include the one-time upfront setup fees for
life of loan tax services (including tracking and paying of tax payments to jurisdictions), fees paid to an
outsource provider for valuation of initial MSRs created upon sale of the loan, and upfront recording fees at
initial servicing setup.
Loan Origination and Other Loan Fees
Our loan origination and other loan fees during the year ended December 31, 2014 increased $2,997, or 14%,
compared to the comparable period in 2013, due to higher origination volume and a higher mix of government insured loans,
which have higher margins than conventional mortgages, and an increase in retail originations, which also have higher margins than correspondent originations. However, our loan origination and other loan fees have decreased as a percentage of total originations to 20 bps from 24 bps for the year ended December 31, 2014 and 2013, respectively, due to the qualified mortgage rules effective January 2014, which limit the total fees allowed to be charged per transaction, but were offset by improved pricing margins. The following table illustrates mortgage loan originations by type for the years ended December 31, 2014 and
2013:
Years Ended December 31, | |||||||||||||
2014 | 2013 | ||||||||||||
$ | % Total | $ | % Total | ||||||||||
Conventional | $ | 6,360,792 | 53 | % | $ | 5,219,463 | 60 | % | |||||
Government insured | 5,281,709 | 44 | % | 3,480,037 | 40 | % | |||||||
Non-agency/Other | 332,632 | 3 | % | 7,387 | — | % | |||||||
Total mortgage loan originations | $ | 11,975,133 | 100 | % | $ | 8,706,887 | 100 | % | |||||
The following is a summary of mortgage loan origination volume by channel for the years ended December 31, 2014 and 2013:
Years Ended December 31, | |||||||||||||||||||
2014 | 2013 | ||||||||||||||||||
# of Loans | $ | % Total | # of Loans | $ | % Total | ||||||||||||||
Retail | 5,474 | $ | 1,209,325 | 10 | % | 3,839 | $ | 628,934 | 7 | % | |||||||||
Wholesale | 11,510 | 2,841,700 | 24 | % | 8,183 | 1,636,449 | 19 | % | |||||||||||
Correspondent | 39,530 | 7,924,108 | 66 | % | 33,774 | 6,441,504 | 74 | % | |||||||||||
Total mortgage loan originations | 56,514 | $ | 11,975,133 | 100 | % | 45,796 | $ | 8,706,887 | 100 | % | |||||||||
The increased volume in the retail channel during the year ended December 31, 2014 is reflective of our strategy to
acquire retail lending business and expand our geographic footprint. It includes originations from our Crossline subsidiary, and
from the retail and wholesale operations that we acquired from Nationstar, both of which we acquired at the end of 2013, and
for which there were no comparable amounts for the first three quarters of 2013.
We seek to manage asset quality and control credit risk by diversifying our loan portfolio and by applying policies designed to promote sound underwriting and loan monitoring practices. We perform various levels of analysis in order to monitor the overall risk profile of our mortgage originations and servicing portfolio. This analysis includes review of the LTV, FICO scores, delinquencies, defaults and historical loan losses. Monthly risk meetings are conducted where portfolio risk analysis, such as FICO and LTV combination migration, is studied to ensure that the population distributions are in accordance with acceptable risk parameters. In addition, default activity is evaluated in the context of credit spectrum to identify any emerging credit quality trends.
57
A summary of the mortgage loan origination volume by FICO score and LTV for the years ended December 31, 2014 and 2013 is as follows:
Year Ended December 31, 2014 | ||||||||||||||||||||||||||
LTV Range | ||||||||||||||||||||||||||
<70% | 70%-80% | 81%-90% | 91%-100% | >100% | Total | % Total | ||||||||||||||||||||
FICO Score | ||||||||||||||||||||||||||
<620 | $ | 8,052 | $ | 11,205 | $ | 6,866 | $ | 31,690 | $ | 1,493 | $ | 59,306 | — | % | ||||||||||||
620-680 | 267,238 | 514,821 | 354,672 | 1,914,891 | 32,456 | 3,084,078 | 26 | % | ||||||||||||||||||
681-719 | 329,907 | 583,585 | 332,680 | 1,367,567 | 25,634 | 2,639,373 | 22 | % | ||||||||||||||||||
>719 | 1,241,960 | 2,010,780 | 768,422 | 2,130,698 | 40,516 | 6,192,376 | 52 | % | ||||||||||||||||||
Total mortgage loan originations | $ | 1,847,157 | $ | 3,120,391 | $ | 1,462,640 | $ | 5,444,846 | $ | 100,099 | $ | 11,975,133 | 100 | % | ||||||||||||
% Total | 15 | % | 26 | % | 12 | % | 46 | % | 1 | % | 100 | % | ||||||||||||||
Year Ended December 31, 2013 | ||||||||||||||||||||||||||
LTV Range | ||||||||||||||||||||||||||
<70% | 70%-80% | 81%-90% | 91%-100% | >100% | Total | % Total | ||||||||||||||||||||
FICO Score | ||||||||||||||||||||||||||
<620 | $ | — | $ | 281 | $ | 658 | $ | 5,555 | $ | 236 | $ | 6,730 | — | % | ||||||||||||
620-680 | 101,853 | 229,008 | 255,545 | 1,351,489 | 31,125 | 1,969,020 | 23 | % | ||||||||||||||||||
681-719 | 150,520 | 357,350 | 272,853 | 956,398 | 37,470 | 1,774,591 | 20 | % | ||||||||||||||||||
>719 | 873,714 | 1,637,813 | 687,301 | 1,675,806 | 81,912 | 4,956,546 | 57 | % | ||||||||||||||||||
Total mortgage loan originations | $ | 1,126,087 | $ | 2,224,452 | $ | 1,216,357 | $ | 3,989,248 | $ | 150,743 | $ | 8,706,887 | 100 | % | ||||||||||||
% Total | 13 | % | 25 | % | 14 | % | 46 | % | 2 | % | 100 | % | ||||||||||||||
Interest Income
Interest income related to our Originations segment increased $15,659, or 94%, during the year ended December 31, 2014 compared to the year ended December 31, 2013. The increase in interest income was primarily a result of an increase in
mortgage loan originations and higher average coupon rates during the year ended December 31, 2014 as compared to the year
ended December 31, 2013, as there is a direct correlation between interest income and mortgage loan origination. The average
coupon rate was 4.04% during the year ended December 31, 2014 compared to 3.84% during the year ended December 31, 2013.
Salaries, Commissions and Benefits Expense
Salaries, commissions and benefits expense related to our Originations segment increased $34,480, or 69%, during
the year ended December 31, 2014, compared to the year ended December 31, 2013, primarily as a result of increased
headcount due to our strategic decision to expand our geographic footprint across the United States, through our acquisitions in
late 2013 and early 2014, and additional mortgage loan advisors and account executives in both our retail and third party
originations channels. In addition to the increase in revenue-producing positions, we also increased headcount in support areas
related to the growth in originations. Headcount related to our originations segment increased from 962 employees at
December 31, 2013 to 988 employees at December 31, 2014. Of the 962 employees at December 31, 2013, 292 employees
were the result of our acquisitions of Crossline in December 2013 and Nationstar in November 2013, and did not result in a full
year of compensation-related expenses during the year ended December 31, 2013. All related employee benefit costs have
increased with the related increase in headcount.
General and Administrative Expenses
General and administrative expenses related to our Originations segment increased $2,249, or 27%, during the year ended December 31, 2014, compared to the year ended December 31, 2013, primarily as a result of increased expenses
attributable to our growth and continued expansion. We have experienced an increase in travel related expenses, marketing
expenses, custodial fees, professional services, licensing related expenses and sales support, as we integrated the acquired retail
operations and managed the expanded origination platform throughout the United States, through our acquisitions in late 2013
and early 2014.
Interest Expense
58
Interest expense related to our Originations segment increased $9,455, or 76% during the year ended December 31, 2014, compared to the year ended December 31, 2013, primarily due to increased borrowings as a result of the increase in the
volume of mortgage loans originated and funded in the current period. The increase in interest expense was offset by the
increase in interest income during the same period due to favorable interest spreads.
Occupancy, Equipment and Communication Expenses
Occupancy, equipment and communication expenses increased $2,794 during the year ended December 31, 2014
compared to the year ended December 31, 2013 primarily due to our retail branch expansion during the year ended December 31, 2014.
Depreciation and Amortization Expense
Depreciation and amortization expense related to our Originations segment increased $733 during the year ended December 31, 2014, compared to the year ended December 31, 2013, primarily due to increased property and equipment
expenditures resulting from our overall growth and expansion, including acquisitions, and the amortization expense related to
our mortgage banking technology platform and the other Crossline intangible assets acquired in December 2013.
Servicing
The Servicing segment incurred a loss before taxes of $50,928 during the year ended December 31, 2014 compared to income before taxes of $30,450 during the year ended December 31, 2013. The variance in the Servicing segment's results was
due primarily to the change in our MSRs valuation as discussed below. Excluding the impact of the change in MSRs valuation,
the Servicing segment earned $8,020 before income taxes during the year ended December 31, 2014 compared to $7,483 during
the year ended December 31, 2013. This was the result of our mortgage servicing portfolio growth and gain on sale of MSRs,
offset by increased expenses related to our servicing portfolio growth, such as increased headcount and quality control,
increased interest expense associated with increased borrowings and increased amortization of MSRs expense related to payoffs
and principal reductions.
The following is a summary of certain metrics specific to the Servicing segment for the years ended December 31, 2014 and 2013:
As of December 31, | |||||||
2014 | 2013 | ||||||
Servicing Portfolio UPB | $ | 18,336,745 | $ | 11,923,510 | |||
Number of Loans Serviced (units) | 99,711 | 65,942 | |||||
Weighted Average Coupon | 4.10 | % | 3.84 | % | |||
Weighted Average Age (in months) | 12 | 10 | |||||
90+ day Delinquency Rate | 0.63 | % | 36.00 | % | |||
Weighted Average FICO score | 720 | 739 | |||||
Weighted Average Servicing Fee (in basis points) | 28 | 27 | |||||
Capitalized Loan Servicing Portfolio | $ | 204,217 | $ | 170,294 | |||
Capitalized Servicing Rate | 1.11 | % | 1.43 | % | |||
Capitalized Servicing Multiple | 3.91 | 5.22 | |||||
Years Ended December 31, | |||||||
2014 | 2013 | ||||||
Gross Constant Prepayment Rate1 | 9.45 | % | 6.48 | % | |||
Average Total Loan Servicing Portfolio | $ | 15,752,085 | $ | 8,082,350 | |||
Average Capitalized Loan Servicing Portfolio | $ | 201,341 | $ | 106,224 | |||
Payoffs and Principal Curtailments of Capitalized Portfolio | $ | 1,528,740 | $ | 505,722 | |||
Sales of Capitalized Portfolio | $ | 3,791,007 | $ | — | |||
1Represents the rate at which a pool of mortgage loans' remaining balance is prepaid each month. The rate is calculated on an
annualized basis and expressed as a percentage of the outstanding principal balance.
59
Changes in Mortgage Servicing Rights Valuation
The decrease in the fair value of our MSRs was driven primarily by the decrease in market interest rates and flattening
of the yield curve during the latter part of 2014. Decreasing interest rates generally result in decreased MSRs values as the
assumption for prepayment speeds of the underlying mortgage loans tends to increase (mortgage loans prepay faster) and a
flattening yield curve decreases the expected value of interest income from the escrow balances held by us. The decrease in the fair value of our MSRs was partially offset by a recognized gain on sale of mortgage servicing rights of $1,082 during the year ended December 31, 2014.
Payoffs and Principal Amortization of Mortgage Servicing Rights Portfolio
Payoffs and principal amortization of our MSRs portfolio related to our Servicing segment represents the value of our
portfolio run-off, including paid off loans. During the year ended December 31, 2014, this amount decreased the value of our
MSRs by $23,735, compared to $8,545 during the year ended December 31, 2013, a difference of 178%. The increase in runoff
and paid off loans correlates with a 266% increase in prepayment speeds from December 31, 2013 to December 31, 2014 as
well as a 54% increase in our servicing portfolio.
Loan Servicing Fees
The following is a summary of loan servicing fee income by component for the years ended December 31, 2014 and 2013:
Years Ended December 31, | |||||||
2014 | 2013 | ||||||
Contractual servicing fees | $ | 42,429 | $ | 21,656 | |||
Late fees | 1,978 | 548 | |||||
Loan servicing fees | $ | 44,407 | $ | 22,204 | |||
Servicing fees as a percentage of average portfolio (annualized) | 0.28 | % | 0.27 | % | |||
Our loan servicing fees increased to $44,407 during the year ended December 31, 2014 from $22,204 during the year ended December 31, 2013. The 100% increase in our loan servicing fees was primarily the result of our higher average
servicing portfolio of $15.8 billion during the year ended December 31, 2014, compared to an average servicing portfolio of
$7.8 billion during the year ended December 31, 2013.
Salaries, Commissions and Benefits Expense
Salaries, commissions and benefits expense related to our Servicing segment increased $3,410, or 133%, during the
year ended December 31, 2014, compared to the year ended December 31, 2013, primarily as a result of increased headcount
due to the growth in our servicing portfolio and the increased age of the portfolio, which increases delinquencies and defaults
on the portfolio. Headcount related to our Servicing segment increased from 52 employees at December 31, 2013 to 84
employees at December 31, 2014, as we continued to add support staff in the quality control and default management areas.
General and Administrative Expenses
General and administrative expenses related to our Servicing segment increased $436, or 46%, during the year ended December 31, 2014, compared to the year ended December 31, 2013, primarily as a result of increased expenses attributable to
our servicing portfolio growth, such as those related to the increased printing of statements and outside services required to
service the loans, such as tax services.
Interest Expense
Interest expense related to our Servicing segment increased $2,991 during the year ended December 31, 2014, compared
to the year ended December 31, 2013, primarily due to principal and interest payment advances for loans paid off during the
period.
Occupancy, Equipment and Communication Expenses
60
Occupancy, equipment and communication expenses increased $1,071 during the year ended December 31, 2014,
compared to the year ended December 31, 2013, primarily as a result of increased expenses attributable to our servicing
portfolio growth and the related increase in staffing. We anticipate continued increases in information technology costs to
support our strategic growth of the servicing segment.
Financing
The Financing segment provides warehouse lending activities to correspondent customers through our NattyMac
subsidiary. We commenced fully utilizing this financing platform in July 2013. The Financing segment incurred a loss before
income taxes of $506 and income before income taxes of $137 during the years ended December 31, 2014 and 2013,
respectively. The loss in the current period is primarily due to the increased expenses during the year ended December 31, 2014
associated with growing the business, including indirect costs allocated to the segment in 2014 as a result of increased
headcount to support the fulfillment services needed to generate revenues. As operations continue to grow, we expect revenues
and the related expenses to increase in line with originations that are funded by NattyMac.
Loan Origination and Other Loan Fees
Our loan origination and other loan fees during the year ended December 31, 2014 increased $424, compared to the
comparable period in 2013, due to higher origination volume. Originations funded by our NattyMac subsidiary grew to
$1,722,733 during the year ended December 31, 2014 from $100,008 during the year ended December 31, 2013.
Interest Income
The increase in interest income was primarily a result of the increase in warehouse loan originations funded during the
year ended December 31, 2014 compared to December 31, 2013, as there is a direct correlation between interest income and
warehouse loan origination activity.
Salaries, Commissions and Benefits Expense
Salaries, commissions and benefits expense related to our Financing segment was $1,726 during the year ended December 31, 2014, associated with directly allocating headcount to support the growth of the business. Headcount related to
our Financing segment was 14 employees at December 31, 2014. There were no such expenses directly attributable to the
Financing segment during the year ended December 31, 2013.
General and Administrative Expenses
General and administrative expenses related to our Financing segment increased $577 during the year ended December 31, 2014, compared to the year ended December 31, 2013, primarily as a result of increased expenses attributable to our lending
activity growth, such as expenses related to the training and development of our growing headcount and increased bank service
charges.
Interest Expense
The interest expense attributable to our Financing segment is related to the utilization of our NMF line with Merchants
Bancorp, entered into on April 15, 2014. There was no interest expense attributable to our Financing segment for the year
ended December 31, 2013.
Occupancy, Equipment and Communication Expenses
Occupancy, equipment and communication expenses increased $231 during the year ended December 31, 2014,
compared to the year ended December 31, 2013, as we incurred more information technology costs and moved to a larger space
in 2014 to support our growth.
Critical Accounting Policies
Our financial accounting and reporting policies are in accordance with GAAP. Some of these accounting policies require us to make estimates and judgments about matters that are uncertain. The application of assumptions could have a material impact on our financial condition or results of operations. Critical accounting policies and related assumptions,
61
estimates and disclosures are determined by management and reviewed periodically with the Audit Committee of the Board of Directors. We believe that the judgments, estimates and assumptions used in the preparation of the consolidated financial statements are appropriate given the factual circumstances at the time. We consider some of our most important accounting policies that require estimates and management judgment to be those policies with respect to reserve for mortgage repurchases and indemnifications; fair value measurements of MSRs, derivative financial instruments, mortgage loans held for sale and loans eligible for repurchase from GNMA and related liability; goodwill and other intangible assets; transfers of financial assets; and income taxes for deferred tax assets valuation allowance considerations. For additional information regarding these significant accounting policies, refer to Note 2, “Basis of Presentation and Significant Accounting Policies,” to our audited consolidated financial statements included in Part II, Item 8 of this Annual Report on Form 10-K.
Reserve for Mortgage Repurchases and Indemnifications
Loans sold to investors by us, and which met investor and agency underwriting guidelines at the time of sale, may be subject to repurchase or indemnification in the event of specific default by the borrower or subsequent discovery that underwriting standards were not met. We may, upon mutual agreement, agree to repurchase the loans or indemnify the investor against future losses on such loans. In such cases, we bear the full risk of loss on loans sold to the extent the liquidation of the underlying collateral is insufficient.
We establish an initial reserve liability for expected losses related to these representations and warranties at the date of the loans are sold and de-recognized from the balance sheet based on the fair value of such reserve liability. Subsequently, based on changing facts and circumstances or changes in certain estimates and assumptions, the reserve liability may be adjusted if there is a reasonable possibility that future losses may be in excess of the initial reserve liability, with a corresponding amount recorded to provision for reserve for mortgage repurchases and indemnifications. In assessing the adequacy of the reserve, management evaluates various unobservable factors which are generally subjective and involve a high degree of management judgment and assumptions. These judgments and assumptions may have a significant effect on our measurements of the liability, and the use of different judgments and assumptions, as well as changes in market conditions, could have a material effect on our statements of operations as well as our balance sheets.
For additional information regarding our reserve for mortgage repurchases and indemnifications, refer to Note 15, "Reserve for Mortgage Repurchases and Indemnifications," to our audited consolidated financial statements included in Part II, Item 8 of this Annual Report on Form 10-K.
Fair Value Measurements
We use fair value measurements in fair value disclosures and to record certain assets and liabilities at fair value on a recurring basis, such as mortgage loans held for sale, derivative financial instruments, MSRs, and loans eligible for repurchase from GNMA, and on a non-recurring basis, such as when measuring intangible assets and long-lived assets. We have elected fair value accounting for mortgage loans held for sale to more closely align our accounting with our interest rate risk management strategies without having to apply the operational complexities of hedge accounting.
When observable market prices do not exist for our assets and liabilities, we estimate fair value primarily by using cash flow and other valuation models. Our valuation models may include adjustments, such as market liquidity and credit quality, where appropriate. Valuations of products using models or other techniques are sensitive to assumptions used for the significant inputs. The process for determining fair value using unobservable inputs, such as discount rates, prepayment speeds, default rates and cost of servicing is generally more subjective and involves a higher degree of management judgment and assumptions than the measurement of fair value using observable inputs. These judgments and assumptions may have a significant effect on our measurements of fair value, and the use of different judgments and assumptions, as well as changes in market conditions, could have a material effect on our statements of operations as well as our balance sheets.
For additional information regarding the fair values of our assets and liabilities, refer to Note 9, "Fair Value Measurements," to our audited consolidated financial statements included in Part II, Item 8 of this Annual Report on Form 10-K.
Mortgage Servicing Rights
MSRs are non-financial assets that are created when a mortgage loan is sold and we retain the right to service the loan. The servicing of these loans includes payment processing, remittance of funds to investors, payment of taxes and insurance, collection of delinquent payments, and disposition of foreclosed properties. In return for these services, we receive servicing fee income and ancillary fee income. The MSRs are initially recorded at fair value, which is estimated using a valuation model
62
that calculates the present value of future servicing cash flows. The valuation model incorporates assumptions that market participants would use in estimating future net servicing income, including estimates of the cost of servicing, the discount rate, the float value, the inflation rate, estimated prepayment speeds, and default rates. We use a dynamic model to estimate the fair value of our MSRs. The model is validated internally and senior management reviews all significant assumptions monthly. In addition, we benchmark the performance of our internal model against the results obtained from a third party valuation specialist firm and other market participant information such as surveys, broker quotes, trades in the marketplace, and other observable data.
For additional information regarding our mortgage servicing rights, refer to Note 8, "Mortgage Servicing Rights," to our audited consolidated financial statements included in Part II, Item 8 of this Annual Report on Form 10-K.
Derivative Financial Instruments
We enter into derivative instruments to reduce our risk exposure to fluctuations in interest rates. For example, we enter into IRLCs with certain customers to originate residential mortgage loans at specified interest rates and within a specified period of time. IRLCs on mortgage loans that are intended to be sold are accounted for as derivatives, with changes in fair value recorded in the statement of operations as part of gain or loss on sale of mortgage loans. The fair value of an IRLC is based on the value of the underlying mortgage loan, quoted MBS prices, estimates of the fair value of the MSRs and an estimate of the probability that the mortgage loan will fund within the terms of the interest rate lock commitment, net of commission expenses; our estimate of this percentage will vary based on the age of the underlying commitment and changes in mortgage interest rates.
The primary factor influencing the probability that a loan will fund within the terms of the IRLC is the change, if any, in mortgage rates subsequent to the commitment date. In general, the probability of funding increases if mortgage rates rise and decreases if mortgage rates fall. This is due primarily to the relative attractiveness of current mortgage rates compared to the applicant’s committed rate. The probability that a loan will fund within the terms of the IRLC also is influenced by the source of the application, age of the application, purpose of the loan (purchase or refinance) and the application approval rate.
We manage the interest rate and price risk associated with our outstanding IRLCs and loans held for sale by entering into derivative instruments, such as forward loan sales commitments and mandatory delivery commitments. For exchange-traded contracts, fair value is based on quoted market prices. For non-exchange traded contracts, fair value is based on dealer quotes, pricing models, and discounted cash flow methodologies. Fair value estimates also take into account counterparty credit risk and our own credit standing.
For additional information regarding our derivative financial instruments, refer to Note 6, "Derivative Financial Instruments," to our audited consolidated financial statements included in Part II, Item 8 of this Annual Report on Form 10-K.
Mortgage Loans Held for Sale
Mortgage loans that are intended to be sold primarily to the GSEs in the foreseeable future are reported as mortgage loans held for sale. We account for mortgage loans held for sale under the fair value option. Fair value of mortgage loans held for sale is typically calculated using observable market information, including pricing from actual market transactions or observable market prices from other loans that have similar collateral, credit, and interest rate characteristics.
A smaller portion of our mortgage loans held for sale consist of 1) loans repurchased from the GSEs that have subsequently been deemed non-saleable when certain representations and warranties are breached; and 2) loans actually repurchased from GNMA securities pursuant to our unilateral right, as servicer, to repurchase such GNMA loans we have previously sold. For loans repurchased from the GSEs, we estimate the fair values using a discounted cash flow analysis with significant unobservable inputs, such as prepayment speeds, default rates, the spread between bid and ask prices and loss severities. The fair value of loans repurchased from GNMA pools are estimated using a liquidation based discount cash flow analysis with significant unobservable inputs, such as our historical ability to make the GNMA loan saleable, by becoming current either through the borrower's performance or through completion of a modification of the loan's terms, and our historical ability to receive insurance reimbursements for related claims filed.
Gains or losses from the sale of mortgages are recognized based upon the difference between the selling price and carrying value of the related loans upon the sale of such loans. Direct loan origination costs are recognized as noninterest expense at origination.
63
In order to facilitate the origination and sale of mortgage loans held for sale, we have entered into various agreements with lenders. These agreements are in the form of loan participation agreements, repurchase agreements, warehouse lines of credit and other credit arrangements with banks and other financial institutions. Mortgage loans held for sale are considered sold when we surrender control over the financial assets and those financial assets are legally isolated from us in the event of our bankruptcy. If the sale criteria are met, the transferred financial assets are derecognized from the balance sheet and a gain or loss is recognized upon sale. If the sale criteria are not met, the transfer is recorded as a secured borrowing in which the assets remain on the balance sheet and the proceeds from the transaction are recognized as a liability. We account for all participation, repurchase, warehouse lines of credit and other credit arrangements as secured borrowings.
For additional information regarding our mortgage loans held for sale, refer to Note 7, "Mortgage Loans Held for Sale," to our audited consolidated financial statements included in Part II, Item 8 of this Annual Report on Form 10-K.
Loans Eligible for Repurchase from GNMA
As discussed above, we routinely sell loans into GNMA guaranteed MBS by pooling eligible loans through a pool custodian and assigning rights to the loans to GNMA. When these GNMA loans are initially pooled and securitized, we meet the criteria for sale treatment and de-recognize the loans. Subsequently, when we have the unconditional right, as servicer, to repurchase GNMA pool loans we have previously sold (generally loans that are more than 90 days past due), we then put back the loans on our balance sheet, initially reflected at fair value. An offsetting liability is also recorded.
Goodwill and Other Intangible Assets
We account for business combinations using the acquisition method, under which the total consideration transferred (including contingent consideration) is allocated to the fair value of the assets acquired (including identifiable intangible assets) and liabilities assumed. The excess of the consideration transferred over the fair value of the assets acquired and liabilities assumed results in goodwill. In certain of our acquisitions, the fair value of the assets acquired and liabilities assumed exceeded the consideration transferred, resulting in a bargain purchase gain.
In determining the total consideration transferred in a business combination, contingent consideration is a significant factor. The fair value of the contingent consideration arrangements are determined by management, with assistance from a third party valuation provider, using either the income approach (Crossline contingent on-boarding payment and NattyMac contingent earnout) or a calibrated Monte-Carlo simulation (Crossline and Medallion contingent earnouts); these methods require management to estimate the amount and timing of future production levels, volatility factors and discount rates. The fair values of the trade names, customer relationship and non-compete intangible assets are determined using a discounted cash flow method. This method requires management to make estimates related to future revenues, expenses, income tax rates and discount rates. The fair values of the agent list and state license intangible assets were determined using a cost-to-recreate approach, which required management to estimate the costs and amounts of time it would take to replace those assets, as well as future income tax rates.
Intangible assets with finite lives are amortized over their estimated lives using an amortization method that reflects the pattern in which the economic benefits of the asset are consumed. We evaluate the estimated remaining useful lives of these intangible assets to determine whether events or changes in circumstances warrant a revision to the remaining periods of amortization. If an intangible asset’s estimated useful life is changed, the remaining net carrying amount of the intangible asset is amortized prospectively over that revised remaining useful life. Additionally, an intangible asset that initially is deemed to have a finite useful life would cease being amortized if it is subsequently determined to have an indefinite useful life. Such intangible assets are then tested for impairment. We review such intangibles for impairment whenever events or changes in circumstances indicate their carrying amounts may not be recoverable, in which case any impairment charge would be recorded to earnings.
Indefinite-lived purchased intangible assets consist of the NattyMac trade name. Goodwill and other intangible assets with an indefinite useful life are not subject to amortization but are reviewed for impairment annually or more frequently whenever events or changes in circumstances indicate that the carrying amount of an intangible asset may not be recoverable. For indefinite-lived intangible assets other than goodwill, we first assess qualitative factors to determine whether the existence of events or circumstances leads to a determination that is more likely than not the assets are impaired. If we determine that it is more likely than not that the intangible assets are impaired, a quantitative impairment test is performed. For the quantitative impairment test, we estimate and compare the fair value of the indefinite-lived intangible asset with its carrying amount. If the carrying amount of the indefinite-lived intangible asset exceeds its fair value, the amount of the impairment is measured as the difference between the carrying amount of the asset and its fair value. Impairment is permanently recognized by writing down
64
the asset to the extent that the carrying value exceeds the estimated fair value. During the year ended December 31, 2015, no impairment was recorded for other intangible assets.
Our goodwill relates to the Retail reporting unit of our Originations segment. For goodwill, GAAP allows us to perform a qualitative assessment of possible impairment to our goodwill balance. We then typically perform a quantitative impairment test. At the reporting unit level, we estimate and compare the fair value to the book value. If the reporting unit's book value exceeds its fair value, we then perform a hypothetical purchase price allocation for the reporting unit. This is done by marking all assets and liabilities to fair value and calculating an implied goodwill value. If the implied goodwill value is less than the carrying value of the goodwill, the amount of impairment is measured as the difference and is permanently recognized by writing down the goodwill to the extent the carrying value exceeds the implied value.
We performed our annual assessment of goodwill impairment during the fourth quarter. This assessment is performed more frequently if events and circumstances indicate that impairment may have occurred. Our goodwill is allocated to and tested at the Retail reporting unit level, a component of our Originations segment inclusive of our retail direct and remaining retail distributed operations. No impairment was noted as a result of this analysis.
For additional information regarding our business combinations and goodwill and other intangible assets, refer to Note 5, "Business Combinations," and Note 11, "Goodwill and Other Intangible Assets," to our audited consolidated financial statements included in Part II, Item 8 of this Annual Report on Form 10-K.
Transfers of Financial Assets
We primarily sell residential mortgage loans to Fannie Mae, Freddie Mac or into pools of Ginnie Mae. We have continuing involvement in mortgage loans sold through servicing arrangements and the liability for loan indemnifications and repurchases under the representations and warranties we make to the investors and insurers of the loans we sell. We are exposed to interest rate risk through our continuing involvement with mortgage loans sold, including the mortgage servicing right asset, as the value of the asset fluctuates as changes in interest rates impact borrower prepayment.
We also sell non-agency residential mortgage loans to non-GSE third parties generally without retaining the servicing rights to such loans.
All mortgage loans we sell are sold on a non-recourse basis; however, certain representations and warranties are made that are customary for loan sale transactions, including eligibility characteristics of the mortgage loans and underwriting responsibilities, in connection with the sales of these assets.
Mortgage loans held for sale are considered de-recognized, or sold, when we surrender control over the financial assets. Control is considered to have been surrendered when the transferred assets have been isolated from us, are beyond our reach and that of our creditors; the purchaser obtains the right (free of conditions that constrain it from taking advantage of that right) to pledge or exchange the transferred assets; and we do not maintain effective control over the transferred assets through an agreement that both entitles and obligates us to repurchase or redeem the transferred assets before their maturity or the ability to unilaterally cause the holder to return specific assets. Such transfers may involve securitizations, participation agreements or repurchase agreements. If the criteria above are not met, such transfers are accounted for as secured borrowings, in which the assets remain on the balance sheet, the proceeds from the transaction are recognized as a liability and no MSRs are recorded for those transferred loans.
In order to facilitate the origination and sale of mortgage loans held for sale, we have entered into various agreements with lenders. These agreements are in the form of loan participations and repurchase agreements with banks and other financial institutions. Mortgage loans held for sale are considered sold when we surrender control over the financial assets and those financial assets are legally isolated from us in the event of our bankruptcy. If the sale criteria are not met, the transfer is recorded as a secured borrowing in which the assets remain on the balance sheet and the proceeds from the transaction are recognized as a liability. From time to time, we may sell loans whereby the underlying risks and cash flows of the mortgage loan have been transferred to a third party through the issuance of participating interests. The terms and conditions of these interests are governed by the participation agreements. We will receive a marketing fee paid by the participating entity upon completion of the sale. In addition, we will also subservice the underlying mortgage loans to the participation agreement for the period that the participating interests are outstanding. As of December 31, 2015 and 2014, all transfers pursuant to our mortgage funding arrangements are accounted for by us as secured borrowings.
Income Taxes
65
We determine deferred income taxes using the balance sheet method. Under this method, the net deferred tax asset or liability is based on future tax consequences attributable to the differences between the book and tax bases of assets and liabilities, as well as operating loss and tax credit carry-forwards. Deferred tax assets and liabilities are measured using enacted tax rates expected to apply to taxable income in the years in which those temporary differences are expected to be recovered or settled. The effect of a change in tax rates on deferred tax assets and liabilities is recognized in earnings in the period that includes the enactment date. Deferred income tax expense results from changes in deferred tax assets and liabilities between periods.
Deferred tax assets are recognized subject to management’s judgment that realization is more likely than not. We determine whether a deferred tax asset is realizable based on currently available facts and circumstances. On a quarterly basis, we evaluate our deferred tax assets to assess whether they are more likely than not to be realized in the future. If we were to experience either reduced profitability or operating losses in a future period, the realization of our deferred tax assets may no longer be considered more likely than not to be realized. In such an instance, we record a valuation allowance on our deferred tax assets by charging earnings. We recorded a valuation allowance in the amount of $1,554 as of December 31, 2015, as we determined that it is more likely than not that a portion of our deferred tax assets will not be realized. There was no such need for a valuation allowance as of December 31, 2014.
Our income tax expense also includes assessments related to uncertain tax positions taken or expected to be taken by us. ASC 740-10, Income Taxes, requires financial statement recognition of the impact of a tax position if a position is more likely than not of being sustained on audit, based on the technical merits of the position. We assess this as facts and circumstances related to our business and operations change in a period. If applicable, we will recognize interest and penalties related to unrecognized tax benefits as a component of income tax expense. The open tax years subject to examination by taxing authorities include the years ended December 31, 2014, 2013, and 2012. We had no federal or state tax examinations in process as of December 31, 2015. For additional information regarding our income taxes, refer to Note 17, "Income Taxes," to our audited consolidated financial statements included in Part II, Item 8 of this Annual Report on Form 10-K.
Recent Accounting Developments
ASU No. 2014-08, "Reporting Discontinued Operations and Disclosures of Disposals of Components of an Entity" was issued in April 2014. Under the new guidance, only disposals of a component of an entity that represent a major strategic shift on an entity's operations and financial results shall be reported in discontinued operations. The guidance also requires the presentation as discontinued operations for an entity that, on acquisition, meets the criteria to be classified as held for sale. In addition, the update expands disclosures for discontinued operations, requires new disclosures regarding disposals of an individually significant component of an entity that does not qualify for discontinued operations presentation and expands disclosures about an entity's significant continuing involvement with a discontinued operations. The updated requires us to apply the amendments prospectively to all components of an entity that are disposed of or classified as held for sale and to all businesses that, on acquisitions, are classified as held for sale within interim and annual periods beginning on or after December 15, 2014. The adoption of this new guidance is reflected within our operations and financial results for the years ended December 31, 2015, 2014 and 2013.
ASU No. 2015-02, "Consolidation (Topic 810) - Amendments to the Consolidation Analysis" was issued in February 2015. This update affects reporting entities that are required to evaluate whether they should consolidate certain legal entities. The amendments in this update affect the following areas: 1) limited partnerships and similar legal entities, 2) evaluating fees paid to a decision maker or a service provider as a variable interest, 3) the effect of fee arrangements on the primary beneficiary determination, 4) the effect of related parties on the primary beneficiary determination, and 5) certain investment funds. The new guidance will be effective for us beginning on January 1, 2016. We do not expect the adoption of the new guidance to have a material impact on our financial statements.
ASU No. 2015-03 "Interest - Imputation of Interest (Subtopic 835-30): Simplifying the Presentation of Debt Issuance
Costs" was issued in April 2015. This update is to simplify presentation of debt issuance costs and requires debt issuance costs
related to a recognized debt liability to be presented in the balance sheet as a direct deduction from the carrying amount of the debt liability, consistent with debt discounts. The new guidance will be effective for us beginning on January 1, 2016. We do not expect the adoption of the new guidance to have a material impact on our financial statements.
ASU No. 2015-05 "Intangibles - Goodwill and Other - Internal Use Software (Topic 350-40): "Customer's Accounting
for Fees Paid in a Cloud Computing Arrangement" was issued in April 2015. This update provides guidance to customers
about whether a cloud computing arrangement includes a software license and how to account for it. The new guidance will be
effective for us beginning on January 1, 2016. We are still evaluating the impact of the adoption of the new guidance on our financial statements.
66
ASU No. 2015-14 "Revenue from Contracts with Customers (Topic 606): Deferral of the Effective Date" was issued in
August 2015. This update extends the effective date of ASU 2014-09 by one year. ASU 2014-09 supersedes the revenue recognition criteria and amends existing requirements in other Topics to be consistent with the new recognition and measurement rules. The update is to ensure that an entity is recognizing revenue to depict the transfer of promised goods or services to customers in an amount that reflects the consideration to which the entity expects to be entitled in exchange for those goods or services. The new guidance will be effective for us beginning on January 1, 2018. We do not expect the adoption of the new guidance to have a material impact on our consolidated financial statements.
ASU No. 2015-16 "Business Combinations (Topic 805): Simplifying the Accounting for Measurement-Period
Adjustments" was issued in September 2015. This update requires that an acquirer 1) recognize adjustments to provisional
amounts that are identified during the measurement period in the reporting period in which the adjustment amounts are
determined, 2) record, in the same period's financial statements, the effect on earnings of changes in depreciation, amortization
or other income effects, if any, as a result of the change to the provisional amounts calculated as if the accounting had been
completed at the acquisition date, and 3) present separately on the face of the income statement or disclose in the notes the
portion of the amount recorded in current period earnings by the line item that would have been recorded in previous reporting
periods if the adjustment to the provisional amounts had been recognized as of the acquisition date. The new guidance will be
effective for us beginning on January 1, 2016. We do not expect the adoption of the new guidance to have a material impact on our consolidated financial statements.
ASU No. 2016-01 "Financial Instruments - Overall (Subtopic 825-10): Recognition and measurement of financial assets and financial liabilities" was issued in January 2016. The amendments in this update require an entity to: (i) measure equity investments at fair value through net income, with certain exceptions; (ii) present in other comprehensive income the changes in instrument-specific credit risk for financial liabilities measured using the fair value option; (iii) present financial assets and financial liabilities by measurement category and form of financial asset; (iv) calculate the fair value of financial instruments for disclosure purposes based on an exit price and; (v) assess a valuation allowance on deferred tax assets related to unrealized losses of available for sale debt securities in combination with other deferred tax assets. The update provides an election to subsequently measure certain non-marketable equity investments at cost less any impairment and adjusted for certain observable price changes. The update also requires a qualitative impairment assessment of such equity investments and amends certain fair value disclosure requirements. The new guidance will be effective for us beginning on January 1, 2018. We do not expect the adoption of the new guidance to have a material impact on our consolidated financial statements.
ASU 2016-02, "Leases (Topic 842)" was issued in February 2016. This update amends various aspects of existing guidance for leases and requires additional disclosures about leasing arrangements. It will require companies to recognize lease assets and lease liabilities by lessees for those leases classified as operating leases under previous GAAP. Topic 842 retains a distinction between finance leases and operating leases. The classification criteria for distinguishing between finance leases and operating leases are substantially similar to the classification criteria for distinguishing between capital leases and operating leases in the previous leases guidance. The new guidance will be effective for us beginning on January 1, 2019 and earlier adoption is permitted. We are evaluating the impact of the adoption of the new guidance on our financial statements.
Liquidity and Capital Resources
Overview
Liquidity measures our ability to meet potential cash requirements, including the funding of servicing advances, the payment of operating expenses, the originations of loans and the repayment of borrowings.
Our primary sources of funds for liquidity include: (i) secured borrowings in the form of repurchase facilities and participation agreements with major financial institutions, as well as our warehouse lines of credit and operating lines of credit, (ii) secured borrowings secured by MSRs, (iii) equity offerings, (iv) servicing fees and ancillary fees, (v) payments received from sales or securitizations of loans, (vi) payments received from mortgage loans held for sale, and (vii) sale of MSRs. Our primary uses of funds for liquidity include: (i) originations of loans, (ii) originations of warehouse lines of credit, (iii) funding of servicing advances, (iv) payment of interest expenses, (v) payment of operating expenses, (vi) repayment of borrowings, (vii) investment in subordinated debt, and (viii) payments for acquisitions of MSRs.
Our financing strategy primarily consists of entering into various mortgage funding arrangements with major financial institutions, as well as regional banks. We believe this provides us with a stable, low-cost, diversified source of funds to finance our business. On January 29, 2015, we signed a Mortgage Repurchase Agreement with Wells Fargo with a maximum borrowing capacity of $200,000, which was subsequently amended to $140,000; and, on November 10, 2015, we signed a
67
Mortgage Repurchase Agreement with EverBank with a maximum borrowing capacity of $150,000 and related GNMA MSR financing of $70,000. These borrowing facilities are comparable to the repurchase facilities that the Company has in place with other financial institutions. The addition of these facilities has further diversified our financing portfolio and has allowed us to right-size our other MSRs financing sources.
On September 11, 2015, we entered into a Master Loan Purchase and Servicing Agreement with Guaranty
Bank, which has an operating line of credit secured by certain FHA mortgage loans repurchased from GNMA pools. These
loans have been repurchased, or will be, by the Company out of GNMA pools in connection with its unilateral right, as servicer,
to repurchase such GNMA loans it has previously sold (generally loans that are more than 90 days past due). The borrowing
matures no later than four years from the date of purchase from GNMA pools and carries an interest rate of coupon rate of the
mortgage loans, less the debenture rate funded by Guaranty Bank. This agreement provides us an alternative to our obligation to continue advancing principal and interest payments related to the GNMA security and allows us the opportunity to make the underlying GNMA security current and salable into new GNMA pools.
With a viable and growing market for the sale of servicing, we see no material negative trends that we believe would affect our access to long-term or short-term borrowings to maintain our current operations, or that would inhibit our ability to fund operations and capital commitments for the next 12 months.
Our servicing agreements impose on us various rights and obligations that affect our liquidity. Among the most significant of these obligations is the requirement that we advance our own funds to meet contractual principal and interest payments for certain investors and to pay taxes, insurance, foreclosure costs and various other items that are required to preserve the assets being serviced. Delinquency rates and prepayment speeds affect the size of servicing advance balances. These advances are typically recovered upon weekly or monthly reimbursements or from sale in the market.
We finance these advances using cash on hand. We are not currently anticipating that the servicing advance asset will grow in the near future beyond our capacity to finance the asset using available cash. If the servicing advances become a sizable asset on our balance sheet, we will negotiate a servicing advance facility with one or more of our financial partners, which we believe to be readily available in the current market.
Cash Flows
Our total unrestricted cash balance decreased from $45,382 as of December 31, 2014 to $32,463 as of December 31, 2015. The following discussion summarizes the changes in our unrestricted cash balance for our continuing and discontinued operations for the years ended December 31, 2015 and 2014:
Operating Activities
Our operating activities provided $165,600 and used $561,149 of cash flow for the years ended December 31, 2015 and 2014, respectively. The increase in cash provided by operating activities was primarily due to selling our loans at a faster rate than the prior period. These positive operating cash outflows were partially offset by an increase in cash used for our warehouse receivables resulting from higher volume of warehouse loan originations within our Financing segment, as we continue to grow with new customer applications and increased warehouse line commitments within our existing customer base.
Investing Activities
Our investing activities provided $71,227 and $752 of cash flow for the years ended December 31, 2015 and 2014, respectively. The increase in cash provided by investing activities was primarily due to the proceeds received from the sales of nearly $8.7 billion of MSRs in the current period to unrelated third parties in four separate bulk sale transactions, as well as one flow sale arrangement, and our previous investment in the subordinated debt of Merchants Bancorp entered into during the second quarter of 2014 in order to facilitate the financing of warehouse lines of credit ("WLOCs") in our Financing segment. This increase was partially offset by purchases of property and equipment.
Financing Activities
Our financing activities used $249,746 and provided $562,675 of cash flow for the years ended December 31, 2015 and 2014, respectively. The increase in cash used by financing activities was primarily due to the timing of borrowings versus repayments under our various mortgage funding arrangements. The timing of our borrowings and repayments fluctuates based on the needs of our operations.
We continue to examine opportunities to acquire loan servicing portfolios and/or businesses that engage in loan servicing and/or loan originations. Future acquisitions could require substantial additional capital in excess of cash from
68
operations. We would expect to finance the capital required for acquisitions through a combination of additional issuances of equity, corporate indebtedness, asset-backed acquisition financing and/or cash from operations.
Capital Resources
We are subject to various regulatory capital requirements administered by the Department of Housing and Urban Development (“HUD”), which governs non-supervised, direct endorsement mortgagees, and GNMA, which governs issuers of GNMA securities. Additionally, we are required to maintain minimum net worth requirements for many of the states in which we sell and service loans. Each state has its own minimum net worth requirement, which range from $0 to $1 million, depending on the state. Also, on January 30, 2015, the Federal Housing Finance Agency ("FHFA"), regulator of FNMA and FHLMC, proposed new minimum financial eligibility rules for non-bank mortgage sellers who originate and service mortgages for FNMA and FHLMC which set additional standards for net worth, capital ratio and liquidity.
Failure to meet minimum capital requirements can result in certain mandatory and possibly additional discretionary remedial actions by regulators that, if undertaken, could (i) remove our ability to sell and service loans to or on behalf of the agencies and (ii) have a direct material effect on our financial statements. In accordance with the regulatory capital guidelines, we must meet specific quantitative measures of assets, liabilities and certain off-balance sheet items calculated under regulatory accounting practices. Further, changes in regulatory and accounting standards, as well as the impact of future events on our results, may significantly affect our net worth adequacy. As of December 31, 2015, we met all minimum net worth requirements to which we were subject.
Financings
Our financing strategy primarily consists of entering into various mortgage funding arrangements with major financial institutions, as well as regional banks. We believe this provides us with a stable, low cost, diversified source of funds to finance our business. We continually evaluate opportunities, based upon market conditions, to finance our operations by accessing the capital markets or other types of indebtedness with institutional lenders, as well as to refinance our outstanding indebtedness in order to reduce our borrowing costs, extend maturities and/or increase our operating flexibility. There can be no guarantee that any such financing or refinancing opportunities will be available on acceptable terms or at all.
At December 31, 2015 and 2014, our borrowings outstanding are as follows:
December 31, 2015 | December 31, 2014 | ||||||||||||
Amount Outstanding | Weighted Average Interest Rate | Amount Outstanding | Weighted Average Interest Rate | ||||||||||
Secured borrowings - mortgage loans | $ | 492,799 | 4.16 | % | 1 | $ | 592,798 | 3.97 | % | ||||
Secured borrowings - eligible GNMA loan repurchases | 37,615 | 3.17 | % | 2 | — | — | % | ||||||
Mortgage repurchase borrowings | 279,421 | 2.47 | % | 472,045 | 2.23 | % | |||||||
Warehouse lines of credit | 1,306 | 4.25 | % | 1,374 | 4.25 | % | |||||||
Secured borrowings - mortgage servicing rights | 77,069 | 5.58 | % | 75,970 | 5.49 | % | |||||||
Operating lines of credit | 5,000 | 4.00 | % | 2,000 | 4.00 | % | |||||||
Total short-term borrowings | $ | 893,210 | $ | 1,144,187 | |||||||||
1 Our costs for secured borrowings on mortgage loans are shown in the table above based on the average underlying mortgage rates. These costs are reduced by earnings and fees specific to each of the secured borrowing facilities.
2 Our costs for financing GNMA loan repurchases under this funding arrangement (remittance rate) are based on a borrowing rate over and above the debenture rate, which is set on each loan by HUD at a required spread to the constant maturity ten-year treasury at that point in time.
We maintain mortgage loan participation, warehouse lines of credit, repurchase and other credit arrangements listed above (collectively referred to as “mortgage funding arrangements”) with various financial institutions, primarily to fund the origination and purchase of mortgage loans. As of December 31, 2015, we held mortgage funding arrangements with six separate financial institutions and a total maximum borrowing capacity of $1,947,000, including the operating lines of credit and funding arrangement for GNMA loan repurchases. Except for our operating lines of credit, each mortgage funding arrangement is collateralized by the underlying mortgage loans. Separately, we had two mortgage funding arrangements for the funding of MSRs, each of which is collateralized by the MSRs pledged to the respective facilities.
The following table summarizes the amounts outstanding, interest rates and maturity dates under our various mortgage funding arrangements as of December 31, 2015 and December 31, 2014:
69
Mortgage Funding Arrangements1 | Amount Outstanding | Maximum Borrowing Capacity | Interest Rate | Maturity Date | |||||||||
Merchants Bank of Indiana - Participation Agreement | $ | 169,589 | $ | 600,000 | 2 | Same as the underlying mortgage rates, less contractual service fee | July 2016 | ||||||
Merchants Bank of Indiana - NattyMac Funding | 323,210 | — | 3 | Same as the underlying mortgage rates, less 49% of facility earnings | March 2017 | ||||||||
Total secured borrowings - mortgage loans | 492,799 | 600,000 | |||||||||||
Guaranty Bank | 37,615 | 50,000 | Coupon rate of underlying loans, less debenture rate | 7 | N/A | 8 | |||||||
Total secured borrowings - eligible GNMA loan repurchases | 37,615 | 50,000 | |||||||||||
Barclays Bank PLC | 45,956 | 300,000 | LIBOR plus applicable margin | December 2016 | |||||||||
Bank of America, N.A. | 184,804 | 700,000 | 4 | LIBOR plus applicable margin | June 2016 | ||||||||
EverBank | — | 150,000 | LIBOR plus applicable margin | November 2016 | |||||||||
Wells Fargo Bank N.A. | 48,661 | 140,000 | LIBOR plus applicable margin | January 2017 | |||||||||
Total mortgage repurchase borrowings | 279,421 | 1,290,000 | |||||||||||
Merchants Bank of Indiana - Warehouse Line of Credit | 1,306 | 2,000 | Prime plus 1.00% | July 2016 | |||||||||
Total warehouse lines of credit | 1,306 | 2,000 | |||||||||||
Barclays Bank PLC - MSRs Secured | 58,979 | — | 5 | LIBOR plus applicable margin | December 2016 | ||||||||
EverBank - MSRs Secured | 18,090 | — | 6 | LIBOR plus applicable margin | November 2016 | ||||||||
Total secured borrowings - MSRs | 77,069 | — | |||||||||||
Total | $ | 888,210 | $ | 1,942,000 | |||||||||
1 Does not include our operating lines of credit for which we have a maximum borrowing capacity of $5,000.
2 Merchants Bank of Indiana will periodically constrain the aggregate maximum borrowing capacity. During the year ended December 31, 2015, the lowest amount to which the aggregate maximum borrowing capacity was limited approximated $550,000. The highest amount to which it was expanded approximated $700,000. At December 31, 2015, the aggregate maximum borrowing capacity was $600,000.
3 The maximum borrowing capacity is a sublimit of the Merchants Participation Agreement maximum borrowing capacity referred to in Note 2 above.
4 The Bank of America maximum borrowing includes $400,000 of mortgage repurchase and $300,000 of mortgage gestation repurchase facilities.
4 Governed by the Barclays Bank PLC maximum borrowing capacity of $300,000, with a sub-limit of $60,000.
5 Based on GNMA MSRs pledged to Merchants Bank of Indiana. Subsequent to year end, such capacity was raised to $35,000.
6 Governed by the EverBank maximum borrowing capacity of $150,000, with a sub-limit of $70,000.
7 Borrowing carries an interest rate of the coupon rate of the underlying mortgage loans, less the debenture rate funded by Guaranty Bank.
8 Borrowing matures no later than four years from the date of most recent purchase from GNMA pools.
As of December 31, 2014:
Mortgage Funding Arrangements1 | Amount Outstanding | Maximum Borrowing Capacity | Interest Rate | Maturity Date | |||||||||
70
Merchants Bank of Indiana - Participation Agreement | $ | 273,341 | $ | 600,000 | 2 | Same as the underlying mortgage rates, less contractual service fee | July 2015 | ||||||
Merchants Bank of Indiana - NattyMac Funding | 319,457 | — | 3 | Same as the underlying mortgage rates, less 49% of facility earnings | March 2015 | 7 | |||||||
Total secured borrowings - mortgage loans | 592,798 | 600,000 | |||||||||||
Barclays Bank PLC | 224,444 | 400,000 | LIBOR plus applicable margin | December 2015 | |||||||||
Bank of America, N.A. | 247,601 | 600,000 | 6 | LIBOR plus applicable margin | Mary 2015 | ||||||||
Total mortgage repurchase borrowings | 472,045 | 1,000,000 | |||||||||||
Merchants Bank of Indiana - Warehouse Line of Credit | 1,374 | 2,000 | Prime plus 1.00% | July 2015 | |||||||||
Total warehouse lines of credit | 1,374 | 2,000 | |||||||||||
Barclays Bank PLC - MSRs Secured | 45,970 | — | 4 | LIBOR plus applicable margin | December 2015 | ||||||||
Merchants Bank of Indiana - MSRs Secured | 30,000 | 30,000 | 5 | LIBOR plus applicable margin | June 2017 | ||||||||
Total secured borrowings - MSRs | 75,970 | 30,000 | |||||||||||
Total | $ | 1,142,187 | $ | 1,632,000 | |||||||||
1 Does not include our operating lines of credit for which we have a maximum borrowing capacity of $2,000.
2 Merchants Bank of Indiana will periodically limit or expand the aggregate maximum borrowing capacity. During the year ended December
31, 2014, the lowest amount to which the aggregate maximum borrowing capacity was limited approximated $500,000. At December 31, 2014, the aggregate maximum borrowing capacity was $600,000.
3 The maximum borrowing capacity is a sublimit of the Merchants Participation Agreement maximum borrowing capacity referred to in Note
2 above.
4 Governed by the Barclays Bank PLC maximum borrowing capacity of $400,000, with a sub-limit of $100,000.
5 Based on GNMA MSRs pledged to Merchants Bank of Indiana. Subsequent to year end, such capacity was raised to $35,000.
6 The Bank of America maximum borrowing includes $400,000 of mortgage repurchase and $200,000 of mortgage gestation repurchase
facilities.
7 Agreement automatically renews 90 days prior to maturity if no termination notice given by either party. No notice was received or given at
the 90 day mark and this line was extended to a maturity date of March 2016.
We intend to renew the mortgage funding arrangements when they mature and have no reason to believe we will be unable to do so.
On May 22, 2014, we entered into a loan and security agreement with Barclays Bank PLC ("Barclays") in which we established a $100,000 revolving credit facility secured by our FNMA and FHLMC MSRs. The transaction was structured so that the $100,000 revolving credit facility with Barclays is a borrowing sub-limit within our existing $300,000 master repurchase agreements with Barclays. As part of the transaction, we, together with Barclays, entered into separate acknowledgment agreements with FNMA and FHLMC in which, among other things, FNMA and FHLMC acknowledge the lien against our FNMA and FHLMC MSRs. On July 7, 2014, we amended our master repurchase agreement with Barclays to increase the aggregate maximum borrowing capacity from $300,000 to $400,000, which was accounted for as a modification of a revolving debt arrangement. Through a series of further amendments, the agreements will mature on December 16, 2016. The maximum borrowing capacity and associated interest rate remain the same.
On April 15, 2014, we entered into an agreement with Merchants Bancorp (an Indiana-based bank holding company and the parent company of Merchants Bank of Indiana), whereby we agreed to invest up to $25,000 in the subordinate debt of Merchants Bancorp. Merchants Bancorp in turn, agreed to form and fund a wholly-owned subsidiary named NattyMac Funding Inc. (“NMF”) that would invest in participation interests in warehouse lines of credit ("WLOCs") originated by our wholly-owned subsidiary, NattyMac, and in participation interests in residential mortgage loans originated by Stonegate. Additionally, Merchants Bancorp of Indiana ("Merchants") pledged 1,000 shares of NMF's common capital stock to us, for which we have the right to claim if Merchants were to default on any parameters set forth by the agreement. The amount of the
71
subordinate debt funded by us is designed to be greater than or equal to 10% of the assets of NMF, based on the average assets of NMF over the quarter period. The subordinate debt provided to Merchants Bancorp will earn a return equal to one-month LIBOR, plus 350 basis points, plus additional interest that will be equal to 49% of the earnings of NMF. On September 25, 2014, we expanded the maximum amount of our investment in the subordinate debt of Merchants Bancorp to $30,000.
On January 29, 2015, we signed a Mortgage Repurchase Agreement with Wells Fargo with a maximum
borrowing capacity of $200,000, which was subsequently amended to $140,000. The borrowing facility is comparable to the repurchase facilities that we have in place with other financial institutions, and is designed to finance newly originated conventional, government and jumbo residential mortgages originated or purchased by us. The facility is uncommitted and matures on January 30, 2017.
On September 11, 2015, we entered into a Master Loan Purchase and Servicing Agreement with Guaranty
Bank, which has an operating line of credit secured by certain FHA mortgage loans repurchased from GNMA pools. These
loans have actually been repurchased by us from GNMA pools in connection with our unilateral right, as servicer,
to repurchase such GNMA loans we have previously sold (generally loans that are more than 90 days past due). The borrowing
matures no later than four years from the date of purchase from GNMA pools and carries an interest rate of coupon rate of the
mortgage loans, less the debenture rate funded by Guaranty Bank.
On November 10, 2015, we signed a Mortgage Repurchase Agreement with EverBank with a maximum borrowing capacity of $150,000 and related GNMA MSR financing of $70,000. The borrowing facility is comparable to the repurchase facilities that we have in place with other financial institutions, and is designed to finance newly originated conventional, government and jumbo residential mortgages originated or purchased by us, in addition to financing GNMA MSRs created and retained by the Company. The facility is uncommitted and matures on November 8, 2016.
We review and monitor our operating lines of credit during the year and amend the borrowing capacity
and maturity date throughout the quarter based on current operations.
The above mortgage funding and operating lines of credit agreements contain covenants which include certain customary financial requirements, including maintenance of minimum tangible net worth, maximum debt to tangible net worth ratio, minimum liquidity, minimum current ratio, minimum profitability and limitations on additional debt and transactions with affiliates, as defined in the respective agreement. As of December 31, 2015 and December 31, 2014, we were in compliance with the covenants contained in these arrangements. We intend to renew the mortgage funding arrangements when they mature and have no reason to believe we will be unable to do so.
Off-Balance Sheet Arrangements
As of December 31, 2015 and December 31, 2014, we did not have any off-balance sheet arrangements.
Contractual Obligations and Commitments
Our estimated contractual obligations and commitments as of December 31, 2015 are as follows:
Payments Due by Period | ||||||||||||||||||||
Total | Less than 1 Year | 1-3 Years | 3-5 Years | More than 5 Years | ||||||||||||||||
Secured borrowings-mortgage loans 1 | $ | 459,131 | $ | 459,131 | $ | — | $ | — | $ | — | ||||||||||
Secured borrowings - NattyMac Funding 1 | 54,168 | — | 54,168 | — | — | |||||||||||||||
Secured borrowings - eligible GNMA loan repurchases 1 | 37,615 | 37,615 | — | — | — | |||||||||||||||
Secured borrowings - MSRs 1 | 81,369 | 81,369 | — | — | — | |||||||||||||||
Mortgage repurchase borrowings 1 | 286,323 | 286,323 | — | — | — | |||||||||||||||
Warehouse lines of credit 1 | 1,362 | 1,362 | — | — | — | |||||||||||||||
Operating lines of credit 1 | 5,200 | 5,200 | — | — | — | |||||||||||||||
Operating lease commitments 2 | 26,455 | 6,314 | 11,336 | 6,079 | 2,726 | |||||||||||||||
Liability for mortgage repurchases and indemnifications | 5,536 | 350 | 882 | 2,593 | 1,711 | |||||||||||||||
Purchase obligation 3 | 1,531 | 897 | 634 | — | — | |||||||||||||||
Total contractual obligations and commitments | $ | 958,690 | $ | 878,561 | $ | 67,020 | $ | 8,672 | $ | 4,437 | ||||||||||
72
1 Includes estimated interest expense.
2 Represents lease obligations for office space and equipment under non-cancelable operating lease agreements. Amounts presented above do not include sublease revenue amounts. Sublease revenue amounts for the years 2016 through 2020 are $494, $539, $463, $389 and $20, respectively.
3 Includes purchase obligations for certain back office support systems software.
In addition to the above contractual obligations, we also had commitments to originate mortgage loans of $1,169,768 as of December 31, 2015. Commitments to originate mortgage loans do not necessarily reflect future cash requirements as some commitments are expected to expire without being drawn upon and, therefore, those commitments have been excluded from the table above. Such commitments are recorded on our consolidated balance sheets.
Quantitative and Qualitative Disclosures about Market Risk
Market risk is defined as the sensitivity of income, fair value measurements and capital to changes in interest rates, foreign currency exchange rates, commodity prices and other relevant market rates or prices. The primary market risks that we are exposed to are interest rate risks and the price risk associated with changes in interest rates. Interest rate risk is defined as risk to current or anticipated earnings or capital arising from movements in interest rates. Price risk is defined as the risk to current or anticipated earnings or capital arising from changes in the value of either assets or liabilities that are entered into as part of distributing or managing risk.
Our interest rate risk and price risk arise from the financial instruments and positions we hold. This includes mortgage loans held for sale, mortgage servicing rights and derivative financial instruments. Due to the nature of our operations, we are not subject to foreign currency exchange or commodity price risk.
These risks are managed as part of our overall monitoring of liquidity, which includes regular meetings of a group of executive managers that identify and manage the sensitivity of earnings or capital to changing interest rates to achieve our overall financial objectives. The members of this group include the Chief Financial Officer, acting as the chair, the EVP of Capital Markets and other members of management as deemed necessary. The group is responsible for:
• | meeting day-to-day cash outflows primarily in the settlement of margin requests from trading counterparties, operating expenses, planned capital expenditures and customer demand for loans; |
• | ensuring sufficient sources of liquidity exist to cover commitments to originate or purchase mortgage loans, warehouse lines of credit or other credit commitments; |
• | funding asset growth in a cost efficient manner; |
• | controlling concentration of exposure to any financing source; |
• | minimizing the impact of market disruptions should adverse events occur which erode Stonegate’s ability to fund itself; and |
• | surviving a major financial crisis which might result in a funding crisis. |
Credit Risk
We have exposure to credit loss in the event of contractual non-performance by our trading counterparties and counterparties to the over-the-counter derivative financial instruments that we use in our interest rate risk management activities. We manage this credit risk by selecting only counterparties that we believe to be financially strong, spreading the credit risk among many such counterparties, by placing contractual limits on the amount of unsecured credit extended to any single counterparty and by entering into netting agreements with the counterparties, as appropriate. For additional information, refer to Note 6 “Derivative Financial Instruments” to the consolidated financial statements included in Part II, Item 8 of this Form 10-K.
We have exposure to credit losses on residential mortgage loans that we hold for sale or investment as well as for losses incurred by investors in mortgage loans that we sell to them as a result of breaches of representations and warranties we make as part of the loan sales. The representations and warranties require adherence to investor or guarantor origination and underwriting guidelines, including but not limited to the validity of the lien securing the loan, property eligibility, borrower credit, income and asset requirements, and compliance with applicable federal, state and local law. The level of mortgage loan repurchase losses is dependent on economic factors, investor repurchase demand strategies, and other external conditions that may change over the lives of the underlying loans.
We also have exposure to credit loss in the event of non-repayment of amounts funded to correspondent customers through our NattyMac financing facility, though this has been somewhat mitigated by our transfer of participation interests in
73
certain warehouse lines of credit, and related risks, to NMF. We also bear the risk of loss on any loans funded in NMF, up to the amount of our investment in the subordinated debt of Merchants Bancorp. We manage this credit risk by performing due diligence and underwriting analysis on the correspondent customers prior to lending. Each counterparty is evaluated according to the underwriting guidelines as documented in the NattyMac Warehouse Underwriting Guidelines as required by the NattyMac Warehouse Credit Policy. In addition, the correspondent customers pledge, as security to the Company, the underlying mortgage loans. We periodically review the warehouse lending receivables for collectability based on historical collection trends and management judgment regarding the ability to collect specific accounts.
We have exposure related to servicing advances made in accordance with the servicing agreements which are recoverable upon collection of future borrower payments or foreclosure of the underlying loans. Our exposure to credit losses is only to the extent that the respective servicing guidelines are not followed or in the event there is a shortfall in liquidation proceeds and records a reserve against the advances when it is probable that the servicing advance will be uncollectible. In certain circumstances, we may be required to remit funds on a non-recoverable basis, which are expensed as incurred. We periodically review our servicing advances for collectability based on historical trends and management judgment regarding the ability to collect specific accounts.
Interest Rate Risk
Our principal market exposure is to interest rate risk, specifically long-term Treasury, LIBOR, and mortgage interest rates due to their impact on mortgage-related assets and commitments. Additionally, our escrow earnings on our mortgage servicing rights are sensitive to changes in short-term interest rates such as LIBOR. We also are exposed to changes in short-term interest rates on certain variable rate borrowings, primarily our mortgage warehouse lines of credit and our MSRs borrowing facilities. We anticipate that such interest rates will remain our primary benchmark for market risk for the foreseeable future.
Our business is subject to variability in results of operations in both the mortgage origination and mortgage servicing activities due to fluctuations in interest rates. In a declining interest rate environment, we would expect our mortgage production activities’ results of operations to be positively impacted by higher loan origination volumes and gain on sale margins. In contrast, we would expect the results of operations of our mortgage servicing activities to decline due to higher actual and projected loan prepayments related to our loan servicing portfolio. In a rising interest rate environment, we would expect a negative impact on the results of operations of our mortgage production activities and our mortgage servicing activities’ results of operations to be positively impacted. The interaction between the results of operations of our mortgage activities is a core component of our overall interest rate risk strategy.
Our mortgage funding arrangements (mortgage participation agreements and warehouse lines of credit) carry variable rates. As of December 31, 2015, approximately $492,799, or 55%, of our total $888,210 in outstanding adjustable rate mortgage funding arrangements had interest rates that were equal to the underlying mortgage loans. The remaining 45% of the adjustable rate mortgage funding arrangements carried a weighted average interest rate of 3.15%, which was well below the weighted average interest rate on the related mortgage loans held for sale as of December 31, 2015. In addition, mortgage loans held for sale are carried on our balance sheet on average for only 20 to 25 days after closing and prior to transfer to FNMA, to FHLMC or into pools of GNMA MBS. As a result, we believe that any negative impact related to our variable rate mortgage funding arrangements resulting from a shift in market interest rates would not be material to our consolidated financial statements as of or for the year ended December 31, 2015.
Interest rate lock commitments represent an agreement to extend credit to a mortgage loan applicant, or an agreement to purchase a loan from a third-party originator, whereby the interest rate on the loan is set prior to funding. Our mortgage loans held for sale, which are held in inventory awaiting sale into the secondary market, and our interest rate lock commitments, are subject to changes in mortgage interest rates from the date of the commitment through the sale of the loan into the secondary market. As such, we are exposed to interest rate risk and related price risk during the period from the date of the lock commitment through (i) the lock commitment cancellation or expiration date; or (ii) the date of sale into the secondary mortgage market. Loan commitments generally range between 30 and 90 days; and our holding period of the mortgage loan from funding to sale is typically within 30 days.
We manage the interest rate risk associated with our outstanding interest rate lock commitments and loans held for sale by entering into derivative loan instruments such as forward loan sales commitments of To-Be-Announced mortgage backed securities ("TBA Forward Commitments"). We expect these derivatives will experience changes in fair value opposite to changes in fair value of the derivative interest rate lock commitments and loans held for sale, thereby reducing earnings volatility. We take into account various factors and strategies in determining the portion of the mortgage pipeline (derivative loan commitments) and mortgage loans held for sale we want to economically hedge. Our expectation of how many of our interest rate lock commitments will ultimately close is a key factor in determining the notional amount of derivatives used in hedging the position.
74
Sensitivity Analysis
We have exposure to economic losses due to interest rate risk arising from changes in the level or volatility of market interest rates. We assess this risk based on changes in interest rates using a sensitivity analysis. The sensitivity analysis measures the potential impact on fair values based on hypothetical changes in interest rates.
We use financial models in determining the impact of interest rate shifts on our mortgage loan portfolio, MSRs portfolio and pipeline derivatives (IRLC and forward MBS trades). A primary assumption used in these models is that an increase or decrease in the benchmark interest rate produces a parallel shift in the yield curve across all maturities.
We utilize a discounted cash flow analysis to determine the fair value of MSRs and the impact of parallel interest rate shifts on MSRs. We obtain independent third party valuations on a quarterly basis, to support the reasonableness of the fair value estimate generated by our internal model. The primary assumptions in this model are prepayment speeds, discount rates, costs of servicing and default rates. However, this analysis ignores the impact of interest rate changes on certain material variables, such as the benefit or detriment on the value of future loan originations, non-parallel shifts in the spread relationships between MBS, swaps and U.S. Treasury rates and changes in primary and secondary mortgage market spreads. We also use a forward yield curve as an input which will impact pre-pay estimates and the value of escrows as compared to a static forward yield curve. We believe that the use of the forward yield curve better presents fair value of MSRs because the forward yield curve is the market’s expectation of future interest rates based on its expectation of inflation and other economic conditions.
For mortgage loans held for sale, IRLCs and forward delivery commitments on MBS, we rely on a model in determining the impact of interest rate shifts. In addition, for IRLCs, the borrowers’ likelihood to close their mortgage loans under the commitment is used as a primary assumption.
Our total market risk is influenced by a wide variety of factors including market volatility and the liquidity of the markets. There are certain limitations inherent in the sensitivity analysis presented, including the necessity to conduct the analysis based on a single point in time and the inability to include the complex market reactions that normally would arise from the market shifts modeled.
We used December 31, 2015 market rates on our instruments to perform the sensitivity analysis. The estimates are based on the market risk sensitivity portfolios described in the preceding paragraphs and assume instantaneous, parallel shifts in interest rate yield curves. Management uses sensitivity analysis, such as those summarized below, based on a hypothetical 25 basis point increase or decrease in interest rates, on a daily basis to monitor the risks associated with changes in interest rates to our mortgage loans pipeline (the combination of mortgage loans held for sale, IRLCs and forward MBS trades). We believe the use of a 25 basis point shift (50 basis point range) is appropriate given the relatively short time period that the mortgage loans pipeline is held on our balance sheet and exposed to interest rate risk (during the processing, underwriting and closing stages of the mortgage loans which generally last approximately 60 days). We also actively manage our risk management strategy for our mortgage loans pipeline (through the use of economic hedges such as forward loan sale commitments and mandatory delivery commitments) and generally adjust our hedging position daily. In analyzing the interest rate risks associated with our MSRs, management also uses multiple sensitivity analyses (hypothetical 25, 50 and 100 basis point increases and decreases) to review the interest rate risk associated with our MSRs, as the MSRs asset is generally more sensitive to interest rate movements over a longer period of time.
These sensitivities are hypothetical and presented for illustrative purposes only. Changes in fair value based on variations in assumptions generally cannot be extrapolated because the relationship of the change in fair value may not be linear.
At a given point in time, the overall sensitivity of our mortgage loans pipeline is impacted by several factors beyond just the size of the pipeline. The composition of the pipeline, based on the percentage of IRLC's compared to mortgage loans held for sale, the age and status of the IRLC's, the interest rate movement since the IRLC's were entered into, the channels from which the IRLC's originate, and other factors all impact the sensitivity. The following table summarizes the (unfavorable) favorable estimated change in our mortgage loans pipeline as of December 31, 2015 and December 31, 2014, given hypothetical instantaneous parallel shifts in the yield curve:
Mortgage loans pipeline1 | Down 25 bps | Up 25 bps | |||||
2015 | $ | (1,771 | ) | $ | 86 | ||
2014 | $ | (2,341 | ) | $ | 551 | ||
1 Represents unallocated mortgage loans held for sale, IRLCs and forward MBS trades that are considered “at risk” for purposes of illustrating interest rate sensitivity. Mortgage loans held for sale, IRLCs and forward MBS trades are considered to be unallocated when we have not committed the underlying mortgage loans for sale to the applicable GSEs.
75
Mortgage Servicing Rights
We use a discounted cash flow approach to estimate the fair value of MSRs. This approach consists of projecting
servicing cash flows discounted at a rate that management believes market participants would use in the determination of value.
The key assumptions used in the estimation of the fair value of MSRs include prepayment speeds, discount rates, default rates,
cost to service, contractual servicing fees, escrow earnings and ancillary income. The shape of the forward yield curve also has an impact on the asset valuation. We believe that the use of the forward yield curve better presents the fair value of MSRs because the forward yield curve is the market’s expectation of future interest rates based on its expectation of inflation and other economic conditions. We obtain an independent third party valuation on a monthly basis, to support the reasonableness of the fair value estimate generated by our internal model. We also have a MSRs committee that meets on a monthly basis to review assumptions, challenge estimates and review valuation results. Our MSRs are subject to substantial interest rate risk as the mortgage loans underlying the MSRs permit the borrowers to prepay the loans. Therefore, the value of MSRs generally tends to vary with interest rate movements and the resulting changes in prepayment speeds. Although the level of interest rates is a key driver of prepayment activity, there are other factors that influence prepayments, including home prices, underwriting standards and product characteristics. Since our mortgage origination activities’ results of operations are also impacted by interest rate changes, our mortgage origination activities’ results of operations may fully or partially offset the change in fair value of MSRs over time. We may, from time to time, review opportunities to sell pools of our MSRs portfolio under certain conditions that would be beneficial to us either due to market demand for servicing, changes in interest rates or our need for liquidity. For additional information about the assumptions used in determining the fair value of our MSRs and a quantitative sensitivity analysis on our MSRs as of December 31, 2015, refer to Note 8, "Mortgage Servicing Rights," to our consolidated financial statements included in Part II, Item 8 of this Annual Report on Form 10-K.
At a given point in time, the primary factors that contribute to the interest rate sensitivity of MSRs are the weighted average coupon of the loans underlying the MSRs compared to current mortgage rates and the size and composition of the MSR portfolio. The spread between the weighted average coupon and current market rates determines modeled prepayment speed. During 2015, the weighted average coupon of our MSRs portfolio remained flat in comparison to December 31, 2014 and, at December 31, 2015, mortgage rates were lower during the year ended December 31, 2015 than they were at during the year ended December 31, 2014. The combination of these factors increased current prepayment estimates and prepayment estimates in the interest rate shifts. The following table summarizes the (unfavorable) favorable estimated change in our MSRs as of December 31, 2015 and December 31, 2014, given hypothetical instantaneous parallel shifts in the yield curve:
MSRs | Down 100 bps | Down 50 bps | Down 25 bps | Up 25 bps | Up 50 bps | Up 100 bps | |||||||||||||||||
2015 | $ | (87,458 | ) | $ | (39,339 | ) | $ | (18,650 | ) | $ | 16,992 | $ | 32,200 | $ | 56,414 | ||||||||
2014 | $ | (95,045 | ) | $ | (48,810 | ) | $ | (23,505 | ) | $ | 20,225 | $ | 37,764 | $ | 67,609 | ||||||||
Prepayment Risk
To the extent that the actual prepayment rate on the mortgage loans underlying our MSRs differs from what we projected when we initially recognized the MSRs and when we measured fair value as of the end of each reporting period, the carrying value of our investment in MSRs will be affected. In general, an increase in prepayment expectations will accelerate the amortization of our MSRs accounted for using the amortization method and decrease our estimates of the fair value of both the MSRs accounted for using the amortization method and those accounted for using the fair value method, thereby reducing net servicing income.
Inflation Risk
Virtually all of our assets and liabilities are interest rate sensitive in nature. As a result, interest rates and other factors will influence our performance more than inflation. Changes in interest rates do not necessarily correlate with inflation rates or changes in inflation rates. Furthermore, our consolidated financial statements are prepared in accordance with GAAP and our activities and balance sheet are measured with reference to historical cost and/or fair value without considering inflation.
Market Value Risk
Our mortgage loans held for sale and MSRs are reported at their estimated fair values. The fair value of these assets fluctuates primarily due to changes in interest rates, but also due to the market demand for the particular asset.
76
ITEM 8. | FINANCIAL STATEMENTS |
STONEGATE MORTGAGE CORPORATION
CONSOLIDATED FINANCIAL STATEMENTS
Years ended December 31, 2015, 2014 and 2013
Contents
77
REPORT OF INDEPENDENT REGISTERED PUBLIC ACCOUNTING FIRM
The Board of Directors and Stockholders
Stonegate Mortgage Corporation:
We have audited the accompanying consolidated balance sheets of Stonegate Mortgage Corporation and subsidiaries as of December 31, 2015 and 2014, and the related consolidated statements of operations, changes in stockholders’ equity, and cash flows for each of the years in the three‑year period ended December 31, 2015. These consolidated financial statements are the responsibility of the Company’s management. Our responsibility is to express an opinion on these consolidated financial statements based on our audit.
We conducted our audit in accordance with the standards of the Public Company Accounting Oversight Board (United States). Those standards require that we plan and perform the audit to obtain reasonable assurance about whether the financial statements are free of material misstatement. An audit includes examining, on a test basis, evidence supporting the amounts and disclosures in the financial statements. An audit also includes assessing the accounting principles used and significant estimates made by management, as well as evaluating the overall financial statement presentation. We believe that our audits provide a reasonable basis for our opinion.
In our opinion, the consolidated financial statements referred to above present fairly, in all material respects, the financial position of Stonegate Mortgage Corporation and subsidiaries as of December 31, 2015 and 2014, and the results of their operations and of their cash flows for each of the years in the three‑year period ended December 31, 2015, in conformity with U.S. generally accepted accounting principles.
As discussed in Note 2 to the financial statements, the Company adopted FASB ASU No. 2014-08, Reporting Discontinued Operations and Disclosures of Disposals of Components of an Entity, in connection with the presentation of discontinued operations in the 2015 consolidated financial statements.
/s/ KPMG LLP
Indianapolis, Indiana
March 15, 2016
78
Stonegate Mortgage Corporation
Consolidated Balance Sheets
(In thousands, except share and per share data) | December 31, 2015 | December 31, 2014 | |||||
Assets | |||||||
Cash and cash equivalents | $ | 32,463 | $ | 45,382 | |||
Restricted cash | 4,045 | 4,482 | |||||
Mortgage loans held for sale, at fair value | 645,696 | 1,048,347 | |||||
Servicing advances, net | 19,374 | 11,193 | |||||
Derivative assets | 12,160 | 12,560 | |||||
Mortgage servicing rights, at fair value | 199,637 | 204,216 | |||||
Property and equipment, net | 22,923 | 17,047 | |||||
Loans eligible for repurchase from GNMA | 80,794 | 109,397 | |||||
Warehouse lending receivables | 199,215 | 85,431 | |||||
Goodwill and other intangible assets, net | 6,902 | 7,390 | |||||
Subordinated loan receivable | 30,000 | 30,000 | |||||
Other assets | 27,417 | 21,106 | |||||
Total assets | $ | 1,280,626 | $ | 1,596,551 | |||
Liabilities and stockholders’ equity | |||||||
Liabilities | |||||||
Secured borrowings - mortgage loans | 492,799 | 592,798 | |||||
Secured borrowings - mortgage servicing rights | 77,069 | 75,970 | |||||
Secured borrowings - eligible GNMA loan repurchases | 37,615 | — | |||||
Mortgage repurchase borrowings | 279,421 | 472,045 | |||||
Warehouse lines of credit | 1,306 | 1,374 | |||||
Operating lines of credit | 5,000 | 2,000 | |||||
Accounts payable and accrued expenses | 23,544 | 28,350 | |||||
Derivative liabilities | 2,517 | 9,044 | |||||
Reserve for mortgage repurchases and indemnifications | 5,536 | 4,967 | |||||
Liability for loans eligible for repurchase from GNMA | 80,794 | 109,397 | |||||
Deferred income tax liabilities, net | 2,364 | 11,831 | |||||
Other liabilities | 11,033 | 8,700 | |||||
Total liabilities | $ | 1,018,998 | $ | 1,316,476 | |||
Commitments and contingencies - Note 18 | |||||||
Stockholders’ equity | |||||||
Common stock, par value $0.01, shares authorized - 100,000,000; shares issued: 25,845,566 and outstanding: 25,796,193 at December 31, 2015; shares issued and outstanding: 25,780,973 at December 31, 2014 | 264 | 264 | |||||
Additional paid-in capital | 270,906 | 267,083 | |||||
Retained earnings | (9,542 | ) | 12,728 | ||||
Total stockholders’ equity | 261,628 | 280,075 | |||||
Total liabilities and stockholders’ equity | $ | 1,280,626 | $ | 1,596,551 | |||
See accompanying notes to the consolidated financial statements.
79
Stonegate Mortgage Corporation
Consolidated Statements of Operations
(In thousands, except per share data) | Years Ended December 31, | ||||||||||
2015 | 2014 | 2013 | |||||||||
Revenues | |||||||||||
Gains on mortgage loans held for sale, net | $ | 141,819 | $ | 133,390 | $ | 83,327 | |||||
Changes in mortgage servicing rights valuation | (30,395 | ) | (55,842 | ) | 22,967 | ||||||
Payoffs and principal amortization of mortgage servicing rights | (41,529 | ) | (23,735 | ) | (8,545 | ) | |||||
Loan origination and other loan fees | 23,956 | 24,581 | 21,227 | ||||||||
Loan servicing fees | 54,772 | 44,407 | 22,204 | ||||||||
Interest and other income | 34,117 | 35,236 | 16,767 | ||||||||
Total revenues | 182,740 | 158,037 | 157,947 | ||||||||
Expenses | |||||||||||
Salaries, commissions and benefits | 116,341 | 116,200 | 72,475 | ||||||||
General and administrative expense | 32,260 | 34,545 | 22,773 | ||||||||
Interest expense | 31,063 | 26,007 | 14,426 | ||||||||
Occupancy, equipment and communication | 16,870 | 14,601 | 9,843 | ||||||||
Depreciation and amortization expense | 7,980 | 5,048 | 2,209 | ||||||||
Total expenses | 204,514 | 196,401 | 121,726 | ||||||||
(Loss) income from continuing operations before income tax (benefit) expense | (21,774 | ) | (38,364 | ) | 36,221 | ||||||
Income tax (benefit) expense | (5,533 | ) | (12,936 | ) | 13,623 | ||||||
(Loss) income from continuing operations, net of tax | (16,241 | ) | (25,428 | ) | 22,598 | ||||||
Less: Preferred stock dividends | — | — | (27 | ) | |||||||
(Loss) income from continuing operations attributable to common stockholders | (16,241 | ) | (25,428 | ) | 22,571 | ||||||
(Loss) income from discontinued operations, net of tax | (6,029 | ) | (5,251 | ) | — | ||||||
Net (loss) income attributable to common stockholders | $ | (22,270 | ) | $ | (30,679 | ) | $ | 22,571 | |||
Basic (loss) earnings per share: | |||||||||||
From continuing operations | $ | (0.63 | ) | $ | (0.99 | ) | $ | 1.61 | |||
From discontinued operations | $ | (0.23 | ) | $ | (0.20 | ) | $ | — | |||
Total basic (loss) earnings per share | $ | (0.86 | ) | $ | (1.19 | ) | $ | 1.61 | |||
Diluted (loss) earnings per share: | |||||||||||
From continuing operations | $ | (0.63 | ) | $ | (0.99 | ) | $ | 1.32 | |||
From discontinued operations | $ | (0.23 | ) | $ | (0.20 | ) | $ | — | |||
Total diluted (loss) earnings per share | $ | (0.86 | ) | $ | (1.19 | ) | $ | 1.32 | |||
See accompanying notes to the consolidated financial statements.
80
Stonegate Mortgage Corporation
Consolidated Statements of Changes in Stockholders’ Equity
(In thousands) | Preferred Stock | Common Stock | Treasury Stock | Additional Paid-in Capital | Retained Earnings | Total Stockholders' Equity | ||||||||||||||||
Shares | Amount | Shares | Amount | |||||||||||||||||||
Balance at December 31, 2012 | 8,342 | $ | 33,000 | 2,834 | $ | 35 | $ | (1,820 | ) | $ | 3,198 | $ | 20,836 | $ | 55,249 | |||||||
Net income | — | — | — | — | — | — | 22,598 | 22,598 | ||||||||||||||
Stock-based compensation expense | — | — | — | — | — | 2,452 | — | 2,452 | ||||||||||||||
Issuance of stock warrants | — | — | — | — | — | 1,522 | — | 1,522 | ||||||||||||||
Issuance of common stock under discretionary incentive plan | — | — | 39 | — | 113 | 325 | — | 438 | ||||||||||||||
Preferred stock dividends | — | — | — | — | — | — | (27 | ) | (27 | ) | ||||||||||||
Conversion of preferred stock to common stock | (8,342 | ) | (33,000 | ) | 8,342 | 84 | — | 32,916 | — | — | ||||||||||||
Issuance of common stock under Rule 144A offering, net of initial purchaser's discount, placement fee and equity issuance costs | — | — | 6,389 | 64 | — | 104,536 | — | 104,600 | ||||||||||||||
Issuance of common stock under initial public offering, net of underwriters' discount and issuance costs | — | — | 8,165 | 81 | 1,707 | 118,881 | — | 120,669 | ||||||||||||||
Balance at December 31, 2013 | — | $ | — | 25,769 | $ | 264 | $ | — | $ | 263,830 | $ | 43,407 | $ | 307,501 | ||||||||
Net loss | — | — | — | — | — | — | (30,679 | ) | (30,679 | ) | ||||||||||||
Stock-based compensation expense | — | — | — | — | — | 3,253 | — | 3,253 | ||||||||||||||
Issuance of common stock | — | — | 12 | — | — | — | — | — | ||||||||||||||
Balance at December 31, 2014 | — | $ | — | 25,781 | 264 | $ | — | 267,083 | 12,728 | 280,075 | ||||||||||||
Net loss | — | — | — | — | — | — | (22,270 | ) | (22,270 | ) | ||||||||||||
Stock-based compensation expense | — | — | — | — | — | 3,823 | — | 3,823 | ||||||||||||||
Issuance of common stock | — | — | 15 | — | — | — | — | — | ||||||||||||||
Balance at December 31, 2015 | — | — | 25,796 | 264 | — | 270,906 | (9,542 | ) | 261,628 | |||||||||||||
See accompanying notes to the consolidated financial statements.
81
Stonegate Mortgage Corporation
Consolidated Statements of Cash Flows
(In thousands) | Years Ended December 31, | ||||||||||
2015 | 2014 | 2013 | |||||||||
Operating activities | |||||||||||
Net (loss) income | $ | (22,270 | ) | $ | (30,679 | ) | $ | 22,598 | |||
Adjustments to reconcile net (loss) income to net cash provided by operating activities: | |||||||||||
Depreciation and amortization expense | 8,835 | 5,201 | 2,209 | ||||||||
Loss on disposal and impairment of long lived assets | 2,336 | 1,527 | 105 | ||||||||
Amortization of debt issuance facility fees | 1,426 | — | 1,522 | ||||||||
Forgiveness of note receivable from stockholder | — | — | 214 | ||||||||
Gains on mortgage loans held for sale, net | (169,935 | ) | (156,925 | ) | (83,327 | ) | |||||
Changes in mortgage servicing rights valuation | 30,395 | 55,842 | (22,967 | ) | |||||||
Payoffs and principal amortization of mortgage servicing rights | 41,529 | 23,735 | 8,545 | ||||||||
Provision for reserve for (release of) mortgage repurchases and indemnifications - change in estimate | 592 | 822 | (417 | ) | |||||||
Stock-based compensation expense | 3,823 | 3,253 | 2,579 | ||||||||
Deferred income tax (benefit) expense | (9,202 | ) | (16,433 | ) | 13,623 | ||||||
Change in fair value of contingent earn-out liabilities | (103 | ) | (28 | ) | (10 | ) | |||||
Payments of contingent earn-out liabilities in excess of original fair value estimate | (406 | ) | — | — | |||||||
Proceeds from sales and principal payments of mortgage loans held for sale | 12,994,854 | 12,299,824 | 8,243,565 | ||||||||
Originations and purchases of mortgage loans held for sale | (12,499,203 | ) | (12,635,574 | ) | (8,706,887 | ) | |||||
Repurchases and indemnifications of previously sold loans | (48,882 | ) | (16,784 | ) | (4,070 | ) | |||||
Repurchases of eligible GNMA loans | (41,627 | ) | — | — | |||||||
Paydown of eligible GNMA loans | 2,969 | — | — | ||||||||
Changes in operating assets and liabilities: | |||||||||||
Restricted cash | 437 | (3,752 | ) | 2,945 | |||||||
Servicing advances | (5,335 | ) | (7,016 | ) | (3,239 | ) | |||||
Warehouse lending receivables | (113,784 | ) | (73,342 | ) | (12,089 | ) | |||||
Other assets | (8,674 | ) | (6,482 | ) | (5,466 | ) | |||||
Accounts payable and accrued expenses | (6,448 | ) | 2,530 | 16,721 | |||||||
Other liabilities | 4,273 | (6,260 | ) | — | |||||||
Due to related parties | — | (608 | ) | 260 | |||||||
Net cash provided by (used in) operating activities | 165,600 | (561,149 | ) | (523,586 | ) | ||||||
Investing activities | |||||||||||
Net proceeds from sale of property and equipment | 288 | — | — | ||||||||
Net proceeds from sales of mortgage servicing rights | 86,977 | 41,653 | — | ||||||||
Subordinated loan receivable | — | (30,000 | ) | — | |||||||
Purchases of property and equipment | (13,532 | ) | (8,634 | ) | (9,939 | ) | |||||
Capitalized long-lived assets | (2,420 | ) | — | — | |||||||
Purchases in a business combination, net of cash acquired | — | (258 | ) | (5,919 | ) | ||||||
Purchase of mortgage servicing rights | (86 | ) | (2,009 | ) | (1,543 | ) | |||||
Repayment of notes receivable from stockholder | — | — | 8 | ||||||||
Net cash provided by (used in) investing activities | 71,227 | 752 | (17,393 | ) | |||||||
(Continued on Next Page)
82
Stonegate Mortgage Corporation
Consolidated Statements of Cash Flows
(Continued)
(In thousands) | Years Ended December 31, | ||||||||||
2015 | 2014 | 2013 | |||||||||
Financing activities | |||||||||||
Proceeds from borrowings under mortgage funding arrangements - mortgage loans and operating lines of credit | 18,892,440 | 19,086,599 | 9,490,391 | ||||||||
Repayments of borrowings under mortgage funding arrangements - mortgage loans and operating lines of credit | (19,144,186 | ) | (18,521,273 | ) | (9,146,592 | ) | |||||
Proceeds from borrowings under mortgage funding arrangements - MSRs | 77,500 | — | — | ||||||||
Repayments of borrowings under mortgage funding arrangements - MSRs | (76,401 | ) | — | — | |||||||
Payments of contingent earn-out liabilities not exceeding original fair value estimate | (1,432 | ) | (1,361 | ) | — | ||||||
Payments of debt issuance costs | 2,333 | (1,290 | ) | — | |||||||
Proceeds from borrowing from stockholder | — | — | 10,000 | ||||||||
Repayment of borrowing from stockholder | — | — | (4,345 | ) | |||||||
Payments of capital lease obligations | — | — | (14 | ) | |||||||
Net proceeds from issuance of common stock | — | — | 225,573 | ||||||||
Payment of equity issuance costs | — | — | (5,959 | ) | |||||||
Payment of preferred stock dividends | — | — | (27 | ) | |||||||
Net cash (used in) provided by financing activities | (249,746 | ) | 562,675 | 569,027 | |||||||
Change in cash and cash equivalents | (12,919 | ) | 2,278 | 28,048 | |||||||
Cash and cash equivalents at beginning of period | 45,382 | 43,104 | 15,056 | ||||||||
Total cash and cash equivalents at end of period | $ | 32,463 | $ | 45,382 | $ | 43,104 | |||||
Supplemental Cash Flow Information: | |||||||||||
Cash paid for interest | $ | 32,836 | $ | 26,142 | $ | 12,233 | |||||
Cash paid for taxes | $ | 704 | $ | 118 | $ | 65 | |||||
Non-cash financing activities: | |||||||||||
Settlement of employee's incentive compensation with shares of common stock | $ | — | $ | — | $ | 438 | |||||
Conversion of preferred stock to common stock | $ | — | $ | — | $ | 33,000 | |||||
Repayment of term loan with shares of common stock | $ | — | $ | — | $ | 5,655 | |||||
See accompanying notes to the consolidated financial statements.
83
Stonegate Mortgage Corporation
Notes to Consolidated Financial Statements
December 31, 2015
(In Thousands, Except Share and Per Share Data or As Otherwise Stated Herein)
1. Organization and Operations
References to the terms “we”, “our”, “us”, “Stonegate” or the “Company” used throughout these Notes to Consolidated Financial Statements refer to Stonegate Mortgage Corporation and, unless the context otherwise requires, its wholly-owned subsidiaries. The Company was initially incorporated in the State of Indiana in January 2005. As a result of an acquisition and subsequent merger with Swain Mortgage Company ("Swain") in 2009, the Company is now an Ohio corporation. The Company’s headquarters is in Indianapolis, Indiana.
The Company is a leading, non-bank mortgage company focused on originating, financing, and servicing U.S.
residential mortgage loans that operates as an intermediary between residential mortgage borrowers and the ultimate investors
of these mortgages. The Company’s integrated and scalable residential mortgage banking platform includes a diversified
origination business which includes a retail branch network, a direct to consumer call center and a network of third party
originators consisting of mortgage brokers, mortgage bankers and financial institutions (banks and credit unions). The
Company predominantly sells mortgage loans to the Federal National Mortgage Association (“Fannie Mae” or “FNMA”), the
Federal Home Loan Mortgage Corporation (“Freddie Mac” or “FHLMC”), financial institution secondary market investors and
the Government National Mortgage Association (“Ginnie Mae” or “GNMA”) as pools of mortgage backed securities (“MBS”).
Both FNMA and FHLMC are considered government-sponsored enterprises ("GSEs"), for which the Company may perform
servicing of U.S. residential mortgage loans. The Company also provides warehouse financing through its NattyMac, LLC
subsidiary to third party correspondent lenders. The Company’s principal sources of revenue include (i) gains on sales of
mortgage loans from loan securitizations and whole loan sales and fee income from originations, (ii) fee income from loan
servicing, and (iii) fee and net interest and other income from its financing facilities and warehouse lending business. The
Company operates in three segments: Originations, Servicing and Financing. This determination is based on the Company’s
current organizational structure, which reflects the manner in which the chief operating decision maker evaluates the
performance of the business.
2. Basis of Presentation and Significant Accounting Policies
Basis of Presentation: The accompanying consolidated financial statements include the accounts of Stonegate and its subsidiaries and have been prepared in conformity with U.S. generally accepted accounting principles (“GAAP”) and in accordance with the instructions to Form 10-K as promulgated by the Securities and Exchange Commission. All intercompany accounts and transactions have been eliminated in consolidation.
Prior Period Reclassifications: During 2015, the Company decided to dispose of certain retail branches, or components of its Originations segment, and the assets associated with them, either through sale or disposal other than by sale. The Company has determined that the disposal of these retail branches met the criteria for presentation and disclosure as discontinued operations. Additional lines of detail in the Consolidated Statements of Operations and Consolidated Statements of Cash Flows have been presented to reflect the remaining operations of the Company. In addition, certain prior period amounts have been reclassified to conform to the current period presentation on the Consolidated Statements of Operations, Consolidated Statements of Cash Flows and within the Notes to Consolidated Financial Statements.
Immaterial Error Corrections: During the current period, the Company identified immaterial errors in its previously issued Consolidated Statements of Cash Flows for the years ended December 31, 2014 and 2013. These immaterial errors impacted the line items “Proceeds from borrowings under mortgage funding arrangements - mortgage loans and operating lines of credit” and “Repayments of borrowings under mortgage funding arrangements - mortgage loans and operating lines of credit” in an exact offsetting manner, such that the subtotal “Net cash provided by financing activities” was not misstated. For the years ended December 31, 2014 and 2013, the offsetting misstatements were 20,919,704 and 9,025,674, respectively.
Use of Estimates: The preparation of financial statements in conformity with GAAP requires us to make estimates and assumptions that affect the amounts reported in the Company’s consolidated financial statements and accompanying notes. Actual results could differ from those estimates. Material estimates that are particularly significant relate to the Company’s fair value measurements of mortgage loans held for sale, mortgage servicing rights (“MSRs”), loans eligible for repurchase from GNMA and the related liability, derivative assets and liabilities, goodwill and other intangible assets, as well as its estimates for the reserve for mortgage repurchases and indemnifications and income tax estimates for deferred tax assets valuation allowance considerations.
84
Stonegate Mortgage Corporation
Notes to Consolidated Financial Statements
December 31, 2015
Risks and Uncertainties: In the normal course of business, companies in the mortgage banking industry encounter certain economic and regulatory risks. Economic risks include interest rate risk and credit risk. In an interest rate cycle in which rates decline over an extended period of time, the Company's mortgage origination activities’ results of operations could be positively impacted by higher loan origination volumes and gain on sale margins. In contrast, the Company's results of operations of its mortgage servicing activities could decline due to higher actual and projected loan prepayments related to its loan servicing portfolio. In an interest rate cycle in which rates rise over an extended period of time, the Company's mortgage origination activities' results of operations could be negatively impacted and its mortgage servicing activities’ results of operations could be positively impacted. Credit risk is the risk of default that may result from the borrowers’ inability or unwillingness to make contractually required payments during the period in which loans are being held for sale. The Company manages these various risks through a variety of policies and procedures, such as the hedging of the loans held for sale and interest rate lock commitments using forward sales of MBS, such as To Be Announced (“TBA”) securities, designed to quantify and mitigate the operational and financial risk to the Company to the extent possible. Specifically, the Company engages in hedging of interest rate risk of its mortgage loans held for sale and interest rate lock commitments with the use of TBA mortgage securities.
The Company sells loans to investors without recourse. As such, the investors have assumed the risk of loss or default by the borrower. However, the Company is usually required by these investors to make certain standard representations and warranties relating to credit information, loan documentation, collateral and regulatory compliance. To the extent that the Company does not comply with such representations, the Company may be required to repurchase the loans or indemnify these investors for any losses from borrower defaults. The Company performs due diligence prior to funding mortgage loans as part of its loan underwriting process, whereby the Company analyzes credit, collateral and compliance risk of all loans in an effort to ensure the mortgage loans meet the investors’ standards. However, if a loan is repurchased, the Company could incur a loss as part of recording such loan at fair value, which may be less than the amount paid to purchase the loan. In addition, if loans pay off within a specified time frame, the Company may be required to refund a portion of the sales proceeds to the investors.
The Company’s business requires substantial cash to support its operating activities. As a result, the Company is dependent on its lines of credit and other financing facilities in order to fund its continued operations. If the Company’s principal lenders decided to terminate or not to renew any of these credit facilities with the Company, the loss of borrowing capacity would have a material adverse impact on the Company’s financial statements unless the Company found a suitable alternative source of financing.
Consolidation: The Company sells loans to FNMA and FHLMC, as well as in GNMA guaranteed mortgage-backed securities (“MBS”) by pooling eligible loans through a pool custodian and assigning rights to the loans to GNMA. FNMA, FHLMC and GNMA provide credit enhancement of the loans through certain guarantee provisions. These securitizations involve variable interest entities (“VIEs”) as the trusts or similar vehicles, by design, that either (1) lack sufficient equity to permit the entity to finance its activities without additional subordinated financial support from other parties, or (2) have equity investors that do not have the ability to make significant decisions relating to the entity’s operations through voting rights, or do not have the obligation to absorb the expected losses, or do not have the right to receive the residual returns of the entity.
The primary beneficiary of a VIE (i.e., the party that has a controlling financial interest) is required to consolidate the assets and liabilities of the VIE. The primary beneficiary is the party that has both (1) the power to direct the activities of an entity that most significantly impact the VIE’s economic performance; and (2) through its interests in the VIE, the obligation to absorb losses or the right to receive benefits from the VIE that could potentially be significant to the VIE. The Company typically retains the right to service the loans. Because of the power of FNMA, FHLMC and GNMA over the VIEs that hold the assets from these residential mortgage loan securitizations, principally through its rights and responsibilities as master servicer for FNMA and FHLMC, and as approver of issuers for GNMA, and the guarantee provisions provided by FNMA, FHLMC and GNMA, the Company is not the primary beneficiary of the VIEs and therefore the VIEs are not consolidated by the Company.
The Company has concluded that on a consolidated basis it has a variable interest in NattyMac Funding ("NMF") resulting from any potential interest it may earn from the 49% NMF earnings participation, as described in Note 14, "Debt". The Company has further concluded that it is not considered the primary beneficiary of its variable interest in NMF based on the fact that it does not have the power to direct the activities of NMF that most significantly impact NMF’s economic performance. NMF has the final authority over its operating policies. If at any time in the future the Company claims the right to the common capital stock of NMF in a default scenario as described in Note 14, "Debt", the primary beneficiary conclusion may change. The Company believes that its maximum exposure to loss as a result of this arrangement is the $30,000 in subordinated loan receivable as of December 31, 2015.
The Company performs on-going reassessments of: (1) whether entities previously evaluated under the majority voting-interest framework have become VIEs, based on certain events, and therefore become subject to the VIE consolidation
85
Stonegate Mortgage Corporation
Notes to Consolidated Financial Statements
December 31, 2015
framework; and (2) whether changes in the facts and circumstances regarding the Company’s involvement with a VIE cause the Company’s consolidation determination to change.
Revenue Recognition:
Mortgage Loans Held for Sale: Loan originations that are intended to be sold in the foreseeable future, including residential mortgages, are reported as mortgage loans held for sale. Mortgage loans held for sale are carried at fair value under the fair value option with changes in fair value recognized in current period earnings. At the date of funding of the mortgage loan held for sale, the funded amount of the loan, the related derivative asset or liability of the associated interest rate lock commitment, less direct loan costs (including but not limited to correspondent fees, broker premiums and underwriting expenses) becomes the initial recorded investment in the mortgage loan held for sale. Such amount approximates the fair value of the loan.
Mortgage loans held for sale are considered de-recognized, or sold, when the Company surrenders control over the financial assets. Control is considered to have been surrendered when the transferred assets have been isolated from the Company, beyond the reach of the Company and its creditors; the purchaser obtains the right (free of conditions that constrain it from taking advantage of that right) to pledge or exchange the transferred assets; and the Company does not maintain effective control over the transferred assets through an agreement that both entitles and obligates the Company to repurchase or redeem the transferred assets before their maturity or the ability to unilaterally cause the holder to return specific assets. Such transfers may involve securitizations, participation agreements or repurchase agreements. If the criteria above are not met, such transfers are accounted for as secured borrowings, in which the assets remain on the balance sheet, the proceeds from the transaction are recognized as a liability and no MSRs are recorded for those transferred loans.
Gains and losses from the sale of mortgages are recognized based upon the difference between the sales proceeds and carrying value of the related loans upon sale and is recorded in gains on mortgage loans held for sale in the statement of operations. The sales proceeds reflect the cash received and the initial fair value of the separately recognized mortgage servicing rights less the fair value of the liability for mortgage repurchases and indemnifications. Gain on mortgage loans held for sale also includes the unrealized gains and losses associated with the mortgage loans held for sale and the realized and unrealized gains and losses from derivatives.
Mortgage Servicing Rights and Change in Mortgage Servicing Rights Valuation: The Company capitalizes MSRs at fair value when purchased or at the time the underlying loans are de-recognized, or sold, and when the Company retains the right to service such loans. To determine the fair value of the MSRs, the Company uses a valuation model that calculates the present value of future cash flows generated by the rights to service. The valuation model incorporates assumptions that market participants would use in estimating future net servicing income, including estimates of the cost of servicing, the discount rate, float value, the inflation rate, estimated prepayment speeds, and default rates. MSRs currently are not actively traded in the markets, accordingly, considerable judgment is required to estimate their fair value and the exercise of that judgment can materially impact current period earnings.
The Company may sell from time to time a certain portion of its MSRs. At the time of the sale, based on the structure of the arrangement, the Company typically records a gain or loss on such sale based on the selling price of the MSRs less the carrying value and transaction costs. The MSRs are sold in separate transactions from the sale of the underlying loans. The MSRs sales are assessed to determine if they qualify as a sale transaction. A transfer of servicing rights related to loans previously sold qualifies as a sale at the date on which title passes, if substantially all risks and rewards of ownership have irrevocably passed to the transferee, and any protection provisions retained by the transferor are minor and can be reasonably estimated. In addition, if a sale is recognized and only minor protection provisions exist, a liability should be accrued for the estimated obligation associated with those provisions. As MSRs are not considered financial assets for accounting purposes, the accounting model used to determine if the transfer of an MSRs asset qualifies as a sale is based on a risks and rewards approach. Upon completion of a sale, the Company would account for the transaction as a sale and derecognize the mortgage servicing rights from the Consolidated Balance Sheets.
Loan Origination and Other Loan Fees: Loan origination and other loan fee income represents revenue earned from originating mortgage loans. Loan origination and other loan fees generally represent flat, per-loan fee amounts and are recognized as revenue, net of loan origination costs (excluding those direct loan origination costs that are recorded as a component of the recorded investment in mortgage loans held for sale), at the time the loans are funded.
Loan Servicing Fees: Loan servicing fee income represents revenue earned for servicing mortgage loans. The servicing fees are based on a contractual percentage of the outstanding principal balance and recognized as revenue as earned, which is generally upon collection of the payments from the borrower. Corresponding loan servicing costs are charged to expense as incurred.
86
Stonegate Mortgage Corporation
Notes to Consolidated Financial Statements
December 31, 2015
Interest Income: Interest income on mortgage loans is accrued to income based upon the principal amount outstanding and contractual interest rates. Income recognition is discontinued when loans become 90 days delinquent or when in management’s opinion, the collectability of principal and income becomes doubtful.
Warehouse Lending Receivables: During the year ended December 31, 2013, the Company introduced its warehouse lending products to its correspondent customers through warehouse line of credit agreements. Under the warehouse line of credit agreements, the Company lends funds to its correspondent customers to finance those correspondents' mortgage loan originations. The correspondent customers pledge, as security to the Company, the underlying mortgage loans, and pay interest on the related outstanding borrowings at a specified interest rate plus a margin, as defined in the underlying line of credit agreements with each correspondent customer. As of December 31, 2015, the Company had outstanding warehouse lending receivables from its correspondent customers of $199,215 and recognized interest income from its warehouse lending activities of $5,325 during the year ended December 31, 2015. As of December 31, 2014, the Company had outstanding warehouse lending receivables from its correspondent customers of $85,431 and recognized interest income from its warehouse lending activities of $2,812 during the year ended December 31, 2014. The Company periodically reviews the warehouse lending receivables for collectability based on a review of the counterparty, historical collection trends and management judgment regarding the ability to collect specific accounts. The Company has determined that no allowance for doubtful accounts was necessary as of December 31, 2015 or December 31, 2014.
Derivative Financial Instruments: All derivative financial instruments are recognized as either assets or liabilities and measured at fair value. The Company accounts for all of its derivatives as free-standing derivatives and does not designate any of these instruments for hedge accounting. Therefore, the gain or loss resulting from the change in the fair value of the derivative is recognized in the Company’s results of operations during the period of change.
The Company enters into commitments to originate residential mortgage loans held for sale, at specified interest rates and within a specified period of time, with customers who have applied for a loan and meet certain credit and underwriting criteria (interest rate lock commitments). These interest rate lock commitments (“IRLCs”) meet the definition of a derivative financial instrument and are reflected in the balance sheet at fair value with changes in fair value recognized in current period earnings. Unrealized gains and losses on the IRLCs are recorded as derivative assets and derivative liabilities, respectively, and are measured based on the value of the underlying mortgage loan, quoted MBS prices, estimates of the fair value of the mortgage servicing rights and an estimate of the probability that the mortgage loan will fund within the terms of the interest rate lock commitment, net of estimated commission expenses.
The Company manages the interest rate and price risk associated with its outstanding IRLCs and loans held for sale by entering into derivative instruments such as forward loan sales commitments and mandatory delivery commitments, including TBA mortgage securities. Management expects these derivatives will experience changes in fair value opposite to changes in fair value of the IRLCs and loans held for sale, thereby reducing earnings volatility. The Company takes into account various factors and strategies in determining the portion of the mortgage pipeline (IRLCs and loans held for sale) it wants to economically hedge.
Reserve for Loan Repurchases and Indemnifications: Loans sold to investors by the Company, and which were believed to have met investor and agency underwriting guidelines at the time of sale, may be subject to repurchase or indemnification in the event of specific default by the borrower or subsequent discovery that underwriting standards were not met. The Company may, upon mutual agreement, agree to repurchase the loans or indemnify the investor against future losses on such loans. In such cases, the Company bears any subsequent credit loss on the loans. The Company has established an initial reserve liability for expected losses related to these representations and warranties at the date the loans are de-recognized from the balance sheet based on the fair value of such reserve liability. Subsequently, based on changing facts and circumstances or changes in certain estimates and assumptions, the reserve liability may be adjusted if there is a reasonable possibility that future losses may be in excess of the initial reserve liability, with a corresponding amount recorded to provision for reserve for mortgage repurchases and indemnifications. In assessing the adequacy of the reserve, management evaluates various factors including actual losses on repurchases and indemnifications during the period, historical loss experience, known delinquent and other problem loans, delinquency trends in the portfolio of sold loans and economic trends and conditions in the industry. Actual losses incurred are reflected as charge-offs against the reserve liability.
Loans Eligible for Repurchase from GNMA: As discussed above, the Company routinely sells loans in GNMA guaranteed MBS by pooling eligible loans through a pool custodian and assigning rights to the loans to GNMA. When these GNMA loans are initially pooled and securitized, the Company meets the criteria for sale treatment and de-recognizes the loans. Subsequently, when the Company has the unconditional right, as servicer, to repurchase GNMA pool loans it has previously sold (generally loans that are more than 90 days past due), the Company then puts back the loans on its balance sheet, initially reflected at fair value. An offsetting liability is also recorded.
87
Stonegate Mortgage Corporation
Notes to Consolidated Financial Statements
December 31, 2015
Servicing Advances, net: Servicing advances, net represent principal, interest, escrow and corporate advances paid by the Company on behalf of customers to cover delinquent balances for principal, interest, property taxes, insurance premiums and other out-of-pocket costs. Advances are made in accordance with the servicing agreements and are recoverable upon collection of future borrower payments or foreclosure of the underlying loans. The Company is exposed to losses only to the extent that the respective servicing guidelines are not followed or in the event there is a shortfall in liquidation proceeds and records a reserve against the advances when it is probable that the servicing advance will be uncollectible. In certain circumstances, the Company may be required to remit funds on a non-recoverable basis, which are expensed as incurred. As of December 31, 2015, the recorded reserve for uncollectible servicing advances was $1,424.
Property and Equipment: Property and equipment is recorded at cost, net of accumulated depreciation. Depreciation is computed using the straight-line method over estimated useful lives of one to three years for internally developed computer software, three to ten years for furniture and equipment and three to five years for purchased computer software and equipment. Leasehold improvements are amortized using the straight-line method over the shorter of the related lease term or their estimated economic useful lives.
The Company periodically assesses property and equipment for recoverability whenever events or changes in circumstances indicate that their carrying amounts may not be recoverable. If management identifies an impairment indicator, it assesses recoverability by comparing the carrying amount of the asset to the undiscounted cash flows expected to result from the use and eventual disposition of the asset. An impairment loss is recognized in earnings whenever the carrying amount is not recoverable. During the year ended December 31, 2015, the Company recognized impairment of $1,726, primarily associated with the assets related to the discontinued operations discussed above. No such impairments were recognized during the years ended December 31, 2014 and 2013.
Goodwill and Other Intangible Assets: Business combinations are accounted for using the acquisition method of accounting. Acquired intangible assets are recognized and reported separately from goodwill. Goodwill represents the excess cost of acquisition over the fair value of net assets acquired. Finite-lived purchased intangible assets consist of customer relationships, non-compete agreement and an active agent list, which have useful lives of eight years, three years and five years, respectively. Intangible assets with finite lives are amortized over their estimated lives using an amortization method that reflects the pattern in which the economic benefits of the asset are consumed. The Company evaluates the estimated remaining useful lives on intangible assets to determine whether events or changes in circumstances warrant a revision to the remaining periods of amortization. If an intangible asset’s estimated useful life is changed, the remaining net carrying amount of the intangible asset is amortized prospectively over that revised remaining useful life. Additionally, an intangible asset that initially is deemed to have a finite useful life would cease being amortized if it is subsequently determined to have an indefinite useful life. Such intangible assets are then tested for impairment. The Company reviews such intangibles for impairment whenever events or changes in circumstances indicate their carrying amounts may not be recoverable, in which case any impairment charge would be recorded to earnings.
Indefinite-lived purchased intangible assets consist of the NattyMac trade name. Goodwill and other intangible assets with an indefinite useful life are not subject to amortization but are reviewed for impairment annually or more frequently whenever events or changes in circumstances indicate that the carrying amount of an intangible asset may not be recoverable. For indefinite-lived intangible assets other than goodwill, the Company first assesses qualitative factors to determine whether the existence of events or circumstances leads to a determination that is more likely than not the assets are impaired. If the Company determines that it is more likely than not that the intangible assets are impaired, a quantitative impairment test is performed. For the quantitative impairment test, the Company estimates and compares the fair value of the indefinite-lived intangible asset with its carrying amount. If the carrying amount of the indefinite-lived intangible asset exceeds its fair value, the amount of the impairment is measured as the difference between the carrying amount of the asset and its fair value. Impairment is permanently recognized by writing down the asset to the extent that the carrying value exceeds the estimated fair value.
The Company's goodwill relates to the Retail reporting unit of its Originations segment. For goodwill, GAAP allows a qualitative assessment prior to requiring a quantitative impairment test. For the quantitative impairment test, at the reporting unit level, the Company estimates and compares the fair value to the book value. If the reporting unit's book value exceeds its fair value, the Company then performs a hypothetical purchase price allocation for the reporting unit. This is done by marking all assets and liabilities to fair value and calculating an implied goodwill value. If the implied goodwill value is less than the carrying value of the goodwill, the amount of impairment is measured as the difference and is permanently recognized by writing down the goodwill to the extent the carrying value exceeds the implied value.
Stock Split: On May 14, 2013, the Company granted a stock dividend of 12.861519 shares of common stock for each share of common stock held as of that date, which was determined to be in substance a stock split for accounting and financial reporting purposes. All actual share, weighted-average share and per share amounts and all references to stock compensation data
88
Stonegate Mortgage Corporation
Notes to Consolidated Financial Statements
December 31, 2015
and prices of the Company’s common stock have been adjusted to reflect this stock split for all periods presented.
Stock-Based Compensation: The Company grants stock options and restricted stock units to certain executive officers, key employees and independent directors. Stock options have been granted for a fixed number of shares with an exercise price at least equal to the fair value of the shares at the date of grant. Restricted stock units have been granted for a fixed number of shares with a fair value equal to the fair value of the Company's common stock on the grant date. The stock options and restricted stock units granted are recognized as compensation expense in the statement of operations based on their grant-date fair values.
Advertising and Marketing: The Company uses primarily print, broadcast and web-based advertising and marketing to promote its products. These expenses also include purchased leads of mortgage loans related to our retail channel and are expensed as incurred. Advertising and marketing expenses related to continuing operations totaled $2,067, $2,347 and $2,317 for the years ended December 31, 2015, 2014 and 2013. Advertising and marketing expenses related to discontinued operations totaled $1,148, $869 and $0 for the years ended December 31, 2015, 2014 and 2013.
Income Taxes: Income taxes are accounted for under the asset and liability method. Deferred tax assets and liabilities are recognized for the future tax consequences attributable to differences between the financial statement carrying amounts of existing assets and liabilities and their respective tax bases and operating loss and tax credit carryforwards. Deferred tax assets and liabilities are measured using enacted tax rates expected to apply to taxable income in the years in which those temporary differences are expected to be recovered or settled. The effect on deferred tax assets and liabilities of a change in tax rates is recognized in earnings in the period that includes the enactment date. A valuation allowance is provided when it is more likely than not that some portion or all of a deferred tax asset will not be realized. The Company recorded a valuation allowance in the amount of $1,554 as of December 31, 2015 related to its continuing operations. No valuation allowance was recorded as of December 31, 2014. The Company recognizes the effect of income tax positions only if those positions are more likely than not of being sustained. Recognized income tax positions are measured at the largest amount that is greater than 50% likely of being realized. Changes in recognition or measurement are reflected in the period in which the change in judgment occurs.
The Company’s income tax expense includes assessments related to uncertain tax positions taken or expected to be taken by the Company. ASC 740-10, Income Taxes, requires financial statement recognition of the impact of a tax position if a position is more likely than not of being sustained on audit, based on the technical merits of the position. Management assesses this as facts and circumstances related to the Company's business and operations change in a period. If applicable, the Company will recognize interest and penalties related to unrecognized tax benefits as a component of income tax expense. The open tax years subject to examination by taxing authorities include the years ended December 31, 2014, 2013, and 2012. The Company had no federal or state tax examinations in process as of December 31, 2015.
Cash and Cash Equivalents: The Company classifies cash and temporary investments with original maturities of three months or less as cash and cash equivalents. The Company typically maintains cash in financial institutions in excess of FDIC limits. The Company evaluates the creditworthiness of these financial institutions in determining the risk associated with these cash balances.
Restricted Cash: The Company maintains certain cash balances that are restricted under broker margin account agreements associated with its derivative activities. Additionally, certain funding received for the repurchase of eligible loans from GNMA, as discussed above, is reflected as restricted cash on the consolidated balance sheets until such repurchases are made.
Recent Accounting Developments: ASU No. 2014-08, "Reporting Discontinued Operations and Disclosures of Disposals of Components of an Entity" was issued in April 2014. Under the new guidance, only disposals of a component of an entity that represent a major strategic shift on an entity's operations and financial results shall be reported in discontinued operations. The guidance also requires the presentation as discontinued operations for an entity that, on acquisition, meets the criteria to be classified as held for sale. In addition, the update expands disclosures for discontinued operations, requires new disclosures regarding disposals of an individually significant component of an entity that does not qualify for discontinued operations presentation and expands disclosures about an entity's significant continuing involvement with a discontinued operations. The updated requires the Company to apply the amendments prospectively to all components of an entity that are disposed of or classified as held for sale and to all businesses that, on acquisitions, are classified as held for sale within interim and annual periods beginning on or after December 15, 2014. The adoption of this new guidance is reflected within the Company's operations and financial results as described in the "Prior period classifications" discussion above.
ASU No. 2015-02, "Consolidation (Topic 810) - Amendments to the Consolidation Analysis" was issued in February 2015. This update affects reporting entities that are required to evaluate whether they should consolidate certain legal entities. The amendments in this update affect the following areas: 1) limited partnerships and similar legal entities, 2) evaluating fees
89
Stonegate Mortgage Corporation
Notes to Consolidated Financial Statements
December 31, 2015
paid to a decision maker or a service provider as a variable interest, 3) the effect of fee arrangements on the primary beneficiary determination, 4) the effect of related parties on the primary beneficiary determination, and 5) certain investment funds. The new guidance will be effective for the Company beginning on January 1, 2016. The Company does not expect the adoption of the new guidance to have a material impact on its financial statements.
ASU No. 2015-03 "Interest - Imputation of Interest (Subtopic 835-30): Simplifying the Presentation of Debt Issuance
Costs" was issued in April 2015. This update is to simplify presentation of debt issuance costs and requires debt issuance costs
related to a recognized debt liability to be presented in the balance sheet as a direct deduction from the carrying amount of the debt liability, consistent with debt discounts. The new guidance will be effective for the Company beginning on January 1,
2016. The Company does not expect the adoption of the new guidance to have a material impact on its financial statements.
ASU No. 2015-05 "Intangibles - Goodwill and Other - Internal Use Software (Topic 350-40): "Customer's Accounting
for Fees Paid in a Cloud Computing Arrangement" was issued in April 2015. This update provides guidance to customers
about whether a cloud computing arrangement includes a software license and how to account for it. The new guidance will be
effective for the Company beginning on January 1, 2016. The Company is evaluating the impact of the adoption of the new guidance on its financial statements.
ASU No. 2015-14 "Revenue from Contracts with Customers (Topic 606): Deferral of the Effective Date" was issued in
August 2015. This update extends the effective date of ASU 2014-09 by one year. ASU 2014-09 supersedes the revenue recognition criteria and amends existing requirements in other Topics to be consistent with the new recognition and measurement rules. The update is to ensure that an entity is recognizing revenue to depict the transfer of promised goods or services to customers in an amount that reflects the consideration to which the entity expects to be entitled in exchange for those goods or services. The new guidance will be effective for the Company beginning on January 1, 2018. The Company does not expect the adoption of the new guidance to have a material impact on its consolidated financial statements.
ASU No. 2015-16 "Business Combinations (Topic 805): Simplifying the Accounting for Measurement-Period
Adjustments" was issued in September 2015. This update requires that an acquirer 1) recognize adjustments to provisional
amounts that are identified during the measurement period in the reporting period in which the adjustment amounts are
determined, 2) record, in the same period's financial statements, the effect on earnings of changes in depreciation, amortization
or other income effects, if any, as a result of the change to the provisional amounts calculated as if the accounting had been
completed at the acquisition date, and 3) present separately on the face of the income statement or disclose in the notes the
portion of the amount recorded in current period earnings by the line item that would have been recorded in previous reporting
periods if the adjustment to the provisional amounts had been recognized as of the acquisition date. The new guidance will be
effective for the Company beginning on January 1, 2016. The Company does not expect the adoption of the new guidance to
have a material impact on its consolidated financial statements.
ASU No. 2016-01 "Financial Instruments - Overall (Subtopic 825-10): Recognition and measurement of financial assets and financial liabilities" was issued in January 2016. The amendments in this update require an entity to: (i) measure equity investments at fair value through net income, with certain exceptions; (ii) present in other comprehensive income the changes in instrument-specific credit risk for financial liabilities measured using the fair value option; (iii) present financial assets and financial liabilities by measurement category and form of financial asset; (iv) calculate the fair value of financial instruments for disclosure purposes based on an exit price and; (v) assess a valuation allowance on deferred tax assets related to unrealized losses of available for sale debt securities in combination with other deferred tax assets. The update provides an election to subsequently measure certain non-marketable equity investments at cost less any impairment and adjusted for certain observable price changes. The update also requires a qualitative impairment assessment of such equity investments and amends certain fair value disclosure requirements. The new guidance will be effective for the Company beginning on January 1, 2018. The Company does not expect the adoption of the new guidance to have a material impact on its consolidated financial statements.
ASU 2016-02, "Leases (Topic 842)" was issued in February 2016. This update amends various aspects of existing guidance for leases and requires additional disclosures about leasing arrangements. It will require companies to recognize lease assets and lease liabilities by lessees for those leases classified as operating leases under previous GAAP. Topic 842 retains a distinction between finance leases and operating leases. The classification criteria for distinguishing between finance leases and operating leases are substantially similar to the classification criteria for distinguishing between capital leases and operating leases in the previous leases guidance. The new guidance will be effective for the Company beginning on January 1, 2019 and earlier adoption is permitted. The Company is evaluating the impact of the adoption of the new guidance on its financial statements.
90
Stonegate Mortgage Corporation
Notes to Consolidated Financial Statements
December 31, 2015
3. Discontinued Operations
In September 2015, the Company made the decision to dispose of certain retail branches, or components of its Originations segment, either by sale or closure to better manage the expenses associated with retail originations. The Company completed the closure of sixty-two of its retail branches as of December 31, 2015. Additionally, on October 29, 2015, the Company sold to an unrelated third party certain assets associated with fourteen retail branches, for proceeds of $259. Under the new guidance of Accounting Standards Update ("ASU") No. 2014-08, the Company determined that the disposal of these retail branches represented a major strategic shift in its operations and, therefore, should be presented and disclosed as discontinued operations.
The results of discontinued operations are summarized below:
Years Ended December 31, | |||||||
2015 | 2014 | ||||||
Total revenues | $ | 34,371 | $ | 27,580 | |||
Total expenses | 44,069 | 36,328 | |||||
Income before income taxes | (9,698 | ) | (8,748 | ) | |||
Income tax expense | (3,669 | ) | (3,497 | ) | |||
Income from discontinued operations, net of tax | $ | (6,029 | ) | $ | (5,251 | ) | |
There were no results of discontinued operations for the year ended December 31, 2013, as the retail branches sold or disposed of were not established until 2014 and beyond. Total expenses for the year ended December 31, 2015 includes impairment charges, based on estimated future recoverable amounts related to the associated assets, of approximately $1,009, early termination contractual charges of $1,144 and the write off of certain guaranteed incentive payments for $782.
In connection with the sale, the Company is entitled to a contingent consideration, which payment is contingent upon the buyer's ability to close mortgage loans in the pipeline but unlocked by the Company prior to the sale date. If such loans are closed by the buyer, the Company will receive from the buyer two annual payments equal to a multiple of this actual total mortgage loan volume of the buyer. Due to the uncertainty regarding the amount and timing of these payments, the Company considers this payment a gain contingency and has not recognized any amounts in its consolidated financial statements as of December 31, 2015.
The carrying amounts of major classes of assets and liabilities related to discontinued operations consisted of the following:
December 31, 2015 | December 31, 2014 | ||||||
ASSETS | |||||||
Restricted cash | $ | 64 | $ | 358 | |||
Mortgage loans held for sale, at fair value | 25,884 | 101,164 | |||||
Derivative assets | 163 | 1,208 | |||||
Property and equipment, net | — | 1,328 | |||||
Other assets | 1,037 | 2,389 | |||||
Total assets related to discontinued operations | $ | 27,148 | $ | 106,447 | |||
LIABILITIES | |||||||
Secured borrowings - mortgage loans | $ | 19,665 | $ | 49,163 | |||
Mortgage repurchase borrowings | 6,359 | 44,677 | |||||
Accounts payable and accrued expenses | 2,014 | 4,723 | |||||
Derivative liabilities | 16 | 694 | |||||
Reserve for mortgage repurchases and indemnifications | 257 | 315 | |||||
91
Stonegate Mortgage Corporation
Notes to Consolidated Financial Statements
December 31, 2015
Other liabilities | 97 | 260 | |||||
Total liabilities related to discontinued operations | $ | 28,408 | $ | 99,832 | |||
Cash flows from discontinued operations related to depreciation expense were $855 and $187 for the years ended December 31, 2015 and 2014, respectively. Capital expenditures paid related to discontinued operations were $760 and $1,515 for the years ended December 31, 2015 and 2014, respectively.
4. (Loss) Earnings Per Share
The following is a reconciliation of net (loss) income attributable to common stockholders and a table summarizing the basic and diluted (loss) earnings per share calculations for the years ended December 31, 2015, 2014 and 2013:
Years Ended December 31, | |||||||||||
2015 | 2014 | 2013 | |||||||||
Net (loss) income: | |||||||||||
(Loss) income from continuing operations, net of tax | $ | (16,241 | ) | $ | (25,428 | ) | $ | 22,598 | |||
Less: Preferred stock dividends | — | — | (27 | ) | |||||||
(Loss) income from continuing operations attributable to common stockholders | $ | (16,241 | ) | $ | (25,428 | ) | $ | 22,571 | |||
(Loss) income from discontinued operations, net of tax | (6,029 | ) | (5,251 | ) | — | ||||||
Net (loss) income attributable to common stockholders | $ | (22,270 | ) | $ | (30,679 | ) | $ | 22,571 | |||
Weighted average shares outstanding (in thousands): | |||||||||||
Denominator for basic (loss) earnings per share – weighted average common shares outstanding | 25,783 | 25,770 | 14,062 | ||||||||
Effect of dilutive shares—employee and director stock options, restricted stock units, warrants and convertible preferred stock | — | — | 3,051 | ||||||||
Denominator for diluted (loss) earnings per share | 25,783 | 25,770 | 17,113 | ||||||||
Basic (loss) earnings per share: | |||||||||||
From continuing operations | $ | (0.63 | ) | $ | (0.99 | ) | $ | 1.61 | |||
From discontinued operations | $ | (0.23 | ) | $ | (0.20 | ) | $ | — | |||
Total attributable to common stockholders | $ | (0.86 | ) | $ | (1.19 | ) | $ | 1.61 | |||
Diluted (loss) earnings per share: | |||||||||||
From continuing operations | $ | (0.63 | ) | $ | (0.99 | ) | $ | 1.32 | |||
From discontinued operations | $ | (0.23 | ) | $ | (0.20 | ) | $ | — | |||
Total attributable to common stockholders | $ | (0.86 | ) | $ | (1.19 | ) | $ | 1.32 | |||
During the years ended December 31, 2015, 2014 and 2013 weighted average shares of 1,471,920, 1,818,049 and 1,812,354, respectively, were excluded from the denominator for diluted (loss) earnings per share because the shares (which related to stock options, restricted stock units and stock warrants) were anti-dilutive.
5. Business Combinations
Acquisition of Medallion Mortgage Company
On February 4, 2014, the Company completed its acquisition of Medallion Mortgage Company ("Medallion"), a residential mortgage originator based in southern California. Medallion serviced customers with an extensive portfolio of residential real estate loan programs and had 10 offices along the southern and central coast of California, Utah and a new operations center in Ventura, California. In the acquisition of Medallion, the Company agreed to purchase certain assets, assume certain liabilities and offer employment to certain employees.
The acquisition of Medallion was accounted for as a business combination. The following table summarizes the total consideration transferred to acquire Medallion and the fair values of the assets acquired and liabilities assumed on the acquisition date:
92
Stonegate Mortgage Corporation
Notes to Consolidated Financial Statements
December 31, 2015
Consideration: | |||
Cash consideration | $ | 258 | |
Fair value of contingent consideration | 603 | ||
Total consideration | 861 | ||
Fair value of net assets acquired: | |||
Property and equipment | 190 | ||
Other assets | 94 | ||
Accounts payable and accrued expenses | (50 | ) | |
Total fair value of net assets acquired | 234 | ||
Goodwill | $ | 627 | |
Acquisition-related expenses 1 | $ | 49 | |
1 Legal and miscellaneous expenses classified as general and administrative expenses.
As part of the acquisition of Medallion, the Company agreed to pay Medallion's seller a contingent consideration, which payment is contingent upon Medallion achieving certain predetermined minimum mortgage loan origination goals during the two year period following the acquisition date (the "earnout"). If such goals were met by Medallion, the Company would pay the seller two annual payments equal to a multiple of the actual total mortgage loan volume of Medallion. The earn-out was uncapped in amount. The fair value of the earn-out was estimated to be approximately $603 as of the acquisition date and was estimated using a calibrated Monte-Carlo simulation. The fair value was primarily based on (i) the Company’s estimate of the mortgage loan origination volume of Medallion over the two year earn-out period, (ii) an asset volatility factor of 16.90% and (iii) a discount rate of 6.05%. The first of the two potential earn-out payments was determined to be $200 and was paid in April 2015. Based on the mortgage loan origination volume of Medallion during 2015, the Company will not need to pay the second of the two potential earn-out payments, as the predetermined minimum mortgage loan origination goals were not met. As such, a liability is no longer reflected on the consolidated balance sheets as of December 31, 2015.
Acquisition of Crossline Capital, Inc.
On December 19, 2013, the Company completed its acquisition of Crossline Capital, Inc. ("Crossline"), a California-based mortgage lender that originated, funded, and serviced residential mortgages. The acquisition of Crossline allowed the Company to increase its origination volume through geographic expansion. At the time of the acquisition, Crossline was licensed to originate mortgages in 20 states including Arizona, California, Colorado, Connecticut, Florida, Georgia, Idaho, Maryland, Massachusetts, New Hampshire, New Mexico, North Carolina, Ohio, Oregon, Pennsylvania, Rhode Island, Texas, Utah, Virginia and Washington, and was an approved FNMA Seller Servicer. In addition, it operated two national mortgage origination call centers in Lake Forest, CA and Scottsdale, AZ and also operated retail mortgage origination branches in seven other locations in Southern California.
The following table summarizes the total consideration transferred to acquire Crossline and the fair values of assets acquired and liabilities assumed on the acquisition date:
Consideration: | |||
Cash consideration | $ | 9,765 | |
Fair value of contingent consideration | 1,706 | ||
Total consideration | 11,471 | ||
Fair value of assets acquired: | |||
Cash and cash equivalents (including restricted cash) | 3,688 | ||
Mortgage loans held for sale | 28,394 | ||
Identified intangible assets | 2,204 | ||
MSRs | 344 | ||
Other assets | 2,333 | ||
Total fair value of assets acquired | 36,963 | ||
Fair value of liabilities assumed: | |||
Warehouse lines of credit | 27,454 | ||
Other liabilities | 1,676 | ||
Total fair value of liabilities assumed | 29,130 | ||
93
Stonegate Mortgage Corporation
Notes to Consolidated Financial Statements
December 31, 2015
Fair value of net assets acquired | 7,833 | ||
Goodwill | $ | 3,638 | |
Acquisition-related expenses | $ | 122 | |
As part of the acquisition of Crossline, the Company agreed to pay Crossline's seller a deferred purchase price, which payment was contingent upon the seller meeting certain conditions. The first contingent payment was conditional upon the following: during the six month period following the acquisition, the seller must sign letters of intent with at least two mortgage loan origination businesses who employ at least five licensed mortgage loan originators and whose total mortgage loan origination volume during the prior twelve month period was at least $50,000 in aggregate unpaid principal balance. If such conditions were met, the seller would be due a payment equal to a multiple of the actual total mortgage loan volume of Crossline during such six month period, not to exceed $500 (the "on-boarding payment"). The fair value of the on-boarding payment was estimated to be approximately $307 as of December 31, 2013 and was estimated by applying the income approach. The fair value was primarily based on (i) the Company’s estimate of the number of mortgage loan originators that will become employed by Stonegate and the expected mortgage loan origination volume over the six month on-boarding period and (ii) a discount rate of 6.50%.
In addition, the Company agreed to pay Crossline's seller a second contingent payment that was conditional upon Crossline achieving certain predetermined minimum mortgage loan origination goals during the two year period following the acquisition date (the "earnout"). If such goals were met by Crossline, the Company would pay the seller quarterly payments equal to a multiple of the actual total mortgage loan volume of Crossline. The earnout was uncapped in amount. The fair value of the earnout was estimated to be approximately $1,399 as of December 31, 2013 and was estimated using a calibrated Monte-Carlo simulation. The fair value was primarily based on (i) the Company’s estimate of the mortgage loan origination volume of Crossline over the two year earnout period, (ii) an asset volatility factor of 18.70% and (iii) a discount rate of 6.50%.
Effective September 30, 2014, the Company amended the agreement governing the earn-out provisions related to the acquisition of Crossline. As a result of the amendment, the remaining earn-out amount to be paid to the original seller was fixed and was no longer contingent. During the year ended December 31, 2014, the Company paid the seller $1,094 in contingent earn-out payments. The remaining payment of $722 was paid in February 2015.
Of the $2,204 of total acquired intangible assets, $380 was assigned to a non-compete agreement with the seller of Crossline, which has an estimated life of three years, and $104 was assigned to state licenses, which had an estimated life of one year. The trade name was assigned $1,720, which was assigned an estimated life of four years. Given the formation of Stonegate Direct in October 2014, which was integrated through the call center operations of Crossline, the Company determined there was a significant change in the manner in which the Crossline trade name was used and as a result determined the change to be a triggering event for an impairment analysis to be performed in accordance with the guidance of long-lived assets. As of December 31, 2014, the Crossline trade name had no carrying value on its Consolidated Balance Sheet. The Company did not recognize any amortization expense related to the definite-lived intangible assets acquired from Crossline during the year ended December 31, 2013 due to the short period of time the assets were held between the acquisition date (December 19, 2013) and December 31, 2013.
The excess of the aggregate consideration transferred over the fair value of the identified net assets acquired from both Medallion and Crossline resulted in tax-deductible goodwill of $4,265 as of December 31, 2015 and 2014. Goodwill recognized from the acquisition of Medallion primarily related to the expected future growth of Medallion's business. Goodwill recognized from the acquisition of Crossline primarily related to the expected future growth of Crossline's business and future economic benefits arising from expected synergies. The goodwill amounts were allocated to the Company's retail reporting unit within its Origination segment. Based on certain qualitative and quantitative assessments, the Company has noted no circumstances which would result in any impairment of this amount as of December 31, 2015.
6. Derivative Financial Instruments
The Company does not designate any of its derivative financial instruments as hedges for accounting purposes. The following summarizes the Company’s outstanding derivative instruments as of December 31, 2015 and 2014:
94
Stonegate Mortgage Corporation
Notes to Consolidated Financial Statements
December 31, 2015
December 31, 2015: | Fair Value | ||||||||||||
Notional | Balance Sheet Location | Asset | (Liability) | ||||||||||
Interest rate lock commitments | $ | 1,169,768 | Derivative assets/liabilities | $ | 10,596 | $ | (334 | ) | |||||
MBS forward sales contracts | 1,705,995 | ||||||||||||
MBS forward purchase contracts | 522,800 | ||||||||||||
Total MBS forward trades | 2,228,795 | Derivative assets/liabilities | 1,564 | (2,183 | ) | ||||||||
Total derivative financial instruments | $ | 3,398,563 | $ | 12,160 | $ | (2,517 | ) | ||||||
December 31, 2014: | Fair Value | ||||||||||||
Notional | Balance Sheet Location | Asset | (Liability) | ||||||||||
Interest rate lock commitments | $ | 1,211,675 | Derivative assets/liabilities | $ | 12,300 | $ | (96 | ) | |||||
MBS forward sales contracts | 1,860,768 | ||||||||||||
MBS forward purchase contracts | 457,481 | ||||||||||||
Total MBS forward trades | 2,318,249 | Derivative assets/liabilities | 260 | (8,948 | ) | ||||||||
Total derivative financial instruments | $ | 3,529,924 | $ | 12,560 | $ | (9,044 | ) | ||||||
The following summarizes the effect of the Company’s derivative financial instruments and related changes in estimated fair value of mortgage loans held for sale on its consolidated statements of operations for the years ended December 31, 2015, 2014 and 2013:
Years Ended December 31, | |||||||||||
2015 | 2014 | 2013 | |||||||||
Interest rate lock commitments | $ | (1,942 | ) | $ | 10,945 | $ | (10,729 | ) | |||
MBS forward trades | 8,069 | (23,581 | ) | 16,680 | |||||||
Net derivative gains (losses) | 6,127 | (12,636 | ) | 5,951 | |||||||
(Losses) gains from changes in estimated fair value of mortgage loans held for sale1 | (13,005 | ) | 21,454 | (6,625 | ) | ||||||
$ | (6,878 | ) | $ | 8,818 | $ | (674 | ) | ||||
1 Mortgage loans held for sale are carried at estimated fair value pursuant to the fair value option. Gains (losses) from changes in estimated fair values are included within “Gains on mortgage loans held for sale, net” on the Company’s consolidated statements of operations. This information is presented here due to its correlation with the changes in value of our derivative financial statements.
The Company has exposure to credit loss in the event of contractual non-performance by its trading counterparties and counterparties to the over-the-counter derivative financial instruments that the Company uses in its interest rate risk management activities. The Company manages this credit risk by selecting only counterparties that the Company believes to be financially strong, spreading the credit risk among many such counterparties, by placing contractual limits on the amount of unsecured credit extended to any single counterparty and by entering into netting agreements with the counterparties, as appropriate.
The Company has entered into agreements with derivative counterparties, a portion of which include netting arrangements whereby the counterparties are entitled to settle their positions on a net basis. However, with respect to this portion of its derivatives, the Company presents such amounts on a gross basis as shown in the table above. In certain circumstances, the Company is required to provide certain derivative counterparties collateral against derivative financial instruments. As of December 31, 2015 and 2014, counterparties held $4,045 and $4,482, respectively, of the Company’s cash and cash equivalents in margin accounts as collateral (which is classified as "Restricted cash" on the Company's consolidated balance sheets), after which the Company was in a net credit gain position of $3,426 and a net credit loss position of $4,562 at December 31, 2015 and 2014, respectively, to those counterparties. For the years ended December 31, 2015 and 2014, the Company incurred no credit losses due to non-performance of any of its counterparties.
7. Mortgage Loans Held for Sale, at Fair Value
The following summarizes mortgage loans held for sale at fair value as of December 31, 2015 and December 31, 2014:
95
Stonegate Mortgage Corporation
Notes to Consolidated Financial Statements
December 31, 2015
December 31, 2015 | December 31, 2014 | ||||||
Conventional 1 | $ | 230,438 | $ | 507,297 | |||
Government insured 2 | 357,442 | 444,955 | |||||
Non-agency/Other | 57,816 | 96,095 | |||||
Total mortgage loans held for sale, at fair value | $ | 645,696 | $ | 1,048,347 | |||
1 Conventional includes FNMA and FHLMC mortgage loans, as well as mortgage loans to various housing agencies.
2 Government insured includes GNMA mortgage loans. GNMA portfolio balance is made up of Federal Housing Administration ("FHA"), Veterans Affairs ("VA"), and United States Department of Agricultural ("USDA") home loans, as well as mortgage loans to various housing agencies.
Under certain of the Company’s mortgage funding arrangements (including secured borrowings and warehouse lines of credit), the Company is required to pledge mortgage loans as collateral to secure borrowings. The mortgage loans pledged as collateral must equal at least 100% of the related outstanding borrowings under the mortgage funding arrangements. The outstanding borrowings are monitored and the Company is required to deliver additional collateral if the amount of the outstanding borrowings exceeds the fair value of the pledged mortgage loans. As of December 31, 2015, the Company had pledged $611,926 in fair value of mortgage loans held for sale as collateral to secure debt under its mortgage funding arrangements, with the remaining $33,770 of mortgage loans held for sale funded with the Company’s excess cash. As of December 31, 2014, the Company had pledged $981,015 in fair value of mortgage loans held for sale as collateral to secure debt under its mortgage funding arrangements, with the remaining $67,332 of mortgage loans held for sale funded with the Company's excess cash. The mortgage loans held as collateral by the respective lenders are restricted solely to satisfy the Company’s borrowings under those mortgage funding arrangements. Refer to Note 14 “Debt” for additional information related to the Company’s outstanding borrowings as of December 31, 2015 and December 31, 2014.
Mortgage loans held for sale are carried at estimated fair value pursuant to the fair value option. Unrealized gains and losses from changes in estimated fair values are included within "Gains on mortgage loans held for sale, net" on the Company's consolidated statements of operations and amounted to a loss of $13,005, a gain of $21,454 and a loss of $6,625, respectively, for the years ended December 31, 2015, 2014 and 2013.
The following are the fair values and related UPB due upon maturity for loans held for sale accounted under the fair
value method as of December 31, 2015 and December 31, 2014:
December 31, 2015 | December 31, 2014 | ||||||||||||||
Fair Value | UPB | Fair Value | UPB | ||||||||||||
Current through 89 days delinquent | $ | 603,778 | $ | 601,499 | $ | 1,044,005 | $ | 1,025,374 | |||||||
90 or more days delinquent1 | 41,918 | 42,918 | 4,342 | 5,342 | |||||||||||
Total | $ | 645,696 | $ | 644,417 | $ | 1,048,347 | $ | 1,030,716 | |||||||
1 Includes $34,540 and $35,547 in fair value and related UPB, respectively, of eligible loans repurchased out of GNMA pools, as described in Note 9 - Fair Value Measurements, for the period ended December 31, 2015.
8. Mortgage Servicing Rights
The Company sells residential mortgage loans in the secondary market and typically retains the right to service the loans sold. Upon sale, the MSRs are capitalized as an asset, which represents the current fair value of the future net cash flows that are expected to be realized for performing the servicing activities. The Company may also purchase MSRs directly from third parties.
The Company’s total mortgage servicing portfolio as of December 31, 2015 and December 31, 2014 is summarized as follows (based on the unpaid principal balance ("UPB") of the underlying mortgage loans):
December 31, 2015 | December 31, 2014 | ||||||
FNMA | $ | 5,468,904 | $ | 5,797,883 | |||
GNMA: | |||||||
FHA | 3,990,276 | 5,365,627 | |||||
VA | 2,731,822 | 2,652,678 | |||||
96
Stonegate Mortgage Corporation
Notes to Consolidated Financial Statements
December 31, 2015
USDA | 805,783 | 974,501 | |||||
FHLMC | 4,449,796 | 3,500,321 | |||||
Other investors | 74,150 | 45,735 | |||||
Total mortgage servicing portfolio | $ | 17,520,731 | $ | 18,336,745 | |||
MSRs balance | $ | 199,637 | $ | 204,216 | |||
MSRs balance as a percentage of total mortgage servicing portfolio | 1.14 | % | 1.11 | % | |||
At December 31, 2015 and December 31, 2014, the Company held $342,474 and $380,576 of escrow funds in custodial bank accounts for its customers for which it services mortgage loans.
A summary of the changes in the balance of MSRs for the years ended December 31, 2015, 2014 and 2013 is as follows:
Years Ended December 31, | |||||||||||
2015 | 2014 | 2013 | |||||||||
Balance at beginning of period | $ | 204,216 | $ | 170,294 | $ | 42,202 | |||||
MSRs originated in connection with loan sales | 157,749 | 157,264 | 111,783 | ||||||||
MSRs sold and derecognized | (97,524 | ) | (44,692 | ) | — | ||||||
Purchased MSRs | 86 | 2,009 | 1,543 | ||||||||
MSRs acquired in a business combination | — | — | 344 | ||||||||
Changes in valuation inputs and assumptions1 | (23,361 | ) | (56,924 | ) | 22,967 | ||||||
Actual portfolio runoff (payoffs and principal amortization) | (41,529 | ) | (23,735 | ) | (8,545 | ) | |||||
Balance at end of period | $ | 199,637 | $ | 204,216 | $ | 170,294 | |||||
1 Represents the unrealized portion of the "Changes in mortgage servicing rights valuation" on the Company's consolidated statements of
operations. The Company realized a loss of $7,034 and a gain of $1,082 related to its MSRs sales for the years ended December 31, 2015 and 2014, respectively. There were no MSRs sales during the year ended December 31, 2013.
During 2014, the Company completed two bulk sales of MSRs, in the amount of $3.8 billion of UPB in underlying FNMA loans to an unrelated third party. These pools of FNMA MSRs were somewhat geographically focused, had average mortgage interest rates that were less than current mortgage interest rates, and did not include any GNMA or FHLMC MSRs, which have a different valuation than FNMA MSRs. Thus, the characteristics of the pools did not represent the characteristics of the Company’s MSRs portfolio as a whole.
On March 31, 2015, the Company completed a sale of MSRs with a UPB of $2.7 billion in FNMA and FHLMC loans to an unrelated party. This pool of MSRs was somewhat geographically focused, had average mortgage interest rates that were different than current mortgage rates, and did not include any GNMA MSRs, which have a different historical performance than FNMA and FHLMC MSRs.
On April 30, 2015, September 30, 2015 and December 31, 2015, in separate transactions, the Company completed sales of MSRs with an underlying UPB of $1.9 billion, $1.5 billion and $2.0 billion, respectively, in GNMA loans to an unrelated party. These pools of MSRs did not include any FNMA or FHLMC MSRs, which have a different historical performance than GNMA MSRs. Thus, the characteristics of each sold pool do not represent the characteristics of the Company’s MSRs portfolio as a whole.
Also on September 30, 2015, the Company entered into a flow sale agreement for the sale of MSRs in $0.7 billion in GNMA loans to an unrelated party. The sales occurred monthly during the covered period, from September 2015 through December 2015. The characteristics of the pools sold are similar to those associated with the Company's current GNMA production.
The Company performs temporary sub-servicing activities with respect to the pools of underlying loans described
above through the established loan file transfer dates of each sale for a fee, during which time the Company is entitled to certain
other ancillary income amounts. The Company uses the proceeds to reinvest back into newly originated MSRs through its
origination platform. Each of these MSRs sale transactions met the criteria for derecognition as of their respective sale dates,
allowing for the MSRs assets to be derecognized and a gain or loss to be recorded at the time of derecognition, based on the
97
Stonegate Mortgage Corporation
Notes to Consolidated Financial Statements
December 31, 2015
respective fair values of the MSRs sold as of the closing dates. The recognized gains or losses were recorded net of direct transaction expenses and estimated protection provisions.
The following table sets forth information related to outstanding loans sold as of December 31, 2015 and
December 31, 2014 for which the Company has continuing involvement:
December 31, 2015 | December 31, 2014 | ||||||
Total unpaid principal balance | $ | 17,520,731 | $ | 18,336,745 | |||
Loans 30-89 days delinquent | $ | 307,736 | $ | 379,881 | |||
Loans delinquent 90 or more days or in foreclosure | $ | 114,298 | $ | 127,751 | |||
The key weighted average assumptions (or range of assumptions), based on market participant inputs for the industry,
used in determining the fair value of the Company’s MSRs as of December 31, 2015 and December 31, 2014 are as follows:
December 31, 2015 | December 31, 2014 | ||
Discount rates | 9.25% - 11.00% | 9.25% - 11.00% | |
Annual prepayment speeds (by investor type): | |||
FNMA | 13.0% | 13.9% | |
GNMA: | |||
FHA | 11.5% | 11.2% | |
VA | 8.8% | 10.1% | |
USDA | 10.5% | 11.8% | |
FHLMC | 11.6% | 13.1% | |
Other investors | 12.4% | 12.4% | |
Cost of servicing (per loan) | $85 | $83 | |
MSRs are generally subject to loss in value when mortgage rates decrease. Decreasing mortgage rates normally
encourage increased mortgage refinancing activity. Increased refinancing activity reduces the life of the loans underlying the
MSRs, thereby reducing MSRs value. Reductions in the value of MSRs affect income through changes in fair value. These
factors have been considered in the estimated prepayment speed assumptions used to determine the fair value of the Company’s
MSRs.
In addition to the assumptions provided above, the Company uses assumptions for delinquency rates in determining
the fair value of MSRs. These assumptions are based primarily on internal estimates, and the Company also obtains third party
data, where applicable, to assess the reasonableness of its internal assumptions. The Company's assumptions for delinquency rates for FNMA, GNMA, FHLMC and Other Investors mortgage loans as of December 31, 2015 and December 31, 2014 are as
follows:
December 31, 2015 | December 31, 2014 | ||
FNMA | 4.01% | 3.93% | |
GNMA: | |||
FHA | 6.58% | 6.42% | |
VA | 6.52% | 6.31% | |
USDA | 6.53% | 6.29% | |
FHLMC | 3.94% | 3.80% | |
Other investors | 6.37% | 6.14% | |
The delinquency rates represent the Company’s estimate of the loans that will eventually enter delinquency over the
entire term of the portfolio’s life. These assumptions affect the future cost to service loans, future revenue earned from the
portfolio and future assumed foreclosure losses. Because the Company’s portfolio is generally comprised of recent vintages,
actual future delinquencies may differ from the Company’s assumptions.
The hypothetical effect of an adverse change in these key assumptions would result in a decrease in the fair values of
98
Stonegate Mortgage Corporation
Notes to Consolidated Financial Statements
December 31, 2015
MSRs as follows as of December 31, 2015 and December 31, 2014:
December 31, 2015 | % of Average Portfolio | December 31, 2014 | % of Average Portfolio | ||||||||||
Discount rates: | |||||||||||||
Impact of discount rate + 1% | $ | (8,578 | ) | 4 | % | $ | (8,345 | ) | 4 | % | |||
Impact of discount rate + 2% | $ | (16,470 | ) | 8 | % | $ | (16,063 | ) | 8 | % | |||
Impact of discount rate + 3% | $ | (23,753 | ) | 12 | % | $ | (23,222 | ) | 11 | % | |||
Prepayment speeds: | |||||||||||||
Impact of prepayment speed * 105% | $ | (5,502 | ) | 3 | % | $ | (5,445 | ) | 3 | % | |||
Impact of prepayment speed * 110% | $ | (10,792 | ) | 5 | % | $ | (10,668 | ) | 5 | % | |||
Impact of prepayment speed * 120% | $ | (20,778 | ) | 10 | % | $ | (20,508 | ) | 10 | % | |||
Cost of servicing: | |||||||||||||
Impact of cost of servicing * 105% | $ | (1,365 | ) | 1 | % | $ | (1,529 | ) | 1 | % | |||
Impact of cost of servicing * 110% | $ | (2,731 | ) | 1 | % | $ | (3,058 | ) | 1 | % | |||
Impact of cost of servicing * 120% | $ | (5,462 | ) | 3 | % | $ | (6,116 | ) | 3 | % | |||
As the table demonstrates, the Company’s methodology for estimating the fair value of MSRs is highly sensitive to
changes in assumptions. For example, actual prepayment experience may differ and any difference may have a material effect
on MSRs fair value. Changes in fair value resulting from changes in assumptions generally cannot be extrapolated because the
relationship of the change in assumption to the change in fair value may not be linear. Also, in this table, the effect of a
variation in a particular assumption on the fair value of the MSRs is calculated without changing any other assumption; in
reality, changes in one factor may be associated with changes in another (for example, decreases in market interest rates may
indicate higher prepayments; however, this may be partially offset by lower prepayments due to other factors such as a
borrower’s diminished opportunity to refinance), which may magnify or counteract the sensitivities. Thus, any measurement of
MSRs fair value is limited by the conditions existing and assumptions made as of a particular point in time. Those assumptions
may not be appropriate if they are applied to a different point in time.
Under certain of the Company's secured borrowing arrangements, the Company is required to pledge mortgage servicing rights as collateral to the secured borrowings. As of December 31, 2015 and December 31, 2014, the Company had pledged $199,007 and $203,811, respectively, in fair value of mortgage servicing rights as collateral to secure debt under certain of its secured borrowing arrangements. However, the financial institutions would be limited to selling the pledged MSRs to the amount needed to satisfy their respective debt, including any accrued but unpaid interest and fees, as applicable. As of December 31, 2015 and December 31, 2014, the outstanding borrowings secured by MSRs was $77,069 and $75,970, respectively. Refer to Note 14 “Debt” for additional information related to the Company’s outstanding borrowings as of December 31, 2015 and December 31, 2014.
The following is a summary of the components of loan servicing fees as reported in the Company’s consolidated statements of operations for the years ended December 31, 2015, 2014 and 2013:
Years Ended December 31, | |||||||||||
2015 | 2014 | 2013 | |||||||||
Contractual servicing fees | $ | 51,775 | $ | 42,429 | $ | 21,656 | |||||
Late fees | 2,997 | 1,978 | 548 | ||||||||
Loan servicing fees | $ | 54,772 | $ | 44,407 | $ | 22,204 | |||||
Servicing fees as a percentage of average portfolio (annualized) | 0.30 | % | 0.28 | % | 0.27 | % | |||||
9. Fair Value Measurements
The Company uses fair value measurements in fair value disclosures and to record certain assets and liabilities at fair value on a recurring basis, such as mortgage loans held for sale, derivative financial instruments, MSRs and loans eligible for repurchase from GNMA, or on a nonrecurring basis, such as when measuring intangible assets and long-lived assets. The Company has elected fair value accounting for loans held for sale to more closely align the Company’s accounting with its interest rate risk strategies without having to apply the operational complexities of hedge accounting.
99
Stonegate Mortgage Corporation
Notes to Consolidated Financial Statements
December 31, 2015
The Company groups its assets and liabilities at fair value in three levels, based on the markets in which the assets and liabilities are traded and the reliability of the assumptions used to determine fair value. These levels are:
Level Input: | Input Definition: |
Level 1 | Unadjusted, quoted prices in active markets for identical assets or liabilities. |
Level 2 | Prices determined using other significant observable inputs. Observable inputs are inputs that other market participants would use in pricing an asset or liability and are developed based on market data obtained from sources independent of the Company. These may include quoted prices for similar assets and liabilities, interest rates, prepayment speeds, credit risk and others. |
Level 3 | Prices determined using significant unobservable inputs. In situations where quoted prices or observable inputs are unavailable (for example, when there is little or no market activity), unobservable inputs may be used. Unobservable inputs reflect the Company's own assumptions about the factors that market participants would use in pricing the asset or liability, and are based on the best information available in the circumstances. |
An asset or liability’s level within the fair value hierarchy is based on the lowest level of input that is significant to the fair value measurement.
While the Company believes its valuation methods are appropriate and consistent with those used by other market participants, the use of different methods or assumptions to estimate the fair value of certain financial statement items could result in a different estimate of fair value at the reporting date. Those estimated values may differ significantly from the values that would have been used had a readily available market for such items existed, or had such items been liquidated, and those differences could be material to the consolidated financial statements.
Management incorporates lack of liquidity into its fair value estimates based on the type of asset or liability measured and the valuation method used. The Company uses discounted cash flow techniques to estimate fair value. These techniques incorporate forecasting of expected cash flows discounted at appropriate market discount rates that are intended to reflect the lack of liquidity in the market.
The following describes the methods used in estimating the fair values of certain financial statement items:
Mortgage Loans Held for Sale: The majority of the Company's mortgage loans held for sale at fair value are saleable
into the secondary mortgage markets and their fair values are estimated using observable quoted market or contracted prices or
market price equivalents, which would be used by other market participants. These saleable loans are considered Level 2. A smaller portion of the Company's mortgage loans held for sale consist of 1) loans repurchased from the GSEs that have subsequently been deemed to be non-saleable to GSEs when certain representations and warranties are breached; and 2) loans actually repurchased from GNMA securities pursuant to the Company's unilateral right, as servicer, to repurchase such GNMA loans it had previously sold. The fair values of the loans repurchased from the GSEs are estimated using a discounted cash flow analysis with significant unobservable inputs, such as prepayment speeds, default rates, the spread between bid and ask prices and loss severities, which are identified as Level 3 inputs. Loans repurchased from GNMA pools are estimated in the manner described in the Loans Eligible for Repurchase from GNMA discussion below. These repurchased loans are also considered Level 3.
Derivative Financial Instruments: The Company estimates the fair value of interest rate lock commitments based on the value of the underlying mortgage loan, quoted MBS prices, estimates of the fair value of the MSRs and an estimate of the probability that the mortgage loan will fund within the terms of the interest rate lock commitment, net of commission expenses. The Company estimates the fair value of forward sales commitments based on quoted MBS prices. With respect to its IRLCs, management determined in the current period that a Level 3 classification was most appropriate based on the various significant unobservable inputs utilized in estimating the fair value of its IRLCs.
Mortgage Servicing Rights: The Company uses a discounted cash flow approach to estimate the fair value of MSRs. This approach consists of projecting servicing cash flows discounted at a rate that management believes market participants would use in their determinations of value. The Company obtains valuations from an independent third party on a monthly basis, to support the reasonableness of the fair value estimate generated by the internal model. The key assumptions used in the estimation of the fair value of MSRs include prepayment speeds, discount rates, default rates, cost to service, contractual servicing fees and escrow earnings. In valuing the fair value of MSRs, the Company uses a forward yield curve as an input
100
Stonegate Mortgage Corporation
Notes to Consolidated Financial Statements
December 31, 2015
which will impact pre-pay estimates and the value of escrows as compared to a static forward yield curve. The Company believes that the use of the forward yield curve better represents fair value of MSRs because the forward yield curve is the market’s expectation of future interest rates based on its expectation of inflation and other economic conditions.
Loans Eligible for Repurchase from GNMA: The Company uses a liquidation based discounted cash flow analysis to estimate the fair value of the assets and liabilities on the balance sheet for certain delinquent government guaranteed or insured mortgage loans from GNMA guaranteed pools in its servicing portfolio. The Company's right to purchase such loans arises as the result of the borrower's failure to make payments for at least 90 days preceding the month of repurchase by the Company and provides an alternative to the Company's obligation to continue advancing principal and interest at the coupon rate of the related GNMA security. The key assumptions used in the discounted cash flow analysis include the Company's historical ability to make the GNMA loan salable, by becoming current either through the borrower's performance or through completion of a modification of the loan's terms, and the Company's historical ability to receive insurance reimbursements for related claims filed.
The following are the major categories of assets and liabilities measured at fair value on a recurring basis as of December 31, 2015:
Level 1 | Level 2 | Level 3 | Total | ||||||||||||
Assets: | |||||||||||||||
Mortgage loans held for sale | $ | — | $ | 549,561 | $ | — | $ | 549,561 | |||||||
Mortgage loans held for sale - non-saleable to GSEs | — | — | 58,799 | 58,799 | |||||||||||
Mortgage loans held for sale - repurchased GNMA loans | — | — | 37,336 | 37,336 | |||||||||||
Derivative assets (IRLCs) | — | 10,596 | 10,596 | ||||||||||||
Derivative assets (MBS forward trades) | — | 1,564 | — | 1,564 | |||||||||||
MSRs | — | — | 199,637 | 199,637 | |||||||||||
Loans eligible for repurchase from GNMA | — | — | 80,794 | 80,794 | |||||||||||
Total assets | $ | — | $ | 551,125 | $ | 387,162 | $ | 938,287 | |||||||
Liabilities: | |||||||||||||||
Derivative liabilities (IRLCs) | $ | — | $ | — | $ | 334 | $ | 334 | |||||||
Derivative liabilities (MBS forward trades) | — | 2,183 | — | 2,183 | |||||||||||
Liability for loans eligible for repurchase from GNMA | — | — | 80,794 | 80,794 | |||||||||||
Total liabilities | $ | — | $ | 2,183 | $ | 81,128 | $ | 83,311 | |||||||
The following are the major categories of assets and liabilities measured at fair value on a recurring basis as of December 31, 2014:
Level 1 | Level 2 | Level 3 | Total | ||||||||||||
Assets: | |||||||||||||||
Mortgage loans held for sale | $ | — | $ | 1,048,347 | $ | — | $ | 1,048,347 | |||||||
Derivative assets (IRLCs) | — | 12,300 | — | 12,300 | |||||||||||
Derivative assets (MBS forward trades) | — | 260 | — | 260 | |||||||||||
MSRs | — | — | 204,216 | 204,216 | |||||||||||
Loans eligible for repurchase from GNMA | — | — | 109,397 | 109,397 | |||||||||||
Total assets | $ | — | $ | 1,060,907 | $ | 313,613 | $ | 1,374,520 | |||||||
Liabilities: | |||||||||||||||
Derivative liabilities (IRLCs) | $ | — | $ | 96 | $ | — | $ | 96 | |||||||
Derivative liabilities (MBS forward trades) | — | 8,948 | — | 8,948 | |||||||||||
Contingent earn-out liabilities | 722 | — | 2,283 | 3,005 | |||||||||||
Liability for loans eligible for repurchase from GNMA | — | — | 109,397 | 109,397 | |||||||||||
Total liabilities | $ | 722 | $ | 9,044 | $ | 111,680 | $ | 121,446 | |||||||
A reconciliation of the beginning and ending balances of the Company’s assets and liabilities classified within Level 3 of the valuation hierarchy for the year ended December 31, 2015 are as follows:
101
Stonegate Mortgage Corporation
Notes to Consolidated Financial Statements
December 31, 2015
Year Ended December 31, 2015 | ||||||||||||||||||
Mortgage Loans Held for Sale - non-saleable to GSEs | Mortgage Loans Held for Sale - Repurchased GNMA Loans | Derivative Assets | Derivative Liabilities | Loans eligible for repurchase from GNMA | Liability for loans eligible for repurchase from GNMA | |||||||||||||
Balance at beginning of period | $ | — | $ | — | $ | — | $ | — | $ | 109,397 | $ | 109,397 | ||||||
Changes in fair value recognized in earnings | (5,580 | ) | (1,089 | ) | — | — | (2,314 | ) | (2,314 | ) | ||||||||
Purchases | 45,688 | 40,209 | — | — | — | — | ||||||||||||
Sales | (5,581 | ) | (1,560 | ) | — | — | (40,209 | ) | (40,209 | ) | ||||||||
Issuances | — | — | — | — | — | — | ||||||||||||
Settlements | (19,750 | ) | (1,204 | ) | — | — | 13,920 | 13,920 | ||||||||||
Transfers into Level 31 | 45,308 | 1,286 | 10,596 | 334 | — | — | ||||||||||||
Transfers out of Level 32 | (1,286 | ) | (306 | ) | — | — | — | — | ||||||||||
Balance at end of period | $ | 58,799 | $ | 37,336 | $ | 10,596 | $ | 334 | $ | 80,794 | $ | 80,794 | ||||||
1 On an ongoing basis, for Mortgage Loans Held for Sale - measured at fair value, transfers into Level 3 represent those deemed unsaleable to GSEs in the current period. For Mortgage Loans Held for Sale - Repurchased GNMA Loans, transfers into Level 3 represent those purchased out of Loans Eligible for Repurchase from GNMA and the related liability, in the current period. For the Company's Derivative Financial Instruments, transfers into Level 3 represent interest rate lock commitments. Management determined in the current period that a Level 3 classification was most appropriate based on the various significant unobservable inputs utilized in estimating the fair value of its IRLCs. Transfers between levels are deemed to have occurred on the last day of the quarter in which a change in classification is determined.
2 On an ongoing basis, for Mortgage Loans Held for Sale - Repurchased GNMA Loans, transfers out of Level 3 represent those which the Company has made saleable. For Loans Eligible for Repurchase from GNMA, and the related liability, transfers out of Level 3 represent loans which have been repurchased in the current period.
Refer to Note 8, "Mortgage Servicing Rights", for a reconciliation of the beginning and ending balances for the years ended December 31, 2015, 2014 and 2013, as well as a discussion of significant observable inputs related to the Company's MSRs and relative ranges of those used in determining their fair value.
Fair Value of Other Financial Instruments
As of December 31, 2015 and December 31, 2014, all financial instruments were either recorded at fair value or the carrying value approximated fair value. For financial instruments that were not recorded at fair value, such as cash, restricted cash, servicing advances, subordinated loan receivable, short-term secured borrowings, warehouse and operating lines of credit, accounts payable and accrued expenses, their carrying values approximated fair value due to the short-term nature of such instruments. For our long-term secured borrowings not recorded at fair value, the carrying value approximated fair value due to the collateralization of such borrowings.
10. Property and Equipment
The following summarizes property and equipment as of December 31, 2015 and December 31, 2014:
December 31, 2015 | December 31, 2014 | ||||||
Internally developed computer software | $ | 20,774 | $ | 9,042 | |||
Purchased computer software and equipment | 7,991 | 7,511 | |||||
Furniture and office equipment | 5,287 | 5,994 | |||||
Leasehold improvements | 1,429 | 1,596 | |||||
Property and equipment, gross | 35,481 | 24,143 | |||||
Accumulated depreciation and amortization | (12,558 | ) | (7,096 | ) | |||
Property and equipment, net | $ | 22,923 | $ | 17,047 | |||
102
Stonegate Mortgage Corporation
Notes to Consolidated Financial Statements
December 31, 2015
Total depreciation and amortization expense from continuing operations related to property and equipment for the years ended December 31, 2015, 2014 and 2013 was $7,200, $4,028 and $1,849, respectively, which includes amortization expense related to internally developed software of $4,600, $1,668 and $449, respectively. Total depreciation and amortization expense from discontinued operations related to property and equipment for the years ended December 31, 2015, 2014 and 2013 was $1,148, $152 and $0, respectively, which includes amortization expense related to internally developed software of $738 for the year ended December 31, 2015. There was no amortization expense related to internally developed software for the years ended December 31, 2014 and 2013.
11. Goodwill and Other Intangible Assets
A summary of the change in the carrying amount of goodwill for the years ended December 31, 2015 and December 31, 2014 is as follows:
Goodwill | ||||
Balance at December 31, 2013 | $ | 3,638 | ||
Medallion business combination | 627 | |||
Balance at December 31, 2014 | $ | 4,265 | ||
Impairment charge | — | |||
Balance at December 31, 2015 | $ | 4,265 | ||
The Company performed its annual assessment of goodwill impairment during the fourth quarter. This assessment is performed more frequently if events and circumstances indicate that impairment may have occurred. The Company's goodwill is allocated to and tested at the Retail reporting unit level, a component of the Originations segment of the business, inclusive of the Company's retail direct and remaining retail distributed operations. No impairment was noted as a result of this analysis.
The Company's other intangible assets relate to its asset acquisition of NattyMac, LLC. in 2013 and acquisition of Crossline Capital, Inc. in 2014, as described in Note 5, "Business Combinations". The components of the Company's other intangible assets as of December 31, 2015 and December 31, 2014 are as follows:
December 31, 2015 | December 31, 2014 | ||||||||||||||||||||||||||||||
Gross Carrying Amount | Accumulated Amortization | Impairment Charges | Net Carrying Amount | Gross Carrying Amount | Accumulated Amortization | Impairment Charges | Net Carrying Amount | ||||||||||||||||||||||||
Finite-lived intangible assets: | |||||||||||||||||||||||||||||||
Trade name | $ | — | $ | — | $ | — | $ | — | $ | 1,720 | $ | (430 | ) | $ | (1,290 | ) | $ | — | |||||||||||||
Customer relationships | 2,350 | (979 | ) | — | 1,371 | 2,350 | (685 | ) | — | 1,665 | |||||||||||||||||||||
Non-compete agreement | 380 | (254 | ) | — | 126 | 380 | (127 | ) | — | 253 | |||||||||||||||||||||
Active agent list | 330 | (220 | ) | — | 110 | 330 | (153 | ) | — | 177 | |||||||||||||||||||||
State licenses | — | — | — | — | 104 | (104 | ) | — | — | ||||||||||||||||||||||
Total finite-lived intangible assets | $ | 3,060 | $ | (1,453 | ) | $ | — | $ | 1,607 | $ | 4,884 | $ | (1,499 | ) | $ | (1,290 | ) | $ | 2,095 | ||||||||||||
Indefinite-lived intangible assets: | |||||||||||||||||||||||||||||||
Trade name | $ | 1,030 | $ | — | $ | — | $ | 1,030 | $ | 1,030 | $ | — | $ | — | $ | 1,030 | |||||||||||||||
Total indefinite-lived intangible assets | 1,030 | — | — | 1,030 | 1,030 | — | — | 1,030 | |||||||||||||||||||||||
Total other intangible assets | $ | 4,090 | $ | (1,453 | ) | $ | — | $ | 2,637 | $ | 5,914 | $ | (1,499 | ) | $ | (1,290 | ) | $ | 3,125 | ||||||||||||
Given the formation of Stonegate Direct in October 2014, which was integrated through the call center operations of Crossline, the Company determined there was a significant change in the manner in which the Crossline trade name was used and as a result determined the change to be a triggering event for an impairment analysis to be performed in accordance with the guidance of long-lived assets. The amount of impairment represented the remaining net carrying amount of the asset and was recognized in the consolidated statements of operations within "Loss on disposal and impairment of long lived assets" during the year ended December 31, 2014. The Crossline trade name and associated impairment charge related to our Originations segment.
103
Stonegate Mortgage Corporation
Notes to Consolidated Financial Statements
December 31, 2015
The Company recorded amortization expense related to its definite-lived intangible assets of $486, $1,019 and $360 during the years ended December 31, 2015, 2014 and 2013, respectively, all related to its continuing operations. Estimated future amortization expense for each of the years ended December 31, is as follows: 2016, $486; 2017, $338; 2018, $294; 2019, $294; 2020, $195; thereafter, $0. Estimated amortization expense was based on existing intangible asset balances as of December 31, 2015. Actual amortization expense may vary from these estimates.
The Company performed its annual impairment test of existing other intangible assets with indefinite lives during the fourth quarter, with no impairment noted.
12. Other Assets
The following summarizes other assets as of December 31, 2015 and December 31, 2014:
December 31, 2015 | December 31, 2014 | ||||||
Receivables from servicing sales, interest and loan related payments, net | $ | 18,739 | $ | 13,059 | |||
Prepaid expenses | 5,990 | 5,109 | |||||
Real estate owned, net 1 | 1,446 | 1,242 | |||||
Deposits | 801 | 1,340 | |||||
Miscellaneous | 441 | 356 | |||||
Total other assets | $ | 27,417 | $ | 21,106 | |||
1 Real estate owned assets are reflected at their net realizable value.
13. Transfers and Servicing of Financial Assets
Residential mortgage loans are primarily sold to FNMA or FHLMC or transferred into pools of GNMA MBS. The Company has continuing involvement in mortgage loans sold through servicing arrangements and the liability for loan indemnifications and repurchases under the representations and warranties it makes to the investors and insurers of the loans it sells. The Company is exposed to interest rate risk through its continuing involvement with mortgage loans sold, including the MSRs, as the value of the asset fluctuates as changes in interest rates impact borrower prepayment.
The Company also sells non-agency residential mortgage loans to non-GSE third parties generally without retaining the servicing rights to such loans.
All loans are sold on a non-recourse basis; however, certain representations and warranties have been made that are customary for loan sale transactions, including eligibility characteristics of the mortgage loans and underwriting responsibilities, in connection with the sales of these assets.
In order to facilitate the origination and sale of mortgage loans held for sale, the Company entered into various agreements with warehouse lenders. Such agreements are in the form of loan participations and repurchase agreements with banks and other financial institutions. Mortgage loans held for sale are considered sold when the Company surrenders control over the financial assets and such financial assets are legally isolated from the Company in the event of bankruptcy. If the sale
criteria are not met, the transfer is recorded as a secured borrowing in which the assets remain on the balance sheet and the
proceeds from the transaction are recognized as a liability. From time to time, the Company may sell loans whereby the
underlying risks and cash flows of the mortgage loan have been transferred to a third party through the issuance of participating
interests. The terms and conditions of these interests are governed by the participation agreements. The Company will receive
a marketing fee paid by the participating entity upon completion of the sale. In addition, the Company will also subservice the
underlying mortgage loans to the participation agreement for the period that the participating interests are outstanding. As of December 31, 2015 and 2014, all transfers pursuant to the Company's mortgage funding arrangements (the collective term
for the Company's mortgage loan participation, warehouse lines of credit, repurchase and other credit arrangements) are
accounted for by the Company as secured borrowings.
The following table sets forth information regarding cash flows for the years ended December 31, 2015, 2014 and 2013 relating to loan sales in which the Company has continuing involvement:
104
Stonegate Mortgage Corporation
Notes to Consolidated Financial Statements
December 31, 2015
Years Ended December 31, | |||||||||||
2015 | 2014 | 2013 | |||||||||
Proceeds from new loan sales 1 | $ | 40,484 | $ | 15,917 | $ | (6,167 | ) | ||||
Proceeds from loan servicing fees | $ | 53,240 | $ | 45,248 | $ | 21,077 | |||||
Cash outflows from servicing advances | $ | 5,335 | $ | 7,015 | $ | 3,232 | |||||
Cash outflows from repurchases and indemnifications of previously sold loans | $ | 48,104 | $ | 16,784 | $ | 4,070 | |||||
Cash outflows from repurchases of eligible GNMA loans2 | $ | 41,627 | $ | — | $ | — | |||||
1 Represents the proceeds from mortgage loans or pools of mortgage loans sold, net of the related repayments of borrowings under the Company's mortgage funding arrangements used to fund the related mortgage loans prior to sale as well as the cost to retain the servicing rights.
2 Represents loans repurchased by the Company out of GNMA pools in connection with its unilateral right, as servicer, to repurchase such GNMA loans it has previously sold (generally loans that are more than 90 days past due).
14. Debt
Borrowings outstanding as of December 31, 2015 and 2014 are as follows:
December 31, 2015 | December 31, 2014 | ||||||||||||
Amount Outstanding | Weighted Average Interest Rate | Amount Outstanding | Weighted Average Interest Rate | ||||||||||
Secured borrowings - mortgage loans | $ | 492,799 | 4.16 | % | 1 | $ | 592,798 | 3.97 | % | ||||
Secured borrowings - eligible GNMA loan repurchases | 37,615 | 3.17 | % | 2 | — | — | % | ||||||
Mortgage repurchase borrowings | 279,421 | 2.47 | % | 472,045 | 2.23 | % | |||||||
Warehouse lines of credit | 1,306 | 4.25 | % | 1,374 | 4.25 | % | |||||||
Secured borrowings - mortgage servicing rights | 77,069 | 5.58 | % | 75,970 | 5.49 | % | |||||||
Operating lines of credit | 5,000 | 4.00 | % | 2,000 | 4.00 | % | |||||||
Total mortgage funding arrangements | $ | 893,210 | $ | 1,144,187 | |||||||||
1 The Company’s costs for secured borrowings on mortgage loans are shown in the table above based on the average underlying mortgage rates. These costs are reduced by earnings and fees specific to each of the secured borrowing facilities.
2 The Company's costs for financing GNMA loan repurchases under this funding arrangement (remittance rate) are based on a borrowing rate over and above the debenture rate, which is set on each loan by HUD at a required spread to the constant maturity ten-year treasury at that point in time.
The Company maintains mortgage loan participation, warehouse lines of credit, repurchase and other credit
arrangements listed above (collectively referred to as “mortgage funding arrangements”) with various financial institutions,
primarily to fund the origination and purchase of mortgage loans. As of December 31, 2015, the Company held mortgage funding arrangements with six separate financial institutions and a total maximum borrowing capacity of $1,947,000, including the operating lines of credit and funding arrangement for GNMA loan repurchases. Except for our operating lines of credit, each mortgage funding arrangement is collateralized by the underlying mortgage loans. Separately, the Company had two mortgage funding arrangements for the funding of MSRs, each of which is collateralized by the MSRs pledged to the respective facilities.
The following table summarizes the amounts outstanding, interest rates and maturity dates under the Company’s various mortgage funding arrangements as of December 31, 2015 and December 31, 2014:
As of December 31, 2015:
Mortgage Funding Arrangements1 | Amount Outstanding | Maximum Borrowing Capacity | Interest Rate | Maturity Date | |||||||||
Merchants Bank of Indiana - Participation Agreement | $ | 169,589 | $ | 600,000 | 2 | Same as the underlying mortgage rates, less contractual service fee | July 2016 | ||||||
105
Stonegate Mortgage Corporation
Notes to Consolidated Financial Statements
December 31, 2015
Merchants Bank of Indiana - NattyMac Funding | 323,210 | — | 3 | Same as the underlying mortgage rates, less 49% of facility earnings | March 2017 | ||||||||
Total secured borrowings - mortgage loans | 492,799 | 600,000 | |||||||||||
Guaranty Bank | 37,615 | 50,000 | Coupon rate of underlying loans, less debenture rate | 7 | N/A | 8 | |||||||
Total secured borrowings - eligible GNMA loan repurchases | 37,615 | 50,000 | |||||||||||
Barclays Bank PLC | 45,956 | 300,000 | LIBOR plus applicable margin | December 2016 | |||||||||
Bank of America, N.A. | 184,804 | 700,000 | 4 | LIBOR plus applicable margin | June 2016 | ||||||||
EverBank | — | 150,000 | LIBOR plus applicable margin | November 2016 | |||||||||
Wells Fargo Bank N.A. | 48,661 | 140,000 | LIBOR plus applicable margin | January 2017 | |||||||||
Total mortgage repurchase borrowings | 279,421 | 1,290,000 | |||||||||||
Merchants Bank of Indiana - Warehouse Line of Credit | 1,306 | 2,000 | Prime plus 1.00% | July 2016 | |||||||||
Total warehouse lines of credit | 1,306 | 2,000 | |||||||||||
Barclays Bank PLC - MSRs Secured | 58,979 | — | 5 | LIBOR plus applicable margin | December 2016 | ||||||||
EverBank - MSRs Secured | 18,090 | — | 6 | LIBOR plus applicable margin | November 2016 | ||||||||
Total secured borrowings - MSRs | 77,069 | — | |||||||||||
Total | $ | 888,210 | $ | 1,942,000 | |||||||||
1 Does not include our operating lines of credit for which we have a maximum borrowing capacity of $5,000.
2 Merchants Bank of Indiana will periodically constrain the aggregate maximum borrowing capacity. During the year ended December 31, 2015, the lowest amount to which the aggregate maximum borrowing capacity was limited approximated $550,000. The highest amount to which it was expanded approximated $700,000. At December 31, 2015, the aggregate maximum borrowing capacity was $600,000.
3 The maximum borrowing capacity is a sublimit of the Merchants Participation Agreement maximum borrowing capacity referred to in Note 2 above.
4 The Bank of America maximum borrowing includes $400,000 of mortgage repurchase and $300,000 of mortgage gestation repurchase facilities.
5 Governed by the Barclays Bank PLC maximum borrowing capacity of $300,000, with a sub-limit of $60,000.
6 Governed by the EverBank maximum borrowing capacity of $150,000, with a sub-limit of $70,000.
7 Borrowing carries an interest rate of the coupon rate of the underlying mortgage loans, less the debenture rate funded by Guaranty Bank.
8 Borrowing matures no later than four years from the date of most recent purchase from GNMA pools.
As of December 31, 2014:
Mortgage Funding Arrangements1 | Amount Outstanding | Maximum Borrowing Capacity | Interest Rate | Maturity Date | |||||||||
Merchants Bank of Indiana - Participation Agreement | $ | 273,341 | $ | 600,000 | 2 | Same as the underlying mortgage rates, less contractual service fee | July 2015 | ||||||
106
Stonegate Mortgage Corporation
Notes to Consolidated Financial Statements
December 31, 2015
Merchants Bank of Indiana - NattyMac Funding | 319,457 | — | 3 | Same as the underlying mortgage rates, less 49% of facility earnings | March 2015 | 7 | |||||||
Total secured borrowings - mortgage loans | 592,798 | 600,000 | |||||||||||
Barclays Bank PLC | 224,444 | 400,000 | LIBOR plus applicable margin | December 2015 | |||||||||
Bank of America, N.A. | 247,601 | 600,000 | 6 | LIBOR plus applicable margin | May 2015 | ||||||||
Total mortgage repurchase borrowings | 472,045 | 1,000,000 | |||||||||||
Merchants Bank of Indiana - Warehouse Line of Credit | 1,374 | 2,000 | Prime plus 1.00% | July 2015 | |||||||||
Total warehouse lines of credit | 1,374 | 2,000 | |||||||||||
Barclays Bank PLC - MSRs Secured | 45,970 | — | 4 | LIBOR plus applicable margin | December 2015 | ||||||||
Merchants Bank of Indiana - MSRs Secured | 30,000 | 30,000 | 5 | LIBOR plus applicable margin | June 2017 | ||||||||
Total secured borrowings - MSRs | 75,970 | 30,000 | |||||||||||
Total | $ | 1,142,187 | $ | 1,632,000 | |||||||||
1 Does not include our operating lines of credit for which we have a maximum borrowing capacity of $2,000.
2 Merchants Bank of Indiana will periodically limit or expand the aggregate maximum borrowing capacity. During the year ended December
31, 2014, the lowest amount to which the aggregate maximum borrowing capacity was limited approximated $500,000. At December 31, 2014, the aggregate maximum borrowing capacity was $600,000.
3 The maximum borrowing capacity is a sublimit of the Merchants Participation Agreement maximum borrowing capacity referred to in Note
2 above.
4 Governed by the Barclays Bank PLC maximum borrowing capacity of $400,000, with a sub-limit of $100,000.
5 Based on GNMA MSRs pledged to Merchants Bank of Indiana. Subsequent to year end, such capacity was raised to $35,000.
6 The Bank of America maximum borrowing includes $400,000 of mortgage repurchase and $200,000 of mortgage gestation repurchase
facilities.
7 Agreement automatically renews 90 days prior to maturity if no termination notice given by either party. No notice was received or given at
the 90 day mark and this line was extended to a maturity date of March 2016.
On May 22, 2014, the Company entered into a loan and security agreement with Barclays Bank PLC ("Barclays") in which the Company established a $100,000 revolving credit facility secured by the Company's FNMA and FHLMC MSRs. The transaction was structured so that the $100,000 revolving credit facility with Barclays is a borrowing sub-limit within the Company's existing $300,000 master repurchase agreements with Barclays. As part of the transaction, the Company, together with Barclays, entered into separate acknowledgment agreements with FNMA and FHLMC in which, among other things, FNMA and FHLMC acknowledge the lien against the Company’s FNMA and FHLMC MSRs. On July 7, 2014, the Company amended its master repurchase agreement with Barclays to increase the aggregate maximum borrowing capacity from $300,000 to $400,000, which was accounted for as a modification of a revolving debt arrangement. Through a series of further amendments, the agreements will mature on December 16, 2016. The maximum borrowing capacity and associated interest rate remain the same.
On April 15, 2014, the Company entered into an agreement with Merchants Bancorp (an Indiana-based bank holding company and the parent company of Merchants Bank of Indiana), whereby the Company agreed to invest up to $25,000 in the subordinate debt of Merchants Bancorp. Merchants Bancorp in turn, agreed to form and fund a wholly-owned subsidiary named NattyMac Funding Inc. (“NMF”) that would invest in participation interests in warehouse lines of credit ("WLOCs") originated by the Company's wholly-owned subsidiary, NattyMac, and in participation interests in residential mortgage loans originated by Stonegate. Additionally, Merchants Bancorp of Indiana ("Merchants") pledged 1,000 shares of NMF's common capital stock to the Company, for which the Company has the right to claim if Merchants were to default on any parameters set forth by the agreement. The amount of the subordinate debt funded by the Company is designed to be greater than or equal to 10% of the assets of NMF, based on the average assets of NMF over the quarter period. The subordinate debt provided to Merchants Bancorp will earn a return equal to one-month LIBOR, plus 350 basis points, plus additional interest that will be equal to 49% of the earnings of NMF. On September 25, 2014, the Company expanded the maximum amount of its investment in the subordinate debt of Merchants Bancorp to $30,000.
107
Stonegate Mortgage Corporation
Notes to Consolidated Financial Statements
December 31, 2015
On January 29, 2015, the Company signed a Mortgage Repurchase Agreement with Wells Fargo Bank N.A. with a maximum borrowing capacity of $200,000, which was subsequently amended to $140,000. The borrowing facility is comparable to the repurchase facilities that the Company has in place with other financial institutions, and is designed to finance newly originated conventional, government and jumbo residential mortgages originated or purchased by the Company. The facility is uncommitted and matures on January 30, 2017.
On September 11, 2015, the Company entered into a Master Loan Purchase and Servicing Agreement with Guaranty
Bank, which has an operating line of credit secured by certain FHA mortgage loans repurchased from GNMA pools. These
loans have actually been repurchased by the Company from GNMA pools in connection with its unilateral right, as servicer,
to repurchase such GNMA loans it has previously sold (generally loans that are more than 90 days past due). The borrowing
matures no later than four years from the date of purchase from GNMA pools and carries an interest rate of coupon rate of the
mortgage loans, less the debenture rate funded by Guaranty Bank.
On November 10, 2015, the Company signed a Mortgage Repurchase Agreement with EverBank with a maximum borrowing capacity of $150,000 and related GNMA MSR financing of $70,000. The borrowing facility is comparable to the repurchase facilities that the Company has in place with other financial institutions, and is designed to finance newly originated conventional, government and jumbo residential mortgages originated or purchased by the Company, in addition to financing GNMA MSRs created and retained by the Company. The facility is uncommitted and matures on November 8, 2016.
The Company reviews and monitors its operating lines of credit during the quarter and amends the borrowing capacity
and maturity date throughout the quarter based on current operations.
The above mortgage funding and operating lines of credit agreements contain covenants which include certain customary financial requirements, including maintenance of minimum tangible net worth, maximum debt to tangible net worth ratio, minimum liquidity, minimum current ratio, minimum profitability and limitations on additional debt and transactions with affiliates, as defined in the respective agreement. As of December 31, 2015 and December 31, 2014, the Company was in compliance with the covenants contained in these agreements. The Company intends to renew the mortgage funding arrangements when they mature and has no reason to believe the Company will be unable to do so.
15. Reserve for Mortgage Repurchases and Indemnifications
Representations and warranties are provided to investors and insurers on loans sold and are also assumed on purchased mortgage loans. In the event of a breach of these representations and warranties, the Company may be required to repurchase the mortgage loan or indemnify the investor against loss. In limited circumstances, the full risk of loss on loans sold is retained to the extent the liquidation of the underlying collateral is insufficient. In some instances where the Company has purchased loans from third parties, it may have the ability to recover the loss from the third party originator. Repurchase-related reserves
are maintained for probable losses related to repurchase and indemnification obligations.
The following is a summary of changes in the reserve for mortgage repurchases and indemnifications for the years ended December 31, 2015, 2014 and 2013:
Years Ended December 31, | |||||||||||
2015 | 2014 | 2013 | |||||||||
Balance at beginning of period | $ | 4,967 | $ | 3,709 | $ | 1,917 | |||||
Provision for mortgage repurchases and indemnifications - new loan sales1 | 3,378 | 2,415 | 2,899 | ||||||||
Crossline business combination | — | — | 498 | ||||||||
Provision for mortgage repurchases and indemnifications - change in estimate2 | 592 | 822 | (417 | ) | |||||||
Losses on repurchases and indemnifications | (3,401 | ) | (1,979 | ) | (1,188 | ) | |||||
Balance at end of period | $ | 5,536 | $ | 4,967 | $ | 3,709 | |||||
1 Recognized as a reduction to "Gain on mortgage loans held for sale, net" in the consolidated statements of operations.
2 Accounts for change in estimate made subsequent to the initial reserve for new loan sales being made.
Because of the inherent uncertainties involved in the various estimates and assumptions used by the Company in determining the mortgage repurchase and indemnifications liability, there is a reasonable possibility that future losses may be in
108
Stonegate Mortgage Corporation
Notes to Consolidated Financial Statements
December 31, 2015
excess of the recorded liability. In assessing the adequacy of the reserve, management evaluates various factors including actual losses on repurchases and indemnifications during the period, historical loss experience, known delinquent and other problem loans, delinquency trends in the portfolio of sold loans and economic trends and conditions in the industry. The Company considers the liability to be appropriate at each balance sheet date.
16. Related Party Transactions
Through May 15, 2013, the Company had an agreement with a stockholder to pay an annual management fee for consulting and advisory services and strategic planning. The agreement was terminated on May 15, 2013 in conjunction with the Company’s private offering of common stock. The total management fees amounted to $820 for the year ended December 31, 2013, and are included in "General and administrative expense" on the Company's consolidated statements of operations.
Through June 30, 2013, the Company had an agreement with a stockholder to manage and grow the Company’s Home Improvement Program division, which primarily focuses on the origination of the Federal Housing Administration ("FHA") 203k loans and Fannie Mae Home Style renovation loans. In accordance with the terms of the agreement the stockholder was to receive an annual management fee of $108 payable quarterly through January 15, 2014, 10% of all revenue generated by the division payable quarterly through January 15, 2014, and 33.33% of the annual net income of the division for the calendar year ended December 31, 2013. This agreement terminated on June 30, 2013. The total related fees amounted to $159 for the year ended December 31, 2013 and are included in "General and administrative expense" on the Company's consolidated statements of operations.
During the year ended December 31, 2013, the Company forgave a note receivable from its former Chief Executive Officer ("CEO") in the amount of $214, which was considered taxable income to the former CEO and compensation expense to the Company.
On September 1, 2015, the Company entered into a consulting agreement with its former CEO for services following the termination of his employment with the Company, commencing September 11, 2015 through March 11, 2016, for which he will receive a monthly retainer of $10 for up to 40 hours of service per month, with services exceeding forty hours in any month to be compensated at an hourly rate. The total fees amounted to $30 for the year ended December 31, 2015, and are included in "General and administrative expenses" on the Company's consolidated statements of operations. As of December 31, 2015, the Company had $10 of amounts due to the former CEO related to this agreement, which is included in "Other liabilities" on the Company's consolidated balance sheets.
On September 1, 2015, the Company entered into a letter agreement with its Chairman of the Board to employ him, effective as of September 10, 2015, on an at-will basis as Interim Chief Executive Officer, for which he will receive a base salary at a weekly rate of $11 (effective as of August 31, 2015) and be eligible to receive a special transition award at the completion of his service as Interim Chief Executive Officer, or if earlier, the first anniversary of his start date, paid in the form of Company common stock in an amount determined by the Company’s Board based on the evaluation of business objectives specified by the Board. As Interim Chief Executive Officer, he will also be entitled to reimbursement of reasonable expenses incurred for his travel and housing in connection with the performance of his duties. During the period of his employment, he will also be entitled to all standard employee benefits afforded to Stonegate’s executive employees. The total compensation amounted to $185 for the year ended December 31, 2015, and is included in "Salaries, commissions and benefits" on the Company's consolidated statements of operations.
17. Income Taxes
The components of income tax expense from continuing operations are as follows for the years ended December 31, 2015, 2014 and 2013:
Years ended December 31, | |||||||||||
2015 | 2014 | 2013 | |||||||||
Current federal income tax expense | $ | — | $ | — | $ | — | |||||
Current state income tax expense | 217 | 115 | — | ||||||||
Deferred federal income tax (benefit) expense | (5,714 | ) | (12,851 | ) | 12,887 | ||||||
Deferred state income tax (benefit) expense | (36 | ) | (200 | ) | 736 | ||||||
Total income tax (benefit) expense | $ | (5,533 | ) | $ | (12,936 | ) | $ | 13,623 | |||
109
Stonegate Mortgage Corporation
Notes to Consolidated Financial Statements
December 31, 2015
The following is a reconciliation of income tax expense from continuing operations recorded on the Company's consolidated statements of income to the expected statutory federal corporate income tax rates for the years ended December 31, 2015, 2014 and 2013:
Years ended December 31, | ||||||||||||||||||||
2015 | 2014 | 2013 | ||||||||||||||||||
$ | % | $ | % | $ | % | |||||||||||||||
Statutory federal income tax (benefit) expense | $ | (7,620 | ) | 35.0 | % | $ | (13,427 | ) | 35.0 | % | $ | 12,677 | 35.0 | % | ||||||
State income tax (benefit) expense, net of federal tax expense (benefit) | (779 | ) | 3.6 | % | (1,520 | ) | 4.0 | % | 662 | 1.8 | % | |||||||||
Non-deductible expenses | 124 | (0.6 | )% | 171 | (0.5 | )% | 230 | 0.6 | % | |||||||||||
Equity compensation forfeiture | 2,070 | (9.5 | )% | — | — | % | — | — | % | |||||||||||
Valuation allowance | 1,554 | (7.1 | )% | — | — | % | — | — | % | |||||||||||
Uncertain tax positions | 583 | (2.7 | )% | — | — | % | — | — | % | |||||||||||
State tax rate adjustment to state deferred | (1,234 | ) | 5.7 | % | 1,801 | (4.7 | )% | — | — | % | ||||||||||
Other | (231 | ) | 1.0 | % | 39 | (0.1 | )% | 54 | 0.2 | % | ||||||||||
Total income tax (benefit) expense | $ | (5,533 | ) | 25.4 | % | $ | (12,936 | ) | 33.7 | % | $ | 13,623 | 37.6 | % | ||||||
The tax effects of significant temporary differences which gave rise to the Company's deferred tax assets and liabilities are as follows as of December 31, 2015 and 2014:
December 31, | |||||||
2015 | 2014 | ||||||
Deferred tax assets relating to: | |||||||
Net operating loss carryforwards | $ | 68,996 | $ | 57,987 | |||
Intangible assets | 533 | 475 | |||||
Reserve for mortgage repurchases and indemnifications | 2,134 | 1,953 | |||||
Stock-based compensation | 1,302 | 2,087 | |||||
Deferred rent and leasehold improvements | 706 | 762 | |||||
Vacation accrual and contributions | 536 | 470 | |||||
Loans held for sale and related derivatives | 22,342 | 14,715 | |||||
Bad debts | 240 | 235 | |||||
Tax credits | 5 | 5 | |||||
Total gross deferred tax assets | $ | 96,794 | $ | 78,689 | |||
Less: valuation allowance | (1,554 | ) | — | ||||
Total net deferred tax assets | $ | 95,240 | $ | 78,689 | |||
Deferred tax liabilities relating to: | |||||||
Mortgage servicing rights | $ | 96,392 | $ | 89,658 | |||
Property and equipment | 514 | 825 | |||||
Loans held for sale and related derivatives | — | — | |||||
Goodwill | 116 | 37 | |||||
Other intangible assets | — | — | |||||
Total deferred tax liabilities | $ | 97,022 | $ | 90,520 | |||
Net deferred tax liabilities | $ | 1,782 | $ | 11,831 | |||
During the years ended December 31, 2015 and 2014, the Company recognized an income tax benefit from continuing operations of $5,533 and $12,936, respectively, which represented effective tax rates of 25.4% and 33.7%, respectively. The income tax benefit from continuing operations for the year ended December 31, 2015 includes the impact of establishing a $1,554 valuation allowance to offset our deferred tax assets, as we determined that it is more likely than not that a portion of our deferred tax assets will not be realized (see additional discussion below). Additionally, the decrease in the effective tax rate in the current period is due to adjustments to state net deferred tax liabilities based on a decreased state effective tax rate and provision to tax return adjustments.
110
Stonegate Mortgage Corporation
Notes to Consolidated Financial Statements
December 31, 2015
As of December 31, 2015, the Company had total company federal and state net operating loss carryforwards of $176,137 and $150,481, respectively. The Company's federal and state net operating loss carryforwards are available to offset future taxable income and expiring from 2028 to 2035. As of December 31, 2014, the Company had total company federal and state net operating loss carryforwards of $148,580 and $125,957, respectively. During the year ended December 31, 2015, the Company entered into a three year cumulative loss position. As a result of the cumulative loss position and changes in the Company's level of activity in various states, the Company has recorded a state valuation allowance of $1,554 as of December 31, 2015. In future periods, the allowance could be adjusted if sufficient evidence exists indicating that it is more likely than not that a portion or all of these deferred tax assets will or will not be realized.
The Company analyzed the impact of its October 10, 2013 initial public offering, private equity offering that occurred on May 15, 2013 and significant investment made by holders of Series D convertible preferred stock on March 9, 2012 (as further described in Note 19, "Capital Stock") and determined that an ownership change under Section 382 of the Internal Revenue Code ("Section 382 ownership change") had occurred. The Internal Revenue Service ("IRS") allows for the application of two approaches (the full value method and the hold constant principle) for valuing companies when identifying a Section 382 ownership change and requires that the taxpayers apply a consistent method from year to year. The Company applied the full value method in its valuation. Management performed an analysis of the resulting annual limitation on the utilization of the Company's net operating loss carryforwards and incorporated it into their annual calculations.
ASC 740-10, Income Taxes, requires financial statement recognition of the impact of a tax position if a position is more likely than not of being sustained on audit, based on the technical merits of the position. As of December 31, 2015, the Company accrued a liability for uncertain tax positions of $583 against the Company’s state NOL carryforward balances. The following is a reconciliation of the ASC 740-10 unrecognized tax positions:
Years Ended December 31, | |||||||||||
2015 | 2014 | 2013 | |||||||||
Balance at the beginning of year | $ | — | $ | — | $ | — | |||||
Increases for tax positions of prior years | 583 | — | — | ||||||||
Balance at end of year | $ | 583 | $ | — | $ | — | |||||
As of December 31, 2015, the Company had $583 of gross unrecognized tax benefits which, if recognized, would affect our effective tax rate. It is reasonably possible that the amount of the unrecognized tax benefit with respect to certain of our uncertain tax positions will increase or decrease during the next 12 months; however, we do not expect the change to have a significant effect on our results of operations, financial condition or cash flows.
The Company is subject to U.S. federal income tax as well as income tax of multiple states and local jurisdictions. With a few insignificant exceptions, we are no longer subject to U.S. federal, state and local income tax examinations by tax authorities for years prior to 2012.
18. Commitments and Contingencies
Commitments to Extend Credit
The Company enters into interest rate lock commitments ("IRLCs") with customers who have applied for residential
mortgage loans and meet certain credit and underwriting criteria. These commitments expose the Company to market risk if
interest rates change and the loan is not economically hedged or committed to an investor. The Company is also exposed to
credit loss if the loan is originated and not sold to an investor and the customer does not perform. The collateral upon extension
of credit typically consists of a first deed of trust in the mortgagor’s residential property. Commitments to originate loans do
not necessarily reflect future cash requirements as some commitments are expected to expire without being drawn upon. Total commitments to originate loans as of December 31, 2015 and December 31, 2014 approximated $1,169,768 and $1,211,675, respectively. The commitments are recognized in the balance sheet within “Derivatives".
Leases
The Company leases office space and equipment under non-cancelable operating agreements expiring through October 2022. Rent expense related to continuing operations amounted to $5,621, $5,936 and $3,458 for the years ended December 31, 2015, 2014 and 2013, respectively. Rent expense related to discontinued operations amounted to $4,956, $3,301
111
Stonegate Mortgage Corporation
Notes to Consolidated Financial Statements
December 31, 2015
and $0 for the years ended December 31, 2015, 2014 and 2013, respectively. Future minimum rental payments under the leases having an initial or remaining non-cancelable term in excess of one year are as follows at December 31, 2015:
2016 | $ | 6,314 | |
2017 | 5,824 | ||
2018 | 5,512 | ||
2019 | 3,902 | ||
2020 | 2,177 | ||
Thereafter | 2,726 | ||
Total minimum rental payments 1 | $ | 26,455 | |
1 Total minimum rental payments presented above do not include sublease revenue amounts. Sublease revenue amounts for the years 2016 through 2020 are $494, $539, $463, $389 and $20, respectively.
Regulatory Net Worth Requirements
The Company is subject to various regulatory capital requirements administered by the Department of Housing and Urban Development ("HUD"), which governs non-supervised, direct endorsement mortgagees, and GNMA, FNMA and FHLMC, which governs issuers of GNMA, FNMA and FHLMC securities. Additionally, the Company is required to maintain minimum net worth requirements for many of the states in which it sells and services loans. Each state has its own minimum net worth requirement; these range from $0 to $1,000, depending on the state.
Failure to meet minimum capital requirements can result in certain mandatory and possibly additional discretionary remedial actions by regulators that, if undertaken, could (i) remove the Company’s ability to sell and service loans to or on behalf of the agencies and (ii) have a direct material effect on the Company’s financial statements. In accordance with the regulatory capital guidelines, the Company must meet specific quantitative measures of assets, liabilities and certain off-balance sheet items calculated under regulatory accounting practices. Further, changes in regulatory and accounting standards, as well as the impact of future events on the Company’s results, may significantly affect the Company’s net worth adequacy.
The Company met all minimum net worth requirements to which it was subject as of December 31, 2015 and 2014. The Company’s required and actual net worth amounts are presented in the following table:
December 31, 2015 | December 31, 2014 | ||||||||||||||
Net Worth 1 | Net Worth Required | Net Worth 1 | Net Worth Required | ||||||||||||
HUD | $ | 254,725 | $ | 2,500 | $ | 272,686 | $ | 2,500 | |||||||
GNMA | $ | 254,725 | $ | 29,742 | $ | 272,686 | $ | 22,982 | |||||||
FNMA | $ | 254,725 | $ | 16,172 | $ | 272,686 | $ | 16,995 | |||||||
FHLMC | $ | 254,725 | $ | 13,624 | $ | 272,686 | $ | 11,251 | |||||||
Various States | $ | 254,725 | $ 0-1,000 | $ | 272,686 | $ 0-1,000 | |||||||||
1 Calculated in compliance with the respective agencies' or states' requirements.
Litigation
The Company is subject to various legal proceedings arising out of the ordinary course of business. As of December 31, 2015, there were no current or pending claims against the Company, which could have a material impact on the Company's statement of financial position, net income or cash flows.
Regulatory Contingencies
The Company is subject to periodic audits and examinations, both formal and informal in nature, from various federal and state agencies, including those made as part of regulatory oversight of our mortgage origination, servicing and financing activities. Such audits and examinations could result in additional actions, penalties or fines by state or federal governmental bodies, regulators or the courts with respect to our mortgage origination, servicing and financing activities, which may be applicable generally to the mortgage industry or to us in particular. During 2014, we received a report of examination from a state regulatory agency that certain fees that were charged to borrowers in connection with the origination of loans through our wholesale and retail channels were impermissible and must be refunded to such borrowers. The total amount of these fees is
112
Stonegate Mortgage Corporation
Notes to Consolidated Financial Statements
December 31, 2015
$417. The Company disagrees with the findings in the report of examination and has communicated its reasoning as to why the related fees are permissible to the state regulatory agency. However, there can be no assurance that the state regulatory agency will agree with our position and that we will not be ultimately required to refund the fees to the related borrowers.
Other Contingencies
During 2013, the Company became aware that it had purchased certain refinancing loans, with a total principal amount of $5,163, from a correspondent lender where the prior mortgage loan on the property securing the mortgage loan that was purchased from the correspondent lender was not satisfied and released by the correspondent’s title company at the time the loan from the correspondent was made. As part of the Company’s process in purchasing a mortgage loan from a correspondent lender, it generally requires that a closing protection letter be issued by the title insurer in favor of the borrower. A closing protection letter was obtained with respect to each of these purchased loans. As a result, the Company believes the borrower is insured against any liens prior to ours that were not identified in connection with the issuance of that closing protection letter. The Company believes that its procedures, including conducting a post-purchase audit, were effective in identifying the failure by the correspondent lender to obtain a release of the prior mortgage loan and that the Company’s practice of obtaining closing protection letters is appropriate to protect it in these situations. The Company has notified the affected borrowers and the relevant insurance carriers, and it expects that the title insurance obtained in connection with the refinancings will result in the loan having a first priority status. However, there can be no assurances that the prior mortgages will be fully satisfied from the title insurance claims.
19. Capital Stock
Initial Public Offering
On October 16, 2013, the Company completed its initial public offering of 8,165,000 shares of common stock (including 1,065,000 shares exercised pursuant to an overallotment option granted to the underwriters) at a price to the public of $16.00 per share, resulting in gross proceeds of approximately $130,640. The underwriting discounts and commissions related to this offering totaled $6,712 and the Company incurred additional equity issuance costs totaling $3,259 related to the initial public offering.
Equity Restructuring
On May 14, 2013, all outstanding shares of the Company’s convertible preferred stock (Series B, C and D) were converted into shares of the Company’s common stock on a one-for-one basis. On May 14, 2013, immediately following the conversion of preferred stock to common stock, each share of common stock held was split into 13.861519 shares of common stock.
On May 15, 2013, the Company sold 6,388,889 shares of its common stock at a per share price of $18.00, for total gross proceeds of $115,000, under a private offering under the exemptions of the Securities Act of 1933, as amended (the “Securities Act”). The initial purchaser’s discount and placement fee related to the May 2013 offering totaled $7,700 and the Company incurred additional equity issuance costs totaling $2,700 related to the May 2013 offering.
Issuance of Warrants
On March 29, 2013, in conjunction with a $10,000 term loan the Company entered into with a stockholder, the Company issued warrants to the stockholder for the right to purchase 277,777 shares of its common stock at a price of $18.00 per share. The warrants are exercisable at any time through May 15, 2018. Because the warrants met the criteria of a derivative financial instrument that is indexed to the Company's own stock, the warrants' allocable fair value of $1,522 was recorded as a component of "Additional paid in capital" and resulted in a debt discount in the same amount. The debt discount was fully amortized into interest expense upon the repayment of the term loan in full, resulting in $1,522 of interest expense during the year ended December 31, 2014.
Use of Capital and Common Stock Repurchases
The Company paid total cash dividends of $27 to its convertible preferred stockholders during the year ended December 31, 2013. The Company had no preferred stockholders during the years ended December 31, 2015 and 2014. The Company does not expect to pay dividends on its common stock for the foreseeable future. The declaration of future dividends and the establishment of the per share amount, record dates and payment dates for any such future dividends are subject to the
113
Stonegate Mortgage Corporation
Notes to Consolidated Financial Statements
December 31, 2015
final determination of the Company’s Board of Directors and will be dependent upon future earnings, cash flows, financial requirements and other factors.
Common stock repurchases are discretionary as the Company is under no obligation to repurchases shares. The Company may repurchase shares when it believes it is a prudent use of capital. There were no repurchases of common stock during the years ended December 31, 2015 or 2014.
20. Stock-Based Compensation
During 2011, the Company adopted the 2011 Omnibus Incentive Plan (the “2011 Plan”) for employees, consultants and non-employee directors. The Plan provided for the grant of stock options (both incentive stock options and nonqualified stock options), stock appreciation rights ("SARs"), restricted stock, performance units, phantom stock, restricted stock units and stock awards.
On August 29, 2013, the Company adopted the 2013 Omnibus Incentive Plan (the "2013 Plan") for employees and consultants. The 2013 Plan provides for the grant of stock options (both incentive stock options and non-qualified stock options), SARs, restricted stock, restricted stock units, dividend equivalent rights, other stock-based or cash-based awards (collectively, “awards”), with each grant evidenced by an award agreement providing the terms of the award. Incentive stock options may be granted only to employees; all other awards may be granted to employees and consultants. Non-employee directors are not permitted to participate in the 2013 Plan. The 2013 Plan is applicable to all awards granted on or after August 29, 2013 and replaces the 2011 Plan. No new stock-based compensation grants were made under the 2011 Plan after the adoption of the 2013 Plan. The terms and conditions of awards granted under the 2011 Plan prior to the adoption of the 2013 will not be affected by the adoption of the 2013 Plan, and the 2011 Plan will remain effective with respect to such awards. Upon adoption on August 29, 2013, a total of 419,250 shares of the Company's common stock were reserved and available for issuance under the 2013 Plan, which included the 315,925 remaining number of shares available for grant under the 2011 Plan. As of December 31, 2015, there were a total of 285,260 shares of common stock available for future grants under the 2013 Plan.
Additionally, on August 29, 2013, the Company adopted the 2013 Non-Employee Director Plan (the "2013 Director Plan"). The 2013 Director Plan and the awards granted thereunder have substantially the same terms as described above in the 2013 Plan. Upon adoption on August 20, 2013, a total of 104,812 shares of the Company's common stock were reserved and available for issuance under the 2013 Director Plan. As of December 31, 2015, there were a total of 17,621 shares of common stock available for future grants under the 2013 Director Plan.
The Company’s current policy for issuing shares of its common stock upon exercise of stock options or vesting of restricted stock units is to either issue new shares or repurchase outstanding shares of its common stock to settle stock option exercises. The Company currently has no plans to repurchase shares of its common stock.
Stock Options
Nonqualified stock options are granted for a fixed number of shares with an exercise price at least equal to the fair value of the shares at the grant date. Nonqualified stock options granted during 2014 and 2013 generally vest over four years in equal annual installments and have a term of ten years from the grant date. Nonqualified stock options granted during 2012 are fully vested as of December 31, 2015 and have a term of ten years from the grant date. Stock options granted do not contain any voting or dividend rights prior to exercise. The Company recognizes compensation expense associated with the stock option grants using the straight-line method over the requisite service period.
A summary of stock option activity for the year ended December 31, 2015 is as follows:
114
Stonegate Mortgage Corporation
Notes to Consolidated Financial Statements
December 31, 2015
Number of Shares | Weighted Average Exercise Price Per Share | Weighted Average Remaining Contractual Life (Years) | Aggregate Intrinsic Value | |||||||||
Outstanding at December 31, 2014 | 1,405,206 | $ | 16.90 | |||||||||
Granted | — | N/A | ||||||||||
Exercised | — | N/A | ||||||||||
Forfeited or expired | (1,043,612 | ) | $ | 18.00 | ||||||||
Outstanding at December 31, 2015 | 361,594 | $ | 13.72 | 7.2 | $ | 150 | ||||||
Exercisable at December 31, 2015 | 234,933 | $ | 11.81 | 7.0 | $ | 150 | ||||||
During the year ended December 31, 2015, 486,262 stock options vested with a per-share exercise price of $17.45, an aggregate intrinsic value of $25 and remaining contractual term of 7.4 years.
The Company uses the Black-Scholes option pricing model to estimate the fair value of stock options granted. There were no options granted during the year ended December 31, 2015. The following assumptions were used to estimate the fair value of options granted during the years ended December 31, 2014 and 2013:
Years Ended December 31, | |||||||
2014 | 2013 | ||||||
Fair value of underlying common stock | $ | 14.04 | $ | 18.00 | |||
Volatility | 41.30 | % | 40.00 | % | |||
Dividend yield | — | % | — | % | |||
Risk-free interest rate | 2.01 | % | 1.08 | % | |||
Expected term (years) | 6.25 | 6.22 | |||||
The weighted average grant-date fair values per share of the stock options granted during the years ended December 31, 2014 and 2013 were $6.07 and $7.25, respectively.
Volatility was estimated based on the historical volatility of comparable publicly traded companies. The dividend yield was based on an estimate of future dividend yields. The risk-free interest rate was based on the U.S. Treasury zero-coupon yield curve in effect at the time of the grants. The expected term was calculated for each grant using the simplified method, as the Company’s outstanding stock option grant met certain SEC criteria for the use of the simplified method.
During the year ended December 31, 2013, as a result of the May 14, 2013 stock-split, the Company modified a stock option award made to one non-employee director. The terms of the award were modified to increase the number of stock options from 7,322 shares to 101,494 shares and to decrease the exercise price of the stock options from $55.00 per share to $3.97 per share. The total incremental compensation costs resulting from this modification was $1,449, of which $682 was recorded as stock-based compensation expense for the year ended December 31, 2013.
Restricted Stock Units
Restricted stock units are granted for a fixed number of shares with a fair value equal to the fair value of the Company's common stock at the grant date. Restricted stock units granted during 2015, 2014 and 2013 vest over three years in equal annual installments. Restricted stock units granted do not contain any voting or dividend rights prior to vesting. The Company recognizes compensation expense associated with the restricted stock units using the straight-line method over the requisite service period.
A summary of the nonvested restricted stock unit activity for the year ended December 31, 2015 is as follows:
115
Stonegate Mortgage Corporation
Notes to Consolidated Financial Statements
December 31, 2015
Restricted Stock Units | Weighted Average Grant Date Fair Value Per Share | |||||
Nonvested at December 31, 2014 | 33,922 | $ | 16.00 | |||
Granted | 151,843 | $ | 8.82 | |||
Vested | (83,502 | ) | $ | 10.75 | ||
Forfeited | (7,633 | ) | $ | 12.70 | ||
Nonvested at December 31, 2015 | 94,630 | $ | 9.37 | |||
The total fair value of restricted stock units converted into common stock was $89 during the year ended December 31, 2015.
During the years ended December 31, 2015, 2014 and 2013, the Company recognized total stock-based compensation expense related to stock options and restricted stock units of $3,823, 3,253 and $$2,452, respectively. During the years ended December 31, 2015, 2014 and 2013, the Company recognized related tax benefits of $1,302, $2,087 and $987, respectively. Total unrecognized stock-based compensation costs related to nonvested stock options and restricted stock units as of December 31, 2015 was $645 and $689, respectively, and will be recognized using the straight-line method over the weighted average remaining requisite service periods of 1.6 and 0.2 years, respectively.
Other Stock Awards
On May 10, 2013, the Company issued 39,145 shares of common stock (from its available treasury shares) to an employee who elected to receive his 2012 incentive compensation in the form of shares of the Company's common stock, as allowed under his employment agreement. The election under the employment agreement that allowed the employee to receive incentive compensation in either cash or the Company's common stock was accounted for as a tandem award compensation agreement. The fair value of the tandem award was determined to be $602 on the date the employee made the election to receive his incentive compensation in stock. Stock-based compensation expense recognized for this tandem award was $127 for the year ended December 31, 2013. The number of shares of common stock issued to this employee upon settlement reflected a net settlement for payroll tax withholding. No such election was made during the years ended December 31, 2015 and 2014.
The Company has not granted any stock appreciation rights, restricted stock awards, performance units, phantom stock or other stock-based compensation awards.
21. Retirement Benefit Plans
The Company maintains 401(k) profit sharing plans covering substantially all employees. Employees may contribute amounts subject to certain IRS and plan limitations. The Company may make discretionary matching and non-elective contributions, subject to certain limitations. During the years ended December 31, 2015, 2014 and 2013, the Company contributed $2,574, $1,873 and $1,077, respectively, to the 401(k) profit sharing plans related to its continuing operations. During the years ended December 31, 2015, 2014 and 2013, the Company contributed $620, $402 and $0, respectively, to the 401(k) profit sharing plans related to its discontinued operations.
22. Segment Information
The Company's organizational structure is currently comprised of three operating segments: Originations, Servicing
and Financing. This determination is based on the Company's current organizational structure, which reflects how the chief
operating decision maker evaluates the performance of the business and focuses primarily on the services performed.
The Originations segment primarily originates and sells residential mortgage loans, which conform to the underwriting
guidelines of the GSEs and government agencies and non-agency whole loan investors. The Servicing segment includes loan
administration, collection and default activities, including the collection and remittance of loan payments, responding to customer inquiries, collection of principal and interest payments, holding custodial funds for the payment of property taxes and insurance premiums, counseling delinquent mortgagors, modifying loans and supervising foreclosures on the Company’s property dispositions. The Financing segment includes warehouse-lending activities to correspondent customers by the Company’s NattyMac subsidiary, which commenced operations in July 2013.
116
Stonegate Mortgage Corporation
Notes to Consolidated Financial Statements
December 31, 2015
The accounting policies of each reportable segment are the same as those of the Company. Certain consolidated back-office operations, such as risk and compliance, human resources, information technology, business processes and marketing, are allocated to each individual segment. Expenses are allocated to individual segments based on the estimated value of services performed, including estimated utilization of square footage and corporate personnel.
Financial highlights from the Company's continuing operations by segment are as follows:
Total Assets | |||||||
December 31, 2015 | December 31, 2014 | ||||||
Originations | $ | 647,287 | $ | 1,199,727 | |||
Servicing | 353,097 | 223,058 | |||||
Financing | 232,061 | 118,593 | |||||
Other1 | 48,181 | 55,173 | |||||
Total | $ | 1,280,626 | $ | 1,596,551 | |||
1 Includes intersegment eliminations and assets not allocated to the three reportable segments.
Year Ended December 31, 2015 | |||||||||||||||||||
Originations | Servicing | Financing | Other/Eliminations1 | Consolidated | |||||||||||||||
Revenues | |||||||||||||||||||
Gains on mortgage loans held for sale, net | $ | 142,772 | $ | (1,088 | ) | $ | — | $ | 135 | $ | 141,819 | ||||||||
Changes in mortgage servicing rights valuation | — | (30,395 | ) | — | — | (30,395 | ) | ||||||||||||
Payoffs and principal amortization of mortgage servicing rights | — | (41,529 | ) | — | — | (41,529 | ) | ||||||||||||
Loan origination and other loan fees | 22,751 | — | 1,205 | — | 23,956 | ||||||||||||||
Loan servicing fees | — | 54,772 | — | — | 54,772 | ||||||||||||||
Interest income | 26,729 | 124 | 7,111 | 153 | 34,117 | ||||||||||||||
Total revenues | 192,252 | (18,116 | ) | 8,316 | 288 | 182,740 | |||||||||||||
Expenses | |||||||||||||||||||
Salaries, commissions and benefits | 78,885 | 8,200 | 1,962 | 27,294 | 116,341 | ||||||||||||||
General and administrative expense | 13,851 | 2,063 | 866 | 15,480 | 32,260 | ||||||||||||||
Interest expense | 19,347 | 7,904 | 3,259 | 553 | 31,063 | ||||||||||||||
Occupancy, equipment and communication | 7,422 | 1,976 | 250 | 7,222 | 16,870 | ||||||||||||||
Depreciation and amortization | 5,581 | 455 | 411 | 1,533 | 7,980 | ||||||||||||||
Corporate allocations | 25,313 | 3,571 | 361 | (29,246 | ) | — | |||||||||||||
Total expenses | 150,399 | 24,169 | 7,109 | 22,836 | 204,514 | ||||||||||||||
Income (loss) from continuing operations before taxes | $ | 41,853 | $ | (42,285 | ) | $ | 1,207 | $ | (22,548 | ) | $ | (21,774 | ) | ||||||
1Includes intersegment eliminations and certain corporate income and expenses not allocated to the three reportable segments, such as those related to our accounting, executive administration, finance, internal audit, investor relations and legal departments.
Year Ended December 31, 2014 | |||||||||||||||||||
Originations | Servicing | Financing | Other/Eliminations1 | Consolidated | |||||||||||||||
Revenues | |||||||||||||||||||
Gains on mortgage loans held for sale, net | $ | 133,405 | $ | — | $ | — | $ | (15 | ) | $ | 133,390 | ||||||||
Changes in mortgage servicing rights valuation | — | (55,842 | ) | — | — | (55,842 | ) | ||||||||||||
Payoffs and principal amortization of mortgage servicing rights | — | (23,735 | ) | — | — | (23,735 | ) | ||||||||||||
Loan origination and other loan fees | 24,193 | — | 455 | (67 | ) | 24,581 | |||||||||||||
Loan servicing fees | — | 44,407 | — | — | 44,407 | ||||||||||||||
Interest income | 32,271 | — | 3,280 | (315 | ) | 35,236 | |||||||||||||
117
Stonegate Mortgage Corporation
Notes to Consolidated Financial Statements
December 31, 2015
Total revenues | 189,869 | (35,170 | ) | 3,735 | (397 | ) | 158,037 | ||||||||||||
Expenses | |||||||||||||||||||
Salaries, commissions and benefits | 84,722 | 5,972 | 1,726 | 23,780 | 116,200 | ||||||||||||||
General and administrative expense | 10,593 | 1,378 | 596 | 21,978 | 34,545 | ||||||||||||||
Interest expense | 21,904 | 3,251 | 1,049 | (197 | ) | 26,007 | |||||||||||||
Occupancy, equipment and communication | 6,793 | 1,794 | 231 | 5,783 | 14,601 | ||||||||||||||
Depreciation and amortization | 1,093 | 84 | 479 | 3,392 | 5,048 | ||||||||||||||
Corporate allocations | 26,619 | 3,279 | 160 | (30,058 | ) | — | |||||||||||||
Total expenses | 151,724 | 15,758 | 4,241 | 24,678 | 196,401 | ||||||||||||||
Income (loss) from continuing operations before taxes | $ | 38,145 | $ | (50,928 | ) | $ | (506 | ) | $ | (25,075 | ) | $ | (38,364 | ) | |||||
1Includes intersegment eliminations and certain corporate income and expenses not allocated to the three reportable segments, such as those related to our accounting, executive administration, finance, internal audit, investor relations and legal departments.
Year Ended December 31, 2013 | |||||||||||||||||||
Originations | Servicing | Financing | Other/Eliminations1 | Consolidated | |||||||||||||||
Revenues | |||||||||||||||||||
Gains on mortgage loans held for sale, net | $ | 83,312 | $ | — | $ | — | $ | 15 | $ | 83,327 | |||||||||
Changes in mortgage servicing rights valuation | — | 22,967 | — | — | 22,967 | ||||||||||||||
Payoffs and principal amortization of mortgage servicing rights | — | (8,545 | ) | — | — | (8,545 | ) | ||||||||||||
Loan origination and other loan fees | 21,196 | — | 31 | — | 21,227 | ||||||||||||||
Loan servicing fees | — | 22,204 | — | — | 22,204 | ||||||||||||||
Interest income | 16,612 | — | 125 | 30 | 16,767 | ||||||||||||||
Total revenues | 121,120 | 36,626 | 156 | 45 | 157,947 | ||||||||||||||
Expenses | |||||||||||||||||||
Salaries, commissions and benefits | 50,242 | 2,562 | — | 19,671 | 72,475 | ||||||||||||||
General and administrative expense | 8,344 | 942 | 19 | 13,468 | 22,773 | ||||||||||||||
Interest expense | 12,449 | 260 | — | 1,717 | 14,426 | ||||||||||||||
Occupancy, equipment and communication | 3,999 | 723 | — | 5,121 | 9,843 | ||||||||||||||
Depreciation and amortization | 360 | — | — | 1,849 | 2,209 | ||||||||||||||
Corporate allocations | 14,401 | 1,689 | — | (16,090 | ) | — | |||||||||||||
Total expenses | 89,795 | 6,176 | 19 | 25,736 | 121,726 | ||||||||||||||
Income (loss) from continuing operations before taxes | $ | 31,325 | $ | 30,450 | $ | 137 | $ | (25,691 | ) | $ | 36,221 | ||||||||
1Includes intersegment eliminations and certain corporate income and expenses not allocated to the three reportable segments, such as those related to our accounting, executive administration, finance, internal audit, investor relations and legal departments.
23. Selected Quarterly Financial Data (Unaudited)
Selected quarterly financial data is as follows:
For the Three Months Ended | ||||||||||||||||
March 31 | June 30 | September 30 | December 31 | |||||||||||||
2015 | ||||||||||||||||
Total revenues | $ | 34,920 | $ | 75,446 | $ | 25,557 | $ | 46,817 | ||||||||
Total expenses | $ | 50,799 | $ | 54,702 | $ | 54,852 | $ | 44,161 | ||||||||
(Loss) income from continuing operations before income tax expenses | $ | (15,879 | ) | $ | 20,744 | $ | (29,295 | ) | $ | 2,656 | ||||||
(Loss) income from continuing operations, net of tax | $ | (9,668 | ) | $ | 12,564 | $ | (20,190 | ) | $ | 1,053 | ||||||
(Loss) income from discontinued operations, net of tax | $ | (1,451 | ) | $ | (1,430 | ) | $ | (2,614 | ) | $ | (534 | ) | ||||
Net (loss) income | $ | (11,119 | ) | $ | 11,134 | $ | (22,804 | ) | $ | 519 | ||||||
118
Stonegate Mortgage Corporation
Notes to Consolidated Financial Statements
December 31, 2015
Basic (loss) earnings per share: | ||||||||||||||||
From continuing operations | $ | (0.38 | ) | $ | 0.49 | $ | (0.78 | ) | $ | 0.04 | ||||||
From discontinued operations | $ | (0.05 | ) | $ | (0.06 | ) | $ | (0.10 | ) | $ | (0.02 | ) | ||||
Total basic (loss) earnings per share | $ | (0.43 | ) | $ | 0.43 | $ | (0.88 | ) | $ | 0.02 | ||||||
Diluted (loss) earnings per share: | ||||||||||||||||
From continuing operations | $ | (0.38 | ) | $ | 0.49 | $ | (0.78 | ) | $ | 0.04 | ||||||
From discontinued operations | $ | (0.05 | ) | $ | (0.06 | ) | $ | (0.10 | ) | $ | (0.02 | ) | ||||
Total diluted (loss) earnings per share | $ | (0.43 | ) | $ | 0.43 | $ | (0.88 | ) | $ | 0.02 | ||||||
2014 | ||||||||||||||||
Total revenues | $ | 34,791 | $ | 50,798 | $ | 54,901 | $ | 17,547 | ||||||||
Total expenses | $ | 43,263 | $ | 49,223 | $ | 52,847 | $ | 51,068 | ||||||||
(Loss) income from continuing operations before income tax expenses | $ | (8,472 | ) | $ | 1,575 | $ | 2,054 | $ | (33,521 | ) | ||||||
(Loss) income from continuing operations, net of tax | $ | (5,257 | ) | $ | 970 | $ | (1,434 | ) | $ | (19,707 | ) | |||||
(Loss) income from discontinued operations, net of tax | $ | (2,627 | ) | $ | (701 | ) | $ | (245 | ) | $ | (1,678 | ) | ||||
Net (loss) income | $ | (7,884 | ) | $ | 268 | $ | (1,679 | ) | $ | (21,384 | ) | |||||
Basic (loss) earnings per share: | ||||||||||||||||
From continuing operations | $ | (0.21 | ) | $ | 0.04 | $ | (0.06 | ) | $ | (0.76 | ) | |||||
From discontinued operations | $ | (0.10 | ) | $ | (0.03 | ) | $ | (0.01 | ) | $ | (0.06 | ) | ||||
Total basic (loss) earnings per share | $ | (0.31 | ) | $ | 0.01 | $ | (0.07 | ) | $ | (0.82 | ) | |||||
Diluted (loss) earnings per share: | ||||||||||||||||
From continuing operations | $ | (0.21 | ) | $ | 0.04 | $ | (0.06 | ) | $ | (0.76 | ) | |||||
From discontinued operations | $ | (0.10 | ) | $ | (0.03 | ) | $ | (0.01 | ) | $ | (0.06 | ) | ||||
Total diluted (loss) earnings per share | $ | (0.31 | ) | $ | 0.01 | $ | (0.07 | ) | $ | (0.82 | ) | |||||
24. Subsequent Events
On February 3, 2016, the Company extended its flow sale agreement for the monthly sale of MSRs in GNMA loans to an unrelated party through March 31, 2016.
On February 29, 2016, the Company amended its mortgage repurchase financing with Bank of America, N.A. to decrease the amount available under the line from $400,000 to $300,000, decreasing the maximum borrowing capacity of the mortgage funding arrangements with Bank of America from $700,000 to $600,000.
On March 1, 2016, the Company amended its mortgage repurchase agreement with EverBank to decrease the maximum borrowing capacity from $150,000 to $125,000, and to decrease the related MSRs secured sub-line from $70,000 to $60,000.
119
ITEM 9. CHANGES IN AND DISAGREEMENTS WITH ACCOUNTANTS ON ACCOUNTING AND FINANCIAL DISCLOSURE.
There have been no changes in or disagreements with our independent registered public accounting firm on accounting or financial disclosures.
ITEM 9A. CONTROLS AND PROCEDURES
Evaluation of Disclosure Controls and Procedures
Our management, with the participation of our Interim Chief Executive Officer and Chief Financial Officer, evaluated the effectiveness of our disclosure controls and procedures pursuant to Rule 13a-15(e) under the Securities Exchange Act of 1934, as amended (the "Exchange Act"), as of December 31, 2015. Based on this evaluation, our Interim Chief Executive Officer and Chief Financial Officer concluded that, as of December 31, 2015, our disclosure controls and procedures are effective. Disclosure controls and procedures are designed at a reasonable assurance level and are effective to provide reasonable assurance that information we are required to disclose in reports that we file or submit under the Exchange Act is recorded, processed, summarized, and reported within the time periods specified in the Securities and Exchange Commission's rules and forms, and that such information is accumulated and communicated to our management, including our Interim Chief Executive Officer and Chief Financial Officer, as appropriate, to allow timely decisions regarding required disclosure.
Management’s Report on Internal control over Financial Reporting
Our management is responsible for establishing and maintaining adequate internal control over financial reporting as defined by Rule 13a-15(f) and Rule 15d-15(f) under the Exchange Act. Our internal control over financial reporting is designed to provide reasonable assurance regarding the reliability of financial reporting and the preparation of financial statements for external purposes in accordance with GAAP. Because of its inherent limitations, internal control over financial reporting may not prevent or detect misstatements. Also, projections of any evaluation of effectiveness to future periods are subject to the risk that controls may become inadequate because of changes in conditions, or that the degree of compliance with the policies or procedures may deteriorate.
Our management assessed the effectiveness of our internal control over financial reporting as of December 31, 2015. In making this assessment, we used the criteria established in Internal Control-Integrated Framework (1992) issued by the Committee of Sponsoring Organization of the Treadway Commission ("COSO"). A control system, no matter how well conceived, implemented and operated, can provide only reasonable, not absolute, assurance that the objectives of the internal control system are met. Because of such inherent limitations, no evaluation of controls can provide absolute assurance that all control issues, if any, within a company have been detected. Based on our assessment and those criteria, our management concluded that our internal control over financial reporting was effective as of December 31, 2015.
Changes in Internal Control over Financial Reporting
There were no changes in our internal control over financial reporting that occurred during year ended December 31, 2015 that have materially affected, or are reasonably likely to materially affect, the Company’s internal control over financial reporting.
Limitations on Effectiveness of Controls and Procedures
In designing and evaluating the disclosure controls and procedures, management recognizes that any controls and procedures, no matter how well designed and operated, can provide only reasonable, not absolute, assurance that they will detect or uncover control issues and instances of fraud, if any, within the Company to disclose material information otherwise required to be set forth in our periodic reports.
ITEM 9B. OTHER INFORMATION
None.
120
PART III
ITEM 10. DIRECTORS, EXECUTIVE OFFICERS AND CORPORATE GOVERNANCE
The information required by this Item concerning our Executive Officers, Directors and nominees for Director, Audit Committee members and financial expert(s) and concerning disclosure of delinquent filers under Section 16(a) of the Exchange Act and our Standards of Business Conduct is incorporated herein by reference from our Definitive Proxy Statement for our 2016 Annual Meeting of Shareholders, which will be filed with the Securities and Exchange Commission ("SEC") pursuant to Regulation 14A on or prior to April 29, 2016.
ITEM 11. EXECUTIVE COMPENSATION
The information required by this Item concerning remuneration of our Executive Officers and Directors, material transactions involving such Executive Officers and Directors and Compensation Committee interlocks, as well as Compensation Committee Report, are incorporated herein by reference from our Definitive Proxy Statement for our 2016 Annual Meeting of Shareholders, which will be filed with the SEC pursuant to Regulation 14A on or prior to April 29, 2016.
ITEM 12. SECURITY OWNERSHIP OF CERTAIN BENEFICIAL OWNERS AND MANAGEMENT AND RELATED STOCKHOLDER MATTERS
The information required by this Item concerning the stock ownership of management and five percent beneficial owners and securities authorized for issuance under equity compensation plans is incorporated herein by reference from our Definitive Proxy Statement for our 2016 Annual Meeting of Shareholders, which will be filed with the SEC pursuant to Regulation 14A on or prior to April 29, 2016.
ITEM 13. CERTAIN RELATIONSHIPS AND RELATED TRANSACTIONS, AND DIRECTOR INDEPENDENCE
The information required by this Item concerning certain relationships and related person transactions and director independence, is incorporated herein by reference from our Definitive Proxy Statement for our 2016 Annual Meeting of Shareholders, which will be filed with the SEC pursuant to Regulation 14A on or prior to April 29, 2016.
ITEM 14. PRINCIPAL ACCOUNTING FEES AND SERVICES
The information required by this Item concerning principal accounting fees and services is incorporated herein by reference from our Definitive Proxy Statement for our 2016 Annual Meeting of Shareholders, which will be filed with the SEC pursuant to Regulation 14A on or prior to April 29, 2016.
PART IV
ITEM 15. EXHIBITS AND FINANCIAL STATEMENT SCHEDULES
Documents filed as part of this Annual Report on Form 10-K:
1. | Financial Statements: |
Our consolidated financial statements as of December 31, 2015 and 2014 and for each of the three years in the period ended December 31, 2015 and the notes thereto, together with the reports of the independent registered public accounting firms on those consolidated financial statements are filed within Item 8 in Part II of this Annual Report on Form 10-K.
2. | Financial Statement Schedules: |
No financial statement schedules are presented since the required information is not present or not present in amounts sufficient to require submission of the schedule, or because the information required is included in the financial statements and accompanying notes.
121
3. Exhibits:
The documents listed in the Exhibit Index of this report are incorporated by reference or are filed with this report, in each case as indicated therein (numbered in accordance with Item 601 of Regulation S-K).
122
SIGNATURES
Pursuant to the requirements of Section 13 or 15(d) of the Securities Exchange Act of 1934, the registrant has duly caused this report to be signed on its behalf by the undersigned thereunto duly authorized.
Stonegate Mortgage Corporation | |||
Registrant | |||
Date: March 15, 2016 | By: | /S/ Richard A. Kraemer | |
Richard A. Kraemer | |||
Chief Executive Officer and Director | |||
Pursuant to the requirements of the Securities and Exchange Act of 1934, this report has been signed below by the following persons on behalf of the registrant and in the capacities and on the dates indicated.
Signature | Title | Date | ||
/S/ James V. Smith | President and Chief Operating Officer | March 15, 2016 | ||
James V. Smith | ||||
/S/ Carrie P. Preston | Chief Financial Officer | March 15, 2016 | ||
Carrie P. Preston | (Principal Financial and Accounting Officer) | |||
/S/ Richard A. Kraemer | Interim Chief Executive Officer and Director | March 15, 2016 | ||
Richard A. Kraemer | (Principal Executive Officer) | |||
/S/ Kevin B. Bhatt | Director | March 15, 2016 | ||
Kevin B. Bhatt | ||||
/S/ James G. Brown | Director | March 15, 2016 | ||
James G. Brown | ||||
/S/ Sam Levinson | Director | March 15, 2016 | ||
Sam Levinson | ||||
/S/ Richard A. Mirro | Director | March 15, 2016 | ||
Richard A. Mirro | ||||
/S/ Joseph Scott Mumphrey | Director | March 15, 2016 | ||
Joseph Scott Mumphrey | ||||
123
INDEX TO EXHIBITS
Exhibit Number | Description |
2.1 | Stock Purchase Agreement, dated as of November 13, 2013, by and among Stonegate Mortgage Corporation, Crossline Capital, Inc. and Timothy R. Elkins (incorporated by reference to Exhibit 2.1 of the Registrant's Current Report on Form 8-K filed with the SEC on November 19, 2013 (File No. 001-36116)) |
3.1 | Third Amended and Restated Articles of Incorporation of the Registrant (incorporated by reference to Exhibit 3.1 to Stonegate Mortgage Corporation Amendment No. 1 to S-1 filed September 30, 2013 (File No. 333-191047)) |
3.2 | Third Amended and Restated Code of Regulations of the Registrant (incorporated by reference to Exhibit 3.2 to Stonegate Mortgage Corporation S-1 filed September 6, 2013 (File No. 333-191047) |
4.1 | Specimen Common Stock Certificate (incorporated by reference to Exhibit 4.1 to Stonegate Mortgage Corporation Amendment No. 1 to S-1 filed September 30, 2013 (File No. 333-191047)) |
4.2 | Form of Indenture (incorporated by reference to Exhibit 4.5 of Stonegate Mortgage Corporation S-3 filed January 14, 2015 (File No. 001-201507)) |
10.1 | Registration Rights Agreement, dated as of May 15, 2013, between Stonegate Mortgage Corporation and FBR Capital Markets & Co. (incorporated by reference to Exhibit 10.1 to Stonegate Mortgage Corporation S-1 filed September 6, 2013 (File No. 333-191047)) |
10.2† | Stonegate Mortgage Corporation Amended and Restated 2011 Omnibus Incentive Plan (incorporated by reference to Exhibit 10.2 to Stonegate Mortgage Corporation S-1 filed September 6, 2013 (File No. 333-191047)) |
10.3† | Option Agreement, dated as of May 15, 2013, between Stonegate Mortgage Corporation and James J. Cutillo (incorporated by reference to Exhibit 10.3 to Stonegate Mortgage Corporation S-1 filed September 6, 2013 (File No. 333-191047)) |
10.4† | Form of Option Agreement (incorporated by reference to Exhibit 10.4 to Stonegate Mortgage Corporation S-1 filed September 6, 2013 (File No. 333-191047)) |
10.5† | First Amendment to Employment Agreement, dated as of May 14, 2013, between Stonegate Mortgage Corporation and James J. Cutillo (incorporated by reference to Exhibit 10.6 to Stonegate Mortgage Corporation S-1 filed September 6, 2013 (File No. 333-191047)) |
10.6† | Stonegate Mortgage Corporation 2013 Non-Employee Director Plan (incorporated by reference to Exhibit 10.25 to Stonegate Mortgage Corporation Amendment No. 1 to S-1 filed September 30, 2013 (File No. 333-191047)) |
10.7† | Stonegate Mortgage Corporation 2013 Omnibus Incentive Compensation Plan (incorporated by reference to Exhibit 10.26 to Stonegate Mortgage Corporation Amendment No. 1 to S-1 filed September 30, 2013 (File No. 333-191047)) |
10.8† | Stonegate Mortgage Corporation Annual Incentive Plan (incorporated by reference to Exhibit 10.27 to Stonegate Mortgage Corporation S-1 filed December 6, 2013 (File No. 333-192715)) |
10.9† | Form of Restricted Stock Unit Award Agreement (incorporated by reference to Exhibit 4.3 to the Registration Statement on Form S-8 filed on November 26, 2013 (File No. 333-192557)) |
10.10† | Form of Option Agreement (incorporated by reference to Exhibit 4.4 to the Registration Statement on Form S-8 filed on November 26, 2013 (File No. 333-192557)) |
10.11† | Letter Agreement, dated as of August 7, 2014, between Stonegate Mortgage Corporation and Robert Eastep (incorporated by reference to Exhibit 10.11 to Stonegate Mortgage Corporation's Annual Report on Form 10-K filed for the year ended December 31, 2014) |
10.12 | Purchase/Placement Agreement, dated as of May 8, 2013, between Stonegate Mortgage Corporation and FBR Capital Markets & Co. (incorporated by reference to Exhibit 10.10 to Stonegate Mortgage Corporation S-1 filed September 6, 2013 (File No. 333-191047)) |
10.13 | Amendment No. 1 to Investor Rights Agreement, dated as of May 15, 2013, between Stonegate Mortgage Corporation and Stonegate Investors Holdings LLC (incorporated by reference to Exhibit 10.12 to Stonegate Mortgage Corporation S-1 filed September 6, 2013 (File No. 333-191047)) |
10.14 | Amendment No. 2 to Investor Rights Agreement, dated as of September 29, 2013, between Stonegate Mortgage Corporation and Stonegate Investors Holdings LLC (incorporated by reference to Exhibit 10.23 to Stonegate Mortgage Corporation Amendment No. 1 to S-1 filed September 30, 2013 (File No. 333-191047)) |
124
Exhibit Number | Description |
10.15 | Amendment No. 1 to Amended and Restated Shareholders’ Agreement, dated as of May 15, 2013, among Stonegate Mortgage Corporation, Stonegate Investors Holdings LLC, and certain Other Stockholders (incorporated by reference to Exhibit 10.14 to Stonegate Mortgage Corporation S-1 filed September 6, 2013 (File No. 333-191047)) |
10.16 | Amendment No. 2 to Amended and Restated Shareholders’ Agreement, dated as of September 29, 2013, among Stonegate Mortgage Corporation, Stonegate Investors Holdings LLC, and certain Other Stockholders (incorporated by reference to Exhibit 10.24 to Stonegate Mortgage Corporation Amendment No. 1 to S-1 filed September 30, 2013 (File No. 333-191047)) |
10.17 | Voting Agreement, dated as of May 15, 2013, among Stonegate Mortgage Corporation, Stonegate Investors Holdings LLC, and FBR Capital Markets & Co. (incorporated by reference to Exhibit 10.15 to Stonegate Mortgage Corporation S-1 filed September 6, 2013 (File No. 333-191047)) |
10.18 | Master Repurchase Agreement, dated as of February 28, 2013, by and between Bank of America, N.A. and Stonegate Mortgage Corporation (incorporated by reference to Exhibit 10.16 to Stonegate Mortgage Corporation S-1 filed September 6, 2013 (File No. 333-191047)) |
10.19 | Amendment No. 1 to Master Repurchase Agreement, dated as of May 12, 2014, by and between Bank of America, N.A. and Stonegate Mortgage Corporation (incorporated by reference to Exhibit 10.19 to Stonegate Mortgage Corporation's Annual Report on Form 10-K filed for the year ended December 31, 2014) |
10.20* | Amendment No. 2 to Master Repurchase Agreement dated as of June 10, 2015, by and between Bank of America, N.A. and Stonegate Mortgage Corporation |
10.21 | Mortgage Loan Participation Purchase and Sale Agreement, dated June 24, 2013, by and between Stonegate Mortgage Corporation and Bank of America, N.A. (incorporated by reference to Exhibit 10.17 to Stonegate Mortgage Corporation S-1 filed September 6, 2013 (File No. 333-191047)) |
10.22 | Amendment No. 4 to Master Loan Participation Purchase and Sale Agreement, dated as of May 12, 2014, by and between Bank of America, N.A. and Stonegate Mortgage Corporation (incorporated by reference to Exhibit 10.21 to Stonegate Mortgage Corporation's Annual Report on Form 10-K filed for the year ended December 31, 2014) |
10.23 | Amendment No. 5 to Master Loan Participation Purchase and Sale Agreement, dated as of November 4, 2014, by and between Bank of America, N.A. and Stonegate Mortgage Corporation (incorporated by reference to Exhibit 10.22 to Stonegate Mortgage Corporation's Annual Report on Form 10-K filed for the year ended December 31, 2014) |
10.24 | Amendment No. 6 to Master Loan Participation Purchase and Sale Agreement, dated as of March 2, 2015, by and between Bank of America, N.A. and Stonegate Mortgage Corporation (incorporated by reference to Exhibit 10.3 to Stonegate Mortgage Corporation’s Quarterly Report on Form 10-Q filed for the quarter ended March 31, 2015) |
10.25* | Amendment No. 8 to Master Loan Participation Purchase and Sale Agreement, dated as of June 10, 2015, by and between Bank of America, N.A. and Stonegate Mortgage Corporation |
10.26* | Amendment No. 10 to Master Loan Participation Purchase and Sale Agreement, dated as of November 27, 2015, by and between Bank of America, N.A. and Stonegate Mortgage Corporation |
10.27 | Master Repurchase Agreement, dated as of December 24, 2012, between Barclays Bank PLC and Stonegate Mortgage Corporation (incorporated by reference to Exhibit 10.19 to Stonegate Mortgage Corporation S-1 filed September 6, 2013 (File No. 333-191047)) |
10.28 | Amendment No. 2 to Master Repurchase Agreement, dated as of December 16, 2014, between Stonegate Mortgage Corporation and Barclays Bank PLC (incorporated by reference to Exhibit 10.24 to Stonegate Mortgage Corporation’s Annual Report on Form 10-K filed for the year ended December 31, 2014) |
10.29 | Mortgage Loan Participation Purchase and Sale Agreement, dated as of December 24, 2012, between Stonegate Mortgage Corporation and Barclays Bank PLC (incorporated by reference to Exhibit 10.20 to Stonegate Mortgage Corporation S-1 filed September 6, 2013 (File No. 333-191047)) |
10.30 | Amended and Restated Master Participation Agreement, dated as of July 1, 2013, between Stonegate Mortgage Corporation and Merchants Bank of Indiana (incorporated by reference to Exhibit 10.22 to Stonegate Mortgage Corporation Amendment No. 1 to S-1 filed September 30, 2013 (File No. 333-191047)) |
10.31 | Revolving Subordinated Loan Agreement, dated April 15, 2014, between Merchants Bancorp and Stonegate Mortgage Corporation (incorporated by reference to Exhibit 10.27 to Stonegate Mortgage Corporation’s Annual Report on Form 10-K filed for the year ended December 31, 2014) |
125
Exhibit Number | Description |
10.32 | Line of Credit Promissory Note, dated August 29, 2014, by Stonegate Mortgage Corporation for the benefit of Merchants Bank of Indiana (incorporated by reference to Exhibit 10.28 to Stonegate Mortgage Corporation’s Annual Report on Form 10-K filed for the year ended December 31, 2014) |
10.33 | Master Repurchase Agreement and Securities Contract, dated January 29, 2015, by and between Wells Fargo Bank, N.A. and Stonegate Mortgage Corporation (incorporated by reference to Exhibit 10.1 to Stonegate Mortgage Corporation’s Quarterly Report on Form 10-Q filed for the quarter ended March 31, 2015) |
10.34 | Amendment No. 1 to Master Repurchase Agreement and Securities Contract, dated as of January 29, 2015, by and between Wells Fargo, N.A. and Stonegate Mortgage Corporation (incorporated by reference to Exhibit 10.2 to Stonegate Mortgage Corporation’s Quarterly Report on Form 10-Q filed for the quarter ended March 31, 2015) |
10.35 | Participation Agreement, dated April 23, 2015, by and between Citizens Bank and Trust Company and Stonegate Mortgage Corporation (incorporated by reference to Exhibit 10.1 to Stonegate Mortgage Corporation’s Quarterly Report on Form 10-Q filed for the quarter ended June 30, 2015) |
10.36 | Master Loan Purchase and Servicing Agreement, dated September 11, 2015, by and between Guaranty Bank and Stonegate Mortgage Corporation (incorporated by reference to Exhibit 10.1 to Stonegate Mortgage Corporation’s Quarterly Report on Form 10-Q filed for the quarter ended September 30, 2015) |
10.37* | Amended and Restated Loan and Security Agreement, dated as of November 10, 2015, between EverBank and Stonegate Mortgage Corporation |
10.38* | Amended and Restated Master Repurchase Agreement, dated as of November 10, 2015, between EverBank and Stonegate Mortgage Corporation |
10.39† | Separation and Release Agreement, by and between Stonegate Mortgage Corporation and James J. Cutillo, dated September 1, 2015 (incorporated by reference to Exhibit 10.1 to Stonegate Mortgage Corporation’s Form 8-K filed on September 2, 2015) |
10.40† | Consulting Agreement, by and between Stonegate Mortgage Corporation and James J. Cutillo, dated September 1, 2015 (incorporated by reference to Exhibit 10.2 to Stonegate Mortgage Corporation’s Form 8-K filed on September 2, 2015) |
10.41† | Letter Agreement between Stonegate Mortgage Corporation and Richard A. Kraemer, dated September 1, 2015 (incorporated by reference to Exhibit 10.3 to Stonegate Mortgage Corporation’s Form 8-K filed on September 2, 2015) |
10.42† | Offer Letter from Stonegate Mortgage Corporation to James V. Smith, dated August 28, 2015 (incorporated by reference to Exhibit 10.4 to Stonegate Mortgage Corporation’s Form 8-K filed on September 2, 2015) |
21.1* | Subsidiaries of the Registrant |
23.1* | Consent of KPMG LLP |
31.1* | Certification of the Company’s Chief Executive Officer pursuant to Exchange Act Rules 13a-14(a)/15d-14(a), as adopted pursuant to Section 302 of the Sarbanes-Oxley Act of 2002 |
31.2* | Certification of the Company’s Chief Financial Officer pursuant to Exchange Act Rules 13a-14(a)/15d-14(a), as adopted pursuant to Section 302 of the Sarbanes-Oxley Act of 2002 |
32.1* | Certification of the Company’s Chief Executive Officer pursuant to 18 U.S.C. Section 1350, as adopted pursuant to Section 906 of the Sarbanes-Oxley Act of 2002 |
32.2* | Certification of the Company’s Chief Financial Officer pursuant to 18 U.S.C. Section 1350, as adopted pursuant to Section 906 of the Sarbanes-Oxley Act of 2002 |
101.INS* | XBRL Instance Document |
101.SCH* | XBRL Taxonomy Extension Schema Document |
101.CAL* | XBRL Taxonomy Extension Calculation Linkbase Document |
101.DEF* | XBRL Taxonomy Extension Definition Linkbase Document |
126
Exhibit Number | Description |
101.LAB* | XBRL Taxonomy Extension Label Linkbase Document |
101.PRE* | XBRL Taxonomy Extension Presentation Linkbase Document |
* Filed herewith | |
† Indicates management contract or compensation plan | |
127