Attached files
| file | filename |
|---|---|
| EX-10.34 - EXHIBIT 10.34 - JAMBA, INC. | v432668_ex10-34.htm |
| EX-10.33 - EXHIBIT 10.33 - JAMBA, INC. | v432668_ex10-33.htm |
| EX-32.1 - EXHIBIT 32.1 - JAMBA, INC. | v432668_ex32-1.htm |
| EX-31.2 - EXHIBIT 31.2 - JAMBA, INC. | v432668_ex31-2.htm |
| EX-31.1 - EXHIBIT 31.1 - JAMBA, INC. | v432668_ex31-1.htm |
| EX-21.1 - EXHIBIT 21.1 - JAMBA, INC. | v432668_ex21-1.htm |
| EX-23.1 - EXHIBIT 23.1 - JAMBA, INC. | v432668_ex23-1.htm |
| EX-32.2 - EXHIBIT 32.2 - JAMBA, INC. | v432668_ex32-2.htm |
UNITED STATES
SECURITIES AND EXCHANGE COMMISSION
Washington, D.C. 20549
FORM 10-K
| x | ANNUAL REPORT PURSUANT TO SECTION 13 OR 15(d) OF THE SECURITIES EXCHANGE ACT OF 1934 |
For the fiscal year ended December 29, 2015
OR
| ¨ | TRANSITION REPORT PURSUANT TO SECTION 13 OR 15(d) OF THE SECURITIES EXCHANGE ACT OF 1934 |
Jamba, Inc.
(Exact name of registrant as specified in its charter)
| Delaware | 001-32552 | 20-2122262 |
| (State or other jurisdiction of | (Commission | (I.R.S. Employer |
| incorporation) | File No.) | Identification No.) |
6475 Christie Avenue, Suite 150,
Emeryville, California 94608
(Address of principal executive offices)
Registrant’s telephone number, including area code: (510) 596-0100
Securities registered pursuant to Section 12(b) of the Act:
| Common Stock, par value $.001 per share | The NASDAQ Stock Market LLC |
Securities registered pursuant to Section 12(g) of the Act:
NONE
Indicate by check mark if the registrant is a well-known seasoned issuer, as defined in Rule 405 of the Securities Act. Yes ¨ No x
Indicate by check mark if the registrant is not required to file reports pursuant to Section 13 or Section 15(d) of the Act. Yes ¨ No x
Indicate by check mark whether the registrant (1) has filed all reports required to be filed by Section 13 or 15(d) of the Securities Exchange Act of 1934 during the preceding 12 months (or for such shorter period that the registrant was required to file such reports), and (2) has been subject to the filing requirements for the past 90 days. Yes x No ¨
Indicate by check mark whether the registrant has submitted electronically and posted on its corporate Web site, if any, every Interactive Data File required to be submitted and posted pursuant to Rule 405 of Regulation S-T (§232.405 of this chapter) during the preceding 12 months (or for such shorter period that the registrant was required to submit and post such files). Yes x No ¨
Indicate by check mark if disclosure of delinquent filers pursuant to Item 405 of Regulation S-K is not contained herein, and will not be contained, to the best of registrant’s knowledge, in definitive proxy or information statements incorporated by reference in Part III of this Form 10-K or any amendment to this Form 10-K. ¨
Indicate by check mark whether the registrant is a large accelerated filer, an accelerated filer, a non-accelerated filer or a smaller reporting company. See the definitions of “large accelerated filer,” “accelerated filer” and “smaller reporting company” in Rule 12b-2 of the Exchange Act (check one):
| Large accelerated filer ¨ | Accelerated filer x |
| Non-accelerated filer ¨ (Do not check if a smaller reporting company) | Smaller reporting company ¨ |
Indicate by check mark whether the registrant is a shell company (as defined in Rule 12b-2 of the Act). Yes ¨ No x
The aggregate market value of the registrant’s common stock, $0.001 par value per share, held by non-affiliates as of the last day of the registrant’s second fiscal quarter ended June 30, 2015 was $161,701,132 (based upon the closing sales price of registrant’s common stock on such date). For purposes of this disclosure, shares of common stock held by persons who held more than 5% of the outstanding shares of common stock and shares held by officers and directors of the registrant have been excluded in that such persons may be deemed to be affiliates. This determination of affiliate status is not necessarily a conclusive determination for other purposes.
The number of shares of common stock of Jamba, Inc. issued and outstanding as of March 7, 2016 was 17,947,195 and 15,088,378, respectively.
DOCUMENTS INCORPORATED BY REFERENCE
Portions of the Proxy Statement for the 2016 Annual Meeting of Stockholders (the “Proxy Statement”), to be filed within 120 days of the end of the fiscal year ended December 29, 2015, are incorporated by reference in Part III hereof. Except with respect to information specifically incorporated by reference in this Form 10-K, the Proxy Statement is not deemed to be filed as part hereof.
JAMBA, INC.
ANNUAL REPORT ON FORM 10-K
FISCAL YEAR ENDED DECEMBER 29, 2015
2
Special Note Regarding Forward-Looking Statements
We believe that some of the information in this document constitutes forward-looking statements within the meaning of Section 27A of the Securities Act of 1933, as amended, and Section 21E of the Securities Exchange Act of 1934, as amended. You can identify these statements by forward-looking words such as “may,” “will,” “would,” “could,” “should,” “might,” “project,” “potential,” “forecast,” “designed,” “goal,” “approximately,” “expect,” “anticipate,” “contemplate,” “believe,” “estimate,” “intend,” “plan,” and “continue” or the negative of those words or words of similar meaning. Any statement that is not a historical fact, including any other estimates, projections, future trends and the outcome of events that have not yet occurred, is a forward-looking statement. Examples of such statements include references to accelerated growth, new store openings, Company Store comparable sales, expense management and the like. You should read statements that contain these words carefully because they:
| · | discuss future expectations; |
| · | contain projections of future results of operations or financial condition; or |
| · | state other “forward-looking” information. |
We believe it is important to communicate our expectations to our stockholders. However, there may be events and circumstances in the future that we are not able to accurately predict or over which we have no control. The risk factors and cautionary language discussed in this document outline examples of risks, uncertainties and events that may cause actual results to differ materially and adversely from the expectations described in the forward-looking statements, including among other things:
| · | our business strategy and financial performance, including our BLEND Plan 3.0 and transition to an asset-light business model; |
| · | our revenue and customer volatility based upon weather and general economic conditions; |
| · | the operating results of our franchisees; |
| · | fluctuations in various food and supply costs; |
| · | competition and other risks related to the food services business; and |
| · | other factors discussed in the “Risk Factors” and “Management Discussion and Analysis of Financial Condition and Results of Operations” portion of this annual report. |
You are cautioned not to place undue reliance on these forward-looking statements, which speak only as of the date of this document.
All forward-looking statements included herein are expressly qualified in their entirety by the cautionary statements contained or referred to in this section. Except to the extent required by applicable laws and regulations, we undertake no obligation to update these forward-looking statements to reflect events or circumstances after the date of this document or to reflect the occurrence of unanticipated events.
You should be aware that the occurrence of the events described in the “Risk Factors” portion of this annual report, the documents incorporated herein and our other SEC filings could have a material adverse effect on our business, prospects, financial condition or operating results.
Background of Jamba, Inc.
Jamba, Inc. through its wholly-owned subsidiary, Jamba Juice Company, is a healthy, active lifestyle brand with a robust global business driven by a portfolio of franchised and company-owned Jamba Juice® stores and licensed JambaGO® and Jamba Juice Express™ formats. The Jamba® brand includes innovative product platforms and both licensed and company driven consumer packaged goods. We are a leading restaurant retailer of “better-for-you” specialty food and beverage offerings which include great tasting, whole fruit smoothies, fresh squeezed juices and juice blends, Energy Bowls, and a variety of food items including, hot oatmeal, breakfast wraps, sandwiches, Artisan Flatbreads, baked goods, and snacks. Jamba Juice Company continues to expand the Jamba brand by direct selling of consumer packaged goods (“CPG”) products, and by licensing its trademarks for CPG products sold through retail channels such as grocery stores, warehouse clubs, and convenience stores.
3
Jamba, Inc. was incorporated in Delaware on January 6, 2005 as a blank check company formed to serve as a vehicle for the acquisition of a then unidentified operating business. On July 6, 2005, Jamba, Inc. consummated its initial public offering. On March 10, 2006, Jamba, Inc. entered into an Agreement and Plan of Merger with Jamba Juice Company, which first began operations in 1990. The merger between Jamba, Inc. and Jamba Juice Company was completed on November 29, 2006.
Unless the context otherwise requires, Jamba, Inc., the registrant, together with Jamba Juice Company, are referred to in this Form 10-K annual report (“Form 10-K”) as the “Company”, “Jamba Juice”, “Jamba”, “we”, “us” and “our.” Information regarding the Company’s fiscal periods is included in Item 7, “Management’s Discussion and Analysis of Financial Condition and Results of Operations.”
Fiscal Year
Our fiscal year ends each year on the Tuesday closest to December 31st and therefore we have a 52 or 53 week fiscal year. Fiscal Years 2015, 2014, and 2013, all 52 week fiscal years, ended on December 29, 2015, December 30, 2014, and December 31, 2013, respectively.
Narrative Description of Business
As of December 29, 2015, there were 893 Jamba Juice stores globally, consisting of 70 Company-owned and operated stores, all located in the United States (“Company Stores”), 748 franchisee-owned and operated stores (“Franchise Stores”) in the United States, and 75 Franchise Stores in international locations (“International Stores”), collectively the (“Jamba System”). The JambaGO® business consists of over 2,000 licensed units located across the United States. JambaGO® units are typically installed in K-12 schools, colleges, universities, Target Cafes®, as well as other captive venues. During 2015, we completed the move from a primarily company-store to a franchise-business model by refranchising 179 locations. Currently 92% of our stores are currently owned and operated by franchisees. As of December 29, 2015, Jamba Juice had a retail consumer products program that included direct selling of CPG products under the Jamba brand name, and licensing its trademarks to CPG products sold through retail channels such as grocery stores, warehouse clubs and convenience stores.
Our Strategic Priorities
The BLEND Plan is our strategic roadmap to continue to transform Jamba into a global lifestyle brand and a best-in-class franchisor, as well as our commitment to creating greater shareholder value through a number of strategic initiatives. Our BLEND Plan priorities include driving the expansion of our franchise base globally, driving store level profitability through four-wall cost optimization plans, continuing to develop brand equity and to be the clear leader in product platforms like smoothies, juices, and bowls. In addition, we will focus on our strategic initiatives of reducing our operating costs through cost-saving reductions and efficiencies and aggressively returning capital to shareholders. Our BLEND Plan consists of the following components:
Brand activation and leadership strength;
Leverage an innovative in-store experience to drive four-wall store profitability;
Expand retail footprint on a global basis;
New products, leadership in smoothies, juice, and bowls; and
Drive our strategic initiatives of an asset-light business model, a reduction of operating costs and an aggressive return of capital to shareholders to enhance shareholder value.
Additionally, our core vision, to inspire and simplify healthy living, permeates the Jamba culture. Our culture is a unique set of core values and actions that manifest themselves in team members executing at the highest levels of service while expressing their passion for our brand. Consistent with our corporate social responsibility efforts, Jamba actively inspires and engages team members to have a broader impact in the communities we serve through volunteering, sponsoring school gardens, youth fitness clinics and youth sports, and fundraising for health- and fitness-related causes. These efforts also inspire our team members to enhance their leadership skills and improve their personal health and wellness. We have been recognized in our local communities and nationally as a leader in employee engagement and wellness, and we actively cultivate our team members’ connection with our vision and values, so they in turn energize our guests with an uplifting customer experience.
4
Brand activation and leadership
Through our ongoing efforts to build total brand value we continue to position Jamba as a leading global health and wellness brand. With 92% of our stores now franchisee-owned, we continue to increase our focus on building the brand on a local level, leveraging multi-channel brand marketing tactics, including the expansion of consumer loyalty programs, the development of engaging local marketing promotions and high-performing social media communications. Local brand activation plays a critical role and we believe it will be a significant revenue and consumer traffic driver for our franchisees. By providing our franchisees with tools and technologies that target their customers through email, social media, radio and out-of-home advertising, we are helping them reach consumers in their immediate trade areas. We continue to test television in key markets in order to assess the potential of the medium for our brand.
Through ongoing innovative product development we continue to meet the needs of today’s increasingly health-conscious consumer. We are addressing our customers’ health and wellness needs on both a national and international level through offerings centered on “Whole Food Nutrition,” which encompass blending juices and combining whole fruits and vegetables into nutritious and convenient beverages and product offerings across all day-parts. Increased trial and awareness of all new products are driven via in-store point of purchase, online and social media and through a robust public relations campaign in major media markets.
By leveraging technology and online services such as text messaging, email, and local social media tools, we enhance and simplify the Jamba experience for today’s socially connected, time-constrained consumers. We continue to upgrade the features of our Jamba Juice mobile application (app), helping customers locate stores, order ahead, speed up transactions and improve the online and in-store experience. We see markedly increased engagement in our social media platforms and on the improved Jamba website. With well over 2 million members, our Jamba Insider Rewards (JIR) program provides incentives for our most loyal customers to make increased visits to Jamba stores. Through JIR, we distribute monthly emails to our members informing them of new products and promotions.
We are actively engaged in the most popular social media platforms, delivering engaging content and the power of influencers to actively promote Jamba to their own followers in Facebook®, YouTube® and other social media platforms. These influencers post about Jamba product nutritional benefits in an authentic voice, exponentially amplifying our own marketing communications and reaching more consumers most interested in health and wellness. We also continue to command a strong following on Facebook, Twitter® and Instagram® with postings that receive increasing favor with Jamba fans. Our YouTube channel attracts fans and increases awareness with fun and informative videos of our high-profile influencers and celebrity athletes.
Serving our communities has been a hallmark of Jamba from the Company’s beginning, and we continued that spirit in 2015. We launched our spring and fall school garden grant program, partnering with the National Gardening Association® and their Kid’s Gardening program. We continued to drive awareness of the need to encourage strong dietary and fitness habits in kids through our Team Up™ For a Healthy America program and through partnerships with the American Heart Association®, National Gardening Association and the GENYOUth Foundation. Our Jamba fundraising card helps support schools in Jamba markets across the country.
Jamba launched several successful marketing campaigns during the year, which are designed to drive significant traffic into our Franchise and Company Stores. We worked closely with local franchisees on numerous local promotions designed to increase trial and awareness.
Leverage an innovative in-store experience to drive four-wall store profitability
We completed our move to an asset-light business model during our 2015 fiscal year and we now have 92% of our locations owned by experienced franchisees. One of the primary areas of focus is on franchisee profitability. Areas that we have highlighted are driving profitable traffic and continuing to find ways to reduce the cost of goods used in our product platforms. Those initiatives will also continue to improve Franchise and Company Store margins, along with ongoing cost control programs in critical areas such as labor, occupancy and other controllable expenses
Our innovative juice and bowls platforms continue to show strong performance, and will be key drivers toward the transformation of the brand and toward driving continued positive growth.
Expand retail footprint on a global basis
As we continue on our path as an asset-light business, our focus will be on expanding our retail footprint globally through franchising. As described below, our focus is on domestic and international growth, and on both traditional and non-traditional store formats, including Jamba Juice Express™ and JambaGO®. Jamba Juice store locations at the end of fiscal 2015 were comprised of approximately 8% Company Store locations and 92% Franchise and International Store locations, globally.
5
Jamba Juice - Domestic
We have a portfolio of flexible store formats that can be utilized in a number of different venues. We generally categorize our stores as either traditional or non-traditional locations. A traditional location is characterized as a business premise that exists primarily as a Jamba Juice store. Traditional stores average approximately 1,000 - 1,200 square feet in size. These stores are located either in major urban centers or in suburban strip mall centers. As of December 29, 2015, there were 587 traditional Jamba Juice store locations. A non-traditional location is characterized as a Jamba Juice store located within another primary business, in conjunction with another business or at institutional settings, such as colleges and universities, entertainment venues, shopping malls, transportation centers, supermarkets and airports. A “captive” audience is a common characteristic of non-traditional locations. We believe one benefit of the development of non-traditional stores is to increase awareness of the Jamba Juice brand to complement the traditional stores in the area. As of December 29, 2015, there were 231 non-traditional Jamba Juice store locations.
During 2015, we announced a franchise incentive program designed to accelerate our growth and support our asset-light business model by attracting a large number of interested and capable franchise operators in both new and existing markets. We believe this program will help our efforts to double our domestic store openings rate to between 7% and 9% per year.
We continue to innovate in the design of traditional and non-traditional stores. Our goal is to vary the size and format of our stores to allow us to locate them in or near a variety of settings. Our flexibility in store construction enables us to develop stores in a wide range of venues, broadening the visibility of the Jamba brand and giving more customers easier, more convenient access. We believe format flexibility will help us to attract qualified franchisees and assure them of potentially achieving a higher return on their investment in capital expenditures. In 2015, we expanded on a significant refresh and remodel of our Company Stores in order to provide a contemporary and fresh experience for our customers. We completed 146 store refreshes, which included upgrading the stores’ facilities to effectively and efficiently serve our blended, whole food and premium juice platforms.
The Jamba Juice Express™ concept (formerly known as Smoothie Stations™) was launched in 2012. The concept is designed to target venues with a smaller footprint than our historical, non-traditional store. Jamba Juice Express™ units offer a limited menu of the brand’s top selling smoothies and juices as compared to our traditional stores. Our Jamba Juice Express™ platform is ideally suited for venues such as colleges and universities, grocery stores, airports, hospitals and business cafeterias. As of December 29, 2015, there were 42 Jamba Juice Expresses™ open in 19 states. Jamba Juice Expresses™ fall within the non-traditional store category and are included in the total Franchise Stores count.
The JambaGO® concept, which we developed in 2012, targets venues servicing captive audiences. The JambaGO® format is a small footprint, low-capital and low-labor machine format, and has proven to be an innovative and differentiated solution for food service providers seeking healthier beverage options for their constituents. The typical venue for a JambaGO® unit has a significant demand for high volumes, requires high-speed service, where a full-sized Jamba Juice store or kiosk would not be feasible. Such venues include retail store cafés or restaurants, K-12 schools, colleges and universities, grocery and convenience stores, stadiums, theaters, event centers and select airport locations. The JambaGO® format has been enabling Jamba to rapidly expand brand presence. During 2013, we launched JambaGO® units at over 1,000 café locations in Target Stores in the United States. The number of JambaGO® units in operation at December 29, 2015 was over 2,000.
As of December 29, 2015, we had 818 Jamba Juice store locations in the United States, operating in 34 states and Washington, D.C., consisting of 70 Company Stores and 748 Franchise Stores. We lease the real estate for all of our Company Stores. Our market planning has shown that there is potential for a total of at least 2,700 Jamba Juice stores in the United States which would meet our current store opening criteria. During fiscal 2015, we opened 51 new Franchise Stores, closed 23 Franchise Stores, acquired 2 Franchise Stores that are currently operated as Company Stores, and completed the refranchise of 179 Company Stores under our accelerated refranchising initiative.
Franchise Opportunity
Through our franchising program, we offer franchisees choices in store location, format and number of stores they wish to operate including (i) traditional “stand alone” stores, (ii) non-traditional store venues such as mall, university, supermarket or transportation center locations; and (iii) multi-unit development agreements which grant the franchisee exclusive rights to develop and operate a specified number of stores within a specified period of time and geographic area.
As of December 29, 2015, we had 32 development agreements that contain rights to develop additional Franchise Stores. The exclusive territories covered by these agreements include selected markets in the states of Arizona, California, Colorado, Connecticut, Florida, Georgia, Hawaii, Kansas, Louisiana, Minnesota, Missouri, Nevada, New York, North Carolina, Oregon, Pennsylvania, Tennessee, Utah, Washington, and Wisconsin. Seventeen of the 32 development agreements were entered in connection with refranchising transactions, where a purchaser of Company Stores also committed to develop new Franchise Stores.
6
To help maximize the growth of our non-traditional franchise development, we continue to strengthen our relationships with beverage and food concessionaires operating at venues such as colleges, universities, airports and other transportation centers, as well as other retail and entertainment venues. In addition to our own efforts, we are regularly approached by concessionaires and contract feeders whose independent research has identified us as ideal for non-traditional venues where they have secured exclusive development rights from venue owners. When it fits our expansion strategies, these opportunities are incorporated into our own plans.
Our comprehensive market planning and site selection process helps guide the successful execution of our growth strategy. We have processes for identifying, analyzing, and assigning undeveloped markets for either Company Store or Franchise Store development. Once a market is selected, we carefully screen trade areas for demand based on demographic, psychographic and Jamba Juice specific variables to assess the risk of developing a store or permitting a franchisee to do so. We review trade areas to ensure that they meet our guidelines for new store development and begin the site selection or approval process. Once a trade area is approved, we carefully screen prospective locations for visibility, traffic patterns, ease-of-use and co-tenancy for potential Company Store and Franchise Store locations. Our expansion strategy involves using this market planning and site selection process to leverage areas of demand within each market. We intend to use this approach to encourage the clustering of stores in specific geographic areas of demand, which we believe will drive brand awareness, improve operating and marketing efficiencies for Franchise Stores while leveraging the costs associated with regional supervision. Distribution efficiencies can also be realized through this strategy. In addition, we believe the ability to hire qualified team members is enhanced in markets where Jamba is a broadly recognized brand.
International Franchising Opportunity
Our international partners work closely with us to build the Jamba Juice brand and implement the Jamba Juice system in their local geographic markets, as well as to maximize revenue and margin growth opportunities, recognizing commercial, cultural and dietary diversity in each market. The number of International Stores grew from 62 as of December 30, 2014 to 75 as of December 29, 2015, with stores located in South Korea, the Philippines, Mexico, Canada, Taiwan, and the Middle East. As of December 29, 2015, we had seven master developers with commitments to open an aggregate of 560 stores internationally, 200 planned during the next three to four years.
At the end of fiscal 2015, we had international master development agreements with partners in Indonesia, Thailand, South Korea, the Philippines, Mexico and the countries of the Gulf Cooperation Council (Bahrain, Kuwait, Oman, Qatar, Saudi Arabia, and the United Arab Emirates). Our partner in Taiwan, Quan Hung Gourmet Company, opened the first Jamba Juice store in Taiwan on October 30, 2015. In 2015, we signed a master franchise development agreement with PT Sari Gemilang Makmur (“PT Sari”), a subsidiary of PT Mitra Adiperkasa Tbk, in Indonesia for 70 stores over 10 years. PT Sari operates over 1,800 retail outlets in 65 cities throughout Indonesia. We expect the first store in Indonesia to open in the first half of 2016. In 2015, we signed a master franchise development agreement with King of Juices Company, LTD (“King of Juices”), in Thailand for 30 stores over 10 years. King of Juices is a new entity led by Ms. Ausanee Mahagitsiri, a seasoned executive who successfully operates other food & beverage concepts in Thailand. We expect the first store in Thailand to open by third quarter 2016.
Our brand and products have international appeal and we continue to engage in discussions with additional potential partners regarding the expansion of Jamba Juice stores into new international markets. The success of further international expansion will depend on, among other things, local acceptance of the Jamba Juice concept and menu offerings, and our ability to attract qualified franchise partners. Our market planning has shown that there is potential for at least 1,500 total international Jamba Juice stores which would meet our current store opening criteria. Our international developer agreements take the form of development and franchise agreements under which we typically receive an initial territory fee, store opening fees, and ongoing royalty revenues based on a percentage of sales.
New products - leadership in smoothies, juices, and bowls
Our long-term growth prospects are driven by our product innovation around our core offerings of smoothies, juices, and bowls. Product innovation is a high priority, and our menu items are designed to offer our customers products that are relevant to a healthy, active lifestyle. Our research and development team, composed of food scientists, quality assurance specialists and food industry experts, is continually developing and testing new and improved menu items that support not only the integrity of the Jamba Juice brand but our commitment to offering healthy, innovative and great tasting products made from high quality ingredients.
Our research and development team continually seeks to enhance the product offerings available to customers, and where possible, reduce product and labor costs. Our research and development process includes both the development of new products and the optimization of existing menu items to ensure only the most appealing products are developed and offered to customers. All of our menu options meet our four mandatory core standards: 0 grams of trans-fat, no high fructose corn syrup, no artificial preservatives, and no artificial flavors.
Drive to an asset-light business model and other strategic initiatives to enhance shareholder value
We have moved aggressively to an asset-light business model that now incorporates a 92% franchise-location organization, increased from 70% in 2014. This transition to an asset-light business model is designed to facilitate a more flexible cost structure which would enable faster execution and enhanced focus on growth initiatives and allow us to pursue additional cost savings.
We previously announced our plan to repurchase up to $45 million of our stock as a way to aggressively return capital to shareholders to enhance shareholder value. In addition, we plan to continue to examine our capital allocation strategies to continue to return value to our shareholders.
7
Domestic Store Operations
Franchise Store Management
We continuously review Franchise Store operations, principally through our Franchise Business Consultants ("FBCs") who are Company representatives that work closely with franchise owners to review the financial health, operations, practices and procedures of our franchisees. We maintain a Franchise Advisory Council (“FAC”), which formalizes a channel of communication through a representative group of franchisees to provide advice, counsel and input to us on important issues impacting our business. Our franchise agreement calls for franchise partners to meet certain operational and maintenance requirements intended to align the operating processes system-wide around one set of standards. Performance is diligently monitored by FBCs, who also provide feedback whenever appropriate.
Company Store Management
We believe operational excellence throughout the Jamba System is vital to our success. Our Company Store field and store operations teams play a critical role in maximizing the performance of our Company Stores across the system. We recruit and retain leaders with broad experience in management and in our industry. Our field leadership consists of a combination of an Operational Director and District Managers to support our Company Store operations.
Our Store Excellence Program is designed to improve operational execution and performance by establishing comprehensive standards, which we expect all of our stores to achieve and maintain. In addition, we implemented a bonus program that offers Company Store managers rewards on achievement of customer experience, sales, and profit goals. These factors continue to positively impact customer satisfaction and help ensure that all stores in the Jamba System are delivering against the key drivers of customer satisfaction on a consistent basis. We believe team members are the key to our success and support the development of a culture that fosters personal interaction, mutual respect, trust, empowerment, enthusiasm and commitment.
Maintaining a culture and a management style that embodies healthy, active lifestyles in an authentic, fun, friendly and efficient manner in Company Stores, as well as Franchise Stores, is essential as we continue to expand, and we believe that it is critical to developing our brand and ensuring our continued success.
Training
We conduct various training programs for franchise partners, team members, support center staff and our leadership team on a regular basis. We are dedicated to providing a meaningful experience for all employees, with ample opportunity to develop leadership skills as they move up through the organization. Our training programs include formal programs such as the Manager-in-Training programs for new managers and informal one-on-one discussions held between General Managers, Franchise Business Consultants, District Managers and Senior Directors of Operations. All of our training programs reinforce the importance of strong customer service and sales skills. We also make training materials and best practice information available to our franchisees to help create, preserve, and support a singular culture of excellence within all of the stores that comprise our system.
Recruiting and Retention
We carefully screen potential team members to ensure that they embody our core values and fit into our culture. By maintaining this emphasis and encouraging responsibility and accountability at every level, we believe that we have created a sense of team member loyalty and an open and interactive work environment, resulting in a highly passionate workforce. Our team members are paid competitive wages and are offered opportunities for advancement. In addition to competitive wages, store managers are eligible for performance-based bonuses. In order to preserve a singular culture within the stores that comprise the Jamba System, we provide best practice information, qualifications and other relevant information to assist franchisees with hiring and retention.
8
Advertising and Marketing
In 2015, much of our advertising and marketing efforts focused on the roll out of our juice platform and on social media. We also continued to reaffirm our commitment to providing healthier food and beverage options to consumers, leveraging our blending and juicing heritage to address the fast-growing consumer trend focused on juicing. As consumers increasingly turned to healthy beverages to get their daily requirement of fruits and vegetables, we accelerated the expansion of our freshly-squeezed juices, blended with nutritious whole foods such as kale, ginger, cucumbers, oranges and chia seeds. In June, we became the leading retailer of made-to-order, freshly-squeezed juice with availability in over 500 Jamba stores across the U.S., maintaining our position as a leading health and wellness brand. With a strong focus on the juice platform and other product introductions, we continued our mission to deliver a variety of innovative products and programs designed to inspire and simplify healthy living by supporting better eating habits and engaging consumers in programs that foster increased physical activity.
Through our “Blend in the Good®” consumer communication platform, we focused consumers’ attention on the fresh produce, fruit and vegetables that are used to make Jamba juices, smoothies and bowls, underscoring our commitment to providing healthier food and beverage options. The Blend in the Good campaign reached across multiple mediums, including print, radio, public relations, in-store point-of-purchase material, online and in social media. The number of Jamba Facebook followers increased to approximately 1.8 million in 2015, and we made strong progress in leveraging other social media platforms such as Twitter, Instagram and YouTube. Membership in our “Jamba Insiders” loyalty program accelerated, passing the one million milestone in July. We partnered with the technology company Spendgo® to provide consumers with an easy-to-use way to participate in the loyalty program.
Jamba marketing, promotional and public relations activities are designed to promote the Jamba brand image and differentiate it from competitors. Marketing and promotional efforts focus on providing consumers with simple, easy-to-adopt solutions for pursuing a healthy active lifestyle and we continuously endeavor to improve our social responsibility and environmental practices to achieve long-term sustainability. In 2015, we officially launched our core CSR platform, “Team Up For a Healthy Whirl’d”, through which we encourage our consumers, business and community partners, employees and store Team Members to join Jamba Juice in making a difference for consumers and the communities we serve.
The Jamba Healthy Living Council, comprised of nationally recognized nutrition and fitness experts, helped us to encourage consumers to consume more fruits and vegetables via our broad offering of healthy beverages through videos, articles, online webinars, and podcasts, on the Jamba website, and at live events. In 2015, these nutrition and fitness experts offered insights at key industry conferences like the American Dietetic Association’s Food and Nutrition Conference & Expo and the School Nutritionist Association Convention. As some are parents themselves, the members of the Healthy Living Council relate to the dietary and fitness concerns of parents and families. The council also provided easy-to-follow nutrition and fitness tips for families and those seeking to live healthy lifestyles.
We continued to work toward improving childhood nutrition and fitness though products, programs and delivery mechanisms, providing all-fruit smoothies to schools with our JambaGO® units and supporting nutrition and fitness education through our “Team Up For a Healthy America” program. In 2015, our Team Up For a Healthy America campaign again provided schools across the country with much-needed athletic equipment. We leveraged our partnership with the National Gardening Association to award 38 garden grants to schools across the nation, and with the GENYOUth Foundation we hosted a series of events including a town hall in St. Louis that gathered local leaders in business, education, politics, medicine, and community service in an engaging discussion focused on building partnerships across the private and public sectors to advance childhood wellness in that city.
We enhanced our relevance to Millennials through popular lifestyle platforms. We leveraged influencers and cultural icons like YouTube fitness entrepreneur Cassie Ho to encourage Millennials to include Jamba in their daily diets.
The Jamba brand continued to be included in the culture and conversations of consumers, as we were featured in stories appearing in nationally syndicated journals and newspapers, including Nation’s Restaurant News, Franchise World, QSR Magazine, Forbes, and The Wall Street Journal. Jamba had a strong presence in national health-oriented publications such as Men's Fitness, Shape, and cultural publications like STAR and OK TV!. We were highly visible on numerous popular websites including mensfitness.com, OKTV!.com, and RadarOnline, the number one online resource for celebrity news. Tennis superstar Venus Williams promoted Jamba on national television talk shows and on Extra!, the nightly entertainment show. Our participation in local fundraising events also helped capture a significant amount of coverage from local television and radio stations. Jamba was recognized by the White House for the fourth year in a row for our youth job creation program as a leading example of how private sector companies can work with local leaders to improve communities. In California, Jamba won awards for service to the community and was recognized as a great place to work.
Our marketing efforts in 2015 significantly extended our reach and relevance to consumers. By improving our use of technology, expanding our reach into various lifestyle activities, helping communities and leading the charge to improve the health and wellness of our nation’s youth, we have continued to inspire and simplify healthy living and have made significant progress toward our goal of being a leading health and wellness brand.
9
Product Supply
We are committed to providing only the finest smoothies, juices, bowls, and other food products. Smoothie, juice, and bowl products depend heavily upon supplies of fresh and individually quick-frozen (IQF) fruit and vegetables. We have an established nationwide fresh produce supply chain in order to facilitate our new made-to-order freshly squeezed juice platform. The quality of each beverage depends to a large degree on the quality of the basic fruit and vegetable ingredients from which it is made. It is essential that the supply of fruit and vegetables is of the highest quality and is consistent throughout the year. To achieve these goals we purchase our projected requirements for the coming year from suppliers at the height of the season. The supply and price of fresh and IQF fruit and vegetables are dependent upon the supply and demand at the time of purchase and are subject to volatility. Supply and price can be affected by multiple factors in the producing regions, including weather, natural disasters and regional political and economic conditions.
We buy certain produce and dairy using fixed priced or to-be-fixed priced purchase commitments to secure adequate supply of quality ingredients for our products. As a result, we have purchase obligations with certain suppliers for certain produce and dairy for various terms typically ranging from one year to three years. We depend on our relationships with our suppliers for our supply of produce, dairy and other products. While two distributors accounted for approximately 98% of the supplies delivered to our Company and Franchise Stores, we believe, based on our established relationships with our suppliers, the risk of non-delivery on our purchase commitments is remote.
Our supply chain, purchasing and product organization are completely funded by all stores across the Jamba System. This funding contributes to the cost of system-wide procurement and management of our supplies and supports our suppliers. The program allows for a mark-up of certain products purchased by Company Stores and Franchise Stores, which is subsequently rebated back to the Company by the supplier.
Competition
The retail beverage and food industry remains highly competitive and fragmented. Restaurants compete based on a number of factors, including quality, price-value relationships, customer service, name recognition, employee hiring and retention and location. We compete with international, national, regional and local retailers of beverage and food products, including quick service restaurants/fast food establishments, coffee shops, juice bars, donut shops, frozen yogurt shops and grocery stores. Competition in the beverage and food market is fragmented, and increasingly so, and a major competitor with substantially greater resources than us could enter the market at any time and compete directly against Jamba Juice stores.
We compete most directly with regional smoothie stores, most of which are franchises of other smoothie brands. The rising popularity of convenient and healthy food items resulted in increased competition from non-smoothie retailers as they increased their offerings of smoothies and other juice-related products, and as we increase our food offerings, we have placed ourselves into direct competition with other quick serve food concepts with well established businesses.
Additionally, we face increasing competition from specialty juice bars and stores, which focus on made-to-order juices, juice blends, cold-press juices and fasting/cleansing packages. Many of these brands have cold-press direct-to-consumer capabilities that multiply the geographic reaches of their stores.
We also face intense competition from both restaurants and other specialty retailers for suitable sites for new stores and qualified personnel to operate both new and existing stores. There can be no assurance that we or our franchisees will be able to continue to secure adequate sites at acceptable rent levels or that we or franchisees will be able to attract a sufficient number of qualified personnel to operate our stores.
10
Government Regulation and Environmental Matters
Government Regulation. We and our franchisees are subject to extensive and varied federal, state and local government regulation, including regulations relating to public health and safety and zoning codes. We operate each of our stores in accordance with standards and procedures designed to comply with applicable codes and regulations. However, if we or our franchisees could not obtain or retain food or other licenses, it would adversely affect our operations. Although we have not experienced, and do not anticipate, any significant difficulties, delays or failures in obtaining required licenses, permits or approvals, any such problem could delay or prevent the opening of, or adversely impact the viability of, a particular store or group of stores.
California and other states and local jurisdictions have enacted laws, rules, regulations and ordinances which may apply to the operation of a Company Store or a Franchise Store, including those which (a) establish general standards, specifications and requirements for the construction, design and maintenance of the store premises; (b) regulate matters affecting the health, safety and welfare of our customers, such as general health and sanitation requirements for restaurants; employee practices concerning the storage, handling, cooking and preparation of food; special health, food service and licensing requirements; restrictions on smoking; exposure to tobacco smoke or other carcinogens or reproductive toxicants and saccharin; availability of and requirements for public accommodations, including restrooms; (c) set standards pertaining to employee health and safety and mandatory health insurance; (d) set standards and requirements for fire safety and general emergency preparedness; (e) regulate the proper use, storage and disposal of waste, insecticides and other hazardous materials; (f) establish general requirements or restrictions on advertising containing false or misleading claims, or health and nutrient claims on menus or otherwise, such as “low calorie”, “healthy” or “organic”; (g) establish requirements concerning withholdings and employee reporting of taxes on tips, (h) regulate the amount or type of ingredients in food and beverages, and (i) regulate or ban the use of particular packaging materials.
In order to develop and construct more stores, we, or our franchisees, need to comply with applicable zoning, land use and environmental regulations. Federal and state environmental regulations have not had a material effect on our operations to date, but expansion of our menu offerings or more stringent and varied requirements of local governmental bodies with respect to zoning, land use and environmental factors could delay or even prevent construction and increase development costs for new stores. We, and our franchisees, are also required to comply with the accessibility standards mandated by the U.S. Americans with Disabilities Act, which generally prohibits discrimination in accommodation or employment based on disability. We may, in the future, have to modify stores, for example, by adding access ramps or redesigning certain architectural fixtures, to provide service to or make reasonable accommodations for disabled persons. While these expenses could be material, our current expectation is that any such action will not require us to expend substantial funds.
We are subject to the U.S. Fair Labor Standards Act, the U.S. Immigration Reform and Control Act of 1986 and various federal and state laws governing various matters including minimum wages, overtime meal and rest periods, accommodations to certain employees, and other working conditions. Complying with these rules subjects us to substantial expense and can also expose us to liabilities from claims for non-compliance. In addition, we and our franchisees pay a significant number of our hourly staff at rates consistent with, but higher than, the applicable federal, state or local minimum wage. Accordingly, increases in the minimum wage would increase our labor cost. We are also subject to various laws and regulations relating to our current and any future franchise operations. See “Risk Factors - Governmental regulation may adversely affect our ability to open new stores or otherwise adversely affect our existing and future operations and results.”
We are also subject to various federal and state laws that regulate the offer and sale of franchises and aspects of the licensor-licensee relationships. Many state franchise laws impose restrictions on the franchise agreement, including the duration and scope of non-competition provisions, the ability of a franchisor to terminate or refuse to renew and the ability of a franchisor to designate sources of supply. The Federal Trade Commission, or the FTC, and some state laws also require that the franchisor furnish to prospective franchisees a franchise disclosure document that contains prescribed information and, in some instances, require the franchisor to register the franchise offering.
11
Environmental Matters
We and our franchisees are subject to federal, state and local environmental laws and regulations concerning the use of, among others, polystyrene products, and several counties in which our stores are located have already banned the use of our polystyrene cups. We continued to make progress on certain eco-sustainability initiatives first launched in 2009, including phasing out the use of polystyrene cups, as well as increasing the use of recyclable products, and reducing waste. At the beginning of 2016 we launched plastic cups, which are more easily recycled than the double-walled coated paper cups we introduced in 2013. Our other green initiatives include the use of more environmentally friendly packaging for our cup carriers, oatmeal cups and lids, breakfast clear cups and lids, spoons and napkins, all of which are made from recycled material. We have also reduced the amount of corrugated cardboard used for bulk shipping, reduced labeling requirements, and reduced freight, resulting in lower fuel emissions. We have established several optimization programs to reduce waste, such as participation in recycling and composting programs for our food waste, where it is feasible for us to do so.
Trademarks and Domain Names
We own and/or have applied to register numerous trademarks and service marks in the United States and in other jurisdictions throughout the world. Some of our trademarks, including Jamba Juice® and the Jamba logo are of material importance to the Company. The duration of trademark registrations varies from country to country. However, trademarks are generally valid and may be renewed indefinitely as long as they are in use and/or their registrations are properly maintained. In addition, the Company has registered and maintains numerous Internet domain names, including “jamba.com” and “jambajuice.com.”
Management Information Systems
Each Company Store has computerized point-of-sale registers, which collect transaction data used to generate pertinent information, including sales transactions and product mix. Additionally, the point-of-sale system is used to authorize, batch and settle credit card data. All product prices are programmed into the point-of-sale register from the Company’s corporate office. Franchise Stores generally use the same point-of-sale registers as Company Stores, but may elect to use alternative systems provided Company approval and certain information is shared with the Company. Franchisees set their own menu prices.
Company Stores use the Company’s licensed labor management software to record employee time clock information, schedule labor, and provide management reports. Company Stores and many Franchise Stores use the Company’s licensed food cost management software to improve inventory management and provide management reports.
Our continued focus on technological and procedural enhancements, in areas such as labor and inventory management, has relieved our store managers from manual administrative tasks and enables them to better focus on delivering exceptional customer service.
Seasonality
Our business is subject to day-to-day volatility based on weather and varies by season. A significant portion of the Company’s revenue is realized during the second and third quarters of the fiscal year, which include the summer months. The fourth quarter of the fiscal year, which encompasses the winter months and the holiday season, has traditionally been our lowest revenue volume quarter. Our business will likely continue to be subject to seasonal patterns for the foreseeable future, given that the largest portion of our sales continues to be from the sale of smoothies during the warmer parts of the year. Because of the seasonality of the business, results for an individual quarter are not necessarily indicative of the results, which may be achieved for the full fiscal year.
12
Executive Officers
Our current executive officers, their respective ages and positions, and descriptions of their business experience are set forth below. There are no family relationships among any of the executive officers named below.
David A. Pace, Chief Executive Officer, age 56
Mr. Pace was appointed Chief Executive Officer in January 2016. Mr. Pace served as Executive Vice President and President of Carrabba’s Italian Grill from 2014 to 2016. From 2010 to 2014, he served as Bloomin’ Brands’ Chief Resources Officer. Mr. Pace has also held executive positions with Starbucks Coffee Company, PepsiCo and Yum! Brands, Inc.
Karen L. Luey, Executive Vice President, Chief Financial Officer, Chief Administrative Officer and Secretary, age 55
Ms. Luey has served as the Company’s Chief Financial Officer since August 2008, Executive Vice President, Chief Administrative Officer since May 2011, and Secretary since February 2012. She served as the Company’s Senior Vice President from August 2008 to May 2011 and Principal Accounting Officer since April 2007. Ms. Luey joined Jamba Juice Company as Vice President and Controller in April 2007. From 2005 to 2007, Ms. Luey was Vice President, Corporate Controller, and Principal Accounting Officer of LeapFrog Enterprises.
Julie S. Washington, Senior Vice President and Chief Brand Officer, age 50
Ms. Washington has served as the Company’s Senior Vice President and Chief Brand Officer since January 2012. Ms. Washington joined Jamba Juice Company as Vice President and General Manager, Consumer Products in 2010. During 2008 to 2010, Ms. Washington was Vice President of Marketing at Luxottica Retail. From 2005 to 2007, Ms. Washington was North America Director of Shopper Marketing at Procter and Gamble.
Steve Adkins, Senior Vice President, US Operations, age 50
Mr. Adkins has served as the Company’s Senior Vice President, US Operations since August 2015. Previously Mr. Adkins served as Senior Vice President, US West, and Senior Vice President of Operations Services from April 2010. Mr. Adkins joined Jamba Juice Company in December 2002 as a Regional Director of Operations in charge of opening the new Midwestern market including Chicago and Minneapolis. In 2005, Mr. Adkins became Zone Vice President East in charge of both Company Stores and overseeing the franchise partners located in the Midwest to the East Coast including New York, Miami, and Texas markets. In October of 2008, he took on the role of Senior Vice President of Company Stores before assuming the role of Senior Vice President, Operations Services. Prior to joining Jamba Juice, Mr. Adkins held the position of Senior Vice President, Operations at Fresh Choice where he worked for 11 years.
Arnaud Joliff, Senior Vice President, Supply Chain, Operation Services and IT, age 46
Mr. Joliff has served as the Company's Senior Vice President, Supply Chain, Operation Services and IT since October 2015. Previously, Mr. Joliff served as Senior Vice President, Supply Chain and Operations Services from January 2015. Mr. Joliff joined Jamba Juice Company as Vice President, Supply Chain in October 2013. Prior to joining Jamba Juice, from 2011 through 2013, Mr. Joliff was Head of Supply Chain Planning for Nestle USA / DSD Division. From 2007 through 2010, Mr. Joliff was Vice President, Supply Chain US for Cott Corporation.
13
Employees
As of December 29, 2015, we employed approximately 1,313 persons, approximately 149 of whom were at our corporate offices or part of our field, licensing, direct selling and franchise support and operations. The remainder of our team members was comprised of Company Store management and hourly store personnel. The Company also hires a significant number of seasonal team members during its peak selling seasons of the spring and summer. Our team members are not covered by a collective bargaining agreement. We consider our employee relations to be good. We place a priority on staffing our stores and support center positions with skilled team members who embrace our culture and we invest in training programs to ensure the quality of our store operations.
Available Information
Our Annual Reports on Form 10-K, Quarterly Reports on Form 10-Q, Current Reports on Form 8-K and amendments to reports filed or furnished pursuant to Sections 13(a) and 15(d) of the Securities Exchange Act of 1934, as amended, are available on our website at http://ir.jambajuice.com, free of charge as soon as reasonably practicable after we electronically file such reports with, or furnish those reports to, the Securities and Exchange Commission (the “SEC”). The SEC also maintains an Internet site that contains reports, proxy and information statements, and other information that we file electronically with the SEC at http://www.sec.gov. The public may also read and copy any materials that we file with the SEC at the SEC’s Public Reference Room at 100 F Street, NE, Washington, DC 20549. Investors may obtain information on the operation of the SEC Public Reference Room by calling the SEC at 1-800-SEC-0330. Our Corporate Governance Principles and Practices, Board of Directors committee charters (including the charters of the Audit Committee, Compensation and Executive Development Committee and Nominating and Governance Committee) and our code of ethics entitled “Code of Business Conduct and Ethics” also are available at that same location on our website. Information on our website is not incorporated into this annual report. Further, our references to the URLs for these websites are intended to be inactive textual references only. Stockholders may request free copies of these documents from:
Jamba, Inc.
c/o ICR, Inc.
685 Third Avenue, 2 nd Floor
New York, NY 10017
(646) 277-1212
investors@jambajuice.com
We included the certifications of the Chief Executive Officer and the Chief Financial Officer of Jamba, Inc. relating to the quality of our public disclosure, as required by Section 302 of the Sarbanes-Oxley Act of 2002 and related rules, in this Annual Report on Form 10-K as Exhibits 31.1 and 31.2 hereto.
14
| ITEM 1A. | RISK FACTORS |
You should carefully consider the risks described below. If any of the risks and uncertainties described below actually occurs, our business, financial condition and results of operations could be materially and adversely affected. The risk factors listed below, however, are not exhaustive. Other sections of this Annual Report on Form 10-K include additional factors that could materially and adversely impact our business, financial condition and results of operations. Moreover, we operate in a very competitive and rapidly changing environment. New factors emerge from time to time and it is not possible to predict the impact of all of these factors on our business, financial condition or results of operation.
RISKS RELATED TO OUR BUSINESS
The loss of our Chief Executive Officer, or one or more of our executive management team could adversely affect our business.
On January 22, 2016, David A. Pace who has been on our Board of Directors since 2012 was appointed Chief Executive Officer of the Company. Our success depends substantially on the contributions and abilities of our executive management team as well as other key employees. We believe that these individuals understand our operational strategies and priorities and the steps necessary to drive our long-term growth and stockholder value. Competition for personnel in our industry is strong and the ability to retain key employees can be difficult. While we have entered into employment agreements with each of our executive officers, we cannot make any assurances that we can retain these individuals for the period necessary for us to achieve and sustain profitability. Our failure to retain and motivate executive management, key employees and Chief Executive Officer sufficient to maintain a competitive position within our industry, and to implement our strategic priorities, would adversely affect our results of operations.
Our revenue is subject to volatility based on weather and varies by season and our operational results may be subject to unusual weather conditions.
Seasonal factors cause our revenue to fluctuate from quarter to quarter. Because the majority of our revenue results from the sale of smoothies, our revenue is typically lower during the winter months and the holiday season, and during periods of inclement weather (because fewer people choose cold beverages) and higher during the spring, summer and fall months (for the opposite reason). Unusual weather conditions, which may or may not result from climate change or other changes in global meteorological conditions, may add to this volatility. Unusual weather conditions may also have an adverse impact on agriculture, result in increased ingredients and raw materials costs, and adversely affect our results of operations.
We are subject to risks associated with climate change and climate change regulation.
Laws and regulations regarding climate change, energy usage and emissions controls may impact the Company directly through higher costs of goods. The potential impacts of climate change and climate change regulations are highly uncertain at this time, and the Company cannot anticipate or predict the material adverse effect on our financial condition, results of operations or cash flows as a result of climate change and climate change regulations. For instance, changes in the prevailing climate may result in a reduction in, or increased prices of available produce, which may adversely affect our revenue and operating margins.
Our financial results depend upon the operating results of our franchisees.
Following the implementation of our significant refranchising initiative, we receive a substantial portion of our revenues in the form of royalties and other franchise revenues, which are generally based on development fees, initial franchise fees and a percentage of sales at franchise-operated stores, Jamba Juice Expresses™ and JambaGO ® units. Accordingly, our financial results to a large extent are dependent upon the operational and financial success of our franchisees. If sales trends or economic conditions worsen for our franchisees, their financial results may deteriorate and our royalty and other revenues may decline and our accounts receivable from franchisees and related allowance for doubtful accounts for our franchisees may increase.
We may not be successful in implementing our strategic priorities, which may have a material adverse impact on our business and financial results.
In fiscal 2013, 2014, and 2015 we worked to implement our strategic priorities under our BLEND Plan 3.0, which we believed necessary to support the Company’s continued growth and long-term stockholder value. For fiscal 2016, we are focused on a number of initiatives that we have incorporated into our strategic priorities under the BLEND Plan 3.0, which we believe continues Jamba’s path to a healthy, active lifestyle brand and creates long-term shareholder value. There can be no assurance that we will be able to continue to successfully implement our strategic priorities or whether these strategic priorities will be successful, and a failure of either could impede our growth and negatively affect our operating results.
We have a history of net losses and may incur losses in the future.
We have incurred net losses in five of the last seven fiscal years. We may continue to incur net losses in the future, and we cannot assure you that we will ever sustain profitability.
15
Failure to establish and maintain our internal control over financial reporting may result in us not being able to accurately report our financial results which could result in the loss of investor confidence and adversely affect the market price of our common stock.
Our management is responsible for establishing and maintaining adequate internal control over our financial reporting. For fiscal 2014 we disclosed a material weakness in our internal control over financial reporting related to identifying and accounting for non-standard transactions. The material weakness we identified was due to an insufficient complement of finance and accounting resources within the organization to ensure the proper application of generally accepted accounting principles (“GAAP”) with respect to the Company’s non-routine transactions, which was in part attributable to employee turnover related to recently implemented cost reductions and infrastructure changes. As a result of this material weakness, our management concluded that our internal control over financial reporting was not effective for Fiscal 2014. As described in Item 9A, we developed and implemented a remediation plan designed to address the material weakness in our internal control over financial reporting.
We cannot, however, be certain that other material weaknesses and control deficiencies will not be discovered in the future. If additional material weaknesses or significant deficiencies in our internal controls are discovered or occur in the future, we may be unable to report our financial results accurately or on a timely basis, which could result in the loss of investor confidence and adversely affect the market price of our common stock.
A worsening of economic conditions or a decrease in consumer spending may substantially decrease our revenues and may adversely impact our ability to implement our business strategy.
To a significant extent, our success depends on discretionary consumer spending, which is influenced by general economic conditions and the availability of discretionary income. While economic conditions have been improving, there is no certainty that this trend will continue or that credit and financial markets and confidence in economic conditions will not deteriorate again. Accordingly, we may experience declines in revenue during economic turmoil or during periods of uncertainty. Any material decline in the amount of discretionary spending, leading cost-conscious consumers to be more selective in restaurants visited, could have a material adverse effect on our revenue, results of operations, business, and financial condition.
The challenges of competing with the many food services businesses may result in reductions in our revenue and operating margins.
We compete with many well-established companies, food service and otherwise, on the basis of taste, quality and price of product offered, customer service, atmosphere, location and overall consumer experience. Our success depends, in part, upon the popularity of our products and our ability to develop new menu items that appeal to consumers across all four day-parts. Shifts in consumer preferences away from our products, our inability to develop new menu items that appeal to consumers across all day-parts, or changes in our menu that eliminate items popular with some consumers could harm our business. We compete with other smoothie and juice bar retailers, specialty coffee retailers, yogurt and ice cream shops, bagel shops, fast-food restaurants, delicatessens, cafés, take-out food service companies, supermarkets and convenience stores. Our competitors change with each of the four day-parts, ranging from coffee bars and bakery cafés to casual dining chains. Many of our competitors, or potential competitors, have substantially greater financial and other resources than we do, which may allow them to react to changes in the market quicker than we can. In addition, aggressive pricing by our competitors or the entrance of new competitors into our markets, could reduce our revenue and operating margins.
Fluctuations in various food and supply costs, particularly produce and dairy, could adversely affect our operating results.
Supplies and prices of the various products that we use to prepare our offerings can be affected by a variety of factors, such as weather, seasonal fluctuations, demand, politics and economics in the producing countries. These factors subject us to shortages or interruptions in product supplies, which could adversely affect our revenue and profits. In addition, the prices of fruit and dairy, which are the main products in our offerings, can be highly volatile. The quality of produce we seek tends to trade on a negotiated basis, depending on supply and demand at the time of the purchase. An increase in pricing of any produce that we use in our products could have a significant adverse effect on our profitability. In addition, higher diesel and gasoline prices may affect our supply or transportation costs and may affect our profitability. Although we attempt to mitigate the risks of volatile commodity prices and allow greater predictability in pricing by entering into fixed price, or to-be-fixed price, purchase commitments for a portion of our produce and dairy requirements, we cannot assure you that these activities will be successful or that they will not result in our paying substantially more for our produce supply than would have been required absent such activities. Declines in sales may also adversely affect our business to the extent we have long-term purchase commitments in excess of our needs.
We are dependent upon a limited number of distributors for a significant amount of our food distribution for our Stores.
For Company Stores, we maintain food distribution contracts primarily with two regional distributors, Systems Services of America (“SSA”) and Gordon Food Services (“GFS”), which also service a majority of our Franchise Stores. SSA distributes to the Western United States, and GFS primarily distributes to the Eastern United States. Although we believe our relationship with these distributors will result in operational efficiencies and cost savings, we cannot assure you that we will be successful or that we will not have to pay substantially more for distributor services in the event GFS or SSA has operational problems. Should GFS or SSA have operational problems, our operations and our operating margins could be adversely affected.
We may face difficulties entering into new or modified arrangements with existing or new suppliers or new service providers.
If we expand our operations into new geographic areas through new Company Stores, Franchise Stores, Jamba Juice Express™, and/or the JambaGO® platform, or introduce new products with special manufacturing, storage or distribution requirements, we may have to seek new suppliers and service providers, or enter into new arrangements with existing ones. We may also encounter difficulties or be unable to negotiate pricing or other terms as favorable as those we currently enjoy, which could harm our business and operating results. For example, the potential growth in smaller format stores may cause the frequency of shipments to increase and the average number of cases per shipment to decrease, thereby increasing the Company’s per case shipment costs.
16
The Company’s success depends on the value of the Jamba Juice® brands.
The Jamba Juice® brand practice is to inspire and simplify healthy living. We believe we must preserve and grow the value of the Jamba Juice brands in order to be successful in building our business, and particularly in building a consumer products growth platform under the Jamba brands. Brand value is based in part on consumer perceptions, and the Jamba Juice brand has been highly rated in several recent brand studies. We intend to reinforce and extend these perceptions for the Jamba brands to help support our licensing efforts. Our brand building initiatives involve increasing our product offerings, opening new Franchise Stores, expanding the JambaGO® and Jamba Juice Express™ platforms, and entering into licensing arrangements to increase awareness of our brands and create and maintain brand loyalty. Our franchisees and licensees are often authorized to use our logos and provide branded beverages, food and other products directly to customers. We provide training and support to, and monitor the operations of, these business partners, but the product quality and service they deliver may be diminished by any number of factors beyond our control, including financial pressures. We believe customers expect the same quality of products and service from our franchisees and licensees as they do from us. Any shortcoming of one of our business partners, particularly an issue affecting the quality of the service experience or the safety of beverages or food, may be attributed by customers to us, thus damaging our reputation and brand value and potentially affecting our results of operations. If our brand building initiatives are unsuccessful, or if business incidents occur that erode consumer perceptions of our brand, then the value of our products may diminish and we may not be able to implement our business strategy.
We may experience higher than anticipated costs in connection with the refresh and remodel of existing Company Stores.
Updating the format and design of our Company Stores is important to maintaining a positive consumer association with the Jamba Juice brand. While we intend for such remodeling efforts to inure to the benefit of the Company, the associated costs may be higher than expected, and our revenues and expenses could be negatively impacted.
We may not be able to adequately protect our intellectual property, which could harm the value of our brand and adversely affect our business.
Our intellectual property is material to the conduct of our business. Our ability to implement our business plan successfully depends in part on our ability to build further brand recognition using our trademarks, service marks, trade dress and other proprietary intellectual property, including our name and logos and the unique ambiance of our stores, both domestically and overseas. We have secured the ownership and rights to our marks in the United States and have filed or obtained registrations in select classes including restaurant services in most other significant foreign jurisdictions. We undertake similar efforts to protect our brands in other relevant consumer product categories in relevant jurisdictions. If our efforts to protect our intellectual property are inadequate, or if any third party misappropriates or infringes on our intellectual property, the value of our store brand and our consumer products brands may be harmed, which could have a material adverse effect on our business. While we have not encountered material claims from prior users of intellectual property relating to restaurant services in areas where we operate or intend to conduct material operations in the near future, there can be no assurances that we will not encounter any material claims in the future. If so, this could harm our image, brands or competitive position and cause us to incur significant penalties and costs.
Our business could be adversely affected by increased labor or healthcare costs. Self-insurance plan claims could materially impact our results.
Labor is a primary component in the cost of operating our business. We compete with other employers in our markets for hourly workers and may become subject to higher labor costs as a result of such competition. We devote significant resources to recruiting and training our team members. A considerable number of the team members employed by us are paid at rates related to the federal minimum wage. In 2009, the federal minimum wage increased to $7.25 per hour. Additionally, many of our Company Store team members work in stores located in states where the minimum wage is greater than the federal minimum wage and receive compensation equal to the state’s minimum wage. The current California’s minimum wage increased to $10.00 per hour effective January 1, 2016.
Moreover, municipalities may set minimum wages above the applicable state standards, such as in San Francisco, which raised the minimum wage to $12.25 on May 1, 2015, will again rise to $13.00 as of July 1, 2016, and will reach $15.00 on July 1, 2018. Any further increases in the federal minimum wage or the enactment of additional state or local minimum wage increases where our employees may be located will increase our labor costs. Competition for employees in various markets could also result in higher required wage rates. Furthermore, the Company is self-insured for employee healthcare and dental benefits. The Company pays a substantial part of the healthcare benefits for team members at the general manager level and above and for those working at the Company’s corporate office. The Company has a guaranteed cost Worker’s Compensation policy effective October 1, 2015. Prior to October 1, 2015 the Company had a retrospective policy for its Worker’s Compensation risks. Liabilities associated with our self-insured plans the Company retains are estimated in part, by considering historical claims experience, reserves and other actuarial assumptions. The estimated accruals for these liabilities are based on statistical analyses of historical industry data as well as the Company’s actual historical trends. If actual claims experience differs from the Company’s assumptions, historical trends, and estimates, changes in the Company’s insurance reserves could materially impact our results of operations.
17
The Patient Protection and Affordable Care Act enacted in 2010, as well as other healthcare reform legislation being considered by Congress and state legislatures may have a material adverse impact on our business. We continue to monitor and evaluate any impact the Patient Protection and Affordable Care Act may have on our business.
We are reliant on our outsourcing partner to provide effective administrative functions.
During the latter part of 2014, we engaged a third party service provider to provide outsourced accounting, IT, human resources, and contract management services. This may allow us to achieve efficiencies and cost savings, in part, through a reduction in our workforce. If our outsourcing partner fails to perform at a sufficient level to ensure our efficient operation, we may not have the resources to timely and efficiently take over those functions, and our financial performance might be adversely impacted as a result.
We are subject to all of the risks associated with leasing space subject to long-term non-cancelable leases.
We, and our franchisees, compete in the market for real estate and our, or their, inability to secure appropriate real estate or lease terms could impact our respective abilities to grow. Our leases generally have initial terms of between five and 15 years, and generally can be extended only in five-year increments if at all. We generally cannot cancel these leases. If an existing or new store is not profitable, and we decide to close it, as we have done in the past and may do in the future, we may nonetheless be committed to perform our obligations under the applicable lease including, among other things, paying the base rent for the balance of the lease term. Additionally, because we sublease the premises of Company Stores sold to franchisees in our refranchising program, we are still legally liable to the landlords under the prime leases, and we will need to assume obligations under the prime lease should a franchisee default on its sublease obligations. Current locations of our stores and franchised locations may become unattractive as demographic patterns change. In addition, as each of our leases expire, we may fail to negotiate renewals, either on commercially acceptable terms or at all, which could require us to close stores in desirable locations.
Our business and results may be subject to disruption from work stoppages, terrorism or natural disasters.
Our operations may be subject to disruption for a variety of reasons, including work stoppages, acts of war, terrorism, pandemics, fire, earthquake, flooding or other natural disasters. These disruptions can result in, among other things, lost sales when consumers stay home or are physically prevented from reaching our stores, property damage, lost sales when our stores are forced to close for extended periods of time and interruptions in supply when vendors suffer damages or transportation is affected. In addition, our corporate offices and support center is located in Northern California near known earthquake fault lines. If a major earthquake or other natural disaster were to occur in Northern California, our corporate offices and support center may be damaged or destroyed. Such a disruption could result in the temporary or permanent loss of critical data, suspension of operations, delays in shipments of product, and disruption of business in both the affected region and nationwide, which would adversely affect our revenue and results of operations.
We are highly dependent on the financial performance of stores concentrated in certain geographic areas.
Our financial performance is highly dependent on stores located in California. Stores located in California comprise over 71% of Company Stores and generate a significant portion of our Company Store revenue. These stores also comprise over 51% of our total global system stores. In recent years, California and other states have experienced significant negative economic impact due to the distressed economic climate. If geographic regions in which we have a high concentration of stores experience significant economic pressures, our sales and operating results could be negatively impacted. In addition, state and local laws, government regulations, weather conditions and natural disasters affecting California and other regions where we have a high concentration of stores may have a material impact upon our operating results.
We may not realize the anticipated benefits of any acquisitions, joint ventures or strategic investments.
We expect to continue to evaluate and consider a wide array of potential strategic transactions, including acquisitions, joint ventures and strategic investments. At any given time, we may be engaged in discussions or negotiations with respect to one or more of these types of transactions. Any of these transactions could be material to our financial condition and results of operations. We may not realize the anticipated benefits of any or all of our acquisitions, joint ventures or strategic investments, or we may not realize them in the time frame expected. Future acquisitions, joint ventures or strategic investments may require us to issue additional equity securities, spend a substantial portion of our available cash, or incur debt or liabilities, amortize expenses related to intangible assets or incur write-offs of goodwill, which could adversely affect our results of operations and dilute the economic and voting rights of our stockholders.
Governmental regulation may adversely affect our ability to open new stores or otherwise adversely affect our existing and future operations and results.
We, and our franchisees, are subject to various federal, state and local regulations. Each of our stores is subject to state and local licensing and regulation by health, sanitation, food and workplace safety and other agencies. We, and our franchisees, may experience material difficulties or failures in obtaining the necessary licenses or approvals for new stores, which could delay planned store openings. In addition, stringent and varied requirements of local regulators with respect to zoning, land use and environmental factors could delay or prevent development of new stores in particular locations.
18
Our operations are also subject to the U.S. Fair Labor Standards Act and National Labor Relations Act, which governs such matters as minimum wages, overtime and other working conditions, along with the U.S. Americans with Disabilities Act, family leave mandates and a variety of similar laws enacted by the states that govern these and other employment law matters. In recent years, there has been an increased legislative, regulatory, and consumer focus on nutrition and advertising practices in the food industry. Establishments operating in the quick-service and fast-casual segments have been a particular focus, and compliance with additional regulations can become costly and affect our operating results.
Our federal, state and local tax returns may, from time to time, be selected for audit by the taxing authorities, which may result in tax assessments, interest or penalties that could have a material adverse impact on our results of operations and financial position.
We are subject to federal, state and local taxes in the U.S. In making tax estimates and paying taxes, significant judgment is often required. Although we believe our tax positions and estimates are reasonable, if a taxing authority disagrees with the positions taken by the Company, we could have an additional tax liability, including interest and penalties. If material, payment of such additional amounts could have a material impact on our results of operations and financial position.
We rely heavily on information technology and a material failure of that technology could impair our ability to efficiently operate our business.
Our business operations rely heavily on information systems, including point-of-sale processing in our stores, management of our supply chain and distribution system, vendor and franchisee invoicing, and various other processes and procedures. The efficient management of our business depends significantly on the reliability and capacity of these systems, and any related failure and/or breach of security could cause delays in customer service and reduce efficiency in our operations. Significant capital investments might be required to remediate any problems.
Failure to protect the integrity and security of individually identifiable data of customers, vendors or employees could expose us to data loss, litigation and liability, and our reputation could be significantly harmed.
Our business operations require us to process and/or maintain certain personal, business and financial information about customers, vendors and employees. The use of such information by us is regulated by federal, state and foreign laws, as well as certain third party agreements. If our security and information systems are compromised or if our employees or franchisees fail to comply with the applicable laws and regulations, and this information is obtained by unauthorized persons or used inappropriately, it could adversely affect our reputation and result in litigation and settlement costs, damage awards, or penalties and fines. As privacy and information security law and regulations change, we may incur additional costs to ensure that we remain in compliance.
A failure or breach of our security systems or infrastructure as a result of cyber-attacks could disrupt our business, result in the disclosure or misuse of confidential or proprietary information, damage our reputation, increase our costs and cause losses.
Information security risks have significantly increased in recent years in part because of the proliferation of new technologies, the use of the Internet and telecommunications technologies to conduct financial transactions, and the increased sophistication and activities of organized crime, hackers, terrorists and other external parties. These threats may derive from fraud or malice on the part of our employees or third parties, or may result from human error or accidental technological failure. These threats include cyber-attacks such as computer viruses, malicious code, phishing attacks or information security breaches.
To date, we have not experienced any material impact relating to cyber-attacks or other information security breaches. Any actual attacks could lead to damage to our reputation, additional costs (such as repairing systems and investigation or compliance costs), penalties, financial losses to both us and our customers and partners and the loss of customers and business opportunities. If such attacks are not detected immediately, their effect could be compounded. As cyber-threats continue to evolve, we may be required to expend significant additional resources to continue to modify or enhance our protective measures or to investigate and remediate any information security vulnerabilities. Any of the risks described above could materially adversely affect our overall business and results of operations.
19
RISKS RELATED TO OUR FRANCHISE BUSINESS
Termination of an arrangement with a master developer could adversely impact our revenues.
We enter into relationships with “master developers” to develop and operate restaurants in defined domestic and international geographic areas. Master developers are granted exclusive rights with respect to larger territories than our typical franchisees. The termination of an arrangement with a master developer or a lack of expansion by certain master developers could result in the delay of the development and expansion of our business in our targeted markets. Any such delay or interruption could result in lower revenues for us, particularly if we were to choose to close Stores following the termination of an arrangement with a master developer.
Our growth strategy depends on increasing franchise ownership.
Our current growth strategy is to continue to pursue an asset-light business model, including selling Company Stores, and increasing the number of franchise locations as a percentage of all stores in the Jamba System. By emphasizing Franchise Store development, we receive an increasingly significant amount of our revenues in the form of royalties from our franchisees. Accordingly, the success of our business is increasingly dependent upon the operational and financial success of our franchisees. This strategy is subject to risks and uncertainties, which may be concentrated where any particular franchisee owns a significant number of franchise locations. While our franchise agreements set forth certain operational standards and guidelines, we have limited control over how our franchisees’ businesses are run, and any significant inability of our franchisees to operate successfully could adversely affect our operating results through decreased royalty payments. We may not be able to identify franchisee candidates with appropriate experience and financial resources or to negotiate mutually acceptable agreements with those that do. Our franchisee candidates may not have access to the financial or management resources that they need to open or continue operating the stores contemplated by their franchise agreements with us. In addition, franchisees may not be able to find suitable sites on which to develop new stores or negotiate acceptable lease terms for the sites, obtain the necessary permits and government approvals or meet construction schedules. If our franchisees incur too much debt or if economic or sales trends deteriorate such that they are unable to repay existing debt, it could result in financial distress or even possible insolvency or bankruptcy. Some of our franchisees experienced financial pressures during fiscal 2014 and 2015. If a significant number of our franchisees become financially distressed, this could harm our operating results through reduced or delayed royalty payments or increased rent obligations for leased properties on which we are contingently liable.
Expansion into new geographic markets may present increased risks.
Franchise growth is planned in new geographic areas in the United States and select international markets for fiscal 2016. Our future results, and the results of new Franchise Stores, depend on various factors, including successful selection and expansion into these new geographic markets and market acceptance of the Jamba Juice experience. Those markets may have different competitive conditions, consumer tastes and discretionary spending patterns as compared to existing markets. As a result, those new stores may be less successful than stores in our existing markets. Consumers in a new market may not be familiar with the Jamba Juice brand, and we may need to build brand awareness in that market through greater investments in advertising and promotional activity than we originally planned. Franchisees may find it more difficult in new markets to hire, motivate and keep qualified employees who can project our vision, passion and culture. Stores opened in new markets may also have lower average store revenue than stores opened in existing markets, and may have higher construction, occupancy or operating costs than stores in existing markets. Furthermore, we may have difficulty in finding reliable suppliers or distributors or ones that can provide us, either initially or over time, with adequate supplies of ingredients meeting our quality standards. Revenue at stores opened in new markets may take longer to increase and reach expected revenue levels, and may never do so, thereby affecting our overall royalty income. As with the experience of other retail food concepts that have tried to expand nationally and internationally, we may find that the Jamba Juice concept has limited appeal to customers in new markets or we may experience a decline in the popularity of the Jamba Juice experience. Newly opened stores may not succeed, future markets and stores may not be successful and, even if we are successful, our average store revenue, and the royalty income generated therefrom, may not increase and may even decline.
20
Our efforts to expand internationally may not be successful and could impair the value of our brand.
Our current strategy includes international expansion in a number of countries around the world. Expanding into international markets will expose us to new risks and uncertainties, including product supply, import/export limitations and regulations to which we are not currently bound and may not be currently set up to handle, consumer preferences, occupancy costs, operating expenses and labor and infrastructure challenges. If stores open in international markets and such stores are unable to source inventory locally, franchisees may be required to import inventory from our U.S. distributors and any resulting import duties, tariffs, transportation or other charges may disproportionately impact such stores’ cost of goods which could harm the viability of such stores. Finally, international operations have inherent risks such as foreign currency exchange rate fluctuations, the application and effect of local laws and regulations and enforceability of intellectual property and contract rights. Additionally, effectively managing growth can be challenging, particularly as we continue to expand into new international markets where we must balance the need for flexibility and a degree of autonomy for local management against the need for consistency with our goals, philosophy and standards. Failure of our international expansion strategy could have a material adverse impact on our results of operations.
Termination or non-renewal of franchise agreements may disrupt store performance.
Each franchise agreement is subject to termination by us in the event of default by the franchisee after the applicable cure period. Upon the expiration of the initial term of a franchise agreement, the franchisee generally has an option to renew for an additional term. There is no assurance that franchisees will meet the criteria for renewal or will desire or be able to renew their franchise agreements. If not renewed, a franchise agreement and payments required thereunder will terminate. We may be unable to find a new franchisee to replace such lost revenue. Furthermore, while we will be entitled to terminate franchise agreements following a default that is not cured within the applicable cure period, if any, the disruption to the performance of the stores could materially and adversely affect our business.
Our franchisees could take actions that harm our reputation and reduce our royalty revenue.
While we have franchise agreements in place with our franchisees that provide certain operational requirements, we do not exercise control over the day-to-day operations of our Franchise Stores. Any operational or developmental shortcomings of our Franchise Stores, including their failure to comply with applicable laws, are likely to be attributed to our system-wide operations in the eyes of consumers and could adversely affect our reputation and have a direct negative impact on the royalty revenue we receive from those and other stores.
We could face liability from our franchisees and from government agencies.
A franchisee or government agency may bring legal action against us based on the franchisor/franchisee relationship. Various state and federal laws govern our relationship with our franchisees and our potential sale of a franchise. If we fail to comply with these laws, we could be liable for damages to franchisees, fines or other penalties. Expensive litigation with our franchisees or government agencies may adversely affect both our profits and our important relations with our franchisees.
21
RISKS RELATED TO THE FOOD SERVICE BUSINESS
Litigation and publicity concerning food quality, health claims, and other issues can result in liabilities, increased expenses, distraction of management, and can also cause customers to avoid our products, which could adversely affect our results of operations, business and financial condition.
Food service businesses can be adversely affected by litigation and complaints from customers or government authorities resulting from food quality, health claims, allergens, illness, injury or other health concerns or operating issues stemming from one retail location or a number of retail locations. Adverse publicity about these allegations may negatively affect us, regardless of whether the allegations are true, by discouraging customers from buying our products.
Our customers occasionally file complaints or lawsuits against us alleging that we are responsible for some illness or injury they suffered at or after a visit to our stores, or that we have problems with food quality or operations. We are also subject to a variety of other claims arising in the ordinary course of our business, including false advertising claims, personal injury claims, contract claims and claims alleging violations of federal and state law regarding workplace and employment matters, discrimination and similar matters, and we could become subject to class action or other lawsuits related to these or different matters in the future. Regardless of whether any claims against us are valid, or whether we are ultimately held liable, claims may be expensive to defend and may divert time and money away from our operations and hurt our performance. A judgment significantly in excess of our insurance coverage, or for which we are not covered by insurance, could materially and adversely affect our financial condition or results of operations. Any adverse publicity resulting from these allegations may also materially and adversely affect our reputation or prospects, which in turn, could adversely affect our results.
In addition, the food services industry has been subject to a growing number of claims based on the nutritional content of food products they sell, and disclosure and advertising practices. We may also be subject to this type of proceeding in the future and, even if not, publicity about these matters (particularly directed at the quick-service and fast-casual segments of the industry) may harm our reputation or prospects and adversely affect our results.
We are also impacted by trends in litigation, including class-action allegations brought under various consumer protection laws, securities and derivative lawsuits claiming violations of state and federal securities law, and employee lawsuits, including wage and hour claims. We may also be impacted by litigation involving our relationship with franchisees and the legal distinction between our franchisees and us for employee claims based on, among other things, wage and hour violations, discrimination, harassment, or wrongful termination, as these types of claims are increasingly asserted against franchisors on a co-employer theory by employees of franchisees.
Due to the inherent uncertainties of litigation and regulatory proceedings, we cannot accurately predict the ultimate outcome of any such proceedings. An unfavorable outcome could have a material adverse impact on our business, financial condition and results of operations. In addition, regardless of the outcome of any litigation or regulatory proceedings, these proceedings could result in substantial costs and may require that we devote substantial resources to defend our Company and could affect the future premiums we would be required to pay on our insurance policies. Further, changes in governmental regulations could have adverse effects on our business and subject us to additional regulatory actions.
Food safety concerns and instances of food-borne illnesses could harm our customers, result in negative publicity and cause the temporary closure of some stores and, in some cases, could adversely affect the price and availability of fruits and vegetables, any of which could harm our brand reputation, result in a decline in revenue or an increase in costs.
We consider food safety a top priority and dedicate substantial resources toward ensuring that our customers enjoy high-quality, safe and wholesome products. However, we cannot guarantee that our internal controls and training will be fully effective in preventing all food-borne illnesses. Furthermore, our reliance on third-party food suppliers and distributors increases the risk that food-borne illness incidents (such as e. coli, hepatitis A, salmonella or listeria) could occur outside of our control and at multiple locations. Instances of food-borne illnesses, whether real or perceived, and whether at our stores or those of our competitors, could harm customers and otherwise result in negative publicity about us or the products we serve, which could adversely affect revenue. If there is an incident involving our stores serving contaminated products, our customers may be harmed, our revenue may decrease and our brand name and reputation may be impaired. If our customers become ill from food-borne illnesses, we could be forced to temporarily close some stores. In addition, we may have different or additional competitors for our intended customers as a result of making any such changes and may not be able to compete successfully against those competitors. Food safety concerns and instances of food-borne illnesses and injuries caused by food contamination have in the past, and could in the future, adversely affect the price and availability of affected ingredients and cause customers to shift their preferences, particularly if we choose to pass any higher ingredient costs along to consumers. As a result, our costs may increase and our revenue may decline. A decrease in customer traffic as a result of these health concerns or negative publicity, or as a result of a change in our menu or dining experience or a temporary closure of any of our stores, could materially and adversely impact our business, financial condition and results of operations.
22
RISKS RELATED TO OWNERSHIP OF COMMON STOCK
Failure of the Company’s internal control over financial reporting could harm its business and financial results.
Our management is responsible for establishing and maintaining effective internal control over financial reporting. Internal control over financial reporting is a process to provide reasonable assurance regarding the reliability of financial reporting for external purposes in accordance with accounting principles generally accepted in the United States. Internal control over financial reporting includes: (i) maintaining reasonably detailed records that accurately and fairly reflect our transactions; and (ii) providing reasonable assurance that we (a) record transactions as necessary to prepare the financial statements, (b) make receipts and expenditures in accordance with management authorizations, and (c) would timely prevent or detect any unauthorized acquisition, use or disposition of our assets that could have a material effect on the financial statements. Because of its inherent limitations, internal control over financial reporting is not intended to provide absolute assurance that we would prevent or detect a misstatement of our financial statements or fraud. Any failure to maintain an effective system of internal control over financial reporting could limit our ability to report our financial results accurately and timely or to detect and prevent fraud. A significant financial reporting failure could cause an immediate loss of investor confidence in us and a sharp decline in the market price of our common stock. As disclosed in Item 9A, management remediated the material weakness identified in fiscal 2014 on our internal control over financial reporting related to identifying and accounting for non-standard transactions.
Our anti-takeover provisions may delay or prevent a change of control of us, which may adversely affect the price of our common stock.
Certain provisions in our corporate documents and Delaware law may delay or prevent a change of control of us, which could adversely affect the price of our common stock. For example, the Company’s amended and restated certificate of incorporation and bylaws include anti-takeover provisions such as:
| · | limitations on the ability of stockholders to amend our charter documents, including stockholder supermajority voting requirements; |
| · | the inability of stockholders to act by written consent or to call a special meeting absent the request of the holders of a majority of the outstanding common stock; and |
| · | advance notice requirements for nomination for election to the board of directors and for stockholder proposals. |
The Company is also afforded the protections of Section 203 of the Delaware General Corporation Law which prevents it from engaging in a business combination with a person who acquires at least 15% of its common stock for a period of three years from the date such person acquired such common stock, unless board of directors or stockholder approval is obtained.
Our stock price may fluctuate significantly.
The trading price of our common stock has been volatile and is likely to continue to be volatile. Our stock price could be subject to wide fluctuations in response to a variety of factors. The stock market has experienced significant price and volume fluctuations that have often been unrelated or disproportionate to the operating performance of particular companies. Broad market factors, including the effect of international political instability, armed conflict, natural disasters, financial markets, and general economic conditions, may have a material adverse effect on our stock price, regardless of our actual performance.
| ITEM 1B. | UNRESOLVED STAFF COMMENTS |
None.
23
| ITEM 2. | PROPERTIES |
The Company’s corporate headquarters is located at 6475 Christie Avenue, Emeryville, California. This facility is occupied under a lease for approximately 37,000 square feet, at a cost of approximately $1.2 million per year and has a lease term that expires on January 31, 2017.
The Company, including our franchisees, currently operates all of its stores under leases and typically signs five to 15 year leases. The Company does not intend to purchase real estate for any of its sites in the future. The Company believes that the size and flexibility of its format provide it with a competitive advantage in securing sites. At December 29, 2015, the Company served its customers primarily through a combination of Company Stores, Franchise Stores and International Stores in 34 different States, the District of Columbia, Taiwan, South Korea, Canada, the Philippines, Mexico and the Middle East.
24
| Store Count as of December 29, 2015 | ||||||||||||
| Company Stores | Franchise & International Stores | Total | ||||||||||
| United States | ||||||||||||
| Arizona | - | 39 | 39 | |||||||||
| California | 50 | 356 | 406 | |||||||||
| Colorado | - | 27 | 27 | |||||||||
| Connecticut | - | 3 | 3 | |||||||||
| Delaware | - | 1 | 1 | |||||||||
| District of Columbia | - | 3 | 3 | |||||||||
| Florida | - | 29 | 29 | |||||||||
| Georgia | - | 6 | 6 | |||||||||
| Hawaii | - | 35 | 35 | |||||||||
| Idaho | - | 10 | 10 | |||||||||
| Illinois | 14 | 8 | 22 | |||||||||
| Indiana | - | 1 | 1 | |||||||||
| Kentucky | - | 1 | 1 | |||||||||
| Louisiana | - | 4 | 4 | |||||||||
| Maryland | - | 5 | 5 | |||||||||
| Massachusetts | - | 1 | 1 | |||||||||
| Michigan | - | 3 | 3 | |||||||||
| Minnesota | - | 7 | 7 | |||||||||
| Missouri | - | 8 | 8 | |||||||||
| Montana | - | 1 | 1 | |||||||||
| Nevada | - | 17 | 17 | |||||||||
| New Jersey | 1 | 8 | 9 | |||||||||
| New York | 5 | 17 | 22 | |||||||||
| North Carolina | - | 7 | 7 | |||||||||
| Ohio | - | 5 | 5 | |||||||||
| Oklahoma | - | 8 | 8 | |||||||||
| Oregon | - | 24 | 24 | |||||||||
| Pennsylvania | - | 7 | 7 | |||||||||
| Tennessee | - | 4 | 4 | |||||||||
| Texas | - | 34 | 34 | |||||||||
| Utah | - | 23 | 23 | |||||||||
| Virginia | - | 6 | 6 | |||||||||
| Washington | - | 34 | 34 | |||||||||
| Wisconsin | - | 5 | 5 | |||||||||
| Wyoming | - | 1 | 1 | |||||||||
| Total in United States | 70 | 748 | 818 | |||||||||
| International | ||||||||||||
| South Korea | - | 29 | 29 | |||||||||
| Philippines | - | 20 | 20 | |||||||||
| Canada | - | 13 | 13 | |||||||||
| Mexico | - | 4 | 4 | |||||||||
| Middle East | - | 7 | 7 | |||||||||
| Taiwan | - | 2 | 2 | |||||||||
| Total International | - | 75 | 75 | |||||||||
| Grand Total | 70 | 823 | 893 | |||||||||
| ITEM 3. | LEGAL PROCEEDINGS |
The Company is party to various legal proceedings arising in the ordinary course of its business, but it is not currently a party to any legal proceeding that management believes would have a material adverse effect on the consolidated financial position or results of operations of the Company.
| ITEM 4. | MINE SAFETY DISCLOSURE |
Not applicable.
25
| ITEM 5. | MARKET FOR JAMBA, INC.’S COMMON EQUITY, RELATED STOCKHOLDER MATTERS AND ISSUER PURCHASES OF EQUITY SECURITIES |
The shares of Jamba, Inc. common stock are currently quoted on the NASDAQ Global Market under the symbol JMBA.
The closing price per share of Jamba, Inc. common stock as reported on the NASDAQ Global Market on March 7, 2016, was $13.59.
The following table sets forth, for the fiscal quarter indicated, the quarterly high and low closing sales prices of our shares of common stock as reported on the NASDAQ Global Market, as applicable, for each quarter during the last two fiscal years.
| Common Stock | ||||||||
| High | Low | |||||||
| 2014 First Quarter | 13.10 | 11.58 | ||||||
| 2014 Second Quarter | 12.30 | 9.95 | ||||||
| 2014 Third Quarter | 14.84 | 11.34 | ||||||
| 2014 Fourth Quarter | 14.63 | 12.07 | ||||||
| 2015 First Quarter | 16.80 | 13.71 | ||||||
| 2015 Second Quarter | 16.77 | 14.98 | ||||||
| 2015 Third Quarter | 16.33 | 12.92 | ||||||
| 2015 Fourth Quarter | 14.75 | 12.75 | ||||||
We have not historically paid any cash dividends on our common stock and do not currently have plans to pay any cash dividends.
The securities authorized for issuance under equity compensation plans information is incorporated herein by reference from the Company’s 2015 Proxy Statement to Stockholders to be filed pursuant to Regulation 14A under the Exchange Act no later than 120 days after the end of the Company’s 2015 fiscal year.
As of March 7, 2016, there were 89 holders of record of our common stock.
On October 29, 2014, the Company’s Board of Directors authorized the repurchase of up to $25 million of shares of common stock over a period of 18 months. The Company’s Board of Directors authorized to increase the Company’s stock repurchase program by $15 million to $40 million in May 2015 and by $5 million to $45 million in September 2015, with the authorizations expiring on May 4, 2016. During the fiscal 2015 and fiscal 2014, the Company repurchased 1,948,004 and 910,813 shares, respectively, under the 2014 Stock Repurchase Program. The average price per share during fiscal 2015 and during fiscal 2014 was $14.38 and $13.17, respectively, at an aggregate of cost of $28.0 million and $12.0 million for fiscal 2015 and fiscal 2014, respectively, leaving $5.0 million available for share repurchase that expires in May 2016. Shares repurchased under the 2014 Stock Repurchase Program are considered treasury stock until retired. The following table presents information related to repurchases of shares of the Company's common stock from inception through the fourth quarter of 2015 (in thousands except share and per share amounts):
26
| Total Number of Shares Purchased | Average Price Paid per Share (1) | Total Number of Shares Purchased as Part of Publicly Announced Plans | Remaining
Maximum Amount Available to be Purchased Under the Plans (1) (in 000's) | |||||||||||||
| October 29, 2014 - December 30, 2014 | 910,813 | $ | 13.17 | 910,813 | $ | 13,009 | ||||||||||
| December 31, 2014 - March 31, 2015 | 445,414 | 15.00 | 445,414 | 6,326 | ||||||||||||
| April 1, 2015 - June 30, 2015 | 195,171 | 16.09 | 195,171 | 3,186 | ||||||||||||
| July 1, 2015 - September 29, 2015 | 1,174,882 | 13.87 | 1,174,882 | 6,887 | ||||||||||||
| September 30, 2015 - October 27, 2015 | 131,837 | 14.31 | 131,837 | 5,000 | ||||||||||||
| October 28, 2015 - November 24, 2015 | 700 | 12.94 | 700 | 4,991 | ||||||||||||
| November 25, 2015 - December 29, 2015 | - | - | - | $ | 4,991 | |||||||||||
| Total | 2,858,817 | $ | 13.99 | 2,858,817 | ||||||||||||
(1) The amounts exclude commission costs.
Performance Graph
The following graph compares our cumulative total stockholder return since December 28, 2010 with the cumulative total return of (i) the NASDAQ Composite Index, (ii) the Russell 2000 Index and (iii) Russell MicroCap Index. The graph assumes that the value of the investment in our common stock and each index (including reinvestment of dividends) was $100 on December 28, 2010. The comparisons in the graph below are based on historical data and are not intended to forecast the possible future performance of our common stock. This performance graph shall not be deemed “soliciting material” or to be “filed” with the SEC for purposes of Section 18 of the Exchange Act, or otherwise subject to the liabilities under that Section, and shall not be deemed to be incorporated by reference into any of our filings under the Securities Act or the Exchange Act.
27
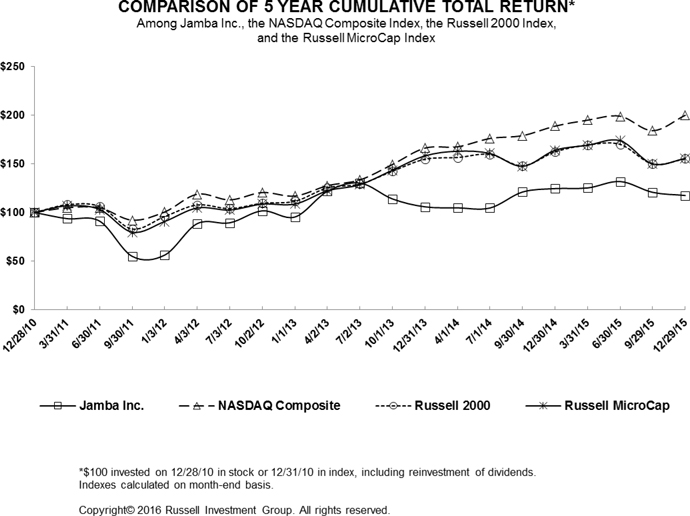
28
| ITEM 6. | SELECTED FINANCIAL DATA |
The table below summarizes the Company’s recent financial information. The historical information was derived from the consolidated financial statements of Jamba, Inc. and subsidiary for the fiscal years ended December 29, 2015, December 30, 2014, December 31, 2013, January 1, 2013 and January 3, 2012. The data set forth below should be read in conjunction with the consolidated financial statements and notes thereto in Item 8 and with Management’s Discussion and Analysis of Financial Condition and Results of Operations in Item 7.
(In thousands, except share data and per share amounts)
Statements of Operations Data
| Fiscal Year Ended December 29, 2015 (2) | Fiscal Year Ended December 30, 2014 (2) | Fiscal Year Ended December 31, 2013 (2) | Fiscal Year Ended January 1, 2013 (2) | Fiscal Year Ended January 3, 2012 (1) (2) | ||||||||||||||||
| Revenue: | ||||||||||||||||||||
| Company stores | $ | 137,025 | $ | 198,737 | $ | 212,887 | $ | 215,125 | $ | 214,837 | ||||||||||
| Franchise and other revenue | 24,651 | 19,311 | 16,362 | 13,664 | 11,597 | |||||||||||||||
| Total revenue | 161,676 | 218,048 | 229,249 | 228,789 | 226,434 | |||||||||||||||
| Costs and operating expenses (income): | ||||||||||||||||||||
| Cost of sales | 33,737 | 52,236 | 52,211 | 50,215 | 49,503 | |||||||||||||||
| Labor | 44,732 | 61,749 | 62,015 | 63,086 | 67,868 | |||||||||||||||
| Occupancy | 18,951 | 27,630 | 29,350 | 29,473 | 31,092 | |||||||||||||||
| Store operating | 25,152 | 33,089 | 34,802 | 33,524 | 32,847 | |||||||||||||||
| Depreciation and amortization | 6,569 | 10,084 | 10,974 | 11,062 | 12,463 | |||||||||||||||
| General and administrative | 36,872 | 37,278 | 37,771 | 40,771 | 37,798 | |||||||||||||||
| Gain on disposal of assets | (21,609 | ) | (2,957 | ) | (3,153 | ) | 648 | 2,053 | ||||||||||||
| Store pre-opening | 1,031 | 763 | 880 | 604 | 965 | |||||||||||||||
| Impairment of long-lived assets | 2,523 | 175 | 728 | 711 | 1,291 | |||||||||||||||
| Store lease termination and closure | 1,669 | 575 | 148 | 421 | 721 | |||||||||||||||
| Other operating, net | 1,795 | 726 | 1,155 | (2,339 | ) | (1,843 | ) | |||||||||||||
| Total costs, operating expenses, and gain | 151,422 | 221,348 | 226,881 | 228,176 | 234,758 | |||||||||||||||
| Income (loss) from operations | 10,254 | (3,300 | ) | 2,368 | 613 | (8,324 | ) | |||||||||||||
| Other (expense) income: | ||||||||||||||||||||
| Interest income | 137 | 74 | 9 | 61 | 159 | |||||||||||||||
| Interest expense | (220 | ) | (195 | ) | (242 | ) | (217 | ) | (473 | ) | ||||||||||
| Total other expense | (83 | ) | (121 | ) | (233 | ) | (156 | ) | (314 | ) | ||||||||||
| Income (loss) before income taxes | 10,171 | (3,421 | ) | 2,135 | 457 | (8,638 | ) | |||||||||||||
| Income tax (expense) benefit | (701 | ) | (168 | ) | (55 | ) | (155 | ) | 340 | |||||||||||
| Net income (loss) | 9,470 | (3,589 | ) | 2,080 | 302 | (8,298 | ) | |||||||||||||
| Preferred stock dividends and deemed dividends | - | - | (588 | ) | (2,181 | ) | (2,331 | ) | ||||||||||||
| Less: Net income attributable to noncontrolling interest | 52 | 43 | - | - | - | |||||||||||||||
| Net income (loss) attributable to Jamba, Inc. | $ | 9,418 | $ | (3,632 | ) | $ | 1,492 | $ | (1,879 | ) | $ | (10,629 | ) | |||||||
| Weighted-average shares used in the computation of earnings (loss) per share attributable to Jamba, Inc.: | ||||||||||||||||||||
| Basic | 15,787,806 | 17,197,904 | 16,793,235 | 14,139,888 | 13,262,131 | |||||||||||||||
| Diluted | 16,228,033 | 17,197,904 | 17,222,030 | 14,139,888 | 13,262,131 | |||||||||||||||
| Earnings (loss) per share attributable to Jamba, Inc. common stockholders: | ||||||||||||||||||||
| Basic | $ | 0.60 | $ | (0.21 | ) | $ | 0.09 | $ | (0.13 | ) | $ | (0.80 | ) | |||||||
| Diluted | $ | 0.58 | $ | (0.21 | ) | $ | 0.09 | $ | (0.13 | ) | $ | (0.80 | ) | |||||||
| (1) | Fiscal year ended January 3, 2012 contains the results of operations for 53 weeks. |
| (2) | Share and per share data have been adjusted for all periods presented to reflect a five-for-one reverse stock split effective May 31, 2013. |
29
Selected Balance Sheet Data (at period end)
| December 29, 2015 | December 30, 2014 | December 31, 2013 | January 1, 2013 | January 3, 2012 | ||||||||||||||||
| Cash and cash equivalents | $ | 19,730 | $ | 17,750 | $ | 32,386 | $ | 31,486 | $ | 19,607 | ||||||||||
| Total assets | 69,537 | 92,489 | 97,916 | 93,613 | 88,293 | |||||||||||||||
| Total liabilities | 64,625 | 75,744 | 71,074 | 72,101 | 68,109 | |||||||||||||||
| Series B redeemable preferred stock | - | - | - | 7,916 | 17,880 | |||||||||||||||
| Total stockholders’ equity | 4,912 | 16,745 | 26,842 | 13,596 | 2,304 | |||||||||||||||
| Total liabilities and stockholders’ equity | 69,537 | 92,489 | 97,916 | 93,613 | 88,293 | |||||||||||||||
KEY FINANCIAL METRICS
Management reviews and discusses its operations based on both financial and non-financial metrics. Among the key financial metrics upon which management focuses, is reviewing its performance based on the Company’s consolidated GAAP results, including Company Store comparable sales, franchise and other revenue and income from operations.
Company Store comparable sales represents the change in year-over-year sales for all Company Stores opened for at least one full fiscal year.
The following table sets forth operating data that do not otherwise appear in our consolidated financial statements as of and for the fiscal years ended December 29, 2015 and December 30, 2014:
| Fiscal Year Ended | ||||||||
| December 29, 2015 | December 30, 2014 | |||||||
| Percentage change in Company Store comparable sales (1) | 1.5 | % | 2.8 | % | ||||
| Total Company Stores | 70 | 263 | ||||||
| Total Franchise Stores - Domestic | 748 | 543 | ||||||
| Total International Stores | 75 | 62 | ||||||
| Total Stores | 893 | 868 | ||||||
| (1) | Percentage change in Company Store comparable sales compares the sales of Company Stores during the full fiscal year ended to the sales from the same Company Stores for the equivalent period in the prior year. A Company Store is included in this calculation after its first full fiscal year of operations. Sales from Franchise and International Stores are excluded in the Company Store comparable sales. |
30
The following table sets forth certain data relating to Company Stores, Franchise Stores and International Stores for the periods indicated:
| Fiscal year ended | ||||||||||||
| December 29, 2015 | December 30, 2014 | December 31, 2013 | ||||||||||
| Company Stores: | ||||||||||||
| Beginning of year | 263 | 268 | 301 | |||||||||
| Company Stores opened | - | - | 2 | |||||||||
| Company Stores acquired from franchisees | 2 | 26 | - | |||||||||
| Company Stores closed | (16 | ) | (13 | ) | (4 | ) | ||||||
| Company Stores sold to franchisees | (179 | ) | (18 | ) | (31 | ) | ||||||
| Total Company Stores | 70 | 263 | 268 | |||||||||
| Fiscal year ended | ||||||||||||
| December 29, 2015 | December 30, 2014 | December 31, 2013 | ||||||||||
| Franchise Stores - Domestic: | ||||||||||||
| Beginning of year | 543 | 535 | 473 | |||||||||
| Franchise Stores opened | 51 | 43 | 52 | |||||||||
| Franchise Stores purchased by Company | (2 | ) | (26 | ) | - | |||||||
| Franchise Stores closed | (23 | ) | (27 | ) | (21 | ) | ||||||
| Franchise Stores purchased from Company | 179 | 18 | 31 | |||||||||
| Total Franchise Stores - Domestic | 748 | 543 | 535 | |||||||||
| Fiscal year ended | ||||||||||||
| December 29, 2015 | December 30, 2014 | December 31, 2013 | ||||||||||
| International Stores: | ||||||||||||
| Beginning of year | 62 | 48 | 35 | |||||||||
| International Stores opened | 22 | 24 | 15 | |||||||||
| International Stores closed | (9 | ) | (10 | ) | (2 | ) | ||||||
| Total International Stores | 75 | 62 | 48 | |||||||||
| ITEM 7. | MANAGEMENT’S DISCUSSION AND ANALYSIS OF FINANCIAL CONDITION AND RESULTS OF OPERATIONS |
You should read the following discussion and analysis in conjunction with Part II, Item 6 “Selected Financial Data” and our audited consolidated financial statements and the related notes thereto included in Item 8 “Financial Statements and Supplementary Data.” In addition to historical consolidated financial information, this discussion contains forward-looking statements that reflect our plans, estimates and beliefs. Actual results could differ from these expectations as a result of factors including those described under Item 1A, “Risk Factors,” “Special Note Regarding Forward-Looking Statements” and elsewhere in this Form 10-K.
31
JAMBA, INC. OVERVIEW
Jamba, Inc. through its wholly-owned subsidiary, Jamba Juice Company, is a healthy, active lifestyle brand with a robust global business driven by a portfolio of franchised and company-owned Jamba Juice® stores and licensed JambaGO® and Jamba Juice Express™ formats. The Jamba® brand includes innovative product platforms and both licensed and company driven consumer packaged goods. We are a leading restaurant retailer of “better-for-you” specialty food and beverage offerings which include great tasting, whole fruit smoothies, fresh squeezed juices and juice blends, Energy Bowls, and a variety of food items including, hot oatmeal, breakfast wraps, sandwiches, Artisan Flatbreads, baked goods, and snacks. Jamba Juice Company continues to expand the Jamba brand by direct selling of CPG products, and by licensing its trademarks for CPG products sold through retail channels such as grocery stores, warehouse clubs, and convenience stores.
Jamba, Inc. was incorporated in January 2005, and went public through an initial public offering later that year. In November 2006, the Company completed its acquisition of Jamba Juice Company, which first began operations in 1990. As of December 29, 2015, there were 893 Jamba Juice stores globally, consisting of 70 Company Stores, 748 Franchise Stores in the United States, and 75 International Stores.
All references to store counts, including data for new store openings, are reported net of related store closures, unless otherwise noted.
Fiscal Year
Our fiscal year ends each year on the Tuesday closest to December 31st and therefore we have a 52 or 53 week fiscal year. In a 53 week fiscal year, the fourth fiscal quarter has 14 weeks. The first and second periods of the fiscal quarters have four weeks each and the third period of each fiscal quarter has five or six weeks. Unless otherwise stated, references to years in the report relate to fiscal years rather than to calendar years. The following fiscal periods are presented in this report.
| Fiscal Period | Period Covered | Weeks | ||
| Fiscal Year 2015 | December 31, 2014 to December 29, 2015 | 52 | ||
| Fiscal Year 2014 | January 1, 2014 to December 30, 2014 | 52 | ||
| Fiscal Year 2013 | January 2, 2013 to December 31, 2013 | 52 |
EXECUTIVE OVERVIEW
Key Overall Strategies
Our BLEND Plan, launched in 2009, continues to guide the Company’s strategy toward transforming Jamba into a globally recognized healthy, active lifestyle brand. Since the introduction of the BLEND Plan, we have accelerated our growth and profitability by following a disciplined set of strategic priorities. The BLEND Plan guides the Company in building Jamba® into a global lifestyle brand that delivers increased earnings and return to shareholders by offering consumers differentiated products and retail experiences at Jamba Juice® stores, ongoing cost-savings initiatives, and through expansion into broader retail distribution channels.
We continue to focus on increasing brand awareness and building our leadership in the fast-growing and highly competitive juice category through differentiated, on-trend new product introductions, an accelerated juice expansion plan and enhanced marketing and communication activation to support our better-for-you brand positioning and to attract new consumers. Our key product categories will be juices, smoothies and bowls. Our priorities will also include the expansion of our global footprint, drive store-level profitability through four-wall cost optimization plans, and transform our model through an aggressive refranchising plan and franchise recruiting efforts.
32
Fiscal 2015 Financial Summary
| · | Net income was $9.4 million compared to $(3.6) million net loss for the prior year. |
| · | Company Stores comparable sales increased 1.5% for the year compared to the prior year, reflecting a fifth consecutive fiscal year of comparable store sales growth. |
| · | System-wide comparable sales increased 2.3% and Franchise Store comparable sales increased 2.7% for the year compared to the prior year. System-wide and Franchise Store comparable store sales are non-GAAP financial measures and represent the change in year-over-year sales for all Company and Franchise Stores (system-wide) and for all Franchise Stores, respectively, opened for at least one full fiscal year. |
| · | Total revenue for the year decreased 25.9% to $161.7 million from $218.0 million for the prior year, primarily as a result of the refranchise of 179 Company Stores, partially offset by the 1.5% increase in Company Store comparable sales and 2.7% increase in Franchise store comparable sales. |
| · | General and administrative expenses for the year decreased 1.1% to $36.9 million for the year compared to $37.3 million for the prior year. |
| · | Gain on disposal of assets was $21.6 million for the year compared to $3.0 million for the prior year as a result of refranchising 179 stores in fiscal 2015. |
| · | Income from operations was $10.3 million and operating margin was 6.3% for the year. |
| · | Franchisees opened 73 new Jamba Juice stores globally; which included seven Jamba Juice Express™ in the United States and 22 new International Stores. At December 29, 2015, there were 893 stores globally; 70 Company Stores, 748 Franchise Stores and 75 International Stores. |
| · | During fiscal 2015, 1.9 million shares were repurchased at an average cost of $14.38 under our share repurchase plan. |
Fiscal 2015 Business Highlights
Brand activation and leadership
Our consumer messaging for 2015 was centered around the theme “Blend In The Good”, designed to focus consumers on the benefits of the fresh fruits and vegetables that are used to make our smoothies, juices and bowls. This campaign was executed over multiple media sources, including digital, social, public relations, TV, radio and print. We reached millions of Millennials through the power of social media in partnership with DanceOn, the number one ranked YouTube channel, and with Pharrell Williams.
In 2015 we re-launched our corporate social responsibility initiatives under the banner of “Team Up For a Healthy Whirl’d” a platform that encourages consumers, partners, and employees to join us in our efforts to inspire healthy people, products, planet, and community. Through Team Up For a Healthy Whirl’d we lead sustainability initiatives, programs to inspire healthier employees, and a number of community engagement activities in the markets we serve.
As we continue to strengthen our brand, we also entered into or expanded programs with strategic partners including with Spendgo, Google, Twitter, SoftCard, Groupon, and others to enhance the customer experience in our stores and in the digital and social media space. Our Jamba Insider Rewards (“JJR”) program was introduced in February of 2014 and today we have 2 million loyalty members. Our loyalty members are rewarded with promotional offers such as discounts, free product and advance notice of in-store events. Through JIR, we distribute monthly emails to our members, informing them of new products and promotions. We recently launched our new Jamba Juice mobile application (“app”), helping customers locate stores, order ahead, speed up transactions and improve the online and in-store experience. We see markedly increased engagement in our social media platforms and on the improved Jamba website, which we launched earlier in the year.
As we move to our new asset-light model, we are also building the brand on a local level through multi-channel brand marketing, including the expansion of consumer loyalty programs, the development of engaging local marketing promotions and robust social media communications. By providing our franchisees with tools and technologies that target their customers through email, social media, radio and out-of-home advertising, we are helping them target consumers in their immediate trade areas. In the third quarter, we piloted a television ad campaign in key markets, our first-ever television ads.
We are building the brand on both a national and global level through innovative product development as we continue to meet the needs of today’s increasingly health-conscious consumer. We are addressing our customers’ health and wellness needs by our offerings centered on “Whole Food Nutrition,” which encompass blending juices and combining whole fruits and vegetables into nutritious and convenient beverages and product offerings across all day-parts. We are now also offering consumers a great-tasting and nutritious alternative with our new Almond Milk Smoothies. Awareness of both products was generated via in-store point of purchase, online and social media and through a robust public relations campaign in major media markets.
33
Continuing in our mission to serve the community, we launched our fall grant program, partnering with the National Gardening Association and their Kid’s Gardening program. We continued to drive awareness of the need to encourage better dietary and fitness habits in kids through our Team Up For a Healthy America program and through partnerships with the American heart Association, National Gardening Association and the GenYouth Foundation. Our recently launched fundraising card helps support schools in Jamba markets across the country.
Leverage an innovative in-store experience to drive four-wall profitability
As we transition to 2016 and with the completion of our move to a franchise business model, we are highly focused in improving franchisee profitability and 4-wall store margins. Areas that we will highlight are driving profitable traffic and continuing to find ways to reduce costs of goods and other costs used in our product platforms.
During 2015, we accelerated the launch of innovative, on-trend products that reaffirmed Jamba’s category leadership in juices and smoothies, which resulted in increases in labor costs due to a strain on speed-of-service and increases in cost of goods sold. This resulted in 4-wall store profit margin decreases in the early part of the year. By the third quarter, we operationalized several key initiatives that had a significant positive impact on COGS and labor. As our innovative juice and bowls platforms continue to show strong performance, we believe that with these course-corrections, these product introductions will be key drivers toward the transformation of the brand and continued positive growth.
Expand retail footprint on a global basis
Our growth initiatives embody the multiple portfolio opportunities we have to expand our world-wide restaurant business, including traditional and non- traditional stores, smaller footprint Jamba Juice Express™ and the JambaGO® formats. As of December 29, 2015, there were 893 Jamba Juice® stores globally, represented by 70 Company Stores and 823 Franchise Stores, of which 42 were Jamba Juice Express™ in the United States, and 75 International Stores. The system is comprised of approximately 92% Franchise and International Store locations and 8% Company Store locations. As of December 29, 2015, we were over 2,000 JambaGO® units in operation nationwide.
A primary growth driver of our enterprise will be new unit development on a global basis. Domestically, we plan on our franchisees opening up to 500 new units over the next four to five years, in both traditional and small format venues. We have a variety of formats to expand our global footprint, including traditional and non-traditional stores, smaller footprint ™ and the JambaGO® formats. During 2015, we announced the launch of a new franchise recruiting campaign focusing on single store development in existing and new domestic markets in order to enhance the implementation of our asset-light model. We are engaged in an aggressive marketing campaign, supported by a rigorous application and selection process. Jamba is leveraging a variety of media, including print and online resources as well as multiple-market road shows to attract potential local franchise owners.
During the year, 51 new locations were opened in the United States, of which 7 locations were new Jamba Juice Express™. In addition, 22 stores were opened at International locations. All International Stores are operated by master franchise partners.
At the end of fiscal 2015, we had international master development agreements with partners in Indonesia, Thailand, South Korea, the Philippines, Mexico and the countries of the Gulf Cooperation Council (Bahrain, Kuwait, Oman, Qatar, Saudi Arabia, and the United Arab Emirates). Our partner in Taiwan, Quan Hung Gourmet Company, opened the first Jamba Juice store in Taiwan on October 30th, 2015. In 2015, we signed a master franchise development agreement with PT Sari Gemilang Makmur (“PT Sari”), a subsidiary of PT Mitra Adiperkasa Tbk, in Indonesia for 70 stores over 10 years. PT Sari operates over 1,800 retail outlets in 65 cities throughout Indonesia. We expect the first store in Indonesia to open in the first half of 2016. In 2015, we signed a master franchise development agreement with King of Juices Company, LTD (“King of Juices”), in Thailand for 30 stores over 10 years. King of Juices is a new entity led by Ms. Ausanee Mahagitsiri, a seasoned executive who successfully operates other food & beverage concepts in Thailand. We expect the first store in Thailand to open by third quarter 2016.
New products - leadership in smoothies, juices and bowls
During fiscal 2014, we launched our made-to-order, fresh fruit and vegetable juice platform in over 500 locations, and currently operate this platform in 550 locations. This platform is primarily comprised of made-to-order juices and smoothies blended with fresh, whole fruits and vegetables like kale, apples, cucumbers, ginger and chia seeds. We believe that we are in the forefront of the consumer trend towards healthier beverage options.
We also introduced a new line of made-to-order bowls in stores nationwide during late fiscal 2014. Jamba Energy Bowls, served in convenient, portable servings, are a nutritious blend of real, whole fruit and soymilk or fresh Greek yogurt, topped with an assortment of dry toppings and fresh fruits. Jamba Energy Bowls™ are a convenient way to get fruit, antioxidants like Vitamin C, and protein and will satisfy consumers looking for a meal replacement they can eat with a spoon.
34
Drive the asset-light business model to enhance shareholder value
We have moved aggressively to an asset-light business model that now incorporates a greater than 90% franchise-location organization, increased from 70% in 2014 after the completion of our refranchising initiative in 2015 involving 179 operating Company Stores and one unopened store. This transition to an asset-light business model is designed to facilitate a more flexible cost structure which would enable faster execution and enhanced focus on growth initiatives and allow us to pursue additional cost savings.
We previously announced our plan to repurchase up to $45 million of our stock as a way to aggressively return capital to shareholders to enhance shareholder value and have $5.0 million available for share repurchase at the end of fiscal 2015. In addition, we plan to continue to examine our capital allocation strategies to continue to return value to our shareholders.
CRITICAL ACCOUNTING POLICIES AND ESTIMATES
The preparation of consolidated financial statements in conformity with GAAP requires the appropriate application of certain accounting policies, many of which require us to make estimates and assumptions about future events and their impact on amounts reported in our consolidated financial statements and related notes. Since future events and their impact cannot be determined with certainty, actual results may differ from our estimates. Such differences may be material to the consolidated financial statements.
We believe our application of accounting policies, and the estimates inherently required therein, are reasonable. These accounting policies and estimates are periodically reevaluated, and adjustments are made when facts and circumstances dictate a change.
Our accounting policies are more fully described in Note 1 “Business and Summary of Significant Accounting Policies” in the “Notes to Consolidated Financial Statements,” included elsewhere in this Form 10-K. We consider the following policies to be the most critical in understanding the judgments that are involved in preparing the consolidated financial statements.
Impairment of Long-Lived Assets
We evaluate long-lived assets for impairment when facts and circumstances indicate that the carrying values of long-lived assets may not be recoverable. The impairment evaluation is generally performed at the individual store asset group level. We first compare the carrying value of the asset to the asset’s estimated future undiscounted cash flows. If the estimated future cash flows are less than the carrying value of the asset, we measure an impairment loss based on the asset’s estimated fair value. The fair value of a store’s assets is estimated using a discounted cash flow model based on internal projections and taking into consideration the view of a market participant. The estimate of cash flows is based on, among other things, certain assumptions about expected future operating performance. Factors considered during the impairment evaluation include factors related to actual operating cash flows, the period of time since a store has been opened or remodeled, refranchising expectations and the maturity of the relevant market.
Our estimates of cash flows used to assess impairment are subject to a high degree of judgment. If our estimates of future cash flows differ from actual cash flows due to, among other things, changes in economic conditions, changes to our business model or changes in operating performance, it would result in an adjustment to results of operations.
Intangible Asset Impairment
Goodwill
We evaluate goodwill for impairment on an annual basis during our fourth fiscal quarter, or more frequently if circumstances, such as material deterioration in performance, indicate carrying values may exceed their fair values. In September 2011, the FASB issued new guidance allowing an entity the option to make a qualitative evaluation about the likelihood of goodwill impairment to determine whether it should calculate the fair value of a reporting unit. If impairment is deemed more likely than not, management would perform the currently prescribed two-step goodwill impairment test. Otherwise, the two-step goodwill impairment test is not required. First, the reporting unit’s estimated fair value is compared to its carrying value, including goodwill. If we determine that the estimated fair value of the reporting unit is less than its carrying value, we move to the second step to determine the implied fair value of the reporting unit’s goodwill. If the carrying amount of the reporting unit’s goodwill exceeds its fair value, an impairment loss is recognized. When reviewing goodwill for impairment, we assess whether goodwill should be allocated to operating levels lower than our single operating segment for which discrete financial information is available and reviewed for decision-making purposes. These lower levels are referred to as reporting units. Currently, our one operating segment was determined to be one reporting unit. Considerable judgment is applied in determining the assumptions used in the qualitative evaluation and in computing fair value. Changes in the assumptions could result in an adjustment to our results of operations.
35
Other Intangible Assets with Indefinite Lives
We evaluate intangible assets not subject to amortization (primarily trademarks) for impairment on an annual basis during the fourth fiscal quarter, or more frequently if events or changes in circumstances indicate that the asset might be impaired. We qualitatively assess the impairment for other intangible assets not subject to amortization to determine whether it is more likely than not that the fair value of intangible assets are less than their carrying amount. For other intangible assets not subject to amortization not assessed qualitatively, a quantitative approach is utilized. We compare the carrying value of the applicable asset to its fair value, which we estimate using a discounted cash flow analysis or by comparison with the market values of similar assets. If the carrying amount of the asset exceeds its estimated fair value, we determine the impairment loss, if any, as the excess of the carrying value of the intangible asset over its fair value. Changes in the assumptions for the discounted cash flow analysis could result in an adjustment to our results of operations.
Other Intangible Assets with Finite Lives
Intangible assets subject to amortization (primarily franchise agreements, reacquired franchise rights, favorable lease intangible assets and acquired customer relationships) are tested for recoverability whenever events or changes in circumstances indicate that their carrying amounts may not be recoverable. Actual results may differ from our estimates and could cause an adjustment to results of operations.
Jambacard® Revenue Recognition
We sell our jambacards to our customers in our retail stores, through our website at www.jambajuice.com and through our resellers. We have sold jambacards since November of 2002. The jambacard works as a reloadable gift card. At the time of the initial load, in an amount between $5 and $500, we record an obligation that is reflected as jambacard liability on the consolidated balance sheets. We relieve the liability and record the related revenue at the time a customer redeems any part of the amount on the card. The card does not have any expiration provisions and is not refundable, except as otherwise required by law.
We recognize income from jambacards when (i) the jambacard is redeemed by the customer or (ii) the likelihood of the jambacard being redeemed by the customer is remote (also referred to as “breakage”), and we determine that we do not have a legal obligation to remit the value of unredeemed jambacards to the relevant jurisdictions. We determine the jambacard breakage amount based upon historical redemption patterns. We review the activity and then conclude that after a certain amount of inactivity the likelihood of redemption becomes remote, and we recognize breakage at that time. Jambacard breakage income is included in other operating, net in the consolidated statements of operations. If the historical redemption pattern changes, our financial statements could be materially affected.
Income Taxes
Deferred tax assets and liabilities are recognized for the future tax consequences attributable to differences between the financial statement carrying amounts of existing assets and liabilities and their respective tax basis. Deferred tax assets and liabilities are measured using enacted income tax rates expected to apply to taxable income in the years in which those temporary differences are expected to be recovered or settled. Any effect on deferred tax assets and liabilities due to a change in tax rates is recognized in income in the period that includes the enactment date. In establishing deferred income tax assets and liabilities, judgments and interpretations are made based on enacted tax laws and published tax guidance applicable to our operations.
Uncertain tax positions are recognized as the greatest amount more than 50% likely of being sustained upon audit based on the technical merits of the position. On a quarterly basis, the Company reviews and updates its inventory of tax positions as necessary to add any new uncertain tax positions taken, or to remove previously identified uncertain positions that have been effectively settled. Additionally, uncertain positions may be re-measured as warranted by changes in facts or law. Accounting for uncertain tax positions requires significant judgments, including estimating the amount, timing and likelihood of ultimate settlement. Although the Company believes that these estimates are reasonable, actual results could differ from these estimates. The Company classifies interest and penalties related to income taxes as a component of income taxes in the consolidated statements of operations.
A liability related to an unrecognized tax benefit is offset against a deferred tax asset for a net operating loss carryforward, a similar tax loss or a tax credit carryforward if such settlement is required or expected in the event the uncertain tax position is disallowed. In situations in which a net operating loss carryforward, a similar tax loss or a tax credit carryforward is not available at the reporting date under the tax law of a jurisdiction or the tax law of a jurisdiction does not require it, and the Company does not intend to use the deferred tax asset for such purpose, the unrecognized tax benefit is presented in the financial statement as a liability and is not combined with deferred tax assets.
Share-based compensation
We account for share-based compensation at fair value. The fair value of options granted is estimated at the date of grant using a Black-Scholes option-pricing, or a lattice model, as deemed appropriate. Option valuation models, including Black-Scholes, require the input of subjective assumptions, and changes in the assumptions used can materially affect the grant date fair value of an award.
36
These assumptions include the risk-free rate of interest, expected dividend yield, expected volatility and the expected life of the award. The risk-free rate of interest is based on the zero coupon U.S. Treasury rates appropriate for the expected term of the award. Expected dividends are zero based on history of not paying cash dividends on our common stock. Expected volatility is based on an average of our recent historic daily stock price observations of our common stock during the period immediately preceding the share-based award grant that is equal in length to the award’s expected term and our implied volatility based on the mean of 180-day call and put options as per the open market. We make assumptions for the number of awards that will ultimately not vest (“forfeitures”) in determining the share-based compensation expense for these awards. We use historical data to estimate expected employee behaviors related to option forfeitures. The expected life is the median of the Company’s peer group’s expected life, after adjusting for vesting and term differences. Currently, there is no market-based mechanism or other practical application to verify the reliability and accuracy of the estimates stemming from these valuation models or assumptions, nor is there a means to compare and adjust the estimates to actual values, except for annual adjustments to reflect actual forfeitures.
The fair value of restricted stock units is determined based on our closing stock price on the date of grant. The restricted stock units granted to employees typically vest and become unrestricted over the three year period following the date of grant. The restricted stock units granted to non-employee directors typically vest and become unrestricted one year after the date of grant. Share-based compensation expense is recognized ratably over the vesting periods for restricted stock units.
The fair value of performance stock units (“PSUs”), which are granted to Company Vice Presidents and above, is determined based on the fair value at grant date. We record expenses related to PSUs with criteria based on market performance by recognizing grant date fair value over the vesting period. Judgment is applied in determining the assumptions for computing the fair value of share-based compensation. Changes in the assumptions could result in an adjustment to our results of operations.
Self-Insurance Reserves
We are self-insured for healthcare benefits. The estimated accruals for these liabilities are based on statistical analyses of historical industry data as well as actual historical trends. For our workers’ compensation benefits, starting October 1, 2015 the Company has a guaranteed cost policy. However, we were self-insured for existing and prior years’ exposures through September 30, 2008. In addition, from September 30, 2008 until September 30, 2015, the Company had a retrospective policy. For both these policies, liabilities associated with the risks that we retain for workers compensation benefits are estimated in part, by considering historical claims experience, demographic factors, severity factors, and other actuarial assumptions. Our estimates use this actuarial data in conjunction with known industry trends and Company experience. If actual claims experience differs from our assumptions, historical trends, and estimates, changes in our insurance reserves would impact the expense recorded in our consolidated statements of operations.
37
RESULTS OF OPERATIONS
The discussion that follows should be read in conjunction with the consolidated financial statements and notes thereto. Our consolidated results of operations for fiscal 2015, 2014 and 2013 are summarized below.
(In thousands, except share data and per share amounts)
| Year ended December 29, 2015 | %(1) | Year ended December 30, 2014 | %(1) | Year ended December 31, 2013 | %(1) | |||||||||||||||||||
| Revenue: | ||||||||||||||||||||||||
| Company Stores | $ | 137,025 | 84.8 | % | $ | 198,737 | 91.1 | % | $ | 212,887 | 92.9 | % | ||||||||||||
| Franchise and other revenue | 24,651 | 15.2 | % | 19,311 | 8.9 | % | 16,362 | 7.1 | % | |||||||||||||||
| Total revenue | 161,676 | 100.0 | % | 218,048 | 100.0 | % | 229,249 | 100.0 | % | |||||||||||||||
| Costs and operating expenses (income): | ||||||||||||||||||||||||
| Cost of sales | 33,737 | 24.6 | % | 52,236 | 26.3 | % | 52,211 | 24.5 | % | |||||||||||||||
| Labor | 44,732 | 32.6 | % | 61,749 | 31.1 | % | 62,015 | 29.1 | % | |||||||||||||||
| Occupancy | 18,951 | 13.8 | % | 27,630 | 13.9 | % | 29,350 | 13.8 | % | |||||||||||||||
| Store operating | 25,152 | 18.4 | % | 33,089 | 16.6 | % | 34,802 | 16.3 | % | |||||||||||||||
| Depreciation and amortization | 6,569 | 4.1 | % | 10,084 | 4.6 | % | 10,974 | 4.8 | % | |||||||||||||||
| General and administrative | 36,872 | 22.8 | % | 37,278 | 17.1 | % | 37,771 | 16.5 | % | |||||||||||||||
| Gain on disposal of assets | (21,609 | ) | (13.4 | )% | (2,957 | ) | (1.4 | )% | (3,153 | ) | (1.4 | )% | ||||||||||||
| Store pre-opening | 1,031 | 0.6 | % | 763 | 0.3 | % | 880 | 0.4 | % | |||||||||||||||
| Impairment of long-lived assets | 2,523 | 1.6 | % | 175 | 0.1 | % | 728 | 0.3 | % | |||||||||||||||
| Store lease termination and closure | 1,669 | 1.0 | % | 575 | 0.3 | % | 148 | 0.1 | % | |||||||||||||||
| Other operating, net | 1,795 | 1.1 | % | 726 | 0.3 | % | 1,155 | 0.5 | % | |||||||||||||||
| Total costs, operating expenses, and gain | 151,422 | 93.7 | % | 221,348 | 101.5 | % | 226,881 | 99.0 | % | |||||||||||||||
| Income (loss) from operations | 10,254 | 6.3 | % | (3,300 | ) | (1.5 | )% | 2,368 | 1.0 | % | ||||||||||||||
| Other income (expense): | ||||||||||||||||||||||||
| Interest income | 137 | 0.1 | % | 74 | 0.1 | % | 9 | 0.0 | % | |||||||||||||||
| Interest expense | (220 | ) | (0.1 | )% | (195 | ) | (0.1 | )% | (242 | ) | (0.1 | )% | ||||||||||||
| Total other expense, net | (83 | ) | (0.0 | )% | (121 | ) | 0.0 | % | (233 | ) | (0.1 | )% | ||||||||||||
| Income (loss) before income taxes | 10,171 | 6.3 | % | (3,421 | ) | (1.5 | )% | 2,135 | 0.9 | % | ||||||||||||||
| Income tax expense | (701 | ) | (0.4 | )% | (168 | ) | (0.1 | )% | (55 | ) | (0.0 | )% | ||||||||||||
| Net income (loss) | 9,470 | 5.9 | % | (3,589 | ) | (1.6 | )% | 2,080 | 0.9 | % | ||||||||||||||
| Preferred stock dividends and deemed dividends | - | - | - | - | (588 | ) | (0.3 | )% | ||||||||||||||||
| Less: Net income attributable to noncontrolling interest | 52 | 0.0 | % | 43 | 0.0 | % | - | - | ||||||||||||||||
| Net income (loss) attributable to Jamba, Inc. | $ | 9,418 | 5.8 | % | $ | (3,632 | ) | (1.6 | )% | $ | 1,492 | 0.6 | % | |||||||||||
| Weighted -average shares used in the computation of earnings (loss) per share attributable to Jamba, Inc.: | ||||||||||||||||||||||||
| Basic | 15,787,806 | 17,197,904 | 16,793,235 | |||||||||||||||||||||
| Diluted | 16,228,033 | 17,197,904 | 17,222,030 | |||||||||||||||||||||
| Earnings (loss) per share attributable to Jamba, Inc. common stockholders: | ||||||||||||||||||||||||
| Basic | $ | 0.60 | $ | (0.21 | ) | $ | 0.09 | |||||||||||||||||
| Diluted | $ | 0.58 | $ | (0.21 | ) | $ | 0.09 | |||||||||||||||||
| (1) | Cost of sales, labor, occupancy and store operating expense percentages are calculated using Company Stores revenue. All other line items are calculated using Total revenue. Certain percentage amounts do not sum to total due to rounding. |
38
Revenue (in 000s)
| Year Ended December 29, 2015 | % of Total Revenue | Year Ended December 30, 2014 | % of Total Revenue | Year Ended December 31, 2013 | % of Total Revenue | |||||||||||||||||||
| Revenue: | ||||||||||||||||||||||||
| Company Stores | $ | 137,025 | 84.8 | % | $ | 198,737 | 91.1 | % | $ | 212,887 | 92.9 | % | ||||||||||||
| Franchise and other revenue | 24,651 | 15.2 | % | 19,311 | 8.9 | % | 16,362 | 7.1 | % | |||||||||||||||
| Total revenue | $ | 161,676 | 100.0 | % | $ | 218,048 | 100.0 | % | $ | 229,249 | 100.0 | % | ||||||||||||
Fiscal Year 2015 to Fiscal Year 2014
Total revenue in fiscal 2015 was $161.7 million, a decrease of $56.4 million or 25.9%, compared to $218.0 million in fiscal 2014. Total revenue is comprised of revenue from Company Stores, royalties and fees from Franchise Stores in the U.S. and from International Stores, income from JambaGO® locations, license income from sales of Jamba-branded CPG products and direct sales of CPG products.
Company Store revenue
Company Store revenue in fiscal 2015 was $137.0 million, a decrease of $61.7 million or 31.1% compared to $198.7 million in fiscal 2014. The decrease in Company Store revenue is primarily due to the reduction of 179 Company Stores due to our refranchising strategy, partially offset by the increase in comparable store sales, as illustrated by the following table:
| Company Store Decrease in Revenue (in 000’s) 2015 vs. 2014 | ||||
| Company Store comparable sales increase | $ | 2,050 | ||
| Reduction in Company Store revenue due to decrease in the number of Company Stores, net | (63,762 | ) | ||
| Total change in Company Store revenue | $ | (61,712 | ) | |
Company Store comparable sales increased $2.1 million in fiscal 2015, or 1.5%, primarily attributable to an increase of 5.0% in average check offset by a decrease of 3.5% in transaction count related to the significantly reduced number of promotions run in fiscal 2015 compared to fiscal 2014. Company Store comparable sales represents the change in year-over-year sales for all Company Stores opened for at least one full fiscal year. As of December 29, 2015, 100% of our Company Stores had been open for at least one full fiscal year. The percentage change in Company Store comparable sales compares the sales of Company Stores during the fiscal year to the sales from the same Company Stores for the equivalent prior year period.
Due to the refranchise activity that occurred throughout fiscal 2015, Company Store revenue comparisons to the prior year will reflect significant decreases on a quarterly and annual basis for fiscal 2016.
Franchise and other revenue
Franchise and other revenue in fiscal 2015 was $24.7 million, an increase of $5.3 million, or 27.7%, compared to franchise and other revenue of $19.3 million in fiscal 2014 primarily due to an increase in the number of Franchise and International Stores. Other revenue, which primarily includes revenue from JambaGo® and CPG, increased by $0.3 million or 5.6% to $5.4 million, compared to $5.1 million in fiscal 2014.
The number of Franchise Stores and International Stores grew to 823 as of December 29, 2015 compared to 605 as of December 30, 2014.
Fiscal Year 2014 to Fiscal Year 2013
Total revenue in fiscal 2014 was $218.0 million, a decrease of $11.2 million or 4.9%, compared to $229.2 million in fiscal 2013.
Company Store revenue
Company Store revenue in fiscal 2014 was $198.7 million, a decrease of $14.2 million or 6.6% compared to $212.9 million in fiscal 2013. The decrease in Company Store revenue is primarily due to the net reduction in Company Stores due to our refranchising strategy, partially offset by the increase in comparable store sales, as illustrated by the following table:
39
| Company Store Decrease in Revenue (in 000’s) 2014 vs. 2013 | ||||
| Company Store comparable sales increase | $ | 5,306 | ||
| Reduction in Company Store revenue due to decrease in the number of Company Stores, net | (19,456 | ) | ||
| Total change in Company Store revenue | $ | (14,150 | ) | |
Company Store comparable sales increased $5.3 million in fiscal 2014, or 2.8%, primarily attributable to an increase of 4.7% in average check offset by a decrease of 1.9% in transaction count. Company Store comparable sales represents the change in year-over-year sales for all Company Stores opened for at least one full fiscal year. As of December 30, 2014, 100% of our Company Stores had been open for at least one full fiscal year. The percentage change in Company Store comparable sales compares the sales of Company Stores during the fiscal year to the sales from the same Company Stores for the equivalent prior year period.
Franchise and other revenue
Franchise and other revenue in fiscal 2014 was $19.3 million, an increase of $2.9 million, or 18.0%, compared to franchise and other revenue of $16.4 million in fiscal 2013 primarily due to an increase in JambaGO® income and the net increase in the number of Franchise and International Stores.
The number of Franchise Stores and International Stores grew to 605 as of December 30, 2014 compared to 583 as of December 31, 2013.
Cost of sales
Cost of sales is primarily comprised of produce, dairy, and other products used to make smoothies and juices, and paper products.
Fiscal Year 2015 to Fiscal Year 2014
As a percentage of Company Store revenue, cost of sales decreased to 24.6% in fiscal 2015, compared to 26.3% in fiscal 2014. The decrease of cost of sales as a percentage of Company Store revenue was primarily due to the benefit from lower sales discounts/price changes (approximately 1.4%), commodities pricing / product mix shift between smoothies and juices (approximately 0.5%) partially offset by an increase in waste of 0.2%. Cost of sales for fiscal 2015 was $33.7 million, a decrease of $18.5 million, as compared to $52.2 million for fiscal 2014, primarily resulting from our refranchising initiative, which was the primary driver of the reduced number of Company Stores from 263 to 70.
Fiscal Year 2014 to Fiscal Year 2013
As a percentage of Company Store revenue, cost of sales increased to 26.3% in fiscal 2014, compared to 24.5% in fiscal 2013. The increase of cost of sales as a percentage of Company Store revenue was primarily due to product mix shift (approximately 1.4%) due to the introduction of our freshly squeezed juices and bowl offerings which carry higher costs and increases in commodity costs (approximately 0.6%). Cost of sales for fiscal 2014 was $52.2 million, flat compared to $52.2 million for fiscal 2013.
Labor
Labor costs are comprised of store management salaries and bonuses, hourly team member payroll, training costs and other associated fringe benefits.
Fiscal Year 2015 to Fiscal Year 2014
As a percentage of Company Store revenue, labor costs increased to 32.6% in fiscal 2015, compared to 31.1% in fiscal 2014. The increase was primarily attributable to the California minimum wage rate increase that was effective July 1, 2014 (approximately 1.2%), an increase in Health Insurance costs due to the Affordable Care Act (approximately 0.5%) and higher wages from the reacquired Chicago store portfolio which occurred in the third quarter of fiscal 2014 (approximately 1.0%) offset favorably by higher Sales leverage and increased staffing efficiencies and operational optimization (approximately 0.9%). Labor costs for fiscal 2015 were $44.7 million, a decrease of $17.0 million compared to $61.7 million for fiscal 2014, primarily resulting from our refranchising initiative, which was the primary driver of the reduced number of Company Stores from 263 to 70.
40
Fiscal Year 2014 to Fiscal Year 2013
As a percentage of Company Store revenue, labor costs increased to 31.1% in fiscal 2014, compared to 29.1% in fiscal 2013. The increase was primarily attributable to increases in payroll expenses, related to the California minimum wage rate increase to $9.00/hour effective July 1, 2014 (approximately 0.9%) and an increase related to additional staffing needs required to maintain speed of service while supporting the expanded fresh juice and bowls programs (approximately 0.4%). Additionally, labor increased due to an increase in benefit claims (approximately 0.3%). Labor costs for fiscal 2014 were $61.7 million, a decrease of $0.3 million compared to $62.0 million for fiscal 2013, primarily due to a decrease in the number of Company Stores and a decrease in related labor costs and expenses to operate, manage, and support these locations. The reduction in expense was partially offset by the increased labor costs to support the increased sales at existing Company Stores and increased staffing utilized for the roll-out of the new product platforms.
Occupancy
Occupancy costs include both fixed and variable portions of rent, common area maintenance charges, property taxes, licenses and property insurance for all Company Store locations.
Fiscal Year 2015 to Fiscal Year 2014
As a percentage of Company Store revenue, occupancy costs were relatively flat, 13.8% in fiscal 2015, compared to 13.9% in fiscal 2014. Occupancy costs for fiscal 2015 were $19.0 million, a decrease of $8.7 million, or 31.4%, compared to $27.6 million for fiscal 2014. The decrease in occupancy costs was primarily due to the net reduction in Company Stores due to our refranchising strategy.
Fiscal Year 2014 to Fiscal Year 2013
As a percentage of Company Store revenue, occupancy costs were relatively flat, 13.9% in fiscal 2014, compared to 13.8% in fiscal 2013. Occupancy costs for fiscal 2014 were $27.6 million, a decrease of $1.7 million, or 5.9%, compared to $29.4 million for fiscal 2013. The decrease in the number of Company Stores year over year resulted in a decrease in the related occupancy costs and expenses to operate, manage, and support these locations.
Store operating expenses
Store operating expenses consist primarily of various store-level costs such as utilities, marketing, repairs and maintenance, credit card fees and other store operating expenses.
Fiscal Year 2015 to Fiscal Year 2014
As a percentage of Company Store revenue, total store operating expenses increased to 18.4% in fiscal 2015, compared to 16.6% in fiscal 2014. The increase in total store operating expenses as a percentage of Company Store revenue was primarily due to an increase to advertising costs (approximately 1.1%), uniform costs related to the new-look roll-out (approximately 0.2%), repairs and maintenance costs to prepare stores for refranchising (approximately 0.1%), and utilities (approximately 0.1%). Total store operating expenses for fiscal 2015 were $25.2 million, a decrease of $7.9 million, or 24.0%, compared to $33.1 million for fiscal 2014, primarily resulting from our refranchising initiative, which was the primary driver of the reduced number of company owned stores from 263 to 70.
Fiscal Year 2014 to Fiscal Year 2013
As a percentage of Company Store revenue, total store operating expenses increased to 16.6% in fiscal 2014, compared to 16.3% in fiscal 2013. The increase in total store operating expenses as a percentage of Company Store revenue was primarily due to increased advertising (approximately 0.1%) and utilities (approximately 0.1%). Total store operating expenses for fiscal 2014 were $33.1 million, a decrease of $1.7 million, or 4.9%, compared to $34.8 million for fiscal 2013, primarily due to the decrease in the number of Company Stores year-over-year which resulted in a decrease in related costs and expenses for these locations.
Depreciation and amortization
Depreciation and amortization expenses include the depreciation of fixed assets and the amortization of intangible assets.
Fiscal Year 2015 to Fiscal Year 2014
As a percentage of total revenue, depreciation and amortization decreased to 4.1% in fiscal 2015, compared to 4.6% in fiscal 2014. The decrease in depreciation and amortization as a percentage of total revenue was primarily due to reclassification from property, fixtures and equipment to assets held for sale for stores prior to their refranchising and the resulting discontinuation of depreciation on those assets. Depreciation and amortization for fiscal 2015 was $6.6 million, a decrease of $3.5 million, or 34.9%, compared to $10.1 million for fiscal 2014.
41
Fiscal Year 2014 to Fiscal Year 2013
As a percentage of total revenue, depreciation and amortization decreased to 4.6% in fiscal 2014, compared to 4.8% in fiscal 2013. The decrease in depreciation and amortization as a percentage of total revenue was primarily due to the impact of leverage as a result of the increase in Company Store comparable sales (approximately 0.1%) and certain assets becoming fully depreciated while capital expenditures remained flat. Depreciation and amortization for fiscal 2014 was $10.1 million, a decrease of $0.9 million, or 8.1%, compared to $11.0 million for fiscal 2013. The decrease is primarily due to the decrease in the number of Company Stores year over year which resulted in the reduction in carrying value of Company Store fixed assets, partially offset by the capital expenditures for the expansion of the fresh juice platform.
General and administrative
General and administrative (G&A) expenses include costs associated with our corporate headquarters in Emeryville, CA, field supervision, performance related incentives, outside and contract services, accounting and legal fees, travel and travel-related expenses, share-based compensation and other.
Fiscal Year 2015 to Fiscal Year 2014
As a percentage of total revenue, G&A expenses increased to 22.8% in fiscal 2015, compared to 17.1% in fiscal 2014. Total G&A expenses for fiscal 2015 were $36.9 million, a decrease of $0.4 million, or 1.1%, compared to $37.3 million for fiscal 2014. The decrease of total G&A expenses was primarily due to decrease in payroll related costs as a result of reduced general and administrative headcount (approximately $4.8 million) and travel costs (approximately $0.6 million) offset by an increase professional fees (approximately $2.8 million), Chief Executive Officer’s severance and bonus (approximately $0.8 million), other senior executives’ severance and bonus (approximately $0.6 million) and increased stock compensation expenses related to stock modifications (approximately $0.8 million). During fiscal year 2015 we incurred costs due to the transition and termination agreements related to our CEO and other senior executives. We also continue to incur costs related to our full transition from a company business model to a franchise model. We exited fiscal 2015 with an annual run rate of G&A expenses of $26.5 million.
Fiscal Year 2014 to Fiscal Year 2013
As a percentage of total revenue, G&A expenses increased to 17.1% in fiscal 2014, compared to 16.5% in fiscal 2013. Total G&A expenses for fiscal 2014 were $37.3 million, a decrease of $0.5 million, or 1.3%, compared to $37.8 million for fiscal 2013. The decrease of total G&A expenses was primarily due to reduced legal, professional and outside services charges (approximately $1.2 million), a decrease in payroll related costs related to reduced general and administrative headcount (approximately $1.1million), partially offset by costs associated with actions taken in 2014 to reduce future expenses, including transition costs related to the outsourcing of accounting, information technology, human resources, and contract management services (approximately $1.4 million) and one-time severance costs (approximately $0.3 million).
Gain on disposal of assets
Gain on disposal of assets includes gains from the refranchising of Company Stores and sales of related furniture, fixtures and equipment.
Fiscal Year 2015 to Fiscal Year 2014
For the fiscal year 2015, the Company recognized gain on disposal of assets of $21.6 million compared to $3.0 million in fiscal year 2014. The increase was primarily due to the gain on refranchising 179 Company Stores relating to our refranchising initiative that was begun in fiscal 2014 to transition the company to an asset-light business model. The refranchising initiative was completed in fiscal 2015.
Fiscal Year 2014 to Fiscal Year 2013
For the fiscal year 2014, gain on disposal of assets was $3.0 million compared to $3.2 million in fiscal 2013, a decrease of $0.2 million. The gain on disposal of assets includes $3.5 million and $4.6 million relating to the sale of fixed assets of refranchised Company Stores in 2014 and 2013, respectively.
Store pre-opening
Fiscal Year 2015 to Fiscal Year 2014
For the fiscal year 2015, Store pre-opening was an expense of $1.0 million compared to an expense of $0.8 million for the fiscal year 2014. The increase in expense of $0.2 million was primarily due to more new store openings over the prior year.
42
Fiscal Year 2014 to Fiscal Year 2013
For the fiscal year 2014, Store pre-opening was an expense of $0.8 million compared to an expense of $0.9 million for the fiscal year 2013. The decrease in expense of $0.1 million was primarily due to less new store openings over the prior year.
Impairment of long-lived assets
Fiscal Year 2015 to Fiscal Year 2014
For the fiscal year 2015, impairment of long-lived assets was an expense of $2.5 million compared to an expense of $0.2 million for the fiscal year 2014. The increase in expense of $2.3 million was primarily due to the non-cash impairment loss relating to stores classified as assets held for sale in the third quarter of fiscal 2015, assets associated with Talbott Teas and other long-lived assets.
Fiscal Year 2014 to Fiscal Year 2013
For the fiscal year 2014, impairment of long-lived assets was an expense of $0.2 million compared to an expense of $0.7 million for the fiscal year 2013. The decrease in expense of $0.5 million was primarily due to decreased impairment expense of long-lived assets due to fewer underperforming stores.
Store lease termination and closure
Fiscal Year 2015 to Fiscal Year 2014
For the fiscal year 2015, store lease termination and closure was an expense of $1.7 million compared to an expense of $0.6 million for the fiscal year 2014. The increase in expense of $1.1 million was primarily due to the eight stores closed at the end of fiscal 2015 before lease expiration.
Fiscal Year 2014 to Fiscal Year 2013
For the fiscal year 2014, store lease termination and closure was an expense of $0.6 million compared to an expense of $0.1 million for the fiscal year 2013. The increase in expense of $0.4 million was primarily due to an increase in store lease termination and closure.
Other operating, net
Other operating, net consists of income from jambacard breakage, jambacard-related fees, expenses related to our franchise, consumer packaged goods and JambaGO® activities.
Fiscal Year 2015 to Fiscal Year 2014
For the fiscal year 2015, other operating, net was an expense of $1.8 million compared to an expense of $0.7 million for the fiscal year 2014. The increase of $1.1 million was primarily due to an increase in bad debt related to the write off of barter credits for marketing services due to vendor insolvency and bad debt (approximately $1.4 million), an increase in CPG and JambaGO® direct expense (approximately $0.4 million), and an increase in International expense (approximately $0.4 million) partially offset by a decrease in franchise expense (approximately $0.4 million), and an increase in Jambacard breakage income (approximately $0.7 million).
Fiscal Year 2014 to Fiscal Year 2013
For the fiscal year 2014, other operating, net was an expense of $0.7 million compared to an expense of $1.2 million for the fiscal year 2013. The decrease in expense of $0.4 million was primarily due to an increase in Jambacard breakage income (approximately $1.6 million) and a decrease in CPG and JambaGO® direct expense (approximately $0.4 million) partially offset by an increase in franchise expense (approximately $1.0 million), and an increase Jambacard expense (approximately $0.5 million).
Interest expense
Fiscal Year 2015 to Fiscal Year 2014
Interest expense in fiscal 2015 and fiscal 2014 was $0.2 million.
Fiscal Year 2014 to Fiscal Year 2013
Interest expense in fiscal 2014 and fiscal 2013 was $0.2 million.
43
Income tax expense/benefit
Fiscal Year 2015 to Fiscal Year 2014
Income tax expense in fiscal 2015 was $(0.7) million compared to an income tax expense of $(0.2) million for fiscal 2014. The increase in income tax expense was primarily due to the fact that the Company generated taxable income in fiscal 2015. The Company was able to reduce the amount of income tax payable in fiscal 2015 by recognizing the benefit of excess stock compensation deductions through the APIC account, however, the excess stock option benefits do not reduce income tax expense from continuing operations.
Fiscal Year 2014 to Fiscal Year 2013
Income tax expense in fiscal 2014 was $(0.2) million compared to an income tax expense of $(0.1) million for fiscal 2013. The increase in income tax expense was primarily due to an increase in foreign withholding tax and the impact of a non-recurring adjustment in the prior year. The increase in foreign withholding taxes was primarily due to the increase in our franchise and royalty income in the foreign countries in fiscal 2014.
Known Events, Trends or Uncertainties Impacting or Expected to Impact Comparisons of Reported or Future Results
Management reviews and discusses its operations based on both financial and non-financial metrics. Among the key financial metrics upon which management focuses, is reviewing the performance based on the Company’s consolidated GAAP results, including Company Store comparable sales, franchise and other revenue, and income from operations. Management also uses certain supplemental, non-GAAP financial metrics in evaluating financial results, including Franchise Store comparable sales and system-wide comparable sales.
Company Store comparable sales represent the change in year-over-year sales for all Company Stores opened for at least one full fiscal year.
Franchise Store comparable sales, a non-GAAP financial measure, represents the change in year-over-year sales for all Franchise Stores opened for at least one full fiscal year, as reported by franchisees and excludes International Stores.
System-wide comparable store sales, a non-GAAP financial measure, represents the change in year-over-year sales for all Company and Franchise Stores opened for at least one full fiscal year and are based on sales by both company-owned and domestic franchise-operated stores, as reported by franchisees, which are in the store base. System-wide comparable store sales do not include International Stores and JambaGO® locations.
Company-owned stores that were sold in refranchising transactions are included in the store base for each accounting period of the fiscal quarter in which the store was sold to the extent the sale is consummated at least three days prior to the end of such accounting period, but only for the days such stores have been company-owned. Thereafter, such stores are excluded from the store base until such stores have been franchise-operated for at least one full fiscal period at which point such stores are included in the store base and compared to sales in the comparable period of the prior year. Comparable store sales exclude closed locations.
Management reviews the increase or decrease in Company Store comparable store sales, Franchise Store comparable sales and system-wide comparable sales compared with the same period in the prior year to assess business trends and make certain business decisions. The Company believes that Franchise Store comparable sales and system-wide comparable sales data, non-GAAP financial measures, are useful in assessing the overall performance of the Jamba brand and, ultimately, the performance of the Company.
44
The following table sets forth operating data that do not otherwise appear in our consolidated financial statements as of and for the 52 week period ended December 29, 2015 and the 52 week period ended December 30, 2014:
| 52 Week Period Ended | 52 Week Period Ended | |||||||
| December 29, 2015 | December 30, 2014 | |||||||
| Percentage change in Company Store comparable sales (1) | 1.5 | % | 2.8 | % | ||||
| Percentage change in Franchise Store comparable sales(2) | 2.7 | % | 2.7 | % | ||||
| Percentage change in system-wide comparable sales(2) | 2.3 | % | 2.7 | % | ||||
| Total Company Stores | 70 | 263 | ||||||
| Total Franchise Stores | 748 | 543 | ||||||
| Total International Stores | 75 | 62 | ||||||
| (1) | Percentage change in Company Store comparable sales compares the sales of Company Stores during the current fiscal year to the sales from the same Company Stores for the prior fiscal year. A Company Store is included in this calculation after its first full fiscal year of operations. Sales from Franchise and International Stores are not included in the Company Store comparable sales. |
| (2) | Percentage change in system-wide comparable sales compares the combined sales of Company and Franchise Stores, excluding Jamba Juice Express™, during the current fiscal year to the combined sales from the same Company and Franchise Stores for the prior fiscal year. A Company or Franchise Store is included in this calculation after its first full fiscal period of operations. System-wide comparable store sales do not include International Stores, Jamba Juice Express™ and JambaGO® locations. |
45
The following table sets forth certain data relating to Company Stores and Franchise Stores for the periods indicated:
| 52 week period ended December 29, 2015 | 52 week period ended December 30, 2014 | |||||||||||||||
| Domestic | International | Domestic | International | |||||||||||||
| Company Stores: | ||||||||||||||||
| Beginning of period | 263 | - | 268 | - | ||||||||||||
| Company Stores opened | - | - | - | - | ||||||||||||
| Company Stores acquired from franchisees | 2 | - | 26 | - | ||||||||||||
| Company Stores closed | (16 | ) | - | (13 | ) | - | ||||||||||
| Company Stores sold to franchisees | (179 | ) | - | (18 | ) | - | ||||||||||
| Total Company Stores | 70 | - | 263 | - | ||||||||||||
| 52 week period ended December 29, 2015 | 52 week period ended December 30, 2014 | |||||||||||||||
| Domestic | International | Domestic | International | |||||||||||||
| Franchise and International Stores: | ||||||||||||||||
| Beginning of period | 543 | 62 | 535 | 48 | ||||||||||||
| Stores opened | 51 | 22 | 43 | 24 | ||||||||||||
| Stores purchased by Company | (2 | ) | - | (26 | ) | - | ||||||||||
| Stores closed | (23 | ) | (9 | ) | (27 | ) | (10 | ) | ||||||||
| Stores purchased from Company | 179 | - | 18 | - | ||||||||||||
| Total Franchise Stores | 748 | 75 | 543 | 62 | ||||||||||||
Refranchising Strategy
Under our accelerated refranchising initiative, announced in November 2014, we completed the sale of 179 Company Stores during the year ended December 29, 2015 as part of our transition to an asset-light business model. We believe our accelerated refranchising initiative is a key driver to accelerate unit growth, reduce general and administrative costs, and to achieve certain operational efficiencies. At the close of fiscal 2015, no stores are classified as assets held for sale on the consolidated balance sheets (see Note 4 to our consolidated financial statements).
As part of the refranchising transactions, where feasible, we entered into development agreements which will commit the buyers to build additional Franchise Stores in territories occupied by the purchased stores. In addition, the buyers of mature Company Stores are generally obligated to refresh and refurbish these stores within certain timeframes.
46
LIQUIDITY AND CAPITAL RESOURCES
Cash Flows Summary
The following table summarizes our cash flows for each of the past three full fiscal years (in thousands):
| December 29, 2015 | December 30, 2014 | December 31, 2013 | ||||||||||
| Net cash (used in) provided by operating activities | $ | (14,531 | ) | $ | 3,543 | $ | 10,470 | |||||
| Net cash provided by (used in) investing activities | 42,344 | (9,417 | ) | (10,234 | ) | |||||||
| Net cash (used in) provided by financing activities | (25,833 | ) | (8,762 | ) | 664 | |||||||
| Net increase (decrease) in cash and cash equivalents | $ | 1,980 | $ | (14,636 | ) | $ | 900 | |||||
Liquidity
As of December 29, 2015, we had cash and cash equivalents of $19.7 million compared to $17.8 million in cash and cash equivalents as of December 30, 2014. As of December 29, 2015 and December 30, 2014, we had no short term or long term debt. Our primary sources of liquidity are cash flows provided by operating activities. In addition, we have a revolving line of credit with Wells Fargo Bank, National Association for $10.0 million, which we may utilize as described below. In the future, we may enter equipment leasing arrangements and incur additional indebtedness as necessary and as permitted under our credit agreement. We cannot assure, however, that such financing will be available on favorable terms or at all.
The $2.0 million increase in cash and cash equivalents in fiscal 2015 was primarily attributable to cash proceeds from the sale of 179 store locations related to our refranchise initiative offset by the repurchase of 1,948,004 shares of common stock, changes in the working capital components of the balance sheet due to the sale of 179 stores, and a greater amount of redemptions of jambacards during the year. We expect that our cash on hand and future cash flows provided by operating activities will be sufficient to fund our working capital and general corporate needs and the non-discretionary capital expenditures for the foreseeable future. Our accelerated refranchising initiative which was completed in December 2015 included the sale of 179 company stores in the California market. The total proceeds from the refranchising initiative was $53.1 million, which included $2.0 million from a note receivable. For fiscal 2016, our primary liquidity and capital requirements will be for working capital, repurchase of common stock, general corporate needs and planned capital expenditures. The use of cash to fund discretionary capital expenditures will be based on the need to conserve our capital.
On February 14, 2012, the Company entered into a Credit Agreement with Wells Fargo Bank, National Association (the “Lender”), which, as amended on November 1, 2012, July 22, 2013, November 4, 2013 and December 29, 2015 (as amended, the “Credit Agreement”), makes available to the Company a revolving line of credit in the amount of $10.0 million. The outstanding balance under the amended credit facility bears interest at a LIBOR Market Index Rate based upon the rate for one month U.S. dollar deposits, plus 2.50% per annum. Under the terms of the Credit Agreement, the Company is required to either maintain minimum cash or consolidated EBITDA levels and maintain minimum levels of tangible net worth and a minimum fixed charge coverage ratio. The Credit Agreement terminates July 22, 2016 or may be terminated earlier by the Company or by the Lender. This credit facility is subject to customary affirmative and negative covenants for credit facilities of this type, including limitations on the Company with respect to liens, indebtedness, guaranties, investments, distributions, mergers and acquisitions and dispositions of assets. The credit facility is evidenced by a revolving note made by the Company in favor of the Lender, is guaranteed by the Company and is secured by substantially all of its assets including the assets of its subsidiaries and a pledge of stock of its subsidiaries. In addition, the Credit Agreement replaced restricted cash requirements established in prior periods, as the line of credit also collateralizes the Company’s outstanding letters of credit of $0.7 million as of December 29, 2015.
During fiscal 2015, there were no borrowings under the Credit Agreement. To acquire the credit facility, the Company incurred upfront fees, which are being amortized over the term of the Credit Agreement. As of December 29, 2015 and December 30, 2014, the unamortized commitment fee amount was not material and is recorded in prepaid expenses and other current assets on the consolidated balance sheet. As of December 29, 2015, the Company was not in compliance with the financial covenants to the Credit Agreement.
The adequacy of our available funds will depend on many factors, including the macroeconomic environment, the operating performance of our Company Stores, the successful expansion of our franchise and licensing programs and the successful rollout and consumer acceptance of our new beverage and food initiatives. Given these factors, our foremost priorities for the near term continue to be preserving and generating cash sufficient to fund our liquidity needs.
47
Operating Activities
Net cash used in operating activities was $14.5 million in fiscal 2015, compared to net cash provided by $3.5 million in fiscal 2014, reflecting a net increase in cash flows used in operating activities of $18.1 million. The increase in cash used in operating activities was primarily due to the net increase in net income (loss) ($13.1 million) adjusted for a net decrease in non-cash items (approximately $26.5 million) and a net increase of cash used in operating assets and liabilities (approximately $4.6 million). Net income (loss) after adjustments for noncash items decreased primarily due to a decrease in cash flows driven by a decline in Company Store revenue, pursuant to our refranchising initiative. Cash flows relating to operating assets and liabilities declined compared to prior year primarily due to our refranchising initiative and an increase in redemption of Jambacards. The Company expects that operating cash flow will be generated through a combination of company store profitability and franchise royalty fees, and a reduced cost structure.
Net cash provided by operating activities was $3.5 million in fiscal 2014, compared to $10.5 million in fiscal 2013, reflecting a net decrease in cash flows of $7.0 million. This decrease in cash provided by operating activities was primarily due to a net increase in net loss after adjustments for noncash items (approximately $6.7 million) driven by the net loss of $3.6 million in fiscal 2014, and a net increase of cash used in accounts receivable, accounts payable and other assets and liabilities (approximately $0.3 million). The increase in cash used was affected by the increase in accounts receivable for programs that were new or emerging in 2014, including sales of our ready-to-drink product, JambaGO®, and Groupon programs. Cash received after year end relating to balances due for these programs was approximately $3.4 million.
The amount of cash provided by our operating activities during any particular fiscal year is highly subject to variations in the seasons. The first and fourth quarters of the fiscal year encompasses the winter and holiday season when we traditionally generate our lowest revenue, and our second and third quarters of the fiscal year encompasses the warmer seasons where a significant portion of our revenue and cash flows are realized. For more information on seasonality, refer to the section below entitled “Seasonality and Quarterly Results.” We also expect to have increased expenditures during the first part of the fiscal year as we invest in product development and domestic expansion with the goal to have new products released and new stores open by mid-year to take advantage of the busier summer months.
Investing Activities
Net cash provided by investing activities was $42.3 million in fiscal 2015, compared to net cash used in investing activities of $9.4 million in fiscal 2014. The $51.8 million increase in net cash provided by investing activities during fiscal 2015 was primarily due to increase in proceeds from disposal of assets (approximately $44.6 million) resulting from our refranchising activities and a decrease in capital expenditure payments (approximately $7.2 million).
Net cash used in investing activities was $9.4 million in fiscal 2014, compared to $10.2 million in fiscal 2013. Net cash used in investing activities decreased $0.8 million in fiscal 2014, primarily due to proceeds from the sale of Company Stores new and existing franchise partners (approximately $0.8 million), partially offset by increased expenditures on property and equipment (approximately $0.1 million) for the acquisition of store locations in Chicago and for the refresh and remodel program.
Financing Activities
Net cash used in financing activities was $25.8 million in fiscal 2015, compared to $8.8 million in fiscal 2014. The $17.1 million increase in net cash used in financing activities was primarily due to increase in the repurchase of the shares of the Company's common stock (approximately $16.9 million) under the stock repurchase plan approved by our Board of Directors in 2014 while the proceeds from our stock issuance plans remained relatively flat.
Net cash used in financing activities was $8.8 million in fiscal 2014, compared to net cash provided by financing activities of $0.7 million in fiscal 2013. The $9.4 million increase in net cash used in financing activities was primarily due to the repurchase of the shares of the Company's common stock (approximately $12.0 million) under the stock repurchase plan approved by our Board of Directors in 2014, partially offset by an increase in receipts from our stock issuance plans, including from the exercise of stock options (approximately $0.9 million) and the proceeds from the sale of a noncontrolling interest in a subsidiary (approximately $0.8 million).
Contractual Obligations
The following table summarizes contractual obligations and borrowings as of December 29, 2015, and the timing and effect that such commitments are expected to have on our liquidity and capital requirements in future periods. We expect to fund these commitments primarily with operating cash flows generated in the normal course of business.
| Payments Due by Period (in $’000s) | ||||||||||||||||||||
| Total | Less Than 1 Year | 1 - 2 Years | 3 - 4 Years | 5 or More Years | ||||||||||||||||
| Operating lease obligations(1) | $ | 117,999 | $ | 27,839 | $ | 23,750 | $ | 33,090 | $ | 33,320 | ||||||||||
| Purchase obligations(2) | 31,737 | 19,251 | 1,358 | 2,782 | 8,346 | |||||||||||||||
| Total | $ | 149,736 | $ | 47,090 | $ | 25,108 | $ | 35,872 | $ | 41,666 | ||||||||||
48
| (1) | Our wholly owned subsidiary, Jamba Juice Company, is a party to each Company Store lease obligation. The operating lease obligations represent future minimum lease payments under non-cancelable operating leases and lease termination fees as of December 29, 2015. The minimum lease payments do not include common area maintenance (“CAM”) charges, insurance, contingent rent obligations or real estate taxes, which are also required contractual obligations under our operating leases. In the majority of our operating leases, CAM charges are not fixed and can fluctuate from year to year. Total CAM charges, insurance, contingent rent obligations, license, permits and real estate taxes related to Company Stores and the corporate support center for our fiscal year ended December 29, 2015 were $5.5 million. |
| (2) | We negotiate pricing and quality specifications for many of the products used in Company Stores and Franchise Stores. This allows for volume pricing and consistent quality of products that meet our standards. Although we negotiate and contract directly with manufacturers, co-packers or growers for our products, we purchase these products from third-party centralized distributors. These distributors source, warehouse and deliver specified products to both Company Stores and Franchise Stores. The Company has purchase obligations with certain suppliers for certain fruits and dairy for various terms typically ranging from one year to five years. The Company has one contract with a supplier for a 15 year term that ends in 2024. |
Off-Balance Sheet Arrangements
We have no off-balance sheet arrangements.
New Accounting Standards
See the Recent Accounting Pronouncements section in Note 1 of our Notes to Consolidated Financial Statements for a summary of new accounting standards.
SEASONALITY AND QUARTERLY RESULTS
Our business is subject to day-to-day volatility based on weather and varies by season. A significant portion of our revenue is realized during the second and third quarters of the fiscal year, which include the summer months. The fourth quarter of the fiscal year, which encompasses the winter months and the holiday season, has traditionally been our lowest revenue volume quarter. Although we have expanded the number of stores offering our bowls, hot oatmeal, hot beverages, sandwiches and Artisan Flatbread selections, our business will likely continue to be subject to seasonal patterns for the foreseeable future, given that the largest portion of our sales continues to be from the sale of smoothies during the warmer parts of the year. Because of the seasonality of the business, results for an individual quarter are not necessarily indicative of the results, which may be achieved for the full fiscal year.
INFLATION
We do not believe that inflation has had a material impact on our results of operations in recent years. However, we cannot predict what effect inflation may have on our operations in the future.
| ITEM 7A. | QUANTITATIVE AND QUALITATIVE DISCLOSURES ABOUT MARKET RISK |
Interest Rates
We do not enter into market risk sensitive instruments for trading purposes. We are exposed to financial market risks due primarily to changes in interest rates in our interest bearing accounts. We do not believe a change in interest rate will materially affect our financial position or results of operations. A one percent change of the interest rate would result in an annual change in the results of operations of $0.2 million.
Commodities Prices
We are exposed to the impact of commodity and utility price fluctuations related to unpredictable factors such as weather and various market conditions over which we do not have control. We purchase significant amounts of produce and dairy products to support the needs of our Company Stores. The price and availability of these commodities directly impacts the results of operations and can be expected to impact the future results of operations.
We purchase fruit based on short-term seasonal pricing agreements. These short-term agreements generally set the price of procured frozen fruit and 100% pure fruit concentrates for less than one year based on estimated annual requirements. We purchase fresh produce based on annual pricing agreements. In order to mitigate the effects of price changes in any one commodity on our cost structure, we contract with multiple suppliers both domestically and internationally. These agreements typically set the price for some or all of our estimated annual fruit and fresh produce requirements, protecting us from short-term volatility. Nevertheless, these agreements typically contain a force majeure clause, which, if utilized (such as hurricanes in 2004 that destroyed the Florida orange crop and more recently with the 2007 freeze that affected California citrus), may subject us to significant price increases.
Our pricing philosophy is not to attempt to change consumer prices with every move up or down of the commodity market, but to take a longer term view of managing margins and the value perception of our products in the eyes of our customers. Our objective is to maximize our revenue through increased customer traffic.
49
| ITEM 8. | FINANCIAL STATEMENTS AND SUPPLEMENTARY DATA |
INDEX TO CONSOLIDATED FINANCIAL STATEMENTS
50
Report of Independent Registered Public Accounting Firm
The Board of Directors and Stockholders
Jamba, Inc.:
We have audited the accompanying consolidated balance sheets of Jamba, Inc. and subsidiaries (the Company) as of December 29, 2015 and December 30, 2014, and the related consolidated statements of operations, stockholders’ equity, and cash flows for the fiscal years ended December 29, 2015, December 30, 2014 and December 31, 2013. In connection with our audits of the consolidated financial statements, we also have audited the related financial statement schedule. These consolidated financial statements and financial statement schedule are the responsibility of the Company’s management. Our responsibility is to express an opinion on these consolidated financial statements and financial statement schedule based on our audits.
We conducted our audits in accordance with the standards of the Public Company Accounting Oversight Board (United States). Those standards require that we plan and perform the audit to obtain reasonable assurance about whether the financial statements are free of material misstatement. An audit includes examining, on a test basis, evidence supporting the amounts and disclosures in the financial statements. An audit also includes assessing the accounting principles used and significant estimates made by management, as well as evaluating the overall financial statement presentation. We believe that our audits provide a reasonable basis for our opinion.
In our opinion, the consolidated financial statements referred to above present fairly, in all material respects, the financial position of Jamba, Inc. and subsidiaries as of December 29, 2015 and December 30, 2014, and the results of their operations and their cash flows for the fiscal years ended December 29, 2015, December 30, 2014 and December 31, 2013 in conformity with U.S. generally accepted accounting principles. Also in our opinion, the related financial statement schedule, when considered in relation to the basic consolidated financial statements taken as a whole, presents fairly, in all material respects, the information set forth therein.
We also have audited, in accordance with the standards of the Public Company Accounting Oversight Board (United States), Jamba, Inc.’s internal control over financial reporting as of December 29, 2015, based on criteria established in Internal Control – Integrated Framework (2013) issued by the Committee of Sponsoring Organizations of the Treadway Commission (COSO), and our report dated March 14, 2016 expressed an unqualified opinion on the effectiveness of the Company’s internal control over financial reporting.
/s/ KPMG LLP
San Francisco, California
March 14, 2016
F-1
CONSOLIDATED BALANCE SHEETS
| (Dollars in thousands, except share and per share amounts) | December 29, 2015 | December 30, 2014 | ||||||
| ASSETS | ||||||||
| Current assets: | ||||||||
| Cash and cash equivalents | $ | 19,730 | $ | 17,750 | ||||
| Receivables, net of allowances of $618 and $280 | 16,932 | 16,977 | ||||||
| Inventories | 818 | 2,300 | ||||||
| Prepaid and refundable taxes | 356 | 474 | ||||||
| Prepaid rent | 1,682 | 504 | ||||||
| Assets held for sale | - | 22,845 | ||||||
| Prepaid expenses and other current assets | 4,495 | 8,105 | ||||||
| Total current assets | 44,013 | 68,955 | ||||||
| Property, fixtures and equipment, net | 18,744 | 17,988 | ||||||
| Goodwill | 1,184 | 945 | ||||||
| Trademarks and other intangible assets, net | 1,464 | 2,360 | ||||||
| Notes receivable and other long-term assets | 4,211 | 2,241 | ||||||
| Total assets | $ | 69,616 | $ | 92,489 | ||||
| LIABILITIES AND STOCKHOLDERS’ EQUITY | ||||||||
| Current liabilities: | ||||||||
| Accounts payable | $ | 3,815 | $ | 3,926 | ||||
| Accrued compensation and benefits | 3,788 | 6,325 | ||||||
| Workers’ compensation and health insurance reserves | 633 | 1,311 | ||||||
| Accrued jambacard liability | 29,306 | 38,184 | ||||||
| Other current liabilities | 18,093 | 16,454 | ||||||
| Total current liabilities | 55,635 | 66,200 | ||||||
| Deferred rent and other long-term liabilities | 8,990 | 9,544 | ||||||
| Total liabilities | 64,625 | 75,744 | ||||||
| Commitments and contingencies (Notes 8 and 17) | ||||||||
| Stockholders’ equity: | ||||||||
| Common stock, $.001 par value, 30,000,000 shares authorized; 17,938,820 and 17,478,616 shares issued, respectively | 18 | 17 | ||||||
| Additional paid-in capital | 403,605 | 396,629 | ||||||
| Treasury shares, at cost, 1,948,004 and 910,813, respectively | (40,009 | ) | (11,991 | ) | ||||
| Accumulated deficit | (358,623 | ) | (368,041 | ) | ||||
| Total equity attributable to Jamba, Inc. | 4,991 | 16,614 | ||||||
| Noncontrolling interest | - | 131 | ||||||
| Total stockholders’ equity | 4,991 | 16,745 | ||||||
| Total liabilities and stockholders’ equity | $ | 69,616 | $ | 92,489 | ||||
See Notes to Consolidated Financial Statements.
F-2
CONSOLIDATED STATEMENTS OF OPERATIONS
| Fiscal Year Ended | ||||||||||||
| December 29, | December 30, | December 31, | ||||||||||
| (Dollars in thousands, except share and per share amounts) | 2015 | 2014 | 2013 | |||||||||
| Revenue: | ||||||||||||
| Company stores | $ | 137,025 | $ | 198,737 | $ | 212,887 | ||||||
| Franchise and other revenue | 24,651 | 19,311 | 16,362 | |||||||||
| Total revenue | 161,676 | 218,048 | 229,249 | |||||||||
| Costs and operating expenses (income): | ||||||||||||
| Cost of sales | 33,737 | 52,236 | 52,211 | |||||||||
| Labor | 44,732 | 61,749 | 62,015 | |||||||||
| Occupancy | 18,951 | 27,630 | 29,350 | |||||||||
| Store operating | 25,152 | 33,089 | 34,802 | |||||||||
| Depreciation and amortization | 6,569 | 10,084 | 10,974 | |||||||||
| General and administrative | 36,872 | 37,278 | 37,771 | |||||||||
| Gain on disposal of assets | (21,609 | ) | (2,957 | ) | (3,153 | ) | ||||||
| Store pre-opening | 1,031 | 763 | 880 | |||||||||
| Impairment of long-lived assets | 2,523 | 175 | 728 | |||||||||
| Store lease termination and closure | 1,669 | 575 | 148 | |||||||||
| Other operating, net | 1,795 | 726 | 1,155 | |||||||||
| Total costs, operating expenses, and gain | 151,422 | 221,348 | 226,881 | |||||||||
| Income (loss) from operations | 10,254 | (3,300 | ) | 2,368 | ||||||||
| Other income (expense): | ||||||||||||
| Interest income | 137 | 74 | 9 | |||||||||
| Interest expense | (220 | ) | (195 | ) | (242 | ) | ||||||
| Total other expense, net | (83 | ) | (121 | ) | (233 | ) | ||||||
| Income (loss) before income taxes | 10,171 | (3,421 | ) | 2,135 | ||||||||
| Income tax expense | (701 | ) | (168 | ) | (55 | ) | ||||||
| Net income (loss) | 9,470 | (3,589 | ) | 2,080 | ||||||||
| Redeemable preferred stock dividends and deemed dividends | - | - | (588 | ) | ||||||||
| Less: Net income attributable to noncontrolling interest | 52 | 43 | - | |||||||||
| Net income (loss) attributable to Jamba, Inc. | $ | 9,418 | $ | (3,632 | ) | $ | 1,492 | |||||
| Weighted-average shares used in the computation of earnings (loss) per share attributable to Jamba, Inc.: | ||||||||||||
| Basic | 15,787,806 | 17,197,904 | 16,793,235 | |||||||||
| Diluted | 16,228,033 | 17,197,904 | 17,222,030 | |||||||||
| Earnings (loss) per share attributable to Jamba, Inc. common stockholders: | ||||||||||||
| Basic | $ | 0.60 | $ | (0.21 | ) | $ | 0.09 | |||||
| Diluted | $ | 0.58 | $ | (0.21 | ) | $ | 0.09 | |||||
See Notes to Consolidated Financial Statements.
F-3
CONSOLIDATED STATEMENTS OF STOCKHOLDERS’ EQUITY
| Common Stock | Equity | Total | ||||||||||||||||||||||||||||||
| (In thousands, except share amounts) | Shares | Amount | Additional
Paid in Capital | Treasury Stock | Accumulated Deficit | Attributable
to Jamba, Inc. | Noncontrolling Interest | Stockholders’ Equity | ||||||||||||||||||||||||
| Balance as of January 2, 2013 | 15,481,782 | $ | 78 | $ | 380,007 | $ | - | $ | (366,489 | ) | $ | 13,596 | $ | - | $ | 13,596 | ||||||||||||||||
| Share-based compensation expense | - | - | 2,550 | - | - | 2,550 | - | 2,550 | ||||||||||||||||||||||||
| Issuance of common stock pursuant to stock plans | 215,505 | 1 | 827 | - | - | 828 | - | 828 | ||||||||||||||||||||||||
| Conversion of redeemable preferred stock | 1,457,780 | 7 | 8,375 | - | - | 8,382 | - | 8,382 | ||||||||||||||||||||||||
| Accretion of redeemable preferred stock | - | - | (466 | ) | - | - | (466 | ) | - | (466 | ) | |||||||||||||||||||||
| Redeemable preferred stock dividends | - | - | (122 | ) | - | - | (122 | ) | - | (122 | ) | |||||||||||||||||||||
| Repurchase of fractional shares due to reverse stock split | (412 | ) | (69 | ) | 63 | - | - | (6 | ) | - | (6 | ) | ||||||||||||||||||||
| Net income | - | - | - | - | 2,080 | 2,080 | - | 2,080 | ||||||||||||||||||||||||
| Balance as of December 31, 2013 | 17,154,655 | $ | 17 | $ | 391,234 | - | (364,409 | ) | 26,842 | - | 26,842 | |||||||||||||||||||||
| Share-based compensation expense | - | - | 3,069 | - | - | 3,069 | - | 3,069 | ||||||||||||||||||||||||
| Issuance of common stock pursuant to stock plans | 323,961 | - | 1,707 | - | - | 1,707 | - | 1,707 | ||||||||||||||||||||||||
| Gain on sale of noncontrolling interest | - | - | 662 | - | - | 662 | 88 | 750 | ||||||||||||||||||||||||
| Paid to noncontrolling interest | - | - | (42 | ) | - | - | (42 | ) | - | (42 | ) | |||||||||||||||||||||
| Due to noncontrolling interest | - | - | (1 | ) | - | - | (1 | ) | - | (1 | ) | |||||||||||||||||||||
| Treasury shares purchased, not retired | - | - | - | (11,991 | ) | - | (11,991 | ) | - | (11,991 | ) | |||||||||||||||||||||
| Net loss | - | - | - | - | (3,632 | ) | (3,632 | ) | 43 | (3,589 | ) | |||||||||||||||||||||
| Balance as of December 30, 2014 | 17,478,616 | $ | 17 | $ | 396,629 | (11,991 | ) | (368,041 | ) | 16,614 | 131 | 16,745 | ||||||||||||||||||||
| Share-based compensation expense | - | - | 5,162 | - | - | 5,162 | - | 5,162 | ||||||||||||||||||||||||
| Issuance of common stock pursuant to stock plans | 460,204 | 1 | 1,792 | - | - | 1,793 | - | 1,793 | ||||||||||||||||||||||||
| Excess tax benefit from exercise of stock options | - | - | 553 | - | - | 553 | - | 553 | ||||||||||||||||||||||||
| Realized gain on sale of noncontrolling interest | - | - | (662 | ) | - | - | (662 | ) | (183 | ) | (845 | ) | ||||||||||||||||||||
| Noncontrolling interest | - | - | 131 | - | - | 131 | - | 131 | ||||||||||||||||||||||||
| Treasury shares purchased, not retired | - | - | - | (28,018 | ) | - | (28,018 | ) | - | (28,018 | ) | |||||||||||||||||||||
| Net income | - | - | - | - | 9,418 | 9,418 | 52 | 9,470 | ||||||||||||||||||||||||
| Balance as of December 29, 2015 | 17,938,820 | $ | 18 | $ | 403,605 | $ | (40,009 | ) | $ | (358,623 | ) | $ | 4,991 | $ | - | $ | 4,991 | |||||||||||||||
See Notes to Consolidated Financial Statements.
F-4
CONSOLIDATED STATEMENTS OF CASH FLOWS
| Fiscal Year | ||||||||||||
| Ended | Ended | Ended | ||||||||||
| (Dollars in thousands) | December 29, 2015 | December 30, 2014 | December 31, 2013 | |||||||||
| Cash (used in) provided by operating activities: | ||||||||||||
| Net income (loss) attributable to common stockholders | $ | 9,470 | $ | (3,589 | ) | $ | 2,080 | |||||
| Adjustments to reconcile net income (loss) to net cash (used in) provided by operating activities: | ||||||||||||
| Depreciation and amortization | 6,569 | 10,084 | 10,974 | |||||||||
| Lease termination, store closure costs, impairment and gain on disposals | (26,555 | ) | (2,420 | ) | (2,580 | ) | ||||||
| Gain from sale of noncontrolling interest | (662 | ) | - | - | ||||||||
| Contingent consideration fair value measurement | (156 | ) | (397 | ) | (651 | ) | ||||||
| Jambacard breakage income | (5,440 | ) | (4,744 | ) | (3,177 | ) | ||||||
| Share-based compensation | 5,162 | 3,069 | 2,550 | |||||||||
| Bad debt, purchase obligation reserves and trade credits | 1,896 | 358 | 645 | |||||||||
| Deferred rent | (2,035 | ) | (397 | ) | (1,186 | ) | ||||||
| Equity loss from joint ventures | 229 | - | - | |||||||||
| Changes in operating assets and liabilities: | ||||||||||||
| Receivables | 1,222 | (2,853 | ) | (2,998 | ) | |||||||
| Inventories | 1,129 | 387 | (157 | ) | ||||||||
| Prepaid and refundable taxes | 118 | 9 | 172 | |||||||||
| Prepaid rent | (1,178 | ) | (197 | ) | 2,773 | |||||||
| Prepaid expenses and other current assets | 1,456 | (2,406 | ) | (2,842 | ) | |||||||
| Other long-term assets | (1,201 | ) | (1,617 | ) | 243 | |||||||
| Restricted cash from operating activities | - | - | 205 | |||||||||
| Accounts payable | (1,274 | ) | (2,145 | ) | (2,809 | ) | ||||||
| Accrued compensation and benefits | (2,537 | ) | (58 | ) | (2,028 | ) | ||||||
| Workers’ compensation and health insurance reserves | (678 | ) | 265 | (41 | ) | |||||||
| Accrued jambacard liability | (3,438 | ) | 5,807 | 6,664 | ||||||||
| Other current liabilities | 1,669 | 3,319 | 2,387 | |||||||||
| Other long-term liabilities | 1,624 | 1,068 | 246 | |||||||||
| Cash (used in) provided by operating activities | $ | (14,610 | ) | $ | 3,543 | $ | 10,470 | |||||
| Cash provided by (used in) investing activities: | ||||||||||||
| Capital expenditures | (7,052 | ) | (14,280 | ) | (14,711 | ) | ||||||
| Acquisitions, net of cash acquired | (735 | ) | (694 | ) | - | |||||||
| Purchase of investment | - | - | (300 | ) | ||||||||
| Proceeds from the sale of stores | 50,131 | 5,557 | 4,777 | |||||||||
| Cash provided by (used in) investing activities | $ | 42,344 | $ | (9,417 | ) | $ | (10,234 | ) | ||||
| Cash (used in) provided by financing activities: | ||||||||||||
| Proceeds pursuant to stock plans | 1,793 | 1,707 | 822 | |||||||||
| Excess tax benefit from exercise of stock options | 553 | - | - | |||||||||
| Proceeds from sale of noncontrolling interest | - | 750 | - | |||||||||
| Payments to noncontrolling interest | (52 | ) | (42 | ) | - | |||||||
| Payments for treasury shares | (28,018 | ) | (11,146 | ) | - | |||||||
| Payments on capital lease obligations | (30 | ) | (31 | ) | - | |||||||
| Redeemable preferred stock dividends paid | - | - | (158 | ) | ||||||||
| Cash (used in) provided by financing activities | $ | (25,754 | ) | $ | (8,762 | ) | $ | 664 | ||||
| Net increase (decrease) in cash and cash equivalents | $ | 1,980 | $ | (14,636 | ) | $ | 900 | |||||
| Cash and cash equivalents at beginning of period | 17,750 | 32,386 | 31,486 | |||||||||
| Cash and cash equivalents at end of period | $ | 19,730 | $ | 17,750 | $ | 32,386 | ||||||
| Supplemental cash flow information: | ||||||||||||
| Cash paid for interest | $ | 31 | $ | 30 | $ | 51 | ||||||
| Income taxes paid | 65 | 178 | 187 | |||||||||
| Noncash investing and financing activities: | ||||||||||||
| Noncash property, fixtures and equipment additions | 1,171 | 1,192 | 311 | |||||||||
| Note taken for store disposal | 2,000 | - | - | |||||||||
| Noncash purchase of shares of Jamba, Inc. | - | 845 | - | |||||||||
| Accretion of redeemable preferred stock | - | - | 466 | |||||||||
| Accrued redeemable preferred stock dividends | - | - | - | |||||||||
| Conversion of redeemable preferred stock | - | - | 8,382 | |||||||||
See Notes to Consolidated Financial Statements.
F-5
NOTES TO CONSOLIDATED FINANCIAL STATEMENTS
FOR THE FISCAL YEARS ENDED DECEMBER 29, 2015, DECEMBER 30, 2014 AND
DECEMBER 31, 2013
1. BUSINESS AND SUMMARY OF SIGNIFICANT ACCOUNTING POLICIES
Business - Jamba, Inc. consummated its initial public offering in July 2005. On March 10, 2006, Jamba, Inc. entered into an Agreement and Plan of Merger with Jamba Juice Company (the “Merger Agreement”). On November 29, 2006 (the “Merger Date”), Jamba, Inc. consummated the merger with Jamba Juice Company (the “Merger”) whereby Jamba Juice Company became its wholly owned subsidiary, which first began operations in 1990.
Jamba, Inc. through its wholly-owned subsidiary, Jamba Juice Company, is a healthy, active lifestyle brand with a robust expanding global business driven by a portfolio of franchised and company-owned Jamba Juice® stores and licensed JambaGO® and Jamba Juice Express™ formats. The Jamba® brand includes innovative product platforms and both licensed and company driven consumer packaged goods. The Company is a leading restaurant retailer of “better-for-you” specialty food and beverage offerings which include great tasting, whole fruit smoothies, fresh squeezed juices and juice blends, Energy Bowls TM, and a variety of food items including, hot oatmeal, breakfast wraps, Artisan Flatbreads TM, baked goods, and snacks. Jamba Juice Company continues to expand the Jamba brand by direct selling of consumer packaged goods (“CPG”) products, and by licensing its trademarks for CPG products sold through retail channels such as grocery stores, warehouse clubs, and convenience stores. The Company’s headquarters are located in Emeryville, California.
During the third quarter of 2015, Jamba Juice changed the name of their Smoothie Station offering to Jamba Juice Express TM. All references throughout the document have been changed to reflect this name change.
As of December 29, 2015, there were 893 Jamba Juice stores globally, consisting of 70 Company-owned and operated stores (“Company Stores”), 748 franchisee-owned and operated stores (“Franchise Stores”) in the United States, and 75 Franchise Stores in international locations (International Stores). The JambaGO® business consists of over 2,000 licensed units located across the United States. JambaGO® units are typically installed in K-12 schools, colleges, universities, Target Cafes, as well as other captive venues.
Basis of Presentation - The consolidated financial statements include the accounts of the Company and its direct subsidiary, Jamba Juice Company. The accounts of Jamba Juice Southern California, LLC (“JJSC”) are consolidated through April 28, 2015, when the Company sold its 88% interest in JJSC to the holder of JJSC’s noncontrolling interest. All significant intercompany balances and transactions have been eliminated in consolidation. The equity method of accounting is used to account for Jamba Juice Company’s investments in its joint ventures because the Company exercises significant influence over the operations and financial policies of the joint ventures. Accordingly, the carrying value of the investment is reported in other long-term assets, and the Company’s equity in the net income and losses of its joint ventures is reported in other operating, net.
Fiscal Year End – The Company’s fiscal year ends on the Tuesday closest to December 31. The Company’s most recently completed fiscal year, referred to as fiscal 2015, started on December 31, 2014 and ended on December 29, 2015, and had 52 weeks. The Company’s fiscal 2014, started on January 1, 2014, and ended on December 30, 2014, and had 52 weeks, and fiscal 2013 started on January 2, 2013 and ended on December 31, 2013 and had 52 weeks.
Significant Estimates - The preparation of financial statements in conformity with accounting principles generally accepted in the United States of America requires management to make estimates and assumptions that affect the reported amounts of assets, liabilities, revenue and expenses and disclosure of contingent assets and liabilities at the date of the financial statements. Actual results could differ from those estimates, and such differences could affect the results of operations reported in future periods.
Reverse Stock Split - Effective May 31, 2013, the Company filed a Certificate of Amendment to its Amended and Restated Certificate of Incorporation, as amended, and consummated a five-for-one reverse stock split (“Reverse Stock Split”) of its issued and outstanding common stock, $0.001 par value per share. The Reverse Stock Split and the Certificate of Amendment were approved by the Company’s stockholders at the Company’s Annual Meeting of Stockholders held on May 14, 2013 for stockholders of record as of the close of business on March 20, 2013.
F-6
On the effective date of the Reverse Stock Split, every five shares of the Company's issued and outstanding common stock were combined into one issued and outstanding share of the Company's common stock, without any change in the par value per share. No fractional shares were issued as a result of the Reverse Stock Split. Stockholders who otherwise were entitled to receive a fractional share in connection with the Reverse Stock Split instead were eligible to receive a cash payment, which was not material in the aggregate, instead of shares. All share and per share information in the accompanying financial statements have been restated retroactively to reflect the stock split.
Reclassifications - Certain prior year amounts have been reclassified to conform to current year presentation in the consolidated financial statements.
Concentrations of Risk - From fiscal 2012 through October 2014, the Company maintained food distribution contracts primarily with one distributor. In October 2014, the Company began working exclusively with Gordon Food Services (“GFS”) in the Eastern United States and Systems Services of America (“SSA”) in the Western United States to distribute food sold in the majority of Company and Franchise Stores. In fiscal 2015, two distributors accounted for approximately 98% of the supplies delivered to Company and Franchise Stores. The Company's limited distributor relationships could have an adverse effect on the Company’s operations.
Financial instruments that potentially subject the Company to concentrations of credit risk consist primarily of cash and cash equivalents. The Company places its cash and cash equivalents with high-quality financial institutions. Balances in the Company’s cash accounts frequently exceed the Federal Deposit Insurance Corporation insurance limit. The Company has not experienced any losses related to these balances and believes the credit risk to be minimal.
Cash and Cash Equivalents - The Company considers all highly liquid instruments with maturities of three months or less when purchased to be cash equivalents.
Receivables - Receivables primarily represent amounts due from royalty fees, advertising fees, construction allowances, amounts receivable from suppliers, distributors and CPG customers, sale of jambacards by other issuers and franchisees, and rent receivable from franchisees. The allowance for doubtful accounts is the Company’s estimate of the amount of probable credit losses in the Company’s existing accounts receivable.
Inventories - Inventories are stated at the lower of cost or market. Cost is determined using the first-in, first-out method (FIFO). Inventories consist of food, beverages and available-for-sale promotional products. The Company reduces inventory for obsolete and slow-moving inventory and for estimated shrinkage between physical inventory counts.
Property, Fixtures and Equipment - Property, fixtures and equipment are recorded at cost. Expenditures for major additions and improvements are capitalized and minor replacements, maintenance and repairs are charged to expense as incurred. Depreciation is computed using the straight-line method over the estimated useful life. The estimated useful life for leasehold improvements is the lesser of 10 years or the term of the underlying lease. The estimated useful life for furniture, fixtures and equipment is three to 10 years.
Business Combinations - The Company accounts for business combinations using the acquisition method. Under the acquisition method, the purchase price of the acquisition is allocated to the underlying tangible and intangible assets acquired based on their respective fair values. Fair values are derived from various observable and unobservable inputs and assumptions. The Company utilizes third-party valuation specialists to assist in the allocation. Initial purchase price allocations are preliminary and are subject to revision within the measurement period, not to exceed one year from the date of acquisition. The costs of the business acquisitions are expensed as incurred. These costs may include fees for accounting, legal, professional consulting and valuation specialists.
F-7
Assets Held For Sale - The Company classifies assets as held for sale and suspends depreciation and amortization when approval at the appropriate level has been provided, the assets can be immediately removed from operations, an active program has begun to locate a buyer, the assets are being actively marketed for sale at or near their current fair value, significant changes to the plan of sale are not likely and the sale is probable within one year. Upon classification as held for sale, long-lived assets are no longer depreciated, and an assessment of impairment is performed to identify and expense any excess of carrying value over fair value less costs to sell. Subsequent changes to the estimated fair value less costs to sell will impact the measurement of assets held for sale. To the extent fair value increases, any impairment previously taken is reversed. If the carrying value of the assets held for sale exceeds the fair value less costs to sell, the Company will record a loss for the amount of the excess. The Company also reclassifies the associated prior year balances for stores reclassified to assets held for sale.
If the Company decides not to sell previously classified assets held for sale, the asset is reclassified back to their original asset group. The assets are recorded at the lower of the carrying value before being classified as held for sale adjusted for depreciation that would have been recognized during the time they were classified as held for sale or fair value at the date the Company decided not to sell.
Gain on Disposal of Assets – A gain or loss on disposal of assets is recognized when the sales transaction of the store closes and control has transferred to the franchisee. The Company calculates the gain or loss by comparing the carrying value of the store assets to the selling price.
Impairment of long-lived assets - The Company evaluates long-lived assets for impairment when facts and circumstances indicate that the carrying values of long-lived assets may not be recoverable. The impairment evaluation is generally performed at the individual store asset group level. The Company first compares the carrying value of the asset to the asset’s estimated future undiscounted cash flows. If the estimated future cash flows are less than the carrying value of the asset, the Company measures an impairment loss based on the asset’s estimated fair value. The fair value of a store’s assets is estimated using a discounted cash flow model based on internal projections and taking into consideration the view of a market participant. The estimate of cash flows is based on, among other things, certain assumptions about expected future operating performance. Factors considered during the impairment evaluation include factors related to actual operating cash flows, the period of time since a store has been opened or remodeled, refranchising expectations and the maturity of the relevant market. The Company recorded impairment charges of $2.5 million, $0.2 million, and $0.7 million for fiscal 2015, fiscal 2014 and fiscal 2013, respectively.
Goodwill, Trademarks and Other Intangible Asset Impairment - Goodwill is evaluated for impairment on an annual basis during the Company’s fourth fiscal quarter, or more frequently if circumstances, such as material deterioration in performance, indicate carrying values may exceed their fair values. The goodwill impairment analysis is a two-step process. First, the reporting unit’s estimated fair value is compared to its carrying value, including goodwill. If the Company determines that the estimated fair value of the reporting unit is less than its carrying value, it moves to the second step to determine the implied fair value of the reporting unit’s goodwill. If the carrying amount of the reporting unit’s goodwill exceeds its implied fair value, an impairment loss is recognized. In September 2011, the FASB issued new guidance allowing an entity the option to make a qualitative evaluation about the likelihood of goodwill impairment to determine whether it should calculate the fair value of a reporting unit. If impairment is deemed more likely than not, management would perform the currently prescribed two-step goodwill impairment test. Otherwise, the two-step goodwill impairment test is not required. The Company applies the qualitative approach when appropriate. When reviewing goodwill for impairment, the Company assesses whether goodwill should be allocated to operating levels lower than its single operating segment for which discrete financial information is available and reviewed for decision-making purposes. These lower levels are referred to as reporting units. Currently, the Company’s one operating segment was determined to be one reporting unit. No goodwill impairment was recorded for fiscal 2015, fiscal 2014, and fiscal 2013.
Intangible assets not subject to amortization (primarily trademarks) are evaluated for impairment on an annual basis during the fourth fiscal quarter, or more frequently if events or changes in circumstances indicate that the asset might be impaired. The Company qualitatively assesses the impairment for other intangible assets not subject to amortization to determine whether it is more likely than not that the fair value of intangible assets are less than their carrying amount.
For other intangible assets not subject to amortization not assessed qualitatively, a quantitative approach is utilized. The Company compares the carrying value of the applicable asset to its fair value, which the Company estimates using a discounted cash flow analysis or by comparing with the market values of similar assets. If the carrying amount of the asset exceeds its estimated fair value, the Company determines the impairment loss, if any, as the excess of the carrying value of the intangible asset over its fair value. An impairment loss is generally recognized when the carrying amount of the trademarks exceeds the fair value. For fiscal 2015 and 2014, the company had no other intangible assets not subject to amortization.
F-8
Intangible assets subject to amortization (primarily franchise agreements, reacquired franchise rights, favorable lease intangible assets and acquired customer relationships) are tested for impairment if changes in circumstances indicate that their carrying amounts may not be recoverable. The Company first compares the carrying value of the asset to the asset’s estimated future undiscounted cash flows. If the estimated future cash flows are less than the carrying value of the asset, the Company measures an impairment loss based on the asset’s estimated fair value. Intangible assets are amortized over their estimated useful lives using a method of amortization that reflects the pattern in which the economic benefits of the intangible assets are consumed or otherwise realized. The useful life for the franchise agreements is approximately 13.4 years. The useful life of reacquired franchise rights represents the remaining term of the franchise agreement. The useful life of the favorable lease portfolio intangible is based on the related lease term.
Jambacards® - The Company, through its subsidiary, Jamba Juice Company, sells jambacards to its customers in its retail stores, through its website and through resellers. The Company’s jambacards do not have an expiration date. An obligation is recorded at the time of either an initial load or a subsequent reload in accrued jambacard liability on the Company’s consolidated balance sheets. The Company recognizes income from jambacards when (i) the jambacard is redeemed by the customer or (ii) the likelihood of the jambacard being redeemed by the customer is remote (also referred to as “breakage”) and the Company determines that it does not have a legal obligation to remit the unredeemed jambacards to the relevant jurisdictions. The Company determines the jambacard breakage amount based upon its historical redemption patterns. Jambacard breakage income is included in other operating, net in the Consolidated Statements of Operations.
Self-Insurance Reserves -The Company is self-insured for healthcare benefits. The estimated accruals for these liabilities are based on statistical analyses of historical industry data as well as actual historical trends. For its workers’ compensation benefits, starting October 1, 2015 the Company has a guaranteed cost policy. However, the Company was self-insured for existing and prior years’ exposures through September 30, 2008. In addition, from September 30, 2008 until September 30, 2015, the Company had a retrospective policy. For these two policies, liabilities associated with the risks that the Company retains for workers compensation benefits are estimated in part, by considering historical claims experience, demographic factors, severity factors, and other actuarial assumptions. The Company’s estimates use this actuarial data in conjunction with known industry trends and Company experience.
Rent Expense - Under the provisions of certain of the Company’s leases, there are rent holidays and/or escalations in payments over the base lease term, as well as renewal periods. The effects of rent holidays and escalations are reflected in rent costs on a straight-line basis over the expected lease term, which includes cancelable option periods when it is deemed to be reasonably assured that the Company will exercise such option periods due to the fact that the Company would incur an economic penalty for not doing so. The lease term commences on the date when the Company becomes legally obligated for the rent payments which generally coincides with the time when the landlord delivers the property for the Company to develop. All rent costs recognized during construction periods are classified as pre-opening expenses.
The Company has assigned certain of its store leases to franchisees as part of refranchising transactions, and in some cases for amounts less than the Company’s rent obligation. Liabilities for those rent concessions are recorded and relieved against rent expense over the remaining term of the related lease.
Construction Allowances - The Company receives construction allowances from certain landlords, which are deferred and amortized on a straight-line basis over the lease term as a reduction of rent expense. Construction allowances are recorded in deferred rent and other long-term liabilities.
Revenue Recognition - Revenue from Company Stores is recognized when product is sold. Revenue is presented net of any taxes collected from customers and remitted to government entities. In February 2014, the Company initiated a loyalty program for its customers, which allows them to earn points based on the volume of their purchases. Under the loyalty program, a customer receives a discount on future purchases when a defined number of points have been earned. The estimated amount of points redeemable in exchange for discounts is recorded in deferred revenue and recognized when the customers redeem the points they earned. At December 29, 2015 and December 30, 2014, the amount in deferred revenue for unredeemed points under the loyalty program was $0.2 million and $0.7 million, respectively.
F-9
Revenue from jambacards is recognized upon redemption in exchange for product. Until redemption, outstanding customer balances are recorded as a liability. See “jambacards” section above for discussion on recognition of jambacard breakage.
The Company generally executes franchise agreements for each store that establishes the terms of its arrangement with the franchisee. The franchise agreements typically require the franchisee to pay an initial, non-refundable fee and continuing fees based upon a percentage of sales. Subject to the Company’s approval and the franchisee’s payment of a renewal fee, a franchisee may generally renew the franchise agreement upon its expiration.
Franchise revenue is generated from royalties, development fees, initial franchise fees and revenue from sales at franchise-operated Jamba Juice Express™ and JambaGO® units. Royalties from Franchise Stores are determined as a percentage of Franchise Store revenue and are recognized in the same period as the related Franchise Store sales occur. If collection of the franchise royalty fee is doubtful, revenue is recognized at the time of collection.
Development fees are paid to the Company as part of an agreement to open and operate a specific number of stores in a specified territory. The amount of the fee is based on the number of stores to be opened pursuant to the development agreement and secures the territory for exclusivity during the development. The nonrefundable fees collected for these services are recognized as the franchise stores under these agreements open. The Company’s multi-unit development agreements specify the number of stores to be opened.
The Company charges an initial franchise fee for providing operational materials, new store opening, planning, and functional training courses. Initial franchise fees, if any, are due for payment at the time the franchise agreement for a particular store is executed. Franchise fees are recognized as revenue when all material services or conditions have been substantially performed or satisfied and no other material conditions or obligations related to the determination of substantial performance exist. Duties and services that are completed prior to approval include training, facilities inspection, receipt of operating license(s), and clearance from appropriate agencies. These duties and services are substantially complete prior to the approval of the opening of a store. Revenue is recognized when the store opens.
Revenue from sales at the Company’s flexible format franchise locations are recognized when the products are delivered to the operators of the Jamba Juice Express™ or JambaGO® units.
Other revenue primarily consists of revenue from sales of CPG products sold to retail outlets and online and royalties from licensed CPG products. Revenue from sale of CPG products is recognized when the products are delivered to the customer. License revenue from CPG products is based on a percentage of product sales and is recognized as revenue upon the sale of the product to retail outlets.
Cost of Sales - The Company includes in cost of sales, costs incurred to acquire fruit, dairy and other products used to make smoothies and juices, other food offerings, and paper products sold by the Company Stores.
Store Lease Termination and Closure Costs - Costs incurred when closing a store are generally expensed as incurred. At the date the Company ceases use of a store under an operating lease, a liability is recorded for the net present value of any remaining lease obligations, net of estimated sublease income, if any. In instances where a buyout is reasonably expected within six months of store closure, liabilities are recorded by estimating the expected buyout fee and the rent expected to be incurred until a buyout agreement is reached. Any costs recorded upon store closure as well as any subsequent adjustments to liabilities for remaining lease obligations as a result of lease termination or changes in estimates of sublease income are recorded in other operating, net on the Consolidated Statements of Operations. Considerable management judgment is necessary to estimate future cash flows, including cash flows from continuing use, terminal value and sublease income. Accordingly, actual results could vary from the Company’s estimates.
Advertising Fund - The Company participates with its franchisees in an advertising fund, established in fiscal 2010, to collect and administer funds contributed for use in advertising and promotional programs, which are designed to increase sales and enhance the reputation of the Company and its franchise owners. Contributions to the advertising fund are required for Company Stores and traditional Franchise Stores and are generally based on a percent of store sales. The Company has control of the advertising fund. The fund is consolidated and all assets and liabilities of the fund are reported.
The advertising fund assets, consisting primarily of cash received from the Company and franchisees and accounts receivable from franchisees, can only be used for selected purposes and are considered restricted. The cash contributed by franchisees is recorded as a liability against which specified advertising costs are charged. The Company does not reflect franchisee contributions to the fund as revenue in its consolidated statements of operations or consolidated statements of cash flows.
F-10
Advertising fund assets as of December 29, 2015 and December 30, 2014 include $2.4 million and $1.2 million of receivables from franchisees, respectively, which is recorded in receivables on the consolidated balance sheet. Advertising fund liabilities as of December 29, 2015 and December 30, 2014, of $1.2 million and $1.0 million, respectively, are reported in other current liabilities and accounts payable on the Consolidated Balance Sheets.
Advertising Costs - Advertising costs are expensed as incurred and were $8.5 million, $10.0 million and $10.4 million in fiscal 2015, fiscal 2014 and fiscal 2013, respectively, and are included in store operating expenses. Advertising contributions received from franchisees, totaled $7.5 million, $5.8 million and $4.8 million for fiscal 2015, fiscal 2014, and fiscal 2013, respectively, and were recorded as an offset to advertising expense.
Store Pre-opening Costs - Costs incurred in connection with start-up and promotion of new store openings as well as rent from possession date to store opening date are expensed as incurred.
Comprehensive Income - Comprehensive income is defined as the change in equity during a period from transactions and other events, excluding changes resulting from investments from owners and distributions to owners. The Company currently has no components of comprehensive income other than net income, therefore no separate statement of comprehensive income is presented.
Income Taxes - Deferred tax assets and liabilities are recognized for the future tax consequences attributable to differences between the financial statement carrying amounts of existing assets and liabilities and their respective tax basis. Deferred tax assets and liabilities are measured using enacted income tax rates expected to apply to taxable income in the years in which those temporary differences are expected to be recovered or settled. Any effect on deferred tax assets and liabilities due to a change in tax rates is recognized in income in the period that includes the enactment date. In establishing deferred income tax assets and liabilities, judgments and interpretations are made based on enacted tax laws and published tax guidance applicable to the Company’s operations. The Company records deferred tax assets and liabilities and evaluates the need for valuation allowances to reduce deferred tax assets to amounts more likely than not of being realized. Changes in the valuation of the deferred tax assets or changes in the income tax provision may affect the Company’s annual effective income tax rate.
Uncertain tax positions are recognized as the greatest amount more than 50% likely of being sustained upon audit based on the technical merits of the position. On a quarterly basis, the Company reviews and updates its inventory of tax positions as necessary to add any new uncertain tax positions taken, or to remove previously identified uncertain positions that have been effectively settled. Additionally, uncertain positions may be re-measured as warranted by changes in facts or law. Accounting for uncertain tax positions requires significant judgments, including estimating the amount, timing and likelihood of ultimate settlement. Although the Company believes that these estimates are reasonable, actual results could differ from these estimates. The Company classifies interest and penalties related to income taxes as a component of income taxes in the consolidated statements of operations.
A liability related to an unrecognized tax benefit is offset against a deferred tax asset for a net operating loss carryforward, a similar tax loss or a tax credit carryforward if such settlement is required or expected in the event the uncertain tax position is disallowed. In situations in which a net operating loss carryforward, a similar tax loss or a tax credit carryforward is not available at the reporting date under the tax law of a jurisdiction or the tax law of a jurisdiction does not require it, and the Company does not intend to use the deferred tax asset for such purpose, the unrecognized tax benefit is presented in the financial statement as a liability and is not combined with deferred tax assets.
Earnings (Loss) Per Share – Basic earnings (loss) per share is computed based on the weighted-average number of common shares outstanding during the period. Diluted earnings (loss) per share is computed based on the weighted-average number of common shares and potentially dilutive securities, which includes preferred stock outstanding, outstanding warrants and outstanding options and restricted stock awards granted under the Company’s stock option plans.
F-11
For purposes of determining the net income available (loss attributable) to common stockholders used in the computation of earnings (loss) per share, the amount of the income (loss) was increased (decreased) by the preferred stock dividends and deemed dividends and net income (loss) attributable to noncontrolling interest. The deemed dividend represents the accretion of the issuance costs and beneficial conversion feature of the Company’s preferred stock.
All outstanding shares of preferred stock were converted to shares of common stock as of June 14, 2013. For fiscal 2013, the impact of the assumed conversion of preferred stock, calculated using the ‘as-if converted’ method, is anti-dilutive and the incremental shares from assumed exercise of restricted stock awards, warrants and stock options were dilutive. The number of incremental shares from the assumed exercise of restricted stock awards, warrants and options was calculated by applying the treasury stock method. Shares and per share data have been adjusted for all periods presented to reflect the Reverse Stock Split effective May 31, 2013.
During fiscal 2015 and fiscal 2014, the Company repurchased 1,948,004 and 910,813 shares of common stock, respectively, which reduced the basic weighted average shares outstanding. For fiscal 2014, the Company’s basic weighted average shares outstanding were equal to its diluted weighted average shares outstanding, since the Company experienced a net loss.
Anti-dilutive common stock equivalents of 1.9 million, 1.5 million, and 2.0 million have been excluded from diluted weighted-average shares outstanding in fiscal 2015, fiscal 2014, and fiscal 2013, respectively.
Share-based compensation - The Company measures and recognizes all share-based compensation under the fair value method.
Stock options for a fixed number of shares are granted to certain employees and directors with an exercise price based on the grant date fair value of the Company’s common stock. Stock options generally vest over a four-year period. Share-based compensation expense is recognized ratably over the service period.
The fair value of restricted stock units granted is determined based on the Company’s closing stock price on the date of grant. For employees, these restricted stock units typically vest and become unrestricted over the three year period following the date of grant. For non-employee directors, these restricted stock units typically vest and become unrestricted one year after the date of grant. Share-based compensation expense is recognized ratably over the vesting periods for restricted stock units.
The fair value of performance stock units (PSUs) granted is determined based on fair value at the date of grant, and is based on the total shareholder return of the Company's common stock relative to a defined group of peer companies over a three-year performance period. The Company records compensation expense on PSUs with criteria based on market performance by recognizing grant date fair value over the vesting period.
Fair Value of Financial Instruments - The following instruments are not measured at fair value on the Company’s consolidated balance sheets but require disclosure of their fair values: cash and cash equivalents, accounts receivables, notes receivable and accounts payable. The estimated fair value of such instruments, excluding notes receivable, approximates their carrying value as reported on the consolidated balance sheets due to the short-term nature. The estimated fair value of notes receivable approximates its carrying value due to the interest rates aligning with market rates. The fair value of such financial instruments is determined using the income approach based on the present value of estimated future cash flows. The fair value of these instruments would be categorized as Level 2 in the fair value hierarchy, with the exception of cash and cash equivalents, which would be categorized as Level 1.
Segment Reporting - The Company has one reportable retail segment.
F-12
Recent Accounting Pronouncements
In May 2014, the Financial Accounting Standards Board (the “FASB”) issued amended guidance on revenue from contracts with customers which amended the existing accounting standards for revenue recognition. Accounting Standards Update (“ASU”) 2014-09 establishes principles for recognizing revenue upon the transfer of promised goods or services to customers, in an amount that reflects the expected consideration received in exchange for those goods or services. In July 2015, the FASB deferred the effective date to fiscal years beginning after December 15, 2017 (including interim reporting periods within those periods). Early adoption is permitted to the original effective date of the fiscal year beginning after December 15, 2016 (including interim reporting periods within those periods). The amendment guidance may be applied retrospectively to each prior period presented with the option to apply practical expedients or retrospectively with the cumulative effect recognized as of the date of initial application. The Company is evaluating the impact and transition method of adopting this new accounting standard on the Consolidated Financial Statements.
In June 2014, the FASB issued amended guidance, ASU 2014-12, on accounting for share-based payments when the terms of an award provide that a performance target could be achieved after the requisite service period. This guidance requires that a performance target that affects vesting and that could be achieved after the requisite service period be treated as a performance condition of the award. A reporting entity should apply existing guidance in ASC Topic 718, Compensation-Stock Compensation, as it relates to such awards. The guidance will be effective for the Company beginning fiscal year 2016 and may be applied either prospectively or retrospectively. The Company is currently evaluating the impact that the standard will have on the Consolidated Financial Statements.
In January 2015, the FASB issued amended guidance, ASU 2015-01, which eliminates the concept of extraordinary items from generally accepted accounting principles. This amendment will be effective for the Company beginning fiscal year 2016 and may be applied retrospectively or prospectively. Early adoption is permitted. Prior to this amendment, an entity was required to separately classify and present an event or transaction that was determined to be both unusual in nature and infrequent in occurrence as an extraordinary item, net of tax, after income from continuing operations in the income statement. Upon adopting this amended guidance, a material event or transaction that an entity considers to be unusual or infrequent, or both, may still be presented separately but will now be presented on a pre-tax basis within income from continuing operations or disclosed in the notes to the financial statements. The Company does not expect this guidance to have a significant impact on the Consolidated Financial Statements.
In February 2015, the FASB issued amended guidance, ASU 2015-02, on the consolidation standard which updates the analysis that a reporting entity must perform to determine whether it should consolidate certain types of legal entities. The amendment modifies the evaluation of whether limited partnerships and similar legal entities are variable interest entities (“VIEs”) or voting interest entities and affects the consolidation analysis of reporting entities that are involved with VIEs, particularly those that have fee arrangements and related party relationships, among other provisions. This amended guidance will be effective for the Company beginning fiscal year 2016. Early adoption is permitted. The Company does not expect this guidance to have a significant impact on the Consolidated Financial Statements.
In April 2015, the FASB issued amended guidance, ASU 2015-03, which requires debt issuance costs to be presented as a direct deduction from the carrying value of the associated debt liability rather than as separate assets on the balance sheet. The recognition and measurement guidance for debt issuance costs are not affected by this amendment. This amended guidance will be effective for the Company beginning fiscal year 2016. Early adoption is permitted, and the new guidance will be applied on a retrospective basis. The Company does not expect the adoption of this amended guidance to have a significant impact on the Consolidated Financial Statements.
In July 2015, the FASB issued guidance which simplifies the measurement of inventory. ASU 2015-11 applies to inventory that is measured using first-in, first-out (“FIFO”) or average cost method and requires measurement of that inventory at the lower of cost or net realizable value. Net realizable value is defined as the estimated selling prices in the ordinary course of business, less reasonably predictable costs of completion, disposal and transportation. This guidance will be effective for the Company beginning fiscal year 2017. Early adoption is permitted. The Company does not expect the adoption of this guidance to have a significant impact on the Consolidated Financial Statements.
In September 2015, the FASB issued ASU 2015-16, Simplifying the Accounting for Measurement-Period Adjustments (ASU 2015-16). The amended guidance requires that an acquirer recognize adjustments to provisional amounts that are identified during the measurement period in the reporting period in which the adjustment amounts are determined. The amendments are effective prospectively for the fiscal years, and the interim reporting periods within those years, beginning on or after December 15, 2015 and early adoption is permitted. The Company has not elected to early adopt ASU 2015-16. The Company does not expect the adoption of this guidance to have a significant impact on the Consolidated Financial Statements.
In November 2015, the FASB issued ASU 2015-17, Income Taxes (Topic 740): Balance Sheet Classification of Deferred Taxes. This ASU requires all deferred tax assets and liabilities to be classified as non-current in the statement of financial position. The provisions of ASU 2015-17 are effective for annual periods beginning after December 15, 2016, including interim periods within that reporting period. The Company has elected, as permitted by the standard, to early adopt ASU 2015-17 as of December 29, 2015. The adoption did not have a material effect on the Consolidated Financial Statements.
In January 2016, the FASB issued ASU 2016-01, Financial Instruments - Overall (Subtopic 825-10): Recognition and Measurement of Financial Assets and Financial Liabilities (ASU 2016-01). ASU 2016-01 addresses certain aspects of recognition, measurement, presentation, and disclosure of financial instruments. ASU 2016-01 will be effective for the Company beginning fiscal year 2018. The Company is currently evaluating the impact that the standard will have on the Consolidated Financial Statements.
In February 2016, the FASB issued authoritative accounting guidance, ASU 2016-02, that will require an entity to recognize assets and liabilities arising from a lease. Consistent with current GAAP, the recognition, measurement, and presentation of expenses and cash flows arising from a lease will depend primarily on its classification as a finance or operating lease. The guidance also requires additional disclosures to enable users of financial statements to understand the amount, timing, and uncertainty of cash flows arising from leases. The guidance will be effective for the Company beginning fiscal year 2019, and includes an option for entities to early adopt. The guidance requires a retrospective cumulative adjustment to retained earnings in the period of initial adoption. The Company is currently assessing the impacts of this guidance on the Consolidated Financial Statements.
F-13
2. REFRANCHISING
In November 2014, the Company announced an accelerated refranchising initiative that included the sale of up to 114 Company Stores in the California market. The Company significantly exceeded the initial goal with 179 stores refranchised in fiscal 2015 as part of the transition to an asset-light business model.
During fiscal 2015, the Company refranchised 179 opened stores and one unopened store (of which 176 were previously classified as assets held for sale) for total proceeds of $53.1 million which included cash of $51.1 million and notes receivable of $2.0 million. As a result of these refranchising transactions during fiscal 2015, the Company recorded a total gain of $21.6 million on the disposal of assets. Notes receivable related to the refranchising of $2.0 million are outstanding as of December 29, 2015 and are included in other long-term assets in the accompanying Consolidated Financial Statements.
3. ASSETS HELD FOR SALE
In November 2014, the Company announced plans to transition to an asset-light model through the refranchising of Company Stores. In connection with that planned transition, 99 Company Stores and one unopened store, met the criteria as assets held for sale as of December 30, 2014. During fiscal 2015, an additional 125 stores met the criteria to be classified as assets held for sale increasing the total to 224 stores of which 179 stores were refranchised.
During the first quarter of fiscal 2015, a loss of $1.1 million was recorded as a result of the reclassification of stores to assets held for sale. This adjustment reflected the lower of net book value or fair value for a certain group of stores. During the third and fourth quarter of fiscal 2015, an impairment loss of $1.9 million was recorded to reflect the most current fair value of a certain group of stores that was included in assets held for sale. During the fourth quarter of fiscal 2015, the Company made the decision to retain 48 store locations that were previously classified as assets held for sale. As a result of this decision, the fair value of the 48 stores was reclassified out of assets held for sale back to their original asset group and related depreciation expense of $0.9 million was recorded.
As of December 29, 2015 and December 30, 2014, assets held for sale of $0 and $22.8 million, respectively, include goodwill and other intangibles of $0 and $0.2 million, respectively, in the accompanying Consolidated Balance Sheets.
4. PROPERTY, FIXTURES, AND EQUIPMENT
Property, fixtures, and equipment consisted of the following as of (in thousands):
| December 29, 2015 | December 30, 2014 | |||||||
| Leasehold improvements | $ | 19,586 | $ | 18,909 | ||||
| Furniture, fixtures, and equipment | 32,200 | 31,719 | ||||||
| Construction in progress (primarily stores under construction) | 3,773 | 428 | ||||||
| Total | 55,559 | 51,056 | ||||||
| Less accumulated depreciation and amortization | (36,815 | ) | (33,068 | ) | ||||
| Total | $ | 18,744 | $ | 17,988 | ||||
Depreciation expense related to property, fixtures, and equipment for fiscal 2015, fiscal 2014, and fiscal 2013 was $6.5 million, $10.0 million, and $10.9 million, respectively.
F-14
5. GOODWILL, TRADEMARKS AND OTHER INTANGIBLE ASSETS
A summary of the changes in goodwill for fiscal 2014 and 2015 follows (in thousands):
| Amount | ||||
| Balance as of December 31, 2013 | $ | 1,038 | ||
| Disposals and reclassification to assets held for sale | (93 | ) | ||
| Balance as of December 30, 2014 | 945 | |||
| Additions | 232 | |||
| Reclassification out of assets held for sale | 7 | |||
| Balance as of December 29, 2015 | $ | 1,184 | ||
The carrying amount and accumulated amortization of trademarks and other intangible assets as of December 29, 2015 and December 30, 2014 were as follows (in thousands):
| Gross Amount | Accumulated Amortization | Net Amount | ||||||||||
| Intangible Assets | ||||||||||||
| As of December 29, 2015 | ||||||||||||
| Favorable leases | $ | 1,850 | $ | (1,850 | ) | $ | - | |||||
| Trademarks | 807 | - | 807 | |||||||||
| Franchise agreements and customer lists | 735 | (496 | ) | 239 | ||||||||
| Reacquired franchise rights | 599 | (181 | ) | 418 | ||||||||
| Total | $ | 3,991 | $ | (2,527 | ) | $ | 1,464 | |||||
| Gross Amount | Accumulated Amortization | Net Amount | ||||||||||
| As of December 30, 2014 | ||||||||||||
| Favorable leases | $ | 2,440 | $ | (1,860 | ) | $ | 580 | |||||
| Trademarks | 929 | - | 929 | |||||||||
| Franchise agreements and customer lists | 943 | (561 | ) | 382 | ||||||||
| Reacquired franchise rights | 651 | (182 | ) | 469 | ||||||||
| Total | $ | 4,963 | $ | (2,603 | ) | $ | 2,360 | |||||
Intangible assets, other than trademarks, are amortized over their expected useful lives, ranging from two to seven years. Amortization expense for intangible assets was $0.1 million for fiscal 2015, fiscal 2014, and fiscal 2013. The remaining intangible assets, subject to amortization of $0.7 million will continue to be amortized over their estimated useful lives. Expected annual amortization expense for the remaining intangible assets recorded as of December 29, 2015 is as follows (in thousands):
| Fiscal Year | Amortization Expense | |||
| 2016 | $ | 118 | ||
| 2017 | 118 | |||
| 2018 | 117 | |||
| 2019 | 101 | |||
| 2020 | 67 | |||
| Thereafter | 136 | |||
Trademarks are not subject to amortization and the Company evaluates for impairment on an annual basis during the fourth quarter or more frequently if events or changes in circumstances indicate that the asset might be impaired. There was no impairment charge for trademarks in fiscal 2015 and fiscal 2014. The Company had trademarks of approximately $0.8 million as of December 29, 2015 and approximately $0.9 million as of December 30, 2014.
F-15
6. ACQUISITIONS
2015 Acquisition
In December 2015, the Company acquired two domestic stores in California from a former franchisee. The purchase was accounted for using the acquisition method of accounting. Under the acquisition method, the purchase price is allocated to the underlying tangible and intangible assets acquired based on their respective fair values. A summary of the purchase price, the fair value of the net assets acquired and the goodwill on the purchase follows (in thousands):
| Cash paid to acquire stores | $ | 737 | ||
| Additional consideration resulting from termination of pre-existing relationships | 85 | |||
| Total purchase consideration | $ | 822 | ||
| Net assets acquired: | ||||
| Current assets | $ | 12 | ||
| Fixed assets | 259 | |||
| Re-acquired franchise rights | 424 | |||
| Unfavorable lease | (105 | ) | ||
| Net assets acquired | $ | 590 | ||
| Goodwill | $ | 232 |
There was a gain on termination of pre-existing relationships that was recorded in gain on disposal of assets on the Consolidated Statement of Operations, and resulted in an increase in the purchase price consideration and an increase in goodwill. The pro-forma effect of the acquisition on the Company’s results of operations was not significant.
The fair value of the fixed assets acquired is classified as level 2 and is based on inputs other than quoted prices in active markets included in level 1, which are either directly or indirectly observable, to estimate replacement value. The fair value of re-acquired franchise rights is classified as level 3, and is based on significant unobservable inputs and assumptions such as management’s estimate of operating profit and assumed discount rates. Significant changes in the inputs or assumptions would increase or decrease the fair value measurements that would impact the depreciation or amortization of fixed assets and reacquired franchise rights and future impairment, if any.
The fixed assets acquired include leasehold improvements which have an estimated useful life of the lesser of 10 years or the remaining term of the underlying lease. The estimated useful life for furniture, fixtures, and equipment acquired is three to 10 years.
2014 Acquisition
In September 2014, the Company acquired 26 domestic stores, of which three were immediately closed, in the Midwest from a former franchise partner pursuant to a Settlement and General Release Agreement. The purchase was accounted for using the acquisition method of accounting. Under the acquisition method, the purchase price is allocated to the underlying tangible and intangible assets acquired based on their respective fair values. A summary of the purchase price, the fair value of the net assets acquired and the gain on the purchase follows (in thousands):
| Cash paid to acquire stores | $ | 725 | ||
| Additional consideration resulting from termination of pre-existing relationships | 369 | |||
| Total purchase consideration | $ | 1,094 | ||
| Net assets acquired: | ||||
| Current assets | $ | 145 | ||
| Fixed assets | 365 | |||
| Re-acquired franchise rights | 476 | |||
| Other assets and liabilities | 343 | |||
| Net assets acquired | $ | 1,329 | ||
| Bargain purchase gain | $ | 235 |
The bargain purchase price and resulting gain was the result of a reacquisition of stores from a franchisor due to their failure to comply with the franchise agreement. The gain is recorded in the Consolidated Statement of Operations. In addition, there was a gain on termination of pre-existing relationships that was recorded in the Consolidated Statement of Operations, and resulted in an increase in the purchase price consideration and a decrease in the bargain purchase gain. The pro-forma effect of the acquisition on the Company’s results of operations was not significant.
The fair value of the fixed assets acquired is classified as level 3 and is based on unobservable inputs including projected future operating results at the store level and assumed discount rates are applied to calculate the present value of the assets. The fair value of re-acquired franchise rights is classified as level 3, and it is based on significant unobservable inputs and assumptions such as management’s estimate of operating profit and assumed discount rates. Significant changes in the inputs or assumptions would increase or decrease the fair value measurements for future impairment of the fixed assets and reacquired franchise rights.
The fixed assets acquired include leasehold improvements which have an estimated useful life of the lesser of 10 years or the remaining term of the underlying lease. The estimated useful life for furniture, fixtures, and equipment acquired is three to 10 years.
The Company began actively marketing the 26 acquired stores in February 2015, which resulted in the determination that the criteria for classification of assets held for sale were met. As a result, the 22 store locations were reclassified to assets held for sale during the first quarter of 2015. As of December 29, 2015, these stores were reclassified out of assets held for sale resulting from management’s decision to retain or close certain of the stores.
F-16
7. FAIR VALUE MEASUREMENT
Financial Assets and Liabilities
Fair value is an exit price, representing the amount that would be received to sell an asset or paid to transfer a liability in an orderly transaction between market participants. As such, fair value is a market-based measurement that should be determined based on assumptions that market participants would use in pricing an asset or a liability. A three-tier fair value hierarchy is established as a basis for considering such assumptions and for inputs used in the valuation methodologies in measuring fair value:
Level 1: Quoted prices are available in active markets for identical assets or liabilities.
Level 2: Inputs are other than quoted prices in active markets included in Level 1, which are either directly or indirectly observable.
Level 3: Unobservable inputs that are supported by little or no market activity, therefore requiring an entity to develop its own assumptions that market participants would use in pricing.
The fair value of the financial liability accounted for on a recurring basis as of December 29, 2015 and December 30, 2014, relating to contingent consideration associated with a previous business acquisition, was recorded at $0 and $0.2 million, respectively. The fair value as of December 30, 2014 was included in deferred rent and other long-term liabilities in the Consolidated Balance Sheets. In the fiscal year 2015, the Company recorded a gain of $0.2 million included in gain on contingent consideration within other operating, net due to a change in circumstances under which the remaining contingent consideration was no longer deemed probable of payment.
Level 3 Inputs
The fair value of the contingent consideration was classified as level 3 because it is based on unobservable inputs. Significant inputs and assumptions include management’s estimate of operating profits from the acquired business, the timing of the payout and the discount rate used to calculate the present value of the liability. Significant changes in any level 3 input or assumption would result in increases or decreases to the related fair value measurements.
Non-financial Assets and Liabilities
There are no long-lived assets being carried at fair value as of December 29, 2015 and December 30, 2014. As a result of its quarterly impairment reviews, the Company recognized total losses of $0.6 million and $0.2 million for the years ended December 29, 2015 and December 20, 2014, respectively, included in impairment of long-lived assets within other operating, net. The losses for fiscal 2015 are due to $0.3 million impairment trademarks and $0.3 million impairment of fixed assets. The losses for fiscal 2014 are all due to impairment of fixed assets.
8. NOTES RECEIVABLE AND OTHER LONG-TERM ASSETS
As of December 29, 2015 and December 30, 2014, other long-term assets consisted of the following (in thousands):
| December 29, 2015 | December 30, 2014 | |||||||
| Notes receivable | $ | 3,107 | $ | 1,256 | ||||
| Deposits and other | 1,104 | 985 | ||||||
| Total | $ | 4,211 | $ | 2,241 | ||||
As of December 29, 2015 and December 30, 2014, notes receivable includes notes from franchisees totaling $3.1 million and $1.3 million, respectively. The note entered into during fiscal 2015 of $2.0 million has a maturity date of February 1, 2021 and the annual interest rate is 3% per annum. The note entered into during fiscal 2014 of $1.1 million has a maturity date of June 1, 2017 and the monthly adjustable interest rate is federal funds prime rate plus 1%.
9. DEVELOPMENT AGREEMENTS
The Company’s wholly owned subsidiary, Jamba Juice Company, has entered into multi-unit license agreements with area developers to develop stores in certain geographic regions. Under typical multi-unit license agreements, the area developer generally pays one-half of the initial nonrefundable fee multiplied by each store to be developed as a nonrefundable development fee upon execution of the multi-unit development agreement. This deposit is included in deferred revenue in the accompanying Consolidated Financial Statements. The agreements are generally for a term of five years. Each time a store is opened under the multi-unit license agreement, the Company credits the franchisee one-half of the initial fee paid as part of the development fee and the franchisee is required to pay the remaining one-half of the initial fee.
The following table summarizes data about the development agreements for Franchise and International Stores as of:
| December 29, 2015 | December 30, 2014 | |||||||
| Number of developers with Franchise Store contractual commitments | 32 | 30 | ||||||
| Number of Franchise Stores for which commitments exist | 163 | 188 | ||||||
| Number of developers with International Stores contractual commitments | 7 | 5 | ||||||
| Number of International Stores for which commitments exist | 485 | 388 | ||||||
Deferred franchise revenue is included in other current liabilities and other long-term liabilities on the Consolidated Balance Sheets. As of December 29, 2015 and December 30, 2014, deferred franchise revenue included $1.1 million and $1.2 million, respectively, relating to non-refundable development fees and initial fees paid by domestic franchisees whose stores have not yet opened. In addition, deferred franchise revenue as of December 29, 2015 and December 30, 2014 included $1.5 million and $1.3 million, respectively, relating to non-refundable international development fees.
F-17
10. DEFERRED RENT AND OTHER LONG-TERM LIABILITIES
Other long-term liabilities consisted of the following (in thousands):
| December 29, 2015 | December 30, 2014 | |||||||
| Deferred rent | $ | 2,961 | $ | 3,762 | ||||
| Deferred revenue | 3,720 | 3,380 | ||||||
| Construction allowance | 735 | 1,234 | ||||||
| Contingent consideration | - | 156 | ||||||
| Other liabilities | 1,574 | 1,012 | ||||||
| Total deferred rent and other long-term liabilities | $ | 8,990 | $ | 9,544 | ||||
11. LEASE COMMITMENTS
The Company leases its office, retail stores, and some equipment under operating leases, with terms expiring through 2025. Most store leases have an initial term of 10 years, with renewal options of up to 10 years and provide for payment of common area operating expenses and real estate taxes. When the Company refranchises Company Stores, usually the franchisees become sublessees and the Company continues to be obligated under the existing lease agreements for the remainder of the lease terms.
Rental expense, net of sublease income was $15.6 million, $22.3 million and $23.5 million in fiscal 2015, fiscal 2014 and fiscal 2013, respectively, and was recorded in occupancy and general and administrative expenses in the accompanying Statements of Operations. The Company recognized sublease income of $13.8 million, $9.2 million and $8.3 million in fiscal 2015, fiscal 2014 and fiscal 2013, respectively.
Contingent rent included in occupancy costs in the Statements of Operations was $0.5 million in fiscal 2015, fiscal 2014 and fiscal 2013.
The aggregate future minimum noncancelable lease payments and minimum rentals to be received from sublessees as of December 29, 2015, were as follows (in thousands):
| Fiscal Year Ending: | Minimum Lease Payments | Minimum Rentals to be Received | ||||||
| 2016 | $ | 27,839 | $ | (20,633 | ) | |||
| 2017 | 23,750 | (18,094 | ) | |||||
| 2018 | 18,464 | (14,046 | ) | |||||
| 2019 | 14,626 | (11,133 | ) | |||||
| 2020 | 10,580 | (7,827 | ) | |||||
| Thereafter | 22,740 | (15,673 | ) | |||||
| Total | $ | 117,999 | $ | (87,406 | ) | |||
12. CREDIT AGREEMENT
On February 14, 2012, the Company entered into a Credit Agreement with Wells Fargo Bank, National Association (the “Lender”), which, as amended on November 1, 2012, July 22, 2013, November 4, 2013 and December 29, 2015 (as amended, the “Credit Agreement”), makes available to the Company a revolving line of credit in the amount of $10.0 million. The outstanding balance under the amended credit facility bears interest at a LIBOR Market Index Rate based upon the rate for one month U.S. dollar deposits, plus 2.50% per annum. Under the terms of the Credit Agreement, the Company is required to either maintain minimum cash or consolidated EBITDA levels and minimum levels of tangible net worth and a minimum fixed charge coverage ratio. The Credit Agreement terminates July 22, 2016 or may be terminated earlier by the Company or by the Lender. This credit facility is subject to customary affirmative and negative covenants for credit facilities of this type, including limitations on the Company with respect to liens, indebtedness, guaranties, investments, distributions, mergers and acquisitions and dispositions of assets. The credit facility is evidenced by a revolving note made by the Company in favor of the Lender, is guaranteed by the Company and is secured by substantially all of its assets including the assets of its subsidiaries and a pledge of stock of its subsidiaries. In addition, the Credit Agreement replaced restricted cash requirements established in prior periods, as the line of credit also collateralizes the Company’s outstanding letters of credit of $0.7 million as of December 29, 2015.
During fiscal 2014, there were no borrowings under the Credit Agreement. To acquire the credit facility, the Company incurred upfront fees, which are being amortized over the term of the Credit Agreement. As of December 29, 2015 and December 30, 2014, the unamortized commitment fee amount was not material and is recorded in prepaid expenses and other current assets on the Consolidated Balance Sheets. As of December 29, 2015, the Company was not in compliance with the financial covenants to the Credit Agreement. As a result, the availability of our line of credit may not be accessible until an amendment to the agreement is completed.
F-18
13. SHARE-BASED COMPENSATION
Jamba, Inc. 2013 Equity Incentive Plan authorizes the Company to provide incentive compensation in the form of stock options, stock appreciation rights (SARs), restricted stock and stock units (“RSUs”), performance shares and units (“PSUs”), other stock-based awards, cash-based awards and deferred compensation awards. The 2013 Plan authorizes up to 3,145,122 shares (adjusted for the Reverse Stock Split).
As of December 29, 2015, under the Company’s 2013 Plan, there remained 564,686 shares available for grant, and under its 2006 Employee, Director and Consultant Stock Plan (the "2006 Plan"), 49,005 shares remained available for grant. All equity grants were issued from the 2013 Plan and it is currently the only equity plan from which future equity awards may be granted. Options granted under the 2013 Plan have an exercise price equal to the closing price of the Company’s common stock on the grant date, are generally exercisable for up to 10 years, and vest annually over a four-year period.
Stock Options - The fair value of options granted was estimated at the date of grant using a Black-Scholes option-pricing model. Option valuation models, including Black-Scholes, require the input of subjective assumptions. The Black-Scholes option-pricing model was developed for use in estimating fair value of traded options, which do not have vesting restrictions and are transferable. The Company’s employee stock options have different characteristics from those of traded options, and changes in the subjective assumptions used can materially affect the grant date fair value of a stock option award.
These assumptions include the risk-free interest rate, the expected life of the award, expected volatility and expected dividend yield. The risk-free interest rate is based on the zero coupon U.S. Treasury rates appropriate for the expected life of the award. For the expected life of the award, the Company utilized the median of the Company’s peer group’s expected life, after adjusting for vesting and term differences. Expected volatility is based on an average of the Company’s recent historic daily stock price observations of the Company’s common stock during the period immediately preceding the share-based award grant that is equal in length to the award’s expected term and the Company’s implied volatility based on the mean of 180-day call and put options as per the open market. Expected dividends are zero based on the history of not paying cash dividends on the Company’s common stock and its intention not to make dividend payments in the future. The Company makes assumptions for the number of awards that will ultimately not vest (“forfeitures”) in determining the share-based compensation expense for these awards. The Company uses historical data to estimate expected employee behaviors related to option exercises and forfeitures. Compensation expense is trued up for actual forfeitures if different than the estimate.
The fair value of stock options was estimated at the date of grant using a Black-Scholes option pricing model with the following weighted-average assumptions. For fiscal 2014, the table below reflects 5,000 options that had an accelerated vesting stock modification related to terminated executives. No other options were issued in fiscal 2014:
| Fiscal Year Ended | Fiscal Year Ended | Fiscal Year Ended | ||||||||||
| December 29, 2015 | December 30, 2014 | December 31, 2013 | ||||||||||
| Weighted-average risk-free interest rate | 1.75 | % | 0.12 | % | 1.31 | % | ||||||
| Expected life of options (years) | 5.85 | 0.80 | 6.25 | |||||||||
| Expected stock volatility | 43.7 | % | 60.8 | % | 63.8 | % | ||||||
| Expected dividend yield | 0 | % | 0 | % | 0 | % | ||||||
F-19
A summary of the stock option activities for fiscal years 2015 and 2014 is presented below (shares and dollars in thousands):
| Number of Options | Weighted-Average Exercise Price | Weighted-Average Contractual Term Remaining | Aggregate Intrinsic Value | |||||||||||||
| Options outstanding at December 31, 2013 | 1,126 | $ | 11.20 | 5.68 | $ | 5,255 | ||||||||||
| Options granted | 5 | 5.64 | ||||||||||||||
| Options exercised | (201 | ) | 5.11 | |||||||||||||
| Options canceled | (41 | ) | 19.28 | |||||||||||||
| Options outstanding at December 30, 2014 | 889 | $ | 10.89 | 4.74 | $ | 6,110 | ||||||||||
| Options granted | 1,010 | 13.92 | ||||||||||||||
| Options exercised | (235 | ) | 7.51 | |||||||||||||
| Options canceled | (134 | ) | 22.33 | |||||||||||||
| Options outstanding at December 29, 2015 | 1,530 | $ | 12.42 | 5.76 | $ | 3,960 | ||||||||||
| Options vested or expected to vest at December 29, 2015 | 1,334 | $ | 12.20 | 5.50 | $ | 3,951 | ||||||||||
| Options exercisable at December 29, 2015 | 590 | $ | 10.14 | 3.00 | $ | 3,884 | ||||||||||
The intrinsic value of stock options is defined as the difference between the current market value and the exercise price, which is equal to the market value at the time of the grant. Information regarding options outstanding and exercisable at December 29, 2015 is as follows (shares in thousands):
| Range of Exercise Prices | Number Outstanding | Weighted-Average Remaining Contractual Life (Years) | Weighted-Average Exercise Price | Number Exercisable | Weighted-Average Exercise Price | |||||||||||||||
| $3.00 - $3.00 | 238 | 2.07 | $ | 3.00 | 238 | $ | 3.00 | |||||||||||||
| $5.40 - $8.95 | 154 | 3.79 | 7.49 | 154 | 7.49 | |||||||||||||||
| $9.70 - $13.30 | 160 | 4.72 | 11.29 | 140 | 11.37 | |||||||||||||||
| $13.50 - $13.71 | 52 | 9.74 | 13.52 | - | - | |||||||||||||||
| $13.94 - $13.94 | 868 | 7.37 | 13.94 | - | - | |||||||||||||||
| $22.40 - $47.55 | 30 | 1.64 | 32.26 | 30 | 32.26 | |||||||||||||||
| $50.25 - $50.25 | 6 | 1.44 | 50.25 | 6 | 50.25 | |||||||||||||||
| $56.80 - $56.80 | 18 | 0.87 | 56.80 | 18 | 56.80 | |||||||||||||||
| $57.00 - $57.00 | 1 | 0.03 | 57.00 | 1 | 57.00 | |||||||||||||||
| $58.85 - $58.85 | 3 | 0.42 | 58.85 | 3 | 58.85 | |||||||||||||||
| 1,530 | 5.76 | $ | 12.42 | 590 | $ | 10.14 | ||||||||||||||
The weighted-average fair value of options granted was $13.92 in fiscal 2015, $5.64 in fiscal 2014 and $6.39 in fiscal 2013. At December 29, 2015, stock options vested or expected to vest over the next three years totaled 1.3 million. The remaining expense to amortize is approximately $2.7 million at December 29, 2015. The weighted-average remaining recognition period is approximately three years.
F-20
Restricted Stock - Information regarding activities during fiscal 2015 and fiscal 2014 for outstanding RSUs granted under the 2006 and 2013 Plans is as follows (shares in thousands):
| Number of Shares of RSUs | Weighted-Average Grant Date Fair Value (per share) | |||||||
| RSUs outstanding as of December 31, 2013 | 209 | $ | 11.39 | |||||
| RSUs granted | 270 | 13.21 | ||||||
| RSUs forfeited (canceled) | (36 | ) | 13.52 | |||||
| RSUs vested | (102 | ) | 13.50 | |||||
| RSUs outstanding as of December 30, 2014 | 341 | 12.50 | ||||||
| RSUs granted | 52 | 15.10 | ||||||
| RSUs forfeited (canceled) | (27 | ) | 13.84 | |||||
| RSUs vested | (176 | ) | 13.95 | |||||
| RSUs outstanding as of December 29, 2015 | 190 | $ | 14.09 | |||||
During fiscal 2015, fiscal 2014, and fiscal 2013, the Company granted 52,000, 270,000 and 190,000 RSUs to participants in its 2012 Management Incentive Plan at a weighted average grant date fair value of $15.10, $13.21 and $10.17, respectively, with a vesting period over three years. The aggregate grant date fair value of the RSUs granted during fiscal 2015, fiscal 2014 and fiscal 2013 was $0.8 million, $3.3 million, and $2.5 million, respectively. The aggregate intrinsic value of RSUs outstanding as of December 29, 2015, December 30, 2014 and December 31, 2013 was $2.6 million, $4.0 million, and $2.4 million, respectively.
Performance Stock Units - Information regarding activities during fiscal 2015 and fiscal 2014 for outstanding PSUs under the 2013 Plans is as follows (shares in thousands):
| Number of Shares of PSUs | Weighted-Average Grant Date Fair Value (per share) | |||||||
| PSUs outstanding as of December 31, 2013 | 107 | $ | 13.18 | |||||
| PSUs granted | 95 | 14.37 | ||||||
| PSUs forfeited (canceled) | (46 | ) | 14.16 | |||||
| PSUs vested | (18 | ) | 14.39 | |||||
| PSUs outstanding as of December 30, 2014 | 138 | 14.96 | ||||||
| PSUs granted | - | - | ||||||
| PSUs forfeited (canceled) | (34 | ) | 13.60 | |||||
| PSUs vested | (47 | ) | 13.65 | |||||
| PSUs outstanding as of December 29, 2015 | 57 | $ | 13.89 | |||||
F-21
PSUs granted under the 2013 Plans are RSUs with performance requirements based on external performance criteria and were granted to Plan participants at the levels of Vice President and above. The vesting schedule is based on the Company’s total shareholder return (“TSR”), relative to a defined group of peer companies over a three-year performance period. The Company records expenses related to these PSUs by recognizing the grant date fair value over the service period. Fair value was determined using a Monte Carlo Simulation Analysis, which incorporated the Company’s TSR relative to the defined peer group at the end of each of the three years of performance.
The aggregate grant date fair value of the PSUs granted during fiscal 2015, 2014 and 2013 was none, $1.2 million and $0.7 million, respectively. The aggregate intrinsic value of the PSUs outstanding as of December 29, 2015 and December 30, 2014 was $0.8 million and $1.9 million, respectively.
Share-based compensation expense was $5.2 million, $3.1 million, and $2.6 million for fiscal 2015, fiscal 2014 and fiscal 2013, respectively, and is included in general and administrative expenses in the Consolidated Statements of Operations. There was a tax benefit of $0.6 million recorded in fiscal 2015 and none in fiscal 2014 and fiscal 2013. At December 29, 2015, unrecognized share-based compensation for stock options and restricted stock awards, net of forfeitures, totaled $2.7 million. This expense will be recognized over the remaining weighted-average vesting period of approximately three years.
14. STOCK REPURCHASES
On October 29, 2014, the Company’s Board of Directors authorized the repurchase of up to $25.0 million of shares of common stock over a period of 18 months (the “Stock Repurchase Program”). The Company’s Board of Directors authorized an increase to the Stock Repurchase Program of $15 million to a total of $40.0 million in May 2015 and an additional $5.0 million to a total of $45.0 million in September 2015, with the authorizations expiring on May 4, 2016. During fiscal 2015 and fiscal 2014, the Company repurchased 1,948,004 and 910,813 shares, respectively, under the Stock Repurchase Program. The average price per share during fiscal 2015 and fiscal 2014 was $14.38 and $13.17, respectively, with an aggregate cost of $28.0 million and $12.0 million for fiscal 2015 and fiscal 2014, respectively, leaving $5.0 million available for share repurchases. Shares repurchased under the Stock Repurchase Program are considered treasury stock until retired. The following table presents information related to repurchases of shares of the Company's common stock from inception of the Stock Repurchase Program through the fourth quarter of 2015:
| Total Number of Shares Purchased | Average Price Paid per Share (1) | Total Number of Shares Purchased as Part of Publicly Announced Plans | Remaining
Maximum Amount Available to be Purchased Under the Plans (1) (in 000's) | |||||||||||||
| October 29, 2014 - December 30, 2014 | 910,813 | $ | 13.17 | 910,813 | $ | 13,009 | ||||||||||
| December 31, 2014 - March 31, 2015 | 445,414 | 15.00 | 445,414 | 6,326 | ||||||||||||
| April 1, 2015 - June 30, 2015 | 195,171 | 16.09 | 195,171 | 3,186 | ||||||||||||
| July 1, 2015 - September 29, 2015 | 1,174,882 | 13.87 | 1,174,882 | 6,887 | ||||||||||||
| September 30, 2015 - October 27, 2015 | 131,837 | 14.31 | 131,837 | 5,000 | ||||||||||||
| October 28, 2015 - November 24, 2015 | 700 | 12.94 | 700 | 4,991 | ||||||||||||
| November 25, 2015 - December 29, 2015 | - | - | - | $ | 4,991 | |||||||||||
| Total | 2,858,817 | $ | 13.99 | 2,858,817 | ||||||||||||
(1) The amounts exclude commission costs.
F-22
15. INCOME TAXES
The components of the income tax (expense) benefit are as follows (in thousands):
| December 29, 2015 | December 30, 2014 | December 31, 2013 | ||||||||||
| Current: | ||||||||||||
| Federal | $ | (438 | ) | $ | - | $ | 79 | |||||
| State | (149 | ) | (37 | ) | (27 | ) | ||||||
| Foreign | (114 | ) | (131 | ) | (107 | ) | ||||||
| $ | (701 | ) | $ | (168 | ) | $ | (55 | ) | ||||
| Deferred: | ||||||||||||
| Federal | $ | - | $ | - | $ | - | ||||||
| State | - | - | - | |||||||||
| Foreign | - | - | - | |||||||||
| $ | - | $ | - | $ | - | |||||||
| Income tax expense | $ | (701 | ) | $ | (168 | ) | $ | (55 | ) | |||
The difference between the effective income tax rate and the United States federal income tax rate is summarized as follows:
| December 29, 2015 | December 30, 2014 | December 31, 2013 | ||||||||||
| Statutory federal rate | 34.0 | % | (34.0 | )% | 34.0 | % | ||||||
| State income taxes less federal benefit | (9.2 | ) | (5.9 | ) | 6.1 | |||||||
| Foreign income taxes | 1.1 | 2.5 | 3.5 | |||||||||
| Change in valuation allowance | (38.1 | ) | 31.5 | (47.4 | ) | |||||||
| Meals | 0.3 | 1.2 | 0.8 | |||||||||
| Business Gain on Acquisition | - | (8.5 | ) | - | ||||||||
| Executive compensation exclusion | - | - | 1.9 | |||||||||
| Alternative minimum taxes | 0.1 | 1.0 | 0.8 | |||||||||
| Expired tax attribute carryforwards | 11.1 | 17.0 | 6.3 | |||||||||
| Tax credits generated | (0.1 | ) | (0.3 | ) | (0.1 | ) | ||||||
| Other | 7.7 | 0.3 | (3.3 | ) | ||||||||
| 6.9 | % | 4.8 | % | 2.6 | % | |||||||
Deferred income taxes are provided for the temporary differences between the carrying values of the Company’s assets and liabilities for financial reporting purposes and their corresponding income tax bases. The temporary differences give rise to either a deferred tax asset or liability in the financial statements that is computed by applying current statutory tax rates to taxable and deductible temporary differences. The deferred tax assets (liabilities) consisted of the following temporary differences as of December 29, 2015 and December 30, 2014 (in thousands):
F-23
| December 29, 2015 | December 30, 2014 | |||||||
| Net operating losses | $ | 50,837 | $ | 51,006 | ||||
| Reserves and accruals | 10,754 | 10,595 | ||||||
| Deferred rent | 1,518 | 1,654 | ||||||
| Tax credit attributes | 1,999 | 1,196 | ||||||
| Basis difference in intangibles | 1,510 | 3,982 | ||||||
| Share-based compensation | 2,979 | 2,541 | ||||||
| Basis difference in fixed assets | 3,245 | 8,513 | ||||||
| Basis difference in intangibles | (289 | ) | - | |||||
| Basis difference in investments | 4 | 3 | ||||||
| Reserves and accruals | (64 | ) | (6 | ) | ||||
| Total gross deferred tax asset | 72,493 | 79,484 | ||||||
| Valuation allowance | (72,493 | ) | (79,484 | ) | ||||
| Total net deferred tax asset | $ | - | $ | - | ||||
Realization of the future tax benefits is dependent on the Company’s ability to generate sufficient taxable income within the carryforward period. A valuation allowance is provided for deferred tax assets when it is “more likely than not” that some portion of the deferred tax asset will not be realized. Because of the Company’s recent history of operating losses, management believes the recognition of the deferred tax assets arising from the above-mentioned future tax benefits is currently not likely to be realized and, accordingly, has provided a valuation allowance. A valuation allowance has been recorded for the net deferred tax assets at December 29, 2015, which decreases the valuation allowance by $7.0 million for the fiscal year ended December 29, 2015.
At December 29, 2015, the Company has federal and state net operating loss carryovers (NOL) of $118.8 million and $113.6 million, respectively, which, if not used earlier, will expire between 2016 and 2034. In addition, the Company also has tax credit carryforwards for federal and state purposes of $1.1 million and $0.9 million, respectively. Of the federal tax credit carryforwards, approximately $0.3 million will start to expire in 2031 if unused before that year. The remaining federal tax credits and the state tax credits do not expire.
The Company underwent an “ownership change” as defined in section 382 of the Internal Revenue Code during the second quarter of the Company’s 2009 fiscal year, as a result of the Company’s issuance of Series B-1 Convertible Preferred Stock and Series B-2 Convertible Preferred Stock and other prior trading in the Company’s stock. The amount of NOL and tax credits from pre-change years that may be used to offset the Company’s taxable income for tax years ending after the ownership change will be subject to an annual limitation, known as a section 382 limitation. The section 382 limitation may cause NOL’s to expire unutilized. The Company reduced its NOL carryovers stated above for the anticipated expirations caused by the Company’s 2009 change. To the extent additional changes have occurred since 2009, additional limitations may apply.
As a result of certain realization requirements of Accounting Standards Codification Topic 718, the table of deferred tax assets and liabilities shown above does not include certain deferred tax assets as of December 29, 2015 and December 30, 2014 that arose directly from tax deductions related to equity compensation in excess of compensation recognized for financial reporting. The deferred tax assets include primarily net operating loss carryforwards. Equity will be increased by a gross amount of $1.2 million if and when such deferred tax assets are ultimately realized through a reduction to the Company’s income tax payable. The Company uses tax law ordering when determining when excess tax benefits have been realized.
Changes in the Company’s unrecognized tax benefits are as follows (in thousands):
| Fiscal Year Ended December 29, 2015 | Fiscal Year Ended December 30, 2014 | |||||||
| Beginning balance | $ | 185 | $ | 185 | ||||
| Increases attributable to tax positions taken during prior periods | - | - | ||||||
| Decreases resulting from lapse of applicable statutes of limitations | - | - | ||||||
| Ending balance | $ | 185 | $ | 185 | ||||
As of December 29, 2015, the entire unrecognized tax benefits reduce the deferred tax asset for the net operating loss carryforwards. If recognized, none of the unrecognized tax benefits would impact the Company’s effective tax rate. As of December 29, 2015, it is reasonably possible that the unrecognized tax benefits will not significantly increase or decrease in the next twelve months.
The Company is subject to taxation in the United States and various state and local jurisdictions. As of December 29, 2015, the Company is not subject to any income tax examinations. Due to tax attribute carryforwards, as of December 29, 2015, the Company remains effectively subject to U.S. federal, state and local income tax examinations by tax authorities for the tax years since 2006.
F-24
16. EMPLOYEE BENEFIT PLAN
The Company maintains a voluntary defined contribution plan covering all eligible employees. Eligible employees may elect to defer and contribute a percentage of their compensation to the plan, not to exceed the dollar amount set by law. During fiscal 2015, fiscal 2014 and fiscal 2013, the Company matched employees’ contributions on a discretionary basis, resulting in a contribution of $0.1 million each for fiscal years 2015, 2014, and 2013.
17. SEVERANCE AND OTHER COMPENSATION
On October 1, 2015, the Company announced the retirement of James D. White, the former Chief Executive Officer. In accordance with his employment agreement, severance and bonus of $0.8 million have been accrued for in fiscal 2015 as they are considered probable of payment and an obligation of the Company. Also during fiscal 2015, severance of $0.6 million was recorded for certain departures of two senior executives. Expenses relating to acceleration of options and awards from stock modifications related to the departure of the three executives of $0.8 million were also accounted for in fiscal 2015 and are included as part of stock compensation.
18. STORE LEASE TERMINATION AND CLOSURE COSTS
During the fourth quarter of 2015, in conjunction with its refranchising initiative, the Company performed a review of its portfolio of Company Stores, and as a result, closed eight underperforming Company Stores in the Chicago and New York City markets on December 29, 2015, which was prior to expiration of their contractual lease terms. The Company accrued exit costs of $1.6 million, including $1.3 million related to the estimated fair value of the lease termination obligation, $0.2 million of asset write-off, and $0.1 million related to severance.
The Company estimated the fair value of the remaining lease termination obligation as of December 29, 2015, the cease-use date, using a weighted average of multiple outcomes approach which considered for each lease: 1) future contractual lease obligations, net of projected sub-lease income (limited to amount of the rental obligation) after a period for remarketing, 2) outcomes including buyout fees for early termination and 3) actual terminations since December 29, 2015. Where relevant, future cash flows were discounted using the Company’s credit adjusted risk free rate which was estimated at 6.5%.
Sublease rental income and absorption period assumptions were based on data available from rental activity in the local markets. Assumptions about potential buyout payments were also based on data available from rental activity in the local markets, allowed for a period for negotiation and then a final settlement at a multiple of monthly rental and common area payments.
The future lease obligation totaled approximately $2.7 million which was reduced for estimates for sublease rental income and/or the impact of early buyout payments of $1.2 million. The net obligation after discounting was increased for estimated transaction fees to advisors of $0.1 million. The resulting obligation at estimated fair value totaled approximately $1.3 million.
Considerable management judgment is necessary to estimate net future cash flows including cash flows from continuing use, terminal value and sublease income. Accordingly, actual results could vary from the estimates. If these assumptions or their related estimates change in the future, the Company will be required to record additional exit costs or reduce exit costs previously recorded. Exit costs recorded for each of the periods presented include the effect of such changes in estimates; there were no subsequent changes during 2015 to the amount of the obligation.
19. OTHER OPERATING, NET
The components of other operating, net are as follows (in thousands):
| Fiscal Year | Fiscal Year | Fiscal Year | ||||||||||
| Ended | Ended | Ended | ||||||||||
| December 29, | December 30, | December 31, | ||||||||||
| 2015 | 2014 | 2013 | ||||||||||
| Jambacard breakage income | $ | (5,440 | ) | $ | (4,744 | ) | $ | (3,177 | ) | |||
| Jambacard expense | 1,155 | 1,299 | 753 | |||||||||
| CPG and JambaGO® direct expense | 3,035 | 2,637 | 3,053 | |||||||||
| Franchise expense | 1,348 | 1,751 | 763 | |||||||||
| Bad debt | 1,474 | 61 | 215 | |||||||||
| International expense | 708 | 316 | 203 | |||||||||
| Gain on contingent consideration | (156 | ) | (397 | ) | (651 | ) | ||||||
| Other | (329 | ) | (197 | ) | (4 | ) | ||||||
| Total other operating, net | $ | 1,795 | $ | 726 | $ | 1,155 | ||||||
F-25
20. OTHER COMMITMENTS AND CONTINGENCIES
Litigation Related - The Company records a liability for litigation claims and contingencies when payment is probable and the amount of loss can be reasonably estimated.
The Company is a defendant in litigation arising in the normal course of business. Although there can be no assurance as to the ultimate disposition of these matters, it is the opinion of the Company’s management, based upon the information available at this time, that the expected outcome of these matters, individually or in the aggregate, will not have a material adverse effect on the results of operations, liquidity or financial condition of the Company.
Other - The Company has purchase obligations with certain suppliers for certain fruits and dairy for various terms typically ranging from one year to five years. The Company has one contract with a supplier for a 15 year term that ends in 2024. These contracts are commitments to purchase a minimum level of fruit and other items used in the production of the Company’s products totaling $31.7 million.
21. RELATED-PARTY TRANSACTIONS
In fiscal 2015, the Company received $0.2 million from Country Pure Foods related to vendor supply chain management fees and $0.3 million from Sodexo related to licensing fees for Jamba Units operated by Sodexo. One Jamba Juice Director is on the Board of Directors for Country Pure Foods and another Jamba Juice Director is an executive with Sodexo.
The Company paid less than $0.1 million in fiscal 2013 and no payments in fiscal 2014 and 2015 to Mistral Capital Management, LLC for monitoring fees pursuant to the securities purchase agreement for the sale of its Series B Preferred Stock. Mistral Capital Management, LLC served as an investment manager to certain funds who held shares of the Company’s Series B Preferred Stock. As of December 29, 2015, there are no shares of Series B Preferred Stock outstanding as conversion of all shares of Series B Preferred Stock was completed by June 14, 2013, thereby terminating the rights of preferred stockholders to representation on the Board of Directors.
F-26
22. UNAUDITED QUARTERLY INFORMATION
The tables below provide the Company’s unaudited consolidated results of operations for each quarter in 2015 and 2014:
| Thirteen Weeks | Thirteen Weeks | Thirteen Weeks | Thirteen Weeks | |||||||||||||
| Ended | Ended | Ended | Ended | |||||||||||||
| March 31, | June 30, | September 29, | December 29, | |||||||||||||
| (In thousands, except share and per share amounts) | 2015 | 2015 | 2015 | 2015 | ||||||||||||
| Revenue: | ||||||||||||||||
| Company stores | $ | 47,728 | $ | 48,360 | $ | 28,213 | $ | 12,724 | ||||||||
| Franchise and other revenue | 4,776 | 5,766 | 7,284 | 6,825 | ||||||||||||
| Total revenue | 52,504 | 54,126 | 35,497 | 19,549 | ||||||||||||
| Costs and operating expenses (income): | ||||||||||||||||
| Cost of sales | 12,407 | 11,474 | 6,626 | 3,230 | ||||||||||||
| Labor | 16,088 | 14,876 | 8,843 | 4,925 | ||||||||||||
| Occupancy | 6,835 | 6,131 | 3,980 | 2,005 | ||||||||||||
| Store operating | 8,034 | 8,059 | 5,901 | 3,158 | ||||||||||||
| Depreciation and amortization | 1,873 | 1,344 | 1,143 | 2,209 | ||||||||||||
| General and administrative | 8,963 | 8,427 | 9,003 | 10,479 | ||||||||||||
| Gain on disposal of assets | (778 | ) | (4,480 | ) | (16,076 | ) | (275 | ) | ||||||||
| Store pre-opening | 22 | 166 | 287 | 556 | ||||||||||||
| Impairment of long-lived assets | - | 295 | 1,907 | 321 | ||||||||||||
| Store lease termination and closure | 22 | 40 | 207 | 1,400 | ||||||||||||
| Other operating, net | 706 | 1,333 | 375 | (619 | ) | |||||||||||
| Total costs, operating expenses, and gain | 54,172 | 47,665 | 22,196 | 27,389 | ||||||||||||
| (Loss) income from operations | (1,668 | ) | 6,461 | 13,301 | (7,840 | ) | ||||||||||
| Other income (expense): | ||||||||||||||||
| Interest income | 15 | 14 | 49 | 59 | ||||||||||||
| Interest expense | (41 | ) | (68 | ) | (53 | ) | (58 | ) | ||||||||
| Total other (expense) income, net | (26 | ) | (54 | ) | (4 | ) | 1 | |||||||||
| (Loss) income before income taxes | (1,694 | ) | 6,407 | 13,297 | (7,839 | ) | ||||||||||
| Income tax expense | (26 | ) | (57 | ) | (194 | ) | (424 | ) | ||||||||
| Net (loss) income | (1,720 | ) | 6,350 | 13,103 | (8,263 | ) | ||||||||||
| Less: Net income attributable to noncontrolling interest | 31 | 21 | - | - | ||||||||||||
| Net (loss) income attributable to Jamba, Inc. | $ | (1,751 | ) | $ | 6,329 | $ | 13,103 | $ | (8,263 | ) | ||||||
| (Loss) earnings per share attributable to Jamba, Inc. common stockholders: | ||||||||||||||||
| Basic | $ | (0.11 | ) | $ | 0.39 | $ | 0.83 | $ | (0.55 | ) | ||||||
| Diluted | $ | (0.11 | ) | $ | 0.38 | $ | 0.81 | $ | (0.55 | ) | ||||||
F-27
| Thirteen Weeks | Thirteen Weeks | Thirteen Weeks | Thirteen Weeks | |||||||||||||
| Ended | Ended | Ended | Ended | |||||||||||||
| April 1, | July 1, | September 30, | December 30, | |||||||||||||
| (In thousands, except share and per share amounts) | 2014 | 2014 | 2014 | 2014 | ||||||||||||
| Revenue: | ||||||||||||||||
| Company stores | $ | 47,272 | $ | 58,632 | $ | 53,377 | $ | 39,456 | ||||||||
| Franchise and other revenue | 4,361 | 5,566 | 4,907 | 4,477 | ||||||||||||
| Total revenue | 51,633 | 64,198 | 58,284 | 43,933 | ||||||||||||
| Costs and operating expenses (income): | ||||||||||||||||
| Cost of sales | 11,582 | 13,587 | 14,611 | 12,456 | ||||||||||||
| Labor | 14,330 | 16,243 | 16,793 | 14,383 | ||||||||||||
| Occupancy | 6,967 | 6,899 | 6,917 | 6,847 | ||||||||||||
| Store operating | 7,402 | 8,495 | 9,400 | 7,792 | ||||||||||||
| Depreciation and amortization | 2,618 | 2,680 | 2,617 | 2,169 | ||||||||||||
| General and administrative | 8,350 | 9,582 | 9,487 | 9,859 | ||||||||||||
| Gain on disposal of assets | (67 | ) | (979 | ) | (555 | ) | (1,356 | ) | ||||||||
| Store pre-opening | 153 | 267 | 166 | 177 | ||||||||||||
| Impairment of long-lived assets | 30 | 145 | - | - | ||||||||||||
| Store lease termination and closure | 18 | 40 | 180 | 337 | ||||||||||||
| Other operating, net | 469 | 633 | 475 | (851 | ) | |||||||||||
| Total costs, operating expenses, and gain | 51,852 | 57,592 | 60,091 | 51,813 | ||||||||||||
| (Loss) income from operations | (219 | ) | 6,606 | (1,807 | ) | (7,880 | ) | |||||||||
| Other income (expense): | ||||||||||||||||
| Interest income | 16 | 18 | 21 | 19 | ||||||||||||
| Interest expense | (46 | ) | (48 | ) | (49 | ) | (52 | ) | ||||||||
| Total other expense, net | (30 | ) | (30 | ) | (28 | ) | (33 | ) | ||||||||
| (Loss) income before income taxes | (249 | ) | 6,576 | (1,835 | ) | (7,913 | ) | |||||||||
| Income tax benefit (expense) | 5 | (223 | ) | 156 | (106 | ) | ||||||||||
| Net (loss) income | (244 | ) | 6,353 | (1,679 | ) | (8,019 | ) | |||||||||
| Less: Net income attributable to noncontrolling interest | - | 17 | 22 | 4 | ||||||||||||
| Net (loss) income attributable to Jamba, Inc. | $ | (244 | ) | $ | 6,336 | $ | (1,701 | ) | $ | (8,023 | ) | |||||
| (Loss) earnings per share attributable to Jamba, Inc. common stockholders: | ||||||||||||||||
| Basic | $ | (0.01 | ) | $ | 0.37 | $ | (0.10 | ) | $ | (0.47 | ) | |||||
| Diluted | $ | (0.01 | ) | $ | 0.36 | $ | (0.10 | ) | $ | (0.47 | ) | |||||
The sum of (loss) earnings per share for all four quarters may not equal the loss per share of the fiscal year due to rounding.
In fiscal 2015 Company Store revenue decreased primarily due to the net reduction in Company Stores resulting from the Company’s refranchising strategy. During fiscal 2015 the Company sold 4 stores in the first quarter, 49 stores in the second quarter, 110 stores in the third quarter, and 14 (net of 2 acquired stores) in the fourth quarter. During fiscal 2014 the Company sold 4 stores during the first quarter, 4 stores in the second quarter, acquired 18 (net of 5 sold stores) in the third quarter, and sold 2 (net of 3 acquired stores) during the fourth quarter. At the end of fiscal 2015, the number of Company Stores was 70 compared to 263 at the end of fiscal 2014. The number of Franchise Stores and International Stores grew to 823 as of December 29, 2015 compared to 605 as of December 30, 2014.
In the second quarter of 2015 the Company sold its 88% interest in JJSC to the holder of JJSC’s noncontrolling interest, in connection with the refranchising initiative.
Gain on disposal of assets increased primarily due to the refranchising activity during fiscal 2015. As a result, the Company recorded net income in the second and third quarter and for the full fiscal year of 2015 compared to a net loss in fiscal 2014.
23. SUBSEQUENT EVENTS
On January 22, 2016, the Company announced David A. Pace will be the Company’s next Chief Executive Officer. Mr. Pace, a member of Jamba’s Board of Directors since 2012, succeeds James D. White. Mr. Pace has been appointed CEO effective January 22, 2016 and will start with the Company on March 14, 2016.
F-28
| ITEM 9. | CHANGES IN AND DISAGREEMENTS WITH ACCOUNTANTS ON ACCOUNTING AND FINANCIAL DISCLOSURE |
Not Applicable.
| ITEM 9A. | CONTROLS AND PROCEDURES |
Disclosure Controls and Procedures
We maintain disclosure controls and procedures that are designed to ensure that information required to be disclosed in the Company’s reports under the Securities Exchange Act of 1934, as amended (the “Exchange Act”), is recorded, processed, summarized and reported within the time periods specified in the SEC’s rules and forms, and that such information is accumulated and communicated to management, including our Chief Executive Officer (CEO) and Chief Financial Officer (CFO), as appropriate, to allow timely decisions regarding required disclosure. In designing and evaluating the disclosure controls and procedures, management recognized that any controls and procedures, no matter how well designed and operated, can provide only reasonable assurance of achieving the desired control objectives, as the Company’s controls are designed to do, and management necessarily was required to apply its judgment in evaluating the risk related to controls and procedures.
In connection with the preparation of this Annual Report on Form 10-K, as of December 29, 2015, an evaluation was performed under the supervision and with the participation of our management, including the CEO and CFO, of the effectiveness of the design and operation of our disclosure controls and procedures (as defined in Rule 13a-15(e) under the Exchange Act). Based on that evaluation, our CEO and CFO concluded that our disclosure controls and procedures were effective as of December 29, 2015. These conclusions were communicated to the Audit committee.
Management’s Report on Internal Control Over Financial Reporting
Our management is responsible for establishing and maintaining adequate internal control over financial reporting as defined in Rule 13a-15(f) and 15d-15(f) under the Exchange Act. Our internal control over financial reporting is designed to provide reasonable assurance regarding the reliability of financial reporting and the preparation of financial statements for external purposes in accordance with U.S. generally accepted accounting principles (“GAAP”). Our internal control over financial reporting includes those policies and procedures that: (i) pertain to the maintenance of records that, in reasonable detail, accurately and fairly reflect the transactions and dispositions of the Company’s assets; (ii) provide reasonable assurance that transactions are recorded as necessary to permit preparation of financial statements in accordance with GAAP, and that the Company’s receipts and expenditures are being made only in accordance with authorizations of the Company’s management and directors; and (iii) provide reasonable assurance regarding prevention or timely detection of unauthorized acquisition, use, or disposition of the Company’s assets that could have a material effect on the financial statements.
Our management has assessed the effectiveness of our internal control over financial reporting as of December 29, 2015. In making its assessment of internal control over financial reporting, management used the criteria set forth by the Committee of Sponsoring Organizations (“COSO”) of the Treadway Commission in Internal Control - Integrated Framework (2013). Based on this assessment, our CEO and CFO concluded that our internal control over financial reporting was effective as of December 29, 2015 based on the criteria set forth by COSO in Internal Control - Integrated Framework (2013).
The effectiveness of the Company’s internal control over financial reporting as of December 29, 2015 has been audited by KPMG LLP, an independent registered public accounting firm, as stated in their report, which is included in Item 9B of this Annual Report on Form 10-K.
Remediation of Material Weakness
A material weakness is a deficiency, or a combination of deficiencies, in internal control over financial reporting such that there is a reasonable possibility that a material misstatement of the company’s annual or interim financial statements will not be prevented or detected on a timely basis. The material weakness that we previously reported was identified as of December 30, 2014 related to an insufficient complement of finance and accounting resources with adequate skills within the organization to ensure the proper application of U.S. GAAP with respect to the Company’s significant non-routine transactions. Specifically, our controls over non-routine transactions were not designed to capture all non-routine activities and our controls were not designed to ensure that non-routine transactions were adequately analyzed and accounted for in accordance with GAAP.
In 2015 we hired additional professional accounting resources to assist with the preparation and review of accounting policies and procedures and financial reporting with knowledge, experience and training in the application of GAAP. The finance and accounting organizational structure has been further enhanced by hiring additional internal and external resources, including third-party consultants to assist and focus on tax, technical accounting and internal controls.
51
In 2015 we have further enhanced the supervisory procedures that include additional levels of analysis and quality control reviews within the accounting and financial reporting functions. We implemented controls around the identification, documentation, and management’s review of significant non-routine transactions.
Changes in Internal Control Over Financial Reporting
We have taken actions to remediate the material weakness related to our internal control over non-routine transactions, as described in Remediation of Material Weakness above. Other than remediation of the material weakness referenced above, there have been no changes in our internal control over financial reporting (as defined in Rules 13a-15(f) and 15d-15(f) under the Exchange Act) during the fiscal year ended December 29, 2015 that have materially affected, or are reasonably likely to materially affect, our internal control over financial reporting.
| ITEM 9B. | OTHER INFORMATION |
NONE
52
Report of Independent Registered Public Accounting Firm
The Board of Directors and Stockholders
Jamba, Inc.:
We have audited Jamba, Inc.’s (“the Company”) internal control over financial reporting as of December 29, 2015, based on criteria established in Internal Control – Integrated Framework (2013) issued by the Committee of Sponsoring Organizations of the Treadway Commission (COSO). Jamba, Inc.’s management is responsible for maintaining effective internal control over financial reporting and for its assessment of the effectiveness of internal control over financial reporting, included in the accompanying Management’s Report on Internal Control over Financial Reporting, appearing under Item 9A. Our responsibility is to express an opinion on the Company’s internal control over financial reporting based on our audit.
We conducted our audit in accordance with the standards of the Public Company Accounting Oversight Board (United States). Those standards require that we plan and perform the audit to obtain reasonable assurance about whether effective internal control over financial reporting was maintained in all material respects. Our audit included obtaining an understanding of internal control over financial reporting, assessing the risk that a material weakness exists, and testing and evaluating the design and operating effectiveness of internal control based on the assessed risk. Our audit also included performing such other procedures as we considered necessary in the circumstances. We believe that our audit provides a reasonable basis for our opinion.
A company’s internal control over financial reporting is a process designed to provide reasonable assurance regarding the reliability of financial reporting and the preparation of financial statements for external purposes in accordance with generally accepted accounting principles. A company’s internal control over financial reporting includes those policies and procedures that (1) pertain to the maintenance of records that, in reasonable detail, accurately and fairly reflect the transactions and dispositions of the assets of the company; (2) provide reasonable assurance that transactions are recorded as necessary to permit preparation of financial statements in accordance with generally accepted accounting principles, and that receipts and expenditures of the company are being made only in accordance with authorizations of management and directors of the company; and (3) provide reasonable assurance regarding prevention or timely detection of unauthorized acquisition, use, or disposition of the company’s assets that could have a material effect on the financial statements.
Because of its inherent limitations, internal control over financial reporting may not prevent or detect misstatements. Also, projections of any evaluation of effectiveness to future periods are subject to the risk that controls may become inadequate because of changes in conditions, or that the degree of compliance with the policies or procedures may deteriorate.
In our opinion, Jamba, Inc. maintained, in all material respects, effective internal control over financial reporting as of December 29, 2015, based on criteria established in Internal Control – Integrated Framework (2013) issued by the Committee of Sponsoring Organizations of the Treadway Commission (COSO).
We also have audited, in accordance with the standards of the Public Company Accounting Oversight Board (United States), the consolidated balance sheets of Jamba, Inc. as of December 29, 2015 and December 30, 2014, and the related consolidated statements of operations, stockholders’ equity, and cash flows for the fiscal years ended December 29, 2015, December 30, 2014, and December 31, 2013, and our report dated March 14, 2016 expressed an unqualified opinion on those consolidated financial statements.
| /s/ KPMG LLP |
| San Francisco, California |
| March 14, 2016 |
53
| ITEM 10. | DIRECTORS, EXECUTIVE OFFICERS AND CORPORATE GOVERNANCE |
Information regarding the Directors of the Company is incorporated herein by reference from the Company’s 2015 Proxy Statement to Stockholders to be filed pursuant to Regulation 14A under the Exchange Act no later than 120 days after the end of the Company’s 2015 fiscal year.
Information regarding the Executive Officers of the Company is contained in Part I of this Annual Report on Form 10-K.
Our Board of Directors has adopted a Code of Business Conduct and Ethics (“Code of Conduct”) applicable to all officers, directors and employees, which is available on our website (http://ir.jambajuice.com) under "Corporate Governance." We intend to satisfy the disclosure requirement under Item 5.05 of Form 8-K regarding amendment to, or waiver from, a provision of our Code of Conduct by posting such information on the website address and location specified above.
| ITEM 11. | EXECUTIVE COMPENSATION |
The information required by Item 11 is incorporated herein by reference from the Company’s 2015 Proxy Statement to Stockholders to be filed pursuant to Regulation 14A under the Exchange Act no later than 120 days after the end of the Company’s 2015 fiscal year.
| ITEM 12. | SECURITY OWNERSHIP OF CERTAIN BENEFICIAL OWNERS AND MANAGEMENT AND RELATED STOCKHOLDER MATTERS |
Except as set forth below, information required by Item 12 is incorporated herein by reference from the Company’s 2015 Proxy Statement to Stockholders to be filed pursuant to Regulation 14A under the Exchange Act no later than 120 days after the end of the Company’s 2015 fiscal year.
| ITEM 13. | CERTAIN RELATIONSHIPS AND RELATED TRANSACTIONS, AND DIRECTOR INDEPENDENCE |
The information required by Item 13 is incorporated herein by reference from the Company’s 2015 Proxy Statement to Stockholders to be filed pursuant to Regulation 14A under the Exchange Act no later than 120 days after the end of the Company’s 2015 fiscal year.
| ITEM 14. | PRINCIPAL ACCOUNTANT FEES AND SERVICES |
The information required by Item 14 is incorporated herein by reference from the Company’s 2015 Proxy Statement to Stockholders to be filed pursuant to Regulation 14A under the Exchange Act no later than 120 days after the end of the Company’s 2015 fiscal year.
54
| ITEM 15. | EXHIBITS, FINANCIAL STATEMENT SCHEDULES |
Documents filed as part of this report:
(1) List of Financial Statements
The following consolidated financial statements are included herein in Part II, Item 8 of this Annual Report on Form 10-K:
| Report of Independent Registered Public Accounting Firm; | F-1 | ||
| Consolidated Balance Sheets at December 29, 2015 and December 30, 2014; | F-2 | ||
| Consolidated Statements of Operations for the Years Ended December 29, 2015, December 30, 2014 and December 31, 2013; | F-3 | ||
| Consolidated Statements of Stockholders’ Equity for the Years Ended December 29, 2015, December 30, 2014 and December 31, 2013; | F-4 | ||
| Consolidated Statements of Cash Flows for the Years Ended December 29, 2015, December 30, 2014 and December 31, 2013; | F-5 | ||
| Notes to Consolidated Financial Statements | F-6 |
(2) Schedules to Financial Statements: Schedule II
All other financial statement schedules have been omitted because they are either inapplicable or the information required is provided in the Company’s Consolidated Financial Statements and Notes thereto or included in Part II, Item 8 of this Annual Report on Form 10-K.
(3) List of Exhibits
Incorporated herein by reference is a list of the Exhibits contained in the Exhibit Index.
55
Pursuant to the requirements of Section 13 or 15(d) of the Securities Exchange Act of 1934, the registrant has duly caused this report to be signed on its behalf by the undersigned, thereunto duly authorized, in the City of Emeryville, State of California, on the 14th day of March, 2016.
JAMBA, INC.
| By: | ||
| /s/ David A. Pace | ||
| David A. Pace | ||
| Chief Executive Officer |
56
POWER OF ATTORNEY
We the undersigned officers and directors of Jamba, Inc., hereby severally constitute and appoint David A. Pace and Karen L. Luey, or either of them, his attorneys-in-fact, for such person in any and all capacities, to sign any amendments to this report and to file the same, with exhibits thereto, and other documents in connection therewith, with the Securities and Exchange Commission, hereby ratifying and confirming all that either of said attorneys-in-fact, or substitute or substitutes, may do or cause to be done by virtue hereof.
Pursuant to the requirements of the Securities Exchange Act of 1934, this report has been signed below by the following persons on behalf of the registrant and in the capacities and on the dates indicated.
| Name | Title | Date | ||
|
/s/ David A. Pace David A. Pace |
Chief Executive Officer, Director (Principal Executive Officer) | March 14, 2016 | ||
|
/s/ Karen L. Luey Karen L. Luey |
Chief Financial Officer, Chief Administrative Officer, Executive Vice President and Secretary (Principal Financial Officer and Principal Accounting Officer) | March 14, 2016 | ||
|
/s/ Michael A. Depatie Michael A. Depatie |
Director | March 14, 2016 | ||
|
/s/ Lorna Donatone Lorna Donatone |
Director | March 14, 2016 | ||
|
/s/ Richard L. Federico Richard L. Federico |
Director | March 14, 2016 | ||
|
/s/ Andrew Heyer Andrew Heyer |
Director | March 14, 2016 | ||
|
/s/ Lesley H. Howe Lesley H. Howe |
Director | March 14, 2016 | ||
|
/s/ James C. Pappas James C. Pappas |
Director | March 14, 2016 | ||
|
/s/ Glenn W. Welling Glenn W. Welling |
Director | March 14, 2016 |
57
JAMBA, INC. AND SUBSIDIARIES
SCHEDULE II
VALUATION AND QUALIFYING ACCOUNTS
Years Ended December 29, 2015, December 30, 2014, and December 31, 2013
(In thousands)
Allowance for Doubtful Accounts
| Balance at the Beginning of the Period | Charged to Expenses | Charged (Credited) to Other Accounts | Deductions | Balance at the
End of the Period | ||||||||||||||||
| Year ended December 29, 2015 | $ | 280 | $ | 741 | $ | - | $ | (403 | ) | $ | 618 | |||||||||
| Year ended December 30, 2014 | $ | 291 | $ | 54 | $ | - | $ | (65 | ) | $ | 280 | |||||||||
| Year ended December 31, 2013 | $ | 108 | $ | 183 | $ | - | $ | - | $ | 291 | ||||||||||
58
EXHIBIT INDEX
| Exhibit Number |
Description | Form | File No. | Exhibit | Filing Date | Filed Herewith | ||||||
| 3.1 | Amended and Restated Certificate of Incorporation of the Company | 8-K | 001-32552 | 3.1 | December 5, 2006 | |||||||
| 3.2 | Certificate of Amendment to Amended and Restated Certificate of Incorporation of the Company | 8-K | 001-32552 | 3.2 | December 5, 2006 | |||||||
| 3.3 | Certificate of Amendment to Amended and Restated Certificate of Incorporation of the Company | 8-K | 001-32552 | 3.1 | May 31, 2013 | |||||||
| 3.4 | Certificate of Elimination of the Series A Preferred Stock | 8-K | 001-32552 | 3.1 | April 3, 2015 | |||||||
| 3.5 | Amended and Restated Bylaws of the Company | 8-K | 001-32552 | 3.1 | August 17, 2010 | |||||||
| 4.1 | Specimen Common Stock Certificate | S-1 | 333-122812 | 4.2 | February 14, 2005 | |||||||
| 4.2 | Registration Rights Agreement dated June 16, 2009 between Jamba, Inc., the Investors and North Point | 8-K | 001-32552 | 4.1 | June 17, 2009 | |||||||
| 10.1 | Form of Indemnity Agreement entered into between the Company and its directors, officers and certain other employees | 8-K | 001-32552 | 10.1 | December 5, 2006 | |||||||
| 10.2 | Form of Distribution Agreement by and between Jamba Juice Company and various suppliers | 8-K | 001-32552 | 10.4 | December 5, 2006 | |||||||
| 10.3 | Office Lease for the property located at 6475 Christie Avenue, Emeryville, CA 94608, by and between Jamba Juice Company and Bay Center Office, LLC dated July 28, 2006 | 8-K | 001-32552 | 10.5 | December 5, 2006 |
59
| 10.4 | Amended and Restated 1994 Stock Incentive Plan** | 8-K | 001-32552 | 10.16 | December 5, 2006 | |||||||
| 10.5 | 2001 Equity Incentive Plan** | 8-K | 001-32552 | 10.17 | December 5, 2006 | |||||||
| 10.6 | Jamba, Inc. Amended and Restated 2006 Employee, Director and Consultant Stock Plan** | DEF14A | 001-32552 | Annex A | April 1, 2010 | |||||||
| 10.7 | Form of Incentive Stock Option Plan under the 2006 Plan** | 10-Q | 001-32552 | 10.2 | August 17, 2011 | |||||||
| 10.8 | Form of Non-Qualified Stock Option Agreement under the 2006 Plan** | 10-Q | 001-32552 | 10.3 | August 17, 2011 | |||||||
| 10.9 | Form of Restricted Stock Units Agreement under the 2006 Plan** | 10-Q | 001-32552 | 10.4 | August 17, 2011 | |||||||
| 10.10 | Jamba, Inc. 2010 Employee Stock Purchase Plan | DEF14A | 001-32552 | Annex B | April 1, 2010 | |||||||
| 10.11 | Non-employee Director Compensation Policy, as amended** | 10-K | 001-32552 | 10.11 | March 7, 2013 | |||||||
| 10.12 | Distribution Service Agreement by Systems Services of America and Jamba Juice Company dated as of December 16, 2012* | 10-K | 001-32552 | 10.11 | March 7, 2013 | |||||||
| 10.13 | Form of Executive Employment Agreement entered into between Jamba Juice Company and each of Karen L. Luey, Thibault de Chatellus, Steve Adkins, Greg Schwartz and Susan Shields** | 8-K | 001-32552 | 10.1 | October 14, 2008 | |||||||
| 10.14 | Jamba, Inc. Management Incentive Plan** | 8-K | 001-32552 | 10.1 | December 21, 2010 | |||||||
| 10.15 | Credit Agreement dated as of February 14, 2012 by and among the Company, Jamba Juice company and Wells Fargo Bank, National Association | 10-K | 001-32552 | 10.18 | March 9, 2012 | |||||||
| 10.16 | Amendment to the Credit Agreement dated as of November 1, 2012 by and among the Company, Jamba Juice Company and Wells Fargo Bank, National Association | 10-K | 001-32552 | 10.19 | March 7, 2013 |
60
| 10.17 | First Amendment to Office Lease for the property located at 6475 Christie Avenue, Emeryville, CA 94608, by and between Jamba Juice Company and Bay Center Investor, LLC, dated March 25, 2011 | 10-Q | 001-32552 | 10.1 | August 2, 2012 | |||||||
| 10.18 | Second Amendment to Office Lease for the property located at 6475 Christie Avenue, Emeryville, CA 94608, by and between Jamba Juice Company and Bay Center Investor, LLC, dated May 31, 2012 | 10-Q | 001-32552 | 10.2 | August 2, 2012 | |||||||
| 10.19 | Jamba, Inc. 2013 Equity Incentive Plan** | 8-K | 001-32552 | 10.1 | May 16, 2013 | |||||||
| 10.20 | Form of Notice of Grant of Stock Option under 2013 Equity Incentive Plan** | 8-K | 001-32552 | 10.2 | May 16, 2013 | |||||||
| 10.21 | Form of Stock Option Agreement under 2013 Equity Incentive Plan** | 8-K | 001-32552 | 10.3 | May 16, 2013 | |||||||
| 10.22 | Form of Notice of Grant of Restricted Stock under 2013 Equity Incentive Plan** | 8-K | 001-32552 | 10.4 | May 16, 2013 | |||||||
| 10.23 | Form of Restricted Stock Agreement under 2013 Equity Incentive Plan** | 8-K | 001-32552 | 10.5 | May 16, 2013 | |||||||
| 10.24 | Form of Notice of Grant of Restricted Stock Unit under 2013 Equity Incentive Plan** | 8-K | 001-32552 | 10.5 | May 16, 2013 | |||||||
| 10.25 | Form of Restricted Stock Unit Agreement under 2013 Equity Incentive Plan** | 8-K | 001-32552 | 10.7 | May 16, 2013 | |||||||
| 10.26 | Second Amendment to the Credit Agreement dated as of July 22, 2013 by and among the Company, Jamba Juice Company and Wells Fargo Bank, National Association | 10-Q | 001-32552 | 10.8 | August 6, 2013 | |||||||
| 10.27 | Executive Retention and Severance Plan** | 10-Q | 001-32552 | 10.9 | August 6, 2013 | |||||||
| 10.28 | Amendment and Limited Waiver, dated November 4, 2013, to the Credit Agreement dated as of February 14, 2012 by and among the Company, Jamba Juice Company and Wells Fargo Bank, National Association | 10-K | 001-32552 | 10.31 | March 10, 2014 |
61
| 10.29 | Nonemployee Director Restricted Stock Unit Deferral Program and Election Notice | 10-Q | 001-32552 | 10.1 | August 11, 2014 | |||||||
| 10.30 | Asset Purchase Agreement, dated April 1, 2015, by and between Jamba Juice Company and Vitaligent, LLC | 10-Q | 001-32552 | 10.1 | August 10, 2015 | |||||||
| 10.31 | Executive Transition Services Agreement, dated October 1, 2015, by and between Jamba Juice Company and James D. White** | 8-K | 001-32552 | 10.1 | October 2, 2015 | |||||||
| 10.32 |
First Amendment to Asset Purchase Agreement, dated July 28, 2015, by and between Jamba Juice Company and Vitaligent, LLC |
10-Q | 001-32552 | 10.1 | November 9, 2015 | |||||||
| 10.33 | Release Agreement, dated December 18, 2015, by and between Jamba Juice Company and Julie Washington** | X | ||||||||||
| 10.34 | Amendment and Limited Waiver, dated December 29, 2015, to the Credit Agreement dated as of February 14, 2012 by and among the Company, Jamba Juice Company and Wells Fargo Bank, National Association | X | ||||||||||
| 21.1 | List of Subsidiaries | X | ||||||||||
| 23.1 | Consent of Independent Registered Public Accounting Firm-KPMG LLP | X | ||||||||||
| 24 | Power of Attorney, included on signature page hereto | X | ||||||||||
| 31.1 | Certification of Chief Executive Officer pursuant to Rule 13a-14(a) and Rule 15d-14(a) of the Securities Exchange Act of 1934, as amended | X | ||||||||||
| 31.2 | Certification of Chief Financial Officer pursuant to Rule 13a-14(a) and Rule 15d-14(a) of the Securities Exchange Act of 1934, as amended | X | ||||||||||
| 32.1 | Certification of Chief Executive Officer pursuant to 18 U.S.C. 1350, as adopted pursuant to Section 906 of the Sarbanes-Oxley Act of 2002 | X | ||||||||||
| 32.2 | Certification of Chief Financial Officer pursuant to 18 U.S.C. 1350, as adopted pursuant to Section 906 of the Sarbanes-Oxley Act of 2002 | X | ||||||||||
62
| 101.INS | XBRL Instance Document | X | ||||||||||
| 101.SCH | XBRL Taxonomy Extension Schema Document | X | ||||||||||
| 101.CAL | XBRL Taxonomy Extension Calculation Linkbase Document | X | ||||||||||
| 101.DEF | XBRL Taxonomy Extension Definition Linkbase Document | X | ||||||||||
| 101.LAB | XBRL Taxonomy Extension Label Linkbase Document | X | ||||||||||
| 101.PRE | XBRL Taxonomy Extension Presentation Linkbase Document | X |
| * | This exhibit (or portions thereof) has been filed separately with the Securities and Exchange Commission pursuant to an application for confidential treatment. The confidential portions of this exhibit have been omitted and are marked by an asterisk. |
| ** | Management contract, or compensatory plan or arrangement. |
63