Attached files
Table of Contents
UNITED STATES
SECURITIES AND EXCHANGE COMMISSION
Washington, D.C. 20549
FORM 10-K
| x | ANNUAL REPORT PURSUANT TO SECTION 13 OR 15(d) OF THE SECURITIES EXCHANGE ACT OF 1934 |
For the fiscal year ended December 29, 2009
OR
| ¨ | TRANSITION REPORT PURSUANT TO SECTION 13 OR 15(d) OF THE SECURITIES EXCHANGE ACT OF 1934 |
Jamba, Inc.
(Exact name of registrant as specified in its charter)
| Delaware | 001-32552 | 20-2122262 | ||
| (State or other jurisdiction of incorporation) | (Commission File No.) | (I.R.S. Employer Identification No.) |
6475 Christie Avenue, Suite 150, Emeryville, California 94608
(Address of principal executive offices)
Registrant’s telephone number, including area code: (510) 596-0100
Securities registered pursuant to Section 12(b) of the Act:
| Common Stock, par value $.001 per share | The NASDAQ Stock Market LLC |
Securities registered pursuant to Section 12(g) of the Act:
NONE
Indicate by check mark if the registrant is a well-known seasoned issuer, as defined in Rule 405 of the Securities Act. Yes ¨ No x
Indicate by check mark if the registrant is not required to file reports pursuant to Section 13 or Section 15(d) of the Act. Yes ¨ No x
Indicate by check mark whether the registrant (1) has filed all reports required to be filed by Section 13 or 15(d) of the Securities Exchange Act of 1934 during the preceding 12 months (or for such shorter period that the registrant was required to file such reports), and (2) has been subject to the filing requirements for the past 90 days. Yes x No ¨
Indicate by check mark whether the registrant has submitted electronically and posted on its corporate Web site, if any, every Interactive Data File required to be submitted and posted pursuant to Rule 405 of Regulation S-T (§232.405 of this chapter) during the preceding 12 months (or for such shorter period that the registrant was required to submit and post such files). Yes ¨ No ¨
Indicate by check mark if disclosure of delinquent filers pursuant to Item 405 of Regulation S-K is not contained herein, and will not be contained, to the best of registrant’s knowledge, in definitive proxy or information statements incorporated by reference in Part III of this Form 10-K or any amendment to this Form 10-K. ¨
Indicate by check mark whether the registrant is a large accelerated filer, an accelerated filer, a non-accelerated filer or a smaller reporting company. See the definitions of “large accelerated filer,” “accelerated filer” and “smaller reporting company” in Rule 12b-2 of the Exchange Act (check one):
| Large accelerated filer ¨ |
Accelerated filer x | Non-accelerated filer ¨ (Do not check if a smaller reporting company) |
Smaller reporting company ¨ |
Indicate by check mark whether the registrant is a shell company (as defined in Rule 12b-2 of the Act). Yes ¨ No x
The aggregate market value of the registrant’s common stock, $0.001 par value per share, held by non-affiliates as of the last day of the registrant’s second fiscal quarter ended July 14, 2009 was $51,127,812 (based upon the closing sales price of registrant’s common stock on such date). For purposes of this disclosure, shares of common stock held by persons who held more than 5% of the outstanding shares of common stock and shares held by officers and directors of the registrant have been excluded in that such persons may be deemed to be affiliates. This determination of affiliate status is not necessarily a conclusive determination for other purposes.
The number of shares of common stock of Jamba, Inc. issued and outstanding as of March 4, 2010 was 52,717,478.
DOCUMENTS INCORPORATED BY REFERENCE
Portions of the Proxy Statement for the 2010 Annual Meeting of Stockholders (the “Proxy Statement”), to be filed within 120 days of the end of the fiscal year ended December 29, 2009, are incorporated by reference in Part III hereof. Except with respect to information specifically incorporated by reference in this Form 10-K, the Proxy Statement is not deemed to be filed as part hereof.
Table of Contents
ANNUAL REPORT ON FORM 10-K
FISCAL YEAR ENDED DECEMBER 29, 2009
| Form 10-K |
Name of Item |
Page | ||
| PART I | 4 | |||
| Item 1. |
4 | |||
| Item 1A. |
17 | |||
| Item 1B. |
29 | |||
| Item 2. |
29 | |||
| Item 3. |
30 | |||
| Item 4. |
30 | |||
| PART II | 31 | |||
| Item 5. |
31 | |||
| Item 6. |
33 | |||
| Item 7. |
MANAGEMENT’S DISCUSSION AND ANALYSIS OF FINANCIAL CONDITION AND RESULTS OF OPERATIONS |
37 | ||
| Item 7A. |
64 | |||
| Item 8. |
66 | |||
| Item 9. |
CHANGES IN AND DISAGREEMENTS WITH ACCOUNTANTS ON ACCOUNTING AND FINANCIAL DISCLOSURE |
98 | ||
| Item 9A. |
98 | |||
| Item 9B. |
98 | |||
| PART III | 100 | |||
| Item 10. |
100 | |||
| Item 11. |
100 | |||
| Item 12. |
SECURITY OWNERSHIP OF CERTAIN BENEFICIAL OWNERS AND MANAGEMENT AND RELATED STOCKHOLDER MATTERS |
100 | ||
| Item 13. |
CERTAIN RELATIONSHIPS AND RELATED TRANSACTIONS, AND DIRECTOR INDEPENDENCE |
100 | ||
| Item 14. |
100 | |||
| PART IV | 101 | |||
| Item 15. |
101 | |||
| 102 | ||||
2
Table of Contents
Special Note Regarding Forward-Looking Statements
We believe that some of the information in this document constitutes forward-looking statements. You can identify these statements by forward-looking words such as “may,” “expect,” “anticipate,” “contemplate,” “believe,” “estimate,” “intend,” “plan,” and “continue” or words of similar meaning. Examples of such statements include references to targeted growth, new store openings, Consolidated and Store-level EBITDA, Company Store comparable sales, expense management and the like. You should read statements that contain these words carefully because they:
| • | discuss future expectations; |
| • | contain projections of future results of operations or financial condition; or |
| • | state other “forward-looking” information. |
We believe it is important to communicate our expectations to our stockholders. However, there may be events in the future that we are not able to accurately predict or over which we have no control. The risk factors and cautionary language discussed in this document outline examples of risks, uncertainties and events that may cause actual results to differ materially from the expectations described in the forward-looking statements, including among other things:
| • | the amount of cash on hand available to us; |
| • | our business strategy; |
| • | changing interpretations of generally accepted accounting principles; |
| • | outcomes of government reviews, inquiries, investigations and related litigation; |
| • | continued compliance with government regulations; |
| • | legislation or regulatory environments, requirements or changes adversely affecting the businesses in which we are engaged; |
| • | statements about industry trends; |
| • | fluctuations in customer demands; |
| • | general economic conditions; and |
| • | geopolitical events and regulatory changes. |
You are cautioned not to place undue reliance on these forward-looking statements, which speak only as of the date of this document.
All forward-looking statements included herein are expressly qualified in their entirety by the cautionary statements contained or referred to in this section. Except to the extent required by applicable laws and regulations, we undertake no obligation to update these forward-looking statements to reflect events or circumstances after the date of this document or to reflect the occurrence of unanticipated events.
You should be aware that the occurrence of the events described in the “Risk Factors” portion of this annual report, the documents incorporated herein and our other SEC filings could have a material adverse effect on our business, prospects, financial condition or operating results.
3
Table of Contents
| ITEM 1. | BUSINESS |
Background of Jamba, Inc.
Jamba, Inc. was incorporated in Delaware on January 6, 2005 as a blank check company formed to serve as a vehicle for the acquisition of a then unidentified operating business. On July 6, 2005, the Company consummated its initial public offering. On March 10, 2006, the Company entered into an Agreement and Plan of Merger with Jamba Juice Company, the category-defining retailer of premium better-for-you blended beverages that was originally founded in 1990. The merger between the Company and Jamba Juice Company (the “Merger”) was completed on November 29, 2006 and Jamba Juice Company now operates as a wholly owned subsidiary of Jamba, Inc.
Unless the context otherwise requires, Jamba, Inc., the registrant, together with Jamba Juice Company, are referred to in this Form 10-K annual report (“Form 10-K”) as the “Company”, “Jamba”, “we”, “us” and “our.” Information regarding the Company’s fiscal periods is included in Item 7, “Management’s Discussion and Analysis of Financial Condition and Results of Operations.”
Narrative Description of Business
Founded in 1990, Jamba Juice is a leading restaurant retailer of better-for-you food and beverage offerings, including great tasting fruit smoothies, juices, and teas, hot oatmeal made with organic steel cut oats, wraps, salads, sandwiches, and California Flatbreads™, and a variety of baked goods and snacks. As of December 29, 2009, Jamba Juice had 739 locations consisting of 478 company-owned and operated stores (“Company Stores”) and 261 franchise stores (“Franchise Stores”), making it one of the largest smoothie retailers in the United States by store count.
In fiscal 2008, we experienced economic challenges which led to significant changes in our executive management team, including the hiring of James D. White as chief executive officer and president in November 2008. In response to these challenges, in Fiscal 2009, we undertook various initiatives and strategic priorities to revitalize the Company for future growth and long-term stockholder value, which we call the BLEND Plan.
The BLEND Plan—Our Strategic Priorities
The BLEND Plan is the Company’s strategic plan to transform the Jamba Juice brand from a made-to-order smoothie company to a healthy, active lifestyle brand. In fiscal 2009, we achieved significant progress against the BLEND Plan and we continue to evolve and develop the Jamba Juice and Jamba brands and implement new business strategies that we believe will have a positive financial impact on the Company. The key strategic priorities for our BLEND Plan in fiscal 2010 include:
| • | building a customer first, operationally focused service culture; |
| • | building a retail food capability across all four day parts (breakfast, lunch, afternoon, and dinner); |
| • | accelerating the development of franchise and non-traditional stores; |
| • | building a consumer products growth platform; and |
| • | continuing to implement a disciplined expense reduction plan. |
These strategic priorities support the Company’s mission to continue to grow and develop Jamba as a premier healthy living brand offering consumers compelling and differentiated products and experiences at Jamba Juice® stores and other retail distribution channels. Key to our success is the Jamba culture, a unique set of core values and actions that manifest themselves in employees executing at the highest levels while expressing their passion for the brand.
4
Table of Contents
Building a Customer First, Operationally Focused Service Culture
A major aspect of our BLEND Plan is to improve the level and consistency of customer service at our stores. We implemented a series of procedural changes to simplify operations and improve customer service and we continued with our system-wide mystery shop program. Consistent with our goal of building a customer first, operationally focused service culture, we continued to make progress training team members and validating results through our “mystery shop” program which has shown a substantial improvement in store performance scores over the last year. We believe these changes resulted in a dramatic improvement in customer satisfaction during the year. Technology and procedural enhancements in areas such as labor management and scheduling implemented in 2009 relieved store managers from unnecessary administrative reporting and enabled them to focus on customer service. We also hired a number of regional franchise consultants as Company liaisons to our franchisees who can assist with rollouts of new products and marketing campaigns, provide best practices and provide franchisee feedback to the Company. We also implemented new performance standards and metrics to drive improvement and reinforce service expectations at the store level, and we refreshed 88 stores to reinforce the vibrant and fun environment customers expect from Jamba Juice stores.
We plan to continue to leverage technology to better understand and improve upon customer service requirements measured by our mystery shop store performance tracking system and the deployment of a customer loyalty program. We will focus on executing a best in class service experience for customers through implementation of enhanced training programs for team members and will continue to refine the in-store customer experience by further refreshing the look and feel of existing Jamba Juice locations. It is our intent that these programs will help to drive customer loyalty and satisfaction thus increasing frequency of visits and market share among Jamba customers.
In an effort to serve as many customer needs as possible, we also engage in off-site sales (which we refer to as “Jamba Catering”) that involve bringing Jamba Juice products to sell at an event such as a school, community or sporting events or for delivery to businesses or other organizations for meetings, parties and the like. Our commitment to health and wellness in schools is evidenced in part by our School Lunch Program. With childhood obesity now a national concern, it is more important than ever for schools to provide nutritional and healthful food and beverage options to its students. Our program seeks to give schools the opportunity to provide these better for you beverage options during the school day. Another component of this effort is the addition of fundraising opportunities for non-profit organizations. We also work with individual organizations at the grass-roots level and on a national basis, as we do in our relationship with the National PTA.
Building a Retail Food Capability Across All Four Day Parts (breakfast, lunch, afternoon and dinner)
Menu Overview
We have traditionally provided a range of freshly blended beverages, baked goods and snacks in our stores. Our menu items are designed to strengthen the relationship with our customers by offering products that are relevant to individuals striving for a healthy, active lifestyle. Product innovation is a high priority and our research and development team, composed of food scientists, quality assurance specialists and food industry experts, is continually developing and testing new and improved menu items that support the integrity of the Jamba brand and our commitment to offering great tasting products made from high quality ingredients.
In January 2009, we began a broad rollout of steel cut hot oatmeal with fruit as another step in establishing our food program. Oatmeal was being offered in over 600 locations nationwide by the end of fiscal 2009. In the summer of 2009 we introduced a variety of “grab-and-go” wraps, salads, sandwiches and our signature California Flatbread™ food offerings which are now available in some combination in over 370 system stores nationwide. We intend to expand the reach of these offerings to be included in every Jamba Juice store across the country during fiscal 2010.
5
Table of Contents
In February 2010 we completed operational testing of our Hot Blends™ beverage platform in 40 stores. We believe Hot Blends beverages will bundle well with our oatmeal and other offerings, and could help offset seasonality and support sales results during the cooler parts of the year. As of March 1, 2010, products in our hot beverage platform are currently available in more than 340 stores system-wide. Our current hot beverage offerings include four Hot Blends beverages prepared in a blender, including three tea latte flavors and a Classic Hot Chocolate made with premium natural and organic ingredients, as well as six varieties of Mighty Leaf® organic tea pouches.
These new products are designed to feature better-for-you, on-the-go food items to attract new customers, increase the frequency of current customer visits, create a point of differentiation, and help to provide a more complete meal solution for our customers across all day parts. We believe this platform may also help offset some of the challenges the seasonal nature of our business has presented in the past.
As a result of our efforts to expand our food and beverage platform, we now have a more diverse menu offering which we believe will be more appealing to a broader group of consumers across all four day parts (breakfast, lunch, afternoon and dinner) and includes all or some combination of delicious smoothies, fresh squeezed juices, boosts, Iced Fruit Tea Infusions™, Hot Blends tea and hot chocolate beverages, wraps, salads, sandwiches, slow-cooked steel cut oatmeal with fruit topping and brown sugar crumble, California Flatbreads, baked goods and a variety of packaged snacks and bottled beverages.
We plan to grow our food and hot beverage capability further during fiscal 2010. We believe there is consumer demand for better-for-you on-the-go food items that is not being fulfilled by other quick service restaurants. Our goal is for Jamba Juice to be the leader in the healthy quick service restaurant segment.
Product Innovation
Our research and development team continually seeks to enhance the product offerings available to customers, and where possible, reduce product and labor costs. Our research and development process includes both the development of new products and the optimization of existing menu items to ensure only the most appealing products are offered to customers. As new products are introduced to the menu, usage occasions can increase and positive word-of-mouth can be spread. We are passionate about creating fresh new products that meet an even greater variety of customer needs. While there is no certainty that product development efforts will lead to the introduction and success of new product offerings or a potential increase in operating margins, we will continue to use these resources to try to develop fresh concepts that appeal to customers at any time of day and in any weather or season.
Accelerating the Development of Franchise and Non-Traditional Stores
Jamba Juice Stores
A primary goal of the Company is to grow our brand by establishing more points of access to make it easier for customers to experience what we have to offer. We believe we have significant market expansion opportunities both nationally and internationally. Our research and planning have shown that there is potential for at least 2,700 total Jamba Juice stores in the United States which we believe could be profitable and would meet our new store opening criteria.
We have grown our concept and brand through Company Store and Franchise Store locations. As of December 29, 2009, there were 739 Jamba Juice locations consisting of 478 Company Stores and 261 Franchise Stores operating in 22 states and the Bahamas. Except for the single Bahamas franchise location we currently have no other international locations; however as discussed elsewhere in this annual report on Form 10-K, we are exploring opportunities for international expansion. Of the 739 locations, 389 stores are located in California, of which 328 are Company Stores and 61 are Franchise Stores. We lease the real estate for all of our Company Stores.
6
Table of Contents
We generally characterize our stores as either “traditional” or “non-traditional” locations. Traditional locations are characterized as a business premise that exists primarily as a Jamba Juice store. Traditional stores in the past averaged approximately 1,400 square feet in size. These stores are located either in major urban centers or in suburban strip mall centers. As of December 29, 2009, there were 612 traditional Jamba Juice store locations.
Non-traditional locations are characterized as a Jamba Juice store located within another primary business in conjunction with other businesses or at institutional settings such as colleges and universities, shopping malls, supermarkets and airports. A “captive” audience is a common characteristic of non-traditional locations. We believe one benefit of the development of non-traditional stores is to increase awareness of the Jamba Juice brand to complement the traditional stores in the area. As of December 29, 2009, there were 127 non-traditional Jamba Juice store locations.
We have lowered the typical costs to construct a traditional Jamba Juice Store from an average of $425,000 in 2008 to an average of $340,000 today, depending upon location. This cost reduction was accomplished through reducing our real estate footprint from an average of 1,400 sq. ft. to 1,200 sq. ft. for newer stores, aggressive competitive bidding with our general contractor pool to reduce leasehold improvement costs, aggressive competitive bidding for our furniture and fixtures package, value engineering, and innovative equipment and physical layouts to help reduce operational costs. We believe reducing a traditional store’s “build-out” costs will help attract franchisees by providing a higher return on investment as franchisees are obligated to finance their own “build-out” costs according to our specifications.
We have also developed flexible designs and formats which range in size from approximately 200 sq. ft. to approximately 900 sq. ft. for kiosks, and in-line/food court configurations with flexible product offerings for non-traditional locations to maximize the opportunity and better respond to the need for stores with different configurations.
Franchising—Growth Strategy
Until the third quarter of fiscal 2008, our growth strategy for traditional stores had been focused on the development of new Company Stores. We have since shifted our focus and resources to place greater emphasis on the development of traditional and non-traditional Franchise Stores. We believe this franchise strategy will better position us for growth in market share, reduce capital outlays, provide better overall margins, allow us to open more stores at a faster pace, increase our brand presence to support other Company initiatives such as licensing and consumer products, and increase customer frequency.
For fiscal 2009, we opened two new Company Stores, and closed eight Company Stores. Franchisees opened 23 new Franchise Stores, closed seven Franchise Stores and, as described in greater detail below, purchased 27 Company Stores which are now operated as Franchise Stores in refranchising transactions.
During fiscal 2009 we opened our 31st university Franchise Store location and our eighth airport Franchise Store location and will continue to work with universities, airports and our franchise developers in an effort to open additional traditional and non-traditional locations across the nation. We anticipate minimal Company Store development in fiscal 2010, with growth being primarily driven by the opening of non-traditional Franchise Stores. In fiscal 2010, we also intend to expand the Jamba brand presence in additional venue types including healthcare facilities and sports and entertainment venues.
Following the end of fiscal 2009, we also entered into an agreement with Centerplate, Inc., a major hospitality company which could potentially give us access to open additional Franchise Stores in as many as 250 locations at a variety of managed sports and entertainment venues across the country. We will also continue to explore opportunities with new multi-unit developers and plan to open Franchise Stores in at least one international market.
7
Table of Contents
In recognition of our expanding franchise program, in fiscal 2009 we established a Franchise Advisory Counsel (“FAC”). The FAC formalizes a channel of communication through a representative group of franchisees to provide advice, counsel and input to us on important issues impacting the business.
Franchising—Our Franchising Program
Through our franchising program, we offer franchisees choices in store format and number of stores they wish to operate including (i) traditional store venues such as single store franchises, (ii) nontraditional store venues such as mall, university or airport locations and (iii) exclusive multi-unit license agreements in which the franchisee develops and operates a specified number of stores within a specified period of time within a specified geographic area, which we call area development agreements (as described in Franchising – Area Development Agreements below).
Our current traditional store franchise agreement provides for a renewable 10-year term. The agreement is renewable for two consecutive 10-year terms, subject to various conditions and state law. The royalty rate in the current franchise agreement is generally 5-6% of revenue, with franchisees required to contribute up to an additional 4% of revenue to a company-administered marketing fund. At the present time, in general, we are charging 2% of revenue as the marketing contribution for our traditional store franchisees. Franchisees are also expected to spend 1.5% of sales on local marketing efforts. There is typically up to a one-mile geographic radius restriction for traditional stores in non-downtown areas. The royalty rates and marketing contributions for non-traditional stores vary depending upon type (airport, college or university or supermarket).
Franchisees typically pay an initial fee ranging from $5,000-$15,000 for non-traditional store locations up to $25,000 for traditional store locations. We generally do not provide any form of financing to our franchisees, but we may consider facilitating financing for potential franchisees in the future.
Franchising—Area Development Agreements
From time to time we enter into area development agreements or multi-unit license agreements with franchisees who want to operate multiple store locations. Area developers typically enter into a separate franchise agreement for each store opened. Under typical multi-unit license agreements, the area developer generally pays one-half of a $25,000 initial fee, or $12,500, for each store required to be developed upon execution of the multi-unit development agreement as a development fee. Area developers are obligated to finance their own build-out of each store location according to our specifications and generally receive a one-mile territory surrounding each store.
As of December 29, 2009, we had two multi-unit area developers who have the right to develop additional franchise stores pursuant to multi-unit license agreements, which they may choose not to exercise. The exclusive territories covered by these multi-unit area license agreements are (i) the Hawaiian Islands, and (ii) parts of Texas, Kansas and Missouri. Both developers have satisfied their development obligations and the development rights of our developer in the Texas, Kansas and Missouri areas will expire in April of 2010.
We also often enter into development agreements in connection with refranchising transactions (see below) where a purchaser of Company Stores also agrees to develop new Franchise Stores. As of December 29, 2009, we had one development agreement for three new Franchise Stores in the greater Portland, Oregon area as a result of a refranchising transaction. As we continue our refranchising efforts, we expect that the buyers, in the aggregate, will undertake development obligations to open as many as 100 additional new Franchise Stores.
We also continue to strengthen our relationships with food and beverage concessionaires operating at non-traditional venues such as universities, airports, and other retail and entertainment venues to help maximize our non-traditional franchise development.
8
Table of Contents
Franchising—Our Refranchising Initiative
In May 2009 we announced our refranchising initiative under which we stated our intent to sell existing Company Stores to new or existing franchisees who want to operate multiple store locations. We believe that our refranchising initiative will help accelerate growth and may also help us to achieve certain operational efficiencies. In June 2009, we obtained listing on the Small Business Administration, or SBA, Registry in connection with this effort. Inclusion in the SBA Registry may help qualified potential buyers to receive expedited SBA loans which could help facilitate the sale of additional Company Stores and the development of additional Franchise Stores.
Under this refranchising initiative we plan to complete the refranchising of up to 150 Company Stores to new or existing franchisees by the end of fiscal 2010. We also expect that many of the refranchising transactions will involve the buyers entering into area development agreements.
As we continue our refranchising efforts, we expect to realize a number of possible benefits including:
| • | generation of additional cash; |
| • | expansion of market share and accelerated growth of the brand outside of California; |
| • | achievement of a more balanced risk and financial profile; |
| • | improve long-term stockholder value and earnings growth for the Company; |
| • | potential reductions in total general and administrative expenses; and |
| • | acceleration of our growth as new area developers begin to fulfill their development obligations. |
We sold 27 Company Stores in three refranchising transactions during fiscal 2009 including the sale of eight stores to one of Jamba Juice Company’s original founders. Since the end of fiscal 2009, we have completed the sale of 20 additional stores in three separate refranchising transactions. Net proceeds generated by the sale of these 47 stores were $9.2 million. We are optimistic about the progress we are making in this initiative, despite significant economic headwinds facing Jamba Juice and the buyers alike. As we continue our refranchising efforts, we expect that the buyers, in the aggregate, will undertake development obligations to open as many as 100 additional Franchise Stores.
Franchising—Market Planning and Site Selection Process
Our market planning and site selection process is integral to the successful execution of our growth strategy. We have processes for identifying, analyzing, and assigning undeveloped markets for either Company Store or Franchise Store development. Once a market is selected, we carefully screen trade areas for demand based on demographic, psychographic and Jamba Juice specific variables to assess the risk of developing a store or permitting a franchisee to do so. We review trade areas to ensure that they meet our guidelines for new store development and begin the site selection or approval process. Once a trade area is approved, we carefully screen prospective locations for visibility, traffic patterns, ease-of-use and co-tenancy for potential Company Store and Franchise Store locations. Our expansion strategy involves using this market planning and site selection process to leverage areas of demand within each market. We intend to use this approach to encourage the clustering of stores in specific geographic areas of demand, which we believe will drive brand awareness, improve operating and marketing efficiencies for Franchise Stores while leveraging the costs associated with regional supervision. Distribution efficiencies can also be realized through this strategy. In addition, we believe the ability to hire qualified team members is enhanced in markets where we are well known.
Building a Consumer Products Growth Platform
We believe there is untapped potential to extend the Jamba brand into the retail consumer packaged goods market. In fiscal 2009, we signed five separate license agreements covering the production of a Jamba Juice
9
Table of Contents
children’s toy blender, frozen novelty bars, a line of apparel and bags, make-at-home smoothie kits and a variety of trail mixes. In 2010 we hope to finalize a new concept to support the re-launch of a Jamba-branded ready-to-drink beverage at retail store locations under our relationship with Nestlé. We continue to have discussions with potential licensees regarding other product categories that we believe are a good fit with the Jamba brand. Examples include fruit teas, fruit yogurt and parfaits, frozen smoothie bars and sorbets, breakfast and energy bars and packaged boosts. Our goal is to extend our product offerings outside of our Jamba Juice stores to not only generate revenue, but also to expand the brand accessibility and product usage occasions available to consumers. To support and optimize this extension, we may structure these relationships in a variety of ways, such as licensing agreements, joint venture agreements, co-packing agreements, and sales and distribution agreements.
We are pleased with the reception of these licensing opportunities we have seen so far from our existing licensees and we continue to work with other potential licensees to expand this platform. We expect to announce additional licenses or other arrangements during fiscal 2010.
Continuing to Implement a Disciplined Expense Reduction Plan
This strategic priority involves all aspects of our system to improve store-level profitability and returns for Company Store and Franchise Stores alike. The plan is focused on a number of initiatives, including reductions in costs of goods sold, labor savings from operational simplification, improved wage and benefit management, the implementation and optimization of a labor planning system, rent and occupancy savings, improved management of controllable costs related to better cost controls and processes and the negotiation of service contracts and more effective and efficient brand communication. We expect our general and administrative expenses to continue to decrease as we implement the strategic initiatives described above, continue to improve our processes and systems and become more franchise focused.
Store Operations
Store Management
Our field and store operations team is the foundation for our performance and is vital to the Company’s long-term growth. We recruit and retain leaders with broad experience in management and our industry. We support our store operations with a combination of Regional Directors of Operations, Area District Managers (instituted in fiscal 2009) and District Managers. We also help support our Franchise Stores with franchise regional consultants who perform in similar capacities.
Our typical store operations team consists of a combination of an Area General Manager (instituted in fiscal 2009) or General Manager at each store, two to four Shift Managers and approximately 10 to 20 front line team members depending on the time of year. We are evaluating opportunities to further optimize our labor planning algorithms further to achieve optimal staffing levels throughout the day which may help us reduce staffing costs at certain stores under certain circumstances.
Maintaining our culture, in Company Stores as well as Franchise Stores, is also essential as we continue to expand, and we believe that it is critical to developing our brand and ensuring our continued success. We believe team members are the key to our success and that our culture fosters personal interaction, mutual respect, trust, empowerment, enthusiasm and commitment.
Training
We conduct various training programs for team members, support center staff and our leadership team. We are dedicated to providing a meaningful experience for all team members, with ample opportunity to develop leadership skills as they move up through the organization. Our training programs include formal programs such as the Manager-in-Training programs for new managers and the more informal one-on-one discussions held
10
Table of Contents
between General Managers, District Managers and Regional Directors of Operations. In fiscal 2009, we began building an online training program for Shift Managers that will be implemented in fiscal 2010. We updated our back-of-house systems to successfully be able to deliver this media in-store. All of our training programs have been updated to reinforce the importance of strong customer service and sales skills and we will use a station based training approach in the future which we believe will help optimize skill set development and resource utilization in our stores. The goal of all the programs was to shorten the learning curve while creating greater confidence in order to achieve success through strong performance and results. We also make training materials and best practice information available to our franchisees to help preserve a singular culture within all of the stores that comprise our system.
Recruiting and Retention
We carefully screen potential team members to ensure that they hold many of our core values and fit into our culture. By maintaining this emphasis and encouraging responsibility and accountability at every level, we believe that we have created a sense of team member loyalty and an open and interactive work environment, resulting in a highly passionate workforce. Our team members are paid competitive wages and are offered opportunities for advancement. In addition to competitive wages, store managers are eligible for performance-based bonuses. We also provide best practice information, qualifications and other information to our franchisees to assist them with hiring and retention and to preserve a singular culture within the stores that comprise our system.
Advertising and Marketing
Our marketing strategy focuses on promoting Jamba Juice as a healthy, active lifestyle brand for consumers who prefer not to sacrifice taste or quality. Marketing efforts are primarily concentrated on creating local buzz that will generate positive word-of-mouth, an approach we call “owning the two-mile radius” around our stores. We also use social media outlets to encourage greater frequency of visits from existing customers and to drive trial and awareness among potential new customers. Consistent with the origins of our brand, we also engage local non-profits and community organizations to drive brand awareness, trial and usage frequency among their members.
Each store, whether a Company Store or Franchise Store, contributes 2% of sales to a national marketing fund and is also expected to spend 1.5% of sales on local marketing efforts. In addition, the Company is exploring the creation of regional advertising cooperatives to further develop regional advertising initiatives. From time to time we engage in marketing campaigns to enhance national brand awareness. We may in the future use print, radio, email, online and other advertising media in furtherance of this goal.
From time to time we also benefit from national media attention relating to some of our programs. Historically, we have not engaged in any mass media marketing programs; nevertheless, we have been featured in stories appearing in The Wall Street Journal and a host of local newspapers and magazines. We have also received product placement in television shows and feature films. Our participation in local fundraising events also helps capture a significant amount of coverage from local television stations.
Product Supply
We are committed to providing only the finest smoothies, juices and other food products. Smoothie and juice products depend heavily upon supplies of fresh and individually quick frozen (“IQF”) fruit. The quality of each smoothie depends to a large degree on the quality of the basic fruit ingredients from which it is made. It is therefore essential that the supply of fruit is of the highest quality and is consistent throughout the year. To achieve these dual goals we purchase our projected requirements for the coming year of a given type of fruit from suppliers at the height of the season for that particular fruit. The supply and price of fresh and IQF fruit are dependent upon the supply and demand at the time of purchase and are subject to significant volatility. Supply
11
Table of Contents
and price can be affected by multiple factors in the producing regions, including weather, natural disasters and regional political and economic conditions. In addition, as we continue to grow, we will likely become more dependent upon global fruit supplies than we have in the past, which could allow natural disasters and global political and economic conditions to have a greater effect on the supply and price of our fruit ingredients and our profitability.
Southwest Traders, Inc. is a distributor of proprietary products to our Company Stores and Franchise Stores. Southwest Traders distributed ingredients that made up approximately 75% of cost of goods for Jamba Juice Company during fiscal 2009. Southwest Traders does not manufacture or negotiate pricing agreements for products sold in our stores. They serve solely in a warehousing and distribution capacity. In addition, the items in our “grab-and-go” food portfolio are supplied to us by a single supplier using regional co-packers and distributed to our system stores by a multiple distributors.
Competition
The retail food and beverage industry is highly competitive and fragmented. Restaurants compete based on a number of factors, including quality, price-value relationships, customer service, name recognition, employee hiring and retention and location. We compete with a variety of purveyors of quick, convenient food and beverage products, including quick service restaurants/fast food establishments, coffee shops, donut shops and grocery stores. While competition in the food and beverage market is fragmented, competition is increasing, and a major competitor with substantially greater resources than the Company could enter the market at any time and compete directly against Jamba Juice stores.
We compete most directly with regional smoothie stores, most of which are franchises of other smoothie brands. The rising popularity of convenient and healthy food items may result in increased competition from non-smoothie retailers as they increase their offerings of smoothies and other juice-related products, and as we increase our food offerings we will be placing ourselves into direct competition with other quick serve food concepts with well established businesses.
In addition, we also face intense competition from both restaurants and other specialty retailers for suitable sites for new stores and qualified personnel to operate both new and existing stores. There can be no assurance that the Company or our franchisees will be able to continue to secure adequate sites at acceptable rent levels or that the Company or franchisees will be able to attract a sufficient number of qualified personnel to operate our stores.
Government Regulation and Environmental Matters
Government Regulation. We are subject to extensive and varied federal, state and local government regulation, including regulations relating to public health and safety and zoning codes. We operate each of our stores in accordance with standards and procedures designed to comply with applicable codes and regulations. However, if we could not obtain or retain food or other licenses, it would adversely affect our operations. Although we have not experienced, and do not anticipate, any significant difficulties, delays or failures in obtaining required licenses, permits or approvals, any such problem could delay or prevent the opening of, or adversely impact the viability of, a particular store or group of stores.
California and other states and local jurisdictions have enacted laws, rules, regulations and ordinances which may apply to the operation of a Company Store, including those which (a) establish general standards, specifications and requirements for the construction, design and maintenance of the store premises; (b) regulate matters affecting the health, safety and welfare of our customers, such as general health and sanitation requirements for restaurants; employee practices concerning the storage, handling, cooking and preparation of food; special health, food service and licensing requirements; restrictions on smoking; exposure to tobacco
12
Table of Contents
smoke or other carcinogens or reproductive toxicants and saccharin; availability of and requirements for public accommodations, including restrooms; (c) set standards pertaining to employee health and safety; (d) set standards and requirements for fire safety and general emergency preparedness; (e) regulate the proper use, storage and disposal of waste, insecticides and other hazardous materials; (f) establish general requirements or restrictions on advertising containing false or misleading claims, or health and nutrient claims on menus or otherwise, such as “low calorie”, “fat free” or “organic”; (g) establish requirements concerning withholdings and employee reporting of taxes on tips and (h) regulate or ban the use of polystyrene cups.
In order to develop and construct more stores, we or our franchisees need to comply with applicable zoning, land use and environmental regulations. Federal and state environmental regulations have not had a material effect on our operations to date, but more stringent and varied requirements of local governmental bodies with respect to zoning, land use and environmental factors could delay or even prevent construction and increase development costs for new stores. We and our franchisees are also required to comply with the accessibility standards mandated by the U.S. Americans with Disabilities Act, which generally prohibits discrimination in accommodation or employment based on disability. We may, in the future, have to modify stores, for example, by adding access ramps or redesigning certain architectural fixtures, to provide service to or make reasonable accommodations for disabled persons. While these expenses could be material, our current expectation is that any such action will not require us to expend substantial funds.
We are subject to the U.S. Fair Labor Standards Act, the U.S. Immigration Reform and Control Act of 1986 and various federal and state laws governing various matters including minimum wages, overtime and other working conditions. We pay a significant number of our hourly staff at rates consistent with but higher than the applicable federal or state minimum wage. Accordingly, increases in the minimum wage would increase our labor cost. We are also subject to various laws and regulations relating to our current and any future franchise operations. See “Risk Factors—Governmental regulation may adversely affect our ability to open new stores or otherwise adversely affect our existing and future operations and results.”
We are also subject to various federal and state laws that regulate the offer and sale of franchises and aspects of the licensor-licensee relationships. Many state franchise laws impose restrictions on the franchise agreement, including the duration and scope of non-competition provisions, the ability of a franchisor to terminate or refuse to renew and the ability of a franchisor to designate sources of supply. The Federal Trade Commission, or the FTC, and some state laws also require that the franchisor furnish to prospective franchisees a franchise disclosure document that contains prescribed information and, in some instances, require the franchisor to register the franchise offering.
Environmental Matters. We are subject to federal, state and local environmental laws and regulations concerning the use of polystyrene products, and several counties in which our stores are located have already banned the use of our polystyrene cups. As more state and local governments take actions to preserve the environment we may be subject to further bans on the use of polystyrene cups. A federal ban on the use of polystyrene cups would force us to eliminate the use of polystyrene products system wide. We are actively exploring economically viable alternatives to polystyrene cups, that can provide the same quality and integrity of our frozen smoothies to ensure customer satisfaction.
During fiscal 2009, however, we launched our eco-sustainability initiative focused on waste reduction, increasing the use of recyclable products and utilizing more organic ingredients. We have also introduced green initiatives including the introduction of more environmentally friendly packaging for our products and the launch of several optimization programs to reduce waste. Among the packaging improvements made to date are the introduction of new cup carriers, oatmeal cups and lids, breakfast clear cups and lids, spoons and napkins that are made from recycled material. We have also reduced the amount of corrugated cardboard used for bulk shipping, reduced labeling requirements, and reduced freight resulting in lower fuel emissions.
13
Table of Contents
Trademarks and Domain Names
The Company owns and/or has applied to register numerous trademarks and service marks in the United States and in other jurisdictions covering more than 50 additional countries throughout the world. Some of the Company’s trademarks, including Jamba Juice® and the Jamba logo are of material importance to the Company. The duration of trademark registrations varies from country to country. However, trademarks are generally valid and may be renewed indefinitely as long as they are in use and/or their registrations are properly maintained. In addition, the Company has registered and maintains numerous Internet domain names, including “jamba.com” and “jambajuice.com.”
Management Information Systems
Each Company Store has computerized point-of-sale registers which collect transaction data used to generate pertinent information, including sales transactions and product mix. Additionally, the point-of-sale system is used to authorize, batch and transmit credit card data. All product prices are programmed into the point-of-sale register from the Company’s corporate office. Franchise Stores generally use the same point-of-sale registers as Company Stores, but may elect to use alternative systems provided certain information is provided to the Company. Franchisees set their own menu prices.
Company Stores use the Company’s licensed labor scheduling and food cost management software to record employee time clock information, schedule labor, improve inventory management and provide management reports.
We believe the current point-of-sale register system is adequate to support our expansion needs.
Seasonality
Our business is highly subject to day-to-day volatility based on weather and varies by season. A significant portion of the Company’s revenue is realized during the second and third quarters of the fiscal year, which include the summer months. The fourth quarter of the fiscal year, which encompasses the winter months and the holiday season, has traditionally been our lowest revenue volume quarter. Although we have expanded the number of stores offering our hot oatmeal, “grab-and-go” food and California Flatbread selections and we recently announced the launch of our Hot Blends beverage platform to help offset the seasonal nature of our business, our business will likely continue to be subject to seasonal patterns for the foreseeable future, given that the largest portion of our sales continues to be from the sale of smoothies during the warmer parts of the year. Because of the seasonality of the business, results for an individual quarter are not necessarily indicative of the results which may be achieved for the full fiscal year.
Executive Officers
Company executive officers, their respective ages and positions as of December 29, 2009 and descriptions of their business experience are set forth below. There are no family relationships among any of the executive officers named below.
James D. White, age 49
Mr. White joined Jamba Juice Company as its President and Chief Executive Officer in December 2008. Previously, Mr. White was Senior Vice President of Consumer Brands for Safeway, Inc. with responsibility for brand strategy, innovation, manufacturing and commercial sales from 2005 to 2008. Prior to Safeway, Mr. White was Senior Vice President of Business Development, North America at the Gillette Company, where his responsibilities included Centralized Marketing, Sales, Retail Execution, Marketing Planning and Canadian Operations from 2002 to 2005. Mr. White also held executive and management roles with Nestlé Purina from
14
Table of Contents
1987 to 2005, including Vice President, Customer Interface Group from 1999 to 2002 and Vice President, Customer Development East from 1997 to 1999.
Karen L. Luey, age 48
Ms. Luey joined Jamba Juice Company as its Vice President, Controller and Principal Accounting Officer in April 2007 and has been Jamba Juice Company’s Senior Vice President and Chief Financial Officer since August 2008 with responsibility for Finance and Accounting, Investor Relations, Strategy and Planning, Information Technology, Risk Management and Loss Prevention. Previously, Ms. Luey was Vice President, Corporate Controller, and Principal Accounting Officer of LeapFrog Enterprises, located in Emeryville, California from 2005 to 2007. Prior to LeapFrog, Ms. Luey was with Sharper Image Corporation in San Francisco, California from 1990 to 2005 in increasingly responsible positions including serving as Vice President, Finance and Controller from 2000 to 2005.
Steve Adkins, age 44
Mr. Adkins has been Jamba Juice Company’s Senior Vice President, Company Operations since July 2008. Mr. Adkins previously served as Jamba Juice Company’s Zone Vice President, East Zone beginning in 2005, and joined Jamba Juice Company in 2002 as a Regional Director of Operations for the Midwest. Previously, Mr. Adkins was with Fresh Choice from 1991 to 2002, departing as Senior Vice President of Operations.
Thibault de Chatellus, age 50
Mr. de Chatellus joined Jamba Juice Company as Senior Vice President, International in May 2007 and became its Senior Vice President, Global Franchise, Development and Operations Services in August 2008. Previously, Mr. de Chatellus served as an independent consultant in Dallas, Texas, focusing on business development strategies in international markets from 2005 through 2007. Prior to consulting, he held several senior executive positions with Blockbuster, Inc. in Ft. Lauderdale, Florida and Dallas, Texas, including Senior Vice President and Category General Manager, Games from February 2003 through June 2005, Senior Vice President, Strategic Concepts from June 2001 through February 2003, Senior Vice President, Content and New Business Channels from April 2000 through June 2001, Senior Vice President, Latin America from September 1996 through April 2000.
Michael W. Fox, age 50
Mr. Fox joined Jamba Juice Company in February 2005 as Vice President, Legal Affairs and has been the Company’s Senior Vice President and General Counsel since August 2008 and has been Corporate Secretary since July 2005. From August 1999 until joining Jamba Juice Company, Mr. Fox was General Counsel and a co-founder of ProMost, Inc., an e-procurement company. From 1993 to July 1999, Mr. Fox was Senior Vice President, Business Affairs and General Counsel of Sony Signatures, Inc., the entertainment merchandising and merchandise licensing company of Sony Corporation of America.
Gregory A. Schwartz, age 45
Mr. Schwartz joined Jamba Juice Company in August 2007 as Vice President, Supply Chain and has been Jamba Juice Company’s Senior Vice President, Supply Chain, since September 2008. Previously, Mr. Schwartz worked at WalMart Stores, Inc., where he served as Vice President, Global Procurement from 2007 until joining Jamba Juice Company. Prior to WalMart, Mr. Schwartz was with Safeway, Inc. from 1999 to 2006 in increasingly responsible positions, including Vice President, Strategic Global Sourcing and Business Development (Blackhawk Network) from 2005 to 2006, Vice President, Strategic Sourcing and Materials Management and Senior Vice President, Omnibrand Sales from 2003 to 2005, and Director, Smart Sourcing Procurement and Senior Vice President, Omnibrand Sales from 1999 to 2003. From 1989 to 1999, Mr. Schwartz held increasingly responsible positions in the strategic sourcing group at Kraft Foods.
15
Table of Contents
Susan H. Shields, age 49
Susan H. Shields joined Jamba Juice Company as Vice President of Consumer Products, Licensing, and Growth initiatives in January of 2009 and has been Jamba Juice Company’s Senior Vice President and Chief Marketing Officer, responsible for the Company’s consumer products licensing strategy and brand extension since November 2009. Ms. Shields has over 20 years of strategic leadership experience in marketing, brand and product development, innovation and business development within the retail and consumer packaged goods food industries with an emphasis on the development of better-for-you food offerings. Prior to joining Jamba Juice, Ms. Shields was Senior Vice President of Innovation and Product Development at Beautifull, Inc. during 2008. From 2006 to 2007, Ms. Shields was Group Vice President of Innovation at Safeway where she was responsible for the growth of the Safeway’s billion dollar innovation pipeline within their consumer branded business. From 2000 to 2006, she served as Vice President and Senior Vice President of New Ventures and Marketing at Del Monte Foods and from 1987 to 1999 she held numerous positions within the Quaker Oats Company.
Employees
As of December 29, 2009, we employed approximately 8,000 persons, approximately 180 of whom were at our corporate offices or part of our field support and operations. The remainder of the employees were store management and hourly store personnel. The Company also hires a significant number of seasonal employees during its peak selling season during the Spring and Summer. Our employees are not covered by a collective bargaining agreement. We consider our employee relations to be good. We place a priority on staffing our stores and support center positions with skilled team members who embrace our culture and invest in training programs to ensure the quality of our store operations.
Available Information
Our Annual Reports on Form 10-K, Quarterly Reports on Form 10-Q, Current Reports on Form 8-K and amendments to reports filed or furnished pursuant to Sections 13(a) and 15(d) of the Securities Exchange Act of 1934, as amended, are available on our website at http://ir.jambajuice.com, free of charge as soon as reasonably practicable after we electronically file such reports with, or furnish those reports to, the Securities and Exchange Commission (the “SEC”). The SEC also maintains an Internet site that contains reports, proxy and information statements, and other information that we file electronically with the SEC at http://www.sec.gov. The public may also read and copy any materials that we file with the SEC at the SEC’s Public Reference Room at 450 Fifth Street, NW, Washington, DC 20549. Investors may obtain information on the operation of the SEC Public Reference Room by calling the SEC at 1-800-SEC-0330. Our Corporate Governance Principles and Practices, Board of Directors committee charters (including the charters of the Audit Committee, Compensation and Executive Development Committee and Nominating and Governance Committee) and our code of ethics entitled “Code of Business Conduct and Ethics” also are available at that same location on our website. Information on our website is not incorporated into this annual report. Stockholders may request free copies of these documents from:
Jamba, Inc.
c/o ICR, Inc.
441 Lexington Avenue, 4th Floor
New York, NY
(646) 277-1212
investors@jambajuice.com
We included the certifications of the Chief Executive Officer and the Chief Financial Officer of Jamba, Inc. relating to the quality of our public disclosure, as required by Section 302 of the Sarbanes-Oxley Act of 2002 and related rules, in this Annual Report on Form 10-K as Exhibits 31.1 and 31.2 hereto.
16
Table of Contents
| ITEM 1A. | RISK FACTORS |
Set forth below and elsewhere in this report and in other documents we file with the SEC are descriptions of the risks and uncertainties that could cause our actual results to differ materially from the results contemplated by the forward-looking statements contained in this report.
RISKS RELATED TO OUR BUSINESS
We may not be successful in implementing our strategic priorities, which may have a material adverse impact on our business and financial results.
In fiscal 2009 we set out to implement the strategic priorities under our BLEND Plan that we believed necessary to revitalize the Company for future growth and long-term stockholder value, including:
| • | building a customer first operationally focused service culture; |
| • | building a retail food capability across all four day parts (breakfast, lunch, afternoon and dinner); |
| • | accelerating the development of franchise and non-traditional stores; |
| • | building a consumer products growth platform; and |
| • | continuing to implement a disciplined expense reduction plan. |
There can be no assurance that we will be able to successfully implement these strategic priorities or whether these strategic priorities will be successful, and a failure of either could impede our growth and operating results.
We have a history of net losses and may incur losses in the future.
We have incurred net losses in each of the last three fiscal years. We may continue to incur net losses in the future and we cannot assure you that we will achieve or sustain profitability.
A worsening of economic conditions, a decrease in consumer spending, or a change in the competitive conditions in this market may substantially decrease our revenues and may adversely impact our ability to implement our business strategy.
Our success depends to a significant extent on discretionary consumer spending, which is influenced by general economic conditions and the availability of discretionary income. In 2009, we continued to see many consumers facing steep mortgage payments, tightening credit and rising energy and food prices, which adversely affected consumer spending. Accordingly, we may experience continuing declines in revenue during economic turmoil or during periods of uncertainty. Any material decline in the amount of discretionary spending, leading cost-conscious consumers to be more selective in restaurants visited, could have a material adverse effect on our revenue, results of operations, business and financial condition.
Our inability to compete with the many food services businesses may result in reductions in our revenue and operating margins.
We compete with many well-established companies, food service and otherwise, on the basis of taste, quality and price of product offered, customer service, atmosphere, location and overall guest experience. Our success depends, in part, upon the popularity of our products and our ability to develop new menu items that appeal to consumers across all four day parts. Shifts in consumer preferences away from our products, our inability to develop new menu items that appeal to consumers across all day parts, or changes in our menu that eliminate items popular with some consumers could harm our business. We compete with other smoothie and juice bar retailers, specialty coffee retailers, yogurt and ice cream shops, bagel shops, fast-food restaurants, delicatessens, cafés, take-out food service companies, supermarkets and convenience stores. Our competitors change with each of the four day parts, ranging from coffee bars and bakery cafés to casual dining chains.
17
Table of Contents
Aggressive pricing by our competitors or the entrance of new competitors into our markets could reduce our revenue and operating margins. We also compete with other employers in our markets for hourly workers and may become subject to higher labor costs as a result of such competition.
We are subject to risks associated with climate change and climate change regulation.
Laws and regulations regarding climate change, energy usage and emissions controls may impact the Company directly through higher cost of goods. The potential impacts of climate change and climate change regulations are highly uncertain at this time, and the Company cannot anticipate or predict the material adverse effect on its consolidated financial condition, results of operations or cash flows as a result of climate change and climate change regulations.
Our revenue is subject to volatility based on weather and varies by season.
Seasonal factors cause our revenue to fluctuate from quarter to quarter. Our revenue is typically lower during the winter months and the holiday season and during periods of inclement weather (because fewer people choose cold beverages) and higher during the Spring, Summer and Fall months (for the opposite reason).
Fluctuations in various food and supply costs, particularly fruit and dairy, could adversely affect our operating results.
Supplies and prices of the various products that we use to prepare our offerings can be affected by a variety of factors, such as weather, seasonal fluctuations, demand, politics and economics in the producing countries. These factors subject us to shortages or interruptions in product supplies, which could adversely affect our revenue and profits. In addition, the prices of fruit and dairy, which are the main products in our offerings, can be highly volatile. The fruit of the quality we seek tends to trade on a negotiated basis, depending on supply and demand at the time of the purchase. An increase in pricing of any fruit that we use in our products could have a significant adverse effect on our profitability. In addition, higher diesel and gasoline prices may affect our supply or transportation costs and may affect our revenue going forward. Although we attempt to help mitigate the risks of volatile commodity prices and allow greater predictability in pricing by entering into fixed price or to-be-fixed priced purchase commitments for a portion of our fruit and dairy requirements, we cannot assure you that these activities will be successful or that they will not result in our paying substantially more for our fruit supply than would have been required absent such activities. Declines in sales may also adversely affect our business to the extent we have long-term purchase commitments in excess of our needs.
We are primarily dependent upon one supplier for a significant amount of our food distribution.
We maintain food distribution contracts primarily with one supplier. This supplier, Southwest Traders, Inc., provided approximately 75% of our cost of goods for fiscal 2009, and 81% of cost of goods for each of our fiscal years 2008 and 2007, which potentially subjects us to a concentration of business risk. If this supplier had operational problems, our operations could be adversely affected.
We may face difficulties entering into new or modified arrangements with existing or new suppliers or new service providers.
If we expand our operations into new geographic areas through new Company Stores or Franchise Stores or introduce new products with special manufacture, storage or distribution requirements, we may have to seek new suppliers and service providers or enter into new arrangements with existing ones. We may also encounter difficulties or be unable to negotiate pricing or other terms as favorable as those we currently enjoy, which could harm our business and operating results.
Our business could be adversely affected by increased labor costs or labor shortages.
Labor is a primary component in the cost of operating our business. We devote significant resources to recruiting and training our team members. A considerable number of the team members employed by us and our
18
Table of Contents
franchisees are paid at rates related to the federal minimum wage. In 2008, the federal minimum wage increased from $5.85 to $6.55 and it increased again in 2009 to $7.25. Additionally, many of our team members work in stores located in states where the minimum wage is greater than the federal minimum and receive compensation equal to the state’s minimum wage. During 2009, we were affected by state minimum wage increases in Illinois, Oregon and Washington, which were all above the federal minimum wage. In addition, the city of San Francisco has a minimum wage requirement greater than the State of California and the Federal minimum which increased again during fiscal 2009. Any further increases in the federal minimum wage or the enactment of additional state or local minimum wage increases will increase labor costs. If we are unable or unwilling to increase our menu prices or take other actions to offset increased operating costs, our operating results could suffer. Additionally, competition and labor shortages in various markets could result in higher required wage rates.
Our ability to utilize our tax attributes may be limited by an “ownership change.”
Our ability to use our tax attributes, such as our U.S. federal income tax net operating loss carryforwards and our tax credit carryforwards, may be substantially restricted if we have had in the past, or have in the future, an “ownership change” as defined in Section 382 of the U.S. Internal Revenue Code. An ownership change occurs if increases in the percentage of our stock held by “5-percent shareholders” (within the meaning of Section 382, with certain public groups treated as 5-percent shareholders) collectively exceed more than fifty percent, comparing the lowest percentage of stock owned by each 5-percent shareholder at any time during the testing period (which is generally a three year rolling period) to the percentage of stock owned by the 5-percent shareholder immediately after the close of any owner shift testing date. Our recent sale of Series B Preferred Stock, or prior trading in our stock by stockholders, may have caused an ownership change. It is possible that future trading in our stock may cause a future ownership change, resulting in an annual limitation on utilization of our tax attributes. If our tax attribute usage is subject to limitation and if we are profitable, our future cash flows could be adversely affected due to our increased tax liability.
We are subject to all of the risks associated with leasing space subject to long-term non-cancelable leases.
We and our franchisees compete for real estate and our or their inability to secure appropriate real estate or lease terms could impact our respective abilities to grow. Our leases generally have initial terms of between five and 15 years, and generally can be extended only in five-year increments if at all. All of our leases require a fixed annual rent, although some require the payment of additional rent if store revenue exceeds a specified amount. Generally, our leases are “net” leases, which require us to pay all of the cost of insurance, taxes, maintenance and utilities. We generally cannot cancel these leases. If an existing or new store is not profitable, and we decide to close it, as we have done in the past and may do in the future, we may nonetheless be committed to perform our obligations under the applicable lease including, among other things, paying the base rent for the balance of the lease term. Current locations of our stores and franchised locations may become unattractive as demographic patterns change. In addition, as each of our leases expire, we may fail to negotiate renewals, either on commercially acceptable terms or at all, which could require us to close stores in desirable locations.
Our business and results may be subject to disruption from work stoppages, terrorism or natural disasters.
Our operations may be subject to disruption for a variety of reasons, including work stoppages, acts of war, terrorism, pandemics, fire, earthquake, flooding or other natural disasters. In particular, our corporate offices and support center is located in Northern California, near known earthquake fault lines. If a major earthquake or other natural disaster were to occur in Northern California, our corporate offices and support center may be damaged or destroyed. Such a disruption could result in the temporary or permanent loss of critical data, suspension of operations, delays in shipments of product, and disruption of business in both the affected region and nationwide, which would adversely affect our revenue and results of operations.
19
Table of Contents
The unexpected loss of one or more members of our executive management team could adversely affect our business.
We have experienced significant changes in our executive management team since fiscal 2008, including the departure of our chief executive officer, chief financial officer, chief marketing officer, senior vice president of operations, and senior vice president of development. We have a relatively new chief executive officer, have internally promoted other members of the executive team, increased their responsibilities and hired additional management personnel from other companies in an effort to help revitalize our business during fiscal 2009. We believe that these individuals understand our operational strategies and new strategic priorities to revitalize our long-term growth and stockholder value. We have entered into employment agreements with each of our executive officers, but we cannot make any assurances that we can retain these individuals for the period necessary for us to achieve and sustain profitability. Competition for personnel in our industry is strong and the ability to retain key employees during a revitalization effort can be difficult. The unexpected future loss of services of one or more members of our executive management team could have a disruptive and adverse effect on our business. If we are unable to retain key executive officers, then it may be difficult for us to maintain a competitive position within our industry or implement our strategic priorities.
Our growth strategy depends on increasing franchise ownership.
There were 478 Company Stores and 261 Franchise Stores open as of December 29, 2009. Our current growth strategy is to transition from a Company Store model to one of growth fueled by Franchise Store development. This strategy is subject to risks and uncertainties. We may not be able to identify franchisee candidates with appropriate experience and financial resources or to negotiate mutually acceptable agreements with them. Our franchisee candidates may not be able to obtain financing at acceptable rates and terms. New and existing franchisees may need additional loans to fund ongoing operations or to meet other obligations under their franchise agreements. Given the current economy and a persistently tight credit market, such loans or other credit terms may not be available to our franchisees on acceptable terms or at all. If prospective franchisees are not able to obtain the credit they need to start a business or if they and our existing franchisees are not able to obtain the credit they need to maintain ongoing operations, we may not be able to increase the percentage of franchised stores at the annual rate we desire or achieve the ownership mix of franchise stores to Company Stores that we desire within our planned timeframes or at all. If we are unable to increase franchise ownership as planned our results of operations may be harmed.
We are highly dependent on the financial performance of stores concentrated in certain geographic areas.
Our financial performance is highly dependent on stores located in California. Stores located in California comprise over 50% of our total system stores. In recent years California and other states have experienced significant economic impact due to the current economic climate. If geographic regions in which we have a high concentration of stores continue to experience significant economic pressures, our sales and operating results could be negatively impacted.
Expansion into new geographic markets may present increased risks.
Franchise growth is planned in new geographic areas in the United States and at least one international market for fiscal 2010. Our future results, and the results of new Franchise Stores, depend on various factors, including successful selection and expansion into these new geographic markets and market acceptance of the Jamba Juice experience. Those markets may have different competitive conditions, consumer tastes and discretionary spending patterns than from existing markets. As a result, those new stores may be less successful than stores in our existing markets. Consumers in a new market may not be familiar with the Jamba Juice brand, and we may need to build brand awareness in that market through greater investments in advertising and promotional activity than we originally planned. Franchisees may find it more difficult in new markets to hire, motivate and keep qualified employees who can project our vision, passion and culture. Stores opened in new
20
Table of Contents
markets may also have lower average store revenue than stores opened in existing markets, and may have higher construction, occupancy or operating costs than stores in existing markets. Furthermore, we may have difficulty in finding reliable suppliers or distributors or ones that can provide us, either initially or over time, with adequate supplies of ingredients meeting our quality standards. Revenue at stores opened in new markets may take longer to ramp up and reach expected revenue levels, and may never do so, thereby affecting our overall royalty income. As with the experience of other retail food concepts that have tried to expand nationally and internationally, we may find that the Jamba Juice concept has limited or no appeal to customers in new markets or we may experience a decline in the popularity of the Jamba Juice experience. Newly opened stores may not succeed, future markets and stores may not be successful and, even if we are successful, our average store revenue, and the royalty income generated therefrom, may not increase and may even decline.
We are also looking to expand our operations into international markets, which will expose us to new risks and uncertainties, including product supply, import/export limitations and regulations to which we are not currently bound and may not be currently set up to handle, consumer preferences, occupancy costs, operating expenses and labor and infrastructure challenges. If stores open in international markets and such stores are unable to source inventory locally, franchisees may be required to import inventory from our U.S. distributors and any resulting import duties, tariffs, transportation or other charges may disproportionately impact such stores’ cost of goods which could harm the viability of such stores. Finally, international operations have inherent risks such as foreign currency exchange rate fluctuations, the application and effect of local laws and regulations and enforceability of intellectual property and contract rights.
Termination or non-renewal of franchise agreements may disrupt store performance.
Each franchise agreement is subject to termination by us in the event of default by the franchisee after the applicable cure periods. Upon the expiration of the initial term of a franchise agreement, the franchisee generally has an option to renew for an additional term. There is no assurance that franchisees will meet the criteria for renewal or will desire or be able to renew their franchise agreements. If not renewed, a franchise agreement and payments required thereunder will terminate. We may be unable to find a new franchisee to replace such lost revenue. Furthermore, while we will be entitled to terminate franchise agreements following a default that is not cured within the applicable cure period, if any, the disruption to the performance of the stores could materially and adversely affect our business.
Our franchising strategy means we will become more dependent on franchisees for our success.
Several of our franchisees have been experiencing financial pressures, which, in certain instances, became more exacerbated during fiscal 2009. Our franchisees closed seven stores in fiscal 2009 and may close additional stores in the future. Royalty revenues are directly correlated to sales by Franchise Stores and, accordingly, Franchise Store closures have an adverse effect on our revenues, results of operations and cash flows. Furthermore, an insolvency or bankruptcy proceeding involving a franchisee could prevent us from collecting payments or exercising any of our other rights under the related franchise agreement.
Our re-franchising strategy may not be successful due to unfavorable economics, availability of credit for our buyers, the failure of royalty revenue to replace revenue available from Company Store sales or the failure of area developers to succeed in their obligations.
We are implementing a strategy to refranchise up to 150 Company Stores in certain geographic markets by the end of fiscal 2010. Given the current risks and financing challenges associated with becoming a franchisee of a restaurant retailer in the current economy, we cannot predict the likelihood of successfully refranchising any such markets or the amount of any proceeds that might be received therefrom, including the amounts that might be realized from the sale of store assets and from any related franchise agreements. Factors that affect whether a store or package of stores may be sold in a refranchising transaction include the availability of willing, qualified, suitable buyers for the Company Stores in question, whether the buyers will be willing to pay us what we believe is a fair price for such Company Stores and how quickly we are able to reach agreement on other terms of the
21
Table of Contents
refranchising transactions and consummate the sale. Buyers may need bank loans to finance all or a portion of their purchases and tight credit markets may make it more difficult for buyers to obtain these loans. Depending on the prices we ultimately receive in any given transaction, among other things, refranchising could result in the recognition of impairment losses on the related assets. Additionally, in certain instances, there may be change in control provisions in the lease which require us to get landlord consent for a refranchising transaction. Failure of a landlord to consent to the assumption of a lease from us by a franchisee, or to a sublease from us to a franchisee, could cause us to remain liable for such lease obligations or impair our ability to complete a transaction.
The conversion of a Company Store to a Franchise Store will reduce the total monthly revenue received by us from that store because we receive all of the revenue generated by a Company Store but receive only the royalty payments generated by Franchise Stores. While we expect the conversion of Company Stores to Franchise Stores to reduce or eliminate the unreimbursed operating costs we incur in connection with the operation of such store, the actual benefit realized from refranchising the store is uncertain and may be less than anticipated, and may not be sufficient to offset the loss of revenue from the conversion of the Company Store.
Upon completion of any refranchising transaction or our refranchising program as a whole, the success of each transaction and the refranchising program as a whole will depend upon, among other things, our buyers’ ultimate ability to effectively operate the stores they purchase, our ability to limit our exposure to contingent liabilities in connection with the sale of our stores and whether the resulting ownership mix of Company Stores and Franchise Stores will allow us to meet our financial objectives. Our existing management, infrastructure, financial, and other resources may be inadequate to support our franchise growth strategy. In addition, refranchising activity could vary significantly from quarter to quarter and such volatility could impact our reported earnings. Although we expect some buyers in our refranchising transactions to enter into area development agreements to develop and open additional stores, there is no guarantee that this will be a part of each or any transaction and there can be no guarantee that the franchisees will succeed in their efforts to open additional stores.
Our franchisees could take actions that harm our reputation and reduce our royalty revenue.
Franchisees are independent contractors and are not our employees. Further, we do not exercise control over the day-to-day operations of our Franchise Stores. Any operational or development shortcomings of our Franchise Stores, including their failure to comply with applicable laws, are likely to be attributed to our system-wide operations in the eyes of consumers and could adversely affect our reputation and have a direct negative impact on the royalty revenue we receive from those stores.
We could face liability from our franchisees and from government agencies.
A franchisee or government agency may bring legal action against us based on the franchisor/franchisee relationship. Various state and federal laws govern our relationship with our franchisees and our potential sale of a franchise. If we fail to comply with these laws, we could be liable for damages to franchisees, fines or other penalties. Expensive litigation with our franchisees or government agencies may adversely affect both our profits and our important relations with our franchisees.
Governmental regulation may adversely affect our ability to open new stores or otherwise adversely affect our existing and future operations and results.
We and our franchisees are subject to various federal, state and local regulations. Each of our stores is subject to state and local licensing and regulation by health, sanitation, food and workplace safety and other agencies. We and our franchisees may experience material difficulties or failures in obtaining the necessary licenses or approvals for new stores, which could delay planned store openings. In addition, stringent and varied requirements of local regulators with respect to zoning, land use and environmental factors could delay or prevent development of new stores in particular locations.
22
Table of Contents
Our operations are also subject to the U.S. Fair Labor Standards Act, which governs such matters as minimum wages, overtime and other working conditions, along with the U.S. Americans with Disabilities Act, family leave mandates and a variety of similar laws enacted by the states that govern these and other employment law matters. In recent years, there has been an increased legislative, regulatory and consumer focus on nutrition and advertising practices in the food industry. Establishments operating in the quick-service and fast-casual segments have been a particular focus, and compliance with additional regulations can become costly and affect our operating results.
Government mandatory healthcare requirements could adversely affect our profits.
The Company pays a substantial part of the healthcare benefits for team members at the General Manager level and above and for those working at the Company’s corporate office. Other team members can purchase more limited healthcare benefits. Legislation is being proposed at the federal and state levels mandating employers to either provide health care coverage to their employees or pay into a fund that would provide coverage for them. If this type of legislation is enacted in additional geographic areas where we do business, it could have an adverse effect on our profits.
Self-insurance plan claims could materially impact our results.
The Company is self-insured for team member healthcare and dental benefits. Liabilities associated with the risks that the Company retains are estimated in part, by considering historical claims experience, demographic factors, severity factors, and other actuarial assumptions. The estimated accruals for these liabilities are based on statistical analyses of historical industry data as well as the Company’s actual historical trends. If actual claims experience differs from the Company’s assumptions, historical trends, and estimates, changes in the Company’s insurance reserves could materially impact our results of operations.
Our federal, state and local tax returns may, from time to time, be selected for audit by the taxing authorities, which may result in tax assessments, interest or penalties that could have a material adverse impact on our results of operations and financial position.
We are subject to federal, state and local taxes in the U.S. In making tax estimates and paying taxes, significant judgment is often required. Although we believe our tax positions and estimates are reasonable, if a taxing authority disagrees with the positions taken by the Company, we could have an additional tax liability, including interest and penalties. If material, payment of such additional amounts could have a material impact on our results of operations and financial position.
FINANCING AND LIQUIDITY RISKS
Insufficient cash flows from operations may adversely affect our financial condition.
In the past, cash flow from operations has at times been insufficient to cover capital expenditures. These results have had a negative impact on our financial condition. We believe the implementation of the strategic priorities under our BLEND Plan will lead to our ability to eventually improve cash flows and to eventually achieve and sustain profitability. Our primary sources of liquidity include cash on hand that is largely attributable to our sale of Series B-1 Convertible Preferred Stock and Series B-2 Convertible Preferred Stock (together, the “Series B Preferred”) in mid-2009, expected proceeds from refranchising transactions and expected availability of cash flows from operations. If we are unable to maintain sufficient working capital, we may be forced to further reduce operating expenses, borrow funds, sell business assets or take other actions, which could be detrimental to our business operations.
23
Table of Contents
RISKS RELATING TO INTELLECTUAL PROPERTY
We may not be able to adequately protect our intellectual property, which could harm the value of our brand and adversely affect our business.
Our intellectual property is material to the conduct of our business. Our ability to implement our business plan successfully depends in part on our ability to build further brand recognition using our trademarks, service marks, trade dress and other proprietary intellectual property, including our name and logos and the unique ambiance of our stores both domestically and overseas. We have secured the ownership and rights to our marks in the United States and have filed or obtained registrations for restaurant services in most other significant foreign jurisdictions. We undertake similar efforts to protect our brands in other relevant consumer product categories in relevant jurisdictions. If our efforts to protect our intellectual property are inadequate, or if any third party misappropriates or infringes on our intellectual property, the value of our store brand and our consumer products brands may be harmed, which could have a material adverse effect on our business. While we have not encountered claims from prior users of intellectual property relating to restaurant services in areas where we operate or intend to conduct material operations in the near future, there can be no assurances that we will not encounter such claims. If so, this could harm our image, brands or competitive position and cause us to incur significant penalties and costs.
The Company’s success depends on the value of the Jamba Juice and Jamba brands.
The Jamba Juice brand practice is to inspire and simplify healthy living. We believe we must preserve and grow the value of the Jamba Juice brand in order to be successful in building our business and particularly in building a consumer products growth platform primarily under the Jamba brand. Brand value is based in part on consumer perceptions and the Jamba Juice brand has been highly rated in several brand studies. We intend to reinforce and extend these perceptions for the Jamba brand to help support our licensing efforts. Our brand building initiatives involve increasing our product offerings, opening new Franchise Stores and entering into licensing arrangements to increase awareness of our brands and create and maintain brand loyalty. If our brand building initiatives are unsuccessful, or if business incidents occur which erode consumer perceptions of our brand, then the value of our products may diminish and we may not be able to implement our business strategy.
RISKS RELATED TO THE FOOD SERVICE BUSINESS
Litigation and publicity concerning food quality, health and other issues can result in liabilities, increased expenses, distraction of management and can also cause customers to avoid our products, which could adversely affect our results of operations, business and financial condition.
Food service businesses can be adversely affected by litigation and complaints from customers or government authorities resulting from food quality, allergens, illness, injury or other health concerns or operating issues stemming from one retail location or a limited number of retail locations. Adverse publicity about these allegations may negatively affect us, regardless of whether the allegations are true, by discouraging customers from buying our products.
Our customers occasionally file complaints or lawsuits against us alleging that we are responsible for some illness or injury they suffered at or after a visit to our stores, or that we have problems with food quality or operations. We are also subject to a variety of other claims arising in the ordinary course of our business, including personal injury claims, contract claims and claims alleging violations of federal and state law regarding workplace and employment matters, discrimination and similar matters, and we could become subject to class action or other lawsuits related to these or different matters in the future. Regardless of whether any claims against us are valid, or whether we are ultimately held liable, claims may be expensive to defend and may divert time and money away from our operations and hurt our performance. A judgment significantly in excess of our insurance coverage, or for which we are not covered by insurance, could materially and adversely affect our financial condition or results of operations. Any adverse publicity resulting from these allegations may also materially and adversely affect our reputation or prospects, which in turn could adversely affect our results.
24
Table of Contents
In addition, the food services industry has been subject to a growing number of claims based on the nutritional content of food products they sell, and disclosure and advertising practices. We may also be subject to this type of proceeding in the future and, even if not, publicity about these matters (particularly directed at the quick-service and fast-casual segments of the industry) may harm our reputation or prospects and adversely affect our results.
Food safety concerns and instances of food-borne illnesses could harm our customers, result in negative publicity and cause the temporary closure of some stores and, in some cases, could adversely affect the price and availability of fruits and vegetables, any of which could harm our brand reputation, result in a decline in revenue or an increase in costs.
We consider food safety a top priority and dedicate substantial resources toward ensuring that our customers enjoy high-quality, safe and wholesome products. However, we cannot guarantee that our internal controls and training will be fully effective in preventing all food-borne illnesses. Furthermore, our reliance on third-party food suppliers and distributors increases the risk that food-borne illness incidents (such as e.coli, hepatitis A, salmonella or listeria) could occur outside of our control and at multiple locations. Instances of food-borne illnesses, whether real or perceived, and whether at our stores or those of our competitors, could harm customers and otherwise result in negative publicity about us or the products we serve, which could adversely affect revenue. If there is an incident involving our stores serving contaminated products, our customers may be harmed, our revenue may decrease and our brand name may be impaired. If our customers become ill from food-borne illnesses, we could be forced to temporarily close some stores. In addition, we may have different or additional competitors for our intended customers as a result of making any such changes and may not be able to compete successfully against those competitors. Food safety concerns and instances of food-borne illnesses and injuries caused by food contamination have in the past, and could in the future, adversely affect the price and availability of affected ingredients and cause customers to shift their preferences, particularly if we choose to pass any higher ingredient costs along to consumers. As a result, our costs may increase and our revenue may decline. A decrease in customer traffic as a result of these health concerns or negative publicity, or as a result of a change in our menu or dining experience or a temporary closure of any of our stores, could materially harm our business.
Bans on the use of polystyrene products can negatively impact our operating results.
We are subject to regulations regarding the use of polystyrene products, and several counties in which our stores are located have already banned the use of our polystyrene cups. As more state and local governments take similar actions, we may be subject to further bans on the use of polystyrene cups. A national ban on the use of polystyrene cups would force us to eliminate the use of polystyrene which could potentially increase our costs and create customer satisfaction issues that could ultimately affect our operating results.
RISKS RELATED TO OWNERSHIP OF COMMON STOCK
Failure of the Company’s internal control over financial reporting could harm its business and financial results.
Our management is responsible for establishing and maintaining effective internal control over financial reporting. Internal control over financial reporting is a process to provide reasonable assurance regarding the reliability of financial reporting for external purposes in accordance with accounting principles generally accepted in the United States of America. Internal control over financial reporting includes: (i) maintaining reasonably detailed records that accurately and fairly reflect our transactions; and (ii) providing reasonable assurance that we (a) record transactions as necessary to prepare the financial statements, (b) make receipts and expenditures in accordance with management authorizations, and (c) would timely prevent or detect any unauthorized acquisition, use or disposition of our assets that could have a material effect on the financial statements. Because of its inherent limitations, internal control over financial reporting is not intended to provide absolute assurance that we would prevent or detect a misstatement of our financial statements or fraud. Any failure to maintain an effective system of internal control over financial reporting could limit our ability to report
25
Table of Contents
our financial results accurately and timely or to detect and prevent fraud. A significant financial reporting failure could cause an immediate loss of investor confidence in us and a sharp decline in the market price of our common stock.
Our anti-takeover provisions may delay or prevent a change of control of us, which may adversely affect the price of our common stock.
Certain provisions in our corporate documents and Delaware law may delay or prevent a change of control of us, which could adversely affect the price of our common stock. For example, we have adopted a stockholder rights plan, commonly known as a “poison pill,” which would make it difficult for someone to acquire the Company without the approval of the Board of Directors. Also, the Company’s amended and restated certificate of incorporation and bylaws include other anti-takeover provisions such as:
| • | Limitations on the ability of stockholders to amend its charter documents, including stockholder supermajority voting requirements; |
| • | The inability of stockholders to act by written consent or to call a special meeting absent the request of the holders of a majority of the outstanding common stock; and |
| • | Advance notice requirements for nomination for election to the board of directors and for stockholder proposals. |
The Company is also afforded the protections of Section 203 of the Delaware General Corporation Law which prevents it from engaging in a business combination with a person who acquires at least 15% of its common stock for a period of three years from the date such person acquired such common stock, unless board of directors or stockholder approval is obtained.
The holders of our Series B Preferred are entitled to receive dividends and liquidation payments in preference to the holders of our common stock.
Dividends accrue on shares of the Series B Preferred at a rate of 8% per annum and are payable quarterly in cash at the option of the Company and can increase to 10% in the event the Company fails to satisfy certain obligations. The Company cannot declare, pay, or set apart for payment any dividend or make any distribution on any shares of our common stock until each outstanding share of Series B Preferred receives an amount equal to the product of (i) the dividend or distribution payable on each share of common stock multiplied by (ii) the number of shares of our common stock issuable upon conversion of a share of Series B Preferred. Dividends on shares of the Series B Preferred shall be cumulative, shall accrue, whether or not declared and whether or not there are any profits, surplus or other funds or assets of the Company legally available therefor.
Upon a liquidation, dissolution or winding up of the affairs of the Company, whether voluntary or involuntary, the holders of shares of the Series B Preferred are entitled to receive a liquidation payment prior to the payment of any amount with respect to shares of our common stock. The amount of this preferential liquidation payment per share of the Series B Preferred can be substantial.
Because of the substantial liquidation preference to which the holders of shares of the Series B Preferred are entitled, the amount available to be distributed to the holders of shares of our common stock upon a liquidation of the Company could be substantially limited or reduced to zero and may make it more difficult to raise capital or recruit and retain key personnel in the future.
We are responsible for keeping the resale of shares of common stock underlying the Series B Preferred and the Advisor Warrant registered with the SEC for defined time periods and will incur liquidated damages if we fail to do so.
Pursuant to the Registration Rights Agreement entered into in connection with the sale of our Series B Preferred, (the “Registration Rights Agreement”), we are obligated to: use our reasonable best efforts to keep the
26
Table of Contents
registration statement on Form S-3, declared effective by the SEC on August 13, 2009, effective until certain conditions regarding resale of the Series B Preferred have been satisfied.
If we fail to comply with this or certain other provisions under the Registration Rights Agreement, then we may be required to pay liquidated damages equal to one-twentieth of one percent (0.05%) of the aggregate purchase price paid by the Series B Purchasers for the securities held thereby that can be registered on the registration statement for each day the failure continues. The total liquidated damages under this provision are capped at 5.0% of the aggregate purchase price paid by the Series B Purchasers in the private placement. Any such payments could materially affect our ability to fund our operations.
The certificate of designation governing the Series B Preferred (the “Series B Certificate of Designation”) contains various covenants and restrictions which may limit our ability to operate our business.
Under the Series B Certificate of Designation, we are not permitted, without the affirmative vote or written consent of the holders of at least a majority of the shares of Series B-1 Preferred and the Series B-2 Preferred, voting together as a single class, directly or indirectly, to take or agree to take certain actions involving a broad array of corporate activities including, but not limited to actions relating to:
| • | the creation of senior securities; |
| • | the issuance to our officers, directors or their affiliates of securities having a purchase price, or derivative securities having exercise or conversion prices, lower than the conversion price then in effect for the Series B Preferred; |
| • | dividends, distributions, sinking fund provisions or redemptions of securities ranking on parity or junior to the Series B Preferred; |
| • | amending our certificate of incorporation or bylaws or taking other actions so as to adversely affect any right held by the holders of the Series B Preferred; |
| • | the issuance of any stock dividend, forward stock split, combination or other similar actions relating to the Series B Preferred; |
| • | reclassifying any outstanding securities; or |
| • | entering into any agreement or other arrangement that would, directly or indirectly, preclude us from complying with our redemption obligations or dividend payment obligations pursuant to the Series B Certificate of Designation. |
These restrictions could limit our ability to plan for or react to market conditions or meet extraordinary capital needs or could otherwise restrict corporate activities, any of which could have a material adverse impact on our business.
The securities purchase agreement for the sale of shares of the Series B Preferred (the “Securities Purchase Agreement”) contains various covenants and restrictions which may limit our ability to operate our business.
Pursuant to the terms of the Securities Purchase Agreement, we are not permitted to take any of the following actions:
| • | permit our consolidated indebtedness to exceed $10,000,000 in the aggregate, at any time from and after June 16, 2009, unless consented to in writing by the holders of a majority of the shares of Series B Preferred or the shares of common stock issued upon conversion of the shares of Series B Preferred; and |
| • | enter into or permit any other transaction (including the purchase, sale, lease or exchange of any asset, property or the rendering of any service), directly or indirectly, with or for the benefit of any of our |
27
Table of Contents
| affiliates and our subsidiaries’ affiliates, except for the payment of any salaries or other employee compensation to officers of any such affiliates (including reasonable compensation to any director of any such affiliates), unless consented to in writing by the holders of a majority of the shares of Series B Preferred or the shares of common stock issued upon conversion of the shares of Series B Preferred. |
These restrictions could limit our ability to plan for or react to market conditions or meet extraordinary capital needs or could otherwise restrict corporate activities, any of which could have a material adverse impact on our business.
The holders of shares of the Series B Preferred will have substantial voting power on matters submitted to a vote of stockholders and on the composition of our board of directors.
The holders of shares of the Series B Preferred are entitled to vote on all matters on which the holders of shares of our common stock are entitled to vote, voting together with the holders of shares of our common stock as a single class. Each share of Series B Preferred is entitled to that number of votes as is equal to the quotient determined by dividing (i) the original issue price of $115 (as adjusted for any stock dividends, combinations, splits, recapitalizations and the like with respect to such shares) by (ii) the then applicable conversion price (initially $1.15 per share). Accordingly, each share of Series B Preferred is currently entitled to 100 votes. The holders of the shares of Series B Preferred also received customary protective provisions under the Series B Certificate of Designation and additional protections under the Securities Purchase Agreement (as discussed in the risk factors above). As a result, the shares of Series B Preferred represent, in the aggregate, more than 36% of the voting power of our equity securities and may therefore have considerable influence in determining the outcome of any corporate transaction or other matter submitted to our stockholders for approval, including the election of directors and approval of mergers, consolidations and the sale of all or substantially all of our assets.
The holders of the Series B Preferred also have significant control over the composition of our Board of Directors. Our certificate of incorporation and the Securities Purchase Agreement confer significant power upon the holders of the Series B Preferred in the election or nomination of members of our Board. Currently, the holders of Series B-1 Preferred have the right to elect two members of our Board and the holders of the Series B-2 Preferred have the right to elect one member of our Board. Under certain circumstances, the holders of Series B Preferred may be entitled to elect additional directors. Upon conversion of the Series B Preferred into common stock, assuming certain ownership thresholds continue to be met, the holders of Series B Preferred will have contractual rights to nominate members to our Board. Because the holders of shares of the Series B Preferred will have the right to designate these members to our Board, they have considerable influence on the composition of our Board and, therefore, the conduct of our business.
The Series B Preferred is redeemable at the option of the holders under certain circumstances.
On or after June 16, 2016, the holders of at least a majority of the then-outstanding shares of Series B Preferred may require us to redeem all or any portion of the outstanding shares of Series B Preferred. The redemption price per share of the Series B Preferred is equal to the greater of (i) the sum of (A) the liquidation preference per share of the Series B Preferred (which initially is $115 per share, subject to adjustment, plus all Dividend Arrearages), plus (B) an amount per share of the Series B Preferred equal to accrued but unpaid dividends not previously added to the liquidation preference from and including the immediately preceding dividend payment date up to, but excluding, the date proposed for such redemption, whether or not declared, in cash, or (ii) the amount of all cash and other property to be distributed in respect of our common stock the holder of a share of the Series B Preferred would have been entitled to had it converted such share (without regard to any limits on conversion) immediately prior to the date proposed for such redemption.
Depending on our cash resources at the time that this redemption right is exercised, we may or may not be able to fund the redemption from our available cash resources. If we were unable to fund the redemption from available cash resources we would need to find an alternative source of financing to do so. There can be no assurances that we would be able to raise such funds on favorable terms or at all if they are required.
28
Table of Contents
We have agreed to give the holders of shares of the Series B Preferred the right to participate in subsequent stock issuances.
We agreed that if we issue and sell any new equity securities after June 16, 2009, subject to certain exceptions, we will give the Series B Purchasers the right to purchase a portion of those new securities so as to permit each of them to maintain their proportional ownership in our stock as long as such purchaser beneficially owns at least 25% of the shares such purchaser originally purchased on June 16, 2009.
The existence of this right may make it more difficult for us to obtain financing from third parties that do not wish to have Series B Purchasers participating in their financing.
The Series B Preferred private placement could adversely affect the market price of our common stock.
Each share of Series B Preferred Stock is convertible into that number of shares of common stock equal to the quotient determined by dividing $115 (as adjusted for any stock dividends, combinations, splits, recapitalizations and the like with respect to such shares) by the then applicable conversion price. The initial conversion price of the Series B Preferred is $1.15 per share. Upon such conversion, the Company must pay the Dividend Arrearage, if any, on each share of Series B Preferred, plus an amount per share of Series B Preferred equal to accrued but unpaid dividends not previously added to the liquidation preference from and including the immediately preceding dividend payment date up to, but excluding, the applicable date of conversion, whether or not declared. The holder of a share of Series B Preferred may elect to convert that holder’s share at any time. In addition, after June 16, 2011, we have the right to force conversion of the then outstanding shares of Series B Preferred upon certain conditions being met.
Sales in the public market of the shares of common stock acquired upon conversion of shares of the Series B Preferred or exercise of the Advisor Warrant, or the perception that such sales could occur, could adversely affect the prevailing market price of our common stock and impair our ability to raise funds in additional stock financings.
| ITEM 1B. | UNRESOLVED STAFF COMMENTS |
None.
| ITEM 2. | PROPERTIES |
The Company’s corporate headquarters is located at 6475 Christie Avenue, Emeryville, California. This facility is occupied under a lease for approximately 36,000 square feet, at a cost of approximately $1.0 million per year and has a lease term that expires on December 31, 2017.
The Company currently operates all of its stores under leases and typically signs five to 15 year leases. The Company does not intend to purchase real estate for any of its sites in the future. The Company believes that the size and flexibility of its format provide it with a competitive advantage in securing sites.
29
Table of Contents
The Company currently serves its customers through a combination of Company Stores and Franchise Stores in 22 different states and the Bahamas.
| Store Count as of December 29, 2009 | ||||||
| Company Stores |
Franchise Stores |
Total | ||||
| Arizona |
2 | 33 | 35 | |||
| California |
328 | 61 | 389 | |||
| Colorado |
17 | 6 | 23 | |||
| Florida |
21 | 2 | 23 | |||
| Illinois |
33 | 3 | 36 | |||
| Indiana |
1 | — | 1 | |||
| Minnesota |
8 | 1 | 9 | |||
| New Jersey |
2 | 2 | 4 | |||
| Nevada |
11 | 2 | 13 | |||
| New York |
18 | 2 | 20 | |||
| Utah |
10 | 8 | 18 | |||
| Washington |
26 | 12 | 38 | |||
| Wisconsin |
1 | — | 1 | |||
| Hawaii |
— | 33 | 33 | |||
| Idaho |
— | 6 | 6 | |||
| Massachusetts |
— | 2 | 2 | |||
| North Carolina |
— | 3 | 3 | |||
| Ohio |
— | 1 | 1 | |||
| Oklahoma |
— | 8 | 8 | |||
| Oregon |
— | 23 | 23 | |||
| Pennsylvania |
— | 1 | 1 | |||
| Texas |
— | 51 | 51 | |||
| Bahamas |
— | 1 | 1 | |||
| Total |
478 | 261 | 739 | |||
| ITEM 3. | LEGAL PROCEEDINGS |
The Company is party to various legal proceedings arising in the ordinary course of its business, but it is not currently a party to any legal proceeding that management believes would have a material adverse effect on the consolidated financial position or results of operations of the Company.
| ITEM 4. | RESERVED |
30
Table of Contents
| ITEM 5. | MARKET FOR JAMBA, INC.’S COMMON EQUITY, RELATED STOCKHOLDER MATTERS AND ISSUER PURCHASES OF EQUITY SECURITIES |
The shares of Jamba, Inc. common stock are currently quoted on the NASDAQ Global Market under the symbol JMBA.
The closing price per share of Jamba, Inc. common stock as reported on the NASDAQ Global Market on March 4, 2010, was $2.08. Shares of our Series B-1 Preferred and Series B-2 Preferred are not publicly traded and there is no market for these securities.
The following table sets forth, for the fiscal quarter indicated, the quarterly high and low closing sales prices of our shares of common stock as reported on the NASDAQ Global Market, as applicable, for each quarter during the last two fiscal years.
| Common Stock | ||||||
| High | Low | |||||
| 2008 First Quarter |
$ | 3.68 | $ | 2.14 | ||
| 2008 Second Quarter |
2.64 | 1.13 | ||||
| 2008 Third Quarter |
1.34 | 0.55 | ||||
| 2008 Fourth Quarter |
0.73 | 0.40 | ||||
| 2009 First Quarter |
0.77 | 0.36 | ||||
| 2009 Second Quarter |
1.42 | 0.72 | ||||
| 2009 Third Quarter |
1.86 | 1.03 | ||||
| 2009 Fourth Quarter |
2.05 | 1.33 | ||||
We have not historically paid any cash dividends on our common stock. We intend to continue to retain earnings, to the extent we have earnings, for use in the operation and expansion of our business, and therefore do not anticipate paying any cash dividends on our common stock in the foreseeable future.
As of March 4, 2010, there were 83 holders of record of our common stock.
31
Table of Contents
Performance Graph
The following graph compares our cumulative total stockholder return since July 28, 2005 with the cumulative total return of (i) the NASDAQ Composite Index, (ii) the Russell 2000 Index and (iii) Russell MicroCap Index. The graph assumes that the value of the investment in our common stock and each index (including reinvestment of dividends) was $100 on July 28, 2005 in the case of our common stock and June 30, 2005 in the case of an investment in an index. We began using the Russell MicroCap Index in our performance graph for the first time in 2009 because we believe the other companies in that index are currently a better comparison for us, particularly in terms of market capitalization. We also note that due to the drop in our market capitalization, our Common Stock was excluded from the Russell 2000 Index during 2008.
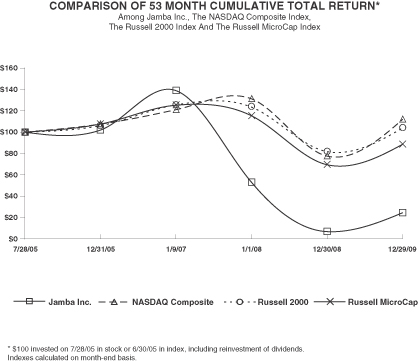
| 7/28/05 | 12/31/05 | 1/9/07 | 1/1/08 | 12/30/08 | 12/29/09 | |||||||
| Jamba Inc. |
100.00 | 101.85 | 138.94 | 52.78 | 6.56 | 24.25 | ||||||
| NASDAQ Composite |
100.00 | 107.35 | 120.78 | 131.06 | 77.45 | 111.88 | ||||||
| Russell 2000 |
100.00 | 105.88 | 125.33 | 123.36 | 81.68 | 103.88 | ||||||
| Russell MicroCap |
100.00 | 107.40 | 125.16 | 115.15 | 69.35 | 88.40 |
32
Table of Contents
| ITEM 6. | SELECTED FINANCIAL DATA |
The table below summarizes the Company’s recent financial information. The historical information was derived from the consolidated financial statements of Jamba, Inc. and subsidiary for the fiscal years ended December 29, 2009, December 30, 2008, January 1, 2008, January 9, 2007, the transition period of January 1 through January 10, 2006 and the period beginning with Jamba, Inc.’s inception (January 6, 2005) through December 31, 2005. The information for Jamba, Inc. for the fiscal year ended January 9, 2007 includes the operations for Jamba Juice Company from November 29, 2006 through January 9, 2007. The data set forth below should be read in conjunction with the consolidated financial statements and notes thereto in Item 8 and with Management’s Discussion and Analysis of Financial Condition and Results of Operations in Item 7.
(In thousands, except share data and per share amounts)
Statements of Operations Data
| Fiscal Year Ended December 29, 2009 |
Fiscal Year Ended December 30, 2008 |
Fiscal Year Ended January 1, 2008(1) |
Fiscal Year Ended January 9, 2007(2) |
Period from January 1, 2006 to January 10, 2006 |
Period from January 6, 2005 (inception) to December 31, 2005 |
|||||||||||||||||||
| Revenue: |
||||||||||||||||||||||||
| Company stores |
$ | 295,607 | $ | 333,784 | $ | 306,035 | $ | 22,064 | $ | — | $ | — | ||||||||||||
| Franchise and other revenue |
5,946 | 9,106 | 11,174 | 1,051 | — | — | ||||||||||||||||||
| Total revenue |
301,553 | 342,890 | 317,209 | 23,115 | — | — | ||||||||||||||||||
| Costs and operating expenses (income): |
||||||||||||||||||||||||
| Cost of sales |
72,669 | 89,163 | 84,226 | 6,039 | — | — | ||||||||||||||||||
| Labor |
100,589 | 120,251 | 102,661 | 8,524 | — | — | ||||||||||||||||||
| Occupancy |
43,888 | 44,868 | 37,458 | 3,590 | — | — | ||||||||||||||||||
| Store operating |
38,734 | 43,714 | 39,942 | 4,222 | — | — | ||||||||||||||||||
| Depreciation and amortization |
18,271 | 24,717 | 19,168 | 1,878 | — | — | ||||||||||||||||||
| General and administrative |
37,044 | 48,057 | 48,384 | 6,195 | — | — | ||||||||||||||||||
| Store pre-opening |
516 | 2,044 | 5,863 | 285 | — | — | ||||||||||||||||||
| Impairment of long-lived assets |
12,639 | 27,802 | 1,550 | — | — | — | ||||||||||||||||||
| Store lease termination and closure |
1,234 | 10,029 | 718 | — | — | — | ||||||||||||||||||
| Trademark and goodwill impairment |
— | 84,061 | 200,624 | — | — | — | ||||||||||||||||||
| Other operating, net |
(3,924 | ) | 3,817 | 4,806 | 675 | — | — | |||||||||||||||||
| Formation and operating |
— | — | — | — | 6 | 197 | ||||||||||||||||||
| Total costs and operating expenses |
321,660 | 498,523 | 545,400 | 31,408 | 6 | 197 | ||||||||||||||||||
| Loss from operations |
(20,107 | ) | (155,633 | ) | (228,191 | ) | (8,293 | ) | (6 | ) | (197 | ) | ||||||||||||
| Other (expense) income: |
||||||||||||||||||||||||
| Gain (loss) on derivative liabilities |
1,597 | 7,895 | 59,424 | (57,383 | ) | 173 | 2,125 | |||||||||||||||||
| Interest income |
404 | 365 | 3,517 | 4,177 | 92 | 1,453 | ||||||||||||||||||
| Interest expense |
(6,905 | ) | (2,064 | ) | (181 | ) | (71 | ) | — | — | ||||||||||||||
| Total other (expense) income |
(4,904 | ) | 6,196 | 62,760 | (53,277 | ) | 265 | 3,578 | ||||||||||||||||
| (Loss) income before income taxes |
(25,011 | ) | (149,437 | ) | (165,431 | ) | (61,570 | ) | 259 | 3,381 | ||||||||||||||
| Income tax benefit (expense) |
1,066 | 274 | 52,135 | 2,544 | 38 | (85 | ) | |||||||||||||||||
| Net (loss) income |
(23,945 | ) | (149,163 | ) | (113,296 | ) | (59,026 | ) | 297 | 3,296 | ||||||||||||||
| Preferred stock dividends and deemed dividends |
(1,860 | ) | — | — | — | — | — | |||||||||||||||||
| Net (loss attributable) income available to stockholders |
$ | (25,805 | ) | $ | (149,163 | ) | $ | (113,296 | ) | $ | (59,026 | ) | $ | 297 | $ | 3,296 | ||||||||
| Weighted-average shares used in the computation of (loss) earnings per share: |
||||||||||||||||||||||||
| Basic |
53,632,299 | 53,252,855 | 52,323,898 | 24,478,384 | 21,000,000 | 11,777,489 | ||||||||||||||||||
| Diluted |
53,632,299 | 53,252,855 | 52,323,898 | 24,478,384 | 23,703,268 | 13,049,709 | ||||||||||||||||||
| (Loss) earnings per share: |
||||||||||||||||||||||||
| Basic |
$ | (0.48 | ) | $ | (2.80 | ) | $ | (2.17 | ) | $ | (2.41 | ) | $ | 0.01 | $ | 0.28 | ||||||||
| Diluted |
$ | (0.48 | ) | $ | (2.80 | ) | $ | (2.17 | ) | $ | (2.41 | ) | $ | 0.01 | $ | 0.25 | ||||||||
| (1) | Due to the Company’s change in fiscal year, the fiscal year ended January 1, 2008 contains the results of operations for a 51-week year. |
| (2) | The information for the Company for the fiscal year ended January 9, 2007 includes operations for Jamba Juice Company from November 29, 2006 through January 9, 2007. The information is only a summary and should be read in conjunction with the historical consolidated financial statements and related notes. Proforma information can be found in Management’s Discussion and Analysis of Financial Condition and Results of Operations in Item 7 of the Company’s 2008 Annual Report on Form 10-K. |
33
Table of Contents
Selected Balance Sheet Data (at period end)
| December 29, 2009 |
December 30, 2008 |
January 1, 2008 |
January 9, 2007 |
January 10, 2006 |
December 31, 2005 | |||||||||||||
| Cash and cash equivalents |
$ | 28,757 | $ | 20,822 | $ | 23,016 | $ | 87,379 | $ | 977 | $ | 977 | ||||||
| Cash held in trust |
— | — | — | — | 128,266 | 128,174 | ||||||||||||
| Total assets |
125,818 | 145,720 | 275,002 | 467,553 | 129,339 | 129,208 | ||||||||||||
| Note payable |
— | 22,829 | — | — | — | — | ||||||||||||
| Total liabilities, including $25,241 of common stock subject to possible redemption as of January 10, 2006 and December 31, 2005 |
80,213 | 105,299 | 91,494 | 181,678 | 39,232 | 39,398 | ||||||||||||
| Series B redeemable preferred stock |
31,069 | — | — | — | — | — | ||||||||||||
| Total stockholders’ equity |
14,536 | 40,421 | 183,508 | 285,875 | 90,107 | 89,810 | ||||||||||||
| Total liabilities and stockholders’ equity |
125,818 | 145,720 | 275,002 | 467,553 | 129,339 | 129,208 | ||||||||||||
KEY FINANCIAL METRICS AND NON-GAAP MEASURES
Management reviews and discusses its operations based on both financial and non-financial metrics. Among the key financial metrics upon which management focuses is reviewing its performance based on the Company’s consolidated GAAP results, including Company Store comparable sales. Management also uses certain supplemental, non-GAAP financial metrics in evaluating financial results, including Company Store “Store-level EBITDA” and “Consolidated EBITDA”.
Company Store comparable sales represents the change in year-over-year sales for all Company Stores opened for at least 13 full fiscal periods.
Consolidated EBITDA is equal to net loss plus franchise support reimbursement, less: (a) interest income; (b) interest expense; (c) income taxes; (d) depreciation and amortization; (e) gain from mark-to-market of derivative liabilities; (f) store pre-opening expenses; (g) trademark and goodwill impairment; (h) impairment of long-lived assets; (i) store lease termination and closure cost; and (j) other operating, net.
Our definition of Store-level EBITDA is different from Consolidated EBITDA because we further adjust net income to exclude general and administrative expenses.
Management uses Consolidated EBITDA and Store-level EBITDA: (i) as measurements of operating performance because they assist us in comparing our operating performance on a consistent basis as they remove the impact of items not directly resulting from our Company Store operations; (ii) for planning purposes, including the preparation of our internal annual operating budget; and (iii) as measurements in assessing the performance of existing store operating income and comparative operating performance.
Consolidated EBITDA and Store-level EBITDA are not measurements determined in accordance with GAAP and should not be considered in isolation or as an alternative to income (loss) from operations or net income (loss) as indicators of financial performance. Each non-GAAP financial measure used as presented may not be comparable to other similarly titled measures used by other companies. For a reconciliation of net income (loss) to these non-GAAP financial measures, see the discussion and related table below.
Consolidated EBITDA and Store-level EBITDA: (a) do not represent net income or cash flows from operating activities as defined by GAAP; (b) are not necessarily indicative of cash available to fund our cash flow needs; and (c) should not be considered as alternatives to net income, operating income, cash flows from operating activities or our other financial information as determined under GAAP.
34
Table of Contents
The Company’s Consolidated EBITDA was $8.6 million for fiscal 2009 as compared to $(5.6) million in fiscal 2008. The Company’s Store-level EBITDA was $45.7 million for fiscal 2009 as compared to $42.4 million for fiscal 2008. A reconciliation of Consolidated EBITDA and Store-level EBITDA for the fiscal years ended December 29, 2009 and December 30, 2008 to net loss follows:
(Dollars in thousands)
| December 29, 2009 |
December 30, 2008 |
|||||||
| Net loss |
$ | (23,945 | ) | $ | (149,163 | ) | ||
| Franchise support reimbursement |
— | (2,470 | ) | |||||
| Interest income |
(404 | ) | (365 | ) | ||||
| Interest expense |
6,905 | 2,064 | ||||||
| Income tax benefit |
(1,066 | ) | (274 | ) | ||||
| Depreciation and amortization |
18,271 | 24,717 | ||||||
| Gain from derivative liabilities |
(1,597 | ) | (7,895 | ) | ||||
| Store pre-opening |
516 | 2,044 | ||||||
| Trademark, goodwill and long-lived asset impairment |
12,639 | 111,863 | ||||||
| Store lease termination and closure |
1,234 | 10,029 | ||||||
| Other operating, net |
(3,924 | ) | 3,817 | |||||
| Consolidated EBITDA |
8,629 | (5,633 | ) | |||||
| General and administrative |
37,044 | 48,057 | ||||||
| Store-level EBITDA |
$ | 45,673 | $ | 42,424 | ||||
The following table sets forth operating data that do not otherwise appear in our consolidated financial statements as of and for the fiscal years ended December 29, 2009 and December 30, 2008:
| Fiscal Year Ended | ||||||
| December 29, 2009 |
December 30, 2008 |
|||||
| Percentage change in Company Store comparable sales (1) |
(10.3 | )% | (8.1 | )% | ||
| Total Company Stores |
478 | 511 | ||||
| Total Franchise Stores |
261 | 218 | ||||
| Total Stores |
739 | 729 | ||||
| (1) | Percentage change in Company Store comparable sales compares the sales of Company Stores during a 13 period fiscal year to the sales from the same Company Stores for the equivalent period in the prior year. A Company Store is included in this calculation after its thirteenth full fiscal period of operations. Sales from franchised stores are not included in the Company Store comparable sales. |
35
Table of Contents
The following table sets forth certain data relating to Company Stores and Franchise Stores for the periods indicated:
| Fiscal year ended | |||||||||
| December 29, 2009 |
December 30, 2008 |
January 1, 2008 |
|||||||
| Company Stores: |
|||||||||
| Beginning of year |
511 | 501 | 373 | ||||||
| Company Stores opened |
2 | 35 | 99 | ||||||
| Company Stores closed |
(8 | ) | (38 | ) | (5 | ) | |||
| Company Stores acquired from franchisees |
— | 13 | 34 | ||||||
| Company Stores sold to franchisees |
(27 | ) | — | — | |||||
| Total Company Stores |
478 | 511 | 501 | ||||||
| Franchise Stores: |
|||||||||
| Beginning of year |
218 | 206 | 222 | ||||||
| Franchise Stores opened |
23 | 37 | 30 | ||||||
| Franchise Stores closed |
(7 | ) | (12 | ) | (12 | ) | |||
| Franchise Stores purchased from Company |
27 | — | — | ||||||
| Franchise Stores sold to Company |
— | (13 | ) | (34 | ) | ||||
| Total Franchise Stores |
261 | 218 | 206 | ||||||
36
Table of Contents
| ITEM 7. | MANAGEMENT’S DISCUSSION AND ANALYSIS OF FINANCIAL CONDITION AND RESULTS OF OPERATIONS |
You should read the following discussion and analysis in conjunction with Part II, Item 6 “Selected Financial Data” and our audited consolidated financial statements and the related notes thereto included in Item 8 “Financial Statements and Supplementary Data.” In addition to historical consolidated financial information, this discussion contains forward-looking statements that reflect our plans, estimates and beliefs. Actual results could differ from these expectations as a result of factors including those described under Item 1A, “Risk Factors,” “Special Note Regarding Forward-Looking Statements” and elsewhere in this Form 10-K.
JAMBA, INC. OVERVIEW
Jamba, Inc. is a holding company which owns and franchises Jamba Juice stores through its wholly-owned subsidiary, Jamba Juice Company. Jamba Juice Company is a leading restaurant retailer of better-for-you food and beverage offerings, including great tasting fruit smoothies, juices and teas, hot oatmeal made with organic steel cut oats, wraps, salads, sandwiches and California Flatbreads™ and a variety of baked goods and snacks. Jamba, Inc. was incorporated in January 2005 and went public through an initial public offering later that year. In November 2006, we completed our acquisition of Jamba Juice Company, which first began operations in 1990. As of December 29, 2009, there were 739 locations consisting of 478 company owned and operated stores (“Company Stores”) and 261 franchise stores (“Franchise Stores”).
Fiscal Year
Our fiscal year ends each year on the Tuesday closest to December 31st and therefore we have a 52 or 53 week fiscal year with the first fiscal quarter being sixteen weeks, the second and third quarters being twelve weeks, and the fourth quarter being twelve or thirteen weeks. Effective June 7, 2007, we changed our fiscal year end from the second Tuesday following December 31st and, as a result, the fourth fiscal quarter of fiscal 2007 was an eleven-week period. We believe that the one week difference in our fiscal year change is insignificant for comparison purposes and would not be material to reporting the overall financial condition or operating results of our Company as a whole. Unless otherwise stated, references to years in the report relate to fiscal years rather than to calendar years. The following fiscal periods are presented in this report.
| Fiscal Period |
Period Covered |
Weeks | ||
| Fiscal Year 2009 |
December 31, 2008 to December 29, 2009 |
52 | ||
| Fiscal Year 2008 |
January 2, 2008 to December 30, 2008 |
52 | ||
| Fiscal Year 2007 |
January 10, 2007 to January 1, 2008 |
51 |
All references to store counts, including data for new store openings, are reported net of related store closures, unless otherwise noted.
EXECUTIVE OVERVIEW
Key Overall Strategies
We have made good progress against the BLEND Plan, which we announced in early 2009. The BLEND Plan represents our multi-year strategic plan to transform the Jamba Juice brand from a made-to-order smoothie company to a healthy, active lifestyle brand. The key strategic priorities of the BLEND Plan include:
| • | building a customer first operationally focused service culture; |
| • | building a retail food capability across all four day parts (breakfast, lunch, afternoon, and dinner); |
| • | accelerating the development of franchise and non-traditional stores; |
37
Table of Contents
| • | building a consumer products growth platform; and |
| • | continuing to implement a disciplined expense reduction plan. |
With a focused and disciplined implementation of the BLEND Plan in 2009, particularly in the areas of managing our costs and expenses, we helped stabilize the business and build the foundation for future growth in 2010 and beyond.
In addition, in June 2009 we strengthened our balance sheet and liquidity position by completing an offering of $35 million in convertible preferred stock via a private placement that allowed us to repay our senior term note and to provide additional working capital to help execute our BLEND Plan.
Fiscal 2009 Financial and Operational Highlights
| • | Consolidated EBITDA increased $14.2 million to $8.6 million in fiscal 2009 from $(5.6) million for fiscal 2008. We attribute much of this improvement to our cost savings initiatives implemented in fiscal 2009, including a reduction in our general and administrative expenses of $11.0 million to $37.0 million or 12.3% of total revenue. |
| • | Store-level EBITDA for our Company Stores increased $3.3 million to $45.7 million for fiscal 2009 from $42.4 million in fiscal 2008, reflecting an improvement of 7.7%. We attribute much of this improvement to our disciplined expense management efforts despite a Company Store comparable sales decrease in fiscal 2009, and the deleverage of fixed costs brought about as a result. |
| • | Total revenue decreased $41.3 million or 12.1% to $301.6 million in fiscal 2009 from $342.9 million for fiscal 2008. We attribute much of this decrease to lower Company Store comparable sales and a lower number of Company Stores operating compared to the prior year. |
| • | Net loss for fiscal 2009 decreased by $125.3 million to a net loss of $23.9 million compared to a net loss of $149.2 million in fiscal 2008. The decrease in net loss was driven by $84.0 million in goodwill and intangible impairment in the prior year that did not occur in the current year, $15.2 million decrease in impairment of long-lived assets, $11.0 million decrease in general and administrative expenses and an $8.8 million decrease in store lease termination and closure costs. Also contributing to our reduction in net loss for 2009 was our disciplined expense management efforts, including reducing cost of sales to 24.6% of Company Store revenue, reducing labor costs to 34.0% of Company Store revenue and reducing other controllable expenses in store operating expenses to 3.5% of Company Store revenue. We also closed eight Company Stores in fiscal 2009. |
| • | Diluted loss per share decreased 83% to $(0.48) per share in fiscal 2009 from $(2.80) per share in the prior year. |
| • | Cash and cash equivalents increased 38.1% to $28.8 million at the end of fiscal 2009 from $20.8 million at the end of fiscal 2008. |
| • | While Company Store comparable sales decreased 10.3% in fiscal 2009, we believe the steps we have taken to increase sales at our stores through, among other things, the introduction of our expanded food and beverage offerings, value promotions, and off-site sales initiatives helped to mitigate the adverse effects of a challenging economy. We also saw an improving trend over the course of the year, with less pronounced declines in the third and fourth fiscal quarters compared to declines in the first and second fiscal quarters. |
| • | For fiscal 2009 we generated cash flow from operations of $8.5 million and primarily all of our capital expenditures were discretionary in nature. |
38
Table of Contents
Fiscal 2009 Accomplishments
Accomplishments to Support Sales
Consistent with our goal to build a customer first operationally focused service culture we continued to make progress training team members and validating results through our mystery shop program which has shown a substantial improvement in store performance scores during the past year. Under our store refresh program, we updated the look and feel of 88 stores in fiscal 2009 to improve the customer experience. We have made strides to re-engage our customers in the two-mile radius surrounding each store and we entered into an agreement with the National PTA to be a proud national sponsor of that organization. We believe our relationship with the National PTA will allow us to engage their membership at the local levels to help drive incremental sales. In addition, we have also started to re-engage local communities to improve the local awareness of the Jamba brand and promote active, healthy lifestyles with our focus on offsite sales and catering opportunities.
We took steps to increase sales at our stores with the introduction of our expanded food offering, which we believe will increase average check, and the introduction of off-site sales initiatives, which we believe will ultimately drive incremental sales volume. With respect to our food offering, we extended the availability of oatmeal to over 600 system stores and we also increased the availability of our “grab-and-go” wraps, salads and sandwiches and our California Flatbreads at a greater number of system stores during the year. We now have over 370 locations offering some component of food beyond oatmeal. We also expanded our beverage offering to include fruit infused teas as an alternative selection and a complement to our food offering.
Accomplishments to Control Costs
Company Store financial performance has improved through our disciplined focus on cost reductions, which include costs of goods sold, reformulations and waste improvements; reducing store labor expenses through operational simplifications, better wage and benefit management, implementing our labor planning system, reducing occupancy costs through re-negotiations with landlords and store closures, reducing controllable and other store costs as a result of better cost controls and processes and renegotiating many of our service contracts. We have also implemented technology enhancements that we believe will help improve our efficiencies by automating current manual processes allowing store personnel to focus on the customer experience.
We also took measures to decrease our general and administrative expenses. Since fiscal 2008, we have reduced G&A expenses by 22.9% through headcount reductions and other cost savings initiatives. G&A expenses as a percentage of revenue were reduced from 14.0% of total revenue in fiscal 2008 to 12.3% of total revenue in fiscal 2009 despite a decrease of 10.3% in Company Store comparable sales.
To the extent possible, we are extending these cost saving initiatives and benefits to Franchise Stores with hopes of helping to improve store-level economics for our franchisees by passing through our negotiated volume rates with suppliers and vendors to our franchisees. We strongly believe that increased sales coupled with better cost and expense management will drive improved store-level economics for Company Stores and Franchise Stores alike.
We believe that the steps taken to improve sales and control costs helped to improve store-level performance metrics including Store-level EBITDA and Consolidated EBITDA and this will continue to be a focus for us moving forward.
Accelerating Franchise Growth
During fiscal 2009 we increased our presence in non-traditional venues with the opening of 14 new non-traditional Franchise Stores with particular focus on university and airport locations. During fiscal 2009 we
39
Table of Contents
opened our 31st university location and our eighth airport location. Shortly after the end of fiscal 2009, we also entered into an agreement with Centerplate, Inc., a major hospitality company which could potentially give us access to open additional Franchise Stores in as many as 250 locations at a variety of managed sports and entertainment venues across the country. At the end of fiscal 2009, Jamba Juice locations were comprised of approximately 65% Company Store locations and 35% Franchise Store locations compared to the end of fiscal 2008, when the mix was approximately 70% Company Store locations and 30% Franchise Store locations.
In order to further help accelerate our growth and brand presence, we also announced our initiative to refranchise up to 150 Company Stores primarily outside of California, with the expectation that buyers will further develop growth of Franchise Stores in their own individual markets. During fiscal 2009 we refranchised 27 locations, and we opened 23 new Franchise Stores and two new Company Stores. We also expect that as part of our refranchising initiative, buyers will agree to undertake separate development obligations to open up to a total of 100 additional Franchise Stores beyond the stores they purchase in refranchising transactions.
Building a Consumer Products Growth Platform
We also made progress in our consumer products licensing program during the year. In fiscal 2009 we signed five separate license agreements covering the production of a Jamba Juice children’s toy blender, frozen novelty bars, a line of apparel and bags, make-at-home smoothie kits and a variety of trail mixes. We also signed a non-binding memorandum of intent with Core-Mark Holding Company, Inc. in February 2010 to establish a relationship to offer and deliver health-oriented Jamba-branded food and beverage consumer products to Core-Mark serviced convenience retail locations. The proposed three-year relationship would generally give Core-Mark exclusive distribution rights of the Jamba-branded products to the convenience store retail channel. We believe these relationships demonstrate that there is demand for Jamba-branded consumer products which we will continue to build upon in fiscal 2010.
Fiscal 2009 in Summary
We believe that we took significant steps in fiscal 2009 to improve the Company’s financial position and operating results, despite generally negative sentiment in consumer confidence and global economic pressures. We also believe that the steps we have taken to increase sales, control costs, accelerate growth through franchising and developing alternative revenue streams such as catering, offsite sales and licensing will provide a solid foundation for further improvements in 2010.
CRITICAL ACCOUNTING POLICIES AND ESTIMATES
The preparation of consolidated financial statements in conformity with generally accepted accounting principles (“GAAP”) requires the appropriate application of certain accounting policies, many of which require us to make estimates and assumptions about future events and its impact on amounts reported in our consolidated financial statements and related notes. Since future events and their impact cannot be determined with certainty, actual results may differ from our estimates. Such differences may be material to the consolidated financial statements.
We believe our application of accounting policies, and the estimates inherently required therein, are reasonable. These accounting policies and estimates are periodically reevaluated, and adjustments are made when facts and circumstances dictate a change.
Our accounting policies are more fully described in Note 1 “Business and Summary of Significant Accounting Policies” in the “Notes to Consolidated Financial Statements,” included elsewhere in this annual report on Form 10-K (“2009 Form 10-K”). We consider the following policies to be the most critical in understanding the judgments that are involved in preparing the consolidated financial statements.
40
Table of Contents
Impairment of Long-Lived Assets
Long-lived assets, including leasehold improvements, and other fixed assets are reviewed for impairment at least quarterly and when indicators of impairment are present. Expected cash flows associated with an asset, in addition to other quantitative and qualitative analyses are the key factors in determining the recoverability of the asset. Identifiable cash flows are measured at the individual store level. The estimate of cash flows is based upon, among other things, certain assumptions about expected future operating performance. Our estimates of undiscounted cash flows may differ from actual cash flows due to, among other things, changes in economic conditions, changes to our business model or changes in operating performance. If the sum of the undiscounted cash flows is less than the carrying value of the asset, we recognize an impairment loss, measured as the amount by which the carrying value exceeds the fair value of the asset.
As a result of our refranchising initiative, announced in June 2009, we classify assets as held for sale and suspend depreciation and amortization on such assets when all of the following criteria are met: (i) Board of Directors approval to refranchise (the store or group of stores) is received; (ii) the stores can be immediately removed from operations; (iii) an active program to locate a buyer is implemented; (iv) the assets are being actively marketed for sale at or near their current fair value; (v) significant changes to the plan of sale are not likely and (vi) the sale is probable within one year. Assets held for sale are recorded at the lower of the carrying amount or fair value less cost to sell. Fair value is determined based on the purchase price in the asset purchase agreement. Assets held for sale are included in prepaid expenses and other current assets in the consolidated balance sheet. See Note 5 in the Notes to Consolidated Financial Statements.
Trademark, Goodwill and Other Intangible Asset Impairment
Trademarks were not subject to amortization and were tested for impairment annually (at year-end), or more frequently if events or changes in circumstances indicated that the asset might be impaired. We performed our test for impairment on trademarks by comparing the fair value of the trademarks to their carrying amounts. An impairment loss is generally recognized when the carrying amount of the trademarks is less than the fair value. The fair value of trademarks was estimated using the income approach-relief from royalty method, which is based on the projected cost savings attributable to the ownership of the trademarks.
We tested for goodwill impairment annually (at year-end) or whenever events occurred or circumstances changed that would more likely than not reduce the fair value of a reporting unit below its carrying amount. The required two-step approach uses accounting judgments and estimates of future operating results. Changes in estimates or the application of alternative assumptions could produce significantly different results. Impairment testing is done at a reporting unit level. An impairment loss generally is recognized when the carrying amount of the reporting unit’s net assets exceeds the estimated fair value of the reporting unit. The estimates and judgments that most significantly affect the fair value calculation are assumptions related to revenue growth, discount rate, public-market trading multiples and control premiums. The fair value of the reporting unit is reconciled to our market capitalization plus an estimated control premium.
Intangible assets subject to amortization (primarily franchise agreements, reacquired franchise rights and a favorable lease portfolio intangible asset recognized in the purchase of Jamba Juice in 2006) are tested for recoverability whenever events or changes in circumstances indicate that their carrying amounts may not be recoverable. Intangible assets are amortized over their estimated useful lives using a method of amortization that reflects the pattern in which the economic benefits of the intangible assets are consumed or otherwise realized. Estimated useful lives for the franchise agreements are 13.4 years. The useful life of reacquired franchise rights is the remaining term of the respective franchise agreement. The useful life of the favorable lease portfolio intangible is based on the related lease term.
41
Table of Contents
Rent Expense
Minimum rental expenses are recognized over the term of the lease. We recognize minimum rent starting when possession of the property is taken from the landlord, which normally includes a construction period prior to store opening. When a lease contains a predetermined fixed escalation of the minimum rent, we recognize the related rent expense on a straight-line basis and record the difference between the recognized rental expense and the amounts payable under the lease as deferred rent liability. We also receive tenant allowances which are included in deferred rent liability. Tenant allowances are amortized as a reduction to rent expense in the consolidated statements of operations over the term of the lease.
Certain leases provide for contingent rents that are not measurable at inception. These contingent rents are primarily based on a percentage of revenue that is in excess of a predetermined level. These amounts are excluded from minimum rent and are included in the determination of rent expense when it is probable that the expense has been incurred and the amount can be reasonably estimated.
Jambacard Revenue Recognition
We sell our jambacards to our customers in our retail stores and through our website at www.jambajuice.com. Our jambacards do not have an expiration date. We recognize income from jambacards when (i) the jambacard is redeemed by the customer or (ii) the likelihood of the jambacard being redeemed by the customer is remote (also referred to as “breakage”) and we determine that we do not have a legal obligation to remit the value of unredeemed jambacards to the relevant jurisdictions. We determine the jambacard breakage amount based upon historical redemption patterns. We have concluded that after three years of inactivity the likelihood of redemption becomes remote and we recognize breakage at that time. Jambacard breakage income is included in other operating, net in the consolidated statements of operations.
We have sold the jambacards since November of 2002. The jambacard works as a reloadable gift or debit card. At the time of the initial load, in an amount between $5 and $500, we record an obligation that is reflected as jambacard liability on the consolidated balance sheets. We relieve the liability and record the related revenue at the time a customer redeems any part of the amount on the card. The card does not have any expiration provisions and is not refundable, except as otherwise required by law.
Self-Insurance Reserves
We are self-insured for healthcare benefits. For workers’ compensation benefits, we were self-insured for existing and prior years’ exposures through September 30, 2008. We changed to a guaranteed cost program for workers compensation on October 1, 2008. Liabilities associated with the risks that we retain are estimated in part, by considering historical claims experience, demographic factors, severity factors, and other actuarial assumptions. The estimated accruals for these liabilities are based on statistical analyses of historical industry data as well as our actual historical trends. If actual claims experience differs from our assumptions, historical trends, and estimates, changes in our insurance reserves would impact the expense recorded in our consolidated statements of operations.
Income Taxes
Deferred tax assets and liabilities are recognized for the future tax consequences attributable to differences between the financial statement carrying amounts of existing assets and liabilities and their respective tax basis. Deferred tax assets and liabilities are measured using enacted income tax rates expected to apply to taxable income in the years in which those temporary differences are expected to be recovered or settled. Any effect on deferred tax assets and liabilities due to a change in tax rates is recognized in income in the period that includes the enactment date. In establishing deferred income tax assets and liabilities, we make judgments and interpretations based on enacted tax laws and published tax guidance applicable to our operations. We record deferred tax assets and liabilities and evaluate the need for valuation allowances to reduce deferred tax assets to estimated realizable amounts. Changes in our valuation of the deferred tax assets or changes in the income tax provision may affect our annual effective income tax rate.
42
Table of Contents
A valuation allowance is provided for deferred tax assets when it is “more likely than not” that some portion of the deferred tax asset will not be realized. Because of our recent history of operating losses, we believe the recognition of the deferred tax assets arising from the above-mentioned future tax benefits is currently not likely to be realized and, accordingly, have maintained a full valuation allowance against our deferred tax assets as of December 29, 2009. Due to new Federal legislation enacted in November, 2009, we have the ability to carryback our alternative minimum tax net operating loss for fiscal 2008 five years in order to offset 100% of the alternative minimum taxable income in those years. By doing so, we will receive a refund of prior alternative minimum tax payments of $0.6 million. Because the deferred tax asset established for these alternative minimum tax credits will be realized, the respective allowance has been released.
On a quarterly basis, we review and update our inventory of tax positions as necessary to add any new uncertain tax positions taken, or to remove previously identified uncertain positions that have been adequately resolved. Additionally, uncertain positions may be re-measured as warranted by changes in facts or law. Accounting for uncertain tax positions requires significant judgments, including estimating the amount, timing and likelihood of ultimate settlement. Although we believe that these estimates are reasonable, actual results could differ from these estimates.
Share-based compensation
We account for share-based compensation based on fair value measurement guidance. The fair value of options granted is estimated at the date of grant using a Black-Scholes option-pricing model. Option valuation models, including Black-Scholes, require the input of highly subjective assumptions, and changes in the assumptions used can materially affect the grant date fair value of an award. These assumptions include the risk-free rate of interest, expected dividend yield, expected volatility and the expected life of the award. The risk-free rate of interest is based on the zero coupon U.S. Treasury rates appropriate for the expected term of the award. Expected dividends are zero based on history of not paying cash dividends on our common stock. Expected volatility is based on a 50/50 blend of historic daily stock price observations of our common stock since our inception and historic, daily stock price observations of our peers (companies in our industry that are viewed as a “concept” and a leader in the premium, specialty growth segment) during the period immediately preceding the share-based award grant that is equal in length to the award’s expected term. We also make assumptions for the number of awards that will ultimately not vest (“forfeitures”) and include it as a part of the determination of fair value. We use historical data to estimate expected employee behaviors related to option exercises and forfeitures. There is currently no market-based mechanism or other practical application to verify the reliability and accuracy of the estimates stemming from these valuation models or assumptions, nor is there a means to compare and adjust the estimates to actual values, except for annual adjustments to reflect actual forfeitures.
The fair value of restricted stock units is determined based on our closing stock price on the date of grant. These restricted stock units vest and become unrestricted three years after the date of grant. Share-based compensation expense is recognized ratably over the three-year service period for restricted stock units.
Accounting for Warrants and Derivative Instruments
On July 6, 2005, we consummated our initial public offering of 15,000,000 warrants (the “Warrants”). On July 7, 2005, we consummated the closing of an additional 2,250,000 warrants that were subject to the underwriters’ over-allotment option. Each Warrant entitled the holder to purchase one share of our common stock at an exercise price of $6.00 per share. These Warrants were freely traded on the NASDAQ Global Market under the symbol “JMBAW” until their expiration on June 28, 2009.
We sold to the representative of the underwriter, for $100, an option to purchase up to a total of 750,000 units (the “Units”). Each Unit consisted of one share of common stock and one redeemable common stock purchase warrant (“Embedded Warrants”). The Embedded Warrants issuable upon exercise of this option were identical to those sold in the initial public offering, except that the Embedded Warrants had an exercise price of
43
Table of Contents
$7.50 (125% of the exercise price of the Warrants). These Units were freely traded on the NASDAQ Global Market under the symbol “JMBAU”. This option was exercisable at $10.00 per Unit until its expiration on June 28, 2009.
We recorded these warrants as liabilities on our consolidated balance sheets and the unrealized changes in the values of these derivatives are shown in our consolidated statements of operations as “Gain (loss) on derivative liabilities.” Since these warrants were freely traded on the NASDAQ Global Market, the fair value of the Warrants was estimated based on the market price of a warrant at each period-end.
Fair values for exchange-traded securities and derivatives were based on quoted market prices. Where market prices were not readily available, fair values were determined using market-based pricing models incorporating readily observable market data and requiring judgments and estimates. The option to purchase 750,000 shares was recorded as an equity instrument, as the underlying shares did not need to be registered, and all other criteria to be accounted for as an equity instrument were met and the Embedded Warrants were recorded as a liability.
We used the Black-Scholes pricing model to estimate the fair value of the Embedded Warrants. Assumptions used as input to the pricing model included the risk-free rate of interest, expected dividend yield, expected volatility, and the expected life of the award. The risk-free rate of interest was based on the zero coupon U.S. Treasury rates appropriate for the expected term of the warrants and was 0.5% as of December 30, 2008 and 3.1% as of January 1, 2008. Expected dividends was zero based on the history of not paying cash dividends on our common stock. We do not have any plans to pay dividends in the future. The expected term was determined to be the remaining contractual life of the warrant or derivative instrument of 1.5 years as of December 30, 2008 and 2.5 years as of January 1, 2008.
Due to our limited trading history as an operating entity, we used volatility rates based on a 50/50 blend of historic daily stock price observations of our common stock since our inception and historic daily stock price observations of our peers. The volatility index used for the calculation was 71.6% as of December 30, 2008 and 42.6% as of January 1, 2008.
The estimated fair value of the warrants and Embedded Warrants was $0.1 million and $0, respectively, as of December 30, 2008. Such amounts were recorded as derivative liabilities in the consolidated balance sheets.
44
Table of Contents
JAMBA, INC. RESULTS OF OPERATIONS—FISCAL 2009 COMPARED TO FISCAL 2008
The discussion that follows should be read in conjunction with the consolidated financial statements and notes thereto. Our consolidated results of operations for fiscal 2009 and 2008 are summarized below.
(In thousands, except share data and per share amounts)
| Fiscal year ended | ||||||||||||||
| December 29, 2009 |
%(1) | December 30, 2008 |
%(1) | |||||||||||
| Revenue: |
||||||||||||||
| Company stores |
$ | 295,607 | 98.0 | % | $ | 333,784 | 97.3 | % | ||||||
| Franchise and other revenue |
5,946 | 2.0 | % | 9,106 | 2.7 | % | ||||||||
| Total revenue |
301,553 | 100.0 | % | 342,890 | 100.0 | % | ||||||||
| Costs and operating expenses (income): |
||||||||||||||
| Cost of sales |
72,669 | 24.6 | % | 89,163 | 26.7 | % | ||||||||
| Labor |
100,589 | 34.0 | % | 120,251 | 36.0 | % | ||||||||
| Occupancy |
43,888 | 14.8 | % | 44,868 | 13.4 | % | ||||||||
| Store operating |
38,734 | 13.1 | % | 43,714 | 13.1 | % | ||||||||
| Depreciation and amortization |
18,271 | 6.1 | % | 24,717 | 7.2 | % | ||||||||
| General and administrative |
37,044 | 12.3 | % | 48,057 | 14.0 | % | ||||||||
| Store pre-opening |
516 | 0.2 | % | 2,044 | 0.6 | % | ||||||||
| Impairment of long-lived assets |
12,639 | 4.2 | % | 27,802 | 8.1 | % | ||||||||
| Store lease termination and closure |
1,234 | 0.4 | % | 10,029 | 2.9 | % | ||||||||
| Trademark and goodwill impairment |
— | 0.0 | % | 84,061 | 24.5 | % | ||||||||
| Other operating, net |
(3,924 | ) | (1.3 | )% | 3,817 | 1.1 | % | |||||||
| Total costs and operating expenses |
321,660 | 106.7 | % | 498,523 | 145.4 | % | ||||||||
| Loss from operations |
(20,107 | ) | (6.7 | )% | (155,633 | ) | (45.4 | )% | ||||||
| Other income (expense): |
||||||||||||||
| Gain from derivative liabilities |
1,597 | 0.5 | % | 7,895 | 2.3 | % | ||||||||
| Interest income |
404 | 0.1 | % | 365 | 0.1 | % | ||||||||
| Interest expense |
(6,905 | ) | (2.3 | )% | (2,064 | ) | (0.6 | )% | ||||||
| Total other (expense) income, net |
(4,904 | ) | (1.7 | )% | 6,196 | 1.8 | % | |||||||
| Loss before income taxes |
(25,011 | ) | (8.4 | )% | (149,437 | ) | (43.6 | )% | ||||||
| Income tax benefit |
1,066 | 0.4 | % | 274 | 0.1 | % | ||||||||
| Net loss |
$ | (23,945 | ) | (8.0 | )% | $ | (149,163 | ) | (43.5 | )% | ||||
| Preferred stock dividends and deemed dividends |
(1,860 | ) | (0.6 | )% | — | — | ||||||||
| Net loss attributable to common stockholders |
$ | (25,805 | ) | (8.6 | )% | $ | (149,163 | ) | (43.5 | )% | ||||
| Weighted-average shares used in the computation of loss per |
||||||||||||||
| Basic |
53,632,299 | 53,252,855 | ||||||||||||
| Diluted |
53,632,299 | 53,252,855 | ||||||||||||
| Loss per share: |
||||||||||||||
| Basic |
$ | (0.48 | ) | $ | (2.80 | ) | ||||||||
| Diluted |
$ | (0.48 | ) | $ | (2.80 | ) | ||||||||
| (1) | Cost of sales, labor, occupancy and store operating expense percentages are calculated using Company Stores revenue. All other line items are calculated using Total revenue. Certain percentage amounts do not sum to total due to rounding. |
45
Table of Contents
Revenue
(in 000’s)
| Year Ended December 29, 2009 |
% of Total Revenue |
Year Ended December 30, 2008 |
% of Total Revenue |
|||||||||
| Revenue: |
||||||||||||
| Company stores |
$ | 295,607 | 98.0 | % | $ | 333,784 | 97.3 | % | ||||
| Franchise and other revenue |
5,946 | 2.0 | % | 9,106 | 2.7 | % | ||||||
| Total revenue |
$ | 301,553 | 100.0 | % | $ | 342,890 | 100.0 | % | ||||
Total revenue is comprised of revenue from Company Stores and royalties and fees from Franchise Stores. Total revenue decreased 12.1% to $301.6 million for fiscal 2009, compared to $342.9 million for the prior year. Company Store revenue decreased 11.4% to $295.6 million compared to $333.8 million for the prior year. The decrease in Company Store revenue is primarily attributable to the decrease in transaction count, partially offset by an increase in average check, as evidenced by the Company Store comparable sales decrease of 10.3% compared to the prior year. The decrease in Company Store revenue was also affected by a net decrease of 33 Company Stores operating since the prior year period, which includes opening two new Company Stores, closing eight stores and refranchising 27 Company Stores in connection with our refranchising initiative and was further affected by the closure of 22 Company Stores at the end of fiscal 2008.
Company Store comparable sales represents the change in year-over-year sales for all Company Stores opened for at least 13 full fiscal periods. At the end of fiscal 2009, approximately 99% of our Company Stores base had been open for at least 13 full fiscal periods.
Franchise and other revenue decreased 34.7% to $5.9 million for fiscal 2009, compared to $9.1 million for the prior year. The number of Franchise Stores as of December 29, 2009 and December 30, 2008 was 261 and 218, respectively. The decrease in franchise and other revenue is primarily attributable to $2.5 million decrease related to fees and reimbursements that the Company received for providing its Florida joint venture with franchise employee support that did not occur in fiscal 2009, lower comparable franchise stores sales, partially offset by a net increase of 43 franchise stores since the prior year period and our purchase of the outstanding ownership interest in our Florida joint venture in the prior year. As Franchise Stores are operated similarly and are experiencing comparable market conditions as Company Stores, the mature Franchise Stores were experiencing similar year-over-year decreases in revenue.
Cost of sales
(in 000’s)
| Year Ended December 29, 2009 |
% of Company Store Revenue |
Year Ended December 30, 2008 |
% of Company Store Revenue |
|||||||||
| Cost of sales |
$ | 72,669 | 24.6 | % | $ | 89,163 | 26.7 | % | ||||
Cost of sales is mostly comprised of the costs of fruit, dairy and other products used to make smoothies and juices, prepared foods and paper products. Cost of sales decreased 18.5% to $72.7 million for fiscal 2009, compared to $89.2 million for the prior year. The $16.5 million decrease in cost of sales was primarily attributable to the net decrease in Company Stores operating since the prior year, cost savings initiatives that continued through fiscal 2009 and a decrease in Company Store comparable sales, partially offset by cost increases attributable to the introduction of our food offerings. As a percentage of Company Store revenue, costs of sales decreased to 24.6% for fiscal 2009 compared to 26.7% for the prior year. The decrease of cost of sales as a percentage of Company Store revenue was primarily attributable to cost savings initiatives that continued through fiscal 2009, a shift in product mix and reductions in waste through our food cost system.
46
Table of Contents
Labor
(in 000’s)
| Year Ended December 29, 2009 |
% of Company Store Revenue |
Year Ended December 30, 2008 |
% of Company Store Revenue |
|||||||||
| Labor |
$ | 100,589 | 34.0 | % | $ | 120,251 | 36.0 | % | ||||
Labor costs are comprised of store management salaries and bonuses, hourly team member payroll, training costs and other associated fringe benefits. Labor costs decreased 16.4% to $100.6 million for fiscal 2009 compared to $120.3 million for the prior year. The $19.7 million decrease in labor costs was primarily attributable to optimization of labor scheduling leading to more efficient labor management, the net decrease in Company Stores since prior year and lower staffing in stores due to a decrease in Company Store comparable sales and a $1.8 million decrease in workers’ compensation cost due to improved claims management. The decrease in labor costs as a percentage of Company Store revenue to 34.0% for fiscal 2009 as compared to 36.0% for the prior year was primarily attributable to optimization of labor scheduling leading to more efficient labor management, partially offset by deleverage resulting from a decrease in Company Store comparable sales.
Occupancy
(in 000’s)
| Year Ended December 29, 2009 |
% of Company Store Revenue |
Year Ended December 30, 2008 |
% of Company Store Revenue |
|||||||||
| Rent |
$ | 33,873 | $ | 35,235 | ||||||||
| Common area maintenance, property taxes, licenses and insurance |
10,015 | 9,633 | ||||||||||
| Total occupancy |
$ | 43,888 | 14.8 | % | $ | 44,868 | 13.4 | % | ||||
Occupancy costs include both fixed and variable portions of rent, common area maintenance charges, property taxes, licenses and property insurance for all Company Store locations. Occupancy costs decreased 2.2% to $43.9 million for fiscal 2009 compared to $44.9 million for the prior year. The $1.4 million decrease in rent expense to $33.9 million was primarily attributable to the net decrease in Company Stores operating since the prior year and benefits from rent reductions that we received from certain landlords. The increase of $0.4 million in common area maintenance, property taxes, licenses and property insurance was primarily attributable to increased real estate taxes and common area maintenance fees, partially offset by the net decrease in Company Stores operating since the prior year. The increase in occupancy costs as a percentage of Company Store revenue to 14.8% in fiscal 2009 as compared to 13.4% for the prior year was primarily due to the deleverage of the fixed portion of occupancy costs resulting from the decrease in Company Store comparable sales.
47
Table of Contents
Store operating
(in 000’s)
| Year Ended December 29, 2009 |
% of Company Store Revenue |
Year Ended December 30, 2008 |
% of Company Store Revenue |
|||||||||
| Utilities |
$ | 11,007 | $ | 11,490 | ||||||||
| Marketing expenses |
5,902 | 8,656 | ||||||||||
| Repairs and maintenance |
5,249 | 5,906 | ||||||||||
| Credit card fees |
3,443 | 3,869 | ||||||||||
| Other |
13,133 | 13,793 | ||||||||||
| Total store operating |
$ | 38,734 | 13.1 | % | $ | 43,714 | 13.1 | % | ||||
Store operating expenses consist primarily of various store-level costs such as utilities, marketing, repairs and maintenance, credit card fees and other store operating expenses. Total store operating expenses decreased 11.4% to $38.7 million for fiscal 2009 compared to $43.7 million for the prior year. The $5.0 million decrease in total store operating expenses was primarily attributable to a decrease in the net number of Company Stores operating in fiscal 2009 as compared to the prior year and the impact of cost savings initiatives instituted during fiscal 2009.
Utilities expense decreased by 4.2% to $11.0 million for fiscal 2009 compared to $11.5 million for the prior year. The $0.5 million decrease in utilities expense was primarily attributable to a decrease in the net number of Company Stores operating in fiscal 2009.
Marketing expenses decreased by 31.8% to $5.9 million for fiscal 2009 compared to $8.7 million for the prior year. The $2.8 million decrease in marketing expenses was primarily attributable to lower promotional spending during fiscal 2009 compared to the prior year as part of our cost savings initiatives.
Repairs and maintenance expense decreased by 11.1% to $5.2 million for fiscal 2009 compared to $5.9 million for the prior year. The $0.7 million decrease in repairs and maintenance expense was primarily attributable to a decrease in the net number of Company Stores operating in fiscal 2009 and to steps taken in connection with our cost savings initiatives.
Credit card fees decreased by 11.0% to $3.4 million for fiscal 2009 compared to $3.9 million for the prior year. The $0.5 million decrease in credit card fees was primarily attributable to a decrease in the net number of Company Stores operating in fiscal 2009 and a decrease in Company Store comparable sales, partially offset by higher usage.
Other store operating expenses decreased by 4.8% to $13.1 million for fiscal 2009 compared to $13.8 million for the prior year. The $0.7 million decrease in other store operating expense was primarily attributable to reductions in cleaning supplies expense and store office expense due to fewer Company Stores operating in fiscal 2009 compared to the prior year and the impact of various cost savings initiatives, partially offset by higher donations as we engage local non-profits and community organizations to drive brand awareness, trial and usage frequency among their members.
Total store operating expenses remained flat as a percentage of Company Store revenue for fiscal 2009 as compared to the prior year which was primarily attributable to a decrease in the net number of Company Stores operating in fiscal 2009 as compared to the prior year and the impact of cost savings initiatives instituted during fiscal 2009, offset by the deleverage of the fixed portion of store operating expenses resulting from the decrease in Company Store comparable sales.
48
Table of Contents
Depreciation and amortization
(in 000’s)
| Year Ended December 29, 2009 |
% of Total Revenue |
Year Ended December 30, 2008 |
% of Total Revenue |
|||||||||
| Depreciation and amortization |
$ | 18,271 | 6.1 | % | $ | 24,717 | 7.2 | % | ||||
Depreciation and amortization expenses include the depreciation of fixed assets and the amortization of intangible assets. Depreciation and amortization decreased 26.1% to $18.3 million for fiscal 2009 compared to $24.7 million for the prior year. The $6.4 million decrease in depreciation and amortization is primarily attributable to the net decrease in Company Stores operating since the prior year and impairment charges for certain stores previously taken in fiscal 2008 and through fiscal 2009. The decrease of depreciation and amortization as a percentage of total revenue to 6.1% for fiscal 2009 as compared to 7.2% for the prior year was primarily attributable to prior impairment charges for certain stores taken in fiscal 2008 and through fiscal 2009, partially offset by deleverage resulting from a decrease in Company Store comparable sales.
General and administrative
(in 000’s)
| Year Ended December 29, 2009 |
% of Total Revenue |
Year Ended December 30, 2008 |
% of Total Revenue |
|||||||||
| Wages and payroll related expenses |
$ | 22,433 | $ | 28,142 | ||||||||
| Outside and contract services |
3,958 | 3,348 | ||||||||||
| Accounting and legal fees |
2,646 | 3,919 | ||||||||||
| Travel and travel-related |
2,376 | 4,209 | ||||||||||
| Share-based compensation |
1,272 | 4,213 | ||||||||||
| Other |
4,359 | 4,226 | ||||||||||
| Total general and administrative |
$ | 37,044 | 12.3 | % | $ | 48,057 | 14.0 | % | ||||
General and administrative (“G&A”) expenses include costs associated with our corporate headquarters in Emeryville, CA, field supervision, bonuses, outside and contract services, accounting and legal fees, travel and travel-related expenses, share-based compensation and other. Total G&A expenses decreased $11.1 million or 22.9% to $37.0 million from $48.1 million and was primarily attributable to decreases in wages and payroll related expenses, shared-based compensation, travel and travel-related expenses and accounting and legal fees.
Wages and payroll related expenses decreased by 20.3% to $22.4 million for fiscal 2009 compared to $28.1 million for the prior year. The $5.7 million decrease in wages and payroll related expenses was primarily attributable to headcount reductions implemented during fiscal 2008 and $1.5 million in severance costs related to workforce reductions recorded during fiscal 2008.
Outside and contract services increased 18.2% to $4.0 million for fiscal 2009 compared to $3.3 million for the prior year. The $0.7 million increase was primarily attributable to payments related to certain sales growth and cost savings initiatives.
Accounting and legal fees decreased by 32.5% to $2.6 million for fiscal 2009 compared to $3.9 million for the prior year. The $1.3 million decrease in accounting and legal fees was primarily attributable to more efficient use of external third-party expertise and greater reliance on internal resources.
Travel and travel-related expenses decreased by 43.5% to $2.4 million for fiscal 2009 compared to $4.2 million for the prior year. The $1.8 million decrease in travel and travel-related expenses was primarily
49
Table of Contents
attributable to more effective management of business travel, reduction in the number of meetings requiring travel and other cost saving measures instituted during the year.
Share-based compensation expense decreased by 69.8% to $1.3 million compared to $4.2 million in the prior year. The $2.9 million decrease in share-based compensation was primarily attributable to the acceleration of certain stock options and equity awards granted to a former executive officer in the prior year and a decrease in fair value of options granted.
Other G&A expenses increased by 3.1% to $4.4 million for fiscal 2009 compared to $4.2 million for the prior year. The $0.2 million increase in other G&A expenses was primarily attributable to project costs related to new product launches and sales driving initiatives.
As a percentage of total revenue, total G&A expenses decreased to 12.3% for fiscal 2009, compared to 14.0% for the prior year. This decrease in G&A expenses as a percentage of total revenue was primarily attributable to decreases in wages and payroll expense, share-based compensation, travel and travel-related expenses and accounting and legal fees, which were partially offset by deleverage resulting from a decrease in Company Store comparable sales, outside and contract services related to certain management initiatives and project costs related to new product launches.
Store pre-opening
(in 000’s)
| Year Ended December 29, 2009 |
% of Total Revenue |
Year Ended December 30, 2008 |
% of Total Revenue |
|||||||||
| Store pre-opening |
$ | 516 | 0.2 | % | $ | 2,044 | 0.6 | % | ||||
Store pre-opening costs are primarily expenses incurred for training new store personnel, pre-opening marketing and pre-opening rent. Store pre-opening costs decreased 74.8% to $0.5 million for fiscal 2009 compared to $2.0 million for the prior year. The $1.5 million decrease in store pre-opening expense was primarily attributable to the opening of two new Company Stores in fiscal 2009 as compared to the opening of 35 new Company Stores in the prior year, and by the opening of 23 Franchise Stores in fiscal 2009 compared to 37 Franchise Stores in the prior year.
Impairment of long-lived assets
(in 000’s)
| Year Ended December 29, 2009 |
% of Total Revenue |
Year Ended December 30, 2008 |
% of Total Revenue |
|||||||||
| Impairment of long-lived assets |
$ | 12,639 | 4.2 | % | $ | 27,802 | 8.1 | % | ||||
Long-lived assets are reviewed for impairment when indicators of impairment are present. Expected future cash flows associated with an asset, in addition to other quantitative and qualitative analyses, including certain assumptions about expected future operating performance and changes in economic conditions are the key factors in determining undiscounted future cash flows. If the sum of the undiscounted cash flows is less than the carrying value of the asset, we recognize an impairment loss equal to the amount by which carrying value exceeds the fair value of the asset.
Impairment of long-lived assets decreased 54.5% to $12.6 million for fiscal 2009 compared to $27.8 million in the prior year. As a percentage of total revenue, impairment of long-lived assets decreased to 4.2% for fiscal
50
Table of Contents
2009, compared to 8.1% for the prior year. For more information, please refer to the discussion under “Business and Summary of Significant Accounting Policies—Impairment of Long-Lived Assets” included in Note 1 in the Notes to Consolidated Financial Statements.
Store lease termination and closure
(in 000’s)
| Year Ended December 29, 2009 |
% of Total Revenue |
Year Ended December 30, 2008 |
% of Total Revenue |
|||||||||
| Store lease termination and closure |
$ | 1,234 | 0.4 | % | $ | 10,029 | 2.9 | % | ||||
Lease termination costs consist primarily of the costs of future obligations related to closed store locations. Discounted liabilities for future lease costs and the fair value of related subleases of closed locations are recorded when the stores are closed. These amounts are subject to adjustments as liabilities are settled. In assessing the discounted liabilities for future costs of obligations related to closed stores, we make assumptions regarding amounts of future subleases. If these assumptions or their related estimates change in the future, we may be required to record additional exit costs or reduce exit costs previously recorded. Exit costs recorded for each of the periods presented include the net effect of such changes in estimates (See Note 9 in the Notes to Consolidated Financial Statements).
Store lease termination and closure costs decreased $8.8 million to $1.2 million in fiscal 2009 compared to $10.0 million in fiscal 2008. This decrease was primarily attributable to the closing of eight Company Stores, of which four were closed prior to their lease expiration in fiscal 2009 as compared to 38 Company Stores in fiscal 2008, of which 30 were closed prior to their lease expiration. The fiscal 2008 closings were a part of our announced restructuring plan to, among other things, close certain underperforming Company Stores. The remaining accrual for lease termination and closure cost at December 29, 2009 is $2.3 million. Lease obligations are payable through 2019.
Trademark and goodwill impairment
(in 000’s)
| Year Ended December 29, 2009 |
% of Total Revenue |
Year Ended December 30, 2008 |
% of Total Revenue |
|||||||||
| Trademark and goodwill impairment |
$ | — | 0.0 | % | $ | 84,061 | 24.5 | % | ||||
There was no trademark and goodwill impairment recorded for fiscal 2009 as the value of our trademarks and goodwill had previously been written down to zero. We recorded $84.1 million of trademark and goodwill impairment during fiscal 2008 primarily related to the impairment of our trademark. Impairment losses recognized resulted from the difference between the fair value and recorded value for goodwill and trademarks (See Note 6 and Note 7 in the Notes to Consolidated Financial Statements). For more information, please refer to the discussion under “Business and Summary of Significant Accounting Policies—Trademark, Goodwill and Other Intangible Asset Impairment” included in Note 1 in the Notes to Consolidated Financial Statements.
Other operating, net
(in 000’s)
| Year Ended December 29, 2009 |
% of Total Revenue |
Year Ended December 30, 2008 |
% of Total Revenue |
||||||||||
| Other operating, net |
$ | (3,924 | ) | (1.3 | )% | $ | 3,817 | 1.1 | % | ||||
51
Table of Contents
Other operating, net consists primarily of gain or loss on disposals, income from jambacard breakage and amortization of jambacard liability. In fiscal 2009, other operating income was $3.9 million for fiscal 2009 compared to other operating expense of $3.8 million for fiscal 2008. The $7.7 million variance in other operating income in fiscal 2009 as compared to fiscal 2008 resulted primarily from a gain of $2.0 million on the sale of certain refranchised Company Stores, a net $1.1 million increase in jambacard breakage income and amortization of jambacard liability, a $1.0 million expense recorded in the prior year resulting from the write-off of loan origination fees and early termination fees for our previous credit agreement with a financial institution and a $1.7 million expense recorded in loss from disposals which occurred in fiscal 2008.
Gain from derivative liabilities
(in 000’s)
| Year Ended December 29, 2009 |
% of Total Revenue |
Year Ended December 30, 2008 |
% of Total Revenue |
|||||||||
| Gain from derivative liabilities |
$ | 1,597 | 0.5 | % | $ | 7,895 | 2.3 | % | ||||
Gain from derivative liabilities decreased 79.8% to $1.6 million in fiscal 2009 compared to $7.9 million for the prior year. The $6.3 million decrease and decrease as a percentage of revenue was attributable to the change in the fair value of our warrants that were classified as derivative liabilities and the change in the fair value of our Put and Call Rights we issued in connection with our previous Financing Agreement (see Note 12 in the Notes to Consolidated Financial Statements). The warrants expired and the put portion of the Put and Call Rights was exercised during the second fiscal quarter of 2009. For more information on our warrants and Put and Call Rights, please refer to the discussion under “Business and Summary of Significant Accounting Policies—Warrants and Derivative Instruments” included in Note 1 in the Notes to Consolidated Financial Statements.
Interest income
(in 000’s)
| Year Ended December 29, 2009 |
% of Total Revenue |
Year Ended December 30, 2008 |
% of Total Revenue |
|||||||||
| Interest income |
$ | 404 | 0.1 | % | $ | 365 | 0.1 | % | ||||
Interest income represents interest earned on cash held in our interest bearing accounts. Interest income was $0.4 million in fiscal 2009 and fiscal 2008. As a percentage of revenue, interest income was 0.1% for fiscal 2009 and fiscal 2008.
Interest Expense
(in 000’s)
| Year Ended December 29, 2009 |
% of Total Revenue |
Year Ended December 30, 2008 |
% of Total Revenue |
|||||||||
| Interest expense |
$ | 6,905 | 2.3 | % | $ | 2,064 | 0.6 | % | ||||
Interest expense for fiscal 2009 increased to $6.9 million for fiscal 2009 compared to $2.1 million for the prior year. As a percentage of total revenue, interest expense increased to 2.3% compared to 0.6% for the prior year. The $4.8 million increase and increase as a percentage of total revenue was primarily attributable to interest paid on our note payable, prepayment penalties and write-off of prepaid loan fees and transaction costs in connection with the repayment of the note payable (See Note 12 in the Notes to Consolidated Financial Statements).
52
Table of Contents
Income tax benefit
(in 000’s)
| Year Ended December 29, 2009 |
% of Total Revenue |
Year Ended December 30, 2008 |
% of Total Revenue |
|||||||||
| Income tax benefit |
$ | 1,066 | 0.4 | % | $ | 274 | 0.1 | % | ||||
Our income tax benefit was $1.1 million in fiscal 2009 and $0.3 million in fiscal 2008. Our effective tax rates for fiscal 2009 and fiscal 2008 were (4.2) % and (0.2) %, respectively. The three most significant items affecting our effective tax rate for 2009 include an increase in the valuation allowance against the deferred tax assets, the release of liability on certain state credits as the statute has expired and the release of the valuation allowance against $0.6 million of alternative minimum tax credits. The most significant item affecting our effective tax rate for fiscal 2008 was the establishment of a valuation allowance against the net deferred tax assets.
53
Table of Contents
JAMBA, INC. RESULTS OF OPERATIONS—FISCAL 2008 COMPARED TO FISCAL 2007
The discussion that follows should be read in conjunction with the consolidated financial statements and notes thereto. Our consolidated results of operations for fiscal 2008 and 2007 are summarized below.
(In thousands, except share data and per share amounts)
| Fiscal year ended | ||||||||||||||
| December 30, 2008 |
%(1) | January 1, 2008 |
%(1) | |||||||||||
| Revenue: |
||||||||||||||
| Company stores |
$ | 333,784 | 97.3 | % | $ | 306,035 | 96.5 | % | ||||||
| Franchise and other revenue |
9,106 | 2.7 | % | 11,174 | 3.5 | % | ||||||||
| Total revenue |
342,890 | 100.0 | % | 317,209 | 100.0 | % | ||||||||
| Costs and operating expenses: |
||||||||||||||
| Cost of sales |
89,163 | 26.7 | % | 84,226 | 27.5 | % | ||||||||
| Labor |
120,251 | 36.0 | % | 102,661 | 33.5 | % | ||||||||
| Occupancy |
44,868 | 13.4 | % | 37,458 | 12.2 | % | ||||||||
| Store operating |
43,714 | 13.1 | % | 39,942 | 13.1 | % | ||||||||
| Depreciation and amortization |
24,717 | 7.2 | % | 19,168 | 6.0 | % | ||||||||
| General and administrative |
48,057 | 14.0 | % | 48,384 | 15.3 | % | ||||||||
| Store pre-opening |
2,044 | 0.6 | % | 5,863 | 1.8 | % | ||||||||
| Impairment of long-lived assets |
27,802 | 8.1 | % | 1,550 | 0.5 | % | ||||||||
| Store lease termination and closure |
10,029 | 2.9 | % | 718 | 0.2 | % | ||||||||
| Trademark and goodwill impairment |
84,061 | 24.5 | % | 200,624 | 63.2 | % | ||||||||
| Other operating, net |
3,817 | 1.1 | % | 4,806 | 1.5 | % | ||||||||
| Total costs and operating expenses |
498,523 | 145.4 | % | 545,400 | 171.9 | % | ||||||||
| Loss from operations |
(155,633 | ) | (45.4 | )% | (228,191 | ) | (71.9 | )% | ||||||
| Other income (expense): |
||||||||||||||
| Gain from derivative liabilities |
7,895 | 2.3 | % | 59,424 | 18.7 | % | ||||||||
| Interest income |
365 | 0.1 | % | 3,517 | 1.1 | % | ||||||||
| Interest expense |
(2,064 | ) | (0.6 | )% | (181 | ) | (0.1 | )% | ||||||
| Total other income, net |
6,196 | 1.8 | % | 62,760 | 19.7 | % | ||||||||
| Loss before income taxes |
(149,437 | ) | (43.6 | )% | (165,431 | ) | (52.2 | )% | ||||||
| Income tax benefit |
274 | 0.1 | % | 52,135 | 16.4 | % | ||||||||
| Net loss |
$ | (149,163 | ) | (43.5 | )% | $ | (113,296 | ) | (35.8 | )% | ||||
| Weighted-average shares used in the computation of loss per share: |
||||||||||||||
| Basic |
53,252,855 | 52,323,898 | ||||||||||||
| Diluted |
53,252,855 | 52,323,898 | ||||||||||||
| Loss per share: |
||||||||||||||
| Basic |
$ | (2.80 | ) | $ | (2.17 | ) | ||||||||
| Diluted |
$ | (2.80 | ) | $ | (2.17 | ) | ||||||||
| (1) | Cost of sales, labor, occupancy and store operating expense percentages are calculated using Company Stores revenue. All other line items are calculated using Total revenue. Certain percentage amounts do not sum to total due to rounding. |
54
Table of Contents
Revenue
(in 000’s)
| Year Ended December 30, 2008 |
% of Total Revenue |
Year Ended January 1, 2008 |
% of Total Revenue |
|||||||||
| Revenue: |
||||||||||||
| Company stores |
$ | 333,784 | 97.3 | % | $ | 306,035 | 96.5 | % | ||||
| Franchise and other revenue |
9,106 | 2.7 | % | 11,174 | 3.5 | % | ||||||
| Total revenue |
$ | 342,890 | 100.0 | % | $ | 317,209 | 100.0 | % | ||||
Total revenue is comprised of revenue from Company Stores and royalties and fees from Franchise Stores. Total revenue increased 8.1% to $342.9 million for fiscal 2008, compared to $317.2 million for the prior year. Company Store revenue increased 9.1% to $333.8 million compared to $306.0 million for the prior year. The increase in Company Store revenue is primarily associated with the impact from the increased net number of Company Stores operating in fiscal 2008 as compared to the prior year. The net number of Company Stores operating in fiscal 2008 is comprised of the opening of 35 new Company Stores during fiscal 2008, the full year impact of 99 new Company Stores opened during fiscal 2007, and the full year impact of 34 former Franchise Stores acquired by the Company in fiscal 2007, partially offset by the closures of 38 Company Stores in fiscal 2008, three of which occurred during the first fiscal 2008 quarter, 11 of which occurred during the second fiscal 2008 quarter, two of which occurred during the third fiscal 2008 quarter, and 22 of which occurred during the fourth fiscal 2008 quarter. Company Store comparable sales decreased by (8.1)% for fiscal 2008. Company Store comparable sales represents the change in year-over-year sales for all Company Stores opened for at least 13 full fiscal periods. At the end of fiscal 2008, 94% of our Company Stores base had been open for at least 13 full fiscal periods. The decrease in Company Store comparable sales was driven primarily by a decrease in transaction count, partially offset by an increase in average check.
Franchise and other revenue decreased 18.5% to $9.1 million for fiscal 2008, compared to $11.2 million for the prior year. The number of Franchise Stores as of December 30, 2008 and January 1, 2008 was 218 and 206, respectively. The decrease in franchise and other revenue in fiscal 2008 compared to the prior year was attributable to $1.3 million deferred royalties from JJC Florida, LLC recognized in fiscal 2007 and the decreased royalty revenue in fiscal 2008 of existing Franchise Stores. As Franchise Stores are operated similarly and are experiencing similar market conditions as Company Stores, the mature Franchise Stores will be experiencing similar year-over-year decreases in revenue.
Cost of Sales
(in 000’s)
| Year Ended December 30, 2008 |
% of Company Store Revenue |
Year Ended January 1, 2008 |
% of Company Store Revenue |
|||||||||
| Cost of sales |
$ | 89,163 | 26.7 | % | $ | 84,226 | 27.5 | % | ||||
Cost of sales is mostly comprised of fruit, dairy and other products used to make smoothies and juices, as well as paper products. Cost of sales increased 5.9% to $89.2 million for fiscal 2008, compared to $84.2 million for the prior year. The $4.9 million increase in cost of sales was due primarily to the increase in Company Store sales as a result of the increased net number of Company Stores operating in fiscal 2008 as compared to the prior year. Despite increases in commodities prices, as a percentage of Company Store revenue, costs of sales decreased to 26.7% for fiscal 2008 compared to 27.5% for the prior year. The decrease of cost of sales as a percentage of Company Store revenue was accomplished in several ways, including a favorable net impact as a result of the product mix shift to higher margin products, price increases taken during fiscal 2008, reduction in waste through improved inventory management, and several cost savings initiatives implemented in fiscal 2008.
55
Table of Contents
Labor
(in 000’s)
| Year Ended December 30, 2008 |
% of Company Store Revenue |
Year Ended January 1, 2008 |
% of Company Store Revenue |
|||||||||
| Labor |
$ | 120,251 | 36.0 | % | $ | 102,661 | 33.5 | % | ||||
Labor costs are comprised of store management salaries and bonuses, hourly team member payroll, training costs and other associated fringe benefits. Labor costs increased 17.1% to $120.3 million for fiscal 2008 compared to $102.7 million for the prior year. The $17.6 million increase in labor costs was due primarily to the increased net number of Company Stores operating in fiscal 2008 as compared to the prior year and the effect of state and federal minimum wage increases that occurred during fiscal 2008 at new and existing Company Stores which was partially offset by reduced improved labor management in those stores. The increase in labor costs as a percentage of Company Store revenue to 36.0% for fiscal 2008 as compared to 33.5% for the prior year was due to a combination of the deleverage of the fixed portion of labor costs resulting from the decrease in Company Store comparable sales and federal and state minimum wage increases affecting most states in which we operate.
Occupancy
(in 000’s)
| Year Ended December 30, 2008 |
% of Company Store Revenue |
Year Ended January 1, 2008 |
% of Company Store Revenue |
|||||||||
| Rent |
$ | 35,235 | $ | 30,224 | ||||||||
| Common area maintenance, real estate taxes, licenses and insurance |
9,633 | 7,234 | ||||||||||
| Total occupancy |
$ | 44,868 | 13.4 | % | $ | 37,458 | 12.2 | % | ||||
Occupancy costs include both fixed and variable portions of rent, real estate taxes, property insurance and common area maintenance charges for all Company Store locations. Occupancy costs increased 19.8% to $44.9 million for fiscal 2008 compared to $37.5 million for the prior year. The $7.4 million increase in occupancy costs was due to the increased net number of Company Stores operating in fiscal 2008 as compared to the prior year. The increase in occupancy costs as a percentage of Company Store revenue to 13.4% in fiscal 2008 as compared to 12.2% for the prior year was primarily due to the deleverage of the fixed portion of occupancy costs resulting from the decrease in Company Store comparable sales.
Store Operating
(in 000’s)
| Year Ended December 30, 2008 |
% of Company Store Revenue |
Year Ended January 1, 2008 |
% of Company Store Revenue |
|||||||||
| Marketing expenses |
$ | 8,656 | $ | 9,600 | ||||||||
| Utilities |
11,490 | 9,325 | ||||||||||
| Repairs and maintenance |
5,906 | 4,144 | ||||||||||
| Credit card fees |
3,869 | 3,504 | ||||||||||
| Other |
13,793 | 13,369 | ||||||||||
| Total store operating |
$ | 43,714 | 13.1 | % | $ | 39,942 | 13.1 | % | ||||
56
Table of Contents
Marketing expenses decreased by 9.8% to $8.7 million for fiscal 2008 compared to $9.6 million for the prior year. The $0.9 million decrease in marketing expenses was primarily due to lower promotional spending during fiscal 2008 compared to fiscal 2007 as part of the Company’s cost-saving initiatives.
Utilities expense increased by 23.2% to $11.5 million for fiscal 2008 compared to $9.3 million for the prior year. The $2.2 million increase in utilities expense was primarily due to an increase in the net number of Company Stores operating in fiscal 2008.
Repairs and maintenance expense increased by 42.5% to $5.9 million for fiscal 2008 compared to $4.1 million for the prior year. The $1.8 million increase in repairs and maintenance expense was primarily due to an increase in the net number of Company Stores operating in fiscal 2008 and the consolidation of “refurbishment” costs into “repair and maintenance” costs in fiscal 2008 where such refurbishment costs were classified as Store Operating “other” expenses in fiscal 2007.
Credit card fees increased by 10.4% to $3.9 million for fiscal 2008 compared to $3.5 million for the prior year. The $0.4 million increase in credit card fees was primarily due to an increase in the volume of total credit card transactions partially offset by lower credit card fees per transaction as a result of renegotiated terms with our credit card processing provider.
Other store operating expenses increased by 3.2% to $ 13.8 million for fiscal 2008 compared to $13.4 million for the prior year. The $0.4 million increase in other store operating expense was primarily due to an increase in the net number of Company Stores operating in fiscal 2008 partially offset by savings resulting from various cost savings initiatives and the treatment of refurbishment costs as described above.
Total store operating expenses increased 9.4% to $43.7 million for fiscal 2008 compared to $39.9 million for the prior year. The $3.8 million increase in total store operating expenses was primarily due to the increased net number of Company Stores operating in fiscal 2008 as compared to the prior year.
Total store operating expenses remained constant as a percentage of Company Store revenue for fiscal 2008 as compared to the prior year primarily due to decreases in national and local marketing expenses and cost savings initiatives implemented in fiscal 2008, partially offset by the deleverage of the fixed portion of store operating expenses resulting from the decrease in Company Store comparable sales.
Depreciation and Amortization
(in 000’s)
| Year Ended December 30, 2008 |
% of Total Revenue |
Year Ended January 1, 2008 |
% of Total Revenue |
|||||||||
| Depreciation and amortization |
$ | 24,717 | 7.2 | % | $ | 19,168 | 6.0 | % | ||||
Depreciation and amortization expenses include the depreciation of fixed assets and the amortization of intangible assets. Depreciation and amortization increased 28.9% to $24.7 million for fiscal 2008 compared to $19.2 million for the prior year. The $5.5 million increase in depreciation and amortization is due to depreciation on the increased net number of Company Stores operating in fiscal 2008 combined with increased amortization due to intangible assets write-offs associated with employment agreements for separated executives and favorable leases of certain closed Company Stores. The increase of depreciation and amortization as a percentage of total revenue to 7.2% for fiscal 2008 as compared to 6.0% for the prior year was primarily due to the intangible assets write-offs and deleverage of depreciation costs resulting from the decrease in Company Store comparable sales.
57
Table of Contents
General and Administrative
(in 000’s)
| Year Ended December 30, 2008 |
% of Total Revenue |
Year Ended January 1, 2008 |
% of Total Revenue |
|||||||||
| Wages and payroll related expenses |
$ | 28,072 | $ | 26,586 | ||||||||
| Relocation and recruiting |
306 | 1,704 | ||||||||||
| Accounting and legal fees |
3,919 | 6,724 | ||||||||||
| Share-based compensation |
4,213 | 4,214 | ||||||||||
| Outside services |
3,106 | 3,068 | ||||||||||
| Other |
8,441 | 6,088 | ||||||||||
| Total general and administrative |
$ | 48,057 | 14.0 | % | $ | 48,384 | 15.3 | % | ||||
General and administrative (“G&A”) expenses include costs associated with our corporate headquarters in Emeryville, CA, field supervision, bonuses, legal, accounting and professional fees and share-based compensation.
Wages and payroll related expenses increased by 5.6% to $28.1 million for fiscal 2008 compared to $26.6 million for the prior year. The $1.5 million increase in wages and payroll related expenses was primarily due to one-time severance costs, the signing bonus associated with the hiring of our new Chief Executive Officer, and full fiscal year effect of new hires made in fiscal 2007. These increases of approximately $3.2 million were partially offset by reductions in our workforce implemented during late fiscal 2008.
Relocation and recruiting expenses decreased by 82.0% to $0.3 million for fiscal 2008 compared to $1.7 million for the prior year. The $1.4 million decrease in relocation and recruiting expense was primarily due to more moderate hiring during fiscal 2008 compared to high levels of growth we experienced the prior year.
Accounting and legal fees decreased by 41.7% to $3.9 million for fiscal 2008 compared to $6.7 million for the prior year. The $2.8 million decrease in accounting and legal fees was primarily due to a decrease in accounting fees combined with lower public company costs incurred, and lower costs incurred for the use of outside counsel in connection with litigation and other matters in fiscal 2008 compared to the prior year.
Share-based compensation expense was flat for fiscal 2008 compared to the prior year, primarily due to a decrease in our stock price which caused a corresponding reduction in the exercise price of options that we granted in fiscal 2008 as compared to fiscal 2007, which was offset by $2.1 million charged for the acceleration of vesting on options held by certain of our executives who separated from the Company in late fiscal 2008.
Outside services increased 1.2% to $3.1 million for fiscal 2008 compared to $3.0 million for the prior year. The $0.1 million increase was due to payments to certain members of our Board of Directors and other advisors as additional compensation for services rendered in connection with our management transition and revitalization efforts, and a $0.2 million recruitment fee related to the hiring of our new Chief Executive Officer, partially offset by a decrease in Board of Director fees for certain Board members who voluntarily declined their quarterly Board compensation and other decreases associated with cost savings initiatives.
Other G&A expenses increased by 38.6% to $8.4 million for fiscal 2008 compared to $6.1 million for the prior year. The $2.3 million increase in other G&A expenses was primarily due to implementation of internal business and infrastructure projects, the reduction in the amount of corporate G&A expenses being capitalized versus expensed due to the decrease in the number of new stores opened in fiscal 2008 as compared to the prior year, project costs related to new product launches and an increase in rent which was partially offset by a decrease in the usage of contract services.
58
Table of Contents
Total G&A expenses decreased 0.7% to $48.1 million for fiscal 2008 compared to $48.4 million for the prior year. The $0.3 million decrease in Total G&A expenses is due to lower accounting and legal fees, lower contract services fees, lower relocation and recruiting costs, headcount reduction and cost-saving initiatives that began in May 2008, aggregating to a $6.0 million reduction in Total G&A fees. The decrease in G&A expenses in fiscal 2008 was almost fully offset by severance costs, employee-related special charges and other expenses, project costs associated with new product launches, costs associated with the hiring of our new Chief Executive Officer and costs associated with the management transition and revitalization efforts, aggregating to $3.4 million and the $2.3 million reduction of overhead capitalization due to reduced store openings.
As a percentage of total revenue, total G&A expenses decreased to 14.0% for fiscal 2008, compared to 15.3% for the prior year. This decrease in G&A expenses as a percentage of total revenue was attributable to increased total revenue.
Store Pre-opening
(in 000’s)
| Year Ended December 30, 2008 |
% of Total Revenue |
Year Ended January 1, 2008 |
% of Total Revenue |
|||||||||
| Store pre-opening |
$ | 2,044 | 0.6 | % | $ | 5,863 | 1.8 | % | ||||
Store pre-opening costs are primarily expenses incurred for training new store personnel, pre-opening marketing and pre-opening rent. Store pre-opening costs decreased 65.1% to $2.0 million for fiscal 2008 compared to $5.9 million for the prior year. The $3.8 million decrease in store pre-opening expense was due to the opening of 35 new Company Stores in fiscal 2008 as compared to the opening 99 new Company Stores in the prior year.
Impairment of long-lived assets
(in 000’s)
| Year Ended December 30, 2008 |
% of Total Revenue |
Year Ended January 1, 2008 |
% of Total Revenue |
|||||||||
| Impairment of long-lived assets |
$ | 27,802 | 8.1 | % | $ | 1,550 | 0.5 | % | ||||
Impairment of long-lived assets which includes leasehold improvements and other fixed assets represents non-cash charges related to the write off of the carrying value of store fixed assets for underperforming Company Stores that are currently operating and was $27.8 million for fiscal 2008 compared to $1.6 million for fiscal 2007. During fiscal 2008, we impaired 144 Company Stores as compared to 20 Company Stores in fiscal 2007.
Store Lease Termination and Closure
(in 000’s)
| Year Ended December 30, 2008 |
% of Total Revenue |
Year Ended January 1, 2008 |
% of Total Revenue |
|||||||||
| Store lease termination and closure |
$ | 10,029 | 2.9 | % | $ | 718 | 0.2 | % | ||||
Store lease termination and closure costs were $10.0 million in fiscal 2008 compared to $0.7 million in fiscal 2007. During fiscal 2008, the Company announced a restructuring plan to, among other things, close certain underperforming Company Stores. We closed 38 Company Stores in fiscal 2008, 30 of which were closed prior to their lease expiration, as compared to five Company Stores in fiscal 2007, four of which were closed prior to their contractual lease expiration date.
59
Table of Contents
Lease termination costs consist primarily of the costs of future obligations related to closed store locations. Discounted liabilities for future lease costs and the fair value of related subleases of closed locations are recorded when the stores are closed. All other costs related to closed units are expensed as incurred. In assessing the discounted liabilities for future costs of obligations related to closed stores, we make assumptions regarding amounts of future subleases. If these assumptions or their related estimates change in the future, we may be required to record additional exit costs or reduce exit costs previously recorded. Exit costs recorded for each of the periods presented include the effect of such changes in estimates (See Note 9 in the Notes to Consolidated Financial Statements).
Trademark and Goodwill Impairment
(in 000’s)
| Year Ended December 30, 2008 |
% of Total Revenue |
Year Ended January 1, 2008 |
% of Total Revenue |
|||||||||
| Trademark and goodwill impairment |
$ | 84,061 | 24.5 | % | $ | 200,624 | 63.2 | % | ||||
Trademark and goodwill impairment in fiscal 2008 was $84.0 million, of which $82.6 million related to the impairment of our trademark, $0.6 million related to the impairment of goodwill from our purchase of the 65% interest in JJC Florida, LLC and $0.8 million related to the impairment of our 35% interest in JJC Florida, LLC. In fiscal 2007, goodwill impairment was $111.0 million and trademark impairment was $89.6 million. Impairment losses related to the difference between the fair value and recorded value for goodwill and trademarks (see Note 6 and Note 7 in the Notes to Consolidated Financial Statements). For more information, please see the “Critical Accounting Policies and Estimates” section of Management’s Discussion and Analysis of Financial Condition and Results of Operations.
Other Operating, net
(in 000’s)
| Year Ended December 30, 2008 |
% of Total Revenue |
Year Ended January 1, 2008 |
% of Total Revenue |
|||||||||
| Other operating, net |
$ | 3,817 | 1.1 | % | $ | 4,806 | 1.5 | % | ||||
Other operating expenses, which consist primarily of franchise support expenses, losses on disposals, amortization of jambacard™ liability and income from jambacard™ breakage, decreased 20.6% to $3.8 million for fiscal 2008 compared to $4.8 million for fiscal 2007. Franchise support expenses are costs associated with franchise employee support provided to JJC Florida, LLC. This decrease in other operating expenses was primarily attributable to a $2.0 million increase in jambacard breakage ($1.6 million of which resulted from a decrease in amortization of jambacard™ liability) and a $0.3 million decrease in franchise support expenses due primarily to reductions in headcount, which was partially offset by a $1.0 million expense resulting from the write-off of loan origination fees and $0.9 million increase in loss from disposals. The decrease of other operating expenses as a percentage of total revenue decreased to 1.1% in fiscal 2008 as compared to 1.5% in fiscal 2007, and this decrease was primarily attributable to the same causes.
Other Income (Expense)
Gain from derivative instruments was $7.9 million and $59.4 million for fiscal 2008 and fiscal 2007, respectively. Our warrants and put and call agreement both are recorded as derivative liabilities. The gain from warrants was $9.2 million in fiscal 2008 as compared to $59.4 million in fiscal 2007 and represents the unrealized gain or loss due to the change in the fair value of the Company’s warrants. During fiscal 2008, the Company also entered into the Financing Agreement that resulted in a put and call agreement. The unrealized
60
Table of Contents
loss from this put and call agreement was $1.3 million in fiscal 2008. The Company’s warrants are recorded as derivative liabilities, instead of equity instruments. For more information, please see the “Critical Accounting Policies and Estimates” section of Management’s Discussion and Analysis of Financial Condition and Results of Operations.
Interest income decreased to $0.4 million for fiscal 2008 from $3.5 million for fiscal 2007. Interest income represents interest earned on cash held in the Company’s investment account. The decrease in interest income was primarily due to the deployment of cash in fiscal 2007 to fund new Company Stores openings and day to day operations. While cash on hand as of December 30, 2008 was $20.8 million as compared to $23.0 million at the end of fiscal 2007, the average cash balance during fiscal 2008 was significantly lower during the year, until funding was provided with the Financing Agreement in September, 2008.
Interest expense increased to $2.1 million for fiscal 2008 from $0.2 million for fiscal 2007. Interest expense for fiscal 2008 represents interest paid on borrowings from our Financing Agreement. We did not have any outstanding borrowings in fiscal 2007. Interest expense for fiscal 2007 represents fees for the Company’s unused line of credit.
Income Tax Benefit (Expense)
The Company’s income tax benefit (expense) was $0.3 million in fiscal 2008 and $52.1 million in fiscal 2007. The effective tax rates were (0.2)% and (31.5)%, respectively. The most significant item affecting the Company’s effective tax rate for fiscal 2008 is the establishment of a valuation allowance against the net deferred tax assets. The two most significant items affecting the Company’s effective tax rate for fiscal 2007 are the unrealized gain on our derivative liability of $59.4 million and the impairment of goodwill of $91.5 million which is the portion of the goodwill impairment that does not have a future tax benefit.
LIQUIDITY AND CAPITAL RESOURCES
Cash Flows Summary
The following table summarizes our cash flows for each of the past two full fiscal years (in thousands):
| December 29, 2009 |
December 30, 2008 |
|||||||
| Net cash provided by operating activities |
$ | 8,464 | $ | 8,164 | ||||
| Net cash used in investing activities |
(3,127 | ) | (33,050 | ) | ||||
| Net cash provided by financing activities |
2,598 | 22,692 | ||||||
| Net increase (decrease) in cash and cash equivalents |
$ | 7,935 | $ | (2,194 | ) | |||
Known Events, Trends or Uncertainties Impacting or Expected to Impact Comparisons of Reported or Future Results
In fiscal 2009, we announced our plan to refranchise up to 150 Company Stores. The impact of this refranchising on our 2010 results will be determined by the stores that we are able to successfully refranchise and the specific prices we are able to obtain for those stores. Additionally, when a Company Store is refranchised into a Franchise Store, notwithstanding any proceeds received from the sale of such stores, in the long term we ultimately exchange revenue from Company Store sales for only a percentage of such sales in the form of royalty payments.
61
Table of Contents
Operating Activities
In fiscal 2009, net cash provided by operating activities was $8.5 million, compared with net cash provided by operating activities of $8.2 million in fiscal 2008. Cash provided by operating activities for fiscal 2009 and fiscal 2008 resulted primarily from changes in working capital, combined with our net loss excluding share-based compensation, depreciation and amortization and other non-cash expenses.
Investing Activities
In fiscal 2009, net cash used in investing activities was $3.1 million, compared with net cash used in investing activities of approximately $33.1 million in fiscal 2008. Capital expenditures are the largest component of our investing activities and include the development of new Company Stores and acquisition of personal property and equipment for existing Company Stores. We opened two Company Stores in fiscal 2009 as compared to 35 Company Stores in fiscal 2008. Net cash used in investing activities in fiscal 2009 was also affected by a change in restricted cash of $3.0 million as a result of the payoff of our Financing Agreement during the year (see Note 12 in the Notes to Consolidated Financial Statements) and proceeds from the sale of Company Stores in refranchising transactions of $4.2 million.
Capital expenditures for fiscal 2009 was $10.8 million as compared to $30.2 million in fiscal 2008. The decrease in capital expenditures resulted primarily from our decision to substantially slow new Company Store development and Franchise Store acquisitions. In fiscal 2010, we expect capital expenditures to be between $9 million to $11 million depending on our liquidity needs. We expect to open less than five new Company Stores as we focus our growth on franchise development. We anticipate investing in new equipment to support building our food capability and upgrade our information system technology.
Financing Activities
In fiscal 2009, net cash provided by financing activities was $2.6 million, compared with net cash provided by financing activities of $22.7 million in fiscal 2008. Cash provided by financing activities for fiscal 2009 resulted primarily from net proceeds of our issuance of preferred stock of $34.1 million, which was used to pay off our note payable of $25.0 million principal plus accrued interest, the exercise of an outstanding put option which required us to repurchase two million shares of our outstanding stock for $3.0 million, transaction costs paid in connection with the issuance of our preferred stock of $1.9 million, preferred stock dividend payments of $1.4 million and payment on capital leases of $0.3 million.
Liquidity
We used a substantial portion of the proceeds from the sale of the Series B Preferred Stock in June 2009 to repay the Senior Notes and certain related transaction costs. The Series B Preferred Stock we issued has an 8% dividend, payable quarterly in cash and accrues irrespective of whether dividends are actually declared or paid. While we no longer carry the debt or the monthly interest payment obligations associated with the Senior Notes, we do have a dividend obligation, payable quarterly measured from the original date of issuance of the Series B Preferred Stock, in an aggregate amount of $700,000 per quarter based on the current number of shares of Series B Preferred Stock outstanding and the current dividend rate of 8% per year. The dividend rate shall increase to 10% in the event the Common Stock is not listed for trading on any of the New York Stock Exchange, the NASDAQ Global Market or the American Stock Exchange or if we fail to declare and pay, in full and in cash, dividends on shares of the Series B Preferred Stock for three consecutive quarters until such time as the dividends are paid in full and in cash. After seven years from the date the shares of Series B Preferred Stock are originally issued, the holders of such shares will have the right to require us to redeem their shares of Series B Preferred Stock, in whole or in part, at a price per share equal to the original sale price per share plus any unpaid but accrued dividends.
62
Table of Contents
As of December 29, 2009, we had cash and cash equivalents of $28.8 million and no short term or long term debt compared to $20.8 million in cash and cash equivalents and an outstanding balance on our Senior Notes as of December 30, 2008. Our primary sources of liquidity are the remaining cash on hand resulting from the issuance of the Series B Preferred Stock and cash flows provided by operating activities. In the future, and as permitted under the Securities Purchase Agreement for the Series B Preferred Stock, we may enter into equipment leasing arrangements and incur up to $10.0 million of indebtedness as necessary. We cannot assure, however, that such financing will be available on favorable terms or at all. As of December 29, 2009, we held $2.7 million in restricted cash, which represented cash held in money market accounts or certificates of deposit to collateralize our letters of credit.
On May 28, 2009, we announced the launch of a refranchising program that is expected to involve the sale of as many as 150 Company Stores primarily located outside of California to existing or prospective franchisees. By the end of fiscal 2010, we expect the sale of any such Company Stores to generate additional cash which we intend to use to fund future growth and for working capital, if necessary. Through the end of fiscal 2009, we completed the sale of 27 Company Stores for aggregate proceeds of $4.2 million and have subsequently completed the sale of an additional 20 stores for aggregate proceeds of $5.0 million.
We expect that our cash on hand, cash flows provided by operating activities and funds from our refranchising initiative will be sufficient to fund our working capital and general corporate needs, Series B Preferred Stock dividend payments and the non-discretionary capital expenditures for at least the next 12 months. Our primary liquidity and capital requirements for working capital and general corporate needs and the planned fiscal 2010 capital expenditures are described above. The use of cash to fund discretionary capital expenditures will be based on the need to conserve our capital.
The adequacy of our available funds will depend on many factors, including the macroeconomic environment, the operating performance of our Company Stores, the successful expansion of our franchise and licensing programs, our refranchising initiative and the successful rollout and consumer acceptance of our food initiatives. Given these factors, our foremost priorities for the near term are preserving and generating cash sufficient to fund our liquidity needs.
Contractual Obligations
The following table summarizes contractual obligations and borrowings as of December 29, 2009, and the timing and effect that such commitments are expected to have on our liquidity and capital requirements in future periods. We expect to fund these commitments primarily with operating cash flows generated in the normal course of business.
| Payments Due by Period (in 000’s) | |||||||||||||||
| Total | Less Than 1 Year |
1-2 Years | 3-4 Years | 5 or More Years | |||||||||||
| Operating lease obligations(1) |
$ | 191,789 | $ | 34,879 | $ | 64,736 | $ | 52,021 | $ | 40,153 | |||||
| Purchase obligations(2) |
72,227 | 27,341 | 15,829 | 4,355 | 24,702 | ||||||||||
| Capital leases |
436 | 416 | 20 | — | — | ||||||||||
| Series B redeemable preferred stock redemption |
35,000 | — | — | — | 35,000 | ||||||||||
| Dividends for Series B redeemable preferred stock |
18,083 | 2,800 | 5,600 | 5,600 | 4,083 | ||||||||||
| Total |
$ | 317,535 | $ | 65,436 | $ | 86,185 | $ | 61,976 | $ | 103,938 | |||||
| (1) | Our wholly owned subsidiary, Jamba Juice Company, is a party to each Company Store lease obligation. The operating lease obligations represent future minimum lease payments under non-cancelable operating leases as of December 29, 2009. The minimum lease payments do not include common area maintenance (“CAM”) charges, insurance, contingent rent obligations or real estate taxes, which are also required contractual obligations under our operating leases. In the majority of our operating leases, CAM charges are not fixed and can fluctuate from year to year. Total CAM charges, insurance, contingent rent obligations, license, permits and real estate taxes for our fiscal year ended December 29, 2009 were $10.0 million. |
63
Table of Contents
| (2) | We negotiate pricing and quality specifications for many of the products used in Company Stores and Franchise Stores. This allows for volume pricing and consistent quality of products that meet our standards. Although we negotiate and contract directly with manufacturers, co-packers or growers for our products, we purchase these products from third-party centralized distributors. These distributors source, warehouse and deliver specified products to both Company Stores and Franchise Stores. We also have contracts with certain vendors which require minimum purchases that are included in the purchase obligations noted above. |
As of December 29, 2009, our gross unrecognized tax benefits totaled $1.1 million and are not included in the table as a reasonably reliable estimate of the timing of future payments, if any, cannot be predicted.
Off-Balance Sheet Arrangements
We have no off-balance sheet arrangements.
New Accounting Standards
See the Recent Accounting Pronouncements section in Note 1 of our Notes to Consolidated Financial Statements for a summary of new accounting standards.
SEASONALITY AND QUARTERLY RESULTS
Our business is highly subject to day to day volatility based on weather and varies by season. A significant portion of our revenue is realized during the second and third quarters of the fiscal year, which include the summer months. The fourth quarter of the fiscal year, which encompasses the winter months and the holiday season, has traditionally been our lowest revenue volume quarter. Although we have expanded the number of stores offering our hot oatmeal, “grab-and-go” food and California Flatbread selections and we recently announced the launch of our Hot Blends beverage platform to help offset the seasonal nature of our business, our business will likely continue to be subject to seasonal patterns for the foreseeable future, given that the largest portion of our sales continues to be from the sale of smoothies during the warmer parts of the year. Because of the seasonality of the business, results for an individual quarter are not necessarily indicative of the results which may be achieved for the full fiscal year.
INFLATION
We do not believe that inflation has had a material impact on our results of operations in recent years. However, we cannot predict what effect inflation may have on our operations in the future.
| ITEM 7A. | QUANTITATIVE AND QUALITATIVE DISCLOSURES ABOUT MARKET RISK |
Interest Rates
We do not enter into market risk sensitive instruments for trading purposes. We are exposed to financial market risks due primarily to changes in interest rates in our interest bearing accounts. We do not believe a change in interest rate will materially affect our financial position or results of operations. A one percent change of the interest rate would result in an annual change in the results of operations of $0.2 million.
Commodities Prices
We purchase significant amounts of fruits and dairy products to support the needs of our Company Stores. The price and availability of these commodities directly impacts the results of operations and can be expected to impact the future results of operations.
64
Table of Contents
We purchase fruit based on short-term seasonal pricing agreements. These short-term agreements generally set the price of procured frozen fruit and 100% pure fruit concentrates for less than one year based on estimated annual requirements. In order to mitigate the effects of price changes in any one commodity on its cost structure, we contract with multiple suppliers both domestically and internationally. These agreements typically set the price for some or all of our estimated annual fruit requirements, protecting us from short-term volatility. Nevertheless, these agreements typically contain a force majeure clause, which, if utilized (such as hurricanes in 2004 that destroyed the Florida orange crop and more recently with the 2007 freeze that affected California citrus), may subject us to significant price increases.
Our pricing philosophy is not to attempt to change consumer prices with every move up or down of the commodity market, but to take a longer term view of managing margins and the value perception of its products in the eyes of our customers. Our objective is to maximize our revenue through increased customer traffic.
65
Table of Contents
| ITEM 8. | FINANCIAL STATEMENTS AND SUPPLEMENTARY DATA |
REPORT OF INDEPENDENT REGISTERED PUBLIC ACCOUNTING FIRM
The Board of Directors and Stockholders
Jamba, Inc.:
We have audited the accompanying consolidated balance sheets of Jamba, Inc. and subsidiary as of December 29, 2009 and December 30, 2008, and the related consolidated statements of operations, stockholders’ equity, and cash flows for the fiscal years ended December 29, 2009 and December 30, 2008. These consolidated financial statements are the responsibility of the Company’s management. Our responsibility is to express an opinion on these consolidated financial statements based on our audits.
We conducted our audits in accordance with the standards of the Public Company Accounting Oversight Board (United States). Those standards require that we plan and perform the audit to obtain reasonable assurance about whether the financial statements are free of material misstatement. An audit includes examining, on a test basis, evidence supporting the amounts and disclosures in the financial statements. An audit also includes assessing the accounting principles used and significant estimates made by management, as well as evaluating the overall financial statement presentation. We believe that our audits provide a reasonable basis for our opinion.
In our opinion, the consolidated financial statements referred to above present fairly, in all material respects, the financial position of Jamba, Inc. and subsidiary as of December 29, 2009 and December 30, 2008, and the results of their operations and their cash flows for the fiscal years ended December 29, 2009 and December 30, 2008, in conformity with U.S. generally accepted accounting principles.
We also have audited, in accordance with the standards of the Public Company Accounting Oversight Board (United States), Jamba, Inc.’s internal control over financial reporting as of December 29, 2009, based on criteria established in Internal Control—Integrated Framework issued by the Committee of Sponsoring Organizations of the Treadway Commission (COSO), and our report dated March 10, 2010 expressed an unqualified opinion on the effectiveness of the Company’s internal control over financial reporting.
| /s/ KPMG LLP |
| San Francisco, California March 10, 2010 |
66
Table of Contents
REPORT OF INDEPENDENT REGISTERED PUBLIC ACCOUNTING FIRM
To the Board of Directors and Stockholders of Jamba, Inc.
Emeryville, California
We have audited the consolidated statements of operations, stockholders’ equity, and cash flows of Jamba, Inc. and subsidiary (the “Company”) for the fiscal year ended January 1, 2008. These financial statements are the responsibility of the Company’s management. Our responsibility is to express an opinion on these financial statements based on our audit.
We conducted our audit in accordance with the standards of the Public Company Accounting Oversight Board (United States). Those standards require that we plan and perform the audit to obtain reasonable assurance about whether the financial statements are free of material misstatement. An audit includes examining, on a test basis, evidence supporting the amounts and disclosures in the financial statements, assessing the accounting principles used and significant estimates made by management, as well as evaluating the overall financial statement presentation. We believe that our audit provides a reasonable basis for our opinion.
In our opinion, such consolidated financial statements present fairly, in all material respects, the results of the Company’s operations and its cash flows for the fiscal year ended January 1, 2008 in conformity with accounting principles generally accepted in the United States of America.
| /s/ Deloitte & Touche LLP |
| San Francisco, California March 14, 2008 |
67
Table of Contents
JAMBA, INC.
CONSOLIDATED BALANCE SHEETS
| (Dollars in thousands, except share and per share amounts) | December 29, 2009 |
December 30, 2008 |
||||||
| ASSETS |
||||||||
| Current assets: |
||||||||
| Cash and cash equivalents |
$ | 28,757 | $ | 20,822 | ||||
| Restricted cash |
1,324 | 5,059 | ||||||
| Receivables, net of allowances of $116 and $416 |
9,949 | 4,594 | ||||||
| Inventories |
3,732 | 3,435 | ||||||
| Prepaid and refundable income taxes |
491 | 5,670 | ||||||
| Prepaid rent |
486 | 185 | ||||||
| Prepaid expenses and other current assets |
3,684 | 1,328 | ||||||
| Total current assets |
48,423 | 41,093 | ||||||
| Property, fixtures and equipment, net |
70,266 | 95,154 | ||||||
| Trademarks and other intangible assets, net |
1,850 | 2,998 | ||||||
| Restricted cash |
1,399 | 2,659 | ||||||
| Deferred income taxes |
998 | 354 | ||||||
| Other long-term assets |
2,882 | 3,462 | ||||||
| Total assets |
$ | 125,818 | $ | 145,720 | ||||
| LIABILITIES AND STOCKHOLDERS’ EQUITY |
||||||||
| Current liabilities: |
||||||||
| Accounts payable |
$ | 7,405 | $ | 8,089 | ||||
| Accrued compensation and benefits |
7,089 | 7,667 | ||||||
| Workers’ compensation and health self-insurance reserves |
1,096 | 1,922 | ||||||
| Accrued jambacard liability |
38,255 | 30,764 | ||||||
| Current portion of capital lease obligations |
240 | 246 | ||||||
| Other accrued expenses |
10,270 | 12,074 | ||||||
| Derivative liabilities |
— | 2,098 | ||||||
| Total current liabilities |
64,355 | 62,860 | ||||||
| Note payable |
— | 22,829 | ||||||
| Long-term capital lease obligations |
5 | 281 | ||||||
| Long-term workers’ compensation and health insurance reserves |
1,158 | 2,659 | ||||||
| Deferred rent and other long-term liabilities |
14,695 | 16,670 | ||||||
| Total liabilities |
80,213 | 105,299 | ||||||
| Commitments and contingencies (Notes 10 and 18) |
||||||||
| Series B redeemable preferred stock, $.001 par value, 304,548 shares authorized, issued, and outstanding at December 29, 2009. No shares authorized or outstanding at December 30, 2008 |
31,069 | — | ||||||
| Stockholders’ equity: |
||||||||
| Common stock, $.001 par value, 150,000,000 shares authorized; 52,712,528 and 54,690,728 shares issued and outstanding |
53 | 55 | ||||||
| Additional paid-in capital |
356,320 | 358,258 | ||||||
| Accumulated deficit |
(341,837 | ) | (317,892 | ) | ||||
| Total stockholders’ equity |
14,536 | 40,421 | ||||||
| Total liabilities and stockholders’ equity |
$ | 125,818 | $ | 145,720 | ||||
See Notes to Consolidated Financial Statements.
68
Table of Contents
JAMBA, INC.
CONSOLIDATED STATEMENTS OF OPERATIONS
| (Dollars in thousands, except share and per share amounts) | Fiscal Year Ended December 29, 2009 |
Fiscal Year Ended December 30, 2008 |
Fiscal Year Ended January 1, 2008 |
|||||||||
| Revenue: |
||||||||||||
| Company stores |
$ | 295,607 | $ | 333,784 | $ | 306,035 | ||||||
| Franchise and other revenue |
5,946 | 9,106 | 11,174 | |||||||||
| Total revenue |
301,553 | 342,890 | 317,209 | |||||||||
| Costs and operating expenses (income): |
||||||||||||
| Cost of sales |
72,669 | 89,163 | 84,226 | |||||||||
| Labor |
100,589 | 120,251 | 102,661 | |||||||||
| Occupancy |
43,888 | 44,868 | 37,458 | |||||||||
| Store operating |
38,734 | 43,714 | 39,942 | |||||||||
| Depreciation and amortization |
18,271 | 24,717 | 19,168 | |||||||||
| General and administrative |
37,044 | 48,057 | 48,384 | |||||||||
| Store pre-opening |
516 | 2,044 | 5,863 | |||||||||
| Impairment of long-lived assets |
12,639 | 27,802 | 1,550 | |||||||||
| Store lease termination and closure |
1,234 | 10,029 | 718 | |||||||||
| Trademark and goodwill impairment |
— | 84,061 | 200,624 | |||||||||
| Other operating, net |
(3,924 | ) | 3,817 | 4,806 | ||||||||
| Total costs and operating expenses |
321,660 | 498,523 | 545,400 | |||||||||
| Loss from operations |
(20,107 | ) | (155,633 | ) | (228,191 | ) | ||||||
| Other income (expense): |
||||||||||||
| Gain on derivative liabilities |
1,597 | 7,895 | 59,424 | |||||||||
| Interest income |
404 | 365 | 3,517 | |||||||||
| Interest expense |
(6,905 | ) | (2,064 | ) | (181 | ) | ||||||
| Total other (expense) income |
(4,904 | ) | 6,196 | 62,760 | ||||||||
| Loss before income taxes |
(25,011 | ) | (149,437 | ) | (165,431 | ) | ||||||
| Income tax benefit |
1,066 | 274 | 52,135 | |||||||||
| Net loss |
(23,945 | ) | (149,163 | ) | (113,296 | ) | ||||||
| Preferred stock dividends and deemed dividends |
(1,860 | ) | — | — | ||||||||
| Net loss attributable to common stockholders |
$ | (25,805 | ) | $ | (149,163 | ) | $ | (113,296 | ) | |||
| Weighted-average shares used in the computation of loss per share: |
||||||||||||
| Basic |
53,632,299 | 53,252,855 | 52,323,898 | |||||||||
| Diluted |
53,632,299 | 53,252,855 | 52,323,898 | |||||||||
| Loss per share: |
||||||||||||
| Basic |
$ | (0.48 | ) | $ | (2.80 | ) | $ | (2.17 | ) | |||
| Diluted |
$ | (0.48 | ) | $ | (2.80 | ) | $ | (2.17 | ) | |||
See Notes to Consolidated Financial Statements.
69
Table of Contents
JAMBA, INC.
CONSOLIDATED STATEMENTS OF STOCKHOLDERS’ EQUITY
| Common Stock | Additional Paid-In Capital |
Accumulated Deficit |
Stockholders’ Equity |
||||||||||||||||
| (Dollars in thousands, except share amounts) | Shares | Amount | |||||||||||||||||
| Balance as of January 9, 2007 |
51,881,616 | $ | 52 | $ | 341,256 | $ | (55,433 | ) | $ | 285,875 | |||||||||
| Exercise of warrants |
669,500 | 1 | 6,500 | — | 6,501 | ||||||||||||||
| Exercise of stock options |
51,640 | — | 214 | — | 214 | ||||||||||||||
| Share-based compensation expense |
— | — | 4,214 | — | 4,214 | ||||||||||||||
| Restricted shares vested in 2007 |
34,375 | — | — | — | — | ||||||||||||||
| Net loss |
— | — | — | (113,296 | ) | (113,296 | ) | ||||||||||||
| Balance as of January 1, 2008 |
52,637,131 | 53 | 352,184 | (168,729 | ) | 183,508 | |||||||||||||
| Share-based compensation expense |
— | — | 4,213 | — | 4,213 | ||||||||||||||
| Issuance of shares |
1,097 | — | — | — | — | ||||||||||||||
| Restricted shares vested in 2008 |
52,500 | — | — | — | — | ||||||||||||||
| Common stock issued in connection with Financing Agreement |
2,000,000 | 2 | 1,861 | — | 1,863 | ||||||||||||||
| Net loss |
— | — | — | (149,163 | ) | (149,163 | ) | ||||||||||||
| Balance as of December 30, 2008 |
54,690,728 | 55 | 358,258 | (317,892 | ) | 40,421 | |||||||||||||
| Share-based compensation expense |
— | — | 1,274 | — | 1,274 | ||||||||||||||
| Common stock repurchased pursuant to repayment of Financing Agreement |
(2,000,000 | ) | (2 | ) | (2,497 | ) | — | (2,499 | ) | ||||||||||
| Issuance of common stock pursuant to stock plans |
21,800 | — | 29 | — | 29 | ||||||||||||||
| Beneficial conversion feature and warrants issued related to preferred shares |
— | — | 1,116 | — | 1,116 | ||||||||||||||
| Accretion of Series B preferred shares |
— | — | (328 | ) | — | (328 | ) | ||||||||||||
| Redeemable preferred stock dividends |
— | — | (1,532 | ) | — | (1,532 | ) | ||||||||||||
| Net loss |
— | — | — | (23,945 | ) | (23,945 | ) | ||||||||||||
| Balance as of December 29, 2009 |
52,712,528 | $ | 53 | $ | 356,320 | $ | (341,837 | ) | $ | 14,536 | |||||||||
See Notes to Consolidated Financial Statements.
70
Table of Contents
JAMBA, INC.
CONSOLIDATED STATEMENTS OF CASH FLOWS
| (Dollars in thousands) | Fiscal Year Ended December 29, 2009 |
Fiscal Year Ended December 30, 2008 |
Fiscal Year Ended January 1, 2008 |
|||||||||
| Cash provided by (used in) operating activities: |
||||||||||||
| Net loss |
$ | (23,945 | ) | $ | (149,163 | ) | $ | (113,296 | ) | |||
| Adjustments to reconcile net loss to net cash provided by (used in) operating activities: |
||||||||||||
| Depreciation and amortization |
18,271 | 24,717 | 19,168 | |||||||||
| Trademark and goodwill impairment |
— | 84,061 | 200,624 | |||||||||
| Impairment of long-lived assets |
12,639 | 27,802 | — | |||||||||
| Lease termination, store closure costs and disposals |
(1,374 | ) | 11,734 | 3,488 | ||||||||
| Jambacard breakage income and amortization, net |
(2,777 | ) | (1,687 | ) | 629 | |||||||
| Share-based compensation |
1,274 | 4,213 | 4,214 | |||||||||
| Bad debt and purchase obligation reserves |
(178 | ) | 579 | 37 | ||||||||
| Deferred rent |
793 | 4,261 | 7,163 | |||||||||
| Deferred income taxes |
(644 | ) | (323 | ) | (52,223 | ) | ||||||
| Writeoff of loan fees and loan discount |
2,865 | — | — | |||||||||
| Equity (income) loss from joint ventures |
(7 | ) | 416 | 204 | ||||||||
| Gain on derivative liabilities |
(1,597 | ) | (7,895 | ) | (59,424 | ) | ||||||
| Amortization of loan premium |
887 | 395 | — | |||||||||
| Changes in operating assets and liabilities: |
||||||||||||
| Receivables, net |
(5,441 | ) | 1,083 | (3,019 | ) | |||||||
| Inventories |
(150 | ) | (207 | ) | (924 | ) | ||||||
| Prepaid and refundable taxes |
5,179 | 144 | (3,317 | ) | ||||||||
| Prepaid rent |
(301 | ) | 3,076 | (1,381 | ) | |||||||
| Prepaid expenses and other current assets |
206 | 452 | 20 | |||||||||
| Other long-term assets |
106 | 200 | (152 | ) | ||||||||
| Restricted cash from operating activities |
1,995 | — | — | |||||||||
| Accounts payable |
(2,080 | ) | (322 | ) | (16 | ) | ||||||
| Accrued compensation and benefits |
(582 | ) | 1,177 | 617 | ||||||||
| Workers’ compensation and health insurance reserves |
(2,327 | ) | (165 | ) | — | |||||||
| Accrued jambacard liability |
10,268 | 3,875 | 8,235 | |||||||||
| Litigation settlement payable |
— | — | (614 | ) | ||||||||
| Accrued expenses and other liabilities |
(2,326 | ) | (2,026 | ) | 2,789 | |||||||
| Other long-term liabilities |
(2,290 | ) | 1,767 | (124 | ) | |||||||
| Cash provided by operating activities |
8,464 | 8,164 | 12,698 | |||||||||
| Cash provided by (used in) investing activities: |
||||||||||||
| Capital expenditures |
(10,839 | ) | (30,173 | ) | (52,269 | ) | ||||||
| Proceeds from the sale of stores |
4,712 | — | — | |||||||||
| Decrease (increase) in restricted cash |
3,000 | (2,852 | ) | (4,866 | ) | |||||||
| Investment in joint ventures |
— | (25 | ) | (53 | ) | |||||||
| Cash paid in acquisitions, net of cash acquired |
— | — | (24,105 | ) | ||||||||
| Cash used in investing activities |
(3,127 | ) | (33,050 | ) | (81,293 | ) | ||||||
| Cash provided by (used in) financing activities: |
||||||||||||
| Proceeds from issuance of redeemable preferred stock |
34,115 | — | — | |||||||||
| Payments on debt facility |
(25,000 | ) | (1,088 | ) | — | |||||||
| Payments on exercise of put agreement |
(3,000 | ) | — | — | ||||||||
| Payments of costs for issuance of redeemable preferred stock |
(1,908 | ) | — | — | ||||||||
| Preferred dividends paid |
(1,360 | ) | — | — | ||||||||
| Payment on capital lease obligations |
(282 | ) | (482 | ) | — | |||||||
| Proceeds from exercise of stock options |
33 | — | 214 | |||||||||
| Borrowings on debt facilities |
— | 23,022 | — | |||||||||
| Payment of debt issuance costs |
— | (1,326 | ) | — | ||||||||
| Proceeds from common stock |
— | 1,863 | — | |||||||||
| Net put/call obligation |
— | 703 | — | |||||||||
| Cash from exercise of warrants |
— | — | 4,018 | |||||||||
| Cash provided by financing activities |
2,598 | 22,692 | 4,232 | |||||||||
| Net increase (decrease) in cash and equivalents |
7,935 | (2,194 | ) | (64,363 | ) | |||||||
| Cash and equivalents at beginning of period |
20,822 | 23,016 | 87,379 | |||||||||
| Cash and equivalents at end of period |
$ | 28,757 | $ | 20,822 | $ | 23,016 | ||||||
| Supplemental cash flow information: |
||||||||||||
| Cash paid for interest |
$ | 3,309 | $ | 1,803 | $ | 186 | ||||||
| Income taxes paid |
51 | 69 | 2,344 | |||||||||
| Noncash investing and financing activities: |
||||||||||||
| Property, fixtures and equipment acquired through use of deposit |
$ | — | $ | — | $ | 2,706 | ||||||
| Noncash property, fixtures and equipment additions |
1,396 | 1,534 | 8,965 | |||||||||
| Accretion of preferred stock issuance cost |
328 | — | — | |||||||||
| Beneficial conversion feature of redeemable preferred stock |
885 | — | — | |||||||||
| Warrants issued in connection with issuance of redeemable preferred stock |
231 | — | — | |||||||||
See Notes to Consolidated Financial Statements.
71
Table of Contents
JAMBA, INC.
NOTES TO CONSOLIDATED FINANCIAL STATEMENTS
1. BUSINESS AND SUMMARY OF SIGNIFICANT ACCOUNTING POLICIES
Business—Jamba, Inc. together with its wholly owned subsidiary (the “Company”) consummated its initial public offering in July 2005. The Company’s management had broad discretion with respect to the specific application of the net proceeds of its initial public offering (“IPO”), although substantially all of the net proceeds of the IPO were intended to be generally applied toward consummating a merger with an operating company. This operating company was subsequently identified as Jamba Juice Company.
On March 10, 2006, the Company entered into an Agreement and Plan of Merger with Jamba Juice Company (the “Merger Agreement”). On November 29, 2006 (the “Merger Date”), the Company consummated the merger with Jamba Juice Company (the “Merger”) whereby Jamba Juice Company became a wholly owned subsidiary of the Company.
The Company and its wholly owned subsidiary is a leading restaurant retailer of better-for-you food and beverage offerings, including great tasting fruit smoothies, juices and teas, hot oatmeal made with organic steel cut oats, wraps, salads, sandwiches and California Flatbread and a variety of baked goods and snacks. As of December 29, 2009, there were 739 locations consisting of 478 company owned and operated stores and 261 franchise stores operating in 22 states and the Bahamas; notwithstanding the single Bahamas location, the Company has no other international locations. Of these 739 locations, 389 are located in California. Jamba Juice Company began operations in 1990.
Basis of Presentation—The consolidated financial statements include the accounts of the Company and its wholly owned subsidiary, Jamba Juice Company. All intercompany balances and transactions have been eliminated. The equity method of accounting is used to account for the joint venture owned by Jamba Juice Company because Jamba Juice Company exercises significant influence over operating and financial policies of its partners. Accordingly, the carrying value of this investment is reported in other long-term assets, and the Company’s equity in the net income and losses of this investment is reported in other operating, net.
Fiscal Year End— On June 7, 2007, Jamba, Inc.’s board of directors approved a change to the Company’s fiscal year end from the second Tuesday following December 31 to the Tuesday closest to December 31. The Company’s most recently completed fiscal year, referred to as fiscal 2009, started on December 31, 2008 and ended on December 29, 2009. The Company’s fiscal 2008 started on January 2, 2008 and ended on December 30, 2008, which is referred to as fiscal 2008. The Company’s fiscal 2007 started on January 10, 2007 and ended on January 1, 2008.
Significant Estimates—The preparation of financial statements in conformity with accounting principles generally accepted in the United States of America requires management to make estimates and assumptions that affect the reported amounts of assets, liabilities, revenue and expenses and disclosure of contingent assets and liabilities at the date of the financial statements. Actual results could differ from those estimates, and such differences could affect the results of operations reported in future periods.
Concentrations of Risk—The Company maintains food distribution contracts primarily with one supplier, Southwest Traders, Inc. This supplier provided approximately 75% of cost of sales for fiscal 2009 and 81% of cost of sales for each of fiscal 2008 and fiscal 2007, which potentially subjects the Company to a concentration of business risk. If this supplier had operational problems or ceased making product available to the Company, operations could be adversely affected.
Financial instruments that potentially subject the Company to concentrations of credit risk consist primarily of cash and cash equivalents. The Company places its cash and cash equivalents with high-quality financial
72
Table of Contents
JAMBA, INC.
NOTES TO CONSOLIDATED FINANCIAL STATEMENTS—(continued)
institutions. Balances in the Company’s cash accounts frequently exceed the Federal Deposit Insurance Corporation insurance limit.
Self-Insurance Reserves—The Company is self-insured for healthcare benefits. For workers’ compensation benefits, the Company was self insured through September 30, 2008. The Company changed to a guaranteed cost program for workers compensation on October 1, 2008. Liabilities associated with the self-insured risks are not discounted and are estimated, in part, by considering historical claims experience, demographic factors, severity factors and other actuarial assumptions. The estimated accruals for these liabilities could be significantly affected if future occurrences and claims differ from these assumptions and historical trends. If actual claims experience differs from Management’s assumptions, historical trends, and estimates, the changes in insurance reserves would impact the expense recorded in the Company’s consolidated statements of operations.
Cash and Cash Equivalents—The Company considers all highly liquid instruments with maturities of three months or less when purchased to be cash equivalents. As of December 29, 2009 and December 30, 2008, the Company did not have any investments with maturities greater than three months.
Restricted Cash and Investments— The Company held $2.7 million in restricted cash, of which $1.3 million was classified as a current asset and $1.4 million classified as a long-term asset, at December 29, 2009, representing cash held in a money market accounts or certificates of deposits to collateralize the Company’s letters of credit, which is required since the Company was self insured.
At December 30, 2008, the Company held $7.7 million in restricted cash, of which $5.0 million was classified as a current asset and $2.7 million classified as a long-term asset, representing cash held in a certificate of deposit to collateralize the Company’s letters of credit, which is required since the Company was self-insured for workers’ compensation. Also included in restricted cash was $3.0 million related to the Company’s previous Financing Agreement (See Note 12).
Receivables—Receivables primarily represent amounts due from sale of jambacards, royalty fees, advertising fees, construction allowances and jambacards issued by the franchisees. The allowance for doubtful accounts is the Company’s estimate of the amount of probable credit losses in the Company’s existing accounts receivable.
Inventories—Inventories include only the purchase cost and are stated at the lower of cost or market. Cost is determined using the first-in, first-out method (FIFO). Inventories consist of food, beverages and available-for-sale promotional products.
Property, Fixtures and Equipment—Property, fixtures and equipment are recorded at cost. Expenditures for major additions and improvements are capitalized and minor replacements, maintenance and repairs are charged to expense as incurred. Depreciation is computed using the straight-line method over the estimated useful life. The estimated useful life for leasehold improvements is the lesser of 10 years or the term of the underlying lease. The estimated useful life for furniture, fixtures and equipment is three to 10 years.
Impairment of Long-Lived Assets— Long-lived assets, including leasehold improvements, and other fixed assets are reviewed for impairment at least quarterly and when indicators of impairment are present. Expected cash flows associated with an asset, in addition to other quantitative and qualitative analyses are the key factors in determining the recoverability of the asset. Identifiable cash flows are measured at the individual store level. The estimate of cash flows is based upon, among other things, certain assumptions about expected future operating performance. Management’s estimates of undiscounted cash flows may differ from actual cash flows due to, among other things, changes in economic conditions, changes to its business model or changes in
73
Table of Contents
JAMBA, INC.
NOTES TO CONSOLIDATED FINANCIAL STATEMENTS—(continued)
operating performance. If the sum of the undiscounted cash flows is less than the carrying value of the asset, the Company recognizes an impairment loss, measured as the amount by which the carrying value exceeds the fair value of the asset.
As a result of its refranchising initiative, announced in June 2009, the Company classifies assets as held for sale and suspends depreciation and amortization on such assets when all of the following criteria are met: (i) Board of Directors approval to refranchise (the store or group of stores) is received; (ii) the stores can be immediately removed from operations; (iii) an active program to locate a buyer is implemented; (iv) the assets are being actively marketed for sale at or near their current fair value; (v) significant changes to the plan of sale are not likely and (vi) the sale is probable within one year. Assets held for sale are recorded at the lower of the carrying amount or fair value less cost to sell. Fair value is determined based on the purchase price in the asset purchase agreement. Assets held for sale are included in prepaid expenses and other current assets in the consolidated balance sheet.
Trademarks, Goodwill and Other Intangible Asset Impairment—Trademarks are not subject to amortization and are tested for impairment annually (at year-end), or more frequently if events or changes in circumstances indicate that the asset might be impaired. The Company performed its test for impairment on trademarks by comparing the fair value of the trademarks to their carrying amounts. An impairment loss was generally recognized when the carrying amount of the trademarks is less than the fair value. The fair value of trademarks was estimated using the income approach-relief from royalty method, which was based on the projected cost savings attributable to the ownership of the trademarks.
The Company tested for goodwill impairment annually (at year-end) or whenever events occurred or circumstances changed that would more likely than not reduce the fair value of a reporting unit below its carrying amount. The required two-step approach uses accounting judgments and estimates of future operating results. Changes in estimates or the application of alternative assumptions could produce significantly different results. Impairment testing is done at a reporting unit level. An impairment loss generally is recognized when the carrying amount of the reporting unit’s net assets exceeds the estimated fair value of the reporting unit. The estimates and judgments that most significantly affect the fair value calculation are assumptions related to revenue growth, discount rate, public-market trading multiples and control premiums. The fair value of the reporting unit is reconciled to the Company’s market capitalization plus an estimated control premium (See Note 6 and Note 7).
Intangible assets subject to amortization (primarily franchise agreements, reacquired franchise rights and a favorable lease portfolio intangible asset recognized in the purchase of Jamba Juice in 2006) are tested for impairment annually (at year-end) or more frequently if changes in circumstances indicate that their carrying amounts may not be recoverable. Intangible assets are amortized over their estimated useful lives using a method of amortization that reflects the pattern in which the economic benefits of the intangible assets are consumed or otherwise realized. Useful lives for the franchise agreements and employment agreements are 13.4 years and 4.0 years, respectively. The useful life of reacquired franchise rights represents the remaining term of the franchise agreement. The useful life of the favorable lease portfolio intangible is based on the related lease term.
Jambacards—The Company, through its subsidiary, Jamba Juice Company, has been selling jambacards to its customers in its retail stores and through its website since November 2002. The Company’s jambacards do not have an expiration date. An obligation is recorded at the time of either an initial load or a subsequent reload in the accrued jambacard liability line item on the Company’s consolidated balance sheets. The Company recognizes income from jambacards when (i) the jambacard is redeemed by the customer or (ii) the likelihood of the jambacard being redeemed by the customer is remote (also referred to as “jambacard breakage”) and the Company determines that it does not have a legal obligation to remit the unredeemed jambacards to the relevant
74
Table of Contents
JAMBA, INC.
NOTES TO CONSOLIDATED FINANCIAL STATEMENTS—(continued)
jurisdictions. The Company determines the jambacard breakage amount based upon its historical redemption patterns. The Company has concluded that after three years of inactivity the likelihood of redemption becomes remote and recognizes breakage income at that time. Jambacard breakage income is included in other operating, net in the consolidated statements of operations.
As a result of the Merger, the jambacard liability was adjusted to fair value by discounting the projected cash flows to present value, which are the costs to service deferred revenue, plus an estimated operating margin. The adjustment is being amortized over the expected life of the jambacard and resulted in $0.1 million, $0.4 million and $2.1 million of expense during fiscal 2009, fiscal 2008 and fiscal 2007, respectively, which offset the amount recorded as jambacard breakage income. The Company recorded $2.9 million, $2.1 million and $1.5 million of jambacard breakage income during fiscal 2009, fiscal 2008 and fiscal 2007, respectively.
Rent Expense—Under the provisions of certain of our leases, there are rent holidays and/or escalations in payments over the base lease term, as well as renewal periods. The effects of rent holidays and escalations are reflected in rent costs on a straight-line basis over the expected lease term, which includes cancelable option periods when it is deemed to be reasonably assured that the Company will exercise such option periods due to the fact that the Company would incur an economic penalty for not doing so. The lease term commences on the date when the Company become legally obligated for the rent payments which generally coincides with the time when the landlord delivers the property for us to develop. All rent costs recognized during construction periods are classified as pre-opening expenses.
Construction Allowances—The Company receives construction allowances from certain landlords, which are deferred and amortized on a straight-line basis over the lease term as a reduction of rent expense. Construction allowances are recorded in deferred rent and other long-term liabilities.
Revenue Recognition—Revenue from Company Stores is recognized when product is sold. Revenue is presented net of any taxes collected from customers and remitted to government entities. Revenue from jambacards is recognized upon redemption. Until redemption, outstanding customer balances are recorded as a liability. See “jambacards” section above for discussion on recognition of jambacard breakage.
Franchise revenue is generated from three sources: development fees, initial franchise fees and royalties. Development fees are paid to the Company as part of an agreement to open and operate a specific number of stores in a specified territory. The amount of the fee is based on the number of stores to be opened pursuant to the development agreement and secures the territory for exclusivity during the development. The nonrefundable fees collected for these services are recognized ratably as the franchise stores under these agreements open. The Company’s multi-unit development agreements specify the number of stores to be opened. Any changes to the specific number of stores would be stated in a subsequent contractual agreement (see Note 3).
The Company charges an initial franchise fee for providing operational materials, new store opening planning, and functional training courses. Initial franchise fees are paid, if any, are due at the time the franchise agreement for a particular store is executed. Franchise fees are recognized as revenue when all material services or conditions have been substantially performed or satisfied and no other material conditions or obligations related to the determination of substantial performance exist. Duties and services that are completed prior to approval include training, facilities inspection, receipt of operating license(s), and clearance from appropriate agencies. These duties and services are substantially complete prior to the approval of the opening of a store. Duties and services relating to the earning of the franchise fees are necessary for the stores to open. Revenue is recognized when the store opens.
Royalties are determined as a percentage of revenue and are recognized in the same period as the related franchise store revenue. If collection of the franchise royalty fee is doubtful, a receivable and an allowance are
75
Table of Contents
JAMBA, INC.
NOTES TO CONSOLIDATED FINANCIAL STATEMENTS—(continued)
recorded by the Company without any revenue recognition and revenue is recognized at the time such receivables are collected.
Advertising Costs—Advertising costs are expensed as incurred and were $5.9 million, $8.6 million and $9.6 million in fiscal 2009, fiscal 2008 and fiscal 2007, respectively, and are classified as store operating expenses. The Company also receives advertising contributions from its franchisees. These contributions are a contractual obligation of the franchisee and are recorded as an offset to advertising expense and were $1.3 million, $1.6 million and $2.1 million for fiscal 2009, fiscal 2008 and fiscal 2007, respectively.
Store Pre-opening Costs—Costs incurred in connection with start-up and promotion of new store openings as well as rent from possession date to store opening date are expensed as incurred.
Comprehensive Income—Comprehensive income is defined as the change in equity during a period from transactions and other events, excluding changes resulting from investments from owners and distributions to owners. Comprehensive income (loss) equals net income (loss) for all periods presented.
Income Taxes— Deferred tax assets and liabilities are recognized for the future tax consequences attributable to differences between the financial statement carrying amounts of existing assets and liabilities and their respective tax basis. Deferred tax assets and liabilities are measured using enacted income tax rates expected to apply to taxable income in the years in which those temporary differences are expected to be recovered or settled. Any effect on deferred tax assets and liabilities due to a change in tax rates is recognized in income in the period that includes the enactment date. In establishing deferred income tax assets and liabilities, management of the Company makes judgments and interpretations based on enacted tax laws and published tax guidance applicable to the Company’s operations. The Company records deferred tax assets and liabilities and evaluates the need for valuation allowances to reduce deferred tax assets to estimated realizable amounts. Changes in the Company’s valuation of the deferred tax assets or changes in the income tax provision may affect its annual effective income tax rate.
On a quarterly basis, the Company reviews and updates its inventory of tax positions as necessary to add any new uncertain tax positions taken, or to remove previously identified uncertain positions that have been adequately resolved. Additionally, uncertain positions may be re-measured as warranted by changes in facts or law. Accounting for uncertain tax positions requires significant judgments, including estimating the amount, timing and likelihood of ultimate settlement. Although we believe that these estimates are reasonable, actual results could differ from these estimates.
Earnings (Loss) Per Share—Basic earnings (loss) per share is computed based on the weighted-average of common shares outstanding during the period. Diluted earnings (loss) per share is computed based on the weighted-average number of common shares and potentially dilutive securities, which includes preferred stock outstanding from the Company’s issuance of preferred stock, outstanding warrants and outstanding options and restricted stock awards granted under the Company’s stock option plans. Anti-dilutive shares of 20.5 million, 21.8 million and 21.8 million have been excluded from diluted weighted-average shares outstanding in fiscal 2009, fiscal 2008 and fiscal 2007, respectively. The Company’s basic weighted-average shares outstanding are equal to its diluted weighted-average shares outstanding since the Company experienced a net loss in each of fiscal 2009, fiscal 2008 and fiscal 2007.
For purposes of determining the net loss attributable to common stock used in the computation of loss per share, the amount of the loss was increased by the preferred stock dividends and deemed dividends. The deemed dividend represents the accretion of the issuance cost and beneficial conversion feature of the Company’s preferred stock.
76
Table of Contents
JAMBA, INC.
NOTES TO CONSOLIDATED FINANCIAL STATEMENTS—(continued)
Share-based compensation—The Company measures and recognizes all share-based compensation under the fair value method.
Stock options for a fixed number of shares are granted to certain employees and directors with an exercise price based on the grant date of the Company’s common stock. The Company also grants restricted stock with a fair value determined based on the closing price of the Company’s common stock on the date of grant (see Note 13). Stock options excluding performance-based stock option grants and restricted stock generally vest over a four-year period. Share-based compensation expense is recognized ratably over the service period.
The fair value of restricted stock units is determined based on the Company’s closing stock price on the date of grant. These restricted stock units vest and become unrestricted three years after the date of grant. Share-based compensation expense is recognized ratably over the three-year service period for restricted stock units.
Fair Value of Financial Instruments—The carrying value of cash and cash equivalents, notes and accounts receivable and accounts payable approximates fair value.
Pursuant to the Financing Agreement (see Note 12), the Company issued two million shares of its common stock (the “Shares”) with certain registration rights, and entered into a Common Stock Put and Call Agreement with the Lenders (the “Put and Call Agreement”). The Shares were classified as equity and recorded at fair value of $1.9 million. The Put and Call Rights were considered legally and separately detachable as they were contractually distinct from the common stock, are not embedded within the common stock shares and were considered a freestanding instrument. The Put and Call Rights were recorded as a liability based on the fair value of $0.7 million and was marked-to-market on a quarterly basis.
Accounting for Warrants and Derivative Instruments— On July 6, 2005, the Company consummated its initial public offering of 15,000,000 warrants (the “Warrants”). On July 7, 2005, the Company consummated the closing of an additional 2,250,000 warrants that were subject to the underwriters’ over-allotment option. Each Warrant entitled the holder to purchase from the Company one share of its common stock at an exercise price of $6.00 per share. These Warrants were freely traded on the NASDAQ Global Market under the symbol “JMBAW” until their expiration on June 28, 2009.
The Company sold to the representative of the underwriter, for $100, an option to purchase up to a total of 750,000 units (the “Units”). Each Unit consisted of one share of common stock and one redeemable common stock purchase warrant (“Embedded Warrants”). The Embedded Warrants issuable upon exercise of this option were identical to those sold in the initial public offering, except that the Embedded Warrants had an exercise price of $7.50 (125% of the exercise price of the Warrants). These Units were freely traded on the NASDAQ Global Market under the symbol “JMBAU.” This option was exercisable at $10.00 per Unit and expired on June 28, 2009.
The Company recorded these warrants as liabilities on the Company’s consolidated balance sheets and the unrealized changes in the values of these derivatives are shown in the Company’s consolidated statements of operations as “Gain (loss) on derivative liabilities.” Since these warrants were freely traded on the NASDAQ Global Market, the fair value of the Warrants was estimated based on the market price of a warrant at each period-end.
Fair values for exchange-traded securities and derivatives were based on quoted market prices. Where market prices were not readily available, fair values were determined using market-based pricing models incorporating readily observable market data and requiring judgments and estimates. The option to purchase
77
Table of Contents
JAMBA, INC.
NOTES TO CONSOLIDATED FINANCIAL STATEMENTS—(continued)
750,000 shares was recorded as an equity instrument, as the underlying shares did not need to be registered, and all other criteria to be accounted for as an equity instrument were met and the Embedded Warrants were recorded as a liability.
The Company used the Black-Scholes pricing model to estimate the fair value of the Embedded Warrants. The assumptions used as input to the pricing model included the risk-free rate of interest, expected dividend yield, expected volatility, and the expected life of the award. The risk-free rate of interest is based on the zero coupon U.S. Treasury rates appropriate for the expected term of the warrants and was 0.5% as of December 30, 2008 and 3.1% as of January 1, 2008. Expected dividends are zero based on the history of not paying cash dividends on the Company’s common stock. The Company does not have any plans to pay dividends in the future. The expected term was determined to be the remaining contractual life of the warrant or derivative instrument of 1.5 years as of December 30, 2008 and 2.5 years as of January 1, 2008.
Due to its limited trading history as an operating entity, the Company used volatility rates based on a 50/50 blend of historic daily stock price observations of the Company’s common stock since its inception and historic, daily stock price observations of the Company’s peers. The volatility index used for the calculation was 71.6% as of December 30, 2008 and 42.6% as of January 1, 2008.
The estimated fair value of the warrants and Embedded Warrants was $0.1 million and $0, respectively, as of December 30, 2008. Such amounts are recorded as derivative liabilities in the consolidated balance sheets.
Segment Reporting—The Company has one reportable retail segment.
Recent Accounting Pronouncements
Financial Accounting Standards Board (“FASB”) Accounting Standards Codification
(Accounting Standards Update (“ASU”) 2009-01)
In June 2009, FASB approved the FASB Accounting Standards Codification (“the Codification” or “FASB ASC”) as the single source of authoritative nongovernmental GAAP. All existing accounting standard documents, such as FASB, American Institute of Certified Public Accountants, Emerging Issues Task Force and other related literature, excluding guidance from the Securities and Exchange Commission (“SEC”), have been superseded by the Codification. All other non-grandfathered, non-SEC accounting literature not included in the Codification has become nonauthoritative. The Codification did not change GAAP, but instead introduced a new structure that combines all authoritative standards into a comprehensive, topically organized online database. The Codification is effective for interim or annual periods ending after September 15, 2009, and impacts the Company’s financial statements as all references to authoritative accounting literature will be referenced in accordance with the Codification. There have been no changes to the content of the Company’s financial statements or disclosures as a result of implementing the Codification.
As a result of the Company’s implementation of the Codification during fiscal 2009, previous references to new accounting standards and literature are no longer applicable. In the current year financial statements, the Company will provide reference to both new and old for guidance adopted since the beginning of the current fiscal year but prior to the Codification.
Subsequent Events
(Included in FASB ASC 855 “Subsequent Events”, previously SFAS No. 165 “Subsequent Events”)
SFAS No. 165 established general standards of accounting for and disclosure of events that occur after the balance sheet date, but before the financial statements are issued or available to be issued (“subsequent events”).
78
Table of Contents
JAMBA, INC.
NOTES TO CONSOLIDATED FINANCIAL STATEMENTS—(continued)
An entity is required to disclose the date through which subsequent events have been evaluated and the basis for that date. For public entities, this is the date the financial statements are issued. On February 24, 2010, FASB amended its guidance on subsequent events to remove the requirement for SEC filers (as defined in ASU 2010-09) to disclose the date through which an entity has evaluated subsequent events. This change alleviates potential conflicts with current SEC guidance. The Company evaluated for subsequent events. No subsequent events were noted that required recognition in the current year’s consolidated financial statements. See Note 20 for a discussion of subsequent events identified pursuant to this standard.
Determination of the Useful Life of Intangible Assets
(Included in FASB ASC 350 “Intangibles — Goodwill and Other”, previously FSP SFAS No. 142-3 “Determination of the Useful Lives of Intangible Assets”)
FSP SFAS No. 142-3 amended the factors that should be considered in developing renewal or extension assumptions used to determine the useful life of a recognized intangible asset under previously issued goodwill and intangible assets topics. This change was intended to improve the consistency between the useful life of a recognized intangible asset and the period of expected cash flows used to measure the fair value of the asset under topics related to business combinations and other GAAP. The requirement for determining useful lives must be applied prospectively to intangible assets acquired after the effective date and the disclosure requirements must be applied prospectively to all intangible assets recognized as of, and subsequent to, the effective date. FSP SFAS No. 142-3 became effective for financial statements issued for fiscal years beginning after December 15, 2008, and interim periods within those fiscal years. Adoption of FSP SFAS No. 142-3 did not impact the Company’s consolidated financial statements.
Consolidation of Variable Interest Entities — Amended
(Included in FASB ASC 810 “Consolidation”, SFAS No. 167 “Amendments to FASB Interpretation No. 46(R)”)
In June 2009, the FASB issued SFAS No. 167 amends FASB Interpretation No. 46(R) “Consolidation of Variable Interest Entities” regarding certain guidance for determining whether an entity is a variable interest entity and modifies the methods allowed for determining the primary beneficiary of a variable interest entity. The amendments include: (1) the elimination of the exemption for qualifying special purpose entities, (2) a new approach for determining who should consolidate a variable-interest entity, and (3) changes to when it is necessary to reassess who should consolidate a variable-interest entity. SFAS No. 167 is effective for the first annual reporting period beginning after November 15, 2009, with earlier adoption prohibited. The Company will adopt SFAS No. 167 in fiscal 2010 and does not anticipate any material impact on the Company’s consolidated financial statements.
ASU No. 2009-04, “Accounting for Redeemable Equity Instruments — Amendment to Section 480-10-S99”
In August 2009, the FASB issued ASU No. 2009-04, “Accounting for Redeemable Equity Instruments — Amendment to Section 480-10-S99.” The amended guidance represents technical changes to ASC 480, “Distinguishing Liabilities from Equity,” to reflect SEC staff pronouncements on EITF Topic D-98, “Classification and Measurement of Redeemable Securities.” The guidance provided in ASU No. 2009-04 is effective for the first reporting period, including interim periods, beginning after issuance. Adoption of ASU No. 2009-04 did not impact the Company’s consolidated financial statements.
ASU No. 2009-05, “Measuring Liabilities at Fair Value”
In August 2009, the FASB issued ASU No. 2009-05, “Measuring Liabilities at Fair Value,” which amends ASC 820, “Fair Value Measurements and Disclosures.” ASU No. 2009-05 provides clarification for the valuation
79
Table of Contents
JAMBA, INC.
NOTES TO CONSOLIDATED FINANCIAL STATEMENTS—(continued)
techniques available when valuing a liability when a quoted price for an identical liability is not available, and clarifies that no adjustment is necessary related to the existence of restrictions that prevent the transfer of the liability. The amendments in this update require the use of valuation techniques that use the quoted price of an identical liability when traded as an asset, or quoted prices for similar liabilities or similar liabilities when traded as assets. Adoption of ASU No. 2009-05 did not impact the Company’s consolidated financial statements.
ASU No. 2009-08, “Earnings per Share — Amendments to Sections 260-10-S99.”
In September 2009, the FASB issued ASU No. 2009-08, “Earnings per Share — Amendments to Sections 260-10-S99.” The amended guidance represents technical changes to ASC 260, “Earnings per Share,” to reflect SEC staff pronouncements on EITF Topic D-53, “Computation of Earnings Per Share for a Period that Includes a Redemption or an Induced Conversion of a Portion of a Class of Preferred Stock,” and EITF Topic D-42, “The Effect of the Calculation of Earnings per Share for the Redemption or Induced Conversion of Preferred Stock.” The update consisted principally of formatting changes and removing out-of-date guidance. The provisions of ASU No. 2009-08 are effective for the first reporting period, including interim periods, beginning after issuance. The Company is currently evaluating the impact, if any, that the adoption of ASU No. 2009-08 will have on its consolidated financial statements.
2. ACQUISITIONS
Fiscal 2008 Acquisition of Joint Venture Partnership
Pursuant to an Unit Purchase Agreement dated December 16, 2008, between the Company’s wholly owned subsidiary, Jamba Juice Company and JJC Florida LLC (“JJC Florida”), the Company purchased the remaining 65% in JJC Florida that the Company did not already own resulting in the acquisition of 13 stores in the Florida geographic region from JJC Florida. The agreement called for the purchase of all the assets, property, and business of JJC Florida related to the operation of its 13 stores. JJC Florida had entered into a joint venture with the Company to develop the Florida market.
The right to develop additional stores expired on June 28, 2005 when the Company entered into an Amended and Restated Management Agreement with JJC Florida. Under this Management Agreement, the Company managed and operated the stores owned by JJC Florida and used Company employees. Under the terms of the Third Amendment to Agreements dated June 28, 2005, JJC Florida’s right to build additional stores in Florida was voided and exclusivity was terminated. The Company had the right to purchase all of the remaining interest in JJC Florida commencing on October 1, 2008 and for 90 days thereafter. In anticipation of this right, the Company and JJC Florida agreed to the purchase and sale transaction on December 16, 2008. Total consideration for the agreement was $1.5 million and an additional $0.2 million in credit for reimbursement of amounts owed to JJC Florida. The acquisition was accounted for using the purchase method and resulted in goodwill of $0.6 million, which was fully impaired at December 30, 2008.
The purchase price allocation for JJC Florida was as follows (in thousands):
| Property, fixtures and equipment, net |
$ | 334 | ||
| Other current assets |
877 | |||
| Other intangible assets, net |
(97 | ) | ||
| Other accrued expenses |
(55 | ) | ||
| Goodwill |
623 | |||
| Total consideration |
$ | 1,682 | ||
80
Table of Contents
JAMBA, INC.
NOTES TO CONSOLIDATED FINANCIAL STATEMENTS—(continued)
The operating results of stores acquired are included in the consolidated statements of operations from the date of acquisition. The goodwill was subsequently impaired after the acquisition.
Fiscal 2007 Acquisitions of Franchisees
The Company acquired the assets of 22 Jamba Juice franchised stores owned by Sanders Liquid Sunshine (“Sanders”) and Vegas Liquid Sunshine (“Vegas”) on September 18, 2007 in the Northern California and Nevada geographic regions, respectively for $15.3 million, which includes a holdback of $1.4 million that was paid in September 2008. In addition, the Company acquired ten stores on April 4, 2007 and two stores on June 26, 2007 from Four Life Foods, LLC (“Four Life”) and Juice The Two of Us, Inc., respectively for a total of $9.3 million. Stores located in the Central California and Northern California geographic regions were acquired from Four Life and Juice The Two of Us, respectively. All acquisitions were accounted for using the purchase method of accounting and resulted in total goodwill of approximately $19.0 million. All of the goodwill is expected to be tax deductible for tax purposes. The operating results of stores acquired are included in the consolidated statements of operations from the date of acquisition.
The pro-forma effects of the acquired stores are not significant to fiscal 2008 or fiscal 2007 operating results.
Purchase Price Allocation
The purchase price was allocated to the assets acquired and liabilities assumed based upon their estimated fair values as of the acquisition dates. The purchase prices for the acquisitions of Four Life, Juice The Two of Us, Sanders and Vegas have been allocated as follows (in thousands):
| Property, fixtures and equipment, net |
$ | 4,377 | ||
| Other current assets |
398 | |||
| Trademarks and other intangible assets, net |
1,095 | |||
| Other long-term assets and deferred franchise revenue |
71 | |||
| Other accrued expenses |
(193 | ) | ||
| Deferred tax liabilities |
(86 | ) | ||
| Other long-term liabilities |
(14 | ) | ||
| Goodwill |
19,008 | |||
| Total purchase price |
$ | 24,656 | ||
3. AREA DEVELOPMENT AGREEMENTS
The Company’s wholly owned subsidiary, Jamba Juice Company, has entered into multi-unit license agreements with area developers to develop stores in certain geographic regions. Under typical multi-unit license agreements, the area developer generally pays one-half of the initial nonrefundable fee multiplied by each store to be developed as a nonrefundable development fee upon execution of the multi-unit license agreement. The agreements are generally for a term of 10 years. Each time a store is opened under the multi-unit license agreement, the Company credits the franchisee one-half of the initial fee paid as part of the development fee and the franchisee is required to pay the remaining one-half of the initial fee. As of December 29, 2009, 82 stores are operating under two current multi-unit license agreements. Both area developers have completed their development obligations under their respective agreements. In addition, the Company has and will continue to enter into development agreements in connection with our refranchising initiatives. Under a development agreement signed in fiscal 2009 in connection with our refranchising efforts, one new area developer has a contractual commitment to open three new Franchise Stores.
81
Table of Contents
JAMBA, INC.
NOTES TO CONSOLIDATED FINANCIAL STATEMENTS—(continued)
The Company generally executes franchise agreements for each store that establish the terms of its arrangement with the franchisee. The franchise agreements typically require the franchisee to pay an initial, non-refundable fee and continuing fees based upon a percentage of sales. Subject to the Company’s approval and the franchisee’s payment of a renewal fee, a franchisee may generally renew the franchise agreement upon its expiration.
Deferred franchise revenue as of December 29, 2009 and December 30, 2008 includes $86,000 and $129,050, respectively, relating to non-refundable development fees paid by one current area developer as well as initial fees paid by franchisees whose stores have not yet opened.
Franchise revenue consists of royalties and fees from our franchisees. The Company recognizes initial fees received from a franchisee as revenue when it has performed substantially all initial services required by the franchise agreement, which is generally upon the opening of a store. The Company recognizes continuing royalties based upon a percentage of franchisee revenues as earned. The Company is not required to contribute capital as part of multi-unit license agreements or franchise agreements.
4. PROPERTY, FIXTURES AND EQUIPMENT
Property, fixtures, and equipment as of December 29, 2009 and December 30, 2008, consisted of the following (in thousands):
| December 29, 2009 |
December 30, 2008 |
|||||||
| Leasehold improvements |
$ | 56,428 | $ | 68,288 | ||||
| Furniture, fixtures and equipment |
66,575 | 66,847 | ||||||
| Construction in progress (primarily stores under construction) |
101 | 628 | ||||||
| Total |
123,104 | 135,763 | ||||||
| Less accumulated depreciation and amortization |
(52,838 | ) | (40,609 | ) | ||||
| Total |
$ | 70,266 | $ | 95,154 | ||||
Depreciation and amortization expense related to property, fixtures and equipment for fiscal 2009, fiscal 2008 and fiscal 2007 was $17.7 million, $23.5 million, and $18.3 million, respectively.
5. ASSETS HELD FOR SALE
Assets held for sale consists of Company Stores that the Company expects to refranchise. Such assets are recorded at the lower of the carrying amount or fair value less cost to sell. Fair value is determined based on the purchase price in the asset purchase agreement. Assets are no longer depreciated once classified as held for sale. Assets held for sale at December 29, 2009 include $2.6 million of property, fixtures and equipment and are included in prepaid expenses and other current assets on the Company’s balance sheet. There were no assets held for sale as of December 30, 2008.
6. GOODWILL
The Company tested for goodwill impairment annually (at year-end) or whenever events occurred or circumstances changed that would more likely than not reduce the fair value of a reporting unit below its carrying amount. The required two-step approach uses accounting judgments and estimates of future operating results. Changes in estimates or the application of alternative assumptions could produce significantly different results. Impairment testing is done at a reporting unit level. An impairment loss generally is recognized when the
82
Table of Contents
JAMBA, INC.
NOTES TO CONSOLIDATED FINANCIAL STATEMENTS—(continued)
carrying amount of the reporting unit’s net assets exceeds the estimated fair value of the reporting unit. The estimates and judgments that most significantly affect the fair value calculation are assumptions related to revenue growth, discount rate, public-market trading multiples and control premiums. The fair value of the reporting unit is reconciled to the Company’s market capitalization plus an estimated control premium.
Based on the results of the Company’s evaluation and due to the challenging business conditions and resulting decline in the market price of the Company’s common stock, the Company recorded an impairment charge of $1.0 million and $111.0 million in the fourth quarter of fiscal 2008 and fiscal 2007, respectively. No goodwill impairment was recorded for fiscal 2009 as the Company’s goodwill had been written down to zero as of the end of fiscal 2008.
The changes in the carrying amount of goodwill are as follows (in thousands):
| Balance as of January 2, 2008 |
||||
| Goodwill, gross |
$ | 113,170 | ||
| Accumulated impairment losses |
(113,170 | ) | ||
| Goodwill, net |
— | |||
| Acquisitions |
993 | |||
| Impairment losses |
(993 | ) | ||
| Balance as of December 30, 2008 |
$ | — | ||
7. TRADEMARKS AND OTHER INTANGIBLE ASSETS
The carrying amount and accumulated amortization of trademarks and other intangible assets as of December 29, 2009 and December 30, 2008, were as follows (in thousands):
| Gross Amount |
Accumulated Amortization |
Net | ||||||||
| Amortized Intangible Assets |
||||||||||
| As of December 29, 2009 |
||||||||||
| Favorable leases |
$ | 2,627 | $ | (1,723 | ) | $ | 904 | |||
| Franchise agreements |
897 | (207 | ) | 690 | ||||||
| Reacquired franchise rights |
550 | (294 | ) | 256 | ||||||
| Total |
$ | 4,074 | $ | (2,224 | ) | $ | 1,850 | |||
| As of December 30, 2008 |
||||||||||
| Favorable leases |
$ | 3,176 | $ | (1,490 | ) | $ | 1,686 | |||
| Franchise agreements |
920 | (143 | ) | 777 | ||||||
| Reacquired franchise rights |
850 | (315 | ) | 535 | ||||||
| Total |
$ | 4,946 | $ | (1,948 | ) | $ | 2,998 | |||
83
Table of Contents
JAMBA, INC.
NOTES TO CONSOLIDATED FINANCIAL STATEMENTS—(continued)
Intangible assets are amortized over their expected useful lives. Amortization expense for intangible assets for fiscal 2009, fiscal 2008 and fiscal 2007 was $1.1 million, $1.9 million and $1.5 million, respectively. Expected annual amortization expense for intangible assets recorded as of December 29, 2009 is as follows (in thousands):
| Fiscal Year |
Amortization | ||
| 2010 |
$ | 569 | |
| 2011 |
411 | ||
| 2012 |
257 | ||
| 2013 |
138 | ||
| 2014 |
95 | ||
| Thereafter |
380 | ||
The Company’s trademarks were fully impaired as of December 20, 2008. Trademarks were not subject to amortization and were tested for impairment annually (at year-end), or more frequently if events or changes in circumstances indicate that the asset might be impaired. The impairment test consisted of the comparison of the fair value of the trademarks to its carrying amount. The fair value of trademarks was estimated using the income approach-relief from royalty method, which was based on the projected cost savings attributable to the ownership of the trademarks. As a result of the evaluation, the Company recorded an impairment charge of $82.6 million in fiscal 2008 and an impairment charge of $89.6 million in fiscal 2007.
8. OTHER LONG-TERM ASSETS
As of December 29, 2009 and December 30, 2008, other long-term assets consisted of the following (in thousands):
| December 29, 2009 |
December 30, 2008 | |||||
| Note receivable from franchisee |
$ | 1,100 | $ | — | ||
| Deposits |
962 | 1,386 | ||||
| Investment in JJC Hawaii, LLC |
562 | 520 | ||||
| Deferred loan fees |
— | 1,081 | ||||
| Other |
258 | 475 | ||||
| Total |
$ | 2,882 | $ | 3,462 | ||
The $1.1 million note receivable from franchisee accrues interest at 5.25% and is due in March 2014. The Company accounts for its investments in JJC Hawaii, LLC under the equity method. The Company owns a 5.0% interest in JJC Hawaii, LLC, as of December 29, 2009 and December 30, 2008. The equity in earnings (losses) recognized by the Company for JJC Hawaii, LLC was $81,000, ($185,000) and ($147,000) for fiscal 2009, fiscal 2008 and fiscal 2007, respectively. The Company previously owned a 35.2% interest until it purchased the remaining interest in JJC Florida, LLC on December 16, 2008 (See Note 2). The equity losses recognized by the Company for JJC Florida were $231,000 for fiscal 2008 and $147,000 for fiscal 2007.
| 9. | IMPAIRMENT, STORE LEASE TERMINATION AND CLOSURE COSTS AND WORKFORCE REDUCTION |
Long-lived asset impairment
The Company reviews its entire store portfolio on a regular basis. The review includes an analysis of each store’s past and present operating performance combined with projected future results. Impairment charges
84
Table of Contents
JAMBA, INC.
NOTES TO CONSOLIDATED FINANCIAL STATEMENTS—(continued)
include the write-down of long-lived assets at stores that were assessed for impairment because of management’s intention to close the store or because of changes in circumstances that indicate the carrying value of an asset may not be recoverable. The Company recorded impairment charges of $12.6 million, $27.8 million and $1.6 million for fiscal 2009, fiscal 2008 and fiscal 2007, respectively.
Store lease termination and closure costs and workforce reduction
As a result of the Company’s revitalization efforts and revised development goals, the Company evaluated the infrastructure needed to support its evolving business model and restructured its Support Center to eliminate certain administrative positions. During fiscal 2008, the Company eliminated 71 positions, closed 31 underperforming Company Stores prior to the normal expiration of their lease term and canceled the opening of 13 stores under development. As a result of these actions, the Company incurred $10.0 million in charges related to asset write-offs for operating Company Stores and sites under development and lease termination related costs and $2.2 million in severance charges. During fiscal 2009, the Company incurred $1.2 million in charges related to asset write-offs for lease termination and closure costs and $0.3 million for severance charges.
Lease termination costs consist primarily of the costs of future obligations related to closed store locations. Discounted liabilities for future lease costs and the fair value of related subleases of closed locations are recorded when the stores are closed. These amounts are subject to adjustments as liabilities are settled. In assessing the discounted liabilities for future costs of obligations related to closed stores, the Company made assumptions regarding amounts of future subleases. If these assumptions or their related estimates change in the future, the Company may be required to record additional exit costs or reduce exit costs previously recorded. Exit costs recorded for each of the periods presented include the effect of such changes in estimates. Severance accruals are expected to be paid during fiscal 2010. Lease obligations are payable through 2019, less sublease amounts. In fiscal 2009, the Company closed four Company Stores before its lease expiration.
The following is a reconciliation of the store closure and severance accrual (in thousands):
| Balance as of January 1, 2008 |
$ | 476 | ||
| Provision for noncancellable lease payments of closed stores |
4,637 | |||
| Severance accrual |
2,192 | |||
| Severance payments |
(1,158 | ) | ||
| Payments on liability |
(483 | ) | ||
| Balance as of December 30, 2008 |
$ | 5,664 | ||
| Provision for noncancellable lease payments of closed stores |
1,089 | |||
| Severance accrual |
311 | |||
| Severance payments |
(1,278 | ) | ||
| Payments on liability |
(3,308 | ) | ||
| Balance as of December 29, 2009 |
$ | 2,478 | ||
Gain/loss on Disposal of Other Assets—The Company recognized gain on disposal of assets resulting primarily from the refranchising of its stores of $2.0 million during fiscal 2009. During fiscal 2008 and fiscal 2007, the Company wrote off the net book value of certain assets that were disposed of due to store remodels or upgrades of equipment of $1.7 million and $1.2 million, respectively and such write-offs were classified in other operating, net.
85
Table of Contents
JAMBA, INC.
NOTES TO CONSOLIDATED FINANCIAL STATEMENTS—(continued)
10. LEASE COMMITMENTS
The Company leases its office, retail stores, and some equipment under operating leases, with terms expiring through 2021. Most store leases have an initial term of 10 years, with renewal options of up to 10 years and provide for payment of common area operating expenses and real estate taxes. Rental expense, net of sublease income was $33.9 million in fiscal 2009, $35.2 million in fiscal 2008 and $31.1 million in fiscal 2007 and is recorded in occupancy costs and general and administrative expenses.
The aggregate future minimum noncancelable lease payments as of December 29, 2009, were as follows (in thousands):
| Fiscal Year Ending: |
|||
| 2010 |
$ | 34,879 | |
| 2011 |
33,398 | ||
| 2012 |
31,338 | ||
| 2013 |
28,507 | ||
| 2014 |
23,514 | ||
| Thereafter |
40,153 | ||
| Total minimum lease commitments |
$ | 191,789 | |
The Company has subleases related to certain of its operating leases. The Company recognized sublease income of $0.8 million in fiscal 2009 and $0.2 million for each of fiscal 2008 and fiscal 2007. Future minimum lease payments under operating leases of $191.8 million have not been reduced by future minimum sublease rental income of $9.8 million.
The Company leases certain equipment and software license of $0.4 million which is considered capital leases and is included in property and equipment on the consolidated balance sheets. Amortization of assets under capital leases is included in depreciation and amortization expense.
The Company has certain contractual obligations for some of its operating leases that could be terminated in the future upon written notice and payment of a termination fee. These termination fees totaled approximately $2.8 million as of December 29, 2009.
11. REDEEMABLE PREFERRED STOCK
On June 16, 2009, the Company issued (i) 170,000 shares of its Series B-1 Convertible Preferred Stock, par value $0.001, (the “Series B-1 Preferred”) to affiliates of Mistral Equity Partners at a price of $115 per share, for an aggregate purchase price of approximately $19.6 million, and (ii) 134,348 shares of its Series B-2 Convertible Preferred Stock, par value $0.001, (the “Series B-2 Preferred”) to CanBa Investments, LLC at a price of $115 per share, for an aggregate purchase price of approximately $15.4 million. The issuance of shares of the Series B-1 and B-2 Preferred Stock (together the “Series B Preferred Stock” or “Preferred Stock”) for $35 million, less approximately $3.1 million in total transaction costs, which includes $2.2 million in transaction fees and $885,000 paid to investors, was completed through a private placement to the purchasers as accredited investors and pursuant to the exemptions from the registration requirements of the Securities Act. The shares of Preferred Stock and the shares of the Company’s Common Stock issuable upon conversion of the Preferred Stock to be issued to the purchasers includes legends restricting transfer other than pursuant to an effective registration statement under the Securities Act or in accordance with an exemption from registration. The holders of the Series B Preferred Stock have the right to require the Company to redeem all or a portion of the shares of the Series B Stock on or after seven years from the date of issuance of the Preferred Stock.
86
Table of Contents
JAMBA, INC.
NOTES TO CONSOLIDATED FINANCIAL STATEMENTS—(continued)
The shares of Preferred Stock are convertible at the election of the holders, at any time, into shares of Common Stock at an initial conversion price of $1.15 per share. The conversion price for the Preferred Stock is subject to customary anti-dilution adjustments for stock splits, dividends or certain other equity restructurings. After a two year period from the original date of issuance, the Company will have the right to require that the shares of Preferred Stock be converted into shares of Common Stock if (i) the Common Stock trading volume averages 150,000 shares per trading day over a 30 trading day period and (ii) the daily volume weighted average price per share of the Common Stock exceeds the product of 2.5 times the then-applicable conversion price for any 20 of the preceding 30 trading days at any time these conditions continue to be satisfied and for a period of 10 trading days thereafter. Upon exercise of this right, the Preferred Stock will be converted at the then-applicable conversion rate and the Company will be obligated to pay any then-existing dividend arrearages in cash.
The Preferred Stock has an 8% dividend, payable quarterly in cash, which accrues irrespective of whether dividends are actually declared or paid. The dividend rate shall increase to 10% in the event the Common Stock is not listed for trading on any of the New York Stock Exchange, the NASDAQ Global Market or the American Stock Exchange or if the Company fails to declare and pay, in full and in cash, dividends on shares of the Preferred Stock for three consecutive quarters until such time as the dividends are paid in full and in cash. After seven years from the date the shares of Preferred Stock are originally issued, the holders of such shares will have the right to require the Company to redeem their shares of Preferred Stock, in whole or in part, at a price per share equal to the original sale price per share plus any unpaid but accrued dividends. The Company has also granted the purchasers of the shares of Preferred Stock certain pre-emptive rights with respect to the sale and issuance by the Company of equity securities, as delineated in the Purchase Agreement. If the Company fails to declare and pay, in full and in cash, dividends on shares of the Preferred Stock for three consecutive quarters, the size of the board of directors of the Company (“Board”) shall be increased by one member and the holders of the Preferred Stock, voting together as a single class, shall be entitled to elect one additional member to the Board until such time as the dividends are paid in full and in cash.
The holders of the shares of Preferred Stock have the right to vote on any matters submitted to a vote of the stockholders of the Company and are entitled to cast that number of votes equal to the aggregate number of shares of Common Stock issuable upon the conversion of such holders’ shares of Preferred Stock at the then-applicable conversion price. The holders of the shares of Preferred Stock will also receive customary protective provisions under the Certificate of Designation and additional protections under the Purchase Agreement (including the requirement that the consent of a majority of the holders of the shares of Common Stock issuable upon conversion of the Preferred Stock must be obtained prior to the Company incurring in excess of $10 million in indebtedness).
The holders of the shares of the Series B-1 Preferred, voting as a separate class, elected two members to the Board. The Series B-1 Preferred holders are allowed to hold two seats on the Board so long as more than 50% of the number of shares of Series B-1 Preferred originally issued is outstanding. In the event the number of shares of Series B-1 Preferred Stock outstanding is less than 50% of the number of shares originally issued but greater than 25% of the number of shares originally issued, the holders of the shares of the Series B-1 Preferred, voting as a separate class, will be entitled to elect only one member to the Board. The ability to have any members to the Board by the holders of the shares of the Series B-1 Preferred will cease once the number of outstanding shares of Series B-1 Preferred is less than 25% of the number of shares of Series B-1 Preferred originally issued.
The holders of the shares of the Series B-2 Preferred, voting as a separate class, elected one member to the Board. The Series B-2 Preferred holders are allowed to hold one seat on the Board so long as more than 25% of the number of shares of Series B-1 Preferred originally issued is outstanding. In the event that (i) at the time of
87
Table of Contents
JAMBA, INC.
NOTES TO CONSOLIDATED FINANCIAL STATEMENTS—(continued)
the Company’s 2010 annual meeting of its stockholders there are more than nine members on the Board and (ii) so long as more than 50% of the number of shares of Series B-2 Preferred originally issued are outstanding, the size of the Board will be increased by one Board seat and the holders of the shares of the Series B-2 Preferred, voting as a separate class, will be entitled to have one member on the Board to fill the seat. The ability to elect any members to the Board by the holders of the shares of Series B-2 Preferred will cease once the number of outstanding shares of Series B-2 Preferred is less than 25% of the number of shares of Series B-2 Preferred originally issued.
In the event of the liquidation, dissolution or winding-up of the affairs of the Company, whether voluntary or involuntary, the holders of shares of the Series B Preferred Stock then outstanding will be entitled to receive, out of the assets of the Company available for distribution to its stockholders before any payment shall be made to the holders of shares of Common Stock or any other junior stock by reason of their ownership thereof, an amount per share equal to the greater of (i) the Series B original issue price of $115 per share plus any applicable accrued dividends or (ii) such amount per share as would have been payable had all shares of Series B Preferred Stock been converted into Common Stock immediately prior to the liquidation.
The Series B Preferred Stock is classified as temporary stockholders’ equity, since the shares are (i) redeemable at the option of the holder in the future after satisfaction of the requisite holding period and (ii) have conditions for redemption which are not solely within the control of the Company. Total transaction costs of $3.1 million, which is comprised of $2.2 million in transaction fees and $885,000 paid to investors is recorded as a reduction in proceeds received by the Company. The $885,000 paid to investors, is also recorded as a beneficial conversion feature. These items will be accreted to the redemption amount over seven years. The proceeds from the issuance of Series B Preferred Stock were used to repay in full the outstanding debt resulting from the Company’s Senior Notes and for working capital. During fiscal 2009, the Company paid cash dividends on the Series B Preferred Stock totaling $1.5 million. Accretion related to the Series B Preferred Stock for fiscal 2009 was $0.3 million.
The Company granted a warrant to purchase common stock to Northpoint Advisors, LLC by the Company for professional services provided. The number of shares purchasable upon exercise of the warrant is 760,870 and the exercise price is $1.15 per share. The fair value of the warrant on June 16, 2009 was estimated at $0.2 million and is recorded as a reduction in proceeds received by the Company and will be accreted to the redemption amount. The number of shares and exercise price are subject to adjustments due to events such as stock splits, distributions of common stock and other similar capital restructuring as noted in the warrant document. The warrant is a registrable security under the provisions of the Registration Rights Agreement of June 16, 2009 among the Company and the investors. The registrable securities include the shares issuable upon exercise of the warrant as well as shares issuable upon conversion of the Series B Preferred Stock to common stock. In accordance with the registration rights agreement, the Company filed an S-3 registration statement after the issuance of the registrable securities.
12. NOTE PAYABLE & FINANCING AGREEMENT
On April 17, 2008, the Company entered into a credit agreement with Wells Fargo Financial, LLC which established a senior secured revolving credit facility of $25.0 million, subject to a maximum of two times trailing thirteen period adjusted EBITDA. The Company subsequently terminated this agreement on September 11, 2008. The early termination fee resulting from the cancellation of this credit agreement was $0.3 million.
On September 11, 2008, the Company entered into a financing agreement (the “Financing Agreement”) with Victory Park Management, LLC, as agent, and its affiliated funds as lenders (“Lenders”) whereby the Lenders
88
Table of Contents
JAMBA, INC.
NOTES TO CONSOLIDATED FINANCIAL STATEMENTS—(continued)
purchased $25 million two-year senior secured term notes from the Company (the “Senior Notes”). The Senior Notes were secured by a first priority lien on all current and future assets of the Company, with certain exceptions. Interest rate on the Senior Notes was at 6-month LIBOR plus 8%, subject to a floor of 12.5% per annum (if the LIBOR rate was not available, interest would accrue at the Prime Rate plus 7%, subject to a floor of 12.5% per annum), with interest payable monthly in arrears, and a $375,000 make-whole interest payment to the extent the Senior Notes continued to be outstanding after 15 months. The Company had the right to prepay the Senior Notes with payment of the principle, accrued interest and, if the prepayment is after the first anniversary of the closing, the make-whole interest payment. As the likelihood of the make-whole interest payment was minimal, no value for this feature was recorded.
The Senior Notes were subject to acceleration and certain mandatory prepayment events set forth in the Financing Agreement. In connection with this Financing Agreement, the Company incurred approximately $0.9 million in loan origination fees and $0.3 million in legal fees. The Company made a $500,000 deposit on possible prepayment to the Lenders at closing, payable with the proceeds from the sale of the Senior Notes. This amount, which is classified in other long-term assets, represented a deposit of any possible prepayment should certain generating events occur that were not in the ordinary course of the Company’s business.
Pursuant to the Financing Agreement, on September 11, 2008, the Company issued to the Lenders two million shares of its common stock (the “Shares”) with certain registration rights, and entered into a Common Stock Put and Call Agreement with the Lenders (the “Put and Call Agreement”). Under the terms of the Put and Call Agreement, the Lenders had a put right requiring the Company to repurchase the Shares at a price of $1.50 per share after the earlier of the first anniversary of the closing date, the payment in full of the Senior Notes or the occurrence of certain events of default under the Financing Agreement or certain other events (the “Put Right”). The Put Right expired under certain circumstances, including if the average daily trading price for the Company’s common stock on the NASDAQ Global Market for 20 of 30 business days after the first anniversary of the closing date was greater than $1.50 per share, with average daily trading volume during such period of at least 250,000 shares, or the Lenders’ sale of the Shares to an unaffiliated third party. Under the terms of the Put and Call Agreement, the Company had a call right requiring the Lenders to sell the Shares to the Company at $1.50 per share before the earlier of the first anniversary of the closing date, the payment in full of the Senior Notes or the occurrence of certain events of default under the Financing Agreement (the “Call Right”).
The two million shares were classified as equity and recorded at fair value of $1.9 million. The Put and Call Rights were considered legally and separately detachable as they were contractually distinct from the common stock, were not embedded within the common stock shares and are considered a freestanding instrument. The Put and Call Rights had been recorded as a liability based on its fair value of $0.7 million and was marked-to-market on a quarterly basis.
As a result of the Company’s preferred stock offering, the Company repaid its note payable and financing agreement on June 16, 2009. The Put Right was exercised by the Lenders and the Company repurchased the Shares. These shares were subsequently canceled by the Company. The prepayment penalties and write-off of prepaid loan fees and transaction costs in connection with the payoff of this Financing Agreement was recorded in interest expense in the Company’s statement of operations.
13. SHARE-BASED COMPENSATION
Stock Options—The Company maintains three share-based compensation plans (collectively, the “Plans”). The Company’s 2006 Employee, Director and Consultant Stock Plan (the “2006 Plan”) was approved by the Company’s stockholders on November 28, 2006, and provides for the granting of up to five million shares of
89
Table of Contents
JAMBA, INC.
NOTES TO CONSOLIDATED FINANCIAL STATEMENTS—(continued)
common stock in the form of nonqualified and incentive stock options, stock grants or other stock-based awards to employees, nonemployee directors and consultants. In addition, in December 2008, the Company also granted stock options as an inducement grant outside of the Company’s existing equity plans to its President and Chief Executive Officer. Under the 2006 Plan, shares available for grant were 1,023,259 as of December 29, 2009.
In connection with the Merger with Jamba Juice Company, the Company assumed the outstanding options under the Jamba Juice Company 1994 Stock Incentive Plan (the “1994 Plan”) and the 2001 Equity Incentive Plan (the “2001 Plan”), which provided for granting nonqualified and incentive stock options to employees, nonemployee directors and consultants. No additional grants are available under the 2001 Plan and the 1994 Plan.
Options granted under the 2006 Plan have an exercise price equal to the closing price of the Company’s common stock on the grant date. Options granted in 2006 under the 2006 Plan have an exercise price equal to the average of the closing price of the Company’s common stock for five trading days, consisting of the two days immediately following the date of grant, the day of the grant, and two days immediately before the date of grant. Options under the 2001 Plan and 1994 Plan were granted at an exercise price equal to or greater than the fair market value of the common stock at the date of the grant and are exercisable for up to 10 years. Options outstanding under the 1994 Plan and the 2001 Plan will be fully vested in 2010.
In December 2008, the Company granted an aggregate of 1,500,000 shares of stock options to its new President and Chief Executive Officer, resulting in an increase in the number of shares issued under stock option awards outstanding. This award was granted as an inducement grant outside of the Company’s existing equity plans and will vest over the next three years.
The fair value of options granted was estimated at the date of grant using a Black-Scholes option-pricing model. Option valuation models, including Black-Scholes, require the input of highly subjective assumptions, and changes in the assumptions used can materially affect the grant date fair value of an award. These assumptions include the risk-free rate of interest, expected dividend yield, expected volatility, and the expected life of the award. The risk-free rate of interest is based on the zero coupon U.S. Treasury rates appropriate for the expected term of the award. Expected dividends are zero based on history of not paying cash dividends on the Company’s common stock. Expected volatility is based on a 50/50 blend of historic daily stock price observations of the Company’s common stock since its inception and historic daily stock price observations of the Company’s peers during the period immediately preceding the share-based award grant that is equal in length to the award’s expected term. As required by authoritative guidance, estimated forfeitures are included as a part of the grant date estimate. The Company uses historical data to estimate expected employee behaviors related to option exercises and forfeitures. There is currently no market-based mechanism or other practical application to verify the reliability and accuracy of the estimates stemming from these valuation models or assumptions, nor is there a means to compare and adjust the estimates to actual values, except for annual adjustments to reflect actual forfeitures.
The fair value of stock options was estimated at the date of grant using a Black-Scholes option pricing model with the following weighted-average assumptions:
| Fiscal Year Ended December 29, 2009 |
Fiscal Year Ended December 30, 2008 |
Fiscal Year Ended January 1, 2008 |
|||||||
| Weighted-average risk-free interest rate |
2.03 | % | 2.40 | % | 4.30 | % | |||
| Expected life of options (years) |
5.0 | 5.0 | 5.0 | ||||||
| Expected stock volatility |
57.9 | % | 49.4 | % | 38.5 | % | |||
| Expected dividend yield |
0 | % | 0 | % | 0 | % |
90
Table of Contents
JAMBA, INC.
NOTES TO CONSOLIDATED FINANCIAL STATEMENTS—(continued)
A summary of the stock option activities for fiscal years 2008 and 2009 are presented below (shares and dollars in thousands):
| Number of Options |
Weighted- Average Exercise Price |
Weighted- Average Contractual Term |
Aggregate Intrinsic Value | ||||||||
| Options outstanding at January 1, 2008 |
3,692 | $ | 9.14 | ||||||||
| Options granted |
3,390 | 1.03 | |||||||||
| Options exercised |
— | — | |||||||||
| Options canceled |
(2,013 | ) | 9.25 | ||||||||
| Options outstanding at December 30, 2008 |
5,069 | $ | 3.68 | ||||||||
| Options granted |
1,270 | 1.09 | |||||||||
| Options exercised |
(22 | ) | 1.31 | ||||||||
| Options canceled |
(971 | ) | 5.48 | ||||||||
| Options outstanding at December 29, 2009 |
5,346 | $ | 2.75 | 8.53 | $ | 3,001 | |||||
| Options vested or expected to vest at December 29, 2009 |
3,889 | $ | 3.23 | 8.37 | $ | 2,124 | |||||
| Options exercisable at December 29, 2009 |
2,225 | $ | 4.17 | 8.02 | $ | 1,173 | |||||
The intrinsic value of stock options is defined as the difference between the current market value and the exercise price, which is equal to the market value at the time of the grant.
Information regarding options outstanding and exercisable at December 29, 2009 is as follows:
| Range of Exercise Prices |
Number Outstanding |
Weighted-Average Remaining Contractual Life |
Weighted-Average Exercise Price |
Number Exercisable |
Weighted-Average Exercise Price | |||||||
| $0.36 - $0.50 |
502,500 | 9.22 years | $ | 0.36 | 416,250 | $ | 0.36 | |||||
| $0.51 - $1.30 |
1,735,363 | 8.98 years | 0.66 | 451,613 | 0.67 | |||||||
| $1.31 - $3.30 |
1,970,000 | 8.95 years | 1.51 | 498,100 | 1.56 | |||||||
| $3.31 - $5.30 |
220,193 | 7.03 years | 4.49 | 142,543 | 4.50 | |||||||
| $5.31 - $7.30 |
33,384 | 7.59 years | 6.78 | 16,884 | 6.77 | |||||||
| $7.31 - $9.30 |
122,444 | 5.90 years | 8.28 | 106,326 | 8.20 | |||||||
| $9.31 - $11.30 |
306,500 | 7.45 years | 9.77 | 228,250 | 9.87 | |||||||
| $11.31 - $11.77 |
455,642 | 6.52 years | 11.42 | 365,414 | 11.42 | |||||||
| 5,346,026 | 8.53 years | $ | 2.75 | 2,225,380 | $ | 4.17 | ||||||
The weighted-average fair value of options granted in fiscal 2009 and fiscal 2008 was $0.61 and $0.47, respectively. At December 29, 2009, 3,888,986 stock options are expected to vest over the next three years.
Share-based compensation expense was $1.3 million, $4.2 million, and $4.2 million for fiscal 2009, fiscal 2008, and fiscal 2007, respectively, and is included in general and administrative expenses in the consolidated statements of operations. No income tax benefit was recorded in fiscal 2009 and fiscal 2008. Income tax benefit recognized in the consolidated statement of operations for share-based compensation was $1.2 million for fiscal 2007.
Restricted Stock—During the fiscal year ended December 29, 2009, the Company issued restricted stock units (“RSUs”) as permitted under the 2006 Plan. RSUs are charged against the 2006 Plan share reserve on the basis of one share for each one share granted. The fair value of RSUs is determined based on the Company’s
91
Table of Contents
JAMBA, INC.
NOTES TO CONSOLIDATED FINANCIAL STATEMENTS—(continued)
closing stock price on the date of grant. These RSUs vest and become unrestricted 33.3% on the first anniversary of the grant date and 33.3% per year thereafter. Share-based compensation expense is recognized ratably over the three-year service period for RSUs.
Information regarding activity for RSUs outstanding under the 2006 Plan is as follows (shares in thousands):
| Number of shares of RSUs |
Weighted- Average Grant Date Fair Value (per share) | ||||
| RSUs outstanding as of December 30, 2008 |
— | — | |||
| RSUs granted |
180 | $ | 1.79 | ||
| RSUs forfeited (canceled) |
— | — | |||
| RSUs outstanding as of December 29, 2009 |
180 | $ | 1.79 | ||
No outstanding RSUs were vested as of December 29, 2009.
14. INCOME TAXES
The components of the income tax provision are as follows (in thousands):
| December 29, 2009 |
December 30, 2008 |
January 1, 2008 |
|||||||||
| Current provision |
$ | 422 | $ | (421 | ) | $ | (88 | ) | |||
| Deferred benefit |
644 | 695 | 52,223 | ||||||||
| Income tax benefit—net |
$ | 1,066 | $ | 274 | $ | 52,135 | |||||
Included in the fiscal 2007 deferred benefit are tax benefits of $3.6 million related 2007 federal net operating losses and $1.3 million related to 2007 state net operating losses.
The difference between the effective income tax rate and the United States federal income tax rate is summarized as follows:
| December 29, 2009 |
December 30, 2008 |
January 1, 2008 |
|||||||
| Statutory federal rate |
(34.0 | )% | (34.0 | )% | (34.0 | )% | |||
| State income taxes less federal benefit |
(5.5 | ) | (5.7 | ) | (5.8 | ) | |||
| Change in valuation allowance |
34.7 | 40.6 | — | ||||||
| Nontaxable gain on derivative liability |
(0.2 | ) | (2.4 | ) | (14.3 | ) | |||
| Stock options |
1.5 | 1.5 | — | ||||||
| Impairment of goodwill |
— | 0.2 | 22.0 | ||||||
| Other |
(0.7 | ) | (0.4 | ) | 0.6 | ||||
| (4.2 | )% | (0.2 | )% | (31.5 | )% | ||||
Deferred income taxes are provided for the temporary differences between the carrying values of the Company’s assets and liabilities for financial reporting purposes and their corresponding income tax bases. The temporary differences give rise to either a deferred tax asset or liability in the financial statements that is computed by applying current statutory tax rates to taxable and deductible temporary differences based upon the classification (i.e., current or noncurrent) of the asset or liability in the financial statements that relates to the particular temporary difference. Deferred taxes related to differences that are not attributable to a specific asset or liability are classified in accordance with the future period in which they are expected to reverse and be
92
Table of Contents
JAMBA, INC.
NOTES TO CONSOLIDATED FINANCIAL STATEMENTS—(continued)
recognized for income tax purposes. The deferred tax asset (liability) consisted of the following temporary differences as of December 29, 2009, and December 30, 2008 (in thousands):
| December 29, 2009 |
December 30, 2008 |
|||||||
| Reserves and accruals |
$ | 8,188 | $ | 8,589 | ||||
| Total current deferred tax asset |
8,188 | 8,589 | ||||||
| Net operating losses |
28,086 | 19,954 | ||||||
| Deferred rent |
2,490 | 2,124 | ||||||
| Tax credit attributes |
2,188 | 2,187 | ||||||
| Basis difference in intangibles |
6,505 | 6,966 | ||||||
| Share-based compensation |
875 | 760 | ||||||
| Basis difference in fixed assets |
20,073 | 17,500 | ||||||
| Basis difference in investments |
(175 | ) | (188 | ) | ||||
| Reserves and accruals |
984 | 2,021 | ||||||
| Other |
161 | 224 | ||||||
| Total non-current deferred tax asset |
61,187 | 51,548 | ||||||
| Valuation allowance |
(68,377 | ) | (59,783 | ) | ||||
| Total net deferred tax asset |
$ | 998 | $ | 354 | ||||
At December 29, 2009 the Company has federal and state net operating loss carryovers of $66.1 million and $83.3 million, respectively, which, if not used earlier, will expire between 2017 and 2030. In addition, the Company also has tax credit carryforwards for federal and state purposes of $1.4 million and $0.7 million, respectively, which do not expire. Due to the enactment of the Worker, Homeownership, and Business Assistance Act of 2009, the Company has the ability to carryback its alternative minimum tax net operating loss for fiscal 2008 five years in order to offset 100% of the alternative minimum taxable income in those years. By doing so, the Company will receive a refund of prior alternative minimum tax payments of $0.6 million. Because the deferred tax asset established for these alternative minimum tax credits will be realized, the respective valuation allowance has been released.
Tax benefit of net operating losses, temporary differences and credit carryforwards are recorded as an asset to the extent that management assesses that these items are “more likely than not” to be realized. Realization of the future tax benefits is dependent on the Company’s ability to generate sufficient taxable income within the carryforward period. A valuation allowance is provided for deferred tax assets when it is “more likely than not” that some portion of the deferred tax asset will not be realized. Because of the Company’s recent history of operating losses, management believes the recognition of the deferred tax assets arising from the above-mentioned future tax benefits is currently not likely to be realized and, accordingly, has provided a valuation allowance. A full valuation allowance has been recorded for the net deferred tax assets at December 29, 2009, which increases the valuation allowance by $8.6 million for the fiscal year ended December 29, 2009. A deferred tax asset of $354,000 remains due to the impact that an uncertain tax position liability has on deferred taxes. In addition, a deferred tax asset of $645,000 remains due to the impact of the Worker, Homeownership and Business Assistance Act of 2009, which allows the Company to carryback alternative minimum tax losses five years.
On September 11, 2008, the Company entered into a Financing Agreement with Victory Park Management, LLC (see Note 12). The allocation of the proceeds from this Financing Agreement to equity created a temporary difference between the financial statement carrying amount of the debt and the tax basis of the debt, giving rise to a deferred tax liability. At December 30, 2008 the related deferred liability of $0.7 million had been treated as a
93
Table of Contents
JAMBA, INC.
NOTES TO CONSOLIDATED FINANCIAL STATEMENTS—(continued)
charge to stockholders’ equity. The deferred liability established and charged to stockholders’ equity related to the financing arrangement has reduced the valuation allowance necessary at December 30, 2008. The impact of this reduction has been allocated to stockholders’ equity and, therefore, there was no net effect on stockholders’ equity at the end of the year. As a result of the Company’s preferred stock offering, the Company repaid its note payable and financing agreement on June 16, 2009.
The reserve for uncertain tax positions was $1.1 million and $1.5 million as of December 29, 2009 and December 30, 2008. If recognized, the reserve would impact the Company’s effective tax rate. This balance is the Company’s best estimate of potential liability for uncertain tax positions and includes accrued interest related to uncertain tax positions. The decrease in the uncertain tax positions was primarily due to lapses in the statute of limitations. Inherent uncertainties exist in estimates of tax contingencies due to changes in tax law, both legislated and concluded through the various jurisdictions’ tax court systems. The Company expects no reversals within the next 12 months.
Changes in the Company’s reserve for uncertain tax positions are as follows (in thousands):
| Fiscal Year Ended December 29, 2009 |
Fiscal Year Ended December 30, 2008 |
Fiscal Year Ended January 1, 2008 | ||||||||
| Beginning balance |
$ | 1,512 | $ | 1,470 | $ | 1,400 | ||||
| Increases attributable to tax positions taken during prior and current periods |
— | 42 | 70 | |||||||
| Decreases resulting from a lapse of applicable statutes of limitations |
(397 | ) | — | — | ||||||
| Ending balance |
$ | 1,115 | $ | 1,512 | $ | 1,470 | ||||
As of December 29, 2009, the Company is subject to U.S. federal income tax examinations for the tax years ended June 27, 2006 and November 28, 2006 for the subsidiary returns and the tax year ended December 31, 2006, January 1, 2008 and December 30, 2008 for the consolidated return. The Internal Revenue Service (“IRS”) has completed its examinations of the subsidiary’s federal income tax return for the tax years ended June 29, 2004 and June 28, 2005. The Company is also subject to state and local income tax examinations for tax returns filed for the years ended June 29, 2004 through December 29, 2009.
The valuation allowance for deferred tax assets was $68.4 million and $59.8 million as of December 29, 2009 and December 30, 2008 respectively. In 2009, there was an increase in the valuation allowance of $9.4 million charged to operations, offset by $0.2 million for an adjustment to equity rather than to the deferred tax assets and $0.6 million related to the Company’s ability to realize the deferred tax asset related to the alternative minimum tax credits.
15. WARRANTS AND DERIVATIVE INSTRUMENTS
The Company issued warrants to purchase 17,250,000 shares of common stock at an exercise price of $6.00 per share and an option to purchase up to a total of 750,000 units at an exercise price of $10.00 per share in connection with its initial public offering in July 2005. All warrants and the options to purchase the units related to the Company’s initial public offering expired on June 28, 2009. The Company has 283,966 warrants outstanding from its Merger and 760,870 warrants outstanding related to the Company’s Series B Preferred Shares issued in July 2009. No warrants were exercised in fiscal 2009 or fiscal 2008. During fiscal 2007, the Company received $4.0 million of proceeds for the exercise of 669,500 of the $6.00 warrants. The fair value of warrants exercised of $2.5 million was reclassified from derivative liability to additional paid-in capital on the date of exercise.
94
Table of Contents
JAMBA, INC.
NOTES TO CONSOLIDATED FINANCIAL STATEMENTS—(continued)
The weighted-average remaining contractual life of the warrants and the option to purchase the units outstanding as of December 30, 2008 was 0.5 years and 1.5 years, respectively. The aggregate intrinsic value of the warrants and the option to purchase the units were $0 and $0.1 million, respectively, as of December 30, 2008. The intrinsic value of warrants exercised during fiscal 2008 and fiscal 2007 was $0 and $2.1 million, respectively.
16. FAIR VALUE MEASUREMENT
The Company measures its cash equivalents at fair value. Fair value is an exit price, representing the amount that would be received to sell an asset or paid to transfer a liability in an orderly transaction between market participants. As such, fair value is a market-based measurement that should be determined based on assumptions that market participants would use in pricing an asset or a liability. A three-tier fair value hierarchy is established as a basis for considering such assumptions and for inputs used in the valuation methodologies in measuring fair value:
Level 1: Quoted prices are available in active markets for identical assets or liabilities.
Level 2: Inputs are other than quoted prices in active markets included in Level 1, which are either directly or indirectly observable.
Level 3: Unobservable inputs that are supported by little or no market activity, therefore requiring an entity to develop its own assumptions that market participants would use in pricing.
The following table presents our financial assets and liabilities that were accounted for at fair value on a recurring basis as of December 29, 2009 and December 30, 2008 by level within the fair value hierarchy (in thousands):
| Level 1 | Level 2 | Level 3 | |||||||
| December 29, 2009 |
|||||||||
| Assets: |
|||||||||
| Cash invested in money market fund(1) |
$ | 2,842 | $ | — | $ | — | |||
| Assets held for sale(2) |
— | — | 1,319 | ||||||
| Long-lived assets(3) |
— | — | 12,311 | ||||||
| December 30, 2008 |
|||||||||
| Assets: |
|||||||||
| Cash invested in money market fund(1) |
1,896 | — | — | ||||||
| Liabilities: |
|||||||||
| $6.00 Warrants(4) |
124 | — | — | ||||||
| Embedded Warrants(4) |
— | — | — | ||||||
| Put/Call Agreement(4) |
— | — | 1,974 | ||||||
| (1) | Included in cash and cash equivalents on the consolidated balance sheet. |
| (2) | Included in prepaid expenses and other current assets on the consolidated balance sheet. |
| (3) | Included in property, fixtures and equipment, net on the consolidated balance sheet. |
| (4) | Included in derivative liabilities on the consolidated balance sheet. |
95
Table of Contents
JAMBA, INC.
NOTES TO CONSOLIDATED FINANCIAL STATEMENTS—(continued)
For assets that are measured using quoted prices in active markets, fair value is the published market price per unit multiplied by the number of units held without consideration of transaction costs. As of December 29, 2009, we had $2.8 million of cash invested in money market funds and active exchange funds.
Assets held for sale consists of Company Stores that the Company expects to refranchise. Such assets are recorded at the lower of the carrying amount or fair value less cost to sell. Fair value is determined based on the purchase price in the asset purchase agreement.
The Company reviews its long-lived assets, including leasehold improvements and other fixed assets for impairment at least quarterly or whenever events or changes in circumstances indicate that its carrying amount may not be recoverable. Impairment losses represented the excess of the carrying value over the fair value of the affected assets and are included in impairment of long-lived assets on the Company’s consolidated statements of operations. The fair value of impaired assets was estimated based upon the present value of the anticipated cash flows associated with each related asset. The estimate of anticipated cash flows is based upon, among other things, certain assumptions about expected future operating performance. If the sum of the undiscounted cash flows is less than the carrying value of the asset, the Company recognizes an impairment loss, measured as the amount by which the carrying value exceeds the fair value of the asset.
17. EMPLOYEE BENEFIT PLAN
The Company maintains a voluntary defined contribution plan covering all eligible employees. Eligible employees may elect to defer and contribute a percentage of their compensation to the plan, not to exceed the dollar amount set by law. The Company will match 100% of the first 3%, and 50% for the 4% and 5% of an employee’s contributions. During fiscal 2009, fiscal 2008, and fiscal 2007, the Company contributed $0.8 million, $1.1 million, and $0.4 million to the plan, respectively.
18. OTHER COMMITMENTS AND CONTINGENCIES
Litigation Related—The Company or its wholly owned subsidiary, Jamba Juice Company, is a defendant in certain litigation arising in the normal course of business. In the opinion of management, the ultimate resolution of such litigation will not have a significant effect on the consolidated financial statements.
Other—The Company has purchase obligations with certain suppliers for certain fruits and dairy for various terms ranging from one year to 15-year terms ending in 2024 for commitments to purchase a minimum level of fruit and other items used in the production of the Company’s products totaling $71.7 million over the next 15 years.
19. RELATED-PARTY TRANSACTIONS
The Company paid $0.1 million to Mistral Capital Management, LLC for monitoring fees pursuant to the securities purchase agreement for the sale of its Series B Preferred Stock. Mistral Capital Management, LLC serves as an investment manager to certain funds who hold shares of the Company’s Series B Preferred Stock. Two members of the Company’s Board of Directors, Andrew R. Heyer and Beth L. Bronner, hold positions as general partner and Managing Director, respectively, of Mistral Capital Management, LLC.
Under an agreement with its Florida joint venture, the Company was reimbursed for incurring employee expenses related to managing and operating certain Florida stores. These reimbursements totaled $2.5 million and $2.9 million in fiscal 2008 and fiscal 2007, respectively.
96
Table of Contents
JAMBA, INC.
NOTES TO CONSOLIDATED FINANCIAL STATEMENTS—(continued)
20. SUBSEQUENT EVENT
The Company completed the sale of 20 of its Company Stores in Utah, Central California and Southern California to franchisees in February, 2010. The Company expects to recognize a gain from these sales in its first quarter.
21. UNAUDITED QUARTERLY INFORMATION
(In thousands, except per share amounts)
| Fiscal Year 2009 | ||||||||||||||||
| Sixteen Weeks Ended April 21, 2009 |
Twelve Weeks Ended July 14, 2009 |
Twelve Weeks Ended October 6, 2009 |
Twelve Weeks Ended December 29, 2009 |
|||||||||||||
| Total revenue |
$ | 88,786 | $ | 83,178 | $ | 78,991 | $ | 50,598 | ||||||||
| Gross profit |
67,579 | 63,869 | 59,709 | 37,727 | ||||||||||||
| (Loss) income from operations |
(8,937 | ) | (1,717 | ) | 2,570 | (12,023 | ) | |||||||||
| Gain on derivative liabilities |
165 | 1,432 | — | — | ||||||||||||
| Interest income |
334 | 30 | 21 | 19 | ||||||||||||
| Interest expense |
(1,749 | ) | (4,851 | ) | (320 | ) | 15 | |||||||||
| Other income (expense) |
(1,250 | ) | (3,389 | ) | (299 | ) | 34 | |||||||||
| Net (loss) income |
(10,204 | ) | (5,123 | ) | 2,766 | (11,384 | ) | |||||||||
| Preferred stock dividends and deemed dividends |
— | (226 | ) | (653 | ) | (981 | ) | |||||||||
| Net (loss attributable) income available to common stockholders |
(10,204 | ) | (5,349 | ) | 2,113 | (12,365 | ) | |||||||||
| Basic (loss) earnings per share |
(0.19 | ) | (0.10 | ) | 0.04 | (0.23 | ) | |||||||||
| Diluted (loss) earnings per share |
(0.19 | ) | (0.10 | ) | 0.04 | (0.23 | ) | |||||||||
| Fiscal Year 2008 | ||||||||||||||||
| Sixteen Weeks Ended April 22, 2008 |
Twelve Weeks Ended July 15, 2008 |
Twelve Weeks Ended October 7, 2008 |
Twelve Weeks Ended December 30, 2008 |
|||||||||||||
| Total revenue |
$ | 101,553 | $ | 98,598 | $ | 86,635 | $ | 56,104 | ||||||||
| Gross profit |
75,174 | 73,264 | 63,889 | 41,400 | ||||||||||||
| Loss from operations |
(19,555 | ) | (84,867 | ) | (11,436 | ) | (39,775 | ) | ||||||||
| Gain (loss) on derivative liabilities |
5,642 | 2,488 | (520 | ) | 285 | |||||||||||
| Interest income |
186 | 59 | 69 | 51 | ||||||||||||
| Interest expense |
(112 | ) | (106 | ) | (485 | ) | (1,361 | ) | ||||||||
| Other income (expense) |
5,716 | 2,441 | (936 | ) | (1,025 | ) | ||||||||||
| Net loss |
(6,431 | ) | (89,195 | ) | (12,363 | ) | (41,174 | ) | ||||||||
| Basic loss per share |
(0.12 | ) | (1.69 | ) | (0.23 | ) | (0.75 | ) | ||||||||
| Diluted loss per share |
(0.12 | ) | (1.69 | ) | (0.23 | ) | (0.75 | ) | ||||||||
97
Table of Contents
| ITEM 9. | CHANGES IN AND DISAGREEMENTS WITH ACCOUNTANTS ON ACCOUNTING AND FINANCIAL DISCLOSURE |
Not Applicable.
| ITEM | 9A. CONTROLS AND PROCEDURES |
Disclosure Controls and Procedures
We maintain disclosure controls and procedures that are designed to ensure that information required to be disclosed in the Company’s reports under the Securities Exchange Act of 1934, as amended (the “Exchange Act”), is recorded, processed, summarized and reported within the time periods specified in the SEC’s rules and forms, and that such information is accumulated and communicated to management, including our Chief Executive Officer (“CEO”) and Chief Financial Officer (“CFO”), as appropriate, to allow timely decisions regarding required disclosure. In designing and evaluating the disclosure controls and procedures, management recognized that any controls and procedures, no matter how well designed and operated, can provide only reasonable assurance of achieving the desired control objectives, as the Company’s controls are designed to do, and management necessarily was required to apply its judgment in evaluating the risk related to controls and procedures.
In connection with the preparation of this Annual Report on Form 10-K, as of December 29, 2009, an evaluation was performed under the supervision and with the participation of our management, including the CEO and CFO, of the effectiveness of the design and operation of our disclosure controls and procedures (as defined in Rule 13a-15(e) under the Exchange Act). Based on that evaluation, our CEO and CFO concluded that our disclosure controls and procedures were effective as of December 29, 2009. These conclusions were communicated to the Audit Committee.
Management’s Report on Internal Control Over Financial Reporting
Our management is responsible for establishing and maintaining adequate internal control over financial reporting as defined in Rule 13a-15(f) under the Exchange Act. Our internal control system is designed to provide reasonable assurance to the Company’s management and Board of Directors regarding the preparation and fair presentation of published financial statements. All internal control systems, no matter how well designed, have inherent limitations. Therefore, even those systems determined to be effective can provide only reasonable assurance with respect to financial statement preparation and presentation.
Our management has assessed the effectiveness of our internal control over financial reporting as of December 29, 2009. In making its assessment of internal control over financial reporting, management used the criteria set forth by the Committee of Sponsoring Organizations (“COSO”) of the Treadway Commission in Internal Control—Integrated Framework. Based on this assessment, our CEO and CFO concluded that our internal control over financial reporting was effective as of December 29, 2009 based on the criteria set forth by COSO in Internal Control—Integrated Framework.
Our independent registered public accounting firm, KPMG LLP, has issued an audit report on the effectiveness of our internal control over financial reporting. This report appears below.
Changes in Internal Control Over Financial Reporting
There were no changes in our internal control over financial reporting that occurred during our last fiscal quarter that have materially affected, or are reasonably likely to materially affect, our internal control over financial reporting.
| ITEM 9B. | OTHER INFORMATION |
Not Applicable.
98
Table of Contents
REPORT OF INDEPENDENT REGISTERED PUBLIC ACCOUNTING FIRM
The Board of Directors and Stockholders
Jamba, Inc.:
We have audited Jamba, Inc.’s internal control over financial reporting as of December 29, 2009, based on criteria established in Internal Control—Integrated Framework issued by the Committee of Sponsoring Organizations of the Treadway Commission (COSO). Jamba, Inc.’s management is responsible for maintaining effective internal control over financial reporting and for its assessment of the effectiveness of internal control over financial reporting, included in the accompanying Management’s Report on Internal Control Over Financial Reporting. Our responsibility is to express an opinion on the Company’s internal control over financial reporting based on our audit.
We conducted our audit in accordance with the standards of the Public Company Accounting Oversight Board (United States). Those standards require that we plan and perform the audit to obtain reasonable assurance about whether effective internal control over financial reporting was maintained in all material respects. Our audit included obtaining an understanding of internal control over financial reporting, assessing the risk that a material weakness exists, and testing and evaluating the design and operating effectiveness of internal control based on the assessed risk. Our audit also included performing such other procedures as we considered necessary in the circumstances. We believe that our audit provides a reasonable basis for our opinion.
A company’s internal control over financial reporting is a process designed to provide reasonable assurance regarding the reliability of financial reporting and the preparation of financial statements for external purposes in accordance with generally accepted accounting principles. A company’s internal control over financial reporting includes those policies and procedures that (1) pertain to the maintenance of records that, in reasonable detail, accurately and fairly reflect the transactions and dispositions of the assets of the company; (2) provide reasonable assurance that transactions are recorded as necessary to permit preparation of financial statements in accordance with generally accepted accounting principles, and that receipts and expenditures of the company are being made only in accordance with authorizations of management and directors of the company; and (3) provide reasonable assurance regarding prevention or timely detection of unauthorized acquisition, use, or disposition of the company’s assets that could have a material effect on the financial statements.
Because of its inherent limitations, internal control over financial reporting may not prevent or detect misstatements. Also, projections of any evaluation of effectiveness to future periods are subject to the risk that controls may become inadequate because of changes in conditions, or that the degree of compliance with the policies or procedures may deteriorate.
In our opinion, Jamba, Inc. maintained, in all material respects, effective internal control over financial reporting as of December 29, 2009, based on criteria established in Internal Control – Integrated Framework issued by the Committee of Sponsoring Organizations of the Treadway Commission.
We also have audited, in accordance with the standards of the Public Company Accounting Oversight Board (United States), the consolidated balance sheets of Jamba, Inc. and subsidiary as of December 29, 2009 and December 30, 2008 and the related consolidated statements of operations, stockholders’ equity, and cash flows for the fiscal years ended December 29, 2009 and December 30, 2008, and our report dated March 10, 2010 expressed an unqualified opinion on those consolidated financial statements.
/s/ KPMG LLP
San Francisco, California
March 10, 2010
99
Table of Contents
| ITEM 10. | DIRECTORS, EXECUTIVE OFFICERS AND CORPORATE GOVERNANCE |
Information regarding the Directors of the Company is incorporated herein by reference from the Company’s 2010 Proxy Statement to Stockholders to be filed pursuant to Regulation 14A under the Exchange Act no later than 120 days after the end of the Company’s 2009 fiscal year.
Information regarding the Executive Officers of the Company is contained in Part I of this Annual Report on Form 10-K.
| ITEM 11. | EXECUTIVE COMPENSATION |
The information required by Item 11 is incorporated herein by reference from the Company’s 2010 Proxy Statement to Stockholders to be filed pursuant to Regulation 14A under the Exchange Act no later than 120 days after the end of the Company’s 2009 fiscal year.
| ITEM 12. | SECURITY OWNERSHIP OF CERTAIN BENEFICIAL OWNERS AND MANAGEMENT AND RELATED STOCKHOLDER MATTERS |
Except as set forth below, information required by Item 12 is incorporated herein by reference from the Company’s 2010 Proxy Statement to Stockholders to be filed pursuant to Regulation 14A under the Exchange Act no later than 120 days after the end of the Company’s 2009 fiscal year.
| ITEM 13. | CERTAIN RELATIONSHIPS AND RELATED TRANSACTIONS, AND DIRECTOR INDEPENDENCE |
The information required by Item 13 is incorporated herein by reference from the Company’s 2010 Proxy Statement to Stockholders to be filed pursuant to Regulation 14A under the Exchange Act no later than 120 days after the end of the Company’s 2009 fiscal year.
| ITEM 14. | PRINCIPAL ACCOUNTING FEES AND SERVICES |
The information required by Item 14 is incorporated herein by reference from the Company’s 2010 Proxy Statement to Stockholders to be filed pursuant to Regulation 14A under the Exchange Act no later than 120 days after the end of the Company’s 2009 fiscal year.
100
Table of Contents
| ITEM 15. | EXHIBITS, FINANCIAL STATEMENT SCHEDULES |
Documents filed as part of this report:
(1) List of Financial Statements
The following consolidated financial statements are included herein in Part II, Item 8 of this Annual Report on Form 10-K:
Report of Independent Registered Public Accounting Firm;
Consolidated Balance Sheets at December 29, 2009 and December 30, 2008;
Consolidated Statements of Operations for the Years Ended December 29, 2009, December 30, 2008 and January 1, 2008;
Consolidated Statements of Stockholders’ Equity for the Years Ended December 29, 2009, December 30, 2008 and January 1, 2008;
Consolidated Statements of Cash Flows for the Years Ended December 29, 2009, December 30, 2008 and January 1, 2008;
Notes to Consolidated Financial Statements
(2) Schedules to Financial Statements:
All financial statement schedules have been omitted because they are either inapplicable or the information required is provided in the Company’s Consolidated Financial Statements and Notes thereto or included in Part II, Item 8 of this Annual Report on Form 10-K.
(3) List of Exhibits
Incorporated herein by reference is a list of the Exhibits contained in the Exhibit Index.
101
Table of Contents
Pursuant to the requirements of Section 13 or 15(d) of the Securities Exchange Act of 1934, the registrant has duly caused this report to be signed on its behalf by the undersigned, thereunto duly authorized, in the City of Emeryville, State of California, on the 10th day of March, 2010.
| JAMBA, INC. | ||
| By: | /s/ JAMES D. WHITE | |
| James D. White | ||
| Chief Executive Officer and President | ||
POWER OF ATTORNEY
We the undersigned officers and directors of Jamba, Inc., hereby severally constitute and appoint James D. White and Karen L. Luey, or either of them, his attorneys-in-fact, for such person in any and all capacities, to sign any amendments to this report and to file the same, with exhibits thereto, and other documents in connection therewith, with the Securities and Exchange Commission, hereby ratifying and confirming all that either of said attorneys-in-fact, or substitute or substitutes, may do or cause to be done by virtue hereof.
Pursuant to the requirements of the Securities Exchange Act of 1934, this report has been signed below by the following persons on behalf of the registrant and in the capacities and on the dates indicated.
| Name |
Title |
Date | ||
| /S/ JAMES D. WHITE James D. White |
Chief Executive Officer, President and Director (Principal Executive Officer) |
March 10, 2010 | ||
| /S/ KAREN L. LUEY Karen L. Luey |
Senior Vice President and Chief Financial Officer (Principal Financial Officer and Principal Accounting Officer) |
March 10, 2010 | ||
| /S/ STEVEN R. BERRARD Steven R. Berrard |
Chairman of the Board and Director | March 10, 2010 | ||
| /S/ BETH BRONNER Beth Bronner |
Director | March 10, 2010 | ||
| /S/ THOMAS C. BYRNE Thomas C. Byrne |
Director | March 10, 2010 | ||
| /S/ RICHARD L. FEDERICO Richard L. Federico |
Director | March 10, 2010 | ||
| /S/ ANDREW HEYER Andrew Heyer |
Director | March 10, 2010 | ||
| /S/ LESLEY H. HOWE Lesley H. Howe |
Director | March 10, 2010 | ||
102
Table of Contents
| Name |
Title |
Date | ||
| /S/ RAMÓN MARTIN-BUSUTIL Ramón Martin-Busutil |
Director | March 10, 2010 | ||
| /S/ MICHAEL SERRUYA Michael Serruya |
Director | March 10, 2010 | ||
| /S/ BRIAN SWETTE Brian Swette |
Director | March 10, 2010 | ||
103
Table of Contents
EXHIBIT INDEX
| Exhibit Number |
Description |
Form |
File No. |
Exhibit | Filing Date |
Filed Herewith | ||||||
| 3.1 |
Amended and Restated Certificate of Incorporation of the Company. | 8-K | 001-32552 | 3.1 | December 5, 2006 | |||||||
| 3.2 |
Certificate of Amendment to Amended and Restated Certificate of Incorporation of the Company. | 8-K | 001-32552 | 3.2 | December 5, 2006 | |||||||
| 3.3 |
Amended and Restated Bylaws of the Company. | 8-K | 001-32552 | 3.3 | March 21, 2007 | |||||||
| 3.4 |
Certificate of Designation, Preferences and Rights of the Terms of the Series A Preferred Stock | 8-K | 001-32552 | 3.1 | October 9, 2008 | |||||||
| 3.5 |
Certificate of Designation of Series B-1 Convertible Preferred Stock and Series B-2 Convertible Preferred Stock | 8-K | 001-32552 | 3.1 | June 16, 2009 | |||||||
| 4.1 |
Specimen Common Stock Certificate. | S-1 | 333-122812 | 4.2 | February 14, 2005 | |||||||
| 4.2 |
Rights Agreement, effective as of October 8, 2008 between Jamba, Inc. and Continental Stock Transfer & Trust Company as Rights Agent | 8-K | 001-32552 | 4.1 | October 9, 2008 | |||||||
| 4.3 |
Registration Rights Agreement dated June 16, 2009 between Jamba, Inc., the Investors and North Point. | 8-K | 001-32552 | 4.1 | June 16, 2009 | |||||||
| 4.4 |
Form of Warrant issued to North Point Advisors LLC. | 8-K | 001-32552 | 4.2 | June 16, 2009 | |||||||
| 4.5 |
Amendment No. 1 to the Rights Agreement dated June 16, 2009 between Jamba, Inc. and Continental Stock Transfer & Trust Company as Rights Agent | 8-K | 001-32552 | 4.3 | June 16, 2009 | |||||||
| 10.1 |
Form of Indemnity Agreement entered into between the Company and its directors, officers and certain other employees. | 8-K | 001-32552 | 10.1 | December 5, 2006 | |||||||
| 10.2 |
Form of Distribution Agreement by and between Jamba Juice Company and various suppliers. | 8-K | 001-32552 | 10.4 | December 5, 2006 | |||||||
| 10.3 |
Office Lease for the property located at 6475 Christie Avenue, Emeryville, CA 94608, by and between Jamba Juice Company and Bay Center Office, LLC dated July 28, 2006. | 8-K | 001-32552 | 10.5 | December 5, 2006 | |||||||
| 10.4 |
Amended and Restated 1994 Stock Incentive Plan.** | 8-K | 001-32552 | 10.16 | December 5, 2006 | |||||||
104
Table of Contents
| Exhibit Number |
Description |
Form |
File No. |
Exhibit | Filing Date |
Filed Herewith | ||||||
| 10.5 |
2001 Equity Incentive Plan.** | 8-K | 001-32552 | 10.17 | December 5, 2006 | |||||||
| 10.6 |
2006 Employee, Director and Consultant Stock Plan.** | 10-K | 001-32552 | 10.18 | April 2, 2007 | |||||||
| 10.7 |
Form of Incentive Stock Option Agreement under the 2006 Plan.** | 8-K | 001-32552 | 10.19 | December 5, 2006 | |||||||
| 10.8 |
Form of Non-Qualified Stock Option Agreement under the 2006 Plan.** | 8-K | 001-32552 | 10.20 | December 5, 2006 | |||||||
| 10.9 |
Non-employee Director Compensation Policy.** | 8-K | 001-32552 | 10.21 | December 5, 2006 | |||||||
| 10.10 |
Form of Registration Rights Agreement between Services Acquisition Corp. International and investors, as amended. | 8-K | 001-32552 | 10.3 | March 16, 2006 | |||||||
| 10.11 |
Distribution Agreement by and between Jamba Juice Company and Southwest Traders, Inc. dated September 1, 2007* | 10-K | 001-32552 | 10.27 | March 17, 2008 | |||||||
| 10.12 |
Credit Agreement, dated April 17, 2008, among Jamba, Inc., Jamba Juice Company, the Lenders that are Signatories Thereto and Wells Fargo Foothill, LLC (the “Credit Agreement”) | 8-K | 001-32552 | 10.1 | April 22, 2008 | |||||||
| 10.13 |
First Amendment to Credit Agreement, dated May 29, 2008 | 10-Q | 001-32552 | 10.2 | June 2, 2008 | |||||||
| 10.14 |
Second Amendment to Credit Agreement, dated August 22, 2008 | 8-K | 001-32552 | 10.1 | August 28, 2008 | |||||||
| 10.15 |
Severance Agreement entered into between Jamba, Inc. and Paul Clayton, dated September 3, 2008 | 8-K | 001-32552 | 10.1 | September 5, 2008 | |||||||
| 10.16 |
Financing Agreement dated September 11, 2008 among between Jamba, Inc., Jamba Juice Company the Lenders Party Thereto and Victory Park Management, LLC | 8-K | 001-32552 | 10.1 | September 12, 2008 | |||||||
| 10.17 |
Common Stock Put and Call Agreement dated as of September 11, 2008 by and among Jamba, Inc., Victory Park Special Situations, L.P. and Victory Park Credit Opportunities, L.P. | 8-K | 001-32552 | 10.2 | September 12, 2008 | |||||||
105
Table of Contents
| Exhibit Number |
Description |
Form |
File No. |
Exhibit | Filing Date |
Filed Herewith | ||||||
| 10.18 |
Registration Rights Agreement dated as of September 11, 2008 by and among Jamba, Inc., Victory Park Special Situations, L.P. and Victory Park Credit Opportunities, L.P. | 8-K | 001-32552 | 10.3 | September 12, 2008 | |||||||
| 10.19 |
Form of Executive Employment Agreement entered into between Jamba Juice Company and each of Karen L. Luey, Thibault de Chatellus, Michael Fox, Steve Adkins, Greg Schwartz and Susan Shields** | 8-K | 001-32552 | 10.1 | October 14, 2008 | |||||||
| 10.20 |
Employment Agreement dated November 17, 2008 between Jamba Juice Company and James White** | 8-K | 001-32552 | 10.1 | November 17, 2008 | |||||||
| 10.21 |
Notice of Grant of Non-Qualified Stock Option and Non-Qualified Stock Option Agreement, Dated December 1, 2008, entered into between Jamba, Inc. and James White.** | 10-K | 001-32552 | 10.22 | December 1, 2008 | |||||||
| 10.22 |
Securities Purchase Agreement dated May 31, 2009 between Jamba, Inc. and the purchasers identified therein (including as exhibits the Form of Certificate of Designation, Form of Registration Rights Agreement and of Amendment No. 1 to Rights Plan. | 8-K | 001-32552 | 10.1 | June 2, 2009 | |||||||
| 10.23 |
Form of Restricted Stock Unit Award | 8-K | 001-32552 | 10.1 | November 18, 2009 | |||||||
| 10.24 |
Form of Notice of Grant of Restricted Stock Units | 8-K | 001-32552 | 10.2 | November 18, 2009 | |||||||
| 14.1 |
Code of Business Conduct and Ethics. | 8-K | 001-32552 | 14.1 | December 5, 2006 | |||||||
| 21.1 |
List of Subsidiary. | X | ||||||||||
| 23.1 |
Consent of Independent Registered Public Accounting Firm–KPMG LLP | X | ||||||||||
| 23.2 |
Consent of Independent Registered Public Accounting Firm-Deloitte & Touche LLP | X | ||||||||||
| 24 |
Power of Attorney, included on signature page hereto. | X | ||||||||||
| 31.1 |
Certification of Chief Executive Officer pursuant to Rule 13a-14(a) and Rule 15d-14(a) of the Securities Exchange Act of 1934, as amended. | X | ||||||||||
106
Table of Contents
| Exhibit Number |
Description |
Form |
File No. |
Exhibit | Filing Date |
Filed Herewith | ||||||
| 31.2 |
Certification of Chief Financial Officer pursuant to Rule 13a-14(a) and Rule 15d-14(a) of the Securities Exchange Act of 1934, as amended. | X | ||||||||||
| 32.1 |
Certification of Chief Executive Officer pursuant to 18 U.S.C. 1350, as adopted pursuant to Section 906 of the Sarbanes-Oxley Act of 2002. | X | ||||||||||
| 32.2 |
Certification of Chief Financial Officer pursuant to 18 U.S.C. 1350, as adopted pursuant to Section 906 of the Sarbanes-Oxley Act of 2002. | X | ||||||||||
| * | This exhibit (or portions thereof) has been filed separately with the Securities and Exchange Commission pursuant to an application for confidential treatment. The confidential portions of this exhibit have been omitted and are marked by an asterisk. |
| ** | Management contract, or compensatory plan or arrangement. |
107