Exhibit 13
ANNUAL REPORT 2015
Report of Independent Registered
Public Accounting Firm
The Board of
Directors and Shareholders of
The Gorman-Rupp Company
We have audited the accompanying consolidated balance sheets of The Gorman-Rupp Company as of December 31, 2015 and 2014, and the related consolidated statements of income, comprehensive income,
equity and cash flows for each of the three years in the period ended December 31, 2015. These financial statements are the responsibility of the Company’s management. Our responsibility is to express an opinion on these financial
statements based on our audits.
We conducted our audits in accordance with the standards of the Public Company Accounting Oversight Board
(United States). Those standards require that we plan and perform the audit to obtain reasonable assurance about whether the financial statements are free of material misstatement. An audit includes examining, on a test basis, evidence supporting
the amounts and disclosures in the financial statements. An audit also includes assessing the accounting principles used and significant estimates made by management, as well as evaluating the overall financial statement presentation. We believe
that our audits provide a reasonable basis for our opinion.
In our opinion, the financial statements referred to above present fairly, in all
material respects, the consolidated financial position of The Gorman-Rupp Company at December 31, 2015 and 2014, and the consolidated results of its operations and its cash flows for each of the three years in the period ended December 31,
2015, in conformity with U.S. generally accepted accounting principles.
We also have audited, in accordance with the standards of the Public
Company Accounting Oversight Board (United States), The Gorman-Rupp Company’s internal control over financial reporting as of December 31, 2015, based on criteria established in Internal Control – Integrated Framework issued by
the Committee of Sponsoring Organizations of the Treadway Commission (2013 framework), and our report dated March 11, 2016 expressed an unqualified opinion thereon.
/s/ Ernst & Young LLP
Cleveland, Ohio
March 11, 2016
14
THE GORMAN-RUPP COMPANY
Consolidated Statements of Income
|
|
|
|
|
|
|
|
|
|
|
|
|
| |
|
Year ended December 31, |
|
| (Thousands of dollars, except shares and per share amounts) |
|
2015 |
|
|
2014 |
|
|
2013 |
|
| Net sales |
|
$ |
406,150 |
|
|
$ |
434,925 |
|
|
$ |
391,665 |
|
| Cost of products sold |
|
|
313,570 |
|
|
|
327,366 |
|
|
|
298,010 |
|
|
|
|
|
|
|
|
|
|
|
|
|
|
| Gross profit |
|
|
92,580 |
|
|
|
107,559 |
|
|
|
93,655 |
|
| Selling, general and administrative expenses |
|
|
56,189 |
|
|
|
54,254 |
|
|
|
51,734 |
|
|
|
|
|
|
|
|
|
|
|
|
|
|
| Operating income |
|
|
36,391 |
|
|
|
53,305 |
|
|
|
41,921 |
|
| Other income |
|
|
1,157 |
|
|
|
940 |
|
|
|
3,050 |
|
| Other expense |
|
|
(282 |
) |
|
|
(511 |
) |
|
|
(694 |
) |
|
|
|
|
|
|
|
|
|
|
|
|
|
| Income before income taxes |
|
|
37,266 |
|
|
|
53,734 |
|
|
|
44,277 |
|
| Income taxes |
|
|
12,157 |
|
|
|
17,593 |
|
|
|
14,173 |
|
|
|
|
|
|
|
|
|
|
|
|
|
|
| Net income |
|
$ |
25,109 |
|
|
$ |
36,141 |
|
|
$ |
30,104 |
|
|
|
|
|
|
|
|
|
|
|
|
|
|
| Earnings per share |
|
$ |
0.96 |
|
|
$ |
1.38 |
|
|
$ |
1.15 |
|
|
|
|
|
|
|
|
|
|
|
|
|
|
| Average number of shares outstanding |
|
|
26,192,072 |
|
|
|
26,256,824 |
|
|
|
26,249,324 |
|
See notes to consolidated financial statements.
Consolidated Statements of Comprehensive Income
|
|
|
|
|
|
|
|
|
|
|
|
|
| |
|
Year ended December 31, |
|
| (Thousands of dollars) |
|
2015 |
|
|
2014 |
|
|
2013 |
|
| Net income |
|
$ |
25,109 |
|
|
$ |
36,141 |
|
|
$ |
30,104 |
|
| Cumulative translation adjustments |
|
|
(4,719 |
) |
|
|
(3,276 |
) |
|
|
(1,381 |
) |
| Pension and postretirement medical liability adjustments, net of tax |
|
|
(370 |
) |
|
|
(5,589 |
) |
|
|
9,202 |
|
|
|
|
|
|
|
|
|
|
|
|
|
|
| Other comprehensive (loss) income |
|
|
(5,089 |
) |
|
|
(8,865 |
) |
|
|
7,821 |
|
|
|
|
|
|
|
|
|
|
|
|
|
|
| Comprehensive income |
|
$ |
20,020 |
|
|
$ |
27,276 |
|
|
$ |
37,925 |
|
|
|
|
|
|
|
|
|
|
|
|
|
|
See notes to consolidated financial statements.
15
ANNUAL REPORT 2015
Consolidated Balance Sheets
|
|
|
|
|
|
|
|
|
| |
|
December 31, |
|
| (Thousands of dollars) |
|
2015 |
|
|
2014 |
|
| Assets |
|
|
|
|
|
|
|
|
| Current assets: |
|
|
|
|
|
|
|
|
| Cash and cash equivalents |
|
$ |
23,724 |
|
|
$ |
24,491 |
|
| Accounts receivable – net |
|
|
76,758 |
|
|
|
70,734 |
|
| Inventories – net |
|
|
82,818 |
|
|
|
94,760 |
|
| Deferred income taxes |
|
|
— |
|
|
|
4,694 |
|
| Prepaid and other |
|
|
6,091 |
|
|
|
6,030 |
|
|
|
|
|
|
|
|
|
|
| Total current assets |
|
|
189,391 |
|
|
|
200,709 |
|
| Property, plant and equipment: |
|
|
|
|
|
|
|
|
| Land |
|
|
3,736 |
|
|
|
3,562 |
|
| Buildings |
|
|
104,128 |
|
|
|
100,943 |
|
| Machinery and equipment |
|
|
163,875 |
|
|
|
162,155 |
|
|
|
|
|
|
|
|
|
|
|
|
|
271,739 |
|
|
|
266,660 |
|
| Accumulated depreciation |
|
|
(141,852 |
) |
|
|
(132,696 |
) |
|
|
|
|
|
|
|
|
|
| Property, plant and equipment – net |
|
|
129,887 |
|
|
|
133,964 |
|
| Other assets |
|
|
3,860 |
|
|
|
6,313 |
|
| Goodwill and other intangible assets – net |
|
|
41,063 |
|
|
|
39,918 |
|
|
|
|
|
|
|
|
|
|
| Total assets |
|
$ |
364,201 |
|
|
$ |
380,904 |
|
|
|
|
|
|
|
|
|
|
See notes to consolidated financial statements.
16
THE GORMAN-RUPP COMPANY
|
|
|
|
|
|
|
|
|
| |
|
December 31, |
|
| |
|
2015 |
|
|
2014 |
|
| Liabilities and equity |
|
|
|
|
|
|
|
|
| Current liabilities: |
|
|
|
|
|
|
|
|
| Accounts payable |
|
$ |
14,529 |
|
|
$ |
17,908 |
|
| Short-term debt |
|
|
— |
|
|
|
12,000 |
|
| Payroll and employee related liabilities |
|
|
10,871 |
|
|
|
11,355 |
|
| Commissions payable |
|
|
7,950 |
|
|
|
9,448 |
|
| Deferred revenue |
|
|
1,741 |
|
|
|
4,166 |
|
| Accrued expenses |
|
|
8,369 |
|
|
|
9,469 |
|
|
|
|
|
|
|
|
|
|
| Total current liabilities |
|
|
43,460 |
|
|
|
64,346 |
|
| Pension benefits |
|
|
9,309 |
|
|
|
4,496 |
|
| Postretirement benefits |
|
|
20,784 |
|
|
|
21,297 |
|
| Deferred and other income taxes |
|
|
3,627 |
|
|
|
8,798 |
|
|
|
|
|
|
|
|
|
|
| Total liabilities |
|
|
77,180 |
|
|
|
98,937 |
|
| Equity: |
|
|
|
|
|
|
|
|
| Common shares, without par value: |
|
|
|
|
|
|
|
|
| Authorized – 35,000,000 shares; |
|
|
|
|
|
|
|
|
| Outstanding – 26,083,623 shares at December 31, 2015 and 26,260,543 shares at December 31, 2014 (after deducting
treasury shares of 965,173 and 788,253, respectively), at stated capital amount |
|
|
5,095 |
|
|
|
5,133 |
|
| Additional paid-in capital |
|
|
— |
|
|
|
3,059 |
|
| Retained earnings |
|
|
304,341 |
|
|
|
291,101 |
|
| Accumulated other comprehensive loss |
|
|
(22,415 |
) |
|
|
(17,326 |
) |
|
|
|
|
|
|
|
|
|
| Total equity |
|
|
287,021 |
|
|
|
281,967 |
|
|
|
|
|
|
|
|
|
|
| Total liabilities and equity |
|
$ |
364,201 |
|
|
$ |
380,904 |
|
|
|
|
|
|
|
|
|
|
17
ANNUAL REPORT 2015
Consolidated Statements of Equity
|
|
|
|
|
|
|
|
|
|
|
|
|
|
|
|
|
|
|
|
|
|
|
|
|
| |
|
Common Shares |
|
|
Additional
Paid-In |
|
|
Retained |
|
|
Accumulated
Other
Comprehensive |
|
|
|
|
| (Thousands of dollars, except share and per share amounts) |
|
Shares |
|
|
Dollars |
|
|
Capital |
|
|
Earnings |
|
|
(Loss) Income |
|
|
Total |
|
| Balances January 1, 2013 |
|
|
26,245,543 |
|
|
$ |
5,130 |
|
|
$ |
2,693 |
|
|
$ |
243,178 |
|
|
$ |
(16,282 |
) |
|
$ |
234,719 |
|
| Net income |
|
|
|
|
|
|
|
|
|
|
|
|
|
|
30,104 |
|
|
|
|
|
|
|
30,104 |
|
| Other comprehensive income |
|
|
|
|
|
|
|
|
|
|
|
|
|
|
|
|
|
|
7,821 |
|
|
|
7,821 |
|
| Issuance of treasury shares |
|
|
7,500 |
|
|
|
1 |
|
|
|
129 |
|
|
|
28 |
|
|
|
|
|
|
|
158 |
|
| Cash dividends—$0.330 per share |
|
|
|
|
|
|
|
|
|
|
|
|
|
|
(8,662 |
) |
|
|
|
|
|
|
(8,662 |
) |
|
|
|
|
|
|
|
|
|
|
|
|
|
|
|
|
|
|
|
|
|
|
|
|
|
| Balances December 31, 2013 |
|
|
26,253,043 |
|
|
|
5,131 |
|
|
|
2,822 |
|
|
|
264,648 |
|
|
|
(8,461 |
) |
|
|
264,140 |
|
| Net income |
|
|
|
|
|
|
|
|
|
|
|
|
|
|
36,141 |
|
|
|
|
|
|
|
36,141 |
|
| Other comprehensive loss |
|
|
|
|
|
|
|
|
|
|
|
|
|
|
|
|
|
|
(8,865 |
) |
|
|
(8,865 |
) |
| Issuance of treasury shares |
|
|
7,500 |
|
|
|
2 |
|
|
|
237 |
|
|
|
27 |
|
|
|
|
|
|
|
266 |
|
| Cash dividends—$0.370 per share |
|
|
|
|
|
|
|
|
|
|
|
|
|
|
(9,715 |
) |
|
|
|
|
|
|
(9,715 |
) |
|
|
|
|
|
|
|
|
|
|
|
|
|
|
|
|
|
|
|
|
|
|
|
|
|
| Balances December 31, 2014 |
|
|
26,260,543 |
|
|
|
5,133 |
|
|
|
3,059 |
|
|
|
291,101 |
|
|
|
(17,326 |
) |
|
|
281,967 |
|
| Net income |
|
|
|
|
|
|
|
|
|
|
|
|
|
|
25,109 |
|
|
|
|
|
|
|
25,109 |
|
| Other comprehensive loss |
|
|
|
|
|
|
|
|
|
|
|
|
|
|
|
|
|
|
(5,089 |
) |
|
|
(5,089 |
) |
| Issuance of treasury shares |
|
|
7,500 |
|
|
|
2 |
|
|
|
184 |
|
|
|
26 |
|
|
|
|
|
|
|
212 |
|
| Treasury shares repurchased |
|
|
(184,420 |
) |
|
|
(40 |
) |
|
|
(3,243 |
) |
|
|
(1,296 |
) |
|
|
|
|
|
|
(4,579 |
) |
| Cash dividends—$0.405 per share |
|
|
|
|
|
|
|
|
|
|
|
|
|
|
(10,599 |
) |
|
|
|
|
|
|
(10,599 |
) |
|
|
|
|
|
|
|
|
|
|
|
|
|
|
|
|
|
|
|
|
|
|
|
|
|
| Balances December 31, 2015 |
|
|
26,083,623 |
|
|
$ |
5,095 |
|
|
$ |
— |
|
|
$ |
304,341 |
|
|
$ |
(22,415 |
) |
|
$ |
287,021 |
|
|
|
|
|
|
|
|
|
|
|
|
|
|
|
|
|
|
|
|
|
|
|
|
|
|
See notes to consolidated financial statements.
18
THE GORMAN-RUPP COMPANY
Consolidated Statements of Cash Flows
|
|
|
|
|
|
|
|
|
|
|
|
|
| |
|
Year ended December 31, |
|
| (Thousands of dollars) |
|
2015 |
|
|
2014 |
|
|
2013 |
|
| Cash flows from operating activities: |
|
|
|
|
|
|
|
|
|
|
|
|
| Net income |
|
$ |
25,109 |
|
|
$ |
36,141 |
|
|
$ |
30,104 |
|
| Adjustments to reconcile net income to net cash provided by operating activities: |
|
|
|
|
|
|
|
|
|
|
|
|
| Depreciation and amortization |
|
|
15,282 |
|
|
|
14,615 |
|
|
|
13,588 |
|
| Pension expense |
|
|
7,657 |
|
|
|
2,708 |
|
|
|
7,164 |
|
| Contributions to pension plan |
|
|
(4,000 |
) |
|
|
(2,500 |
) |
|
|
(4,200 |
) |
| Deferred income taxes |
|
|
(563 |
) |
|
|
(1,367 |
) |
|
|
241 |
|
| Gain on sale of property, plant and equipment |
|
|
(88 |
) |
|
|
(343 |
) |
|
|
(2,535 |
) |
| Changes in operating assets and liabilities, net of effects of acquisitions: |
|
|
|
|
|
|
|
|
|
|
|
|
| Accounts receivable – net |
|
|
(4,750 |
) |
|
|
(8,529 |
) |
|
|
(662 |
) |
| Inventories – net |
|
|
12,576 |
|
|
|
(2,987 |
) |
|
|
(48 |
) |
| Accounts payable |
|
|
(4,123 |
) |
|
|
(693 |
) |
|
|
2,985 |
|
| Commissions payable |
|
|
(1,498 |
) |
|
|
3,367 |
|
|
|
(1,487 |
) |
| Deferred revenue |
|
|
(2,425 |
) |
|
|
(3,024 |
) |
|
|
7,112 |
|
| Accrued expenses |
|
|
(2,436 |
) |
|
|
(3,700 |
) |
|
|
6,947 |
|
| Benefit obligations and other |
|
|
(58 |
) |
|
|
(4,685 |
) |
|
|
(8,823 |
) |
|
|
|
|
|
|
|
|
|
|
|
|
|
| Net cash provided by operating activities |
|
|
40,683 |
|
|
|
29,003 |
|
|
|
50,386 |
|
| Cash flows from investing activities: |
|
|
|
|
|
|
|
|
|
|
|
|
| Capital additions – net |
|
|
(8,260 |
) |
|
|
(13,278 |
) |
|
|
(21,014 |
) |
| Proceeds from sale of property, plant and equipment |
|
|
466 |
|
|
|
681 |
|
|
|
2,905 |
|
| Payments for acquisitions, net of cash acquired |
|
|
(3,386 |
) |
|
|
(16,667 |
) |
|
|
— |
|
|
|
|
|
|
|
|
|
|
|
|
|
|
| Net cash used for investing activities |
|
|
(11,180 |
) |
|
|
(29,264 |
) |
|
|
(18,109 |
) |
| Cash flows from financing activities: |
|
|
|
|
|
|
|
|
|
|
|
|
| Cash dividends |
|
|
(10,599 |
) |
|
|
(9,715 |
) |
|
|
(8,662 |
) |
| Treasury shares repurchased |
|
|
(4,579 |
) |
|
|
— |
|
|
|
— |
|
| Proceeds from bank borrowings |
|
|
— |
|
|
|
18,000 |
|
|
|
6,000 |
|
| Payments to banks for borrowings |
|
|
(13,912 |
) |
|
|
(15,000 |
) |
|
|
(19,000 |
) |
|
|
|
|
|
|
|
|
|
|
|
|
|
| Net cash used for financing activities |
|
|
(29,090 |
) |
|
|
(6,715 |
) |
|
|
(21,662 |
) |
| Effect of exchange rate changes on cash |
|
|
(1,180 |
) |
|
|
344 |
|
|
|
389 |
|
|
|
|
|
|
|
|
|
|
|
|
|
|
| Net (decrease) increase in cash and cash equivalents |
|
|
(767 |
) |
|
|
(6,632 |
) |
|
|
11,004 |
|
| Cash and cash equivalents: |
|
|
|
|
|
|
|
|
|
|
|
|
| Beginning of year |
|
|
24,491 |
|
|
|
31,123 |
|
|
|
20,119 |
|
|
|
|
|
|
|
|
|
|
|
|
|
|
| End of period |
|
$ |
23,724 |
|
|
$ |
24,491 |
|
|
$ |
31,123 |
|
|
|
|
|
|
|
|
|
|
|
|
|
|
See notes to consolidated financial statements.
19
ANNUAL REPORT 2015
Notes to Consolidated Financial Statements
(Amounts in tables in thousands of dollars)
Note A – Summary of Significant
Accounting Policies
General Information and Basis of Presentation
The Gorman-Rupp Company is a leading designer, manufacturer and international marketer of pumps and pump systems for use in diverse water, wastewater, construction, dewatering, industrial, petroleum,
original equipment, agriculture, fire protection, heating, ventilating and air conditioning (HVAC), military and other liquid-handling applications.
The consolidated financial statements have been prepared in accordance with U.S. generally accepted accounting principles and include the accounts of the Company and its wholly-owned subsidiaries. All
significant intercompany transactions and balances have been eliminated. Earnings per share are calculated based on the weighted-average number of common shares outstanding.
Cash Equivalents and Short-Term Investments
The Company considers highly liquid
instruments with maturities of 90 days or less to be cash equivalents. The Company periodically makes short-term investments for which cost approximates fair value. Short-term investments at December 31, 2015 and 2014 consist primarily of
certificates of deposit, and are classified as prepaid and other on the Consolidated Balance Sheets.
Accounts Receivable and Allowance for
Doubtful Accounts
Accounts receivable are stated at the historical carrying amount net of allowance for doubtful accounts. The Company
maintains an allowance for doubtful accounts for estimated losses from the failure of its customers to make required payments for products delivered. The Company estimates this allowance based on knowledge of the financial condition of customers,
review of historical receivables and reserve trends and other relevant information.
Inventories
Inventories are stated at the lower of cost or market. The costs for approximately 73% of inventories at December 31, 2015 and 75% of inventories at
December 31, 2014 are determined using the last-in, first-out (LIFO) method, with the remainder determined using the first-in, first-out (FIFO) method. Cost components include materials, inbound freight costs, labor and allocations of fixed and
variable overheads on an absorption costing basis.
Long-Lived Assets
Property, plant and equipment are stated on the basis of cost. Repairs and maintenance costs are expensed as incurred. Depreciation for property, plant and equipment and amortization for finite-lived
intangible assets are computed using the straight-line method over the estimated useful lives of the assets and are included in cost of products sold and selling, general and administrative expenses based on the use of the assets. Depreciation
expense was $13.8 million, $13.2 million and $12.4 million during 2015, 2014 and 2013, respectively.
Depreciation of property, plant and equipment is determined based on the following lives:
|
|
|
|
|
| Buildings |
|
|
20-50 years |
|
| Machinery and equipment |
|
|
5-15 years |
|
| Software |
|
|
3-5 years |
|
Amortization of finite-lived intangible assets is determined based on the following lives:
|
|
|
|
|
| Technology and drawings |
|
|
13-20 years |
|
| Customer relationships |
|
|
9-15 years |
|
| Other intangibles |
|
|
2-18 years |
|
Long-lived assets, except goodwill and indefinite-lived intangible assets, are reviewed for impairment whenever events or
changes in circumstances indicate the carrying amount may not be recovered through future net cash flows generated by the assets. Impairment losses may be recorded when the undiscounted cash flows estimated to be generated by those assets are less
than the assets’ carrying amounts based on the excess of the carrying amounts over the estimated fair value of the assets.
Goodwill
and Indefinite-Lived Intangible Assets
Goodwill and other indefinite-lived intangible assets are not amortized but are reviewed annually
for impairment as of October 1 or whenever events or changes in circumstances indicate there may be a possible permanent loss of value using either a quantitative or qualitative analysis. The Company uses a market-based approach to estimate the
fair value of our reporting units and performs a quantitative analysis using a discounted cash flow model and other valuation techniques, but may elect to perform a qualitative analysis when deemed appropriate.
For 2015, the Company used a quantitative analysis for substantially all of its goodwill impairment testing under which the fair value for each reporting
unit was estimated using a discounted cash flow model, which considered forecasted cash flows discounted at an estimated weighted-average cost of capital. The forecasted cash flows were based on the Company’s long-term operating plan and a
terminal value was used to estimate the cash flows beyond the period covered by the operating plan. The weighted-average cost of capital is an estimate of the overall after-tax rate of return required by equity and debt market holders of a business
enterprise. These analyses require the exercise of significant judgments, including judgments about appropriate discount rates, perpetual growth rates and the timing of expected future cash flows. Sensitivity analyses were performed around these
assumptions in order to assess the reasonableness of the assumptions and the resulting estimated fair values. For 2015, based on the quantitative analysis, the fair values of the Company’s reporting units continue to exceed the respective
carrying amounts. See Note J for additional information.
A qualitative analysis may be performed by assessing certain trends and factors,
including projected market outlook and growth rates, forecasted and actual sales and operating profit margins, discount rates, industry data and other relevant qualitative factors. These trends and factors are compared to, and based on, the
assumptions used in the most recent quantitative assessment.
THE GORMAN-RUPP COMPANY
Indefinite-lived intangible assets primarily consist of trademarks and trade names. The fair value of these
assets is determined using a royalty relief methodology similar to that employed when the associated assets were acquired, but using updated estimates of future sales, cash flows and profitability. For 2015 and 2014, the fair value of indefinite
lived intangible assets exceeded their carrying value.
For additional information about goodwill and other intangible assets, see Note H.
Revenue Recognition
The
Company’s revenues from product sales are recognized when all of the following criteria are met: persuasive evidence of a sale arrangement exists, the price is fixed or determinable, product delivery has occurred or services have been rendered,
there are no further obligations to customers and collectability is probable. Product delivery occurs when the risks and rewards of ownership and title pass, which normally occurs upon shipment to the customer.
Concentration of Credit Risk
The
Company generally does not require collateral from its customers and has a very good collection history. There were no sales to a single customer that exceeded 10% of total net sales for the years ended December 31, 2015, 2014 or 2013.
Shipping and Handling Costs
The Company classifies all amounts billed to customers for shipping and handling as revenue and reflects related shipping and handling costs in cost of
products sold.
Advertising
The Company expenses all advertising costs as incurred, which for the years ended December 31, 2015, 2014 and 2013 totaled $3.2 million, $3.5
million, and $3.4 million, respectively.
Product Warranties
A liability is established for estimated future warranty and service claims based on historical claims experience and specific product failures. The Company expenses warranty costs directly to cost of
products sold. Changes in the Company’s product warranty liability are:
|
|
|
|
|
|
|
|
|
|
|
|
|
| |
|
2015 |
|
|
2014 |
|
|
2013 |
|
| Balance at beginning of year |
|
$ |
1,166 |
|
|
$ |
1,170 |
|
|
$ |
1,133 |
|
| Provision |
|
|
1,732 |
|
|
|
1,607 |
|
|
|
1,220 |
|
| Claims |
|
|
(1,518 |
) |
|
|
(1,611 |
) |
|
|
(1,183 |
) |
|
|
|
|
|
|
|
|
|
|
|
|
|
| Balance at end of year |
|
$ |
1,380 |
|
|
$ |
1,166 |
|
|
$ |
1,170 |
|
|
|
|
|
|
|
|
|
|
|
|
|
|
Foreign Currency Translation
Assets and liabilities of the Company’s operations outside the United States which are accounted for in a functional currency other than U.S. dollars are translated into U.S.
dollars using year-end exchange rates. Revenues and expenses are translated at weighted-average exchange rates effective during the year. Foreign currency translation gains and losses are
included as a component of accumulated other comprehensive loss within equity.
Gains and losses resulting from foreign currency transactions,
the amounts of which are not material, are included in other income and expense.
Fair Value
The carrying value of cash and cash equivalents, accounts receivable, accounts payable and short-term debt approximates their fair value.
Use of Estimates
The preparation of
financial statements in conformity with generally accepted accounting principles requires management to make estimates and assumptions that affect the amounts reported in the consolidated financial statements and accompanying notes. Actual results
could differ from those estimates.
Reclassification
Certain amounts for 2014 and 2014 have been reclassified to conform to the 2015 presentation.
New Accounting Pronouncements
The
Company considers the applicability and impact of all Accounting Standard Updates (“ASUs”). ASUs not listed below were assessed and determined to be either not applicable or are expected to have minimal impact on the Company’s
consolidated financial statements.
In November 2015 the FASB issued ASU 2015-17, “Income Taxes (Topic 740): Balance Sheet
Classification of Deferred Taxes” which amended accounting guidance related to the presentation of deferred tax liabilities and assets. The amended guidance requires that all deferred tax liabilities and assets be classified as noncurrent
on the balance sheet. This guidance is effective for reporting periods beginning after December 15, 2016; however, early adoption is permitted. The Company adopted ASU 2015-17 during the quarter ended December 31, 2015. No prior periods
were retrospectively adjusted.
In May 2014, the FASB issued ASU 2014-09, “Revenue from Contracts with Customers (Topic
606),” which supersedes most current revenue recognition guidance, including industry-specific guidance, and requires entities to recognize revenue in a way that depicts the transfer of promised goods or services to customers in an amount
that reflects the consideration to which the entity expects to be entitled to in exchange for those goods or services. ASU 2014-09 is effective for fiscal years, and interim periods within those years, beginning after December 15, 2016;
however, in July 2015, the FASB approved a one year deferral of this standard, with a new effective date for fiscal years beginning after December 15, 2017. The Company currently does not expect the adoption of ASU 2014-09 to have a material
impact on its consolidated financial statements.
ANNUAL REPORT 2015
Notes to Consolidated Financial Statements
(Amounts in tables in thousands of
dollars)
Note B – Allowance for Doubtful Accounts
The allowance for doubtful accounts was $917,000 and $474,000 at December 31, 2015 and 2014, respectively.
Note C – Inventories
Inventories
are stated at the lower of cost or market. Replacement cost approximates current cost and the excess over LIFO cost is approximately $59.1 million and $57.9 million at December 31, 2015 and 2014, respectively. Some inventory quantities were
reduced during 2015, resulting in liquidation of some LIFO quantities carried at lower costs from earlier years versus current year costs. The related effect increased net income by $363,000. Allowances for excess and obsolete inventory totaled $5.0
million and $4.6 million at December 31, 2015 and 2014, respectively.
|
|
|
|
|
|
|
|
|
| Inventories-net |
|
2015 |
|
|
2014 |
|
| Raw materials and in-process |
|
$ |
25,652 |
|
|
$ |
16,217 |
|
| Finished parts |
|
|
46,270 |
|
|
|
42,414 |
|
| Finished products |
|
|
10,896 |
|
|
|
36,129 |
|
|
|
|
|
|
|
|
|
|
| Total net inventories |
|
$ |
82,818 |
|
|
$ |
94,760 |
|
|
|
|
|
|
|
|
|
|
Note D – Financing Arrangements
In May 2014, the Company borrowed $18.0 million under an unsecured bank loan agreement to finance the acquisition of Bayou City Pump, Inc. The loan bore interest at LIBOR plus 0.75%, adjustable and
payable monthly with annual renewal. At December 31, 2015, there was no balance outstanding on the loan.
The Company may borrow up to
$20.0 million with interest at LIBOR plus 0.75% or at alternative rates as selected by the Company under an unsecured bank line of credit which matures in November 2017. At December 31, 2015 and 2014, $19.99 million and $20.0 million,
respectively, were available for borrowing after deducting $6,000 in outstanding letters of credit in 2015.
The Company also has an $8.0
million unsecured bank line of credit with interest at LIBOR plus 0.75% payable monthly which matures in May 2016. At December 31, 2015 and 2014, $3.9 million and $6.0 million, respectively, was available for borrowing after deducting $4.1
million and $4.0 million in outstanding letters of credit, respectively.
The Company also has a $3.0 million bank guarantee with interest at
1.75% in an agreement dated June 2015. At December 31, 2015, $600,000 was available for borrowing after deducting $2.4 million in outstanding letters of credit.
The financing arrangements described above contain nominal restrictive covenants, including limits on additional borrowings and maintenance of certain operating and financial ratios. At December 31,
2015 and 2014, the Company was in compliance with all requirements.
Interest expense, which approximates interest paid, was $122,000,
$134,000 and $146,000 in 2015, 2014 and 2013, respectively.
The Company has operating leases for certain offices, manufacturing facilities, land, office equipment and
automobiles. Rental expense relating to operating leases was $1.0 million in 2015 and $1.1 million in 2014 and 2013.
The future minimum lease
payments due under these operating leases as of December 31, 2015 are:
|
|
|
|
|
|
|
|
|
|
|
|
|
|
|
|
|
|
|
|
|
|
|
|
|
|
|
| 2016 |
|
|
2017 |
|
|
2018 |
|
|
2019 |
|
|
2020 |
|
|
Thereafter |
|
|
Total |
|
| $ |
838 |
|
|
$ |
551 |
|
|
$ |
416 |
|
|
$ |
168 |
|
|
$ |
44 |
|
|
$ |
10 |
|
|
$ |
2,027 |
|
Note E – Accumulated Other Comprehensive Loss
The reclassifications out of accumulated other comprehensive loss as reported in the Consolidated Statement of Income are:
|
|
|
|
|
|
|
|
|
|
|
|
|
| Pension and other post
retirement benefits: |
|
2015 |
|
|
2014 |
|
|
2013 |
|
| Recognized actuarial loss (a) |
|
$ |
1,581 |
|
|
$ |
483 |
|
|
$ |
1,357 |
|
| Settlement loss (b) |
|
|
2,584 |
|
|
|
— |
|
|
|
2,756 |
|
| Settlement loss (c) |
|
|
1,199 |
|
|
|
— |
|
|
|
1,413 |
|
| Total before income tax |
|
|
5,364 |
|
|
|
483 |
|
|
|
5,526 |
|
| Income tax |
|
|
(1,749 |
) |
|
|
(177 |
) |
|
|
(2,006 |
) |
|
|
|
|
|
|
|
|
|
|
|
|
|
| Net of income tax |
|
$ |
3,615 |
|
|
$ |
306 |
|
|
$ |
3,520 |
|
|
|
|
|
|
|
|
|
|
|
|
|
|
| (a) |
The recognized actuarial loss is included in the computation of net periodic benefit cost. See Note G for additional details. |
| (b) |
This portion of the settlement loss is included in cost of products sold in the Consolidated Statements of Income. |
| (c) |
This portion of the settlement loss is included in selling, general and administrative expenses in the Consolidated Statements of Income. |
The components of accumulated other comprehensive loss as reported in the Consolidated Balance Sheets are:
|
|
|
|
|
|
|
|
|
|
|
|
|
| |
|
Currency
Translation
Adjustments |
|
|
Pension and
OPEB
Adjustments |
|
|
Accumulated
Other
Comprehensive
(Loss) Income |
|
| Balance at January 1, 2013 |
|
$ |
319 |
|
|
$ |
(16,601 |
) |
|
$ |
(16,282 |
) |
| Reclassifications adjustments |
|
|
— |
|
|
|
5,526 |
|
|
|
5,526 |
|
| Current period (charge) credit |
|
|
(1,381 |
) |
|
|
8,925 |
|
|
|
7,544 |
|
| Income tax benefit |
|
|
— |
|
|
|
(5,249 |
) |
|
|
(5,249 |
) |
|
|
|
|
|
|
|
|
|
|
|
|
|
| Balance at December 31, 2013 |
|
|
(1,062 |
) |
|
|
(7,399 |
) |
|
|
(8,461 |
) |
| Reclassification adjustments |
|
|
— |
|
|
|
483 |
|
|
|
483 |
|
| Current period charge |
|
|
(3,276 |
) |
|
|
(9,294 |
) |
|
|
(12,570 |
) |
| Income tax charge |
|
|
— |
|
|
|
3,222 |
|
|
|
3,222 |
|
|
|
|
|
|
|
|
|
|
|
|
|
|
| Balance at December 31, 2014 |
|
|
(4,338 |
) |
|
|
(12,988 |
) |
|
|
(17,326 |
) |
| Reclassifications adjustments |
|
|
— |
|
|
|
5,364 |
|
|
|
5,364 |
|
| Current period charge |
|
|
(4,719 |
) |
|
|
(6,038 |
) |
|
|
(10,757 |
) |
| Income tax benefit |
|
|
— |
|
|
|
304 |
|
|
|
304 |
|
|
|
|
|
|
|
|
|
|
|
|
|
|
| Balance at December 31, 2015 |
|
$ |
(9,057 |
) |
|
$ |
(13,358 |
) |
|
$ |
(22,415 |
) |
|
|
|
|
|
|
|
|
|
|
|
|
|
THE GORMAN-RUPP COMPANY
Note F – Income Taxes
The components of income before income taxes are:
|
|
|
|
|
|
|
|
|
|
|
|
|
| |
|
2015 |
|
|
2014 |
|
|
2013 |
|
| United States |
|
$ |
35,391 |
|
|
$ |
49,692 |
|
|
$ |
40,374 |
|
| Foreign countries |
|
|
1,875 |
|
|
|
4,042 |
|
|
|
3,903 |
|
|
|
|
|
|
|
|
|
|
|
|
|
|
| Total |
|
$ |
37,266 |
|
|
$ |
53,734 |
|
|
$ |
44,277 |
|
|
|
|
|
|
|
|
|
|
|
|
|
|
The components of income tax expense are:
|
|
|
|
|
|
|
|
|
|
|
|
|
| |
|
2015 |
|
|
2014 |
|
|
2013 |
|
| Current expense: |
|
|
|
|
|
|
|
|
|
|
|
|
| Federal |
|
$ |
11,465 |
|
|
$ |
16,638 |
|
|
$ |
12,159 |
|
| Foreign |
|
|
292 |
|
|
|
946 |
|
|
|
792 |
|
| State and local |
|
|
963 |
|
|
|
1,376 |
|
|
|
981 |
|
|
|
|
|
|
|
|
|
|
|
|
|
|
|
|
|
12,720 |
|
|
|
18,960 |
|
|
|
13,932 |
|
|
|
|
|
|
|
|
|
|
|
|
|
|
| Deferred (benefit) expense: |
|
|
|
|
|
|
|
|
|
|
|
|
| Federal |
|
|
(443 |
) |
|
|
(1,181 |
) |
|
|
108 |
|
| Foreign |
|
|
(112 |
) |
|
|
(114 |
) |
|
|
(38 |
) |
| State and local |
|
|
(8 |
) |
|
|
(72 |
) |
|
|
171 |
|
|
|
|
|
|
|
|
|
|
|
|
|
|
|
|
|
(563 |
) |
|
|
(1,367 |
) |
|
|
241 |
|
|
|
|
|
|
|
|
|
|
|
|
|
|
| Income tax expense |
|
$ |
12,157 |
|
|
$ |
17,593 |
|
|
$ |
14,173 |
|
|
|
|
|
|
|
|
|
|
|
|
|
|
The reconciliation between income tax expense and the amount computed by applying the statutory federal income tax rate
of 35% to income before income taxes is:
|
|
|
|
|
|
|
|
|
|
|
|
|
| |
|
2015 |
|
|
2014 |
|
|
2013 |
|
| Income taxes at statutory rate |
|
$ |
13,043 |
|
|
$ |
18,807 |
|
|
$ |
15,497 |
|
| State and local income taxes, net of federal tax benefit |
|
|
680 |
|
|
|
674 |
|
|
|
587 |
|
| Research and development tax credits |
|
|
(380 |
) |
|
|
(371 |
) |
|
|
(740 |
) |
| Domestic production activities deduction |
|
|
(964 |
) |
|
|
(1,324 |
) |
|
|
(952 |
) |
| Lower foreign taxes differential |
|
|
(476 |
) |
|
|
(583 |
) |
|
|
(612 |
) |
| Uncertain tax positions |
|
|
26 |
|
|
|
53 |
|
|
|
94 |
|
| Valuation allowance |
|
|
(59 |
) |
|
|
174 |
|
|
|
162 |
|
| Other |
|
|
287 |
|
|
|
163 |
|
|
|
137 |
|
|
|
|
|
|
|
|
|
|
|
|
|
|
| Income tax expense |
|
$ |
12,157 |
|
|
$ |
17,593 |
|
|
$ |
14,173 |
|
|
|
|
|
|
|
|
|
|
|
|
|
|
The Company made income tax payments of $13.5 million, $19.4 million, $13.2 million in 2015, 2014, and 2013,
respectively.
Deferred income tax assets and liabilities consist of:
|
|
|
|
|
|
|
|
|
|
|
|
|
| |
|
2015 |
|
|
2014 |
|
|
2013 |
|
| Deferred tax assets: |
|
|
|
|
|
|
|
|
|
|
|
|
| Inventories |
|
$ |
1,664 |
|
|
$ |
1,030 |
|
|
$ |
1,688 |
|
| Accrued liabilities |
|
|
2,450 |
|
|
|
2,538 |
|
|
|
2,341 |
|
| Postretirement health benefits obligation |
|
|
7,547 |
|
|
|
7,602 |
|
|
|
6,545 |
|
| Pension |
|
|
3,443 |
|
|
|
1,649 |
|
|
|
— |
|
| Deferred revenue |
|
|
— |
|
|
|
1,267 |
|
|
|
— |
|
| Other |
|
|
292 |
|
|
|
550 |
|
|
|
101 |
|
|
|
|
|
|
|
|
|
|
|
|
|
|
| Total deferred tax assets |
|
|
15,396 |
|
|
|
14,636 |
|
|
|
10,675 |
|
| Valuation allowance |
|
|
(277 |
) |
|
|
(336 |
) |
|
|
(162 |
) |
|
|
|
|
|
|
|
|
|
|
|
|
|
| Net deferred tax assets |
|
|
15,119 |
|
|
|
14,300 |
|
|
|
10,513 |
|
| Deferred tax liabilities: |
|
|
|
|
|
|
|
|
|
|
|
|
| Depreciation and amortization |
|
|
(18,059 |
) |
|
|
(17,711 |
) |
|
|
(16,858 |
) |
| Pension |
|
|
— |
|
|
|
— |
|
|
|
(1,634 |
) |
|
|
|
|
|
|
|
|
|
|
|
|
|
| Total deferred tax liabilities |
|
|
(18,059 |
) |
|
|
(17,711 |
) |
|
|
(18,492 |
) |
|
|
|
|
|
|
|
|
|
|
|
|
|
| Net deferred tax liabilities |
|
$ |
(2,940 |
) |
|
$ |
(3,411 |
) |
|
$ |
(7,979 |
) |
|
|
|
|
|
|
|
|
|
|
|
|
|
The Company has a valuation allowance as of December 31, 2015 of $277,000 against certain of its deferred tax
assets. The comparable amount of valuation allowance at December 31, 2014 was $336,000. ASC 740 requires that a valuation allowance be recorded against deferred tax assets when it is more likely than not that some or all of a Company’s
deferred tax assets will not be realized based on available positive and negative evidence.
At December 31, 2015, total unrecognized tax
benefits were $567,000. Of the total, $447,000 of unrecognized tax benefits, if ultimately recognized, would reduce the Company’s annual effective tax rate.
A reconciliation of the beginning and ending amount of unrecognized tax benefits is as follows:
|
|
|
|
|
|
|
|
|
|
|
|
|
| |
|
2015 |
|
|
2014 |
|
|
2013 |
|
| Balance at beginning of year |
|
$ |
576 |
|
|
$ |
516 |
|
|
$ |
421 |
|
| Additions based on tax positions related to the current year |
|
|
113 |
|
|
|
158 |
|
|
|
189 |
|
| Reductions due to lapse of applicable statute of limitations |
|
|
(101 |
) |
|
|
(98 |
) |
|
|
(46 |
) |
| Settlements |
|
|
(21 |
) |
|
|
— |
|
|
|
(48 |
) |
|
|
|
|
|
|
|
|
|
|
|
|
|
| Balance at end of year |
|
$ |
567 |
|
|
$ |
576 |
|
|
$ |
516 |
|
|
|
|
|
|
|
|
|
|
|
|
|
|
The Company is subject to income taxes in the U.S. federal and various state, local and foreign jurisdictions. Income tax
regulations within each jurisdiction are subject to the interpretation of the related tax laws and regulations and require significant judgment to apply. With few exceptions, the Company is no longer subject
ANNUAL REPORT 2015
Notes to Consolidated Financial Statements
(Amounts in tables in thousands of
dollars)
to U.S. federal, state and local, or non-U.S. income tax examinations by tax authorities for the years
before 2011. The Company has $56,000 of unrecognized tax benefits recorded for periods which the relevant statutes of limitations expire in the next 12 months.
The Company is currently under examination by the Internal Revenue Service for its tax year ending December 31, 2013. Any adjustment from this examination is not expected to have a material impact on
the consolidated financial position or results of operations of the Company. Management anticipates this examination will be resolved within the next 12 months.
The Company has state tax credit carryforwards of $533,000 and $545,000 as of December 31, 2015 and 2014, respectively, set to expire between 2018 and 2025.
The Company recognizes interest and penalties related to unrecognized tax benefits in income tax expense for all periods presented. The Company accrued
approximately $116,000 and $99,000 for the payment of interest and penalties at December 31, 2015 and 2014, respectively.
The Company
did not provide taxes with respect to $19.8 million of undistributed earnings at December 31, 2015, since the earnings are considered by the Company to be permanently reinvested. In an unanticipated future event where these earnings are
distributed or deemed distributed in a taxable transaction, the Company may be subject to United States income tax and foreign withholding taxes, the net tax liability of which is estimated to be $1.4 million.
In September 2013, the Internal Revenue Service issued final regulations governing the income tax treatment of acquisitions, dispositions, and repairs of
tangible property. Taxpayers are required to follow the new regulations in taxable years beginning on or after January 1, 2014. The impact of the regulations is not material to the Company’s consolidated financial statements.
Note G – Pensions and Other Postretirement Benefits
The Company sponsors a defined benefit pension plan (“Plan”) covering certain domestic employees. Benefits are based on each covered employee’s years of service and compensation. The Plan
is funded in conformity with the funding requirements of applicable U.S. regulations. The Plan was closed to new participants effective January 1, 2008. Employees hired after this date, in eligible locations, participate in an enhanced 401(k)
plan instead of the defined benefit pension plan. Employees hired prior to this date continue to accrue benefits.
Additionally, the Company
sponsors defined contribution pension plans made available to all domestic and Canadian employees. Total contributions to the plans in 2015 and 2014 were $1.6 million and were $1.3 million in 2013.
The Company also sponsors a non-contributory defined benefit health care plan that provides health benefits to certain domestic and Canadian retirees and
their spouses.
The Company funds the cost of these benefits as incurred. For measurement purposes, and based on maximum
benefits as defined by the plan, a zero percent annual rate of increase in the per capita cost of covered health care benefits for retirees age 65 and over was assumed for 2015 and is expected to remain constant going forward. A 5% rate of increase
for retirees under age 65 was assumed.
The Company recognizes the obligations associated with its defined benefit pension plan and defined
benefit health care plan in its consolidated financial statements. The following table presents the plans’ funded status as of the measurement date reconciled with amounts recognized in the Company’s consolidated balance sheets:
|
|
|
|
|
|
|
|
|
|
|
|
|
|
|
|
|
| |
|
Pension Plan |
|
|
Postretirement Plan |
|
| |
|
2015 |
|
|
2014 |
|
|
2015 |
|
|
2014 |
|
| Accumulated benefit obligation at
end of year |
|
$ |
63,830 |
|
|
$ |
65,454 |
|
|
$ |
22,430 |
|
|
$ |
22,813 |
|
|
|
|
|
|
|
|
|
|
|
|
|
|
|
|
|
|
| Change in projected benefit obligation: |
|
|
|
|
|
|
|
|
|
|
|
|
|
|
|
|
| Benefit obligation at beginning of year |
|
$ |
80,069 |
|
|
$ |
70,635 |
|
|
$ |
22,813 |
|
|
$ |
19,794 |
|
| Service cost |
|
|
3,064 |
|
|
|
2,904 |
|
|
|
1,194 |
|
|
|
907 |
|
| Interest cost |
|
|
2,640 |
|
|
|
2,895 |
|
|
|
790 |
|
|
|
845 |
|
| Settlement |
|
|
1,431 |
|
|
|
— |
|
|
|
— |
|
|
|
— |
|
| Benefits paid |
|
|
(10,069 |
) |
|
|
(3,584 |
) |
|
|
(1,094 |
) |
|
|
(1,736 |
) |
| Effect of foreign exchange |
|
|
— |
|
|
|
— |
|
|
|
(94 |
) |
|
|
(49 |
) |
| Actuarial loss (gain) |
|
|
465 |
|
|
|
7,219 |
|
|
|
(1,179 |
) |
|
|
3,052 |
|
|
|
|
|
|
|
|
|
|
|
|
|
|
|
|
|
|
| Benefit obligation
at end of year |
|
$ |
77,600 |
|
|
$ |
80,069 |
|
|
$ |
22,430 |
|
|
$ |
22,813 |
|
|
|
|
|
|
|
|
|
|
|
|
|
|
|
|
|
|
| Change in plan assets: |
|
|
|
|
|
|
|
|
|
|
|
|
|
|
|
|
| Plan assets at beginning of year |
|
$ |
75,573 |
|
|
$ |
70,889 |
|
|
$ |
— |
|
|
$ |
— |
|
| Actual return on plan assets |
|
|
(1,213 |
) |
|
|
5,768 |
|
|
|
— |
|
|
|
— |
|
| Employer contributions |
|
|
4,000 |
|
|
|
2,500 |
|
|
|
1,094 |
|
|
|
1,736 |
|
| Benefits paid |
|
|
(10,069 |
) |
|
|
(3,584 |
) |
|
|
(1,094 |
) |
|
|
(1,736 |
) |
|
|
|
|
|
|
|
|
|
|
|
|
|
|
|
|
|
| Plan assets at end of year |
|
|
68,291 |
|
|
|
75,573 |
|
|
|
— |
|
|
|
— |
|
|
|
|
|
|
|
|
|
|
|
|
|
|
|
|
|
|
| Funded status at end of year |
|
$ |
(9,309 |
) |
|
$ |
(4,496 |
) |
|
$ |
(22,430 |
) |
|
$ |
(22,813 |
) |
|
|
|
|
|
|
|
|
|
|
|
|
|
|
|
|
|
| Amounts recognized in the Consolidated Balance Sheets consist of: |
|
|
|
|
|
|
|
|
|
|
|
|
|
|
|
|
| Current liabilities |
|
$ |
— |
|
|
$ |
— |
|
|
$ |
(1,646 |
) |
|
$ |
(1,516 |
) |
| Noncurrent liabilities |
|
|
(9,309 |
) |
|
|
(4,496 |
) |
|
|
(20,784 |
) |
|
|
(21,297 |
) |
|
|
|
|
|
|
|
|
|
|
|
|
|
|
|
|
|
| Total liabilities |
|
$ |
(9,309 |
) |
|
$ |
(4,496 |
) |
|
$ |
(22,430 |
) |
|
$ |
(22,813 |
) |
|
|
|
|
|
|
|
|
|
|
|
|
|
|
|
|
|
THE GORMAN-RUPP COMPANY
|
|
|
|
|
|
|
|
|
|
|
|
|
|
|
|
|
| |
|
Pension
Plan |
|
|
Postretirement
Plan |
|
| |
|
2015 |
|
|
2014 |
|
|
2015 |
|
|
2014 |
|
| Amounts recognized in accumulated other comprehensive loss consist of: |
|
|
|
|
|
|
|
|
|
|
|
|
|
|
|
|
| Net actuarial loss (gain) |
|
$ |
29,992 |
|
|
$ |
28,836 |
|
|
$ |
(8,082 |
) |
|
$ |
(7,601 |
) |
| Deferred tax (benefit) expense |
|
|
(11,590 |
) |
|
|
(11,162 |
) |
|
|
3,038 |
|
|
|
2,915 |
|
|
|
|
|
|
|
|
|
|
|
|
|
|
|
|
|
|
| After tax actuarial loss (gain) |
|
$ |
18,402 |
|
|
$ |
17,674 |
|
|
$ |
(5,044 |
) |
|
$ |
(4,686 |
) |
|
|
|
|
|
|
|
|
|
|
|
|
|
|
|
|
|
|
|
|
|
|
|
|
|
|
|
|
|
|
| Components of net periodic benefit cost: |
|
|
|
|
|
|
|
|
|
|
|
|
| |
|
2015 |
|
|
2014 |
|
|
2013 |
|
| Pension Plan |
|
|
|
|
|
|
|
|
|
|
|
|
| Service cost |
|
$ |
3,064 |
|
|
$ |
2,904 |
|
|
$ |
3,144 |
|
| Interest cost |
|
|
2,640 |
|
|
|
2,895 |
|
|
|
2,851 |
|
| Expected return on plan assets |
|
|
(4,060 |
) |
|
|
(4,755 |
) |
|
|
(5,080 |
) |
| Recognized actuarial loss |
|
|
2,230 |
|
|
|
1,664 |
|
|
|
2,080 |
|
| Settlement loss |
|
|
3,783 |
|
|
|
— |
|
|
|
4,169 |
|
|
|
|
|
|
|
|
|
|
|
|
|
|
| Net periodic benefit cost |
|
$ |
7,657 |
|
|
$ |
2,708 |
|
|
$ |
7,164 |
|
|
|
|
|
|
|
|
|
|
|
|
|
|
| Other changes in pension plan assets and benefit obligations recognized in other comprehensive loss: |
|
|
|
|
|
|
|
|
|
|
|
|
| Net loss (gain) |
|
$ |
1,156 |
|
|
$ |
4,541 |
|
|
$ |
(10,734 |
) |
|
|
|
|
|
|
|
|
|
|
|
|
|
| Total expense (income) recognized in net periodic benefit cost and other comprehensive income |
|
$ |
8,813 |
|
|
$ |
7,249 |
|
|
$ |
(3,570 |
) |
|
|
|
|
|
|
|
|
|
|
|
|
|
| Postretirement Plan |
|
|
|
|
|
|
|
|
|
|
|
|
| Service cost |
|
$ |
1,194 |
|
|
$ |
907 |
|
|
$ |
1,153 |
|
| Interest cost |
|
|
790 |
|
|
|
845 |
|
|
|
724 |
|
| Recognized actuarial gain |
|
|
(649 |
) |
|
|
(1,181 |
) |
|
|
(723 |
) |
|
|
|
|
|
|
|
|
|
|
|
|
|
| Net periodic benefit cost |
|
$ |
1,335 |
|
|
$ |
571 |
|
|
$ |
1,154 |
|
| Other changes in post retirement plan assets and benefit obligations recognized in other comprehensive
loss: |
|
|
|
|
|
|
|
|
|
|
|
|
| Net (loss) gain |
|
$ |
(529 |
) |
|
$ |
4,233 |
|
|
$ |
(3,717 |
) |
|
|
|
|
|
|
|
|
|
|
|
|
|
| Total expense (income) recognized in net periodic benefit cost and other comprehensive income |
|
$ |
806 |
|
|
$ |
4,804 |
|
|
$ |
(2,563 |
) |
|
|
|
|
|
|
|
|
|
|
|
|
|
During 2015 and 2013, the Company recorded settlement losses relating to retirees that received lump-sum distributions
from the Company’s defined benefit pension plan totaling $3.8 million and $4.2 million, respectively. These charges were the result of lump-sum payments to retirees which exceeded the Plan’s actuarial service and interest cost thresholds
in each of 2015 and 2013. The cost threshold was not exceeded in 2014.
The prior service cost is amortized on a straight-line basis over the average estimated remaining service
period of active participants. The unrecognized actuarial gain or loss in excess of the greater of 10% of the benefit obligation or the market value of plan assets is also amortized on a straight-line basis over the average estimated remaining
service period of active participants.
|
|
|
|
|
|
|
|
|
|
|
|
|
|
|
|
|
| |
|
Pension |
|
|
Postretirement |
|
| |
|
Benefits |
|
|
Benefits |
|
| |
|
2015 |
|
|
2014 |
|
|
2015 |
|
|
2014 |
|
| Weighted-average assumptions used to determine benefit obligations at December 31: |
|
|
|
|
|
|
|
|
|
|
|
|
|
|
|
|
| Discount rate |
|
|
3.70 |
% |
|
|
3.45 |
% |
|
|
3.90 |
% |
|
|
3.60 |
% |
| Rate of compensation increase |
|
|
3.50 |
% |
|
|
3.50 |
% |
|
|
— |
|
|
|
— |
|
| Weighted-average assumptions used to determine net periodic benefit cost for years ended December 31: |
|
|
|
|
|
|
|
|
|
|
|
|
|
|
|
|
| Discount rate |
|
|
3.67 |
% |
|
|
4.30 |
% |
|
|
3.60 |
% |
|
|
4.50 |
% |
| Expected long-term rate of return on plan assets |
|
|
6.00 |
% |
|
|
7.00 |
% |
|
|
— |
|
|
|
— |
|
| Rate of compensation increase |
|
|
3.50 |
% |
|
|
3.50 |
% |
|
|
— |
|
|
|
— |
|
To enhance the Company’s efforts to mitigate the impact of the defined benefit pension plan on its financial
statements, the Company has recently moved towards a liability driven investing model to more closely align assets with liabilities based on when the liabilities are expected to come due. Currently, based on 2015 funding levels, equities may
comprise between 14% and 34% of the Plan’s market value. Fixed income investments may comprise between 60% and 80% of the Plan’s market value. Alternative investments may comprise between 0% and 12% of the Plan’s market value. Cash
and cash equivalents (including all senior debt securities with less than one year to maturity) may comprise between 0% and 10% of the Plan’s market value.
Financial instruments included in pension plan assets are categorized into a fair value hierarchy of three levels, based on the degree of subjectivity inherent in the valuation methodology. Level 1 assets
are based on unadjusted quoted prices in active markets that are accessible to the reporting entity at the measurement date for identical assets. Level 2 assets are valued at inputs other than quoted prices in active markets for identical assets
that are observable either directly or indirectly for substantially the full term of the assets. Level 3 assets are valued based on unobservable inputs for the asset (i.e., supported by little or no market activity). These inputs include
management’s own assessments about the assumptions that market participants would use in pricing assets (including assumptions about risk). The level in the fair value hierarchy within which the fair value measurement is classified is
determined based on the lowest level input that is significant to the fair value measure in its entirety.
ANNUAL REPORT 2015
Notes to Consolidated Financial Statements
(Amounts in tables in thousands of
dollars)
All of the Plan’s assets are in level 1 or level 2 within the fair value hierarchy and the following
table sets forth by asset class the Plan’s fair value of assets.
Plan fair value asset allocation by category:
|
|
|
|
|
|
|
|
|
| 2015 |
|
$ |
|
|
% |
|
| Level 1 |
|
|
|
|
|
|
|
|
| Equity |
|
$ |
16,908 |
|
|
|
25 |
% |
| Fixed Income |
|
|
1,468 |
|
|
|
2 |
% |
| Mutual Funds |
|
|
3,476 |
|
|
|
5 |
% |
| Money Fund and Cash |
|
|
1,011 |
|
|
|
1 |
% |
|
|
|
|
|
|
|
|
|
| Total Level 1 |
|
|
22,863 |
|
|
|
33 |
% |
| Level 2 |
|
|
|
|
|
|
|
|
| Fixed Income |
|
|
41,984 |
|
|
|
62 |
% |
| Money Fund |
|
|
3,428 |
|
|
|
5 |
% |
|
|
|
|
|
|
|
|
|
| Total Level 2 |
|
|
45,412 |
|
|
|
67 |
% |
| Level 3 |
|
|
|
|
|
|
|
|
| Total Level 3 |
|
|
— |
|
|
|
— |
|
|
|
|
|
|
|
|
|
|
| Total fair value of Plan assets |
|
$ |
68,275 |
|
|
|
100 |
% |
|
|
|
|
|
|
|
|
|
|
|
|
| 2014 |
|
$ |
|
|
% |
|
| Level 1 |
|
|
|
|
|
|
|
|
| Equity |
|
$ |
17,819 |
|
|
|
23 |
% |
| Fixed Income |
|
|
2,169 |
|
|
|
3 |
% |
| Mutual Funds |
|
|
3,598 |
|
|
|
5 |
% |
| Money Fund and Cash |
|
|
1,901 |
|
|
|
3 |
% |
|
|
|
|
|
|
|
|
|
| Total Level 1 |
|
|
25,487 |
|
|
|
34 |
% |
| Level 2 |
|
|
|
|
|
|
|
|
| Fixed Income |
|
|
47,716 |
|
|
|
63 |
% |
| Money Fund |
|
|
2,362 |
|
|
|
3 |
% |
|
|
|
|
|
|
|
|
|
| Total Level 2 |
|
|
50,078 |
|
|
|
66 |
% |
| Level 3 |
|
|
|
|
|
|
|
|
| Total Level 3 |
|
|
— |
|
|
|
— |
|
|
|
|
|
|
|
|
|
|
| Total fair value of Plan assets |
|
$ |
75,565 |
|
|
|
100 |
% |
|
|
|
|
|
|
|
|
|
Contributions
The Company may contribute $2 million to $6 million to its pension plan in 2016.
Expected
future benefit payments
The following benefit payments are expected to be paid as follows based on actuarial calculations:
|
|
|
|
|
|
|
|
|
|
|
|
|
|
|
|
|
|
|
|
|
|
|
|
|
| |
|
2016 |
|
|
2017 |
|
|
2018 |
|
|
2019 |
|
|
2020 |
|
|
Thereafter |
|
| Pension |
|
$ |
5,524 |
|
|
$ |
7,498 |
|
|
$ |
7,544 |
|
|
$ |
6,055 |
|
|
$ |
7,205 |
|
|
$ |
29,274 |
|
| Postretirement |
|
|
1,678 |
|
|
|
1,677 |
|
|
|
1,651 |
|
|
|
1,656 |
|
|
|
1,666 |
|
|
|
8,757 |
|
A one percentage point increase in the assumed health care trend rate would increase postretirement expense by
approximately $274,000, changing the benefit obligation by approximately $2.1 million; while a one percentage point decrease in the assumed health care trend rate would decrease postretirement expense by approximately $232,000, changing the benefit
obligation
by approximately $1.8 million. The assumed trend rates for healthcare costs are a 5% increase per year for retirees prior to the age 65 and 0% for retirees post age 65.
A one percentage point change in the assumed rate of return on the defined benefit pension plan assets is estimated to have an approximate $677,000
effect on pension expense. Additionally, a one percentage point increase in the discount rate is estimated to have a $1.6 million decrease in pension expense, while a one percentage point decrease in the discount rate is estimated to have a $1.9
million increase in pension expense.
Note H – Goodwill and Other Intangible Assets
Changes in the carrying value of goodwill during the years ended December 31, 2015 and 2014 are as follows:
|
|
|
|
|
| |
|
Goodwill |
|
| Balance at January 1, 2014 |
|
$ |
18,046 |
|
| Acquisitions |
|
|
4,725 |
|
| Foreign currency |
|
|
(156 |
) |
|
|
|
|
|
| Balance at December 31, 2014 |
|
|
22,615 |
|
| Acquisitions |
|
|
2,428 |
|
| Foreign currency |
|
|
(484 |
) |
|
|
|
|
|
| Balance at December 31, 2015 |
|
$ |
24,559 |
|
|
|
|
|
|
The major components of goodwill and other intangible assets are:
|
|
|
|
|
|
|
|
|
|
|
|
|
|
|
|
|
| |
|
2015 |
|
|
2014 |
|
| |
|
Historical
Cost |
|
|
Accumulated
Amortization |
|
|
Historical
Cost |
|
|
Accumulated
Amortization |
|
| Finite-lived intangible assets: |
|
|
|
|
|
|
|
|
|
|
|
|
|
|
|
|
| Customer relationships |
|
$ |
12,706 |
|
|
$ |
4,430 |
|
|
$ |
12,175 |
|
|
$ |
3,372 |
|
| Technology and drawings |
|
|
6,745 |
|
|
|
2,412 |
|
|
|
6,620 |
|
|
|
2,035 |
|
| Other intangibles |
|
|
2,406 |
|
|
|
1,577 |
|
|
|
1,544 |
|
|
|
1,517 |
|
|
|
|
|
|
|
|
|
|
|
|
|
|
|
|
|
|
| Total finite-lived intangible assets |
|
|
21,857 |
|
|
|
8,419 |
|
|
|
20,339 |
|
|
|
6,924 |
|
| Goodwill |
|
|
24,559 |
|
|
|
— |
|
|
|
22,615 |
|
|
|
— |
|
| Trade names and trademarks |
|
|
3,066 |
|
|
|
— |
|
|
|
3,888 |
|
|
|
— |
|
|
|
|
|
|
|
|
|
|
|
|
|
|
|
|
|
|
| Total |
|
$ |
49,482 |
|
|
$ |
8,419 |
|
|
$ |
46,842 |
|
|
$ |
6,924 |
|
|
|
|
|
|
|
|
|
|
|
|
|
|
|
|
|
|
Amortization of intangible assets in 2015, 2014 and 2013 was $1.5 million, $1.4 million and $1.2 million, respectively.
Amortization of these intangible assets for 2016 through 2020 is expected to approximate $1.5 million per year.
THE GORMAN-RUPP COMPANY
Note I – Business Segment Information
The Company operates in one business segment comprising the design, manufacture and sale of pumps and pump systems. The Company’s products are used in water, wastewater, construction, industrial,
petroleum, original equipment, agriculture, fire protection, heating, ventilation and air conditioning (HVAC), military and other liquid-handling applications.
The pumps and pump systems are marketed in the United States and worldwide through a network of more than 1,000 distributors, through manufacturers’ representatives (for sales to many original
equipment manufacturers), through third-party distributor catalogs, and by direct sales. International sales are made primarily through foreign distributors and representatives.
The Company sells to more than 150 countries around the world. The components of customer sales, determined based on the location of customers are:
|
|
|
|
|
|
|
|
|
|
|
|
|
|
|
|
|
|
|
|
|
|
|
|
|
| |
|
2015 |
|
|
% |
|
|
2014 |
|
|
% |
|
|
2013 |
|
|
% |
|
| United States |
|
$ |
269,628 |
|
|
|
66 |
|
|
$ |
298,338 |
|
|
|
69 |
|
|
$ |
257,038 |
|
|
|
66 |
|
| Foreign countries |
|
|
136,522 |
|
|
|
34 |
|
|
|
136,587 |
|
|
|
31 |
|
|
|
134,627 |
|
|
|
34 |
|
|
|
|
|
|
|
|
|
|
|
|
|
|
|
|
|
|
|
|
|
|
|
|
|
|
| Total |
|
$ |
406,150 |
|
|
|
100 |
|
|
$ |
434,925 |
|
|
|
100 |
|
|
$ |
391,665 |
|
|
|
100 |
|
|
|
|
|
|
|
|
|
|
|
|
|
|
|
|
|
|
|
|
|
|
|
|
|
|
Net sales from external customers by product category are:
|
|
|
|
|
|
|
|
|
|
|
|
|
| |
|
2015 |
|
|
2014 |
|
|
2013 |
|
| Pumps and pump systems |
|
$ |
352,652 |
|
|
$ |
379,626 |
|
|
$ |
336,779 |
|
| Repairs of pumps and pump systems and other |
|
|
53,498 |
|
|
|
55,299 |
|
|
|
54,886 |
|
|
|
|
|
|
|
|
|
|
|
|
|
|
| Total |
|
$ |
406,150 |
|
|
$ |
434,925 |
|
|
$ |
391,665 |
|
|
|
|
|
|
|
|
|
|
|
|
|
|
As of December 31, 2015 and 2014, 94% and 95% of the Company’s long-lived assets were located in the United
States, respectively.
Note J – Acquisitions
As of August 2015, the Company’s subsidiary, Gorman-Rupp Europe B.V., acquired substantially all of the assets and certain liabilities of Hydro+ SA (Hydro) and Hydro+ Rental SPRL (Hydro Rental),
subsequently renamed Gorman-Rupp Rental SPRL, based near Namur, Belgium. The Company assumed $1.9 million in bank debt, which was subsequently paid off in 2015. Hydro has been the Company’s Belgian pump and pump systems distributor since 1998,
and in 2011 formed Hydro Rental to expand pump and pump system rentals in the same region. Hydro’s principal products are centrifugal pumps supplied by the Company, and Hydro has begun converting some of these pumps into packaged pump station
systems tailored for its European market. As of the
acquisition date, combined annual revenues of the Hydro companies were expected to be $4 million U.S.
dollars.
The Company recognized customer relationships of $748,000, technology and drawings of $130,000, tradenames and trademarks of $70,000
and goodwill of $2.4 million related to the asset acquisition of Hydro and Hydro Rental.
The results of operations of the acquired businesses
have been included in Gorman-Rupp’s consolidated results since August 2015. Supplemental pro forma information has not been provided as the acquisition did not have a material impact on the Company’s consolidated results of operations.
In June 2014, the Company, through its wholly-owned subsidiary National Pump Company, acquired substantially all of the assets and certain
liabilities of Bayou City Pump, Inc. (“BCP”). Founded in 1973, BCP is a leading manufacturer of and service provider for highly-reliable and energy-efficient vertical turbine pumping systems primarily for the inland and coastal marine
liquid petroleum and chemical transportation market. BCP has steadily expanded its product designs and service capabilities in recent years to become a significant provider in North American marine transportation. BCP also has developed and
manufactures a specialty sludge pumping system for use in a variety of industrial applications. BCP’s strong customer relationships and long history will help expand sales in targeted niche markets complementary to National Pump Company’s
significant and growing vertical turbine products leadership position. In addition, its Houston, Texas base will provide additional capacity and machining capabilities in combination with National Pump’s existing location acquired late in 2012.
The Company recognized customer relationships of $4.1 million, technology and drawings of $830,000, tradenames and trademarks of $370,000 and
goodwill of $4.7 million related to the asset acquisition of Bayou City Pump, Inc.
The results of operations of the acquired business have
been included in Gorman-Rupp’s consolidated results since June 2014. Supplemental pro forma information has not been provided as the acquisition did not have a material impact on the Company’s consolidated results of operations.
Goodwill relating to the National Pump Company reporting unit comprising recent acquisitions (NPC) represents 4.5% of the Company’s
December 31, 2015 total assets. Our annual impairment analysis performed as of October 1, 2015 concluded that NPC’s fair value was within 10% of its carrying value. If recently depressed U.S. agricultural conditions continue for an
extended time, this market’s related growth and profitability assumptions may reduce NPC’s indicated fair value to require a potential future impairment charge.
ANNUAL REPORT 2015
Management’s Discussion and Analysis
Executive Overview
The following discussion of Results of Operations includes certain non-GAAP financial data, and measures such as earnings before interest, taxes, depreciation and amortization. The adjusted gross margins,
operating margins and earnings per share amounts exclude non-cash pension settlement charges as a result of lump sum payments related to the defined benefit pension plan. Management utilizes these adjusted financial data and measures to assess
comparative operations against those of prior periods without the distortion of non-comparable factors. The Gorman-Rupp Company believes that these non-GAAP financial data and measures will be useful to investors as well as to assess the continuing
strength of the Company’s underlying operations.
The Gorman-Rupp Company is a leading designer, manufacturer and international marketer
of pumps and pump systems for use in diverse water, wastewater, construction, dewatering, industrial, petroleum, original equipment, agriculture, fire protection, heating, ventilating and air conditioning (HVAC), military and other liquid-handling
applications. The Company attributes its success to long-term product quality, applications and performance combined with timely delivery and service, and continually develops initiatives to improve performance in these key areas.
Gorman-Rupp actively pursues growth opportunities through organic growth, international business expansion and acquisitions.
We continually invest in training for our employees, in new product development and in modern manufacturing equipment, technology and facilities all
designed to increase production efficiency and capacity and drive growth by delivering innovative solutions to our customers. We believe that the diversity of our markets is a major contributor to the generally stable financial growth we have
produced over the past 80 plus years.
The Company places a strong emphasis on cash flow generation and having excellent liquidity and
financial flexibility. This focus has afforded us the
continuing ability to reinvest our cash resources and preserve a strong balance sheet to position us for future opportunities. The $120.1 million of cash generated by operating activities over
the past three years was utilized primarily to fund growth-oriented acquisitions and productivity-enhancing capital expenditures, pay dividends, entirely repay acquisitions-related short-term debt and supplementally fund the Company’s defined
benefit pension plan.
The Company generated $52.7 million in earnings before interest, taxes, depreciation and amortization during 2015. From
these earnings, we invested a total $9.2 million in buildings, building improvements, machinery and equipment and returned $10.6 million in dividends to shareholders.
Capital additions for 2016 are presently planned to be in the range of $12-$14 million primarily for building expansion and machinery and equipment purchases, and are expected to be financed through
internally-generated funds and existing lines of credit.
On January 28, 2016, the Board of Directors authorized the payment of a
quarterly dividend of $0.105 per share, representing the 264th consecutive quarterly dividend to be paid by the Company. During 2015, the Company again paid increased dividends and thereby attained its forty-third consecutive year of increased
dividends. These consecutive years place Gorman-Rupp in the top 50 of all U.S. public companies with respect to number of consecutive years of increased dividend payments. The dividend yield at December 31, 2015 was 1.5%.
The Company currently expects to continue its exceptional history of paying regular quarterly dividends and increased annual dividends. However, any
future dividends will be reviewed individually and declared by our Board of Directors at its discretion, dependent on our assessment of the Company’s financial condition and business outlook at the applicable time.
We continue to be pleased with Patterson Pump
THE GORMAN-RUPP COMPANY
Company’s performance on the PCCP project for which shipments of the large flood control pumps for New
Orleans began in 2014 and are expected to be completed during the third quarter of 2016. Approximately $37.7 million of shipments related to the PCCP project occurred during 2015. When completed, this flood control project will be one of the largest
such projects in the world.
Outlook
Domestic and foreign uncertainties, including turmoil related to the price of oil, foreign currency translation impacts and extended unfavorable domestic weather conditions, made 2015 a very challenging
year. These uncertainties continue to be a negative influence on capital goods investment and have caused declines in most of our markets we serve, and may continue to do so through most of 2016. Although the Company normally operates in a very lean
environment, we have reduced spending where practical in the short-term to address lower incoming order rates and will continue to evaluate our cost structure and make further adjustments as required.
Generally we believe that the Company is well positioned to grow organically at a reasonably comparable sales pace and operating margin over the long
term by expanding our customer base, both domestically and globally, and through new product offerings. We expect that the increasing need for water and wastewater infrastructure rehabilitation within the United States, and similar needs
internationally, including in emerging economies, along with increasing demand for pumps and pump systems for industrial and agricultural applications, will provide strong growth opportunities for Gorman-Rupp in the future.
Results of Operations – 2015 Compared to 2014:
The Company attained its second highest ever annual sales of $406.2 million in 2015 compared to record net sales of $434.9 million in 2014, a decrease of $28.7 million or 6.6%, due principally to lower
domestic sales. Sales declined 4.4% in our larger water markets group and 11.8% in our non-water markets.
Activity in the water end markets included $13.3 million of increased sales in the fire protection market
principally from higher international sales. This increase was offset by $15.0 million of lower sales in the construction market due primarily to the severe global decline in new oil and gas drilling which affected both domestic and international
sales. Despite increased shipments of $23.4 million related to the large New Orleans PCCP project, sales in the municipal market decreased $7.1 million overall driven by reduced demand for large volume pumps for wastewater and water supply projects.
Also, sales decreased $6.4 million in the agricultural market primarily due to unseasonably wet weather conditions in most locations domestically and lower farm products pricing and farm income. Sales decreased 11.8% or $15.4 million in non-water
markets due to $8.4 million of lower sales in the OEM market primarily related to less power generation equipment and pumps for military applications. Also, sales in the industrial market decreased $6.6 million largely due to the downturn in oil and
gas.
International sales were $136.5 million in 2015 compared to $136.6 million in 2014. Excluding the impact of the change in foreign
exchange rates, international sales were up $8.0 million or 5.8%. International sales represented 34% and 31% of total sales for the Company in 2015 and 2014, respectively. Sales continued to be somewhat softer in Europe due to sluggish economic
conditions.
The Company’s backlog of orders was $117.1 million at December 31, 2015 compared to $160.7 million at December 31,
2014. The decrease in backlog from a year ago is due primarily to approximately $37.7 million of shipments related to the PCCP project in 2015. The remainder of the decrease is a result of lower order rates in 2015 due to unfavorable domestic
weather conditions and global impacts relating to oil pricing and production. Approximately 95% of the Company’s backlog of unfilled orders at December 31, 2015 is scheduled to be shipped during 2016.
ANNUAL REPORT 2015
Management’s Discussion and Analysis
Due to recent increased employee retirements and a related surge in lump sum pension payments, the Company
recorded a U.S. GAAP-required and actuarially-determined $3.8 million of non-cash pension settlement charges during 2015 relating to its defined benefit pension plan. The rate of retirements was less in 2014 and settlement charges were not required.
Cost of products sold in 2015 was $313.6 million compared to $327.4 million in 2014, a decrease of $13.8 million or 4.2%. Gross profit was
$92.6 million in 2015 compared to $107.6 million in 2014, a decrease of 13.9% resulting in gross margins of 22.8% and 24.7% in 2015 and 2014, respectively. The margin decline in 2015 was due principally to the sales volume decrease from the record
level in 2014, sales mix changes due to increased percentages of shipments of lower margin engine and motor equipped systems, and non-cash pension settlement charges described above of approximately 60 basis points.
Selling, general and administrative (“SG&A”) expenses for 2015 were $56.2 million, or 13.8% of net sales, compared with $54.3 million, or
12.5% of net sales for 2014. The increase in SG&A expenses as a percent of sales was due principally to the sales volume decrease from the record level in 2014 and non-cash pension settlement charges described above of approximately 30 basis
points. In addition, professional fees increased approximately 20 basis points primarily regarding audit fees and acquisition-related legal fees.
Operating income in 2015 was $36.4 million compared to a record $53.3 million in 2014, resulting in operating margins of 9.0% and 12.3%, respectively. The operating margin for 2015 was reduced by
approximately 90 basis points due to non-cash pension settlement charges described above.
The effective income tax rate was 32.6% in 2015 and
32.7% in 2014.
Net income for 2015 was $25.1 million compared to a record $36.1 million in 2014, a decrease of $11.0 million or 30.5%. As a
percent of net sales,
net income was 6.2% in 2015 and 8.3% in 2014. Earnings per share were $0.96 in 2015 compared to $1.38 in 2014, a decrease of $0.42 per share or 30.4%. Earnings per share for 2015 included a
reduction of $0.10 due to the non-cash pension settlement charges described above.
Results of Operations – 2014 Compared to 2013:
The Company attained record net sales of $434.9 million in 2014 compared to net sales of $391.7 million in 2013, an increase of $43.3
million or 11.0%. Sales improved 10.4% in our larger water markets group and 12.5% in our non-water markets.
Major contributors to the
increase included a $20.0 million increase in the municipal market driven by sales of large volume pumps for wastewater and flood control, a $13.3 million increase in the industrial market related to fracking, $8.5 million from the acquisition of
Bayou City Pump Company and an increase of $6.1 million in the construction market principally for pumps for rental businesses and oil and gas drilling support within North America. In addition, sales in the fire protection market increased $3.8
million primarily due to domestic sales. These increases were partially offset by a $4.3 million decrease in the agriculture market due to wet weather conditions in several domestic regions.
International sales were $136.6 million in 2014 compared to $134.6 million in 2013, a slight increase of $2.0 million or 1.5% from the prior year. Excluding the impact of the change in foreign exchange
rates, international sales were up $4.3 million or 3.2%. International sales represented 31% and 34% of total sales for the Company in 2014 and 2013, respectively. Sales were softer in Europe due to sluggish economic conditions.
The Company’s backlog of orders was $160.7 million at December 31, 2014 compared to $182.2 million at December 31, 2013 and $170.0 million
at September 30, 2014. The decrease in backlog from 2013 was principally due to record shipments during 2014, including approximately $14.4 million related to the PCCP flood control project in New Orleans.
THE GORMAN-RUPP COMPANY
Cost of products sold in 2014 was $327.4 million compared to $298.0 million in 2013, an increase of $29.4
million or 9.9%. Gross profit was $107.6 million in 2014 compared to $93.7 million in 2013, an increase of 14.8% resulting in gross margins of 24.7% and 23.9% in 2014 and 2013, respectively. The gross margin for 2013 was reduced by 70 basis points
due to a non-cash pension settlement charge which did not recur in 2014.
Selling, general and administrative (“SG&A”) expenses
for 2014 were $54.3 million, or 12.5% of net sales, compared with $51.7 million, or 13.2% of net sales for 2013. The decrease in SG&A expenses as a percent of sales was primarily due to leverage generated by the record sales volume during 2014.
Operating income in 2014 was a record $53.3 million compared to $41.9 million in 2013, resulting in operating margins of 12.3% and 10.7%,
respectively. The operating margin for 2013 was reduced by 110 basis points due to a non-cash pension settlement charge which did not recur in 2014.
Other income in 2014 was $940,000 compared to $3.1 million in 2013. Other income in 2013 included a gain on sale of property, plant and equipment of $2.5 million.
The effective income tax rate was 32.7% in 2014 compared to 32.0% in 2013. The difference in the effective tax rate was primarily due to the federal
research and development tax credit that was not enacted for 2012 until January 2013, and thus not permitted to be recorded until 2013 for 2012. Therefore, two years of the research and development tax credit were recognized in 2013.
Net income for 2014 was a record $36.1 million compared to $30.1 million in 2013, an increase of $6.0 million or 20.1%. As a percent of net sales, net
income was 8.3% and 7.7% in 2014 and 2013, respectively.
Earnings per share were $1.38 in 2014 compared to $1.15 in 2013, an increase of
$0.23 per share or 20.0%.
Earnings per share for 2013 included a reduction of $0.10 due to non-cash pension settlement charges offset by
$0.06 per share of gain on the sale of
property, plant and equipment, both of which did not recur in 2014. Currency translation negatively impacted earnings in 2014 by $0.01 per share.
Trends
The Company does not believe
that it is exposed to material market risks as a result of its export sales or operations outside of the United States. Approximately 70% of the Company’s international sales are export sales from the United States. Export sales are denominated
predominately in U.S. dollars and made on open account or with letters of credit.
For more than 10 years, numerous business entities in the
pump and fluid-handling industries, as well as a multitude of companies in many other industries, have been targeted in a series of lawsuits in several jurisdictions by various individuals seeking redress to claimed injury as a result of the
entities’ alleged use of asbestos in their products. The Company and one of its subsidiaries, Patterson Pump Company, remain drawn into mass-scale asbestos-related litigation, typically as one of hundreds of co-defendants in a particular
proceeding. The allegations in the lawsuits involving the Company and/or Patterson Pump Company are vague, general and speculative, and most cases have not advanced beyond the early stage of discovery. In certain situations, the plaintiffs have
voluntarily dismissed the Company and/or its subsidiaries from some of the lawsuits after the plaintiffs have acknowledged that there is no basis for their claims. In other situations, the Company and/or Patterson Pump Company have been dismissed
from some of the lawsuits as a result of court rulings in favor of motions to dismiss and/or motions for summary judgment. In approximately one hundred cases the Company and/or its subsidiaries have entered into nominal economic settlements
recommended for payment by its insurers, coupled with dismissal of the lawsuits. Insurers of the Company have engaged legal counsel to represent the Company and its subsidiaries and to protect their interests. Management does not currently believe
that the small number of legal proceedings arising out of the ordinary course of business, or the industry-
ANNUAL REPORT 2015
Management’s Discussion and Analysis
wide asbestos litigation, will materially impact the Company’s consolidated results of operations,
liquidity or financial condition.
Liquidity and Sources of Capital
Cash and cash equivalents totalled $23.7 million and there was no outstanding bank debt at December 31, 2015. In addition, the Company had $24.5 million available in bank lines of credit after
deducting $6.5 million in outstanding letters of credit primarily related to customer orders. The Company was in compliance with its nominal restrictive covenants, including limits on additional borrowings and maintenance of certain operating and
financial ratios, at all times in 2015 and 2014.
Capital expenditures for 2016, consisting principally of building expansion and machinery
and equipment purchases, are estimated to be in the range of $12 to $14 million and are expected to be financed through internally generated funds and existing lines of credit. During 2015, 2014 and 2013, the Company financed its capital
improvements and working capital requirements principally through internally generated funds.
Working capital increased 7.0% to $145.9
million at December 31, 2015 compared to $136.4 million a year ago. Operational reductions in inventories of $11.9 million were equally offset by the Company’s payoff of its $12.0 million of short-term debt, and most of the remaining
working capital increase was due to a surge in shipments during December, about one-half of which related to delayed November shipments.
Earnings before interest, income taxes and depreciation and amortization were $52.7 million for 2015, $68.5 million for 2014 and $58.0 million in 2013.
Net of capital expenditures, these amounts were $44.4 million, $55.2 million and $37.0 million, respectively. Additionally net of dividends, these amounts were $33.8 million, $45.5 million and $28.3 million respectively.
Financial Cash Flow
Net cash provided
by operating activities was $40.7 million, $29.0 million and $50.4 million
for 2015, 2014 and 2013, respectively. The change in cash provided by operating activities in 2015 compared to 2014 was primarily due to reductions in inventories and changes in deferred tax
assets and liabilities related to the Company’s pension plan.
Cash used for investing activities was $11.2 million, $29.3 million and
$18.1 million for 2015, 2014 and 2013, respectively. Net cash paid for acquisitions was $3.4 million in 2015 and $16.7 million in 2014. Net capital expenditures were approximately $8.3 million, $13.3 million and $21.0 million in 2015, 2014 and 2013,
respectively.
Net cash used for financing activities was $29.1 million in 2015, $6.7 million in 2014 and $21.7 million in 2013. During 2015,
the Company paid off its $12.0 million of short-term bank borrowings and $1.9 million of assumed acquisition debt. The Company also paid $10.6 million in dividends.
The changes in foreign currency translation against the U.S. dollar decreased cash by $1.2 million in 2015 and increased cash by $344,000 and $389,000 in 2014 and 2013, respectively.
The ratio of current assets to current liabilities was 4.4 to 1 and 3.1 to 1 at December 31, 2015 and 2014, respectively.
Management believes that cash on hand, combined with cash provided by operating activities and existing financing capabilities, will be sufficient to
meet cash requirements for the next twelve months, including capital expenditures, the expected payment of quarterly dividends and principal and interest on debt outstanding.
Contractual Obligations
Capital commitments in the table below include commitments to
purchase machinery and equipment that have been approved by the Board of Directors and are enforceable and legally binding on the Company. The capital commitments do not represent the entire anticipated purchases in the future, but represent only
those substantive items for which the Company is contractually obligated as of December 31, 2015. Also, the Company has some operating leases for certain offices, manufacturing
THE GORMAN-RUPP COMPANY
facilities, land, office equipment and automobiles. Rental expenses relating to these leases were $1.0
million in 2015 and $1.1 million in 2014 and 2013.
The following table summarizes the Company’s contractual obligations at
December 31, 2015:
|
|
|
|
|
|
|
|
|
|
|
|
|
|
|
|
|
|
|
|
|
| |
|
Payment Due By Period |
|
| (Thousands of dollars) |
|
Total |
|
|
Less
than
1 Year |
|
|
1-3
Years |
|
|
3-5
Years |
|
|
More
than
5 Years |
|
| Capital commitments |
|
$ |
1,191 |
|
|
$ |
1,191 |
|
|
$ |
— |
|
|
$ |
— |
|
|
$ |
— |
|
| Operating leases |
|
|
2,027 |
|
|
|
838 |
|
|
|
967 |
|
|
|
212 |
|
|
|
10 |
|
|
|
|
|
|
|
|
|
|
|
|
|
|
|
|
|
|
|
|
|
|
| Total |
|
$ |
3,218 |
|
|
$ |
2,029 |
|
|
$ |
967 |
|
|
$ |
212 |
|
|
$ |
10 |
|
|
|
|
|
|
|
|
|
|
|
|
|
|
|
|
|
|
|
|
|
|
Critical Accounting Policies
The accompanying consolidated financial statements have been prepared in conformity with accounting principles generally accepted in the United States. When more than one accounting principle, or the
method of its application, is generally accepted, management selects the principle or method that is appropriate in the Company’s specific circumstances. Application of these accounting principles requires management to make estimates about the
future resolution of existing uncertainties; as a result, actual results could differ from these estimates.
In preparing these consolidated
financial statements, management has made its best estimates and judgments of the amounts and disclosures included in the consolidated financial statements, giving due regard to materiality. The Company does not believe there is a great likelihood
that materially different amounts would be reported under different conditions or using different assumptions pertaining to the accounting policies described below.
Revenue Recognition
Substantially all of the Company’s revenues from product sales
are recognized when all of the following criteria are met: persuasive evidence of a sale arrangement exists, the price is fixed or determinable, product delivery has occurred or
services have been rendered, there are no further obligations to customers and collectability is probable. Product delivery occurs when the risks and rewards of ownership and title pass, which
usually occurs upon shipment to the customer.
Allowance for Doubtful Accounts
The Company evaluates the collectability of its accounts receivable based on a combination of factors. In circumstances where the Company is aware of a specific customer’s inability to meet its
financial obligations to the Company (e.g., bankruptcy filings, substantial downgrading of credit scores), the Company records a specific allowance for bad debts against amounts due to reduce the net recognized receivable to the amount the Company
reasonably believes will be collected. For all other customers, the Company recognizes allowances for bad debts based on the length of time the receivables are past due. If circumstances change (e.g., an unexpected material adverse change in a large
customer’s ability to meet its financial obligations), the Company’s estimates of the recoverability of amounts due could be reduced by a material amount. Historically, the Company’s collection history has been good.
Inventories and Related Allowance
Inventories are valued at the lower of cost or market value and have been reduced by an allowance for excess and obsolete inventories. The estimated
allowance is based on a variety of factors, including historical inventory usage and management evaluations. Historically, the Company has not experienced substantive write-offs due to obsolescence. The Company uses the last-in, first-out (LIFO)
method for the majority of its inventories.
Product Warranties
A liability is established for estimated future warranty and service claims based on historical claims experience and specific product failures.
Pension Plans and Other Postretirement Benefit Plans
The Company recognizes the
obligations associated with its defined benefit pension plan and defined benefit health care plan in its consolidated financial
ANNUAL REPORT 2015
Management’s Discussion and Analysis
statements. The measurement of liabilities related to pension plans and other postretirement benefit plans
is based on management’s assumptions related to future events including interest rates, return on pension plan assets, rate of compensation increases and health care cost trend rates. Actual pension plan asset performance will either reduce or
increase pension losses included in accumulated other comprehensive loss, which ultimately affects net income. The discount rates used to determine the present value of future benefits are based on estimated yields of investment grade fixed income
investments.
The discount rates used to value pension plan obligations were 3.70% and 3.45% at December 31, 2015 and 2014, respectively.
The discount rates used to value postretirement obligations were 3.90% and 3.60% at December 31, 2015 and 2014, respectively. The discount rates were determined by constructing a zero-coupon spot yield curve derived from a universe of
high-quality bonds as of the measurement date. The expected rate of return on pension assets is designed to be a long- term assumption that will be subject to year-to-year variability. The rates for 2015 and 2014 were 6.00% and 7.00%, respectively.
Actual pension plan asset performance will either reduce or increase unamortized losses included in accumulated other comprehensive loss, which will ultimately affect net income. The assumed rate of compensation increase was 3.50% in 2015 and 2014.
The assumption used for the rate of increase in medical costs over the next five years was unchanged in 2015 from 2014. A one percentage
point increase in the assumed health care trend would increase postretirement expense by approximately $274,000, changing the benefit obligation by approximately $2.1 million; while a one percentage point decrease in the assumed health care trend
would decrease postretirement expense by approximately $232,000, changing the benefit obligation by approximately $1.8 million.
Substantially
all retirees elect to take lump sum settlements of their benefits. When interest rates are low as they have been the last five years, this subjects the Company to the risk of exceeding an actuarial threshold computed on an annual basis and
triggering a GAAP-required non-cash pension settlement loss. This event occurred in 2015 and 2013.
Income Taxes
The basic principles related to accounting for income taxes are to recognize the amount of taxes payable or refundable for the current year and deferred tax liabilities and assets for the future tax
consequences of events that have been recognized in an entity’s financial statements or tax returns.
Realization of the Company’s
deferred tax assets is principally dependent upon the Company’s achievement of projected future taxable income, which management believes will be sufficient to fully utilize the deferred tax assets recorded, with the exception of deferred tax
associated with certain state tax credits for which a valuation allowance has been recognized.
Goodwill and Other Intangibles
The Company accounts for goodwill in a purchase business combination as the excess of the cost over the fair value of net assets acquired.
Business combinations can also result in other intangible assets being recognized. Amortization of intangible assets, if applicable, occurs over their estimated useful lives.
Goodwill and indefinite lived intangible assets are tested annually for impairment as of October 1, or whenever events or changes in circumstances indicate there may be a possible permanent loss of
value in accordance with ASC 350, Intangibles –
Goodwill and Other.
Goodwill is tested for impairment at the reporting unit level and is based on the net assets for each reporting unit, including goodwill and intangible assets. The Company has the option to first assess
qualitative factors to determine whether the existence of events or circumstances leads to a determination that it is more likely than not that the fair value of a reporting unit is less than its carrying amount. If, after assessing the totality of
events or circumstances, an entity determines it is not more likely than not that the fair value of a reporting unit is less than its carrying amount, then performing the two-step impairment test is unnecessary.
In assessing the qualitative factors to determine whether it is more likely than not that the fair
THE GORMAN-RUPP COMPANY
value of a reporting unit is less than its carrying amount, we identify and assess relevant drivers of fair
value and events and circumstances that may impact the fair value and the carrying amount of the reporting unit. The identification of relevant events and circumstances and how these may impact a reporting units’ fair value or carrying amount
involve significant judgments and assumptions. The judgments and assumptions include the identification of macroeconomic conditions, industry and market considerations, cost factors, overall financial performance, Company-specific events and share
price trends and making the assessment on whether each relevant factor will impact the impairment test positively or negatively and the magnitude of any such impact.
When performing a quantitative assessment of goodwill impairment if necessary or in years where we elect to do so, a discounted cash flow model is used to estimate the fair value of each reporting unit,
which considers forecasted cash flows discounted at an estimated weighted-average cost of capital. The forecasted cash flows are based on the Company’s long-term operating plan and the weighted-average cost of capital is an estimate of the
overall after-tax rate of return. Other valuation techniques including comparative market multiples are used when appropriate. Discount rate assumptions are based on an assessment of the risk inherent in the future cash flows of the respective
reporting units.
Based upon our fiscal 2015 and 2014 quantitative and qualitative impairment analyses, the Company concluded that it is more
likely than not that the fair value of our reporting units continues to exceed the respective carrying amounts.
Indefinite life intangible
assets primarily consist of trademarks and trade names. The fair value of these assets is determined using a royalty relief methodology similar to that employed when the associated assets were acquired, but using updated estimates of future sales,
cash flows and profitability. For 2015 and 2014, the fair value of indefinite lived intangible assets exceeded the respective carrying value.
Other intangible assets are reviewed for impairment whenever events or changes in circumstances indicate
the carrying amount may not be recovered through future net cash flows generated by the assets.
Other Matters
Certain transactions with related parties are in the ordinary course of business and are not material to the Company’s consolidated financial
position, net income or cash flows.
The Company does not have any off-balance sheet arrangements, financings or other relationships with
unconsolidated “special purpose entities.”
The Company is not a party to any long-term debt agreements, or any material capital
leases or purchase obligations.
ANNUAL REPORT 2015
Report of Management on Internal Control
Over Financial Reporting
Management is responsible for establishing and
maintaining adequate internal control over financial reporting for the Company (as defined in Exchange Act rules 13[a]–15[f ]). Internal control over financial reporting is a process designed by, or under the supervision of, the Company’s
principal executive and principal financial officers, or persons performing similar functions, and affected by the Company’s Board of Directors, management and other personnel, to provide reasonable assurance regarding the reliability of
financial reporting and the preparation of financial statements for external purposes in accordance with accounting principles generally accepted in the United States.
The Company’s internal control over financial reporting includes those policies and procedures that (i) pertain to the maintenance of records that, in reasonable detail, accurately and fairly
reflect the transactions and dispositions of the assets of the Company; (ii) provide reasonable assurance that transactions are recorded as necessary to permit preparation of financial statements in accordance with accounting principles
generally accepted in the United States, and that receipts and expenditures of the Company are being made only in accordance with authorizations of Management and Directors of the Company; and (iii) provide reasonable assurance regarding
prevention or timely detection of unauthorized acquisition, use or disposition of the Company’s assets that could have a material effect on the financial statements.
Because of its inherent limitations, internal control over financial reporting may not prevent or detect misstatements. In addition, projections of any evaluation of effectiveness to future periods are
subject to the risk that controls may become inadequate because of changes in conditions, or that the degree of compliance with the policies or procedures may deteriorate.
Management conducted an evaluation of the effectiveness of internal control over financial reporting based on the framework in Internal Control – Integrated Framework issued by the Committee
of Sponsoring Organizations of the Treadway Commission (2013 framework), (the COSO Criteria). Based on this evaluation, Management concluded that the Company’s internal control over financial reporting was effective as of December 31,
2015.
The independent registered public accounting firm of Ernst & Young LLP that has audited the consolidated
financial statements included in this annual report on Form 10-K, has also issued an attestation report on the Company’s internal control over financial reporting as of December 31, 2015. This report is included on the following page.
/s/ Jeffrey S. Gorman
Jeffrey S. Gorman
President and Chief Executive Officer
/s/ Wayne L. Knabel
Wayne L. Knabel
Chief Financial Officer
March 11, 2016
36
THE GORMAN-RUPP COMPANY
Report of Independent Registered
Public Accounting Firm
The Board of Directors and Shareholders
of The Gorman-Rupp Company
We have
audited The Gorman-Rupp Company’s internal control over financial reporting as of December 31, 2015, based on criteria established in Internal Control – Integrated Framework issued by the Committee of Sponsoring Organizations
of the Treadway Commission (2013 framework), (the COSO criteria). The Gorman-Rupp Company’s management is responsible for maintaining effective internal control over financial reporting, and for its assessment of the effectiveness of internal
control over financial reporting included in the accompanying Report of Management on Internal Control Over Financial Reporting. Our responsibility is to express an opinion on the company’s internal control over financial reporting based on our
audit.
We conducted our audit in accordance with the standards of the Public Company Accounting Oversight Board (United States). Those
standards require that we plan and perform the audit to obtain reasonable assurance about whether effective internal control over financial reporting was maintained in all material respects. Our audit included obtaining an understanding of internal
control over financial reporting, assessing the risk that a material weakness exists, testing and evaluating the design and operating effectiveness of internal control based on the assessed risk, and performing such other procedures as we considered
necessary in the circumstances. We believe that our audit provides a reasonable basis for our opinion.
A company’s internal control over
financial reporting is a process designed to provide reasonable assurance regarding the reliability of financial reporting and the preparation of financial statements for external purposes in accordance with generally accepted accounting principles.
A company’s internal control over financial reporting includes those policies and procedures that (1) pertain to the maintenance of records that, in reasonable detail, accurately and fairly reflect the transactions and dispositions of the
assets of the company; (2) provide reasonable assurance that transactions are recorded as necessary to permit preparation of financial statements in accordance with generally accepted accounting principles, and that receipts and expenditures of
the company are being made only in accordance with authorizations of management and directors of the company; and (3) provide reasonable assurance regarding prevention or timely detection of unauthorized acquisition, use, or disposition of the
company’s assets that could have a material effect on the financial statements.
Because of its inherent limitations, internal control
over financial reporting may not prevent or detect misstatements. Also, projections of any evaluation of effectiveness to future periods are subject to the risk that controls may become inadequate because of changes in conditions, or that the degree
of compliance with the policies or procedures may deteriorate.
In our opinion, The Gorman-Rupp Company maintained, in all material respects,
effective internal control over financial reporting as of December 31, 2015, based on the COSO criteria.
We also have audited, in
accordance with the standards of the Public Company Accounting Oversight Board (United States), the consolidated balance sheets of The Gorman-Rupp Company as of December 31, 2015 and 2014, and the related consolidated statements of income,
comprehensive income, equity and cash flows for each of the three years in the period ended December 31, 2015 of The Gorman-Rupp Company and our report dated March 11, 2016 expressed an unqualified opinion thereon.
/s/ Ernst & Young LLP
Cleveland, Ohio
March 11, 2016
37
ANNUAL REPORT 2015
Eleven-Year Summary of Selected Financial Data
(Thousands of dollars, except per share amounts)
|
|
|
|
|
|
|
|
|
|
|
|
|
|
|
|
|
| |
|
2015 |
|
|
2014 |
|
|
2013 |
|
|
2012 |
|
| Operating Results |
|
|
|
|
|
|
|
|
|
|
|
|
|
|
|
|
| Net sales |
|
$ |
406,150 |
|
|
$ |
434,925 |
|
|
$ |
391,665 |
|
|
$ |
375,691 |
|
| Gross profit |
|
|
92,580 |
|
|
|
107,559 |
|
|
|
93,655 |
|
|
|
90,151 |
|
| Income taxes |
|
|
12,157 |
|
|
|
17,593 |
|
|
|
14,173 |
|
|
|
14,244 |
|
| Net income |
|
|
25,109 |
|
|
|
36,141 |
|
|
|
30,104 |
|
|
|
28,203 |
|
| Depreciation and amortization |
|
|
15,282 |
|
|
|
14,615 |
|
|
|
13,588 |
|
|
|
12,066 |
|
| Interest expense |
|
|
122 |
|
|
|
134 |
|
|
|
146 |
|
|
|
122 |
|
| Return on net sales (%) |
|
|
6.2 |
|
|
|
8.3 |
|
|
|
7.7 |
|
|
|
7.5 |
|
| Sales dollars per employee |
|
|
318.5 |
|
|
|
340.6 |
|
|
|
315.6 |
|
|
|
326.4 |
|
| Income dollars per employee |
|
|
19.7 |
|
|
|
28.3 |
|
|
|
24.3 |
|
|
|
24.5 |
|
| Financial Position |
|
|
|
|
|
|
|
|
|
|
|
|
|
|
|
|
| Current assets |
|
$ |
189,391 |
|
|
$ |
200,709 |
|
|
$ |
189,289 |
|
|
$ |
175,675 |
|
| Current liabilities |
|
|
43,460 |
|
|
|
64,346 |
|
|
|
60,760 |
|
|
|
64,821 |
|
| Working capital |
|
|
145,931 |
|
|
|
136,363 |
|
|
|
128,529 |
|
|
|
110,854 |
|
| Current ratio |
|
|
4.4 |
|
|
|
3.1 |
|
|
|
3.1 |
|
|
|
2.7 |
|
| Property, plant and equipment—net |
|
$ |
129,887 |
|
|
$ |
133,964 |
|
|
$ |
131,189 |
|
|
$ |
123,066 |
|
| Capital additions—net |
|
|
8,257 |
|
|
|
13,275 |
|
|
|
21,015 |
|
|
|
16,373 |
|
| Total assets |
|
|
364,201 |
|
|
|
380,904 |
|
|
|
355,638 |
|
|
|
335,183 |
|
| Equity |
|
|
287,021 |
|
|
|
281,967 |
|
|
|
264,140 |
|
|
|
234,719 |
|
| Dividends paid |
|
|
10,599 |
|
|
|
9,715 |
|
|
|
8,662 |
|
|
|
8,188 |
|
| Average number of employees |
|
|
1,275 |
|
|
|
1,277 |
|
|
|
1,241 |
|
|
|
1,151 |
|
| Shareholder Information |
|
|
|
|
|
|
|
|
|
|
|
|
|
|
|
|
| Earnings per share |
|
$ |
0.96 |
|
|
$ |
1.38 |
|
|
$ |
1.15 |
|
|
$ |
1.07 |
|
| Cash dividends per share |
|
|
0.405 |
|
|
|
0.370 |
|
|
|
0.330 |
|
|
|
0.312 |
|
| Equity per share at December 31 |
|
|
11.00 |
|
|
|
10.74 |
|
|
|
10.06 |
|
|
|
8.94 |
|
| Average number of shares outstanding |
|
|
26,192,072 |
|
|
|
26,256,824 |
|
|
|
26,249,324 |
|
|
|
26,242,366 |
|
Summary of Quarterly Results of Operations
(Thousands of dollars, except per share amounts)
The following is a summary of unaudited
quarterly results of operations for the years ended December 31, 2015 and 2014:
|
|
|
|
|
|
|
|
|
|
|
|
|
|
|
|
|
| Quarter Ended 2015 |
|
Net Sales |
|
|
Gross Profit |
|
|
Net Income |
|
|
Earnings
per Share |
|
| First quarter |
|
$ |
99,233 |
|
|
$ |
23,915 |
|
|
$ |
7,275 |
|
|
$ |
0.28 |
|
| Second quarter |
|
|
103,892 |
|
|
|
24,141 |
|
|
|
6,629 |
|
|
|
0.25 |
|
| Third quarter |
|
|
104,229 |
|
|
|
23,312 |
|
|
|
5,893 |
|
|
|
0.22 |
|
| Fourth quarter |
|
|
98,796 |
|
|
|
21,212 |
|
|
|
5,312 |
|
|
|
0.21 |
|
|
|
|
|
|
|
|
|
|
|
|
|
|
|
|
|
|
| Total |
|
$ |
406,150 |
|
|
$ |
92,580 |
|
|
$ |
25,109 |
|
|
$ |
0.96 |
|
|
|
|
|
|
|
|
|
|
|
|
|
|
|
|
|
|
38
THE GORMAN-RUPP COMPANY
|
|
|
|
|
|
|
|
|
|
|
|
|
|
|
|
|
|
|
|
|
|
|
|
|
|
|
| 2011 |
|
|
2010 |
|
|
2009 |
|
|
2008 |
|
|
2007 |
|
|
2006 |
|
|
2005 |
|
| |
|
|
|
|
|
|
|
|
|
|
|
|
|
|
|
|
|
|
|
|
|
|
|
|
|
|
| $ |
359,490 |
|
|
$ |
296,808 |
|
|
$ |
266,242 |
|
|
$ |
330,646 |
|
|
$ |
305,562 |
|
|
$ |
270,910 |
|
|
$ |
231,249 |
|
| |
87,837 |
|
|
|
76,337 |
|
|
|
61,773 |
|
|
|
77,089 |
|
|
|
67,452 |
|
|
|
58,676 |
|
|
|
47,071 |
|
| |
13,881 |
|
|
|
12,370 |
|
|
|
8,986 |
|
|
|
13,297 |
|
|
|
12,524 |
|
|
|
8,654 |
|
|
|
6,235 |
|
| |
28,804 |
|
|
|
25,963 |
|
|
|
18,269 |
|
|
|
27,197 |
|
|
|
22,859 |
|
|
|
19,072 |
|
|
|
10,903 |
|
| |
11,459 |
|
|
|
10,601 |
|
|
|
8,955 |
|
|
|
7,848 |
|
|
|
7,597 |
|
|
|
6,688 |
|
|
|
6,808 |
|
| |
179 |
|
|
|
175 |
|
|
|
170 |
|
|
|
45 |
|
|
|
49 |
|
|
|
41 |
|
|
|
25 |
|
| |
8.0 |
|
|
|
8.7 |
|
|
|
6.9 |
|
|
|
8.2 |
|
|
|
7.5 |
|
|
|
7.0 |
|
|
|
4.7 |
|
| |
327.1 |
|
|
|
304.4 |
|
|
|
264.1 |
|
|
|
302.5 |
|
|
|
286.9 |
|
|
|
258.3 |
|
|
|
233.3 |
|
| |
26.2 |
|
|
|
26.6 |
|
|
|
18.1 |
|
|
|
24.9 |
|
|
|
21.5 |
|
|
|
18.2 |
|
|
|
11.0 |
|
| |
|
|
|
|
|
|
|
|
|
|
|
|
|
|
|
|
|
|
|
|
|
|
|
|
|
|
| $ |
155,872 |
|
|
$ |
143,194 |
|
|
$ |
131,400 |
|
|
$ |
134,266 |
|
|
$ |
135,288 |
|
|
$ |
120,118 |
|
|
$ |
110,501 |
|
| |
50,873 |
|
|
|
59,678 |
|
|
|
43,175 |
|
|
|
35,569 |
|
|
|
33,481 |
|
|
|
27,646 |
|
|
|
28,219 |
|
| |
104,999 |
|
|
|
83,516 |
|
|
|
88,225 |
|
|
|
98,697 |
|
|
|
101,807 |
|
|
|
92,472 |
|
|
|
82,282 |
|
| |
3.1 |
|
|
|
2.4 |
|
|
|
3.0 |
|
|
|
3.8 |
|
|
|
4.0 |
|
|
|
4.3 |
|
|
|
3.9 |
|
| $ |
114,349 |
|
|
$ |
113,526 |
|
|
$ |
108,523 |
|
|
$ |
80,406 |
|
|
$ |
59,970 |
|
|
$ |
52,351 |
|
|
$ |
51,505 |
|
| |
11,175 |
|
|
|
8,310 |
|
|
|
38,071 |
|
|
|
27,909 |
|
|
|
12,826 |
|
|
|
7,258 |
|
|
|
3,189 |
|
| |
298,700 |
|
|
|
286,707 |
|
|
|
249,424 |
|
|
|
231,538 |
|
|
|
211,534 |
|
|
|
187,540 |
|
|
|
179,541 |
|
| |
214,764 |
|
|
|
199,834 |
|
|
|
177,612 |
|
|
|
159,206 |
|
|
|
149,960 |
|
|
|
128,142 |
|
|
|
127,048 |
|
| |
7,430 |
|
|
|
7,024 |
|
|
|
6,767 |
|
|
|
6,682 |
|
|
|
6,503 |
|
|
|
6,126 |
|
|
|
5,983 |
|
| |
1,099 |
|
|
|
975 |
|
|
|
1,008 |
|
|
|
1,093 |
|
|
|
1,065 |
|
|
|
1,049 |
|
|
|
991 |
|
| |
|
|
|
|
|
|
|
|
|
|
|
|
|
|
|
|
|
|
|
|
|
|
|
|
|
|
| $ |
1.10 |
|
|
$ |
0.99 |
|
|
$ |
0.70 |
|
|
$ |
1.04 |
|
|
$ |
0.88 |
|
|
$ |
0.73 |
|
|
$ |
0.42 |
|
| |
0.283 |
|
|
|
0.269 |
|
|
|
0.259 |
|
|
|
0.256 |
|
|
|
0.248 |
|
|
|
0.234 |
|
|
|
0.229 |
|
| |
8.19 |
|
|
|
7.65 |
|
|
|
6.80 |
|
|
|
6.10 |
|
|
|
5.75 |
|
|
|
4.91 |
|
|
|
4.87 |
|
| |
26,234,579 |
|
|
|
26,132,160 |
|
|
|
26,107,886 |
|
|
|
26,101,891 |
|
|
|
26,095,586 |
|
|
|
26,089,004 |
|
|
|
26,081,676 |
|
|
|
|
|
|
|
|
|
|
|
|
|
|
|
|
|
|
| Quarter Ended 2014 |
|
Net Sales |
|
|
Gross Profit |
|
|
Net Income |
|
|
Earnings
per Share |
|
| First quarter |
|
$ |
110,064 |
|
|
$ |
27,554 |
|
|
$ |
9,954 |
|
|
$ |
0.38 |
|
| Second quarter |
|
|
109,728 |
|
|
|
26,904 |
|
|
|
8,860 |
|
|
|
0.34 |
|
| Third quarter |
|
|
110,159 |
|
|
|
28,066 |
|
|
|
9,439 |
|
|
|
0.36 |
|
| Fourth quarter |
|
|
104,974 |
|
|
|
25,035 |
|
|
|
7,888 |
|
|
|
0.30 |
|
|
|
|
|
|
|
|
|
|
|
|
|
|
|
|
|
|
| Total |
|
$ |
434,925 |
|
|
$ |
107,559 |
|
|
$ |
36,141 |
|
|
$ |
1.38 |
|
|
|
|
|
|
|
|
|
|
|
|
|
|
|
|
|
|
39
ANNUAL REPORT 2015
Shareholder Information
Comparison of 5-Year Cumulative Total Shareholder Return Among The Gorman-Rupp Company,
NYSE MKT Composite Index and SIC Code 3561
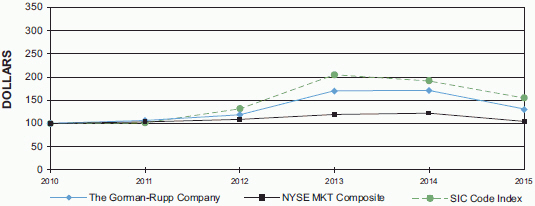
ASSUMES $100 INVESTED ON JANUARY 1, 2011 AND DIVIDENDS REINVESTMENT THROUGH YEAR ENDING DECEMBER 31,
2015.
Set forth above is a line graph comparing the yearly percentage change in the cumulative total shareholder return, including reinvested
cash dividends, on the Company’s common shares against the cumulative total return of the NYSE MKT Exchange Index and a Peer Group Index for the period of five fiscal years commencing January 1, 2011 and ending December 31, 2015. The
issuers in the SIC Code Index were selected on a line-of-business basis by reference to SIC Code 3561— Pumps and Pumping Equipment. The SIC Code Index is composed of the following issuers: Ampco-Pittsburgh Corp., Colfax Corp., Flowserve Corp.,
Graco Inc., Idex Corp., ITT Corp., The Gorman-Rupp Company and Xylem Inc.
Quarterly Stock Prices and Dividends
The high and low sales price and dividends per share for common shares traded on the NYSE MKT Exchange were:
|
|
|
|
|
|
|
|
|
|
|
|
|
|
|
|
|
|
|
|
|
|
|
|
|
| |
|
Sales Price of Common Shares |
|
|
Dividends Per Share |
|
| |
|
2015 |
|
|
2014 |
|
|
2015 |
|
|
2014 |
|
| |
|
High |
|
|
Low |
|
|
High |
|
|
Low |
|
|
|
|
|
|
|
| First quarter |
|
$ |
32.47 |
|
|
$ |
27.69 |
|
|
$ |
35.16 |
|
|
$ |
29.12 |
|
|
$ |
0.100 |
|
|
$ |
0.090 |
|
| Second quarter |
|
|
30.91 |
|
|
|
26.28 |
|
|
|
39.36 |
|
|
|
29.28 |
|
|
|
0.100 |
|
|
|
0.090 |
|
| Third quarter |
|
|
28.78 |
|
|
|
18.14 |
|
|
|
36.82 |
|
|
|
28.28 |
|
|
|
0.100 |
|
|
|
0.090 |
|
| Fourth quarter |
|
|
32.60 |
|
|
|
23.27 |
|
|
|
33.08 |
|
|
|
27.70 |
|
|
|
0.105 |
|
|
|
0.100 |
|
There were approximately 3,105 shareholders as of January 31, 2016, of which 973 were registered holders of common
shares.
|
|
|
|
|
|
|
| Annual Meeting |
|
Transfer Agent and Registrar |
|
Mailing Address |
|
Exchange Listing |
|
|
|
|
| The annual meeting of the shareholders of The Gorman-Rupp Company will be held at the Company’s Corporate Headquarters,
600 South Airport Road, Mansfield, Ohio, on
April 28, 2016 at 10:00 a.m., Eastern Daylight Time. |
|
Broadridge Corporate Issuer
Solutions, Inc. P.O. Box 1342
Brentwood, New York 11717
Phone (844) 318-0130 or
(720) 358-3598
Fax (215) 553-5402 E-mail Shareholder@broadridge.com |
|
The Gorman-Rupp Company P.O.
Box 1217 Mansfield, OH 44901-1217
Phone (419) 755-1011 Fax (419)
755-1263 Principal Office
The Gorman-Rupp Company 600 South Airport
Road Mansfield, OH 44903 |
|
NYSE MKT Exchange Symbol GRC
Independent Registered Public Accounting Firm
Ernst & Young LLP Suite 1800
950 Main Avenue Cleveland, OH
44113-7214 |
40