Attached files
| file | filename |
|---|---|
| EX-32 - EX-32 - GORMAN RUPP CO | d469357dex32.htm |
| EX-31.(B) - EX-31.(B) - GORMAN RUPP CO | d469357dex31b.htm |
| EX-31.(A) - EX-31.(A) - GORMAN RUPP CO | d469357dex31a.htm |
| EX-24 - EX-24 - GORMAN RUPP CO | d469357dex24.htm |
| EX-23 - EX-23 - GORMAN RUPP CO | d469357dex23.htm |
| EX-21 - EX-21 - GORMAN RUPP CO | d469357dex21.htm |
| EX-14 - EX-14 - GORMAN RUPP CO | d469357dex14.htm |
Table of Contents
UNITED STATES SECURITIES AND EXCHANGE COMMISSION
Washington, D.C. 20549
FORM 10-K
| ☒ | ANNUAL REPORT PURSUANT TO SECTION 13 OR 15(d) OF THE SECURITIES EXCHANGE ACT OF 1934 |
For the fiscal year ended December 31, 2017
OR
| ☐ | TRANSITION REPORT PURSUANT TO SECTION 13 or 15 (d) OF THE SECURITIES EXCHANGE ACT OF 1934 |
Commission file number 1-6747
THE GORMAN-RUPP COMPANY
(Exact name of Registrant as specified in its charter)
| Ohio | 34-0253990 | |
| (State or other jurisdiction of incorporation or organization) |
(I.R.S. Employer Identification No.) | |
| 600 South Airport Road, Mansfield, Ohio | 44903 | |
| (Address of principal executive offices) | (Zip Code) | |
Registrant’s telephone number, including area code: (419) 755-1011
Securities registered pursuant to Section 12(b) of the Act:
| Title of each class |
Name of each exchange on which registered | |
| Common Shares, without par value | New York Stock Exchange |
Securities registered pursuant to Section 12(g) of the Act: None
Indicate by check mark if the Registrant is a well-known seasoned issuer, as defined in Rule 405 of the Securities Act. Yes ☐ No ☒
Indicate by check mark if the Registrant is not required to file reports pursuant to Section 13 or Section 15(d) of the Act. Yes ☐ No ☒
Indicate by check mark whether the Registrant (1) has filed all reports required to be filed by Section 13 or 15(d) of the Securities Exchange Act of 1934 during the preceding 12 months (or for such shorter period that the Registrant was required to file such reports), and (2) has been subject to such filing requirements for the past 90 days. Yes ☒ No ☐
Indicate by check mark whether the Registrant has submitted electronically and posted on its corporate Website, if any, every Interactive Data File required to be submitted and posted pursuant to Rule 405 of Regulation S-T (§232.405 of this chapter) during the preceding 12 months (or for such shorter period that the registrant was required to submit and post such files). Yes ☒ No ☐
Indicate by check mark if disclosure of delinquent filers pursuant to Item 405 of Regulation S-K (§229.405 of this chapter) is not contained herein, and will not be contained, to the best of Registrant’s knowledge, in the definitive proxy statement or information statement incorporated by reference in Part III of this Form 10-K or any amendment to this Form 10-K. ☐
Indicate by check mark whether the Registrant is a large accelerated filer, an accelerated filer, a non-accelerated filer, or a smaller reporting company. See the definitions of “large accelerated filer”, “accelerated filer” and “smaller reporting company” in Rule 12b-2 of the Exchange Act.
| Large accelerated filer ☐ | Accelerated filer ☒ | Non-accelerated filer ☐ | Smaller reporting company ☐ | |||
| Emerging growth company ☐ |
(Do not check if smaller reporting company)
If an emerging growth company, indicate by check mark if the registrant has elected not to use the extended transition period for complying with any new or revised financial accounting standards provided pursuant to Section 13(a) of the Exchange Act. ☐
Indicate by check mark whether the Registrant is a shell company (as defined in Rule 12b-2 of the Exchange Act). Yes ☐ No ☒
The aggregate market value of The Gorman-Rupp Company Common Shares held by non-affiliates and based on the closing sales price as of June 30, 2017 was approximately $450,494,000.
On January 31, 2018, there were 26,106,623 shares of The Gorman-Rupp Company Common Shares, without par value, outstanding.
DOCUMENTS INCORPORATED BY REFERENCE
Portions of the Notice of 2018 Annual Meeting of Shareholders and related Proxy Statement are incorporated by reference into Part III (Items 10-14).
Table of Contents
The Gorman-Rupp Company and Subsidiaries
Annual Report on Form 10-K
For the Year Ended December 31, 2017
i
Table of Contents
PART I
Safe Harbor Statement
In connection with the “safe harbor” provisions of the Private Securities Litigation Reform Act of 1995, The Gorman-Rupp Company provides the following cautionary statement: This Annual Report on Form 10-K contains various forward-looking statements based on assumptions concerning The Gorman-Rupp Company’s operations, future results and prospects. These forward-looking statements are based on current expectations about important economic, political, and technological factors, among others, and are subject to risks and uncertainties, which could cause the actual results or events to differ materially from those set forth in or implied by the forward-looking statements and related assumptions.
Such factors include, but are not limited to: (1) continuation of the current and projected future business environment; (2) highly competitive markets; (3) availability of raw materials; (4) loss of key management; (5) cyber security threats; (6) acquisition performance and integration; (7) compliance with, and costs related to, a variety of import and export laws and regulations; (8) environmental compliance costs and liabilities; (9) exposure to fluctuations in foreign currency exchange rates; (10) conditions in foreign countries in which The Gorman-Rupp Company conducts business; (11) changes in our tax rates and exposure to additional income tax liabilities; (12) impairment in the value of intangible assets, including goodwill; (13) defined benefit pension plan settlement expense; (14) family ownership of common equity; and (15) risks described from time to time in our reports filed with the Securities and Exchange Commission. Except to the extent required by law, we do not undertake and specifically decline any obligation to review or update any forward-looking statements or to publicly announce the results of any revisions to any of such statements to reflect future events or developments or otherwise.
| ITEM 1. | BUSINESS |
The Gorman-Rupp Company (“Registrant”, “Gorman-Rupp” or the “Company”) was incorporated in Ohio in 1934. The Company designs, manufactures and globally sells pumps and pump systems for use in water, wastewater, construction, dewatering, industrial, petroleum, original equipment, agriculture, fire protection, heating, ventilating and air conditioning (“HVAC”), military and other liquid-handling applications.
PRODUCTS
The Company operates in one business segment, the manufacture and sale of pumps and pump systems. The following table sets forth, for the years 2015 through 2017, the total net sales, income before income taxes and year-end total assets of the Company.
| (in thousands) | ||||||||||||
| 2017 | 2016 | 2015 | ||||||||||
| Net sales |
$ | 379,389 | $ | 382,071 | $ | 406,150 | ||||||
| Income before taxes |
39,378 | 36,482 | 37,266 | |||||||||
| Total assets |
395,015 | 382,818 | 364,201 | |||||||||
The Company’s product line consists of pump models ranging in size from 1/4” to nearly 15 feet and ranging in rated capacity from less than one gallon per minute to nearly one million gallons per minute. The types of pumps which the Company produces include self-priming centrifugal, standard centrifugal, magnetic drive centrifugal, axial and mixed flow, vertical turbine line shaft, submersible, high pressure booster, rotary gear, diaphragm, bellows and oscillating.
The pumps have drives that range from 1/35 horsepower electric motors up to much larger electric motors or internal combustion engines capable of producing several thousand horsepower. Many of the larger units comprise encased, fully integrated water and wastewater pumping stations. In certain cases, units are designed for the inclusion of customer-supplied drives.
1
Table of Contents
The Company’s larger pumps are sold principally for use in the construction, industrial, water and wastewater handling fields; for flood control; for boosting low residential water pressure; for pumping refined petroleum products, including the ground refueling of aircraft; for fluid control in HVAC applications; and for various agricultural purposes.
The Company’s pumps are also utilized for dewatering purposes. Additionally, pumps manufactured for fire protection are used for sprinkler back-up systems, fire hydrants, stand pipes, fog systems and deluge systems at hotels, banks, factories, airports, schools, public buildings and hundreds of other types of facilities throughout the world.
Many of the Company’s smallest pumps are sold to customers for incorporation into such products as food processing, chemical processing, photo processing, medical and other waste treatment, HVAC equipment, appliances and solar heating.
MARKETING
The Company’s pumps are marketed in the United States and worldwide through a broad network of distributors, through manufacturers’ representatives (for sales to many original equipment manufacturers), through third-party distributor catalogs, direct sales, and by ecommerce. The Company regularly seeks alliances with distributors and other partners to further enhance marketing opportunities. Export sales are made primarily through foreign distributors and representatives. The Company has long-standing relationships with many of the leading independent distributors in the markets it serves and provides specialized training programs to distributors on a regular basis.
During 2017, 2016 and 2015, there were no shipments to any single customer that exceeded 10% of total net sales. Gorman-Rupp continued to actively pursue international business opportunities and, in 2017, shipped its pumps to approximately 150 countries around the world. No sales made to customers in any one foreign country amounted to more than 5% of total net sales for 2017, 2016 or 2015.
Approximately $137.6 million of 2017 sales were shipped outside the United States, as compared to $131.2 million in 2016 and $136.5 million in 2015. International sales represented 36% of total net sales in year 2017 and 34% of total net sales in each of the years 2016 and 2015. See Note 9 to the Consolidated Financial Statements, Business Segment Information. The Company continued its efforts to penetrate international markets principally by its increased global investments and its focus on meeting the world’s water and wastewater pumping needs.
COMPETITION
The pump industry is highly fragmented and therefore Gorman-Rupp competes with a large number of businesses. Numerous pump competitors exist as subsidiaries, divisions or departments within significantly larger corporations. Foreign-sourced pumps have also increasingly penetrated into most of the Company’s domestic markets.
Most commercial and industrial pumps are specifically designed and engineered for a particular customer’s application. The Company believes that proper application, product performance, and quality of delivery and service are its principal methods of competition, and attributes its success to its continued emphasis in these areas. In the sale of products and services, the Company benefits from its large installed base, which requires replacement parts due to the critical application and nature of the products and the conditions under which they operate.
PURCHASING AND PRODUCTION
Substantially all of the materials, supplies, components and accessories used by the Company in the fabrication of its products, including all castings (for which most patterns are made and owned by the Company),
2
Table of Contents
structural steel, bar stock, motors, solenoids, engines, seals, and plastic and elastomeric components are purchased by the Company from other suppliers and manufacturers. No purchases are made under long-term contracts and the Company is not dependent upon a single source for any materials, supplies, components or accessories which are of material importance to its business.
The Company purchases motor components for its large submersible pumps, and motors and engines for its pump systems, from a limited number of suppliers, while motors for its polypropylene bellows pumps and magnetic drive pumps are purchased from several alternative vendors. Products requiring small motors are also sourced from alternative suppliers.
The other production operations of the Company consist of the machining of castings, the cutting, shaping and welding of bar stock and structural members, the design and assembly of electrical control panels, the manufacture of some small motors and a few minor components, and the assembling, painting and testing of its products. Substantially all of the Company’s products are tested prior to shipment.
OTHER ASPECTS
As of December 31, 2017, the Company employed approximately 1,165 persons, of whom approximately 660 were hourly employees. The Company has no collective bargaining agreements, has never experienced a work stoppage and considers its labor relations to be satisfactory.
Although the Company owns a number of patents, and several of them are important to its business, Gorman-Rupp believes that the business of the Company is not materially dependent upon any one or more patents. The Company’s patents, trademarks and other intellectual property are adequate for its business purposes.
The backlog of orders at December 31, 2017 was $114.0 million compared to $98.8 million at December 31, 2016, an increase of 15.4%. Approximately 95% of the Company’s backlog of unfilled orders is scheduled to be shipped during 2018, with the remainder principally during the first half of 2019. The increase in backlog from 2016 is due primarily to an improvement in overall business conditions with notable increases in the fire protection, municipal and construction markets.
AVAILABLE INFORMATION
The Company maintains a website accessible through its internet address of www.gormanrupp.com. Gorman-Rupp makes available free of charge on or through www.gormanrupp.com its Annual Report to Shareholders, its annual reports on Form 10-K, its quarterly reports on Form 10-Q, and its current reports on Form 8-K, and any amendments to those reports, as soon as reasonably practicable after those reports (and any amendments) are electronically filed with or furnished to the Securities and Exchange Commission (“Commission”). However, the information contained on the Company’s website is not a part of this Form 10-K or any other report filed with or furnished to the Commission.
A paper copy of the Company’s Form 10-K is also available free of charge upon written request to the Company’s Corporate Secretary.
| ITEM 1A. | RISK FACTORS |
Gorman-Rupp’s business and financial performance are subject to various risks and uncertainties, some of which are beyond its control. In addition to the risks discussed elsewhere in this Form 10-K, the following risks and uncertainties could materially adversely affect the Company’s business, prospects, financial condition, results of operations, liquidity and access to capital markets. These risks could cause the Company’s actual results to differ materially from its historical experience and from expected results discussed in forward-looking statements made by the Company related to conditions or events that it anticipates may occur in the future.
3
Table of Contents
Continuation of current and projected future business environment
The overall pump industry is cyclical in nature, and some of its business activity is related to general business conditions in the durable goods and capital equipment markets. Demand for most of the Company’s products and services is affected by the level of new capital investment and planned maintenance expenditures by its customers. The level of such investment and expenditures by our customers depends, in turn, on factors such as general economic conditions, availability of credit, economic conditions within their respective industries and expectations of future market behavior. Volatility in prices of commodities such as oil and agricultural products can negatively affect the levels of investment and expenditures of certain customers and result in postponement of capital spending decisions or the delay or cancellation of existing orders which may negatively impact the Company’s sales.
Highly competitive markets
Gorman-Rupp sells products in highly competitive markets. Maintaining and improving the Company’s competitive position requires periodic investment in manufacturing, engineering, quality standards, marketing, customer service and support, and distribution networks. Even with such investment, the Company may not be successful in maintaining its competitive position. The Company’s competitors may develop products that are superior to its products, or may develop methods of more efficiently and effectively providing products and services, or may adapt more quickly to new technologies or evolving customer requirements. Pricing pressures may require the Company to adjust the prices of its products downward to stay competitive. The Company may not be able to compete successfully with its existing competitors or with new competitors. Failure to compete successfully could reduce the Company’s sales, operating margins and overall financial performance.
Availability of raw materials
The Company could be adversely affected by raw material price volatility and any inability of suppliers to meet quality and delivery requirements. Additionally, raw material and energy expenses are substantive drivers of costs in the manufacture of pumps and changes in these costs are often unpredictable. The Company may not be able to pass along any increased material costs to customers for competitive or other reasons. While the Company manufactures certain parts and components used in its products, the Company’s business requires substantial amounts of raw materials, parts and components that are purchased from suppliers. The availability and prices of raw materials, parts and components may be subject to curtailment or change due to, among other things, suppliers’ allocations to other purchasers, interruptions in production by suppliers, changes in exchange rates and prevailing price levels. Any change in the availability of, or increases in the price for, these raw materials, parts and components could materially affect our business, financial condition, results of operations or cash flows.
Loss of key management
The Company’s success depends to a significant extent on the continued service of its executive management team and the ability to recruit, hire and retain other key management personnel to support the Company’s growth and operational initiatives and replace executives who retire or resign. Failure to retain key management and attract and retain other highly-skilled personnel could limit the Company’s global growth and operational initiatives, or may result in inefficient and ineffective management and operations, which could harm the Company’s revenues, operations and product development efforts and could eventually result in a decrease in profitability.
Cyber security threats
Increased global information technology security threats and more sophisticated and targeted computer crime pose a risk to the security of Gorman-Rupp’s systems and networks and to the confidentiality, availability, and
4
Table of Contents
integrity of its data. While the Company attempts to mitigate these risks by employing a number of measures, including employee training, comprehensive monitoring of its networks and systems, and the deployment of backup and protective systems, the Company’s systems, networks, proprietary information, products, solutions and services remain potentially vulnerable to advanced persistent threats. Depending on their nature and scope, such threats could potentially lead to damages or destruction including, but not limited to, the compromising of confidential information relating to customer, supplier, or employee data, improper use of the Company’s systems and networks, manipulation and destruction of data, defective products, production downtimes and operational disruptions which, in turn, could adversely affect Gorman-Rupp’s reputation, competitiveness, and results of operations.
Acquisition performance and integration
The Company’s historical growth has depended, and its future growth is likely to continue to depend, in part on its acquisition strategy and the successful integration of acquired businesses into existing operations. The Company intends to continue to seek additional acquisition opportunities that have the potential to support and strengthen its operations. The Company cannot assure it will be able to successfully identify suitable acquisition opportunities, prevail against competing potential acquirers, negotiate appropriate acquisition terms, obtain financing that may be needed to consummate such acquisitions, complete proposed acquisitions, successfully integrate acquired businesses into existing operations or expand into new markets. In addition, the Company cannot assure that any acquisition, once successfully integrated, will perform as planned, be accretive to earnings, or prove to be beneficial to the Company’s operations and cash flows.
Compliance with, and costs related to, a variety of import and export laws and regulations
The Company is subject to a variety of laws regarding international operations, including regulations issued by the U.S. Department of Commerce Bureau of Industry and Security and various foreign governmental agencies. Actual or alleged violations of import-export laws could result in enforcement actions and financial penalties. The Company cannot predict the nature, scope or effect of future regulatory requirements to which our international operations and trading practices might be subject or the manner in which existing laws might be administered or interpreted. Future regulations could limit the countries in which certain of our products may be manufactured or sold or could restrict our access to, and increase the cost of obtaining, products from foreign sources.
Environmental compliance costs and liabilities
The Company’s operations and properties are subject to various, and increasingly numerous, domestic and foreign environmental laws and regulations which can impose operating and financial sanctions for violations. Moreover, environmental and sustainability initiatives, practices, rules and regulations are under increasing scrutiny of both governmental and non-governmental bodies and may require changes in operational practices, standards and expectations and, in turn, increase the Company’s compliance costs. Periodically, the Company has incurred, and expects to continue to incur, operating and capital costs to comply with environmental requirements. The Company monitors its environmental responsibilities, together with trends in the related laws, and believes it is in substantial compliance with current regulations. If the Company is required to incur increased compliance costs or violates environmental laws or regulations, future environmental compliance expenditures or liabilities could have a material adverse effect on our financial condition, results of operations or cash flows.
Exposure to fluctuations in foreign currency exchange rates
The Company is exposed to fluctuations in foreign currency exchange rates, particularly with respect to the Euro, Canadian Dollar, South African Rand and the British Pound. Any significant change in the value of these currencies could affect the Company’s ability to sell products competitively and control its cost structure, which could have a material effect on its financial condition, results of operations or cash flows.
5
Table of Contents
Conditions in foreign countries in which the Company conducts business
In 2017, 36% of the Company’s sales were to customers outside the United States. The Company expects its international and export sales to continue to be a significant portion of its revenue and it has placed a particular emphasis on increasing its growth and presence internationally. The Company’s sales from international operations and export sales are subject, in varying degrees, to risks inherent to doing business outside the United States. These risks include the following, some of which are further addressed in our other Risk Factors:
| • | Possibility of unfavorable circumstances arising from host country laws or regulations; |
| • | Currency exchange rate fluctuations and restrictions on currency repatriation; |
| • | Potential negative consequences from changes to taxation policies; |
| • | Disruption of operations from labor and political disturbances; |
| • | Changes in tariff and trade barriers and import and export licensing requirements; |
| • | Increased costs and risks of developing, staffing and simultaneously managing a number of global operations as a result of distance as well as language and cultural differences; and |
| • | Insurrections, armed conflicts, terrorism or war. |
Any of these events could have an adverse impact on the Company’s business and operations.
Changes in our tax rates and exposure to additional income tax liabilities
Our future effective income tax rates could be unfavorably affected by various factors, including changes in the tax rates as well as rules and regulations in jurisdictions in which we generate income. During the fourth quarter of 2017 the Company recorded, on a provisional basis, the transitional impact of the U.S. Tax Cuts and Jobs Act (“Tax Act”) that was enacted on December 22, 2017. Given the significant complexity of the Tax Act, and potential future guidance from the U.S. Treasury, the Securities and Exchange Commission and the Financial Accounting Standards Board, these estimates may be adjusted in 2018. In addition, the amount of income taxes we pay is subject to ongoing audits by U.S. federal, state and local tax authorities and by non-U.S. authorities. If these audits result in assessments different from amounts recorded, our future financial results may include unfavorable adjustments.
Impairment in the value of intangible assets, including goodwill
The Company’s total assets reflect goodwill from acquisitions, representing the excess cost over the fair value of the identifiable net assets acquired, including other indefinite-lived and finite-lived intangible assets. Goodwill and other indefinite-lived intangible assets are not amortized but are reviewed annually for impairment as of October 1 or whenever events or changes in circumstances indicate there may be a possible permanent loss of value using either a quantitative or qualitative analysis. Finite-lived assets are reviewed for impairment whenever events or changes in circumstances indicate the carrying amount may not be recovered through future net cash flows generated by the assets. If future operating performance at one or more of the Company’s reporting units were to fall significantly below forecast levels or if market conditions for one or more of its acquired businesses were to decline, the Company could be required to incur a non-cash charge to operating income for impairment. Any impairment in the value of these assets could have an adverse non-cash impact on the Company’s reported results of operations.
In 2017 and 2016, the Company recorded pre-tax non-cash goodwill and other intangible impairment charges of $4.1 million and $1.8 million, respectively, related to the Company’s Bayou City Pump Company reporting unit. There was no goodwill or other intangible impairment charges recorded in 2015. See Note 8 to the Consolidated Financial Statements, Goodwill and Other Intangible Assets.
6
Table of Contents
The Company’s annual impairment analysis concluded that the fair value of the Company’s National Pump Company reporting (“National”) unit exceeded its carrying value be approximately 7%. A sensitivity analysis was performed for the National reporting unit, assuming a hypothetical 50 basis point decrease in the expected long-term growth rate or a hypothetical 50 basis point increase in the weighted average cost of capital, and both scenarios independently yielded an estimated fair value for the National reporting unit slightly above carrying value. While the result of this test indicated that no impairment existed at National, if recently depressed U.S. agricultural conditions continue for an extended time, the agricultural market’s growth and profitability assumptions may reduce National’s indicated fair value in the future, which could result in an impairment charge. See Note 8 to the Consolidated Financial Statements, Goodwill and Other Intangible Assets.
Defined benefit pension plan settlement expense
The Company sponsors a defined benefit pension plan covering certain domestic employees and accrues amounts for funding of its obligations under the plan. The defined benefit pension plan allows eligible retiring employees to receive a lump-sum distribution for benefits earned in lieu of annual payments and most of the Company’s retirees historically have elected this option. Under applicable accounting rules, if the lump-sum distributions made for a plan year exceed an actuarially-determined threshold of the total of the service cost and interest cost for the plan year, the Company at such point would be required to recognize for that year’s results of operations settlement expense for the resulting unrecognized actuarial loss. The Company has been required to make such adjustments in some prior years, and, if such non-cash adjustments are necessary in future periods, they may negatively impact the Company’s operating results.
In 2017 and 2015, the Company recorded pre-tax non-cash pension settlement charges of $4.0 million and $3.8 million, respectively, driven by lump-sum distributions discussed above. There was no pension settlement charge recorded in 2016. See Note 7 to the Consolidated Financial Statements, Pensions and Other Postretirement Benefits.
Family ownership of common equity
A substantial percentage of the Company’s Common Shares is held by various members of the Gorman and Rupp families and their affiliates. These family holdings historically have not been frequently traded; therefore, the Common Shares, in part because of these circumstances, generally have a history of relatively low volume trading experiences on the NYSE.
| ITEM 1B. | UNRESOLVED STAFF COMMENTS |
None.
| ITEM 2. | PROPERTIES |
The Company’s corporate headquarters are located in Mansfield, Ohio. The production operations of the Company are conducted at several locations throughout the United States and other countries as set forth below. The Company is a lessee under a number of operating leases for certain real properties, none of which is material to its operations.
7
Table of Contents
The Company’s principal production operations are:
| United States |
||||
| Mansfield (two) and Bellville, Ohio |
Royersford, Pennsylvania (two) | Olive Branch, Mississippi | ||
| Toccoa, Georgia | Glendale, Arizona | Lubbock, Texas | ||
| Other Countries |
||||
| St. Thomas, Ontario, Canada |
County Westmeath, Ireland | Culemborg, The Netherlands* | ||
| Johannesburg, South Africa |
Namur, Belgium | |||
| * | Leased property |
The Company owns a facility in Dallas, Texas comprising a training center and warehouse. In addition, the Company leases a warehouse facility in Jebal Ali, Dubai.
Gorman-Rupp considers its plants, machinery and equipment to be well maintained, in good operating condition and adequate for the present uses and business requirements of the Company.
| ITEM 3. | LEGAL PROCEEDINGS |
For more than fifteen years, numerous business entities in the pump and fluid-handling industries, as well as a multitude of companies in many other industries, have been targeted in a series of lawsuits in several jurisdictions by various individuals seeking redress to claimed injury as a result of the entities’ alleged use of asbestos in their products. Since 2001, the Company and some of its subsidiaries have been involved in this mass-scaled litigation, typically as one of many co-defendants in a particular proceeding. The allegations in the lawsuits involving the Company and/or its subsidiaries have been vague, general and speculative. Most of these lawsuits have been dismissed without advancing beyond the early stage of discovery, some as a result of nominal monetary settlements recommended for payment by the Company’s insurers. The claims and related legal expenses generally have been covered by the Company’s insurance, subject to applicable deductibles and limitations. Accordingly, this series of lawsuits has not, cumulatively or individually, had a material adverse impact on the Company’s consolidated results of operations, liquidity or financial condition, nor is it expected to have any such impact in the future, based on the current knowledge of the Company.
In addition, the Company and/or its subsidiaries are parties in a small number of legal proceedings arising in the ordinary course of business. Management does not currently believe that these proceedings will materially impact the Company’s consolidated results of operations, liquidity or financial condition.
| ITEM 4. | MINE SAFETY DISCLOSURE |
Not applicable.
8
Table of Contents
EXECUTIVE OFFICERS OF THE REGISTRANT
The following table sets forth certain information with respect to the executive officers of the Company as of January 31, 2018:
| Name |
Age | Office | Date Elected to Executive Office Position | |||||
| James C. Gorman |
93 | Chairman | 1989 | |||||
| Jeffrey S. Gorman |
65 | President and Chief Executive Officer | 1998 | |||||
| James C. Kerr |
55 | Chief Financial Officer | 2017 | |||||
| Brigette A. Burnell |
42 | General Counsel and Corporate Secretary | 2014 | |||||
Mr. J. C. Gorman served as the Company’s President from 1964 until 1989, and as Chief Executive Officer from 1964 until 1996. He has served as a Director of the Company continuously since 1946.
Mr. J. S. Gorman was elected President and Chief Executive Officer effective May 1, 1998, after having served as Senior Vice President since 1996. Mr. J. S. Gorman also held the position of General Manager of the Mansfield Division from 1989 through 2005. He served as Assistant General Manager from 1986 to 1988; and he held the office of Corporate Secretary from 1982 to 1990. He has served as a Director of the Company continuously since 1989.
Mr. Kerr was elected Chief Financial Officer effective January 1, 2017 and previously served as Vice President of Finance from July 18, 2016 to December 31, 2016. Mr. Kerr previously served as both Executive Vice President and Chief Financial Officer from 2006 to 2015 and Vice President, Controller from 1998 to 2006 for Jo-Ann Stores.
Ms. Burnell was elected General Counsel effective May 1, 2015 and was elected Corporate Secretary effective May 1, 2014. Ms. Burnell previously served as Corporate Counsel effective May 1, 2014. Ms. Burnell joined the Company as Corporate Attorney on January 2, 2014. Ms. Burnell previously served as Corporate Counsel of Red Capital Group from 2011 to 2013 advising the company on legal matters in all areas of business, after having served as an Associate at Jones Day from 2002 to 2011.
Mr. J. S. Gorman is the son of Mr. J. C. Gorman. There are no other family relationships among any of the Executive Officers and Directors of the Company.
9
Table of Contents
PART II
| ITEM 5. | MARKET FOR REGISTRANT’S COMMON EQUITY, RELATED STOCKHOLDER MATTERS AND ISSUER PURCHASES OF EQUITY SECURITIES |
MARKET INFORMATION
The following tables set forth the high and low sale prices and dividends per share for the Company’s Common Shares as reported by the New York Stock Exchange (“NYSE”) for the periods indicated:
| Sales Price of Common Shares | Dividends Per Share |
|||||||||||||||||||||||
| 2017 | 2016 | 2017 | 2016 | |||||||||||||||||||||
| High | Low | High | Low | |||||||||||||||||||||
| First quarter |
$ | 33.44 | $ | 29.25 | $ | 27.92 | $ | 21.09 | $ | 0.115 | $ | 0.105 | ||||||||||||
| Second quarter |
31.66 | 23.55 | 31.73 | 24.68 | 0.115 | 0.105 | ||||||||||||||||||
| Third quarter |
33.29 | 25.06 | 29.59 | 25.14 | 0.115 | 0.105 | ||||||||||||||||||
| Fourth quarter |
33.50 | 29.48 | 34.45 | 22.30 | 0.125 | 0.115 | ||||||||||||||||||
The Company’s Common Stock is listed on the NYSE under the ticker symbol “GRC”. On May 16, 2017, the Company moved its stock exchange listing to the NYSE from the NYSE MKT. On February 1, 2018, there were approximately 7,600 shareholders, of which 1,600 were registered holders of Common Shares.
The Company currently expects to continue its exceptional history of paying regular quarterly dividends and increased annual dividends. However, any future dividends will be reviewed individually and declared by our Board of Directors at its discretion, dependent on our assessment of the Company’s financial condition and business outlook at the applicable time.
PERFORMANCE GRAPH
Set forth below is a line graph comparing the yearly percentage change in the cumulative total shareholder return, including reinvested cash dividends, on the Company’s common shares against the cumulative total return of each of the NYSE Composite and the NYSE American, as well as a peer group index for the period of five fiscal years commencing January 1, 2013 and ending December 31, 2017. The issuers in the peer group SIC Code Index were selected on a line-of-business basis by reference to SIC Code 3561— Pumps and Pumping Equipment. The SIC Code Index is composed of the following issuers: Ampco-Pittsburgh Corp., Colfax Corp., Flowserve Corp., The Gorman-Rupp Company, Graco Inc., Idex Corp., ITT Corp., and Xylem Inc. The graph assumes that the value of the investment in the Company’s Common Stock, in each index, and in the peer group (including reinvestment of dividends) was $100 on 12/31/2012 and tracks it through 12/31/2017.
10
Table of Contents
Comparison of 5-Year Cumulative Total Shareholder Return Among The Gorman-Rupp Company,
NYSE Composite Index, NYSE American Index and SIC Code 3561
COMPARISON OF 5 YEAR CUMULATIVE TOTAL RETURN*
Among The Gorman-Rupp Company, the NYSE American Index,
the NYSE Composite Index and SIC Code 3561
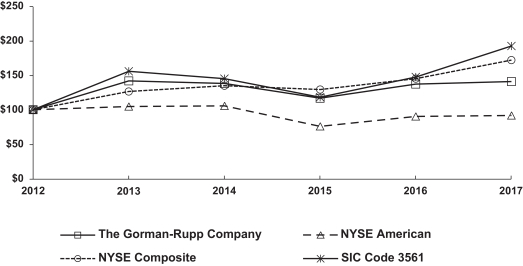
*$100 invested on 12/31/12 in stock or index, including reinvestment of dividends.
Fiscal year ending December 31.
| 2012 | 2013 | 2014 | 2015 | 2016 | 2017 | |||||||||||||||||||
| The Gorman-Rupp Company |
100.00 | 141.84 | 137.89 | 116.49 | 137.07 | 140.48 | ||||||||||||||||||
| NYSE American |
100.00 | 104.47 | 105.23 | 75.69 | 89.97 | 91.27 | ||||||||||||||||||
| NYSE Composite |
100.00 | 126.28 | 134.81 | 129.29 | 144.73 | 171.83 | ||||||||||||||||||
| SIC Code 3561 |
100.00 | 155.48 | 144.87 | 117.71 | 147.01 | 192.44 | ||||||||||||||||||
The stock price performance included in this graph is not necessarily indicative of future stock price performance.
11
Table of Contents
| ITEM 6. | SELECTED FINANCIAL DATA |
Five-Year Summary of Selected Financial Data
(Thousands of dollars, except per share amounts)
| 2017 | 2016 | 2015 | 2014 | 2013 | ||||||||||||||||
| Operating Results |
||||||||||||||||||||
| Net sales |
$379,389 | $382,071 | $406,150 | $434,925 | $391,665 | |||||||||||||||
| Gross profit |
98,745 | 92,025 | 92,580 | 107,559 | 93,655 | |||||||||||||||
| Income taxes |
12,823 | 11,599 | 12,157 | 17,593 | 14,173 | |||||||||||||||
| Net income |
26,555 | 24,883 | 25,109 | 36,141 | 30,104 | |||||||||||||||
| Depreciation and amortization |
15,053 | 15,529 | 15,282 | 14,615 | 13,588 | |||||||||||||||
| Interest expense |
17 | 20 | 122 | 134 | 146 | |||||||||||||||
| Return on net sales (%) |
7.0 | 6.5 | 6.2 | 8.3 | 7.7 | |||||||||||||||
| Sales dollars per employee |
327.9 | 313.2 | 318.5 | 340.6 | 315.6 | |||||||||||||||
| Income dollars per employee |
23.0 | 20.4 | 19.7 | 28.3 | 24.3 | |||||||||||||||
| Financial Position |
||||||||||||||||||||
| Current assets |
$227,934 | $203,900 | $189,391 | $200,709 | $189,289 | |||||||||||||||
| Current liabilities |
45,696 | 49,352 | 43,460 | 64,346 | 60,760 | |||||||||||||||
| Working capital |
182,238 | 154,548 | 145,931 | 136,363 | 128,529 | |||||||||||||||
| Current ratio |
5.0 | 4.1 | 4.4 | 3.1 | 3.1 | |||||||||||||||
| Property, plant and equipment, net |
$117,071 | $122,067 | $129,887 | $133,964 | $131,189 | |||||||||||||||
| Capital additions |
7,754 | 6,877 | 8,260 | 13,278 | 21,015 | |||||||||||||||
| Total assets |
395,015 | 382,818 | 364,201 | 380,904 | 355,638 | |||||||||||||||
| Equity |
325,495 | 302,888 | 287,021 | 281,967 | 264,140 | |||||||||||||||
| Dividends paid |
12,268 | 11,218 | 10,599 | 9,715 | 8,662 | |||||||||||||||
| Average number of employees |
1,157 | 1,220 | 1,275 | 1,277 | 1,241 | |||||||||||||||
| Shareholder Information |
||||||||||||||||||||
| Earnings per share |
$ 1.02 | $ 0.95 | $ 0.96 | $ 1.38 | $ 1.15 | |||||||||||||||
| Cash dividends per share |
0.470 | 0.430 | 0.405 | 0.370 | 0.330 | |||||||||||||||
| Equity per share at December 31 |
12.47 | 11.61 | 11.00 | 10.74 | 10.06 | |||||||||||||||
| Average number of shares outstanding |
26,100,865 | 26,087,721 | 26,192,072 | 26,256,824 | 26,249,324 | |||||||||||||||
Summary of Quarterly Results of Operations
(Thousands of dollars, except per share amounts)
| Quarter Ended 2017 | Net Sales | Gross Profit | Net Income | Earnings per Share |
||||||||||||
| First quarter |
$ 92,603 | $21,195 | $ 5,065 | $0.19 | ||||||||||||
| Second quarter |
97,872 | 26,145 | 7,848 | 0.30 | ||||||||||||
| Third quarter |
93,976 | 26,199 | 5,702 | 0.22 | ||||||||||||
| Fourth quarter |
94,938 | 25,206 | 7,940 | 0.31 | ||||||||||||
|
|
|
|
|
|
|
|
|
|||||||||
| Total |
$379,389 | $98,745 | $26,555 | $1.02 | ||||||||||||
|
|
|
|
|
|
|
|
|
|||||||||
| Quarter Ended 2016 | Net Sales | Gross Profit | Net Income | Earnings per Share |
||||||||||||
| First quarter |
$100,257 | $22,897 | $ 6,282 | $0.24 | ||||||||||||
| Second quarter |
96,265 | 23,240 | 6,620 | 0.25 | ||||||||||||
| Third quarter |
91,346 | 22,670 | 6,927 | 0.27 | ||||||||||||
| Fourth quarter |
94,203 | 23,218 | 5,054 | 0.19 | ||||||||||||
|
|
|
|
|
|
|
|
|
|||||||||
| Total |
$382,071 | $92,025 | $24,883 | $0.95 | ||||||||||||
|
|
|
|
|
|
|
|
|
|||||||||
12
Table of Contents
| ITEM 7. | MANAGEMENT’S DISCUSSION AND ANALYSIS OF FINANCIAL CONDITION AND RESULTS OF OPERATIONS |
(Amounts in tables in thousands of dollars)
Executive Overview
The following discussion of Results of Operations includes certain non-GAAP financial data, and measures such as adjusted earnings before interest, taxes, depreciation and amortization and adjusted earnings per share amounts which exclude non-cash pension settlement charges in 2017 and 2015 and non-cash impairment charges in 2017 and 2016 relating to goodwill and other intangible assets. Management utilizes these adjusted financial data and measures to assess comparative operations against those of prior periods without the distortion of non-comparable factors. The Gorman-Rupp Company believes that these non-GAAP financial data and measures will be useful to investors as well as to assess the continuing strength of the Company’s underlying operations from period to period. Provided below is a reconciliation of adjusted earnings per share amounts and adjusted earnings before interest, taxes, depreciation and amortization.
| 2017 | 2016 | 2015 | ||||||||||
| Adjusted earnings per share: |
||||||||||||
| Reported earnings per share – GAAP basis |
$1.02 | $0.95 | $0.96 | |||||||||
| Plus pension settlement charge |
0.10 | - | 0.10 | |||||||||
| Plus goodwill impairment and other intangible asset charges |
0.10 | 0.05 | - | |||||||||
|
|
|
|
|
|
|
|||||||
| Non-GAAP adjusted earnings per share |
$1.22 | $1.00 | $1.06 | |||||||||
|
|
|
|
|
|
|
|||||||
| Adjusted earnings before interest, taxes, depreciation and amortization: |
||||||||||||
| Reported net income – GAAP basis |
$26,555 | $24,883 | $25,109 | |||||||||
| Plus interest |
17 | 20 | 122 | |||||||||
| Plus income taxes |
12,823 | 11,599 | 12,157 | |||||||||
| Plus depreciation and amortization |
15,053 | 15,529 | 15,282 | |||||||||
|
|
|
|
|
|
|
|||||||
| Non-GAAP earnings before interest, taxes, depreciation and amortization |
54,448 | 52,031 | 52,670 | |||||||||
| Plus pension settlement charge |
4,031 | - | 3,783 | |||||||||
| Plus goodwill impairment and other intangible asset charges |
4,098 | 1,800 | - | |||||||||
|
|
|
|
|
|
|
|||||||
| Non-GAAP adjusted earnings before interest, taxes, depreciation and amortization |
$62,577 | $53,831 | $56,453 | |||||||||
|
|
|
|
|
|
|
|||||||
The Gorman-Rupp Company is a leading designer, manufacturer and international marketer of pumps and pump systems for use in diverse water, wastewater, construction, dewatering, industrial, petroleum, original equipment, agriculture, fire protection, heating, ventilating and air conditioning (HVAC), military and other liquid-handling applications. The Company attributes its success to long-term product quality, applications and performance combined with timely delivery and service, and continually seeks to develop initiatives to improve performance in these key areas.
Gorman-Rupp actively pursues growth opportunities through organic growth, international business expansion and acquisitions.
We regularly invest in training for our employees, in new product development and in modern manufacturing equipment, technology and facilities all designed to increase production efficiency and capacity and drive growth by delivering innovative solutions to our customers. We believe that the diversity of our markets is a major contributor to the generally stable financial growth we have produced over the past 80 plus years.
13
Table of Contents
The Company places a strong emphasis on cash flow generation and having excellent liquidity and financial flexibility. This focus has afforded us the ability to reinvest our cash resources and preserve a strong balance sheet to position us for future acquisition and product development opportunities. The Company had no bank debt as of December 31, 2017. The $137.4 million of aggregate cash generated by operating activities over the past three years was utilized primarily to pay dividends, fund the Company’s defined benefit pension plan, purchase productivity-enhancing capital equipment, entirely repay acquisitions-related short-term debt and fund growth-oriented acquisitions. The Company’s cash position increased $22.1 million during 2017 to $79.7 million at December 31, 2017.
The Company generated $62.6 million in adjusted earnings before interest, taxes, depreciation and amortization during 2017. From these earnings, the Company invested $7.8 million primarily in machinery and equipment and returned $12.3 million in dividends to shareholders.
Capital additions for 2018 are presently planned to be in the range of $10-$15 million primarily for building expansion and machinery and equipment purchases, and are expected to be financed through internally-generated funds and existing lines of credit.
Net sales for the year ended December 31, 2017 were $379.4 million compared to $382.1 million for 2016, a decrease of 0.7% or $2.7 million. Excluding sales from the PCCP project of $0.7 million in 2017 and $9.9 million in 2016, net sales in 2017 increased 1.8% or $6.5 million. Domestic sales, excluding PCCP, increased $0.1 million while international sales increased 4.9% or $6.4 million.
Gross profit was $98.7 million for 2017, resulting in gross margin of 26.0%, compared to gross profit of $92.0 million and gross margin of 24.1% for 2016. Gross margin included a non-cash pension settlement charge of $2.6 million or 70 basis points in 2017 which did not occur in 2016. Excluding the non-cash pension settlement charge, gross margin increased by 260 basis points due principally to favorable sales mix.
SG&A was $56.8 million and 15.0% of net sales for 2017 compared to $54.5 million and 14.3% of net sales for 2016. SG&A included a non-cash pension settlement charge of $1.4 million or 40 basis points in 2017 which did not occur last year. SG&A included a gain on the sale of property, plant and equipment of $1.0 million or 30 basis points in 2016. Excluding these items, SG&A decreased slightly compared to last year and as a percentage of sales was flat.
Operating income was $37.9 million, resulting in operating margin of 10.0% for the 2017, compared to operating income of $35.7 million and operating margin of 9.3% for 2016. In 2017, operating income included non-cash impairment charges of $4.1 million or 100 basis points and a non-cash pension settlement charge of $4.0 million or 110 basis points. In 2016, operating income included a non-cash impairment charge of $1.8 million or 50 basis points and a gain on the sale of property, plant and equipment of $0.6 million or 20 basis points. Excluding these items, operating income improved $9.1 million or 250 basis points due principally to improved gross margin.
Net income was $26.6 million for 2017 compared to $24.9 million in 2016, and earnings per share were $1.02 and $0.95 for the respective periods. Earnings per share for 2017 included non-cash impairment charges of $0.10 per share and a non-cash pension settlement charge of $0.10 per share. Earnings per share for 2016 included a non-cash impairment charge of $0.05 per share.
The Company’s backlog of orders was $114.0 million at December 31, 2017 compared to $98.8 million at December 31, 2016, an increase of 15.4%. The increase in backlog was primarily due to increases in the fire protection, municipal and construction markets principally driven by improved economic conditions both domestically and internationally.
On January 25, 2018, the Board of Directors authorized the payment of a quarterly dividend of $0.125 per share, representing the 272nd consecutive quarterly dividend to be paid by the Company. During 2017, the
14
Table of Contents
Company again paid increased dividends and thereby attained its 45th consecutive year of increased dividends. These consecutive years of increases continue to position Gorman-Rupp in the top 50 of all U.S. public companies with respect to number of years of increased dividend payments. The dividend yield at December 31, 2017 was 1.5%.
The Company currently expects to continue its exceptional history of paying regular quarterly dividends and increased annual dividends. However, any future dividends will be reviewed individually and declared by our Board of Directors at its discretion, dependent on our assessment of the Company’s financial condition and business outlook at the applicable time.
Outlook
Overall business conditions have continued to improve during 2017 and we are optimistic about our incoming order rate as we enter 2018. However, we continue to experience some softness in the agriculture and certain oil and gas driven markets. Increased emphasis on infrastructure improvements at both the federal and state levels coupled with the newly enacted U.S. tax legislation could be additional positive factors over the next several years. The Company remains focused on operational efficiencies and will continue to manage expenses closely. Our underlying fundamentals remain strong and we remain well positioned to drive long-term growth. Our strong balance sheet provides us with the flexibility to continue to evaluate acquisition opportunities and new product development that we expect will help add value to our operations over the longer-term.
On December 22, 2017, the U.S. Tax Cuts and Jobs Act (the “Tax Act”) was enacted. The Tax Act reduces the federal corporate tax rate on U.S. earnings to 21% and moves from a global taxation regime to a modified territorial regime. As part of the Tax Act, U.S. companies are required to pay a tax on historical earnings generated offshore that have not been repatriated to the U.S. Companies are required to re-measure their deferred tax assets and liabilities to reflect the lower federal base rate of 21%. These transitional impacts resulted in a provisional net tax expense of $0.4 million for the fourth quarter of 2017, comprised of an estimated repatriation tax expense of $2.0 million (which includes U.S. repatriation taxes and foreign withholding taxes) and a net deferred tax benefit of approximately $1.6 million. The provisional estimates are based on the Company’s initial analysis of the Tax Act. Given the significant complexity of the Tax Act, anticipated guidance from the U. S. Treasury about implementing the Tax Act, and the potential for additional guidance from the Securities and Exchange Commission or the Financial Accounting Standards Board related to the Tax Act, these estimates may be adjusted during 2018. The Company’s preliminary estimate of its future effective tax rate attributable to the Tax Act is between 23% and 26%. The Company continues to evaluate the impact of the Tax Act, and will update its estimates as appropriate.
Results of Operations – 2017 Compared to 2016:
In 2017, due primarily to the continued decreased demand for barge pumps for the marine transportation market driven by low oil prices and overcapacity of inland barges, the Bayou City Pump Company (“Bayou”) reporting unit recorded pre-tax non-cash goodwill and intangible asset impairment charges of $4.1 million. In 2016, due primarily to the prolonged downturn in the oil and gas industry, the Bayou reporting unit recorded a pre-tax non-cash goodwill impairment charge of $1.8 million. There were no impairment charges recorded in 2015. See Note 8, Goodwill and Other Intangible Assets.
In 2017, due to increased employee retirements and related lump sum pension payments, the Company recorded a U.S. GAAP-required and actuarially-determined $4.0 million non-cash pension settlement charge. The value of lump sum pension payments was less in 2016 and a non-cash pension settlement charge was not required.
Net Sales
| Year Ended December 31, | ||||||||||||||||
| 2017 | 2016 | $ Change | % Change | |||||||||||||
| Net sales |
$ | 379,389 | $ | 382,071 | $ | (2,682) | (0.7)% | |||||||||
15
Table of Contents
Net sales for the year ended December 31, 2017 were $379.4 million compared to $382.1 million for 2016, a decrease of 0.7% or $2.7 million. Excluding sales from the PCCP project of $0.7 million in 2017 and $9.9 million in 2016, net sales in 2017 increased 1.8% or $6.5 million. Domestic sales, excluding PCCP, increased $0.1 million while international sales increased 4.9% or $6.4 million.
Sales in our larger water markets, excluding PCCP, decreased 0.4% or $1.1 million in 2017 compared to 2016. Sales in the construction market increased $10.4 million due primarily to sales to rental market customers, and sales of repair parts increased $2.4 million. These increases were offset by decreased sales in the municipal market decreased $7.3 million principally driven by decreased shipments attributable to flood control projects. In addition, sales in the fire protection market decreased $4.2 million principally due to market softness in the Middle East, and sales in the agriculture market decreased $2.4 million principally due to low farm income and competitive pricing pressure.
Sales in our non-water markets increased 6.9% or $7.6 million in 2017 compared to 2016. Sales increased $7.7 million in the industrial market driven by an increase in oil and gas drilling activity. Sales in the OEM market increased $2.5 million primarily related to power generation equipment and new customers associated with transportation and alternative energy applications. These increases were partially offset by decreased shipments of $2.6 million in the petroleum market driven by challenging market conditions.
International sales were $137.6 million in 2017 compared to $131.2 million in 2016. International sales represented 36% and 34% of total sales for the Company in each of the years 2017 and 2016, respectively. International sales increased in the construction and industrial markets and continued to be softer in the fire protection market due to sluggish economic conditions in the Middle East.
Cost of Products Sold and Gross Profit
| Year Ended December 31, | ||||||||||||||||
| 2017 | 2016 | $ Change | % Change | |||||||||||||
| Cost of products sold |
$ | 280,644 | $ | 290,046 | $ | (9,402) | (3.2)% | |||||||||
| % of Net sales |
74.0% | 75.9% | ||||||||||||||
| Gross margin |
26.0% | 24.1% | ||||||||||||||
Gross profit was $98.7 million for 2017, resulting in gross margin of 26.0%, compared to gross profit of $92.0 million and gross margin of 24.1% for 2016. Gross margin included a non-cash pension settlement charge of $2.6 million or 70 basis points in 2017 which did not occur in 2016. Excluding the non-cash pension settlement charge, gross margin increased by 260 basis points due principally to favorable sales mix.
Selling, General and Administrative Expenses (SG&A)
| Year Ended December 31, | ||||||||||||||||
| 2017 | 2016 | $ Change | % Change | |||||||||||||
| Selling, general and administrative expenses | $ | 56,789 | $ | 54,528 | $ | 2,261 | 4.1% | |||||||||
| % of Net sales |
15.0% | 14.3% | ||||||||||||||
SG&A was $56.8 million and 15.0% of net sales for 2017 compared to $54.5 million and 14.3% of net sales for 2016. SG&A included a non-cash pension settlement charge of $1.4 million or 40 basis points in 2017 which did not occur last year. SG&A included a gain on the sale of property, plant and equipment of $1.0 million or 30 basis points in 2016. Excluding these items, SG&A decreased slightly compared to last year and as a percentage of sales was flat.
16
Table of Contents
Operating Income
| Year Ended December 31, | ||||||||||||||||
| 2017 | 2016 | $ Change | % Change | |||||||||||||
| Operating income |
$ | 37,858 | $ | 35,697 | $ | 2,161 | 6.1% | |||||||||
| % of Net sales |
10.0% | 9.3% | ||||||||||||||
Operating income was $37.9 million, resulting in operating margin of 10.0% for 2017, compared to operating income of $35.7 million and operating margin of 9.3% for 2016. In 2017, operating margin included non-cash impairment charges of $4.1 million or 100 basis points and a non-cash pension settlement charge of $4.0 million or 110 basis points. In 2016, operating margin included a non-cash impairment charge of $1.8 million or 50 basis points and a gain on the sale of property, plant and equipment of $0.6 million or 20 basis points. Excluding these items, operating income improved $9.1 million or 250 basis points due principally to improved gross margin.
Net Income
| Year Ended December 31, | ||||||||||||||||
| 2017 | 2016 | $ Change | % Change | |||||||||||||
| Income before income taxes |
$39,378 | $36,482 | $2,896 | 7.9% | ||||||||||||
| % of Net sales |
10.4% | 9.6% | ||||||||||||||
| Income taxes |
$12,823 | $11,599 | $1,224 | 10.6% | ||||||||||||
| Effective tax rate |
32.6% | 31.8% | ||||||||||||||
| Net income |
$26,555 | $24,883 | $1,672 | 6.7% | ||||||||||||
| % of Net sales |
7.0% | 6.5% | ||||||||||||||
| Earnings per share |
$ 1.02 | $ 0.95 | $ 0.07 | 7.4% | ||||||||||||
The increase in net income in 2017 compared to 2016 was due primarily to improved gross margin partially offset by a non-cash pension settlement charge in 2017 of $2.7 million, net of income taxes, and non-cash impairment charges of $2.7 million, net of income taxes. Net income in 2016 included a non-cash impairment charge of $1.2 million, net of income taxes. The effective tax rate in 2017 included $0.4 million net impact of the Tax Act enacted on December 22, 2017.
Earnings per share for 2017 included non-cash impairment charges of $0.10 per share and a non-cash pension settlement charge of $0.10 per share. Earnings per share for 2016 included a non-cash impairment charge of $0.05 per share partially offset by a gain on the sale of property, plant and equipment of $0.02 per share.
Results of Operations – 2016 Compared to 2015:
In 2016, due primarily to the decreased demand for barge pumps for the marine transportation market driven by low oil prices and overcapacity of inland barges, the Bayou reporting unit recorded a pre-tax non-cash goodwill impairment charge of $1.8 million. There was no goodwill impairment charge recorded in 2015. See Note 8, Goodwill and Other Intangible Assets.
In 2015, due to increased employee retirements and related lump sum pension payments, the Company recorded a U.S. GAAP-required and actuarially-determined $3.8 million non-cash pension settlement charge. The value of lump sum pension payments was less in 2016 and a non-cash pension settlement charge was not required.
Net Sales
| Year Ended December 31, | ||||||||||||||||
| 2016 | 2015 | $ Change | % Change | |||||||||||||
| Net sales |
$ | 382,071 | $ | 406,150 | $ | (24,079) | (5.9)% | |||||||||
17
Table of Contents
Net sales for the year ended December 31, 2016 were $382.1 million compared to $406.2 million for 2015, a decrease of 5.9% or $24.1 million. Excluding sales from the PCCP project of $9.9 million in 2016 and $37.7 million in 2015, net sales in 2016 increased 1.0% or $3.7 million. Domestic sales, excluding PCCP, increased 3.9% or $9.0 million and international sales decreased 3.9% or $5.3 million. Of the total decrease in net sales in 2016, approximately $0.9 million was due to unfavorable foreign currency translation.
Sales in our larger water markets, excluding PCCP, increased 3.6% or $9.1 million in 2016 compared to 2015. Sales in the municipal market, excluding PCCP, increased $15.1 million driven by increased shipments attributable to other flood control projects, clean water and wastewater applications. Sales in the construction market increased $2.7 million due primarily to sales to rental businesses and sales to new customers. However, sales decreased $3.7 million in the fire protection market largely due to market softness domestically and in the Middle East, and $2.3 million in the agriculture market principally due to wet weather conditions in many domestic locations and decreased farm income. In addition, sales of repair parts decreased $2.8 million.
Sales decreased 4.6% or $5.4 million in non-water markets for 2016 compared to 2015. Increased sales of $3.2 million in the OEM market related to power generation equipment and services were offset by a decrease of $7.7 million in the industrial market largely attributable to the slowdown in oil and gas production.
International sales were $131.2 million in 2016 compared to $136.5 million in 2015. International sales represented 34% of total sales for the Company in each of the years 2016 and 2015. Sales continued to be somewhat softer in Europe and in the Middle East due to sluggish economic conditions primarily affecting the fire protection and OEM markets.
Cost of Products Sold and Gross Profit
| Year Ended December 31, | ||||||||||||||||
| 2016 | 2015 | $ Change | % Change | |||||||||||||
| Cost of products sold |
$ | 290,046 | $ | 313,570 | $ | (23,524) | (7.5)% | |||||||||
| % of Net sales |
75.9% | 77.2% | ||||||||||||||
| Gross margin |
24.1% | 22.8% | ||||||||||||||
The gross margin increase in 2016 compared to 2015 was due principally to favorable sales mix changes, most notably within the municipal market and lower LIFO inventory expense of 50 basis points. Also, a non-cash pension settlement charge of 60 basis points was recognized in 2015 which did not recur in 2016. Conversely, health care expenses increased 30 basis points in 2016 primarily due to higher claims.
Selling, General and Administrative Expenses (SG&A)
| Year Ended December 31, | ||||||||||||||||
| 2016 | 2015 | $ Change | % Change | |||||||||||||
| Selling, general and administrative expenses |
$ | 54,528 | $ | 56,189 | $ | (1,661) | (3.0)% | |||||||||
| % of Net sales |
14.3% | 13.8% | ||||||||||||||
The increase in SG&A expenses as a percentage of net sales in 2016 compared to 2015 was due principally to loss of leverage due to lower sales volume and increased professional services fees of approximately 30 basis points related largely to costs incurred in connection with acquired businesses during the previous two years. Offsetting these variances were a gain on the sale of property, plant and equipment in 2016 of 30 basis points and a non-cash pension settlement charge of 30 basis points in 2015 which did not recur in 2016.
18
Table of Contents
Operating Income
| Year Ended December 31, | ||||||||||||||||
| 2016 | 2015 | $ Change | % Change | |||||||||||||
| Operating income |
$ | 35,697 | $ | 36,391 | $ | (694) | (1.9)% | |||||||||
| % of Net sales |
9.3% | 9.0% | ||||||||||||||
The change in operating margin was impacted by the variances mentioned above, including a non-cash goodwill impairment charge in 2016 of 50 basis points and a non-cash pension settlement charge totaling 90 basis points in 2015 which did not recur in 2016.
Net Income
| Year Ended December 31, | ||||||||||||||||
| 2016 | 2015 | $ Change | % Change | |||||||||||||
| Income before income taxes |
$36,482 | $37,266 | $(784) | (2.1)% | ||||||||||||
| % of Net sales |
9.6% | 9.2% | ||||||||||||||
| Income taxes |
$11,599 | $12,157 | $(558) | (4.6)% | ||||||||||||
| Effective tax rate |
31.8% | 32.6% | ||||||||||||||
| Net income |
$24,883 | $25,109 | $(226) | (0.9)% | ||||||||||||
| % of Net sales |
6.5% | 6.2% | ||||||||||||||
| Earnings per share |
$ 0.95 | $ 0.96 | $(0.01) | (1.0)% | ||||||||||||
The decreases in net income and earnings per share in 2016 compared to 2015 were due primarily to sales volume decreases and a non-cash goodwill impairment charge in 2016 of $1.2 million, net of income taxes. These unfavorable variances were offset by a gain on the sale of property, plant and equipment, lower LIFO inventory expense and lower pension expense due to a pension settlement charge of $2.5 million, net of income taxes, in 2015 which did not recur in 2016. The decrease in the effective tax rate between the two periods was due primarily to changes in the estimated domestic production activities deduction and the impact of more income in jurisdictions with lower tax rates.
Liquidity and Sources of Capital
Cash and cash equivalents totaled $79.7 million and there was no outstanding bank debt at December 31, 2017. In addition, the Company had $21.8 million available in bank lines of credit after deducting $9.2 million in outstanding letters of credit primarily related to customer orders. The Company was in compliance with its debt covenants, including limits on additional borrowings and maintenance of certain operating and financial ratios, at all times in 2017 and 2016.
Capital expenditures for 2018, which are expected to consist principally of building expansion and machinery and equipment purchases, are estimated to be in the range of $10-$15 million and are expected to be financed through internally generated funds and existing lines of credit. During 2017, 2016 and 2015, the Company financed its capital improvements and working capital requirements principally through internally generated funds.
Free cash flow, a non-GAAP measure for reporting cash flow, is defined by the Company as adjusted earnings before interest, income taxes and depreciation and amortization, less capital expenditures and dividends. The Company believes free cash flow provides investors with an important perspective on cash available for investments, acquisitions and working capital requirements.
19
Table of Contents
The following table reconciles adjusted earnings before interest, income taxes and depreciation and amortization as reconciled above to free cash flow:
| 2017 | 2016 | 2015 | ||||||||||
| Non-GAAP adjusted earnings before interest, taxes, depreciation and amortization | $ 62,577 | $ 53,831 | $ 56,453 | |||||||||
| Less capital expenditures |
(7,754) | (6,877) | (8,260) | |||||||||
| Less cash dividends |
(12,268) | (11,218) | (10,599) | |||||||||
|
|
|
|
|
|
|
|||||||
| Non-GAAP free cash flow |
$ 42,555 | $ 35,736 | $ 37,594 | |||||||||
|
|
|
|
|
|
|
|||||||
Financial Cash Flow
| Year Ended December 31, | ||||||||||||
| 2017 | 2016 | 2015 | ||||||||||
| Beginning of period cash and cash equivalents |
$ 57,604 | $ 23,724 | $ 24,491 | |||||||||
| Net cash provided by operating activities |
43,265 | 53,434 | 40,683 | |||||||||
| Net cash used for investing activities |
(10,410) | (8,466) | (11,180) | |||||||||
| Net cash used for financing activities |
(12,268) | (11,218) | (29,090) | |||||||||
| Effect of exchange rate changes on cash |
1,489 | 130 | (1,180) | |||||||||
|
|
|
|
|
|
|
|||||||
| Net increase (decrease) in cash and cash equivalents | 22,076 | 33,880 | (767) | |||||||||
|
|
|
|
|
|
|
|||||||
| End of period cash and cash equivalents |
$ 79,680 | $ 57,604 | $ 23,724 | |||||||||
|
|
|
|
|
|
|
|||||||
The change in cash provided by operating activities in 2017 compared to 2016 was primarily due to a decrease in accounts receivable, more than offset by increased inventories and decreased commissions payable and benefit obligations. The change in cash provided by operating activities in 2016 compared to 2015 was primarily due to reductions in inventories and accounts receivable driven by lower sales volume, partially offset by contributions to the Company’s defined benefit pension plan.
During 2017, investing activities of $10.4 million primarily consisted of a $3.0 million increase in short-term investments and $7.8 million of capital expenditures for machinery and equipment offset by $0.3 million of proceeds from the sale of property, plant and equipment. During 2016, investing activities of $8.5 million primarily consisted of capital expenditures for machinery and equipment, a new operations facility in Africa, and other building improvements totaling $6.9 million as well as a payment for an acquisition, net of cash acquired, of $3.0 million, offset by proceeds from the sale of property, plant, and equipment of $1.4 million. During 2015, investing activities of $11.2 million primarily consisted of capital expenditures for building, building improvements and machinery and equipment totaling $8.3 million as well as payments for acquisitions, net of cash acquired, of $3.4 million, offset by proceeds from the sale of property, plant, and equipment of $0.5 million.
Net cash used for financing activities consisted of dividend payments of $12.3 million, $11.2 million and $10.6 million during 2017, 2016 and 2015, respectively. During 2015, the Company also paid off its $12.0 million of short-term bank borrowings and $1.9 million of assumed acquisition debt and made a privately-arranged market value purchase of Company shares in the amount of $4.6 million from a Rupp family estate.
The Company currently expects to continue its exceptional history of paying regular quarterly dividends and increased annual dividends. However, any future dividends will be reviewed individually and declared by our Board of Directors at its discretion, dependent on our assessment of the Company’s financial condition and business outlook at the applicable time.
20
Table of Contents
Contractual Obligations
Capital commitments in the table below include contractual commitments to purchase machinery and equipment that have been approved by the Board of Directors. The capital commitments do not represent the entire anticipated purchases in the future, but represent only those substantive items for which the Company is contractually obligated as of December 31, 2017. Also, the Company has some operating leases for certain offices, manufacturing facilities, land, office equipment and automobiles. Rental expenses relating to these leases were $0.9 million in 2017, $1.1 million in 2016 and $1.0 million in 2015.
The following table summarizes the Company’s contractual obligations at December 31, 2017:
| Payment Due By Period | ||||||||||||||||||||
| Total | Less than 1 Year |
1-3 Years |
3-5 Years |
More than 5 Years |
||||||||||||||||
| Capital commitments |
$2,070 | $2,070 | $ - | $ - | $ - | |||||||||||||||
| Operating leases |
1,557 | 825 | 677 | 46 | 9 | |||||||||||||||
|
|
|
|
|
|
|
|
|
|
|
|||||||||||
| Total |
$3,627 | $2,895 | $677 | $46 | $ 9 | |||||||||||||||
|
|
|
|
|
|
|
|
|
|
|
|||||||||||
Critical Accounting Policies
The accompanying consolidated financial statements have been prepared in conformity with accounting principles generally accepted in the United States. When more than one accounting principle, or the method of its application, is generally accepted, management selects the principle or method that is appropriate in the Company’s specific circumstances. Application of these accounting principles requires management to make estimates about the future resolution of existing uncertainties; as a result, actual results could differ from these estimates.
In preparing these consolidated financial statements, management has made its best estimates and judgments of the amounts and disclosures included in the consolidated financial statements, giving due regard to materiality. The Company does not believe there is a great likelihood that materially different amounts would be reported under different conditions or using different assumptions pertaining to the accounting policies described below.
Revenue Recognition
Substantially all of the Company’s revenues from product sales are recognized when all of the following criteria are met: persuasive evidence of a sale arrangement exists, the price is fixed or determinable, product delivery has occurred or services have been rendered, there are no further obligations to customers and collectability is probable. Product delivery occurs when the risks and rewards of ownership and title pass, which usually occurs upon shipment to the customer.
The Company adopted, effective January 1, 2018, the new revenue guidance in ASU 2014-09 pursuant to the modified retrospective method. Any adjustment to the opening balance of retained earnings is not expected to be material. See Note 1 to the Consolidated Financial Statements, Summary of Significant Accounting Policies.
Allowance for Doubtful Accounts
The Company evaluates the collectability of its accounts receivable based on a combination of factors. In circumstances where the Company is aware of a specific customer’s inability to meet its financial obligations to the Company (e.g., bankruptcy filings, substantial downgrading of credit scores), the Company records a specific allowance for bad debts against amounts due to reduce the net recognized receivable to the amount the Company reasonably believes will be collected. For all other customers, the Company recognizes allowances for bad debts
21
Table of Contents
based on the length of time the receivables are past due. If circumstances change (e.g., an unexpected material adverse change in a large customer’s ability to meet its financial obligations), the Company’s estimates of the recoverability of amounts due could be reduced by a material amount. Historically, the Company’s collection history has been good.
Inventories and Related Allowance
Inventories are valued at the lower of cost or market value and have been reduced by an allowance for excess and obsolete inventories. The estimated allowance is based on a variety of factors, including historical inventory usage and management evaluations. Historically, the Company has not experienced substantive write-offs due to obsolescence. The Company uses the last-in, first-out (LIFO) method for the majority of its inventories.
Product Warranties
A liability is established for estimated future warranty and service claims based on historical claims experience and specific product failures.
Pension Plan and Other Postretirement Benefit Plans
The Company recognizes the obligations associated with its defined benefit pension plan and defined benefit health care plans in its consolidated financial statements. The measurement of liabilities related to its pension plan and other postretirement benefit plans is based on management’s assumptions related to future events including interest rates, return on pension plan assets, rate of compensation increases and health care cost trend rates. Actual pension plan asset performance will either reduce or increase pension losses included in accumulated other comprehensive loss, which ultimately affects net income. The discount rates used to determine the present value of future benefits are based on estimated yields of investment grade fixed income investments.
The discount rates used to value pension plan obligations were 3.27% and 3.60% at December 31, 2017 and 2016, respectively. The discount rates used to value postretirement obligations were 3.39% and 3.77% at December 31, 2017 and 2016, respectively. The discount rates were determined by constructing a zero-coupon spot yield curve derived from a universe of high-quality bonds as of the measurement date. The expected rate of return on pension assets is designed to be a long- term assumption that will be subject to year-to-year variability. The rate for 2017 and 2016 was 6.00%. Actual pension plan asset performance will either reduce or increase unamortized losses included in accumulated other comprehensive loss, which will ultimately affect net income. The assumed rate of compensation increase was 3.50% in 2017 and 2016.
Substantially all retirees elect to take lump sum settlements of their pension plan benefits. When interest rates are low as they have been the last five years, this subjects the Company to the risk of exceeding an actuarial threshold computed on an annual basis and triggering a GAAP-required non-cash pension settlement loss, which occurred in 2017 and 2015.
The assumption used for the rate of increase in medical costs over the next five years was unchanged in 2017 from 2016. A one percentage point increase in the assumed health care trend would increase postretirement expense by approximately $271,000, changing the benefit obligation by approximately $1.6 million; while a one percentage point decrease in the assumed health care trend would decrease postretirement expense by approximately $233,000, changing the benefit obligation by approximately $1.4 million.
Income Taxes
The basic principles related to accounting for income taxes are to recognize the amount of taxes payable or refundable for the current year and deferred tax liabilities and assets for the future tax consequences of events that have been recognized in an entity’s financial statements or tax returns.
22
Table of Contents
Realization of the Company’s deferred tax assets is principally dependent upon the Company’s achievement of projected future taxable income, which management believes will be sufficient to fully utilize the deferred tax assets recorded, with the exception of deferred tax associated with certain state tax credits for which a valuation allowance has been recognized.
On December 22, 2017, the U.S. Tax Cuts and Jobs Act (the “Tax Act”) was enacted. The Tax Act reduces the federal corporate tax rate on U.S. earnings to 21% and moves from a global taxation regime to a modified territorial regime. As part of the Tax Act, U.S. companies are required to pay a tax on historical earnings generated offshore that have not been repatriated to the U.S. Companies are required to re-measure their deferred tax assets and liabilities to reflect the lower federal base rate of 21%. The Company recorded provisional estimates based on its initial analysis of the Tax Act. Given the significant complexity of the Tax Act, anticipated guidance from the U. S. Treasury about implementing the Tax Act, and the potential for additional guidance from the Securities and Exchange Commission or the Financial Accounting Standards Board related to the Tax Act, these estimates may be adjusted during 2018.
Goodwill and Other Intangibles
The Company accounts for goodwill in a purchase business combination as the excess of the cost over the fair value of net assets acquired. Business combinations can also result in other intangible assets being recognized. Amortization of intangible assets, if applicable, occurs over their estimated useful lives.
Goodwill is tested annually for impairment as of October 1, or whenever events or changes in circumstances indicate there may be a possible permanent loss of value in accordance with ASC 350, Intangibles - Goodwill and Other.
Goodwill is tested for impairment at the reporting unit level and is based on the net assets for each reporting unit, including goodwill and intangible assets. The Company has the option to first assess qualitative factors to determine whether the existence of events or circumstances leads to a determination that it is more likely than not that the fair value of a reporting unit is less than its carrying amount. If, after assessing the totality of events or circumstances, an entity determines it is not more likely than not that the fair value of a reporting unit is less than its carrying amount, then performing a quantitative impairment assessment is unnecessary.
In assessing the qualitative factors to determine whether it is more likely than not that the fair value of a reporting unit is less than its carrying amount, we identify and assess relevant drivers of fair value and events and circumstances that may impact the fair value and the carrying amount of the reporting unit. The identification of relevant events and circumstances and how these may impact a reporting unit’s fair value or carrying amount involve significant judgments and assumptions. The judgments and assumptions include the identification of macroeconomic conditions, industry and market considerations, cost factors, overall financial performance, Company-specific events and share price trends and making the assessment on whether each relevant factor will impact the impairment test positively or negatively and the magnitude of any such impact.
When performing a quantitative assessment of goodwill impairment if necessary, or in years where we elect to do so, a discounted cash flow model is used to estimate the fair value of each reporting unit, which considers forecasted cash flows discounted at an estimated weighted-average cost of capital. The forecasted cash flows are based on the Company’s long-term operating plan and the weighted-average cost of capital is an estimate of the overall after-tax rate of return. Other valuation techniques including comparative market multiples are used when appropriate. Discount rate assumptions are based on an assessment of the risk inherent in the future cash flows of the respective reporting units.
Based upon our fiscal 2017 and 2016 quantitative and qualitative impairment analyses, except for the Bayou reporting unit, the Company concluded that it is more likely than not that the fair value of our reporting units continues to exceed the respective carrying amounts. In 2017 and 2016, due primarily to the decreased demand
23
Table of Contents
for barge pumps for the marine transportation market driven by low oil prices and overcapacity of inland barges, the Bayou reporting unit recorded pre-tax non-cash goodwill impairment charges of $0.9 million and $1.8 million, respectively.
The Company’s annual impairment analysis performed as of October 1, 2017 concluded that National Pump Company’s (“National”) fair value exceeded its carrying value by approximately 7%. A sensitivity analysis was performed for the National reporting unit, assuming a hypothetical 50 basis point decrease in the expected long-term growth rate or a hypothetical 50 basis point increase in the weighted average cost of capital, and both scenarios independently yielded an estimated fair value for the National reporting unit slightly above carrying value. If recently depressed U.S. agricultural conditions continue for an extended time, this market’s related growth and profitability assumptions may reduce National’s indicated fair value to require a potential future impairment charge. Goodwill relating to the National reporting unit represents 3% of the Company’s December 31, 2017 total assets. See Note 8, to the Consolidated Financial Statements, Goodwill and Other Intangible Assets.
Other indefinite-lived intangible assets primarily consist of trademarks and trade names. The fair value of these assets is also tested annually for impairment as of October 1, or whenever events or changes in circumstances indicate there may be a possible permanent loss of value. The fair value of these assets is determined using a royalty relief methodology similar to that employed when the associated assets were acquired, but using updated estimates of future sales, cash flows and profitability. For 2017 and 2016 the fair value of all indefinite lived intangible assets exceeded the respective carrying values.
Finite-lived assets are reviewed for impairment whenever events or changes in circumstances indicate the carrying amount may not be recovered through future net cash flows generated by the assets. Recoverability of assets to be held and used is measured by a comparison of the carrying amount of the assets to future net undiscounted cash flows estimated to be generated by such assets. Based upon our fiscal 2017 and 2016 quantitative and qualitative impairment analyses, except for an impairment of a customer relationship intangible asset in the Bayou reporting unit, the Company was not aware of any events or changes in circumstances that indicate the carrying value of its finite-lived assets may not be recoverable. In 2017, due primarily to the continued decreased demand for barge pumps for the marine transportation market driven by low oil prices and overcapacity of inland barges, Bayou recorded a pre-tax non-cash customer relationship impairment charge of $3.2 million. See Note 8, to the Consolidated Financial Statements, Goodwill and Other Intangible Assets.
Other Matters
Certain transactions with related parties are in the ordinary course of business and are not material to the Company’s consolidated financial position, net income or cash flows.
The Company does not have any off-balance sheet arrangements, financings or other relationships with unconsolidated “special purpose entities.”
The Company is not a party to any long-term debt agreements, or any material capital leases or purchase obligations.
| ITEM 7A. | QUANTITATIVE AND QUALITATIVE DISCLOSURES ABOUT MARKET RISK |
The Company is subject to market risk associated principally with changes in foreign currency exchange rates. The Company’s foreign currency exchange rate risk is limited primarily to the Euro, Canadian Dollar, South African Rand and the British Pound. The Company manages its foreign exchange risk principally through invoicing customers in the same currency as the source of products. The foreign currency transaction gains (losses) for the period ending December 31, 2017, 2016 and 2015 were $850,000, $498,000, and $40,000, respectively, and are reported within Other income and Other expense on the Consolidated Statements of Income.
24
Table of Contents
| ITEM 8. | FINANCIAL STATEMENTS AND SUPPLEMENTARY DATA |
Report of Independent Registered Public Accounting Firm
To the Shareholders and the Board of Directors of The Gorman-Rupp Company
Opinion on the Financial Statements
We have audited the accompanying consolidated balance sheets of The Gorman-Rupp Company (the Company) as of December 31, 2017 and 2016, and the related consolidated statements of income, comprehensive income, equity and cash flows for each of the three years in the period ended December 31, 2017, and the related notes (collectively referred to as the “consolidated financial statements”). In our opinion, the consolidated financial statements present fairly, in all material respects, the financial position of the Company at December 31, 2017 and 2016, and the results of its operations and its cash flows for each of the three years in the period ended December 31, 2017, in conformity with U.S. generally accepted accounting principles.
We also have audited, in accordance with the standards of the Public Company Accounting Oversight Board (United States) (PCAOB), the Company’s internal control over financial reporting as of December 31, 2017, based on criteria established in Internal Control–Integrated Framework issued by the Committee of Sponsoring Organizations of the Treadway Commission (2013 framework), and our report dated February 23, 2018 expressed an unqualified opinion thereon.
Basis for Opinion
These financial statements are the responsibility of the Company’s management. Our responsibility is to express an opinion on the Company’s financial statements based on our audits. We are a public accounting firm registered with the PCAOB and are required to be independent with respect to the Company in accordance with the U.S. federal securities laws and the applicable rules and regulations of the Securities and Exchange Commission and the PCAOB.
We conducted our audits in accordance with the standards of the PCAOB. Those standards require that we plan and perform the audit to obtain reasonable assurance about whether the financial statements are free of material misstatement, whether due to error or fraud. Our audits included performing procedures to assess the risks of material misstatement of the financial statements, whether due to error or fraud, and performing procedures that respond to those risks. Such procedures included examining, on a test basis, evidence regarding the amounts and disclosures in the financial statements. Our audits also included evaluating the accounting principles used and significant estimates made by management, as well as evaluating the overall presentation of the financial statements. We believe that our audits provide a reasonable basis for our opinion.
/s/ Ernst & Young LLP
We have served as the Company’s auditor since at least 1967, but we are unable to determine the specific year.
Cleveland, Ohio
February 23, 2018
25
Table of Contents
The Gorman-Rupp Company
Consolidated Statements of Income
| Year ended December 31, | ||||||||||||
| (Thousands of dollars, except shares and per share amounts) | 2017 | 2016 | 2015 | |||||||||
| Net sales |
$379,389 | $382,071 | $406,150 | |||||||||
| Cost of products sold |
280,644 | 290,046 | 313,570 | |||||||||
|
|
|
|
|
|
|
|||||||
| Gross profit |
98,745 | 92,025 | 92,580 | |||||||||
| Selling, general and administrative expenses |
56,789 | 54,528 | 56,189 | |||||||||
| Impairment of goodwill and other intangible assets |
4,098 | 1,800 | - | |||||||||
|
|
|
|
|
|
|
|||||||
| Operating income |
37,858 | 35,697 | 36,391 | |||||||||
| Other income, net |
1,520 | 785 | 875 | |||||||||
|
|
|
|
|
|
|
|||||||
| Income before income taxes |
39,378 | 36,482 | 37,266 | |||||||||
| Income taxes |
12,823 | 11,599 | 12,157 | |||||||||
|
|
|
|
|
|
|
|||||||
| Net income |
$ 26,555 | $ 24,883 | $ 25,109 | |||||||||
|
|
|
|
|
|
|
|||||||
| Earnings per share |
$ 1.02 | $ 0.95 | $ 0.96 | |||||||||
|
|
|
|
|
|
|
|||||||
| Average number of shares outstanding |
26,100,865 | 26,087,721 | 26,192,072 | |||||||||
See notes to consolidated financial statements.
Consolidated Statements of Comprehensive Income
| Year Ended December 31, | ||||||||||||
| (Thousands of dollars) | 2017 | 2016 | 2015 | |||||||||
| Net income |
$26,555 | $24,883 | $25,109 | |||||||||
| Cumulative translation adjustments |
3,521 | 215 | (4,719) | |||||||||
| Pension and postretirement medical liability adjustments, net of tax |
4,435 | 1,735 | (370) | |||||||||
|
|
|
|
|
|
|
|||||||
| Other comprehensive income (loss) |
7,956 | 1,950 | (5,089) | |||||||||
|
|
|
|
|
|
|
|||||||
| Comprehensive income |
$34,511 | $26,833 | $20,020 | |||||||||
|
|
|
|
|
|
|
|||||||
See notes to consolidated financial statements.
26
Table of Contents
The Gorman-Rupp Company
Consolidated Balance Sheets
| December 31, | ||||||||
| (Thousands of dollars) | 2017 | 2016 | ||||||
| Assets |
||||||||
| Current assets: |
||||||||
| Cash and cash equivalents |
$ | 79,680 | $ | 57,604 | ||||
| Accounts receivable, net |
67,369 | 71,424 | ||||||
| Inventories, net |
74,967 | 69,049 | ||||||
| Prepaid and other |
5,918 | 5,823 | ||||||
|
|
|
|
|
|||||
| Total current assets |
227,934 | 203,900 | ||||||
| Property, plant and equipment, net |
117,071 | 122,067 | ||||||
| Other assets |
7,779 | 7,769 | ||||||
| Prepaid pension assets |
4,313 | 6,211 | ||||||
| Goodwill and other intangible assets, net |
37,918 | 42,871 | ||||||
|
|
|
|
|
|||||
| Total assets |
$ | 395,015 | $ | 382,818 | ||||
|
|
|
|
|
|||||
| Liabilities and equity |
||||||||
| Current liabilities: |
||||||||
| Accounts payable |
$ | 15,798 | $ | 16,306 | ||||
| Payroll and employee related liabilities |
12,027 | 11,336 | ||||||
| Commissions payable |
7,589 | 11,163 | ||||||
| Deferred revenue |
460 | 1,361 | ||||||
| Accrued expenses |
9,822 | 9,186 | ||||||
|
|
|
|
|
|||||
| Total current liabilities |
45,696 | 49,352 | ||||||
| Postretirement benefits |
15,737 | 20,709 | ||||||
| Other long-term liabilities |
8,087 | 9,869 | ||||||
|
|
|
|
|
|||||
| Total liabilities |
69,520 | 79,930 | ||||||
| Equity: |
||||||||
| Common shares, without par value: |
||||||||
| Authorized – 35,000,000 shares; |
||||||||
| Outstanding – 26,106,623 shares at December 31, 2017 and 26,093,123 shares at December 31, 2016 (after deducting treasury shares of 942,173 and 955,673, respectively), at stated capital amounts |
5,100 | 5,097 | ||||||
| Additional paid-in capital |
526 | 215 | ||||||
| Retained earnings |
332,378 | 318,041 | ||||||
| Accumulated other comprehensive loss |
(12,509) | (20,465) | ||||||
|
|
|
|
|
|||||
| Total equity |
325,495 | 302,888 | ||||||
|
|
|
|
|
|||||
| Total liabilities and equity |
$ | 395,015 | $ | 382,818 | ||||
|
|
|
|
|
|||||
See notes to consolidated financial statements.
27
Table of Contents
The Gorman-Rupp Company
Consolidated Statements of Cash Flows
| Year Ended December 31, | ||||||||||||
| (thousands of dollars) | 2017 | 2016 | 2015 | |||||||||
| Cash flows from operating activities: |
||||||||||||
| Net income |
$ | 26,555 | $ | 24,883 | $ | 25,109 | ||||||
| Adjustments to reconcile net income to net cash provided by operating activities: |
||||||||||||
| Depreciation and amortization |
15,053 | 15,529 | 15,282 | |||||||||
| Pension expense |
6,368 | 3,431 | 7,657 | |||||||||
| Contributions to pension plan |
(2,000) | (16,000) | (4,000) | |||||||||
| Deferred income tax (benefit) charge |
(6,140) | 3,511 | (563) | |||||||||
| Gain on sale of property, plant and equipment |
153 | (607) | (88) | |||||||||
| Impairment of goodwill and other intangible assets |
4,098 | 1,800 | - | |||||||||
| Changes in operating assets and liabilities, net of effects of acquisitions: |
||||||||||||
| Accounts receivable, net |
5,473 | 5,273 | (4,750) | |||||||||
| Inventories, net |
(4,305) | 13,904 | 12,576 | |||||||||
| Accounts payable |
(1,268) | 1,393 | (4,123) | |||||||||
| Commissions payable |
(3,849) | 3,300 | (1,498) | |||||||||
| Deferred revenue |
(902) | (380) | (2,425) | |||||||||
| Accrued expenses and other |
3,958 | (7,996) | (2,436) | |||||||||
| Income taxes |
7,950 | 64 | 815 | |||||||||
| Benefit obligations |
(7,879) | 5,329 | (873) | |||||||||
|
|
|
|
|
|
|
|||||||
| Net cash provided by operating activities |
43,265 | 53,434 | 40,683 | |||||||||
| Cash flows from investing activities: |
||||||||||||
| Capital additions |
(7,754) | (6,877) | (8,260) | |||||||||
| Proceeds from sale of property, plant and equipment |
320 | 1,379 | 466 | |||||||||
| Purchase of short-term investments, net |
(2,976) | - | - | |||||||||
| Payments for acquisitions, net of cash acquired |
- | (2,968) | (3,386) | |||||||||
|
|
|
|
|
|
|
|||||||
| Net cash used for investing activities |
(10,410) | (8,466) | (11,180) | |||||||||
| Cash flows from financing activities: |
||||||||||||
| Cash dividends |
(12,268) | (11,218) | (10,599) | |||||||||
| Treasury shares repurchased |
- | - | (4,579) | |||||||||
| Proceeds from bank borrowings |
- | - | - | |||||||||
| Payments to banks for borrowings |
- | - | (13,912) | |||||||||
|
|
|
|
|
|
|
|||||||
| Net cash used for financing activities |
(12,268) | (11,218) | (29,090) | |||||||||
| Effect of exchange rate changes on cash |
1,489 | 130 | (1,180) | |||||||||
|
|
|
|
|
|
|
|||||||
| Net increase (decrease) in cash and cash equivalents |
22,076 | 33,880 | (767) | |||||||||
| Cash and cash equivalents: |
||||||||||||
| Beginning of year |
57,604 | 23,724 | 24,491 | |||||||||
|
|
|
|
|
|
|
|||||||
| End of period |
$ | 79,680 | $ | 57,604 | $ | 23,724 | ||||||
|
|
|
|
|
|
|
|||||||
See notes to consolidated financial statements.
28
Table of Contents
The Gorman-Rupp Company
Consolidated Statements of Equity
| (Thousands of dollars, except share and per share amounts) |
Common Shares
|
Additional Paid-In Capital |
Retained Earnings |
Accumulated Other Comprehensive (Loss) Income |
Total | |||||||||||||||||||
| Shares | Dollars | |||||||||||||||||||||||
| Balances December 31, 2014 |
26,260,543 | $ | 5,133 | $ | 3,059 | $ | 291,101 | $ | (17,326) | $ | 281,967 | |||||||||||||
| Net income |
25,109 | 25,109 | ||||||||||||||||||||||
| Other comprehensive loss |
(5,089) | (5,089) | ||||||||||||||||||||||
| Issuance of treasury shares |
7,500 | 2 | 184 | 26 | 212 | |||||||||||||||||||
| Treasury shares repurchased | (184,420) | (40) | (3,243) | (1,296) | (4,579) | |||||||||||||||||||
| Cash dividends – $0.405 per share | (10,599) | (10,599) | ||||||||||||||||||||||
|
|
|
|
|
|
|
|
|
|
|
|
|
|||||||||||||
| Balances December 31, 2015 | 26,083,623 | 5,095 | - | 304,341 | (22,415) | 287,021 | ||||||||||||||||||
| Net income |
24,883 | 24,883 | ||||||||||||||||||||||
| Other comprehensive income |
1,950 | 1,950 | ||||||||||||||||||||||
| Issuance of treasury shares |
9,500 | 2 | 215 | 35 | 252 | |||||||||||||||||||
| Cash dividends – $0.430 per share | (11,218) | (11,218) | ||||||||||||||||||||||
|
|
|
|
|
|
|
|
|
|
|
|
|
|||||||||||||
| Balances December 31, 2016 |
26,093,123 | 5,097 | 215 | 318,041 | (20,465) | 302,888 | ||||||||||||||||||
| Net income |
26,555 | 26,555 | ||||||||||||||||||||||
| Other comprehensive income |
7,956 | 7,956 | ||||||||||||||||||||||
| Issuance of treasury shares |
13,500 | 3 | 311 | 50 | 364 | |||||||||||||||||||
| Cash dividends – $0.470 per share | (12,268) | (12,268) | ||||||||||||||||||||||
|
|
|
|
|
|
|
|
|
|
|
|
|
|||||||||||||
| Balances December 31, 2017 |
26,106,623 | $ | 5,100 | $ | 526 | $ | 332,378 | $ | (12,509) | $ | 325,495 | |||||||||||||
|
|
|
|
|
|
|
|
|
|
|
|
|
|||||||||||||
See notes to consolidated financial statements.
29
Table of Contents
The Gorman-Rupp Company
Notes to Consolidated Financial Statements
(Amounts in tables in thousands of dollars)
Note 1 – Summary of Significant Accounting Policies
General Information and Basis of Presentation
The Gorman-Rupp Company is a leading designer, manufacturer and international marketer of pumps and pump systems for use in diverse water, wastewater, construction, dewatering, industrial, petroleum, original equipment, agriculture, fire protection, heating, ventilating and air conditioning (HVAC), military and other liquid-handling applications.
The consolidated financial statements have been prepared in accordance with U.S. generally accepted accounting principles and include the accounts of the Company and its wholly-owned subsidiaries. All significant intercompany transactions and balances have been eliminated. Earnings per share are calculated based on the weighted-average number of Common Shares outstanding.
Cash Equivalents and Short-Term Investments
The Company considers highly liquid instruments with maturities of 90 days or less to be cash equivalents. The Company periodically makes short-term investments for which cost approximates fair value. Short-term investments at December 31, 2017 and 2016 consist primarily of certificates of deposit and treasury bonds and are classified as prepaid and other on the Consolidated Balance Sheets.
Accounts Receivable and Allowance for Doubtful Accounts
Accounts receivable are stated at the historical carrying amount net of allowance for doubtful accounts. The Company maintains an allowance for doubtful accounts for estimated losses from the failure of its customers to make required payments for products delivered. The Company estimates this allowance based on knowledge of the financial condition of customers, review of historical receivables and reserve trends and other relevant information.
Inventories
Inventories are stated at the lower of cost or market. The costs for approximately 72% of inventories at December 31, 2017 and December 31, 2016 were determined using the last-in, first-out (LIFO) method, with the remainder determined using the first-in, first-out (FIFO) method. Cost components include materials, inbound freight costs, labor and allocations of fixed and variable overheads on an absorption costing basis.
Property, plant and equipment
Property, plant and equipment are stated on the basis of cost. Repairs and maintenance costs are expensed as incurred. Depreciation for property, plant and equipment assets is computed using the straight-line method over the estimated useful lives of the assets and is included in cost of products sold and selling, general and administrative expenses based on the use of the assets. Depreciation expense was $13.5 million for 2017 and $13.8 million for each of the years 2016 and 2015.
Depreciation of property, plant and equipment is determined based on the following lives:
| Buildings |
20-50 years | |||
| Machinery and equipment |
5-15 years | |||
| Software |
3-5 years |
30
Table of Contents
Property, plant and equipment consist of the following:
| 2017 | 2016 | |||||||
| Land |
$ | 4,187 | $ | 4,099 | ||||
| Buildings |
106,437 | 104,952 | ||||||
| Machinery and equipment |
170,615 | 165,157 | ||||||
|
|
|
|
|
|||||
| 281,239 | 274,208 | |||||||
| Less accumulated depreciation |
(164,168) | (152,141) | ||||||
|
|
|
|
|
|||||
| Property, plant and equipment, net |
$ | 117,071 | $ | 122,067 | ||||
|
|
|
|
|
|||||
Property, plant and equipment are evaluated for impairment whenever events or changes in circumstances indicate the carrying amount may not be recovered through future net cash flows generated by the assets. Impairment losses may be recorded when the undiscounted cash flows estimated to be generated by those assets are less than the assets’ carrying amounts based on the excess of the carrying amounts over the estimated fair value of the assets.
Goodwill and Identifiable Intangible Assets
Goodwill
Goodwill represents the excess of the cost of acquired businesses over the fair value of tangible assets and identifiable intangible assets purchased and liabilities assumed.
Goodwill is reviewed annually for impairment as of October 1 or whenever events or changes in circumstances indicate there may be a possible permanent loss of value using either a quantitative or qualitative analysis. The Company uses a market-based approach to estimate the fair value of our reporting units and performs a quantitative analysis using a discounted cash flow model and other valuation techniques. This process requires significant judgements, including estimation of future cash flows, which is dependent on internal forecasts. The Company may otherwise elect to perform a qualitative analysis when deemed appropriate. A qualitative analysis may be performed by assessing certain trends and factors, including projected market outlook and growth rates, forecasted and actual sales and operating profit margins, discount rates, industry data and other relevant qualitative factors. These trends and factors are compared to, and based on, the assumptions used in the most recent quantitative assessment.
In 2017 and 2016, due primarily to the decreased demand for barge pumps for the marine transportation market driven by low oil prices and overcapacity of inland barges, the Bayou City Pump Company reporting unit recorded pre-tax goodwill impairment charges of $0.9 million and $1.8 million, respectively. There were no goodwill impairment charges in any of the Company’s other reporting units in 2017 or 2016 and no impairment charges were recognized across all reporting units in 2015. See Note 8, Goodwill and Other Intangible Assets.
Identifiable intangible assets
The Company’s primary identifiable intangible assets include customer relationships, technology and drawings, and trade names and trademarks. Identifiable intangible assets with finite lives are amortized and those identifiable intangible assets with indefinite lives are not amortized. Amortization for finite-lived intangible assets is computed using the straight-line method over the estimated useful lives of the assets and is included in cost of products sold and selling, general and administrative expenses based on the use of the assets. Amortization of finite-lived intangible assets is determined based on the following lives:
| Technology and drawings |
13-20 years | |||
| Customer relationships |
9-15 years | |||
| Other intangibles |
2-18 years |
31
Table of Contents
Identifiable intangible assets that are subject to amortization are evaluated for impairment whenever events or changes in circumstances indicate the carrying amount may not be recovered through future net cash flows generated by the assets. Impairment losses may be recorded when the undiscounted cash flows estimated to be generated by those assets are less than the assets’ carrying amounts based on the excess of the carrying amounts over the estimated fair value of the assets. Based upon our fiscal 2017 and 2016 quantitative and qualitative impairment analyses, except for Bayou’s customer relationship intangible asset and the risk related to National’s indicated fair value, the Company was not aware of any events or changes in circumstances that indicate the carrying value of its finite-lived intangible assets may not be recoverable. In 2017, due primarily to the continued decreased demand for barge pumps for the marine transportation market driven by low oil prices and overcapacity of inland barges, the Company performed a recoverability test related to Bayou’s customer relationship intangible asset pursuant to ASC 360. As a result of the recoverability test, Bayou recorded a pre-tax non-cash customer relationship impairment charge of $3.2 million.
Identifiable intangible assets not subject to amortization are tested for impairment annually or more frequently if events warrant. The fair value of these assets is determined using a royalty relief methodology similar to that employed when the associated assets were acquired, but using updated estimates of future sales, cash flows and profitability. For 2017 and 2016, the fair value of indefinite lived intangible assets exceeded their carrying value.
For additional information about goodwill and other intangible assets, see Note 8, Goodwill and Other Intangible Assets, and Note 10, Acquisitions.
Revenue Recognition
The Company’s revenues from product sales are recognized when all of the following criteria are met: persuasive evidence of a sale arrangement exists, the price is fixed or determinable, product delivery has occurred or services have been rendered, there are no further obligations to customers and collectability is probable. Product delivery occurs when the risks and rewards of ownership and title pass, which normally occurs upon shipment to the customer.
Income Taxes
Income tax expense includes United States, state, local and international income taxes. Deferred tax assets and liabilities are recognized for the tax consequences of temporary differences between the financial reporting and the tax basis of existing assets and liabilities and for loss carryforwards. The tax rate used to determine the deferred tax assets and liabilities is the enacted tax rate for the year and manner in which the differences are expected to reverse. Valuation allowances are recorded to reduce deferred tax assets to the amount that will more likely than not be realized.
On December 22, 2017, the U.S. Tax Cuts and Jobs Act (the “Tax Act”) was enacted. The Tax Act significantly revises U.S. corporate income tax regulations by, among other things, lowering corporate income tax rates, implementing the territorial tax system and imposing a repatriation tax on deemed repatriated earnings of foreign subsidiaries. For further discussion of the currently estimated impact of the Tax Act on the Company, see the disclosure under the heading Outlook within Item 7 of Part II of this Form 10-K and Note 6 to the Consolidated Financial Statements, Income Taxes.
Pension and Other Postretirement Benefits
The Company sponsors a defined benefit pension plan covering certain domestic employees. Additionally, the Company sponsors defined contribution pension plans made available to all domestic and Canadian employees.
32
Table of Contents
The Company also sponsors a non-contributory defined benefit postretirement health care plan that provides health benefits to certain domestic and Canadian retirees and their spouses. The Company funds the cost of these benefits as incurred.
The determination of the Company’s obligation and expense for pension and other postretirement benefits is dependent on its selection of certain assumptions used by actuaries in calculating such amounts, which are described in Note 7, Pensions and Other Postretirement Benefits. The Company recognizes the funded status of its defined benefit pension plan as an asset or liability in the Consolidated Balance Sheets and recognizes the change in the funded status in the year in which the change occurs through accumulated other comprehensive loss in the Consolidated Balance Sheets.
Concentration of Credit Risk
The Company generally does not require collateral from its customers and has a very good collection history. There were no sales to a single customer that exceeded 10% of total net sales for the years ended December 31, 2017, 2016 or 2015.
Shipping and Handling Costs
The Company classifies all amounts billed to customers for shipping and handling as revenue and reflects related shipping and handling costs in cost of products sold.
Advertising
The Company expenses all advertising costs as incurred, which for the years ended December 31, 2017, 2016 and 2015 totaled $3.1 million, $2.8 million, and $3.2 million, respectively.
Product Warranties
A liability is established for estimated future warranty and service claims based on historical claims experience and specific product failures. The Company expenses warranty costs directly to cost of products sold. Changes in the Company’s product warranty liability are:
| 2017 | 2016 | 2015 | ||||||||||
| Balance at beginning of year |
$ | 1,435 | $ | 1,380 | $ | 1,166 | ||||||
| Provision |
1,377 | 1,991 | 1,732 | |||||||||
| Claims |
(1,714) | (1,936) | (1,518) | |||||||||
|
|
|
|
|
|
|
|||||||
| Balance at end of year |
$ | 1,098 | $ | 1,435 | $ | 1,380 | ||||||
|
|
|
|
|
|
|
|||||||
Stock-based compensation
The Company grants performance-based shares pursuant to The Gorman-Rupp Company 2015 Omnibus Incentive Plan. Performance-based shares vest and are awarded at the end of a three year performance period, based on the levels of achievement of compound annual growth targets for operating income and shareholders’ equity. The Company recognizes compensation expense for performance-based share grants based on the stock price at the date of the grant using the straight-line amortization method, over the vesting period specified in the grants. The company recognized stock-based compensation expense of $0.4 million for the year ended December 31, 2017. No stock-based compensation expense was recorded for the years ended December 31, 2016 or 2015.
33
Table of Contents
Foreign Currency Translation
Assets and liabilities of the Company’s operations outside the United States which are accounted for in a functional currency other than U.S. dollars are translated into U.S. dollars using year-end exchange rates. Revenues and expenses are translated at weighted-average exchange rates effective during the year. Foreign currency translation gains and losses are included as a component of accumulated other comprehensive loss within equity.
Gains and losses resulting from foreign currency transactions, the amounts of which are not material, are included in other income and other expense.
Fair Value
The carrying value of cash and cash equivalents, accounts receivable, accounts payable and short-term debt approximates fair value based on the short-term nature of these instruments. The Company does not recognize any non-financial assets at fair value.
Use of Estimates
The preparation of financial statements in conformity with generally accepted accounting principles requires management to make estimates and assumptions that affect the amounts reported in the consolidated financial statements and accompanying notes. Actual results could differ from those estimates.
New Accounting Pronouncements
The Company considers the applicability and impact of all ASUs. ASUs not listed below were assessed and determined either to be not applicable or are expected to have minimal impact on the Company’s consolidated financial statements.
In March 2017, the FASB issued ASU No. 2017-07, “Compensation – Retirement Benefits (Topic 715) – Improving the Presentation of Net Periodic Pension Cost and Net Periodic Postretirement Benefit Cost,” which provides additional guidance on the presentation of net periodic pension and postretirement benefit costs in the income statement and on the components eligible for capitalization. The amendments in this ASU require that an employer report the service cost component of the net periodic benefit costs in the same income statement line item as other compensation costs arising from services rendered by employees during the period. The non-service-cost components of net periodic benefit costs are to be presented in the income statement separately from the service cost components and outside a subtotal of income from operations. The ASU also allows for the capitalization of the service cost components, when applicable (i.e., as a cost of internally manufactured inventory or a self-constructed asset). The ASU is effective for fiscal years, and interim periods within those years, beginning after December 15, 2017 and early adoption is permitted. The amendments in this ASU are to be applied retrospectively. The adoption of ASU 2017-07 will result in a change within operating income with a corresponding change in other income (expense), net to reflect the impact of presenting all components of net benefit cost, except for service cost, outside of operating income. See Note 6 for the components of the Company’s net benefit costs. The Company will adopt ASU 2017-07 in the first quarter of 2018 and does not expect the adoption to have a material impact on its consolidated financial statements.
In January 2017, the FASB issued ASU No. 2017-04, “Intangibles – Goodwill and Other (Topic 350) – Simplifying the Test for Goodwill Impairment,” which eliminates the requirement to calculate the implied fair value of goodwill to measure a goodwill impairment charge. Instead, entities will record an impairment charge based on the excess of a reporting unit’s carrying amount over its fair value. The ASU is effective for impairment tests performed in fiscal years, and interim periods within those years, beginning after December 15, 2019 and early adoption is permitted. The amendments in this ASU are to be applied on a prospective basis. The Company
34
Table of Contents
early adopted this new guidance during the three months ended September 30, 2017. The Company concluded that ASU 2017-04 is preferable to the current guidance due to efficiency, since ASU 2017-04 eliminates the requirement to determine the fair value of individual assets and liabilities of a reporting unit to measure goodwill impairment. See Note 8 – Impairment Charges for additional information on our interim goodwill and other intangible asset impairment tests performed.
In February 2016, the FASB issued ASU 2016-02, “Leases (Topic 842),” which requires lessees to recognize assets and liabilities on the balance sheet for the rights and obligations created by all leases with a term of more than one year. Accounting by lessors will remain similar to existing U.S. GAAP. The guidance is effective for fiscal years, and interim periods within those years, beginning after December 15, 2018 and early adoption is permitted. The Company currently does not expect the adoption of ASU 2016-02 will have a material impact on its consolidated financial statements as its future minimum lease commitments are not material.
In May 2014, the FASB issued ASU 2014-09, “Revenue from Contracts with Customers (Topic 606),” which supersedes most current revenue recognition guidance, including industry-specific guidance, and requires entities to recognize revenue in a way that depicts the transfer of promised goods or services to customers in an amount that reflects the consideration to which the entity expects to be entitled to in exchange for those goods or services. Subsequent accounting standards updates have been issued, which amend and/or clarify the application of ASU 2014-09. Based on the Company’s evaluation of its current revenue streams and contracts, it expects that most will be recorded consistently under both the current and new standard. The Company adopted the new revenue guidance effective January 1, 2018 pursuant to the modified retrospective method. Any adjustment to the opening balance of retained earnings is not expected to be material.
Note 2 – Allowance for Doubtful Accounts
The allowance for doubtful accounts was $0.7 million and $1.0 million at December 31, 2017 and 2016, respectively.
Note 3 – Inventories
Inventories are stated at the lower of cost or market. Replacement cost approximates current cost and the excess over LIFO cost is approximately $59.7 million and $58.4 million at December 31, 2017 and 2016, respectively. Some inventory quantities were reduced during 2017, resulting in liquidation of some LIFO quantities carried at lower costs from earlier years versus current year costs. The related effect increased net income by approximately $0.5 million. Allowances for excess and obsolete inventory totaled $4.9 million and $4.5 million at December 31, 2017 and 2016, respectively.
| 2017 | 2016 | |||||||
| Inventories, net | ||||||||
| Raw materials and in-process |
$17,528 | $17,986 | ||||||
| Finished parts |
48,247 | 43,423 | ||||||
| Finished products |
9,192 | 7,640 | ||||||
|
|
|
|
|
|||||
| Total net inventories |
$74,967 | $69,049 | ||||||
|
|
|
|
|
|||||
Note 4 – Financing Arrangements
The Company may borrow up to $20.0 million with interest at LIBOR plus 0.75% or at alternative rates as selected by the Company under an unsecured bank line of credit which matures in February 2020. The Company pays a non-usage fee of 0.1% per annum on the average unused portion of the line of credit. At December 31, 2017 and 2016, $18.3 million and $20.0 million, respectively, was available for borrowing after deducting $1.7 million and an immaterial amount in outstanding letters of credit, respectively.
35
Table of Contents
The Company also has an $8.0 million unsecured bank line of credit with interest at LIBOR plus 0.75% payable monthly which matures in May 2018. At December 31, 2017 and 2016, $2.7 million and $3.2 million, respectively, was available for borrowing after deducting $5.3 million and $4.8 million in outstanding letters of credit, respectively.
The Company also has a $3.0 million bank guarantee with interest at 1.75% in an agreement dated June 2016. At December 31, 2017 and 2016, $0.8 million and $0.6 million, respectively, was available for borrowing after deducting $2.2 million and $2.4 million in outstanding letters of credit, respectively.
The financing arrangements described above contain standard restrictive covenants, including limits on additional borrowings and maintenance of certain operating and financial ratios. At December 31, 2017 and 2016, the Company was in compliance with all requirements.
Interest expense, which approximates interest paid, was $17,000, $20,000 and $122,000 in 2017, 2016 and 2015, respectively.
The Company has operating leases for certain offices, manufacturing facilities, land, office equipment and automobiles. Rental expense relating to operating leases was $0.9 million, $1.1 million and $1.0 million in 2017, 2016 and 2015, respectively.
The future minimum lease payments due under these operating leases as of December 31, 2017 are:
| 2018 | 2019 | 2020 | 2021 | 2022 | Thereafter | Total | ||||||||||||||||
| $825 | $489 | $188 | $33 | $13 | $9 | $ | 1,557 | |||||||||||||||
|
|
|
|
|
|
|
|
|
|
|
|
|
|||||||||||
Note 5 – Accumulated Other Comprehensive Loss
The reclassifications out of accumulated other comprehensive loss as reported in the Consolidated Statements of Income are:
| 2017 | 2016 | 2015 | ||||||||||
| Pension and other postretirement benefits: |
||||||||||||
| Recognized actuarial loss (a) |
$ | 1,093 | $ | 1,402 | $ | 1,581 | ||||||
| Settlement loss (b) |
2,628 | - | 2,584 | |||||||||
| Settlement loss (c) |
1,403 | - | 1,199 | |||||||||
|
|
|
|
|
|
|
|||||||
| Total before income tax |
5,124 | 1,402 | 5,364 | |||||||||
| Income tax |
(1,670) | (446) | (1,749) | |||||||||
|
|
|
|
|
|
|
|||||||
| Net of income tax |
$ | 3,454 | $ | 956 | $ | 3,615 | ||||||
|
|
|
|
|
|
|
| (a) | The recognized actuarial loss is included in the computation of net periodic benefit cost. See Note 7, Pensions and Other Postretirement Benefits. |
| (b) | This portion of the settlement loss is included in cost of products sold in the Consolidated Statements of Income. |
| (c) | This portion of the settlement loss is included in selling, general and administrative expenses in the Consolidated Statements of Income. |
36
Table of Contents
The components of accumulated other comprehensive loss as reported in the Consolidated Balance Sheets are:
| Currency Translation Adjustments |
Pension and OPEB Adjustments |
Accumulated Other Comprehensive (Loss) Income |
||||||||||
| Balance at December 31, 2014 |
$(4,338) | $(12,988) | $(17,326) | |||||||||
| Reclassification adjustments |
- | 5,364 | 5,364 | |||||||||
| Current period charge |
(4,719) | (6,038) | (10,757) | |||||||||
| Income tax benefit |
- | 304 | 304 | |||||||||
|
|
|
|
|
|
|
|||||||
| Balance at December 31, 2015 |
(9,057) | (13,358) | (22,415) | |||||||||
| Reclassification adjustments |
- | 1,402 | 1,402 | |||||||||
| Current period benefit |
215 | 1,357 | 1,572 | |||||||||
| Income tax charge |
- | (1,024) | (1,024) | |||||||||
|
|
|
|
|
|
|
|||||||
| Balance at December 31, 2016 |
(8,842) | (11,623) | (20,465) | |||||||||
| Reclassification adjustments |
5,124 | 5,124 | ||||||||||
| Current period benefit |
3,521 | 1,479 | 5,000 | |||||||||
| Income tax charge |
(2,168) | (2,168) | ||||||||||
|
|
|
|
|
|
|
|||||||
| Balance at December 31, 2017 |
$(5,321) | $ (7,188) | $(12,509) | |||||||||
|
|
|
|
|
|
|
|||||||
Note 6 – Income Taxes
The components of income before income taxes are:
| 2017 | 2016 | 2015 | ||||||||||
| United States |
$33,277 | $33,101 | $35,391 | |||||||||
| Foreign countries |
6,101 | 3,381 | 1,875 | |||||||||
|
|
|
|
|
|
|
|||||||
| Total |
$39,378 | $36,482 | $37,266 | |||||||||
|
|
|
|
|
|
|
|||||||
The components of income tax expense are:
| 2017 | 2016 | 2015 | ||||||||||
| Current expense: |
||||||||||||
| Federal |
$16,489 | $ 6,960 | $11,465 | |||||||||
| Foreign |
1,243 | 547 | 292 | |||||||||
| State and local |
1,231 | 581 | 963 | |||||||||
|
|
|
|
|
|
|
|||||||
| 18,963 | 8,088 | 12,720 | ||||||||||
|
|
|
|
|
|
|
|||||||
| Deferred expense (benefit): |
||||||||||||
| Federal |
(5,968) | 3,429 | (443) | |||||||||
| Foreign |
51 | (184) | (112) | |||||||||
| State and local |
(223) | 266 | (8) | |||||||||
|
|
|
|
|
|
|
|||||||
| (6,140) | 3,511 | (563) | ||||||||||
|
|
|
|
|
|
|
|||||||
| Income tax expense |
$12,823 | $11,599 | $12,157 | |||||||||
|
|
|
|
|
|
|
|||||||
37
Table of Contents
The reconciliation between income tax expense and the amount computed by applying the statutory federal income tax rate of 35% to income before income taxes is:
| 2017 | 2016 | 2015 | ||||||||||
| Income taxes at statutory rate |
$13,782 | $12,769 | $13,043 | |||||||||
| State and local income taxes, net of federal tax benefit |
555 | 576 | 680 | |||||||||
| Research and development tax credits |
(295) | (371) | (380) | |||||||||
| Domestic production activities deduction |
(1,191) | (822) | (964) | |||||||||
| Lower foreign taxes differential |
(842) | (820) | (476) | |||||||||
| Uncertain tax positions |
346 | (93) | 26 | |||||||||
| Valuation allowance |
100 | - | (59) | |||||||||
| Federal tax reform – deferred rate change |
(1,624) | - | - | |||||||||
| Deemed mandatory repatriation |
1,370 | - | - | |||||||||
| Foreign withholding tax |
600 | - | - | |||||||||
| Other |
22 | 360 | 287 | |||||||||
|
|
|
|
|
|
|
|||||||
| Income tax expense |
$12,823 | $11,599 | $12,157 | |||||||||
|
|
|
|
|
|
|
|||||||
The Company made income tax payments of $13.5 million, $7.8 million, and $13.5 million in 2017, 2016, and 2015, respectively.
Deferred income tax assets and liabilities consist of:
| 2017 | 2016 | 2015 | ||||||||||
| Deferred tax assets: |
||||||||||||
| Inventories |
$ 1,131 | $ 721 | $ 1,664 | |||||||||
| Accrued liabilities |
1,872 | 3,139 | 2,450 | |||||||||
| Postretirement health benefits obligation |
3,844 | 7,449 | 7,547 | |||||||||
| Pension |
- | - | 3,443 | |||||||||
| Other |
583 | 879 | 292 | |||||||||
|
|
|
|
|
|
|
|||||||
| Total deferred tax assets |
7,430 | 12,188 | 15,396 | |||||||||
| Valuation allowance |
(459) | (277) | (277) | |||||||||
|
|
|
|
|
|
|
|||||||
| Net deferred tax assets |
6,971 | 11,911 | 15,119 | |||||||||
| Deferred tax liabilities: |
||||||||||||
| Depreciation and amortization |
(8,715) | (16,119) | (18,059) | |||||||||
| Pension |
(997) | (3,017) | - | |||||||||
| Foreign withholding tax |
(600) | - | - | |||||||||
|
|
|
|
|
|
|
|||||||
| Total deferred tax liabilities |
(10,312) | (19,136) | (18,059) | |||||||||
|
|
|
|
|
|
|
|||||||
| Net deferred tax liabilities |
$ (3,341) | $ (7,225) | $ (2,940) | |||||||||
|
|
|
|
|
|
|
|||||||
The Company has state tax credit carryforwards of $644,000 and $518,000 as of December 31, 2017 and 2016, respectively, that will expire incrementally between 2018 and 2022.
The Company has a valuation allowance of $459,000 as of December 31, 2017 and $277,000 as of December 31, 2016 against certain of its deferred tax assets. ASC 740 requires that a valuation allowance be recorded against deferred tax assets when it is more likely than not that some or all of a Company’s deferred tax assets will not be realized based on available positive and negative evidence.
Total unrecognized tax benefits were $797,000 and $492,000 at December 31, 2017 and 2016, respectively. The total amount of unrecognized tax benefits that, if ultimately recognized, would reduce the Company’s annual effective tax rate were $674,000 and $397,000 at December 31, 2017 and 2016, respectively.
38
Table of Contents
A reconciliation of the beginning and ending amount of unrecognized tax benefits is as follows:
| 2017 | 2016 | 2015 | ||||||||||
| Balance at beginning of year |
$ 492 | $ 567 | $ 576 | |||||||||
| Additions based on tax positions related to the current year |
239 | 101 | 113 | |||||||||
| Additions based on tax positions related to prior years |
165 | - | - | |||||||||
| Reductions due to lapse of applicable statute of limitations |
(99) | (108) | (101) | |||||||||
| Settlements |
- | (68) | (21) | |||||||||
|
|
|
|
|
|
|
|||||||
| Balance at end of year |
$ 797 | $ 492 | $ 567 | |||||||||
|
|
|
|
|
|
|
|||||||
The Company is subject to income taxes in the U.S. federal and various state, local and foreign jurisdictions. Income tax regulations within each jurisdiction are subject to the interpretation of the related tax laws and regulations and require significant judgment to apply. With few exceptions, the Company is no longer subject to U.S. federal, state and local, or non-U.S. income tax examinations by tax authorities for the years before 2013. The Company has $56,000 of unrecognized tax benefits recorded for periods for which the relevant statutes of limitations expire in the next 12 months.
The Company recognizes interest and penalties related to unrecognized tax benefits in income tax expense for all periods presented. The Company accrued approximately $168,000, $98,000 and $116,000 for the payment of interest and penalties at December 31, 2017, 2016 and 2015, respectively.
On December 22, 2017, the United States enacted tax reform legislation commonly known as the Tax Cuts and Jobs Act (the “Tax Act”), resulting in significant modifications to existing law. The Company follows the guidance in SEC Staff Accounting Bulletin 118 (“SAB 118”), which provides additional clarification regarding the application of ASC 740 in situations where the Company does not have the necessary information available, prepared, or analyzed in reasonable detail to complete the accounting for certain income tax effects of the Tax Act for the reporting period in which the Tax Act was enacted. SAB 118 provides for a measurement period beginning in the reporting period that includes the Tax Act’s enactment date and ending when the Company has obtained, prepared, and analyzed the information needed in order to complete the accounting requirements but in no circumstances should the measurement period extend beyond one year from the enactment date.
The Company recorded $0.4 million provisional net tax expense in the fourth quarter of 2017 to reflect the effects of the Tax Act. This net expense included a provisional noncurrent income tax payable in the amount of $1.4 million related to the one-time deemed repatriation transition tax on previously unrepatriated foreign earnings and a one-time provisional benefit of $1.6 million, which consisted primarily of the re-measurement of U.S. deferred tax assets and liabilities reflecting the change in the U.S. federal rate from 35% to 21%. The Company has also recorded a $0.6 million foreign withholding tax. The provisional estimates are based on the Company’s initial analysis of the Tax Act. Given the significant complexity of the Tax Act, anticipated guidance from the U. S. Treasury about implementing the Tax Act, and the potential for additional guidance from the Securities and Exchange Commission or the Financial Accounting Standards Board related to the Tax Act, these estimates may be adjusted during 2018.
Note 7 – Pensions and Other Postretirement Benefits
The Company sponsors a defined benefit pension plan (“Plan”) covering certain domestic employees. Benefits are based on each covered employee’s years of service and compensation. The Plan is funded in conformity with the funding requirements of applicable U.S. regulations. The Plan was closed to new participants effective January 1, 2008. Employees hired after this date, in eligible locations, participate in an enhanced 401(k) plan instead of the defined benefit pension plan. Employees hired prior to this date continue to accrue benefits.
Additionally, the Company sponsors defined contribution pension plans made available to all domestic and Canadian employees. Total contributions to the plans were $1.9 million for 2017 and $1.6 million in each of the years 2016 and 2015.
39
Table of Contents
The Company also sponsors a non-contributory defined benefit postretirement health care plan that provides health benefits to certain domestic and Canadian retirees and their spouses. The Company funds the cost of these benefits as incurred. For measurement purposes, and based on maximum benefits as defined by the plan, a zero percent annual rate of increase in the per capita cost of covered health care benefits for domestic retirees age 65 and over was assumed for 2017 and is expected to remain constant going forward. A 5% rate of increase for all employees under age 65 and Canadian retirees over age 65 was assumed. Plan changes made during 2017 related to prescription drug coverage, spousal coverage and premiums being charged for retirees under age 65 resulted in a decrease in the Accumulated Postretirement Benefit Obligation at year-end.
40
Table of Contents
The Company recognizes the obligations associated with its defined benefit pension plan and defined benefit postretirement health care plan in its consolidated financial statements. The following table presents the plans’ funded status as of the measurement date reconciled with amounts recognized in the Company’s consolidated balance sheets:
| Pension Plan | Postretirement Plan | |||||||||||||||
| 2017 | 2016 | 2017 | 2016 | |||||||||||||
| Accumulated benefit obligation at end of year |
$63,173 | $64,033 | $17,367 | $22,340 | ||||||||||||
| Change in projected benefit obligation: |
|
|||||||||||||||
| Benefit obligation at beginning of year |
$77,107 | $77,600 | $22,340 | $22,430 | ||||||||||||
| Service cost |
2,727 | 2,837 | 1,249 | 1,192 | ||||||||||||
| Interest cost |
2,537 | 2,643 | 814 | 842 | ||||||||||||
| Plan Changes |
- | - | (6,646) | - | ||||||||||||
| Settlement |
1,398 | - | - | - | ||||||||||||
| Benefits paid |
(12,066) | (5,510) | (2,278) | (1,637) | ||||||||||||
| Effect of foreign exchange |
- | - | 24 | 7 | ||||||||||||
| Actuarial loss (gain) |
4,786 | (463) | 1,864 | (494) | ||||||||||||
|
|
|
|
|
|
|
|
|
|||||||||
| Benefit obligation at end of year |
$76,489 | $77,107 | $17,367 | $22,340 | ||||||||||||
|
|
|
|
|
|
|
|
|
|||||||||
| Change in plan assets: |
||||||||||||||||
| Plan assets at beginning of year |
$83,318 | $68,291 | $ - | $ - | ||||||||||||
| Actual return on plan assets |
7,550 | 4,537 | - | - | ||||||||||||
| Employer contributions |
2,000 | 16,000 | 2,278 | 1,637 | ||||||||||||
| Benefits paid |
(12,066) | (5,510) | (2,278) | (1,637) | ||||||||||||
|
|
|
|
|
|
|
|
|
|||||||||
| Plan assets at end of year |
80,802 | 83,318 | - | - | ||||||||||||
|
|
|
|
|
|
|
|
|
|||||||||
| Funded status at end of year |
$ 4,313 | $ 6,211 | $(17,367) | $(22,340) | ||||||||||||
|
|
|
|
|
|
|
|
|
|||||||||
| Pension Plan | Postretirement Plan | |||||||||||||||
| 2017 | 2016 | 2017 | 2016 | |||||||||||||
| Amounts recognized in the Consolidated Balance Sheets consist of: |
||||||||||||||||
| Noncurrent assets |
$4,313 | $6,211 | $ - | $ - | ||||||||||||
| Current liabilities |
- | - | (1,630) | (1,631) | ||||||||||||
| Noncurrent liabilities |
- | - | (15,737) | (20,709) | ||||||||||||
|
|
|
|
|
|
|
|
|
|||||||||
| Total assets (liabilities) |
$4,313 | $6,211 | $(17,367) | $(22,340) | ||||||||||||
|
|
|
|
|
|
|
|
|
|||||||||
| Amounts recognized in accumulated other comprehensive loss consist of: |
|
|||||||||||||||
| Net actuarial loss (gain) |
$24,571 | $27,041 | $(5,377) | $(7,890) | ||||||||||||
| Prior Service Cost |
- | - | (6,646) | - | ||||||||||||
| Deferred tax (benefit) expense |
(9,223) | (10,506) | 3,683 | 2,978 | ||||||||||||
|
|
|
|
|
|
|
|
|
|||||||||
| After tax actuarial loss (gain) |
$15,348 | $16,535 | $(8,340) | $(4,912) | ||||||||||||
|
|
|
|
|
|
|
|
|
|||||||||
41
Table of Contents
| Components of net periodic benefit cost: |
|
|||||||||||||||
| 2017 | 2016 | 2015 | ||||||||||||||
| Pension Plan |
||||||||||||||||
| Service cost |
$2,727 | $2,837 | $3,064 | |||||||||||||
| Interest cost |
2,537 | 2,643 | 2,640 | |||||||||||||
| Expected return on plan assets |
(4,697) | (4,150) | (4,060) | |||||||||||||
| Recognized actuarial loss |
1,770 | 2,101 | 2,230 | |||||||||||||
| Settlement loss |
4,031 | - | 3,783 | |||||||||||||
|
|
|
|
|
|
|
|||||||||||
| Net periodic benefit cost |
$6,368 | $3,431 | $7,657 | |||||||||||||
|
|
|
|
|
|
|
|||||||||||
| Other changes in pension plan assets and benefit obligations recognized in other comprehensive loss: |
|
|||||||||||||||
| Net (gain) loss |
$(2,470) | $(2,952) | $1,156 | |||||||||||||
|
|
|
|
|
|
|
|||||||||||
| Total expense (income) recognized in net periodic benefit cost and other comprehensive income | $ 3,898 | $ 479 | $8,813 | |||||||||||||
|
|
|
|
|
|
|
|||||||||||
| Postretirement Plan |
||||||||||||||||
| Service cost |
$1,249 | $1,192 | $1,194 | |||||||||||||
| Interest cost |
814 | 842 | 790 | |||||||||||||
| Recognized actuarial gain |
(677) | (699) | (649) | |||||||||||||
|
|
|
|
|
|
|
|||||||||||
| Net periodic benefit cost |
$1,386 | $1,335 | $1,335 | |||||||||||||
| Other changes in postretirement plan assets and benefit obligations recognized in other comprehensive loss: |
|
|||||||||||||||
| Net (gain) loss |
$(4,105) | $ 205 | $(529) | |||||||||||||
|
|
|
|
|
|
|
|||||||||||
| Total (benefit) expense recognized in net periodic benefit cost and other comprehensive income | $(2,719) | $1,540 | $ 806 | |||||||||||||
|
|
|
|
|
|
|
|||||||||||
During 2017 and 2015, the Company recorded a settlement loss relating to retirees that received lump-sum distributions from the Company’s defined benefit pension plan totaling $4.0 million and $3.8 million, respectively. These charges were the result of lump-sum payments to retirees which exceeded the Plan’s actuarial service and interest cost thresholds. No settlement loss was incurred in 2016.
42
Table of Contents
The prior service cost is amortized on a straight-line basis over the average estimated remaining service period of active participants. The unrecognized actuarial gain or loss in excess of the greater of 10% of the benefit obligation or the market value of plan assets is also amortized on a straight-line basis over the average estimated remaining service period of active participants.
| Pension Plan | Postretirement Plan | |||||||||||||||
| 2017 | 2016 | 2017 | 2016 | |||||||||||||
| Weighted-average assumptions used to determine benefit obligations at December 31: |
|
|||||||||||||||
| Discount rate |
3.27% | 3.60% | 3.39% | 3.77% | ||||||||||||
| Rate of compensation increase |
3.50% | 3.50% | - | - | ||||||||||||
| Weighted-average assumptions used to determine net periodic benefit cost for years ended December 31: |
|
|||||||||||||||
| Discount rate |
3.27% | 3.70% | 3.77% | 3.90% | ||||||||||||
| Expected long-term rate of return on plan assets |
6.00% | 6.00% | - | - | ||||||||||||
| Rate of compensation Increase |
3.50% | 3.50% | - | - | ||||||||||||
To enhance the Company’s efforts to mitigate the impact of the defined benefit pension plan on its financial statements, in 2014 the Company moved towards a liability driven investing model to more closely align assets with liabilities based on when the liabilities are expected to come due. Currently, based on 2017 funding levels, equities may comprise between 7% and 27% of the Plan’s market value. Fixed income investments may comprise between 70% and 90% of the Plan’s market value. Alternative investments may comprise between 0% and 6% of the Plan’s market value. Cash and cash equivalents (including all senior debt securities with less than one year to maturity) may comprise between 0% and 10% of the Plan’s market value.
Financial instruments included in pension plan assets are categorized into a fair value hierarchy of three levels, based on the degree of subjectivity inherent in the valuation methodology. Level 1 assets are based on unadjusted quoted prices in active markets that are accessible to the reporting entity at the measurement date for identical assets. Level 2 assets are valued at inputs other than quoted prices in active markets for identical assets that are observable either directly or indirectly for substantially the full term of the assets. Level 3 assets are valued based on unobservable inputs for the asset (i.e., supported by little or no market activity). These inputs include management’s own assessments about the assumptions that market participants would use in pricing assets (including assumptions about risk). The level in the fair value hierarchy within which the fair value measurement is classified is determined based on the lowest level input that is significant to the fair value measure in its entirety.
43
Table of Contents
All of the Plan’s assets in the following table sets forth by asset class the Plan’s fair value of assets.
Plan fair value asset allocation by category:
| 2017 | $ | % | ||||||
|
|
|
|
||||||
| Level 1: |
||||||||
| Equity |
$14,637 | 18% | ||||||
| Fixed income |
12,573 | 16% | ||||||
| Mutual funds |
857 | 1% | ||||||
| Money funds and cash |
6,173 | 8% | ||||||
|
|
|
|
|
|||||
| Total Level 1 |
34,240 | 43% | ||||||
| Level 2: |
||||||||
| Fixed income |
46,556 | 57% | ||||||
| Money funds |
||||||||
|
|
|
|
|
|||||
| Total Level 2 |
46,556 | 57% | ||||||
| Level 3: |
||||||||
| Equity |
6 | - | ||||||
|
|
|
|
|
|||||
| Total Level 3 |
6 | - | ||||||
|
|
|
|
|
|||||
| Total fair value of Plan assets |
$80,802 | 100% | ||||||
|
|
|
|
|
|||||
| 2016 | $ | % | ||||||
|
|
|
|
||||||
| Level 1: |
||||||||
| Equity |
$ | 19,752 | 24% | |||||
| Fixed income |
11,805 | 14% | ||||||
| Mutual funds |
- | - | ||||||
| Money funds and cash |
11,134 | 13% | ||||||
|
|
|
|
|
|||||
| Total Level 1 |
42,691 | 51% | ||||||
| Level 2: |
||||||||
| Fixed income |
40,597 | 49% | ||||||
| Money funds |
- | - | ||||||
|
|
|
|
|
|||||
| Total Level 2 |
40,597 | 49% | ||||||
| Level 3: |
||||||||
| Equity |
30 | - | ||||||
|
|
|
|
|
|||||
| Total Level 3 |
30 | - | ||||||
|
|
|
|
|
|||||
| Total fair value of Plan assets |
$ | 83,318 | 100% | |||||
|
|
|
|
|
|||||
Contributions
The Company expects to contribute $2 million to its defined benefit pension plan in 2018.
Expected future benefit payments
The following benefit payments are expected to be paid as follows based on actuarial calculations:
| 2018 | 2019 | 2020 | 2021 | 2022 | Thereafter | |||||||||||||||||||
| Pension |
$ | 4,274 | $ | 4,251 | $ | 5,427 | $ | 5,046 | $ | 5,964 | $ | 26,953 | ||||||||||||
| Postretirement |
1,657 | 1,519 | 1,373 | 1,215 | 1,157 | 5,960 | ||||||||||||||||||
44
Table of Contents
A one percentage point increase in the assumed health care trend rate would increase postretirement expense by approximately $271,000, changing the benefit obligation by approximately $1.6 million; while a one percentage point decrease in the assumed health care trend rate would decrease postretirement health care expense by approximately $233,000, changing the benefit obligation by approximately $1.4 million. The assumed trend rates for healthcare costs are a 5% increase per year for retirees prior to the age 65 and 0% for retirees post age 65. A 5% rate of increase for all employees under age 65 and Canadian retirees over age 65 was assumed.
A one percentage point change in the assumed rate of return on the defined benefit pension plan assets is estimated to have an approximate $783,000 effect on pension expense. Additionally, a one percentage point increase in the discount rate is estimated to have a $1.2 million decrease in pension expense, while a one percentage point decrease in the discount rate is estimated to have a $1.4 million increase in pension expense.
Note 8 – Goodwill and Other Intangible Assets
The major components of goodwill and other intangible assets are:
| 2017 | 2016 | |||||||||||||||
| Historical Cost |
Accumulated Amortization |
Historical Cost |
Accumulated Amortization |
|||||||||||||
| Finite-lived intangible assets: |
||||||||||||||||
| Customer relationships |
$ 7,966 | $4,791 | $11,885 | $4,650 | ||||||||||||
| Technology and drawings |
6,758 | 3,121 | 6,741 | 2,804 | ||||||||||||
| Other intangibles |
1,866 | 1,021 | 1,723 | 942 | ||||||||||||
|
|
|
|
|
|
|
|
|
|||||||||
| Total finite-lived intangible assets |
16,590 | 8,933 | 20,349 | 8,396 | ||||||||||||
| Goodwill |
27,551 | - | 28,030 | - | ||||||||||||
| Trade names and trademarks |
2,710 | - | 2,888 | - | ||||||||||||
|
|
|
|
|
|
|
|
|
|||||||||
| Total |
$46,851 | $8,933 | $51,267 | $8,396 | ||||||||||||
|
|
|
|
|
|
|
|
|
|||||||||
Amortization of intangible assets was $1.6 million, $1.7 million and $1.5 million in 2017, 2016 and 2015, respectively. Amortization of these intangible assets for 2018 through 2022 is expected to approximate $1.0 million per year.
Changes in the carrying value of goodwill during the years ended December 31, 2017 and 2016 are as follows:
| Goodwill | ||||
| Balance at December 31, 2015 |
$24,559 | |||
| Acquisitions |
5,187 | |||
| Impairment |
(1,800) | |||
| Foreign currency |
84 | |||
|
|
|
|||
| Balance at December 31, 2016 |
28,030 | |||
| Acquisitions |
- | |||
| Impairment |
(925) | |||
| Foreign currency |
446 | |||
|
|
|
|||
| Balance at December 31, 2017 |
$27,551 | |||
|
|
|
|||
The decreasing demand for barge pumps for the marine transportation market, driven by low oil prices and overcapacity of inland barges, has continued to negatively affect the Bayou City Pump Company (“Bayou”)
45
Table of Contents
reporting unit, leading management to reconsider its estimates for future profitability of this reporting unit prior to the October 1 annual goodwill impairment testing date in 2017 and thereby increasing the likelihood that the associated goodwill and other intangible assets could be impaired. As such, the Company performed an interim discounted cash flow analysis to test for potential impairment of goodwill pursuant to ASC 350. As a result of this impairment test, the Company concluded that the goodwill was impaired and recorded a non-cash impairment charge of $0.9 million which represented the full remaining amount of Bayou’s goodwill. This impairment charge is included in Impairment of goodwill and other intangible assets on the Condensed Consolidated Statements of Income.
For 2017, the Company used a quantitative analysis for the annual goodwill impairment testing as of October 1 for its National Pump Company (“National”) reporting unit. The fair value for this reporting unit was estimated using a discounted cash flow model, which considered forecasted cash flows discounted at an estimated weighted- average cost of capital. The forecasted cash flows were based on the Company’s long-term operating plan and a terminal value was used to estimate the cash flows beyond the period covered by the operating plan. The weighted-average cost of capital is an estimate of the overall after-tax rate of return required by equity and debt market holders of a business enterprise. These analyses require the exercise of significant judgments, including judgments about appropriate discount rates, perpetual growth rates and the timing of expected future cash flows. Sensitivity analyses were performed around these assumptions in order to assess the reasonableness of the assumptions and the resulting estimated fair values.
The result of this goodwill impairment test indicated that no impairment existed at National. The Company’s annual impairment analysis performed as of October 1, 2017 concluded that National’s fair value exceeded its carrying value by approximately 7%. A sensitivity analysis was performed for the National reporting unit, assuming a hypothetical 50 basis point decrease in the expected long-term growth rate or a hypothetical 50 basis point increase in the weighted average cost of capital, and both scenarios independently yielded an estimated fair value for the National reporting unit slightly above carrying value. If recently depressed U.S. agricultural conditions continue for an extended time, this market’s related growth and profitability assumptions may reduce National’s indicated fair value to require a potential future impairment charge. Goodwill relating to the National reporting unit represents 3% of the Company’s December 31, 2017 total assets.
For 2017, for all other reporting units, the Company used a qualitative analysis for goodwill impairment testing as of October 1. This qualitative assessment included consideration of current industry and market conditions and circumstances as well as any mitigating factors that would most affect the fair value of the Company and these reporting units. Based on the assessment and consideration of the totality of the facts and circumstances, including the business environment in the fourth quarter of 2017, the Company determined that it was not more likely than not that the fair value of the Company or these reporting units is less than their respective carrying amounts. As such, no goodwill impairments for these reporting units were recorded for the year ended December 31, 2017.
Other indefinite-lived intangible assets primarily consist of trademarks and trade names. The fair value of these assets is also tested annually for impairment as of October 1, or whenever events or changes in circumstances indicate there may be a possible permanent loss of value. The fair value of these assets is determined using a royalty relief methodology similar to that employed when the associated assets were acquired, but using updated estimates of future sales, cash flows and profitability. For 2017 and 2016 the fair value of all indefinite lived intangible assets exceeded the respective carrying values.
Finite-lived assets are reviewed for impairment whenever events or changes in circumstances indicate the carrying amount may not be recovered through future net cash flows generated by the assets. Recoverability of assets to be held and used is measured by a comparison of the carrying amount of the assets to future net undiscounted cash flows estimated to be generated by such assets. Based upon our fiscal 2017 and 2016 quantitative and qualitative impairment analyses, except for Bayou’s customer relationship intangible asset and the risk related to National’s indicated fair value, the Company was not aware of any events or changes in
46
Table of Contents
circumstances that indicate the carrying value of its finite-lived intangible assets may not be recoverable. In 2017, due primarily to the continued decreased demand for barge pumps for the marine transportation market driven by low oil prices and overcapacity of inland barges, the Company performed a recoverability test related to Bayou’s customer relationship intangible asset pursuant to ASC 360. As a result of the recoverability test, Bayou recorded a pre-tax non-cash customer relationship impairment charge of $3.2 million, which represented the full amount of Bayou’s customer relationships. The impairment charge is included in Impairment of goodwill and other intangible assets on the Condensed Consolidated Statements of Income.
Note 9 – Business Segment Information
The Company operates in one business segment comprising the design, manufacture and sale of pumps and pump systems. The Company’s products are used in water, wastewater, construction, industrial, petroleum, original equipment, agriculture, fire protection, heating, ventilation and air conditioning (HVAC), military and other liquid-handling applications.
The pumps and pump systems are marketed in the United States and worldwide through a broad network of distributors, through manufacturers’ representatives (for sales to many original equipment manufacturers), through third-party distributor catalogs, and by direct sales. International sales are made primarily through foreign distributors and representatives.
The Company sells to approximately 150 countries around the world. The components of customer sales, determined based on the location of customers are:
| 2017 | % | 2016 | % | 2015 | % | |||||||||||||||||||
| United States |
$ | 241,746 | 64 | $ | 250,872 | 66 | $ | 269,628 | 66 | |||||||||||||||
| Foreign countries |
137,643 | 36 | 131,199 | 34 | 136,522 | 34 | ||||||||||||||||||
|
|
|
|
|
|
|
|
|
|
|
|
|
|||||||||||||
| Total |
$ | 379,389 | 100 | $ | 382,071 | 100 | $ | 406,150 | 100 | |||||||||||||||
|
|
|
|
|
|
|
|
|
|
|
|
|
|||||||||||||
Net sales from external customers by product category are:
| 2017 | 2016 | 2015 | ||||||||||
| Pumps and pump systems |
$ | 322,201 | $ | 328,973 | $ | 352,652 | ||||||
| Repairs of pumps and pump systems and other |
57,188 | 53,098 | 53,498 | |||||||||
|
|
|
|
|
|
|
|||||||
| Total |
$ | 379,389 | $ | 382,071 | $ | 406,150 | ||||||
|
|
|
|
|
|
|
|||||||
As of December 31, 2017 and 2016, 89% and 92% of the Company’s long-lived assets were located in the United States, respectively.
Note 10 – Acquisitions
In October 2016, the Company, through its wholly-owned subsidiary Patterson Pump Company (“Patterson”), acquired substantially all of the assets and certain liabilities of Morrison Pump Company (“Morrison”). The purchase price consisted of cash and deferred payments. The deferred payments represent the estimated fair value of the additional variable cash consideration payable in connection with the acquisition that is contingent upon the achievement of certain performance milestones. The Company estimated the fair value using expected future cash flows over the period in which the obligation is expected to be settled, which are considered to be level 3 inputs. The Company recognized goodwill of $5.2 million related to the asset acquisition of Morrison.
The results of operations of Morrison have been included in Gorman-Rupp’s consolidated results since October 2016.
47
Table of Contents
In August 2015, the Company’s subsidiary, Gorman-Rupp Europe B.V., acquired substantially all of the assets and certain liabilities of Hydro+ SA (“Hydro”) and Hydro+ Rental SPRL (“Hydro Rental”), subsequently renamed Gorman-Rupp Rental SPRL, based near Namur, Belgium. The Company assumed $1.9 million in bank debt, which was subsequently paid off in 2015. The Company recognized customer relationships of $748,000, technology and drawings of $130,000, tradenames and trademarks of $70,000 and goodwill of $2.4 million related to the asset acquisition of Hydro and Hydro Rental.
The results of operations of both Hydro companies have been included in Gorman-Rupp’s consolidated results since August 2015.
| ITEM 9. | CHANGES IN AND DISAGREEMENTS WITH ACCOUNTANTS ON ACCOUNTING AND FINANCIAL DISCLOSURE |
None.
| ITEM 9A. | CONTROLS AND PROCEDURES |
Evaluation of Disclosure Controls and Procedures
The Company maintains a set of disclosure controls and procedures designed to ensure that information required to be disclosed by the Company in reports that it files or submits under the Securities Exchange Act of 1934 is recorded, processed, summarized and reported within the time periods specified in Securities and Exchange Commission rules and forms. The Company’s disclosure controls and procedures are also designed to ensure that information required to be disclosed in Company reports filed under the Securities Exchange Act of 1934 is accumulated and communicated to the Company’s management, including the principal executive officer and the principal financial officer, as appropriate, to allow timely decisions regarding required disclosure.
An evaluation was carried out under the supervision and with the participation of the Company’s management, including the principal executive officer and the principal financial officer, of the effectiveness of the design and operation of the Company’s disclosure controls and procedures as of the end of the period covered by this report on Form 10-K. Based on the evaluation, the principal executive officer and the principal financial officer have concluded that the Company’s disclosure controls and procedures were effective as of December 31, 2017.
48
Table of Contents
Report of Management on Internal Control Over Financial Reporting
Management is responsible for establishing and maintaining adequate internal control over financial reporting for the Company (as defined in Exchange Act Rules 13a-15(f) and 15d-15(f). Internal control over financial reporting is a process designed by, or under the supervision of, the Company’s principal executive and principal financial officers, or persons performing similar functions, and affected by the Company’s Board of Directors, management and other personnel, to provide reasonable assurance regarding the reliability of financial reporting and the preparation of financial statements for external purposes in accordance with accounting principles generally accepted in the United States.
The Company’s internal control over financial reporting includes those policies and procedures that (i) pertain to the maintenance of records that, in reasonable detail, accurately and fairly reflect the transactions and dispositions of the assets of the Company; (ii) provide reasonable assurance that transactions are recorded as necessary to permit preparation of financial statements in accordance with accounting principles generally accepted in the United States, and that receipts and expenditures of the Company are being made only in accordance with authorizations of management and Directors of the Company; and (iii) provide reasonable assurance regarding prevention or timely detection of unauthorized acquisition, use or disposition of the Company’s assets that could have a material effect on the financial statements.
Because of its inherent limitations, internal control over financial reporting may not prevent or detect misstatements. In addition, projections of any evaluation of effectiveness to future periods are subject to the risk that controls may become inadequate because of changes in conditions, or that the degree of compliance with the policies or procedures may deteriorate.
Management conducted an evaluation of the effectiveness of internal control over financial reporting based on the framework in Internal Control – Integrated Framework issued by the Committee of Sponsoring Organizations of the Treadway Commission (2013 framework) (the COSO Criteria). Based on this evaluation, management concluded that the Company’s internal control over financial reporting was effective as of December 31, 2017.
The independent registered public accounting firm of Ernst & Young LLP that has audited the consolidated financial statements included in this annual report on Form 10-K, has also issued an attestation report on the Company’s internal control over financial reporting as of December 31, 2017. This report is included on the following page.
/s/ Jeffrey S. Gorman
Jeffrey S. Gorman
President and Chief Executive Officer
/s/ James C. Kerr
James C. Kerr
Chief Financial Officer
February 23, 2018
49
Table of Contents
Report of Independent Registered Public Accounting Firm
To the Shareholders and the Board of Directors of The Gorman-Rupp Company
Opinion on Internal Control over Financial Reporting
We have audited The Gorman-Rupp Company’s internal control over financial reporting as of December 31, 2017, based on criteria established in Internal Control—Integrated Framework issued by the Committee of Sponsoring Organizations of the Treadway Commission (2013 framework) (the COSO criteria). In our opinion, The Gorman-Rupp Company (the Company) maintained, in all material respects, effective internal control over financial reporting as of December 31, 2017, based on the COSO criteria.
We also have audited, in accordance with the standards of the Public Company Accounting Oversight Board (United States) (PCAOB), the 2017 consolidated financial statements of the Company and our report dated February 23, 2018 expressed an unqualified opinion thereon.
Basis for Opinion
The Company’s management is responsible for maintaining effective internal control over financial reporting and for its assessment of the effectiveness of internal control over financial reporting included in the accompanying Report of Management on Internal Control Over Financial Reporting. Our responsibility is to express an opinion on the Company’s internal control over financial reporting based on our audit. We are a public accounting firm registered with the PCAOB and are required to be independent with respect to the Company in accordance with the U.S. federal securities laws and the applicable rules and regulations of the Securities and Exchange Commission and the PCAOB.
We conducted our audit in accordance with the standards of the PCAOB. Those standards require that we plan and perform the audit to obtain reasonable assurance about whether effective internal control over financial reporting was maintained in all material respects.
Our audit included obtaining an understanding of internal control over financial reporting, assessing the risk that a material weakness exists, testing and evaluating the design and operating effectiveness of internal control based on the assessed risk, and performing such other procedures as we considered necessary in the circumstances. We believe that our audit provides a reasonable basis for our opinion.
Definition and Limitations of Internal Control Over Financial Reporting
A company’s internal control over financial reporting is a process designed to provide reasonable assurance regarding the reliability of financial reporting and the preparation of financial statements for external purposes in accordance with generally accepted accounting principles. A company’s internal control over financial reporting includes those policies and procedures that (1) pertain to the maintenance of records that, in reasonable detail, accurately and fairly reflect the transactions and dispositions of the assets of the company; (2) provide reasonable assurance that transactions are recorded as necessary to permit preparation of financial statements in accordance with generally accepted accounting principles, and that receipts and expenditures of the company are being made only in accordance with authorizations of management and directors of the company; and (3) provide reasonable assurance regarding prevention or timely detection of unauthorized acquisition, use, or disposition of the company’s assets that could have a material effect on the financial statements.
Because of its inherent limitations, internal control over financial reporting may not prevent or detect misstatements. Also, projections of any evaluation of effectiveness to future periods are subject to the risk that controls may become inadequate because of changes in conditions, or that the degree of compliance with the policies or procedures may deteriorate.
/s/ Ernst & Young LLP
Cleveland, Ohio
February 23, 2018
50
Table of Contents
Changes in Internal Control over Financial Reporting
There were no changes in the Company’s internal control over financial reporting that occurred during the last fiscal quarter that have materially affected, or are reasonably likely to materially affect, the Company’s internal control over financial reporting.
| ITEM 9B. | OTHER INFORMATION |
None.
PART III
| ITEM 10. | DIRECTORS, EXECUTIVE OFFICERS AND CORPORATE GOVERNANCE |
Attention is directed to the sections captioned “Election of Directors,” “Board of Directors and Board Committees,” “Audit Committee Report,” “Beneficial Ownership of Shares” and “Section 16(a) Beneficial Ownership Reporting Compliance” in the Company’s definitive Notice of 2018 Annual Meeting of Shareholders and related Proxy Statement (filed with the SEC pursuant to Regulation 14A not later than 120 days after the end of the fiscal year covered by this Form 10-K), which are incorporated herein by this reference.
With respect to Executive Officers, attention is directed to Part I of this Form 10-K.
The Company has adopted a Code of Ethics that applies to its Directors, officers and all employees. The Code of Ethics is set forth as an exhibit to this Form 10-K. In addition, the Code of Ethics is posted on the Company’s website accessible through its Internet address of www.gormanrupp.com (under the heading “Investor Relations” and the sub-heading “Corporate Governance”), including any amendments.
| ITEM 11. | EXECUTIVE COMPENSATION |
Attention is directed to the sections “Board of Directors and Board Committees,” “Executive Compensation,” “Compensation Discussion and Analysis,” “Pension Benefits,” “Summary Compensation Table,” “Grants of Plan Based Awards,” “Outstanding Equity Awards at December 31, 2017,” “Non-Employee Director Compensation,” “Risk Oversight,” “Compensation Committee Interlocks and Insider Participation,” “Compensation Committee Report,” and “CEO Pay Ratio” in the Company’s definitive Notice of 2018 Annual Meeting of Shareholders and related Proxy Statement (filed pursuant to Regulation 14A not later than 120 days after the end of the fiscal year covered by this Form 10-K), which are incorporated herein by this reference.
| ITEM 12. | SECURITY OWNERSHIP OF CERTAIN BENEFICIAL OWNERS AND MANAGEMENT AND RELATED STOCKHOLDER MATTERS |
Attention is directed to the section “Beneficial Ownership of Shares” and “Election of Directors” in the Company’s definitive Notice of 2018 Annual Meeting of Shareholders and related Proxy Statement (filed with the SEC pursuant to Regulation 14A not later than 120 days after the end of the fiscal year covered by this Form 10-K), which are incorporated herein by this reference.
51
Table of Contents
Equity Compensation Plan Information
The following table provides information as of December 31, 2017 about the Company’s Common Shares that may be issued upon exercise of options, warrants and rights granted, and shares remaining available for issuance, under all of the Company’s existing equity compensation plans, including the 2015 Omnibus Incentive Plan and the 2016 Non-Employee Directors’ Compensation Plan.
| Plan Category |
Number of securities to be issued upon exercise of outstanding options warrants and rights |
Weighted average exercise price of outstanding options warrants and rights |
Number of securities remaining available for future issuance under equity compensation plans |
|||||||||
| Equity compensation plans approved by shareholders | - | $ | -0- | 814,203 | ||||||||
| Equity compensation plans not approved by shareholders | - | n/a | - | |||||||||
|
|
|
|
|
|
|
|||||||
| Total |
- | $ | -0- | 814,203 | ||||||||
| ITEM 13. | CERTAIN RELATIONSHIPS AND RELATED TRANSACTIONS, AND DIRECTOR INDEPENDENCE |
Attention is directed to the section “Board of Directors and Board Committees” and “Related Party Transactions” in the Company’s definitive Notice of 2018 Annual Meeting of Shareholders and related Proxy Statement (filed with the SEC pursuant to Regulation 14A not later than 120 days after the end of the fiscal year covered by this Form 10-K), which is incorporated herein by this reference. The Company has no relationships or transactions required to be reported by Item 404 of Regulation S-K.
| ITEM 14. | PRINCIPAL ACCOUNTING FEES AND SERVICES |
Attention is directed to the section “Ratification of Appointment of Independent Registered Public Accounting Firm” in the Company’s definitive Notice of 2018 Annual Meeting of Shareholders and related Proxy Statement (filed with the SEC pursuant to Regulation 14A not later than 120 days after the end of the fiscal year covered by this Form 10-K), which is incorporated herein by this reference.
PART IV
| ITEM 15. | EXHIBITS AND FINANCIAL STATEMENT SCHEDULES |
| (a) | (1) | The Index to Consolidated Financial Statements of the Registrant under Item 8 of this Report is incorporated herein by reference as the list of Financial Statements required as part of this Report. | ||||
| (2) | All financial statement schedules for which provision is made in the applicable accounting regulation of the Securities and Exchange Commission are not required under the related instructions or are inapplicable, or the information required to be set forth therein is included in the consolidated financial statements or Notes thereto. | |||||
| (3) | Exhibits — The exhibit list in the Exhibit Index is incorporated by reference as the list of exhibits required as part of this Report. |
52
Table of Contents
ANNUAL REPORT ON FORM 10-K
THE GORMAN-RUPP COMPANY
For the Year Ended December 31, 2017
| * | Incorporated herein by this reference from Exhibit (3)(4)(a) of the Company’s Annual Report on Form 10-K for the year ended December 31, 2015. |
| ** | Incorporated herein by this reference from Exhibit (3)(ii)(4) of the Company’s Quarterly Report on Form 10-Q for the quarter ended March 31, 2015. |
| *** | Incorporated herein by this reference from Exhibits (10)(a)(b) of the Company’s Annual Report on Form 10-K for the year ended December 31, 2014. |
| **** | Incorporated herein by this reference from Exhibit 10.1 of the Company’s Current Report on Form 8-K filed on April 28, 2015. |
| ***** | Incorporated herein by this reference from Exhibit 10.1 of the Company’s Current Report on Form 8-K filed on May 4, 2015. |
| ****** | Incorporated herein by this reference from Exhibit (4)(c) of the Company’s Registration Statement on Form S-8 filed on May 24, 2016. |
| # | Management contract or compensatory plan or arrangement. |
53
Table of Contents
Table of Contents
Pursuant to the requirements of Section 13 or 15(d) of the Securities Exchange Act of 1934, the Registrant has duly caused this report to be signed on its behalf by the undersigned, thereunto duly authorized.
| THE GORMAN-RUPP COMPANY | ||
| *By: | /s/ BRIGETTE A. BURNELL | |
| Brigette A. Burnell | ||
| Attorney-In-Fact | ||
| Date: February 23, 2018 | ||
55
Table of Contents
Pursuant to the requirements of the Securities Exchange Act of 1934, this report has been signed below by the following persons on behalf of the Registrant and in the capacities and on the date indicated.
| *JEFFREY S. GORMAN |
President and Chief Executive Officer and Director | |
| Jeffrey S. Gorman | (Principal Executive Officer) | |
| *JAMES C. KERR |
Chief Financial Officer | |
| James C. Kerr | (Principal Financial and Accounting Officer) | |
| *JAMES C. GORMAN |
Director | |
| James C. Gorman | ||
| *M. ANN HARLAN |
Director | |
| M. Ann Harlan | ||
| *THOMAS E. HOAGLIN |
Director | |
| Thomas E. Hoaglin | ||
| *CHRISTOPHER H. LAKE |
Director | |
| Christopher H. Lake | ||
| *KENNETH R. REYNOLDS |
Director | |
| Kenneth R. Reynolds | ||
| *RICK R. TAYLOR |
Director | |
| Rick R. Taylor | ||
| *W. WAYNE WALSTON |
Director | |
| W. Wayne Walston | ||
| * | The undersigned, by signing her name hereto, does sign and execute this Annual Report on Form 10-K on behalf of The Gorman-Rupp Company and on behalf of each of the above-named Officers and Directors of The Gorman-Rupp Company pursuant to Powers of Attorney executed by The Gorman-Rupp Company and by each such Officer and Director and filed with the Securities and Exchange Commission. |
February 23, 2018
| By: | /s/ BRIGETTE A. BURNELL | |
| Brigette A. Burnell | ||
| Attorney-In-Fact |
56