Attached files
| file | filename |
|---|---|
| EX-31.2 - EXHIBIT 31.2 - MASTEC INC | mtz12311510-kex312.htm |
| EX-32.2 - EXHIBIT 32.2 - MASTEC INC | mtz12311510-kex322.htm |
| EX-31.1 - EXHIBIT 31.1 - MASTEC INC | mtz12311510-kex311.htm |
| EX-12.1 - EXHIBIT 12.1 - MASTEC INC | mtz12311510-kex121.htm |
| EX-4.11 - EXHIBIT 4.11 - MASTEC INC | mtz12311510-kex411.htm |
| EX-32.1 - EXHIBIT 32.1 - MASTEC INC | mtz12311510-kex321.htm |
| EX-23.1 - EXHIBIT 23.1 - MASTEC INC | mtz12311510-kex231.htm |
| EX-21 - EXHIBIT 21 - MASTEC INC | mtz12311510-kex21.htm |
UNITED STATES
SECURITIES AND EXCHANGE COMMISSION
Washington, D.C. 20549
_____________________________________________
Form 10-K
_____________________________________________
ANNUAL REPORT PURSUANT TO SECTION 13 OR 15(d)
OF THE SECURITIES EXCHANGE ACT OF 1934
For the fiscal year ended December 31, 2015
Commission File Number 001-08106
_____________________________________________

MasTec, Inc.
(Exact Name of Registrant as Specified in Its Charter)
Florida | 65-0829355 |
(State or Other jurisdiction of | (I.R.S. Employer |
Incorporation or Organization) | Identification No.) |
800 S. Douglas Road, 12th Floor, | |
Coral Gables, FL | 33134 |
(Address of Principal Executive Offices) | (Zip Code) |
(305) 599-1800
(Registrant’s Telephone Number, Including Area Code)
Securities registered pursuant to Section 12(b) of the Exchange Act:
Title of Each Class | Name of Each Exchange on Which Registered |
Common Stock, $0.10 Par Value | New York Stock Exchange |
Securities registered pursuant to Section 12(g) of the Exchange Act: None
Indicate by check mark if the registrant is a well-known seasoned issuer; as defined in rule 405 of the Securities Act. Yes ¨ No þ
Indicate by check mark if the registrant is not required to file reports pursuant to Section 13 or Section 15(d) of the Act. Yes ¨ No þ
Indicate by check mark whether the registrant (1) has filed all reports required to be filed by Section 13 or 15(d) of the Securities Exchange Act of 1934 during the preceding 12 months (or for such shorter period that the registrant was required to file such reports), and (2) has been subject to such filing requirements for the past 90 days. Yes þ No ¨
Indicate by check mark whether the registrant has submitted electronically and posted on its corporate Web site, if any, every Interactive Data File required to be submitted and posted pursuant to Rule 405 of Regulation S-T (§ 232.405 of this chapter) during the preceding 12 months (or for such shorter period that the registrant was required to submit and post such files). Yes þ No ¨
Indicate by check mark if disclosure of delinquent filers pursuant to Item 405 of Regulation S-K (Section 229.405 of this chapter) is not contained herein, and will not be contained, to the best of registrant’s knowledge, in definitive proxy or information statements incorporated by reference in Part III of this Form 10-K or any amendment to this Form 10-K. þ
Indicate by check mark if the registrant is a large accelerated filer, an accelerated filer, a non-accelerated filer, or a smaller reporting company. See the definitions of “large accelerated filer,” “accelerated filer,” and “smaller reporting company” in Rule 12b-2 of the Exchange Act. (Check one):
þ Large accelerated filer ¨ Accelerated filer ¨ Non-accelerated filer ¨ Smaller reporting company
Indicate by check mark whether the registrant is shell company (as defined in Rule 12b-2 of the Act.) Yes ¨ No þ
The aggregate market value of the registrant’s outstanding common stock held by non-affiliates of the registrant computed by reference to the price at which the common stock was last sold as of the last business day of the registrant’s most recently completed second fiscal quarter was approximately $1.3 billion (based on a closing price of $19.87 per share for the registrant’s common stock on the New York Stock Exchange on June 30, 2015).
There were 80,164,837 shares of common stock outstanding as of February 22, 2016.
The registrant’s definitive proxy statement to be filed with the Securities and Exchange Commission pursuant to Regulation 14A for the 2016 annual meeting of shareholders is incorporated by reference in Part III of this Form 10-K to the extent stated herein.
TABLE OF CONTENTS
Page | ||
Management’s Discussion and Analysis of Financial Condition and Results of Operations | ||
2
Cautionary Statement Regarding Forward-Looking Statements
The Company is making this statement pursuant to the safe harbor provisions for forward-looking statements described in the Private Securities Litigation Reform Act of 1995. We make statements in this Annual Report on Form 10-K (“this Form 10-K”) and in the documents that we incorporate by reference into this Annual Report that are forward-looking. When used in this Annual Report or in any other presentation, statements which are not historical in nature, including the words “anticipate,” “estimate,” “could,” “should,” “may,” “plan,” “seek,” “expect,” “believe,” “intend,” “target,” “will,” “project” and variations of these words and negatives thereof and similar expressions are intended to identify forward-looking statements. They also include statements regarding:
• | our future growth and profitability; |
• | our competitive strengths; and |
• | our business strategy and the trends we anticipate in the industries and economies in which we operate. |
These forward-looking statements are based on our current expectations and are subject to a number of risks, uncertainties and assumptions. These statements are not guarantees of future performance and are subject to risks, uncertainties and other factors, some of which are beyond our control, are difficult to predict, and could cause actual results to differ materially from those expressed or forecasted in the forward-looking statements. Important factors that could cause actual results to differ materially from those in forward-looking statements include:
• | activity in the oil and gas, utility and power generation industries and the impact on our customers’ expenditure levels caused by fluctuations in prices of oil, natural gas, electricity and other energy sources; |
• | market conditions, technological developments and regulatory changes that affect us or our customers’ industries; |
• | our ability to accurately estimate the costs associated with our fixed price and other contracts, including any material changes in estimates for completion of projects; |
• | our ability to manage projects effectively and in accordance with our estimates; |
• | the effect on demand for our services of changes in the amount of capital expenditures by our customers due to, among other things, economic conditions, commodity price fluctuations, the availability and cost of financing, and customer consolidation in the industries we serve; |
• | the highly competitive nature of our industry; |
• | risks related to our recent or potential acquisitions; |
• | risks related to our strategic arrangements, including our equity method investments and proportionately consolidated non-controlled Canadian joint venture; |
• | risks associated with operating in or expanding into additional international markets; |
• | risks from fluctuations in foreign currencies; |
• | the timing and extent of fluctuations in geographic, weather and operational factors affecting our customers, projects and the industries in which we operate; |
• | the ability of our customers, including our largest customers, to terminate or reduce the amount of work, or in some cases, the prices paid for services, on short or no notice under our contracts; |
• | our dependence on a limited number of customers, as well as any impact of consolidation of those customers; |
• | customer disputes related to our performance of services; |
• | any material changes in estimates for legal costs or case settlements or adverse determinations on any claim, lawsuit or proceeding; |
• | disputes with, or failures of, our subcontractors to deliver agreed-upon supplies or services in a timely fashion; |
• | our ability to replace non-recurring projects with new projects; |
• | the adequacy of our insurance, legal and other reserves and allowances for doubtful accounts; |
• | risks from failure to comply with laws applicable to our foreign activities; |
• | the outcome of our plans for future operations, growth and services, including business development efforts, backlog, acquisitions and dispositions; |
• | our ability to maintain a workforce based upon current and anticipated workloads; |
3
• | our ability to attract and retain qualified personnel, key management and skilled employees, including from acquired businesses, and our ability to enforce any noncompetition agreements; |
• | our ability to identify suitable acquisition or strategic investment opportunities, to integrate acquired businesses within expected timeframes and to achieve the revenue, cost savings and earnings levels from such acquisitions at or above the levels projected; including the risk of potential asset impairment charges, including write-downs of goodwill; |
• | any exposure resulting from system or information technology interruptions or data security breaches; |
• | risks related to the restatement of certain of our fiscal year 2014 interim financial statements, including from ongoing or possible regulatory action, private party litigation, including, without limitation, the civil investigation commenced by the Securities and Exchange Commission (the “SEC”) related to this matter; |
• | the impact of U.S. federal, local, state, foreign or tax legislation and other regulations affecting renewable energy, electricity prices, electrical transmission, oil and gas production, wireless, wireline/fiber and related projects and expenditures; |
• | the effect of state and federal regulatory initiatives, including costs of compliance with existing and future safety and environmental requirements; |
• | fluctuations in fuel, maintenance, materials, labor and other costs; |
• | the impact of being required to pay our subcontractors even if our customers do not pay us; |
• | risks associated with potential environmental issues and other hazards from our operations; |
• | the impact of any unionized workforce on our operations, including labor availability, productivity and relations; |
• | liabilities associated with multiemployer pension plans for our operations that employ unionized workers, including underfunding and withdrawal liabilities; |
• | restrictions imposed by our credit facility, senior notes and any future loans or securities; |
• | our ability to obtain performance and surety bonds; |
• | a small number of our existing shareholders have the ability to influence major corporate decisions; |
• | any dilution or stock price volatility that shareholders may experience in connection with shares we may issue as consideration for earn-out obligations or as purchase consideration in connection with past or future acquisitions, or as a result of other stock issuances; and |
• | other factors referenced in this Annual Report, including, without limitation, under Item 1. “Business,” Item 1A. “Risk Factors,” Item 7. “Management’s Discussion and Analysis of Financial Condition and Results of Operations” and other factors detailed from time to time in the reports and other filings we make with the SEC. |
We believe these forward-looking statements are reasonable; however, you should not place undue reliance on any forward-looking statements, which are based on current expectations. Furthermore, forward-looking statements speak only as of the date they are made. If any of these risks or uncertainties materialize, or if any of our underlying assumptions are incorrect, our actual results may differ significantly from the results that we express in, or imply by, any of our forward-looking statements. These and other risks are detailed in this Annual Report on Form 10-K, in the documents that we incorporate by reference into this Annual Report on Form 10-K and in other documents that we file with the SEC. We do not undertake any obligation to publicly update or revise these forward-looking statements after the date of this Annual Report on Form 10-K to reflect future events or circumstances, except as required by applicable law. We qualify any and all of our forward-looking statements by these cautionary factors.
PART I
ITEM 1. | BUSINESS |
We are a leading infrastructure construction company operating mainly throughout North America across a range of industries. Our primary activities include the engineering, building, installation, maintenance and upgrade of communications, energy and utility infrastructure, such as: wireless, wireline/fiber and satellite communications; petroleum and natural gas pipeline infrastructure; electrical utility transmission and distribution; conventional and renewable power generation; and industrial infrastructure. Our customers are primarily in these industries. Including our predecessor companies, we have been in business for more than 85 years. We offer our services primarily under the MasTec service mark and, as of December 31, 2015, we had approximately 15,900 employees and 470 locations. We have been consistently ranked among the top specialty contractors by Engineering News-Record for the past several years.
We provide our services to a diversified base of customers. We often provide services under master service and other service agreements, which are generally multi-year agreements. The remainder of our work is generated pursuant to contracts for specific projects or jobs that require the construction or installation of an entire infrastructure system or specified units within an infrastructure system. Revenue from non-recurring, project specific work may experience greater variability than master service agreement work due to the need to replace the revenue as projects are completed.
4
If we are not able to replace work from completed projects with new project work, we may not be able to maintain our current revenue levels or our current level of capacity and resource utilization. We actively review our backlog of project work and take appropriate action to minimize such exposure.
We have expanded and diversified our business in recent years, which has deepened our presence and broadened our service offerings in key markets, including: wireless services; natural gas, natural gas liquids and petroleum pipeline; and electrical transmission, among others. In addition, we seek to grow organically and, to a lesser extent, through acquisition, in order to broaden our geographic presence and expand the services we provide within our traditional business areas, such as telecommunications, install-to-the-home and customer fulfillment services. For discussion of acquisitions in recent years, see Item 7. “Management’s Discussion and Analysis of Financial Condition and Results of Operations - Business,” which is incorporated herein by reference.
We manage our continuing operations under five operating segments, which represent our five reportable segments: (1) Communications; (2) Oil and Gas; (3) Electrical Transmission; (4) Power Generation and Industrial and (5) Other. This structure is generally focused on broad end-user markets for our labor-based construction services.
The Communications segment performs engineering, construction and maintenance of communications infrastructure primarily related to wireless and wireline/fiber communications and install-to-the-home customers, and to a lesser extent, infrastructure for electrical utilities, among others. We perform engineering, construction and maintenance services on oil and natural gas pipelines and processing facilities for the energy and utilities industries through our Oil and Gas segment. The Electrical Transmission segment primarily serves the energy and utility industries through the engineering, construction and maintenance of electrical transmission lines and substations. The Power Generation and Industrial segment primarily serves energy, utility and other end-markets through the installation and construction of conventional and renewable power facilities, related electrical transmission infrastructure, ethanol/biofuel facilities and various types of industrial infrastructure. The Other segment includes a proportionately consolidated non-controlled Canadian joint venture, equity method investments and other small business units that perform construction services in a variety of international end-markets.
In this Annual Report on Form 10-K, “$” means U.S. dollars unless otherwise indicated. Customer revenue by segment for the years indicated was as follows (in millions):
For the Years Ended December 31, | ||||||||||||||||||||
Reportable Segment: | 2015 | 2014 | 2013 | |||||||||||||||||
Communications | $ | 1,973.2 | 47 | % | $ | 2,041.0 | 44 | % | $ | 1,962.6 | 45 | % | ||||||||
Oil and Gas | 1,495.1 | 36 | % | 1,731.4 | 38 | % | 1,628.8 | 38 | % | |||||||||||
Electrical Transmission | 341.5 | 8 | % | 471.9 | 10 | % | 428.8 | 10 | % | |||||||||||
Power Generation and Industrial | 381.6 | 9 | % | 357.0 | 8 | % | 294.3 | 7 | % | |||||||||||
Other | 24.1 | — | % | 14.7 | — | 12.3 | — | |||||||||||||
Eliminations | (7.2 | ) | — | (4.2 | ) | — | (2.0 | ) | — | |||||||||||
Consolidated revenue | $ | 4,208.3 | 100 | % | $ | 4,611.8 | 100 | % | $ | 4,324.8 | 100 | % | ||||||||
See Note 14 - Segments and Related Information in the notes to the audited consolidated financial statements, which is incorporated by reference, for details pertaining to segment classifications, as well as operating results and financial position by segment and significant customer concentrations.
Industry Trends
Our industry is composed of national, regional and local companies that provide services to customers in a range of industries. We believe the following industry trends affect demand for our services:
Demand for Wireless and Wireline/Fiber Communications Network Services
Demand for faster and more reliable wireless and wireline/fiber communications network services has increased significantly with the continued expansion and proliferation of 4th generation (“4G”) wireless service and 1 Gigabit-per-second wireline high-speed internet connectivity, including mobile consumer and business device applications, data transmission, including two-way simultaneous transmission of video and voice data, video and music download services, high definition television, home security, home automation and other advanced data services. Data usage over wireless and wireline/fiber networks is rapidly increasing as new consumers enter the market and existing customers utilize more of these services. In its 2016 Global Mobile Data Traffic Forecast Update, Cisco Systems, Inc. predicted that global mobile data traffic will increase almost eight-fold by 2020, with an expected compound annual growth rate of over 50%. As a result, service providers continue to upgrade the capacity and performance of their communications networks and are deploying competing networks using new technologies to serve this developing market and the increasing need for faster data delivery services, including 4G technology for wireless communications and the deployment of higher speed fiber network technologies. Major carriers are also in the process of testing the next generation of 5G technology for future deployment. In addition to deployment of wireless networks, multiple incumbent as well as new entrants are devoting significant capital expenditures to upgrade wireline/fiber networks to 1-gigabit speeds. We expect these changing dynamics in the mobile and wireline/fiber data markets to create continuing opportunities for providers of wireless and wireline/fiber infrastructure construction services in all North American markets.
5
Additionally, providers in the install-to-the-home market are seeking to expand their service offerings with opportunities in the areas of customer fulfillment, home security and home automation. We believe that we are one of the leading wireline, wireless, install-to-the-home and customer fulfillment contractors in North America and we expect to benefit from these trends.
Demand for Pipeline Infrastructure
Recent technological advances have significantly increased estimates of available North American oil and natural gas reserves. The resulting increase in production levels has significant implications for the construction of pipelines. According to the Department of Energy’s (“DOE”) Annual Energy Outlook 2015, increased levels of natural gas production could lead to the U.S. becoming a net exporter of natural gas by 2017. In addition to developments in the North American oil and gas sector, Mexico has revised its constitution and has adopted other legal measures to authorize and attract foreign investment in the energy sector in order to expand and revitalize Mexico’s energy industry. These initiatives call for a significant shift from fuel oils to more environmentally sensitive and cleaner natural gas. To accomplish this, Mexico has initiated a program for the long-term importation of natural gas from the U.S. to provide for cleaner and more economical electrical power generation and energy usage. Mexican utilities and other entities have recently awarded contracts to MasTec to construct pipelines to move natural gas to the Mexico / U.S. border, and we believe there will be additional pipeline infrastructure opportunities for the import of natural gas from the U.S. to Mexico and within Mexico. Mexico’s importation of inexpensive, reliable and cleaner burning natural gas could lead to a reduction in the cost of electricity, which could be a driving force behind growing economic developments and the creation of infrastructure construction opportunities in other areas, such as power generation, transmission and telecommunications.
Natural gas is one of the cleanest burning hydrocarbon fuels and is in demand because of its relative cost advantage over other fossil fuel sources. Higher availability of low-cost natural gas supplies could substantially increase gas-fired electric generating plant additions, changing the North American fuel mix while increasing dependency on a single, largely domestic fuel type. According to the North American Electric Reliability Corporation’s (“NERC”) 2015 Long-Term Reliability Assessment, natural gas surpassed coal as the predominant fuel source in 2015 and is the leading fuel type for electric power generation. Although drilling and completion activities have been negatively affected by decreases in world oil prices, U.S. energy reserves have increased dramatically. As a result, expanded long-term opportunities for new and expanded pipelines are expected throughout North America. We also believe that U.S. energy policy goals will continue to promote domestic sources of energy in order to reduce U.S. dependence on foreign energy sources, both for economic and national security reasons.
As result of these factors, the level of hydrocarbon pipeline construction activity in North America has grown significantly in the past several years. While the oil markets have experienced significant volatility from declining oil prices beginning in 2014, we believe that the global economy will continue to depend on oil, natural gas and natural gas liquids, which we believe will generate continued opportunities for pipeline infrastructure in the future.
We believe that we are one of the leading pipeline contractors in North America. Our service offerings include the construction and maintenance of large diameter (“long-haul”) pipeline, midstream pipeline, and to a lesser extent, gathering lines and related compressor and pumping stations and treatment plants. We anticipate that future demand for pipeline infrastructure in the North America and internationally should provide pipeline, power generation and heavy industrial construction opportunities and that our diverse capabilities and expertise in these sectors will enable us to continue to be a leading service provider in this market.
Inadequacy of Existing Electrical Power Transmission and Distribution Networks
The U.S. electrical transmission and distribution infrastructure requires significant ongoing maintenance, upgrade and expansion to manage power line congestion and avoid delivery failures. Also, regional shifts in population and industry may also create pockets of demand for increased transmission and distribution construction and upgrades. Expected electrical grid expansions in Canada and Mexico may create additional opportunities for contractors that provide electrical transmission and distribution infrastructure services. According to the DOE’s Annual Energy Outlook 2015, approximately 300 gigawatts of new electricity generating capacity is expected to be added from through 2040, with an increase in electricity generation of almost 25%. Renewable energy generation projects, which are typically in remote areas, may require investment in new transmission lines to interconnect with the electrical grid. In addition, efforts to modernize, secure and visually improve the existing transmission system are expected. We believe significant capital investment in the transmission and distribution system will continue to be required to meet these needs, and MasTec is well positioned in this sector.
Renewable Energy Projects
The recent governmental policy focus on a clean environment, coupled with recent clean air and climate change legislation, regulation and agreements, as well as the desire to decrease U.S. dependence on foreign oil imports, have created demand for more domestic, environmentally sensitive electrical power production, such as wind and solar collection farms. Currently, almost 40 states, as well as the District of Columbia and four territories, have adopted renewable portfolio standards or goals. The DOE’s Annual Energy Outlook 2015 projected approximately 97 gigawatts of new wind and solar capacity over the next ten years. In addition, according to NERC’s 2015 Long-Term Reliability Assessment, greenhouse gas emission regulations, the demand for energy efficiency and the projected continued decline in the cost of renewable resources are expected to continue to incentivize construction of renewable resources throughout North America. We have expertise in wind, solar and industrial plant construction and expect to continue to be a leading player in renewable energy infrastructure projects.
The renewable energy industry is heavily reliant on federal and state tax incentives. The Consolidated Appropriations Act of 2016 (“CAA”) extended certain provisions of the Internal Revenue Code, which contains federal tax incentives applicable to the renewable energy industry. Currently, the tax code provides that the production tax credit for wind projects applies to qualifying projects for which the construction commencement date was prior to January 1, 2020. The credit will be reduced by 20% for 2017, by 40% for 2018, and finally will be reduced by 60% for 2019. Solar projects, however, will be eligible for an investment tax credit (the “Solar ITC”). The Solar ITC is 30% for projects commencing prior to 2020 and is reduced
6
to 26% for projects commencing in 2020 and to 22% for projects commencing in 2021. Thereafter, the Solar ITC will permanently remain at 10%. Other tax incentives applicable to the renewable energy industry include accelerated tax depreciation provisions, including bonus depreciation, for certain renewable energy generation assets, such as equipment using solar or wind energy or energy from geothermal deposits or biomass. These incentives provide for a five-year depreciable life for qualifying assets rather than the longer depreciable lives of many non-renewable energy assets. In addition to a shorter depreciable life, those assets qualifying for bonus depreciation benefit from significant allowable first-year depreciation.
We believe that we are one of the leading renewables contractors in North America and we expect to benefit from these trends.
See Item 1A. “Risk Factors - The renewable energy industry is heavily reliant on tax incentives, the availability of which may be uncertain and could adversely affect demand for our services.”
Heavy Industrial Opportunities
Industrial plant construction opportunities exist in a wide variety of industries. The low price of natural gas is expected to spur the construction of new gas-fired electrical generating plants, conversions of coal-fired power plants to cleaner natural gas and the construction of other plants which use natural gas as a fuel source or chemical feedstock. Industrial facilities and plants that support the biofuels, food processing, natural gas, petroleum and related industries present opportunities as additional domestic energy reserves are produced, transported and processed.
Competitive Strengths
Our competitive strengths include:
Diverse Customer Relationships. We serve a diversified customer and industry base. Our customers include some of the largest communications, utility and power generation companies in North America. We have longstanding relationships and have developed strong alliances with many of our customers, and we strive to maintain these customer relationships and our status as a preferred vendor to our customers.
Reputation for Reliable Customer Service and Technical Expertise. We have established a reputation for quality customer service and technical expertise. Our reputation gives us an advantage when competing for new work, both from existing and potential customers. In addition, we have broad capabilities and expertise in the areas of communications, pipeline, electrical utility, power generation and heavy industrial infrastructure.
North American Footprint. Including our predecessor companies, we have been in business for more than 85 years and are one of the largest companies in the infrastructure construction services industry, with approximately 470 locations and 15,900 employees, operating primarily throughout North America, including the U.S., Canada and Mexico. We offer consistent, comprehensive infrastructure services to our customers and believe that our experience, technical expertise, geographic reach and size are important to our customers.
Ability to Respond Quickly and Effectively. The skills required to serve our end-markets are similar, which allows us to utilize qualified personnel across multiple end-markets and projects. We are able to respond quickly and effectively to industry changes, demand and major weather events by allocating our employees, fleet and other assets as and where they are needed, enabling us to provide cost effective and timely services for our customers.
Experienced Management Team. Our management team plays a significant role in establishing and maintaining long-term relationships with our customers, supporting the growth of our business, integrating acquired businesses and managing the financial aspects of our operations. Our chief executive officer, chief operating officer and business unit presidents have broad industry experience and a deep understanding of our customers and their requirements. Generally, key management personnel of acquired businesses continue to work for us under long-term employment or services agreements.
Socially Responsible Investing
We are committed to socially responsible investing and corporate practices. We are one of the largest renewables contractors in North America, having constructed a significant percentage of North America’s wind farms. Our renewables business also builds solar power plants. In our largest fleet operation, we developed sophisticated routing, scheduling and fuel management programs that significantly reduce our consumption of fuel. Additionally, we have recycling programs for discarded materials and programs for the proper disposition of hazardous wastes. In our Oil and Gas segment, we perform engineering, construction and maintenance services on oil and natural gas pipelines and processing facilities for the energy and utilities industries. In many cases, we are helping consumers and customers access cleaner burning natural gas by providing transportation infrastructure for businesses and consumers that wish to switch to these cleaner burning and lower carbon fuel sources. We also provide state-of-the-art pipeline transportation options, which consume fewer hydrocarbons in the transportation process than do traditional truck and rail transport.
We seek to align the interests of our Board of Directors and management with that of our shareholders. We believe that an independent, well-diversified Board makes us a better corporate citizen, and we have a Board with racial, ethnic, gender and skill diversity. We also believe that our separation of Chairman and CEO further enhances accountability and social responsibility. Our management team and our Board of Directors also have significant ownership in MasTec’s common stock, which further aligns their interests with those of our other shareholders.
We have detailed governance procedures, including an Audit Committee Charter, a Compensation Committee Charter and Nominating and Corporate Governance Committee Charter, as well as a comprehensive Code of Business Conduct and Ethics, Director and Communication Principles and Board of Director Governance Principles, all of which can reviewed on the “Investors” page of our website at MasTec.com.
7
Strategy
The key elements of our business strategy are as follows:
Focus on Growth Opportunities. We believe that our end-markets offer multiple growth opportunities, and we expect continued spending by key customers in many of the industries we serve. We expect expansion of wireless and fiber optic network infrastructure, development of pipeline infrastructure, expansion and upgrades of electrical transmission capacity and the distribution grid, development of power generation infrastructure, including renewable energy sources, and heavy industrial projects to be areas of investment and opportunity in the coming years. We intend to use our broad geographic presence, technical expertise, financial and operational resources, customer relationships and full range of services to capitalize on these trends and grow our business.
Operational Excellence. We seek to improve our operating margins and cash flows by focusing on profitable services and projects that have high margin potential. We also strive to identify opportunities for leverage within our business, such as deploying resources across multiple customers and projects in order to enhance our operating effectiveness and utilization rates, while continuing to maintain strong working capital management practices. We continue to pursue actions and programs designed to achieve these goals, such as increasing accountability throughout our organization, effectively managing customer contract bidding procedures, hiring additional experienced operating and financial professionals and expanding and further integrating the use of our financial and other management information systems.
Maintain Conservative Capital Structure. We evaluate our capital structure on an ongoing basis and have expanded our financial resources in recent years. We believe that we have sufficient capital resources to fund our planned operations and have approximately $500 million of borrowing availability under our revolving credit facility as of December 31, 2015. During the year ended December 31, 2014, we increased aggregate borrowing commitments under our senior secured credit facility to $1.25 billion from $750 million as of December 31, 2013. Additionally, $215 million principal amount of senior convertible notes matured in 2014. In 2013, we repurchased and redeemed $150 million principal amount of 7.625% senior notes due 2017 and issued $400 million principal amount of 4.875% senior notes due 2023. We may consider opportunities to refinance, repurchase or retire outstanding debt or repurchase equity in the future as part of our ongoing capital structure evaluation. See Item 7. “Management’s Discussion and Analysis of Financial Condition and Results of Operations” for discussion of the share repurchase program we completed in April 2015.
Leverage Performance and Core Expertise Through Strategic Acquisitions, Alliances and/or Selected Divestitures. We may pursue selected acquisitions, investments and strategic alliances that will allow us to expand our operations into targeted geographic areas or continue to expand our service offerings in related fields. We have diversified our business and expanded our service offerings and geographical footprint through numerous acquisitions in the last few years. Our strategy includes timely and efficient integration of acquisitions to best fit into our internal control environment and to maximize the potential of acquired businesses. We may also divest certain businesses or assets due to their performance and/or fit within our long-term business strategy.
Services
Our core services are the engineering, building, installing, maintaining and upgrading of infrastructure for communications, utility and power generation customers. We provide similar services to each of these customers, including:
Build. We build infrastructure projects for customers across a range of industries. We specialize in building underground and overhead distribution systems, including trenches, conduits, cable and power lines, which provide wireless and wireline/fiber communications; natural gas, crude oil and refined product transport pipelines; electrical power generation, transmission and distribution systems; power generation infrastructure, including renewable energy; heavy industrial plants; and compressor and pump stations and treatment plants.
Install. We install electrical and other energy distribution and transmission systems, power generation facilities, buried and aerial fiber optic cables, coaxial cables, copper lines, satellite dishes, home security and home automation in a variety of environments for our customers. In connection with our installation work, we deploy and manage network connections that involve our customers’ hardware, software and network equipment.
Maintain and Upgrade. We offer 24 hour/365 days-a-year maintenance and upgrade support to our customers. Our comprehensive service offerings include the regular maintenance of our customers’ distribution facilities, networks and infrastructure, including natural gas and petroleum pipeline, communications, electrical distribution and transmission and power generation infrastructure. We also provide emergency services for accidents or storm damage. Our upgrade work ranges from routine replacements and upgrades to major overhauls.
Customers
We have longstanding relationships with many customers, and often provide services under master service and other service agreements. Our master service agreements are typically exclusive up to a specified dollar amount per work order for each defined geographic area, but do not obligate our customers to undertake any infrastructure projects or other work with us. Work performed under master service and other service agreements is usually generated through work orders, each of which is performed for a fixed fee. Services provided under these agreements range from engineering, project management and installation work to maintenance and upgrade services. Master service and other service agreements are frequently awarded on a competitive bidding basis, although customers are sometimes willing to negotiate contract extensions beyond their original terms without re-bidding. Our master service and other service agreements have various terms, depending upon the nature of the services provided, and typically provide for termination on short or no advance notice. For the years ended December 31, 2015, 2014 and 2013, 48%, 49% and 46% of our revenue, respectively, was derived from projects performed under master service and other service agreements.
The remainder of our work is generated pursuant to contracts for specific projects or jobs that require the construction and installation of an entire infrastructure system or specified units within an infrastructure system. Customers are billed with varying frequency, generally monthly or upon
8
attaining specific milestones. Such contracts may include retainage provisions under which, generally, from 5% to 10% of the contract price is withheld from us until the work has been completed and accepted by the customer.
We believe that our industry experience, technical expertise and reputation for customer service, as well as the relationships developed between our customers and our senior management and project management teams are important to our being retained by our customers. See Note 14 - Segments and Related Information and Note 15 - Commitments and Contingencies in the notes to the audited consolidated financial statements, which are incorporated by reference, for significant customer concentrations.
Backlog
Estimated backlog represents the amount of revenue we expect to realize over the next 18 months from future work on uncompleted contracts, including new contractual agreements on which work has not begun, as well as revenue from change orders and renewal options. Our estimated backlog includes amounts under master service and other service agreements in addition to construction projects and includes our proportionate share of estimated revenue attributable to a proportionately consolidated non-controlled Canadian joint venture. We determine the amount of backlog for work under master service and other service agreements based on historical trends, anticipated seasonal impacts, experience from similar projects and estimates of customer demand based on communications with our customers. The following table presents 18-month backlog by reportable segment, as of the dates indicated:
Reportable Segment (in millions): | December 31, 2015 | September 30, 2015 | December 31, 2014 | ||||||||
Communications | $ | 3,138 | $ | 3,082 | $ | 2,965 | |||||
Oil and Gas | 2,006 | 933 | 756 | ||||||||
Electrical Transmission | 252 | 265 | 296 | ||||||||
Power Generation and Industrial | 265 | 269 | 298 | ||||||||
Other | 13 | 13 | 31 | ||||||||
Estimated 18-month backlog | $ | 5,674 | $ | 4,562 | $ | 4,346 | |||||
We expect to realize approximately 80% of our year end 2015 backlog in 2016. Our backlog estimates include amounts under master service agreements, pursuant to which our customers are not contractually committed to purchase a minimum amount of services; and most of these agreements can be canceled on short or no advance notice. Approximately 50% and 69% of our estimated backlog as of December 31, 2015 and 2014, respectively, represented amounts under master service or other service agreements. In the past, we have occasionally experienced a combination of cancellations and reductions in expected future work from master service agreements as a result of changes in current and planned spending for our wireless customers, as well as cancellations and deferrals of certain oil and gas projects, primarily in western Canada, due to volatility in the oil markets. There can be no assurance as to our customers’ requirements or that our estimates are accurate. In addition, timing of revenue for construction and installation projects included in our backlog can be subject to change as a result of customer delays, regulatory requirements and other project related factors. These changes could cause estimated revenue to be realized in periods later than originally expected, or not at all. As a result, our backlog as of any particular date is an uncertain indicator of future revenue and earnings.
Backlog is not a term recognized under accounting principles generally accepted in the United States (“U.S. GAAP”); however, it is a common measurement used in our industry. Our methodology for determining backlog may not be comparable to the methodologies used by others.
Sales and Marketing
Our customers increasingly require resources from multiple disciplines. Therefore, our subsidiary services companies market their services not only individually, but also in combination with other companies, including other MasTec companies and independent companies, to provide what we believe are the most efficient and effective solutions to meet our customers’ demands. Through our unified MasTec® brand and an integrated organizational structure designed to permit rapid deployment of labor, equipment and materials, we are able to quickly and efficiently allocate resources to meet customer needs. We offer services that are branded under the MasTec® service mark and other service marks.
We have developed a marketing plan emphasizing the MasTec® registered service mark and trade names of certain acquired companies, as well as an integrated service offering to position ourselves as a provider of a full range of service solutions, providing services including installation as well as sophisticated engineering, design and integration. We believe our longstanding relationships with customers and our reputation for reliability and efficiency facilitate our recurring business. Our marketing efforts are principally carried out by the management of our business units and project groups in coordination with our corporate marketing organization. Our management team has many years of industry experience, both at the service provider level, and in some cases, with the customers we serve. Our business unit and project group managers market directly to existing and potential customers for new contracts and also seek our inclusion on lists of vendors invited to submit proposals for service agreements and individual projects. Our executive management supplements these efforts at the national and international level.
Safety and Insurance/Risk Management
We strive to instill and enforce safe work habits in our employees, and we require that our employees participate in training programs relevant to their employment, including all those required by law. We evaluate employees in part based upon their safety records and the safety records of the employees they supervise. We have established a company-wide safety program to share best practices and to monitor and improve compliance with safety procedures and regulations.
9
Our business involves the use of heavy equipment and exposure to potentially dangerous workplace conditions. While we are committed to operating safely and prudently, we are subject to claims by employees, customers and third parties for property damage and personal injuries that occur in connection with our work. Our insurance policies are subject to high deductibles and we are self-insured up to the amount of the deductible. We maintain insurance policies for workers’ compensation, general liability and automobile liability that are subject to per claim deductibles. We also maintain excess umbrella coverage and an insurance policy with respect to employee group medical claims. We are required to post letters of credit and provide cash collateral to certain of our insurance carriers and to provide surety bonds in certain states. See Note 15 - Commitments and Contingencies in the notes to the audited consolidated financial statements, which is incorporated by reference.
Suppliers, Materials and Working Capital
Under many of our contracts, our customers provide the necessary materials and supplies for projects and we are responsible for the installation of, but not the cost or warranty of those materials. Under certain other projects, we purchase the necessary materials and supplies on behalf of our customers from third-party providers. We are not dependent on any one vendor and have not experienced any significant difficulty in obtaining project-related materials or supplies as and when required.
We utilize independent contractors to assist on projects and to help us manage our work flow. Our independent contractors are typically sole proprietorships or small business entities that provide their own vehicles, tools and insurance coverage. We are not dependent on any one independent contractor. We need working capital to support seasonal variations in our business, such as the impact of weather conditions on external construction and maintenance work and the spending patterns of our customers, both of which influence the timing of associated spending to support related customer demand. See Item 7. “Management’s Discussion and Analysis of Financial Condition and Results of Operations - Financial Condition, Liquidity and Capital Resources - Working Capital,” which is incorporated by reference.
Competition
Our industry is highly competitive and highly fragmented. We compete with a number of companies in the markets in which we operate, ranging from small local independent companies to large national firms. The national or large regional firms that compete with us include Quanta Services, Inc., MYR Group, Inc., Dycom Industries, Inc., Pike Electric, Inc., Willbros Group, Jacobs Engineering Group Inc., Bechtel Corporation, D.H. Blattner & Sons, Inc., M.A. Mortenson Company, General Dynamics, Black & Veatch and Nexius.
Relatively few significant barriers to entry exist in the markets in which we operate, and as a result, any organization that has adequate financial resources and access to technical expertise may become a competitor. Some of our customers employ their own personnel to perform infrastructure services of the type we provide. We compete based upon our industry experience, technical expertise, financial and operational resources, geographic presence, industry reputation and customer service. While we believe our customers consider a number of factors when selecting a service provider, they award most of their work through a bid process. Consequently, price is often a principal factor in determining which service provider is selected.
Regulation and Environmental Matters
We are subject to state and federal laws that apply to businesses generally, including laws and regulations related to labor relations, worker safety and environmental protection. While many of our customers operate in regulated industries (for example, utilities regulated by the public service commission or communications companies regulated by the Federal Communications Commission (“FCC”), we are not generally subject to such regulation and oversight.
As a contractor, our operations are subject to various laws, including:
• | regulations related to vehicle registrations, including those of the states and the U.S. Department of Transportation (“DOT”); |
• | regulations related to worker safety and health, including those established by the Occupational Safety and Health Administration (“OSHA”) and state equivalents; |
• | contractor licensing requirements; |
• | permitting and inspection requirements; and |
• | building and electrical codes. |
We are also subject to numerous environmental laws, including the handling, transportation and disposal of non-hazardous and hazardous substances and wastes, as well as emissions and discharges into the environment, including discharges into air, surface water, groundwater and soil. We also are subject to laws and regulations that impose liability and cleanup responsibility for releases of hazardous substances into the environment. Under certain of these laws and regulations, liabilities can be imposed for cleanup of properties, regardless of whether we directly caused the contamination or violated any law at the time of discharge or disposal. The presence of contamination from such substances or wastes could interfere with ongoing operations or adversely affect our business. In addition, we could be held liable for significant penalties and damages under certain environmental laws and regulations. See Item1A. “Risk Factors - Our failure to comply with environmental laws could result in significant liabilities.”
We believe we have all material licenses and permits needed to conduct operations and that we are in material compliance with applicable regulatory requirements. However, if we fail to comply with applicable regulatory requirements, we could incur significant liabilities.
10
Financial Information About Geographic Areas
We operate throughout North America, primarily in the United States and Canada, as well as in Mexico and in other countries in Latin America. For the years ended December 31, 2015, 2014 and 2013, revenue of $3.6 billion, $3.9 billion and $4.1 billion, respectively, was derived from U.S. operations, and revenue of $575 million, $700 million and $268 million, respectively, was derived from foreign operations, primarily in Canada. The majority of our foreign operations during the years ended December 31, 2015, 2014 and 2013 were in our Oil and Gas segment. Long-lived assets held in the U.S. included property and equipment, net, of $465 million, $494 million and $437 million as of December 31, 2015, 2014 and 2013, respectively. Long-lived assets held in foreign countries, primarily in Canada, included property and equipment, net, of $94 million, $129 million and $51 million as of December 31, 2015, 2014 and 2013, respectively. Intangible assets and goodwill, net, of approximately $1.1 billion, $1.1 billion and $1.0 billion as of December 31, 2015, 2014 and 2013, respectively, related to our U.S. operations. Intangible assets and goodwill, net, of $107 million, $228 million and $93 million as of December 31, 2015, 2014 and 2013, respectively, related to businesses in foreign countries, primarily in Canada. Foreign customers accounted for approximately 17%, 20% and 9% of our consolidated net accounts receivable position as of December 31, 2015, 2014 and 2013, respectively, which represents accounts receivable, net, less billings in excess of costs and earnings.
Employees
As of December 31, 2015, we had approximately 15,900 employees, approximately 1,000 of whom were represented by unions or were subject to collective bargaining agreements. See Note 11 - Other Retirement Plans in the notes to the audited consolidated financial statements, which is incorporated by reference.
We hire employees from a number of sources, including our industry, trade schools, colleges and universities. Our primary sources for employees include promotion from within, team member referrals, print and internet advertising and direct recruiting. We attract and retain employees by offering competitive salaries, technical training opportunities, bonus opportunities, stock ownership and a comprehensive benefits package. We believe that our focus on training and career development helps us to attract and retain employees. Our employees participate in ongoing educational programs, many of which are internally developed, to enhance their technical and management skills through classroom and field training. We provide opportunities for promotion and mobility within our organization, which we also believe helps us to retain our employees. We believe we have good employee relations.
Available Information
A copy of this Annual Report on Form 10-K, as well as our Quarterly Reports on Form 10-Q, Current Reports on Form 8-K and any amendments to those reports filed or furnished pursuant to Section 13 or 15(d) of the Securities Exchange Act of 1934 are available free of charge on the internet at our website, www.mastec.com, as soon as reasonably practicable after we electronically file these reports with, or furnish these reports to the SEC. Copies of our Board of Directors Governance Principles and Code of Business Conduct and Ethics, which applies to all directors and employees, and includes a code of ethics for our Chief Executive Officer (“CEO”), Chief Financial Officer (“CFO”) and other senior executives, and which expressly applies to our senior financial officers (including our principal executive officer, principal financial officer and our controller), and the charters for each of our Audit, Compensation and Nominating and Corporate Governance Committees are also available on our website in the Investors section under the tab “Corporate Governance,” or may be obtained by contacting our Vice President of Investor Relations by phone at (305) 406-1815, or by email at investor.relations@mastec.com. We intend to provide any amendments or waivers to our Code of Business Conduct and Ethics for any of our directors and senior officers on our website within four business days of any such amendment or waiver. The reference to our website address does not constitute incorporation by reference of the information contained on the website and such information is not part of this report. Our reports filed with the SEC may be accessed at the SEC’s website at www.sec.gov, or alternatively, may be read or copied at the SEC’s Public Reference Room at 100 F Street, NE, Washington, D.C. 20549. Information on the operation of the SEC’s Public Reference Room may be obtained by calling the SEC at 1-800-SEC-0330.
Use of our Website to Distribute Material Company Information
We use our website as a channel of distribution for important company information. We routinely post on our website important information, including press releases, investor presentations and financial information, which may be accessed by clicking on the Investors section of www.mastec.com. We also use our website to expedite public access to time-critical information regarding our company in advance of or in lieu of distributing a press release or a filing with the SEC disclosing the same information. Therefore, investors should look to the Investor Relations subpage of our website for important and time-critical information. Visitors to our website can also register to receive automatic e-mail and other notifications alerting them when new information is made available on the Investor Relations subpage of our website.
ITEM 1A. | RISK FACTORS |
You should carefully consider the risks described below, together with all of the other information in this Annual Report on Form 10-K. If any of these risks actually occur, our business, financial condition and results of operations could suffer, and the trading price of our common stock could decline.
Risks Related to Our Industry and Our Customers’ Industries
Demand for pipeline construction services depends on oil and natural gas industry activity and expenditure levels that are directly affected by trends in oil, natural gas and other fuel prices and the cost of energy infrastructure projects.
Demand for our pipeline construction services is sensitive to the level of exploration, development, production, transportation, processing and refining activity of, and the corresponding capital spending by, oil and natural gas companies and demand by industrial and utility customers. Prices
11
for oil and natural gas are potentially subject to large fluctuations in response to changes in the supply of, and demand for, oil and natural gas, as well as market uncertainty and a variety of other factors that are beyond our control. An example is the recent volatility experienced by the oil markets due to declining oil prices beginning in 2014, which has had a significant effect on pipeline activities in western Canada. Decreasing prices for oil and natural gas generally depress levels of exploration, development and production activity, which could result in a corresponding decline in demand for, and/or our customers’ ability to finance, pipeline construction services. Factors affecting the prices of oil and natural gas include:
• | world-wide levels of supply and demand for, and prices of, oil and natural gas generally, and demand for natural gas in the United States in particular; |
• | oil and gas quality and field location, both of which affect price and producer economics; |
• | governmental regulations, including policies regarding the exploration, production, development and transportation of oil and natural gas, as well as environmental laws and initiatives to control global warming; |
• | global weather conditions and natural disasters; |
• | worldwide political, military and economic conditions; the level of oil production by non-Organization of the Petroleum Exporting Countries (“OPEC”) suppliers and available excess production capacity within OPEC; |
• | oil refining capacity, refiner blending shifts and shifts in end-customer preferences toward fuel efficiency and the use of natural gas; |
• | the cost of producing and delivering oil and gas; and |
• potential acceleration of development of alternative fuels.
Historically and recently, the markets for oil and gas have been volatile and are likely to continue to be volatile. Spending on exploration and production activities by large oil and gas companies has a significant impact on the demand for pipeline construction services. Furthermore, pipelines have competition from rail and trucking companies that also transport hydrocarbons. In addition, demand for pipeline construction services may be affected by the costs of energy exploration and the construction of energy infrastructure projects. For example, while an increase in oil and gas prices may cause an increase in oil and gas exploration, production and transportation activity, the associated increase in demand for equipment, materials and labor required for such exploration and activity may increase their costs and dampen demand for our services. Furthermore, increased costs for raw materials such as steel and other commodities may make some projects uneconomical, thus reducing demand for our pipeline construction services. Low oil and gas prices might lessen the demand for our services. A decrease in demand for our pipeline construction services could materially and adversely affect our results of operations, cash flows and liquidity.
Many of the industries we serve are subject to customer consolidation, rapid technological and regulatory changes, and our inability or failure to adjust to our customers’ changing needs could result in decreased demand for our services.
We derive a substantial portion of our revenue from customers in the communications, utilities and power generation industries, which are subject to consolidation, rapid changes in technology and governmental regulation. Consolidation could result in the loss of one or more of, or affect spending by, our significant customers, including, for example, the July 2015 acquisition of DIRECTV® by AT&T, which could have an adverse effect on demand for our services. Additionally, changes in technology may reduce demand for the services we provide. For example, the telecommunications industry is characterized by rapid technological change, intense competition and changing consumer demands. New technologies, or upgrades to existing technologies by customers, could reduce demand for our services. New technologies could displace existing technologies, such as the wireline/fiber or wireless systems that we install for our customers who currently use them to deliver services to consumers and businesses. Furthermore, improvements in existing technologies could allow communications providers to significantly improve their networks without physically upgrading them. Technological advances may also result in lower costs for sources of energy, which may render existing renewable energy and natural gas projects and technologies uncompetitive or obsolete. Our failure to rapidly adopt and master new technologies as they are developed in any of the industries we serve could have a material adverse effect on our results of operations, cash flows and liquidity. Furthermore, our customers in the communications, utilities and power generation industries face stringent regulatory and environmental requirements and permitting processes as they implement plans for their projects, which could result in delays, reductions and cancellations of some of their projects and which could materially and adversely affect our results of operations, cash flows and liquidity.
Economic downturns could reduce capital expenditures in the industries we serve, which could result in decreased demand for our services.
The demand for our services has been, and will likely continue to be, cyclical in nature and vulnerable to general downturns in the U.S. economy and the economies of other countries in which we operate. During economic downturns, our customers may not have the ability to fund capital expenditures for infrastructure, or may have difficulty obtaining financing for planned projects. In addition, uncertain or adverse economic conditions that create volatility in the credit and equity markets may reduce the availability of debt or equity financing for our customers, causing them to reduce capital spending. This has resulted, and in the future could result in cancellations of projects or deferral of projects to a later date. Such cancellations or deferrals could result in decreased demand for our services and could materially adversely affect the results of our operations, cash flows and liquidity. These conditions make it difficult to estimate our customers’ demand for our services and add uncertainty to the determination of our backlog.
In addition, our customers are negatively affected by economic downturns that decrease the need for their services or the profitability of their services. Slow-downs in real estate, fluctuations in commodity prices and decreased demand by end-customers for services could affect our customers and their capital expenditure plans. We continually monitor our customers’ industries and their relative health compared to the economy as a whole because we have previously been negatively impacted by economic downturns. Reductions in new housing starts, for example, have negatively affected our customers who utilize our services to construct their “last mile” of communications infrastructure, and such reductions have also had negative impacts
12
on other industries we serve, including electrical utility transmission and grid connection as well as pipeline construction. Additionally, our customers who provide satellite and other communications services to consumers could be adversely impacted by an economic downturn if new subscriptions and upgrades for new and existing consumers are not ordered at the rate that our customers anticipate. During an economic downturn, our customers also may not have the ability or desire to continue to fund capital expenditures for infrastructure or may outsource less work. A decrease in any of these projects, new subscriptions or upgrades could negatively impact demand for the services we provide and could materially adversely affect our results of operations, cash flows and liquidity.
Our customers may be adversely affected by market conditions and economic downturns, which could impair their ability to pay for our services.
Slowing conditions in the industries we serve, economic downturns or bankruptcies within these industries, may impair the financial condition of one or more of our customers and hinder their ability to pay us on a timely basis. In the past, we incurred significant losses after a number of customers filed for bankruptcy or experienced financial difficulties following a general economic downturn, in which certain industry factors worsened the impact of the overall economic downturn on those customers. In difficult economic times, some of our clients may find it difficult to pay invoices for our services on a timely basis, increasing the risk that our accounts receivable could become uncollectible and ultimately be written off. In certain cases, our clients are project-specific entities that do not have significant assets other than their interests in the project. From time to time, it may be difficult for us to collect payments owed to us by these clients. Delays in client payments may require us to make a working capital investment, which could impact our cash flows and liquidity. If a client fails to pay invoices on a timely basis or defaults in making its payments on a project in which we have devoted significant resources, there could be a material adverse effect on our results of operations and liquidity.
Our industry is highly competitive, which may reduce our market share and harm our financial performance.
Our industry is highly fragmented, and we compete with other companies in most of the markets in which we operate, ranging from small independent firms servicing local markets to larger firms servicing regional and national markets. We also face competition from existing and prospective customers that employ in-house personnel to perform some of the services we provide. There are relatively few barriers to entry into certain of the markets in which we operate and, as a result, any organization that has adequate financial resources and access to technical expertise and skilled personnel may become a competitor. Most of our customers’ work is awarded through a bid process. Consequently, price is often the principal factor that determines which service provider is selected, especially on smaller, less complex projects. Smaller competitors sometimes win bids for these projects based on price alone due to their lower costs and financial return requirements. However, our bids for certain projects may not be successful because of a customer’s perception of our relative ability to perform the work as compared to our competitors or a customer’s perception of technology advantages held by our competitors as well as other factors. Our results of operations, cash flows and liquidity could be materially and adversely affected if we are unsuccessful in bidding for projects or renewing our master service agreements, or if our ability to win such projects or agreements requires that we accept lower margins. We also face competition from the in-house service organizations of our existing or prospective customers. As such, we cannot be certain that our existing or prospective customers will continue to outsource services in the future, either at the same rate, or at all.
Risks Related to Our Business
Our failure to properly manage projects, or project delays, may result in additional costs or claims, which could have a material adverse effect on our operating results, cash flows and liquidity.
Certain of our engagements involve large-scale, complex projects that may occur over extended time periods. The quality of our performance on such a project depends in large part upon our ability to manage our client relationship and the project itself and to timely deploy appropriate resources, including third-party contractors and our own personnel. Our results of operations, cash flows and liquidity have, in the current year, and in the future could be, adversely affected if we miscalculate the resources or time needed to complete a project with capped or fixed fees, or the resources or time needed to meet contractual milestones. Additionally, delays on a particular project, including delays in designs, engineering information or materials provided by the customer or a third party, delays or difficulties in equipment and material delivery, schedule changes, delays from a customer’s failure to timely obtain permits or rights-of-way or to meet other regulatory requirements, weather-related delays, permitting delays and other factors, some of which are beyond our control, may cause us to incur costs for standby pay, and may lead to personnel shortages on other projects scheduled to commence at a later date.
We also may encounter project delays due to local opposition, which may include injunctive actions as well as public protests to the siting of electric power, natural gas or oil transmission lines, solar or wind projects, or other facilities, and such delays could adversely affect our project margins. In addition, some of our agreements require that we share in cost overages or pay liquidated damages if we do not meet project deadlines; therefore, any failure to properly estimate or manage cost or delays in the completion of projects, could subject us to penalties, which could adversely affect our results of operations, cash flows and liquidity. Further, any defects or errors, or failures to meet our customers’ expectations could result in large damage claims against us, and because of the substantial cost of, and potentially long lead-times necessary to acquire certain of the materials and equipment used in our complex projects, such as pipeline and power generation, including renewable energy, damage claims may substantially exceed the amount we can charge for our associated services.
We may not accurately estimate the costs associated with services provided under fixed price contracts, which could impair our financial performance.
We derive a significant portion of our revenue from fixed-price master service and other service agreements. Under these contracts, we typically set the price of our services on a per unit or aggregate basis and assume the risk that costs associated with our performance may be greater than anticipated. In addition to master or other service agreements, we enter into contracts for specific projects or jobs that may require the installation or construction of an entire infrastructure system or specified units within an infrastructure system. Under those agreements, we contractually agree to a price per unit. Profitability will be reduced if the actual costs to complete each unit exceed original estimates. We are also required to immediately recognize the full amount of any expected losses on these projects if estimated costs to complete the remaining work for the projects exceed the revenue to be earned. Our profitability is therefore dependent upon our ability to accurately estimate the costs associated with our services and our ability to
13
execute in accordance with our plans. A variety of factors affect these costs, such as lower than anticipated productivity, conditions at work sites differing materially from those anticipated at the time we bid on the contract and higher costs of materials and labor. These variations, along with other risks inherent in performing fixed price contracts, may cause actual project revenue and profits to differ from original estimates. As a result, if actual costs exceed our estimates, certain agreements or projects could have lower margins than anticipated, or losses, which could reduce our profitability, cash flows and liquidity.
Our failure to recover adequately on claims against project owners, subcontractors or suppliers for payment or performance could have a material adverse effect on our financial results.
We occasionally bring claims against project owners for additional costs that exceed the contract price or for amounts not included in the original contract price. Similarly, we present change orders and claims to our subcontractors and suppliers. If we fail to properly document the nature of change orders or claims, or are otherwise unsuccessful in negotiating a reasonable settlement, we could incur reduced profits, cost overruns or a loss on the project. These types of claims can often occur due to matters such as owner-caused delays, changes from the initial project scope, which result in additional cost, both direct and indirect, or from project or contract terminations. From time to time, these claims can be the subject of lengthy and costly proceedings, and it is often difficult to accurately predict when these claims will be fully resolved. When these types of events occur and unresolved claims are pending, we may invest significant working capital in projects to cover cost overruns pending the resolution of the relevant claims. A failure to promptly recover on these types of claims could have a material adverse effect on our liquidity and financial results.
Our business may be affected by difficult work sites and environments, which could cause delays, increase our costs and reduce profitability.
We perform work under a variety of conditions, including, but not limited to, challenging and hard to reach terrain and difficult site conditions. Performing work under such conditions can result in project delays or cancellations, potentially causing us to incur additional, unanticipated costs, reductions in revenue or the payment of liquidated damages. In addition, some of our contracts require that we assume the risk should actual site conditions vary from those expected. Some of our projects involve challenging engineering, procurement and construction phases, which may occur over extended time periods. We may encounter difficulties in engineering, delays in designs or materials provided by the customer or a third party, equipment and material delivery delays, schedule changes, delays from customer failure to timely obtain rights-of-way, weather-related delays, delays by subcontractors in completing their portion of the project and other factors, some of which are beyond our control, but which affect our ability to complete a project as originally scheduled. In some cases, delays and additional costs may be substantial, and we may be required to cancel a project and/or compensate the customer for the delay. We may not be able to recover any of such costs. Any such delays or cancellations or errors or other failures to meet customer expectations could result in damage claims substantially in excess of the revenue associated with a project. Delays or cancellations could also negatively impact our reputation or relationships with our customers, which could adversely affect our ability to secure new contracts.
We recognize revenue from installation/construction fixed price contracts, as well as for certain projects pursuant to master and other service agreements, using the percentage-of-completion method; therefore, variations of actual results from our assumptions may reduce our profitability.
We recognize revenue from installation/construction fixed price contracts, as well as for certain projects pursuant to master and other service agreements, using the percentage-of-completion method, measured by the percentage of costs incurred to date to total estimated costs for each contract. The cumulative amount of revenue recorded on a contract at a specified point in time is the percentage of total estimated revenue that incurred costs to date bear to estimated total contract costs. The percentage-of-completion method, therefore, relies on estimates of total expected contract costs. Contract revenue and total cost estimates are reviewed and revised periodically as the work progresses. Adjustments are reflected in contract revenue in the fiscal period in which such estimates are revised. Estimates are based on management’s reasonable assumptions, judgment and experience, but are subject to the risks inherent in estimates, including unanticipated delays or technical complications. Variation of actual results from estimates on a large project or on a number of smaller projects could be material. We immediately recognize the full amount of an estimated loss on a contract when our estimates indicate such a loss. Such adjustments and accrued losses could result in reduced profitability, which could negatively impact our liquidity and results of operations. See the discussion of the previously identified material weakness in our internal control over financial reporting in Part II - Item 9A. “Controls and Procedures” of this 2015 Form 10-K.
We derive a significant portion of our revenue from a few customers, and the loss of one or more of these customers, or a reduction in their demand for our services, could impair our financial performance.
Giving retroactive effect to the July 2015 acquisition of DIRECTV® by AT&T, we derived approximately 32%, 33% and 32% of our revenue from AT&T for the years ended December 31, 2015, 2014 and 2013, respectively. We derived approximately 8% and 18% and of our revenue from Enbridge, Inc. for the years ended December 31, 2014 and 2013, respectively. Our revenue could significantly decline if we were to lose one or more of our significant customers, or if one or more of our customers elected to perform the work that we provide with in-house service teams. Our top ten customers accounted for approximately 61%, 66% and 71% of our revenue for the years ended December 31, 2015, 2014 and 2013, respectively. Because our business is concentrated among relatively few major customers, and certain of our services are provided on a non-recurring, project by project basis, our results of operations, cash flows and liquidity could be negatively affected if these customers reduce the amount of business they provide to us, or if we complete the required work on our projects for these customers and cannot replace them with similar projects. Just over half of our revenue for the year ended December 31, 2015 was derived from non-recurring project specific work. In addition, many of the contracts with our largest customers may be canceled on short or no advance notice. Any of these factors could negatively impact our results of operations, cash flows and liquidity.
We maintain a workforce based upon current and anticipated workloads. If we do not receive future contract awards, if these awards are delayed, or if there is a significant reduction in the level of work we provide under master service agreements, we could incur significant costs and reduced profitability from underutilization of our workforce.
14
Our estimates of future performance and results of operations depend on, among other matters, whether and when we will receive certain new contract awards, including the extent to which we utilize our workforce. The rate at which we utilize our workforce is impacted by a variety of factors including our ability to manage attrition, our ability to forecast our need for services, which allows us to maintain an appropriately sized workforce, our ability to transition employees from completed projects to new projects or between internal business groups and our need to devote resources to non-chargeable activities such as training or business development. While our estimates are based upon our good faith judgment, these estimates can be unreliable and may frequently change based on newly available information. In the case of large-scale projects where timing is often uncertain, it is particularly difficult to predict whether and when we will receive a contract award. The uncertainty of contract award timing can present difficulties in matching our workforce size with our contract needs. If an expected contract award is delayed or not received, we could incur costs resulting from reductions in staff or redundancy of facilities, which could reduce our profitability and cash flows.
Most of our contracts may be canceled on short or no advance notice, which could reduce our revenue, and certain of our contracts with customers are subject to their ability to secure financing or other conditions and therefore may not result in revenue or profits.
Most of our contracts are cancelable on short or no advance notice, ranging from immediate cancellation to cancellation upon 180 days notice, even if we are not in default under the contract. Many of our contracts, including our service agreements, are periodically open to public bid. We may not be the successful bidder on our existing contracts that are re-bid. We also provide a significant portion of our services on a non-recurring, project-by-project basis. We could experience a reduction in our revenue, profitability and liquidity if: (i) our customers cancel a significant number of contracts; (ii) we fail to win a significant number of our existing contracts upon re-bid; or (iii) we complete the required work under a significant number of our non-recurring projects and cannot replace them with similar projects. Additionally, from time to time, we enter into contracts that contain financing or other conditions, which must be satisfied before we may begin work; therefore, certain of these contracts may not result in revenue or profits if our customers are unable to obtain financing or to satisfy any other conditions associated with such projects.
Claims, lawsuits and proceedings could reduce our profitability, cash flows and liquidity.
We are subject to various claims, lawsuits and proceedings that arise in the ordinary course of business, including governmental and other regulatory investigations and proceedings. These actions may seek, among other things, compensation for alleged personal injury, workers’ compensation, employment discrimination, breach of contract, property damage, punitive damages, civil penalties or other losses, liquidated damages, consequential damages, or injunctive or declaratory relief. In addition, pursuant to our service agreements, we generally indemnify our customers for claims related to the services we provide. Claimants may seek large damage awards and defending claims can involve significant costs. When appropriate, we establish reserves against these items that we believe to be adequate in light of current information, legal advice and professional indemnity insurance coverage, and we adjust such reserves from time to time according to case developments. See Note 15 - Commitments and Contingencies in the notes to the audited consolidated financial statements, which is incorporated by reference. If our legal reserves are inadequate, our insurance coverage proves to be inadequate or becomes unavailable, or our self-insurance liabilities are higher than expected, we could experience a reduction in our profitability and liquidity. Furthermore, because litigation is inherently uncertain, an adverse determination on any such claim, lawsuit or proceeding could have a material adverse effect on our business, financial condition or results of operations. In addition, claims, lawsuits and proceedings may harm our reputation or divert management resources away from operating our business, and cause us to incur significant expenses. There can be no assurance that the results of any of these actions will not have a material adverse effect on our business, results of operations or financial condition.
We may choose, or be required, to pay our subcontractors even if our customers do not pay, or delay paying us for the related services.
We use subcontractors to perform portions of our services. In some cases, we pay our subcontractors before our customers pay us for the related services. We could experience a material decrease in profitability and liquidity if we choose, or are required, to pay our subcontractors for work performed for customers that fail to pay, or delay paying us for the related work.
Our subcontractors may fail to satisfy their obligations to us or other parties, or we may be unable to maintain these relationships, either of which may have a material adverse effect on our results of operations, cash flows and liquidity.
We depend on subcontractors to perform work on some of our projects. There is a risk that we may have disputes with subcontractors arising from, among other things, the quality and timeliness of work performed by the subcontractors, customer concerns about the subcontractors or our failure to extend existing work orders or issue new work orders under a subcontract. If any of our subcontractors fail to deliver on a timely basis the agreed-upon supplies and/or perform the agreed-upon services, then our ability to fulfill our obligations as a prime contractor may be jeopardized. In addition, the absence of qualified subcontractors with whom we have satisfactory relationships could adversely affect the quality of our service and our ability to perform under some of our contracts. Any of these factors may have a material adverse effect on our results of operations, cash flows and liquidity.
In addition, we rely on suppliers to obtain the necessary materials for certain projects. We also rely on equipment manufacturers and lessors to provide us with the equipment we require to conduct our operations. Although we are not dependent on any single supplier or equipment manufacturer or lessor, any substantial limitation on the availability of required suppliers or equipment could negatively affect our operations. Market and economic conditions may contribute to a lack of available suppliers or equipment. To the extent we cannot acquire materials or equipment, we could experience a material adverse effect on our results of operations, cash flows and liquidity.
Our participation in strategic arrangements, including equity method investments and contractual joint ventures, exposes us to numerous risks.
We have certain strategic arrangements, including equity method investments and a proportionately consolidated non-controlled Canadian joint venture. The purpose of these strategic arrangements is typically to combine our skills and resources with those of others to allow for the performance of particular projects. We do not control the day-to-day operations of these businesses. Success on such strategic arrangements depends in large part on whether our partners satisfy their contractual and performance obligations. In certain of these strategic arrangements, we and our partners are jointly and severally liable for liabilities and obligations of the entity or venture. If one of our partners fails to perform or is financially unable to bear its portion
15
of required capital contributions or other obligations, including liabilities stemming from claims or lawsuits, we could be required to make additional investments, provide additional services or pay more than our proportionate share of a liability to make up for our partner’s shortfall. Further, if we are unable to adequately address our partner’s performance issues, the customer(s) may terminate the project(s), which could result in legal liability to us, harm our reputation and could materially adversely affect our results of operations, cash flows and liquidity. In addition, we have incurred, and in the future could continue to incur, losses from our equity method investments and proportionately consolidated non-controlled joint venture. We also have, and in the future could be subject to, a write-down of a portion or all of the net investment related to such arrangements. See Note 3 - Acquisitions and Note 5 - Fair Value of Financial Instruments in the notes to the audited consolidated financial statements, which notes are incorporated by reference.
Our operations in existing international markets, or expanding into additional international markets, may not be successful and could expose us to risks, including the failure to comply with the U.S. Foreign Corrupt Practices Act and other similar anti-bribery laws, which could harm our business and prospects.
We derived 14% of our revenue for the year ended December 31, 2015 from international markets, and we may further expand the volume of international services we provide as well as the foreign geographic territories in which we operate. Our international operations are presently conducted primarily in Canada, Mexico and in other countries in Latin America, but we have performed work in various other foreign countries, and revenue derived from, or the number of countries in which we operate, could expand over the next few years. Economic conditions, including those resulting from wars, civil unrest, acts of terrorism and other conflicts, or volatility in the global markets may adversely affect our customers, their demand for our services and their ability to pay for our services. In addition, there are numerous risks inherent in conducting our business internationally, including, but not limited to, potential instability in international markets, changes in regulatory requirements applicable to international operations, foreign currency fluctuations, exchange controls and other limits on our ability to repatriate earnings, political, economic and social conditions in foreign countries and complex U.S. and foreign laws and treaties, including tax laws and the U.S. Foreign Corrupt Practices Act (the “FCPA”). These risks could restrict our ability to provide services to international customers or to operate our international business profitably, and our overall business and results of operations could be negatively affected by our foreign activities.
The FCPA and similar anti-bribery laws in other jurisdictions prohibit U.S.-based companies and their intermediaries from making improper payments for the purpose of obtaining or retaining business. We pursue opportunities in certain parts of the world that experience corruption to some degree, and, in certain circumstances, compliance with anti-bribery laws may conflict with local customs and practices. Our policies mandate compliance with these anti-bribery laws. Further, we require our subcontractors, agents and others who work for us or on our behalf to comply with the FCPA and other anti-bribery laws. Although we have policies and procedures designed to ensure that we, our employees and our agents comply with the FCPA and other anti-bribery laws, there is no assurance that such policies or procedures will protect us against liability under the FCPA or other laws for actions taken by our agents, employees and intermediaries. If we are found to be liable for FCPA violations (either due to our own acts or our inadvertence, or due to the acts or inadvertence of others), we could incur severe criminal or civil penalties or other sanctions, which could have a material adverse effect on our reputation, business, results of operations or cash flows. In addition, detecting, investigating and resolving actual or alleged FCPA violations is expensive and can consume significant time and attention of our senior management.
We are subject to foreign exchange and currency risks that could adversely affect our operations, and our ability to reinvest earnings from operations, as well as mitigate our foreign exchange risk through hedging transactions may be limited.
We generally attempt to denominate our contracts in U.S. dollars or in the currencies of our costs. In the past, however, we have entered, and in the future we may enter into new contracts in foreign locations that are denominated in currencies other than U.S. dollars, subjecting us to currency risk exposure, particularly when the contract revenue is denominated in a currency different from the contract costs. Certain portions of our consolidated revenue and consolidated operating expenses are in foreign currencies. As a result, we are subject to significant foreign currency risks, including risks resulting from changes in foreign exchange rates and limitations on our ability to reinvest earnings from operations in one country to fund the financing requirements of our operations in other countries.
If we are unable to attract and retain qualified managers and skilled employees, we will be unable to operate efficiently, which could reduce our revenue, profitability and liquidity.
Our business is labor intensive, and some of our operations experience a high rate of employee turnover. In addition, given the nature of the highly specialized work we perform, many of our employees are trained in and possess specialized technical skills that are necessary to operate our business and maintain productivity and profitability. At times of low unemployment rates in the areas we serve, it can be difficult for us to find qualified and affordable personnel. We may be unable to hire and retain a sufficiently skilled labor force necessary to support our operating requirements and growth strategy. Our labor and training expenses may increase as a result of a shortage in the supply of skilled personnel. We may not be able to pass these expenses on to our customers, which could adversely affect our profitability. Additionally, our business is managed by a number of key executive and operational officers and is dependent upon retaining and recruiting qualified management. Labor shortages, increased labor or training costs, or the loss of key personnel could materially adversely affect our results of operations, cash flows and liquidity.
The renewable energy industry is heavily reliant on tax incentives, the availability of which may be uncertain and could adversely affect demand for our services.
Because the unsubsidized cost of electric power from renewable resources such as wind and solar often exceeds that of fossil fuel and nuclear generating facilities, the renewable energy industry is heavily reliant on tax incentives. These tax incentives effectively reduce the market price at which renewable energy can be sold, which spurs investment in renewable energy facilities. These tax incentives, however, have a finite duration. The finite duration of these tax incentives creates uncertainty for developers of renewable energy facilities and may adversely affect investment in them and, accordingly, demand for our services. As a result, we cannot predict the impact that tax incentive legislation will have on the demand for our services. For example, the current election to claim the investment tax credit in lieu of the production tax credit is available only for qualified wind facilities on which construction commenced prior to January 1, 2020. The credit will be reduced by 20% for 2017, by 40% for 2018, and finally will be reduced by
16
60% for 2019. Solar Projects, however, will be eligible for an investment tax credit (the “Solar ITC”). The Solar ITC is 30% for projects commencing prior to 2020 and is reduced to 26% for projects commencing in 2020 and to 22% for projects commencing in 2021. Thereafter, the Solar ITC will permanently remain at 10%. Whether the investment tax credit will be effective in the future for wind, solar or other renewable energy projects is uncertain, as are any future efforts to extend or renew the production tax credit and the investment tax credit. Furthermore, the provisions regarding any extension or renewal may not be as favorable as those that currently exist. We cannot assure you that any extension or renewal of the production tax credit and/or the investment tax credit would be enacted prior to their expiration or, if allowed to expire, that any extension or renewal enacted thereafter would be enacted with retroactive effect. We also cannot assure you that the tax laws providing for accelerated and bonus depreciation with respect to wind or solar energy generation assets will not be modified, amended or repealed in the future. If the investment tax credit is not effective or if the federal production tax credit is not extended or renewed, or is extended or renewed at a lower rate, these generating facilities may be less profitable to build and operate and the ability of our customers to obtain financing for these projects may be impaired or eliminated. As a result, our revenue and results of operations could be materially adversely affected if demand for our services or the tax incentives were reduced.
Changes to renewable portfolio standards could, and decreased demand for renewable energy projects would, negatively impact our results of operations, cash flows and liquidity.
A portion of our business provides construction and/or installation services to owners and operators of wind power, solar power and other renewable energy facilities. The development of wind, solar and other renewable energy facilities is highly dependent upon federal tax credits, the existence of renewable portfolio standards and other tax or state incentives. Renewable portfolio standards are state specific statutory provisions requiring that electric utilities generate a certain amount of electricity from renewable energy sources or devote a certain portion of operational/development capacity to renewable energy sources. Additionally, certified renewable energy generators earn certificates for every megawatt hour of electricity they produce and can sell these along with their electricity to their customers. In the past, these standards have spurred growth in the renewable energy industry and demand for renewable energy infrastructure construction services. However, revenue from renewable energy projects in the past have been, and in the future are expected to continue to be, highly volatile. Currently, almost 40 states, as well as the District of Columbia and four territories, have adopted renewable portfolio standards or goals. Elimination of, or changes to, existing renewable portfolio standards or similar environmental policies may negatively affect demand for our services. Additionally, renewable energy is generally more expensive to produce and may require additional power generation sources as backup. The locations of renewable energy projects are often remote and are not viable unless connection to the grid to transport the power to demand centers is economically feasible. Furthermore, funding for renewable energy initiatives may not be available, particularly during periods of tight credit markets. These factors could result in fewer renewable energy projects than anticipated or a delay in the timing of construction of these projects and the related infrastructure, which would negatively affect demand for our services.
Our failure to comply with the regulations of OSHA, the U.S. DOT and other state and local agencies that oversee transportation and safety compliance could reduce our revenue, profitability and liquidity.
The Occupational Safety and Health Act of 1970, as amended, establishes certain employer responsibilities, including maintenance of a workplace free of recognized hazards likely to cause death or serious injury, compliance with standards promulgated by OSHA and various recordkeeping, disclosure and procedural requirements. Various standards, including standards for notices of hazards and safety in excavation and demolition work, may apply to our operations. We have incurred, and will continue to incur, capital and operating expenditures and other costs in the ordinary course of business in complying with OSHA and other state and local laws and regulations, and could incur penalties and fines in the future, including, in extreme cases, criminal sanctions.
While we have invested, and will continue to invest, substantial resources in occupational health and safety programs, our industry involves a high degree of operational risk, and there can be no assurance that we will avoid significant liability. Although we have taken what we believe to be appropriate precautions, we have had employee injuries and fatalities in the past and may suffer additional injuries or fatalities in the future. Serious accidents of this nature may subject us to substantial penalties, civil litigation or criminal prosecution. Personal injury claims for damages, including for bodily injury or loss of life, could result in substantial costs and liabilities, which could materially and adversely affect our financial condition, results of operations or cash flows. In addition, if our safety record were to deteriorate, or if we suffered substantial penalties or criminal prosecution for violation of health and safety regulations, customers could cancel existing contracts and not award future business to us, which could materially adversely affect our liquidity, cash flows and results of operations. We have, from time to time, received notice from the DOT that our motor carrier operations will be monitored and that the failure to improve our safety performance could result in suspension or revocation of vehicle registration privileges. If we were not able to successfully resolve such issues, our ability to service our customers could be damaged, which could lead to a material adverse effect on our results of operations, cash flows and liquidity.
Many of our customers are highly regulated, and new regulations or changes in existing regulations may adversely impact their demand for our services and/or the profitability of those services. In addition, the adoption of any future federal, state, or local laws or implementing regulations imposing reporting obligations on, or limiting or banning, the drilling and completion process could make it more difficult to complete natural gas and oil wells and could have a material adverse effect on growth in oil and gas related infrastructure development.
Most of our communications customers are regulated by the FCC, and our energy customers are regulated by the Federal Energy Regulatory Commission (“FERC”). In addition, our utility customers are regulated by state public utility commissions. These agencies could change the way in which they interpret the application of current regulations and/or may impose additional regulations. Interpretative changes or new regulations having an adverse effect on our customers and the profitability of the services they provide could reduce demand for our services, which could adversely affect our results of operations, cash flows and liquidity.
Additionally, various federal, state, local, or foreign legislative and regulatory initiatives have been undertaken, which could result in additional requirements or restrictions being imposed on drilling and completion operations. These regulations, and any future restrictions which might be adopted, could lead to operational delays and increased operating costs for our customers in the oil and gas industry that could result in reduced capital spending. The Company could also be negatively affected by delays and/or cancellations of future oil and gas infrastructure projects.
17
Our failure to comply with environmental laws could result in significant liabilities.
Some of the work we perform is in underground environments. If the field location maps supplied to us are not accurate, or if objects are present in the soil that are not indicated on the field location maps, our underground work could strike objects in the soil containing pollutants and result in a rupture and discharge of pollutants. In such a case, we could incur significant costs, including clean-up costs, and we may be liable for fines and damages. We own and lease several facilities at which we store our equipment. Some of these facilities contain fuel storage tanks which may be above or below ground. If these tanks were to leak, we could be responsible for the cost of remediation as well as potential fines. Additionally, we sometimes perform directional drilling operations below certain environmentally sensitive terrains and water bodies. Due to the inconsistent nature of the terrain and water bodies, it is possible that such directional drilling may cause a surface fracture releasing subsurface materials. These releases may contain contaminants in excess of amounts permitted by law, potentially exposing us to remediation costs and fines. In addition, new environmental laws and regulations, stricter enforcement of existing laws and regulations, the discovery of previously unknown contamination or leaks, or the imposition of new clean-up requirements could require us to incur significant costs or become the basis for new or increased liabilities that could have a material negative effect on our results of operations, cash flows and liquidity.
There are also recent regulatory actions and proposals to address greenhouse gas emissions. These actions and proposals, some of which are under legal challenge, could result in potential new regulations, additional charges to fund energy efficiency activities, or other regulatory actions. Any of these actions could result in increased costs associated with our operations and affect the prices we charge our customers. For example, if new regulations are adopted regulating greenhouse gas emissions from sources such as cars and trucks, we could experience a significant increase in environmental compliance costs in light of our large fleet and amount of construction machinery owned. In addition, if our operations are perceived to result in high greenhouse gas emissions, our reputation could suffer.
Our operations may affect the environment or cause exposure to hazardous substances, and our properties may have environmental contamination, which could result in material liabilities.
Our operations are subject to various environmental laws and regulations, including those dealing with the handling and disposal of waste products, polychlorinated biphenyls (“PCBs”), fuel storage and air quality. Certain of our current and historical construction operations have used hazardous materials and, to the extent that such materials are not properly stored, contained or recycled, they could become hazardous waste. Additionally, some of our contracts require that we assume the environmental risk of site conditions and require that we indemnify our customers for any damages, including environmental damages, incurred in connection with our projects. We may be subject to claims under various environmental laws and regulations, federal and state statutes and/or common law doctrines for toxic torts and other damages, as well as for natural resource damages and the investigation and clean up of soil, surface water, groundwater, and other media under laws such as the Comprehensive Environmental Response, Compensation and Liability Act (“CERCLA”). Such claims may arise, for example, out of current or former conditions at project sites, current or former properties owned or leased by us, and contaminated sites that have always been owned or operated by third parties. Liability may be imposed without regard to fault and may be strict and joint and several, such that we may be held responsible for more than our share of any contamination or other damages, or even for the entire share, and may be unable to obtain reimbursement from the parties causing the contamination.
Our inability to enforce non-competition agreements with former principals and key management of the businesses we acquire may adversely affect our operating results, cash flows and liquidity.
In connection with our acquisitions, we generally require that key management and former principals of the businesses we acquire enter into non-competition agreements in our favor. Enforceability of these non-competition agreements varies from state to state, and state courts will generally examine all of the facts and circumstances at the time a party seeks to enforce a non-competition agreement; consequently, we cannot predict with certainty whether, if challenged, a court will enforce any particular non-competition agreement. If one or more former principals or members of key management of the businesses we acquire leave and the courts refuse to enforce the non-competition agreement entered into by such person or persons, we might be subject to increased competition, which could materially and adversely affect our operating results, cash flows and liquidity.
Our business is subject to physical hazards that could result in substantial liabilities and weaken our financial condition.
Construction projects undertaken by us expose our employees to electrical lines, pipelines carrying potentially explosive or toxic materials, heavy equipment, mechanical failures, transportation accidents, adverse weather conditions and the risk of damage to equipment and property. These hazards can cause personal injuries and loss of life, severe damage to or destruction of property and equipment and other consequential damages and could lead to suspension of operations and large damage claims which could, in some cases, substantially exceed the amount we charge for the associated services. In addition, if serious accidents or fatalities occur, or our safety records were to deteriorate, we may be restricted from bidding on certain work and obtaining other new contracts and certain existing contracts could be terminated. Our safety processes and procedures are monitored by various agencies and rating bureaus. The occurrence of accidents in our business could result in significant liabilities, employee turnover, increase the costs of our projects, or harm our ability to perform under our contracts or enter into new contracts with customers, which could materially adversely affect our revenue, profitability and liquidity.
Our business is seasonal and is affected by adverse weather conditions and the spending patterns of our customers, exposing us to variable quarterly results.
Some of our customers reduce their expenditures and work order requests towards the end of the calendar year. Adverse weather conditions, particularly during the winter season, can also affect our ability to perform outdoor services in certain regions of North America. As a result, we generally experience reduced revenue in the first quarter of each calendar year. Natural catastrophes such as hurricanes or other severe weather could also have a negative effect on the economy overall and on our ability to perform outdoor services in affected regions or utilize equipment and crews stationed in those regions, which could negatively affect our results of operations, cash flows and liquidity.
18
Acquisitions involve risks that could negatively affect our operating results, cash flows and liquidity.
We have made, and in the future may continue to make strategic acquisitions and investments. However, we may not be able to identify suitable acquisition or strategic investment opportunities, or may be unable to obtain any required consent of our lenders and therefore may not be able to complete such acquisitions or strategic investments. We may pay for acquisitions or strategic investments with our common stock or with convertible securities, which may dilute the ownership interests of our common shareholders, or we may decide to pursue acquisitions with which our investors may not agree. In connection with most of our acquisitions, we have agreed to substantial earn-out arrangements. To the extent we defer the payment of the purchase price for any acquisition through a cash earn-out arrangement, it will reduce our cash flows in subsequent periods. In addition, acquisitions may expose us to operational challenges and risks, including:
• | the ability to profitably manage acquired businesses or successfully integrate the acquired business’ operations, financial reporting and accounting control systems into our business; |
• | the expense of integrating acquired businesses including, for example, our recent acquisition of WesTower Communications Inc. (“WesTower”), which resulted in acquisition integration costs in 2014 and 2015; |
• | increased indebtedness and contingent earn-out obligations; |
• | the ability to fund cash flow shortages that may occur if anticipated revenue is not realized or is delayed, whether by general economic or market conditions, or unforeseen internal difficulties; |
• | the availability of funding sufficient to meet increased capital needs; |
• | diversion of management’s attention; and |
• | the ability to retain or hire qualified personnel required for expanded operations. |
In addition, acquired companies may have liabilities that we failed, or were unable, to discover in the course of performing due diligence investigations. We cannot assure you that the indemnification granted to us by sellers of acquired companies will be sufficient in amount, scope or duration to fully offset the possible liabilities associated with businesses or properties we assume upon consummation of an acquisition. We may learn additional information about our acquired businesses that could materially adversely affect us, such as unknown or contingent liabilities, unprofitable projects and liabilities related to compliance with applicable laws. Any such liabilities, individually or in the aggregate, could have a material adverse effect on our business. Failure to successfully manage the operational challenges and risks associated with, or resulting from, acquisitions could adversely affect our results of operations, cash flows and liquidity. Borrowings or issuances of convertible debt associated with these acquisitions may also result in higher levels of indebtedness which could affect our ability to service our debt within the scheduled repayment terms.
We have incurred goodwill and intangible asset impairment charges, and in the future could incur additional impairment charges, which could harm our profitability.
We have significant amounts of long-lived assets, goodwill and intangible assets. As of December 31, 2015, we had $1.2 billion of goodwill and identifiable intangible assets. When we acquire a business, we record goodwill equal to the excess of the amount we pay for the business, including anticipated future liabilities, over the fair value of the acquired net assets of that business. We periodically review the carrying values of goodwill and intangible assets to determine whether such carrying values exceed their fair market values. Declines in the profitability of individual reporting units, due to economic or market conditions or otherwise, as well as adverse changes in financial, competitive and other conditions, could adversely affect the values of our reporting units, resulting in an impairment of goodwill or intangible assets. In addition, adverse changes to the key valuation assumptions contributing to the fair value of our reporting units could result in an impairment of goodwill or intangible assets. In the fourth quarter of 2015, we recorded $78.6 million of goodwill and intangible asset impairment related to a reporting unit in our Oil and Gas segment. For additional details, see Note 1 - Business, Basis of Presentation and Significant Accounting Policies in the notes to the audited consolidated financial statements, which is incorporated by reference. Based on future economic and capital market conditions, as well as the operating performance of our reporting units, future impairment charges could be incurred, which could adversely affect our financial condition and operating results.
We may incur restructuring charges, which could reduce our profitability.
From time to time, we review our operations in an effort to improve profitability. In the past, we have, and in the future we could incur charges as a result of eliminating service offerings that no longer fit into our business plan, charges associated with the integration of acquired businesses, reducing or eliminating services or operations that do not produce adequate revenue or margins or reducing costs of reporting units that need margin improvements. Any charges related to restructuring or impairment would be reflected as operating expenses and could materially reduce our profitability and liquidity.
We rely on information, communications and data systems in our operations. Systems and information technology interruption and breaches in data security could adversely affect our ability to operate and our operating results.
We are heavily reliant on computer, information and communications technology and related systems in order to operate. From time to time, we experience system interruptions and delays. Our operations could be interrupted or delayed or our data security could be breached if we are unable to add software and hardware, effectively maintain and upgrade our systems and network infrastructure and take other steps to improve the efficiency of and protect our systems. In addition, our computer and communications systems and operations could be damaged or interrupted by natural disasters, power loss, telecommunications failures, computer viruses, acts of war or terrorism, physical or electronic break-ins and similar events or disruptions, including breaches by computer hackers and cyber-terrorists. Any of these or other events could cause system interruption, delays and/or loss of critical
19
data including private data, could delay or prevent operations including the processing of transactions and reporting of financial results, loss of data, processing inefficiency, downtime, or could result in the unintentional disclosure of customer or our information and could adversely affect our operating results. Similar risks may affect our customers and vendors, indirectly affecting us. While management has taken steps to address these concerns by implementing network security and internal control measures, there can be no assurance that a system failure or loss or data security breach will not materially adversely affect our financial condition and operating results.
Many of our contracts do not obligate our customers to undertake any infrastructure projects or other work with us.
We derive approximately half of our revenue from multi-year master service agreements and other service agreements. Under our multi-year master service agreements and other service agreements, we contract to provide customers with individual project services through work orders within defined geographic areas on a fixed fee basis. Under these agreements, our customers have no obligation to undertake any infrastructure projects or other work with us. This makes it difficult to estimate our customers’ demand for our services. A significant decline in the projects customers assign us under these service agreements could negatively affect our results of operations, cash flows and liquidity.
Amounts included in our backlog may not result in actual revenue or translate into profits. Our backlog is subject to cancellation and unexpected adjustments and therefore is an uncertain indicator of future operating results.
Our backlog consists of the estimated amount of services to be completed from future work on uncompleted contracts, including new contracts under which work has not begun, as well as revenue from change orders and renewal options. Approximately half of our 18-month backlog as of December 31, 2015 was attributable to master service agreements and other service agreements, none of which require our customers to purchase a minimum amount of services and are cancelable on short or no advance notice. The balance of our backlog is our estimate of work to be completed on long-term installation/construction fixed price agreements. These backlog amounts are based on our estimates, which include historical experience with our customers and our experience on similar projects. These estimates may prove inaccurate, and we may therefore not receive revenue in the originally anticipated period, or at all. In addition, contracts included in our backlog may not be profitable. We may experience variances in the realization of our backlog because of project delays or cancellations resulting from weather conditions, other project deferrals or delays, scope adjustments, external market factors and economic factors beyond our control. If our backlog fails to materialize, our results of operations, cash flows and liquidity would be materially and adversely affected. Accordingly, our backlog as of any particular date is an uncertain indicator of future earnings.
Certain of our businesses have employees who are represented by unions or are subject to collective bargaining agreements; the unionized workforce and any related obligations could adversely affect our operations.
Certain of our employees are represented by labor unions and collective bargaining agreements. Although all such collective bargaining agreements prohibit strikes and work stoppages, we cannot be certain that strikes or work stoppages will not occur despite the terms of these agreements. Strikes or work stoppages would adversely affect our relationships with our customers and could cause us to lose business and decrease our revenue. Additionally, as current agreements expire, the labor unions may not be able to negotiate extensions or replacements on terms favorable to their members, or at all, or avoid strikes, lockouts or other labor actions from time to time that may affect their members. Therefore, it cannot be assured that new agreements will be reached with employee labor unions as existing contracts expire, or on terms that we find desirable. Any labor action against us relating to failure to reach an agreement with employee labor unions could have a material adverse effect on our liquidity, cash flows and results of operations.
Our participation in multiemployer pension plans may subject us to liabilities that could materially and adversely affect our liquidity, cash flows and results of operations.
Substantially all of our union and collective bargaining agreements require us to participate with other companies in multiemployer pension plans. To the extent that U.S.-registered plans are underfunded defined benefit plans, the Employee Retirement Income Security Act of 1974, as amended by the Multiemployer Pension Plan Amendments Act of 1980 (“ERISA”), may subject us to substantial liabilities if we withdraw from such multiemployer plans or if they are terminated. Under current law pertaining to employers that are contributors to U.S.-registered multiemployer defined benefit plans, a plan’s termination, an employer’s voluntary partial or complete withdrawal from, or the mass withdrawal of all contributing employers from, an underfunded multiemployer defined benefit plan requires participating employers to make payments to the plan for their proportionate share of the multiemployer plan’s unfunded vested liabilities. These liabilities include an allocable share of the unfunded vested benefits of the plan for all plan participants, not only for benefits payable to participants of the contributing employer. As a result, participating employers may bear a higher proportion of liability for unfunded vested benefits if the other participating employers cease to contribute to, or withdraw from, the plan. The allocable portion of liability to participating employers could be more disproportionate if employers that have withdrawn from the plan are insolvent, or if they otherwise fail to pay their proportionate share of the withdrawal liability. We currently contribute, and in the past have contributed to, plans that are underfunded, and, therefore, could have potential liability associated with a voluntary or involuntary withdrawal from, or termination of, these plans. Other than the Company’s 2011 withdrawal from the Central States Southeast and Southwest Areas Pension Fund (“Central States”), as discussed below, we do not have plans to withdraw from, and are not aware of related liabilities associated with these plans. However, there can be no assurance that we will not be assessed liabilities in the future. The Pension Protection Act of 2006 (“PPA”) added funding rules to U.S.-registered plans that require underfunded pension plans to improve their funding ratios within prescribed intervals based on their level of underfunding, under which benefit reductions may apply and/or participating employers could be required to make additional contributions. In addition, if a multiemployer defined benefit plan fails to satisfy certain minimum funding requirements, the Internal Revenue Service (“IRS”) may impose on the employers contributing to such a plan a nondeductible excise tax of 5% of the amount of the accumulated funding deficiency.
Based upon the information available to us from plan administrators as of December 31, 2015, several of the multiemployer pension plans in which we participate are underfunded and, as a result, we could be required to increase our contributions in the form of a surcharge on future benefit contributions. The amount of additional funds we may be obligated to contribute in the future cannot be estimated, as such amounts are based on future levels of work of the union employees covered by these plans, investment returns and the level of underfunding of such plans.
20
In November 2014, we, along with other members of the Pipe Line Contractors Association (“PLCA”), voluntarily terminated our participation in several defined benefit multiemployer pension plans. No withdrawal liability was assessed as of the date we terminated our participation in such plans. Although we do not believe we have any material liability associated with our termination of participation, there can be no assurance that these plans, which were in “critical status” as of the date we terminated our participation, will not assess penalties in the future. Additionally, in November 2011, we, along with other members of the PLCA, voluntarily withdrew from Central States, a defined benefit multiemployer pension plan that was in critical status. Subsequent to our withdrawal in 2011, Central States asserted that the PLCA members did not effectively withdraw in 2011. In September 2015, the withdrawal date dispute was resolved in the PLCA’s favor by the U.S. Court of Appeals for the Seventh Circuit in a decision finding that the PLCA members lawfully and effectively withdrew from Central States by and through their actions in 2011. Based on current discussions with Central States, the plan will be providing the PLCA members with updated withdrawal liability information, taking into consideration payments to date. We do not expect a material impact to the recorded withdrawal liability, however there can be no assurance as to the final amount as determined by the plan administrator. Withdrawal liabilities, requirements to pay increased contributions, and/or excise taxes in connection with any of the multiemployer pension plans in which we participate could negatively impact our cash flows, liquidity and results of operations.
Our financial results are based, in part, upon estimates and assumptions that may differ from actual results.
In preparing our consolidated financial statements in conformity with U.S. GAAP, management makes a number of estimates and assumptions that affect the amounts reported in the consolidated financial statements. These estimates and assumptions must be made because certain information used in the preparation of our consolidated financial statements is either dependent on future events or cannot be calculated with a high degree of precision from data available. In some cases, these estimates are particularly uncertain and we must exercise significant judgment. Key estimates include: the recognition of revenue and project profit or loss (which we define as project revenue less project costs of revenue, including depreciation) in particular, on long-term construction contracts or other projects accounted for under the percentage-of-completion method, for which the recorded amounts require estimates of costs to complete projects, ultimate project profit and the amount of contract price adjustments that are probable; allowances for doubtful accounts; estimated fair values of goodwill and intangible assets, acquisition-related contingent consideration, investments in cost and equity method investees; asset lives used in computing depreciation and amortization; accrued self-insured claims; share-based compensation; other reserves and accruals; accounting for income taxes; and the estimated impact of contingencies and ongoing litigation. Actual results could differ materially from the estimates and assumptions that we use, which could have a material adverse effect on our results of operations, cash flows and liquidity. See Note 1 - Business, Basis of Presentation and Significant Accounting Policies in the notes to the audited consolidated financial statements, which is incorporated by reference.
We may have additional tax liabilities associated with our domestic and international operations.
We are subject to income taxes in the United States and certain foreign jurisdictions. Management must exercise significant judgment in determining our provision for income taxes due to lack of clear and concise tax laws and regulations in certain jurisdictions. Tax laws may be changed or clarified and such changes may adversely affect our tax provisions. We are audited by various U.S. and foreign tax authorities and in the ordinary course of our business there are many transactions and calculations for which the ultimate tax determination may be uncertain. Although we believe that our tax estimates are reasonable, the final outcome of tax audits and related litigation could be materially different from that which is reflected in our financial statements.
We are self-insured against many potential liabilities.
We are effectively self-insured for substantially all claims because most claims against us do not exceed the deductibles under our insurance policies. We actuarially determine any liabilities for unpaid claims and associated expenses, including losses incurred but not reported, and reflect the present value of those liabilities in our balance sheet as other current and other long-term liabilities, as appropriate. The determination of such claims and expenses and the appropriateness of the related liability is reviewed and updated quarterly. However, insurance liabilities are difficult to assess and estimate due to the many relevant factors, the effects of which are often unknown, including the severity of an injury, the determination of our liability in proportion to other parties, the number of incidents not reported and the effectiveness of our safety program. If our insurance claims increase or if costs exceed our estimates of insurance liabilities, we could experience a decline in profitability and liquidity.
Warranty claims resulting from our services could have a material adverse effect on our business.
We generally warrant the work we perform for a one to two-year period following substantial completion of a project, subject to further extensions of the warranty period following repairs or replacements. We have not historically accrued reserves for potential warranty claims as they have not been material, but such claims could potentially increase. If warranty claims occur, we could be required to repair or replace warrantied items at our cost, or, if our customers elect to repair or replace the warrantied item using the services of another provider, we could be required to pay for the cost of the repair or replacement. Additionally, while we generally require that the materials provided to us by suppliers have warranties consistent with those we provide to our customers, if any of these suppliers default on their warranty obligations to us, we may incur costs to repair or replace the defective materials for which we are not reimbursed. The costs associated with such warranties, including any warranty-related legal proceedings, could have a material adverse effect on our results of operations, cash flows and liquidity.
Our revolving credit facility and senior notes impose restrictions on us which may prevent us from engaging in transactions that might benefit us, including responding to changing business and economic conditions or securing additional financing, if needed.
The terms of our indebtedness contain customary events of default and covenants that prohibit us from taking certain actions without satisfying certain financial tests or obtaining the consent of the lenders. The prohibited actions include, among other things:
• | buying back shares in excess of specified amounts; |
21
• | making investments and acquisitions in excess of specified amounts; |
• | incurring additional indebtedness in excess of specified amounts; |
• | paying cash dividends; |
• | creating certain liens against our assets; |
• | prepaying subordinated indebtedness; |
• | engaging in certain mergers or combinations; |
• | failing to satisfy certain financial tests; and |
• | engaging in transactions that would result in a “change of control” (as defined in the credit facility and the indenture governing our senior notes). |
Our credit facility requires that we comply with a consolidated leverage ratio and a consolidated interest coverage ratio. Should we be unable to comply with the terms and covenants of our credit facility, we would be required to obtain consents from our bank group, further modify our credit facility or secure another source of financing to continue to operate our business, none of which may be available to us on reasonable terms or at all. A default could also result in the acceleration of our obligations under the credit facility or under the indentures relating to our senior notes. In addition, these covenants may prevent us from engaging in transactions that benefit us, including responding to changing business and economic conditions or securing additional financing, if needed. Our business is capital intensive and to the extent we need additional financing, we may not be able to obtain such financing at all or on favorable terms, which may materially decrease our profitability, cash flows and liquidity.
We may be unable to obtain sufficient bonding capacity to support certain service offerings, and the need for performance and surety bonds may reduce our availability under our credit facility.
Some of our contracts require performance and payment bonds. If we are not able to renew or obtain a sufficient level of bonding capacity in the future, we may be precluded from being able to bid for certain contracts or successfully contract with certain customers. In addition, even if we are able to successfully renew or obtain performance or payment bonds, we may be required to post letters of credit in connection with the bonds, which would reduce availability under our credit facility. Furthermore, under standard terms in the surety market, sureties issue bonds on a project-by-project basis and can decline to issue bonds at any time or require the posting of additional collateral as a condition to issuing or renewing any bonds. If we were to experience an interruption or reduction in the availability of bonding capacity as a result of these or any other reasons, we may be unable to compete for or work on certain projects that would require bonding.
We may be subject to risks related to the restatement of certain of our 2014 interim financial statements, including from ongoing or possible regulatory action, private party litigation, including, without limitation, the civil investigation commenced by the SEC, related to the restatements and independent Audit Committee investigation.
As previously disclosed, the Audit Committee of our Board of Directors, with the assistance of independent counsel and accounting advisors, undertook an independent investigation during 2015 of certain of our accounting practices related to percentage-of-completion accounting. As a result of the investigation, we concluded that certain accounting restatements were appropriate with respect to interim periods during our fiscal year ended December 31, 2014, as reflected in our 2014 Form 10-K. The independent investigation has been concluded. Our restatement of prior interim financial statements has exposed us to risks associated with litigation, regulatory proceedings and government enforcement actions.
As previously disclosed, we self-reported to the staff of the SEC (the “Staff”) regarding the Audit Committee’s independent investigation and are cooperating with the Staff’s requests for additional information regarding the investigation. In December 2015, we were notified by the Staff that it had commenced a formal civil investigation relating to the previously disclosed adjustments to the 2014 financial statements and Audit Committee independent investigation. We intend to continue our cooperation with the SEC. While we believe that we made appropriate judgments in adjusting our consolidated financial statements, the SEC may disagree with our conclusions and adjustments.
We and certain of our executive officers are defendants in a federal securities class action lawsuit, which is described in Note 15 - Commitments and Contingencies in the notes to the audited consolidated financial statements, which is incorporated by reference. This lawsuit may divert our attention from our ordinary business operations, and we may incur significant expenses associated with it, including, without limitation, substantial attorneys’ fees and other fees of professional advisors and potential obligations to indemnify officers or directors who are or may become parties to or involved in such matters. We are unable at this time to predict the outcome of our potential liability in this matter.
A failure of our internal control over financial reporting could materially impact our business.
Our management is responsible for establishing and maintaining adequate internal control over financial reporting. An internal control system, no matter how well designed and operated, can provide only reasonable, not absolute, assurance that the objectives of the control system are met. Further, the design of a control system must reflect the fact that there are resource constraints, and the benefits of controls must be considered relative to their costs. Because of the inherent limitations in all internal control systems, internal control over financial reporting may not prevent or detect misstatements. Any failure to maintain an effective system of internal control over financial reporting could limit our ability to report our financial results accurately and timely or to detect and prevent fraud, and could expose us to litigation, harm the Company’s reputation, or adversely affect the market price of our common stock shares.
22
As of December 31, 2014, our CEO and CFO concluded that our internal control over financial reporting was not effective due to the existence of a material weakness. As of December 31, 2015, management has determined that the material weakness has been remediated. We cannot assure you, however, that additional material weaknesses in our internal control over financial reporting will not be identified in the future. For more information relating to our internal control over financial reporting, evaluation of disclosure controls and procedures, and the remediation of our prior material weakness in internal control over financial reporting, see Part II - Item 9A. “Controls and Procedures” of this 2015 Form 10-K.
We may incur additional healthcare costs arising from federal healthcare reform legislation.
The costs of employee health care insurance have been increasing in recent years due to rising health care costs, legislative changes, and general economic conditions. Additionally, we may incur additional costs because of the Patient Protection and Affordable Care Act and the Health Care and Education Reconciliation Act of 2010 (collectively, the "Health Care Reform Laws"). Certain provisions of these laws became effective in 2015 and additional provisions will become effective over the next several years. Because of the breadth and complexity of these laws, the lack of guidance on implementation and the phased-in nature of the new regulations, as well as other health care reform legislation considered by Congress and state legislatures, we cannot predict with certainty the future effect of these laws on us. A continued increase in health care costs or additional costs incurred as a result of the Health Care Reform Laws or other future health care reform laws imposed by Congress or state legislatures could have a negative effect on our results of operations, cash flows or liquidity.
Increases in the costs of fuel could reduce our operating margins.
The price of fuel needed to run our vehicles and equipment is unpredictable and fluctuates based on events outside our control, including geopolitical developments, supply and demand for oil and gas, actions by the oil and gas producers, war and unrest in oil producing countries, regional production patterns and environmental concerns. Any increase in fuel costs could materially reduce our profitability and liquidity because most of our contracts do not allow us to adjust our pricing for such expenses.
Risks Related to Our Company and Our Common Stock
There may be future sales of our common stock or other dilution of our equity, which may adversely affect the market price of our common stock. In connection with certain completed acquisitions, we have issued shares of our common stock, and we additionally have the option to issue shares of our common stock instead of cash as consideration for future earn-out obligations. We may agree to issue additional securities in connection with other future acquisition or financing transactions, which, if issued, would dilute your share ownership and could lead to volatility in our common stock price.
We grow our business organically as well as through acquisitions. One method of acquiring companies or otherwise funding our corporate activities is through the issuance of equity securities. In connection with certain completed acquisitions, we have the option to issue shares of our common stock instead of paying cash for certain earn-out obligations. Such issuances could have the effect of diluting our earnings per share as well as our existing shareholders’ individual ownership percentages and could lead to volatility in our common stock price. Our Amended and Restated Articles of Incorporation provide that we may issue up to a total 145,000,000 shares of common stock, of which 80,103,470 shares were outstanding as of December 31, 2015.
We are not restricted from issuing additional common stock. The issuance of additional shares of our common stock in connection with future acquisitions, convertible securities or other issuances of our common stock, including restricted stock awards, restricted stock units and/or options, or otherwise, will dilute the ownership interest of our common shareholders. Sales of a substantial number of shares of our common stock or other equity-related securities in the public market could depress the market price of our common stock and impair our ability to raise capital through the sale of additional equity or equity-linked securities. We cannot predict the effect that future sales of our common stock or other equity-related securities would have on the market price of our common stock.
Our failure to prepare and timely file our periodic reports with the SEC limits our access to the public markets to raise debt or equity capital.
We did not file our 2014 Form 10-K or our Quarterly Report on Form 10-Q for the quarter ended March 31, 2015 (our “First Quarter 2015 Form 10-Q”) within the time frame required by SEC rules. Because of our failure to have timely filed those periodic reports with the SEC, we are currently ineligible to use SEC Form S-3, which is a short-form registration statement, to register our securities for public offer and sale, until we have timely filed all periodic reports under the Securities Exchange Act of 1934, as amended, for a period of twelve months and any portion of a month from the due date of the last untimely report, which we expect to occur in June 2016. Our inability to use Form S-3 limits our ability to access the public capital markets rapidly, including in reaction to changing business needs or market conditions. While we may currently register an offering of our securities on Form S-1, doing so would likely increase transaction costs and adversely impact our ability to raise capital or complete any related transaction, such as an acquisition, in a timely manner.
We have a significant amount of debt. Our substantial indebtedness could adversely affect our business, financial condition and results of operations and our ability to meet our payment obligations.
We have a significant amount of debt and substantial debt service requirements. This level of debt could have significant consequences on our future operations, including:
• | making it more difficult for us to meet our payment and other obligations; |
• | our failure to comply with the financial and other restrictive covenants contained in our debt agreements, which could trigger events of default that result in all of our debt becoming immediately due and payable; |
23
• | reducing the availability of our cash flow to fund working capital, capital expenditures, acquisitions or strategic investments and other general corporate requirements, and limiting our ability to obtain additional financing for these purposes; |
• | subjecting us to increased interest expense related to our indebtedness with variable interest rates, including borrowings under our credit facility; |
• | limiting our flexibility in planning for, or reacting to, and increasing our vulnerability to changes in our business, the industry in which we operate and the general economy; |
• | placing us at a competitive disadvantage compared to our competitors that have less debt or are less leveraged; and |
• | preventing us from paying dividends. |
Any of the above-listed factors could have an adverse effect on our business, financial condition and results of operations and our ability to meet our payment obligations. Our ability to meet our payment and other obligations under our debt instruments depends on our ability to generate significant cash flow in the future. This, to some extent, is subject to general economic, financial, competitive, legislative and regulatory factors as well as other factors that are beyond our control. We cannot assure you that our business will generate cash flow from operations, or that future borrowings will be available to us under our credit facility or otherwise, in an amount sufficient to enable us to meet our payment obligations and to fund other liquidity needs. If we are not able to generate sufficient cash flow to service our debt obligations, we may need to refinance or restructure our debt, sell assets, reduce or delay capital investments, or seek to raise additional capital, and some of these activities may be on terms that are unfavorable or highly dilutive. Our ability to refinance our indebtedness will depend on the capital markets and our financial condition at such time. If we are unable to implement one or more of these alternatives, we may not be able to meet our payment obligations.
The market price of our common stock has been, and may continue to be, highly volatile.
The market price of our common stock on the New York Stock Exchange has been volatile in recent years. We may continue to experience significant volatility in the market price of our common stock. Numerous factors could have a significant effect on the price of our common stock, including:
• | announcements of fluctuations in our operating results or the operating results of one of our competitors; |
• | market conditions in our customers' industries; |
• | capital spending plans of our significant customers; |
• | global and domestic energy prices; |
• | announcements by us or one of our competitors of new or terminated customers or new, amended or terminated contracts; |
• | announcements of acquisitions by us or one of our competitors; |
• | changes in recommendations or earnings estimates by securities analysts; |
• | future repurchases of our common stock; and |
• | future sales of our common stock or other securities, including any shares issued in connection with business acquisitions or earn-out obligations for any past or future acquisitions. |
In addition, the stock market has experienced significant price and volume fluctuations in recent years, which have sometimes been unrelated or disproportionate to operating performance. Volatility in the market price of our common stock could cause shareholders to lose some or all of their investment in our common stock.
A small number of our existing shareholders have the ability to influence major corporate decisions.
Jorge Mas, our Chairman, José R. Mas, our Chief Executive Officer, and other members of the Mas family employed by MasTec, beneficially owned approximately 20.6% of the outstanding shares of our common stock as of December 31, 2015. Accordingly, they are in a position to influence:
• | the vote of most matters submitted to our shareholders, including any merger, consolidation or sale of all or substantially all of our assets; |
• | the nomination of individuals to our Board of Directors; and |
• | a change in our control. |
These factors may discourage, delay or prevent a takeover attempt that shareholders might consider in their best interests or that might result in shareholders receiving a premium for their common stock.
Our articles of incorporation and certain provisions of Florida law contain anti-takeover provisions that may make it more difficult to effect a change in our control.
24
Certain provisions of our articles of incorporation, by-laws and the Florida Business Corporation Act could delay or prevent an acquisition or change in control and the replacement of our incumbent directors and management, even if doing so might be beneficial to our shareholders by providing them with the opportunity to sell their shares possibly at a premium over the then market price of our common stock. For example, our Board of Directors is divided into three classes. At any annual meeting of our shareholders, our shareholders only have the right to appoint approximately one-third of the directors on our Board of Directors. Consequently, it will take at least two annual shareholder meetings to effect a change in control of our Board of Directors, which may discourage hostile takeover bids. In addition, our articles of incorporation authorize our Board of Directors, without further shareholder approval, to issue preferred stock. The issuance of preferred stock could also dilute the voting power of holders of our common stock, including the granting of voting control to others, which could delay or prevent an acquisition or change in control.
ITEM 1B. | UNRESOLVED STAFF COMMENTS |
Not applicable.
ITEM 2. | PROPERTIES |
Our corporate headquarters, located in Coral Gables, Florida, is a leased facility approximating 37,000 square feet. As of December 31, 2015, our operations were conducted from approximately 470 locations, primarily within the United States and Canada, and, to a lesser extent, Mexico and in other countries in Latin America. None of these facilities is material to our operations because most of our services are performed on customers’ premises or on public rights of way and suitable alternative locations are available in substantially all areas where we currently conduct business. We also own property and equipment that had a net book value of approximately $559 million as of December 31, 2015. This property and equipment includes land, buildings, vans, trucks, tractors, trailers, bucket trucks, forklifts, backhoes, sidebooms, bulldozers, excavators, trenchers, graders, loaders, scrapers, drilling machines, directional boring machines, digger derricks, pile drivers, cranes, computers, computer software, office and building equipment, including furniture and fixtures and other equipment. Substantially all of our equipment is acquired from third-party vendors, upon none of which we depend, and we did not experience any difficulties in obtaining desired equipment in 2015.
ITEM 3. | LEGAL PROCEEDINGS |
The information set forth in Note 15 – Commitments and Contingencies in the notes to the audited consolidated financial statements in Item 8 of this Annual Report on Form 10-K is incorporated by reference.
ITEM 4. | MINE SAFETY DISCLOSURES |
Not applicable.
PART II
ITEM 5. MARKET FOR THE REGISTRANT’S COMMON EQUITY, RELATED SHAREHOLDER MATTERS AND ISSUER PURCHASES OF EQUITY SECURITIES
Market Information
Our common stock is listed on the New York Stock Exchange under the symbol “MTZ.” The following table sets forth the high and low sale prices of our common stock for the quarters indicated, as reported by the New York Stock Exchange.
For the Years Ended December 31, | |||||||||||||||
2015 | 2014 | ||||||||||||||
High | Low | High | Low | ||||||||||||
First Quarter | $ | 22.79 | $ | 16.00 | $ | 44.03 | $ | 32.27 | |||||||
Second Quarter | $ | 21.52 | $ | 15.34 | $ | 44.80 | $ | 27.96 | |||||||
Third Quarter | $ | 20.91 | $ | 14.48 | $ | 32.10 | $ | 26.38 | |||||||
Fourth Quarter | $ | 21.10 | $ | 15.42 | $ | 30.70 | $ | 18.14 | |||||||
Holders. As of February 22, 2016, there were 7,227 shareholders of record of our common stock.
Dividends. We have never paid cash dividends and do not anticipate paying any cash dividends in the foreseeable future. We intend to retain future earnings for reinvestment. Our Board of Directors will make any future determination as to the payment of dividends at its discretion, and this determination will depend upon our operating results, financial condition and capital requirements, general business conditions and such other factors that the Board of Directors considers relevant. In addition, our credit agreements prohibit us from paying cash dividends or making other distributions of our common stock without prior consent of the lender. The indenture governing our senior notes also contains covenants that restrict our ability to make certain payments including the payment of dividends. See Item 7. “Management’s Discussion and Analysis of Financial Condition and Results of Operations - Financial Condition, Liquidity and Capital Resources.”
25
Issuer Purchases of Equity Securities. During the fourth quarter of 2014, our Board of Directors authorized the repurchase of up to $100 million of our common stock under a share repurchase program, under which we repurchased an aggregate of 5.2 million shares for $100 million during the year ended December 31, 2015, which completed the program. See Note 12 - Equity in the notes to the audited consolidated financial statements, which is incorporated by reference.
The following table provides information about repurchases of our common stock during the three month period ended December 31, 2015:
Total Number of Shares Purchased | Average Price Paid per Share | Total Number of Shares Purchased as Part of Publicly Announced Program | Approximate Dollar Value of Shares that May Yet be Purchased under the Program | ||||||||||||
October 1 through October 31 | — | $ | — | — | $ | — | |||||||||
November 1 through November 30 | 1,085 | (a) | $ | 16.81 | — | $ | — | ||||||||
December 1 through December 31 | 40,986 | (a) | $ | 17.51 | — | $ | — | ||||||||
Total | 42,071 | — | |||||||||||||
(a) | Reflects shares of common stock withheld for income tax purposes in connection with shares issued to certain employees and directors under compensation and benefit programs. |
Performance Graph
The performance graph below compares the cumulative total returns for our common stock with the cumulative total return (including reinvestment of dividends) of the Standard and Poor’s 500 Composite Stock Index (“S&P 500”), and with that of our peer group, composed of Quanta Services, Inc., MYR Group, Inc., Dycom Industries, Inc., Willbros Group and Jacobs Engineering Group Inc.. The graph assumes an investment of $100 in our common stock and in each of the respective indices for the period from December 31, 2010 to December 31, 2015. The comparisons in the graph are based upon historical data and are not intended to forecast or be indicative of possible future performance of our common stock.
The performance graph shall not be deemed incorporated by reference by any general statement incorporating by reference this annual report into any filing under the Securities Act of 1933 or the Securities Exchange Act of 1934, except to the extent we specifically incorporate this information by reference, and shall not otherwise be deemed filed under such acts.
26
COMPARISON OF 5 YEAR CUMULATIVE TOTAL RETURN*
Among MasTec, Inc., the S&P 500 Index, and Peer Group
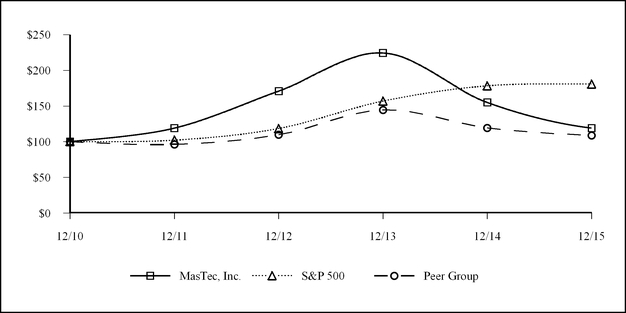
*$100 invested on 12/31/10 in stock or index, including reinvestment of dividends.
Fiscal year ending December 31.
Copyright© 2016 S&P, a division of The McGraw-Hill Companies Inc. All rights reserved.
As of December 31, | 2010 | 2011 | 2012 | 2013 | 2014 | 2015 | |||||||||||||||||
MasTec, Inc. | $ | 100.00 | $ | 119.05 | $ | 170.87 | $ | 224.26 | $ | 154.97 | $ | 119.12 | |||||||||||
S&P 500 | $ | 100.00 | $ | 102.11 | $ | 118.45 | $ | 156.82 | $ | 178.29 | $ | 180.75 | |||||||||||
Peer Group | $ | 100.00 | $ | 96.16 | $ | 109.8 | $ | 144.62 | $ | 119.54 | $ | 109.07 | |||||||||||
27
ITEM 6. | SELECTED FINANCIAL DATA |
The following selected consolidated financial data has been derived from our audited consolidated financial statements and should be read together with our audited consolidated financial statements and notes thereto, as well as Item 7. “Management’s Discussion and Analysis of Financial Condition and Results of Operations.” Our consolidated results of operations are not necessarily comparable from period to period due to the impact of acquisitions.
For the Years Ended December 31, | |||||||||||||||||||
2015 (a) | 2014 (b) | 2013 (c) | 2012 (d) | 2011 (e) | |||||||||||||||
(in millions, except per share amounts) | |||||||||||||||||||
Statement of Operations Data | |||||||||||||||||||
Revenue | $ | 4,208.3 | $ | 4,611.8 | $ | 4,324.8 | $ | 3,726.8 | $ | 2,831.3 | |||||||||
Costs of revenue, excluding depreciation and amortization | $ | 3,721.3 | $ | 3,978.0 | $ | 3,682.4 | $ | 3,239.2 | $ | 2,459.7 | |||||||||
Net (loss) income from continuing operations | $ | (79.7 | ) | $ | 122.0 | $ | 147.7 | $ | 116.6 | $ | 97.5 | ||||||||
Net (loss) income attributable to MasTec, Inc. | $ | (79.1 | ) | $ | 115.9 | $ | 140.9 | $ | 107.4 | $ | 106.0 | ||||||||
(Loss) earnings per share from continuing operations: | |||||||||||||||||||
Basic | $ | (0.98 | ) | $ | 1.53 | $ | 1.92 | $ | 1.49 | $ | 1.19 | ||||||||
Diluted | $ | (0.98 | ) | $ | 1.42 | $ | 1.74 | $ | 1.42 | $ | 1.13 | ||||||||
Our results include the following pretax amounts for the years indicated:
(a) | In 2015: (i) $78.6 million of goodwill and intangible asset impairment; (ii) $17.8 million of integration costs from our acquisition of WesTower Communications Inc. (“WesTower”); (iii) $17.4 million of Audit Committee independent investigation related costs; (iv) $21.4 million of losses on a Canadian wind project; (v) $16.3 million of project losses on a non-controlled proportionately consolidated Canadian joint venture; and (vi) a $12.2 million charge relating to a court mandated mediation settlement. |
(b) In 2014: $5.3 million of integration costs from our acquisition of WesTower.
(c) In 2013: (i) a $5.6 million loss on extinguishment of debt; and (ii) $2.8 million of legal settlement charges.
(d) In 2012: a $9.6 million legal settlement charge.
(e) | In 2011: (i) a $29.0 million gain on remeasurement of our equity investment in EC Source Services LLC (“EC Source”); and (ii) a $6.4 million multiemployer pension plan withdrawal charge. |
As of December 31, | |||||||||||||||||||
2015 | 2014 | 2013 | 2012 | 2011 | |||||||||||||||
(in millions) | |||||||||||||||||||
Balance Sheet Data | |||||||||||||||||||
Working capital | $ | 380.1 | $ | 550.9 | $ | 477.8 | $ | 335.5 | $ | 236.3 | |||||||||
Property and equipment, net | $ | 558.7 | $ | 623.1 | $ | 488.1 | $ | 348.9 | $ | 263.0 | |||||||||
Total assets | $ | 2,940.2 | $ | 3,564.0 | $ | 2,923.2 | $ | 2,416.3 | $ | 2,094.7 | |||||||||
Total debt | $ | 1,023.1 | $ | 1,134.8 | $ | 816.8 | $ | 598.9 | $ | 494.7 | |||||||||
Total equity | $ | 943.4 | $ | 1,148.1 | $ | 1,021.1 | $ | 861.9 | $ | 811.2 | |||||||||
ITEM 7. | MANAGEMENT’S DISCUSSION AND ANALYSIS OF FINANCIAL CONDITION AND RESULTS OF OPERATIONS |
The following discussion and analysis of our financial condition and results of operations should be read in conjunction with our historical consolidated financial statements and related notes thereto in Item 8. “Financial Statements and Supplementary Data.” The discussion below contains forward-looking statements that are based upon our current expectations and is subject to uncertainty and changes in circumstances. Actual results may differ materially from these expectations due to inaccurate assumptions and known or unknown risks and uncertainties, including those identified in “Cautionary Statement Regarding Forward-Looking Statements” and Item 1A. “Risk Factors.”
Business
See Item 1. “Business,” which is incorporated by reference, for discussion pertaining to our business and reportable segments. We have acquired several businesses in recent years. For additional information pertaining to our recent acquisitions, see Note 3 - Acquisitions in the notes to the audited consolidated financial statements, which is incorporated by reference.
Prior Year Acquisitions. In 2014, we acquired (i) a telecommunications company that focuses on construction and maintenance of communications infrastructure for wireless networks; (ii) a telecommunications services firm specializing in the installation of in-home security systems; (iii) a telecommunications services firm specializing in the engineering, installation, furnishing and integration of telecommunications equipment, and (iv) a western Canadian construction services company, that provides infrastructure construction services primarily in support of oil and gas production,
28
processing, mining and transportation. In 2013, we acquired (i) an oil and gas pipeline and facility construction services company, headquartered in Alberta, Canada; (ii) a former subcontractor to our wireless business that provides self-perform communications tower construction, installation, maintenance and other services and (iii) an electrical transmission services company that focuses primarily on substation construction activities. In 2012, we acquired (i) a natural gas and petroleum pipeline infrastructure services company that performs services including pipeline and facilities construction, painting and maintenance services; (ii) a former subcontractor to our oil and gas business that provides self-perform clearing and trenching services for natural gas and petroleum pipeline infrastructure construction, and (iii) a former subcontractor to our wireless business that provides self-perform communications tower construction, installation, maintenance and other services.
Prior Year Dispositions. In 2013, we sold Globetec Construction, LLC (“Globetec”).
Economic, Industry and Market Factors
We closely monitor the effects that changes in economic and market conditions may have on our customers. General economic and market conditions can negatively affect demand for our customers’ products and services, which can lead to rationalization of our customers’ capital and maintenance budgets in certain end-markets. Fluctuations in market prices for oil, gas and other fuel sources can affect demand for our services, in particular, pipeline and power generation construction services. These fluctuations, as well as the highly competitive nature of our industry, particularly when work is deferred, can result, and in recent years, has resulted in lower bids and lower profit on the services we provide. In the face of increased pricing pressure, we strive to maintain our profit margins through productivity improvements and cost reduction programs. Other market and industry factors, such as (i) changes to our customers’ capital spending plans; (ii) mergers and acquisitions among the customers we serve, such as the July 2015 acquisition of DIRECTV® by AT&T; (iii) access to capital for customers in the industries we serve; (iv) changes in technology, tax and other incentives; (v) renewable energy portfolio standards; and (vi) new or changing regulatory requirements affecting the industries we serve, can also affect demand for our services. While we actively monitor economic, industry and market factors affecting our business, we cannot predict the impact such factors may have on our future results of operations, liquidity and cash flows and we may be unable to fully mitigate or take advantage of changes in these factors.
Impact of Seasonality and Cyclical Nature of Business
Our revenue and results of operations can be subject to seasonal and other variations. These variations are influenced by weather, customer spending patterns, bidding seasons, project schedules and timing, in particular, for large non-recurring projects and holidays. Typically, our revenue is lowest in the first quarter of the year because cold, snowy or wet conditions cause project delays. Revenue in the second quarter is typically higher than in the first quarter, as some projects begin, but continued cold and wet weather can often impact second quarter productivity. The third and fourth quarters are typically the most productive quarters of the year, as a greater number of projects are underway and weather is normally more accommodating to construction projects. In the fourth quarter, many projects tend to be completed by customers seeking to spend their capital budgets before the end of the year, which generally has a positive impact on our revenue. However, the holiday season and inclement weather can cause delays, which can reduce revenue and increase costs on affected projects. Any quarter may be positively or negatively affected by adverse or unusual weather patterns, such as excessive rainfall or warm winter weather, making it difficult to predict quarterly revenue and margin variations.
Additionally, our industry can be highly cyclical. Fluctuations in end-user demand within the industries we serve, or in the supply of services within those industries, can impact demand for our services. As a result, our business may be adversely affected by industry declines or by delays in new projects. Variations in project schedules or unanticipated changes in project schedules, in particular, in connection with large construction and installation projects, can create fluctuations in revenue, which may adversely affect us in a given period, even if not in total. In addition, revenue from master service agreements, while generally predictable, can be subject to volatility. The financial condition of our customers and their access to capital; variations in project margins; regional, national and global economic and market conditions; regulatory or environmental influences; and acquisitions, dispositions or strategic investments can also materially affect quarterly results. Accordingly, our operating results in any particular period may not be indicative of the results that can be expected for any other period.
Understanding our Operating Results
Revenue
We provide engineering, building, installation, maintenance and upgrade services to our customers. We derive revenue from projects performed under master and other service agreements as well as from fixed price contracts for specific projects or jobs requiring the construction and installation of an entire infrastructure system or specified units within an entire infrastructure system. See Item 1. “Business” for discussion of our business and revenue-generating activities and see “Comparison of Fiscal Year Results” below for details of revenue by reportable segment.
Costs of Revenue, Excluding Depreciation and Amortization
Costs of revenue, excluding depreciation and amortization, consists principally of salaries, employee incentives and benefits, subcontracted services, equipment rentals and repairs, fuel and other equipment expenses, material costs, parts and supplies, insurance and facilities expenses. Project margins are calculated by subtracting a project’s costs of revenue, excluding certain depreciation and amortization, from project revenue. Project profitability and corresponding project margins will be reduced if actual costs to complete a project exceed our estimates on fixed price and installation/construction service agreements. Estimated losses on contracts are recognized immediately when estimated costs to complete a project exceed the remaining revenue to be received over the remainder of the contract. Factors impacting our costs of revenue, excluding depreciation and amortization, include:
Revenue Mix. The mix of revenue derived from the projects we perform impacts overall project margins, as margin opportunities can vary by project. For example, installation work is often performed on a fixed price basis, and has a higher level of margin risk than maintenance or upgrade
29
work, which is often performed under pre-established or time and materials pricing arrangements, and may vary from project to project. As a result, changes in project mix between installation work and maintenance or upgrade services can impact our project margins in a given period. Additionally, the mix of project revenue for customers in the communications versus utility and power generation industries can also have an impact on overall project margins, as project margins can vary by industry and over time.
Seasonality, Weather and Geographic Mix. Seasonal patterns can have a significant impact on project margins. Generally, business is slower at the beginning of the year. Adverse or favorable weather conditions can impact project margins in a given period. For example, extended periods of rain or snowfall can negatively impact revenue and project margins as a result of reduced productivity from projects being delayed or temporarily halted. Conversely, in periods when weather remains dry and temperatures are accommodating, more work can be done, sometimes with less cost, which can favorably impact project margins. In addition, the mix of business conducted in different geographic areas can affect project margins due to the particular characteristics associated with the physical locations where the work is being performed, such as mountainous or rocky terrain versus open terrain. Site conditions, including unforeseen underground conditions, can also impact project margins.
Performance Risk. Overall project margins may fluctuate due to work volume, project pricing, job productivity and crew productivity. Job productivity can be impacted by quality of the work crew and equipment, availability of skilled labor, environmental or regulatory factors, customer decisions and crew productivity. Crew productivity can be influenced by weather conditions and job terrain, such as whether project work is in a right of way that is open or one that is obstructed (either by physical obstructions or legal encumbrances).
Subcontracted Resources. Our use of subcontracted resources in a given period is dependent upon activity levels and the amount and location of existing in-house resources and capacity. Project margins on subcontracted work can vary from project margins on self-perform work. As a result, changes in the mix of subcontracted resources versus self-perform work can impact our overall project margins.
Material versus Labor Costs. In many cases, our customers are responsible for supplying their own materials on projects; however, under certain contracts, we may agree to provide all or part of the required materials. Project margins are typically lower on projects where we furnish a significant amount of materials due to the fact that mark-ups on materials are generally lower than project margins on labor costs. Therefore, increases in the percentage of work with significant materials requirements could decrease our overall project margins.
General and Administrative Expense
General and administrative expenses consist principally of compensation and benefit expenses, travel expenses and related costs for our finance, benefits and risk management, legal, facilities, information services and executive personnel. General and administrative expenses also include non-cash stock based compensation expenses, outside professional and accounting fees, including Audit Committee independent investigation related costs; acquisition costs, including those related to acquisition integration, expenses associated with information technology used in administration of the business and various forms of insurance.
Interest Expense, Net
Interest expense, net, consists of contractual interest expense on outstanding debt obligations, amortization of deferred financing costs and other interest expense, offset by interest earned on cash and fixed income investments.
Other Income, Net
Other income, net, consists primarily of gains or losses from sales of assets and investments, certain legal settlements, income or expense from equity method investments and gains or losses from changes to estimated earn-out accruals.
Financial Performance Metrics
Our senior management team regularly reviews certain key financial performance metrics within our business, including:
• | revenue and profitability on an overall basis, by reportable segment and for selected projects; |
• | revenue by customer and by contract type; |
• | costs of revenue, excluding depreciation and amortization; general and administrative expenses; depreciation and amortization; other expenses or income; interest expense, net; and provision for income taxes; |
• | earnings from continuing operations before interest, taxes, depreciation and amortization (“EBITDA”) and Adjusted EBITDA, which we define as EBITDA excluding: (i) non-cash stock-based compensation expense; (ii) goodwill and intangible asset impairment; (iii) acquisition integration costs; (iv) Audit Committee investigation related costs; (v) losses on a proportionately consolidated non-controlled Canadian joint venture, (vi) court-mandated mediation and other legal settlement charges; (vii) gains or losses on equity investee interest rate swaps, and (viii) losses on debt extinguishment. See discussion of non-U.S. GAAP financial measures following the “Comparison of Fiscal Year Results” below; |
• | days sales outstanding, net of billings in excess of costs and earnings; and days payable outstanding; |
• | interest and debt service coverage ratios; and |
• | liquidity and cash flows. |
30
Management’s analysis of this information includes detailed discussions of proposed investments in new business opportunities or property and equipment, acquisition integration efforts and cost reduction efforts. Measuring these key performance indicators is an important tool used by management to make informed and timely operational decisions, which we believe can help us improve our performance.
Conclusion of the Independent Investigation of the Audit Committee
During 2015, the Audit Committee of the Board of Directors of MasTec, Inc., with the assistance of independent counsel and accounting advisors, conducted and concluded the previously disclosed independent investigation, which resulted in the restatement of certain of our 2014 interim financial statements. See Note 1 - Business, Basis of Presentation and Significant Accounting Policies in the notes to the audited consolidated financial statements, which is incorporated by reference, for related discussion. Also, see Item 9A. “Controls and Procedures” in this Annual Report on Form 10-K, regarding certain results of the investigation and our internal control over financial reporting.
Critical Accounting Estimates
This discussion and analysis of our financial condition and results of operations is based upon our audited consolidated financial statements, which have been prepared in accordance with U.S. GAAP. The preparation of these consolidated financial statements requires the use of estimates and assumptions that affect the amounts reported in our audited consolidated financial statements and the accompanying notes. We base our estimates on historical experience and on various other assumptions that we believe to be reasonable under the circumstances, the results of which form the basis of making judgments about the carrying values of assets and liabilities that are not readily apparent from other sources. Given that management estimates, by their nature, involve judgments regarding future uncertainties, actual results may differ from these estimates if conditions change or if certain key assumptions used in making these estimates ultimately prove to be inaccurate. Our accounting policies and critical accounting estimates are reviewed periodically by the Audit Committee of the Board of Directors. Refer to Note 1 - Business, Basis of Presentation and Significant Accounting Policies in the notes to the audited consolidated financial statements, which is incorporated by reference, for discussion of our significant accounting policies.
We believe that our accounting estimates pertaining to: revenue and cost recognition for percentage-of-completion projects, including related project profit or loss, which we define as project revenue less project costs of revenue, including depreciation; allowances for doubtful accounts; fair value estimates in connection with business acquisitions, in particular, estimated values of net assets acquired and estimated liabilities for future earn-out obligations; valuations of goodwill and indefinite-lived intangible assets; income taxes; self-insurance liabilities; and litigation and other contingencies are the most critical in the preparation of our consolidated financial statements as they are important to the portrayal of our financial condition and require significant or complex judgment and estimates on the part of management.
Revenue Recognition for Percentage-of-Completion Projects
Revenue from fixed price contracts provides for a fixed amount of revenue for the entire project, subject to certain additions for changed scope or specifications. Revenue from these contracts, as well as for certain projects pursuant to master and other service agreements, is recognized using the percentage-of-completion method, under which the percentage of revenue to be recognized for a given project is measured by the percentage of costs incurred to date on the contract to the total estimated costs for the contract. The estimation process for revenue recognized under the percentage-of-completion method is based on the professional knowledge and experience of our engineers, project managers and financial professionals. Management reviews estimates of contract revenue and costs on an ongoing basis. Changes in job performance, job conditions and final contract settlements are factors that influence our assessment of total contract value and total estimated costs to complete those contracts and, therefore, our profit recognition. Changes in these factors may result in revisions to costs and income, and their effects are recognized in the period in which the revisions are determined, which could materially affect our results of operations in the period in which such changes are recognized. Excluding the effects on our 2015 results of project losses of (i) $21.4 million on a Canadian wind project, (ii) $16.3 million on a proportionately consolidated non-controlled Canadian joint venture, and (iii) $14.0 million on an Electrical Transmission project, project profit was affected by less than 5% for both the years ended December 31, 2015 and 2014 as a result of changes in contract estimates included in projects that were in process as of December 31, 2014 and 2013, respectively. Provisions for losses on uncompleted contracts are made in the period in which such losses are determined to be probable and the amount can be reasonably estimated. The majority of fixed price contracts are generally completed within one year.
We may incur costs subject to change orders, whether approved or unapproved by the customer, and/or claims related to certain contracts. We determine the probability that such costs will be recovered based upon engineering studies and legal opinions, past practices with the customer, specific discussions, correspondence or preliminary negotiations with the customer. We treat project costs as a cost of contract performance in the period incurred if it is not probable that the costs will be recovered, or we defer the cost and/or recognize revenue up to the amount of the related cost if it is probable that the contract price will be adjusted and can be reliably estimated. As of December 31, 2015 and 2014, we had approximately $38 million and $87 million, respectively, of change orders and/or claims that had been included as contract price adjustments on certain contracts that were in the process of being resolved in the normal course of business, including through negotiation, arbitration and other proceedings. These contract price adjustments, which are included within costs and earnings in excess of billings or billed accounts receivable, as appropriate, represent management’s best estimate of contract revenue that has been or will be earned and that we believe is probable of collection. As of December 31, 2015 and 2014, these change orders were primarily related to contracts in the Oil and Gas and Electrical Transmission segments. We actively engage in substantive meetings with these customers to complete the final approval process and expect these processes to be completed within one year. The amounts ultimately realized upon final acceptance by our customers could be higher or lower than such estimated amounts.
Allowance for Doubtful Accounts
We regularly analyze the collectibility of accounts receivable and the adequacy of our allowance for doubtful accounts based on the aging of account balances, historical bad debt experience, customer concentrations, customer credit-worthiness, customer financial condition and credit reports, availability of mechanics’ and other liens, existence of payment bonds and other sources of payment and current economic trends. Estimates of collectibility are subject to significant change during times of economic weakness or uncertainty in either the overall economy or within the industries
31
served by us. If estimates of the collectibility of accounts receivable change, or should customers experience unanticipated financial difficulties, or if anticipated recoveries in existing bankruptcies or other work-out situations fail to materialize, additional reserves may be required, which could materially affect our results of operations in a given period. As of December 31, 2015, other than matters subject to litigation as discussed in Note 15 - Commitments and Contingencies in the notes to the audited consolidated financial statements, which is incorporated by reference, we did not have material amounts receivable that we believed were subject to significant uncertainty of collection or from customers experiencing financial difficulty.
Valuation of Net Assets Acquired and Estimated Future Earn-Out Obligations in Business Combinations
The determination of the fair value of net assets acquired in a business combination requires estimates and judgments of future cash flow expectations for the acquired business and related identifiable tangible and intangible assets. Fair values are calculated using expected cash flows and industry-standard valuation techniques. Due to the time required to gather and analyze the necessary data for each acquisition, U.S. GAAP provides a “measurement period” of up to one year in which to finalize the determination of the fair value of net assets acquired. As discussed in Note 1 - Business, Basis of Presentation and Significant Accounting Policies, we adopted Accounting Standards Update (“ASU”) 2015-16 in the fourth quarter of 2015, which eliminated the requirement to retrospectively account for measurement period adjustments resulting from adjustments to initial valuations and estimates resulting from newly discovered information that existed as of the date of acquisition. Prior to the adoption of this ASU, such adjustments were recorded as if the adjustments had been taken into account as of the date of acquisition, which resulted in the revision of comparative prior period information when presented in subsequent periods. Adjustments to the fair value of net assets acquired or expected future earn-out obligations resulting from circumstances that developed after the date of acquisitions are reflected as income or expense, as appropriate, in the period during which the adjustment is considered probable. Significant changes in the assumptions or estimates used in the underlying valuations, such as changes in the expected profitability or cash flows of an acquired business could materially affect our operating results in the period such changes are recognized.
Valuation of Goodwill and Indefinite-Lived Intangible Assets
We have goodwill and certain indefinite-lived intangible assets that have been recorded in connection with our acquisitions of businesses. Goodwill and indefinite-lived intangible assets are not amortized, but instead are tested for impairment at least annually. We perform our annual impairment tests of goodwill and indefinite-lived intangible assets during the fourth quarter of each year, and we monitor goodwill and indefinite-lived intangible assets for potential impairment triggers on a quarterly basis.
Goodwill is required to be tested for impairment at the reporting unit level. A reporting unit is an operating segment or one level below an operating segment, which is referred to as a component. Except for our Electrical Transmission operating segment, each of our reporting units comprises one component. Following is a summary of goodwill and indefinite-lived intangible assets by segment as of December 31, 2015:
Communications | Oil and Gas | Electrical Transmission | Power Generation and Industrial | Total | |||||||||||||||
Goodwill (in millions) | $ | 414.9 | $ | 306.1 | $ | 149.9 | $ | 117.6 | $ | 988.5 | |||||||||
Percentage of total | 41.9 | % | 31.0 | % | 15.2 | % | 11.9 | % | 100.0 | % | |||||||||
Indefinite-lived intangible assets (in millions) | $ | 0.4 | $ | 42.0 | $ | 31.3 | $ | 34.5 | $ | 108.2 | |||||||||
Percentage of total | 0.4 | % | 38.8 | % | 28.9 | % | 31.9 | % | 100.0 | % | |||||||||
For the year ended December 31, 2015, we performed a qualitative assessment for our goodwill and indefinite-lived intangible assets by examining relevant events and circumstances that could have an effect on their fair values, such as: macroeconomic conditions, industry and market conditions, entity-specific events, financial performance and other relevant factors or events that could affect earnings and cash flows.
Due to continued volatility in oil and gas prices during 2015 and in the beginning of 2016, which has negatively impacted financial performance, expectations and future cash flow projections at several of our reporting units, we performed quantitative testing for three reporting units within our Oil and Gas operating segment. We also performed quantitative testing for two indefinite-lived pre-qualification intangible assets in the Oil and Gas segment.
Due to adverse weather disruptions, site-related project inefficiencies, and reduced project activity from the combination of lower overall market activity levels due to project delays and lower than expected success rates on new project awards during 2015, we performed quantitative testing for the Electrical Transmission operating segment. We also performed quantitative testing for one indefinite-lived pre-qualification intangible asset in the Electrical Transmission segment.
For the reporting units described above, we performed a two-step quantitative goodwill impairment test. We estimated their respective fair values using a combination of market and income approaches. Under the market approach, fair values were estimated using published market multiples for comparable companies. Under the income approach, a discounted cash flow methodology was used, including: (i) management estimates, such as projections of revenue, operating costs and cash flows, taking into consideration historical and anticipated financial results; (ii) general economic and market conditions; and (iii) the impact of planned business and operational strategies. The estimated discount rates were determined using our average cost of capital at the time of the analysis, taking into consideration the risk inherent within each reporting unit individually, which is greater than the risk inherent in the Company as a whole. Significant assumptions used in testing the reporting units included terminal values based on terminal growth rates ranging from 3.0%-3.5%, nine years of discounted cash flows prior to the terminal value, and discount rates ranging from 12.0% to 14.0%. We believe the assumptions used in our quantitative goodwill impairment tests are reflective of the risks inherent in the business models of our reporting units and within our industry.
32
The estimated fair values of two reporting units in the Oil and Gas segment discussed above were determined to substantially exceed their carrying values for the year ended December 31, 2015. A 100 basis point change in the discount rate would not have had a material impact on the results of the impairment tests for these two reporting units. The second step of the goodwill impairment test was performed for the third reporting unit tested within the Oil and Gas segment. The implied fair value of goodwill was less than its carrying value as of December 31, 2015, and as a result a pre-tax, non-cash goodwill impairment charge of $68.5 million was recorded for the difference. This reporting unit has $11.2 million of goodwill remaining at December 31, 2015. See Note 1 - Business, Basis of Presentation and Significant Accounting Policies and Note 4 - Goodwill and Other Intangible Assets in the notes to the audited consolidated financial statements, which notes are incorporated by reference, for additional discussion.
The estimated fair value of the Electrical Transmission segment exceeded its carrying value by approximately 5%. A 100 basis point change in the discount rate would have resulted in carrying value exceeding fair value for the Electrical Transmission segment. Significant changes in other assumptions or estimates such as a reduction in profitability and/or cash flows could result in non-cash goodwill and indefinite-lived intangible asset impairment charges in the Electrical Transmission segment.
For the indefinite-lived pre-qualification intangible assets in the Oil and Gas and Electrical Transmission segments for which additional testing was performed, we estimated fair values using a cost methodology, incorporating estimates of the opportunity cost associated with the assets’ loss based on discounted cash flows over a two to three-year period. The impairment tests incorporated estimated discount rates ranging from 12.0% to 14.0%. For one of the indefinite-lived pre-qualification intangible assets in the Oil and Gas segment and the indefinite-lived pre-qualification intangible asset in the Electrical Transmission segment, the estimated fair values were substantially in excess of the carrying value. For the other indefinite-lived pre-qualification intangible asset in the Oil and Gas segment, the carrying value of the asset exceeded its estimated fair value as of December 31, 2015, and as a result a pre-tax, non-cash impairment charge of $10.1 million was recorded for the difference. See Note 1 - Business, Basis of Presentation and Significant Accounting Policies and Note 4 - Goodwill and Other Intangible Assets for additional discussion. The adjusted carrying value of this pre-qualification asset is approximately $20.5 million at December 31, 2015.
As of December 31, 2015, we believe that the recorded balances of goodwill and indefinite-lived intangible assets are recoverable; however, there can be no assurance that goodwill and indefinite-lived intangible assets will not be impaired in future periods. Significant changes in the assumptions or estimates used in our impairment analyses, such as a reduction in profitability and/or cash flows, could result in additional non-cash goodwill and indefinite-lived intangible asset impairment charges and materially affect our operating results.
Income Taxes
Our provision for income taxes uses an effective tax rate based on annual pre-tax income, statutory tax rates, permanent tax differences and tax planning opportunities in the various jurisdictions in which we operate. Significant factors that can impact our annual effective tax rate include our assessment of certain tax matters, the location and amount of taxable earnings and changes in certain non-deductible expenses and expected credits. Although we believe our provision for income taxes is correct and the related assumptions are reasonable, the final outcome of tax matters could be materially different from what we currently anticipate, which could result in significant costs or benefits to us. As of December 31, 2015, we have not made a provision for U.S. income taxes on unremitted foreign earnings because such earnings, which generally become subject to U.S. taxation upon the remittance of dividends and certain other circumstances, are considered to be insignificant and are intended to be indefinitely reinvested outside the United States. We expect that domestic cash resources will be sufficient to fund our domestic operations and cash commitments in the future.
Self-Insurance
We are self-insured up to the amount of our deductible for our insurance policies. Liabilities under our insurance programs are accrued based upon our estimate of the ultimate liability for claims, with assistance from third-party actuaries. The determination of such claims and the related liability is reviewed and updated quarterly, however, these insurance liabilities are difficult to assess and estimate due to unknown factors, including the severity of an injury, the determination of our liability in proportion to other parties and the number of incidents not reported. Accruals are based upon known facts and historical trends, and although we believe such accruals are adequate. However, a change in experience or actuarial assumptions could materially affect our results of operations in a particular period.
Litigation and Contingencies
Accruals for litigation and contingencies are based on our assessment, including advice of legal counsel, of the expected outcome of litigation or other dispute resolution proceedings or the expected resolution of contingencies. Significant judgment is required in both the determination of probability of loss and the determination as to whether the amount is reasonably estimable. As additional information becomes available, we reassess potential liabilities related to pending claims and litigation and may revise previous estimates, which could materially affect our results of operations in a given period.
2016 Outlook
We expect market opportunities in the following areas:
Wireless and Wireline/Fiber Network Upgrades - while we were affected by customers’ reductions in capital spending levels for wireless infrastructure in 2015, mobile data traffic continues to expand, which we believe will create increased demand for the services we provide. Major carriers are in the process of upgrading to 4G technology and are testing the next generation of 5G technology for future deployment. We believe that the need for increased capacity as a result of continued growth in data traffic, coupled with demand for enhanced, faster and more reliable wireless network services and products, including the upgrade of networks to the latest technology, will generate increased demand for our services in the long-term. We also believe investment in 1 Gigabit per second wireline/fiber network upgrades and expansion of existing networks will increase in 2016 as
33
major national, regional and rural telecommunications providers and other companies continue to invest in and deploy capabilities in these areas. Accordingly, we currently expect improved market opportunities in wireless and wireline/fiber infrastructure construction.
Oil, Natural Gas and Natural Gas Liquids Pipelines - technological advances have made access to oil and natural gas easier and less expensive in recent years and created additional North American reserves and production. Much of the new oil and gas production is from relatively remote areas, with the largest concentration of refining capacity in North America on the U.S. Gulf Coast. As a result of this reserve dislocation, significant amounts of oil and gas need to be transported to markets or refining centers to be utilized or converted into usable fuel. We believe that these initiatives and the related demand for more environmentally sensitive forms of transport will provide continued opportunities for our pipeline construction, oil and gas gathering, gas compression, liquids pumping and oil and gas treatment infrastructure construction services.
Due to recent energy regulation reforms, Mexico has begun an initiative to import natural gas from the U.S. to replace other, higher priced and dirtier hydrocarbons that are currently used to fuel its electric power plants. This initiative is expected to drive pipeline infrastructure construction, in addition to generating expanded manufacturing and economic development in northern Mexico along the U.S. border, which, if successful, could generate additional opportunities, not only in pipeline construction, but also in conventional and renewable power generation, electrical transmission and communications infrastructure construction.
Declines in oil prices that began in 2014 and continued through 2015 have had a significant effect on gathering pipeline and related facilities project activities in 2015, particularly in western Canada. In addition, in 2015, there was a reduced level of long-haul pipeline activity, which we believe will increase in 2016. Our Oil and Gas segment backlog growth as of December 31, 2015 is reflective of the significant expected expansion of long-haul project activity as well as expected pipeline construction associated with our investment in two joint ventures formed to design and construct pipelines that will interconnect at the U.S./Mexico border. We believe that future demand for clean-burning, domestic natural gas will grow as a result of environmental and climate concerns, as well as in order to reduce U.S. dependence on foreign energy sources.
Electrical Grid Upgrades - we believe that the nation’s electrical grid will continue to require significant ongoing maintenance, upgrade and expansion to manage capacity, reliability and security issues. In addition, investment in transmission and substation infrastructure will be required to deliver renewable energy to population and industrial centers with high electrical power demand. We expect continued efforts to modernize and expand the national electrical grid in order to develop a smart grid. We believe that reliability issues will stimulate capital investment to maintain the electrical grid. We also believe that utility companies will continue to utilize outsourced services to support ongoing construction and maintenance activities. We have proven expertise in handling complex electrical transmission projects and believe that we are well positioned for these opportunities.
Install-to-the-Home and Customer Fulfillment - we believe the continued high number of AT&T/DIRECTV® subscribers and special or proprietary programming and other in-home technology advances should provide us with the continuing opportunity to provide installation, upgrade and maintenance services for new and existing customers. Leveraging our expertise in home installation and our existing network of technicians, we also provide installation, upgrade and maintenance services for the growing market in home security and automation services, primarily through AT&T Digital Life®, which has expanded in multiple markets throughout the U.S. Additionally, we provide services in 28 markets for Sprint’s Direct 2 YouTM program for home/office delivery and setup of mobile devices, which we believe could generate significant future opportunities for us.
Renewable Energy Projects - we continued to see strong levels of renewable project activity in 2015 as developers continued work on projects benefiting from the tax incentive provisions of ATRA. Based on the recent extension of production tax credits, we expect continued strong levels of activity in 2016 as developers seek to complete these projects. Our power generation business specializes in the construction, maintenance and upgrade of renewable energy infrastructure, including wind farms and solar farms. Regulatory mandates and recent clean air and climate change initiatives, in addition to federal incentive programs for electricity generation from alternative and renewable sources, which call for expansion of domestic renewable energy sources through tax incentives, cash grants and loan guarantees, are expected to continue to drive demand for these and other energy optimization services.
Power Plants and Heavy Industrial - we believe there will be increased demand for heavy industrial construction across a range of industries. The current low price and environmental advantage of clean burning natural gas should result in the conversion of coal fired power plants and the construction of new gas fired power plants. Additionally, a wide variety of industries may seek to expand, convert or construct new plants to take advantage of this economical, cleaner and lower cost carbon fuel source. We continue to expand our capabilities in heavy industrial construction in anticipation of this trend.
Our 2016 results could be adversely affected by the matters discussed in the “Cautionary Statement Regarding Forward-Looking Statements,” Item 1A. “Risk Factors” and Item 3. “Legal Proceedings” of this Annual Report on Form 10-K.
Comparison of Fiscal Year Results
The following table reflects our consolidated results of operations in dollar and percentage of revenue terms for the periods indicated (dollar amounts in millions). Our consolidated results of operations are not necessarily comparable from period to period due to the impact of recent acquisitions and the impact of certain other items, which are described more fully in the comparison of results section below.
34
For the Years Ended December 31, | ||||||||||||||||||||
2015 | 2014 | 2013 | ||||||||||||||||||
Revenue | $ | 4,208.3 | 100.0 | % | $ | 4,611.8 | 100.0 | % | $ | 4,324.8 | 100.0 | % | ||||||||
Costs of revenue, excluding depreciation and amortization | 3,721.3 | 88.4 | % | 3,978.0 | 86.3 | % | 3,682.4 | 85.1 | % | |||||||||||
Depreciation and amortization | 169.7 | 4.0 | % | 154.5 | 3.3 | % | 140.9 | 3.3 | % | |||||||||||
Goodwill and intangible asset impairment | 78.6 | 1.9 | % | — | — | — | — | |||||||||||||
General and administrative expenses | 265.9 | 6.3 | % | 238.3 | 5.2 | % | 215.4 | 5.0 | % | |||||||||||
Interest expense, net | 48.1 | 1.1 | % | 50.8 | 1.1 | % | 46.4 | 1.1 | % | |||||||||||
Loss on extinguishment of debt | — | — | — | — | 5.6 | 0.1 | % | |||||||||||||
Other income, net | (7.5 | ) | (0.1 | )% | (8.2 | ) | (0.2 | )% | (6.1 | ) | (0.1 | )% | ||||||||
(Loss) income from continuing operations before income taxes | $ | (67.7 | ) | (1.6 | )% | $ | 198.4 | 4.3 | % | $ | 240.2 | 5.6 | % | |||||||
Provision for income taxes | (12.0 | ) | (0.3 | )% | (76.4 | ) | (1.7 | )% | (92.5 | ) | (2.1 | )% | ||||||||
Net (loss) income from continuing operations | $ | (79.7 | ) | (1.9 | )% | $ | 122.0 | 2.6 | % | $ | 147.7 | 3.4 | % | |||||||
Net loss from discontinued operations | — | — | (6.5 | ) | (0.1 | )% | (6.5 | ) | (0.1 | )% | ||||||||||
Net (loss) income | $ | (79.7 | ) | (1.9 | )% | $ | 115.5 | 2.5 | % | $ | 141.2 | 3.3 | % | |||||||
Net (loss) income attributable to non-controlling interests | (0.6 | ) | (0.0 | )% | (0.4 | ) | (0.0 | )% | 0.3 | 0.0 | % | |||||||||
Net (loss) income attributable to MasTec, Inc. | $ | (79.1 | ) | (1.9 | )% | $ | 115.9 | 2.5 | % | $ | 140.9 | 3.3 | % | |||||||
We review our operating results by reportable segment. See Note 14 - Segments and Related Information in the notes to the audited consolidated financial statements, which is incorporated by reference. Our reportable segments are: (1) Communications; (2) Oil and Gas; (3) Electrical Transmission; (4) Power Generation and Industrial and (5) Other. Management’s review of reportable segment results includes analyses of trends in revenue, EBITDA and EBITDA margin. We calculate EBITDA for segment reporting purposes consistently with our consolidated EBITDA calculation. See the discussion of our non-U.S. GAAP financial measures, including certain adjusted Non-U.S. GAAP measures, as described following the comparison of results discussion below. The following table presents revenue, EBITDA and EBITDA margin by reportable segment for our continuing operations for the periods indicated (dollar amounts in millions):
For the Years Ended December 31, | |||||||||||||||||||||||||||||||||
Revenue | EBITDA and EBITDA Margin | ||||||||||||||||||||||||||||||||
Reportable Segment: | 2015 | 2014 | 2013 | 2015 | 2014 | 2013 | |||||||||||||||||||||||||||
Communications | $ | 1,973.2 | $ | 2,041.0 | $ | 1,962.6 | $ | 194.8 | 9.9 | % | $ | 204.0 | 10.0 | % | $ | 247.7 | 12.6 | % | |||||||||||||||
Oil and Gas | 1,495.1 | 1,731.4 | 1,628.8 | 157.0 | 10.5 | % | 195.1 | 11.3 | % | 215.9 | 13.3 | % | |||||||||||||||||||||
Electrical Transmission | 341.5 | 471.9 | 428.8 | (71.3 | ) | (20.9 | )% | 45.0 | 9.5 | % | 41.2 | 9.6 | % | ||||||||||||||||||||
Power Generation and Industrial | 381.6 | 357.0 | 294.3 | 8.8 | 2.3 | % | 14.2 | 4.0 | % | (16.3 | ) | (5.5 | )% | ||||||||||||||||||||
Other | 24.1 | 14.7 | 12.3 | (18.8 | ) | (78.1 | )% | (1.2 | ) | (8.4 | )% | 0.5 | 3.9 | % | |||||||||||||||||||
Eliminations | (7.2 | ) | (4.2 | ) | (2.0 | ) | — | — | — | — | — | — | |||||||||||||||||||||
Corporate | — | — | — | (120.5 | ) | — | (53.4 | ) | — | (61.4 | ) | — | |||||||||||||||||||||
Consolidated Results | $ | 4,208.3 | $ | 4,611.8 | $ | 4,324.8 | $ | 150.0 | 3.6 | % | $ | 403.7 | 8.8 | % | $ | 427.6 | 9.9 | % | |||||||||||||||
The following discussion and analysis of our results of operations should be read in conjunction with our audited consolidated financial statements and notes thereto in Item 8 of this Form 10-K.
Comparison of Years Ended December 31, 2015 and 2014
Revenue. Our revenue was $4,208 million in 2015 as compared with $4,612 million in 2014, a decrease of $403 million, or 8.7%. Oil and Gas revenue decreased by $236 million, or 14%, Electrical Transmission revenue decreased by $130 million, or 28%, and Communications revenue decreased by $68 million, or 3%. These decreases were offset, in part, by increases in Power Generation and Industrial revenue of $25 million, or 7%, and an increase in Other segment revenue of $9 million, or 64.0%. Acquisitions contributed a $302 million increase in revenue, whereas organic revenue declined by $705 million, due to lower levels of activity in our Oil and Gas segment, lower levels of wireless services in our Communications segment and lower levels of activity in our Electrical Transmission segment. A discussion of revenue by segment follows below.
Communications Segment. Communications revenue was $1,973 million in 2015 as compared with $2,041 million in 2014, a decrease of approximately $68 million, or 3%. Acquisitions contributed $209 million of additional revenue, whereas organic revenue declined by $276 million versus the prior year, primarily as a result of lower levels of wireless services due to changes in our wireless customers’ capital spending plans. The decrease in wireless revenue was partially offset by an increase from certain utility services, including wireline/fiber network project activity.
Oil and Gas Segment. Oil and Gas revenue was $1,495 million in 2015, as compared with $1,731 million in 2014, a decrease of $236 million, or 14%. Acquisitions contributed $89 million of additional revenue, whereas organic revenue declined by $325 million as compared with the same
35
period in the prior year. The decline in organic revenue resulted from (i) lower overall levels of gathering pipeline and related facilities project activities in our Canadian operations due to the decline in oil prices; (ii) reduced levels of long-haul pipeline project activity in 2015, and (iii) the negative effect of fluctuations in foreign currency exchange rates on our Canadian operations as compared with the prior year.
Electrical Transmission Segment. Electrical Transmission revenue was $341 million in 2015, as compared with $472 million in 2014, a decrease of $130 million, or 28%. Electrical transmission revenue in 2015 included the effect of (i) adverse weather disruptions and (ii) site-related project inefficiencies, as well as (iii) reduced project activity from the combination of lower overall market activity levels due to project delays and lower than expected success rates on new project awards during 2015 as a result of management diversion from business operations and marketing due to the Audit Committee’s independent investigation that was concluded in December 2015.
Power Generation and Industrial Segment. Power Generation and Industrial revenue was $382 million in 2015, as compared with $357 million in 2014, an increase of $25 million, or 7%. The increase was primarily caused by a greater number of renewable power projects as compared with the prior year.
Other Segment. Other segment revenue was $24 million in 2015, as compared with $15 million in 2014, an increase of $9 million, or 64%. The increase was primarily related to increased oil and gas operations in Mexico, as well as revenue from a proportionately consolidated non-controlled Canadian joint venture that was acquired in 2014.
Costs of revenue, excluding depreciation and amortization. Costs of revenue, excluding depreciation and amortization, decreased by $257 million, or 6.5%, to $3,721 million in 2015 from $3,978 million in 2014. Lower revenue resulted in a decrease of $348 million in costs of revenue, excluding depreciation and amortization, whereas decreased productivity resulted in an increase of approximately $91 million. Costs of revenue, excluding depreciation and amortization, as a percentage of revenue increased by approximately 220 basis points, from 86.3% of revenue in 2014 to 88.4% of revenue in 2015. This increase was driven by increased costs in our Electrical Transmission, Power Generation and Industrial, Other and Oil and Gas segments. Increased costs in our Electrical Transmission segment were due to lower levels of cost utilization from reduced levels of revenue, site-related project inefficiencies and the effects of adverse weather conditions. Costs of revenue, excluding depreciation and amortization, as a percentage of revenue increased in our Power Generation and Industrial segment due to project losses of approximately $21 million on a troubled wind project in Canada that was completed in 2015 and in our Other business segment from project losses of approximately $16 million on a proportionately consolidated non-controlled Canadian joint venture. Our Oil and Gas segment incurred higher costs as a percentage of revenue in 2015 due to production inefficiencies from lower levels of revenue, as discussed above. These increases in costs of revenue, excluding depreciation and amortization, as a percent of revenue, were partially offset by productivity improvements in our Communications segment.
Depreciation and amortization. Depreciation and amortization was $170 million, or 4.0% of revenue in 2015, as compared with $154 million, or 3.3% of revenue in 2014, an increase of approximately $15 million, or 9.8%. Acquisitions contributed $18 million of depreciation and amortization expense, whereas organic depreciation and amortization expense decreased by $3 million as compared with the prior year.
Goodwill and intangible asset impairment. We incurred $78.6 million of goodwill and intangible asset impairment in 2015 related to a reporting unit in our Oil and Gas segment. For additional details, see Note 4 - Goodwill and Other Intangible Assets in the notes to the audited consolidated financial statements, which is incorporated by reference.
General and administrative expense. General and administrative expenses were $266 million, or 6.3% of revenue in 2015, as compared with $238 million, or 5.2% of revenue in 2014, an increase of $28 million, or 11.6%. Acquisitions contributed approximately $6 million of incremental general and administrative costs, excluding acquisition integration costs incurred in connection with the WesTower acquisition. Acquisition integration costs and the Audit Committee’s independent investigation contributed $13 million and $16 million, respectively, of the increase in general and administrative expenses in 2015, in addition to an increase in other legal costs. These increases were partially offset by decreases in non-cash stock based and incentive compensation expense. As a percentage of revenue, general and administrative expenses increased by approximately 110 basis points.
Interest expense, net. Interest expense, net of interest income, was $48 million in 2015, or 1.1% of revenue, as compared with $51 million, or 1.1% of revenue in 2014, a decrease of $3 million, or 5.3%. In 2014, our senior convertible notes matured and were converted, which reduced our interest expense in 2015. The decrease in interest expense in 2015 from our senior convertible notes was partially offset by incremental interest expense on our credit facilities as a result of higher average outstanding borrowings, as well as from discount fees associated with financing arrangements and consent solicitation agent fees due to the delay in filing of our 2014 Form 10-K and 2015 First Quarter Form 10-Q.
Other income, net. Other income, net, was $7 million in 2015, as compared with $8 million in 2014. Other income, net, consists primarily of gains or losses from sales of assets and investments, certain legal/other settlements, our proportionate share of income or expense from equity method investments and gains or losses from changes to estimated earn-out accruals. Other income, net, in 2015 includes a $12 million charge related to a court mandated mediation settlement and approximately $8 million of losses on equity method investments, including a $4 million recognized unrealized loss on interest rate swaps incurred by our equity method investments in two joint ventures formed to design and construct pipelines that will interconnect at the U.S./Mexico border. These losses were offset by $20 million of a net reduction in the estimated earn-out liability for acquired businesses. Gains on sales of equipment were approximately $8 million in 2015 as compared with $6 million in 2014.
Provision for income taxes. Income tax expense was $12 million in 2015 as compared with $76 million in 2014, a decrease of approximately $64 million. Pre-tax income in 2014 was $198 million as compared with pre-tax losses of $68 million in 2015. Income tax expense in 2015 includes the effect of approximately $3 million incurred in connection with the cumulative revaluation of certain deferred tax liabilities pursuant to an Alberta provincial income tax law that was enacted in June 2015. For the year ended December 31, 2015, we had a provision for income tax despite having pre-tax losses because the amount of our permanent differences, primarily related to the impairment of goodwill, exceeded our pre-tax losses.
36
Loss from discontinued operations. Loss from discontinued operations, net of tax, was $6 million in 2014. In 2014, management determined that the contingent assets associated with Globetec, which was sold in 2013, were not recoverable and recorded related losses on disposal of $6 million, net of tax.
Analysis of EBITDA by segment
Communications Segment. EBITDA for our Communications segment was $195 million, or 9.9% of revenue in 2015, compared to $204 million, or 10.0% of revenue in 2014, a decrease of $9 million, or 4%. Communications segment EBITDA for 2015 includes $18 million of acquisition integration costs associated with the WesTower acquisition, as compared with $5 million in 2014. As a percentage of revenue, EBITDA decreased by 10 basis points, or approximately $2 million, due to acquisition integration costs from the WesTower acquisition, offset in part by production efficiencies and improved cost utilization.
Oil and Gas Segment. EBITDA for our Oil and Gas segment was $157 million, or 10.5% of revenue in 2015, compared to $195 million, or 11.3% of revenue in 2014, a decrease of $38 million, or 20%. As a percentage of revenue, EBITDA decreased approximately 80 basis points, or approximately $12 million, due to production inefficiencies resulting from lower levels of revenue as a result of (i) lower overall levels of gathering pipeline and related facilities project activities in our Canadian operations due to the decline in oil prices and (ii) reduced levels of long-haul pipeline project activity in 2015. In addition, fluctuations in foreign currency exchange rates had a negative affect on EBITDA for our Canadian operations as compared with the same period in the prior year.
Electrical Transmission Segment. EBITDA for our Electrical Transmission segment was negative $71 million, or negative 20.9% of revenue in 2015, as compared with EBITDA of $45 million, or 9.5% of revenue in 2014, a decrease in EBITDA of $116 million. Lower revenue contributed approximately $12 million of the decrease in EBITDA. Additionally, in the third quarter of 2015, our Electrical Transmission segment recorded a $12 million charge related to a settlement reached as a result of a court mandated mediation. Electrical Transmission segment EBITDA has also been negatively affected by lower levels of cost utilization from reduced levels of revenue as compared with the prior year, as well as the effects of site-related project inefficiencies, adverse weather disruptions and higher legal costs. This segment was the primary focus of the Audit Committee independent investigation that was concluded in December 2015, which significantly diverted management’s attention from its operations and marketing efforts.
Power Generation and Industrial Segment. EBITDA for our Power Generation and Industrial segment was $9 million in 2015, or 2.3% of revenue, as compared with EBITDA of $14 million in 2014, or 4% of revenue, a decrease of $5 million, or 38%. Power Generation and Industrial segment EBITDA for 2015 includes $21 million of losses on a troubled Canadian wind project that was completed in 2015. As a percentage of revenue, EBITDA decreased by approximately 170 basis points. The basis point decrease resulting from this project was partially offset by improved cost utilization from higher levels of revenue and other project efficiencies.
Other Segment. EBITDA from Other businesses was negative $19 million in 2015, as compared with negative $1 million of EBITDA in 2014. Other segment EBITDA in 2015 includes (i) a $4 million recognized unrealized loss on interest rate swaps incurred by our equity method investments in two joint ventures formed to design and construct pipelines that will interconnect at the U.S./Mexico border, and (ii) $16 million of losses on a proportionately consolidated non-controlled Canadian joint venture that was acquired in 2014 and has experienced project delays. These losses were offset, in part, by positive EBITDA in our international operations.
Corporate Segment. Corporate EBITDA was negative $121 million in 2015, as compared with negative EBITDA of $53 million in 2014. Corporate EBITDA in 2015 includes $78.6 million of goodwill and intangible asset impairment and $16 million of costs related to the Audit Committee independent investigation. The increase in negative Corporate EBITDA was offset, in part, by a net reduction in the estimated earnout liability for acquired businesses and a reduction in stock-based and incentive compensation expense. See Note 4 - Goodwill and Other Intangible Assets in the notes to the audited consolidated financial statements, which is incorporated by reference, for details regarding the 2015 goodwill and intangible asset impairment.
Comparison of Years Ended December 31, 2014 and 2013
Revenue. Our revenue was $4,612 million in 2014 as compared with $4,325 million in 2013, an increase of $287 million, or 6.6%. Oil and Gas revenue increased by $103 million, or 6%, Communications revenue increased by $78 million, or 4%, Power Generation and Industrial revenue increased by $63 million, or 21% and Electrical Transmission revenue increased by $43 million, or 10%. Acquisitions contributed $565 million of the year-over-year increase in revenue, whereas organic revenue declined by $278 million, primarily as a result of lower levels of long-haul pipeline services in our Oil and Gas segment and lower levels of wireless and wireline/fiber services in our Communications segment. A discussion of revenue by segment follows below.
Communications Segment. Communications revenue was $2,041 million in 2014 as compared with $1,963 million in 2013, an increase of approximately $78 million, or 4%. Communications revenue, including acquisitions, increased as a result of growth in wireless and install-to-the-home services. This growth was offset, in part, by a decrease in wireline/fiber revenue due to project timing. Acquisitions contributed $185 million of the year-over-year increase in revenue, whereas organic revenue declined by $107 million versus the prior year.
Oil and Gas Segment. Oil and Gas revenue was $1,731 million in 2014, compared to $1,629 million in 2013, an increase of $103 million, or 6%, driven primarily by midstream pipeline and gas gathering activities, as well as pipeline facility and other project work. These increases were partially offset by lower levels of long-haul pipeline work during the second half of 2014 and the negative effect of fluctuations in foreign currency exchange rates on our Canadian operations due to the strengthening of the U.S. dollar against the Canadian dollar in 2014 as compared to 2013. Acquisitions contributed $358 million of the year-over-year increase in revenue, whereas organic revenue decreased by $256 million versus the prior year as a result of the factors discussed above.
37
Electrical Transmission Segment. Electrical Transmission revenue was $472 million in 2014, as compared with $429 million in 2013, an increase of $43 million, or 10%. Organic revenue grew by $27 million, or 6%, primarily as a result of project timing. Acquisitions contributed $16 million of the year-over-year increase in revenue.
Power Generation and Industrial Segment. Power Generation and Industrial revenue was $357 million in 2014, compared to $294 million in 2013, an increase of $63 million, or 21%. The increase was primarily caused by higher levels of renewable power projects following the renewal of the federal production tax credit for qualified wind facilities in 2013.
Other Segment. Revenue from Other businesses was $15 million in 2014, compared to $12 million in 2013. The increase was primarily related to project revenue from a proportionately consolidated non-controlled Canadian joint venture that was acquired in 2014, offset, in part, by a decrease in revenue from the completion of a wireless project in our international division.
Costs of revenue, excluding depreciation and amortization. Costs of revenue, excluding depreciation and amortization, were $3,978 million in 2014, as compared with $3,682 million in 2013, an increase of $296 million, or 8.0%, of which approximately $244 million was driven by higher revenue and approximately $51 million of which resulted from decreased productivity. Costs of revenue, excluding depreciation and amortization, as a percentage of revenue increased by approximately 110 basis points to 86.3% of revenue in 2014 from 85.1% of revenue in 2013. The increase was driven by (i) Communications segment production inefficiencies and increased overhead costs as a result of lower than anticipated levels of wireless and wireline/fiber services, as well as (ii) higher costs in our Oil and Gas segment due to production inefficiencies resulting from lower levels of organic revenue as well as timing of selected project startups.
Depreciation and amortization. Depreciation and amortization was $154 million, or 3.3% of revenue in 2014, as compared with $141 million, or 3.3% of revenue in 2013, an increase of approximately $14 million, or 9.6%. Acquisitions contributed approximately $25 million of the year-over-year increase in depreciation and amortization expense, whereas organic depreciation and amortization expense decreased by $12 million versus the prior year.
General and administrative expense. General and administrative expenses were $238 million, or 5.2% of revenue in 2014, as compared with $215 million, or 5.0% of revenue in 2013, an increase of $23 million, or 10.6%. The increase was largely driven by acquisitions, which contributed approximately $28 million of year-over-year incremental general and administrative costs, including $5 million of acquisition integration costs incurred in connection with the WesTower acquisition. General and administrative costs, excluding acquisition-related expenses, decreased by $5 million, primarily due to decreases in various administrative costs, including bonus, bad debt expense and information technology costs, offset, in part, by increases in legal costs and non-cash stock-based compensation expense. As a percentage of revenue, general and administrative expenses increased by approximately 20 basis points.
Interest expense, net. Interest expense, net of interest income, was $51 million in 2014, as compared with $46 million in 2013, an increase of $4 million, or 9.3%. The increase was largely attributable to $5 million of incremental interest expense on our senior secured credit facility (as amended to date, the “Credit Facility”) as a result of higher average borrowings in 2014 as compared with 2013. In addition, in March 2013, we issued $400 million aggregate principal amount of 4.875% senior notes, resulting in $2 million of incremental interest expense in 2014 as compared with the prior year. Additionally, higher average outstanding balances on capital lease obligations in 2014 contributed $2 million of incremental interest expense. These increases were offset, in part, by the 2014 maturities of $215 million aggregate principal amount of our senior convertible notes, which resulted in a $5 million decrease in interest expense. We paid approximately $202.3 million in cash in settlement of these notes, which was funded primarily by our Credit Facility. As a percentage of revenue, interest expense was flat at 1.1% of revenue.
Loss on extinguishment of debt. We incurred $6 million of debt extinguishment costs in 2013 in connection with the repurchase and redemption of $150 million aggregate principal amount of our 7.625% senior notes. This amount comprised $4 million of early payment premiums and $2 million of unamortized deferred financing costs.
Other income, net. Other income, net, was $8 million in 2014, as compared with $6 million in 2013. Gains on sale of equipment were approximately $6 million in 2014 as compared with $7 million in 2013. Other expense in 2013 included a final legal settlement charge of $3 million related to Sintel, a legacy litigation matter. Refer to Note 15 - Commitments and Contingencies in the notes to the audited consolidated financial statements, which is incorporated by reference. Offsetting amounts in other income in 2014 included $6 million of income from a reduction in the estimated earn-out liability for a 2012 acquisition and $6 million of expense from an increase in the earn-out liability associated with a separate acquisition for which the earn-out period was completed in 2014.
Provision for income taxes. Income tax expense was $76 million in 2014 as compared with $93 million in 2013, a decrease of approximately $16 million. The decrease was attributable to lower income in 2014 as compared with the prior year.
Loss from discontinued operations. Loss from discontinued operations, net of tax, was $6 million in 2014 as compared with $6 million in 2013. During the third quarter of 2013, we completed the sale of the Globetec operation and recorded estimated losses on disposal and impairment charges of $4 million, net of tax. Operating losses associated with Globetec in 2013 were $2 million, net of tax. During 2014, management determined the contingent assets associated with Globetec were not recoverable and recorded additional losses on disposal of $6 million, net of tax.
Analysis of EBITDA by segment
Communications Segment. EBITDA for our Communications segment was $204 million, or 10.0% of revenue in 2014, compared to $248 million, or 12.6% of revenue in 2013, a decrease of $44 million, or 18%. As a percentage of revenue, EBITDA decreased approximately 260 basis points, or approximately $54 million. The decrease was driven primarily by production inefficiencies and increased overhead costs as a result of lower
38
than anticipated levels of wireless and wireline/fiber services, coupled with acquisition integration costs of $5 million in connection with the WesTower acquisition. Higher revenue contributed $10 million of incremental EBITDA.
Oil and Gas Segment. EBITDA for our Oil and Gas segment was $195 million, or 11.3% of revenue in 2014, compared to $216 million, or 13.3% of revenue in 2013, a decrease of $21 million, or 10%. As a percentage of revenue, EBITDA decreased approximately 200 basis points, or approximately $34 million, with a majority of this decline due to production inefficiencies resulting from lower organic revenue and timing of selected project startups. The decline in EBITDA margins was offset, in part, by $14 million of incremental EBITDA from higher revenue.
Electrical Transmission Segment. EBITDA for our Electrical Transmission segment was $45 million, or 9.5% of revenue in 2014, as compared with EBITDA of $41 million, or 9.6% of revenue in 2013, an increase of $4 million, or 9%. EBITDA margins decreased slightly in 2014, by approximately 10 basis points, or approximately $0.3 million. Higher revenue, as described above, contributed $4 million of incremental EBITDA.
Power Generation and Industrial Segment. EBITDA for our Power Generation and Industrial segment was $14 million in 2014, or 4.0% of revenue in 2014, as compared with negative EBITDA of $16 million in 2013, an increase of $31 million. The improvement in EBITDA was driven largely by increased levels of renewable power project work in 2014 following renewal of the federal production tax credit for qualified wind facilities in 2013. The renewable project work we performed in 2014 carried higher margins than the commercial and industrial project work that we completed in 2013.
Other Segment. EBITDA from Other businesses was negative $1.2 million in 2014, as compared with $0.5 million of EBITDA in 2013. The decrease was primarily attributable to losses on a proportionately consolidated non-controlled Canadian joint venture that was acquired in 2014, which experienced project delays. This project was approximately 45% complete as of December 31, 2014.
Corporate Segment. Corporate EBITDA was negative $53 million in 2014, as compared with negative EBITDA of $61 million in 2013, an improvement of $8 million. EBITDA in 2013 was negatively affected by $6 million of debt extinguishment costs and $3 million of legal settlement charges. Corporate EBITDA in 2014 was also negatively affected by $3 million of incremental non-cash stock-based compensation expense, offset by a reduction in bad debt expense.
Foreign Operations
We have operations in Canada, Mexico and in other countries in Latin America. See Note 14 - Segments and Related Information in the notes to the audited consolidated financial statements, which is incorporated by reference.
Non-U.S. GAAP Financial Measures
As appropriate, we supplement our reported U.S. GAAP financial information with certain non-U.S. GAAP financial measures, including earnings from continuing operations before interest, income taxes, depreciation and amortization (“EBITDA”). In addition, we have presented “Adjusted EBITDA,” as well as adjusted net income from continuing operations (“Adjusted Net Income From Continuing Operations”) and adjusted diluted earnings per share from continuing operations (“Adjusted Diluted Earnings Per Share From Continuing Operations”). All of these “adjusted” non-U.S. GAAP measures exclude non-cash stock-based compensation expense, goodwill and intangible asset impairment, acquisition integration costs resulting from the WesTower acquisition, Audit Committee independent investigation related costs, project losses on a proportionately consolidated non-controlled Canadian joint venture, charges from a settlement reached during a court mandated mediation, gains or losses on equity investee interest rate swaps, Sintel legal settlement charges and the loss on debt extinguishment from the repurchase and redemption of our 7.625% senior notes and, for adjusted Net Income from Continuing Operations, the effect of an Alberta provincial income tax rate increase. See Note 10 - Stock-Based Compensation and Other Employee Benefit Plans, Note 4 - Goodwill and Other Intangible Assets, Note 3 - Acquisitions, Note 14 - Segments and Related Information, Note 15 - Commitments and Contingencies, Note 5 - Fair Value of Financial Instruments, Note 8 - Debt and Note 13 - Income Taxes in the notes to the audited consolidated financial statements, which are incorporated by reference. The definitions of EBITDA and Adjusted EBITDA above are not the same as in our Credit Facility or in the indenture governing our notes; therefore, EBITDA and Adjusted EBITDA as presented in this discussion should not be used for purposes of determining our compliance with the covenants contained in our debt instruments.
We use EBITDA, Adjusted EBITDA, Adjusted Net Income From Continuing Operations and Adjusted Diluted Earnings Per Share From Continuing Operations to evaluate our performance, both internally and as compared with our peers, because these measures exclude certain items that may not be indicative of our core operating results, as well as items that can vary widely across different industries or among companies within the same industry. Additionally, these measures provide a baseline for analyzing trends in our underlying business. Management also considers EBITDA and Adjusted EBITDA as indicators of our ability to generate cash to service debt, fund capital expenditures and expand our business, but management does not consider the presented non-U.S. GAAP financial measures as measures of our liquidity. While EBITDA and Adjusted EBITDA are measures of our ability to generate cash, these measures exclude the cash impact of changes in our assets and liabilities as well as interest and income taxes. Net cash provided by operating activities in the consolidated statements of cash flows accounts for these changes in our assets and liabilities.
We believe these non-U.S. GAAP financial measures provide meaningful information and help investors understand our financial results and assess our prospects for future performance. Because non-U.S. GAAP financial measures are not standardized, it may not be possible to compare these financial measures with other companies’ non-U.S. GAAP financial measures having the same or similar names. These financial measures should not be considered in isolation from, as substitutes for, or alternative measures of, reported net (loss) income from continuing operations, diluted earnings (loss) per share from continuing operations and net cash provided by operating activities, and should be viewed in conjunction with the most comparable U.S. GAAP financial measures and the provided reconciliations thereto. We believe these non-U.S. GAAP financial measures, when viewed together with our U.S. GAAP results and related reconciliations, provide a more complete understanding of our business. We strongly encourage investors to review our consolidated financial statements and publicly filed reports in their entirety and not rely on any single financial measure.
39
The following table presents a reconciliation of EBITDA and Adjusted EBITDA to net (loss) income from continuing operations, in dollar and percentage of revenue terms, for the years indicated (dollar amounts in millions). The tables below may contain slight summation differences due to rounding.
For the Years Ended December 31, | ||||||||||||||||||||
EBITDA Reconciliation - Continuing Operations: | 2015 | 2014 | 2013 | |||||||||||||||||
Net (loss) income from continuing operations | $ | (79.7 | ) | (1.9 | )% | $ | 122.0 | 2.6 | % | $ | 147.7 | 3.4 | % | |||||||
Interest expense, net | 48.1 | 1.1 | % | 50.8 | 1.1 | % | 46.4 | 1.1 | % | |||||||||||
Provision for income taxes | 12.0 | 0.3 | % | 76.4 | 1.7 | % | 92.5 | 2.1 | % | |||||||||||
Depreciation and amortization | 169.7 | 4.0 | % | 154.5 | 3.3 | % | 140.9 | 3.3 | % | |||||||||||
EBITDA – Continuing operations | $ | 150.0 | 3.6 | % | $ | 403.7 | 8.8 | % | $ | 427.6 | 9.9 | % | ||||||||
Non-cash stock-based compensation expense | 12.4 | 0.3 | % | 15.9 | 0.3 | % | 12.9 | 0.3 | % | |||||||||||
Goodwill and intangible asset impairment | 78.6 | 1.9 | % | — | — | — | — | |||||||||||||
Acquisition integration costs | 17.8 | 0.4 | % | 5.3 | 0.1 | % | — | — | ||||||||||||
Audit Committee investigation related costs | 16.5 | 0.4 | % | — | — | — | — | |||||||||||||
Losses on non-controlled joint venture | 16.3 | 0.4 | % | — | — | — | — | |||||||||||||
Court mandated mediation settlement | 12.2 | 0.3 | % | — | — | — | — | |||||||||||||
Loss on equity investee interest rate swaps | 4.4 | 0.1 | % | — | — | — | — | |||||||||||||
Sintel legal settlement charge | — | — | — | — | 2.8 | 0.1 | % | |||||||||||||
Loss on extinguishment of debt | — | — | — | — | 5.6 | 0.1 | % | |||||||||||||
Adjusted EBITDA – Continuing operations | $ | 308.1 | 7.3 | % | $ | 424.9 | 9.2 | % | $ | 448.9 | 10.4 | % | ||||||||
Adjusted EBITDA and Adjusted EBITDA margin for our continuing operations by reportable segment, and a related reconciliation to EBITDA for our continuing operations, for the years indicated is as follows:
For the Years Ended December 31, | ||||||||||||||||||||
Reportable Segment: | 2015 | 2014 | 2013 | |||||||||||||||||
Communications | $ | 213.1 | 10.8 | % | $ | 209.6 | 10.3 | % | $ | 248.0 | 12.6 | % | ||||||||
Oil and Gas | 157.0 | 10.5 | % | 195.1 | 11.3 | % | 215.9 | 13.3 | % | |||||||||||
Electrical Transmission | (59.2 | ) | (17.3 | )% | 45.0 | 9.5 | % | 41.2 | 9.6 | % | ||||||||||
Power Generation and Industrial | 8.8 | 2.3 | % | 14.2 | 4.0 | % | (16.3 | ) | (5.5 | )% | ||||||||||
Other | 1.9 | 8.1 | % | (1.2 | ) | (8.4 | )% | 0.5 | 3.9 | % | ||||||||||
Eliminations | — | — | — | — | — | — | ||||||||||||||
Corporate | (13.5 | ) | NA | (37.9 | ) | NA | (40.4 | ) | NA | |||||||||||
Adjusted EBITDA - Continuing operations | $ | 308.1 | 7.3 | % | $ | 424.9 | 9.2 | % | $ | 448.9 | 10.4 | % | ||||||||
Non-cash stock-based compensation expense | 12.4 | 0.3 | % | 15.9 | 0.3 | % | 12.9 | 0.3 | % | |||||||||||
Goodwill and intangible asset impairment | 78.6 | 1.9 | % | — | — | — | — | |||||||||||||
Acquisition integration costs | 17.8 | 0.4 | % | 5.3 | 0.1 | % | — | — | ||||||||||||
Audit Committee investigation related costs | 16.5 | 0.4 | % | — | — | — | — | |||||||||||||
Losses on non-controlled joint venture | 16.3 | 0.4 | % | — | — | — | — | |||||||||||||
Court mandated mediation settlement | 12.2 | 0.3 | % | — | — | — | — | |||||||||||||
Loss on equity investee interest rate swaps | 4.4 | 0.1 | % | — | — | — | — | |||||||||||||
Sintel legal settlement charge | — | — | — | — | 2.8 | 0.1 | % | |||||||||||||
Loss on extinguishment of debt | — | — | — | — | 5.6 | 0.1 | % | |||||||||||||
EBITDA – Continuing operations | $ | 150.0 | 3.6 | % | $ | 403.7 | 8.8 | % | $ | 427.6 | 9.9 | % | ||||||||
The following table presents a reconciliation of EBITDA and Adjusted EBITDA to net cash provided by operating activities for total MasTec (in millions):
40
For the Years Ended December 31, | |||||||||||
Total EBITDA Reconciliation: | 2015 | 2014 | 2013 | ||||||||
EBITDA - Continuing operations | $ | 150.0 | $ | 403.7 | $ | 427.6 | |||||
EBITDA - Discontinued operations | — | (10.8 | ) | (8.8 | ) | ||||||
EBITDA - Total MasTec | $ | 150.0 | $ | 392.9 | $ | 418.8 | |||||
Reconciliation to Adjusted EBITDA and to Net Cash Provided by Operating Activities, Total MasTec: | |||||||||||
Non-cash stock-based compensation expense | 12.4 | 15.9 | 12.9 | ||||||||
Goodwill and intangible asset impairment | 78.6 | — | — | ||||||||
Acquisition integration costs | 17.8 | 5.3 | — | ||||||||
Audit Committee investigation related costs | 16.5 | — | — | ||||||||
Losses on non-controlled joint venture | 16.3 | — | — | ||||||||
Court mandated mediation settlement | 12.2 | — | — | ||||||||
Loss on equity investee interest rate swaps | 4.4 | — | — | ||||||||
Loss on extinguishment of debt | — | — | 5.6 | ||||||||
Sintel legal settlement charge | — | — | 2.8 | ||||||||
Adjusted EBITDA - Continuing operations | $ | 308.1 | $ | 424.9 | $ | 448.9 | |||||
Adjusted EBITDA - Discontinued operations | — | (10.8 | ) | (8.8 | ) | ||||||
Adjusted EBITDA - Total MasTec | $ | 308.1 | $ | 414.1 | $ | 440.1 | |||||
Interest expense, net | (48.1 | ) | (50.8 | ) | (46.5 | ) | |||||
Provision for income taxes | (12.0 | ) | (72.2 | ) | (90.1 | ) | |||||
Acquisition integration costs | (17.8 | ) | (5.3 | ) | — | ||||||
Audit Committee investigation related costs | (16.5 | ) | — | — | |||||||
Losses on non-controlled joint venture | (16.3 | ) | — | — | |||||||
Court mandated mediation settlement | (12.2 | ) | — | — | |||||||
Loss on equity investee interest rate swaps | (4.4 | ) | — | — | |||||||
Payments for call premiums on extinguishment of debt | — | — | (4.1 | ) | |||||||
Sintel legal settlement charge | — | — | (2.8 | ) | |||||||
Adjustments to reconcile net (loss) income to net cash provided by operating activities, excluding non-cash EBITDA adjustments (a) | (20.1 | ) | 17.0 | 17.9 | |||||||
Change in assets and liabilities, net of acquisitions | 206.7 | 20.2 | (114.1 | ) | |||||||
Net cash provided by operating activities, Total MasTec | $ | 367.4 | $ | 323.0 | $ | 200.4 | |||||
(a) | Non-cash EBITDA adjustments include (i) depreciation and amortization expense in all years; (ii) in 2015, $78.6 million of goodwill and intangible asset impairment; (iii) non-cash stock-based compensation expense in all years; and (iv) in 2013, a $1.5 million write-off of deferred financing costs on redeemed debt. |
Adjusted Net Income From Continuing Operations and Adjusted Diluted Earnings Per Share From Continuing Operations
The table below reconciles Adjusted Net Income From Continuing Operations and Adjusted Diluted Earnings Per Share From Continuing Operations with reported net (loss) income from continuing operations and reported diluted (loss) earnings per share from continuing operations, the most directly comparable U.S. GAAP financial measures. Adjustments have been tax-effected using the effective tax rate from continuing operations for the respective periods, excluding certain discrete items. For the year ended December 31, 2015, because the reported loss from continuing operations, on an adjusted basis is income from continuing operations, we included an additional 0.6 million weighted average common stock equivalents in our diluted share count to calculate adjusted diluted earnings per share for the respective period.
41
For the Years Ended December 31, | |||||||||||||||||||||||
2015 | 2014 | 2013 | |||||||||||||||||||||
Continuing Operations: | Net (Loss) Income (in millions) | Diluted (Loss) Earnings Per Share | Net Income (in millions) | Diluted Earnings Per Share | Net Income (in millions) | Diluted Earnings Per Share | |||||||||||||||||
Reported U.S. GAAP measure | $ | (79.7 | ) | $ | (0.98 | ) | $ | 122.0 | $ | 1.42 | $ | 147.7 | $ | 1.74 | |||||||||
Adjustments:(a) | |||||||||||||||||||||||
Non-cash stock-based compensation expense | 8.1 | 0.10 | 9.8 | 0.11 | 8.0 | 0.09 | |||||||||||||||||
Goodwill and intangible asset impairment | 76.4 | 0.94 | — | — | — | — | |||||||||||||||||
Acquisition integration costs | 9.9 | 0.12 | 3.2 | 0.04 | — | — | |||||||||||||||||
Audit Committee investigation related costs (b) | 11.3 | 0.14 | — | — | — | — | |||||||||||||||||
Losses on non-controlled joint venture | 13.0 | 0.16 | — | — | — | — | |||||||||||||||||
Court mandated mediation settlement | 6.8 | 0.08 | — | — | — | — | |||||||||||||||||
Loss on equity investee interest rate swaps | 2.9 | 0.04 | — | — | — | — | |||||||||||||||||
Impact of Alberta tax law change | 2.8 | 0.03 | — | — | — | — | |||||||||||||||||
Loss on extinguishment of debt | — | — | — | — | 3.5 | 0.04 | |||||||||||||||||
Sintel legal settlement charge | — | — | — | — | 1.7 | 0.02 | |||||||||||||||||
Adjusted non-U.S. GAAP measure | $ | 51.4 | $ | 0.64 | $ | 135.0 | $ | 1.57 | $ | 160.8 | $ | 1.90 | |||||||||||
(a) | Reconciling items represent the after-tax expense and corresponding diluted per share impact for the respective adjustments presented above. |
(b) | Audit Committee investigation related costs for the year ended December 31, 2015 include the after-tax effect of approximately $1 million of consent solicitation agent fees recorded within interest expense, net, in 2015, related to the delay in filing of the 2014 Form 10-K and the First Quarter 2015 Form 10-Q. |
Financial Condition, Liquidity and Capital Resources
Our primary sources of liquidity are cash flows from continuing operations, availability under our Credit Facility and our cash balances. Our primary liquidity needs are for working capital, income taxes, capital expenditures, insurance collateral in the form of cash and letters of credit, earn-out obligations, equity, joint venture and other investments, debt service and share repurchase programs. We also evaluate opportunities for strategic acquisitions and investments from time to time, and we may consider opportunities to repurchase, refinance or retire outstanding debt or repurchase additional shares of our outstanding common stock in the future, any of which may require our use of cash.
Capital Expenditures. We estimate that we will spend approximately $80 million to $90 million in 2016 on capital expenditures, or approximately $70 million to $80 million, net of asset disposals. We also expect to incur approximately $70 million to $80 million of equipment purchases under capital lease or other financing arrangements. For the year ended December 31, 2015, we spent approximately $84 million on capital expenditures, or $70 million net of asset disposals, and incurred approximately $27 million of equipment purchases under capital lease and other financing arrangements. Actual capital expenditures may increase or decrease from estimates depending upon business activity levels. We evaluate equipment lease versus buy decisions on an ongoing basis based on our assessments of short and long-term equipment requirements. As a result, our capital expenditures may increase or decrease in the future.
Acquisition-Related Contingent Consideration. In most of our acquisitions, we have agreed to make future earn-out payments to the sellers, which are contingent upon the future earnings performance of the acquired businesses. Certain earn-out payments may be paid in either cash or, under specific circumstances, MasTec common stock, or a combination thereof, at our option. The estimated total value of earn-out obligations recorded as liabilities as of December 31, 2015 was approximately $59 million. Of this amount, $17 million represents the liability for earn-out obligations that have been earned. The remainder is management’s estimate of potential earn-out obligations that are contingent upon future performance. Potential future earn-out obligations for acquisitions after January 1, 2009 are measured at their estimated fair value as of the date of acquisition, with subsequent changes in fair value recorded in earnings as a component of other income or expense, in accordance with U.S. GAAP. Earn-outs for acquisitions completed prior to January 1, 2009 are recorded as additional goodwill as earned. During the years ended December 31, 2015, 2014 and 2013, we made payments of $48 million, $60 million and $19 million, respectively, related to earn-out obligations, and for the year ended December 31, 2015, we recorded approximately $39 million of net reductions to estimated earn-out liabilities for acquired businesses, $19 million of which was offset with a corresponding receivable amount.
Income Taxes. Cash tax payments, net of tax refunds, were $3 million, $77 million and $80 million for the years ended December 31, 2015, 2014 and 2013, respectively. Our cash tax payments vary from period to period with changes in taxable income and earnings. The reduction in cash tax payments in 2015 resulted primarily from lower taxable income. Pre-tax income in 2014 was $198 million as compared with pre-tax losses of $68 million in 2015.
Working Capital. We need working capital to support seasonal variations in our business, primarily due to the impact of weather conditions on external construction and maintenance work and the spending patterns of our customers, both of which influence the timing of associated spending to support related customer demand. Our business is typically slower in the first quarter of each calendar year. Working capital needs are generally higher during the summer or fall months due to increased demand for our services when favorable weather conditions exist in many of the regions in which we operate. Conversely, working capital needs are typically converted to cash during the winter months. These seasonal trends, however, can
42
be offset by changes in the timing of projects, which can be affected by project delays or accelerations and/or other factors that may affect customer spending.
Working capital requirements also tend to increase when we commence multiple projects, or particularly large projects, because labor, including subcontractor costs, and certain other costs, including inventory, become payable before the receivables resulting from work performed are billed and collected. Timing of billing milestones and project close-outs can contribute to changes in unbilled revenue. As of December 31, 2015, we expect that substantially all of our costs in excess of billings and earnings will be billed to customers in the normal course of business within the next twelve months. Accounts receivable balances, which consist of contract billings as well as costs and earnings in excess of billings and retainage, decreased to $0.9 billion as of December 31, 2015 from $1.3 billion as of December 31, 2014. This decrease was driven by lower levels of revenue, as discussed in “Comparison of Fiscal Year Results” above, as well as a reduction in our days sales outstanding (“DSO”), net of billings in excess of costs and earnings, as discussed below. Inventory balances decreased from $113 million as of December 31, 2014 to $91 million as of December 31, 2015, primarily from utilization of wireless project inventories, including inventory from acquired businesses.
Our billing terms are generally net 30 days, and some of our contracts allow our customers to retain a portion of the contract amount (generally, from 5% to 10%) until the job is completed. For certain customers, we maintain inventory to meet the materials requirements of the contracts. Occasionally, certain of our customers pay us in advance for a portion of the materials we purchase for their projects, or allow us to pre-bill them for materials purchases up to specified amounts. Vendor terms are generally 30 days. Our agreements with subcontractors often contain a “pay-if-paid” provision, whereby our payments to subcontractors are made only after we are paid by our customers.
Settlement of Convertible Notes. In 2014, our senior convertible notes, in an original principal amount of $215 million, matured and were converted by the holders. We paid $202 million in cash using proceeds from our Credit Facility and issued an aggregate 6.6 million shares of our common stock in respect thereof. The shares included 5.8 million premium shares, which represented a conversion value of $156 million, related to the value of certain of the convertible notes in excess of their principal amount. See discussion in Note 8 - Debt in the notes to the audited consolidated financial statements, which is incorporated by reference, for additional information.
Summary of Financial Condition, Liquidity and Capital Resources
We anticipate that funds generated from operations, borrowings under our Credit Facility and our cash balances will be sufficient to meet our working capital requirements, required income tax payments, debt service obligations, anticipated capital expenditures, equity, joint venture and other investments, insurance collateral requirements, earn-out obligations and letters of credit for at least the next twelve months.
Sources and Uses of Cash
As of December 31, 2015, we had $380 million in working capital, defined as current assets less current liabilities, as compared with $551 million as of December 31, 2014, a decrease of $171 million, due, in large part, to lower levels of activity in 2015 as compared with 2014 in addition to a reduction in our DSO. Total cash and cash equivalents of $5 million as of December 31, 2015 decreased by $19 million from total cash and cash equivalents of $24 million as of December 31, 2014.
Sources and uses of cash are summarized below (in millions):
For the Years Ended December 31, | |||||||||||
2015 | 2014 | 2013 | |||||||||
Net cash provided by operating activities | $ | 367.4 | $ | 323.0 | $ | 200.4 | |||||
Net cash used in investing activities | $ | (128.7 | ) | $ | (439.3 | ) | $ | (263.2 | ) | ||
Net cash (used in) provided by financing activities | $ | (258.9 | ) | $ | 118.7 | $ | 59.0 | ||||
Operating Activities. Cash flow from operations is primarily influenced by demand for our services and operating margins, but can also be affected by working capital needs associated with the various types of services we provide. Working capital is affected by changes in accounts receivable, costs and earnings in excess of billings and billings in excess of costs and earnings, all of which tend to be related. These working capital items are also generally affected by changes in revenue resulting from both the timing and the volume of work performed, by variability in the timing of customer billings and collections of receivables, as well as settlement of payables and other obligations. Net cash provided by operating activities for the year ended December 31, 2015 was $367 million, as compared with $323 million of net cash provided by operating activities in 2014. Net changes in assets and liabilities had a positive impact on cash provided by operating activities of $187 million, related largely to changes in accounts receivable and inventory levels, net of acquired balances, offset, in part, by changes in accounts payable and accrued expenses. The positive effect of net changes in assets and liabilities was offset by the net loss of $80 million for the year ended December 31, 2015 as compared with net income of $116 million for 2014, driven, in part, by $79 million of goodwill and intangible asset impairment in 2015.
Our DSO, net of billings in excess of costs and earnings, was 68 as of December 31, 2015, as compared with 75 as of September 30, 2015 and 86 as of December 31, 2014. DSO, net of billings in excess of costs and earnings is calculated as accounts receivable, net, less billings in excess of costs and earnings, divided by average daily revenue for the most recently completed quarter as of the balance sheet date. The decrease in DSO is primarily attributable to improved timing of collections, changes in project and customer mix and the settlement of certain disputed matters. Other than matters subject to litigation, we do not anticipate material collection issues related to our outstanding accounts receivable balances, nor do we have material amounts due from customers experiencing financial difficulties. We expect to collect substantially all of our outstanding accounts receivable, net, within the next twelve months.
43
Investing Activities. Net cash used in investing activities decreased by $311 million to $129 million in 2015 from $439 million in 2014. In 2014, we acquired several businesses. Acquisition-related payments decreased by $345 million as compared with 2014, offset, in part, by an increase in payments for other investments, net, primarily related to activity associated with our equity method investees of $57 million. For additional information, see discussion in Note 3 - Acquisitions and Note 5 - Fair Value of Financial Instruments, which notes are incorporated by reference. In 2015, we acquired an equity investment in two joint ventures that were formed to construct and operate two natural gas pipelines that will interconnect at the U.S./Mexico border. Capital expenditure activity in 2015 decreased to $84 million, or $70 million, net of asset disposals, from capital expenditures of $109 million, or $93 million net of asset disposals, in 2014, a decrease of approximately $22 million, net of asset disposals. Total capital additions, including capital lease and other financing arrangements, decreased from $185 million in 2014 to $111 million for the year ended December 31, 2015 due primarily to lower levels of activity as compared with the prior year.
Financing Activities. Net cash used in financing activities for the year ended December 31, 2015 was $259 million, as compared with $119 million of cash provided by financing activities in the prior year, a decrease in net cash provided by financing activities of $378 million. Credit facility-related activity, net, for the year ended December 31, 2015, totaled $40 million of repayments, net of borrowings, compared to $446 million of borrowings, net of repayments for the year ended December 31, 2014, for a decrease in cash provided by financing activities from credit facility-related activities, net, of $486 million. Additionally, for the year ended December 31, 2015, we paid $100 million to repurchase shares of our common stock under our 2014 share repurchase program, whereas for the same period in 2014, we paid $202 million in settlement of our senior convertible notes, which resulted in a net increase in cash provided by financing activities of $102 million. Also contributing to the year-over-year change is a reduction in payments of acquisition-related contingent consideration of $13 million.
Senior Secured Credit Facility
We have a senior secured credit facility, which, as amended to date, we refer to as our Credit Facility. The Credit Facility has aggregate borrowing commitments of $1.25 billion, composed of $1.0 billion of revolving commitments and a term loan in the aggregate principal amount of $250 million (the “Term Loan”). The Credit Facility provides the ability to borrow in either Mexican pesos or Canadian dollars, up to an aggregate equivalent amount of $200 million. Revolving commitments under the Credit Facility mature on October 29, 2018, and the Term Loan matures on November 21, 2019. The Term Loan is subject to amortization in quarterly principal installments of $3.1 million, subject to reduction as a result of the application of certain prepayments in accordance with the terms of the Credit Facility, commencing as of the quarter ending March 31, 2016. The maximum amount available for letters of credit under the Credit Facility is $450 million, of which up to $100 million can be denominated in either Mexican pesos or Canadian dollars. The Credit Facility also provides for swing line loans of up to $75 million. Under the Credit Facility, we have the option to increase revolving commitments and/or establish additional term loan tranches in an aggregate amount of $250 million, subject to certain conditions. Borrowings under the Credit Facility are used for working capital requirements, capital expenditures and other corporate purposes, including equity, joint venture or other investments, the repurchase or prepayment of indebtedness, and share repurchases.
Interest on outstanding revolving loans and the Term Loan under the Credit Facility accrues at variable rates based, at our option, on a Eurocurrency rate, as defined in the Credit Facility, plus a margin, or a base rate, as defined in the Credit Facility, plus a margin. As of December 31, 2015, we had $208.5 million of outstanding revolving loans under our Credit Facility, which accrued interest at a weighted average interest rate of 2.95%, and had $292.8 million of issued letters of credit, which mature at various dates. As of December 31, 2015, letter of credit fees accrued at 1.000% per annum for performance standby letters of credit and at 2.00% per annum for financial standby letters of credit. The Term Loan accrued interest at a rate of 2.42% as of December 31, 2015. Borrowing capacity of $498.7 million as of December 31, 2015 was available for revolving loans or up to $157.2 million for new letters of credit. The unused facility fee was 0.4% as of December 31, 2015.
The Credit Facility is guaranteed by certain of our subsidiaries (the “Guarantor Subsidiaries”) and the obligations under the Credit Facility are secured by substantially all of our and the Guarantor Subsidiaries’ respective assets, subject to certain exceptions. The Credit Facility provides for a Maximum Consolidated Leverage Ratio, as defined in the Credit Facility, of up to (i) 4.25 until September 29, 2016, (ii) 4.00 during the period commencing on September 30, 2016 and ending on December 30, 2016, and (iii) 3.50 thereafter (subject to the Acquisition Adjustment described below). The Credit Facility also requires that we maintain a Minimum Consolidated Interest Coverage Ratio, as defined in the Credit Facility, of 3.00. The Credit Facility provides that, for purposes of calculating the Consolidated Leverage Ratio, certain cash charges may be added back to the calculation of Consolidated EBITDA, as defined in the Credit Facility, and funded indebtedness excludes the undrawn standby performance letters of credit. Additionally, notwithstanding the terms discussed above, subject to certain conditions, if a permitted acquisition or series of permitted acquisitions having consideration exceeding $50 million occurs during a fiscal quarter, the Consolidated Leverage Ratio may be temporarily increased to up to 3.75 during such fiscal quarter and the subsequent two fiscal quarters (the “Acquisition Adjustment”). Such right may be exercised no more than two times during the term of the Credit Facility. Subject to customary exceptions, the Credit Facility limits the borrowers’ and the Guarantor Subsidiaries’ ability to engage in certain activities, including acquisitions, mergers and consolidations, debt incurrence, investments, capital expenditures, asset sales, debt prepayments, lien incurrence and the making of distributions or repurchases of capital stock. However, distributions payable solely in capital stock are permitted. The Credit Facility provides for customary events of default and carries cross-default provisions with our other significant debt instruments, including our indemnity agreement with our surety provider, as well as customary remedies, including the acceleration of repayment of outstanding amounts and other remedies with respect to the collateral securing the Credit Facility obligations.
We are dependent upon borrowings and letters of credit under the Credit Facility to fund our operations. Should we be unable to comply with the terms and conditions of the Credit Facility, we would be required to obtain modifications to the Credit Facility or obtain an alternative source of financing to continue to operate, neither of which may be available to us on commercially reasonable terms, or at all.
Other Credit Facilities. We have other credit facilities that support the working capital requirements of our foreign operations, which have varying dates of maturity and are generally renewed on an annual basis. Borrowings under these credit facilities are primarily denominated in Canadian dollars and maximum borrowing capacity totaled approximately $28.9 million as of December 31, 2015. Outstanding borrowings, which accrued interest at a weighted average rate of 3.6%, totaled approximately $16.4 million as of December 31, 2015.
44
4.875% Senior Notes and 7.625% Senior Notes
In March 2013, we issued $400 million of 4.875% senior notes due March 15, 2023 (our “4.875% Senior Notes”) in a registered public offering, and we repurchased and redeemed our 7.625% senior notes due 2017 (our “7.625% Senior Notes”). The 4.875% Senior Notes are subject to certain provisions and covenants, as more fully described in Note 8 - Debt in the notes to the audited consolidated financial statements included in this Form 10-K, which note is incorporated by reference.
Senior Convertible Notes
In 2014, our senior convertible notes, in an original principal amount of $215 million, matured and were converted by the holders. We paid $202 million in cash using proceeds from our Credit Facility and issued an aggregate 6.6 million shares of our common stock in respect thereof.
Acquisition Debt
In connection with certain acquisitions, we have entered into or assumed certain debt and/or capital lease obligations. As of December 31, 2015, $9.8 million of acquisition-related debt remained outstanding.
Debt Guarantees and Covenants
The 4.875% Senior Notes are senior unsecured unsubordinated obligations and rank equal in right of payment with existing and future unsubordinated debt, and rank senior in right of payment to existing and future subordinated debt and are fully and unconditionally guaranteed on an unsecured, unsubordinated, joint and several basis by certain of our existing and future 100%-owned direct and indirect domestic subsidiaries that are each guarantors of the Credit Facility or other outstanding indebtedness. See Note 18 - Supplemental Guarantor Condensed Consolidating Financial Information in the notes to the audited consolidated financial statements, which is incorporated by reference. Also, see Note 3 - Acquisitions and Note 5 - Fair Value of Financial Instruments in the notes to the audited consolidated financial statements, which notes are incorporated by reference, for a discussion pertaining to debt guarantees associated with our equity method and other investment arrangements.
We were in compliance with the provisions and covenants contained in our outstanding debt instruments as of December 31, 2015.
Additional Information
For detailed discussion and additional information pertaining to our debt instruments, see Note 8 - Debt in the notes to the audited consolidated financial statements, which is incorporated by reference.
Contractual Payment Obligations
The following table sets forth our contractual payment obligations as of December 31, 2015 during the periods indicated below (in millions):
Contractual Obligations | Total | Less than 1 Year | 1 - 3 Years | 3 - 5 Years | More than 5 Years and Thereafter | |||||||||||||||
Senior secured credit facility: | ||||||||||||||||||||
Revolving loans | $ | 208.5 | $ | — | $ | 208.5 | $ | — | $ | — | ||||||||||
Term loan | 250.0 | 12.5 | 25.0 | 212.5 | — | |||||||||||||||
Other credit facilities | 16.4 | — | 16.4 | — | — | |||||||||||||||
4.875% Senior Notes | 400.0 | — | — | — | 400.0 | |||||||||||||||
Notes payable for equipment | 17.4 | 10.4 | 7.0 | — | — | |||||||||||||||
Earn-out obligations (a) | 17.7 | 17.7 | — | — | — | |||||||||||||||
Capital leases | 130.9 | 54.8 | 68.9 | 7.1 | 0.1 | |||||||||||||||
Operating leases | 201.3 | 75.0 | 88.1 | 28.2 | 10.0 | |||||||||||||||
Obligations under multiemployer pension plan (b) | 3.0 | 1.2 | 1.8 | — | — | |||||||||||||||
Interest (c) | 191.3 | 35.3 | 65.9 | 44.6 | 45.5 | |||||||||||||||
Total | $ | 1,436.5 | $ | 206.9 | $ | 481.6 | $ | 292.4 | $ | 455.6 | ||||||||||
(a) | Under certain acquisition agreements, we have agreed to pay the sellers earn-outs based on the performance of the businesses acquired. Certain of these earn-out payments may be made either in cash or in MasTec common stock, or a combination thereof, at our option. Due to the contingent nature of these earn-out payments, we have only included earn-out obligations that we expect will be paid in cash and have been earned as of December 31, 2015. |
(b) | Represents estimated withdrawal liability as of December 31, 2015 and excludes normal contributions required under our collective bargaining agreements. See Note 15 - Commitments and Contingencies in the notes to the audited consolidated financial statements, which is incorporated by reference. |
(c) | Represents expected future interest payments on debt and capital lease obligations. With the exception of our credit facilities, all of our debt instruments are fixed rate interest obligations. |
45
Off-balance sheet arrangements
As is common in our industry, we have entered into certain off-balance sheet arrangements in the ordinary course of business. Our significant off-balance sheet transactions include liabilities associated with non-cancelable operating leases, letter of credit obligations, surety and performance and payment bonds entered into in the normal course of business, self-insurance liabilities, liabilities associated with multiemployer pension plans, liabilities associated with certain indemnification and guarantee arrangements and obligations relating to our non-consolidated affiliates, joint venture arrangements and variable interest entities. Refer to Note 15 - Commitments and Contingencies in the notes to the audited consolidated financial statements, which is incorporated by reference, for current period details pertaining to our off-balance sheet arrangements. See Note 3 - Acquisitions and Note 5 - Fair Value of Financial Instruments in the notes to the audited consolidated financial statements, for discussion pertaining to certain of our cost and equity method investments and other investment arrangements, which notes are incorporated by reference.
Impact of Inflation
The primary inflationary factors affecting our operations are labor and fuel costs, and to a lesser extent, material costs. The prices of oil and gas are subject to unexpected fluctuations due to events outside of our control, including geopolitical events and fluctuations in global supply and demand. An example is the recent volatility experienced by the oil markets due to declining oil prices beginning in the latter part of 2014. We closely monitor inflationary factors and any impact they may have on our operating results or financial condition.
Recently Issued Accounting Pronouncements
See Note 1 - Business, Basis of Presentation and Significant Accounting Policies in the notes to the audited consolidated financial statements, which is incorporated by reference.
ITEM 7A. | QUANTITATIVE AND QUALITATIVE DISCLOSURES ABOUT MARKET RISK |
Interest Rate Risk
As of December 31, 2015, our variable interest rate debt was primarily related to our Credit Facility. Interest on outstanding revolving loans under our Credit Facility accrues at variable rates based, at our option, on a Eurocurrency rate, as defined in the Credit Facility, plus a margin, or a base rate, as defined in the Credit Facility, plus a margin. Interest on our Term Loan under the Credit Facility accrues at a variable rate based, at our option, on either a Eurocurrency rate or a base rate, each as defined in the Credit Facility, in each case, plus a margin. As of December 31, 2015, we had $208.5 million aggregate principal amount of outstanding revolving loans under our Credit Facility with a weighted average interest rate of 2.95% and a Term Loan with a balance of $250 million with an interest rate of 2.42%. Interest on letters of credit issued under our Credit Facility as of December 31, 2015 accrued at 1% per annum for performance standby letters of credit and at 2% per annum for financial standby letters of credit. A 100 basis point increase in the applicable interest rates under our Credit Facility would not have had a material impact on our results of operations for the year ended December 31, 2015. We also are exposed to interest rate risk from our equity method investments in two joint ventures formed to design and construct pipelines that will interconnect at the U.S./Mexico border, each of which have interest rate swaps. See Note 5 - Fair Value of Financial Instruments in the notes to the audited consolidated financial statements, which is incorporated by reference.
As of December 31, 2015, our fixed interest rate debt primarily included $400 million aggregate principal amount of 4.875% Senior Notes and $17 million of notes payable for equipment, which had a weighted average interest rate of approximately 2.7%. None of this debt subjects us to interest rate risk, but we may be subject to changes in interest rates if and when we refinance this debt at maturity or otherwise.
Foreign Currency Risk
We have foreign operations in Canada, Mexico and in other countries in Latin America. Revenue generated from foreign operations represented 14% of our total revenue for the year ended December 31, 2015. Revenue and expense related to our foreign operations are, for the most part, denominated in the functional currency of the foreign operation, which minimizes the impact that fluctuations in exchange rates would have on net income or loss. We are subject to fluctuations in foreign currency exchange rates when transactions are denominated in currencies other than the functional currencies. Such transactions were not material to our operations in 2015. Translation gains or losses, which are recorded in other comprehensive income or loss, result from translation of the assets and liabilities of our foreign subsidiaries into U.S. dollars. For the year ended December 31, 2015 foreign currency translation losses totaled approximately $38 million and related primarily to our Canadian operations and the decline of the Canadian dollar against the U.S dollar during 2015.
Our exposure to fluctuations in foreign currency exchange rates could increase in the future if we continue to expand our operations outside of the United States. We seek to manage foreign currency exposure by minimizing our consolidated net asset and liability positions in currencies other than the functional currency, neither of which were material as of December 31, 2015. We may enter into foreign currency derivative contracts in the future to manage such exposures.
46
ITEM 8. | FINANCIAL STATEMENTS AND SUPPLEMENTARY DATA |
Index to Consolidated Financial Statements
Page | |
47
REPORT OF INDEPENDENT REGISTERED PUBLIC ACCOUNTING FIRM
The Board of Directors and Shareholders of MasTec, Inc.
Coral Gables, Florida
We have audited the accompanying consolidated balance sheets of MasTec, Inc. and subsidiaries as of December 31, 2015 and 2014 and the related consolidated statements of operations, comprehensive income (loss), equity, and cash flows for each of the three years in the period ended December 31, 2015. In connection with our audits of the consolidated financial statements, we have also audited the schedule listed in Item 15(a)2. These financial statements and the schedule are the responsibility of the Company’s management. Our responsibility is to express an opinion on these financial statements and schedule based on our audits.
We conducted our audits in accordance with the standards of the Public Company Accounting Oversight Board (United States). Those standards require that we plan and perform the audit to obtain reasonable assurance about whether the financial statements are free of material misstatement. An audit includes examining, on a test basis, evidence supporting the amounts and disclosures in the financial statements, assessing the accounting principles used and significant estimates made by management, as well as evaluating the overall presentation of the financial statements and schedule. We believe that our audits provide a reasonable basis for our opinion.
In our opinion, the consolidated financial statements referred to above present fairly, in all material respects, the financial position of MasTec, Inc. and subsidiaries at December 31, 2015 and 2014, and the results of their operations and their cash flows for each of the three years in the period ended December 31, 2015 in conformity with accounting principles generally accepted in the United States of America.
Also, in our opinion, the financial statements schedule, when considered in relation to the basic consolidated financial statements taken as a whole, presents fairly, in all material respects, the information set forth therein.
We also have audited, in accordance with the Standards of the Public Company Accounting Oversight Board (United States), MasTec, Inc.’s internal control over financial reporting as of December 31, 2015, based on criteria established in Internal Control - Integrated Framework (2013) issued by the Committee of Sponsoring Organizations of the Treadway Commission (the COSO criteria) and our report dated February 25, 2016 expressed an unqualified opinion thereon.
/s/ BDO USA, LLP | |
Certified Public Accountants | |
Miami, Florida | |
February 25, 2016 | |
48
MASTEC, INC.
CONSOLIDATED STATEMENTS OF OPERATIONS
(in thousands, except per share amounts)
For the Years Ended December 31, | |||||||||||
2015 | 2014 | 2013 | |||||||||
Revenue | $ | 4,208,330 | $ | 4,611,803 | $ | 4,324,787 | |||||
Costs of revenue, excluding depreciation and amortization | 3,721,303 | 3,977,963 | 3,682,367 | ||||||||
Depreciation and amortization | 169,662 | 154,452 | 140,926 | ||||||||
Goodwill and intangible asset impairment | 78,625 | — | — | ||||||||
General and administrative expenses | 265,910 | 238,305 | 215,402 | ||||||||
Interest expense, net | 48,055 | 50,769 | 46,442 | ||||||||
Loss on extinguishment of debt | — | — | 5,624 | ||||||||
Other income, net | (7,479 | ) | (8,116 | ) | (6,188 | ) | |||||
(Loss) income from continuing operations before income taxes | $ | (67,746 | ) | $ | 198,430 | $ | 240,214 | ||||
Provision for income taxes | (11,957 | ) | (76,429 | ) | (92,542 | ) | |||||
Net (loss) income from continuing operations | $ | (79,703 | ) | $ | 122,001 | $ | 147,672 | ||||
Discontinued operations: | |||||||||||
Net loss from discontinued operations | $ | — | $ | (6,452 | ) | $ | (6,456 | ) | |||
Net (loss) income | $ | (79,703 | ) | $ | 115,549 | $ | 141,216 | ||||
Net (loss) income attributable to non-controlling interests | (593 | ) | (374 | ) | 266 | ||||||
Net (loss) income attributable to MasTec, Inc. | $ | (79,110 | ) | $ | 115,923 | $ | 140,950 | ||||
Earnings per share (See Note 2): | |||||||||||
Basic (loss) earnings per share: | |||||||||||
Continuing operations | $ | (0.98 | ) | $ | 1.53 | $ | 1.92 | ||||
Discontinued operations | — | (0.08 | ) | (0.09 | ) | ||||||
Total basic (loss) earnings per share | $ | (0.98 | ) | $ | 1.45 | $ | 1.83 | ||||
Basic weighted average common shares outstanding | 80,489 | 79,953 | 76,923 | ||||||||
Diluted (loss) earnings per share: | |||||||||||
Continuing operations | $ | (0.98 | ) | $ | 1.42 | $ | 1.74 | ||||
Discontinued operations | — | (0.07 | ) | (0.08 | ) | ||||||
Total diluted (loss) earnings per share | $ | (0.98 | ) | $ | 1.35 | $ | 1.66 | ||||
Diluted weighted average common shares outstanding | 80,489 | 86,196 | 84,901 | ||||||||
The accompanying notes are an integral part of these consolidated financial statements.
49
MASTEC, INC.
CONSOLIDATED STATEMENTS OF COMPREHENSIVE INCOME (LOSS)
(in thousands)
For the Years Ended December 31, | |||||||||||
2015 | 2014 | 2013 | |||||||||
Net (loss) income | $ | (79,703 | ) | $ | 115,549 | $ | 141,216 | ||||
Other comprehensive loss, net of tax (See Note 12) | (38,347 | ) | (20,718 | ) | (7,785 | ) | |||||
Comprehensive (loss) income | $ | (118,050 | ) | $ | 94,831 | $ | 133,431 | ||||
Comprehensive (loss) income attributable to non-controlling interests | (593 | ) | (374 | ) | 266 | ||||||
Comprehensive (loss) income attributable to MasTec, Inc. | $ | (117,457 | ) | $ | 95,205 | $ | 133,165 | ||||
The accompanying notes are an integral part of these consolidated financial statements.
50
MASTEC, INC.
CONSOLIDATED BALANCE SHEETS
(in thousands, except shares and per share amounts)
As of December 31, | |||||||
2015 | 2014 | ||||||
Assets | |||||||
Current assets: | |||||||
Cash and cash equivalents | $ | 4,984 | $ | 24,059 | |||
Accounts receivable, net of allowance | 911,106 | 1,303,552 | |||||
Inventories, net | 90,599 | 112,804 | |||||
Prepaid expenses | 58,023 | 46,873 | |||||
Other current assets | 68,190 | 44,463 | |||||
Total current assets | $ | 1,132,902 | $ | 1,531,751 | |||
Property and equipment, net | 558,667 | 623,118 | |||||
Goodwill | 988,511 | 1,082,466 | |||||
Other intangible assets, net | 199,379 | 250,373 | |||||
Other long-term assets | 60,738 | 76,272 | |||||
Total assets | $ | 2,940,197 | $ | 3,563,980 | |||
Liabilities and equity | |||||||
Current liabilities: | |||||||
Current maturities of long-term debt | $ | 77,654 | $ | 73,631 | |||
Accounts payable | 348,543 | 485,347 | |||||
Accrued salaries and wages | 46,550 | 60,528 | |||||
Other accrued expenses | 69,369 | 89,343 | |||||
Acquisition-related contingent consideration, current | 17,731 | 49,798 | |||||
Billings in excess of costs and earnings | 149,483 | 155,674 | |||||
Other current liabilities | 43,459 | 66,527 | |||||
Total current liabilities | $ | 752,789 | $ | 980,848 | |||
Acquisition-related contingent consideration, net of current portion | 41,675 | 103,515 | |||||
Long-term debt | 945,464 | 1,061,159 | |||||
Long-term deferred tax liabilities, net | 188,759 | 203,476 | |||||
Other long-term liabilities | 68,119 | 66,907 | |||||
Total liabilities | $ | 1,996,806 | $ | 2,415,905 | |||
Commitments and contingencies (See Note 15) | |||||||
Equity | |||||||
Preferred stock, $1.00 par value: authorized shares - 5,000,000; issued and outstanding shares – none | $ | — | $ | — | |||
Common stock, $0.10 par value: authorized shares - 145,000,000; issued shares - 88,197,474 and 87,614,955 as of December 31, 2015 and 2014, respectively | 8,820 | 8,762 | |||||
Capital surplus | 769,996 | 756,688 | |||||
Retained earnings | 378,678 | 457,788 | |||||
Accumulated other comprehensive loss | (72,351 | ) | (34,004 | ) | |||
Treasury stock, at cost: 8,094,004 and 2,876,311 shares as of December 31, 2015 and 2014, respectively | (145,573 | ) | (45,573 | ) | |||
Total MasTec, Inc. shareholders’ equity | $ | 939,570 | $ | 1,143,661 | |||
Non-controlling interests | $ | 3,821 | $ | 4,414 | |||
Total equity | $ | 943,391 | $ | 1,148,075 | |||
Total liabilities and equity | $ | 2,940,197 | $ | 3,563,980 | |||
The accompanying notes are an integral part of these consolidated financial statements.
51
MASTEC, INC.
CONSOLIDATED STATEMENTS OF EQUITY
(in thousands, except shares)
Common Stock | Treasury Stock | Contributed Shares (Note 10) | Capital Surplus | Retained Earnings | Accumulated Other Comprehensive Loss | Total MasTec, Inc. Shareholders’ Equity | Non-Controlling Interests | Total Equity | |||||||||||||||||||||||||||||||||
Shares | Amount | Shares | Amount | ||||||||||||||||||||||||||||||||||||||
Balance as of December 31, 2012 | 85,915,552 | $ | 8,592 | (9,467,286 | ) | $ | (150,000 | ) | $ | — | $ | 803,166 | $ | 200,915 | $ | (5,501 | ) | $ | 857,172 | $ | 4,703 | $ | 861,875 | ||||||||||||||||||
Net income | 140,950 | 140,950 | 266 | 141,216 | |||||||||||||||||||||||||||||||||||||
Other comprehensive loss | (7,785 | ) | (7,785 | ) | (7,785 | ) | |||||||||||||||||||||||||||||||||||
Non-cash stock-based compensation | 12,944 | 12,944 | 12,944 | ||||||||||||||||||||||||||||||||||||||
Income tax effect from stock-based compensation | 4,315 | 4,315 | 4,315 | ||||||||||||||||||||||||||||||||||||||
Exercise of stock options | 513,254 | 51 | 3,816 | 3,867 | 3,867 | ||||||||||||||||||||||||||||||||||||
Issuance of restricted shares | 68,122 | 7 | (7 | ) | — | — | |||||||||||||||||||||||||||||||||||
Other stock issuances, net | 428,444 | 42 | 4,584 | 4,626 | 4,626 | ||||||||||||||||||||||||||||||||||||
Contributed shares | (200,000 | ) | (20 | ) | 6,002 | (5,982 | ) | — | — | ||||||||||||||||||||||||||||||||
Balance as of December 31, 2013 | 86,725,372 | $ | 8,672 | (9,467,286 | ) | $ | (150,000 | ) | $ | 6,002 | $ | 822,836 | $ | 341,865 | $ | (13,286 | ) | $ | 1,016,089 | $ | 4,969 | $ | 1,021,058 | ||||||||||||||||||
Net income (loss) | 115,923 | 115,923 | (374 | ) | 115,549 | ||||||||||||||||||||||||||||||||||||
Other comprehensive loss | (20,718 | ) | (20,718 | ) | (20,718 | ) | |||||||||||||||||||||||||||||||||||
Non-cash stock-based compensation | 15,950 | 15,950 | 15,950 | ||||||||||||||||||||||||||||||||||||||
Income tax effect from stock-based compensation | 2,484 | 2,484 | 2,484 | ||||||||||||||||||||||||||||||||||||||
Exercise of stock options | 210,900 | 21 | 2,225 | 2,246 | 2,246 | ||||||||||||||||||||||||||||||||||||
Issuance of restricted shares | 659,212 | 66 | (66 | ) | — | — | |||||||||||||||||||||||||||||||||||
Other stock issuances, net | 19,471 | 3 | (1,140 | ) | (1,137 | ) | (1,137 | ) | |||||||||||||||||||||||||||||||||
Issuance of treasury stock for convertible notes | 6,590,975 | 104,427 | 104,427 | 104,427 | |||||||||||||||||||||||||||||||||||||
Conversion of convertible notes | (91,784 | ) | (91,784 | ) | (91,784 | ) | |||||||||||||||||||||||||||||||||||
Contributed shares, transfer to capital surplus | (6,002 | ) | 6,002 | — | — | ||||||||||||||||||||||||||||||||||||
Other activity | 181 | 181 | (181 | ) | — | ||||||||||||||||||||||||||||||||||||
Balance as of December 31, 2014 | 87,614,955 | $ | 8,762 | (2,876,311 | ) | $ | (45,573 | ) | $ | — | $ | 756,688 | $ | 457,788 | $ | (34,004 | ) | $ | 1,143,661 | $ | 4,414 | $ | 1,148,075 | ||||||||||||||||||
Net loss | (79,110 | ) | (79,110 | ) | (593 | ) | (79,703 | ) | |||||||||||||||||||||||||||||||||
Other comprehensive loss | (38,347 | ) | (38,347 | ) | (38,347 | ) | |||||||||||||||||||||||||||||||||||
Non-cash stock-based compensation | 12,395 | 12,395 | 12,395 | ||||||||||||||||||||||||||||||||||||||
Income tax effect from stock-based compensation | (597 | ) | (597 | ) | (597 | ) | |||||||||||||||||||||||||||||||||||
Exercise of stock options | 81,971 | 8 | 536 | 544 | 544 | ||||||||||||||||||||||||||||||||||||
Issuance of restricted shares | 446,874 | 45 | (45 | ) | — | — | |||||||||||||||||||||||||||||||||||
Other stock issuances, net | 53,674 | 5 | 1,019 | 1,024 | 1,024 | ||||||||||||||||||||||||||||||||||||
Acquisition of treasury stock, at cost | (5,217,693 | ) | (100,000 | ) | (100,000 | ) | (100,000 | ) | |||||||||||||||||||||||||||||||||
Balance as of December 31, 2015 | 88,197,474 | $ | 8,820 | (8,094,004 | ) | $ | (145,573 | ) | $ | — | $ | 769,996 | $ | 378,678 | $ | (72,351 | ) | $ | 939,570 | $ | 3,821 | $ | 943,391 | ||||||||||||||||||
The accompanying notes are an integral part of these consolidated financial statements.
52
MASTEC, INC.
CONSOLIDATED STATEMENTS OF CASH FLOWS
(in thousands)
For the Years Ended December 31, | |||||||||||
2015 | 2014 | 2013 | |||||||||
Cash flows from operating activities: | |||||||||||
Net (loss) income | $ | (79,703 | ) | $ | 115,549 | $ | 141,216 | ||||
Adjustments to reconcile net (loss) income to net cash provided by operating activities: | |||||||||||
Depreciation and amortization | 169,662 | 154,452 | 140,926 | ||||||||
Goodwill and intangible asset impairment | 78,625 | — | — | ||||||||
Non-cash interest expense | 2,633 | 7,355 | 10,717 | ||||||||
Non-cash stock-based compensation expense | 12,395 | 15,950 | 12,944 | ||||||||
Excess tax benefit from stock-based compensation | (57 | ) | (3,728 | ) | (4,315 | ) | |||||
Provision for deferred income taxes | 3,925 | 13,756 | 6,533 | ||||||||
Other non-cash items | 1,537 | 5,955 | 8,009 | ||||||||
(Gains) losses on sales of assets, including discontinued operations (See Note 1) | (8,191 | ) | (6,434 | ) | (1,492 | ) | |||||
Non-cash change in estimated fair value of acquisition-related contingent consideration | (20,073 | ) | — | — | |||||||
Changes in assets and liabilities, net of acquisitions: | |||||||||||
Accounts receivable | 362,275 | 163,773 | (204,330 | ) | |||||||
Inventories | 22,356 | (12,621 | ) | 13,481 | |||||||
Other assets, current and long-term portion | (7,647 | ) | (14,221 | ) | 6,248 | ||||||
Accounts payable and accrued expenses | (162,441 | ) | (87,494 | ) | 72,514 | ||||||
Billings in excess of costs and earnings | (5,085 | ) | (34,320 | ) | (8,227 | ) | |||||
Book overdrafts | 4,699 | 9,911 | 6,363 | ||||||||
Other liabilities, current and long-term portion | (7,497 | ) | (4,872 | ) | (185 | ) | |||||
Net cash provided by operating activities | $ | 367,413 | $ | 323,011 | $ | 200,402 | |||||
Cash flows used in investing activities: | |||||||||||
Cash paid for acquisitions, net of cash acquired | (148 | ) | (345,543 | ) | (148,567 | ) | |||||
Proceeds from disposal of business, net of cash divested | — | — | (2,997 | ) | |||||||
Capital expenditures | (84,410 | ) | (109,254 | ) | (126,288 | ) | |||||
Proceeds from sale of property and equipment | 13,932 | 16,655 | 15,858 | ||||||||
Payments for other investments | (127,480 | ) | (4,092 | ) | (16,173 | ) | |||||
Proceeds from other investments | 69,406 | 2,972 | — | ||||||||
Proceeds from sale or redemption of available-for-sale securities | — | — | 14,956 | ||||||||
Net cash used in investing activities | $ | (128,700 | ) | $ | (439,262 | ) | $ | (263,211 | ) | ||
Cash flows (used in) provided by financing activities: | |||||||||||
Proceeds from credit facilities | 1,702,431 | 2,385,971 | 1,149,040 | ||||||||
Repayments of credit facilities | (1,742,077 | ) | (1,939,612 | ) | (1,249,601 | ) | |||||
Proceeds from issuance of senior notes | — | — | 400,000 | ||||||||
Repayment of senior notes, including convertible notes | — | (202,325 | ) | (150,000 | ) | ||||||
Repayments of other borrowings | (13,843 | ) | (15,700 | ) | (27,705 | ) | |||||
Payments of capital lease obligations | (57,095 | ) | (51,587 | ) | (43,040 | ) | |||||
Repurchase of common stock | (100,000 | ) | — | — | |||||||
Proceeds from stock-based awards, net of tax withholdings | 1,566 | 1,113 | 8,355 | ||||||||
Excess tax benefit from stock-based compensation | 57 | 3,728 | 4,315 | ||||||||
Payments of acquisition-related contingent consideration | (47,523 | ) | (60,341 | ) | (18,683 | ) | |||||
Payments of financing costs | (2,436 | ) | (2,572 | ) | (13,688 | ) | |||||
Net cash (used in) provided by financing activities | $ | (258,920 | ) | $ | 118,675 | $ | 58,993 | ||||
Effect of currency translation on cash | 1,132 | (1,292 | ) | (24 | ) | ||||||
Net increase (decrease) in cash and cash equivalents | (19,075 | ) | 1,132 | (3,840 | ) | ||||||
Cash and cash equivalents - beginning of period | 24,059 | 22,927 | 26,767 | ||||||||
Cash and cash equivalents - end of period | $ | 4,984 | $ | 24,059 | $ | 22,927 | |||||
Supplemental cash flow information: | |||||||||||
Interest paid | $ | 47,405 | $ | 42,979 | $ | 37,531 | |||||
Income taxes paid, net of refunds | $ | 2,536 | $ | 76,975 | $ | 79,504 | |||||
Supplemental disclosure of non-cash information: | |||||||||||
Equipment acquired under capital lease | $ | 18,032 | $ | 64,618 | $ | 86,330 | |||||
Equipment acquired under financing arrangements | $ | 8,949 | $ | 11,105 | $ | 24,244 | |||||
Acquisition-related contingent consideration, new business combinations | $ | — | $ | 33,612 | $ | 32,451 | |||||
Premium shares, conversion of convertible notes | $ | — | $ | 155,744 | $ | — | |||||
The accompanying notes are an integral part of these consolidated financial statements.
53
MASTEC, INC.
NOTES TO CONSOLIDATED FINANCIAL STATEMENTS
Note 1 – Business, Basis of Presentation and Significant Accounting Policies
Nature of the Business
MasTec, Inc. (collectively with its subsidiaries, “MasTec” or the “Company”) is a leading infrastructure construction company operating mainly throughout North America across a range of industries. The Company’s primary activities include the engineering, building, installation, maintenance and upgrade of communications, energy and utility infrastructure, such as: wireless, wireline/fiber and satellite communications; petroleum and natural gas pipeline infrastructure; electrical utility transmission and distribution; conventional and renewable power generation; and industrial infrastructure. MasTec’s customers are primarily in these industries. MasTec presents its results under five reportable segments: (1) Communications; (2) Oil and Gas; (3) Electrical Transmission; (4) Power Generation and Industrial; and (5) Other.
Principles of Consolidation
The accompanying consolidated financial statements include MasTec, Inc. and its subsidiaries and include the accounts of all majority-owned subsidiaries over which the Company exercises control and, when applicable, entities in which the Company has a controlling financial interest. Other parties’ interests in companies for which MasTec exercises control and has a controlling financial interest are reported as non-controlling interests within equity. Net income or loss attributable to non-controlling interests is reported as a separate line item below net income or loss. The Company’s investments in entities in which the Company does not have a controlling interest, but for which it has the ability to exert significant influence, are accounted for using the equity method of accounting. Equity method investments are recorded as other long-term assets in the consolidated balance sheets. Income or loss from these investments is recorded within other income or expense in the consolidated statements of operations, and are reflected as increases or decreases, as appropriate, to the carrying amount of the related investments. The cost method is used for investments in entities in which the Company does not have the ability to exert significant influence. All significant intercompany balances and transactions have been eliminated in consolidation. The assets and liabilities of foreign subsidiaries with a functional currency other than the U.S. dollar are translated into U.S. dollars at period-end exchange rates, with resulting translation gains or losses accumulated within other comprehensive income or loss. Revenue and expenses are translated into U.S. dollars at average rates of exchange during the applicable period. Substantially all of the Company’s foreign operations use the local currency as the functional currency. Gains or losses resulting from transactions executed in a foreign currency are included in other income or expense, net. The Company does not currently have subsidiaries that operate in highly inflationary environments. The results of operations and financial position of any discontinued operations are aggregated and presented separately from the Company’s continuing operations in the consolidated financial statements for all periods presented. Certain prior year amounts have been reclassified to conform to the current period presentation. In these consolidated financial statements, “$” means U.S. dollars unless otherwise indicated.
Investments in Affiliates and Other Entities
In the ordinary course of business, the Company enters into various investment arrangements, which may include equity or other interests in business entities, including contractual joint ventures or other forms of equity participation. These investment arrangements may include financing arrangements, such as the extension of loans. See Note 3 - Acquisitions and Note 5 - Fair Value of Financial Instruments for discussion pertaining to certain of the Company’s cost and equity method investments and other investment arrangements. In connection with certain of these investment arrangements, the Company provides infrastructure construction services to or through its equity investees and/or its proportionately consolidated non-controlled contractual joint venture. Management determines whether such investment arrangements involve a variable interest entity (“VIE”) based on the characteristics of the particular entity. If an entity is determined to be a VIE, then management determines if the Company is the primary beneficiary of the entity and whether or not consolidation of the VIE within the Company's financial statements is required. The primary beneficiary consolidating the VIE must normally have both (i) the power to direct the primary activities of the VIE and (ii) the obligation to absorb losses of the VIE or the right to receive benefits from the VIE, which, in either case, could be significant to the VIE. If management determines that the Company is the primary beneficiary of a VIE, then the VIE would be consolidated, and the other party’s equity interest in the VIE would be accounted for as a non-controlling interest. As of December 31, 2015, the Company determined that certain of its investment arrangements were VIEs, but that it was not the primary beneficiary. In arrangements in which the Company has an undivided interest in the assets, liabilities, revenues and profits or losses of an unincorporated entity, such amounts are consolidated on a basis proportional to the Company’s ownership interest in the unincorporated entity.
Management Estimates
The preparation of financial statements in conformity with U.S. GAAP requires the use of estimates and assumptions that affect the amounts reported in the financial statements and accompanying notes. Key estimates include: the recognition of revenue and project profit or loss (which the Company defines as project revenue less project costs of revenue, including depreciation), in particular, on long-term construction contracts or other projects accounted for under the percentage-of-completion method, for which the recorded amounts require estimates of costs to complete projects, ultimate project profit and the amount of contract price adjustments that are probable; allowances for doubtful accounts; estimated fair values of goodwill and intangible assets and liabilities, acquisition-related contingent consideration and investments in cost and equity method investees; asset lives used in computing depreciation and amortization; accrued self-insured claims; share-based compensation; accounting for income taxes; and the estimated impact of contingencies and ongoing litigation. While management believes that such estimates are fair when considered in conjunction with its consolidated financial position and results of operations taken as a whole, actual results could differ from those estimates and such differences could be material to the consolidated financial statements.
54
Independent Investigation of the Audit Committee and Related Restatements
During 2015, the Audit Committee of the Board of Directors of MasTec, Inc., with the assistance of independent counsel and accounting advisors, conducted and concluded a previously disclosed independent investigation, which included a detailed review of percentage-of-completion accounting, primarily at the Company’s Electrical Transmission segment, and a detailed review of selected accounting judgments, estimates and entries over a multi-year period across the balance of the Company’s segments selected to further test the reliability of the previously issued financial statements. In connection with this process, the Company concluded that certain accounting adjustments were appropriate with respect to interim periods in 2014, which adjustments were recorded and reflected in the respective quarterly periods, and reported as restated financial information in the Company’s annual report on Form 10-K for the year ended December 31, 2014 (the “2014 Form 10-K”). See Note 2 - Independent Investigation of the Audit Committee and Related Restatements in the 2014 Form 10-K for related discussion and details.
Significant Accounting Policies
The following is a summary of significant accounting policies followed in the preparation of the accompanying consolidated financial statements.
Revenue Recognition
Revenue is derived from projects performed under master and other service agreements as well as from fixed price contracts for specific projects or jobs requiring the construction and installation of an entire infrastructure system or specified units within an entire infrastructure system. The Company frequently provides maintenance, installation and repair work under unit price or fixed price master service or other service agreements that are renewed on a periodic basis. Revenue and related costs for master and other service agreements billed on a time and materials basis are recognized as the services are rendered. Revenue derived from projects performed under master service and other service agreements totaled 48%, 49% and 46%, respectively, for the years ended December 31, 2015, 2014 and 2013. The Company also performs services under master and other service agreements on a fixed fee basis, under which MasTec furnishes specified units of service for a fixed price per unit of service and revenue is recognized as the services are rendered. Revenue from fixed price contracts provides for a fixed amount of revenue for the entire project, subject to certain additions for changed scope or specifications. Revenue from these contracts, as well as for certain projects pursuant to master and other service agreements, is recognized using the percentage-of-completion method, under which the percentage of revenue to be recognized for a given project is measured by the percentage of costs incurred to date on the contract to the total estimated costs for the contract. Such contracts provide that the customer accept completion of progress to date and compensate the Company for services rendered, which may be measured in terms of costs incurred, units installed, hours expended or some other measure of progress. Contract costs include all direct materials, labor and subcontracted costs and those indirect costs related to contract performance, such as indirect labor, supplies, tools, repairs and the operational costs of capital equipment (excluding certain depreciation). Much of the materials associated with the Company’s work are customer-furnished and are therefore not included in contract revenue and costs.
The estimation process for revenue recognized under the percentage-of-completion method is based on the professional knowledge and experience of the Company’s engineers, project managers and financial professionals. Management reviews estimates of contract revenue and costs on an ongoing basis. Changes in job performance, job conditions and final contract settlements are factors that influence management’s assessment of total contract value and total estimated costs to complete those contracts and, therefore, the Company’s profit recognition. Changes in these factors may result in revisions to costs and income, and their effects are recognized in the period in which the revisions are determined, which could materially affect the Company’s results of operations in the period in which such changes are recognized. Excluding the effects on the Company’s 2015 results of project losses of (i) $21.4 million on a Canadian wind project, (ii) $16.3 million on a proportionately consolidated non-controlled Canadian joint venture, and (iii) $14.0 million on an Electrical Transmission project, project profit was affected by less than 5% for both the years ended December 31, 2015 and 2014 as a result of changes in contract estimates included in projects that were in process as of December 31, 2014 and 2013, respectively. Provisions for losses on uncompleted contracts are made in the period in which such losses are determined to be probable and the amount can be reasonably estimated. The majority of fixed price contracts are generally completed within one year.
The Company may incur costs subject to change orders, whether approved or unapproved by the customer, and/or claims related to certain contracts. Management determines the probability that such costs will be recovered based upon engineering studies and legal opinions, past practices with the customer, specific discussions, correspondence or preliminary negotiations with the customer. The Company treats project costs as a cost of contract performance in the period incurred if it is not probable that the costs will be recovered, or defers costs and/or recognizes revenue up to the amount of the related cost if it is probable that the contract price will be adjusted and can be reliably estimated. As of December 31, 2015 and 2014, the Company had approximately $38 million and $87 million, respectively, of change orders and/or claims that had been included as contract price adjustments on certain contracts that were in the process of being resolved in the normal course of business, including through negotiation, arbitration and other proceedings. These contract price adjustments, which are included within costs and earnings in excess of billings or billed accounts receivable, as appropriate, represent management’s best estimate of contract revenue that has been or will be earned and that management believes is probable of collection. As of December 31, 2015 and 2014, these change orders were primarily related to contracts in the Oil and Gas and Electrical Transmission segments. Revenue related to unapproved change orders totaled approximately $10 million and $29 million, respectively, for the years ended December 31, 2015 and 2014. The Company actively engages in substantive meetings with its customers to complete the final approval process, and generally expects these processes to be completed within one year. The amounts ultimately realized upon final acceptance by its customers could be higher or lower than such estimated amounts.
Billings in excess of costs and estimated earnings on uncompleted contracts are classified as current liabilities. Costs and estimated earnings in excess of billings, or work in process, is classified within current assets for the majority of the Company’s projects. Work in process on contracts is based on work performed but not yet billed to customers as per individual contract terms.
55
Allowance for Doubtful Accounts
The Company maintains an allowance for doubtful accounts for estimated losses resulting from the inability of its customers to make required payments. Management analyzes the collectibility of accounts receivable and the adequacy of the allowance for doubtful accounts on a regular basis based on the aging of account balances, historical bad debt experience, customer concentrations, customer credit-worthiness, customer financial condition and credit reports, availability of mechanics’ and other liens, existence of payment bonds and other sources of payment and current economic trends. For reporting units where losses have occurred historically and are considered to be ordinary course, reserves are established for anticipated losses based on an analysis of the accounts receivable portfolio. For reporting units where historical losses have been immaterial, reserves are established when it is probable that a specific receivable is not collectible and the loss can be reasonably estimated. Amounts are written off against the allowance when deemed uncollectible.
If estimates of the collectibility of accounts receivable change, or should customers experience unanticipated financial difficulties, or if anticipated recoveries in existing bankruptcies or other work-out situations fail to materialize, additional reserves may be required. Estimates of collectibility are subject to significant change during times of economic weakness or uncertainty in either the overall economy or within the industries served by MasTec. Management actively monitors the economic environment and its impact on MasTec’s customers in connection with its evaluation of accounts receivable aging, collections and the adequacy of the allowance for doubtful accounts.
Cash and Cash Equivalents
Cash consisting of interest-bearing demand deposits is carried at cost, which approximates fair value. All highly liquid investments purchased with an original maturity of three months or less are considered to be cash equivalents, which are carried at fair value. On a daily basis, available funds are swept from the Company’s depository accounts into a concentration account and used to repay outstanding revolving loans under the Company’s credit facility. Other cash balances maintained by certain operating subsidiaries that are not swept into the concentration account, as well as deposits made subsequent to the daily cash sweep, are classified as cash. The Company generally does not fund its disbursement accounts for checks it has written until the checks are presented to the bank for payment. Outstanding checks that have not yet cleared through the banking system represent book overdrafts, which are classified within accounts payable. There are no compensating balance requirements associated with the Company’s depository accounts and there are no other restrictions on the transfer of cash associated with the Company’s depository accounts. As of December 31, 2015 and 2014, book overdrafts, which are included within accounts payable in the consolidated balance sheets, totaled $36.0 million and $31.3 million, respectively.
Inventories
Inventories consist of materials and supplies for construction and installation projects, which are valued at the lower of cost or market using either the average cost or specific identification methods of costing. For materials or supplies purchased on behalf of specific customers or projects, loss of the customer or cancellation of the project could result in an impairment of the value of materials purchased. Technological or market changes can also render certain materials obsolete. Allowances for inventory obsolescence are determined based upon specific facts and circumstances and market conditions. As of December 31, 2015 and 2014, inventory obsolescence reserves were $2.8 million and $6.4 million, respectively.
Long-Lived Assets
The Company’s long-lived assets consist primarily of property and equipment and finite-lived intangible assets. Property and equipment are recorded at cost, or if acquired in a business combination, at the acquisition date fair value. Certain costs incurred in connection with developing or obtaining internal-use software are capitalized within office furniture and equipment. Depreciation and amortization of long-lived assets is computed using the straight-line method over the estimated useful lives of the respective assets. Leasehold improvements are depreciated over the shorter of the term of the lease or the estimated useful lives of the improvements. Property and equipment under capital leases are depreciated over their estimated useful lives. Expenditures for repairs and maintenance are charged to expense as incurred. Expenditures for betterments and major improvements are capitalized and depreciated over the remaining useful lives of the assets. The carrying amounts of assets sold or retired and the related accumulated depreciation are eliminated in the year of disposal, with resulting gains or losses included in other income or expense. Acquired intangible assets that have finite lives are amortized over their useful lives, which are generally based on contractual or legal rights.
Management reviews long-lived assets for impairment whenever events or changes in circumstances indicate that their carrying amounts may not be recoverable. If an evaluation is required, the estimated future undiscounted cash flows associated with the asset are compared with the asset’s carrying amount to determine if there has been an impairment, which is calculated as the difference between the fair value of an asset and its carrying value. Estimates of future undiscounted cash flows are based on expected growth rates for the business, anticipated future economic conditions and estimates of residual values. Fair values take into consideration management estimates of risk-adjusted discount rates, which are believed to be consistent with assumptions that marketplace participants would use in their estimates of fair value. For the three years in the period ended December 31, 2015, there were no material impairment charges associated with long-lived assets of the Company’s continuing operations.
Goodwill and Indefinite-Lived Intangible Assets
The Company has goodwill and certain indefinite-lived intangible assets that have been recorded in connection with its acquisitions of businesses. Goodwill and indefinite-lived intangible assets are not amortized, but instead are tested for impairment at least annually. The Company performs its annual impairment tests of goodwill and indefinite-lived intangible assets during the fourth quarter of each year. Goodwill is required to be tested for impairment at the reporting unit level. A reporting unit is an operating segment or one level below the operating segment level, which is referred to as a component. Management identifies its reporting units by assessing whether components (i) have discrete financial information available; (ii) engage in business activities; and (iii) whether a segment manager regularly reviews the component’s operating results. Net assets and goodwill of acquired businesses are allocated to the reporting unit associated with the acquired business based on the anticipated organizational structure of the combined entities. If two or more components are deemed economically similar, those components are aggregated into one reporting unit when performing
56
the annual goodwill impairment review. Other than the Company’s Electrical Transmission operating segment, each of the Company’s reporting units comprises one component. For the years ended December 31, 2015 and 2014, the Company combined the four components of its Electrical Transmission operating segment into one reporting unit, based on a review of segment operations, which indicated increased shared operational, sales and general and administrative resources across the four components. For the year ended December 31, 2013, no components were aggregated for the annual impairment reviews.
For each of the three years in the period ended December 31, 2015, management performed a qualitative assessment for its goodwill and indefinite-lived intangible assets by examining relevant events and circumstances that could have an effect on their fair values, such as: macroeconomic conditions, industry and market conditions, entity-specific events, financial performance and other relevant factors or events that could affect earnings and cash flows. Due to continued volatility in oil and gas prices during 2015 and in the beginning of 2016, which has negatively impacted financial performance, expectations and future cash flow projections at several of the reporting units, management performed quantitative testing for three reporting units within the Oil and Gas operating segment. Due to adverse weather disruptions, site-related project inefficiencies, and reduced project activity from the combination of lower overall market activity levels due to project delays and lower than expected success rates on new project awards during 2015, management performed quantitative testing for the Electrical Transmission operating segment.
For the reporting units requiring additional testing, management performed a two-step quantitative goodwill impairment test. Management estimated their respective fair values using a combination of market and income approaches. Under the market approach, fair values were estimated using published market multiples for comparable companies. Under the income approach, a discounted cash flow methodology was used, including: (i) management estimates, such as projections of revenue, operating costs and cash flows, taking into consideration historical and anticipated financial results; (ii) general economic and market conditions; and (iii) the impact of planned business and operational strategies. Estimated discount rates were determined using the Company’s average cost of capital at the time of the analysis, taking into consideration the risk inherent within each reporting unit individually, which are greater than the risk inherent in the Company as a whole. Significant assumptions used in testing the reporting units included terminal values based on terminal growth rates ranging from 3.0%-3.5%, nine years of discounted cash flows prior to the terminal value, and discount rates ranging from 12.0% to 14.0%. Management believes the assumptions used in its quantitative goodwill impairment tests are reflective of the risks inherent in the business models of its reporting units and within its industry.
In 2015, the estimated fair value of one reporting unit in the Oil and Gas operating segment was determined be less than its carrying value and the second step of the goodwill impairment test was performed. The implied fair value of this reporting unit’s goodwill was compared with its carrying value and a pre-tax, non-cash impairment charge of $68.5 million was recorded for the difference. This reporting unit has $11.2 million of goodwill remaining at December 31, 2015.
In 2015, the estimated fair value of the Electrical Transmission operating segment exceeded its carrying value by approximately 5%. A 100 basis point change in the discount rate would have resulted in the Electrical Transmission operating segment carrying value exceeding fair value. The Electrical Transmission operating segment has approximately $150 million of goodwill. The estimated fair values of all other reporting units for which quantitative impairment tests were performed for the year ended December 31, 2015 were determined to substantially exceed their carrying values. A 100 basis point change in the discount rate would not have had a material impact on the results of these impairment tests as of the date the testing was performed.
For the reasons noted above, management also performed quantitative testing during 2015 for two indefinite-lived pre-qualification intangible assets in the Oil and Gas operating segment and one indefinite-lived pre-qualification intangible asset in the Electrical Transmission operating segment. Management estimated fair values using a cost methodology, incorporating estimates of the opportunity cost associated with the assets’ loss based on discounted cash flows over a two to three-year period. The impairment tests incorporated estimated discount rates ranging from 12.0% to 14.0%. For one of the indefinite-lived pre-qualification intangible assets in the Oil and Gas operating segment and the indefinite-lived pre-qualification intangible asset in the Electrical Transmission operating segment, the estimated fair values substantially exceeded their carrying values. For the other indefinite-lived pre-qualification intangible asset in the Oil and Gas operating segment, the carrying value of the asset exceeded its estimated fair value and a pre-tax, non-cash impairment charge of $10.1 million was recorded for the difference. The adjusted carrying value of this pre-qualification asset is approximately $20.5 million at December 31, 2015.
Based on the qualitative assessments for the year ended December 31, 2014, and additional testing performed in the fourth quarter of 2014 subsequent to the annual test due to a significant decline in oil prices, quantitative testing was performed for four reporting units, one within the Communications operating segment, one within the Power Generation and Industrial operating segment, and two within the Oil and Gas operating segment. Significant assumptions included an average terminal value equal to 5.5 times normalized year five EBITDA and discount rates ranging from 12% to 13.5%. The estimated fair values of the reporting units in the Communications and Power Generation and Industrial operating segments were determined to substantially exceed their carrying values. The estimated fair values of the subsequently tested reporting units in the Oil and Gas operating segment exceeded their carrying values by approximately 15% each.
Management also performed quantitative testing in 2014 for an indefinite-lived intangible asset in the Power Generation and Industrial operating segment. Management estimated its fair value using the relief-from-royalty method, which incorporated royalty savings cash flows and a terminal value capitalization rate based on the discount rate and estimated long-term growth rate. The discount rate was estimated to be 10.5% for the year ended December 31, 2014. The estimated fair value of the indefinite-lived intangible asset exceeded its carrying value by just over 10%.
Based on the qualitative assessments for the year ended December 31, 2013, quantitative testing was performed for three reporting units, one each within the Oil and Gas, Power Generation and Industrial and Electrical Transmission operating segments. Significant assumptions included an average terminal value equal to 5.5 times normalized year five EBITDA and a discount rate estimated to be 7.2%. The estimated fair values of the reporting units were determined to substantially exceed their carrying values.
57
Quantitative testing was also performed in 2013 for the indefinite-lived intangible asset for which a quantitative test was performed in 2014. The discount rate was estimated to be 7.2% for the year ended December 31, 2013. The estimated fair value of the indefinite-lived intangible asset was determined to substantially exceed its carrying value.
As of December 31, 2015 and 2014, management believes that its recorded balances of goodwill and indefinite-lived intangible assets are recoverable; however, significant changes in the assumptions or estimates used in the Company’s impairment analyses, such as a reduction in profitability and/or cash flows, could result in additional non-cash goodwill and indefinite-lived intangible asset impairment charges in future periods.
Valuation of Net Assets Acquired and Estimated Future Earn-Out Obligations in Business Combinations
The determination of the fair value of net assets acquired in a business combination requires estimates and judgments of future cash flow expectations for the acquired business and related identifiable tangible and intangible assets. Fair values are calculated using expected cash flows and industry-standard valuation techniques. For current assets and current liabilities, book value is generally assumed to equal fair value. Goodwill is the amount by which consideration paid exceeds the fair value of acquired net assets. Acquisition costs, including acquisition integration costs, are expensed as incurred and are included within general and administrative expenses in the consolidated statements of operations.
Consideration paid generally consists of cash, common stock and potential future payments that are contingent upon the acquired business achieving certain levels of earnings in the future, also referred to as “contingent consideration” or “earn-out” payments. Contingent consideration liabilities are measured at their estimated fair value as of the date of acquisition, with subsequent changes in fair value recorded within other income or expense in the consolidated statements of operations. Fair value as of the date of acquisition is estimated based on projections of expected future cash flows of the acquired business. Subsequent to the date of acquisition, if future earn-out payments are expected to exceed earn-out payments estimated as of the date of acquisition, then a loss would be recognized in the period in which that expectation is considered probable. Conversely, if future earn-out payments are expected to be less than earn-out payments estimated as of the date of acquisition, a gain would be recognized in the period in which that expectation is considered probable.
Due to the time required to gather and analyze the necessary data for each acquisition, U.S. GAAP provides a “measurement period” of up to one year in which to finalize the determination of the fair value of net assets acquired. As discussed below, Accounting Standards Update (“ASU”) 2015-16, which the Company adopted in the fourth quarter of 2015, eliminated the requirement to retrospectively account for measurement period adjustments resulting from adjustments to initial valuations and estimates resulting from newly discovered information that existed as of the date of acquisition. Prior to the adoption of this ASU, such adjustments were recorded as if the adjustments had been taken into account as of the date of acquisition, which resulted in the revision of comparative prior period information when presented in subsequent periods. Adjustments to the fair value of net assets acquired resulting from circumstances that developed after the date of acquisitions are reflected as income or expense, as appropriate, in the period during which the adjustment is considered probable. See Note 3 - Acquisitions for details of measurement period adjustments associated with the Company’s acquisitions.
Deferred Financing Costs
Deferred financing costs relate to the Company’s debt instruments, the short and long-term portions of which are included in prepaid expenses and other current assets and other long-term assets, respectively, in the consolidated balance sheets. Deferred financing costs are amortized over the related terms of the debt using the effective interest method. During the years ended December 31, 2015, 2014 and 2013, the Company incurred $2.4 million, $2.6 million and $9.6 million, respectively, of debt-related deferred financing costs. Deferred financing costs, net of accumulated amortization, totaled $12.8 million and $13.2 million as of December 31, 2015 and 2014, respectively. See Recently Adopted Accounting Pronouncements below for details pertaining to the adoption of ASU 2015-03 and ASU 2015-15 as of January 1, 2016, which will change the presentation of deferred financing costs in the consolidated balance sheets beginning in 2016, with retrospective application to 2015.
Self-Insurance
The Company is self-insured up to the amount of its deductible for its insurance policies. MasTec maintains insurance policies subject to per claim deductibles of $1.5 million for its workers’ compensation policy, $2.0 million for its general liability policy and $3.0 million for its automobile liability policy. The Company has excess umbrella coverage up to $100.0 million per claim and in the aggregate. Liabilities under these insurance programs are accrued based upon management’s estimates of the ultimate liability for claims reported and an estimate of claims incurred but not reported with assistance from third-party actuaries. MasTec also maintains an insurance policy with respect to employee group medical claims, which is subject to annual per employee maximum losses of $0.5 million. MasTec’s liability for employee group medical claims is based on statistical analysis of historical claims experience and specific knowledge of actual losses that have occurred. The Company is also required to post letters of credit and provide cash collateral to certain of its insurance carriers and to obtain surety bonds in certain states. Cash collateral deposited with insurance carriers is included in other long-term assets in the consolidated balance sheets.
The present value of the Company’s self-insurance liability is reflected in the consolidated balance sheets within current and other long-term liabilities, as appropriate. The determination of such claims and expenses and the appropriateness of the related liability is reviewed and updated quarterly, however, these insurance liabilities are difficult to assess and estimate due to unknown factors, including the severity of an injury, the determination of the Company’s liability in proportion to other parties and the number of incidents not reported. Accruals are based upon known facts and historical trends and management believes its accruals are adequate. However, a change in experience or actuarial assumptions could materially affect results of operations in a particular period.
58
Income Taxes
The Company records income taxes using the asset and liability method of accounting for deferred income taxes. Under this method, deferred tax assets and liabilities are recognized for the expected future tax consequence of temporary differences between the financial statement and income tax basis of the Company’s assets and liabilities. Income taxes are estimated in each of the jurisdictions in which the Company operates. This process involves estimating the tax exposure, together with assessing temporary differences resulting from differing treatment of items, such as deferred revenue, for tax and accounting purposes. These differences result in deferred tax assets and liabilities, which are included within the consolidated balance sheets as net current and net long-term assets and/or liabilities, as appropriate. The recording of a deferred tax asset assumes the realization of such asset in the future. Otherwise, a valuation allowance is recorded to reduce the asset to its estimated net realizable value. If management determines that the Company may not be able to realize all or part of a deferred tax asset in the future, a valuation allowance for the deferred tax asset is charged to income tax expense in the period the determination is made. Management considers future pretax income and ongoing prudent and feasible tax planning strategies in assessing the estimated net realizable value of tax assets and the corresponding need for a valuation allowance.
In determining the provision for income taxes, management uses an effective tax rate based on annual pre-tax income, statutory tax rates, permanent tax differences and tax planning opportunities in the various jurisdictions in which the Company operates. Significant factors that impact the annual effective tax rate include management’s assessment of certain tax matters, the location and amount of taxable earnings, changes in certain non-deductible expenses and expected credits. As of December 31, 2015, the Company has not made a provision for U.S. income taxes on unremitted foreign earnings because such earnings, which generally become subject to U.S. taxation upon the remittance of dividends and certain other circumstances, are considered to be insignificant and are intended to be indefinitely reinvested outside the United States. The Company expects that domestic cash resources will be sufficient to fund its domestic operations and cash commitments in the future.
The Company and its subsidiaries file income tax returns in numerous tax jurisdictions, including U.S. federal, most U.S. states and certain foreign jurisdictions. Although management believes its calculations for tax returns are correct and the positions taken thereon are reasonable, the final outcome of tax audits could be materially different from the resolution management currently anticipates, and those differences could result in significant costs or benefits to the Company. If applicable, any interest or penalties pertaining to the Company’s income tax returns, if assessed, would be recorded within interest expense or general and administrative expense, respectively, in the consolidated statements of operations.
Stock-Based Compensation
The Company has granted to employees and others restricted stock awards and restricted stock units (together “restricted shares”) as well as options to purchase shares of the Company’s common stock. Non-cash stock compensation expense is included within general and administrative expense in the consolidated statements of operations. Share-based payments, to the extent they are compensatory, are recognized based on their grant date fair values and the estimated number of shares ultimately expected to vest. The Company records a deferred tax asset, or future tax benefit, based on the amount of share-based compensation recognized in the financial statements over the vesting period of share-based awards. If the fair value on the date of exercise of a stock option, or the fair value on the date of vesting of a restricted share grant, exceeds its fair value on the date of grant, then the tax effect of this difference (“excess tax benefit”) is recorded as an increase to additional paid-in capital (“APIC”), creating an “APIC Pool.” If the fair value on the date of exercise of a stock option, or the fair value on the date of vesting of a restricted share grant, is less than its fair value on the date of grant, then the tax effect of this difference would reduce the APIC Pool. If the APIC Pool is reduced to zero, subsequent shortfalls would increase income tax expense.
Grants of restricted shares are valued based on the closing share price of MasTec’s common stock as reported on the New York Stock Exchange (the “closing share price”) on the date of grant. Compensation expense arising from restricted shares is recognized on a straight line basis over the vesting period. Grants of restricted shares have cliff vesting terms ranging from day of issuance to 3 years. As of December 31, 2015, all outstanding stock options were fully vested.
Upon vesting of restricted shares or upon exercise of options, some of the underlying shares are generally sold to cover the required withholding taxes. However, some participants may choose the net share settlement method to cover withholding tax requirements, in which case shares are not issued, but are treated as common stock repurchases in the consolidated financial statements, as they reduce the number of shares that would have been issued upon vesting. The Company then pays the corresponding withholding taxes to the appropriate taxing authorities in cash on behalf of the recipient. In addition, shares may be withheld to cover the exercise price of options in a cashless option exercise. Withheld shares, which are valued at the closing share price on the date of vesting or exercise, as applicable, are recorded as a reduction to additional paid-in capital and are reflected as a financing activity within the consolidated statements of cash flows. Shares withheld for the exercise prices of options totaled 12,628, 34,179 and 34,844 for the years ended December 31, 2015, 2014 and 2013, respectively, and shares withheld for employee tax withholdings totaled approximately 61,779, 63,210, and 36,776 for the years ended December 31, 2015, 2014 and 2013, respectively. Total payments for employee tax obligations to taxing authorities were $1.1 million, $2.7 million and $1.2 million for the years ended December 31, 2015, 2014 and 2013, respectively.
The Company has certain employee stock purchase plans under which shares of the Company’s common stock are available for purchase by eligible employees. These plans allow qualified employees to purchase MasTec, Inc. common stock at 85% of its fair market value at the lower of (i) the date of commencement of the offering period or (ii) the last day of the exercise period, as defined in the plan documents. Through June 30, 2013, the offering period was an annual period, composed of four interim exercise periods. Effective July 1, 2013, the offering period became quarterly. The fair value of purchases under the Company’s employee stock purchase plans is estimated using the Black-Scholes option-pricing valuation model. The determination of fair value of stock-based awards using an option-pricing model is affected by the Company’s stock price as well as assumptions pertaining to several variables, including expected stock price volatility, the expected term of the award and the risk-free rate of interest. In the option-pricing model for the Company’s employee stock purchase plans, expected stock price volatility is based on historical volatility of the Company’s common stock. The expected term of the award is based on historical and expected exercise patterns and the risk-free rate of interest is based on U.S. Treasury yields. The Company has not paid dividends in the past, and does not anticipate paying dividends in the foreseeable future, and therefore uses an expected dividend yield of zero.
59
Litigation and Contingencies
Litigation and contingencies are reflected in the consolidated financial statements based on management’s assessment, including advice of legal counsel, of the expected outcome of litigation or other dispute resolution proceedings and/or the expected resolution of contingencies. Liabilities for estimated losses are accrued if the potential loss from any claim or legal proceeding is considered probable and the amount can be reasonably estimated. Significant judgment is required in both the determination of probability of exposure and the determination as to whether the amount is reasonably estimable. Accruals are based only on information available at the time of the assessment due to the uncertain nature of such matters. As additional information becomes available, management reassesses potential liabilities related to pending claims and litigation and may revise its previous estimates, which could materially affect the Company’s results of operations in a given period.
Fair Value of Financial Instruments
The Company’s financial instruments include cash and cash equivalents, accounts and notes receivable, cash collateral deposited with insurance carriers, life insurance assets, cost and equity method investments, deferred compensation plan assets and liabilities, accounts payable and other current liabilities, acquisition-related contingent consideration, certain intangible assets and liabilities, including off-market contracts and debt obligations.
Fair value is the price that would be received to sell an asset or paid to transfer a liability (an exit price) in the principal or most advantageous market for the asset or liability in an orderly transaction between market participants on the measurement date. The fair value guidance establishes a valuation hierarchy, which requires maximizing the use of observable inputs when measuring fair value. The three levels of inputs that may be used are: (i) Level 1 - quoted market prices in active markets for identical assets or liabilities; (ii) Level 2 - observable market-based inputs or other observable inputs; and (iii) Level 3 - significant unobservable inputs that cannot be corroborated by observable market data, which are generally determined using valuation models incorporating management estimates of market participant assumptions. In instances in which the inputs used to measure fair value fall into different levels of the fair value hierarchy, the fair value measurement classification is determined based on the lowest level input that is significant to the fair value measurement in its entirety. Management’s assessment of the significance of a particular item to the fair value measurement in its entirety requires judgment, including the consideration of inputs specific to the asset or liability.
Fair values of financial instruments are estimated using public market prices, quotes from financial institutions and other available information. Due to their short-term maturity, the carrying amounts of cash and cash equivalents, accounts receivable, accounts payable and other current liabilities approximate their fair values. Management believes the carrying values of notes receivable, cash collateral deposited with insurance carriers, deferred compensation plan assets and liabilities and outstanding balances on its credit facilities approximate their fair values. Cost and equity method investments are initially recorded at their cost basis.
Discontinued Operations
In determining whether a group of assets to be disposed of should be presented as a discontinued operation, management determines whether such assets comprise a component of the Company, which includes an assessment as to whether it has historic operations and cash flows that can be clearly distinguished. Management also determines whether the cash flows associated with the group of assets will be significantly eliminated from the ongoing operations of the Company as a result of the disposal transaction and whether the Company will have no significant continuing involvement in the operations of the disposed assets after the disposal transaction. If management believes these conditions exist, then the assets and liabilities and results of operations of the assets to be disposed, as well as any estimated gain or loss on the disposal transaction, are aggregated for presentation separately from the financial position and operating results of the Company’s continuing operations.
For those businesses for which management has committed to a plan of sale, the business is valued at the lower of its carrying amount or estimated fair value less costs to sell. If the carrying amount of the business exceeds its estimated fair value, an impairment loss is recognized. Estimated fair value is determined using management estimates and entity-specific assumptions. Management considers historical experience and all available information at the time such estimates are made; however, the fair value that is ultimately recognized upon sale of the related business may differ from the estimated fair value as reflected in the consolidated financial statements. Depreciation and amortization expense is not recorded on assets of a business to be sold once that business has been classified as held for sale.
During the year ended December 31, 2013, the Company sold its interests in its Globetec business for nominal consideration and retained certain contingent assets and liabilities. In 2014, management determined that the contingent assets associated with Globetec were not recoverable and recorded additional losses on disposal of $9.6 million. Revenue from discontinued operations for Globetec totaled $18.0 million for the year ended December 31, 2013 and net loss from discontinued operations totaled $6.5 million in both of the years ended December 31, 2014 and 2013, of which $5.8 million and $4.4 million, respectively, represented losses on disposal and impairment charges, net of tax.
New Accounting Pronouncements
Recent Accounting Pronouncements Not Yet Adopted
In January 2016, the Financial Accounting Standards Board (“FASB”) issued Accounting Standards Update (“ASU”) 2016-01, Financial Instruments - Overall (Subtopic 825-10): Recognition and Measurement of Financial Assets and Financial Liabilities (“ASU 2016-01”). ASU 2016-01, which provides guidance for the recognition, measurement, presentation and disclosure of financial assets and financial liabilities. ASU 2016-01 is effective for fiscal years, and for interim periods within those years, beginning after December 15, 2017 and, for most provisions, is effective using the cumulative-effect transition approach. Early application is permitted for certain provisions. The Company is currently evaluating the potential effect of this ASU on its consolidated financial statements.
60
In November 2015, the FASB issued ASU 2015-17, Income Taxes (Topic 740): Balance Sheet Classification of Deferred Taxes (“ASU 2015-17”). ASU 2015-17 requires that all deferred tax liabilities and tax assets be classified as non-current in a classified balance sheet, rather than separating such deferred taxes into current and non-current amounts, as is required under current guidance. ASU 2015-17 is effective for fiscal years, and for interim periods within those years, beginning after December 15, 2016 and may be applied either prospectively or retrospectively. The Company is currently evaluating the timing of adoption and the potential effect of this ASU on its consolidated financial statements.
In July 2015, the FASB issued ASU 2015-11, Inventory (Topic 330): Simplifying the Measurement of Inventory (“ASU 2015-11”). ASU 2015-11 requires that inventory measured using any method other than last-in, first out (“LIFO”) or the retail inventory method to be subsequently measured at the lower of cost or net realizable value, rather than at the lower of cost or market value. Under this ASU, subsequent measurement of inventory using the LIFO and retail inventory method is unchanged. ASU 2015-11 is effective prospectively for fiscal years, and for interim periods within those years, beginning after December 15, 2016. Early application is permitted. The Company is currently evaluating the potential effect of this ASU on its consolidated financial statements.
In May 2014, the FASB issued ASU 2014-09, Revenue from Contracts with Customers (Topic 606) (“ASU 2014-09”). The core principle of this ASU is that a company will recognize revenue when it transfers goods or services to customers in an amount that reflects the consideration to which it expects to be entitled in exchange for those goods or services. In doing so, companies will need to use more judgment and make more estimates than under current guidance and will be required to disclose information about the nature, amount, timing and uncertainty of revenue and cash flows arising from customer contracts, including disclosure of assumptions and estimates where significant judgment has been applied. In August 2015, the FASB issued ASU 2015-14, Revenue from Contracts with Customers (Topic 606): Deferral of the Effective Date, which delayed the effective date of ASU 2014-09 by one year. ASU 2014-09, as amended, is effective using either the retrospective or cumulative-effect transition approach for fiscal years, and for interim periods within those years, beginning after December 15, 2017. Early application is permitted, but not before fiscal years, and interim periods within those years, beginning after December 15, 2016. The Company is currently determining which transition method it will use and is evaluating the potential effect of this ASU on its consolidated financial statements.
Recent Accounting Pronouncements Adopted for the Year Ended December 31, 2015
In September 2015, the FASB issued ASU 2015-16, Business Combinations (Topic 805): Simplifying the Accounting for Measurement-Period Adjustments (“ASU 2015-16”). ASU 2015-16 eliminates the requirement to retrospectively account for adjustments to provisional amounts within the measurement period recognized at the acquisition date in a business combination. ASU 2015-16 requires that these adjustments be recognized in the reporting period in which the adjustment amounts are determined and be calculated as if the accounting had been completed as of the acquisition date. ASU 2015-16 is effective prospectively for fiscal years, and for interim periods within those years, beginning after December 15, 2015. Early application is permitted. The Company adopted this ASU in the fourth quarter of 2015. The adoption of ASU 2015-16 did not have a material effect on the Company’s consolidated financial statements.
In April 2014, the FASB issued ASU 2014-08, Presentation of Financial Statements (Topic 205) and Property, Plant, and Equipment (Topic 360): Reporting Discontinued Operations and Disclosures of Disposals of Components of an Entity (“ASU 2014-08”). ASU 2014-08 changes the requirements for reporting discontinued operations and requires additional disclosures about discontinued operations. Only disposals of components of an entity representing a strategic shift that has, or will have, a major effect on an entity’s operations and financial results should be reported as discontinued operations under ASU 2014-08. Examples include a disposal of a major geographical area, a major line of business, or a major equity method investment. ASU 2014-08 also requires expanded disclosure about discontinued operations and requires disclosure about individually significant dispositions that do not qualify as a discontinued operation. ASU 2014-08 is effective prospectively for fiscal years, and for interim periods within those years, beginning after December 15, 2014. The adoption of this ASU as of January 1, 2015 did not have an effect on the Company’s consolidated financial statements, but could impact whether future disposals of operations would qualify as discontinued operations.
Recent Accounting Pronouncements To Be Adopted in 2016
In April 2015, the FASB issued ASU 2015-05, Intangibles - Goodwill and Other - Internal-Use Software (Subtopic 350-40): Customer’s Accounting for Fees Paid in a Cloud Computing Arrangement. ASU 2015-05 provides guidance for determining whether a cloud computing arrangement includes a software license and requires that all software licenses within the scope of Subtopic 350-40 be accounted for in a manner consistent with other licenses of intangible assets. ASU 2015-05, for which early application is permitted, is effective for fiscal years, and for interim periods within those fiscal years, beginning after December 15, 2015, with retrospective application permitted for all relevant prior periods. This ASU, which the Company adopted as of January 1, 2016, is not expected to have a material effect on the Company’s consolidated financial statements.
In April 2015, the FASB issued ASU 2015-03, Interest - Imputation of Interest (Subtopic 835-30): Simplifying the Presentation of Debt Issuance Costs (“ASU 2015-03”). ASU 2015-03 requires that debt issuance costs related to a recognized debt liability be presented as a direct deduction from the carrying amount of the debt, consistent with debt discounts. ASU 2015-03 is effective for fiscal years, and for interim periods within those fiscal years, beginning after December 15, 2015. Early application is permitted. Retrospective application is required for all relevant prior periods. In August 2015, the FASB issued ASU 2015-15, Interest - Imputation of Interest (Subtopic 835-30): Presentation and Subsequent Measurement of Debt Issuance Costs Associated with Line-of-Credit Arrangements - Amendments to SEC Paragraphs Pursuant to Staff Announcement at June 18, 2015 EITF Meeting (SEC Update) (“ASU 2015-15”). ASU 2015-15 clarifies that, subsequent to adoption of ASU 2015-03, an entity has the option to defer and present debt issuance costs from line-of-credit arrangements as an asset and subsequently amortize the costs ratably over the term of the line-of-credit arrangement, regardless of whether there are any outstanding borrowings on the line-of-credit arrangement. The Company adopted these ASUs as of January 1, 2016. See Deferred Financing Costs discussion above for related balances as of December 31, 2015 and 2014.
In February 2015, the FASB issued ASU 2015-02, Consolidation (Topic 810): Amendments to the Consolidation Analysis (“ASU 2015-02”). ASU 2015-02 changes the evaluation that a reporting entity must perform to determine whether it should consolidate certain types of legal entities,
61
reduces the number of consolidation models and places emphasis on risk of loss when determining a controlling financial interest. Under ASU 2015-02, all entities are within the scope of Accounting Standards Codification (“ASC”) Subtopic 810, Consolidation, including limited partnerships and similar legal entities, unless a scope exception applies. The presumption that a general partner controls a limited partnership has been eliminated. In addition, fees paid to decision makers that meet certain conditions no longer cause consolidation of VIEs in certain instances. The amendments place more emphasis on variable interests other than fee arrangements and reduce the extent to which related party arrangements cause an entity to be considered a primary beneficiary. ASU 2015-02 is effective for fiscal years, and for interim periods within those fiscal years, beginning after December 15, 2015. Early application is permitted. This ASU, which the Company adopted as of January 1, 2016, is not expected to have a material effect on the Company’s consolidated financial statements.
In January 2015, the FASB issued ASU 2015-01, Income Statement - Extraordinary and Unusual Items (Subtopic 225-20): Simplifying Income Statement Presentation by Eliminating the Concept of Extraordinary Items (“ASU 2015-01”). ASU 2015-01 eliminates the presentation and disclosure requirements of extraordinary items because it was unclear when an item should be considered both unusual and infrequent and was extremely rare in practice. ASU 2015-01 is effective for fiscal years, and for interim periods within those fiscal years, beginning after December 15, 2015. This ASU, which the Company adopted as of January 1, 2016, is not expected to have an effect on the Company’s consolidated financial statements.
In November 2014, the FASB issued ASU 2014-16, Derivatives and Hedging (Topic 815): Determining Whether the Host Contract in a Hybrid Financial Instrument Issued in the Form of a Share is More Akin to Debt or to Equity (a consensus of the FASB Emerging Issues Task Force) (“ASU 2014-16”). The amendments in ASU 2014-16 do not change the current criteria in U.S. GAAP for determining when separation of certain embedded derivative features in a hybrid financial instrument is required. Rather, ASU 2014-16 clarifies how current U.S. GAAP should be interpreted in evaluating the economic characteristics and risks of a host contract in a hybrid financial instrument that is issued in the form of a share. ASU 2014-16 is effective for existing hybrid financial instruments issued in the form of a share on a modified retrospective basis for fiscal years, and for interim periods within those years, beginning after December 15, 2015. This ASU, which the Company adopted as of January 1, 2016, is not expected to have an effect on the Company’s consolidated financial statements.
Note 2 – Earnings Per Share
Basic earnings or loss per share is computed by dividing net income or loss available to MasTec’s common shareholders by the weighted average number of common shares outstanding for the period. Diluted earnings per share is computed by dividing net income available to MasTec’s common shareholders by the number of fully diluted shares, which includes the effect of dilutive potential issuances of common shares as determined using income from continuing operations, including the potential issuance of common shares upon the exercise, conversion or vesting of outstanding stock options and unvested restricted shares, as calculated under the treasury stock method, as well as shares associated with the Company’s convertible debt securities, which matured and were converted in 2014. If the Company reports a loss, rather than income, from continuing operations, the computation of diluted loss per share excludes dilutive common stock equivalents as their effect would be anti-dilutive. For the year ended December 31, 2015, the Company reported a net loss from continuing operations, which resulted in the exclusion of 563,803 weighted average dilutive common shares from the calculation of diluted net loss per share for the related period.
Except for the shares mentioned above, there were no anti-dilutive common stock equivalents excluded from the calculation of diluted earnings per share for the year ended December 31, 2015. For the year ended December 31, 2014, there were 244,623 weighted average anti-dilutive common stock equivalents excluded from the calculation of diluted earnings per share because their effect would have been anti-dilutive. For the year ended December 31, 2013, there were no anti-dilutive common stock equivalents.
The following table provides details underlying the Company’s earnings per share calculations for the periods indicated (in thousands):
For the Years Ended December 31, | |||||||||||
2015 | 2014 | 2013 | |||||||||
Net (loss) income attributable to MasTec: | |||||||||||
Net (loss) income, continuing operations - basic (a) | $ | (79,110 | ) | $ | 122,375 | $ | 147,492 | ||||
Interest expense, net of tax, convertible notes | — | 181 | 315 | ||||||||
Net (loss) income, continuing operations - diluted | $ | (79,110 | ) | $ | 122,556 | $ | 147,807 | ||||
Net loss from discontinued operations - basic and diluted (a) | — | (6,452 | ) | (6,542 | ) | ||||||
Net (loss) income attributable to MasTec - diluted | $ | (79,110 | ) | $ | 116,104 | $ | 141,265 | ||||
Weighted average shares outstanding: | |||||||||||
Weighted average shares outstanding - basic | 80,489 | 79,953 | 76,923 | ||||||||
Dilutive common stock equivalents | — | 813 | 777 | ||||||||
Dilutive shares, convertible notes | — | 5,430 | 7,201 | ||||||||
Weighted average shares outstanding - diluted | 80,489 | 86,196 | 84,901 | ||||||||
(a) | Calculated as total net (loss) income less amounts attributable to non-controlling interests. |
62
Convertible Notes - Diluted Share Impact
In June 2014, $115 million aggregate principal amount of 4.0% senior convertible notes (the “4.0% Convertible Notes”) matured, at which time the holders elected to convert the notes. Upon conversion, the Company paid $105 million in cash and issued 4.2 million shares of common stock in respect thereof. Additionally, in December 2014, $100 million aggregate principal amount of 4.25% senior convertible notes (the “4.25% Convertible Notes”, and, collectively with the 4.0% Convertible Notes, the “Convertible Notes”) matured and were converted, and, upon conversion, the Company paid $97 million in cash and issued 2.4 million shares of common stock in respect of such notes.
Until their maturity in 2014, dilutive shares associated with the convertible notes issued in 2009, aggregating $13 million in principal amount, were attributable to the underlying principal amounts and were reflected in the calculation of weighted average diluted earnings per share for the corresponding periods by application of the “if-converted” method, whereas dilutive shares associated with the convertible notes issued in 2011 (the "2011 Convertible Notes"), aggregating $202 million in principal amount, were derived from the premium value of such convertible notes in excess of their principal amounts, as calculated using the treasury stock method. These shares were referred to as the “premium shares.” The 4.25% Convertible Notes were convertible at $15.48 per share and the 4.0% Convertible Notes were convertible at $15.76 per share.
For the year ended December 31, 2014, there were 5.0 million equivalent premium shares included in the Company’s dilutive share calculation related to the 2011 Convertible Notes, as calculated based on the conversion shares of approximately 13.0 million related thereto and the average price per share of the Company's common stock from the beginning of the year through their respective dates of maturity. For the year ended December 31, 2013, there were approximately 6.4 million equivalent premium shares included in the Company’s dilutive share calculation related to the 2011 Convertible Notes.
Note 3 – Acquisitions
The Company acquired several businesses during 2014 and 2013, as discussed below. During the measurement period, as defined under U.S. GAAP, preliminary estimates of the fair values of net assets acquired may be revised if new information is obtained about the facts and circumstances existing as of the date of acquisition, or for purchase price adjustments, based on the final net assets and net working capital of the acquired business, as prescribed in the applicable purchase agreement. Such adjustments may result in the recognition of, or adjust the fair values of, acquired assets and assumed liabilities, and are presented in the accompanying tables as if the adjustments had been taken into account as of the date of acquisition. As of December 31, 2015, all such measurement period adjustments had been determined and were final. Changes to preliminary estimates of the fair values of net assets acquired that do not qualify as measurement period adjustments are included in current period results. As discussed in Note 1 - Business, Basis of Presentation and Significant Accounting Policies, ASU 2015-16 eliminated the requirement to retrospectively account for measurement period adjustments in the consolidated financial statements. The Company adopted ASU 2015-16 in the fourth quarter of 2015. Certain measurement period adjustments for the WesTower acquisition are reflected in the table accompanying the WesTower discussion below.
2014 Acquisitions
WesTower
Effective October 1, 2014, MasTec acquired all of the issued and outstanding equity interests of WesTower Communications Inc. (“WesTower”), a telecommunications services firm that focuses on construction and maintenance of communications infrastructure for wireless networks throughout the Eastern, Central and Western United States. The acquisition of WesTower has expanded the Company’s geographical presence, market penetration and skilled employee base within its existing wireless operations. WesTower is reported within the Company’s Communications segment.
The following table summarizes the estimated fair values, as adjusted, of consideration paid and identifiable assets acquired and liabilities assumed for WesTower as of the date of acquisition (in millions):
Acquisition consideration: | October 1, 2014 | ||
Cash | $ | 198.0 | |
Identifiable assets acquired and liabilities assumed: | |||
Accounts receivable | $ | 179.8 | |
Other current assets, including $18.0 million of cash acquired | 66.6 | ||
Property, equipment and other long-term assets | 9.3 | ||
Finite-lived intangible assets | 42.6 | ||
Billings in excess of costs and earnings | (33.3 | ) | |
Other current liabilities, including current portion of capital lease obligations | (87.7 | ) | |
Long-term liabilities, including capital lease obligations | (26.4 | ) | |
Total identifiable net assets | $ | 150.9 | |
Goodwill | $ | 47.1 | |
Total net assets acquired, including goodwill | $ | 198.0 | |
The fair values and weighted average useful lives of WesTower’s acquired finite-lived intangible assets were assigned as follows:
63
Fair Value (in millions) | Weighted Average Useful Life (in years) | ||||
Finite-lived intangible assets: | |||||
Backlog | $ | 4.7 | 5 | ||
Trade name | 1.1 | 4 | |||
Non-compete agreements | 0.3 | 4 | |||
Customer relationships | 36.5 | 18 | |||
Total acquired finite-lived intangible assets | $ | 42.6 | 16 | ||
Finite-lived intangible assets are amortized in a manner consistent with the pattern in which the related benefits are expected to be consumed. Goodwill arising from the acquisition represents the estimated value of WesTower’s geographic presence in key high growth markets, its assembled workforce and synergies expected to be achieved from the combined operations of WesTower and MasTec. The goodwill balance is not tax deductible.
In connection with the WesTower acquisition, the Company incurred acquisition integration costs of approximately $17.8 million and $5.3 million for the years ended December 31, 2015 and 2014, which were included within general and administrative expenses within the consolidated statements of operations. These acquisition integration costs consisted primarily of employee termination costs, including employee compensation relating to the elimination of certain positions that were determined to be redundant, and other integration-type costs, including facility consolidation expenses, system migration expenses and training costs. As of December 31, 2015, the Company had completed the integration of WesTower. As of December 31, 2015 and 2014, acquisition integration costs totaling $1.5 million and $3.5 million, respectively, were included within current liabilities in the consolidated balance sheets. Liabilities assumed in connection with the WesTower acquisition in the table above include the estimated value of certain off-market contracts, which are recognized in revenue over the terms of the related contracts.
Subsequent to the acquisition date, in connection with the ongoing review of the acquired net working capital and acquired net assets of WesTower, the Company recorded increases of $15.7 million and $5.3 million, respectively, to other current assets and long-term liabilities, and a decrease of $7.8 million to other long-term assets, related to deferred taxes. The changes to the deferred tax amounts, as well as other immaterial adjustments, net, to the acquisition date values of accounts receivable, property and equipment and other current liabilities, resulted in a $3.6 million decrease in the acquisition date value of goodwill associated with the WesTower acquisition, which adjusted balances are reflected in the table above.
Pacer
Effective June 1, 2014, MasTec acquired all of the issued and outstanding equity interests of Pacer Construction Holdings Corporation and its affiliated operating companies (collectively, “Pacer”). Pacer is a western Canadian civil construction services company, headquartered in Calgary, Alberta, Canada. Pacer’s services include infrastructure construction primarily in support of oil and gas production, processing, mining and transportation. Pacer, a leading contractor in the Canadian oil sands market, is expected to enhance MasTec’s ability to develop energy infrastructure in western Canada and take advantage of associated opportunities in North America over the coming years. Pacer is primarily reported within the Company’s Oil and Gas segment, while Pacer’s proportionate share of its undivided interest in its proportionately consolidated non-controlled contractual joint venture is reported within the Other segment.
The following table summarizes the estimated fair values, as adjusted, of consideration paid and identifiable assets acquired and liabilities assumed for Pacer as of the date of acquisition (in millions). Net of cash acquired, substantially all of the current assets acquired consist of accounts receivable.
Acquisition consideration: | June 1, 2014 | ||
Cash | $ | 126.5 | |
Fair value of contingent consideration (earn-out liability) | 24.3 | ||
Total consideration transferred | $ | 150.8 | |
Identifiable assets acquired and liabilities assumed: | |||
Current assets, including $3.4 million of cash acquired | $ | 114.0 | |
Property and equipment | 81.2 | ||
Pre-qualifications | 38.7 | ||
Finite-lived intangible assets | 19.4 | ||
Current liabilities, including current portion of capital lease obligations and long-term debt | (71.8 | ) | |
Net equity method investment obligations | (31.0 | ) | |
Long-term debt, including capital lease obligations | (69.6 | ) | |
Deferred income taxes | (30.5 | ) | |
Total identifiable net assets | $ | 50.4 | |
Goodwill | $ | 100.4 | |
Total net assets acquired, including goodwill | $ | 150.8 | |
64
The values of certain of the assets acquired and liabilities assumed include the proportionate values of Pacer’s proportionately consolidated non-controlled contractual joint venture, which is involved in a civil construction project. Pacer’s undivided interest in this contractual joint venture automatically terminates upon completion of the project, which is not controlled by Pacer and is managed by a third party. This project, which was over 50% complete as of December 31, 2015, incurred losses for the year ended December 31, 2015 due to delayed receipt of a key material. Pacer’s proportionate share of these losses totaling $16.3 million for the year ended December 31, 2015, are included in the Other segment. Pacer has minimal direct involvement in the remaining work on this project. For the years ended December 31, 2015 and 2014, revenue recognized by Pacer in connection with work performed for this contractual joint venture totaled $2.1 million and $1.7 million, respectively. As of December 31, 2015 and 2014, receivables from this contractual joint venture, including acquired receivables, totaled $1.2 million and $1.8 million, respectively. Performance guarantees associated with this contractual joint venture as of December 31, 2015 and 2014 totaled Canadian $132.1 million (or approximately $95.4 million and $113.6 million, respectively), based on the full contract value of the project, for which Pacer is obligated on a joint and several basis with its joint venture partner. In addition, from time to time, the Company may provide financing to this contractual joint venture. For the year ended December 31, 2015, Pacer provided $8.2 million of financing to this contractual joint venture under financing arrangements, and no such payments were made for the year ended December 31, 2014. As of December 31, 2015, there were no additional amounts committed by Pacer to this contractual joint venture under such financing arrangements.
The equity method investment obligations identified in the table above relate to acquired interests in entities that provide construction services. Subsequent to the acquisition of Pacer, and in connection with the ongoing review of the related acquired net assets, the Company determined that the initial fair value assigned to these investments was in excess of their fair value and that it would cease participation in their operations upon completion of the existing projects. The Company recorded a $49 million reduction to the acquisition date value of Pacer’s equity method investments to reflect their expected fair values as determined based on their expected net cash outflows, including the wind-down of these investments. Prior to entering into the receiverships discussed below, Pacer provided $10.2 million and $23.0 million of financing to these equity investees during the years ended December 31, 2015 and December 31, 2014, respectively. For the years ended December 31, 2015 and 2014, revenue recognized by Pacer on behalf of these entities totaled $2.9 million and $3.1 million, respectively, of which $1.4 million was outstanding as of December 31, 2015. There were no outstanding receivables as of December 31, 2014. Performance guarantees associated with these entities totaled approximately $61.2 million as of December 31, 2014, based on the full contract value of certain projects, for which Pacer was obligated on a joint and several basis with its other shareholders. As of December 31, 2015, all jobs related to these performance guarantees had been completed and the Company believes any remaining exposure to be insignificant. There are no other financial guarantees associated with, or remaining amounts committed to, these entities as of December 31, 2015. While the Company believes the obligations and guarantees associated with these entities represent variable interests, Pacer does not have the power to control the primary activities of, nor is the primary beneficiary of, these investments.
In March 2015, Pacer became the secured creditor of one of its equity method investees by purchasing the outstanding revolving credit facility of this investee for approximately $20.8 million in order to satisfy its obligations pursuant to a financial guarantee to the investee’s lender. This payment is included within Pacer’s net equity method investment obligations as of the date of acquisition. Subsequent to Pacer’s purchase of the outstanding credit facility, a receivership order was granted to assist with the orderly wind-down of the investee’s operations. As part of the receivership proceedings, Pacer provided $38.3 million of financing to the receiver, of which $12.8 million has been repaid as of December 31, 2015. The remaining balance is recorded within other current assets in the consolidated balance sheet as of December 31, 2015. Pacer does not expect to advance additional amounts to the receiver, and believes that it will be repaid the remaining amounts advanced under the receivership within the next twelve months. In September 2015, a separate equity method investee of Pacer entered into a receivership arrangement to facilitate the wind-down of its operations. As of December 31, 2015, there was an immaterial amount of remaining net assets related to this investee.
Subsequent to the acquisition date, in connection with the ongoing review of the acquired net working capital and net assets of Pacer, the Company recorded an $8.4 million increase in property and equipment, a $5.6 million increase in certain current liabilities and a $1.2 million increase in long-term deferred tax liabilities. These adjustments, along with the adjustments to the equity method investment obligations discussed above, as well as other immaterial adjustments, net, to the acquisition date values of certain current assets and intangible assets, resulted in a $47.5 million increase in the acquisition date value of goodwill associated with the Pacer acquisition, which adjustments are reflected in the table above.
The fair values and weighted average useful lives of Pacer’s acquired finite-lived intangible assets, as adjusted, were assigned as follows:
Fair Value (in millions) | Weighted Average Useful Life (in years) | ||||
Finite-lived intangible assets: | |||||
Backlog | $ | 6.1 | 3 | ||
Non-compete agreements | 2.3 | 9 | |||
Customer relationships | 11.0 | 8 | |||
Total acquired finite-lived intangible assets | $ | 19.4 | 6 | ||
Finite-lived intangible assets are amortized in a manner consistent with the pattern in which the related benefits are expected to be consumed. The intangible asset related to Pacer’s pre-qualifications with selected customer companies was assigned an indefinite life as the pre-qualifications are not expected to expire or diminish in value, and the companies to which they relate have extremely long operating histories. Goodwill arising from the acquisition represents the estimated value of Pacer’s geographic presence in key high-growth Canadian markets, its assembled workforce, its management team’s industry-specific project management expertise and synergies expected to be achieved from the combined operations of Pacer and MasTec. The goodwill balance is not tax deductible. In the fourth quarter of 2015, the Company recorded a $78.6 million impairment of Pacer’s goodwill and indefinite-lived intangible assets. See Note 4 - Goodwill and Other Intangible Assets for additional details.
65
The contingent consideration included in the table above equals 25% of the excess, if any, of Pacer’s expected earnings from continuing operations before interest, taxes, depreciation and amortization (“EBITDA”) above certain thresholds for a five-year period, as set forth in the purchase agreement, and is payable annually in Canadian dollars. The fair value of the earn-out liability was estimated using an income approach and incorporated significant inputs not observable in the market. Key assumptions in the estimated valuation included the discount rate and probability-weighted EBITDA projections. The range of potential undiscounted payments was estimated to be between Canadian $0 and $71 million, or approximately $0 and $52 million as of December 31, 2015. As is customary for purchase agreements in the industry, the earn-out agreement contains certain right of offset provisions, under which the Company may, under certain circumstances, offset against the earn-out liability working capital adjustments, indemnification claims and similar items owed from the former owners of the entity.
Other 2014 Acquisitions
Effective April 1, 2014, MasTec acquired 100% of a telecommunications services firm, specializing in the installation of in-home security systems. Additionally, effective January 1, 2014, MasTec acquired 100% of a telecommunications services firm, specializing in the engineering, installation, furnishing and integration of telecommunications equipment. The aggregate purchase price for these acquisitions, which are included in MasTec’s Communications segment, was approximately $40.7 million, including cash and earn-out obligations, as adjusted, as of December 31, 2015.
2013 Acquisitions
Big Country
Effective May 1, 2013, MasTec acquired 100% of Big Country Energy Services, Inc. and its affiliated operating companies (collectively, “Big Country”), a North American oil and gas pipeline and facility construction services company, headquartered in Calgary, Alberta, Canada, for an aggregate purchase price composed of approximately $103.5 million in cash, and a five year earn-out, valued at $9.0 million as of December 31, 2015. As is customary for purchase agreements in the industry, the earn-out agreement contains certain right of offset provisions, under which the Company may, under certain circumstances, offset against the earn-out liability working capital adjustments, indemnification claims and similar items owed from the former owners of the entity. Big Country, which is reported within the Company’s Oil and Gas segment, provides services including the construction of oil, natural gas and natural gas liquids gathering systems and pipelines, pipeline modification and replacement services; compressor and pumping station construction; and other related services.
Other 2013 Acquisitions
Effective April 1, 2013, MasTec acquired a former subcontractor to its wireless business, which provides self-perform communications tower construction, installation, maintenance and other services in support of telecommunications infrastructure construction in the Company’s Communications segment. In addition, effective August 1, 2013, MasTec acquired an electrical transmission services company, which focuses primarily on substation construction activities within the Company’s Electrical Transmission segment.
Unaudited Supplemental Pro Forma Information
The following unaudited supplemental pro forma financial information includes the results of operations of each of the companies acquired in 2014 and 2013 and is presented as if each acquired company had been consolidated as of the beginning of the year immediately preceding the year in which the company was acquired. The unaudited supplemental pro forma financial information has been provided for illustrative purposes only and does not purport to be indicative of the actual results that would have been achieved by the combined companies for the periods presented, or of the results that may be achieved by the combined companies in the future. Future results may vary significantly from the results reflected in the following unaudited supplemental pro forma financial information because of future events and transactions, as well as other factors, many of which are beyond MasTec’s control.
The unaudited supplemental pro forma financial information presented below has been prepared by adjusting the historical results of MasTec to include the historical results of the acquired businesses described above, and was then adjusted (i) to remove acquisition costs, including certain acquisition integration costs; (ii) to increase amortization expense resulting from the incremental intangible assets acquired; (iii) to increase interest expense as a result of the cash consideration paid; (iv) to remove integration-related employee redundancy costs; and (v) to reduce interest expense from debt repaid upon acquisition of the respective businesses. The unaudited supplemental pro forma financial information does not include adjustments to reflect the impact of other cost savings or synergies that may result from these acquisitions.
For the Years Ended December 31, | |||||||
Unaudited supplemental pro forma financial information (in millions): | 2014 | 2013 | |||||
Revenue | $ | 5,085.2 | $ | 5,465.9 | |||
Net income from continuing operations | $ | 130.3 | $ | 160.8 | |||
66
Results of Businesses Acquired
Revenue and net (loss) income from continuing operations resulting from the year-over-year incremental impact of acquired businesses, which are included within the Company’s consolidated results of operations for the years indicated, were as follows (in millions):
For the Years Ended December 31, | |||||||||||
Actual of acquirees (year-over-year impact): | 2015 | 2014 | 2013 | ||||||||
Revenue | $ | 301.5 | $ | 565.4 | $ | 406.6 | |||||
Net (loss) income from continuing operations (a) | $ | (13.4 | ) | $ | 0.7 | $ | 20.0 | ||||
(a) | Acquiree net (loss) income from continuing operations for the years ended December 31, 2015 and 2014 includes approximately $9.3 million and $5.0 million, respectively, of pre-tax acquisition integration costs incurred in connection with the WesTower acquisition and, for the year ended December 31, 2015, includes project losses of $16.3 million associated with the Company’s proportionate interest in a non-controlled Canadian joint venture. Other acquisition-related costs, including certain acquisition integration costs totaling $11.2 million, $2.7 million and $1.9 million for the years ended December 31, 2015, 2014 and 2013, respectively, which are included within general and administrative expenses in the Company’s consolidated statements of operations, are not included in the above presented acquiree results for the respective periods. The above results also do not include interest expense associated with consideration paid for these acquisitions. |
Note 4 - Goodwill and Other Intangible Assets
During the fourth quarter of 2015, a pre-tax non-cash goodwill impairment charge of $68.5 million and a pre-tax non-cash indefinite-lived intangible asset impairment charge of $10.1 million were recorded related to a reporting unit with significant revenue concentration in western Canada. Continued volatility in oil and gas prices during 2015 and in the beginning of 2016 has negatively impacted financial performance, expectations and future cash flow projections for this entity. See Note 1 - Business, Basis of Presentation and Significant Accounting Policies for additional discussion.
The following table provides a reconciliation of changes in goodwill by reportable segment for the periods indicated (in millions):
Communications | Oil and Gas | Electrical Transmission | Power Generation and Industrial | Total Goodwill | |||||||||||||||
Balance, goodwill, as of December 31, 2013 | $ | 326.8 | $ | 307.7 | $ | 149.9 | $ | 117.6 | $ | 902.0 | |||||||||
Additions from new business combinations | 84.4 | 100.4 | — | — | 184.8 | ||||||||||||||
Accruals of acquisition-related contingent consideration, net (a) | 6.5 | — | — | — | 6.5 | ||||||||||||||
Currency translation adjustments | — | (10.8 | ) | — | — | (10.8 | ) | ||||||||||||
Balance, goodwill, as of December 31, 2014 | $ | 417.7 | $ | 397.3 | $ | 149.9 | $ | 117.6 | $ | 1,082.5 | |||||||||
Accruals of acquisition-related contingent consideration, net (a) | 0.8 | — | — | — | 0.8 | ||||||||||||||
Currency translation adjustments | — | (22.7 | ) | — | — | (22.7 | ) | ||||||||||||
Measurement period adjustments (b) | (3.6 | ) | — | — | — | (3.6 | ) | ||||||||||||
Goodwill impairment | — | (68.5 | ) | — | — | (68.5 | ) | ||||||||||||
Balance, goodwill, as of December 31, 2015 | $ | 414.9 | $ | 306.1 | $ | 149.9 | $ | 117.6 | $ | 988.5 | |||||||||
Balance, accumulated impairment losses, goodwill, as of December 31, 2015 | $ | — | $ | (68.5 | ) | $ | — | $ | — | $ | (68.5 | ) | |||||||
(a) | Represents contingent consideration for acquisitions prior to January 1, 2009, which is accrued as earned, in accordance with U.S. GAAP. |
(b) | Represent adjustments to preliminary estimates of the fair values of net assets acquired within the measurement period. See Note 3 - Acquisitions for discussion of ASU 2015-16, which was adopted in the fourth quarter of 2015. |
The following table provides a reconciliation of changes in other intangible assets for the periods indicated (in millions):
67
Other Intangible Assets | |||||||||||||||||||
Non-amortizing | Amortizing | ||||||||||||||||||
Trade Names | Pre-Qualifications | Customer Relationships and Backlog | Other (a) | Total | |||||||||||||||
Other intangible assets, gross carrying amount as of December 31, 2013 | $ | 34.8 | $ | 59.4 | $ | 128.4 | $ | 22.5 | $ | 245.1 | |||||||||
Accumulated amortization | (67.7 | ) | (11.8 | ) | (79.5 | ) | |||||||||||||
Other intangible assets, net, as of December 31, 2013 | $ | 34.8 | $ | 59.4 | $ | 60.7 | $ | 10.7 | $ | 165.6 | |||||||||
Additions from new business combinations | — | 38.7 | 73.4 | 4.2 | 116.3 | ||||||||||||||
Amortization expense | (23.2 | ) | (1.9 | ) | (25.1 | ) | |||||||||||||
Currency translation adjustments | — | (4.8 | ) | (1.4 | ) | (0.2 | ) | (6.4 | ) | ||||||||||
Other intangible assets, net, as of December 31, 2014 | $ | 34.8 | $ | 93.3 | $ | 109.5 | $ | 12.8 | $ | 250.4 | |||||||||
Amortization expense | (26.5 | ) | (1.9 | ) | (28.4 | ) | |||||||||||||
Currency translation adjustments | — | (9.8 | ) | (2.2 | ) | (0.5 | ) | (12.5 | ) | ||||||||||
Intangible asset impairment | — | (10.1 | ) | — | — | (10.1 | ) | ||||||||||||
Other intangible assets, net, as of December 31, 2015 | $ | 34.8 | $ | 73.4 | $ | 80.8 | $ | 10.4 | $ | 199.4 | |||||||||
Remaining weighted average amortization period (in years) | 11 | 11 | 11 | ||||||||||||||||
(a) | Consists principally of trade names and non-compete agreements. |
Amortization expense associated with intangible assets for the years ended December 31, 2015, 2014 and 2013 totaled $28.4 million, $25.1 million and $21.2 million, respectively. Expected future amortization expense associated with amortizing intangible assets as of December 31, 2015 is summarized in the following table (in millions):
Amortization Expense | |||
2016 | $ | 20.9 | |
2017 | 16.3 | ||
2018 | 12.7 | ||
2019 | 8.5 | ||
2020 | 7.3 | ||
Thereafter | 25.5 | ||
Total | $ | 91.2 | |
Note 5 - Fair Value of Financial Instruments
Assets and Liabilities Measured at Fair Value on a Recurring Basis
As of December 31, 2015 and 2014, financial instruments required to be measured at fair value on a recurring basis consisted primarily of acquisition-related contingent consideration liabilities, which represent the estimated fair value of additional future earn-outs payable for acquisitions of businesses (“ASC 805 contingent consideration”), in accordance with U.S. GAAP. The fair value of ASC 805 contingent consideration is based on management estimates and entity-specific assumptions, which are Level 3 inputs, and is evaluated on an ongoing basis. As of December 31, 2015 and 2014, the fair value of the Company’s ASC 805 contingent consideration totaled $58.4 million and $146.1 million, respectively.
There were no additions to ASC 805 contingent consideration from new business combinations for the year ended December 31, 2015. Additions to ASC 805 contingent consideration from new business combinations for the years ended December 31, 2014 and 2013 totaled $33.6 million and $32.5 million, respectively. The Company paid approximately $40.5 million, $48.4 million and $8.5 million of ASC 805 contingent consideration for the years December 31, 2015, 2014 and 2013, respectively. For the year ended December 31, 2015, the Company recognized a net reduction of $39.2 million of ASC 805 contingent consideration in the Oil and Gas, Electrical Transmission and Communications segments, of which $20.1 million related to finalization of earn-out arrangements and adjustments to the expected future earn-out obligations of certain other acquisitions based on the expected future performance of the acquisitions for the earn-out period and was recorded within other income, net, in the consolidated statements of operations. The remaining reduction of $19.1 million was offset with a corresponding receivable amount.
Foreign currency translation gains associated with ASC 805 contingent consideration, which are included within other comprehensive income, totaled $8.0 million, $4.5 million and $2.2 million for the years ended December 31, 2015, 2014 and 2013, respectively.
Assets and Liabilities Measured at Fair Value on a Non-Recurring Basis
68
Assets and liabilities recognized or disclosed at fair value on a non-recurring basis, for which remeasurement occurs in the event of an impairment or other measurement event, if applicable, include items such as cost and equity method investments, life insurance assets, long-lived assets, goodwill, other intangible assets and liabilities, including off-market contracts and debt. In the fourth quarter of 2015, the Company recorded a goodwill and intangible asset impairment. For additional details, see Note 1 - Business, Basis of Presentation and Significant Accounting Policies.
As of both December 31, 2015 and 2014, the carrying amount of the Company’s 4.875% Senior Notes totaled $400 million. As of December 31, 2015 and 2014, the estimated fair value of the 4.875% Senior Notes, based on quoted market prices in active markets, a Level 1 input, totaled $344.0 million and $375.0 million, respectively.
Cost and Equity Method Investments. The aggregate carrying value of the Company’s cost and equity method investment assets totaled approximately $16.7 million and $17.7 million as of December 31, 2015 and 2014, respectively. In addition, as of December 31, 2014, the Company had approximately $32.4 million recorded within other current liabilities relating to one of its equity method investments, as discussed in Note 3 - Acquisitions. Included in the Company’s cost and equity method investments are: (i) a $15 million cost investment in Cross Country Pipeline Supply, Inc. (“CCP”), which is a related party, as discussed in Note 16 - Related Party Transactions; (ii) two joint ventures acquired in connection with the Company’s acquisition of Pacer, as described in Note 3 - Acquisitions and; (iii) the Company’s equity interests in Trans-Pecos Pipeline, LLC (“TPP”) and Comanche Trail Pipeline, LLC (“CTP,” and together with TPP, the “Waha JVs”).
In June 2015, MasTec acquired 33% equity interests in the Waha JVs for an aggregate initial investment of $6 million and commitments of future equity contributions and/or loan guarantees of up to an additional $78 million. The joint ventures were formed to design, build, own and operate a header system and two pipelines that will transport natural gas. A subsidiary of MasTec will construct the pipelines, with construction expected to commence in 2016. Each pipeline is planned to interconnect at the United States/Mexico border with pipelines currently under development and construction in Mexico. In the fourth quarter of 2015, TPP and CTP entered into separate non-recourse financing facilities, which are each secured by pledges of the equity interests in the respective entities, as well as a first lien security interest over virtually all of TPP’s and CTP’s assets. To moderate exposure to interest rate fluctuations on the financing facilities, TPP and CTP each entered into interest rate swaps. Until TPP and CTP obtain the required regulatory approval for the projects, the swaps are guaranteed by TPP and CTP’s equity investors, including MasTec, for their proportionate share of any potential losses associated with early termination of the swaps. The Company is also subject to its proportionate share of any recognized unrealized fair market value gains or losses from fluctuations in interest rates associated with these swaps. For the year ended December 31, 2015, the Company’s proportionate share of unrealized fair market value losses on these interest rate swaps was approximately $4 million, which was reflected within other long-term liabilities in the consolidated balance sheets.
The Company made equity contributions of approximately $56 million, inclusive of the initial $6 million, to these joint ventures in 2015, which were repaid to the Company in the fourth quarter of 2015 through borrowings under the financing facilities. As required by the financing facilities, MasTec issued letters of credit as collateral for its equity commitments to the joint ventures totaling $78 million (the “Equity LC Amount”). Until TPP and CTP obtain the required regulatory approval for the projects, borrowings under the financing facilities must be guaranteed or collateralized by TPP and CTP’s equity investors, including MasTec, for their proportionate share of the borrowings. Accordingly, to collateralize its share of the borrowings, MasTec increased the face amount of the letters of credit by $8 million to $86 million as of December 31, 2015, and in the first quarter of 2016, by another $45 million to $131 million. The Company expects the face amount of the letters of credit to be reduced in the first half of 2016 after obtaining the required regulatory approval for the projects, leaving only the Equity LC Amount outstanding.
The fair values of the Company’s cost and equity method investments are not readily available. The Company is not aware of events or changes in circumstances that would have a significant adverse effect on the carrying values of its cost and/or equity method investments as of December 31, 2015 or 2014.
Note 6 - Accounts Receivable, Net of Allowance
The following table provides details of accounts receivable, net of allowance, as of the dates indicated (in millions):
December 31, | |||||||
2015 | 2014 | ||||||
Contract billings | $ | 437.3 | $ | 669.7 | |||
Retainage | 148.8 | 162.2 | |||||
Costs and earnings in excess of billings | 332.7 | 485.6 | |||||
Accounts receivable, gross | $ | 918.8 | $ | 1,317.5 | |||
Less allowance for doubtful accounts | (7.7 | ) | (13.9 | ) | |||
Accounts receivable, net | $ | 911.1 | $ | 1,303.6 | |||
Retainage, which has been billed, but is not due until completion of performance and acceptance by customers, is generally expected to be collected within one year. Receivables expected to be collected beyond one year are recorded within other long-term assets.
Activity in the allowance for doubtful accounts for the periods indicated is as follows (in millions):
69
For the Years Ended December 31, | |||||||
2015 | 2014 | ||||||
Allowance for doubtful accounts at beginning of year | $ | 13.9 | $ | 15.7 | |||
Provision for doubtful accounts | 2.1 | 1.8 | |||||
Amounts charged against the allowance | (8.3 | ) | (3.6 | ) | |||
Allowance for doubtful accounts at end of year | $ | 7.7 | $ | 13.9 | |||
The provision for doubtful accounts for the year ended December 31, 2014 included a reversal of $0.5 million to eliminate a reserve that was not required and should have been reversed in a prior year. Based on materiality considerations, this item was recognized in 2014.
During 2014, the Company entered into a non-recourse financing arrangement, under which certain receivables are purchased by a customer’s bank for a nominal fee. This arrangement improved the collection cycle time of the related receivables, the effect of which amounted to an improvement in cash collections of approximately $12 million and $70 million for the years ended December 31, 2015 and 2014, respectively. Cash collected from this arrangement is reflected within cash provided by operating activities in the consolidated statements of cash flows. The discount charge, which is included within interest expense in the consolidated statements of operations, totaled $1.6 million for the year ended December 31, 2015. For year ended December 31, 2014 the discount charge was immaterial.
Note 7 - Property and Equipment, Net
The following table provides details of property and equipment, net, including property and equipment held under capital leases as of the dates indicated (in millions):
December 31, | |||||||||
2015 | 2014 | Estimated Useful Lives (in years) | |||||||
Land | $ | 4.6 | $ | 4.6 | |||||
Buildings and leasehold improvements | 21.7 | 19.9 | 3-40 | ||||||
Machinery and equipment | 912.9 | 926.1 | 2-20 | ||||||
Office furniture and equipment | 136.9 | 126.1 | 3-7 | ||||||
Construction in progress | 10.8 | 12.0 | |||||||
Total property and equipment | $ | 1,086.9 | $ | 1,088.7 | |||||
Less accumulated depreciation and amortization | (528.2 | ) | (465.6 | ) | |||||
Property and equipment, net | $ | 558.7 | $ | 623.1 | |||||
The gross amount of capitalized internal-use software, which is included within office furniture and equipment, totaled $101.4 million and $92.7 million as of December 31, 2015 and 2014, respectively. Capitalized internal-use software, net of accumulated amortization, totaled $33.4 million and $33.6 million as of December 31, 2015 and 2014, respectively. Depreciation and amortization expense associated with property and equipment for the years ended December 31, 2015, 2014 and 2013 totaled $141.3 million, $129.4 million and $119.7 million, respectively.
Note 8 - Debt
The following table provides details of the carrying values of debt as of the dates indicated (in millions):
December 31, | ||||||||||
Description | Maturity Date | 2015 | 2014 | |||||||
Senior secured credit facility: | ||||||||||
Revolving loans | October 29, 2018 | $ | 208.5 | $ | 282.7 | |||||
Term loan | November 21, 2019 | 250.0 | 250.0 | |||||||
4.875% Senior Notes | March 15, 2023 | 400.0 | 400.0 | |||||||
Other credit facilities | Varies | 16.4 | 1.2 | |||||||
Capital lease obligations, weighted average interest rate of 2.8% | In installments through June 13, 2021 | 130.9 | 176.5 | |||||||
Notes payable, equipment, weighted average interest rate of 2.7% | In installments through June 30, 2018 | 17.4 | 24.4 | |||||||
Total debt | $ | 1,023.2 | $ | 1,134.8 | ||||||
Less current maturities | (77.7 | ) | (73.6 | ) | ||||||
Long-term debt | $ | 945.5 | $ | 1,061.2 | ||||||
70
Senior Secured Credit Facility
The Company’s senior secured credit facility, as amended to date, referred to as the Credit Facility, has aggregate borrowing commitments totaling $1.25 billion, which is composed of $1.0 billion of revolving commitments and a term loan in the aggregate principal amount of $250 million (the “Term Loan”). The Credit Facility provides the ability to borrow in either Mexican pesos or Canadian dollars, up to an aggregate equivalent amount of $200 million. Revolving commitments under the Credit Facility mature on October 29, 2018, and the Term Loan matures on November 21, 2019. The Term Loan is subject to amortization in quarterly principal installments of $3.1 million, subject to reduction as a result of the application of certain prepayments in accordance with the terms of the Credit Facility, commencing as of the quarter ending March 31, 2016. The maximum amount available for letters of credit under the Credit Facility is $450 million, of which up to $100 million can be denominated in either Mexican pesos or Canadian dollars. The Credit Facility also provides for swing line loans of up to $75 million. Under the Credit Facility, the Company has the option to increase revolving commitments and/or establish additional term loan tranches in an aggregate amount of $250 million, subject to certain conditions. Borrowings under the Credit Facility are used for working capital requirements, capital expenditures and other corporate purposes, including equity, joint venture or other investments, the repurchase or prepayment of indebtedness and share repurchases. Approximately $1.5 million, $2.5 million and $1.9 million of financing costs were incurred during the years ended December 31, 2015, 2014 and 2013, respectively, in connection with the Credit Facility. Total deferred financing costs associated with the Credit Facility, including the Term Loan, totaled $6.4 million and $6.9 million, net of accumulated amortization, as of December 31, 2015 and 2014, respectively.
As of December 31, 2015 and 2014, outstanding revolving loans under the Credit Facility accrued interest at weighted average rates of approximately 2.95% and 2.18% per annum, respectively, and the Term Loan accrued interest at a rate of 2.42% and 1.92% as of December 31, 2015 and 2014, respectively. Letters of credit of approximately $292.8 million and $153.6 million were issued as of December 31, 2015 and 2014, respectively. As of December 31, 2015 and 2014, letter of credit fees accrued at 1% and 0.875% per annum, respectively, for performance standby letters of credit and at 2% and 1.75% per annum, respectively, for financial standby letters of credit. Outstanding letters of credit mature at various dates and most have automatic renewal provisions, subject to prior notice of cancellation. As of December 31, 2015 and 2014, borrowing capacity of $498.7 million and $563.7 million, respectively, was available for revolving loans, or up to $157.2 million and $296.4 million, respectively, for new letters of credit. The unused facility fee was 0.40% and 0.35% as of December 31, 2015 and 2014, respectively.
Under an “accordion” feature of the Credit Facility, the Company has the option, subject to certain conditions, to increase revolving commitments and/or establish additional term loan tranches in an aggregate amount of $250 million. These additional term loan tranches may, subject to certain terms and conditions described in the Credit Facility, rank equal or junior in respect of right of payment and/or collateral to the Credit Facility and may, subject to certain limitations described in the Credit Facility, have terms and pricing that differ from the Credit Facility.
Outstanding revolving loans and the Term Loan under the Credit Facility bear interest, at the Company’s option, at a rate equal to either (a) a Eurocurrency Rate, as defined in the Credit Facility, plus a margin of 1.00% to 2.00% or (b) a Base Rate, plus a margin of 0.00% to 1.00%. The Base Rate equals the highest of (i) the Federal Funds Rate, as defined in the Credit Facility, plus 0.50%, (ii) Bank of America’s prime rate and (iii) the Eurocurrency Rate plus 1.00%. Financial standby letters of credit and commercial letters of credit issued under the Credit Facility are subject to a letter of credit fee of 1.00% to 2.00%, and performance standby letters of credit are subject to a letter of credit fee of 0.50% to 1.00%. The Company must also pay a commitment fee to the lenders of 0.20% to 0.40% on any unused availability under the Credit Facility. In each of the foregoing cases, the applicable margin or fee is based on the Company’s Consolidated Leverage Ratio, as defined in the Credit Facility, as of the then most recent fiscal quarter.
The Credit Facility provides for a maximum Consolidated Leverage Ratio, as defined in the Credit Facility, of up to (i) 4.25 until September 29, 2016, (ii) 4.00 during the period commencing on September 30, 2016 and ending on December 30, 2016, and (iii) 3.50 thereafter (subject to the Acquisition Adjustment described below). The Credit Facility also requires that the Company maintain a minimum Consolidated Interest Coverage Ratio, as defined in the Credit Facility, of 3.00. The Credit Facility provides that, for purposes of calculating the Consolidated Leverage Ratio, certain cash charges may be added back to the calculation of Consolidated EBITDA, as defined in the Credit Facility, and funded indebtedness excludes the undrawn standby performance letters of credit. Additionally, notwithstanding the terms discussed above, subject to certain conditions, if a permitted acquisition or series of permitted acquisitions having consideration exceeding $50 million occurs during a fiscal quarter, the Consolidated Leverage Ratio may be temporarily increased to up to 3.75 during such fiscal quarter and the subsequent two fiscal quarters (the “Acquisition Adjustment”). Such right may be exercised no more than two times during the term of the Credit Facility.
Subject to customary exceptions, the Credit Facility limits the borrowers’ and the Guarantor Subsidiaries’ ability to engage in certain activities, including acquisitions, mergers and consolidations, debt incurrence, investments, capital expenditures, asset sales, debt prepayments, lien incurrence and the making of distributions or repurchases of capital stock. However, distributions payable solely in capital stock are permitted. The Credit Facility provides for customary events of default and carries cross-default provisions with the Company’s other significant debt instruments, including the Company’s indemnity agreement with its surety provider, as well as customary remedies, including the acceleration of repayment of outstanding amounts and other remedies with respect to the collateral securing the Credit Facility obligations.
The Credit Facility is guaranteed by certain subsidiaries of the Company (the “Guarantor Subsidiaries”) and the obligations under the Credit Facility are secured by substantially all of the Company’s and the Guarantor Subsidiaries’ respective assets, subject to certain exceptions. Under the Credit Facility, if the “Loan Party EBITDA,” as defined in the Credit Facility, as of the last four consecutive fiscal quarters does not represent at least 70% of the “Adjusted Consolidated EBITDA,” as defined in the Credit Facility, for such period, then the Company must designate additional subsidiaries as Guarantor Subsidiaries, and cause them to join the applicable guaranty and security agreements to the Credit Facility. Additionally, any domestic subsidiary with consolidated EBITDA of at least 15% of the Adjusted Consolidated EBITDA must become a Guarantor Subsidiary and join the applicable guaranty and security agreements.
Other Credit Facilities. The Company has other credit facilities that support the working capital requirements of its foreign operations. Borrowings under these credit facilities, which have varying dates of maturity and are generally renewed on an annual basis, are primarily denominated
71
in Canadian dollars. Maximum borrowing capacity totaled Canadian $40.0 million and $45.0 million as of December 31, 2015 and 2014, respectively, or approximately $28.9 million and $38.7 million, respectively. Outstanding borrowings totaled approximately $16.4 million and $1.2 million as of December 31, 2015 and 2014, respectively, and accrued interest at weighted average rates of 3.6% and 4.0%, respectively. Outstanding borrowings that are not renewed are repaid with borrowings under the Credit Facility. Accordingly, the carrying amounts of the Company’s borrowings under its other credit facilities are classified within long-term debt in the Company’s consolidated balance sheets. The Company’s other credit facilities are subject to customary provisions and covenants.
4.875% Senior Notes and 7.625% Senior Notes
The Company has $400 million of 4.875% Senior Notes due March 15, 2023, which were issued in March 2013 in a registered public offering. Interest on the 4.875% Senior Notes is payable on March 15 and September 15 of each year. The 4.875% Senior Notes are senior unsecured unsubordinated obligations and rank equal in right of payment with existing and future unsubordinated debt, and rank senior in right of payment to existing and future subordinated debt and are fully and unconditionally guaranteed on an unsecured, unsubordinated, joint and several basis by certain of the Company’s existing and future 100%-owned direct and indirect domestic subsidiaries that are each guarantors of the Credit Facility or other outstanding indebtedness. See Note 18 - Supplemental Guarantor Condensed Consolidating Financial Information. The 4.875% Senior Notes are effectively junior to MasTec’s secured debt, including the Credit Facility and the Term Loan, to the extent of the value of the assets securing that debt.
The Company has the option to redeem all or a portion of the 4.875% Senior Notes at any time on or after March 15, 2018 at the redemption prices set forth in the indenture that governs the 4.875% Senior Notes (the “4.875% Senior Notes Indenture”) plus accrued and unpaid interest, if any, to the redemption date. At any time prior to March 15, 2018, the Company may redeem all or a part of the 4.875% Senior Notes at a redemption price equal to 100% of the principal amount of 4.875% Senior Notes redeemed plus an applicable premium, as defined in the 4.875% Senior Notes Indenture, together with accrued and unpaid interest, if any, to the redemption date. In addition, at any time prior to March 15, 2016, the Company may redeem up to 35% of the principal amount of the 4.875% Senior Notes using the net cash proceeds of one or more sales of the Company’s capital stock, as defined in the 4.875% Senior Notes Indenture, at a redemption price of 104.875% of the principal amount, plus accrued and unpaid interest to the redemption date.
The 4.875% Senior Notes Indenture, among other things, generally limits the ability of the Company and certain of its subsidiaries, subject to certain exceptions, to (i) incur additional debt and issue preferred stock, (ii) create liens, (iii) pay dividends, acquire shares of capital stock, make payments on subordinated debt or make investments, (iv) place limitations on distributions from certain subsidiaries, (v) issue guarantees, (vi) issue or sell the capital stock of certain subsidiaries, (vii) sell assets, (viii) enter into transactions with affiliates and (ix) effect mergers. The 4.875% Senior Notes Indenture provides for customary events of default, as well as customary remedies upon an event of default, as defined in the 4.875% Senior Notes Indenture, including acceleration of repayment of outstanding amounts. In connection with the delayed filings of certain of the Company’s SEC reports in 2015, the Company paid consent and solicitation agent fees of $0.9 million and $0.8 million, respectively, related to consents that extended the reporting deadlines of the 4.875% Senior Notes. The consent and solicitation agent fees were recorded within deferred financing costs and interest expense, respectively.
In connection with the issuance of the 4.875% Senior Notes in 2013, approximately $7.7 million in financing costs were paid. Total deferred financing costs related to the 4.875% Senior Notes, net of accumulated amortization, were $6.4 million and $6.3 million, as of December 31, 2015 and 2014, respectively. These deferred financing costs are included as prepaid expenses and other current assets and other long-term assets, as appropriate, within the consolidated balance sheets. The Company used a portion of the proceeds from the 4.875% Senior Notes offering to fund the repurchase and redemption of the Company’s $150 million principal amount of the Company’s 7.625% senior notes due 2017 (the “7.625% Senior Notes”). The remaining net proceeds were used for working capital and other general corporate purposes.
In connection with the issuance of the 4.875% Senior Notes, the Company repurchased approximately $121.1 million of its 7.625% Senior Notes on March 18, 2013 in a tender offer at a price of 102.792% of the principal amount, which included an early tender payment of $30.00 per $1,000 principal amount of notes tendered. The holders of the tendered 7.625% Senior Notes also received accrued interest from the most recent interest payment date to, but not including, the date of repurchase. In addition, on March 29, 2013, the Company redeemed the remaining outstanding $28.9 million aggregate principal amount of the 7.625% Senior Notes in accordance with their terms at a price of 102.542% of the principal amount plus accrued interest from the most recent interest payment date to, but not including, the date of redemption. A pre-tax debt extinguishment loss of $5.6 million was recognized during the year ended December 31, 2013 in connection with the repurchase and redemption of the 7.625% Senior Notes, including $4.1 million of early payment premiums and $1.5 million of unamortized deferred financing costs. This loss was separately disclosed within the consolidated statements of operations.
Senior Convertible Notes
The Company’s 4.25% Convertible Notes matured and were converted in December 2014. The Company paid an aggregate of $97 million in cash and issued an aggregate of 2.4 million shares of its common stock to settle the 4.25% Convertible Notes in accordance with their respective terms. The value of the shares issued to settle the 4.25% Convertible Notes was $41.0 million, based on the closing price of the Company’s common stock on the date the shares were issued. Additionally, the Company’s 4.0% Convertible Notes matured and were converted in June 2014. The Company paid an aggregate of $105 million in cash and issued an aggregate of 4.2 million shares of its common stock to settle the 4.0% Convertible Notes in accordance with their respective terms. The value of the shares issued to settle the 4.0% Convertible Notes was $114.8 million, based on the closing price of the Company’s common stock on the date the shares were issued. The shares issued in settlement of the Convertible Notes were issued from the Company’s treasury stock.
72
Acquisition Debt
In connection with certain acquisitions, the Company has entered into or assumed certain debt and/or capital lease obligations. As of December 31, 2015 and 2014, $9.8 million and $20.2 million, respectively, of acquisition-related debt remained outstanding.
Debt Covenants
MasTec was in compliance with the provisions and covenants contained in its outstanding debt instruments as of December 31, 2015 and 2014.
Contractual Maturities of Debt and Capital Lease Obligations
Contractual maturities of MasTec’s debt and capital lease obligations as of December 31, 2015 were as follows (in millions):
2016 | $ | 77.7 | |
2017 | 60.2 | ||
2018 | 265.6 | ||
2019 | 219.2 | ||
2020 | 0.4 | ||
Thereafter | 400.1 | ||
Total | $ | 1,023.2 | |
Interest Expense, Net
The following table provides details of interest expense, net, for the periods indicated (in millions):
For the Years Ended December 31, | |||||||||||
2015 | 2014 | 2013 | |||||||||
Interest expense: | |||||||||||
Contractual and other interest expense (a) | $ | 45.8 | $ | 43.5 | $ | 37.6 | |||||
Accretion of senior convertible note discount | — | 4.0 | 5.2 | ||||||||
Amortization of deferred financing costs | 2.9 | 3.4 | 4.0 | ||||||||
Total interest expense | $ | 48.7 | $ | 50.9 | $ | 46.8 | |||||
Interest income | (0.6 | ) | (0.1 | ) | (0.4 | ) | |||||
Interest expense, net | $ | 48.1 | $ | 50.8 | $ | 46.4 | |||||
(a) | Contractual and other interest expense for the year ended December 31, 2015 includes $0.8 million of consent solicitation agent fees related to the delay in filing of the Company’s 2014 Form 10-K and its First Quarter 2015 Form 10-Q, as well as $1.6 million of discount fees related to financing arrangements. |
As of December 31, 2015 and 2014, accrued interest payable, which is recorded within other accrued expenses in the consolidated balance sheets, totaled $7.7 million, and $7.4 million, respectively.
Note 9 - Lease Obligations
Capital Leases
MasTec enters into agreements that provide financing for machinery and equipment, which expire on various dates. Leases meeting certain criteria are capitalized, with the related asset recorded in property and equipment and a corresponding amount recorded as a liability. Capital lease additions are reflected in the consolidated statements of cash flows within the supplemental disclosures of non-cash information. The gross amount of assets held under capital leases, which are included within property and equipment, net, in the consolidated balance sheets, totaled $286.3 million and $281.6 million as of December 31, 2015 and 2014, respectively. Assets held under capital leases, net of accumulated depreciation, totaled $193.3 million and $217.8 million as of December 31, 2015 and 2014, respectively.
Operating Leases
In the ordinary course of business, the Company enters into non-cancelable operating leases for certain of its facility, vehicle and equipment needs, including related party leases. See Note 16 - Related Party Transactions. These leases allow the Company to conserve cash and provide flexibility in that the Company pays a monthly rental fee for the use of related facilities, vehicles and equipment rather than purchasing them. The terms of these agreements vary from lease to lease, including some with renewal options and escalation clauses. The Company may decide to cancel or terminate a lease before the end of its term, in which case the Company is typically liable for the remaining lease payments under the term of the lease. For operating leases with purchase options, the option to purchase equipment is at estimated fair market value. Rent expense relating to operating leases that have non-cancelable terms in excess of one year totaled approximately $81.8 million, $71.5 million and $53.3 million for the years ended December 31, 2015, 2014 and 2013, respectively. The Company also incurred expenses relating to facilities, vehicles and equipment having original terms of one year or
73
less of approximately $196.2 million, $191.7 million and $200.1 million for the years ended December 31, 2015, 2014 and 2013, respectively.
Future Lease Commitments
Future minimum lease commitments under capital leases and non-cancelable operating leases, including the effect of escalation clauses in effect as of December 31, 2015, were as follows (in millions):
Capital Leases | Operating Leases | ||||||
2016 | $ | 57.6 | $ | 75.0 | |||
2017 | 45.6 | 51.8 | |||||
2018 | 26.8 | 36.3 | |||||
2019 | 7.6 | 18.3 | |||||
2020 | 0.5 | 9.9 | |||||
Thereafter | 0.1 | 10.0 | |||||
Total minimum lease payments | $ | 138.2 | $ | 201.3 | |||
Less amounts representing interest | (7.3 | ) | |||||
Total capital lease obligations, net of interest | $ | 130.9 | |||||
Less current portion | (54.8 | ) | |||||
Long-term portion of capital lease obligations, net of interest | $ | 76.1 | |||||
Note 10 – Stock-Based Compensation and Other Employee Benefit Plans
The Company has stock-based compensation plans, under which stock options, restricted stock awards and restricted stock units are reserved for issuance. The MasTec, Inc. 2013 Incentive Plan (the “2013 Incentive Plan”) permits a total of approximately 7,391,000 shares of the Company’s common stock to be issued, including approximately 5,291,000 shares that remained available under plans that were terminated upon adoption of the 2013 Incentive Plan. In addition, the Company has certain employee stock purchase plans under which shares of the Company’s common stock are available for purchase by eligible employees. The MasTec, Inc. Bargaining Units Employee Stock Purchase Plan (the “2013 Bargaining Units ESPP”) permits the issuance of up to 1,000,000 new shares of MasTec, Inc. common stock to eligible employees and the MasTec, Inc. 2011 Employee Stock Purchase Plan, as amended in 2015 (together with the 2013 Bargaining Units ESPP, the “ESPPs”) provides for the issuance of up to 2,000,000 shares of MasTec, Inc. common stock for eligible employees, of which 1,000,000 shares became available in January 2016. Under all stock-based compensation plans in effect as of December 31, 2015, there were approximately 4,795,000 shares available for future grant.
Restricted Shares
MasTec grants restricted stock awards and restricted stock units (together “restricted shares”), which are valued based on the closing share price of MasTec common stock on the date of grant. During the restriction period, holders of restricted stock awards are entitled to vote the shares. Total unearned compensation related to restricted shares as of December 31, 2015 was approximately $24.1 million, which is expected to be recognized over a weighted average period of approximately 2 years. The intrinsic value, or fair value, of restricted shares that vested, which is based on the closing share price on the date of vesting, totaled $8.1 million, $17.5 million and $2.2 million, respectively, for the years ended December 31, 2015, 2014 and 2013. During the year ended December 31, 2013, the Company entered into an agreement with the previous owners of EC Source Services, LLC (“EC Source”) to establish an incentive program for its employees and granted 350,000 restricted share awards, all of which vested on December 31, 2014. The former owners of EC Source contributed cash and shares of MasTec common stock to the Company in connection with this program.
Activity, restricted shares: | Restricted Shares | Per Share Weighted Average Grant Date Fair Value | ||||
Non-vested restricted shares, as of December 31, 2013 | 1,123,545 | $ | 23.78 | |||
Granted | 972,754 | 26.88 | ||||
Vested | (659,212 | ) | 25.27 | |||
Canceled/forfeited | (22,442 | ) | 17.38 | |||
Non-vested restricted shares, as of December 31, 2014 | 1,414,645 | $ | 25.32 | |||
Granted | 706,761 | 17.27 | ||||
Vested | (446,874 | ) | 21.24 | |||
Canceled/forfeited | (44,300 | ) | 26.11 | |||
Non-vested restricted shares, as of December 31, 2015 | 1,630,232 | $ | 22.94 | |||
74
Stock Options
The Company has granted options to purchase its common stock to employees and members of the Board of Directors and affiliates under various stock option plans at not less than the fair market value of the underlying stock on the date of grant. All outstanding stock options are fully vested.
Activity, stock options: | Stock Options | Per Share Weighted Average Exercise Price | Weighted Average Remaining Contractual Life (in years) | Aggregate Intrinsic Value(a) (in millions) | ||||||||
Options outstanding and exercisable as of December 31, 2013 | 495,571 | $ | 11.17 | 1.96 | $ | 10.7 | ||||||
Exercised | (210,900 | ) | 9.97 | |||||||||
Canceled/forfeited | — | |||||||||||
Options outstanding and exercisable as of December 31, 2014 | 284,671 | $ | 12.06 | 1.29 | $ | 3.0 | ||||||
Exercised | (81,971 | ) | 9.60 | |||||||||
Canceled/forfeited | — | |||||||||||
Options outstanding and exercisable as of December 31, 2015 | 202,700 | $ | 13.06 | 0.55 | $ | 0.9 | ||||||
(a) | Amount represents the difference between the exercise price and the closing share price of the Company’s common stock on the last trading day of the corresponding period, multiplied by the number of in-the-money options. |
The total intrinsic value of options exercised which is based on the difference between the exercise price and the closing share price of the Company’s common stock as of the date of exercise, totaled $0.8 million, $6.5 million and $10.6 million for the years ended December 31, 2015, 2014 and 2013, respectively. Proceeds from options exercised totaled $0.5 million, $0.8 million and $3.9 million for the years ended December 31, 2015, 2014 and 2013, respectively.
Employee Stock Purchase Plans
The following table provides details pertaining to the Company’s ESPPs for the periods indicated:
For the Years Ended December 31, | |||||||||||
2015 | 2014 | 2013 | |||||||||
Cash proceeds (in millions) | $ | 2.0 | $ | 3.3 | $ | 6.4 | |||||
Common shares issued | 134,389 | 136,918 | 454,523 | ||||||||
Weighted average price per share | $ | 14.67 | $ | 24.33 | $ | 14.19 | |||||
Weighted average per share grant date fair value | $ | 4.22 | $ | 5.81 | $ | 5.60 | |||||
Due to the delay in filing of the Company’s 2014 Form 10-K, contributions to the ESPPs were temporarily suspended in the second quarter of 2015. Contributions resumed in the third quarter of 2015.
Non-Cash Stock-Based Compensation Expense
Details of non-cash stock-based compensation expense and related tax benefits for the periods indicated were as follows (in millions):
For the Years Ended December 31, | |||||||||||
2015 | 2014 | 2013 | |||||||||
Non-cash stock-based compensation expense | $ | 12.4 | $ | 15.9 | $ | 12.9 | |||||
Income Tax Effects: | |||||||||||
Income tax benefit from non-cash stock-based compensation | $ | 4.2 | $ | 8.7 | $ | 9.7 | |||||
Excess tax benefit from non-cash stock-based compensation (a) | $ | 0.1 | $ | 3.7 | $ | 4.3 | |||||
(a) | Excess tax benefits, which represent cash flows from tax deductions in excess of the tax effect of compensation expense associated with exercised stock options and vested restricted shares, are classified as financing cash flows in the Company’s consolidated statements of cash flows. |
401(k) Plan. MasTec has a 401(k) plan covering all eligible employees. Subject to certain dollar limits, eligible employees may contribute up to 75% of their pre-tax annual compensation to the 401(k) plan. The Company’s matching contribution is equal to 100% of the first 3% of the employee’s salary and 50% of the next 2% of the employee’s salary, up to a maximum 4% employer match. Discretionary matching contributions, which are payable 50% in shares of MasTec common stock and 50% in cash, are paid quarterly. During the years ended December 31, 2015, 2014 and 2013, matching contributions totaled approximately $10.2 million, $7.9 million and $5.9 million, respectively.
75
Deferred Compensation Plans. MasTec offers a deferred compensation plan to its highly compensated employees. These employees are allowed to contribute a percentage of their pre-tax annual compensation to the deferred compensation plan. The Company also offers a deferred compensation plan to its Board of Directors, under which directors may elect to defer the receipt of compensation for their services. Total deferred compensation plan assets, which are included within other long-term assets in the consolidated balance sheets, totaled $7.6 million and $6.2 million as of December 31, 2015 and 2014, respectively. Total deferred compensation plan liabilities, which are included within other long-term liabilities in the consolidated balance sheets, totaled $7.4 million and $6.1 million as of December 31, 2015 and 2014, respectively.
Note 11 – Other Retirement Plans
Multiemployer Plans. Certain of MasTec’s subsidiaries, including certain subsidiaries in Canada, are party to various collective bargaining agreements with unions representing certain of their employees. These agreements require the subsidiaries party to the agreements to pay specified wages, provide certain benefits to their union employees and contribute certain amounts to multiemployer pension and other multiemployer benefit plans and trusts. These contributions are recorded as a component of employee wages and salaries within costs of revenue, excluding depreciation and amortization. Contributions are generally based on fixed amounts per hour per employee for employees covered under these plans. Multiemployer plan contribution rates are determined annually and assessed on a “pay-as-you-go” basis based on union employee payrolls. Union payrolls cannot be determined for future periods because the number of union employees employed at any given time, and the plans in which they may participate, vary depending upon the location and number of ongoing projects at a given time and the need for union resources in connection with those projects. The collective bargaining agreements expire at various times and have typically been renegotiated and renewed on terms similar to the ones contained in the expiring agreements.
The Pension Protection Act of 2006, as amended, (the “PPA”) defines the funding rules for defined benefit pension plans and establishes funding classifications for U.S.-registered multiemployer pension plans. In December 2014, the Multiemployer Pension Reform Act of 2014 (the “MPRA”) was enacted to amend and permanently extend the PPA. Under the PPA, plans are classified into one of five categories, based on multiple factors. The amendments that became effective with MPRA include a new “critical and declining” category. The plan classifications, also referred to as a plan’s “zone status,” are: Green (safe), Yellow (endangered), Orange (seriously endangered), and Red (critical or critical and declining). Factors included in the determination of a plan’s zone status include: funded percentage, cash flow position and whether the plan is projecting a minimum funding deficiency.
A multiemployer plan that is so underfunded as to be in “endangered,” “seriously endangered,” “critical,” or “critical and declining” status (as determined under the PPA) is required to adopt a funding improvement plan (“FIP”) or a rehabilitation plan (“RP”), which, among other actions, could include decreased benefits and increased employer contributions, which could take the form of a surcharge on benefit contributions. These actions are intended to improve their funding status over a period of years. If a pension fund is in critical status, a participating employer must pay an automatic surcharge in addition to contributions otherwise required under the collective bargaining agreement (“CBA”). With some exceptions, the surcharge is equal to 5% of required contributions for the initial critical year and 10% for each succeeding plan year in which the plan remains in critical status. The surcharge ceases on the effective date of a CBA (or other agreement) that includes contribution and benefit terms consistent with the rehabilitation plan. Certain plans in which the Company participates are in “endangered,” “seriously endangered,”, “critical”, or “critical and declining” status. The amount of additional funds, if any, that the Company may be obligated to contribute to these plans in the future cannot be estimated due to the uncertainty of the future levels of work that could be required of the union employees covered by these plans, as well as the required future contribution rates and possible surcharges applicable to these plans.
Management evaluates the Company’s participation in the multiemployer pension plans in which it participates on an ongoing basis. In November 2014, the Company, along with other members of the Pipe Line Contractors Association (“PLCA”), voluntarily terminated its participation in several defined benefit multiemployer pension plans that were in critical status in order to mitigate potential future liability in connection with these plans, for which there was no withdrawal liability assessed by the plan administrators as of the date the Company terminated its participation. Although the Company does not believe that it has any material liability associated with its termination of participation in these plans, there can be no assurance that these plans, which were in critical status as of the date the Company terminated its participation, will not assess penalties in the future. Additionally, in November 2011, the Company, along with other members of the PLCA, voluntarily withdrew from the Central States Southeast and Southwest Areas Pension Fund (“Central States”), a defined benefit multiemployer pension plan that was in critical status, and a $6.4 million withdrawal liability was established based on an estimate provided by the Central States administrator as of the date of withdrawal. The Company began paying installments towards this withdrawal liability in 2013, of which $3.0 million and $4.2 million was outstanding as of December 31, 2015 and 2014, respectively, which is included within other current and other long-term liabilities, as appropriate, in the consolidated balance sheets. See Note 15 - Commitments and Contingencies for additional information.
Details of significant multiemployer pension plans as of and for the periods indicated, based upon information available to the Company from plan administrators as well as publicly available information on the U.S. Department of Labor website, are provided in the following table:
76
Contributions (in millions) For the Years Ended December 31, | Pension Protection Act Zone Status | |||||||||||||||||||||
Multiemployer Pension Plan | Employer Identification Number | Plan Number | 2015 | 2014 | 2013 | Expiration Date of CBA | 2015 | As of | 2014 | As of | FIP/RP Status | Surcharge | ||||||||||
Central Pension Fund of the I.U.O.E and Participating Employers | 366052390 | 001 | $ | 5.7 | $ | 6.5 | $ | 10.8 | 06/01/2017 | Green | 01/31/2015 | (a) | Green | 01/31/2014 | (a) | NA | No | |||||
Pipeline Industry Pension Fund | 736146433 | 001 | 2.5 | 4.8 | 9.8 | 06/02/2017 | Green | 12/31/2014 | (b) | Green | 12/31/2013 | (b) | NA | No | ||||||||
International Union of Operating Engineers' Local 132 Pension Fund | 556015364 | 001 | 1.9 | — | 0.4 | 06/01/2017 | Green | 03/31/2015 | Green | 03/31/2014 | NA | No | ||||||||||
West Virginia Laborers' Pension Trust Fund | 556026775 | 001 | 1.4 | 0.4 | 0.5 | 06/01/2017 | Green | 03/31/2015 | Green | 03/31/2014 | NA | No | ||||||||||
National Electrical Benefit Fund | 530181657 | 001 | 1.4 | 1.3 | 1.1 | Varies through 06/02/2018 | Green | 12/31/2014 | Green | 12/31/2013 | NA | No | ||||||||||
Teamsters National Pipe Line Pension Fund | 461102851 | 001 | 1.4 | 1.7 | 2.7 | 06/01/2017 | Green | 12/31/2014 | (b) | Green | 12/31/2013 | (b) | NA | No | ||||||||
Michigan Laborers' Pension Fund | 386233976 | 001 | 0.8 | 2.1 | 4.3 | 06/01/2017 | Yellow | 08/31/2015 | Yellow | 08/31/2014 | (a)(b) | Implemented | No | |||||||||
Laborers' National Pension Fund | 751280827 | 001 | 0.8 | 0.8 | 1.1 | 06/01/2017 | Green | 12/31/2014 | Green | 12/31/2013 | NA | No | ||||||||||
Laborers' District Council of Western Pennsylvania Pension Fund | 256135576 | 001 | 0.5 | 1.5 | 0.4 | 06/01/2017 | Red | 12/31/2014 | Red | 12/31/2013 | Implemented | No | ||||||||||
I.B.E.W. Local 769 Management Pension Plan A | 866049763 | 001 | 0.3 | 1.6 | 0.7 | 07/30/2016 | Green | 06/30/2015 | Green | 06/30/2014 | (b) | NA | No | |||||||||
Eighth District Electrical Pension Fund | 846100393 | 001 | 0.2 | 0.9 | 2.2 | 02/28/2018 | Green | 03/31/2015 | Green | 03/31/2014 | NA | No | ||||||||||
Operating Engineers' Construction Industry and Misc. Pension Fund | 256135579 | 001 | 0.1 | 1.2 | 0.1 | 06/01/2017 | Green | 12/31/2014 | (a) | Green | 12/31/2013 | (a) | NA | No | ||||||||
Operating Engineers' Local 324 Pension Fund | 381900637 | 001 | — | 1.7 | 4.5 | 06/01/2017 | Red | 04/30/2015 | Red | 04/30/2014 | Implemented | No | ||||||||||
Other funds | 6.8 | (c) | 7.4 | (c) | 6.0 | |||||||||||||||||
Total multiemployer pension plan contributions | $ | 23.8 | $ | 31.9 | $ | 44.6 | ||||||||||||||||
(a) | This plan has utilized extended amortization provisions, which provide plans with extensions of time to amortize pension funding shortfalls. |
(b) | The Company’s contributions to this plan represent greater than 5% of the plan’s total contributions. |
(c) | The 2015 and 2014 contributions include approximately $1.4 million and $0.9 million U.S. dollars, respectively, for Canadian multiemployer pension plans associated with the Company’s 2014 acquisition of Pacer, a Canadian company that employs union resources subject to collective bargaining agreements in connection with certain of its project work. Canadian multiemployer pension plans are not subject to the provisions of ERISA or the funding rules under the PPA that apply to U.S. registered multiemployer pension plans. Contributions to Canadian multiemployer pension plans are based on fixed amounts per hour per employee for employees covered under these plans. |
Total contributions to multiemployer plans, and the related number of employees covered by these plans, including with respect to the Company’s Canadian operations for the periods indicated, were as follows:
Multiemployer Plans | |||||||||||||||||
Covered Employees | Contributions (in millions) | ||||||||||||||||
For the Years Ended December 31: | Low | High | Pension | Other Multiemployer | Total | ||||||||||||
2015 | 590 | 2,463 | $ | 23.8 | $ | 9.0 | $ | 32.8 | |||||||||
2014 | 590 | 2,167 | $ | 31.9 | $ | 4.5 | $ | 36.4 | |||||||||
2013 | 778 | 2,734 | $ | 44.6 | $ | 3.6 | $ | 48.2 | |||||||||
The average number of employees covered under multiemployer plans in which the Company participates has decreased in recent years, due to fewer union resource-based projects, which resulted in a decrease in total multiemployer plan contributions. This decrease was partially offset by higher contribution amounts and per employee contribution rates for certain other multiemployer plans as a result of changes in project and plan mix. The number of union employees employed at any given time varies depending upon the location and number of ongoing projects and the need for union resources in connection with those projects.
77
Note 12 – Equity
Share Activity
During the first half of 2015, the Company repurchased 5.2 million shares of its common stock for an aggregate purchase price of $100 million, which completed the share repurchase program authorized by the Company’s Board of Directors in the fourth quarter of 2014. The Company may use either authorized and unissued shares or treasury shares to meet share issuance requirements, including those resulting from the exercise of stock options, vesting of restricted shares and other share issuance requirements. During the year ended December 31, 2014, the Company reissued a total of 6.6 million shares of its treasury stock with a cost basis of $104.4 million in settlement of its senior convertible notes, which matured and were converted in 2014. See Note 8 - Debt.
Subsequent Event
In February 2016, the Company’s Board of Directors authorized a $100 million share repurchase program (the “2016 Share Repurchase Program”). Under the 2016 Share Repurchase Program, the Company may repurchase shares from time to time in open market transactions or in privately-negotiated transactions in accordance with applicable securities laws. The timing and the amount of any repurchases will be determined based on market conditions, legal requirements, cash flow and liquidity needs and other factors. The share repurchase program may be modified or suspended at any time, at the Company’s discretion. Share repurchases, which are recorded at cost and are held in the Company’s treasury, will be funded with available cash or with availability under the Credit Facility.
Comprehensive Income (Loss)
Comprehensive income (loss) is a measure of net income (loss) and other changes in equity that result from transactions other than those with shareholders. Comprehensive income (loss) consists of net income (loss), foreign currency translation adjustments, unrealized gains and losses from available-for-sale securities and net income (loss) attributable to non-controlling interests.
Accumulated Other Comprehensive Loss
Accumulated other comprehensive loss activity for the periods indicated was as follows (in thousands):
For the Years Ended December 31, | ||||||||||||||||||||||||||||||||||||
2015 | 2014 | 2013 | ||||||||||||||||||||||||||||||||||
Unrealized (Losses) Gains | ||||||||||||||||||||||||||||||||||||
Foreign Currency | Other | Total | Foreign Currency | Other | Total | Foreign Currency | Other | Total | ||||||||||||||||||||||||||||
Balance as of January 1 | $ | (28,716 | ) | $ | (5,288 | ) | $ | (34,004 | ) | $ | (7,998 | ) | $ | (5,288 | ) | $ | (13,286 | ) | $ | (105 | ) | $ | (5,396 | ) | $ | (5,501 | ) | |||||||||
Activity before reclassifications, net of tax | (38,347 | ) | — | (38,347 | ) | (20,718 | ) | — | (20,718 | ) | (7,893 | ) | 337 | (7,556 | ) | |||||||||||||||||||||
Reclassifications, net of tax | — | — | — | — | — | — | — | (229 | ) | (229 | ) | |||||||||||||||||||||||||
Activity, net of tax | $ | (38,347 | ) | $ | — | $ | (38,347 | ) | $ | (20,718 | ) | $ | — | $ | (20,718 | ) | $ | (7,893 | ) | $ | 108 | $ | (7,785 | ) | ||||||||||||
Balance as of December 31 | $ | (67,063 | ) | $ | (5,288 | ) | $ | (72,351 | ) | $ | (28,716 | ) | $ | (5,288 | ) | $ | (34,004 | ) | $ | (7,998 | ) | $ | (5,288 | ) | $ | (13,286 | ) | |||||||||
Unrealized foreign currency gains and losses relate primarily to fluctuations in foreign currency exchange rates of the Company’s foreign subsidiaries with a functional currency other than the U.S. dollar. Foreign currency activity is related primarily to the Company’s Canadian operations, including expansion of certain of the Company’s organic business operations into Canada.
Note 13 - Income Taxes
The components of (loss) income from continuing operations before income taxes for the periods indicated were as follows (in millions):
For the Years Ended December 31, | |||||||||||
2015 | 2014 | 2013 | |||||||||
Domestic | $ | (26.5 | ) | $ | 171.4 | $ | 233.4 | ||||
Foreign | (41.2 | ) | 27.0 | 6.8 | |||||||
Total | $ | (67.7 | ) | $ | 198.4 | $ | 240.2 | ||||
The provision for income taxes from continuing operations for the periods indicated were as follows (in millions):
78
For the Years Ended December 31, | |||||||||||
2015 | 2014 | 2013 | |||||||||
Current: | |||||||||||
Federal | $ | (4.5 | ) | $ | 47.3 | $ | 77.0 | ||||
Foreign | 9.4 | 3.9 | 1.7 | ||||||||
State and local | 3.3 | 6.6 | 10.9 | ||||||||
$ | 8.2 | $ | 57.8 | $ | 89.6 | ||||||
Deferred: | |||||||||||
Federal | $ | 25.7 | $ | 14.9 | $ | 0.5 | |||||
Foreign | (19.9 | ) | 2.7 | (1.5 | ) | ||||||
State and local | (2.0 | ) | 1.0 | 3.9 | |||||||
$ | 3.8 | $ | 18.6 | $ | 2.9 | ||||||
Provision for income taxes | $ | 12.0 | $ | 76.4 | $ | 92.5 | |||||
The benefit from income taxes from discontinued operations for the year ended December 31, 2014 totaled $4.3 million.
The tax effects of significant items comprising the Company’s net deferred tax liability as of the dates indicated were as follows (in millions):
December 31, | |||||||
2015 | 2014 | ||||||
Deferred tax assets: | |||||||
Accrued self-insurance | $ | 27.7 | $ | 26.0 | |||
Operating loss carryforwards | 29.9 | 17.8 | |||||
Compensation and benefits | 17.7 | 20.7 | |||||
Bad debt | 3.1 | 5.0 | |||||
Other | 13.1 | 15.9 | |||||
Valuation allowance | (0.3 | ) | (0.2 | ) | |||
Total deferred tax assets | $ | 91.2 | $ | 85.2 | |||
Deferred tax liabilities: | |||||||
Property and equipment | $ | 118.9 | $ | 114.3 | |||
Goodwill | 57.7 | 47.5 | |||||
Other intangible assets | 37.8 | 44.0 | |||||
Gain on remeasurement of equity investee | 11.2 | 11.2 | |||||
Long-term contracts | 18.8 | 28.7 | |||||
Other | 16.4 | 11.3 | |||||
Total deferred tax liabilities | $ | 260.8 | $ | 257.0 | |||
Net deferred tax liabilities | $ | (169.6 | ) | $ | (171.8 | ) | |
Total net current and long-term deferred tax balances included in the Company’s consolidated balance sheets as of the dates indicated were as follows (in millions):
December 31, | |||||||
2015 | 2014 | ||||||
Current deferred tax assets, net | $ | 19.2 | $ | 31.7 | |||
Long-term deferred tax liabilities, net | (188.8 | ) | (203.5 | ) | |||
Net deferred tax liabilities | $ | (169.6 | ) | $ | (171.8 | ) | |
In assessing the ability to realize the deferred tax assets, management considers whether it is more likely than not that some portion or all of the deferred tax assets will not be realized. The ultimate realization of deferred tax assets is dependent upon the generation of future taxable income during the periods in which these temporary differences become deductible. Management considers the projected future taxable income and prudent and feasible tax planning strategies in making this assessment. The Company’s valuation allowances as of December 31, 2015 and 2014 are related primarily to state and foreign net operating loss carryforwards. The Company’s state net operating loss carryforwards, which may be carried forward between 5 and 20 years depending on the jurisdiction, totaled approximately $9.6 million and $5.0 million as of December 31, 2015 and 2014, respectively.
79
The Company’s foreign net operating loss carryforwards, which are primarily related to the Company’s Canadian operations, totaled approximately $16.5 million and $12.8 million as of December 31, 2015 and 2014, respectively. These foreign net operating loss carryforwards begin to expire in 2033. The Company’s federal net operating loss carryforwards, which begin to expire in 2022, totaled $3.8 million as of December 31, 2015, and an immaterial amount as of December 31, 2014.
As of December 31, 2015, the Company has not made a provision for U.S. income taxes on unremitted foreign earnings because such earnings, which generally become subject to U.S. taxation upon remittance of dividends and certain other circumstances, are considered to be insignificant and are intended to be indefinitely reinvested outside the United States. The Company expects that domestic cash resources will be sufficient to fund its domestic operations and cash commitments in the future.
A reconciliation of the U.S. statutory federal income tax rate related to pretax income from continuing operations to the effective tax rate for the periods indicated is as follows:
For the Years Ended December 31, | ||||||||
2015 | 2014 | 2013 | ||||||
U.S. statutory federal rate applied to pretax income | 35.0 | % | 35.0 | % | 35.0 | % | ||
State and local income taxes, net of federal benefit | (1.0 | ) | 3.7 | 4.0 | ||||
Foreign tax rate differential | (14.4 | ) | (1.3 | ) | (0.4 | ) | ||
Non-deductible expenses | (13.5 | ) | 3.4 | 2.4 | ||||
Goodwill and intangible asset impairment | (17.7 | ) | 0.0 | 0.0 | ||||
Change in state tax rate | (3.6 | ) | (0.7 | ) | 1.2 | |||
Domestic production activities deduction | (1.0 | ) | (1.6 | ) | (2.5 | ) | ||
Other | (1.4 | ) | (0.1 | ) | (0.8 | ) | ||
Valuation allowance for deferred tax assets | 0.0 | 0.1 | (0.4 | ) | ||||
Effective income tax rate | (17.6 | )% | 38.5 | % | 38.5 | % | ||
An entity may only recognize or continue to recognize tax positions that meet a “more likely than not” threshold. In the ordinary course of business, there is inherent uncertainty in quantifying income tax positions. The Company assesses its income tax positions and records tax benefits for all years subject to examination based on management’s evaluation of the facts, circumstances and information available at the reporting date. For those tax positions where it is more likely than not that a tax benefit will be sustained, the Company has recognized the largest amount of tax benefit with a greater than 50% likelihood of being realized upon ultimate settlement with a taxing authority that has full knowledge of all relevant information. For those income tax positions where it is not more likely than not that a tax benefit will be sustained, no tax benefit has been recognized in the Company’s financial statements. Management believes that the Company has not taken material tax positions that would be deemed to be “uncertain,” therefore, the Company has not established a liability for uncertain positions for the years ended December 31, 2015 or 2014.
The IRS completed its examinations of the Company’s federal income tax returns for the calendar years 2012 and 2013. As a result, the Company received a refund totaling approximately $3.5 million relating primarily to the timing of certain deductions relating to the Company’s fixed assets. Certain state taxing authorities are examining various years. The final outcome of these examinations is not yet determinable. With few exceptions, as of December 31, 2015, the Company is no longer subject to U.S. federal or state examinations by taxing authorities for years before 2012.
Note 14 - Segments and Related Information
Segment Discussion
MasTec manages its continuing operations under five operating segments, which represent MasTec’s five reportable segments: (1) Communications; (2) Oil and Gas; (3) Electrical Transmission; (4) Power Generation and Industrial and (5) Other. This structure is generally focused on broad end-user markets for MasTec’s labor-based construction services. All five reportable segments derive their revenue from the engineering, installation and maintenance of infrastructure, primarily in North America.
The Communications segment performs engineering, construction and maintenance of communications infrastructure primarily related to wireless and wireline/fiber communications and install-to-the-home customers, and, to a lesser extent, infrastructure for electrical utilities , among others. MasTec performs engineering, construction and maintenance services on oil and natural gas pipelines and processing facilities for the energy and utilities industries through its Oil and Gas segment. The Electrical Transmission segment primarily serves the energy and utility industries through the engineering, construction and maintenance of electrical transmission lines and substations. The Power Generation and Industrial segment primarily serves energy, utility and other end-markets through the installation and construction of conventional and renewable power facilities, related electrical transmission infrastructure, ethanol/biofuel facilities and various types of industrial infrastructure. The Other segment includes a proportionately consolidated non-controlled Canadian joint venture, equity method investments and other small business units that perform construction services in a variety of international end-markets.
The accounting policies of the reportable segments are the same as those described in Note 1 - Business, Basis of Presentation and Significant Accounting Policies. Intercompany revenue and costs among the reportable segments are de minimus and accounted for as if the sales were to third parties because these items are based on negotiated fees between the segments involved. All intercompany transactions and balances are eliminated in
80
consolidation. Intercompany revenue and costs between entities within a reportable segment are eliminated to arrive at segment totals. Eliminations between segments are separately presented. Corporate results include amounts related to Corporate functions such as administrative costs, professional fees, acquisition-related transaction costs (exclusive of acquisition integration costs, which are included within the segment results of the acquired business), and other discrete items, such as goodwill and intangible asset impairment. Segment results include certain allocations of centralized costs such as general liability, medical and workers’ compensation insurance and certain information technology costs. Income tax expense is managed by Corporate on a consolidated basis and is not allocated to the reportable segments.
Earnings before interest, taxes, depreciation and amortization (“EBITDA”) is the measure of profitability used by management to manage its segments and, accordingly, in its segment reporting. As appropriate, the Company supplements the reporting of consolidated financial information determined in accordance with U.S. GAAP with certain non-U.S. GAAP financial measures, including EBITDA. The Company believes these non-U.S. GAAP measures provide meaningful information and help investors understand the Company’s financial results and assess its prospects for future performance. The Company uses EBITDA to evaluate its performance, both internally and versus that of its peers, because it excludes certain items that may not be indicative of the Company’s reportable segment results, as well as items that can vary widely across different industries or among companies within the same industry. Segment EBITDA is calculated in a manner consistent with consolidated EBITDA.
For the year ended December 31, 2015: (i) Communications segment EBITDA included $17.8 million of acquisition integration costs resulting from the WesTower acquisition; (ii) Electrical Transmission segment EBITDA included a $12.2 million charge relating to a court mandated mediation settlement; (iii) Other segment EBITDA included $16.3 million of project losses on a proportionately consolidated non-controlled Canadian joint venture and $4.4 million of recognized unrealized losses on interest rate swaps incurred by our equity method investments in the Waha JVs; (iv) Corporate segment EBITDA included $78.6 million of goodwill and intangible asset impairment and $16.5 million of Audit Committee independent investigation related costs; and (v) Power Generation and Industrial segment EBITDA included $21.4 million of losses on a Canadian wind project. For the year ended December 31, 2014 Communications segment EBITDA included $5.3 million of acquisition integration costs resulting from the WesTower acquisition.
Summarized financial information for MasTec’s reportable segments is presented and reconciled to consolidated financial information for total MasTec in the following tables (in millions):
For the Years Ended December 31, | |||||||||||
Revenue: | 2015 | 2014 | 2013 | ||||||||
Communications (a) | $ | 1,973.2 | $ | 2,041.0 | $ | 1,962.6 | |||||
Oil and Gas | 1,495.1 | 1,731.4 | 1,628.8 | ||||||||
Electrical Transmission | 341.5 | 471.9 | 428.8 | ||||||||
Power Generation and Industrial | 381.6 | 357.0 | 294.3 | ||||||||
Other | 24.1 | 14.7 | 12.3 | ||||||||
Eliminations | (7.2 | ) | (4.2 | ) | (2.0 | ) | |||||
Consolidated revenue | $ | 4,208.3 | $ | 4,611.8 | $ | 4,324.8 | |||||
(a) | Revenue generated primarily by utilities customers represented 10.6%, 6.8% and 6.9% of Communications segment revenue for the years ended December 31, 2015, 2014 and 2013, respectively. |
For the Years Ended December 31, | |||||||||||
EBITDA - Continuing Operations: | 2015 | 2014 | 2013 | ||||||||
Communications | $ | 194.8 | $ | 204.0 | $ | 247.7 | |||||
Oil and Gas (a) | 157.0 | 195.1 | 215.9 | ||||||||
Electrical Transmission | (71.3 | ) | 45.0 | 41.2 | |||||||
Power Generation and Industrial | 8.8 | 14.2 | (16.3 | ) | |||||||
Other (b) | (18.8 | ) | (1.2 | ) | 0.5 | ||||||
Corporate (c) | (120.5 | ) | (53.4 | ) | (61.4 | ) | |||||
Consolidated EBITDA - Continuing operations | $ | 150.0 | $ | 403.7 | $ | 427.6 | |||||
(a) | Oil and Gas EBITDA includes equity in losses from unconsolidated affiliates of $3.6 million and $0.3 million for the years ended December 31, 2015 and 2014, respectively. |
(b) | Other EBITDA includes equity in losses from unconsolidated affiliates of $4.4 million for the year ended December 31, 2015. |
(c) | Corporate EBITDA includes goodwill and intangible asset impairment of $78.6 million for the year ended December 31, 2015. |
81
For the Years Ended December 31, | |||||||||||
Depreciation and Amortization: | 2015 | 2014 | 2013 | ||||||||
Communications | $ | 50.6 | $ | 42.6 | $ | 36.8 | |||||
Oil and Gas | 84.5 | 82.8 | 80.9 | ||||||||
Electrical Transmission | 21.1 | 17.1 | 12.6 | ||||||||
Power Generation and Industrial | 6.6 | 6.4 | 6.7 | ||||||||
Other | 0.1 | — | — | ||||||||
Corporate | 6.8 | 5.6 | 3.9 | ||||||||
Consolidated depreciation and amortization | $ | 169.7 | $ | 154.5 | $ | 140.9 | |||||
As of December 31, | |||||||||||
Assets: | 2015 | 2014 | 2013 (a) | ||||||||
Communications | $ | 1,032.2 | $ | 1,197.4 | $ | 973.5 | |||||
Oil and Gas (b) | 1,131.4 | 1,389.5 | 1,060.8 | ||||||||
Electrical Transmission | 409.1 | 489.5 | 449.3 | ||||||||
Power Generation and Industrial | 252.5 | 340.1 | 324.5 | ||||||||
Other | 34.3 | 24.6 | 22.8 | ||||||||
Corporate | 80.7 | 122.9 | 79.8 | ||||||||
Consolidated segment assets | $ | 2,940.2 | $ | 3,564.0 | $ | 2,910.7 | |||||
(a) | Consolidated total assets were $2,923.2 million as of December 31, 2013, including assets of discontinued operations of $12.5 million. |
(b) | Includes $1.7 million and $2.7 million, net, of investments in equity method investees as of December 31, 2015 and 2014, respectively. |
For the Years Ended December 31, | |||||||||||
Capital Expenditures: | 2015 | 2014 | 2013 | ||||||||
Communications | $ | 25.8 | $ | 23.4 | $ | 25.1 | |||||
Oil and Gas | 38.1 | 44.2 | 67.4 | ||||||||
Electrical Transmission | 13.0 | 25.8 | 17.6 | ||||||||
Power Generation and Industrial | 3.5 | 6.7 | 5.7 | ||||||||
Other | 0.2 | — | — | ||||||||
Corporate | 3.8 | 9.2 | 10.3 | ||||||||
Consolidated capital expenditures | $ | 84.4 | $ | 109.3 | $ | 126.1 | |||||
The following table presents a reconciliation of EBITDA to consolidated (loss) income from continuing operations before income taxes:
For the Years Ended December 31, | |||||||||||
EBITDA Reconciliation: | 2015 | 2014 | 2013 | ||||||||
EBITDA - Continuing operations | $ | 150.0 | $ | 403.7 | $ | 427.6 | |||||
Less: | |||||||||||
Interest expense, net | (48.1 | ) | (50.8 | ) | (46.4 | ) | |||||
Depreciation and amortization | (169.7 | ) | (154.5 | ) | (140.9 | ) | |||||
(Loss) income from continuing operations before income taxes | $ | (67.7 | ) | $ | 198.4 | $ | 240.2 | ||||
Foreign Operations. MasTec operates in North America, primarily in the United States and Canada, as well as in Mexico and in other countries in Latin America. For the years ended December 31, 2015, 2014 and 2013, revenue of $3.6 billion, $3.9 billion and $4.1 billion, respectively, was derived from U.S. operations, and revenue of $574.8 million, $699.9 million and $268.1 million, respectively, was derived from foreign operations, primarily in Canada. The majority of the Company’s foreign operations during the years ended December 31, 2015, 2014 and 2013 were in the Company’s Oil and Gas segment. Long-lived assets held in the U.S. included property and equipment, net, of $464.6 million, $494.1 million and $436.9 million as of December 31, 2015, 2014 and 2013, respectively. Long-lived assets held in foreign countries, primarily in Canada, included property and equipment, net, of $94.1 million, $129.0 million and $51.2 million as of December 31, 2015, 2014 and 2013, respectively. Intangible assets and goodwill, net, of approximately $1.1 billion, $1.1 billion and $1.0 billion as of December 31, 2015, 2014 and 2013, respectively, related to the Company’s U.S. operations. Intangible assets and goodwill, net, of $107.3 million, $227.7 million and $92.9 million as of December 31, 2015, 2014 and 2013, respectively, related to businesses in foreign countries, primarily in Canada. Foreign customers accounted for approximately 17%, 20% and 9% of the Company’s consolidated
82
net accounts receivable position as of December 31, 2015, 2014 and 2013, respectively, which represents accounts receivable, net, less billings in excess of costs and earnings.
Significant Customers
Revenue concentration information for significant customers as a percentage of total consolidated revenue was as follows:
For the Years Ended December 31, | |||||
2015 | 2014 | 2013 | |||
Customer: | |||||
AT&T (including DIRECTV®) (a)(b) | 32% | 33% | 32% | ||
Enbridge, Inc. (c) | 1% | 8% | 18% | ||
(a) | The Company’s relationship with AT&T is based upon multiple separate master service agreements, other service agreements and construction/installation contracts for AT&T’s (i) wireless, (ii) wireline/fiber, (iii) home security and automation businesses, and (iv) for DIRECTV® services, is based upon an agreement to provide installation and maintenance services. Revenue from AT&T is included in the Communications segment. |
(b) | DIRECTV® was acquired by AT&T in July 2015. Revenue from DIRECTV® is presented on a combined basis with AT&T for all periods. |
(c) | The Company's relationship with Enbridge, Inc. is based upon various construction contracts for pipeline activities. Revenue from Enbridge, Inc. is primarily included in the Oil and Gas segment. |
Note 15 - Commitments and Contingencies
In addition to the matters discussed below, MasTec is subject to a variety of legal cases, claims and other disputes that arise from time to time in the ordinary course of its business. MasTec cannot provide assurance that it will be successful in recovering all or any of the potential damages it has claimed or in defending claims against it. The outcome of such cases, claims and disputes, including those set forth below, cannot be predicted with certainty and an unfavorable resolution of one or more of them could have a material adverse effect on the Company’s business, financial condition, results of operations and cash flows.
PPL. In October 2012, PPL Electric Utilities Corporation (“PPL”) and T&D Power, Inc., a MasTec, Inc. subsidiary (“T&D”), entered into a $206 million overhead transmission line construction contract (the “Contract”), pursuant to which T&D agreed to construct an approximately 100 mile transmission line in Pennsylvania. In September 2013, PPL issued a notice terminating the Contract for convenience. T&D then submitted termination invoices to recover certain pre-termination costs, overhead and profit, as well as termination-related demobilization costs, along with the applicable overhead and profit. PPL disputes these invoices. As a result of the dispute, T&D sued PPL in December 2013 in federal court in the Eastern District of Pennsylvania, and pursued claims in excess of $40 million for breach of contract, including PPL’s breach of its implied duty of good faith and fair dealing. After the parties completed discovery, in July 2015, PPL filed a motion for partial summary judgment, which was subsequently denied by the federal court. On October 5, 2015, trial proceedings commenced and during this process, the federal court required the parties to mediate, resulting in a settlement agreement in which the Company was awarded monies that were received in the fourth quarter of 2015. This settlement resulted in a charge of $12.2 million, related to the reduction of receivables associated with this contract. This charge was recorded within other expense of the Electrical Transmission segment in the third quarter of 2015.
SunLight Entities. In 2011, Power Partners MasTec, LLC., a MasTec, Inc. subsidiary (“Power Partners”), entered into engineering, procurement, and construction agreements (the “EPC Agreements”) with special purpose entities, SunLight General Somerset Solar, LLC, SunLight General Morris Solar, LLC and SunLight General Sussex Solar, LLC (collectively, the “SunLight Entities”), respectively, to perform design and construction services for three public solar projects in New Jersey located in Somerset, Morris and Sussex Counties (the “Projects”). Power Partners and the SunLight Entities engaged in three separate arbitration proceedings against each other to address various disputes that existed between the parties regarding the Projects. In August 2014, the arbitration panel rendered awards in Power Partners’ favor in the aggregate amount of approximately $68 million, including fees and expenses. Power Partners also filed a lawsuit in June 2013 in federal court in New Jersey against the Somerset and Morris Authorities (the “Authorities”) and the principals of the SunLight Entities with claims exceeding $60 million as part of its efforts to seek payment of amounts that were also the subject of the arbitration proceedings. In March 2015, the Authorities, the SunLight Entities and principals and Power Partners entered into separate settlement agreements. As part of the settlement, Power Partners received amounts that were substantially equal to the previously recorded amounts, and all of the parties executed mutual releases.
Wrigley v. MasTec, Inc. On May 7, 2015, a putative class action lawsuit (the “Lawsuit”), Wrigley v. MasTec, Inc., et. al. (Case No. 1:15-cv-21740) was filed in the United States District Court, Southern District of Florida, naming the Company, the Company’s Chief Executive Officer, José R. Mas, and the Company’s Chief Financial Officer, George L. Pita, as defendants. On August 5, 2015, co-lead plaintiffs were appointed, and an amended complaint was filed on October 13, 2015. The Lawsuit has been purportedly brought by a shareholder, both individually and on behalf of a putative class of shareholders, alleging violations of the federal securities laws arising from alleged false or misleading statements contained in, or alleged material omissions from, certain of the Company’s filings with the SEC and other statements, in each case with respect to accounting matters that are the subject of the Audit Committee’s independent internal investigation. The amended complaint seeks damages stemming from losses Plaintiffs claim to have suffered as a result of purchasing Company securities at an allegedly inflated market price. On December 14, 2015, the Company filed a motion to dismiss the amended complaint. On February 12, 2016, the Plaintiffs responded to the Company’s motion to dismiss. The District Court also scheduled a two-week trial period beginning on March 20, 2017 pending its ruling on the Company’s motion to dismiss. The Company believes that the Lawsuit is without merit and intends to vigorously defend against it; however, there can be no assurance that the Company will be successful in its defense.
83
Other Commitments and Contingencies
Regulatory Matters. As previously disclosed, the Company self-reported to the staff of the SEC (the “Staff”) regarding the previously disclosed Audit Committee’s independent investigation. On December 2, 2015, the Company was notified by the Staff that it had commenced a formal civil investigation relating to the previously disclosed adjustments to the 2014 financial statements and Audit Committee independent investigation. The Company intends to continue full cooperation with the SEC.
Leases. In the ordinary course of business, the Company enters into non-cancelable operating leases for certain of its facility, vehicle and equipment needs, including related party leases. See Note 9 - Lease Obligations and Note 16 - Related Party Transactions.
Letters of Credit. In the ordinary course of business, the Company is required to post letters of credit for its insurance carriers, surety bond providers and in support of performance under certain contracts as well as certain obligations associated with the Company’s equity method investments. Such letters of credit are generally issued by a bank or similar financial institution. The letter of credit commits the issuer to pay specified amounts to the holder of the letter of credit under certain conditions. If this were to occur, the Company would be required to reimburse the issuer of the letter of credit, which, depending upon the circumstances, could result in a charge to earnings. As of December 31, 2015 and 2014, there were $292.8 million and $153.6 million, respectively, of letters of credit issued under the Company’s Credit Facility. The Company is not aware of material claims relating to outstanding letters of credit as of December 31, 2015 or 2014.
Performance and Payment Bonds. In the ordinary course of business, MasTec is required by certain customers to provide performance and payment bonds for some of the Company’s contractual commitments related to projects in process. These bonds provide a guarantee to the customer that the Company will perform under the terms of a contract and that the Company will pay subcontractors and vendors. If the Company fails to perform under a contract or to pay subcontractors and vendors, the customer may demand that the surety make payments or provide services under the bond. The Company must reimburse the surety for expenses or outlays it incurs. As of December 31, 2015, the estimated cost to complete projects secured by the Company’s $539.3 million in performance and payment bonds was $36.0 million. As of December 31, 2014, the estimated cost to complete projects secured by the Company’s $748.3 million in performance and payment bonds was $60.1 million. These amounts do not include performance and payment bonds associated with the Company’s equity method investments and proportionately consolidated non-controlled Canadian joint venture, which are separately disclosed in Note 3 - Acquisitions.
Investments in Affiliates and Other Entities. The Company holds an undivided interest in a proportionately consolidated non-controlled Canadian contractual joint venture, which is managed by a third party, for the purpose of providing infrastructure construction services for a civil construction project. This joint venture automatically terminates upon completion of the project. Losses incurred by the joint venture are generally shared proportionally by the joint venture members, with members of the joint venture jointly and severally liable for all of the obligations of the joint venture. The joint venture agreement provides that each joint venture partner indemnify the other party for any liabilities incurred by such joint venture in excess of its ratable portion of such liabilities. Thus, it is possible that the Company could be required to pay or perform obligations in excess of its share if the other joint venture partner fails or refuses to pay or perform its share of the obligations. As of December 31, 2015, the Company was not aware of circumstances that would reasonably lead to future claims against it for material amounts.
The Company has other investment arrangements, including equity investments in joint ventures, as discussed in Note 3 - Acquisitions and Note 5 - Fair Value of Financial Instruments. From time to time, the Company may provide financing, performance, financial and/or other guarantees to or on behalf of its unconsolidated affiliates, including its equity method investees and/or proportionately consolidated non-controlled Canadian joint venture.
Self-Insurance. MasTec maintains insurance policies for workers’ compensation, general liability and automobile liability, which are subject to per claim deductibles. The Company also maintains excess umbrella coverage. As of December 31, 2015 and 2014, MasTec’s liability for unpaid claims and associated expenses, including incurred but not reported losses related to these policies, totaled $76.1 million and $70.3 million, respectively, of which $47.5 million and $39.6 million, respectively, were reflected within other long-term liabilities in the consolidated balance sheets. MasTec also maintains an insurance policy with respect to employee group medical claims, which is subject to annual per employee maximum losses. MasTec’s liability for employee group medical claims as of December 31, 2015 and 2014 totaled $1.6 million and $4.4 million, respectively.
The Company is required to post letters of credit and provide cash collateral to certain of its insurance carriers and to provide surety bonds in certain states. Insurance-related letters of credit for the Company’s workers’ compensation, general liability and automobile liability policies amounted to $83.2 million and $75.0 million as of December 31, 2015 and 2014, respectively. In addition, cash collateral deposited with insurance carriers, which is included within other long-term assets in the consolidated balance sheets, amounted to $1.3 million and $1.2 million for these policies as of December 31, 2015 and 2014, respectively. Outstanding surety bonds related to workers’ compensation self-insurance programs amounted to $13.4 million and $13.0 million as of December 31, 2015 and 2014, respectively.
Employment Agreements. The Company has employment agreements with certain executives and other employees, which provide for compensation and certain other benefits and for severance payments under certain circumstances. Certain employment agreements also contain clauses that become effective upon a change in control of the Company. Upon the occurrence of any of the defined events in the various employment agreements, the Company would be obligated to pay certain amounts to the relevant employees, which vary with the level of the employees’ respective responsibility.
Collective Bargaining Agreements and Multiemployer Plans. As discussed in Note 11 - Other Retirement Plans, certain of MasTec’s subsidiaries are party to various collective bargaining agreements with unions representing certain of their employees. The Employee Retirement Income Security Act of 1974, as amended by the Multiemployer Pension Plan Amendments Act of 1980 (collectively, “ERISA”), which governs U.S.-registered multiemployer pension plans, subjects employers to substantial liabilities in the event of the employer’s complete or partial withdrawal from, or upon
84
termination of, such plans. Under current law pertaining to employers that are contributors to U.S.-registered multiemployer defined benefit plans, a plan’s termination, an employer’s voluntary withdrawal from, or the mass withdrawal of contributing employers from, an underfunded multiemployer defined benefit plan requires participating employers to make payments to the plan for their proportionate share of the multiemployer plan’s unfunded vested liabilities. These liabilities include an allocable share of the unfunded vested benefits of the plan for all plan participants, not only for benefits payable to participants of the contributing employer. As a result, participating employers may bear a higher proportion of liability for unfunded vested benefits if the other participating employers cease to contribute to, or withdraw from, the plan. The allocable portion of liability to participating employers could be more disproportionate if employers that have withdrawn from the plan are insolvent, or if they otherwise fail to pay their proportionate share of the withdrawal liability. The Company currently contributes, and in the past has contributed to, plans that are underfunded, and, therefore, could have potential liability associated with a voluntary or involuntary withdrawal from, or termination of, these plans. Other than the Company’s 2011 withdrawal from Central States, as discussed in Note 11 - Other Retirement Plans, the Company does not have plans to withdraw from, and is not aware of related liabilities associated with these plans. However, there can be no assurance that the Company will not be assessed liabilities in the future. The PPA requires that underfunded pension plans improve their funding ratios within prescribed intervals based on their level of underfunding, under which benefit reductions may apply and/or participating employers could be required to make additional contributions. In addition, if a multiemployer defined benefit plan fails to satisfy certain minimum funding requirements, the IRS may impose on the employers contributing to such plan a non-deductible excise tax of 5% of the amount of the accumulated funding deficiency.
Based upon the information available to the Company from plan administrators as of December 31, 2015, several of the multiemployer pension plans in which it participates are underfunded and, as a result, the Company could be required to increase its contributions, including in the form of a surcharge on future benefit contributions. The amount of additional funds the Company may be obligated to contribute in the future cannot be estimated, as these amounts are based on future levels of work of the union employees covered by these plans, investment returns and the level of underfunding of such plans. As discussed in Note 11 - Other Retirement Plans, in November 2014, the Company, along with other members of the PLCA, voluntarily terminated its participation in several defined benefit multiemployer pension plans. Additionally, in November 2011, the Company, along with other members of the PLCA, voluntarily withdrew from Central States. Subsequent to the Company’s withdrawal in 2011, Central States asserted that the PLCA members did not effectively withdraw in 2011. In September 2015, the withdrawal date dispute was resolved in the PLCA’s favor by the U.S. Court of Appeals for the Seventh Circuit in a decision finding that the PLCA members lawfully and effectively withdrew from Central States by and through their actions in 2011. Based on current discussions with Central States, the plan will be providing the PLCA members with updated withdrawal liability information, taking into consideration payments to date. The Company does not expect a material impact to the recorded withdrawal liability, however there can be no assurance as to the final amount as determined by the plan administrator.
Indemnities. The Company generally indemnifies its customers for the services it provides under its contracts, as well as other specified liabilities, which may subject the Company to indemnity claims, liabilities and related litigation. As of December 31, 2015 and 2014, the Company was not aware of material asserted or unasserted claims in connection with these indemnity obligations.
Other Guarantees. In the ordinary course of its business, from time to time, MasTec guarantees the obligations of its subsidiaries, including obligations under certain contracts with customers, certain lease obligations and in some states, obligations in connection with obtaining contractors’ licenses. MasTec has also issued performance and other guarantees in connection with its undivided interest in a proportionately consolidated non-controlled Canadian joint venture and certain of its equity investees. See Note 3 - Acquisitions and Note 5 - Fair Value of Financial Instruments for discussion of certain of the Company’s equity method investees and other investment arrangements, including related guarantees. MasTec also generally warrants the work it performs for a one to two-year period following substantial completion of a project. Much of the work performed by the Company is evaluated for defects shortly after the work is completed. MasTec has not historically accrued reserves for potential warranty claims as they have not been material. However, if warranty claims occur, the Company could be required to repair or replace warrantied items, or, if customers elect to repair or replace the warrantied item using the services of another provider, the Company could be required to pay for the cost of the repair or replacement.
Concentrations of Risk. The Company is subject to certain risk factors, including, but not limited to: risks related to fluctuations in the market price of oil and/or natural gas; changes in customers’ capital spending plans; the nature of its contracts, which do not obligate MasTec’s customers to undertake any infrastructure projects and may be canceled on short notice; customer consolidation; seasonality; adverse weather conditions; fluctuations in geographic or other operational factors; economic downturns; technological, legislative and/or regulatory changes affecting the Company’s businesses; competition; exposure related to foreign operations; collectibility of receivables; exposure from system or information technology interruptions; acquisition integration and financing; recoverability of goodwill; availability of qualified employees; exposure to litigation; exposure to multiemployer pension plan liabilities; and potential exposure to environmental liabilities. The Company grants credit, generally without collateral, to its customers. Consequently, the Company is subject to potential credit risk related to changes in business and economic factors. However, MasTec generally has certain lien rights on that work and maintains a diverse customer base. The Company believes its billing and collection policies are adequate to minimize potential credit risk. MasTec’s customers include public and private energy providers, pipeline operators, wireless service providers, satellite and broadband operators, local and long distance carriers and government entities. The industries served by MasTec’s customers include, among others: communications (including wireless, wireline/fiber and satellite communications) and utilities (including petroleum and natural gas pipeline infrastructure; electrical utility transmission and distribution; power generation; and industrial infrastructure). In the third quarter of 2015, DIRECTV® was acquired by AT&T. Revenue from DIRECTV® is presented on a combined basis with AT&T for all periods presented. Giving retroactive effect to the acquisition of DIRECTV® by AT&T, the Company had approximately 530 customers for the year ended December 31, 2015. As of December 31, 2015 one customer accounted for approximately 12% of the Company’s consolidated net accounts receivable position, which represents accounts receivable, net, less billings in excess of costs and earnings, and, as of December 31, 2014, a separate customer accounted for approximately 19% of the Company’s consolidated net accounts receivable position. In addition, the Company derived 61%, 66% and 71%, of revenue from its top ten customers for the for the years ended December 31, 2015, 2014 and 2013, respectively.
Note 16 - Related Party Transactions
85
MasTec purchases, rents and leases equipment used in its business from a number of different vendors on a non-exclusive basis, including Cross Country Pipeline Supply, Inc. (“CCP”), in which the Company has a cost method investment of $15 million. Juan Carlos Mas, who is the brother of Jorge Mas, Chairman of MasTec’s Board of Directors, and José R. Mas, MasTec’s Chief Executive Officer, serves as the chairman of CCP. Additionally, an entity owned by Jorge, José and Juan Carlos Mas is a minority shareholder of CCP. For the years ended December 31, 2015, 2014 and 2013, MasTec paid CCP approximately $10.6 million, $6.3 million and $1.3 million, respectively, for equipment rentals, leases and servicing, and as of December 31, 2015 and 2014, related payables totaled approximately $0.6 million and $1.3 million, respectively.
MasTec leases employees to a customer in which Jorge Mas and José R. Mas own a majority interest. For the years ended December 31, 2015, 2014 and 2013, MasTec charged approximately $0.8 million, $0.7 million and $0.6 million, respectively, to this customer. As of both December 31, 2015 and 2014, outstanding receivables from employee leasing arrangements with this customer totaled $0.1 million. The Company also provides satellite communication services to this customer. For the years ended December 31, 2015, 2014 and 2013, revenue from satellite communication services provided to this customer totaled approximately $0.9 million, $1.0 million and $1.3 million, respectively, and as of December 31, 2015 and 2014, related receivables totaled approximately $0.3 million and $0.5 million, respectively.
MasTec leases a property located in Florida from Irma S. Mas, the mother of Jorge Mas and José R. Mas. For the years ended December 31, 2015, 2014 and 2013, lease payments associated with this property totaled approximately $48,000, $48,000 and $52,000, respectively.
The Company entered into a leasing arrangement in 2015 with a third party that leases an aircraft from a Company owned by Jorge Mas. The amount paid by the Company under this arrangement for the year ended December 31, 2015 was immaterial.
Certain of the Company’s subsidiaries have entered into related party lease arrangements for operational facilities and equipment, typically with the former owners of acquired businesses. Related party lease payments for the years ended December 31, 2015, 2014 and 2013 totaled approximately $22.1 million, $12.2 million and $11.5 million, respectively. In addition, certain subsidiaries have entered into related party arrangements for various types of services, including project-related site restoration and marketing and business development activities, for which the Company paid approximately $10.5 million, $6.0 million and $9.2 million for the years ended December 31, 2015, 2014 and 2013, respectively.
Split Dollar Agreements
MasTec has a split dollar agreement with José R. Mas, which became effective in August 2014 and replaced a prior split dollar and deferred bonus agreement. Under the new split dollar agreement, MasTec is the sole owner of each of the policies subject to the agreement. The Company will make the premium payments under each of the policies. Upon the death of José R. Mas or the survivor of José R. Mas and his wife (collectively, the “José R. Mas insureds”) under the applicable policy, MasTec is entitled to receive a portion of the death benefit under the policy equal to the greater of (i) premiums paid by the Company on the policy and (ii) the then cash value of the policy (excluding surrender charges or other similar charges or reductions) immediately before the triggering death. The balance of the death benefit is payable to the Jose Mas trust or other beneficiary designated by the trustees. In the event of the Company’s bankruptcy or dissolution, the Jose Mas trust shall have the assignable option to purchase the policies subject to the split dollar agreement from the Company. The purchase price for each policy shall be the greater of either the total premiums paid by the Company for the policy, or the then cash value of the policy, excluding surrender charges or other similar charges or reductions. The total maximum face amount of the insurance policies subject to the split dollar agreement is capped at $75 million. The Company is designated as the named fiduciary under the split dollar agreement, and the policy may not be surrendered without the express written consent of the Jose Mas trust.
MasTec also has a split dollar agreement with Jorge Mas, which became effective in October 2013 and replaced a prior split dollar and deferred bonus agreement. Under the new split dollar agreement, MasTec is the sole owner of each of the policies subject to the agreement. The Company will make the premium payments under each of the policies. Upon the death of Jorge Mas or the survivor of Jorge Mas and his wife (collectively, the “Jorge Mas insureds”) under the applicable policy, MasTec is entitled to receive a portion of the death benefit under the policy equal to the greater of (i) premiums paid by the Company on the policy and (ii) the then cash value of the policy (excluding surrender charges or other similar charges or reductions) immediately before the triggering death. The balance of the death benefit is payable to the Jorge Mas trust or other beneficiary designated by the trustees. In the event of the Company’s bankruptcy or dissolution, the Jorge Mas trust shall have the assignable option to purchase the policies subject to the split dollar agreement from the Company. The purchase price for each policy shall be the greater of either the total premiums paid by the Company for the policy, or the then cash value of the policy, excluding surrender charges or other similar charges or reductions. The total maximum face amount of the insurance policies subject to the split dollar agreement is capped at $200 million. The Company is designated as the named fiduciary under the split dollar agreement, and the policy may not be surrendered without the express written consent of the Jorge Mas trust.
For the year ended December 31, 2015, the Company paid $0.7 million in connection with the split dollar agreement for José R. Mas. For the year ended December 31, 2014, the Company received $0.1 million of proceeds from policies surrendered, net of premiums paid, related to the split dollar and deferred bonus agreements for José R. Mas. For the year ended December 31, 2013, the Company did not make any payments in respect thereof. The Company paid approximately $1.1 million for both the years ended December 31, 2015 and 2014, related to the Jorge Mas split dollar agreements. For the year ended December 31, 2013, the Company paid approximately $1.2 million, net of proceeds from policies surrendered, related to these agreements. As of December 31, 2015 and 2014, life insurance assets associated with these agreements totaled $13.0 million and $11.1 million, respectively, and were included within other long-term assets in the consolidated balance sheets.
Note 17 – Quarterly Information (Unaudited)
The following tables present selected unaudited quarterly operating results for the years ended December 31, 2015 and 2014 (in millions, except per share data). The Company believes that all necessary adjustments have been included in the amounts stated below to present fairly the quarterly results when read in conjunction with the consolidated financial statements and notes thereto.
86
For the 2015 Quarters Ended | For the 2014 Quarters Ended | ||||||||||||||||||||||||||||||
March 31 | June 30 | September 30 | December 31 | March 31(b) | June 30(b) | September 30(b) | December 31 | ||||||||||||||||||||||||
Revenue | $ | 1,003.3 | $ | 1,066.6 | $ | 1,111.0 | $ | 1,027.4 | $ | 957.8 | $ | 1,107.2 | $ | 1,315.5 | $ | 1,231.3 | |||||||||||||||
Costs of revenue, excluding depreciation and amortization | $ | 886.4 | $ | 945.9 | $ | 972.7 | $ | 916.3 | $ | 841.3 | $ | 950.7 | $ | 1,122.9 | $ | 1,063.1 | |||||||||||||||
Net (loss) income from continuing operations | $ | (6.4 | ) | $ | (3.8 | ) | $ | 7.4 | $ | (76.9 | ) | $ | 12.3 | $ | 33.7 | $ | 49.4 | $ | 26.6 | ||||||||||||
Net (loss) income attributable to MasTec, Inc. | $ | (6.3 | ) | $ | (3.7 | ) | $ | 7.6 | $ | (76.7 | ) | $ | 12.1 | $ | 33.7 | $ | 49.0 | $ | 21.1 | ||||||||||||
(Loss) earnings per share from continuing operations: | |||||||||||||||||||||||||||||||
Basic(a) | $ | (0.08 | ) | $ | (0.05 | ) | $ | 0.10 | $ | (0.96 | ) | $ | 0.16 | $ | 0.43 | $ | 0.60 | $ | 0.33 | ||||||||||||
Diluted(a) | $ | (0.08 | ) | $ | (0.05 | ) | $ | 0.09 | $ | (0.96 | ) | $ | 0.14 | $ | 0.39 | $ | 0.57 | $ | 0.32 | ||||||||||||
(a) | Earnings per share calculations, including the sum of the individual quarterly earnings per share amounts to the full year earnings per share amounts, may contain slight summation differences due to rounding. |
(b) | Reflects restated data as previously presented in the Company’s 2014 10-K. See Independent Investigation of the Audit Committee and Related Restatements in Note 1 - Business, Basis of Presentation and Significant Accounting Policies. |
During the year ended December 31, 2014, the Company acquired certain businesses, as discussed in Note 3 - Acquisitions. As a result, the quarterly results of 2015 may not be comparable with those of 2014. Other transactions affecting comparisons of the Company’s quarterly results include the effects of:
(i) | Goodwill and intangible asset impairment, pretax, totaling $78.6 million in the fourth quarter of 2015; |
(ii) | WesTower acquisition integration costs, pretax, totaling $8.8 million, $7.8 million and $1.2 million in the first, second and third quarters of 2015, respectively, and $5.3 million in the fourth quarter of 2014; |
(iii) | Audit Committee independent investigation related costs, pretax, totaling $3.0 million, $7.5 million, $4.1 million and $2.8 million in the first, second, third, and fourth quarters of 2015, respectively; |
(iv) | Project losses on a Canadian wind project, pretax, totaling $16.0 million, $1.6 million and $3.8 million in the first, second, and third quarters of 2015, respectively; |
(v) | Project losses on a proportionately consolidated non-controlled Canadian joint venture, pretax, totaling $5.5 million, $2.8 million and $8.0 million in the first, third, and fourth quarters of 2015, respectively; |
(vi) | A court-mandated remediation settlement charge of $12.2 million, pretax, in the third quarter of 2015; |
(vii) | Recognized unrealized losses on interest rate swaps incurred by our equity method investments in the Waha JVs, pretax, totaling $4.4 million in the fourth quarter of 2015; and |
(viii) | Income tax expense of $2.8 million, primarily incurred in the second quarter of 2015, resulting from a tax law change in Alberta. |
87
Note 18 – Supplemental Guarantor Condensed Consolidating Financial Information
The 4.875% Senior Notes are fully and unconditionally guaranteed on an unsecured, unsubordinated, joint and several basis by certain of the Company’s existing and future 100%-owned direct and indirect domestic subsidiaries that are each guarantors of the Credit Facility or other outstanding indebtedness (the “Guarantor Subsidiaries”). The Company’s subsidiaries organized outside of the United States and certain domestic subsidiaries (collectively, the “Non-Guarantor Subsidiaries”) do not guarantee any of these notes. A Guarantor Subsidiary’s guarantee is subject to release in certain customary circumstances, including upon the sale of a majority of the capital stock or substantially all of the assets of such Guarantor Subsidiary; if the Guarantor Subsidiary’s guarantee under the Company’s Credit Facility and other indebtedness is released or discharged (other than due to payment under such guarantee); or when the requirements for legal defeasance are satisfied or the obligations are discharged in accordance with the related indentures.
The following supplemental financial information sets forth the condensed consolidating balance sheets and the condensed consolidating statements of operations and comprehensive income and cash flows for the parent company (MasTec, Inc.), the Guarantor Subsidiaries on a combined basis, the Non-Guarantor Subsidiaries on a combined basis and the eliminations necessary to arrive at the information for the Company as reported on a consolidated basis. Eliminations represent adjustments to eliminate investments in subsidiaries and intercompany balances and transactions between or among MasTec, Inc., the Guarantor Subsidiaries and the Non-Guarantor Subsidiaries. Investments in subsidiaries are accounted for using the equity method for this presentation.
CONDENSED CONSOLIDATING STATEMENTS OF OPERATIONS AND COMPREHENSIVE INCOME (in millions)
For the Year Ended December 31, 2015 | MasTec, Inc. | Guarantor Subsidiaries | Non-Guarantor Subsidiaries | Eliminations | Consolidated MasTec, Inc. | ||||||||||||||
Revenue | $ | — | $ | 3,527.0 | $ | 689.7 | $ | (8.4 | ) | $ | 4,208.3 | ||||||||
Costs of revenue, excluding depreciation and amortization | — | 3,073.6 | 656.1 | (8.4 | ) | 3,721.3 | |||||||||||||
Depreciation and amortization | — | 130.6 | 39.0 | — | 169.7 | ||||||||||||||
Goodwill and intangible asset impairment | — | — | 78.6 | — | 78.6 | ||||||||||||||
General and administrative expenses | 2.1 | 235.4 | 28.4 | — | 265.9 | ||||||||||||||
Interest expense, net | — | 42.8 | 5.3 | — | 48.1 | ||||||||||||||
Other income, net | — | (6.2 | ) | (1.3 | ) | — | (7.5 | ) | |||||||||||
(Loss) income from continuing operations before income taxes | $ | (2.1 | ) | $ | 50.8 | $ | (116.4 | ) | $ | — | $ | (67.7 | ) | ||||||
Benefit from (provision for) income taxes | 1.1 | (27.1 | ) | 14.1 | — | (12.0 | ) | ||||||||||||
Net (loss) income from continuing operations | $ | (1.0 | ) | $ | 23.7 | $ | (102.3 | ) | $ | — | $ | (79.7 | ) | ||||||
Net loss from discontinued operations | — | — | — | — | — | ||||||||||||||
Equity in income (loss) from subsidiaries, net of tax | (78.1 | ) | — | — | 78.1 | — | |||||||||||||
Net (loss) income | $ | (79.1 | ) | $ | 23.7 | $ | (102.3 | ) | $ | 78.1 | $ | (79.7 | ) | ||||||
Net loss attributable to non-controlling interests | — | — | (0.6 | ) | — | (0.6 | ) | ||||||||||||
Net (loss) income attributable to MasTec, Inc. | $ | (79.1 | ) | $ | 23.7 | $ | (101.7 | ) | $ | 78.1 | $ | (79.1 | ) | ||||||
Comprehensive (loss) income | $ | (117.5 | ) | $ | 23.7 | $ | (140.7 | ) | $ | 116.5 | $ | (118.1 | ) | ||||||
88
CONDENSED CONSOLIDATING STATEMENTS OF OPERATIONS AND COMPREHENSIVE INCOME (in millions)
For the Year Ended December 31, 2014 | MasTec, Inc. | Guarantor Subsidiaries | Non-Guarantor Subsidiaries | Eliminations | Consolidated MasTec, Inc. | ||||||||||||||
Revenue | $ | — | $ | 3,768.4 | $ | 847.7 | $ | (4.3 | ) | $ | 4,611.8 | ||||||||
Costs of revenue, excluding depreciation and amortization | — | 3,226.2 | 756.1 | (4.3 | ) | 3,978.0 | |||||||||||||
Depreciation and amortization | — | 119.3 | 35.2 | — | 154.5 | ||||||||||||||
General and administrative expenses | 2.5 | 208.5 | 27.3 | — | 238.3 | ||||||||||||||
Interest expense, net | — | 47.8 | 3.0 | — | 50.8 | ||||||||||||||
Other income, net | — | (1.9 | ) | (6.3 | ) | — | (8.2 | ) | |||||||||||
(Loss) income from continuing operations before income taxes | $ | (2.5 | ) | $ | 168.5 | $ | 32.4 | $ | — | $ | 198.4 | ||||||||
Benefit from (provision for) income taxes | 1.0 | (70.6 | ) | (6.8 | ) | — | (76.4 | ) | |||||||||||
Net (loss) income from continuing operations | $ | (1.5 | ) | $ | 97.9 | $ | 25.6 | $ | — | $ | 122.0 | ||||||||
Net loss from discontinued operations | — | — | (6.5 | ) | — | (6.5 | ) | ||||||||||||
Equity in income from subsidiaries, net of tax | 117.4 | — | — | (117.4 | ) | — | |||||||||||||
Net income (loss) | $ | 115.9 | $ | 97.9 | $ | 19.1 | $ | (117.4 | ) | $ | 115.5 | ||||||||
Net loss attributable to non-controlling interests | — | — | (0.4 | ) | — | (0.4 | ) | ||||||||||||
Net income (loss) attributable to MasTec, Inc. | $ | 115.9 | $ | 97.9 | $ | 19.5 | $ | (117.4 | ) | $ | 115.9 | ||||||||
Comprehensive income (loss) | $ | 95.2 | $ | 97.9 | $ | (1.6 | ) | $ | (96.7 | ) | $ | 94.8 | |||||||
For the Year Ended December 31, 2013 | MasTec, Inc. | Guarantor Subsidiaries | Non-Guarantor Subsidiaries | Eliminations | Consolidated MasTec, Inc. | ||||||||||||||
Revenue | $ | — | $ | 3,903.8 | $ | 425.6 | $ | (4.6 | ) | $ | 4,324.8 | ||||||||
Costs of revenue, excluding depreciation and amortization | — | 3,321.3 | 365.7 | (4.6 | ) | 3,682.4 | |||||||||||||
Depreciation and amortization | — | 120.1 | 20.8 | — | 140.9 | ||||||||||||||
General and administrative expenses | 2.1 | 184.6 | 28.7 | — | 215.4 | ||||||||||||||
Interest expense, net | — | 45.5 | 0.9 | — | 46.4 | ||||||||||||||
Loss on extinguishment of debt | — | 5.6 | — | — | 5.6 | ||||||||||||||
Other income, net | — | (6.1 | ) | — | — | (6.1 | ) | ||||||||||||
(Loss) income from continuing operations before income taxes | $ | (2.1 | ) | $ | 232.8 | $ | 9.5 | $ | — | $ | 240.2 | ||||||||
Benefit from (provision for) income taxes | 0.8 | (91.9 | ) | (1.4 | ) | — | (92.5 | ) | |||||||||||
Net (loss) income from continuing operations | $ | (1.3 | ) | $ | 140.9 | $ | 8.1 | $ | — | $ | 147.7 | ||||||||
Net loss from discontinued operations | — | — | (6.5 | ) | — | (6.5 | ) | ||||||||||||
Equity in income from subsidiaries, net of tax | 142.2 | — | — | (142.2 | ) | — | |||||||||||||
Net income (loss) | $ | 140.9 | $ | 140.9 | $ | 1.6 | $ | (142.2 | ) | $ | 141.2 | ||||||||
Net income attributable to non-controlling interests | — | — | 0.3 | — | 0.3 | ||||||||||||||
Net income (loss) attributable to MasTec, Inc. | $ | 140.9 | $ | 140.9 | $ | 1.3 | $ | (142.2 | ) | $ | 141.0 | ||||||||
Comprehensive income (loss) | $ | 133.1 | $ | 140.9 | $ | (6.2 | ) | $ | (134.4 | ) | $ | 133.4 | |||||||
89
CONDENSED CONSOLIDATING BALANCE SHEETS (in millions)
As of December 31, 2015 | MasTec, Inc. | Guarantor Subsidiaries | Non-Guarantor Subsidiaries | Eliminations | Consolidated MasTec, Inc. | ||||||||||||||
Assets | |||||||||||||||||||
Current assets | $ | — | $ | 930.5 | $ | 202.4 | $ | — | $ | 1,132.9 | |||||||||
Property and equipment, net | — | 448.2 | 110.5 | — | 558.7 | ||||||||||||||
Goodwill and other intangible assets, net | — | 1,047.4 | 140.5 | — | 1,187.9 | ||||||||||||||
Investments in and advances to consolidated affiliates, net | 930.3 | 103.7 | 50.6 | (1,084.6 | ) | — | |||||||||||||
Other long-term assets | 9.3 | 34.1 | 17.3 | — | 60.7 | ||||||||||||||
Total assets | $ | 939.6 | $ | 2,563.9 | $ | 521.3 | $ | (1,084.6 | ) | $ | 2,940.2 | ||||||||
Liabilities and equity | |||||||||||||||||||
Total current liabilities | $ | — | $ | 633.2 | $ | 119.6 | $ | — | $ | 752.8 | |||||||||
Long-term debt | — | 912.7 | 32.8 | — | 945.5 | ||||||||||||||
Other long-term liabilities | — | 275.5 | 23.0 | — | 298.5 | ||||||||||||||
Total liabilities | $ | — | $ | 1,821.4 | $ | 175.4 | $ | — | $ | 1,996.8 | |||||||||
Total equity | $ | 939.6 | $ | 742.5 | $ | 345.9 | $ | (1,084.6 | ) | $ | 943.4 | ||||||||
Total liabilities and equity | $ | 939.6 | $ | 2,563.9 | $ | 521.3 | $ | (1,084.6 | ) | $ | 2,940.2 | ||||||||
As of December 31, 2014 | MasTec, Inc. | Guarantor Subsidiaries | Non-Guarantor Subsidiaries | Eliminations | Consolidated MasTec, Inc. | ||||||||||||||
Assets | |||||||||||||||||||
Current assets | $ | — | $ | 1,249.6 | $ | 282.2 | $ | — | $ | 1,531.8 | |||||||||
Property and equipment, net | — | 472.6 | 150.5 | — | 623.1 | ||||||||||||||
Goodwill and other intangible assets, net | — | 1,068.3 | 264.5 | — | 1,332.8 | ||||||||||||||
Investments in and advances to consolidated affiliates, net | 1,134.4 | — | 123.0 | (1,257.4 | ) | — | |||||||||||||
Other long-term assets | 9.3 | 28.7 | 38.3 | — | 76.3 | ||||||||||||||
Total assets | $ | 1,143.7 | $ | 2,819.2 | $ | 858.5 | $ | (1,257.4 | ) | $ | 3,564.0 | ||||||||
Liabilities and equity | |||||||||||||||||||
Total current liabilities | $ | — | $ | 777.4 | $ | 203.4 | $ | — | $ | 980.8 | |||||||||
Long-term debt | — | 1,027.3 | 33.9 | — | 1,061.2 | ||||||||||||||
Advances from consolidated affiliates, net | — | 70.7 | — | (70.7 | ) | — | |||||||||||||
Other long-term liabilities | — | 239.3 | 134.6 | — | 373.9 | ||||||||||||||
Total liabilities | $ | — | $ | 2,114.7 | $ | 371.9 | $ | (70.7 | ) | $ | 2,415.9 | ||||||||
Total equity | $ | 1,143.7 | $ | 704.5 | $ | 486.6 | $ | (1,186.7 | ) | $ | 1,148.1 | ||||||||
Total liabilities and equity | $ | 1,143.7 | $ | 2,819.2 | $ | 858.5 | $ | (1,257.4 | ) | $ | 3,564.0 | ||||||||
90
CONDENSED CONSOLIDATING STATEMENTS OF CASH FLOWS (in millions)
For the Year Ended December 31, 2015 | MasTec, Inc. | Guarantor Subsidiaries | Non-Guarantor Subsidiaries | Eliminations | Consolidated MasTec, Inc. | ||||||||||||||
Net cash (used in) provided by operating activities | $ | 0.9 | $ | 426.7 | $ | (60.2 | ) | $ | — | $ | 367.4 | ||||||||
Cash flows (used in) provided by investing activities: | |||||||||||||||||||
Cash paid for acquisitions, net of cash acquired | — | (0.1 | ) | — | — | (0.1 | ) | ||||||||||||
Capital expenditures | — | (71.9 | ) | (12.5 | ) | — | (84.4 | ) | |||||||||||
Proceeds from sale of property and equipment | — | 10.5 | 3.4 | — | 13.9 | ||||||||||||||
Payments for investments, net | (1.9 | ) | — | (56.2 | ) | — | (58.1 | ) | |||||||||||
Net cash used in investing activities | $ | (1.9 | ) | $ | (61.5 | ) | $ | (65.3 | ) | $ | — | $ | (128.7 | ) | |||||
Cash flows provided by (used in) financing activities: | |||||||||||||||||||
Proceeds from credit facilities | — | 1,097.3 | 605.1 | — | 1,702.4 | ||||||||||||||
Repayments of credit facilities | — | (1,154.4 | ) | (587.8 | ) | — | (1,742.2 | ) | |||||||||||
Repayments of other borrowings and capital lease obligations | — | (54.3 | ) | (16.6 | ) | — | (70.9 | ) | |||||||||||
Repurchase of common stock | (100.0 | ) | — | — | — | (100.0 | ) | ||||||||||||
Proceeds from stock-based awards, net of tax withholdings | 2.7 | (1.1 | ) | — | — | 1.6 | |||||||||||||
Excess tax benefit from stock-based compensation | — | 0.1 | — | — | 0.1 | ||||||||||||||
Payments of acquisition-related contingent consideration | — | (37.3 | ) | (10.2 | ) | — | (47.5 | ) | |||||||||||
Payments of financing costs | — | (2.4 | ) | — | — | (2.4 | ) | ||||||||||||
Net financing activities and advances (to) from consolidated affiliates | 98.3 | (226.8 | ) | 128.5 | — | — | |||||||||||||
Net cash provided by financing activities | $ | 1.0 | $ | (378.9 | ) | $ | 119.0 | $ | — | $ | (258.9 | ) | |||||||
Effect of currency translation on cash | — | — | 1.1 | — | 1.1 | ||||||||||||||
Net increase (decrease) in cash and cash equivalents | $ | — | $ | (13.7 | ) | $ | (5.4 | ) | $ | — | $ | (19.1 | ) | ||||||
Cash and cash equivalents - beginning of period | — | 18.5 | 5.6 | — | 24.1 | ||||||||||||||
Cash and cash equivalents - end of period | $ | — | $ | 4.8 | $ | 0.2 | $ | — | $ | 5.0 | |||||||||
For the Year Ended December 31, 2014 | MasTec, Inc. | Guarantor Subsidiaries | Non-Guarantor Subsidiaries | Eliminations | Consolidated MasTec, Inc. | ||||||||||||||
Net cash (used in) provided by operating activities | $ | (0.5 | ) | $ | 251.9 | $ | 71.6 | $ | — | $ | 323.0 | ||||||||
Cash flows (used in) provided by investing activities: | |||||||||||||||||||
Cash paid for acquisitions, net of cash acquired | — | (222.7 | ) | (122.9 | ) | — | (345.6 | ) | |||||||||||
Capital expenditures | — | (84.8 | ) | (24.5 | ) | — | (109.3 | ) | |||||||||||
Proceeds from sale of property and equipment | — | 14.3 | 2.4 | — | 16.7 | ||||||||||||||
Payments for investments, net | (1.0 | ) | (0.1 | ) | — | — | (1.1 | ) | |||||||||||
Net cash used in investing activities | $ | (1.0 | ) | $ | (293.3 | ) | $ | (145.0 | ) | $ | — | $ | (439.3 | ) | |||||
Cash flows provided by (used in) financing activities: | |||||||||||||||||||
Proceeds from credit facilities | — | 1,894.4 | 491.6 | — | 2,386.0 | ||||||||||||||
Repayments of credit facilities | — | (1,410.0 | ) | (529.6 | ) | — | (1,939.6 | ) | |||||||||||
Repayments of senior convertible notes | — | (202.3 | ) | — | — | (202.3 | ) | ||||||||||||
Repayments of other borrowings and capital lease obligations | — | (39.0 | ) | (28.3 | ) | — | (67.3 | ) | |||||||||||
Proceeds from stock-based awards, net of tax withholdings | 3.8 | (2.7 | ) | — | — | 1.1 | |||||||||||||
Excess tax benefit from stock-based compensation | — | 3.7 | — | — | 3.7 | ||||||||||||||
Payments of acquisition-related contingent consideration | — | (60.3 | ) | — | — | (60.3 | ) | ||||||||||||
Payments of financing costs | — | (2.6 | ) | — | — | (2.6 | ) | ||||||||||||
Net financing activities and advances (to) from consolidated affiliates | (2.3 | ) | (126.7 | ) | 129.0 | — | — | ||||||||||||
Net cash provided by financing activities | $ | 1.5 | $ | 54.5 | $ | 62.7 | $ | — | $ | 118.7 | |||||||||
Effect of currency translation on cash | — | — | (1.3 | ) | — | (1.3 | ) | ||||||||||||
Net increase (decrease) in cash and cash equivalents | $ | — | $ | 13.1 | $ | (12.0 | ) | $ | — | $ | 1.1 | ||||||||
Cash and cash equivalents - beginning of period | — | 5.4 | 17.6 | — | 23.0 | ||||||||||||||
Cash and cash equivalents - end of period | $ | — | $ | 18.5 | $ | 5.6 | $ | — | $ | 24.1 | |||||||||
91
CONDENSED CONSOLIDATING STATEMENTS OF CASH FLOWS (in millions)
For the Year Ended December 31, 2013 | MasTec, Inc. | Guarantor Subsidiaries | Non-Guarantor Subsidiaries | Eliminations | Consolidated MasTec, Inc. | ||||||||||||||
Net cash (used in) provided by operating activities | $ | (1.7 | ) | $ | 174.1 | $ | 28.0 | $ | — | $ | 200.4 | ||||||||
Cash flows (used in) provided by investing activities: | |||||||||||||||||||
Cash paid for acquisitions, net of cash acquired | — | (45.0 | ) | (103.6 | ) | — | (148.6 | ) | |||||||||||
Proceeds from disposal of business, net of cash divested | — | (3.0 | ) | — | — | (3.0 | ) | ||||||||||||
Capital expenditures | — | (114.4 | ) | (11.9 | ) | — | (126.3 | ) | |||||||||||
Proceeds from sale of property and equipment | — | 14.7 | 1.2 | — | 15.9 | ||||||||||||||
Payments for investments, net | (1.2 | ) | — | — | — | (1.2 | ) | ||||||||||||
Net cash used in investing activities | $ | (1.2 | ) | $ | (147.7 | ) | $ | (114.3 | ) | $ | — | $ | (263.2 | ) | |||||
Cash flows provided by (used in) financing activities: | |||||||||||||||||||
Proceeds from credit facilities | — | 961.6 | 187.4 | — | 1,149.0 | ||||||||||||||
Repayments of credit facilities | — | (1,042.2 | ) | (207.4 | ) | — | (1,249.6 | ) | |||||||||||
Proceeds from senior notes, net | — | 250.0 | — | — | 250.0 | ||||||||||||||
Repayments of other borrowings and capital lease obligations | — | (69.1 | ) | (1.6 | ) | — | (70.7 | ) | |||||||||||
Proceeds from stock-based awards, net of tax withholdings | 9.9 | (1.5 | ) | — | — | 8.4 | |||||||||||||
Excess tax benefit from stock-based compensation | — | 4.3 | — | — | 4.3 | ||||||||||||||
Payments of acquisition-related contingent consideration | — | (16.7 | ) | (2.0 | ) | — | (18.7 | ) | |||||||||||
Payments of financing costs, including call premiums on extinguishment of debt | — | (13.7 | ) | — | — | (13.7 | ) | ||||||||||||
Net financing activities and advances (to) from consolidated affiliates | (7.0 | ) | (106.4 | ) | 113.4 | — | — | ||||||||||||
Net cash provided by (used in) financing activities | $ | 2.9 | $ | (33.7 | ) | $ | 89.8 | $ | — | $ | 59.0 | ||||||||
Effect of currency translation on cash | — | — | 0.0 | — | 0.0 | ||||||||||||||
Net (decrease) increase in cash and cash equivalents | $ | — | $ | (7.3 | ) | $ | 3.5 | $ | — | $ | (3.8 | ) | |||||||
Cash and cash equivalents - beginning of period | — | 12.7 | 14.1 | — | 26.8 | ||||||||||||||
Cash and cash equivalents - end of period | $ | — | $ | 5.4 | $ | 17.6 | $ | — | $ | 22.9 | |||||||||
92
Item 9. | CHANGES IN AND DISAGREEMENTS WITH ACCOUNTANTS ON ACCOUNTING AND FINANCIAL DISCLOSURE |
None
Item 9A. | CONTROLS AND PROCEDURES |
Evaluation of Disclosure Controls and Procedures. As of the end of the period covered by this Annual Report on Form 10-K, our management, with the participation of our Chief Executive Officer and Chief Financial Officer, evaluated the effectiveness of the design and operation of our disclosure controls and procedures (as defined in Rule 13a-15(e) under the Securities Exchange Act of 1934, as amended (the “Exchange Act”)). We maintain disclosure controls and procedures designed to ensure that information required to be disclosed in reports filed or submitted by us under the Exchange Act is recorded, processed, summarized and reported within time periods specified in the SEC’s rules and forms. Disclosure controls and procedures include, without limitation, controls and procedures designed to ensure that information required to be disclosed by us in the reports that we file or submit under the Exchange Act is accumulated and communicated to management, including our Chief Executive Officer and Chief Financial Officer, or persons performing similar functions, as appropriate to allow timely decisions regarding required disclosure. Based on management’s evaluation, our Chief Executive Officer and Chief Financial Officer concluded that our disclosure controls and procedures were effective at the reasonable assurance level as of December 31, 2015.
Management’s Report on Internal Control Over Financial Reporting. Our management is responsible for establishing and maintaining adequate internal control over financial reporting, as such term is defined in Exchange Act Rule 13a-15(f). Management, including our Chief Executive Officer and Chief Financial Officer, evaluated the effectiveness of our internal control over financial reporting as of the end of the period covered by this report. In making its assessment of the effectiveness of internal control, management used the criteria set forth by the Committee of Sponsoring Organizations of the Treadway Commission (“COSO criteria”) in Internal Control-Integrated Framework (2013 Framework) and also considered the remediation program described below. Our internal control over financial reporting is designed to provide reasonable assurance to management and to our Board of Directors regarding the reliability of financial reporting and the preparation and fair presentation of financial statements for external purposes in accordance with generally accepted accounting principles. Our internal control over financial reporting includes those policies and procedures that:
(i) pertain to the maintenance of records that, in reasonable detail, accurately and fairly reflect the transactions and dispositions of our assets;
(ii) provide reasonable assurance that transactions are recorded as necessary to permit preparation of financial statements in accordance with generally accepted accounting principles, and that receipts and expenditures are being made only in accordance with authorizations of our management and directors; and
(iii) provide reasonable assurance regarding prevention or timely detection of unauthorized acquisition, use or disposition of our assets that could have a material effect on the financial statements.
Based on this assessment, management has concluded that our internal control over financial reporting was effective as of December 31, 2015.
BDO USA, LLP, the independent registered public accounting firm which audits our financial statements, has audited our internal control over financial reporting as of December 31, 2015 and has expressed an unqualified opinion thereon as stated in their report that is included herein.
Remediation of Prior Material Weakness in Internal Control Over Financial Reporting. Management previously determined that a material weakness in internal control over financial reporting existed within a service line in our Electrical Transmission segment due to the operational failure of the internal control process requiring adequate documentation of significant judgments made in determining cost-to-complete estimates under percentage-of-completion accounting. The review process failed to ensure that cost-to-complete estimates had sufficient supporting documentation. As a result, significant judgments were made and incorporated into the accounting records used to determine project revenue without sufficient documentation that clearly sets forth the rationale and factors used in making those judgments.
A material weakness is a deficiency, or a combination of deficiencies, in internal control over financial reporting, such that there is a reasonable possibility that a material misstatement of our annual or interim financial statements will not be prevented or detected on a timely basis.
In response to this material weakness, management implemented changes to the Company’s internal control over financial reporting, including:
(i) | the revision of the MasTec Revenue Recognition Policy (the “MasTec Policy”) with more detailed guidance on cost estimate procedures, project cost reserves and other aspects of percentage-of-completion accounting; |
(ii) | increased documentation requirements for significant judgments made in relation to cost-to-complete estimates, including documentation of major assumptions, discussions and factors considered in making those decisions; |
(iii) | corporate reviews of significant project variances and inspection of documentation to determine that changes are in accordance with the MasTec Policy and have appropriate rationale and sufficient supporting documentation, including additional staffing for such reviews; and |
(iv) | enhanced procedures at the service line with on-going temporary corporate oversight and review of the cost-to-complete estimates for major high risk jobs; |
93
Management has determined that the remediation actions discussed above were effectively designed and demonstrated effective operation for a sufficient period of time to enable management to conclude that the previously disclosed material weakness has been remediated as of December 31, 2015.
Changes in Internal Control over Financial Reporting. Other than the remediation of the previously identified material weakness discussed above, there have been no changes in the Company’s internal control over financial reporting during the quarter ended December 31, 2015 that have materially affected, or are reasonably likely to materially affect, the Company’s internal control over financial reporting.
94
Report of Independent Registered Public Accounting Firm
MasTec, Inc.
Coral Gables, Florida
We have audited MasTec Inc.’s internal control over financial reporting as of December 31, 2015, based on criteria established in Internal Control - Integrated Framework (2013) issued by the Committee of Sponsoring Organizations of the Treadway Commission (the COSO criteria). MasTec Inc.’s management is responsible for maintaining effective internal control over financial reporting and for its assessment of the effectiveness of internal control over financial reporting, included in the accompanying “Management’s Report on Internal Control Over Financial Reporting.” Our responsibility is to express an opinion on the company’s internal control over financial reporting based on our audit.
We conducted our audit in accordance with the standards of the Public Company Accounting Oversight Board (United States). Those standards require that we plan and perform the audit to obtain reasonable assurance about whether effective internal control over financial reporting was maintained in all material respects. Our audit included obtaining an understanding of internal control over financial reporting, assessing the risk that a material weakness exists, and testing and evaluating the design and operating effectiveness of internal control based on the assessed risk. Our audit also included performing such other procedures as we considered necessary in the circumstances. We believe that our audit provides a reasonable basis for our opinion.
A company’s internal control over financial reporting is a process designed to provide reasonable assurance regarding the reliability of financial reporting and the preparation of financial statements for external purposes in accordance with generally accepted accounting principles. A company’s internal control over financial reporting includes those policies and procedures that (1) pertain to the maintenance of records that, in reasonable detail, accurately and fairly reflect the transactions and dispositions of the assets of the company; (2) provide reasonable assurance that transactions are recorded as necessary to permit preparation of financial statements in accordance with generally accepted accounting principles, and that receipts and expenditures of the company are being made only in accordance with authorizations of management and directors of the company; and (3) provide reasonable assurance regarding prevention or timely detection of unauthorized acquisition, use, or disposition of the company’s assets that could have a material effect on the financial statements.
Because of its inherent limitations, internal control over financial reporting may not prevent or detect misstatements. Also, projections of any evaluation of effectiveness to future periods are subject to the risk that controls may become inadequate because of changes in conditions, or that the degree of compliance with the policies or procedures may deteriorate.
In our opinion, MasTec, Inc. maintained, in all material respects, effective internal control over financial reporting as of December 31, 2015, based on the COSO criteria.
We also have audited, in accordance with the standards of the Public Company Accounting Oversight Board (United States), the consolidated balance sheets of MasTec, Inc. as of December 31, 2015 and 2014, and the related consolidated statements of operations, comprehensive income, equity, and cash flows for each of the three years in the period ended December 31, 2015 and our report dated February 25, 2016 expressed an unqualified opinion thereon.
/s/ BDO USA, LLP
Certified Public Accountants
Miami, Florida
February 25, 2016
95
ITEM 9B. | OTHER INFORMATION |
None.
PART III
ITEM 10. | DIRECTORS, EXECUTIVE OFFICERS AND CORPORATE GOVERNANCE |
The information about directors required for this item is incorporated by reference from our Proxy Statement to be filed in connection with our 2016 Annual Meeting of Shareholders.
We have adopted a code of business conduct and ethics, called the Code of Business Conduct and Ethics, this applies to all of our directors, officers, including our principal executive, financial and accounting officers, and employees and includes additional criteria that are applicable to our Chief Executive Officer and senior financial officers. The full text of the Code of Business Conduct and Ethics is available in the Investor section of MasTec’s website at www.mastec.com under the tab “Corporate Governance” and is available in print to any shareholder who requests it. See also Item 1. “Business - Available Information.” We intend to provide amendments or waivers to our Code of Business Conduct and Ethics for any of our directors and principal officers on our website within four business days after such amendment or waiver. The reference to our website address does not constitute incorporation by reference of the information contained on the website, and such information is not a part of this annual report.
ITEM 11. | EXECUTIVE COMPENSATION |
The information required for this item is incorporated by reference from our Proxy Statement to be filed in connection with our 2016 Annual Meeting of Shareholders.
ITEM 12. | SECURITY OWNERSHIP OF CERTAIN BENEFICIAL OWNERS AND MANAGEMENT AND RELATED STOCKHOLDER MATTERS |
Equity Compensation Plans
The following table sets forth information about our common stock that may be issued under all of our equity compensation plans as of December 31, 2015, which included: the MasTec, Inc. 2013 Incentive Compensation Plan (“the 2013 Incentive Plan”); the MasTec, Inc. 2011 Employee Stock Purchase Plan (the “2011 ESPP”); the MasTec, Inc. Bargaining Units Employee Stock Purchase Plan (the “2013 Bargaining Units ESPP”); and individual option agreements. The 2013 Incentive Plan replaced the 2003 Employee Stock Incentive Plan, as amended and the Amended and Restated 2003 Stock Incentive Plan for Non-Employees, as amended (together, the “2003 Plans”). Shares that remained available under the 2003 Plans became available under the 2013 Incentive Plan as of its effective date.
Plan Category | (a) Number of Securities to be Issued Upon Exercise of Outstanding Options, Warrants and Rights | (b) Weighted Average Exercise Price of Outstanding Options, Warrants and Rights | (c) Number of Securities Remaining Available for Future Issuance Under Equity Compensation Plans (Excluding Securities Reflected in Column (a)) | |||||||||
Equity compensation plans approved by security holders | 202,700 | $ | 13.06 | 4,795,339 | (1) | |||||||
Equity compensation plans not approved by security holders | N/A | N/A | N/A | |||||||||
Total | 202,700 | 4,795,339 | ||||||||||
(1) | Under the 2013 Incentive Plan, 3,600,674 shares were available for issuance as of December 31, 2015. Under the 2011 ESPP and 2013 Bargaining Units ESPP, 214,180 shares and 980,485 shares, respectively, were available for issuance as of December 31, 2015. In January 2016, an additional 1,000,000 shares became available for grant under the 2011 ESPP. |
Summaries of Plans Not Approved by Our Shareholders
Deferred Fee Plan. The Deferred Fee Plan became effective on January 1, 2006. Under the terms of the Deferred Fee Plan, directors may elect to defer the receipt of cash and stock fees for their services as directors. Each director may elect the type of fees to be deferred and the percentage of such fees to be deferred. Deferred cash fees may be directed to a deferred cash account or a deferred stock account (or both). Deferred stock fees may only be directed to a deferred stock account. Elections to defer fees remain in force, unless amended or revoked within the required time periods.
The deferred cash account will be credited with interest on the cash balance at the end of each calendar quarter. The interest rate is equal to the rate of interest payable by us on our revolving credit facility, as determined as of the first day of each calendar quarter. The deferred stock account will be credited with stock dividends (or with cash dividends that are converted to deferred stock credits pursuant to the plan.)
96
Distribution of a director’s cash and stock accounts will begin on January 15 of the year following the directors’ termination of all services with us, or in the case of a change of control (as defined in the Deferred Fee Plan), in a lump sum as soon as practicable following such change of control. Distributions from the deferred cash account will be made in cash and distributions from the deferred stock account will be made in shares of MasTec’s common stock. Distributions will either be made in a lump-sum payment or in up to five consecutive installments as elected by the director.
Individual Option Grants. We have entered into various option agreements with non-employee directors, advisors and other parties in connection with providing certain services, acquisitions and other matters. Such options have various vesting schedules and exercise prices and have been included in the equity compensation plan table above.
The other information required by this Item 11 is incorporated by reference from our Proxy Statement to be filed in connection with our 2016 Annual Meeting of Shareholders.
ITEM 13. | CERTAIN RELATIONSHIPS AND RELATED TRANSACTIONS, AND DIRECTOR INDEPENDENCE |
The information required for this item is incorporated by reference from our Proxy Statement to be filed in connection with our 2016 Annual Meeting of Shareholders.
ITEM 14. | PRINCIPAL ACCOUNTING FEES AND SERVICES |
The information required for this item is incorporated by reference from our Proxy Statement to be filed in connection with our 2016 Annual Meeting of Shareholders.
PART IV
ITEM 15. EXHIBITS AND FINANCIAL STATEMENT SCHEDULES
(a) | 1. Financial Statements – the consolidated financial statements and the reports of the Independent Registered Public Accounting firms are listed on pages 49 through 92. |
2. Financial Statement Schedules - Schedule II - Valuation and Qualifying Accounts.
3. Exhibits including those incorporated by reference:
Exhibits | Description (1) | |
3.1 | Composite Articles of Incorporation of MasTec, Inc. filed as Exhibit 3.1 to our Annual Report on Form 10-K filed with the SEC on February 25, 2010 and incorporated by reference herein. | |
3.2 | Amended and Restated By-laws of MasTec, Inc., amended and restated as of January 22, 2010, filed as Exhibit 3.1 to our Current Report on Form 8-K filed with the SEC on January 28, 2010 and incorporated by reference herein. | |
4.1 | Indenture, dated June 5, 2009, by and among MasTec, Inc., MasTec Inc.’s subsidiaries party thereto, as guarantors, and U.S. Bank National Association, as trustee filed as Exhibit 4.2 to our Current Report on Form 8-K filed with the SEC on June 5, 2009 and incorporated by reference herein. | |
4.2 | Fifth Supplemental Indenture, dated as of March 18, 2013, by and among MasTec, Inc., MasTec, Inc.’s subsidiaries party thereto, as guarantors, and U.S. Bank National Association, as trustee, filed as Exhibit 4.3 to our Current Report on Form 8-K filed with the SEC on March 18, 2013 and incorporated by reference herein. | |
4.3 | Sixth Supplemental Indenture, dated as of September 30, 2013, by and among MasTec, Inc., the new guarantors party thereto and U.S. Bank National Association, as trustee, filed as Exhibit 4.11 to our Annual Report on Form 10-K filed with the SEC on February 27, 2014 and incorporated by reference herein. | |
4.4 | Seventh Supplemental Indenture, dated as of November 11, 2013, by and among MasTec, Inc., the new guarantors party thereto and U.S. Bank National Association, as trustee, filed as Exhibit 4.12 to our Annual Report on Form 10-K filed with the SEC on February 27, 2014 and incorporated by reference herein. | |
4.5 | Eighth Supplemental Indenture, dated as of March 12, 2014, by and among MasTec, Inc., the new guarantors party thereto and U.S. Bank National Association, as trustee, filed as Exhibit 4.1 to our Quarterly Report on Form 10-Q filed with the SEC on August 11, 2014 and incorporated by reference herein. | |
4.6 | Ninth Supplemental Indenture, dated as of April 30, 2014, by and among MasTec, Inc., the new guarantors party thereto and U.S. Bank National Association, as trustee, filed as Exhibit 4.2 to our Quarterly Report on Form 10-Q filed with the SEC on August 11, 2014 and incorporated by reference herein. | |
4.7 | Tenth Supplemental Indenture, dated as of July 10, 2014, by and among MasTec, Inc., the new guarantors party thereto and U.S. Bank National Association, as trustee, filed as Exhibit 4.3 to our Quarterly Report on Form 10-Q filed with the SEC on August 11, 2014 and incorporated by reference herein. | |
4.8 | Eleventh Supplemental Indenture, dated as of August 8, 2014, by and among MasTec, Inc., the new guarantors party thereto and U.S. Bank National Association, as trustee, filed as Exhibit 4.1 to our Quarterly Report on Form 10-Q filed with the SEC on October 30, 2014 and incorporated by reference herein. | |
97
4.9 | Twelfth Supplemental Indenture, dated as of December 8, 2014, by and among MasTec, Inc., the new guarantors party thereto and U.S. Bank National Association, as trustee, filed as Exhibit 4.9 to our Annual Report on Form 10-K filed with the SEC on July 31, 2015 and incorporated by reference herein. | |
4.10 | Thirteenth Supplemental Indenture, dated as of April 10, 2015, by and among MasTec, Inc., the guarantors party thereto and U.S. Bank National Association, as trustee, filed as Exhibit 4.1 to our Current Report on Form 8-K filed with the SEC on April 13, 2015 and incorporated by reference herein. | |
4.11* | Fourteenth Supplemental Indenture, dated as of January 7, 2016, by and among MasTec, Inc., the new guarantors party thereto and U.S. Bank National Association, as trustee. | |
10.1+ | MasTec, Inc. Deferred Compensation Plan, effective as of June 1, 2008, filed as Exhibit 99.1 to our Current Report on Form 8-K filed with the SEC on April 4, 2008 and incorporated by reference herein. | |
10.2+ | Employment Agreement, effective as of January 1, 2010, between MasTec, Inc. and Robert Apple filed as Exhibit 10.2 to our Current Report on Form 8-K filed with the SEC on January 28, 2010 and incorporated by reference herein. | |
10.3+ | MasTec, Inc. 2011 Employee Stock Purchase Plan filed as Annex A to our Definitive Proxy Statement on Schedule 14A filed with the SEC on March 23, 2011 and incorporated by reference herein. | |
10.4 | Agreement and Plan of Merger, dated as of November 16, 2010, by and among MasTec, Inc., EC Source Services, LLC and the other parties thereto, filed as Exhibit 10.44 to our Quarterly Report on Form 10-Q filed with the SEC on May 4, 2011 and incorporated by reference herein. | |
10.5+ | Amendment to the MasTec, Inc. 2011 Employee Stock Purchase Plan, filed as Exhibit 10.4 to our Quarterly Report on Form 10-Q filed with the SEC on August 3, 2011 and incorporated by reference herein. | |
10.6 | Third Amended and Restated Credit Agreement, dated as of August 22, 2011, by and among MasTec, Inc., certain of its subsidiaries, Bank of America, N.A., as Administrative Agent, Swing Line Lender and an L/C Issuer, and the lenders party thereto, filed as Exhibit 10.29 to our Annual Report on Form 10-K/A, filed on June 22, 2012, and incorporated by reference herein. | |
10.7 | Consolidated, Amended and Restated Subsidiary Guaranty Agreement, dated as of August 22, 2011, by and among the Guarantors party thereto and Bank of America, N.A., as Administrative Agent filed as Exhibit 10.2 to our Current Report on Form 8-K filed with the SEC on August 24, 2011 and incorporated by reference herein. | |
10.8 | Security Agreement, dated as of August 22, 2011, by and among MasTec, Inc., certain of its subsidiaries and Bank of America, N.A., as Administrative Agent filed as Exhibit 10.3 to our Current Report on Form 8-K filed with the SEC on August 24, 2011 and incorporated by reference herein. | |
10.9 | Fourth Amended, Restated and Consolidated Pledge Agreement, dated as of August 22, 2011, by and among MasTec, Inc., certain of its subsidiaries and Bank of America, N.A., as Administrative Agent filed as Exhibit 10.4 to our Current Report on Form 8-K filed with the SEC on August 24, 2011 and incorporated by reference herein. | |
10.10 | MasTec, Inc. Annual Incentive Plan for Executive Officers Plan, filed as Annex A to our Definitive Proxy Statement on Schedule 14A filed with the SEC on March 29, 2012, and incorporated by reference herein. | |
10.11+ | Employment Agreement, dated April 18, 2007, by and between MasTec, Inc. and Jose R. Mas, filed as Exhibit 10.1 to our Current Report on Form 8-K filed with the SEC on April 20, 2007 and incorporated by reference herein. | |
10.12+ | Employment Agreement, dated as of January 1, 2008, by and between MasTec, Inc. and Alberto de Cardenas, filed as Exhibit 10.53 to our Annual Report on Form 10-K filed with the SEC on February 28, 2008 and incorporated by reference herein. | |
10.13+ | Split-Dollar Agreement, dated as of October 16, 2013, by and among MasTec, Inc., Jorge Mas, and Jose Ramon Mas and Juan Carlos Mas, as Trustees of the Jorge Mas Irrevocable Trust, dated June 1, 2012, filed as Exhibit 10.1 to our Quarterly Report on Form 10-Q filed with the SEC on October 31, 2013 and incorporated by reference herein. | |
10.14 | Amendment No. 1 to Credit Agreement and Amendment No. 1 to Subsidiary Guaranty, dated as of October 29, 2013, by and among MasTec, Inc., MasTec North America, Inc., Bank of America, N.A., as Administrative Agent, Swing Line Lender, L/C Issuer and a Lender, each of the other Lenders party thereto and each of the Subsidiary Guarantors party thereto, filed as Exhibit 10.30 to our Annual Report on Form 10-K filed with the SEC on February 27, 2014 and incorporated by reference herein. | |
10.15+ | MasTec, Inc. Bargaining Units ESPP, filed as Annex A to our Definitive Proxy Statement on Schedule 14A filed with the SEC on March 29, 2012 and incorporated by reference herein. | |
10.16+ | MasTec, Inc. 2013 Incentive Compensation Plan, filed with the SEC on April 10, 2013 as Annex B to our Definitive Proxy Statement on Schedule 14A and incorporated by reference herein. | |
10.17+ | Form of Employee Stock Option Agreement for the MasTec, Inc. 2013 Incentive Compensation Plan, filed as Exhibit 10.33 to our Annual Report on Form 10-K filed with the SEC on February 27, 2014 and incorporated by reference herein. | |
10.18+ | Form of Employee Restricted Stock Agreement for the MasTec, Inc. 2013 Incentive Compensation Plan, filed as Exhibit 10.34 to our Annual Report on Form 10-K filed with the SEC on February 27, 2014 and incorporated by reference herein. | |
10.19+ | Form of Non-Employee Stock Option Agreement for the MasTec, Inc. 2013 Incentive Compensation Plan, filed as Exhibit 10.35 to our Annual Report on Form 10-K filed with the SEC on February 27, 2014 and incorporated by reference herein. | |
10.20+ | Form of Non-Employee Restricted Stock Agreement for the MasTec, Inc. 2013 Incentive Compensation Plan, filed as Exhibit 10.36 to our Annual Report on Form 10-K filed with the SEC on February 27, 2014 and incorporated by reference herein. | |
10.21+ | Amended and Restated Employment Agreement by and between MasTec, Inc. and C. Robert Campbell, dated January 23, 2014, filed as Exhibit 10.1 to our Current Report on Form 8-K filed with the SEC on January 24, 2014 and incorporated by reference herein. | |
10.22+ | Employment Agreement by and between MasTec, Inc. and George Pita, dated January 23, 2014, filed as Exhibit 10.2 to our Current Report on Form 8-K filed with the SEC on January 24, 2014 and incorporated by reference herein. | |
10.23+ | Split-Dollar Agreement between MasTec, Inc. and José Mas dated August 11, 2014, filed as Exhibit 10.2 to our Quarterly Report on Form 10-Q filed with the SEC on August 11, 2014 and incorporated by reference herein. | |
98
10.24 | Amendment No. 2 to Credit Agreement, dated as of June 25, 2014, by and among MasTec, Inc., MasTec North America, Inc., Bank of America, N.A., as Administrative Agent, Swing Line Lender, L/C Issuer and a Lender, each of the other Lenders party thereto and each of the Subsidiary Guarantors party thereto, filed as Exhibit 10.1 to our Quarterly Report on Form 10-Q filed with the SEC on August 11, 2014 and incorporated by reference herein. | |
10.25 | Amendment No. 4 to Credit Agreement, dated as of November 21, 2014, by and among MasTec, Inc., MasTec North America, Inc., Bank of America, N.A., as Administrative Agent, Swing Line Lender, L/C Issuer and a Lender, each of the other Lenders party thereto and each of the Subsidiary Guarantors Party thereto, filed as Exhibit 10.36 to our Annual Report on Form 10-K filed with the SEC on July 31, 2015 and incorporated by reference herein. | |
10.26+ | Deferred Fee Plan for Directors dated December 19, 2005, filed as Exhibit 10.38 to our Form 8-K filed with the SEC on December 23, 2005 and incorporated by reference herein. | |
12.1* | Statement Regarding Computation of Ratio of Earnings to Fixed Charges | |
21* | Subsidiaries of MasTec, Inc. | |
23.1* | Consent of Independent Registered Public Accounting Firm. | |
31.1* | Certifications required by Section 302(b) of the Sarbanes-Oxley Act of 2002. | |
31.2* | Certifications required by Section 302(b) of the Sarbanes-Oxley Act of 2002. | |
32.1** | Certifications required by Section 906 of the Sarbanes-Oxley Act of 2002. | |
32.2** | Certifications required by Section 906 of the Sarbanes-Oxley Act of 2002. | |
101.INS* | XBRL Instance Document | |
101.SCH* | XBRL Taxonomy Extension Schema | |
101.CAL* | XBRL Taxonomy Extension Calculation Linkbase | |
101.DEF* | XBRL Taxonomy Extension Definition Linkbase. | |
101.LAB* | XBRL Taxonomy Extension Label Linkbase | |
101.PRE* | XBRL Taxonomy Extension Presentation Linkbase | |
______________
(1) | SEC file number for all Securities Exchange Act reports referenced in the exhibit list is 001 - 08106. |
* | Filed herewith. |
** | Furnished herewith. |
+ | Management contract or compensation plan arrangement. |
99
MASTEC, INC.
SCHEDULE II – VALUATION AND QUALIFYING ACCOUNTS
(in millions)
Balance at Beginning of Period | Charges to Cost and Expense | (Deductions) | Balance at End of Period | ||||||||||||
Year ended December 31, 2015 | |||||||||||||||
Allowance for doubtful accounts | $ | 13.9 | $ | 2.1 | (a) | $ | (8.3 | ) | (b) | $ | 7.7 | ||||
Costs and earnings in excess of billings allowance | 12.5 | — | (a) | (5.6 | ) | (b) | 6.9 | ||||||||
Inventory valuation reserve | 6.4 | — | (c) | (3.6 | ) | (d) | 2.8 | ||||||||
Valuation allowance for deferred tax assets | 0.2 | 0.1 | (e) | — | (f) | 0.3 | |||||||||
Total | $ | 33.0 | $ | 2.2 | $ | (17.5 | ) | $ | 17.7 | ||||||
Year ended December 31, 2014 | |||||||||||||||
Allowance for doubtful accounts | $ | 15.7 | $ | 1.8 | (a) | $ | (3.6 | ) | (b) | $ | 13.9 | ||||
Costs and earnings in excess of billings allowance | 10.4 | 2.1 | (a) | — | (b) | 12.5 | |||||||||
Inventory valuation reserve | 2.6 | 3.8 | (c) | — | (d) | 6.4 | |||||||||
Valuation allowance for deferred tax assets | 0.1 | 0.1 | (e) | — | (f) | 0.2 | |||||||||
Total | $ | 28.8 | $ | 7.8 | $ | (3.6 | ) | $ | 33.0 | ||||||
Year ended December 31, 2013 | |||||||||||||||
Allowance for doubtful accounts | $ | 11.3 | $ | 6.1 | (a) | $ | (1.7 | ) | (b) | $ | 15.7 | ||||
Costs and earnings in excess of billings allowance | 1.7 | 8.7 | (a) | — | (b) | 10.4 | |||||||||
Inventory valuation reserve | 2.0 | 2.0 | (c) | (1.4 | ) | (d) | 2.6 | ||||||||
Valuation allowance for deferred tax assets | 2.0 | 0.2 | (e) | (2.1 | ) | (f) | 0.1 | ||||||||
Total | $ | 17.0 | $ | 17.0 | $ | (5.2 | ) | $ | 28.8 | ||||||
(a) | Provisions for doubtful accounts and costs and earnings in excess of billings. |
(b) | Write-offs and reversals of uncollectible accounts receivable and non-billable costs and earnings in excess of billings. |
(c) | Provision for inventory obsolescence. |
(d) | Inventory write-offs. |
(e) | Increase in the foreign tax loss carryforwards. |
(f) | Utilization of tax loss carryforwards and other tax benefits. |
100
SIGNATURES
Pursuant to the requirements of Section 13 or 15(d) of the Securities Exchange Act of 1934, the Registrant has duly caused this report to be signed on its behalf by the undersigned, thereunto duly authorized, in the City of Miami, State of Florida, on February 25, 2016.
MASTEC, INC. | |
/s/ JOSÉ R. MAS | |
José R. Mas | |
Chief Executive Officer | |
(Principal Executive Officer) | |
/s/ GEORGE L. PITA | |
George L. Pita | |
Chief Financial Officer | |
(Principal Financial and Accounting Officer) | |
Pursuant to the requirements of the Securities Exchange Act of 1934, this report has been signed below by the following persons on behalf of the Registrant and in the capacities indicated on February 25, 2016.
/s/ JORGE MAS | Chairman of the Board of Directors |
Jorge Mas | |
/s/ JOSÉ R. MAS | Chief Executive Officer and Director |
José R. Mas | (Principal Executive Officer) |
/s/ GEORGE L. PITA | Chief Financial Officer |
George L. Pita | (Principal Financial and Accounting Officer) |
/s/ ERNST N. CSISZAR | Director |
Ernst N. Csiszar | |
/s/ ROBERT J. DWYER | Director |
Robert J. Dwyer | |
/s/ JOHN VAN HEUVELEN | Director |
John Van Heuvelen | |
/s/ FRANK E. JAUMOT | Director |
Frank E. Jaumot | |
/s/ JULIA L. JOHNSON | Director |
Julia L. Johnson | |
/s/ JAVIER PALOMAREZ | Director |
Javier Palomarez | |
/s/ JOSÉ S. SORZANO | Director |
José S. Sorzano | |
101
Exhibit Index
Exhibits | Description (1) | |
3.1 | Composite Articles of Incorporation of MasTec, Inc. filed as Exhibit 3.1 to our Annual Report on Form 10-K filed with the SEC on February 25, 2010 and incorporated by reference herein. | |
3.2 | Amended and Restated By-laws of MasTec, Inc., amended and restated as of January 22, 2010, filed as Exhibit 3.1 to our Current Report on Form 8-K filed with the SEC on January 28, 2010 and incorporated by reference herein. | |
4.1 | Indenture, dated June 5, 2009, by and among MasTec, Inc., MasTec Inc.’s subsidiaries party thereto, as guarantors, and U.S. Bank National Association, as trustee filed as Exhibit 4.2 to our Current Report on Form 8-K filed with the SEC on June 5, 2009 and incorporated by reference herein. | |
4.2 | Fifth Supplemental Indenture, dated as of March 18, 2013, by and among MasTec, Inc., MasTec, Inc.’s subsidiaries party thereto, as guarantors, and U.S. Bank National Association, as trustee, filed as Exhibit 4.3 to our Current Report on Form 8-K filed with the SEC on March 18, 2013 and incorporated by reference herein. | |
4.3 | Sixth Supplemental Indenture, dated as of September 30, 2013, by and among MasTec, Inc., the new guarantors party thereto and U.S. Bank National Association, as trustee, filed as Exhibit 4.11 to our Annual Report on Form 10-K filed with the SEC on February 27, 2014 and incorporated by reference herein. | |
4.4 | Seventh Supplemental Indenture, dated as of November 11, 2013, by and among MasTec, Inc., the new guarantors party thereto and U.S. Bank National Association, as trustee, filed as Exhibit 4.12 to our Annual Report on Form 10-K filed with the SEC on February 27, 2014 and incorporated by reference herein. | |
4.5 | Eighth Supplemental Indenture, dated as of March 12, 2014, by and among MasTec, Inc., the new guarantors party thereto and U.S. Bank National Association, as trustee, filed as Exhibit 4.1 to our Quarterly Report on Form 10-Q filed with the SEC on August 11, 2014 and incorporated by reference herein. | |
4.6 | Ninth Supplemental Indenture, dated as of April 30, 2014, by and among MasTec, Inc., the new guarantors party thereto and U.S. Bank National Association, as trustee, filed as Exhibit 4.2 to our Quarterly Report on Form 10-Q filed with the SEC on August 11, 2014 and incorporated by reference herein. | |
4.7 | Tenth Supplemental Indenture, dated as of July 10, 2014, by and among MasTec, Inc., the new guarantors party thereto and U.S. Bank National Association, as trustee, filed as Exhibit 4.3 to our Quarterly Report on Form 10-Q filed with the SEC on August 11, 2014 and incorporated by reference herein. | |
4.8 | Eleventh Supplemental Indenture, dated as of August 8, 2014, by and among MasTec, Inc., the new guarantors party thereto and U.S. Bank National Association, as trustee, filed as Exhibit 4.1 to our Quarterly Report on Form 10-Q filed with the SEC on October 30, 2014 and incorporated by reference herein. | |
4.9 | Twelfth Supplemental Indenture, dated as of December 8, 2014, by and among MasTec, Inc., the new guarantors party thereto and U.S. Bank National Association, as trustee, filed as Exhibit 4.9 to our Annual Report on Form 10-K filed with the SEC on July 31, 2015 and incorporated by reference herein. | |
4.10 | Thirteenth Supplemental Indenture, dated as of April 10, 2015, by and among MasTec, Inc., the guarantors party thereto and U.S. Bank National Association, as trustee, filed as Exhibit 4.1 to our Current Report on Form 8-K filed with the SEC on April 13, 2015 and incorporated by reference herein. | |
4.11* | Fourteenth Supplemental Indenture, dated as of January 7, 2016, by and among MasTec, Inc., the new guarantors party thereto and U.S. Bank National Association, as trustee. | |
10.1+ | MasTec, Inc. Deferred Compensation Plan, effective as of June 1, 2008, filed as Exhibit 99.1 to our Current Report on Form 8-K filed with the SEC on April 4, 2008 and incorporated by reference herein. | |
10.2+ | Employment Agreement, effective as of January 1, 2010, between MasTec, Inc. and Robert Apple filed as Exhibit 10.2 to our Current Report on Form 8-K filed with the SEC on January 28, 2010 and incorporated by reference herein. | |
10.3+ | MasTec, Inc. 2011 Employee Stock Purchase Plan filed as Annex A to our Definitive Proxy Statement on Schedule 14A filed with the SEC on March 23, 2011 and incorporated by reference herein. | |
10.4 | Agreement and Plan of Merger, dated as of November 16, 2010, by and among MasTec, Inc., EC Source Services, LLC and the other parties thereto, filed as Exhibit 10.44 to our Quarterly Report on Form 10-Q filed with the SEC on May 4, 2011 and incorporated by reference herein. | |
10.5+ | Amendment to the MasTec, Inc. 2011 Employee Stock Purchase Plan, filed as Exhibit 10.4 to our Quarterly Report on Form 10-Q filed with the SEC on August 3, 2011 and incorporated by reference herein. | |
10.6 | Third Amended and Restated Credit Agreement, dated as of August 22, 2011, by and among MasTec, Inc., certain of its subsidiaries, Bank of America, N.A., as Administrative Agent, Swing Line Lender and an L/C Issuer, and the lenders party thereto, filed as Exhibit 10.29 to our Annual Report on Form 10-K/A, filed on June 22, 2012, and incorporated by reference herein. | |
10.7 | Consolidated, Amended and Restated Subsidiary Guaranty Agreement, dated as of August 22, 2011, by and among the Guarantors party thereto and Bank of America, N.A., as Administrative Agent filed as Exhibit 10.2 to our Current Report on Form 8-K filed with the SEC on August 24, 2011 and incorporated by reference herein. | |
10.8 | Security Agreement, dated as of August 22, 2011, by and among MasTec, Inc., certain of its subsidiaries and Bank of America, N.A., as Administrative Agent filed as Exhibit 10.3 to our Current Report on Form 8-K filed with the SEC on August 24, 2011 and incorporated by reference herein. | |
10.9 | Fourth Amended, Restated and Consolidated Pledge Agreement, dated as of August 22, 2011, by and among MasTec, Inc., certain of its subsidiaries and Bank of America, N.A., as Administrative Agent filed as Exhibit 10.4 to our Current Report on Form 8-K filed with the SEC on August 24, 2011 and incorporated by reference herein. | |
102
10.10 | MasTec, Inc. Annual Incentive Plan for Executive Officers Plan, filed as Annex A to our Definitive Proxy Statement on Schedule 14A filed with the SEC on March 29, 2012, and incorporated by reference herein. | |
10.11+ | Employment Agreement, dated April 18, 2007, by and between MasTec, Inc. and José R. Mas, filed as Exhibit 10.1 to our Current Report on Form 8-K filed with the SEC on April 20, 2007 and incorporated by reference herein. | |
10.12+ | Employment Agreement, dated as of January 1, 2008, by and between MasTec, Inc. and Alberto de Cardenas, filed as Exhibit 10.53 to our Annual Report on Form 10-K filed with the SEC on February 28, 2008 and incorporated by reference herein. | |
10.13+ | Split-Dollar Agreement, dated as of October 16, 2013, by and among MasTec, Inc., Jorge Mas, and José Ramon Mas and Juan Carlos Mas, as Trustees of the Jorge Mas Irrevocable Trust, dated June 1, 2012, filed as Exhibit 10.1 to our Quarterly Report on Form 10-Q filed with the SEC on October 31, 2013 and incorporated by reference herein. | |
10.14 | Amendment No. 1 to Credit Agreement and Amendment No. 1 to Subsidiary Guaranty, dated as of October 29, 2013, by and among MasTec, Inc., MasTec North America, Inc., Bank of America, N.A., as Administrative Agent, Swing Line Lender, L/C Issuer and a Lender, each of the other Lenders party thereto and each of the Subsidiary Guarantors party thereto, filed as Exhibit 10.30 to our Annual Report on Form 10-K filed with the SEC on February 27, 2014 and incorporated by reference herein. | |
10.15+ | MasTec, Inc. Bargaining Units ESPP, filed as Annex A to our Definitive Proxy Statement on Schedule 14A filed with the SEC on March 29, 2012 and incorporated by reference herein. | |
10.16+ | MasTec, Inc. 2013 Incentive Compensation Plan, filed with the SEC on April 10, 2013 as Annex B to our Definitive Proxy Statement on Schedule 14A and incorporated by reference herein. | |
10.17+ | Form of Employee Stock Option Agreement for the MasTec, Inc. 2013 Incentive Compensation Plan, filed as Exhibit 10.33 to our Annual Report on Form 10-K filed with the SEC on February 27, 2014 and incorporated by reference herein. | |
10.18+ | Form of Employee Restricted Stock Agreement for the MasTec, Inc. 2013 Incentive Compensation Plan, filed as Exhibit 10.34 to our Annual Report on Form 10-K filed with the SEC on February 27, 2014 and incorporated by reference herein. | |
10.19+ | Form of Non-Employee Stock Option Agreement for the MasTec, Inc. 2013 Incentive Compensation Plan, filed as Exhibit 10.35 to our Annual Report on Form 10-K filed with the SEC on February 27, 2014 and incorporated by reference herein. | |
10.20+ | Form of Non-Employee Restricted Stock Agreement for the MasTec, Inc. 2013 Incentive Compensation Plan, filed as Exhibit 10.36 to our Annual Report on Form 10-K filed with the SEC on February 27, 2014 and incorporated by reference herein. | |
10.21+ | Amended and Restated Employment Agreement by and between MasTec, Inc. and C. Robert Campbell, dated January 23, 2014, filed as Exhibit 10.1 to our Current Report on Form 8-K filed with the SEC on January 24, 2014 and incorporated by reference herein. | |
10.22+ | Employment Agreement by and between MasTec, Inc. and George Pita, dated January 23, 2014, filed as Exhibit 10.2 to our Current Report on Form 8-K filed with the SEC on January 24, 2014 and incorporated by reference herein. | |
10.23+ | Split-Dollar Agreement between MasTec, Inc. and José Mas dated August 11, 2014, filed as Exhibit 10.2 to our Quarterly Report on Form 10-Q filed with the SEC on August 11, 2014 and incorporated by reference herein. | |
10.24 | Amendment No. 2 to Credit Agreement, dated as of June 25, 2014, by and among MasTec, Inc., MasTec North America, Inc., Bank of America, N.A., as Administrative Agent, Swing Line Lender, L/C Issuer and a Lender, each of the other Lenders party thereto and each of the Subsidiary Guarantors party thereto, filed as Exhibit 10.1 to our Quarterly Report on Form 10-Q filed with the SEC on August 11, 2014 and incorporated by reference herein. | |
10.25 | Amendment No. 4 to Credit Agreement, dated as of November 21, 2014, by and among MasTec, Inc., MasTec North America, Inc., Bank of America, N.A., as Administrative Agent, Swing Line Lender, L/C Issuer and a Lender, each of the other Lenders party thereto and each of the Subsidiary Guarantors Party thereto, filed as Exhibit 10.36 to our Annual Report on Form 10-K filed with the SEC on July 31, 2015 and incorporated by reference herein. | |
10.26+ | Deferred Fee Plan for Directors dated December 19, 2005, filed as Exhibit 10.38 to our Form 8-K filed with the SEC on December 23, 2005 and incorporated by reference herein. | |
12.1* | Statement Regarding Computation of Ratio of Earnings to Fixed Charges | |
21* | Subsidiaries of MasTec, Inc. | |
23.1* | Consent of Independent Registered Public Accounting Firm. | |
31.1* | Certifications required by Section 302(b) of the Sarbanes-Oxley Act of 2002. | |
31.2* | Certifications required by Section 302(b) of the Sarbanes-Oxley Act of 2002. | |
32.1** | Certifications required by Section 906 of the Sarbanes-Oxley Act of 2002. | |
32.2** | Certifications required by Section 906 of the Sarbanes-Oxley Act of 2002. | |
101.INS* | XBRL Instance Document | |
101.SCH* | XBRL Taxonomy Extension Schema | |
101.CAL* | XBRL Taxonomy Extension Calculation Linkbase | |
101.DEF* | XBRL Taxonomy Extension Definition Linkbase. | |
101.LAB* | XBRL Taxonomy Extension Label Linkbase | |
101.PRE* | XBRL Taxonomy Extension Presentation Linkbase | |
(1) | SEC file number for all Securities Exchange Act reports referenced in the exhibit list is 001 - 08106. |
* | Filed herewith. |
** | Furnished herewith. |
+ | Management contract or compensation plan arrangement. |
103
104