Attached files
Table of Contents
UNITED STATES
SECURITIES AND EXCHANGE COMMISSION
Washington, D.C. 20549
Form 10-K
ANNUAL REPORT PURSUANT TO SECTION 13 OR 15(d)
OF THE SECURITIES EXCHANGE ACT OF 1934
For the fiscal year ended December 31, 2009
Commission File Number 001-08106

MasTec, Inc.
(Exact Name of Registrant as Specified in Its Charter)
| Florida | 65-0829355 | |
| (State or Other jurisdiction of | (I.R.S. Employer | |
| Incorporation or Organization) | Identification No.) | |
| 800 S. Douglas Road, 12th Floor, | ||
| Coral Gables, FL | 33134 | |
| (Address of Principal Executive Offices) | (Zip Code) | |
(305) 599-1800
(Registrant’s Telephone Number, Including Area Code)
Securities registered pursuant to Section 12(b) of the Exchange Act:
| Title of Each Class |
Name of Each Exchange on Which Registered | |
| Common Stock, $0.10 Par Value | New York Stock Exchange |
Securities registered pursuant to Section 12(g) of the Exchange Act: None
Indicate by check mark if the registrant is a well-known seasoned issuer; as defined in rule 405 of the Securities Act. Yes x No ¨
Indicate by check mark if the registrant is not required to file reports pursuant to Section 13 or Section 15(d) of the Act. Yes ¨ No x
Indicate by check mark whether the registrant (1) has filed all reports required to be filed by Section 13 or 15(d) of the Securities Exchange Act of 1934 during the preceding 12 months (or for such shorter period that the registrant was required to file such reports), and (2) has been subject to such filing requirements for the past 90 days. Yes x No ¨
Indicate by check mark whether the registrant has submitted electronically and posted on its corporate Web site, if any, every Interactive Data File required to be submitted and posted pursuant to Rule 405 of Regulation S-T (§ 232.405 of this chapter) during the preceding 12 months (or for such shorter period that the registrant was required to submit and post such files). Yes ¨ No ¨
Indicate by check mark if disclosure of delinquent filers pursuant to Item 405 of Regulation S-K (Section 229.405 of this chapter) is not contained herein, and will not be contained, to the best of registrant’s knowledge, in definitive proxy or information statements incorporated by reference in Part III of this Form 10-K or any amendment to this Form 10-K. ¨
Indicate by check mark if the registrant is a large accelerated filer, an accelerated filer, a non-accelerated filer, or a smaller reporting company. See the definitions of “large accelerated filer”, “accelerated filer”, and “smaller reporting company” in Rule 12b-2 of the Exchange Act. (Check one):
Large accelerated filer ¨ Accelerated filer x Non-accelerated filer ¨ Smaller reporting company ¨
Indicate by check mark whether the registrant is shell company (as defined in Rule 12b-2 of the Act.) Yes ¨ No x
The aggregate market value of the registrant’s outstanding common stock held by non-affiliates of the registrant computed by reference to the price at which the common stock was last sold as of the last business day of the registrant’s most recently completed second fiscal quarter was $638,408,933 (based on a closing price of $11.72 per share for the registrant’s common stock on the New York Stock Exchange on June 30, 2009).
There were 75,993,511 shares of common stock outstanding as of February 22, 2010.
The registrant’s definitive proxy statement to be filed with the Securities and Exchange Commission pursuant to Regulation 14A for the 2010 annual meeting of shareholders is incorporated by reference in Part III of this Form 10-K to the extent stated herein.
Table of Contents
| 4 | ||||
| Item 1. |
4 | |||
| Item 1A. |
13 | |||
| Item 1B. |
27 | |||
| Item 2. |
27 | |||
| Item 3. |
27 | |||
| Item 4. |
28 | |||
| 28 | ||||
| Item 5. |
28 | |||
| Item 6. |
30 | |||
| Item 7. |
Management’s Discussion and Analysis of Financial Condition and Results of Operations |
30 | ||
| Item 7A. |
45 | |||
| Item 8. |
46 | |||
| Item 9. |
Changes in and Disagreements with Accountants on Accounting and Financial Disclosure |
83 | ||
| Item 9A. |
83 | |||
| Item 9B. |
85 | |||
| 85 | ||||
| Item 10. |
85 | |||
| Item 11. |
85 | |||
| Item 12. |
Security Ownership of Certain Beneficial Owners and Management and Related Stockholder Matters |
85 | ||
| Item 13. |
Certain Relationships and Related Transactions, and Director Independence |
87 | ||
| Item 14. |
87 | |||
| 87 | ||||
| Item 15. |
87 | |||
| 92 | ||||
2
Table of Contents
Cautionary Statement Regarding Forward-Looking Statements
We are making this statement pursuant to the safe harbor provisions for forward-looking statements described in the Private Securities Litigation Reform Act of 1995. We make statements in this Annual Report on Form 10-K and in the documents that we incorporate by reference into this Annual Report that are forward-looking. When used in this Annual Report or in any other presentation, statements which are not historical in nature, including the words “anticipate,” “estimate,” “could,” “should,” “may,” “plan,” “seek,” “expect,” “believe,” “intend,” “target,” “will,” “project” and variations of these words and negatives thereof and similar expressions are intended to identify forward-looking statements. They also include statements regarding:
| • | our future growth and profitability; |
| • | our competitive strengths; and |
| • | our business strategy and the trends we anticipate in the industries and economies in which we operate. |
These forward-looking statements are based on our current expectations and are subject to a number of risks, uncertainties and assumptions. These statements are not guarantees of future performance and are subject to risks, uncertainties and other factors, some of which are beyond our control, are difficult to predict, and could cause actual results to differ materially from those expressed or forecasted in the forward-looking statements. Important factors that could cause actual results to differ materially from those in forward-looking statements include:
| • | further or continued economic downturns, reduced capital expenditures, reduced financing availability, customer consolidation and technological and regulatory changes in the industries we serve; |
| • | market conditions, technical and regulatory changes that affect us or our customers’ industries; |
| • | our ability to estimate the costs associated with our fixed price and other contracts and performance on such projects; |
| • | our ability to replace non-recurring projects with new projects; |
| • | our ability to retain qualified personnel and key management, including from acquired businesses, enforce any noncompetition agreements, integrate acquired businesses within expected timeframes and achieve the revenue, cost savings and earnings levels from such acquisitions at or above the levels projected; |
| • | the impact of the American Recovery and Reinvestment Act of 2009 (the “Stimulus Act”) and any similar local or state regulations affecting renewable energy, electrical transmission, broadband and related projects and expenditures; |
| • | the effect of state and federal regulatory initiatives, including costs of compliance with existing and future environmental requirements; |
| • | our ability to attract and retain qualified managers and skilled employees; |
| • | trends in oil and natural gas prices; |
| • | increases in fuel, maintenance, materials, labor and other costs; |
| • | the timing and extent of fluctuations in geographic, weather, equipment and operational factors affecting the industries in which we operate; |
| • | any material changes in estimates for legal costs or case settlements or adverse determinations on any claim, lawsuit or proceeding; |
| • | the highly competitive nature of our industry; |
| • | our dependence on a limited number of customers; |
| • | the ability of our customers, including our largest customers, to terminate or reduce the amount of work, or in some cases prices paid for services on short or no notice under our contracts; |
| • | the impact of any unionized workforce on our operations, including labor availability and relations; |
| • | liabilities associated with multiemployer union pension plans, including underfunding liabilities, for our operations that employ unionized workers; |
| • | any liquidity issues related to our securities held for sale; |
| • | the adequacy of our insurance, legal and other reserves and allowances for doubtful accounts; |
| • | any exposure related to our divested state Department of Transportation projects and assets; |
3
Table of Contents
| • | restrictions imposed by our credit facility, senior notes, convertible notes and any future loans or securities; |
| • | the outcome of our plans for future operations, growth and services, including business development efforts, backlog and acquisitions; |
| • | any dilution or stock price volatility which shareholders may experience in connection with shares we may issue as consideration for earn-out obligations in connection with past or future acquisitions, or as a result of conversions of convertible notes or other stock issuances; and |
| • | the other factors referenced in this Annual Report, including, without limitation, under “Item 1. Business”, “Item 1A Risk Factors”, “Item 7. Management’s Discussion and Analysis of Financial Condition and Results of Operations” and other factors detailed from time to time in the reports and other filings we make with the Securities and Exchange Commission. |
We believe these forward-looking statements are reasonable; however, you should not place undue reliance on any forward-looking statements, which are based on current expectations. Furthermore, forward-looking statements speak only as of the date they are made. If any of these risks or uncertainties materialize, or if any of our underlying assumptions are incorrect, our actual results may differ significantly from the results that we express in, or imply by, any of our forward-looking statements. These and other risks are detailed in this Annual Report on Form 10-K, in the documents that we incorporate by reference into this Annual Report on Form 10-K and in other documents that we file with the Securities and Exchange Commission. We do not undertake any obligation to publicly update or revise these forward-looking statements after the date of this Annual Report on Form 10-K to reflect future events or circumstances. We qualify any and all of our forward-looking statements by these cautionary factors.
| Item 1. | Business |
Overview
We are a leading specialty contractor operating mainly throughout the United States and across a range of industries. Our core activities are the building, installation, maintenance and upgrade of utility and communications infrastructure, including but not limited to: electrical utility transmission and distribution, wind farm, solar farm and other renewable energy, natural gas and petroleum pipeline infrastructure, wireless, wireline and satellite communications and water and sewer systems. Our primary customers are in the following industries: utilities (including wind farms, solar farms and other renewable energy, natural gas gathering systems and pipeline infrastructure), communications (including telephony, satellite television and cable television) and government (including water and sewer, utilities and communications work on military bases).
We, or our predecessor companies, have been in business for over 75 years. We offer our services primarily under the MasTec service mark and operate through a network of approximately 200 locations and approximately 8,600 employees as of December 31, 2009. We have consistently ranked among the top specialty contractors by Engineering News-Record over the past five years.
We serve a diversified domestic customer base including DIRECTV®, AT&T, Enbridge, Verizon, Duke Energy, Iberdrola Renewables, Great River Energy, Florida Power & Light, Oneok and Dominion Virginia Power. For the years ended December 31, 2009, 2008 and 2007, approximately 72%, 72% and 77% of our revenues were from our ten largest customers, respectively. We have longstanding relationships with many customers and often provide services under multi-year master service agreements and other service agreements.
We have continued our diversification and expansion strategy through several recent acquisitions which have expanded our service offerings to customers. During 2007 and 2008, we acquired the remaining ownership interest in GlobeTec Construction, LLC. GlobeTec is involved in the construction and maintenance of water and sewer pipelines and projects. In October 2007, we acquired Three Phase Line Construction, Inc., which is involved in the construction and maintenance of transmission and distribution utility systems, substation and storm restoration in several northern states and has a largely unionized workforce, which is required for certain projects. In December 2007, we acquired certain assets of Power Partners, LLC, an electrical utility contractor specializing in wind farm electrical system design and construction. In May 2008, we acquired Pumpco, Inc., which we refer to as Pumpco, a mid-stream natural gas pipeline construction company. In July 2008, we acquired certain assets of Nsoro, LLC, which specializes in wireless network design, construction, upgrade and maintenance. In December 2008, we acquired Wanzek Construction, Inc., which we refer to as Wanzek, a construction company focusing on wind farm, heavy civil and industrial and infrastructure construction. In November 2009, we acquired Precision Pipeline, LLC, which we refer to as Precision, a large diameter natural gas, crude oil and refined products transmission pipeline construction and infrastructure services provider, which has a largely unionized workforce.
4
Table of Contents
In June 2009, we completed an underwritten public offering for $115 million of 4% senior convertible notes, as well as a public secondary offering of 5.175 million shares of common stock by certain selling shareholders. The 4% senior convertible notes are convertible into shares of our common stock at a conversion price of approximately $15.76 per share of common stock, and are subject to customary anti-dilution adjustment terms for these types of notes. The proceeds from the 4% senior convertible notes were used to repay the $55 million of 8% convertible notes, convertible at $12.00 per share, issued in connection with our 2008 acquisition of Wanzek, and to pay off the outstanding balance on our credit facility of approximately $20 million. The remaining net proceeds were used for working capital, acquisitions and for general corporate purposes.
Concurrent with the issuance of the 4% senior convertible notes, Jon Wanzek, CEO of Wanzek and his affiliates sold 5.175 million shares of MasTec common stock in an underwritten registered public offering. Mr. Wanzek and his affiliates received 7.5 million MasTec shares in connection with our 2008 acquisition of Wanzek. Mr. Wanzek continues to serve as President of Wanzek under an employment contract. We did not receive any proceeds from the sale of the shares of common stock by the selling shareholders.
In November 2009, we purchased all of the issued and outstanding membership interests of Precision Pipeline, LLC for approximately $132 million in cash, the assumption of $34 million of Precision’s debt and a five-year earn-out equal to 40% of Precision’s EBITDA (as defined in the purchase agreement) for the last two months of 2009 and 30% of Precision’s annualized EBITDA in excess of $35 million for the remainder of the earn-out period, payable at our option in cash or shares of our common stock, or a combination thereof. Concurrent with the Precision acquisition, we issued $100 million of 4.25% senior convertible notes. The 4.25% senior convertible notes are convertible into shares of our common stock at a conversion price of approximately $15.48 per share of common stock, and are subject to customary anti-dilution adjustment terms for these types of notes. The net proceeds from the offering were used to fund the acquisition of Precision and for general corporate purposes.
Precision, based in Eau Claire, Wisconsin, is a leading energy infrastructure services provider, specializing in the construction and maintenance of large diameter pipelines. Precision’s experience in the long-haul, interstate pipeline industry complements our existing energy infrastructure service offerings, which include natural gas gathering systems, processing plants and compression stations and mid-stream pipelines. We believe that our acquisition of Precision enhances our end-to-end design and construction capabilities within the energy industry. With the acquisition of Precision, we become one of the leading pipeline contractors in the country, capable of providing a full array of construction services to oil and gas producers, as well as mid-stream and interstate pipeline operators.
Industry Trends
Our industry is composed of national, regional and local companies that provide outsourced infrastructure services to customers in the utilities and communications industries as well as to government customers.
We believe the following industry trends impact demand for our services:
Stimulus Act. The American Recovery and Reinvestment Act of 2009, or the Stimulus Act, signed on February 17, 2009, should have a positive impact on our customer spending in a number of important areas, plus offer additional incentives that should benefit our business. The Stimulus Act extends the federal tax incentives applicable to the wind energy industry, specifically the production tax credit for wind projects placed into service before 2013, and allows wind projects to claim the investment tax credit equal to 30% of the cost of certain qualifying assets that may be elected in lieu of claiming the production tax credit. The production tax credit provides the owner of a U.S. wind facility (consisting primarily of the pad, tower and turbine) with a ten-year credit against its federal income tax obligations based on the amount of electricity produced at such facility by the owner and sold to unrelated persons during that period. The Stimulus Act also includes a U.S. Treasury grant program which allows taxpayers that own production tax credit-eligible and investment tax credit-eligible facilities to receive grants from the U.S. Treasury equal to the amount of the investment tax credit that would otherwise be available to the facility. The accelerated depreciation provisions for wind generation assets provides for a five year depreciable life for these assets, rather than the 15 to 20 year depreciable lives of many non-renewable energy assets. In addition, historically these incentives have increased the construction activity in this sector and are expected to do so in the future. The Stimulus Act also contains several provisions aimed at improving the U.S.’s electrical transmission system in part to facilitate the transfer of renewable energy from rural areas to high demand areas, including at least $6 billion in funds for renewable energy and transmission loan guarantees, which are expected to facilitate more than $60 billion in loans for these projects. The Stimulus Act also provides for $7.2 billion in funds for the development of broadband facilities throughout the United States. While we believe the Stimulus Act will provide opportunities in the industries we serve, we are uncertain as to when, or if, the governmental stimulus initiatives will begin to have a noticeable impact on the industries we serve. We do, however, anticipate increased capital spending on infrastructure in the future.
5
Table of Contents
Renewable Energy Projects. The desire to decrease the country’s dependence on foreign oil imports and the focus on a clean environment have created demand for more domestic, environmentally sensitive electrical power production such as wind and solar collection farms. According to the American Wind Energy Association, as of December 31, 2009, the United States had approximately 35,200 megawatts of installed wind farm generating capacity, with approximately 9,900 megawatts added in 2009. There are approximately 3,200 megawatts currently under construction. According to the Federal Energy Regulatory Commission’s (“FERC”) Market Oversight Report from December 2009, 30 states in the United States and the District of Columbia have already adopted renewable portfolio standards or goals, which standards require or target that certain specified percentages of energy sales or installed capacity come from renewable sources such as wind, solar, geothermal or biofuel. In its 2009 Long-Term Reliability Assessment, North American Electric Reliability Corporation, or NERC, the organization of U.S. electric grid operators, projects approximately 260,000 megawatts of new renewable capacity over the coming ten years, with 96 percent of this comprised of wind. As a result of these trends, Emerging Energy Research, or EER, forecasted that more than $66 billion will be invested in additional wind energy capacity in the United States through 2013. The Stimulus Act, which calls for expansion of domestic renewable energy sources through tax incentives and loan guarantees, should also provide our wind farm business with the potential for sustained growth.
Wind power generation is only feasible where adequate average wind speed and consistency are present. The principal onshore wind resource in the United States is located in the central plains area of the country, roughly from the Texas panhandle to the Canadian border. This wind corridor is a relatively remote area where population density and industrial energy demand are relatively low. As a result, often few traditionally fueled generation facilities exist in these areas and extensive collection and transmission projects are also necessary to connect these renewable energy generation projects to the electrical grid.
We believe that demand for new domestic sources of clean power generation and the related substations and transmission lines necessary to connect them to the electrical grid will provide significant growth prospects for the foreseeable future. The new generation of wind turbines can produce electrical power at more competitive rates. Currently, approximately 2% of the United States’ electrical needs are met by wind power generation. A July 2008 report by the U.S. Department of Energy, however, presents a roadmap for increasing wind power generation to 20% of demand by 2030, which would require hundreds of billions of dollars in new wind farm investment and transmission lines. In July 2009, the Department of Energy, or DOE, announced the selection of 28 new wind energy projects for up to $13.8 million in funding, including $12.8 million in Stimulus Act funds. These projects will help address market and deployment challenges, including wind turbine research, testing and transmission analysis, planning and assessments. The DOE’s 2008 Wind Technologies Market Report detailed $16 billion in investment in wind projects made in the U.S in 2008, making the U.S. the leader in annual wind energy capacity growth, as well as cumulative wind energy capacity.
We also believe that U.S. energy policy goals will continue to promote domestic sources of energy in order to reduce U.S dependence on foreign energy sources. With recent developments in drilling and completion technologies for oil and gas, we expect new North American producing fields to be developed and old fields to be expanded significantly. According to FERC’s 2009 Long-Term Reliability Assessment, by 2011, natural gas is projected to overtake coal as the dominant fuel source for peak capacity generation in North America. We anticipate the resulting incremental production will provide continuing construction opportunities as oil and gas producers and pipeline operators move oil, gas and refined products to markets via pipelines, providing us with robust pipeline and related construction opportunities. As evidence of this expected growth, as of October 15, 2009, FERC had over 5,000 miles of pending major pipeline projects on file.
With the acquisition of Precision, combined with our historical gas gathering system business and the recent acquisitions of Pumpco, Inc. (specializing in mid-stream natural gas pipeline) and Wanzek (specializing in wind, solar and natural gas compression and industrial plant construction), we expect to be a leading player in both renewable energy and gas, crude oil and crude oil products transmission pipeline infrastructure.
Inadequacy of Existing Electric Power Transmission and Distribution Networks. The United States’ electric transmission and distribution infrastructure requires significant ongoing maintenance, upgrades and extensions to manage power line congestion and avoid delivery failures. According to a November 2008 report published by the Edison Electric Institute, or EEI, the projected investment in new transmission systems from 2009 to 2013 is $27 billion and $298 billion for the period 2010 to 2030. Additionally, new renewable energy generation projects, including wind and solar collection farms, are typically located in remote areas, consequently significant investment in new transmission lines will be required to connect this power to the electrical grid and to transport this power to more populated or industrial areas with higher demand. For example, in July 2008, the Texas Public Utility Commission, or PUC, approved the investment of approximately $4.9 billion for the construction of electric transmission lines to carry power generated by new wind farms in remote western and northern parts of state to major population and industrial centers in Texas. In 2009, the PUC issued the order for construction of these transmission lines.
6
Table of Contents
While the electrical grid reliability continues to deteriorate, demand for electricity is expected to continue to grow as the economy recovers. According to the 2010 Annual Energy Outlook published by the U.S. DOE’s Energy Information Administration, or EIA, the population of the United States will increase by about 28% from 2008 to 2035, with energy consumption increasing by a corresponding 14%. Additionally, the same EIA report projects that total U.S. electricity consumption will increase by approximately 29% from 3,880 billion kilowatt-hours in 2008 to 5,020 billion kilowatt-hours in 2035. NERC reports in its 2009 Long-Term Reliability Assessment that peak demand for electricity in the U.S., which typically occurs in the summer, is forecast to increase by 14.8% over the next ten years. The Stimulus Act allocates $11 billion in funds for modernization and expansion of the nation’s electrical grid in order to develop a smart grid.
Based on their 2009 Long-Term Reliability Assessment, NERC projects the number of transmission miles will increase 32,000 circuit miles in the U.S. over the next ten years. We believe spending levels will continue to increase as utilities work to address infrastructure maintenance requirements, as well as the future reliability standards required by the Energy Policy Act of 2005, or the Energy Act.
Increased Production and Demand for Natural Gas. Natural gas is one of the cleanest burning hydrocarbon fuels and is in demand due to its relative cost advantage over other fossil fuel sources. The level of natural gas pipeline construction activity in the United States is expected to increase. According to a report published in October 2009 by the Interstate National Gas Association approximately 2,500 – 3,500 miles of U.S. pipeline projects are expected through 2012. We believe that as new unconventional shale gas reserves are developed, the demand for additional gas transport projects will grow.
Demand for Increased Wireless and Wired Voice, Video and Data Services. Demand for faster and more robust voice, video and data services has increased significantly with the proliferation of the Internet, broadband, video and music download services, high definition television and other advanced video services. To serve this developing market and the ever-increasing need for more bandwidth, voice, video and data for fixed and mobile devices, service providers are upgrading the performance of their wired and wireless networks or deploying new competing networks using new technologies such as Worldwide Interoperability for Microwave Access, or WiMax. Investment is facilitated by declining equipment costs and expanded capabilities of wireline and wireless network equipment. At the same time, major regional and rural telecommunication companies are upgrading their networks from copper line to fiber optic line in order to enhance their ability to provide customers with bundled services that include video, voice and data. Similar dynamics of providers seeking to improve their offerings are prevalent in the cable and satellite markets as well. The Stimulus Act allocates $7.2 billion for the development of broadband facilities throughout the U.S. and the expansion of broadband access into areas that are currently not served by high-speed data networks.
Competitive Strengths
Our competitive strengths include:
Diverse Customer Relationships. We serve a diversified customer and industry base. Our customers include some of the largest contractors, communications, utility and wind farm companies in the United States, including DIRECTV®, AT&T, Enbridge, Verizon, Duke Energy, Iberdrola Renewables, Great River Energy, Florida Power & Light, Oneok and Dominion Virginia Power. We have longstanding relationships with many customers and often provide services to many of our significant customers under multi-year master service agreements and other service agreements. Furthermore, we believe that since acquiring Wanzek and Precision, no single customer will account for greater than 30% of our revenue.
National Footprint. We, or our predecessor companies, have been in business for over 75 years and we are one of the largest companies in our industry. Through our network of over 200 locations and approximately 8,600 employees across the United States, as of December 31, 2009, we offer consistent, comprehensive infrastructure services to our customers nationwide. We believe our experience, technical expertise, geographic reach and size are important to our customers.
Ability to Respond Quickly and Effectively. The skills required to serve our end markets are similar, which allows us to utilize qualified personnel across multiple industries. We are able to respond quickly and effectively to industry changes and major weather events by allocating our employees, fleet and other assets as and where they are needed, enabling us to provide cost effective and timely services for our customers.
7
Table of Contents
Reputation for Reliable Customer Service and Technical Expertise. We believe that over the years we have established a reputation for quality customer service and technical expertise. We also believe our reputation for technical expertise gives us an advantage in competing for new work from both our existing and potential customers. Additionally, the technical expertise gained through recent acquisitions broadens our exposure in areas of wind power and renewable energy, wireless technology and pipeline infrastructure.
Experienced Management Team. Our management team, which includes our chief executive officer, president, chief operating officer, group presidents and financial officers, plays a significant role in establishing and maintaining long-term relationships with our customers, supporting the growth of our business and managing the financial aspects of our operations. Our chief executive officer, president, chief operating officer and business unit presidents average 20 plus years of industry experience and have a deep understanding of our customers and their requirements. Generally, key managers and founders of our recently acquired companies continue to work for us under long-term employment agreements or services agreements and, in some cases, earn-out arrangements.
Strategy
The key elements of our business strategy are as follows:
Focus on Growth Opportunities. We believe that the end markets we focus on offer several compelling growth opportunities. We expect increased spending by key customers in industries in which we provide services. We expect wind and solar farm development and maintenance, natural gas pipeline infrastructure development, electrical transmission and distribution grid upgrades and expansions and wireless infrastructure expansion, to be areas of high investment and opportunity over the next few years. We intend to use our national presence, technical expertise, customer relationships and full range of services to capitalize on these trends to grow our business.
Operational Excellence. We intend to continue improving our operating margins and cash flows by focusing on profitable services and on projects that have higher margins, while continuing to improve our working capital management. We intend to improve our operating effectiveness by, in some cases, allocating our resources across multiple customers and projects which will continue to increase our utilization rates. We intend to continue our actions and programs we have instituted to improve our operating efficiencies and working capital management, such as hiring additional experienced operating and financial professionals, increasing accountability throughout our organization, expanding the use of our Oracle management information systems, managing customer contract bidding procedures more effectively and increasing individual project profitability.
Maintain Conservative Capital Structure. We have increased our financial resources in recent years with the offering of our senior notes in 2007, the expansion of our credit facility in 2008 and two separate senior convertible note offerings in 2009. Further, during the first quarter of 2009, Moody’s reaffirmed our credit ratings. We intend to maintain a prudent capital structure.
Focus on Acquisition Integration. Several acquisitions over the last few years have diversified our business and expanded our service offerings to our customers. Our strategy includes timely and efficient integration of these acquisitions to best fit into our internal control environment and to maximize the potential of the acquisitions.
Leverage Core Expertise Through Acquisitions and Strategic Alliances. We may pursue selected acquisitions and strategic alliances that allow us to expand our operations into targeted geographic areas or allow us to expand our service offerings in related fields.
Services
Our core services are building, installing, maintaining and upgrading infrastructure for communications, utility and government customers. We provide similar services to each of these customers, including:
Build. We build wind farms, solar farms, underground and overhead distribution systems, such as trenches, conduits, cable, power lines and pipelines, which provide wireless and wireline communications, electrical power generation and delivery, and natural gas, crude oil and refined product transport pipelines.
Install. We install buried and aerial fiber optic cables, coaxial cables, copper lines, electrical and other energy distribution systems, transmission systems and satellite dishes in a variety of environments for our customers. In connection with our installation work, we deploy and manage network connections that involve our customers’ hardware, software and network equipment.
8
Table of Contents
Maintain and Upgrade. We offer 24-hours-a-day, 7-days-a-week and 365-days-a-year maintenance and upgrade support to our customers. Our comprehensive service offerings include the regular maintenance of our customers’ distribution facilities and networks as well as emergency services for accidents or storm damage. Our upgrade work ranges from routine replacements and upgrades to major network overhauls.
Customers
We provide building, installation, maintenance and upgrade services to our customers, which are companies in the communications and utilities industries, as well as government customers.
We have longstanding relationships with many customers, and a significant portion of our revenue is derived from projects performed under service agreements. We also provide services under master service agreements which are generally multi-year agreements. Certain of our master service agreements are exclusive up to a specified dollar amount per work order for each defined geographic area but do not obligate our customers to undertake any infrastructure projects or other work with us. Work performed under master service and other agreements is typically generated by work orders, each of which is performed for a fixed fee. The majority of these services are for either maintenance or upgrade services. These master service agreements and other service agreements are frequently awarded on a competitive bid basis, although customers may negotiate contract extensions beyond their original terms without re-bidding. Our master service agreements and other service agreements have various terms, depending upon the nature of the services provided and are typically subject to termination on short notice.
During the year ended December 31, 2009, DIRECTV® and AT&T accounted for 30% and 16% of total revenue, respectively. During the year ended December 31, 2008, DIRECTV® and AT&T accounted for 34% and 12% of total revenue, respectively. During the year ended December 31, 2007, DIRECTV® accounted for 44% of total revenue. Our relationship with DIRECTV® is based upon two agreements to provide installation, upgrade and maintenance services for DIRECTV® customers and, in support of the installation business, to provide marketing and sales services on behalf of DIRECTV®. Our relationship with AT&T is primarily based upon master service agreements, other service agreements and construction/installation contracts for both AT&T’s wireline and wireless infrastructure.
The remainder of our work is generated pursuant to contracts for specific projects that may require the construction and installation of specified units within an infrastructure system or an entire infrastructure system. Customers are billed with varying frequency: weekly, monthly or upon attaining specific milestones. Such contracts generally include retainage provisions under which 2% to 15% of the contract price is withheld from us until the work has been completed and accepted by the customer.
We believe that our industry experience, technical expertise and customer service are important to our being retained by large utility and communications companies and governments. The relationships developed between these customers and our senior management and project management teams are also important to our being retained.
Backlog
Our 18-month backlog was approximately $2.1 billion as of December 31, 2009 and $1.7 billion as of December 31, 2008. We expect to realize approximately 77% of our 2009 backlog in 2010. Approximately 66% of our backlog at December 31, 2009 was comprised of services to be performed under existing master service agreements and long term contracts. The balance is our estimate of work to be completed on other service agreements. See “Item 1A. Risk Factors - Amounts included in our backlog may not result in actual revenue or translate into profits.”
Sales and Marketing
We market our services individually and in combination with other companies to provide what we believe is the most efficient and effective solution to meet our customers’ demands, which increasingly require resources from multiple disciplines. Through our unified MasTec® brand and an integrated organizational structure designed to permit rapid deployment of labor, equipment and materials, we are able to quickly and efficiently allocate resources to meet customer needs.
We have developed a marketing plan emphasizing the MasTec® registered service mark and tradenames of certain acquired companies, as well as, an integrated service offering to position ourselves as a provider of a full range of service solutions, providing services ranging from basic installation to sophisticated engineering, design and integration. We believe our long-standing relationships with our customers and reputation for reliability and efficiency facilitate our recurring business. Our marketing efforts are principally carried out by the management of our project groups in coordination with our corporate marketing organization. Our
9
Table of Contents
management team has many years of industry experience, both at the service provider level and in some cases with the customers we serve. Our project group managers market directly to existing and potential customers for new contracts and also market our company to be placed on lists of vendors invited to submit proposals for service agreements and individual projects. Our executive management supplements these efforts at the national level.
Safety and Insurance/Risk Management
We strive to instill safe work habits in our employees. We require our employees to participate in internal training and service programs relevant to their employment and to complete any training programs required by law. We evaluate employees in part based upon their safety records and the safety records of the employees they supervise. We have established a company-wide safety program to share best practices and to monitor and improve compliance with safety procedures and regulations.
Our business involves heavy equipment and exposure to conditions that can be dangerous. While we are committed to operating safely and prudently, we are subject to claims by employees, customers and third parties for property damage and personal injuries that occur in connection with our work. See “Item 1A. Risk Factors - Our business is subject to hazards that could result in substantial liabilities and weaken our financial condition.”
We presently maintain insurance policies subject to per claim deductibles of $1 million for our workers’ compensation policy, $2 million for our general liability policy and $2 million for our automobile liability policy. We have excess umbrella coverage of up to $100 million per claim and in the aggregate. We also maintain an insurance policy with respect to employee group health claims subject to per claim deductibles of $0.4 million. See “Item 1A. Risk Factors - We are self-insured against many potential liabilities.” We are required to periodically post letters of credit and provide cash collateral to our insurance carriers related to our insurance programs. Total outstanding letters of credit related to our insurance programs amounted to $66.9 million and cash collateral posted amounted to $3.0 million at December 31, 2009. See “Item 7. Management’s Discussion and Analysis of Financial Condition and Results of Operations - Critical Accounting Policies and Estimates-Insurance Reserves.”
Suppliers, Materials and Working Capital
Under many of our contracts, our customers supply the necessary materials and supplies and we are responsible for installation, but not for material costs or material warranties. Under certain of our contracts we acquire materials and supplies for our own account from third-party providers. We are not dependent on any one supplier for materials or supplies and have not experienced any significant difficulty in obtaining an adequate supply of materials and supplies.
We utilize independent contractors to assist on projects and to help us manage work flow. Our independent contractors are typically sole proprietorships or small business entities that provide their own vehicles, tools and insurance coverage. We are not dependent on any single independent contractor. See “Item 1A. Risk Factors - We may choose, or be required, to pay our subcontractors even if our customers do not pay, or delay paying, us for the related services.”
We need working capital to support seasonal variations in our business, primarily due to the impact of weather conditions on external construction and maintenance work, including storm restoration work, and the corresponding spending by our customers on their annual capital expenditure budgets. Our business is typically slower in the first quarter of each calendar year. We generally experience seasonal working capital needs from approximately April through December to support growth in unbilled revenue and accounts receivable, and to a lesser extent, inventory. Our billing terms are generally net 30 to 60 days, although some contracts allow our customers to retain a portion (from 2% to 15%) of the contract amount until the contract is completed. We maintain inventory to meet the material requirements of some of our contracts. Some of our customers pay us in advance for a portion of the materials we purchase for their projects, or allow us to pre-bill them for materials purchases up to a specified amount. Our vendors generally offer us terms ranging from 30 to 90 days. Our agreements with subcontractors often contain a “pay-when-paid” provision, whereby our payments to subcontractors are made only after we are paid by our customers.
Competition
Our industry is highly competitive and highly fragmented. We often compete with a number of companies in markets where we operate, ranging from small local independent companies to large national firms. The national or large regional firms that compete with us include Quanta Services, Inc., Pike Electric, Inc., Bechtel Corporation, M.A. Mortenson Company, D.H. Blattner & Sons, Inc., and Dycom Industries, Inc.
10
Table of Contents
Relatively few significant barriers to entry exist in the markets in which we operate and, as a result, any organization that has adequate financial resources and access to technical expertise may become a competitor. Some of our customers employ personnel to perform infrastructure services of the type we provide. We compete based upon our industry experience, technical expertise, financial and operational resources, nationwide presence, industry reputation and customer service. While we believe our customers consider a number of factors when selecting a service provider, most of their work is awarded through a bid process. Consequently, price is often a principal factor in determining which service provider is selected. See “Item 1A. Risk Factors - Our industry is highly competitive which may reduce our market share and harm our financial performance.”
Regulation and Environmental Matters
We are subject to state and federal laws that apply to businesses generally, including laws and regulations related to labor relations, worker safety and environmental protection. While many of our customers operate in regulated industries (for example, utilities regulated by the public service commission or broadband companies regulated by franchise agreements with various municipalities), we are not generally subject to such regulation and oversight.
As a contractor, our operations are subject to various laws, including:
| • | regulations related to vehicle registrations, including those of state and the United States Departments of Transportation; |
| • | regulations related to worker safety and health, including those established by the Occupational Safety and Health Administration; |
| • | contractor licensing requirements; |
| • | building and electrical codes; and |
| • | permitting and inspection requirements. |
We are also subject to numerous environmental laws governing our operations, including the handling, transportation and disposal of non-hazardous and hazardous substances and wastes, as well as emissions and discharges into the environment, including discharges into air, surface water and groundwater and soil. We also are subject to laws and regulations that impose liability and cleanup responsibility for releases of hazardous substances into the environment. Under certain of these laws and regulations, such liabilities can be imposed for cleanup of properties, regardless of whether we directly caused the contamination or violated any law at the time of discharge or disposal. The presence of contamination from such substances or wastes could interfere with ongoing operations or adversely affect our business. In addition, we could be held liable for significant penalties and damages under certain environmental laws and regulations. For example,
| • | Some of the work we perform is in underground environments. If the field location maps supplied to us are not accurate, or if objects are present in the soil that are not indicated on the field location maps, our underground work could strike objects in the soil containing pollutants and result in a rupture and discharge of pollutants. In such a case, we may be liable for fines and damages. |
| • | We own and lease several facilities at which we store our equipment. Some of these facilities contain fuel storage tanks which may be above or below ground. If these tanks were to leak, we could be responsible for the cost of remediation as well as potential fines. |
| • | We sometimes perform directional drilling operations in certain environmentally sensitive terrains and water bodies. Due to the inconsistent nature of the terrain and water bodies, it is possible that such directional drilling may cause a surface fracture releasing subsurface materials. These releases may contain contaminants in excess of amounts permitted by law, potentially exposing us to remediation costs and fines. |
See “Item 1A. Risk Factors - Our failure to comply with environmental laws could result in significant liabilities.”
We believe we have all licenses and permits needed to conduct operations and that we are in compliance with all material applicable regulatory requirements. However, if we fail to comply with any material applicable regulatory requirements, we could incur significant liabilities. See “Item 1A. Risk Factors - Our failure to comply with regulations of the U.S. Occupational Safety and Health Administration, the U.S. Department of Transportation and other state and local agencies that oversee transportation and safety compliance could reduce our revenue, profitability and liquidity.”
11
Table of Contents
We offer services and are branded under the MasTec® and other service marks. We do not have any patents that are material to our business.
Financial Information About Geographic Areas
As of December 31, 2009, we operate almost exclusively in the United States, with immaterial operations in certain foreign countries, including Mexico. During the year ended December 31, 2008, we operated almost exclusively in the United States, and during the year ended December 31, 2007, we operated in the United States and Canada. In March 2007, we declared our Canadian operations as discontinued. On April 10, 2007, we sold substantially all of our Canadian operations. Accordingly, our results of operations for all periods presented reflect our Canadian business as discontinued.
Employees
As of December 31, 2009, we had approximately 8,600 employees. Approximately 1,400 of our employees are represented by a union or subject to a collective bargaining agreement, requiring us to pay specified wages and provide certain benefits to these employees. These agreements expire at various times and have typically been renegotiated and renewed on terms that are similar to the ones contained in the expiring agreements.
We hire employees from a number of sources, including our industry, trade schools and colleges. Our primary sources for employees include promotion from within, team member referrals, print and internet advertising and direct recruiting. We attract and retain employees by offering technical training opportunities, bonus opportunities, stock ownership, competitive salaries and a comprehensive benefits package.
We believe that our focus on training and career development helps us to attract and retain employees. Our employees participate in ongoing educational programs, many of which are internally developed, to enhance their technical and management skills through classroom and field training. We provide opportunities for promotion and mobility within our organization that we also believe helps us to retain our employees. We believe our relations with our employees are good.
Available Information
A copy of this Annual Report on Form 10-K, as well as our Quarterly Reports on Form 10-Q, Current Reports on Form 8-K and any amendments to those reports filed or furnished pursuant to Section 13 or 15(d) of the Securities Exchange Act of 1934, are available free of charge on the internet at our website, www.mastec.com, as soon as reasonably practicable after we electronically file these reports with, or furnish these reports to, the Securities and Exchange Commission, which we refer to as the SEC. Copies of our Board of Directors Governance Principles, Personal Responsibility Code, which applies to all directors and employees, and expressly applies to our senior financial officers (including our principal executive officer, principal financial officer and our controller), and the charters for each of our Audit, Compensation and Nominating and Corporate Governance Committees are also available on the internet in the Investor Relations section of our website, www.mastec.com, or may be obtained by contacting our Vice President of Investor Relations, by phone at (305) 406-1815, or by email at investor.relations@mastec.com. We intend to provide any amendments or waivers to our Personal Responsibility Code for any of our directors and senior officers on our website within four business days of any such amendment or waiver. The reference to our website address does not constitute incorporation by reference of the information contained on the website and should not be considered part of this report. Our reports filed with the SEC may be read or copied at the SEC’s Public Reference Room at 100 F Street, NE, Washington, D.C. 20549. Information on the operation of the SEC’s Public Reference Room may be obtained by calling the SEC at 1-800-SEC-0330. Alternatively, you may access these reports at the SEC’s website at www.sec.gov.
12
Table of Contents
| Item 1A. | Risk Factors |
You should carefully consider the risks described below, together with all of the other information in this Annual Report on Form 10-K. The risks described below are not the only risks facing us. Additional risks and uncertainties not currently known to us or that we currently deem to be immaterial may also materially and adversely affect our business operations. If any of these risks actually occurs, our business, financial condition and results of operations could suffer and the trading price of our common stock could decline.
Risks Related to Our Industry and Our Customers’ Industries
The current credit crisis and economic downturn could reduce capital expenditures in the industries we serve, which may result in a decrease in demand for our services.
The demand for our services has been, and will likely continue to be, cyclical in nature and vulnerable to general downturns in the U.S. economy. Given the recent financial market turmoil and tightening of credit, our customers may not have the ability to fund capital expenditures for infrastructure, or may have difficulty in obtaining financing, which has resulted, and may continue to result, in cancellations of projects or deferral of projects to a later date. Such cancellations or deferrals have resulted, and could continue to result, in decreased demand for our services and could materially adversely affect our results of operations, cash flows and liquidity.
In addition, our customers are affected by economic downturns that decrease the need for their services or the profitability of their services. Slow-downs in real estate, fluctuations in commodity prices and decreased demand by end-customers for higher value services could affect our customers and their capital expenditure plans. Because we have been negatively impacted by previous economic downturns, we constantly monitor our customers’ industries and their relative health compared to the economy as a whole. The reduction in new housing starts, for example, could negatively impact our customers who utilize our services to construct their “last mile” of communications infrastructure, as well as other industries we serve, including electric utility transmission and grid connection, water and sewer and natural gas pipeline construction. Additionally, our customers who provide satellite and broadband communications to consumers across the country could be adversely impacted by an economic downturn if new subscriptions and upgrades for new and existing consumers are not ordered at the rate that we and our customers anticipate. During an economic downturn, like the current economic downturn, our customers also may not have the ability or desire to continue to fund capital expenditures for infrastructure at their current levels or may determine to outsource less work. A decrease in any of these projects, new subscriptions and upgrades or any other services we provide could materially adversely affect our results of operations, cash flows and liquidity.
Many of the industries we serve are subject to consolidation and rapid technological and regulatory change, and our inability or failure to adjust to our customers’ changing needs could reduce demand for our services.
We derive, and anticipate that we will continue to derive, a substantial portion of our revenue from customers in the communications and utilities industries. The communications and utilities industries are subject to rapid changes in technology and governmental regulation. Changes in technology may reduce the demand for the services we provide. For example, new or developing technologies could displace the wireline systems used for the transmission of voice, video and data, and improvements in existing technology may allow communications providers to significantly improve their networks without physically upgrading them. Technological advances may also result in lower costs for sources of energy, which may render existing wind energy, solar energy and natural gas projects and technologies uncompetitive or obsolete. Additionally, both the communications and utilities industries have been characterized by a high level of consolidation that may result in the loss of one or more of our customers. Our failure to rapidly adopt and master new technologies as they are developed in any of the industries we serve or the consolidation of one or more of our significant customers could have a material adverse effect on our results of operations, cash flows and liquidity.
Our industry is highly competitive, which may reduce our market share and harm our financial performance.
Our industry is highly fragmented, and we compete with other companies in most of the markets in which we operate, ranging from small independent firms servicing local markets to larger firms servicing regional and national markets. We also face competition from existing or prospective customers that employ in-house personnel to perform some of the same types of services we provide. There are relatively few barriers to entry into the markets in which we operate and, as a result, any organization that has adequate financial resources and access to technical expertise and skilled personnel may become one of our competitors.
13
Table of Contents
Most of our customers’ work is awarded through a bid process. Consequently, price is often the principal factor in determining which service provider is selected, especially on smaller, less complex projects. Smaller competitors are sometimes able to win bids for these projects based on price alone due to their lower costs and financial return requirements. If we are unsuccessful in bidding on these projects, or if our ability to win such projects requires that we accept lesser margins, then our results of operations, cash flows and liquidity could be materially and adversely affected.
Risks Related to Our Business
We derive a significant portion of our revenue from a few customers, and the loss of one of these customers or a reduction in their demand for our services could impair our financial performance.
For the year ended December 31, 2009, we derived approximately 30%, 16% and 7% of our revenue from DIRECTV®, AT&T and Enbridge, respectively. For the year ended December 31, 2008, we derived approximately 34%, 12% and 8% of our revenue from DIRECTV®, AT&T and Verizon, respectively. In addition, our ten largest customers accounted for approximately 72%, 72% and 77% of our revenue in the years ended December 31, 2009, 2008 and 2007, respectively. Because our business is concentrated among relatively few major customers, and certain of our services are provided on a non-recurring, project by project basis, we could experience a reduction in our results of operations, cash flows and liquidity if we lose one or more of these customers or the amount of business we obtain from them is reduced, or if we complete the required work on our projects and cannot replace them with similar projects. In addition, all of the contracts with our largest customers may be canceled on short or no notice.
Our profitability and liquidity could decline if certain customers reduce the amounts they pay for our services or if our customers are unable to pay for our services.
In the past, we incurred significant losses after a number of customers filed for bankruptcy or experienced financial difficulties following a general economic downturn and certain industry specific factors that worsened the impact of the overall economic downturn on those customers. In 2009, 2008 and 2007 total provisions for bad debts aggregated to $2.4 million, $3.5 million and $17.5 million, respectively, of which $0.3 million, $0.9 million and $14.1 million, respectively, resulted from anticipated legal settlements for customers in bankruptcy and discontinued operations. As of December 31, 2009, we had remaining receivables from customers undergoing bankruptcy reorganization totaling $1.6 million, of which $0.6 million is included in specific reserves for bad debts, with the remaining amounts expected to be recovered through secured and unsecured claims and enforcement of liens or bonds.
Most of our contracts do not obligate our customers to undertake any infrastructure projects or other work with us.
A significant portion of our revenue is derived from multi-year master service agreements and other service agreements. Under our multi-year master service agreements and other service agreements, we contract to provide customers with individual project services, through work orders, within defined geographic areas on a fixed fee basis. Under these agreements, our customers have no obligation to undertake any infrastructure projects or other work with us. A significant decline in the projects customers assign us under these service agreements could result in a decline in our results of operations, cash flows and liquidity.
We have recorded unrealized losses to reduce the carrying value of certain auction rate securities we hold, and we may incur additional impairment charges with respect to auction rate securities in future periods.
The current overall credit concerns in capital markets may affect our ability to liquidate certain auction rate securities that we classify as securities available for sale on our balance sheet. Our securities available for sale consist of auction-rate securities which represent interests in pools of student loans guaranteed by the U.S. government under the Federal Family Education Loan Program and structured finance securities. These structured finance securities are collateralized by investment grade credit-linked notes made up of floating rate international bank notes or credit card receivable notes that collateralize credit default swap agreements on corporate debt obligations. As of December 31, 2009, all of our securities available for sale, with a par value of $33.7 million and a fair value of $24.5 million, had insufficient bidders at the scheduled rollover dates.
During 2009, all of our structured finance auction rate securities, with a par value of $16.2 million and an estimated fair value of $8.1 million, were downgraded to non-investment grade by Standard & Poor’s and Fitch. If there were events of default on the underlying portfolio of the credit default swaps that exceeded the stated net default rates, which range from 8% to 10.75%, we could suffer a loss on some or all of the principal value of these corporate debt obligation auction rate securities. As of December 31, 2009, we have aggregate unrealized losses on these securities of $9.1 million. Of the $9.1 million, $8.1 million relates to our structured finance auction rate securities. Due to deterioration in the credit quality of these structured finance securities in 2009, we deemed the
14
Table of Contents
decline in value for these securities to be an other-than-temporary impairment, and accordingly, recorded a charge of $6.1 million in earnings as an other-than-temporary impairment in 2009. Our valuation is sensitive to market conditions and management’s judgment and can change significantly based on the assumptions used. Factors that may impact our valuation include changes to credit ratings of the securities as well as to the underlying assets supporting those securities, rates of default of the underlying assets, underlying collateral value, discount rates, counterparty risk and ongoing strength and quality of market credit and liquidity. At this time, we are uncertain whether the liquidity issues associated with these investments will improve, when we will be able to exit these investments at their cost basis or whether we will incur additional temporary or other-than-temporary losses as a result of these investments. As a result of this uncertainty, the $24.5 million fair value of these securities is classified as long-term assets at December 31, 2009.
In October 2009, we settled our claim against the investment advisor that sold us the auction rate securities. The investment advisor paid us a one-time payment and we retained the auction rate securities. In connection with the settlement, we released the investment advisor from any liability or claims of any kind related to the auction rate securities. Accordingly, if we are unable to sell our auction rate securities at par in the future, we will have no recourse against the investment advisor.
Most of our contracts may be canceled on short notice, so our revenue is not guaranteed.
Most of our contracts are cancelable on short notice, ranging from immediate cancellation to cancellation upon 180 days notice, even if we are not in default under the contract. Many of our contracts, including our service agreements, are periodically open to public bid. We may not be the successful bidder on our existing contracts that are re-bid. We also provide a significant portion of our services on a non-recurring, project-by-project basis. We could experience a reduction in our revenue, profitability and liquidity if:
| • | our customers cancel a significant number of contracts; |
| • | we fail to win a significant number of our existing contracts upon re-bid; or |
| • | we complete the required work under a significant number of our non-recurring projects and cannot replace them with similar projects. |
We may not accurately estimate the costs associated with our services provided under fixed-price contracts which could impair our financial performance.
A substantial portion of our revenue is derived from master service agreements and other service agreements that are fixed price contracts. Under these contracts, we set the price of our services on a per unit or aggregate basis and assume the risk that the costs associated with our performance may be greater than we anticipated. In addition to master or other service agreements, we enter into contracts that require installation or construction of specified units within an infrastructure system. Under those agreements, we have also contractually agreed to a price per unit. Profitability will be reduced if the actual costs to complete each unit exceed original estimates. We are also required to immediately recognize the full amount of any expected losses on these projects if estimated costs to complete the remaining units for the projects exceed the revenue to be earned on such units. Our profitability is therefore dependent upon our ability to accurately estimate the costs associated with our services. These costs may be affected by a variety of factors, such as lower than anticipated productivity, conditions at the work sites differing materially from what was anticipated at the time we bid on the contract and higher costs of materials and labor. These variations, along with other risks inherent in performing fixed price contracts, may cause actual revenue and gross profits for a project to differ from those originally estimated, and as a result, certain agreements or projects could have lower margins than anticipated, or losses if actual costs for our contracts exceed our estimates, which could reduce our profitability, cash flows and liquidity.
Our failure to properly manage projects, or project delays, may result in additional costs or claims, which could have a material adverse effect on our operating results, cash flows and liquidity.
Certain of our engagements involve large-scale, complex projects. The quality of our performance on such a project depends in large part upon our ability to manage our client relationship and the project itself and to timely deploy appropriate resources, including third-party contractors and our own personnel. Our results of operations, cash flows and liquidity could be adversely affected if we miscalculate the resources or time needed to complete a project with capped or fixed fees, or the resources or time needed to meet contractual milestones. Additionally, delays on a particular project, including permitting delays, may cause us to incur costs for standby pay, and may lead to personnel shortages on other projects scheduled to commence at a later date. In addition, some of our agreements require that we share in cost overages or pay liquidated damages if we do not meet project deadlines; therefore, any failure to properly estimate or manage cost, or delay in the completion of projects could subject us to penalties which could further adversely affect our results of operations, cash flows and liquidity. Further, any defects or errors, or failures to meet our customers’
15
Table of Contents
expectations could result in large damage claims against us, and because of the substantial cost of, and potentially long lead-time necessary to acquire certain of the materials and equipment used in our complex projects, particularly our wind farm and pipeline projects, damage claims may substantially exceed the amount we can charge for our associated services.
We recognize revenue for our installation/construction fixed price contracts using the percentage-of-completion method, therefore, variations of actual results from our assumptions may reduce our profitability.
We recognize revenue on long-term installation/construction fixed price contracts using the percentage-of-completion method. Under the percentage-of-completion method, we record revenue as work on the contract progresses. The cumulative amount of revenue recorded on a contract at a specified point in time is that percentage of total estimated revenue that incurred costs to date bear to estimated total contract costs. The percentage-of-completion method therefore relies on estimates of total expected contract costs. Contract revenue and total cost estimates are reviewed and revised periodically as the work progresses. Adjustments are reflected in contract revenue in the fiscal period in which such estimates are revised. Estimates are based on management’s reasonable assumptions and experience, but are only estimates. Variation of actual results from estimates on a large project or on a number of smaller projects could be material. We immediately recognize the full amount of the estimated loss on a contract when our estimates indicate such a loss. Such adjustments and accrued losses could result in reduced profitability which could negatively impact our liquidity. For example, for the years ended December 31, 2009, 2008 and 2007, we incurred approximately $1.3 million, $0.7 million and $0.3 million, respectively, of losses on percentage-of-completion contracts.
Amounts included in our backlog may not result in actual revenue or translate into profits, and our backlog is subject to cancellation and unexpected adjustments and therefore is an uncertain indicator of future operating results.
Approximately 66% of our 18-month backlog at December 31, 2009 was composed of master service agreements and other service agreements, none of which require our customers to purchase a minimum amount of services and are cancelable on short notice. The balance of our backlog is our estimate of work to be completed on long-term installation/construction fixed price agreements. These backlog amounts are based on our estimates and therefore may not result in actual receipt of revenue in the originally anticipated period, or at all. In addition, contracts included in our backlog may not be profitable. We may experience variances in the realization of our backlog because of project delays or cancellations resulting from weather conditions, other project deferrals or delays, scope adjustments, external market factors and economic factors beyond our control. If our backlog fails to materialize, our results of operations, cash flows and liquidity would be materially and adversely affected. Accordingly, our backlog as of any particular date is an uncertain indicator of future earnings.
Our business is seasonal and is affected by adverse weather conditions and the spending patterns of our customers, exposing us to variable quarterly results.
Some of our customers reduce their expenditures and work order requests towards the end of the year. Adverse weather conditions, particularly during the winter season, also affect our ability to perform outdoor services in certain regions of the United States. As a result, we experience reduced revenue in the first quarter of each calendar year.
Natural catastrophes such as hurricanes in the United States could also have a negative impact on the economy overall and on our ability to perform outdoor services in affected regions or utilize equipment and crews stationed in those regions, which could result in a decline in results of operations, cash flows and liquidity.
Warranty claims resulting from our services could have a material adverse effect on our business.
We generally warrant the work we perform for a one- to two-year period following substantial completion of a project, subject to further extensions of the warranty period following repairs or replacements. We have not historically accrued any reserves for potential warranty claims as they have been immaterial. The costs associated with such warranties, including any warranty-related legal proceedings, could have a material adverse effect on our results of operations, cash flows and liquidity.
We are self-insured against many potential liabilities.
Although we maintain insurance policies with respect to automobile liability, general liability, workers’ compensation and employee group health claims, those policies are subject to high deductibles, and we are self-insured up to the amount of the deductible. Since most claims against us do not exceed the deductibles under our insurance policies, we are effectively self-insured for substantially all claims. We actuarially determine any liabilities for unpaid claims and associated expenses, including incurred but
16
Table of Contents
not reported losses, and reflect the present value of those liabilities in our balance sheet as other current and non-current liabilities. The determination of such claims and expenses and the appropriateness of the related liability is reviewed and updated quarterly. However, insurance liabilities are difficult to assess and estimate due to the many relevant factors, the effects of which are often unknown, including the severity of an injury, the determination of our liability in proportion to other parties, the number of incidents not reported and the effectiveness of our safety program. If our insurance claims increase or costs exceed our estimates of insurance liabilities, we could experience a decline in profitability and liquidity.
Increases in our insurance premiums or collateral requirements could significantly reduce our profitability, liquidity and availability under our credit facility.
Because of factors such as increases in claims, projected significant increases in medical costs and wages, lost compensation and reductions in coverage, insurance carriers may be unwilling to continue to provide us with our current levels of coverage without a significant increase in insurance premiums or collateral requirements to cover our deductible obligations. An increase in premiums or collateral requirements could significantly reduce our profitability and liquidity as well as reduce availability under our revolving credit facility.
We may be unable to obtain sufficient bonding capacity to support certain service offerings, and the need for performance and surety bonds may reduce our availability under our credit facility.
Some of our contracts require performance and payment bonds. We may not be able to maintain a sufficient level of bonding capacity in the future, which could preclude us from being able to bid for certain contracts and successfully contract with certain customers. In addition, even if we are able to successfully renew or obtain performance or payment bonds in the future, we may be required to post letters of credit in connection with the bonds which would reduce availability under our credit facility.
The impact of the Stimulus Act is uncertain.
The lack of available capital and the illiquidity in the debt and capital markets, coupled with the economic downturn resulted in a tremendous amount of uncertainty with numerous renewable energy projects being delayed or canceled. While we believe that the Stimulus Act, which was enacted into law in February 2009, should aid the wind, electrical transmission and rural broadband businesses, we did not receive any Stimulus Act related revenue in 2009 and the extent to which it will result in future revenues is uncertain. We cannot predict when programs under the Stimulus Act will be implemented or the timing and scope of any investments to be made under these programs. Investments for renewable energy, electric power infrastructure rural broadband facilities under Stimulus Act programs may not occur, may be less than anticipated or may be delayed, which would negatively impact demand for our services.
Additionally, the tax incentives provided by the Stimulus Act have a finite duration. Currently, the election to claim the investment tax credit in lieu of the production tax credit is only available for qualified wind facilities placed in service from 2009 to December 31, 2012; the U.S. Treasury grant program will only be applicable to wind projects placed in service in 2009 or 2010 (or after 2010 so long as construction begins in 2009 or 2010 and is completed before 2013); and the production tax credit is scheduled to expire on December 31, 2012 and will not be available for energy generated from wind facilities placed in service after that date unless the credit program is extended or renewed. Whether the new investment tax credit or U.S. Treasury grant program will be effective for wind projects or renewable projects in uncertain, as are any future efforts to extend or renew the production tax credit, the investment tax credit, and/or the U.S. Treasury grant program. Furthermore, the provisions regarding any extension or renewal may not be as favorable as those that currently exist. In addition, we cannot assure you that any extension or renewal of the production tax credit, the investment tax credit, and/or the U.S. Treasury grant program would be enacted prior to its expiration or, if allowed to expire, that any extension or renewal enacted thereafter would be enacted with retroactive effect. We also cannot assure you that the tax laws providing for accelerated depreciation of wind generation assets will not be modified, amended or repealed in the future. If the investment tax credit or the U.S. Treasury grant program are not effective or if the federal production tax credit is not extended or renewed, or is extended or renewed at a lower rate, the ability of our customers to obtain financing for these wind farm developments may be impaired or eliminated, and the resulting wind farms would be less profitable, thereby potentially reducing demand for our wind power services. Our revenue and results of operations could be materially adversely affected if demand for our wind power services or the tax incentives were reduced.
Legislative actions and incentives relating to electric power and renewable energy may fail to result in increased demand for our services.
While we believe the Energy Act will provide opportunities in the industries we serve, implementation of the Energy Act is still subject to considerable fiscal and regulatory uncertainty. Regulations implementing the components of the Energy Act that may affect
17
Table of Contents
demand for our services remain in some cases subject to review in various federal courts. In one such case, decided in February 2009, a federal court of appeals vacated FERC’s interpretation of the scope of its backstop siting authority. Accordingly, the effect of these regulations, once finally implemented, is uncertain. As a result, the legislation may not result in increased spending on the electric power transmission infrastructure. Continued uncertainty regarding the implementation of the Energy Act may result in slower growth in demand for our services. In addition, changes to energy regulatory policy may be forthcoming due to the new administration.
Changes to renewable portfolio standards could, and decreased demand for renewable energy projects would, negatively impact our results of operations, cash flows and liquidity.
A significant portion of our business is currently focused on providing construction and/or installation services to owners and operators of wind power facilities. The development of wind facilities is highly dependent upon the federal production tax credit (discussed above) and the existence of renewable portfolio standards and other state incentives. Renewable portfolio standards are state specific statutory provisions requiring that electric utilities generate a certain amount of electricity from renewable energy sources or devote a certain portion of its operational/development capacity to renewable energy sources. Additionally, certified renewable energy generators earn certificates for every unit of electricity they produce and can sell these along with their electricity to supply companies. These standards have spurred significant growth in the wind energy industry and a corresponding increase in the demand for our wind power-related services. Currently, more the half of the states in the United States as well as the District of Columbia have adopted renewable portfolio standards or goals. Eliminations of or changes to existing renewable portfolio standards or similar environmental policies may impact the demand for our wind and solar power-related services.
Additionally, renewable energy is generally more expensive to produce and may require additional power generation sources as backup. The locations of renewable energy projects are often remote and are not viable unless connectivity to the grid to transport the power to demand centers is economically feasible. Furthermore, funding for renewable energy initiatives may not be available, which may be further constrained as a result of turbulent credit markets. These factors could result in fewer renewable energy projects than anticipated or a delay in the timing of construction of these projects and the related infrastructure, which would negatively affect the demand for our services.
Demand for pipeline construction services depends on oil and natural gas industry activity and expenditure levels that are directly affected by trends in oil and natural gas prices and the cost of energy infrastructure projects.
Demand for our pipeline construction services is particularly sensitive to the level of exploration, development, and production activity of, and the corresponding capital spending by, oil and natural gas companies. Prices for oil and natural gas are subject to large fluctuations in response to relatively minor changes in the supply of and demand for oil and natural gas, market uncertainty, and a variety of other factors that are beyond our control. Low prices for oil and natural gas generally depress levels of exploration, development, and production activity, resulting in a corresponding decline in the demand for pipeline construction services. Factors affecting the prices of oil and natural gas include:
| • | the level of supply and demand for oil and natural gas, especially demand for natural gas in the United States; |
| • | governmental regulations, including the policies of governments regarding the exploration for and production and development of their oil and natural gas reserves, as well as environmental laws and initiatives to control global warming; |
| • | global weather conditions and natural disasters; |
| • | worldwide political, military, and economic conditions; the level of oil production by non-OPEC countries and the available excess production capacity within OPEC; |
| • | oil refining capacity and shifts in end-customer preferences toward fuel efficiency and the use of natural gas; and |
| • | the cost of producing and delivering oil and gas; potential acceleration of development of alternative fuels. |
Historically, the markets for oil and gas have been volatile and are likely to continue to be volatile. Spending on exploration and production activities by large oil and gas companies has a significant impact on the activity levels of pipeline construction services.
18
Table of Contents
In addition, demand for pipeline construction services may be affected by the costs of energy exploration and constructing energy infrastructure projects. For example, while high oil and gas prices may increase oil and gas exploration, production and transportation activity, high demand for equipment, materials and labor required for such projects may increase the costs of such projects and dampen demand. Furthermore, increased costs for raw materials such as steel and other commodities may make some projects uneconomical despite robust oil and gas prices, thus reducing demand for our pipeline construction services. A decrease in demand for our pipeline construction services could materially and adversely affect our results of operations, cash flows and liquidity.
We have agreed to keep certain liabilities related to the state Department of Transportation related projects and assets that were sold in February 2007.
Effective February 1, 2007, we sold our state Department of Transportation related projects and assets. On January 24, 2008, we entered into a settlement agreement with the buyer of our state Department of Transportation projects and assets to settle previously disclosed warranty, indemnification and other claims primarily relating to work we had performed on the state Department of Transportation projects we sold. In connection with the settlement agreement, the parties also agreed to further amend and restate the Amended Asset Purchase Agreement effective as of January 24, 2008, which we refer to as the “Revised Amended Agreement.” In connection with the sale of our state Department of Transportation related projects and assets and the related settlement, we agreed to keep certain liabilities, mainly related to the cost to maintain and continue certain performance and payment bonds, certain obligations under leases between the parties and certain other litigation matters. We may also be unable to recover any losses we incur as a result of any third party claims to the extent any third parties seek payment from us directly and we are unable to recover such losses from the buyer pursuant to the indemnification obligations contained in the Revised Amended Agreement, including any losses resulting from creditor claims, in the event the buyer was financially unable to meet certain obligations.
Under the terms of the Revised Amended Agreement, the buyer is no longer required to issue a standby letter of credit in our favor to cover any remaining exposure related to our bonded obligations. Instead, pursuant to the terms of the settlement agreement, the buyer entered into indemnity agreements directly with certain surety bonding companies in connection with our bonded obligations. Therefore, if the buyer is unable to meet its contractual obligations, the surety bonding company can seek its remedies under the indemnity agreement. If the surety bonding company, however, pays the amounts due under the bonds, the surety bonding company will seek reimbursement of such payment from us. Accordingly, we may incur losses in the future related to these contingent liabilities if the buyer does not complete the bonded contracts and we are unable to recover such losses from the buyer pursuant to the indemnification provisions contained in the Revised Amended Agreement. The buyer of the Department of Transportation related projects and assets filed for bankruptcy protection in October 2009, which increases the likelihood that we will be required to assume certain obligations associated with these projects. At December 31, 2009, we estimated that the remaining cost to complete these state Department of Transportation projects was $0.7 million on the related $159.7 million in performance and payment bonds. Should actual costs to complete exceed estimates, we could incur future losses which could adversely affect our results of operations, cash flows and liquidity.
Our reporting entities may incur goodwill impairment charges which could harm our profitability.
When we acquire a business, we record goodwill equal to the excess amount we pay for the business, including anticipated future liabilities and liabilities assumed, over the fair value of the tangible and intangible assets of that business. As a result of acquisitions, we have $579.5 million and $420.6 million of goodwill and other identifiable intangible assets recorded as of December 31, 2009 and 2008, respectively. We expect to continue to record additions to goodwill in future periods in connection with completed acquisitions, particularly as a result of future earn-out payments for acquisitions completed prior to December 31, 2008, or from any future acquisitions.
We periodically review the carrying values of our goodwill to determine whether such carrying values exceed their fair market values. In connection with our decision to sell substantially all our Canadian net assets, we wrote off goodwill associated with this entity in the amount of $0.4 million for the year ended December 31, 2007. We may incur additional impairment charges related to goodwill in connection with any of our acquisitions in the future if the markets they serve or their businesses deteriorate.
We may incur restructuring or impairment charges, which could reduce our profitability.
From time to time we review our operations in an effort to improve profitability. We could incur charges in the future as a result of:
| • | eliminating service offerings that no longer fit into our business strategy; |
| • | reducing or eliminating services or operations that do not produce adequate revenue or margin; |
19
Table of Contents
| • | reducing costs of businesses that provide adequate profit contributions but need margin improvements; and |
| • | reviewing new business opportunities capable of utilizing our existing human and physical resources. |
For example, as a result of the sale of our state Department of Transportation operations, we recorded impairment charges totaling $2.9 million for the year ended December 31, 2007. All charges related to restructuring or impairment would be reflected as operating expenses and could materially reduce our profitability and liquidity.
Our revolving credit facility, senior notes and senior convertible notes impose restrictions on us which may prevent us from engaging in transactions that might benefit us, including responding to changing business and economic conditions or securing additional financing, if needed.
At December 31, 2009, we had $365 million aggregate principal amount outstanding on our senior notes due 2017 and our senior convertible notes due 2014. We also have a revolving credit facility with no outstanding balance at December 31, 2009. At December 31, 2009, availability was approximately $89.8 million, net of outstanding standby letters of credit aggregating $79.8 million.
The terms of our indebtedness contain customary events of default and covenants that prohibit us from taking certain actions without satisfying certain financial tests or obtaining the consent of the lenders. The prohibited actions include, among other things:
| • | buying back shares in excess of specified amounts; |
| • | making investments and acquisitions in excess of specified amounts; |
| • | incurring additional indebtedness in excess of specified amounts; |
| • | paying cash dividends; |
| • | creating certain liens against our assets; |
| • | prepaying subordinated indebtedness; |
| • | engaging in certain mergers or combinations; and |
| • | engaging in transactions that would result in a “change of control” (as defined in the credit facility and the indenture governing our senior notes). |
Additionally, certain provisions of our convertible notes could make it more expensive for a third party to acquire us or require us to repurchase the convertible notes for cash when required by the holders, including following a “fundamental change” (as defined in the indenture).
Our credit facility requires us to comply with a minimum fixed charge coverage ratio. Should we be unable to comply with the terms and covenants of our credit facility, we would be required to obtain further modifications of the facility or secure another source of financing to continue to operate our business. A default could also result in the acceleration of our obligations under the credit facility, or under the indenture relating to the senior notes and the indenture relating to our convertible notes. In addition, these covenants may prevent us from engaging in transactions that benefit us, including responding to changing business and economic conditions or securing additional financing, if needed. Our business is capital intensive and, to the extent we need additional financing, we may not be able to obtain such financing at all or on favorable terms, which may materially decrease our profitability, cash flows and liquidity.
If we are unable to attract and retain qualified managers and skilled employees, we will be unable to operate efficiently, which could reduce our revenue, profitability and liquidity.
Our business is labor intensive, and some of our operations experience a high rate of employee turnover. In addition, given the nature of the highly specialized work we perform, many of our employees are trained in and possess specialized technical skills. At times of low unemployment rates in the areas we serve, it can be difficult for us to find qualified and affordable personnel. We may be unable to hire and retain a sufficient skilled labor force necessary to support our operating requirements and growth strategy. Our labor expenses may increase as a result of a shortage in the supply of skilled personnel. We may also be forced to incur significant training expenses if we are unable to hire employees with the requisite skills. Additionally, our business is managed by a number of key executive and operational officers and is dependent upon retaining and recruiting qualified management. Labor shortages, increased labor or training costs, or the loss of key personnel could materially adversely affect our results of operations, cash flows and liquidity.
20
Table of Contents
Certain of our businesses have employees who are represented by a union or are subject to collective bargaining agreements; the unionized workforce and any related obligations could adversely affect our operations.
Certain of our employees are represented by labor unions and collective bargaining agreements. Although all of these agreements prohibit strikes and work stoppages, we cannot be certain that strikes or work stoppages will not occur in the future despite the terms of these agreements. Strikes or work stoppages would adversely impact relationships with our customers and could cause us to lose business and decrease our revenue. Additionally, as current agreements expire, the labor unions may not be able to negotiate extensions or replacements on terms favorable to their members, or at all, or avoid strikes, lockouts or other labor actions from time to time that may affect their members. Therefore, it cannot be assured that new agreements will be reached with employee labor unions as existing contracts expire or on terms that we find desirable. Any labor action against us relating to failure to reach an agreement with employee labor unions could have a material adverse effect on our liquidity, cash flows and results of operations
Our participation in multi-employer pension plans may subject us to liabilities that could materially adversely affect our liquidity, cash flows and results of operations.
Substantially all of our union and collective bargaining agreements require us to participate with other companies in multi-employer pension plans. To the extent that those plans are underfunded, the Employee Retirement Income Security Act of 1974, as amended by the Multi-Employer Pension Plan Amendments Act of 1980, may subject us to substantial liabilities under those plans if we withdraw from them or they are terminated. Furthermore, the Pension Protection Act of 2006 added new funding rules generally applicable to plan years beginning after 2007 for multi-employer plans that are classified as “endangered,” “seriously endangered,” or “critical” status. For a plan in “critical” status, benefit reductions may apply and/or we may be required to make additional contributions if a plan is determined to be underfunded, which could materially adversely affect our liquidity, cash flows and results of operations.
Increases in the costs of fuel could reduce our operating margins.
The price of fuel needed to run our vehicles and equipment is unpredictable and fluctuates based on events outside our control, including geopolitical developments, supply and demand for oil and gas, actions by the OPEC and other oil and gas producers, war and unrest in oil producing countries, regional production patterns and environmental concerns. Most of our contracts do not allow us to adjust our pricing. Accordingly, any increase in fuel costs could materially reduce our profitability and liquidity.
Our subcontractors may fail to satisfy their obligations to us or other parties, or we may be unable to maintain these relationships, either of which may have a material adverse effect on our results of operations, cash flows and liquidity.
We depend on subcontractors to complete some of the work on some of our projects. There is a risk that we may have disputes with subcontractors arising from, among other things, the quality and timeliness of work performed by the subcontractor, customer concerns about the subcontractor or our failure to extend existing task orders or issue new task orders under a subcontract. In addition, if any of our subcontractors fail to deliver on a timely basis the agreed-upon supplies and/or perform the agreed-upon services, then our ability to fulfill our obligations as a prime contractor may be jeopardized. In addition, the absence of qualified subcontractors with whom we have a satisfactory relationship could adversely affect the quality of our service and our ability to perform under some of our contracts. Any of these factors may have a material adverse effect on our results of operations, cash flows and liquidity.
We may choose, or be required, to pay our subcontractors even if our customers do not pay, or delay paying us for the related services.
We use subcontractors to perform portions of our services and to manage work flow. In some cases, we pay our subcontractors before our customers pay us for the related services. If we choose, or are required, to pay our subcontractors for work performed for customers who fail to pay, or delay paying us for the related work, we could experience a material decrease in profitability and liquidity.
21
Table of Contents
Our business may be affected by difficult work sites and environments, which could cause delays and result in additional costs.
We perform work under a variety of conditions, including, but not limited to, difficult and hard to reach terrain and difficult site conditions. Performing work under such conditions can result in project delays or cancellations, potentially causing us to incur additional, unanticipated costs, reductions in revenues or the payment of liquidated damages. In addition, some of our contracts require that we assume the risk that actual site conditions vary from those expected.
Some of our projects involve challenging engineering, procurement and construction phases that may occur over extended time periods, sometimes over several years. We may encounter difficulties in engineering, delays in designs or materials provided by the customer or a third party, equipment and material delivery, schedule changes, delays from customer failure to timely obtain rights-of-way, weather-related delays, delays by subcontractors in completing their portion of the project, and other factors, some of which are beyond our control, but which impact our ability to complete a project within the original delivery schedule. In some cases, delays and additional costs may be substantial, and we may be required to cancel a project and/or compensate the customer for the delay. We may not be able to recover any of such costs. Any such delays or cancellations, defects or errors or other failures to meet customer expectations could result in damage claims substantially in excess of the revenue associated with a project, as well as negatively impact our reputation or relationships with customers, adversely affecting our ability to secure new contracts.
Our failure to comply with environmental laws could result in significant liabilities.
Some of the work we perform is in underground environments. If the field location maps supplied to us are not accurate, or if objects are present in the soil that are not indicated on the field location maps, our underground work could strike objects in the soil containing pollutants and result in a rupture and discharge of pollutants. In such a case, we may be liable for fines and damages.
We own and lease several facilities at which we store our equipment. Some of these facilities contain fuel storage tanks which may be above or below ground. If these tanks were to leak, we could be responsible for the cost of remediation as well as potential fines.
We sometimes perform directional drilling operations below certain environmentally sensitive terrains and water bodies. Due to the inconsistent nature of the terrain and water bodies, it is possible that such directional drilling may cause a surface fracture releasing subsurface materials. These releases may contain contaminants in excess of amounts permitted by law, potentially exposing us to remediation costs and fines.
In addition, new environmental laws and regulations, stricter enforcement of existing laws and regulations, the discovery of previously unknown contamination or leaks, or the imposition of new clean-up requirements could require us to incur significant costs or become the basis for new or increased liabilities that could have a material negative impact our results of operations, cash flows and liquidity.
Our failure to comply with the regulations of the U.S. Occupational Safety and Health Administration, the U.S. Department of Transportation and other state and local agencies that oversee transportation and safety compliance could reduce our revenue, profitability and liquidity.
The Occupational Safety and Health Act of 1970, as amended, or OSHA, establishes certain employer responsibilities, including maintenance of a workplace free of recognized hazards likely to cause death or serious injury, compliance with standards promulgated by the Occupational Safety and Health Administration and various record keeping, disclosure and procedural requirements. Various standards, including standards for notices of hazards and safety in excavation and demolition work may apply to our operations. We have incurred, and will continue to incur, capital and operating expenditures and other costs in the ordinary course of business in complying with OSHA and other state and local laws and regulations, and could incur penalties and fines in the future, including in extreme cases, criminal sanctions.
While we have invested, and will continue to invest, substantial resources in occupational health and safety programs, our industry involves a high degree of operational risk, and there can be no assurance that we will avoid significant liability exposure. Although we have taken what are believed to be appropriate precautions, we have suffered employee injuries and fatalities in the past and may suffer additional injuries or fatalities in the future. Serious accidents of this nature may subject us to substantial penalties, civil litigation or criminal prosecution. Personal injury claims for damages, including for bodily injury or loss of life, could result in substantial costs and liabilities, which could materially and adversely affect our financial condition, results of operations or cash flows. In addition, if our safety record were to substantially deteriorate, or if we suffered substantial penalties or criminal prosecution for violation of health and safety regulations, customers could cancel existing contracts and not award future business to us, which could materially adversely affect our liquidity, cash flows and results of operations.
22
Table of Contents
We have, from time to time, received notice from the U.S. Department of Transportation that our motor carrier operations will be monitored and that the failure to improve our safety performance could result in suspension or revocation of vehicle registration privileges. If we were not able to successfully resolve these issues, our ability to service our customers could be damaged, which could lead to a material adverse effect on our results of operations, cash flows and liquidity.
Our financial results are based, in part, upon estimates and assumptions that may differ from actual results.
In preparing our consolidated financial statements in conformity with accounting principles generally accepted in the United States, a number of estimates and assumptions are made by management that affect the amounts reported in the financial statements. These estimates and assumptions must be made because certain information that is used in the preparation of our financial statements is either dependent on future events or cannot be calculated with a high degree of precision from data available. In some cases, these estimates are particularly uncertain and we must exercise significant judgment. Estimates are primarily used in our assessment of revenue recognition for costs and estimated earnings in excess of billings, allowance for doubtful accounts, accrued self-insured claims, valuation of goodwill and intangible assets, asset lives used in computing depreciation and amortization, including amortization of intangibles, the fair value of securities available for sale and accounting for performance-based stock awards, income taxes (including net deferred tax assets) and other contingencies, including litigation matters. Actual results could differ materially from the estimates and assumptions that we use, which could have a material adverse effect on our results of operations, cash flows and liquidity.
Our business is subject to hazards that could result in substantial liabilities and weaken our financial condition.
Construction projects undertaken by our employees involve exposure to electrical lines, pipelines carrying potentially explosive materials, heavy equipment, mechanical failures, transportation accidents, adverse weather conditions and damage to equipment and property. These hazards can cause personal injuries and loss of life, severe damage to or destruction of property and equipment and other consequential damages and could lead to suspension of operations and large damage claims which could, in some cases, substantially exceed the amount we charge for the associated services. In addition, if serious accidents or fatalities occur, or our safety records were to deteriorate, we may be restricted from bidding on certain work and obtaining other new contracts and certain existing contracts could be terminated. Our safety processes and procedures are monitored by various agencies and rating bureaus. See “Risk Factors - Our failure to comply with the regulations of the U.S. Occupational Safety and Health Administration, the U.S. Department of Transportation and other state and local agencies that oversee transportation and safety compliance could reduce our revenue, profitability and liquidity.” The occurrence of accidents in our business could result in significant liabilities, employee turnover, increase the costs of our projects, or harm our ability to perform under our contracts or enter into new contracts with customers, which could materially reduce our revenue, profitability and liquidity.
Our operations may impact the environment or cause exposure to hazardous substances, and our properties may have environmental contamination, which could result in material liabilities.
Our operations are subject to various environmental laws and regulations, including those dealing with the handling and disposal of waste products, PCBs, fuel storage and air quality. Certain of our current and historical construction operations have used hazardous materials and, to the extent that such materials are not properly stored, contained or recycled, they could become hazardous waste. Additionally, some of our contracts require that we assume the environmental risk of site conditions and require that we indemnify our customers for any damages, including environmental damages, incurred in connection with our projects. We may be subject to claims under various environmental laws and regulations federal and state statutes and/or common law doctrines for toxic torts and other damages, as well as for natural resource damages and the investigation and clean up of soil, surface water, groundwater, and other media under laws such as CERCLA. Such claims may arise, for example, out of current or former conditions at project sites, current or former properties owned or leased by us, and contaminated sites that have always been owned or operated by third parties. Liability may be imposed without regard to fault and may be strict, joint and several, such that we may be held responsible for more than our share of any contamination or other damages, or even for the entire share, and may be unable to obtain reimbursement from the parties causing the contamination.
23
Table of Contents
Many of our customers are highly regulated and the addition of new regulations or changes to existing regulations may adversely impact their demand for our specialty contracting services and the profitability of those services.
Many of our communications customers are regulated by the Federal Communications Commission, or FCC, and our energy customers are regulated by FERC, and, in addition, our utility customers are regulated by state public utility commissions. These agencies may interpret the application of their regulations in a manner that is different than the way such regulations are currently interpreted and may impose additional regulations. If existing or new regulations have an adverse affect on our customers and adversely impact the profitability of the services they provide, then demand for our specialty contracting services may be reduced.
Claims, lawsuits and proceedings could reduce our profitability, cash flows and liquidity.
We are subject to various claims, lawsuits and proceedings which arise in the ordinary course of business. These actions may seek, among other things, compensation for alleged personal injury, workers’ compensation, employment discrimination, breach of contract, property damage, punitive damages, civil penalties or other losses, consequential damages, or injunctive or declaratory relief. In addition, pursuant to our service agreements, we generally indemnify our customers for claims related to the services we provide. Claimants may seek large damage awards and defending claims can involve significant costs. When appropriate, we establish reserves against these items that we believe to be adequate in light of current information, legal advice and professional indemnity insurance coverage, and we adjust such reserves from time to time according to case developments. If our reserves are inadequate, or if in the future our insurance coverage proves to be inadequate or unavailable, or there is an increase in liabilities for which we self-insure, we could experience a reduction in our profitability and liquidity. An adverse determination on any such claim, lawsuit or proceeding could have a material adverse effect on our business, financial condition or results of operations. In addition, claims, lawsuits and proceedings may harm our reputation or divert management resources away from operating our business.
Acquisitions involve risks that could result in a reduction of our operating results, cash flows and liquidity.
We have made, and in the future may continue to make strategic acquisitions such as our recent acquisition of Precision. However, we may not be able to identify suitable acquisition opportunities or may be unable to obtain the consent of our lenders and therefore not be able to complete such acquisitions. We may pay for acquisitions with our common stock or with convertible securities, which may dilute your investment in our common stock, or we may decide to pursue acquisitions that investors may not agree with. In connection with most of our acquisitions, we have also agreed to substantial earn-out arrangements. To the extent we defer the payment of the purchase price for any acquisition through a cash earn-out arrangement, it will reduce our cash flows in subsequent periods. In addition, acquisitions may expose us to operational challenges and risks, including:
| • | the ability to profitably manage additional businesses or successfully integrate acquired business operations and financial reporting and accounting control systems into our business; |
| • | increased indebtedness and contingent purchase price obligations associated with an acquisition; |
| • | the ability to fund cash flow shortages that may occur if anticipated revenue is not realized or is delayed, whether by general economic or market conditions, or unforeseen internal difficulties; |
| • | the availability of funding sufficient to meet increased capital needs; |
| • | diversion of management’s attention; and |
| • | the ability to retain or hire qualified personnel required for expanded operations. |
In addition, acquired companies may have liabilities that we failed, or were unable, to discover in the course of performing due diligence investigations. We cannot assure you that the indemnification granted to us by sellers of acquired companies will be sufficient in amount, scope or duration to fully offset the possible liabilities associated with businesses or properties that we assume upon consummation of an acquisition. We may learn additional information about our acquired businesses that materially adversely affect us, such as unknown or contingent liabilities and liabilities related to compliance with applicable laws. Any such liabilities, individually or in the aggregate, could have a material adverse effect on our business.
Failure to successfully manage the operational challenges and risks associated with, or resulting from, acquisitions could adversely affect our results of operations, cash flows and liquidity. Borrowings or issuances of convertible securities associated with these acquisitions may also result in higher levels of indebtedness which could impact our ability to service our debt within the scheduled repayment terms.
24
Table of Contents
Our inability to enforce non-competition agreements with former principals and key management of the businesses we acquire may adversely affect our operating results, cash flows and liquidity.
In connection with our acquisitions, we generally require that key management and the former principals of the businesses we acquire enter into non-competition agreements in our favor. The laws of each state differ concerning the enforceability of non-competition agreements. Generally, state courts will examine all of the facts and circumstances at the time a party seeks to enforce a non-competition agreement; consequently, we cannot predict with certainty whether, if challenged, a court will enforce any particular non-competition agreement. If one or more former principals or members of key management of the businesses we acquire leave and the courts refuse to enforce the non-compete agreement entered into by such person or persons, we might be subject to increased competition, which could materially and adversely affect our operating results, cash flows and liquidity.
Risks Related to Our Company and Our Common Stock
We have a significant amount of debt. Our substantial indebtedness could adversely affect our business, financial condition and results of operations and our ability to meet our payment obligations.
We have a significant amount of debt and substantial debt service requirements. As of December 31, 2009, we had approximately $438 million of outstanding debt.
This level of debt could have significant consequences on our future operations, including:
| • | making it more difficult for us to meet our payment and other obligations; |
| • | an event of default if we fail to comply with the financial and other restrictive covenants contained in our debt agreements, which event of default could result in all of our debt becoming immediately due and payable; |
| • | reducing the availability of our cash flow to fund working capital, capital expenditures, acquisitions and other general corporate requirements, and limiting our ability to obtain additional financing for these purposes; |
| • | subjecting us to the risk of increased sensitivity to interest rate increases on our indebtedness with variable interest rates, including borrowings under our credit facility; |
| • | limiting our flexibility in planning for, or reacting to, and increasing our vulnerability to, changes in our business, the industry in which we operate and the general economy; and |
| • | placing us at a competitive disadvantage compared to our competitors that have less debt or are less leveraged. |
Any of the above-listed factors could have an adverse effect on our business, financial condition and results of operations and our ability to meet our payment obligations.
Our ability to meet our payment and other obligations under our debt instruments depends on our ability to generate significant cash flow in the future. This, to some extent, is subject to general economic, financial, competitive, legislative and regulatory factors as well as other factors that are beyond our control. We cannot assure you that our business will generate cash flow from operations, or that future borrowings will be available to us under our credit facility or otherwise, in an amount sufficient to enable us to meet our payment obligations and to fund other liquidity needs. If we are not able to generate sufficient cash flow to service our debt obligations, we may need to refinance or restructure our debt, sell assets, reduce or delay capital investments, or seek to raise additional capital, and some of these activities may on terms that are unfavorable or highly dilutive. Our ability to refinance our indebtedness will depend on the capital markets and our financial condition at such time. If we are unable to implement one or more of these alternatives, we may not be able to meet our payment obligations.
The market price of our common stock has been, and may continue to be, highly volatile.
During the three years ended December 31, 2009, our common stock fluctuated from a high of $16.25 per share to a low of $5.55 per share. We may continue to experience significant volatility in the market price of our common stock. Numerous factors could have a significant effect on the price of our common stock, including:
| • | announcements of fluctuations in our operating results or the operating results of one of our competitors; |
25
Table of Contents
| • | future sales of our common stock or other securities, including any shares issued in connection with earn-out obligations for any past or future acquisition; |
| • | announcements by us or one of our competitors of new or terminated customers or new, amended or terminated contracts; |
| • | market conditions for providers of services to communications companies, utilities and government; |
| • | conversions or anticipated conversions of our senior convertible notes, or any sales in the public market of any of our common stock issuable upon such conversion; |
| • | changes in recommendations or earnings estimates by securities analysts; and |
| • | announcements of acquisitions by us or one of our competitors. |
In addition, the stock market has experienced significant price and volume fluctuations in recent years, which have sometimes been unrelated or disproportionate to operating performance. The market price for our common stock has been volatile, and such volatility could cause the market price of our common stock to decrease and could cause you to lose some or all of your investment in our common stock.
There may be future sales or other dilution of our equity, which may adversely affect the market price of our common stock. In connection with certain completed acquisitions, we have issued shares of our common stock or securities that are convertible into shares of our common stock, and in addition, we have the option to issue shares of our common stock instead of cash as consideration for future earn-out obligations. We may agree to issue additional securities in connection with other future acquisitions; which, if issued, would dilute your share ownership and could lead to volatility in our common stock price.
We grow our business organically as well as through acquisitions. One method of acquiring companies or otherwise funding our corporate activities is through the issuance of additional equity securities. In connection with certain completed acquisitions, we have the option to issue shares of our common stock instead of cash for certain earn-out obligations, provided we first register those shares for resale, including one such obligation for which our earn-out obligation is unlimited. Such issuances could have the effect of diluting our earnings per share as well as our existing shareholders’ individual ownership percentages and could lead to volatility in our common stock price. Our Amended and Restated Articles of Incorporation provide that we may issue up to a total 145,000,000 shares of common stock, of which 75,954,004 shares were outstanding as of December 31, 2009.
We are not restricted from issuing additional common stock, including securities that are convertible into or exchangeable for, or that represent the right to receive, common stock. We issued $115 million of 4% senior convertible notes in June 2009, the proceeds of which were partially used to redeem at par the $55 million 8% convertible notes issued in connection with the Wanzek acquisition in December 2008. In connection with the acquisition of Precision, we issued $100 million of 4.25% senior convertible notes in November 2009. The issuance of additional shares of our common stock upon conversion of our convertible notes, in connection with future acquisitions or other issuances of our common stock or convertible securities, including outstanding options and warrants, or otherwise will dilute the ownership interest of our common shareholders. Sales of a substantial number of shares of our common stock or other equity-related securities in the public market could depress the market price of our common stock and impair our ability to raise capital through the sale of additional equity or equity-linked securities. We cannot predict the effect that future sales of our common stock or other equity-related securities would have on the market price of our common stock.
A small number of our existing shareholders have the ability to influence major corporate decisions.
Jorge Mas, our Chairman, Jose Mas, our Chief Executive Officer and other members of the Mas family who are employed by MasTec, beneficially owned approximately 28.4% of the outstanding shares of our common stock as of December 31, 2009. Accordingly, they are in a position to influence:
| • | the vote of most matters submitted to our shareholders, including any merger, consolidation or sale of all or substantially all of our assets; |
| • | the nomination of individuals to our Board of Directors; and |
| • | a change in our control. |
These factors may discourage, delay or prevent a takeover attempt that you might consider in your best interest or that might result in you receiving a premium for your common stock.
26
Table of Contents
Our articles of incorporation and certain provisions of Florida law contain anti-takeover provisions that may make it more difficult to effect a change in our control.
Certain provisions of our articles of incorporation and by-laws and the Florida Business Corporation Act, or the FBCA, could delay or prevent an acquisition or change in control and the replacement of our incumbent directors and management, even if doing so might be beneficial to our shareholders by providing them with the opportunity to sell their shares possibly at a premium over the then market price of our common stock. For example, our Board of Directors is divided into three classes. At any annual meeting of our shareholders, our shareholders only have the right to appoint approximately one-third of the directors on our Board of Directors. Consequently, it will take at least two annual shareholder meetings to effect a change in control of our Board of Directors, which may discourage hostile takeover bids. In addition, our articles of incorporation authorize our Board of Directors, without further shareholder approval, to issue preferred stock. The issuance of preferred stock could also dilute the voting power of holders of our common stock, including the granting of voting control to others, which could delay or prevent an acquisition or change in control.
| Item 1B. | Unresolved Staff Comments |
None.
| Item 2. | Properties |
Our corporate headquarters is a 24,000 square foot leased facility located in Coral Gables, Florida.
As of December 31, 2009, our operations were conducted from over 200 locations. None of these facilities is material to our operations because most of our services are performed on customers’ premises or on public rights of way and suitable alternative locations are available in substantially all areas where we currently conduct business.
We also own property and equipment that had a net book value of $198.8 million at December 31, 2009. This property and equipment includes land, buildings, vans, trucks, tractors, trailers, bucket trucks, backhoes, bulldozers, directional boring machines, digger derricks, cranes, networks, computers, computer software, office and other equipment. Our equipment is acquired from various third-party vendors, none of which we depend upon, and we did not experience any difficulties in obtaining desired equipment in 2009.
| Item 3. | Legal Proceedings |
Legacy Litigation
We are subject to litigation, some of which dates from the period from 2001 through 2005 and which we refer to as legacy litigation. The legacy litigation is set forth below.
In March 2006, the United States Army Corps of Engineers (“Corps of Engineers”) brought a complaint in a federal district court against us for environmental violations in connection with a project in Coos County, Oregon and sought damages in excess of $16 million. The matter went to trial in February 2008, and in February 2009, the Federal District Court entered a judgment in favor of the Corps of Engineers in the amount of $1.5 million. The Corps of Engineers filed a notice of appeal but subsequently dismissed its appeal in September 2009. The judgment was paid in January 2010.
We filed a lawsuit against Consolidated Edison, Inc., Consolidated Edison Company of New York, Inc. and Con Edison Communications, Inc. (collectively, “Con Edison”) in May 2002 in connection with a telecommunication project we worked on for Telergy, Inc. (“Telergy”). The lawsuit alleged that Con Edison directly interfered with our work for Telergy and that this interference resulted in Telergy’s bankruptcy and resulted in Con Edison obtaining our work on the Telergy project without paying for it. The matter was settled in December 2009 with the parties releasing each other from liability, and Con Edison agreeing to pay us $6 million, of which $3 million was paid in December 2009. The $3 million remaining is due in December 2014 but it shall be reduced by a certain percentage of any payments received by us for services we performed for Con Edison. We recorded a gain of $2.0 million, net of legal fees, in 2009 in connection with the settlement.
We are vigorously pursuing claims in excess of $5 million against Aon Risk Services, Inc. of Florida, an insurance broker, for breach of contract and breach of fiduciary duty for the losses arising from a denial of insurance coverage. Discovery is ongoing.
27
Table of Contents
We provided telecommunication infrastructure services to Adesta Communications, Inc. (“Adesta”) in 2000 and 2001. Adesta filed for bankruptcy in 2001. Adesta’s bankruptcy trustee sold Adesta’s assets in the trust, and we are waiting for a distribution from that trust. Based on our current understanding of the expected distribution, we have a receivable of approximately $1.0 million based on trust assets available for distribution, which is recorded in other current assets on our consolidated balance sheet as of December 31, 2009.
The labor union representing the workers of Sistemas e Instalaciones de Telecomunicación S.A. (“Sintel”), a former MasTec subsidiary, filed a claim that initiated an investigative action with the Audiencia Nacional, a Spanish federal court, against Telefonica and dozens of other defendants including former officers and directors of MasTec (including a current director) relating to Sintel’s 2000 bankruptcy. The union alleged Sintel and its creditors were damaged in the approximate amount of 300 million euros (approximately $430 million as of December 31, 2009). In June 2009, the Audiencia Nacional issued an order that the trial phase was commencing against the MasTec defendants and other defendants. The MasTec defendants believe the claims are frivolous and are vigorously defending the matter. We will vigorously defend any potential liability. We were not directly involved in any of the transactions which the Spanish prosecutor alleges led to Sintel’s bankruptcy. Our directors’ and officers’ insurance carrier has agreed to fund legal expenses under a reservation of rights. The amount of loss to us, if any, relating to this matter cannot presently be determined.
Resolved Litigation
As previously disclosed, in July 2008, we filed a claim in arbitration against our investment advisor (“Investment Advisor”) with the Financial Industry Regulatory Authority, Inc. (“FINRA”) for negligence, unsuitability, negligent supervision, negligent misrepresentations and omissions of material fact, breach of fiduciary duty, breach of contract and violations of state securities laws in connection with the sale by the Investment Advisor to us of certain auction rate securities in the aggregate principal amount of $33.7 million. We sought, among other relief, rescission of the purchase of the auction rate securities and the Investment Advisors denied our claims. The matter was settled in October 2009 with a mutual release from liability, the Investment Advisor paying us $7 million, before legal expenses, which was recorded in other income, and our keeping the auction rate securities.
In addition to the matters discussed above, we are subject to a variety of legal cases, claims and other disputes that arise from time to time in the ordinary course of its business. We cannot provide assurance that it will be successful in recovering all or any of the potential damages it has claimed or in defending claims against it.
Accrued aggregate liabilities related to the matters described above and other litigation matters amounted to $2.2 million at December 31, 2009 and $13.2 million at December 31, 2008.
| Item 4. | Submission of Matters to a Vote of Security Holders |
None.
| Item 5. | Market for the Registrant’s Common Equity, Related Shareholder Matters and Issuer Purchases of Equity Securities |
Market Information
Our common stock is listed on the New York Stock Exchange under the symbol “MTZ”. The following table sets forth, for the quarters indicated, the high and low sale prices of our common stock, as reported by the New York Stock Exchange.
28
Table of Contents
| Year Ended December 31, | ||||||||||||
| 2009 | 2008 | |||||||||||
| High | Low | High | Low | |||||||||
| First Quarter |
$ | 13.00 | $ | 8.90 | $ | 10.32 | $ | 6.96 | ||||
| Second Quarter |
$ | 14.00 | $ | 11.26 | $ | 12.10 | $ | 7.18 | ||||
| Third Quarter |
$ | 12.78 | $ | 9.15 | $ | 15.74 | $ | 9.73 | ||||
| Fourth Quarter |
$ | 13.45 | $ | 11.11 | $ | 13.20 | $ | 5.55 | ||||
Holders. As of February 22, 2010, there were 3,570 shareholders of record of our common stock.
Performance Graph
The performance graph below compares the cumulative total returns for our common stock with the cumulative total return (including reinvestment of dividends) of the Standard and Poor’s 500 Composite Stock Index (S&P 500), and with that of our Peer Group, comprised of Dycom Industries, Inc., Quanta Services, Inc. and Pike Electric, Inc.
The graph assumes an investment of $100 in our common stock and in each of the respective indices, for the period from December 31, 2004 to December 31, 2009. The comparisons in the graph are required by the SEC and are not intended to forecast or be indicative of possible future performance of our common stock.
The performance graph shall not be deemed incorporated by reference by any general statement incorporating by reference this annual report into any filing under the Securities Act of 1933 or the Securities Exchange Act of 1934 except to the extent we specifically incorporate this information by reference, and shall not otherwise be deemed filed under such acts.
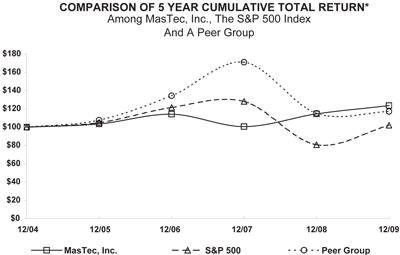
| * $100 invested on 12/31/04 in stock or index, including reinvestment of dividends. Fiscal year ending December 31. |
||||
| Copyright© 2010 S&P, a division of The McGraw-Hill Companies Inc. All rights reserved. | ||||
Dividends. We have never paid any cash dividends and do not anticipate paying any cash dividends in the foreseeable future. We intend to retain any future earnings for reinvestment. Our Board of Directors will make any future determination as to the payment of dividends at its discretion, and its determination will depend upon our operating results, financial condition and capital requirements, general business conditions and such other factors that the Board of Directors considers relevant. In addition, our credit agreements prohibit us from paying cash dividends or making other distributions of our common stock without prior consent of the lender. The indenture governing our senior notes also contains covenants that restrict our ability to make certain payments including the payment of dividends. See “Item 7. Management’s Discussion and Analysis of Financial Condition and Results of Operations - Financial Condition, Liquidity and Capital Resources.”
29
Table of Contents
Purchases of Common Stock. We did not repurchase any shares of our common stock during the three months ended December 31, 2009.
| Item 6. | Selected Financial Data |
The following table states our selected consolidated financial data, which has been derived from our audited consolidated financial statements. The table reflects our consolidated results of operations for the periods indicated. Our consolidated results of operations are not necessarily comparable from period to period due to the impact of recent acquisitions. See the Notes to Consolidated Financial Statements, Note 4 - Acquisitions. All periods presented reflect our Canadian operations and state Department of Transportation projects as discontinued operations. The following selected financial data should be read together with our consolidated financial statements and notes thereto as well as “Item 7. Management’s Discussion and Analysis of Financial Condition and Results of Operations.”
| Year Ended December 31, | |||||||||||||||||||
| 2009 | 2008 | 2007 | 2006 | 2005 | |||||||||||||||
| (In thousands, except per share amounts) | |||||||||||||||||||
| Statement of Operations Data |
|||||||||||||||||||
| Revenue |
$ | 1,623,502 | $ | 1,378,663 | $ | 1,037,779 | $ | 940,421 | $ | 838,663 | |||||||||
| Costs of revenue, excluding depreciation |
$ | 1,376,125 | $ | 1,179,190 | $ | 891,606 | $ | 808,142 | $ | 722,427 | |||||||||
| Income from continuing operations |
$ | 70,748 | $ | 66,602 | $ | 6,283 | $ | 40,050 | $ | 21,331 | |||||||||
| Loss from discontinued operations, net of tax |
$ | — | $ | (814 | ) | $ | (13,611 | ) | $ | (90,398 | ) | $ | (35,947 | ) | |||||
| Net income (loss) attributable to MasTec |
$ | 70,748 | $ | 65,788 | $ | (7,328 | ) | $ | (50,348 | ) | $ | (14,616 | ) | ||||||
| Basic net income (loss) per share attributable to MasTec: |
|||||||||||||||||||
| Continuing operations |
$ | 0.93 | $ | 0.98 | $ | 0.10 | $ | 0.63 | $ | 0.44 | |||||||||
| Discontinued operations |
$ | — | $ | (0.01 | ) | $ | (0.21 | ) | $ | (1.42 | ) | $ | (0.73 | ) | |||||
| Total basic net income (loss) per share attributable to MasTec |
$ | 0.93 | $ | 0.97 | $ | (0.11 | ) | $ | (0.79 | ) | $ | (0.30 | ) | ||||||
| Diluted net income (loss) per share attributable to MasTec: |
|||||||||||||||||||
| Continuing operations |
$ | 0.90 | $ | 0.97 | $ | 0.09 | $ | 0.62 | $ | 0.43 | |||||||||
| Discontinued operations |
$ | — | $ | (0.01 | ) | $ | (0.20 | ) | $ | (1.39 | ) | $ | (0.72 | ) | |||||
| Total diluted net income (loss) per share attributable to MasTec |
$ | 0.90 | $ | 0.96 | $ | (0.11 | ) | $ | (0.77 | ) | $ | (0.29 | ) | ||||||
| December 31, | |||||||||||||||||||
| 2009 | 2008 | 2007 | 2006 | 2005 | |||||||||||||||
| (In thousands) | |||||||||||||||||||
| Balance Sheet Data |
|||||||||||||||||||
| Working capital |
$ | 203,023 | $ | 105,317 | $ | 163,812 | $ | 164,042 | $ | 135,742 | |||||||||
| Property and equipment, net |
$ | 198,812 | $ | 158,013 | $ | 81,939 | $ | 61,212 | $ | 47,513 | |||||||||
| Total assets |
$ | 1,363,449 | $ | 1,090,897 | $ | 710,749 | $ | 646,113 | $ | 584,837 | |||||||||
| Total debt |
$ | 438,396 | $ | 304,338 | $ | 162,973 | $ | 130,176 | $ | 200,370 | |||||||||
| Total shareholders’ equity |
$ | 528,162 | $ | 443,090 | $ | 314,565 | $ | 304,711 | $ | 179,603 | |||||||||
| Item 7. | Management’s Discussion and Analysis of Financial Condition and Results of Operations |
The following discussion and analysis of our financial condition and results of operations should be read in conjunction with our historical consolidated financial statements and related notes thereto in “Item 8. Financial Statements and Supplementary Data.” The discussion below contains forward-looking statements that are based upon our current expectations and are subject to uncertainty and changes in circumstances. Actual results may differ materially from these expectations due to inaccurate assumptions and known or unknown risks and uncertainties, including those identified in “Cautionary Statement Regarding Forward-Looking Statements” and “Item 1A. Risk Factors.”
Overview
We are a leading specialty contractor operating mainly throughout the United States and across a range of industries. Our core activities are the building, installation, maintenance and upgrade of utility and communications infrastructure, including but not limited to: electrical utility transmission and distribution, wind farm, solar farm, other renewable energy, natural gas and petroleum pipeline infrastructure, wireless, wireline and satellite communications and water and sewer systems. Our primary customers are in the following industries: utilities (including wind farms, solar farms and other renewable energy, natural gas gathering systems and pipeline infrastructure), communications (including telephony, satellite television and cable television) and government (including water and sewer, utilities and communications work on military bases).
We, or our predecessor companies, have been in business for over 75 years. We offer our services primarily under the MasTec service mark and operate through a network of approximately 200 locations and approximately 8,600 employees as of December 31, 2009. We have consistently ranked among the top specialty contractors by Engineering News-Record over the past five years.
30
Table of Contents
We have continued our diversification and expansion strategy through several recent acquisitions which have expanded our service offerings to customers. During 2007 and 2008, we acquired the remaining ownership interest in GlobeTec Construction, LLC. GlobeTec is involved in the construction and maintenance of water and sewer pipelines and projects. In October 2007, we acquired Three Phase Line Construction, Inc., which is involved in the construction and maintenance of electrical transmission and distribution utility systems, substation and storm restoration in several northern states and has a largely unionized workforce, which is required for some projects. In December 2007, we acquired certain assets of Power Partners, LLC, which is an electrical utility contractor specializing in wind farm electrical system design and construction. In May 2008, we acquired Pumpco, Inc., which is a mid-stream natural gas pipeline construction company. In July 2008, we acquired certain assets of Nsoro, LLC, which specializes in wireless network design, construction, upgrade and maintenance. In December 2008, we acquired Wanzek Construction, Inc, (“Wanzek”), a construction company focusing on wind farm, heavy civil and industrial and infrastructure construction. In November 2009, we acquired Precision Pipeline, LLC (“Precision”), a large diameter natural gas, crude oil and refined products transmission pipeline construction and infrastructure services provider, which has a largely unionized workforce. See the Notes to Consolidated Financial Statements, Note 4 - Acquisitions for details.
In June 2009, we completed an underwritten public offering for $115 million of 4% senior convertible notes, as well as a public secondary offering of 5.175 million shares of common stock by certain selling shareholders. In November 2009, we purchased all of the issued and outstanding membership interests of Precision Pipeline, LLC for approximately $132 million in cash, the assumption of $34 million of Precision’s debt and a five-year earn-out equal to 40% of Precision’s EBITDA (as defined in the purchase agreement) for the last two months of 2009 and 30% of Precision’s annualized EBITDA in excess of $35 million for the remainder of the earn-out period, payable at our option in cash or shares of our common stock, or a combination thereof. Concurrent with the Precision acquisition, we issued $100 million of 4.25% senior convertible notes. See Item 1, “Business – Recent Developments,” for further details.
As discussed in the results of operations, revenue for the year ended December 31, 2009 was up approximately 18% versus the same period in 2008, primarily as a result of recent acquisitions. Despite the increase in year over year revenues, both our organic as well as our acquired businesses have been negatively impacted by the weak state of the U.S. economy and the resulting delay in expenditures by our customers. As a result, we have not yet seen the full anticipated impact of our diversification strategy. We are uncertain as to when, or if, the governmental stimulus initiatives will begin to have a noticeable impact on the industries we serve, however, we do anticipate increased capital spending on infrastructure in the future.
We recognize that we and our customers are operating in a challenging business environment in light of the economic downturn and weak capital markets. We are closely monitoring our customers and the effect that changes in economic and market conditions may have on them. Certain of our customers reduced spending in 2009, in part due to the negative economic and market conditions, and we anticipate that these negative conditions will continue to affect demand for some of our services in the near-term. However, we believe that most of our customers remain financially stable in general and will be able to continue with their business plans in the long-term without substantial constraints.
Revenue
We provide building, installation, maintenance, and upgrade services to our customers, which are companies in the communications and utilities industries, as well as government customers. Revenue for customers in these industries is as follows (in thousands):
| Year Ended December 31, | ||||||||||||||||||
| 2009 | 2008 | 2007 | ||||||||||||||||
| Communications |
$ | 940,107 | 58 | % | $ | 865,519 | 63 | % | $ | 769,375 | 74 | % | ||||||
| Utilities |
614,149 | 38 | % | 447,197 | 32 | % | 217,739 | 21 | % | |||||||||
| Government |
69,246 | 4 | % | 65,947 | 5 | % | 50,665 | 5 | % | |||||||||
| $ | 1,623,502 | 100 | % | $ | 1,378,663 | 100 | % | $ | 1,037,779 | 100 | % | |||||||
A significant portion of our revenue is derived from projects performed under service agreements. We also provide services under master service agreements which are generally multi-year agreements. Certain of our master service agreements are exclusive up to a specified dollar amount per work order for each defined geographic area, but do not obligate our customers to undertake any infrastructure projects or other work with us. Work performed under master service and other agreements is typically generated by work orders, each of which is performed for a fixed fee. The majority of these services are for either maintenance or upgrade services.
31
Table of Contents
These master service agreements and other service agreements are frequently awarded on a competitive bid basis, although customers are sometimes willing to negotiate contract extensions beyond their original terms without re-bidding. Our master service agreements and other service agreements have various terms, depending upon the nature of the services provided and are typically subject to termination on short notice.
The remainder of our work is generated pursuant to contracts for specific projects or jobs that may require the construction and installation of specified units within an infrastructure system or an entire infrastructure system. Customers are billed with varying frequency: weekly, monthly or upon attaining specific milestones. Such contracts generally include retainage provisions under which 2% to 15% of the contract price is withheld from us until the work has been completed and accepted by the customer.
Revenue by type of contract is as follows (in thousands):
| Year Ended December 31, | ||||||||||||||||||
| 2009 | 2008 | 2007 | ||||||||||||||||
| Master service and other service agreements |
$ | 922,582 | 57 | % | $ | 845,895 | 61 | % | $ | 776,853 | 75 | % | ||||||
| Installation/construction project agreements |
700,920 | 43 | % | 532,768 | 39 | % | 260,926 | 25 | % | |||||||||
| $ | 1,623,502 | 100 | % | $ | 1,378,663 | 100 | % | $ | 1,037,779 | 100 | % | |||||||
Costs of Revenue
Our costs of revenue include the costs of providing services or completing the projects under our contracts, including: operations payroll and benefits, fuel, subcontractor costs, equipment rental, materials not provided by our customers, and insurance. Profitability will be reduced if actual costs to complete each unit exceed original estimates on fixed price and installation/construction service agreements. Estimated losses on contracts are recognized immediately when estimated costs to complete a project exceed the remaining revenue to be received over the remainder of the contract.
In certain circumstances, our customers supply materials such as cable, conduit, telephone equipment and pipe and determine the specifications of the materials that are to be utilized to perform installation and/or construction services. In cases in which our customers retain the financial and performance risk of all customer furnished materials, these materials are not included in our revenue and cost of sales.
General and Administrative Expenses
General and administrative expenses include all costs of our management and administrative personnel, provisions for bad debts, rent, utilities, travel, business development efforts and back office administration such as financial services, insurance, administration, professional costs and clerical and administrative overhead.
Discontinued Operations
Effective February 2007, we sold the state Department of Transportation related projects and net assets. As a result of this sale, we recorded impairment charges totaling $2.9 million during the year ended December 31, 2007. On January 24, 2008, we entered into a settlement with the buyer of our state Department of Transportation projects and assets to settle previously disclosed warranty, indemnification and other claims primarily relating to work we had performed on the projects that were sold. As a result of the settlement, we recorded a charge of $6.0 million, which is reflected in our loss from discontinued operations for the year ended December 31, 2007. In October 2009, the buyer filed for bankruptcy protection, which increases the likelihood that we will be required to assume certain obligations associated with these projects.
In April 2007, we sold substantially all of our Canadian operations for approximately $1.0 million. In connection therewith, we recorded a non-cash impairment charge of $0.6 million, including $0.4 million reduction in the carrying amount of goodwill. See the Notes to Consolidated Financial Statements, Note 20 - Discontinued Operations for details.
The financial information for all periods presented in this annual report on Form 10-K reflects the above operations as discontinued operations.
32
Table of Contents
Financial Metrics
Members of our senior management team regularly review key performance metrics and the status of operating initiatives within our business. These key performance indicators include:
| • | revenue and profitability on an overall and individual project basis; |
| • | monthly, quarterly and annual changes in revenue and profitability on an overall and individual project basis; |
| • | revenues by customer, by industry and by contract type; |
| • | costs of revenue, general and administrative expenses, depreciation and amortization, tax and interest expense as a percentage of revenue; |
| • | days sales and days payable outstanding; |
| • | interest and debt service coverage ratios; |
| • | liquidity and cash flows; |
| • | safety results and productivity; and |
| • | customer service metrics on an individual project basis. |
We analyze this information periodically through operating reviews, which include detailed discussions of proposed investments in new business opportunities or property equipment, integration efforts and cost reduction efforts. Measuring these key performance indicators is an important tool used by management to make operational decisions. These tools enable our management to make informed and timely decisions about the allocation of costs and resources, which we believe can help us improve our performance.
Critical Accounting Policies and Estimates
This discussion and analysis of our financial condition and results of operations is based upon our consolidated financial statements, which have been prepared in accordance with accounting principles generally accepted in the United States. The preparation of these financial statements requires us to make estimates and judgments that affect the reported amounts of assets, liabilities, revenue and expenses, and related disclosure of contingent assets and liabilities. On an on-going basis, we evaluate our estimates, including those related to revenue recognition, allowances for doubtful accounts, securities available for sale, goodwill and intangible assets, reserves and accruals, impairment of assets, income taxes, insurance reserves and litigation and contingencies. We base our estimates on historical experience and on various other assumptions that we believe to be reasonable under the circumstances, the results of which form the basis of making judgments about the carrying values of assets and liabilities that are not readily apparent from other sources. Actual results may differ from these estimates if conditions change or if certain key assumptions used in making these estimates ultimately prove to be materially incorrect.
We believe the following accounting policies are the most critical in the preparation of our consolidated financial statements as they are both important to the portrayal of our financial condition and they require significant or complex judgment and estimates on the part of management. Refer to the Notes to Consolidated Financial Statements, Note 2 - Summary of Significant Accounting Policies, for further description of the Company’s significant accounting policies.
Our critical accounting policies are reviewed frequently with the Audit Committee of the Board of Directors.
Revenue Recognition
Revenue and related costs for master and other service agreements billed on a time and materials basis are recognized as the services are rendered. Services are also performed under master and other service agreements billed on a fixed fee basis. Under fixed fee master service and similar type service agreements, we furnish various specified units of service for a separate fixed price per unit of service. For service agreements on a fixed fee basis, profitability will be reduced if the actual costs to complete each unit exceed original estimates.
In addition to master and other service agreements, we enter into contracts that require the installation or construction of specified units within an infrastructure system. Under these contracts, revenue is recognized at the contractually agreed price per unit as the units are completed and delivered. Profitability will be reduced if the actual costs to complete each unit exceed our original estimates. The full amount of any estimated loss on these projects is immediately recognized if estimated costs to complete the remaining units for the project exceed the revenue to be earned on such units.
33
Table of Contents
We also enter into fixed price, long-term installation/construction contracts that primarily require the construction and installation of an entire infrastructure system. Revenue and related costs are recognized as work progresses under these contracts using the percentage-of-completion method, which requires us to estimate total project costs and profit to be earned on each long-term, fixed price contract. Our process of estimating total costs is based upon the knowledge and experience of our project managers and financial professionals. Under the percentage-of-completion method, we record revenue and recognize profit or loss as work on the contract progresses. The cumulative amount of revenue recorded on a contract at a specified point in time is that percentage of total estimated revenue that contract costs incurred to date bear to estimated total contract costs. We recognize the full amount of any estimated loss on a contract at the time our estimates indicate such a loss.
Periodically, work is performed outside of the specific requirements of the contract at the request of the customer. Generally, revenue associated with such work is not recognized until the change order reflecting the scope and price for such work is executed. In rare circumstances, the revenue may be recognized up to the amount of the cost, if it is probable that the revenue is both realizable and collectible.
In certain circumstances, our customers supply materials such as cable, conduit, telephone equipment and pipe and determine the specifications of the materials that are to be utilized to perform installation and/or construction services. Customer-furnished materials for which the customer retains the financial and performance risk are not included in revenue and cost of sales.
Contract costs include all direct material, labor and subcontract costs as well as indirect costs related to contract performance, such as indirect labor, supplies, tools and the operational costs of capital equipment (excluding depreciation). Factors that we consider in estimating the work to be completed and ultimate contract recovery include: the availability and productivity of labor, the nature and complexity of the work to be performed, the effect of change orders, the availability of materials, the effect of any delays in performance and the recoverability of any claims. Changes in job performance, job conditions, estimated profitability and final contract settlements are factors that impact management’s assessment of the total estimated costs to complete these contracts and therefore, may result in revisions to costs and income. If actual results significantly differ from the estimates we used for revenue recognition and claim assessments, our financial condition and results of operations could be materially impacted.
Billings in excess of costs and estimated earnings on uncompleted contracts are classified as current liabilities. Any costs and estimated earnings in excess of billings are classified as current assets. Work in process on contracts is based on work performed but not yet billed to customers as per individual contract terms.
Allowance for Doubtful Accounts
We maintain allowance for doubtful accounts for estimated losses resulting from the inability of our customers to make required payments. When evaluating the adequacy of the allowance for doubtful accounts, we analyze the collectibility of accounts receivable based on the aging of account balances, historical bad debt experience, customer concentrations, customer credit-worthiness, customer financial condition and credit reports, availability of mechanics’ and other liens, existence of payment bonds and other sources of payment and current economic trends. If our estimates of the collectibility of accounts receivable change, adjustments to the allowance for doubtful accounts may be required, which could reduce our profitability.
Our estimates for the allowance for doubtful accounts are subject to significant change during times of economic weakness or uncertainty in either the overall U.S. economy or the industries we serve. To proactively manage accounts receivable aging and collections and evaluate the adequacy of our allowance for doubtful accounts, we continue to monitor the economic environment and its impact on our customers.
We recorded total provisions against earnings for doubtful accounts of $2.4 million, $3.5 million and $17.5 million, for the years ended December 31, 2009, 2008 and 2007, respectively, of which $0.3 million, $0.9 million and $14.1 million, respectively, resulted from anticipated legal settlements for customers in bankruptcy and discontinued operations.
34
Table of Contents
Securities Available-for-Sale
Securities available for sale. Securities available-for-sale are recorded at fair value and temporary unrealized holding gains and losses are recorded as a separate component of accumulated other comprehensive income (loss), net of deferred taxes. Unrealized losses are charged against net earnings when a decline in fair value is determined to be other-than-temporary. Several factors are reviewed to determine whether a loss is other-than-temporary. These factors include but are not limited to: the length of time a security is in an unrealized loss position, the extent to which fair value is less than cost, the financial condition and near term prospects of the issuer, changes to the credit ratings of the securities, as well as the underlying assets supporting these securities, rates of default on the underlying portfolio of credit default swaps and the Company’s intent and ability to hold the security for a period of time sufficient to allow for any anticipated recovery in fair value.
In accordance with ASC 820, Fair Value Measurements and Disclosures, an impairment is considered to be other-than-temporary if an entity: intends to sell the security, more likely than not will be required to sell the security before recovering its cost, or does not expect to recover the security’s entire amortized cost basis, even if there is no intent to sell the security. In assessing the expectation of recovery, we perform an assessment of the present value of cash flows expected to be collected. If this assessment yields an amount less than the amortized cost basis of the security, even if we have the intent, and more likely than not, the ability to hold the securities, a credit loss is deemed to exist, which is considered an other-than-temporary impairment. The amount of an other-than-temporary impairment attributable to credit losses is recognized in earnings, while the amount of an other-than-temporary impairment related to other factors is recognized in other comprehensive income.
Our securities available for sale consist of auction-rate securities that represent interests in pools of student loans guaranteed by the U.S. government under the Federal Family Education Loan Program and structured finance securities. These structured finance securities are collateralized by investment grade credit-linked notes made up of floating rate international bank notes or credit card receivable notes that collateralize credit default swap agreements on corporate debt obligations with remaining terms of 7 to 8 years. Under the terms of these credit default swaps, the principal value of these auction rate securities would be impaired at net default rates of the underlying corporate debt obligations ranging from 8% to 10.75%. Liquidity for auction-rate securities is typically provided by an auction process that resets the applicable interest rate at pre-determined intervals, usually every 7, 28 or 35 days. Due to disruptions in the credit markets beginning in 2008, these auctions have not had sufficient bidders to allow investors to complete a sale, indicating that immediate liquidity at par is unavailable. Management is uncertain at this time as to when, or if, the liquidity issues associated with these investments will improve, and as a result of this uncertainty, has classified these securities as long-term assets since June 30, 2008.
As of December 31, 2009, there was insufficient observable market data to determine the fair value of our auction rate securities due to the lack of activity in this market. Therefore, the fair value of these investments was estimated by an independent valuation firm, Houlihan Smith & Company, Inc., using a probability weighted discounted cash flow model. This model incorporates assumptions market participants would use in their estimates of fair value such as reset interest rates, final stated maturities, collateral values, credit quality and insurance, and applies the probabilities of either (a) a successful auction, (b) a failed auction, or (c) a default, at each auction. This valuation is sensitive to market conditions and management’s judgment and can change significantly based on the assumptions used. Factors that may impact the valuation include changes to credit ratings of the securities as well as to the underlying assets supporting the securities, rates of default of the underlying assets, underlying collateral values, discount rates, counterparty risk and ongoing strength and quality of market credit and liquidity.
During 2009, all of our structured finance auction rate securities, with a par value of $16.2 million and an estimated fair value of $8.1 million, were downgraded to non-investment grade by Standard & Poor’s and Fitch. Due to the deterioration in credit quality of our structured finance auction rate securities, the Company has deemed the decline in fair value on these securities to be an other-than-temporary impairment as of December 31, 2009. Of the total other-than-temporary impairment of these structured finance securities of $8.1 million, $6.1 million is attributed to credit losses. Accordingly, the Company recorded an other-than-temporary impairment in earnings of $6.1 million during the year ended December 31, 2009.
In October 2009, we settled our claim against the investment advisor that sold us the auction rate securities.
See Note 6 - Securities Available for Sale and Note 17 - Commitments and Contingencies in the notes to the consolidated financial statements.
35
Table of Contents
Valuation of Goodwill and Intangible Assets
Management performs its annual impairment review of goodwill and certain intangible assets with indefinite lives during the fourth quarter each year at the reporting unit level. The assets of each acquired business and the related goodwill are allocated to multiple reporting units based upon the availability and suitability of management expertise to execute and integrate the acquired projects. Management identifies its reporting units by assessing whether businesses holding purchased assets, including goodwill, and related assumed liabilities have discrete financial information available. Our reporting units are one level below our reportable segment.
Our reporting units sell and provide contracting services, including building, installation, maintenance and upgrade services by, primarily, digging and drilling trenches and installing poles, towers, antennae, wire, and equipment. Each of our reporting units performs these services across multiple industries, including telecommunications, energy, and government and to a variety of customers, some of which receive services from multiple reporting units.
Management estimates the fair value of each reporting unit and compares the fair value to its carrying value including goodwill. If the carrying value exceeds the fair value, the value of the reporting units’ goodwill or other indefinite-lived intangibles may be impaired and written down.
During the three year period ended December 31, 2009, management estimated the fair value of the its reporting units based on a five-year projection of revenues, operating costs, and cash flows considering historical and anticipated future results, general economic and market conditions, as well as the impact of planned business and operational strategies. Management applied a five year discounted cash flow technique utilizing a terminal value equal to 5.5 to 7 times year five EBITDA (earnings before net interest expense, income taxes, depreciation and amortization). Discount rates ranged from 9% to 14% per annum and represent our estimated cost of capital at the time of the analysis. A 100 basis point change in the discount rate would not have had a material impact on the results of the impairment analysis. Based upon these analyses, no material impairment charges were required for the three years ended December 31, 2009. However, significant changes in the estimates used in our analysis could result in an impairment charge related to goodwill and intangible assets. In addition, we could record impairment losses in the future if profitability and cash flows of our reporting entities decline to the point where their carrying values exceeded their market values. See “Item 1A. Risk Factors - our reporting entity may incur goodwill impairment charges which could harm our profitability.”
Insurance Reserves
We presently maintain insurance policies subject to per claim deductibles of $1 million for our workers’ compensation policy, $2 million for our general liability policy and $2 million for our automobile liability policy. We have excess umbrella coverage up to $100 million per claim and in the aggregate. We also maintain an insurance policy with respect to employee group health claims subject to per claim deductibles of $0.4 million. We actuarially determine any liabilities for unpaid claims and associated expenses, including incurred but not reported losses, and reflect the present value of those liabilities in our balance sheet as other current and non-current liabilities. The determination of such claims and expenses and the appropriateness of the related liability is reviewed and updated quarterly. However, insurance liabilities are difficult to assess and estimate due to the many relevant factors, the effects of which are often unknown, including the severity of an injury, the determination of our liability in proportion to other parties, the number of incidents not reported and the effectiveness of our safety program. We continue to work with our insurance carriers to resolve claims quickly in an effort to reduce our exposure. We are also attempting to accelerate the claims process where possible so that amounts incurred can be reported rather than estimated. Known amounts for claims that are in the process of being settled, but have been paid in periods subsequent to those being reported, are recorded in the subsequent reporting period. Our accruals are based upon known facts, historical trends and our reasonable estimate of future expenses and we believe such accruals to be adequate.
Income Taxes
Tax valuation allowances are established to reduce tax assets, such as tax loss carryforwards, to net realizable value. We consider future pretax income and ongoing prudent and feasible tax planning strategies in assessing the net realizable value of tax assets and the need for such a valuation allowance. In the event that we determine that we may not be able to realize all or part of the net deferred tax asset in the future, a valuation allowance for the deferred tax asset is charged against income in the period such determination is made. We have net operating loss carryforwards of approximately $120.6 million for federal income tax purposes that begin to expire in 2023. Based on our recent history of profitability and our forecasts for future periods, we have determined that it is more likely than not that the federal and state net operating loss carryforwards and other temporary differences will be realized. Therefore, we have released the valuation allowance that we established against these domestic net operating losses in prior years. We have valuation allowances aggregating $5.4 million and $24.2 million as of December 31, 2009 and 2008, respectively. The valuation allowance totaling $5.4 million at December 31, 2009 relates to foreign net operating losses and credit carryforwards that we believe may not be realized in future periods.
36
Table of Contents
Litigation and Contingencies
Litigation and contingencies are reflected in our consolidated financial statements based on our assessments, along with legal counsel, of the expected outcome of such litigation or expected resolution of such contingency. An accrual is made when the loss of such contingency is probable and estimable. If the final outcome of such litigation and contingencies differs significantly from our current expectations, such outcome could result in a charge to earnings. See “Part I. Item 3. Legal Proceedings” for discussion of current litigation matters.
2010 Outlook
We believe we have significant market opportunities in 2010 in five areas:
Alternative and Renewable Energy Projects - we believe this market will continue to grow in 2010 and we have made acquisitions to expand our capabilities in this area, where our primary focus is the construction of wind farms, solar farms and related infrastructure. The increasing regulatory mandates for electricity generation from alternative and renewable sources and the Stimulus Act, which calls for expansion of domestic renewable energy sources through tax incentives, cash grants and loan guarantees, should provide our wind farm business with the potential for sustained growth.
Work for Electrical Grid Upgrades - we believe that the nation’s electrical grid, which routinely encounters capacity and reliability issues, will be expanded, modernized and upgraded in the coming years. Also, renewable energy, which is often generated in remote areas, will require a significant investment in new transmission and substation assets in order to deliver this power to population and industrial centers with high electrical power demand. The Stimulus Act allocates $11 billion for modernization and expansion of the national electrical grid in order to develop a smart grid. Additionally, we believe that cost and labor conditions are making it increasingly attractive for utilities to outsource their construction and maintenance activities.
Wireless and Fiber Communications Network Upgrades - we believe certain wireless and wire line communications networks upgrades will grow in 2010 and that the Regional Bell Operating Companies, or RBOCs, and other communications companies, will continue to enhance their capabilities in these areas which could increasing the demand for our services. We have recently expanded our capabilities in wireless construction. Additionally, the Stimulus Act allocates $7.2 billion for the development of broadband facilities throughout the U.S and the expansion of broadband access into areas that are currently not served by high-speed data networks.
Natural Gas Pipelines - we believe that demand for clean-burning, domestic natural gas will grow in future years in order to reduce U.S. dependence on foreign energy sources. With recent developments in drilling and completion technologies for oil and gas, we expect new North American producing fields to be developed and old fields to be expanded significantly. We anticipate the resulting incremental production will provide increasing opportunities for our gas gathering, gas compression, gas treatment, long-haul and mid-stream gas pipeline construction operations. We have made recent acquisitions to expand our capabilities in these areas.
Install to the Home - we believe the increased number of DIRECTV® subscribers and expansion of high definition video programming provide us with the continuing opportunity to provide installation, upgrade and maintenance services for new and existing customers. Also, AT&T began a co-marketing agreement with DIRECTV® on February 1, 2009 in which they bundle DIRECTV® services with their voice and data services in numerous markets exclusively serviced by us. Additionally, our expertise in home installation provides opportunities to offer similar, or unrelated, installation services for new customers.
Our 2010 results could be adversely affected by the matters discussed in the “Cautionary Statement Regarding Forward-looking Statements”, “Item 1A. Risk Factors” and “Item 3. Legal Proceedings” of this Annual Report on Form 10-K.
Comparisons of Fiscal Year Results
The components of our consolidated statements of operations, expressed in dollars (in thousands) and as a percentage of revenue, are set forth in the following table. Our consolidated results of operations are not necessarily comparable from period to period due to the impact of recent acquisitions. See the Notes to Consolidated Financial Statements, Note 4 – Acquisitions.
37
Table of Contents
| Year Ended December 31, | |||||||||||||||||||||
| 2009 | 2008 | 2007 | |||||||||||||||||||
| Revenue |
$ | 1,623,502 | 100.0 | % | $ | 1,378,663 | 100.0 | % | $ | 1,037,779 | 100.0 | % | |||||||||
| Costs of revenue, excluding depreciation |
1,376,125 | 84.8 | 1,179,190 | 85.5 | 891,606 | 85.9 | |||||||||||||||
| Depreciation and amortization |
49,539 | 3.1 | 28,465 | 2.1 | 18,088 | 1.7 | |||||||||||||||
| General and administrative expenses |
96,932 | 6.0 | 89,705 | 6.5 | 113,623 | 11.0 | |||||||||||||||
| Interest expense, net of interest income |
24,690 | 1.5 | 14,758 | 1.1 | 9,236 | 0.9 | |||||||||||||||
| Other (income) expense, net |
(2,917 | ) | (0.2 | ) | (927 | ) | (0.1 | ) | (3,516 | ) | (0.3 | ) | |||||||||
| Income from continuing operations before income taxes and non-controlling interest and minority interest |
79,133 | 4.9 | 67,472 | 4.9 | 8,742 | 0.8 | |||||||||||||||
| Income taxes |
(8,385 | ) | (0.5 | ) | (870 | ) | (0.1 | ) | — | — | |||||||||||
| Non-controlling interest |
— | — | — | — | (2,459 | ) | (0.2 | ) | |||||||||||||
| Income from continuing operations |
70,748 | 4.4 | 66,602 | 4.8 | 6,283 | 0.6 | |||||||||||||||
| Loss from discontinued operations |
— | — | (814 | ) | (0.0 | ) | (13,611 | ) | (1.3 | ) | |||||||||||
| Net income (loss) attributable to MasTec |
$ | 70,748 | 4.4 | % | $ | 65,788 | 4.8 | % | $ | (7,328 | ) | (0.7 | %) | ||||||||
The following discussion and analysis of our results of operations should be read in conjunction with our consolidated financial statements and notes thereto in Item 8 of this Form 10-K.
Comparison of Years Ended December 31, 2009 and 2008
Revenue. Revenue was $1.6 billion for the year ended December 31, 2009, compared to $1.4 billion in 2008, representing an increase of $0.2 billion or 17.8%. Of the total increase, $0.4 billion resulted from new business activities, primarily acquisition related. The increase from new business activities was partially offset by the negative impact on organic revenue as a result of tightened capital expenditures by our customers and slower developing business resulting from the slowdown in the U.S. economy, the slow pace of the Stimulus Act project funding, tight credit markets and a corresponding reduction in bid awards. Revenues for the year ended December 31, 2009 do not reflect any impact of the federal and state stimulus initiatives as the marketplace has been slow to generate opportunities due to the slow pace of project funding. Key customers driving growth in 2009 include Enbridge, AT&T, Duke Energy, Iberdrola Renewables, Great River Energy and Florida Power & Light.
Costs of Revenue. Costs of revenue were $1.4 billion, or 84.8% of revenue in 2009, compared to $1.2 billion, or 85.5% of revenue in 2008. The dollar increase is driven by our revenue growth as discussed above. As a percentage of revenue, costs of revenue in 2009 decreased 70 basis points. The decrease reflects productivity gains in a number of operating expense categories as well as decreased fuel and material costs, partially offset by higher labor costs as a percentage of revenues.
Depreciation and amortization. Depreciation and amortization was $49.5 million in 2009, compared to $28.5 million in 2008, representing an increase of $21 million or 74.0%. The increase was due to acquisitions, which resulted in the addition of $9.1 million in depreciation and $10.3 million in amortization in 2009 as compared to 2008.
General and administrative expenses. General and administrative expenses were $96.9 million, or 6.0% of revenue in 2009, compared to $89.7, million or 6.5% of revenue in 2008, representing an increase of $7.2 million but a decrease as a percentage of revenue of 50 basis points. The increase in total general and administrative expenses was primarily due to increased labor and information technology costs to support new business activities, partially offset by our receipt of a settlement award in the fourth quarter of 2009 in connection with the settlement of a legacy litigation matter. Excluding the settlement, general and administrative expenses were 6.1% of revenue in 2009, a 40 basis point improvement, resulting from scale and productivity gains as well as lower executive compensation expense due to the compensation settlement for the our former CEO in 2008. Despite the fact that we did not realize our full revenue expectations in 2009, we have maintained our capacity for work anticipating improved market conditions in the coming quarters. There is no certainty, however, that improved market conditions will, in fact, materialize.
Interest expense, net. Interest expense, net of interest income was $24.7 million, or 1.5% of revenue in 2009, compared to $14.8 million, or 1.1% of revenue in 2008, representing an increase of approximately $9.9 million. This increase resulted from interest expense in the first half of 2009 on the $55 million 8% convertible notes and on the revolving credit facility in connection with the
38
Table of Contents
Wanzek acquisition, as well as interest expense in 2009 on the senior convertible notes that were issued in June and November 2009. Interest expense, net, also increased as a result of reduced interest income due to lower interest rates. We expect interest expense to increase in 2010 as compared with 2009 due to the full year impact of the $100 million 4.25% convertible notes issued in November.
Other income, net. Other income, net was $2.9 million in 2009, compared to $0.9 million in 2008, representing an increase of $2.0 million. The increase resulted from higher gains on the sale of property and equipment, as well as a $7.0 million settlement on litigation related to our auction rate securities, partially offset by a $6.1 million credit loss resulting from an other-than-temporary impairment on our corporate debt obligation auction rate securities.
Income taxes. Income taxes were $8.4 million in 2009, compared to $0.9 million in 2008, representing an increase of $7.5 million. This increase is primarily due to higher effective tax rates as a result of the reduction of the valuation allowance that was established against net operating losses in prior years. The reduction in the valuation allowance in 2009 resulted in an increase in our effective tax rate from 1.3% in 2008 to 10.6% in 2009. Accordingly, we expect our effective tax rate to be significantly higher in 2010 as compared with 2009 due to the reduction in our valuation allowances in 2009.
Comparison of Years Ended December 31, 2008 and 2007
Revenue. Revenue was $1.4 billion for the year ended December 31, 2008, compared to $1.0 billion in 2007, representing an increase of $0.4 billion or 33%. Of the total increase, 19% was primarily related to wireless, natural gas pipeline, wind farm and other utilities projects resulting from the acquisitions of Wanzek, Nsoro, Pumpco and Three Phase Line Construction. The remaining increase of 14% was driven by growth in our legacy utility and communications businesses, as well as organic growth in Power Partners. Key customers driving growth in 2008 include AT&T, Tetra Tech, Energy Transfer Company, Oncor, M. A. Mortenson, Verizon and DIRECTV®.
Costs of Revenue. Costs of revenue were $1.2 billion, or 85.5%, of revenue in 2008, compared to $0.9 billion, or 85.9%, of revenue in 2007. The dollar increase is driven by our revenue growth as discussed above. As a percentage of revenue, cost of revenue in 2008 decreased 40 basis points primarily resulting from productivity gains and savings in labor costs, partially offset by higher materials costs, and reflects the overall similarity in margins between our acquisitions and legacy businesses.
Depreciation and Amortization. Depreciation and amortization was $28.5 million in 2008 compared to $18 million in 2007, representing an increase of $10.4 million or 57.4%. The increase was due primarily to depreciation associated with recent acquisitions, particularly Pumpco and Three Phase Line Construction, as well as from capital expenditures during 2007 and 2008 to purchase or lease machinery and equipment to support our growth, and amortization of intangibles related to the acquisitions of Wanzek, Nsoro, Pumpco, Power Partners and Three Phase Line Construction.
General and Administrative Expenses. General and administrative expenses were $89.7 million, or 6.5%, of revenue in 2008, compared to $113.6 million, or 11.0%, of revenue in 2007. General and administrative expenses in 2007 included a charge of $38.6 million (of the total $39.3 million in total charges) related to legacy legal cases, disputes and other contingencies, including litigation and other disputes involving accounts receivable. Excluding this charge, general and administrative expenses would have been $75.0 million or 7.2% of revenue in 2007. This 70 basis point decrease in general and administrative expenses as a percent of revenue (excluding the 2007 legacy legal charge) was primarily due to lower employee compensation costs due to scale and productivity gains and reduced outside legal fees as the legacy legal cases wind down, partially offset by charges totaling $3.5 million related to legacy legal settlements and an incremental charge of $2.5 million related to the compensation settlement for our former CEO in 2008.
Interest expense, net. Interest expense, net of interest income was $14.8 million in 2008 compared to $9.2 million in 2007, representing an increase of $5.6 million or 61%. This increase was the result of a decline in interest income due to reduced interest rates and lower cash balances as well as higher interest expense on higher debt balances, driven by cash paid and debt incurred in connection with recent acquisitions and in support of our growing business.
Other income, net. Other income, net was $0.9 million in 2008, compared to $3.5 million in 2007, representing a decrease of $2.6 million primarily due to lower gains on sales of property and equipment. We recognized gains on asset sales of approximately $0.7 million during the year ended December 31, 2008, compared to $3.1 million during the year ended December 31, 2007, including a $2.5 million gain on the sale of real property.
39
Table of Contents
Income taxes. The provision for income taxes in 2008 of $0.9 million represents state and local taxes for recently acquired companies in jurisdictions in which we do not have an offsetting net operating loss position. Our effective tax rates for 2008 and 2007 were significantly affected by recording valuation allowances to recognize uncertainty of realizing the benefits of net operating loss carryforwards.
Non-controlling interest. In the year ended December 31, 2007, we recorded $2.5 million in non-controlling interest expense related to GlobeTec as we owned between 51% and 96% of this entity during the year. In 2008, we acquired the remaining interest and accordingly, we owned 100% of this entity. As such, there was no non-controlling interest charge during this period.
Discontinued operations. The loss from discontinued operations in 2008 of $0.8 million was primarily related to our Canadian operations. The year ended December 31, 2007 included $12.3 million in losses related to our state Department of Transportation projects and assets and $1.3 million in losses related to our Canadian operations, both of which were disposed of during 2007.
Financial Condition, Liquidity and Capital Resources
Our primary sources of liquidity are cash flows from continuing operations, availability under our credit facility and our cash balances.
Credit Facility
In November 2009, we entered into an amendment to our senior secured credit facility, expiring May 10, 2013, which we refer to as our Credit Facility, pursuant to which the lenders consented to our acquisition of Precision. Under the amendment, the lenders’ consent to our acquisition of Precision was conditioned upon our raising a minimum of $75 million in financing. Additionally, the amendment provided that interest on outstanding balances on the Credit Facility accrues at rates based, at our option, on the agent bank’s base rate plus a margin of between 1.25% and 1.75%, or at the LIBOR rate plus a margin of 2.25% and 3.00%, depending on certain financial thresholds.
We also entered into an amendment in June 2009 to the Credit Facility. The June amendment provided us with the ability to repay the $55 million 8% Wanzek convertible notes with the proceeds of the $115 million 4% senior convertible notes that were issued in June 2009. Pursuant to the June amendment, the unused line fee for our Credit Facility has been increased to a range between 0.5% to 0.75% per annum based on usage.
Under a previous amendment effective July 29, 2008, the Credit Facility has a maximum amount of available borrowing of $210 million, subject to certain restrictions. The maximum available borrowing may be increased to $260 million if certain conditions are met.
As in the past, the amount that we can borrow at any given time is based upon a formula that takes into account, among other things, eligible billed and unbilled accounts receivable, equipment, real estate and eligible cash collateral, which can result in borrowing availability of less than the full amount of the Credit Facility. At December 31, 2009 and 2008, net availability under the Credit Facility totaled $89.8 million and $82.2 million, respectively, net of outstanding standby letters of credit aggregating $79.8 million and $82.4 million in each period, respectively. These letters of credit mature at various dates and most have automatic renewal provisions subject to prior notice of cancellation. The Credit Facility is collateralized by a first priority security interest in substantially all of our assets and the assets of our wholly-owned subsidiaries and a pledge of the stock of certain of our operating subsidiaries. At December 31, 2009 we did not have an outstanding balance on the Credit Facility. At December 31, 2008, our outstanding balance was $42.5 million. Interest under the Credit Facility accrues at variable rates based, at our option, on the agent bank’s base rate (as defined in the Credit Facility) plus a margin of between 1.25% and 1.75%, or at the LIBOR rate plus a margin of between 2.25% and 3.0%, depending on certain financial thresholds. At December 31, 2009, the margin over LIBOR was 2.5% and the margin over the base rate was 1.25%. The Credit Facility includes an unused facility fee ranging from 0.5% to 0.75% based on usage.
The Credit Facility contains customary events of default (including cross-default) provisions and covenants related to our operations that prohibit, among other things, making investments and acquisitions in excess of specified amounts, incurring additional indebtedness in excess of specified amounts, creating liens against our assets, prepaying subordinated indebtedness, making acquisitions in excess of specified amounts, and engaging in certain mergers or combinations without the prior written consent of the lenders. The Credit Facility also limits our ability to make certain distributions or pay dividends. In addition, we are required to maintain a minimum fixed charge coverage ratio of 1.2 to 1.0, as defined in the Credit Facility. Any deterioration in the quality of billed and unbilled receivables, reduction in the value of our equipment or an increase in our lease expense related to real estate would reduce availability under the Credit Facility. At December 31, 2009, we were in compliance with all provisions and covenants of the Credit Facility.
40
Table of Contents
Based upon the current availability under our Credit Facility, liquidity and projections for 2010, we believe we will be in compliance with the Credit Facility’s terms and conditions and the minimum availability requirements throughout 2010. We are dependent upon borrowings and letters of credit under this Credit Facility to fund operations. Should we be unable to comply with the terms and conditions of the Credit Facility, we would be required to obtain modifications to the Credit Facility or another source of financing to continue to operate. We may not be able to achieve our 2010 projections; however, we do not expect this to adversely affect our ability to remain in compliance with the Credit Facility’s minimum net availability requirements and minimum fixed charge coverage ratio for at least the next twelve months.
Senior Convertible Notes
In November 2009, we issued $100 million of 4.25% senior convertible notes due December 15, 2014 in a private placement. The senior convertible notes bear interest at a rate of 4.25% per year, payable semi-annually in arrears, on June 15 and December 15 of each year, commencing on June 15, 2010. On or prior to December 12, 2014, holders may convert their notes into shares of our common stock initially at a conversion rate of 64.6162 shares of our common stock per $1,000 principal amount of notes, which represents an initial conversion price of approximately $15.48 per share, subject to customary anti-dilution adjustment terms for these types of notes. Approximately $3.7 million in financing costs were incurred in connection with the issuance of these notes. These deferred financing costs are included in other assets in the consolidated balance sheet and are being amortized over the term of the notes. The proceeds of the 4.25% senior convertible notes were used to fund the acquisition of Precision and for general corporate purposes.
In June 2009, we issued $115 million of 4% senior convertible notes due June 15, 2014 in a registered offering. The 4% senior convertible notes bear interest at a rate of 4% per year, payable semi-annually in arrears, on June 15 and December 15 of each year, commencing on December 15, 2009. On or prior to June 13, 2014, holders may convert their notes into shares of our common stock initially at a conversion rate of 63.4417 shares of our common stock per $1,000 principal amount of notes, which represents an initial conversion price of approximately $15.76 per share, subject to customary anti-dilution adjustment terms for these types of notes. Approximately $5.3 million in financing costs were incurred in connection with the issuance of these notes. These deferred financing costs are included in other assets in the consolidated balance sheet and are being amortized over the term of the notes.
The proceeds of the 4% senior convertible notes were used to repay the $55 million of 8% convertible notes issued in connection with the Wanzek acquisition, convertible at $12.00 per share, as well as the outstanding balance on the Credit Facility of approximately $20 million in June 2009. The remaining net proceeds were used for working capital, future acquisitions of businesses and general corporate purposes.
The 4.25% and 4.0% senior convertible notes are guaranteed by substantially all of our operating subsidiaries. There are no financial covenants on these notes.
At December 31, 2009, we were in compliance with all provisions and covenants of the indenture governing our senior convertible notes.
Senior Notes
As of December 31, 2009, we had $150.0 million of 7.625% senior notes due in February 2017, with interest due semi-annually, outstanding. The notes contain default (including cross-default) provisions and covenants restricting many of the same transactions as under our Credit Facility. The indenture which governs our senior notes allows us to incur additional indebtedness to the extent that our fixed charge coverage ratio, as defined, is at least 2:1. If the fixed charge coverage ratio is less than 2:1, then we are still permitted to incur the following additional indebtedness, among others: credit facilities under a defined threshold, renewals to existing debt permitted under the indenture capital lease obligations up to 5% of our consolidated net assets, plus an additional $50 million of indebtedness at any time the senior notes remain outstanding. The senior notes are guaranteed by all of our operating subsidiaries. At December 31, 2009, we were in compliance with all the provisions and covenants of the 7.625% senior notes.
Acquisition Debt
In connection with the acquisition of Pumpco, we entered into an equipment term loan in the aggregate amount of $22.5 million at 7.05% interest, payable in 60 monthly installments, maturing in 2013. The proceeds from this equipment term loan were used to pay off $8.7 million of Pumpco indebtedness, with the remaining balance funding a portion of the acquisition purchase price. We also assumed approximately $9.5 million in notes payable for equipment and capital lease obligations. In connection with the acquisition
41
Table of Contents
of Nsoro, we assumed approximately $12 million in indebtedness, which was subsequently repaid during the third quarter of 2008. In connection with the acquisition of Wanzek, we entered into an 8% convertible note in the principal amount of $55 million which was repaid in the second quarter of 2009, and also assumed approximately $15 million of Wanzek’s debt. In connection with the acquisition of Precision, we assumed approximately $34 million in indebtedness for equipment debt and capital lease obligations. There are no financial covenants associated with the acquisition debt described above. See Notes 4 - Acquisitions and Note 10 - Debt in the Notes to Consolidated Financial Statements for further discussion.
Liquidity and Working Capital
Our primary liquidity needs are for working capital, capital expenditures, insurance collateral in the form of cash and letters of credit, earn out obligations and debt service. We estimate we will spend between $40 million and $49 million in 2010 on capital expenditures. This is an increase versus our current level of capital expenditures, which was lower, due in part to the slowdown in the U.S. economy during 2009. The nature of our business, however, is equipment intensive and actual capital expenditures can increase or decrease from estimates depending upon business activity levels. We will continue to evaluate lease versus buy decisions to meet our equipment needs and based on this evaluation, our capital expenditures may increase from this estimate in the future. We expect to continue to sell older vehicles and equipment as we upgrade to new equipment. Additionally, we have made certain acquisitions and have agreed to pay certain of the sellers earn-out payments, generally based on the future performance of acquired business. Certain of these earn-out payments may be made in either cash or, under certain circumstances, shares of our common stock at our option. During the years ended December 31, 2009 and 2008, we made cash payments of $20.6 million and $11.4 million, respectively, related to such earn-out obligations.
We need working capital to support seasonal variations in our business, primarily due to the impact of weather conditions on external construction and maintenance work, including storm restoration work, and the associated spending to support related customer demand. Our business is typically slower in the first quarter of each calendar year. Accordingly, we generally experience seasonal working capital needs from approximately April through December to support growth in unbilled revenue and accounts receivable, and to a lesser extent, inventory. Our billing terms are generally net 30 to 60 days, and some of our contracts allow our customers to retain a portion (from 2% to 15%) of the contract amount until the job is completed. We maintain inventory to meet the material requirements of certain of our contracts. Certain of our customers pay us in advance for a portion of the materials we purchase for their projects, or allow us to pre-bill them for materials purchases up to specified amounts. Our vendors generally offer us terms ranging from 30 to 90 days. Our agreements with subcontractors usually contain a “pay-when-paid” provision, whereby our payments to subcontractors are made only after we are paid by our customers.
The slow economy and general lack of credit have not had a significant impact on our overall financial position, results of operations or cash flows as of and for the year ended December 2009, although certain of our businesses have been negatively impacted by the weak state of the U.S. economy and the resulting delay in expenditures by our customers. Given the generally good credit quality of our customer base, we do not expect a collections issue that would impact our liquidity in the foreseeable future. However, should additional customers file for bankruptcy or experience difficulties, or should anticipated recoveries in existing bankruptcies and other workout situations fail to materialize, we could experience reduced cash flows and losses in excess of current allowances.
As a result of our current capital structure, including our Credit Facility, we do not anticipate the current restricted credit markets will impact our liquidity. We anticipate that funds generated from continuing operations, borrowings under our Credit Facility and our cash balances will be sufficient to meet our working capital requirements, anticipated capital expenditures, insurance collateral requirements, earn-out obligations, letters of credit and debt service obligations for at least the next twelve months.
Sources and Uses of Cash
As of December 31, 2009, we had $203.0 million in working capital, defined as current assets less current liabilities, compared to $105.3 million as of December 31, 2008. This increase was primarily driven by higher cash balances, partially offset by higher earn-out liabilities, which are reflected in other current liabilities in our consolidated balance sheet, driven by our recent acquisition activity and the expectation of receiving a substantial portion of the benefit of our net operating losses in 2010, supplemented by the utilization of the valuation allowance on deferred tax assets. Cash and cash equivalents, including approximately $18.2 million of restricted cash, increased from $47.3 million at December 31, 2008 to $88.5 million at December 31, 2009 primarily due to strong cash collections and higher earnings.
42
Table of Contents
Sources and uses of cash are summarized below:
| Year Ended December 31, | ||||||||||||
| 2009 | 2008 | 2007 | ||||||||||
| (In millions) | ||||||||||||
| Net cash provided by operating activities |
$ | 124.1 | $ | 58.2 | $ | 68.7 | ||||||
| Net cash used in investing activities |
$ | (176.0 | ) | $ | (142.0 | ) | $ | (62.5 | ) | |||
| Net cash provided by financing activities |
$ | 93.3 | $ | 57.0 | $ | 32.8 | ||||||
Net cash provided by operating activities increased by $65.9 million to $124.1 million for the year ended December 31, 2009 as compared with the same period in 2008. This increase resulted from an increase in net income, adjusted for non-cash items, such as depreciation and amortization and credit losses from an other-than-temporary impairment, of $30.5 million. In addition, cash provided by operating activities increased as a result of strong collections on accounts receivables, which was partially offset by reductions in billings in excess of costs and earnings and decreases in other liabilities, including the payment of $11.2 million due to the resolution of legacy litigation matters.
Net cash used in investing activities increased by $34.0 million to $176.0 million for the year ended December 31, 2009 as compared with the same period in 2008. The increase was driven by an increase of $33.8 million in cash used in connection with acquisitions, including the acquisition of Precision and payments of earn-out obligations of $20.6 million, as compared with the year ended December 31, 2008 during which the acquisitions of Wanzek, Pumpco and Nsoro were completed.
Net cash provided by financing activities increased by $36.3 million to $93.3 million for the year ended December 31, 2009 as compared with the same period in 2008. The increase in net cash provided financing activities was driven primarily by the excess of net proceeds from our two 2009 senior convertible note offerings, with a total principal value of $215 million, over total repayments of debt, including the $55 million 8% Wanzek convertible notes and net repayments of borrowings under the Credit Facility of approximately $42.5 million.
Auction Rate Securities
Our securities available for sale consist of auction rate securities that represent interests in pools of student loans guaranteed by the U.S. government under the Federal Family Education Loan Program and structured finance securities. These structured finance securities are collateralized by credit-linked notes made up of investment grade floating rate international bank notes or credit card receivable notes that collateralize credit default swap agreements on corporate debt obligations with remaining terms of 7 to 8 years. Under the terms of these credit default swaps, the principal value of these auction rate securities would be impaired at net default rates of the underlying corporate debt obligations ranging from 8% to 10.75%. Liquidity for auction-rate securities is typically provided by an auction process that resets the applicable interest rate at pre-determined intervals, usually every 7, 28 or 35 days. Due to disruptions in the credit markets, these auctions have not had sufficient bidders to allow investors to complete a sale, indicating that immediate liquidity at par is unavailable. Given the uncertainty as to when the liquidity issues associated with the auction process will improve, we have classified these securities as long-term assets since June 30, 2008.
As of December 31, 2009, we hold $33.7 million in par value of these auction rate securities, with an estimated fair value and carrying value of $24.5 million. As of December 31, 2009, we have aggregate unrealized losses on these securities of $9.1 million. Of the $9.1 million, $8.1 million relates to our structured finance auction rate securities. Due to deterioration in the credit quality of these structured finance securities in 2009, we deemed the decline in value for these securities to be an other-than-temporary impairment, and accordingly, recorded a charge of $6.1 million in earnings as an other-than-temporary impairment in 2009. At this time, we are uncertain when the liquidity issues associated with the auction process will improve or whether we will be able to exit these investments at their cost basis or whether we will record additional temporary or other-than-temporary losses as a result of these investments. We anticipate holding these securities until we can realize their cost basis and believe our existing cash resources will be sufficient to meet our anticipated needs for working capital and capital expenditures to execute our current business plan.
In October 2009, we settled our claim against the investment advisor that sold us the auction rate securities.
See Note 6 - Securities Available for Sale and Note 17 - Commitments and Contingencies in the notes to the consolidated financial statements.
43
Table of Contents
The following table sets forth our contractual obligations as of December 31, 2009 during the periods indicated below (in thousands):
| Payments Due By Period | |||||||||||||||
| Contractual Obligations |
Total | Less than 1 Year |
1 - 3 Years |
3 - 5 Years |
More than 5 Years and Thereafter | ||||||||||
| Senior notes |
$ | 150,000 | $ | — | $ | — | $ | — | $ | 150,000 | |||||
| Senior convertible notes (1) |
215,000 | — | — | 215,000 | — | ||||||||||
| Equipment term loan |
16,177 | 4,156 | 9,337 | 2,684 | — | ||||||||||
| Notes payable for equipment |
21,048 | 10,541 | 8,557 | 1,950 | — | ||||||||||
| Earn-out obligations (2) |
25,137 | 25,137 | — | — | — | ||||||||||
| Capital leases |
36,171 | 13,776 | 12,543 | 9,852 | — | ||||||||||
| Operating leases |
63,177 | 25,221 | 24,395 | 9,872 | 3,689 | ||||||||||
| Legal settlement (3) |
1,517 | 1,517 | — | — | — | ||||||||||
| Interest (4) |
124,674 | 24,607 | 44,842 | 30,440 | 24,785 | ||||||||||
| Total |
$ | 652,901 | $ | 104,955 | $ | 99,674 | $ | 269,798 | $ | 178,474 | |||||
| (1) | Amount is comprised of two series of senior convertible notes ($115 million of our 4% senior convertible notes due in 2014 and $100 million of our 4.25% senior convertible notes due in 2014). See Note 10 - Debt. |
| (2) | Under certain acquisition agreements, we have agreed to pay the sellers earn-outs based on the performance of the businesses acquired. Certain of these earn-out payments may be made in either cash or, under certain circumstances, MasTec common stock at our option. Due to the contingent nature of these earn-out payments, we have only included earn- out obligations that we assume will be paid in cash, are quantifiable and have been earned as of December 31, 2009. |
| (3) | In February 2009, we entered into a definitive settlement agreement to settle our dispute with the Corps of Engineers, which provides for payment of $1.5 million. See Note 17 - Commitments and Contingencies. |
| (4) | Interest represents interest payments due on all debt and capital lease obligations. All of our debt, with the exception of our line of credit, for which we had no outstanding balance at December 31, 2009, are fixed interest rate obligations. |
Off-balance sheet arrangements. We provide letters of credit to secure our obligations primarily related to our insurance arrangements and surety bonds. We also provide letters of credit related to legal matters. Total letters of credit reduce our available borrowings under our Credit Facility and amounted to $79.8 million at December 31, 2009 of which $66.9 million were related to our insurance programs.
Certain of our contracts require us to provide performance and payment bonds, which we obtain from a surety company. If we were unable to meet our contractual obligations to a customer and the surety paid our customer the amount due under the bond, the surety would seek reimbursement of such payment from us. At December 31, 2009, the cost to complete on projects secured by our $598.7 million performance and payment bonds was $69.9 million.
Seasonality
Some of our customers reduce their expenditures and work order requests towards the end of the year. Adverse weather conditions, particularly during the winter season, also affect our ability to perform outdoor services in certain regions of the United States. We expect this pattern to be more dramatic in the future as a greater proportion of our projects are in northern climates due to our recent acquisitions. As a result, we experience reduced revenue in the first quarter of each calendar year.
Impact of Inflation
The primary inflationary factor affecting our operations is increased labor costs. We did not experience significant inflation in labor costs in 2009, 2008 or 2007. To a lesser extent, we are also affected by changes in fuel costs which decreased in 2009 as compared with 2008 and 2007.
Recently Issued Accounting Pronouncements
See Note 2 – Summary of Significant Accounting Policies in “Item 8. Financial Statements and Supplementary Data.”
44
Table of Contents
| Item 7A. | Quantitative and Qualitative Disclosures About Market Risk |
Interest Rate Risk
None of our outstanding debt at December 31, 2009 was subject to variable interest rates as we had no outstanding draws on our Credit Facility as of December 31, 2009. Interest under the Credit Facility accrues interest at variable rates based, at our option, on the agent bank’s base rate (as defined in the Credit Facility) plus a margin of between 1.25% and 1.75%, or at the LIBOR rate plus a margin of between 2.25% and 3.00%, depending on certain financial thresholds. At December 31, 2009, the margin over LIBOR was 2.5% and the margin over the base rate was 1.25%.
Our fixed interest rate debt primarily includes $150.0 million (face value) in senior notes, $115.0 million in 4.0% senior convertible notes issued in June 2009, $100.0 million in 4.25% senior convertible notes issued in November 2009 in connection with Precision Pipeline acquisition and a $22.5 million equipment term loan issued in connection with the Pumpco acquisition.
Foreign Currency Risk
During 2009, we had immaterial operations in certain foreign countries, including Mexico. Due to the limited nature of our foreign operations, we believe that our foreign currency risk is minimal. Previously, we had an investment in a subsidiary in Canada and sold our services into this foreign market. On April 10, 2007, we sold substantially all of our Canadian operations, and any remaining currency risk is minimal. The operations in Canada have been accounted for as discontinued operations for all periods presented.
Auction Rate Securities
The Company’s securities available for sale consist of investment grade auction rate securities that represent interests in pools of student loans guaranteed by the U.S. government under the Federal Family Education Loan Program and structured finance securities. These structured finance securities are collateralized by credit-linked notes made up of investment grade floating rate international bank notes or credit card receivable notes that collateralize credit default swap agreements on corporate debt obligations with remaining terms of 7 to 8 years. Under the terms of these credit default swaps, the principal value of these auction rate securities would be impaired at net default rates of the underlying corporate debt obligations ranging from 8% to 10.75%. The current credit crisis and economic downturn increases both the illiquidity and default risks of these securities. During the year ended December 31, 2009, we recorded an other-than-temporary impairment charge of $6.1 million on these structured finance securities. See Note 6 – Securities Available for Sale in the Notes to Consolidated Financial Statements.
45
Table of Contents
| Item 8. | Financial Statements and Supplementary Data |
Index to Consolidated Financial Statements
46
Table of Contents
REPORT OF INDEPENDENT REGISTERED PUBLIC ACCOUNTING FIRM
The Board of Directors and
Shareholders of MasTec, Inc.
We have audited the accompanying consolidated balance sheets of MasTec, Inc. and subsidiaries as of December 31, 2009 and 2008 and the related consolidated statements of operations, changes in shareholders’ equity, and cash flows for the three years then ended. In connection with our audits of the consolidated financial statements, we have also audited the schedule listed in Item 15(a)2. These financial statements and the schedule are the responsibility of the Company’s management. Our responsibility is to express an opinion on these financial statements and schedule based on our audits.
We conducted our audits in accordance with the standards of the Public Company Accounting Oversight Board (United States). Those standards require that we plan and perform the audit to obtain reasonable assurance about whether the financial statements and schedule are free of material misstatement. An audit includes examining, on a test basis, evidence supporting the amounts and disclosures in the financial statements. An audit also includes assessing the accounting principles used and significant estimates made by management, as well as evaluating the overall presentation of the financial statements and schedule. We believe that our audits provide a reasonable basis for our opinion.
In our opinion, the financial statements referred to above present fairly, in all material respects, the consolidated financial position of MasTec, Inc. as of December 31, 2009 and 2008, and the consolidated results of their operations and their cash flows for the three years then ended in conformity with accounting principles generally accepted in the United States of America.
As discussed in Note 2 to the consolidated financial statements, the Company adopted FASB 141(R), Business Combinations, codified in ASC 805, Business Combinations, effective January 1, 2009.
Also, in our opinion, the financial statements schedules, when considered in relation to the basic consolidated financial statements takes as a whole, presents fairly, in all material respects, the information set forth therein.
We also have audited, in accordance with the Standards of the Public Company Accounting Oversight Board (United States), the effectiveness of MasTec, Inc.’s internal control over financial reporting as of December 31, 2009, based on criteria established in Internal Control - Integrated Framework issued by the Committee of Sponsoring Organizations of the Treadway Commission (COSO) and our report dated February 24, 2010, expressed an unqualified opinion thereon.
| /s/ BDO Seidman, LLP |
| Certified Public Accountants |
| Miami, Florida |
| February 24, 2010 |
47
Table of Contents
CONSOLIDATED STATEMENTS OF OPERATIONS
| Year Ended December 31, | ||||||||||||
| 2009 | 2008 | 2007 | ||||||||||
| (In thousands, except per share amounts) | ||||||||||||
| Revenue |
$ | 1,623,502 | $ | 1,378,663 | $ | 1,037,779 | ||||||
| Costs of revenue, excluding depreciation |
1,376,125 | 1,179,190 | 891,606 | |||||||||
| Depreciation and amortization |
49,539 | 28,465 | 18,088 | |||||||||
| General and administrative expenses, including non-cash stock compensation expenses of $3,026, $3,699 and $5,555, respectively |
96,932 | 89,705 | 113,623 | |||||||||
| Interest expense, net of interest income |
24,690 | 14,758 | 9,236 | |||||||||
| Other (income) expense, net |
(2,917 | ) | (927 | ) | (3,516 | ) | ||||||
| Income from continuing operations before income taxes and non-controlling interest |
79,133 | 67,472 | 8,742 | |||||||||
| Income taxes |
(8,385 | ) | (870 | ) | — | |||||||
| Income from continuing operations before non-controlling interest |
70,748 | 66,602 | 8,742 | |||||||||
| Net income attributable to non-controlling interest |
— | — | (2,459 | ) | ||||||||
| Income from continuing operations |
70,748 | 66,602 | 6,283 | |||||||||
| Loss from discontinued operations, net of tax |
— | (814 | ) | (13,611 | ) | |||||||
| Net income (loss) attributable to MasTec |
$ | 70,748 | $ | 65,788 | $ | (7,328 | ) | |||||
| Basic net income (loss) per share attributable to MasTec: |
||||||||||||
| Continuing operations |
$ | 0.93 | $ | 0.98 | $ | 0.10 | ||||||
| Discontinued operations |
— | (0.01 | ) | (0.21 | ) | |||||||
| Total basic net income (loss) per share |
$ | 0.93 | $ | 0.97 | $ | (0.11 | ) | |||||
| Basic weighted average common shares outstanding |
75,701 | 67,983 | 66,147 | |||||||||
| Diluted net income (loss) per share attributable to MasTec: |
||||||||||||
| Continuing operations |
$ | 0.90 | $ | 0.97 | $ | 0.09 | ||||||
| Discontinued operations |
— | (0.01 | ) | (0.20 | ) | |||||||
| Total diluted net income (loss) per share |
$ | 0.90 | $ | 0.96 | $ | (0.11 | ) | |||||
| Diluted weighted average common shares outstanding |
81,762 | 68,916 | 67,626 | |||||||||
| Supplemental disclosure: |
||||||||||||
| Other (income) expense, net: |
||||||||||||
| Total other-than-temporary impairment losses $ |
$ | 8,149 | $ | — | $ | — | ||||||
| Portion of impairment loss recognized in other comprehensive income (before taxes) |
(2,030 | ) | — | — | ||||||||
| Net impairment losses recognized in earnings |
6,119 | — | — | |||||||||
| Other (income) expense |
(9,036 | ) | (927 | ) | (3,516 | ) | ||||||
| Total other (income) expense, net |
$ | (2,917 | ) | $ | (927 | ) | $ | (3,516 | ) | |||
The accompanying notes are an integral part of these consolidated financial statements.
48
Table of Contents
CONSOLIDATED BALANCE SHEETS
| December 31, | December 31, | |||||||
| 2009 | 2008 | |||||||
| (in thousands, except share data) | ||||||||
| Assets |
||||||||
| Current assets: |
||||||||
| Cash and cash equivalents, including restricted cash of $18,208 at December 31, 2009 and $18,050 at December 31, 2008 |
$ | 88,521 | $ | 47,263 | ||||
| Accounts receivable, costs and earnings in excess of billings and retainage, net of allowance |
324,212 | 327,382 | ||||||
| Inventories |
31,770 | 32,769 | ||||||
| Deferred tax asset |
56,006 | 5,945 | ||||||
| Prepaid expenses and other current assets |
25,298 | 26,006 | ||||||
| Total current assets |
525,807 | 439,365 | ||||||
| Property and equipment, net |
198,812 | 158,013 | ||||||
| Goodwill and other intangibles, net |
579,544 | 420,604 | ||||||
| Deferred taxes, net |
— | 25,165 | ||||||
| Securities available for sale |
24,511 | 20,580 | ||||||
| Other assets |
34,775 | 27,170 | ||||||
| Total assets |
$ | 1,363,449 | $ | 1,090,897 | ||||
| Liabilities and Shareholders’ Equity |
||||||||
| Current liabilities: |
||||||||
| Current maturities of debt |
$ | 28,473 | $ | 16,884 | ||||
| Accounts payable and other accrued expenses |
191,363 | 192,407 | ||||||
| Billings in excess of costs and earnings |
48,558 | 57,720 | ||||||
| Accrued legal settlement charges |
2,189 | 13,212 | ||||||
| Accrued insurance |
10,034 | 17,297 | ||||||
| Other current liabilities |
42,167 | 36,528 | ||||||
| Total current liabilities |
322,784 | 334,048 | ||||||
| Obligations related to acquisitions |
30,573 | — | ||||||
| Other liabilities |
22,732 | 26,305 | ||||||
| Deferred tax liabilities |
49,275 | — | ||||||
| Long-term debt |
409,923 | 287,454 | ||||||
| Total liabilities |
$ | 835,287 | $ | 647,807 | ||||
| Commitments and contingencies |
||||||||
| Shareholders’ equity: |
||||||||
| Preferred stock, $1.00 par value; authorized shares – 5,000,000; issued and outstanding shares – none |
$ | — | $ | — | ||||
| Common stock, $0.10 par value; authorized shares – 145,000,000 and 100,000,000 at December 31, 2009 and December 31, 2008, respectively; issued and outstanding shares – 75,954,004 and 75,454,565 shares at December 31, 2009 and December 31, 2008, respectively |
7,596 | 7,545 | ||||||
| Capital surplus |
629,730 | 622,745 | ||||||
| Accumulated deficit |
(103,040 | ) | (173,788 | ) | ||||
| Accumulated other comprehensive loss |
(6,124 | ) | (13,412 | ) | ||||
| Total shareholders’ equity |
528,162 | 443,090 | ||||||
| Total liabilities and shareholders’ equity |
$ | 1,363,449 | $ | 1,090,897 | ||||
The accompanying notes are an integral part of these consolidated financial statements.
49
Table of Contents
CONSOLIDATED STATEMENTS OF CHANGES IN SHAREHOLDERS’ EQUITY
(In thousands)
| Shares | Amount | Capital Surplus |
Accumulated Deficit |
Accumulated Other Comprehensive Income (Loss) |
Total | |||||||||||||||
| Balance December 31, 2006 |
65,182 | 6,518 | 530,179 | (232,248 | ) | 262 | 304,711 | |||||||||||||
| Net loss attributable to MasTec |
(7,328 | ) | (7,328 | ) | ||||||||||||||||
| Foreign currency translation adjustment |
— | — | — | — | (539 | ) | (539 | ) | ||||||||||||
| Unrealized loss on securities available for sale |
— | — | — | — | (4,790 | ) | (4,790 | ) | ||||||||||||
| Comprehensive loss for period |
(12,657 | ) | ||||||||||||||||||
| Non cash stock compensation |
— | — | 5,530 | — | — | 5,530 | ||||||||||||||
| Issuance of common stock from public offerings |
300 | 30 | 3,031 | — | — | 3,061 | ||||||||||||||
| Issuance of common stock for acquisition |
||||||||||||||||||||
| Stock issued, primarily for stock options exercised |
1,692 | 169 | 13,751 | — | — | 13,920 | ||||||||||||||
| Balance December 31, 2007 |
67,174 | 6,717 | 552,491 | (239,576 | ) | (5,067 | ) | 314,565 | ||||||||||||
| Net income attributable to MasTec |
— | — | — | 65,788 | — | 65,788 | ||||||||||||||
| Foreign currency translation adjustment |
— | — | — | — | (67 | ) | (67 | ) | ||||||||||||
| Unrealized loss on securities available for sale |
— | — | — | — | (8,278 | ) | (8,278 | ) | ||||||||||||
| Comprehensive income for period |
— | — | — | — | — | 57,443 | ||||||||||||||
| Non cash stock compensation |
— | — | 3,816 | — | — | 3,816 | ||||||||||||||
| Issuance of common stock for acquisition |
7,500 | 750 | 58,500 | — | — | 59,250 | ||||||||||||||
| Stock issued, primarily for stock options exercised |
781 | 78 | 7,938 | — | — | 8,016 | ||||||||||||||
| Balance December 31, 2008 |
75,455 | $ | 7,545 | $ | 622,745 | $ | (173,788 | ) | $ | (13,412 | ) | $ | 443,090 | |||||||
| Net income attributable to MasTec |
— | — | — | 70,748 | — | 70,748 | ||||||||||||||
| Foreign currency translation adjustment |
— | — | — | — | (134 | ) | (134 | ) | ||||||||||||
| Unrealized gain on securities available for sale |
— | — | — | — | 3,641 | 3,641 | ||||||||||||||
| Reclassification adjustment for impairment loss on available-for- sale auction rate securities included in net earnings |
— | — | — | — | 3,781 | 3,781 | ||||||||||||||
| Comprehensive income for period |
— | — | — | — | — | 78,036 | ||||||||||||||
| Non cash stock compensation |
— | — | 3,065 | — | — | 3,065 | ||||||||||||||
| Stock issued, primarily for stock options exercised |
499 | 51 | 3,920 | — | — | 3,971 | ||||||||||||||
| Balance December 31, 2009 |
75,954 | $ | 7,596 | $ | 629,730 | $ | (103,040 | ) | $ | (6,124 | ) | $ | 528,162 | |||||||
The accompanying notes are an integral part of these consolidated financial statements.
50
Table of Contents
CONSOLIDATED STATEMENTS OF CASH FLOWS
| Year Ended December 31, | ||||||||||||
| 2009 | 2008 | 2007 | ||||||||||
| (In thousands) | ||||||||||||
| Cash flows from operating activities: |
||||||||||||
| Net income (loss) attributable to MasTec |
$ | 70,748 | $ | 65,788 | $ | (7,328 | ) | |||||
| Adjustments to reconcile net income (loss) to net cash provided by operating activities: activities: |
||||||||||||
| Depreciation and amortization |
49,539 | 28,465 | 18,088 | |||||||||
| Impairment of goodwill and assets |
— | — | 328 | |||||||||
| Non-cash stock-based compensation expense |
3,065 | 3,816 | 5,555 | |||||||||
| Gain on disposal of assets and investments |
(1,334 | ) | (673 | ) | (2,854 | ) | ||||||
| Provision for doubtful accounts |
2,414 | 3,482 | 17,473 | |||||||||
| Provision for losses on construction projects |
1,301 | 711 | 267 | |||||||||
| Impairment of securities available for sale |
6,119 | — | — | |||||||||
| Provision for inventory obsolescence |
302 | 99 | — | |||||||||
| Non-controlling interest |
— | — | 2,459 | |||||||||
| Income from equity investment |
— | — | (119 | ) | ||||||||
| Income tax refunds |
— | — | 515 | |||||||||
| Changes in assets and liabilities net of effect of acquisitions: |
||||||||||||
| Accounts receivable, unbilled revenue and retainage, net |
85,044 | (13,797 | ) | 991 | ||||||||
| Inventories |
956 | (8,859 | ) | 24,756 | ||||||||
| Other assets, current and non-current portion |
(25,722 | ) | 12,217 | 7,728 | ||||||||
| Accounts payable and accrued expenses |
(26,547 | ) | (8,348 | ) | (20,092 | ) | ||||||
| Other accrued liabilities, current and non-current portion |
(41,746 | ) | (24,719 | ) | 20,931 | |||||||
| Net cash provided by operating activities |
124,139 | 58,182 | 68,698 | |||||||||
| Cash flows used in investing activities: |
||||||||||||
| Capital expenditures |
(21,859 | ) | (35,015 | ) | (32,135 | ) | ||||||
| Cash paid for acquisitions and contingent consideration, net of cash acquired |
(157,619 | ) | (123,825 | ) | (35,432 | ) | ||||||
| Investments in unconsolidated companies |
— | — | (1,025 | ) | ||||||||
| Investment in life insurance policies |
(717 | ) | (1,107 | ) | (1,284 | ) | ||||||
| Net proceeds from sale of assets and investments |
4,171 | 2,459 | 3,223 | |||||||||
| Purchases of securities available for sale |
— | (16,437 | ) | (565,854 | ) | |||||||
| Proceeds from sale of securities available for sale |
— | 31,938 | 570,050 | |||||||||
| Net cash used in investing activities |
(176,024 | ) | (141,987 | ) | (62,457 | ) | ||||||
| Cash flows provided by financing activities: |
||||||||||||
| Proceeds from credit facility |
35,682 | 186,345 | — | |||||||||
| Proceeds from issuance of senior convertible notes |
215,000 | — | — | |||||||||
| Repayments of credit facility |
(78,150 | ) | (143,877 | ) | — | |||||||
| Proceeds from the issuance of senior notes |
— | — | 150,000 | |||||||||
| Repayments of senior subordinated notes |
— | — | (121,000 | ) | ||||||||
| Proceeds from other borrowings |
— | 31,491 | 45 | |||||||||
| Repayments of other borrowings, net |
(71,436 | ) | (20,967 | ) | (3,954 | ) | ||||||
| Payments of capital lease obligations |
(2,711 | ) | (2,041 | ) | (2,113 | ) | ||||||
| Proceeds from stock option exercises |
3,971 | 8,101 | 13,895 | |||||||||
| Payments of financing costs |
(9,079 | ) | (2,064 | ) | (4,117 | ) | ||||||
| Net cash provided by financing activities |
93,277 | 56,988 | 32,756 | |||||||||
| Net increase (decrease) in cash and cash equivalents |
41,392 | (26,817 | ) | 38,997 | ||||||||
| Net effect of exchange rate changes on cash and cash equivalents |
(134 | ) | (208 | ) | 9 | |||||||
| Cash and cash equivalents - beginning of period |
47,263 | 74,288 | 35,282 | |||||||||
| Cash and cash equivalents - end of period |
$ | 88,521 | $ | 47,263 | $ | 74,288 | ||||||
| Cash paid during the period for: |
||||||||||||
| Interest |
$ | 22,985 | $ | 13,898 | $ | 13,557 | ||||||
| Income taxes |
$ | 2,147 | $ | 665 | $ | 275 | ||||||
| Supplemental non-cash disclosures: |
||||||||||||
| Note to sellers of Wanzek |
$ | — | $ | 55,000 | — | |||||||
| Shares issued to sellers of Wanzek (7.5 million) |
$ | — | $ | 59,250 | — | |||||||
| Equipment acquired under capital lease |
$ | 1,901 | $ | 880 | $ | 6,246 | ||||||
The accompanying notes are an integral part of these consolidated financial statements.
51
Table of Contents
NOTES TO CONSOLIDATED FINANCIAL STATEMENTS
Note 1 - Nature of the Business
MasTec, Inc. (collectively, with its subsidiaries, “MasTec” or the “Company”) is a leading specialty contractor operating mainly throughout the United States and across a range of industries. The Company’s core activities are the building, installation, maintenance and upgrade of utility and communications infrastructure, including but not limited to, electrical utility transmission and distribution, wind farm, solar farm and other renewable energy, natural gas and petroleum pipeline infrastructure, wireless, wireline, and satellite communications and water and sewer systems. MasTec’s primary customers are in the following industries: utilities (including wind farms, solar farms and other renewable energy, natural gas gathering systems and pipeline infrastructure), communications (including telephony, satellite television and cable television) and government (including water and sewer, utilities and communications work on military bases).
Note 2 - Summary of Significant Accounting Policies
The following is a summary of the significant accounting policies followed in the preparation of the accompanying consolidated financial statements. On July 1, 2009, the Financial Accounting Standards Board (“FASB”) issued the FASB Accounting Standards Codification (“ASC” or “the Codification”), the single source of authoritative, nongovernmental U.S generally accepted accounting principles (GAAP), except for rules and interpretive releases of the Securities and Exchange Commission (“SEC”), which are sources of authoritative GAAP for SEC registrants. All other nongrandfathered, non-SEC accounting literature not included in the Codification is nonauthoritative. The new guidelines and numbering system prescribed by the Codification are used when referring to GAAP in this Form 10-K. As the Codification was not intended to change or alter existing GAAP, has not had any impact on the Company’s consolidated financial statements.
Management estimates. The preparation of financial statements in conformity with accounting principles generally accepted in the United States requires management to make estimates and assumptions that affect the amounts reported in the financial statements and accompanying notes. Key estimates for MasTec include the recognition of revenue, allowance for doubtful accounts, accrued self-insured claims, the fair value of goodwill, intangible assets and securities available for sale, asset lives used in computing depreciation and amortization, including amortization of intangibles, accounting for income taxes, contingencies and litigation. While management believes that such estimates are fair when considered in conjunction with the consolidated financial position and results of operations taken as a whole, actual results could differ from those estimates and such differences may be material to the financial statements.
Principles of consolidation. The accompanying financial statements include MasTec, Inc. and its subsidiaries. GlobeTec Construction, LLC (“GlobeTec”) was consolidated in all periods presented as the Company had at least a 51% controlling interest in this entity. Other parties’ interest in GlobeTec was reported as a non-controlling interest in the consolidated financial statements for the year ended December 31, 2007. During 2007, the Company acquired an additional 45% ownership interest in GlobeTec, and during the first quarter of 2008, the remaining 4% interest in GlobeTec was acquired bringing MasTec’s ownership interest in this entity to 100%. All intercompany accounts and transactions have been eliminated in consolidation.
Reclassifications. Certain reclassifications were made to the prior year financial statements in order to conform to the current period presentation.
Comprehensive income (loss). Comprehensive income (loss) is a measure of net gain (loss) and all other changes in equity that result from transactions other than with shareholders. Comprehensive income (loss) consists of net income (loss), foreign currency translation adjustments and unrealized gains and losses on securities available for sale.
Accumulated other comprehensive loss of $6.1 million and $13.4 million as of December 31, 2009 and 2008, respectively, is primarily due to unrealized losses from securities available for sale and their related tax impact. See Note 6 – Securities Available for Sale.
Revenue recognition. Revenue and related costs for master and other service agreements billed on a time and materials basis are recognized as the services are rendered. Services are also performed under master and other service agreements billed on a fixed fee basis. Under fixed fee master service and similar type service agreements, MasTec furnishes various specified units of service for a separate fixed price per unit of service. For service agreements on a fixed fee basis, profitability will be reduced if the actual costs to complete each unit exceed original estimates.
52
Table of Contents
MasTec, Inc.
Notes To Consolidated Financial Statements - continued
In addition to master and other service agreements, the Company enters into contracts that require the installation or construction of specified units within an infrastructure system. Under these contracts, revenue is recognized at the contractually agreed price per unit as the units are completed and delivered. Profitability will be reduced if the actual costs to complete each unit exceed original estimates. The full amount of any estimated loss on these projects is immediately recognized if estimated costs to complete the remaining units for the project exceed the revenue to be earned on such units.
The Company also enters into fixed price, long-term installation/construction contracts that primarily require the construction and installation of an entire infrastructure system. Revenue and related costs are recognized as work progresses under these contracts using the percentage-of-completion method as prescribed in the Construction-Type and Production-Type Contracts Revenue Recognition Subtopic of the Codification, which requires the Company to estimate total project costs and profit to be earned on each long-term, fixed-price contract. MasTec’s process for estimating total costs is based upon the professional knowledge and experience of its project managers and financial professionals. Under the percentage-of-completion method, the Company records revenue and recognizes profit or loss as work on the contract progresses. The cumulative amount of revenue recorded on a contract at a specified point in time is that percentage of total estimated revenue that contract costs incurred to date bear to estimated total contract costs. The full amount of any estimated loss on a contract is recognized at the time the estimates indicate such a loss.
Periodically, work is performed outside of the specific requirements of the contract at the request of the customer. Generally, the revenue associated with such work is not recognized until the change order reflecting the scope and price for such work is executed. In rare circumstances, in accordance with the Construction-Type and Production-Type Contracts Revenue Recognition Subtopic of the Codification, the revenue may be recognized up to the amount of the cost if it is probable that the revenue is both realizable and collectible.
In certain circumstances MasTec’s customers determine the specification and supply materials such as cable, conduit and telephone equipment and pipes. Customer-furnished materials for which the customer retains the financial and performance risk associated with these materials are not included in revenue and cost of sales.
Contract costs include all direct material, labor and subcontract costs as well as indirect costs related to contract performance, such as indirect labor, supplies, tools and the operational costs of capital equipment (excluding depreciation). Factors that the Company considers in estimating the work to be completed and ultimate contract recovery include: the availability and productivity of labor, the nature and complexity of the work to be performed, the effect of change orders, the availability of materials, the effect of any delays in performance and the recoverability of any claims. Changes in job performance, job conditions, estimated profitability and final contract settlements are factors that impact management’s assessment of the total estimated costs to complete these contracts and therefore, may result in revisions to costs and income. If actual results significantly differ from the estimates used for revenue recognition and claim assessments, the Company’s financial condition and results of operations could be materially impacted.
Billings in excess of costs and estimated earnings on uncompleted contracts are classified as current liabilities. Any costs and estimated earnings in excess of billings are classified as current assets. Work in process on contracts is based on work performed but not yet billed to customers as per individual contract terms.
Allowance for doubtful accounts. The Company maintains an allowance for doubtful accounts for estimated losses resulting from the inability of its customers to make required payments. Management analyzes the collectibility of accounts receivable and the adequacy of the allowance for doubtful accounts on a regular basis based on the aging of account balances, historical bad debt experience, customer concentrations, customer credit-worthiness, customer financial condition and credit reports, availability of mechanics’ and other liens, existence of payment bonds and other sources of payment and current economic trends. An increase in the allowance for doubtful accounts is recorded when it is probable a receivable is not collectible and the loss can be reasonably estimated. Amounts are written off against the allowance when deemed uncollectible.
Cash and cash equivalents. All short-term highly liquid investments with original maturities of three months or less are considered to be cash equivalents stated at cost which approximates market value. Restricted cash, included in cash and cash equivalents, represents cash deposited in support of letters of credit issued through the Company’s credit facility. The Company’s credit facility provides full availability for those funds, and there is no reduction in liquidity. Restricted cash is invested in certificates of deposit with maturities equal to or less than 90 days.
53
Table of Contents
MasTec, Inc.
Notes To Consolidated Financial Statements - continued
Fair value of financial instruments. Effective January 1, 2008, the Company adopted ASC 820, Fair Value Measurements and Disclosures (“ASC 820”), which defines fair value, establishes a framework for measuring fair value in accordance with GAAP and expands disclosure requirements about fair value measurements. Under ASC 820, there are three categories for the classification and measurement of assets and liabilities carried at fair value:
Level 1: Quoted market prices in active markets for identical assets or liabilities.
Level 2: Observable market based inputs or observable inputs that are corroborated by market data.
Level 3: Unobservable inputs reflecting the reporting entity’s own assumptions.
The adoption of ASC 820 for MasTec’s financial assets and liabilities did not have a material impact on its fair value measurements. The Company adopted these requirements for its nonfinancial assets and nonfinancial liabilities as of January 1, 2009, except for those items recognized or disclosed at fair value on an annual or more frequent recurring basis. This adoption did not have a material impact on the consolidated financial statements.
In October 2008, the FASB issued guidance clarifying the application of ASC 820 in inactive markets and provided instructions for evaluating and using observable and unobservable inputs in these circumstances. This guidance has been adopted by the Company in the preparation of the consolidated financial statements since December 31, 2008.
The fair market value of financial instruments is generally estimated through the use of public market prices, quotes from financial institutions and other available information. Judgment is required in interpreting data to develop estimates of market value and, accordingly, amounts are not necessarily indicative of the amounts that could be realized in a current market exchange. Short-term financial instruments, including cash and cash equivalents, accounts and notes receivable, accounts payable and other liabilities, consist primarily of instruments without extended maturities, for which the fair value, based on management’s estimates, approximates carrying value.
At December 31, 2009 and December 31, 2008, the estimated fair value of the Company’s $150 million par value outstanding senior notes was approximately $142.5 million and $112.4 million, respectively. At December 31, 2009, the estimated fair value of the Company’s outstanding $115 million par value 4% senior convertible notes was approximately $120.6 million, and the estimated fair value of the Company’s $100 million outstanding 4.25% senior convertible notes was $106.4. The estimated fair value of the senior notes and the senior convertible notes are based on quoted market prices, representing Level 1 inputs under ASC 820.
At December 31, 2009, there was insufficient observable market data to determine the fair value of the Company’s auction rate securities due to the lack of activity in this market. Therefore, the fair value of these investments was estimated by an independent valuation firm, Houlihan Smith & Company, Inc., using a probability weighted discounted cash flow model, a Level 3 input under ASC 820.
Securities available for sale. Securities available-for-sale are recorded at fair value and temporary unrealized holding gains and losses are recorded as a separate component of accumulated other comprehensive income (loss), net of deferred taxes. Unrealized losses are charged against net earnings when a decline in fair value is determined to be other-than-temporary. Several factors are reviewed to determine whether a loss is other-than-temporary. These factors include but are not limited to: the length of time a security is in an unrealized loss position, the extent to which fair value is less than cost, the financial condition and near term prospects of the issuer, changes to the credit ratings of the securities, as well as the underlying assets supporting these securities, rates of default on the underlying portfolio of credit default swaps and the Company’s intent and ability to hold the security for a period of time sufficient to allow for any anticipated recovery in fair value.
In accordance with ASC 820 an impairment is considered to be other-than-temporary if the Company: intends to sell the security, more likely than not will be required to sell the security before recovering its cost, or does not expect to recover the security’s entire amortized cost basis, even if there is no intent to sell the security. In assessing the expectation of recovery, the Company performs an assessment of the present value of cash flows expected to be collected. If this assessment yields an amount less than the amortized cost basis of the security, even if the Company has the intent, and more likely than not, the ability to hold the securities, a credit loss is deemed to exist, which is considered an other-than-temporary impairment. The amount of an other-than-temporary impairment attributable to credit losses is recognized in earnings, while the amount of an other-than-temporary impairment related to other factors is recognized in other comprehensive income.
54
Table of Contents
MasTec, Inc.
Notes To Consolidated Financial Statements - continued
The Company’s securities available for sale consist of auction-rate securities that represent interests in pools of student loans guaranteed by the U.S. government under the Federal Family Education Loan Program and structured finance securities. These structured finance securities are collateralized by investment grade credit-linked notes made up of floating rate international bank notes or credit card receivable notes that collateralize credit default swap agreements on corporate debt obligations with remaining terms of 7 to 8 years. Under the terms of these credit default swaps, the principal value of these auction rate securities would be impaired at net default rates of the underlying corporate debt obligations ranging from 8% to 10.75%. Liquidity for auction-rate securities is typically provided by an auction process that resets the applicable interest rate at pre-determined intervals, usually every 7, 28 or 35 days. Due to disruptions in the credit markets beginning in 2008, these auctions have not had sufficient bidders to allow investors to complete a sale, indicating that immediate liquidity at par is unavailable. Management is uncertain at this time as to when, or if, the liquidity issues associated with these investments will improve, and as a result of this uncertainty, has classified these securities as long-term assets since June 30, 2008.
As of December 31, 2009, there was insufficient observable market data to determine the fair value of the Company’s auction rate securities due to the lack of activity in this market. Therefore, the fair value of these investments was estimated by an independent valuation firm, Houlihan Smith & Company, Inc., using a probability weighted discounted cash flow model. This model incorporates assumptions market participants would use in their estimates of fair value such as reset interest rates, final stated maturities, collateral values, credit quality and insurance, and applies the probabilities of either (a) a successful auction, (b) a failed auction, or (c) a default, at each auction. This valuation is sensitive to market conditions and management’s judgment and can change significantly based on the assumptions used. Factors that may impact the valuation include changes to credit ratings of the securities as well as to the underlying assets supporting the securities, rates of default of the underlying assets, underlying collateral values, discount rates, counterparty risk and ongoing strength and quality of market credit and liquidity.
During 2009, all of the Company’s structured finance auction rate securities, with a par value of $16.2 million and an estimated fair value of $8.1 million, were downgraded to non-investment grade by Standard & Poor’s and Fitch. Due to the deterioration in credit quality of the Company’s structured finance auction rate securities, the Company has deemed the decline in fair value on these securities to be an other-than-temporary impairment as of December 31, 2009. Of the total other-than-temporary impairment of these structured finance securities of $8.1 million, $6.1 million is attributed to credit losses. Accordingly, the Company recorded an other-than-temporary impairment in earnings of $6.1 million during the year ended December 31, 2009.
In October 2009, the Company settled its claim against the investment advisor that sold its auction rate securities.
See Note 6 – Securities Available for Sale and Note 17 – Commitments and Contingencies.
Inventories. Inventories consist of materials and supplies for construction and install to the home projects, and are typically purchased on a project-by-project basis. Inventories are valued at the lower of cost (using the specific identification method) or market. Construction projects are completed pursuant to customer specifications. The loss of the customer or the cancellation of the project could result in an impairment of the value of materials purchased for that customer or project. Technological or market changes can also render certain materials obsolete. Allowances for inventory obsolescence are determined based upon the specific facts and circumstances for each project and market conditions. There was no material obsolescence provision required for the years ended December 31, 2009 and 2008.
Property and equipment. Property and equipment are recorded at cost. Depreciation is computed using the straight-line method over the estimated useful lives of the respective assets. Leasehold improvements are depreciated over the shorter of the term of the lease or the estimated useful lives of the improvements. Expenditures for repairs and maintenance are charged to expense as incurred. Expenditures for betterments and major improvements are capitalized and depreciated over the remaining useful life of the asset. The carrying amounts of assets sold or retired and related accumulated depreciation are eliminated in the year of disposal and the resulting gains and losses are included in other income or expense.
Deferred costs. Deferred financing costs related to the credit facility, senior notes and senior convertible notes, whose short and long-term portions are included in other current and non-current assets in the Consolidated Balance Sheets, are amortized over the related terms of the debt using the effective interest method. Net deferred financing costs were $14.3 million and $4.2 million at December 31, 2009 and 2008, respectively.
Software capitalization. The Company capitalizes certain costs incurred in connection with developing or obtaining internal use software. These capitalized software costs are included in “Property and equipment, net” in the Consolidated Balance Sheets and are being amortized over a period not to exceed seven years.
55
Table of Contents
MasTec, Inc.
Notes To Consolidated Financial Statements - continued
Valuation of Long-Lived Assets. Management periodically reviews long-lived assets, consisting primarily of property and equipment and intangible assets with finite lives, for impairment. In analyzing potential impairment, management uses projections of future discounted cash flows from the assets. These projections are based on management’s view of growth rates for the related business, anticipated future economic conditions and the appropriate discount rates relative to risk and estimates of residual values. Management believes that these estimates are consistent with assumptions that marketplace participants would use in their estimates of fair value.
Valuation of Goodwill and Intangible Assets. Goodwill acquired in a purchase business combination and determined to have an infinite useful life is not amortized, but instead tested for impairment at least annually. Management conducts, on at least an annual basis, a review of the Company’s reporting entities to determine whether the carrying values of goodwill exceed the fair value using a discounted cash flow methodology for each entity. This impairment analysis requires several estimates, including future cash flows and growth rates for the reporting units, as well as the selection of a discount rate. Goodwill impairment may exist if the net book value of the reporting entity exceeds its estimated fair value. Should this be the case, the value of goodwill may be impaired and written down.
In addition, acquired intangible assets are recognized and amortized over their useful lives, which could be based on contractual or legal rights. Management periodically reviews long-lived intangible assets for impairment.
Accrued insurance. MasTec maintains insurance policies subject to per claim deductibles of $1 million for its workers’ compensation policy, $2 million for its general liability policy and $2 million for its automobile liability policy. The Company has excess umbrella coverage up to $100 million per claim and in the aggregate. MasTec actuarially determines liabilities for unpaid claims and associated expenses, including incurred but not reported losses, and reflects the present value of those liabilities in the balance sheet as other current and non-current liabilities. The determination of such claims and expenses and appropriateness of the related liability is reviewed and updated quarterly. Accruals are based upon known facts, historical trends and a reasonable estimate of future expenses. However, a change in experience or actuarial assumptions could nonetheless materially affect results of operations in a particular period. Known amounts for claims that are in the process of being settled, but have been paid in periods subsequent to those being reported, are also recorded in such reporting period. As of December 31, 2009 and December 31, 2008, MasTec’s liability for unpaid claims and associated expenses, including incurred but not reported losses, was $31.6 million and $39.9 million, respectively, of which $22.1 million and $24.2 million was reflected within non-current other liabilities, respectively.
The Company also maintains an insurance policy with respect to employee group health claims subject to per employee deductibles of $0.4 million.
The Company is periodically required to post letters of credit and provide cash collateral to its insurance carriers. As of December 31, 2009 and December 31, 2008, such letters of credit amounted to $66.9 million and $66.2 million, respectively, a portion of which is collateralized by $18.0 million of restricted cash at both December 31, 2009 and December 31, 2008. In addition, other cash collateral deposited with insurance carriers amounted to $3.0 million and $3.3 million as of December 31, 2009 and December 31, 2008, respectively, which is included in other assets in the consolidated balance sheets.
Income taxes. The Company records income taxes using the asset and liability method of accounting for deferred income taxes. Under this method, deferred tax assets and liabilities are recognized for the expected future tax consequence of temporary differences between the financial statement and income tax basis of our assets and liabilities. Income taxes are estimated in each of the jurisdictions in which the Company operates. This process involves estimating the tax exposure together with assessing temporary differences resulting from differing treatment of items, such as deferred revenue, for tax and accounting purposes. These differences result in deferred tax assets and liabilities, which are included within the consolidated balance sheet. The recording of a net deferred tax asset assumes the realization of such asset in the future. Otherwise a valuation allowance must be recorded to reduce this asset to its net realizable value. Management considers future pretax income and ongoing prudent and feasible tax planning strategies in assessing the net realizable value of tax assets and the need for such a valuation allowance. In the event that management determines that the Company may not be able to realize all or part of the net deferred tax asset in the future, a valuation allowance for the deferred tax asset is charged against income in the period such determination is made.
Stock-based compensation. The Company has granted to employees and others restricted stock and options to purchase common stock. Non-cash stock compensation expense is primarily included in general and administrative expense; an immaterial amount of non-cash stock compensation expense for certain operational employees is included within cost of sales in the consolidated statements of operations.
56
Table of Contents
MasTec, Inc.
Notes To Consolidated Financial Statements - continued
The Company grants restricted stock, which is valued based on the market price of MasTec’s common stock on the date of grant. Compensation expense arising from restricted stock grants with graded vesting is recognized using the ratable method (an accelerated method of expense recognition) over the vesting period. Those shares issued with cliff vesting are amortized on a straight line basis over the vesting period. Unearned compensation for performance-based options and restricted stock is shown as a reduction of shareholders’ equity in the consolidated balance sheets.
During the three years ended December 31, 2009, there were no stock options granted. For stock options granted in prior periods, the Black-Scholes valuation model was used to estimate the fair value of options to purchase MasTec’s common stock, and the Company uses the ratable method to amortize compensation expense over the vesting period of the option grant.
See Note 13 – Stock-Based Compensation Plans for further discussion.
Recently issued accounting pronouncements. In June 2009, the FASB issued the FASB Accounting Standards Codification (the “Codification”). Effective July 1, 2009, the Codification became the single source of authoritative nongovernmental GAAP, superseding existing rules and related literature issued by the FASB, American Institute of Certified Public Accountants (“AICPA”) and Emerging Issues task Force (“EITF”). The Codification also eliminates the previous U.S. GAAP hierarchy and establishes one level of authoritative GAAP. Rules and interpretive releases of the SEC under authority of federal securities laws are also sources of authoritative GAAP for SEC registrants. All other literature is considered non-authoritative. The Company adopted the Codification for the quarter ended September 30, 2009. As the Codification has not changed GAAP, other than the manner in which new accounting guidance is referenced, the adoption of the Codification had no impact on the Company’s consolidated financial statements.
In December 2007, the FASB issued SFAS No. 141 (R), Business Combinations (SFAS 141(R)), codified as Accounting Standards Codification (“ASC”) 805, Business Combinations, and SFAS No. 160, Non-controlling Interests in Consolidated Financial Statements (SFAS 160), codified as ASC 810, Consolidations. SFAS 141(R) and SFAS 160 significantly changed the accounting for and reporting of business combinations transactions and non-controlling (minority) interests. SFAS 141 (R) requires an acquirer to measure the identifiable assets acquired, the liabilities assumed, and any non-controlling interest in the acquired entity at their fair values on the acquisition date, with goodwill being the excess value over the net identifiable assets acquired. The Company adopted SFAS 141(R) on January 1, 2009 and applied its provisions in accounting for the acquisition of Precision Pipeline, LLC (See Note 4—Acquisitions). The adoption of SFAS 160 on January 1, 2009 did not have a material impact on the consolidated financial statements as the Company currently does not have any non-controlling interests.
In June 2009, the FASB issued SFAS No. 166, Accounting for Transfers of Financial Assets, an amendment to SFAS No. 140 ASU 2009-16, codified in Accounting Standards Update (“ASU”) 2009-16. The new standard eliminates the concept of a “qualifying special-purpose entity,” changes the requirements for derecognizing financial assets, and requires additional disclosures in order to enhance information reported to users of financial statements by providing greater transparency about transfers of financial assets, including securitization transactions, and an entity’s continuing involvement in and exposure to the risks related to transferred financial assets. ASU 2009-16 is effective for fiscal years beginning after November 15, 2009. The adoption of ASU 2009-16 on January 1, 2010 is not expected to have a material impact on MasTec’s consolidated financial statements.
In June 2009, the FASB issued SFAS No. 167, “Amendments to FASB Interpretation No. 46(R)” (SFAS 167), codified in ASU 2009-17. SFAS 167 amends FASB Interpretation No. 46(R), “Variable Interest Entities” for determining whether an entity is a variable interest entity (VIE) and requires an enterprise to perform an analysis to determine whether the enterprise’s variable interest or interests give it a controlling financial interest in a VIE. Under ASU 2009-17, an enterprise has a controlling financial interest when it has (a) the power to direct the activities of a VIE that most significantly impact the entity’s economic performance and (b) the obligation to absorb losses of the entity or the right to receive benefits from the entity that could potentially be significant to the VIE. ASU 2009-17 also requires an enterprise to assess whether it has an implicit financial responsibility to ensure a VIE operates as designed when determining whether it has power to direct the activities of the VIE that most significantly impact the entity’s economic performance. ASU 2009-17 also requires ongoing assessments of whether an enterprise is the primary beneficiary of a VIE, requires enhanced disclosures and eliminates the scope exclusion for qualifying special-purpose entities. ASU 2009-17 is effective for fiscal years beginning after November 15, 2009 and as such has not yet been incorporated into the Codification. The adoption of ASU 2009-17 on January 1, 2010 is not expected to have a material impact on MasTec’s consolidated financial statements.
In August 2009, the FASB issued ASU 2009-05, Measuring Liabilities at Fair Value, (“ASU 2009-05”). ASU 2009-05 amends ASC 820, Fair Value Measurements. Specifically, ASU 2009-05 provides clarification that in circumstances in which a quoted price in an active market for the identical liability is not available, a reporting entity is required to measure fair value using one or more of the following methods: (1) a valuation technique that uses a) the quoted price of the identical liability when traded as an asset or b) quoted prices for similar liabilities or similar liabilities when traded as assets and/or (2) a valuation technique that is consistent with the principles of ASC 820 (e.g. an income approach or market approach). ASU 2009–05 also clarifies that when estimating the fair value of a liability, a reporting entity is not required to include inputs relating to the existence of transfer restrictions on that liability. This standard was effective for the quarter beginning October 1, 2009, and its adoption did not have a material impact on the Company’s financial position or results of operations.
In October 2009, the FASB issued ASU No. 2009-13, Multiple–Deliverable Revenue Arrangements, (“ASU 2009-13”). ASU 2009-13 amends existing revenue recognition accounting pronouncements that are currently within the scope of FASB ASC Subtopic 605-25. The consensus to Emerging Issues Task Force (“EITF”) Issue No. 08-1, Revenue Arrangements with Multiple Deliverables,
57
Table of Contents
MasTec, Inc.
Notes To Consolidated Financial Statements - continued
provides accounting principles and application guidance on whether multiple deliverables exist, how the arrangement should be separated, and the consideration allocated. This guidance eliminates the requirement to establish the fair value of undelivered products and services and also eliminates the residual method of allocating arrangement consideration. The new guidance provides for separate revenue recognition based upon management’s estimate of the selling price for an undelivered item when there is no other means to determine the fair value of that undelivered item. Under the previous guidance, if the fair value of all of the elements in the arrangement was not determinable, then revenue was deferred until all of the items were delivered or fair value was determined. This new approach is effective for fiscal years beginning on or after June 15, 2010. Entities can elect to apply ASU 2009-13 (1) prospectively to new or materially modified arrangements after its effective date or (2) retrospectively for all periods presented. The Company is currently evaluating the potential impact of this standard on its financial position and results of operations.
In October 2009, the FASB ratified EITF consensus No. 09-1 and issued ASU No. 2009-15, “Accounting for Own-Share Lending Arrangements in Contemplation of Convertible Debt Issuance of Other Financing” (“ASU 2009-15”). ASU 2009-15 requires an entity that enters into a share-lending arrangement on its own shares (that are classified in equity pursuant to other authoritative accounting guidance) in contemplation of a convertible debt issuance or other financing to initially measure the share-lending arrangement at fair value and treat it as an issuance cost and to exclude the shares borrowed under the share-lending arrangement from basic and diluted EPS. In addition, under ASU 2009-15, if it becomes probable that the share-lending arrangement counterparty will default on the arrangement, the issuing entity should record a loss in current earnings equal to the fair value of the shares outstanding less any recoveries. The entity will continue to adjust the loss until actual default. Upon actual default, the issuing entity must include the shares outstanding under the share-lending arrangement (net of any share recoveries) in basic and diluted EPS. The ASU also requires entities to provide certain disclosures about the share-lending arrangement. The adoption of ASU 2009-15 on January 1, 2010 is not expected to have a material impact on the Company’s consolidated financial statements.
On January 21, 2010, the FASB issued ASU 2010-06, Improving Disclosures about Fair Value Measurements (“ASU 2010-06”) which amends ASC 820 Fair Value Measurements and Disclosures to add new requirements for disclosures about transfers into and out of Levels 1 and 2 separate disclosures about purchases, sales, issuances, and settlements relating to Level 3 measurements. ASU 2010-06 also clarifies existing fair value disclosures about the level of disaggregation and about inputs and valuation techniques used to measure fair value. Further, ASU 2010-06 amends guidance on employers’ disclosures about postretirement benefit plans assets under ASC 715, Compensation – Retirement Benefits to require that disclosures be provided by classes of assets instead of by major categories of assets. ASU 2010-06 is effective for the first reporting period beginning after December 15, 2009, except for the requirement to provide the Level 3 activity of purchases, sales, issuance, and settlements on a gross basis, which will be effective for fiscal years beginning after December 15, 2010, and for interim periods within those fiscal years. The adoption of ASU 2010-16 on January 1, 2010 is not expected to have a material impact on the Company’s consolidated financial statements.
Subsequent events. The Company has evaluated subsequent events through February 24, 2010, the date these financial statements were issued.
Note 3 – Earnings Per Share
Basic earnings per share is computed by dividing earnings available to common shareholders by the weighted average number of common shares outstanding for the period. Diluted earnings per share reflects the potential dilution that could occur if stock options and unvested restricted stock (“common stock equivalents”), securities, or other contracts to issue common stock were exercised or converted into common stock or resulted in the issuance of common stock that then shared in the earnings of MasTec.
As described in Note 10 – Debt, the Company had three convertible notes outstanding during some portion of the year ended December 31, 2009 and one convertible note outstanding as of December 31, 2008. These notes are reflected in the calculation of diluted earnings per share by application of the “if converted” method to the extent that their effect is dilutive. Under the “if-converted method,” in computing the dilutive effect of the Company’s convertible notes, net income is adjusted to add back the after-tax amount of interest recognized in the period associated with the convertible notes, and correspondingly, the convertible notes are assumed to have been converted, with the resulting common shares added to weighted average shares outstanding.
58
Table of Contents
MasTec, Inc.
Notes To Consolidated Financial Statements - continued
The following table represents a reconciliation of the income from continuing operations, net income and weighted average shares outstanding for the calculation of basic and diluted earnings per share for the years ended December 31 (in thousands, except per share amounts):
| 2009 | 2008 | 2007 | |||||||||
| Net Income (loss) |
|||||||||||
| Basic: |
|||||||||||
| Net income from continuing operations attributable to MasTec |
$ | 70,748 | $ | 66,602 | $ | 6,283 | |||||
| Loss from discontinued operations |
— | (814 | ) | (13,611 | ) | ||||||
| Net income (loss) attributable to MasTec |
$ | 70,748 | $ | 65,788 | $ | (7,328 | ) | ||||
| Diluted: |
|||||||||||
| Interest expense on 4% senior convertible notes |
$ | 2,260 | $ | — | $ | — | |||||
| Interest expense on 4.25% senior convertible notes |
419 | — | — | ||||||||
| Interest expense on 8% convertible notes |
— | 183 | — | ||||||||
| Net income from continuing operations attributable to MasTec |
73,427 | 66,785 | 6,283 | ||||||||
| Net income (loss) attributable to MasTec |
73,427 | 65,971 | (7,328 | ) | |||||||
| Shares |
|||||||||||
| Basic: |
|||||||||||
| Weighted average shares outstanding |
75,701 | 67,983 | 66,147 | ||||||||
| Diluted: |
|||||||||||
| Effect of dilutive common stock equivalents |
1,025 | 744 | 1,479 | ||||||||
| Effect of dilutive 4% senior convertible notes |
4,134 | — | — | ||||||||
| Effect of dilutive 4.25% senior convertible notes |
903 |
|
— — |
|
— | ||||||
| Effect of dilutive 8% senior convertible notes |
— | 189 | — | ||||||||
| Weighted average shares outstanding |
81,763 | 68,916 | 67,626 | ||||||||
Earnings per share for the years ended December 31 is as follows:
| 2009 | 2008 | 2007 | ||||||||
| Basic: |
||||||||||
| Income from continuing operations attributable to MasTec |
$ | 0.93 | $ | 0.98 | $ | 0.10 | ||||
| Net income (loss) attributable to MasTec |
$ | 0.93 | $ | 0.97 | $ | (0.11 | ) | |||
| Diluted: |
||||||||||
| Income from continuing operations attributable to MasTec |
$ | 0.90 | $ | 0.97 | $ | 0.09 | ||||
| Net income (loss) attributable to MasTec |
$ | 0.90 | $ | 0.96 | $ | (0.11 | ) | |||
Note 4 - Acquisitions
Precision
Effective November 1, 2009, MasTec purchased all of the issued and outstanding membership interests of Precision Pipeline, LLC and Precision Transport Company, LLC (together, “Precision”) for approximately $132 million in cash, the assumption of $34 million of Precision’s debt and a five-year earn-out equal to 40% of Precision’s EBITDA (as defined in the purchase agreement) for the last two months of 2009 and 30% of Precision’s annualized EBITDA in excess of $35 million for the remainder of the earn-out period, payable at MasTec’s option in cash or shares of MasTec common stock, or a combination thereof. Concurrent with the Precision acquisition, the Company issued $100 million of 4.25% senior convertible notes. See Note 10 - Debt. The net proceeds from the offering were used to fund the acquisition of Precision and for general corporate purposes.
Precision, based in Eau Claire, Wisconsin, is a leading energy infrastructure services provider, specializing in the construction and maintenance of large diameter pipelines. Precision’s experience in the long-haul, interstate pipeline industry complements the Company’s existing energy infrastructure service offerings, which include natural gas gathering systems, processing plants and compression stations and mid-stream pipelines. The acquisition of Precision will enhance MasTec’s end-to-end design and construction capabilities within the energy industry.
59
Table of Contents
MasTec, Inc.
Notes To Consolidated Financial Statements - continued
The following table summarizes the estimated fair value of consideration paid for Precision and the preliminary allocation of the purchase price to the fair value of the assets acquired and liabilities assumed at the date of acquisition (in thousands). The allocation of purchase price to the fair value of the tangible and intangible assets and the useful lives of these assets remains preliminary as management continues to assess the valuation of the acquired assets and liabilities and any ultimate purchase price adjustments based on the final net working capital as prescribed in the purchase agreement.
| Purchase Price Consideration: |
||||
| Cash |
$ | 131,873 | ||
| Debt assumed |
33,600 | |||
| Fair value of contingent consideration (earn-out) |
40,334 | |||
| Total consideration |
205,807 | |||
| Preliminary Purchase Price Allocation: |
||||
| Current assets |
$ | 95,838 | ||
| Investment in joint venture |
1,484 | |||
| Non-compete agreements |
1,800 | |||
| Customer contracts |
14,500 | |||
| Goodwill |
123,501 | |||
| Property and equipment |
56,347 | |||
| Total assets acquired |
293,470 | |||
| Current liabilities |
(87,663 | ) | ||
| Liability arising from contingent consideration arrangement |
(40,334 | ) | ||
| Long-term debt |
(33,600 | ) | ||
| Total liabilities assumed |
(161,597 | ) | ||
| Net assets acquired |
$ | 131,873 | ||
The intangible asset related to customer contracts is amortized over the expected remaining term of these contracts consistent with the pattern in which the related benefits are consumed over its two year useful life, and the intangible asset related to the non-compete agreements with the sellers is being amortized over their seven-year term.
Goodwill of approximately $123.5 million arising from the acquisition represents the value of the assembled union workforce, the industry-specific project management expertise of Precisions’ management team, as well as the synergies expected to be achieved from the combined operations of Precision and MasTec, which are now capable of providing a full array of construction services to oil and gas producers, as well as mid-stream and interstate pipeline operators.
The fair value of the earn-out arrangement described above was estimated at $40.3 million using the income approach incorporating significant inputs not observable in the market (Level 3 inputs under ASC 820). Key assumptions include the probability adjusted EBITDA projections and the use of the risk-free rate as a discount factor, as the risk is reflected in the EBITDA probability assessment. The range of potential undiscounted payments that MasTec could be required to make under the earn-out arrangement is estimated to be between $0 and $65 million, however, there is no maximum earn-out payment amount.
Current assets include accounts receivable, costs and earnings in excess of billings, and retainage of $84.4 million. The gross contractual amounts due total $85.3 million, of which $0.9 million is not expected to be collected.
Acquisition costs of approximately $0.4 million related to the acquisition of Precision are included in Selling, general and administrative expenses in the consolidated statement of operations for the year ended December 31, 2009. Additionally, debt issuance costs of approximately $3.7 million related to the issuance of the 4.25% senior convertible notes were recorded in Other assets in the consolidated balance sheet and are being amortized over the term of the notes.
Precision’s earnings have been consolidated as of the effective date of the acquisition, November 1, 2009.
60
Table of Contents
MasTec, Inc.
Notes To Consolidated Financial Statements - continued
Wanzek
In December 2008, MasTec purchased all of the issued and outstanding shares of Wanzek Construction, Inc., (“Wanzek”) for: (i) $50 million in cash, (ii) 7.5 million shares of MasTec common stock, (iii) an 8% convertible note in the principal amount of $55 million due December 2013 with interest payments payable in April, August, and December of each year, commencing in April 2009 (the “Wanzek convertible notes”), (iv) the assumption of up to $15 million of Wanzek’s debt and (v) a two-year earn-out equal to 50% of Wanzek’s EBITDA over $40 million per year. The purchase agreement provides for “piggyback” registration rights without penalty or registration payment arrangements. The acquisition was effective as of December 1, 2008, and accordingly, Wanzek’s earnings have been consolidated as of that date.
Wanzek, headquartered in Fargo, North Dakota, has been in business more than 37 years and manages a team of highly-skilled workers and tradesmen who are deployed throughout the country and who are capable of working under extreme weather conditions. Wanzek currently derives a significant portion of its revenue from wind farm construction and maintains a fleet of heavy equipment, including a number of specialized heavy cranes, a critical component for the successful erection of wind turbine towers. With the acquisition of Wanzek, MasTec is capable of providing end-to-end construction services to wind farm owners and developers. The Wanzek acquisition complements MasTec’s existing expertise and contracts in the construction of the electrical collection systems, substations and transmission lines necessary to connect energy from wind farms to the power grid. Wanzek brings additional experience and capabilities to MasTec in the construction of natural gas processing plants and compression stations, and other heavy/civil and industrial process construction.
On June 1, 2009, MasTec entered into a note purchase option agreement with Wanzek which allowed the Company to repurchase all, or part of, the Wanzek convertible notes at any time on or prior to July 31, 2009 for the principal amount thereof plus all accrued interest. Pursuant to the note purchase option agreement, to the extent that on or prior to July 31, 2009, MasTec completed an offering with net proceeds in excess of the principal amount of the Wanzek convertible notes plus all interest accrued thereon, the Company was required to exercise its option to repurchase all of the Wanzek convertibles notes. Accordingly, as $115 million of 4% senior convertible notes were issued in June 2009, the Company repurchased the $55 million Wanzek convertible notes plus approximately $2 million of accrued interest.
In connection with the note purchase option agreement, the Company also agreed to remove the six-month transfer restrictions that would have otherwise been applicable to the 7.5 million shares of MasTec common stock issued to the sellers of Wanzek in connection with the acquisition and allowed the sellers of Wanzek to participate in a secondary offering of a total of 5.175 million shares of MasTec common stock. The common stock offering closed in June 2009, at a price of $12.125 per share. The Company did not receive any proceeds from the sale of the common stock, but did pay certain offering expenses of approximately $0.2 million on behalf of the selling shareholders, which were recorded as additional goodwill.
Additionally, during 2009, adjustments were recorded as additional goodwill related to (i) $2.3 million paid to the sellers of Wanzek as a purchase price adjustment based on Wanzek’s final net working capital as of the effective closing date as prescribed in the purchase agreement and (ii) a deferred tax liability of $13.2 million related to the trade name intangible.
The purchase price to acquire Wanzek, including transaction costs, has been allocated to the assets acquired and liabilities assumed at the effective date of the acquisition based on estimated fair values, as summarized below (in thousands):
61
Table of Contents
MasTec, Inc.
Notes To Consolidated Financial Statements - continued
| Current assets |
$ | 68,952 | ||
| Property and equipment |
31,355 | |||
| Other assets |
794 | |||
| Customer contracts and relationships |
24,200 | |||
| Trade name |
34,500 | |||
| Non-compete agreement |
1,350 | |||
| Goodwill |
105,378 | |||
| Total assets acquired |
266,529 | |||
| Current liabilities |
(58,181 | ) | ||
| Other liabilities |
(29,401 | ) | ||
| Debt |
(12,831 | ) | ||
| Total liabilities assumed |
(100,413 | ) | ||
| Net assets acquired |
$ | 166,116 | ||
The portion of intangible assets related to existing customer contracts is amortized over the remaining term of these contracts. The remaining portion of the intangible assets related to customer relationships is amortized on an accelerated basis in relation to the benefits received over its weighted average ten-year useful life. The intangible asset related to the non-compete agreement with the seller is being amortized over its useful life of three years, and the Wanzek trade name has an indefinite life.
Funraisers
On October 1, 2008, MasTec acquired from Red Ventures LLC, (the “Seller”), the same seller that sold DirectStar TV LLC (“DirectStar”) to MasTec, 100% of the membership interests of Funraisers PR, LLC (“Funraisers”), a company engaged in a start-up business that provides marketing, advertising, promotion, and sales activities for internet data delivery service by satellite and certain other broadband companies. DirectStar, together with its subsidiaries, including Funraisers, is referred to as the “DirectStar Business.” Funraisers earnings have been consolidated since the date of acquisition.
Although MasTec did not pay any upfront consideration for Funraisers at the closing, in connection with the transaction MasTec has agreed to increase the earn-out payable with respect to DirectStar until December 31, 2018. Additionally, the Seller has an option to purchase DirectStar Business back from MasTec. This option is exercisable from January 1, 2011 to December 31, 2013 for an amount determined, in part, on the earnings of DirectStar for the trailing twelve months preceding the exercise date multiplied by a multiple to be determined in part on MasTec’s earnings before interest, taxes, depreciation and amortization (“EBITDA”) multiple minus a factor representing the remaining earn-out payments under the purchase agreements subject to a floor and cap as set forth in the agreement. This option has an estimated fair value of $0 at the date of acquisition and at December 31, 2009, as determined using a probability-weighted market-based approach including Level 3 inputs such as projected EBITDA and EBITDA multiples.
Inclusion of pro forma results of operations as if the acquisition of Funraisers had been completed at the beginning of 2008 would not have a material impact on the results of operations for the year ended December 31, 2008, as presented.
Nsoro
On July 31, 2008, MasTec purchased certain assets of Nsoro, LLC (“Nsoro”) for a purchase price of $17.5 million, paid in cash at closing, plus the assumption of approximately $12 million in indebtedness and earn-out payments payable over an eight-year period equal to 50% of Nsoro’s earnings before taxes above certain minimum thresholds. The earn-out is payable in cash and, in certain circumstances, MasTec common stock or a combination thereof at the Company’s discretion. Nsoro is headquartered in Atlanta, Georgia and specializes in wireless infrastructure management and construction. The strategic acquisition of Nsoro gives MasTec the opportunity to service its large communications customers’ wireless capital spending plans.
Analysis of work in process, costs and estimated earnings in excess of billings and billings in excess of costs has resulted in reclassifying entries to gross-up amounts previously netted, and revised estimates in the valuation of acquired assets and liabilities since the initial purchase price allocation, which was finalized in the third quarter of 2009, have resulted in changes to goodwill. The purchase price to acquire Nsoro, including transaction costs of $2.4 million, has been allocated to the assets acquired and liabilities assumed at the effective date of the acquisition based on estimated fair values, as summarized below (in thousands).
62
Table of Contents
MasTec, Inc.
Notes To Consolidated Financial Statements - continued
| Current assets |
$ | 85,202 | ||
| Property and equipment |
716 | |||
| Customer relationships |
10,600 | |||
| Trade name |
980 | |||
| Goodwill |
3,230 | |||
| Other long-term assets |
94 | |||
| Total assets acquired |
100,822 | |||
| Current liabilities |
(68,791 | ) | ||
| Debt |
(12,164 | ) | ||
| Total liabilities assumed |
(80,955 | ) | ||
| Net assets acquired |
$ | 19,867 | ||
The customer relationship and trade name intangible assets are amortized on a straight-line basis over a twenty year and five year life, respectively, consistent with the benefits expected to be received.
In connection with the acquisition of Nsoro, management approved a plan to exit the activities of four Nsoro locations including the termination and/or relocation of the employees at these locations. These exit activities resulted in liabilities assumed of approximately $0.2 million included in the allocation of purchase price above. These locations were substantially closed at the end of 2008.
Nsoro’s earnings have been consolidated since the date of acquisition. Inclusion of pro forma results of operations as if the acquisition had been completed at the beginning of 2008 would not have a material impact on the results of operations for the year ended December 31, 2008, as presented.
Pumpco
In May 2008, MasTec acquired all of the issued and outstanding capital stock of Pumpco, Inc. (“Pumpco”) for a purchase price of $44 million, paid in cash, plus the retirement and assumption of certain indebtedness and earn-out payments payable over a five-year period equal to 50% of Pumpco’s earnings before taxes above significant specified thresholds. The earn-out is payable in cash and, at the Company’s option, MasTec common stock or a combination thereof. In connection with the acquisition, the Company entered into a $22.5 million equipment term loan and used the proceeds to pay off $8.7 million of Pumpco indebtedness with the balance used to pay a portion of the acquisition purchase price. The equipment term loan is secured by most of Pumpco’s existing equipment and is guaranteed by MasTec. The acquisition is effective as of May 1, 2008, and, accordingly, Pumpco’s earnings have been consolidated as of that date.
Pumpco, headquartered in Giddings, Texas, has been in business for over 25 years and specializes in midstream natural gas pipeline construction. The acquisition of Pumpco continues MasTec’s diversification and growth strategy and expands its presence and capabilities in servicing gas pipeline customers.
The purchase price to acquire Pumpco, including transaction costs, has been allocated to the assets acquired and liabilities assumed at the effective date of the acquisition based on estimated fair values, as summarized below. The initial purchase price allocation, which was finalized in the second quarter of 2009, has been adjusted to reflect additional deferred tax liabilities and goodwill.
63
Table of Contents
MasTec, Inc.
Notes To Consolidated Financial Statements - continued
| Current Assets |
$ | 11,349 | ||
| Property and equipment |
34,655 | |||
| Customer contracts and relationships |
5,200 | |||
| Non-compete agreement |
1,740 | |||
| Trade name |
2,400 | |||
| Goodwill |
18,286 | |||
| Total assets acquired |
73,630 | |||
| Current liabilities |
(3,655 | ) | ||
| Other liabilities |
(8,807 | ) | ||
| Debt |
(9,539 | ) | ||
| Total liabilities assumed |
(22,001 | ) | ||
| Net assets acquired |
$ | 51,629 | ||
The portion of intangible assets related to existing customer contracts is amortized over the remaining term of these contracts. The remaining portion of the intangible assets related to customer relationships is amortized on an accelerated basis in relation to the benefits received over its ten-year useful life. Intangible assets related to customer contracts and relationships, the non-compete agreement with the seller, and the Pumpco trade name has a weighted average useful life of 13 years.
Power Partners, LLC
In December 2007, MasTec acquired certain assets, of Power Partners, LLC for $5.5 million in cash, and assumed certain liabilities of $2.8 million and agreed to pay the seller an earn-out based on future performance through the fifth anniversary of the closing date. The Company may, at its option, issue shares of its common stock to the sellers of Power Partners, LLC in connection with the earn-out for this acquisition. Power Partners, LLC, is an electrical utility contractor specializing in wind farm construction. Power Partners’ earnings have been consolidated since the date of acquisition.
Three Phase Line Construction, Inc.
In October 2007, MasTec acquired all the outstanding shares of capital stock of Three Phase Line Construction, Inc. (“Three Phase”) for a purchase price of $8.0 million in cash, subject to adjustments, and an earn-out based on future performance of the acquired entity through the fifth anniversary of the closing date. The Company may, at its option, issue shares of its common stock to the sellers of Three Phase Line in connection with the earn-out for this acquisition. Three Phase is involved in the construction and maintenance of transmission and distribution utility systems, substation and storm restoration in several northern states. Three Phase’s earnings have been consolidated since the date of acquisition.
Acquisition of Remaining Interest in GlobeTec
During 2007, MasTec acquired an additional 45% ownership interest in GlobeTec Construction, LLC (“GlobeTec”) for $6.5 million in cash. In addition to the cash payments, MasTec has agreed to pay certain sellers an earn-out based on future performance through the fourth anniversary of the closing date based on fiscal year. As a result of these investments, MasTec’s ownership interest in GlobeTec increased from 51% to 96% during the year ended December 31, 2007. In March 2008, the Company acquired the remaining 4% interest in GlobeTec, bringing MasTec’s ownership interest in this entity to 100%. The acquisition of the remaining 4% interest in GlobeTec was not material to the Company’s consolidated financial statements.
Acquisition of Remaining Interest in DirectStar
Effective February 1, 2007, the Company acquired the remaining 51% equity interest in DirectStar, its equity-method investee. As a result of the acquisition of the remaining 51% equity interest, the Company consolidated the operations of the acquired entity with its results commencing in February 2007. In February 2007, the Company paid the seller $8.65 million in cash, in addition to approximately $6.35 million which the Company also paid at that time to discharge its remaining obligations to the seller under the purchase agreement for the original 49% equity interest, and issued to the seller 300,000 shares of MasTec common stock. The Company has also agreed to pay the seller an earn-out through December 31, 2018 based on the future performance of the acquired business. In connection with the purchase, the Company entered into a service agreement with the sellers for them to manage the business. Under certain circumstances, MasTec may be required to invest up to an additional $3.0 million in the acquired entity.
64
Table of Contents
MasTec, Inc.
Notes To Consolidated Financial Statements - continued
Unaudited Pro Forma Information
The following unaudited pro forma data presents revenue and results of operations as if the acquisitions of Precision, Wanzek and Pumpco had occurred on January 1, 2008 for the year ended December 31, 2008, and the acquisition of Precision had occurred on January 1, 2009 for the year ended December 31, 2009.
| Years Ended December 31, | ||||||
| 2009 (unaudited) |
2008 (unaudited) | |||||
| (In thousands) | ||||||
| Revenue |
$ | 1,844,862 | $ | 2,271,425 | ||
| Income from continuing operations |
$ | 104,948 | $ | 164,030 | ||
Tax Deductible Goodwill
The Company has $173.6 million and $76.8 million in tax deductible goodwill related to acquisitions as of December 31, 2009 and 2008, respectively.
Note 5 - Goodwill and Other Intangible Assets
The following table sets forth information for MasTec’s goodwill and intangible assets as of December 31(in thousands):
| 2009 | Weighted Average Amortization Period |
2008 | Weighted Average Amortization Period | |||||||
| Amortizing intangible assets: (1) |
||||||||||
| Gross carrying amount |
$ | 71,219 | 11 years | $ | 57,629 | 14 years | ||||
| Less: accumulated amortization |
21,918 | 8,978 | ||||||||
| Amortizing intangible assets, net |
$ | 49,301 | $ | 48,651 | ||||||
| Non-amortizing intangible assets: |
||||||||||
| Goodwill |
$ | 488,988 | $ | 331,037 | ||||||
| Trade name |
35,314 | 34,976 | ||||||||
| Other |
5,941 | 5,940 | ||||||||
| Non-amortizing intangible assets |
$ | 530,243 | $ | 371,953 | ||||||
| Goodwill and other intangible assets |
$ | 579,544 | $ | 420,604 | ||||||
| (1) | Consist principally of customer relationships, tradenames, and non-compete agreements with finite lives. |
During the years ended December 31, 2009 and 2008, MasTec recorded approximately $158.0 million and $138.0 million, respectively, of goodwill and $16.6 million and $83.5 million, respectively, of other identifiable intangible assets in connection with acquisitions and payment of earn-outs made in these years.
MasTec continues to amortize identifiable intangible assets that have a definite useful life. Total amortization expense related to these identifiable intangible assets was $12.9 million, $3.7 million and $1.0 million in 2009, 2008 and 2007, respectively.
65
Table of Contents
MasTec, Inc.
Notes To Consolidated Financial Statements - continued
Information about estimated amortization expense for identifiable intangible assets that have a finite life for the periods subsequent to December 31, 2009 is summarized in the following table (in thousands):
| Amortization Expense | |||
| 2010 |
13,044 | ||
| 2011 |
7,585 | ||
| 2012 |
4,801 | ||
| 2013 |
3,696 | ||
| 2014 |
2,994 | ||
| Thereafter |
17,181 | ||
| Total |
$ | 49,301 | |
Management performs its annual impairment review of goodwill and certain intangible assets with indefinite lives during the fourth quarter each year at the reporting unit level. The assets of each acquired business and the related goodwill are allocated to multiple reporting units based upon the availability and suitability of management expertise to execute and integrate the acquired projects. Management identifies the Company’s reporting units by assessing whether businesses holding purchased assets, including goodwill, and related assumed liabilities have discrete financial information available. The Company’s reporting units are one level below its reportable segment.
The Company’s reporting units sell and provide contracting services, including building, installation, maintenance and upgrade services by primarily, digging and drilling trenches and installing poles, pipes, towers, antennae, wire, and equipment. Each of our reporting units performs these services across multiple industries, including telecommunications, energy, and government and to a variety of customers, some of which receive services from multiple reporting units.
Management estimates the fair value of each reporting unit and compares the fair value to its carrying value, including goodwill. If the carrying value exceeds the fair value, the value of the reporting units’ goodwill or other indefinite-lived intangibles may be impaired and written down.
During the three year period ended December 31, 2009, management estimated the fair value of the Company’s reporting units based on a five-year projection of revenues, operating costs, and cash flows considering historical and anticipated future results, general economic and market conditions, as well as the impact of planned business and operational strategies. Management applied a five year discounted cash flow technique utilizing a terminal value equal to 5.5 to 7 times year five EBITDA (earnings before net interest expense, income taxes, depreciation and amortization). Discount rates ranged from 9% to 14% per annum and represent the Company’s estimated cost of capital at the time of the analysis. A 100 basis point change in the discount rate would not have had a material impact on the results of the impairment analysis. Based upon these analyses, no material impairment charges were required for the three years ended December 31, 2009.
Note 6 - Securities Available for Sale
The Company’s securities available for sale consist of auction rate securities that represent interests in pools of student loans guaranteed by the U.S. government under the Federal Family Education Loan Program and structured finance securities. These structured finance securities are collateralized by investment grade credit-linked notes made up of floating rate international bank notes or credit card receivable notes that collateralize credit default swap agreements on corporate debt obligations with remaining terms of 7 to 8 years. Under the terms of the credit default swaps, the principal value of these auction rate securities would be impaired at net default rates on the underlying corporate debt obligations ranging from 8% to 10.75%. Liquidity for these auction-rate securities is typically provided by an auction process that resets the applicable interest rate at pre-determined intervals, usually every 7, 28 or 35 days. Due to disruptions in the credit markets beginning in 2008, these auctions have not had sufficient bidders to allow investors to complete a sale, indicating that immediate liquidity at par is unavailable. The Company continues to earn and collect interest on its auction rate securities. Management is uncertain at this time as to when, or if, the liquidity issues associated with these investments will improve, and as a result of this uncertainty, has classified these securities as long-term assets since June 30, 2008.
As of December 31, 2009, there was insufficient observable market data to determine the fair value of the Company’s auction rate securities due to the lack of activity in this market. Therefore, the fair value of these investments was estimated by an independent valuation firm, Houlihan Smith & Company, Inc., using a probability weighted discounted cash flow model. This model incorporates assumptions market participants would use in their estimates of fair value such as reset interest rates, final stated maturities, collateral values, credit quality and insurance, and applies the probabilities of either (a) a successful auction, (b) a failed auction, or (c) a default, at each auction (Level 3 inputs under ASC 820, Fair Value Measurements and Disclosures). This valuation is
66
Table of Contents
MasTec, Inc.
Notes To Consolidated Financial Statements - continued
sensitive to market conditions and management’s judgment and can change significantly based on the assumptions used. Factors that may impact the valuation include changes to credit ratings of the securities as well as to the underlying assets supporting the securities, rates of default of the underlying assets, underlying collateral values, discount rates, counterparty risk and ongoing strength and quality of market credit and liquidity.
The following tables set forth the fair value of the Company’s long-term auction rate securities by type of security and underlying credit rating as of December 31, 2009 and December 31, 2008 (in thousands):
| As of December 31, 2009 |
Underlying Credit Rating (1) | ||||||||
| AAA | CCC | Total | |||||||
| Underlying security: |
|||||||||
| Student loans |
$ | 16,460 | $ | — | $ | 16,460 | |||
| Structured finance securities |
— | 8,051 | 8,051 | ||||||
| Total auction rate securities included in long-term assets |
$ | 16,460 | $ | 8,051 | $ | 24,511 | |||
| As of December 31, 2008 |
Underlying Credit Rating (1) | |||||||||||
| AAA | BBB | BB | Total | |||||||||
| Underlying security: |
||||||||||||
| Student loans |
$ | 15,854 | $ | — | $ | — | $ | 15,854 | ||||
| Structured finance securities |
— | 3,265 | 1,461 | 4,726 | ||||||||
| Total auction rate securities included in long-term assets |
$ | 15,854 | $ | 3,265 | $ | 1,461 | $ | 20,580 | ||||
| (1) | The Company’s auction rate securities maintain split ratings. For purposes of this table, securities are categorized according to their lowest rating. |
As of December 31, 2009, the yields on the Company’s long-term auction-rate securities ranged from 1.73% to 2.49%. These yields represent the predetermined “maximum” reset rates that occur upon auction failures according to the specific terms within each security’s prospectus. As of December 31, 2009, the weighted average yield for the Company’s long-term auction-rate securities was 2.05%. Total interest earned on the Company’s auction-rate securities during the years ended December 31, 2009, 2008 and 2007 was $0.7 million, $1.5 million and $4.1 million, respectively. Further, the issuers have been making interest payments when due.
As of December 31, 2009 and 2008, the estimated fair value of the Company’s securities available for sale totaled $24.5 million and $20.6 million, respectively. During the years ended December 31, 2009 and 2008, the Company recorded unrealized gains of $3.9 million and unrealized losses of $8.3 million in other comprehensive income, net of deferred taxes.
During 2009, all of the Company’s structured finance auction rate securities, with a par value of $16.2 million and an estimated fair value of $8.1 million, were downgraded to non-investment grade by Standard & Poor’s and Fitch. Due to the continued deterioration in credit quality of the Company’s structured finance auction rate securities, the Company deemed the decline in fair value of $8.1 million on these securities to be an other-than-temporary impairment. Of the total other-than-temporary impairment of $8.1 million, $6.1 million was attributed to credit losses. Accordingly, the Company recorded an other-than-temporary impairment in earnings of $6.1 million during the year ended December 31, 2009.
Credit losses on the structured finance securities were estimated using Level 3 inputs by comparing their estimated fair values at December 31, 2009, which are based on a number of factors as discussed above, including estimated probabilities of default, with the values that would have been derived if the probability of default were zero percent. The difference between the estimated fair value at December 31, 2009 and the estimated fair value assuming a zero probability of default was considered to be the portion of the total decline in fair value attributable to credit losses.
An impairment is considered to be other-than-temporary if an entity intends to sell the security, more likely than not will be required to sell the security before recovering its cost, or does not expect to recover the security’s entire amortized cost basis, even if there is no intent to sell the security. In assessing the expectation of recovery, companies are required to perform an assessment of the present value of cash flows expected to be collected. If this assessment yields an amount less than the amortized cost basis of the security, even if the entity has the intent, and more likely than not, the ability to hold the security, a credit loss is deemed to exist, which is considered an other-than-temporary impairment. The amount of an other-than-temporary impairment attributable to credit losses is recognized in earnings, while the amount of an other-than-temporary impairment related to other factors is recognized in other comprehensive income, net of deferred taxes. The Company expects to recover the remaining cost basis of its auction rate securities as of December 31, 2009, and does not intend to sell or believe that it will be required to sell the securities before recovery
67
Table of Contents
MasTec, Inc.
Notes To Consolidated Financial Statements - continued
of their cost basis, which may be at maturity. Management believes the temporary unrealized decline in estimated fair value of $3.0 million at December 31, 2009 is primarily attributable to the limited liquidity of these investments and the overall market volatility in the current period. As a result, the Company has unrealized losses of $3.0 million on the remaining cost basis of its auction rate securities included as a component of other comprehensive income (losses), net of deferred taxes, as of December 31, 2009.
All of the Company’s auction rate securities have been in a continuous unrealized loss position for 12 months or longer as of December 31, 2009 and December 31, 2008. The cost basis, gross unrealized losses and estimated fair value, determined using Level 3 inputs, for these securities are as follows (in thousands):
| December 31, 2009 | ||||||||||
| Cost Basis | Cumulative Unrealized Losses |
Fair Value | ||||||||
| Auction rate securities – student loans |
$ | 17,450 | $ | (990 | ) | $ | 16,460 | |||
| Auction rate securities – structured finance securities |
10,081 | (2,030 | ) | 8,051 | ||||||
| Total auction rate securities |
$ | 27,531 | $ | (3,020 | ) | $ | 24,511 | |||
| December 31, 2008 | ||||||||||
| Cost Basis | Cumulative Unrealized Losses |
Fair Value | ||||||||
| Auction rate securities – student loans |
$ | 17,450 | $ | (1,596 | ) | $ | 15,854 | |||
| Auction rate securities – structured finance securities |
16,200 | (11,474 | ) | 4,726 | ||||||
| Total auction rate securities |
$ | 33,650 | $ | (13,070 | ) | $ | 20,580 | |||
The contractual maturity of the auction rate securities available for sale at December 31, 2009 ranges from 18 to 38 years for student loan auction rate securities and from 7 to 8 years for structured finance auction rate securities.
In October 2009, the Company settled its claim against the investment advisor that sold its auction rate securities. See Note 17 – Commitments and Contingencies.
Note 7 - Accounts Receivable, Cost and Earnings in Excess of Billings and Retainage, Net of Allowance
Accounts receivable, classified as current, consist of the following (in thousands):
| 2009 | 2008 | |||||||
| Contract billings |
$ | 231,759 | $ | 210,215 | ||||
| Retainage |
22,971 | 29,408 | ||||||
| Costs and earnings in excess of billings |
79,763 | 99,405 | ||||||
| 334,493 | 339,028 | |||||||
| Less allowance for doubtful accounts |
(10,281 | ) | (11,646 | ) | ||||
| Accounts receivable, net |
$ | 324,212 | $ | 327,382 | ||||
Retainage, which has been billed but is not due until completion of performance and acceptance by customers, is expected to be collected within one year. Any receivables, including retainage, expected to be collected beyond a year are recorded in long-term other assets.
Activity for the allowance for doubtful accounts from continuing operations is as follows (in thousands):
| For the Year Ended December 31, | ||||||||
| 2009 | 2008 | |||||||
| Allowance for doubtful accounts at beginning of year |
$ | 11,646 | $ | 15,276 | ||||
| Provision for doubtful accounts from continuing operations |
2,414 | 3,482 | ||||||
| Amounts charged against the allowance |
(3,779 | ) | (7,112 | ) | ||||
| Allowance for doubtful accounts at end of year |
$ | 10,281 | $ | 11,646 | ||||
68
Table of Contents
MasTec, Inc.
Notes To Consolidated Financial Statements - continued
Amounts charged against the allowance primarily represent the write-off of accounts which had been fully reserved previously.
Note 8 - Other Current Assets and Liabilities
Prepaid expenses and other current assets as of December 31, 2009 and 2008 consist of the following (in thousands):
| 2009 | 2008 | |||||
| Non-trade receivables |
$ | 2,380 | $ | 6,797 | ||
| Other receivables |
6,962 | 5,865 | ||||
| Prepaid expenses and deposits |
14,221 | 10,781 | ||||
| Deferred project cost |
1,033 | 2,109 | ||||
| Other |
702 | 454 | ||||
| Total prepaid expenses and other current assets |
$ | 25,298 | $ | 26,006 | ||
Other current liabilities consist of the following as of December 31, 2009 and 2008 (in thousands):
| 2009 | 2008 | |||||
| Obligations related to acquisitions |
$ | 25,137 | $ | 14,701 | ||
| Accrued amounts related to discontinued operations |
341 | 2,018 | ||||
| Accrued losses on contracts |
1,007 | 3,860 | ||||
| Other |
15,682 | 15,949 | ||||
| Total other current liabilities |
$ | 42,167 | $ | 36,528 | ||
Note 9 - Property and Equipment, Net
Property and equipment, net, including property and equipment under capital leases, is comprised of the following as of December 31, 2009 and 2008 (in thousands):
| 2009 | 2008 | Estimated Useful Lives (In Years) | ||||||||
| Land |
$ | 4,675 | $ | 3,866 | ||||||
| Buildings and leasehold improvements |
10,959 | 9,246 | 5 - 40 | |||||||
| Machinery and equipment |
266,730 | 214,480 | 2 - 15 | |||||||
| Office furniture and equipment |
55,323 | 49,285 | 3 - 5 | |||||||
| 337,687 | 276,877 | |||||||||
| Less accumulated depreciation |
(138,875 | ) | (118,864 | ) | ||||||
| $ | 198,812 | $ | 158,013 | |||||||
Property and equipment under capital leases are depreciated over their estimated useful lives.
Depreciation expense for the years ended December 31, 2009, 2008 and 2007 is $36.6 million, $24.8 million and $17.0 million, respectively.
Management reviews long-lived assets for impairment whenever events or changes in circumstances indicate that the carrying amount may not be realizable. If an evaluation is required, the estimated future undiscounted cash flows associated with the asset are compared to the asset’s carrying amount to determine if an impairment of such asset is necessary. The effect of any impairment would be to expense the difference between the fair value of such asset and its carrying value. Based on the Company’s analysis, there were no material impairment charges during the three years ended December 31, 2009.
69
Table of Contents
MasTec, Inc.
Notes To Consolidated Financial Statements - continued
Note 10 - Debt
Debt is comprised of the following at December 31, 2009 and 2008 (in thousands):
| 2009 | 2008 | |||||||
| Revolving credit facility |
$ | — | $ | 42,468 | ||||
| 7.625% senior notes due February 2017 |
150,000 | 150,000 | ||||||
| 4% senior convertible notes due June 2014 |
115,000 | — | ||||||
| 4.25% senior convertible notes due December 2014 |
100,000 | — | ||||||
| 8% convertible notes due December 2013 |
— | 55,000 | ||||||
| 7.05% equipment term loan due in installments through 2013 |
16,177 | 20,243 | ||||||
| Capital lease obligations |
36,171 | 11,013 | ||||||
| Notes payable for equipment, at interest rates up to 9%, due in installments through the year 2013 |
21,048 | 25,614 | ||||||
| Total debt |
438,396 | 304,338 | ||||||
| Less current maturities |
(28,473 | ) | (16,884 | ) | ||||
| Long-term debt |
$ | 409,923 | $ | 287,454 | ||||
Revolving Credit Facility
In November 2009, the Company entered into an amendment to our senior secured credit facility, expiring May 10, 2013, referred to as the Credit Facility, pursuant to which the lenders consented to the Company’s acquisition of Precision. Under the amendment, the lenders’ consent to the Company’s acquisition of Precision was conditioned upon our raising a minimum of $75 million in financing. Additionally, the amendment provided that interest on outstanding balances on the Credit Facility accrues at rates based, at the Company’s option, on the agent bank’s base rate plus a margin of between 1.25% and 1.75%, or at the LIBOR rate plus a margin of 2.25% and 3.00%, depending on certain financial thresholds.
The Company also entered into an amendment in June 2009 to the Credit Facility. The June amendment provided the Company with the ability to repay the $55 million 8% Wanzek convertible notes with the proceeds of the $115 million 4% senior convertible notes that were issued in June 2009. Pursuant to the June amendment, the unused line fee for the Credit Facility has been increased to a range between 0.5% to 0.75% per annum based on usage. Under a previous amendment effective July 29, 2008, the Credit Facility has a maximum amount of available borrowing of $210 million, subject to certain restrictions. The maximum available borrowing may be increased to $260 million if certain conditions are met.
As in the past, the amount the Company can borrow at any given time is based upon a formula that takes into account, among other things, eligible billed and unbilled accounts receivable, equipment, real estate and eligible cash collateral, which can result in borrowing availability of less than the full amount of the Credit Facility. At December 31, 2009 and 2008, net availability under the Credit Facility totaled $89.8 million and $82.2 million, respectively, net of outstanding standby letters of credit aggregating $79.8 million and $82.4 million in each period, respectively. These letters of credit mature at various dates and most have automatic renewal provisions subject to prior notice of cancellation. The Credit Facility is collateralized by a first priority security interest in substantially all of our assets and the assets of our wholly-owned subsidiaries and a pledge of the stock of certain of our operating subsidiaries. At December 31, 2009 the Company did not have an outstanding balance on the Credit Facility. At December 31, 2008, the Company’s outstanding balance was $42.5 million. Interest under the Credit Facility accrues at variable rates based, at the Company’s option, on the agent bank’s base rate (as defined in the Credit Facility) plus a margin of between 1.25% and 1.75%, or at the LIBOR rate plus a margin of between 2.25% and 3.0%, depending on certain financial thresholds. At December 31, 2009, the margin over LIBOR was 2.5% and the margin over the base rate was 1.25%. The Credit Facility includes an unused facility fee ranging from 0.5% to 0.75% based on usage.
The Credit Facility contains customary events of default (including cross-default) provisions and covenants related to the Company’s operations that prohibit, among other things, making investments and acquisitions in excess of specified amounts, incurring additional indebtedness in excess of specified amounts, creating liens against our assets, prepaying subordinated indebtedness, making acquisitions in excess of specified amounts, and engaging in certain mergers or combinations without the prior written consent of the lenders. The Credit Facility also limits our ability to make certain distributions or pay dividends. In addition, the Company is required to maintain a minimum fixed charge coverage ratio of 1.2 to 1.0, as defined in the Credit Facility. Any deterioration in the quality of billed and unbilled receivables, reduction in the value of the Company’s equipment or an increase in the Company’s lease expense related to real estate would reduce availability under the Credit Facility. At December 31, 2009, the Company was in compliance with all provisions and covenants of the Credit Facility.
70
Table of Contents
MasTec, Inc.
Notes To Consolidated Financial Statements - continued
Senior Notes
As of December 31, 2009, $150.0 million of MasTec’s 7.625% senior notes due in February 2017, with interest due semi-annually were outstanding. The notes contain default (including cross-default) provisions and covenants restricting many of the same transactions as under MasTec’s Credit Facility. The indenture which governs MasTec’s senior notes allows MasTec to incur additional indebtedness to the extent that its fixed charge coverage ratio, as defined, is at least 2:1. If the fixed charge coverage ratio is less than 2:1, then MasTec is still permitted to incur the following additional indebtedness among others: credit facilities under a defined threshold, renewals to existing debt permitted under the indenture, capital lease obligations up to 5% of MasTec’s consolidated net assets, plus an additional $50 million of indebtedness at any time the senior notes remain outstanding. The senior notes are guaranteed by all of MasTec’s operating subsidiaries. At December 31, 2009, the Company was in compliance with all the provisions and covenants of the 7.625% senior notes.
Senior Convertible Notes
In November 2009, the Company issued $100 million of 4.25% senior convertible notes due December 15, 2014 in a private placement. The senior convertible notes bear interest at a rate of 4.25% per year, payable semi-annually in arrears, on June 15 and December 15 of each year, commencing on June 15, 2010. On or prior to December 12, 2014, holders may convert their notes into shares of MasTec common stock initially at a conversion rate of 64.6162 shares of the Company’s common stock per $1,000 principal amount of notes, which represents an initial conversion price of approximately $15.48 per share, subject to customary anti-dilution adjustment terms for these types of notes. Approximately $3.7 million in financing costs were incurred in connection with the issuance of these notes. These deferred financing costs are included in other assets in the consolidated balance sheet and are being amortized over the term of the notes. The proceeds of the 4.25% senior convertible notes were used to fund the acquisition of Precision and for general corporate purposes.
In June 2009, the Company issued $115 million of 4% senior convertible notes due June 15, 2014 in a registered offering. The 4% senior convertible notes bear interest at a rate of 4% per year, payable semi-annually in arrears, on June 15 and December 15 of each year, commencing on December 15, 2009. On or prior to June 13, 2014, holders may convert their notes into shares of MasTec common stock initially at a conversion rate of 63.4417 shares of the Company’s common stock per $1,000 principal amount of notes, which represents an initial conversion price of approximately $15.76 per share, subject to customary anti-dilution adjustment terms for these types of notes. Approximately $5.3 million in financing costs were incurred in connection with the issuance of these notes. These deferred financing costs are included in other assets in the consolidated balance sheet and are being amortized over the term of the notes.
The proceeds of the 4% senior convertible notes were used to repay the $55 million of 8% convertible notes issued in connection with the Wanzek acquisition, convertible at $12.00 per share, as well as the outstanding balance on the Credit Facility of approximately $20 million in June 2009. The remaining net proceeds were used for working capital, future acquisitions of businesses and general corporate purposes.
The 4.25% and 4.0% senior convertible notes are guaranteed by substantially all of the Company’s operating subsidiaries. There are no financial covenants on these notes.
At December 31, 2009, we were in compliance with all provisions and covenants of the indenture governing our senior convertible notes.
Convertible Notes
As described in Note 4 – Acquisitions, in connection with MasTec’s acquisition of Wanzek, MasTec issued an 8% convertible note in the principal amount of $55 million due December 2013 with interest payments payable in April, August, and December of each year, commencing in April 2009 and convertible at the holder’s election at a conversion price of $12 per share. The 8% convertible note was repaid in June 2009 with the proceeds of the Company’s 4% senior convertible notes.
Equipment Term Loan
In connection with the acquisition of Pumpco (see Note 4 - Acquisitions), MasTec entered into an equipment term loan in the aggregate principal amount of $22.5 million with an interest rate of 7.05%, payable in sixty monthly installments, and maturing in 2013. This loan is secured by most of Pumpco’s existing equipment and guaranteed by MasTec. Proceeds from this loan were used to pay off $8.7 million of Pumpco’s indebtedness with the remaining balance used to pay a portion of the acquisition purchase price. There are no financial covenants on this loan.
71
Table of Contents
MasTec, Inc.
Notes To Consolidated Financial Statements - continued
Other Acquisition Debt
In connection with the acquisition of Nsoro (see Note 4 - Acquisitions), MasTec assumed approximately $12 million in indebtedness, which was subsequently paid off during the third quarter. In connection with the acquisition of Precision, we assumed approximately $34 million in indebtedness for equipment debt and capital lease obligations. There are no financial covenants associated with the acquisition debt described above.
Contractual Maturities of Debt Obligations
The following table summarizes the contractual maturities of MasTec’s debt obligations as of December 31, 2009 (in thousands):
| 2010 |
28,473 | ||
| 2011 |
18,113 | ||
| 2012 |
12,324 | ||
| 2013 |
10,131 | ||
| 2014 |
219,355 | ||
| Thereafter |
150,000 | ||
| Total |
$ | 438,396 | |
Capital Leases
MasTec enters into agreements that provide financing for various machinery and equipment. Leases meeting certain criteria are capitalized, with the related asset being recorded in property and equipment and an offsetting amount recorded as a liability. These capital leases are non-cash transactions and, accordingly, have been excluded from the consolidated statements of cash flows. As of December 31, 2009, MasTec had $36.1 million in total indebtedness relating to the capital leases, of which $22.4 million was considered long-term.
Note 11 - Lease Commitments
MasTec has operating lease agreements for premises and equipment that expire on various dates. The operating lease agreements are subject to escalation. Rent expense from continuing operations for the years ended December 31, 2009, 2008 and 2007 was approximately $71.7 million, $57.6 million and $48.1 million, respectively.
MasTec also has capital lease agreements for equipment that expire on various dates.
Minimum future lease commitments under non-cancelable operating leases and future minimum capital lease payments, including the effect of escalation clauses in effect at December 31, 2009 were as follows (in thousands):
| Operating Leases |
Capital Leases |
||||||
| 2010 |
$ | 25,221 | $ | 15,308 | |||
| 2011 |
14,700 | 9,118 | |||||
| 2012 |
9,695 | 4,980 | |||||
| 2013 |
6,237 | 6,303 | |||||
| 2014 |
3,635 | 4,024 | |||||
| Thereafter |
3,689 | — | |||||
| Total minimum lease payments |
$ | 63,177 | 39,733 | ||||
| Less amounts representing interest |
(3,562 | ) | |||||
| Total capital lease obligations, net of interest |
36,171 | ||||||
| Less current portion |
(13,776 | ) | |||||
| Long term portion of capital lease obligations, net of interest |
$ | 22,395 | |||||
For operating leases with purchase options, the option to purchase equipment is at estimated fair market value. MasTec has non-cancelable subleases for certain capital leases which are recorded in other assets.
72
Table of Contents
MasTec, Inc.
Notes To Consolidated Financial Statements - continued
Note 12 – Transactions in the Company’s Common Stock
In connection with MasTec’s acquisition of Wanzek on December 16, 2008, as described in Note 4 - Acquisitions, MasTec issued 7,500,000 shares of its common stock to the sellers of Wanzek, which were valued at $59.3 million based on the average market price five days before and after the date the terms of the acquisition were agreed to and announced.
Note 13 – Stock-Based Compensation Plans
The Company has five stock-based compensation plans with stock options and restricted stock grants outstanding as of December 31, 2009: the 1994 Stock Incentive Plan (the “1994 Plan”), the 1994 Stock Option Plan for Non-Employee Directors (the “Directors’ Plan”), the 1999 Non-Qualified Employee Stock Option Plan (the “Non-Qualified Plan”), the 2003 Employee Stock Incentive Plan as amended (the “2003 Plan”) and the Amended and Restated 2003 Stock Incentive Plan for Non-Employees as amended (the “2003 Non-Employee Plan”) and individual option and restricted stock agreements. Typically, options under these plans are granted at fair market value at the date of grant, vest between one to five years after grant, and terminate no later than 10 years from the date of grant. The 2003 Non-Employee Plan was adopted in April 2003 and authorized granting of restricted stock to non-employees. The 1994 Plan and the Directors Plan expired in 2004 and no future stock options can be granted under these plans. In addition, the 1997 Non-Qualified Employee Stock Purchase Plan allows eligible employees to purchase MasTec’s common stock through payroll deductions or in a lump sum at a 15% discount from fair market value. The amount of compensation expense related to these employee stock purchases is immaterial.
Under these plans, there were a total of 3,819,248 options and/or restricted shares available for grant at December 31, 2009. The total stock-based compensation expense recorded for the years ended December 31, 2009, 2008 and 2007 was $3.0 million, $3.8 million and $5.5 million, respectively.
Stock Options
The Company granted options to purchase its common stock to its employees and members of the Board of Directors and affiliates under various stock option plans at no less than the fair market value of the underlying stock on the date of grant. These options are granted for a term not exceeding ten years and are generally forfeited in the event the employee or director terminates his or her employment or relationship with the Company or one of its affiliates. All option plans contain anti-dilutive provisions that require the adjustment of the number of shares of common stock represented by each option for any stock splits or dividends.
The following is a summary of stock option transactions during the year ended December 31, 2009:
| Stock Options |
Weighted Average Exercise Price |
Weighted Average Remaining Contractual Life (years) |
Aggregate Intrinsic Value Unexercised in-the-Money Options (in millions) | ||||||||
| Options outstanding January 1, 2009 |
4,610,527 | $ | 12.69 | ||||||||
| Granted |
— | ||||||||||
| Exercised |
(381,814 | ) | 7.74 | ||||||||
| Canceled/forfeited |
(1,353,044 | ) | 18.92 | ||||||||
| Options outstanding December 31, 2009 |
2,875,669 | $ | 10.42 | 4.93 | $ | 7.5 | |||||
| Options exercisable December 31, 2009 |
2,855,669 | $ | 10.41 | 4.93 | $ | 7.4 | |||||
73
Table of Contents
MasTec, Inc.
Notes To Consolidated Financial Statements - continued
The Company uses the Black-Scholes-Merton (Black-Scholes) option pricing model to determine the fair value of stock option awards. The Company has not granted any stock options since 2006. The weighted-average grant date fair value of options granted during 2006 was $8.45, determined using the following assumptions:
| 2006 | ||
| Expected term-employees |
4.2 – 7 years | |
| Expected term-executives |
5.7 – 7.7 years | |
| Volatility |
40% – 65% | |
| Risk-free interest rate |
4.6% – 4.9% | |
| Dividends |
None | |
| Forfeiture rate |
7.5% |
As of December 31, 2009, there was less than $0.1 million of unrecognized compensation expense related to unvested outstanding stock options which is expected to be recognized over a weighted-average period of one year. The total intrinsic value of options exercised during the years ended December 31, 2009, 2008 and 2007 was $1.6 million, $2.7 million and $6.1 million, respectively.
Restricted Stock
MasTec grants restricted stock which is valued based on the market price of MasTec common stock on the date of grant. Compensation expense arising from restricted stock grants with graded vesting is recognized using the ratable method (an accelerated method of expense recognition) over the vesting period. Those shares issued with cliff vesting are amortized on a straight line basis over the vesting period. Unearned compensation for performance-based options and restricted stock is shown as a reduction of shareholders’ equity in the consolidated balance sheets. Total unearned compensation related to restricted stock grants as of December 31, 2009 is $5.3 million, which is expected to be recognized over a weighted-average period of 3 years. The total fair value of restricted shares vested during the years ended December 31, 2009, 2008 and 2007 was $0.7 million, $0.8 million and $1.6 million, respectively.
| Restricted Shares |
Weighted Average Grant-Date Fair Value | |||||
| Non-vested restricted stock, January 1, 2009 |
953,309 | $ | 8.49 | |||
| Granted |
176,774 | $ | 12.04 | |||
| Vested |
(61,524 | ) | $ | 12.17 | ||
| Forfeited |
(64,500 | ) | $ | 7.06 | ||
| Non-vested restricted stock, December 31, 2009 |
1,004,059 | $ | 8.98 | |||
Note 14 - Retirement Plans
MasTec has a 401(k) plan covering all eligible employees. Subject to certain dollar limits, eligible employees may contribute up to 75% of their pre-tax annual compensation to the 401(k) plan. MasTec matches 100% of the employee’s contribution up to 1% of the employee’s salary, payable quarterly in common shares of MasTec. During 2009 and 2008, MasTec made matching contributions of approximately $400,000 and $387,000, respectively.
In 2008, MasTec also began offering a deferred compensation plan to its highly compensated employees. These employees are allowed to contribute a percentage of their pre-tax annual compensation to the deferred compensation plan. In addition, under the deferred compensation plan, MasTec matches 100% of the employee’s contribution up to 1% of the employee’s salary. MasTec’s matching contribution is payable quarterly in common shares of MasTec stock. During 2009 and 2008, MasTec made matching contributions of $64,000 and $20,000, respectively.
As a result of the acquisition of Precision, MasTec now participates with other companies in multi-employer pension plans and is required to make contributions to these plans. The Employee Retirement Income Security Act of 1974, as amended by the Multi-Employer Pension Plan Amendments Act of 1980, imposes certain liabilities upon employers who are contributors to a multi-employer plan in the event of the employer’s withdrawal from, or upon termination of, such plan. The Company does not have any current plans to withdraw from these plans, and therefore, it is not possible to ascertain the net assets and actuarial present value of the plans’ unfunded vested benefits allocable to any MasTec subsidiary, or the amounts, if any, for which any MasTec subsidiary may be contingently liable, if such a withdrawal from a plan were to occur in the future. In addition, the Pension Protection Act of 2006 added new funding rules generally applicable to plan years beginning after 2007 for multi-employer plans that are classified as “endangered,” “seriously endangered,” or “critical” status. For a plan in critical status, additional required contributions and benefit reductions apply; however, MasTec has not been notified of any multi-employer plan to which it contributes being in “critical” status. Contributions to all union multi-employer pension plans by MasTec were approximately $4.5 million for the year ended December 31, 2009.
74
Table of Contents
MasTec, Inc.
Notes To Consolidated Financial Statements - continued
Note 15 - Income Taxes
The provision (benefit) for income taxes from continuing operations consists of the following (in thousands):
| 2009 | 2008 | 2007 | |||||||||
| Current: |
|||||||||||
| Federal |
$ | 1,073 | $ | 128 | $ | (103 | ) | ||||
| Foreign |
— | — | — | ||||||||
| State and local |
1,022 | 870 | — | ||||||||
| 2,095 | 998 | (103 | ) | ||||||||
| Deferred: |
|||||||||||
| Federal |
5,479 | (128 | ) | 103 | |||||||
| Foreign |
— | — | — | ||||||||
| State and local, net of valuation provisions |
811 | — | — | ||||||||
| 6,290 | (128 | ) | 103 | ||||||||
| Provision for income taxes |
$ | 8,385 | $ | 870 | $ | — | |||||
The tax effects of significant items comprising our net deferred tax asset as of December 31, 2009 and 2008 are as follows (in thousands):
| 2009 | 2008 | |||||||
| Current: |
||||||||
| Deferred tax assets: |
||||||||
| Bad debts |
$ | 3,408 | $ | 4,447 | ||||
| Accrued self insurance |
3,534 | 4,711 | ||||||
| Operating loss and tax credit carry forward |
50,849 | 18,189 | ||||||
| Other |
11,165 | 13,299 | ||||||
| Valuation allowance |
(3,416 | ) | (18,189 | ) | ||||
| Subtotal |
65,540 | 22,457 | ||||||
| Deferred tax liabilities: |
||||||||
| Accounts receivable retainage |
5,476 | 11,229 | ||||||
| Other |
4,058 | 5,283 | ||||||
| Total deferred tax liabilities |
9,534 | 16,512 | ||||||
| Net current deferred tax asset |
$ | 56,006 | $ | 5,945 | ||||
| Noncurrent: |
||||||||
| Deferred tax assets: |
||||||||
| Non-compete |
$ | 1,167 | $ | 2,259 | ||||
| Accrued self insurance |
8,247 | 10,994 | ||||||
| Operating loss and tax credit carry forward |
7,161 | 59,250 | ||||||
| Other |
8,897 | 7,705 | ||||||
| Valuation allowance |
(1,989 | ) | (6,003 | ) | ||||
| Subtotal |
23,483 | 74,205 | ||||||
| Deferred tax liabilities: |
||||||||
| Property and equipment |
28,390 | 18,428 | ||||||
| Other |
24,727 | 14,985 | ||||||
| Goodwill |
19,641 | 15,627 | ||||||
| Total deferred tax liabilities |
72,758 | 49,040 | ||||||
| Net noncurrent deferred tax asset |
$ | (49,275 | ) | $ | 25,165 | |||
| Net deferred tax asset |
$ | 6,731 | $ | 31,110 | ||||
75
Table of Contents
MasTec, Inc.
Notes To Consolidated Financial Statements - continued
At December 31, 2009, MasTec had approximately $120.6 million of net operating loss carryforwards for U.S. federal income tax purposes that expire beginning in 2023.
In assessing the ability to realize the deferred tax assets, management considers whether it is more likely than not that some portion or all of the deferred tax assets will not be realized. The ultimate realization of deferred tax assets is dependent upon the generation of future taxable income during the periods in which these temporary differences become deductible. Management considers the projected future taxable income and prudent and feasible tax planning strategies in making this assessment. As of December 31, 2009 and 2008, valuation allowances of $5.4 million and $24.2 million have been recorded, respectively.
A reconciliation of U.S. statutory federal income tax rate related to pretax income (loss) from continuing operations to the effective tax rate for the years ended December 31 is as follows:
| 2009 | 2008 | 2007 | |||||||
| U.S. statutory federal rate applied to pretax income |
35.0 | % | 35.0 | % | 35.0 | % | |||
| State and local income taxes |
4.1 | 2.0 | 2.6 | ||||||
| Non-deductible expenses |
1.5 | 2.0 | 1.4 | ||||||
| Effect of non-deductible expenses |
— | — | — | ||||||
| Change in state tax rate |
0.5 | ||||||||
| Other |
0.2 | (0.8 | ) | 0.4 | |||||
| Valuation allowance for deferred tax assets |
(30.7 | ) | (36.9 | ) | (39.4 | ) | |||
| Effective income tax rate |
10.6 | % | 1.3 | % | 0.0 | % | |||
Under ASC 740, an entity may only recognize or continue to recognize tax positions that meet a “more likely than not” threshold. In the ordinary course of business there is inherent uncertainty in quantifying our income tax positions. The Company assesses its income tax positions and records tax benefits for all years subject to examination based on management’s evaluation of the facts, circumstances and information available at the reporting date. For those tax positions where it is more likely than not that a tax benefit will be sustained, the Company has recognized the largest amount of tax benefit with a greater than 50% likelihood of being realized upon ultimate settlement with a taxing authority that has full knowledge of all relevant information. For those income tax positions where it is not more likely than not that a tax benefit will be sustained, no tax benefit has been recognized in the Company’s financial statements. Management believes that the Company has not taken material tax positions that would be deemed to be “uncertain,” therefore, the Company has not established a liability for uncertain positions for the year ended December 31, 2009.
Note 16 - Operations by Geographic Areas and Segments
MasTec manages its business on a project basis and the Company operates in one reportable segment as a specialty trade contractor. MasTec provides services to its customers in the communications, utilities and government industries. These services are provided by MasTec’s various subsidiaries throughout the United States and all of the Company’s subsidiaries have been aggregated into one reporting segment due to their similar economic characteristics, processes, service offerings and customers. Revenue for customers in these industries is as follows (in thousands):
| 2009 | 2008 | 2007 | |||||||
| Communications |
$ | 940,107 | $ | 865,519 | $ | 769,375 | |||
| Utilities |
614,149 | 447,197 | 217,739 | ||||||
| Government |
69,246 | 65,947 | 50,665 | ||||||
| $ | 1,623,502 | $ | 1,378,663 | $ | 1,037,779 | ||||
The Company has recently made several acquisitions and management continues to evaluate these acquisitions for qualification as a reportable segment.
During the year ended December 31, 2009, the Company had limited operations in Mexico in addition to its operations in the United States. Revenues from its Mexican operations totaled $1.2 million for the year ended December 31, 2009. In 2008, the Company operated almost exclusively in the United States.
During the year ended December 31, 2007, MasTec operated in the United States and Canada. In March 2007, MasTec declared its Canadian operations as discontinued. Accordingly, results of operations for all periods presented reflect MasTec’s Canadian business as discontinued.
76
Table of Contents
MasTec, Inc.
Notes To Consolidated Financial Statements - continued
Note 17 - Commitments and Contingencies
Legacy Litigation. MasTec is subject to litigation, some of which dates from the period from 2001 through 2005.
Resolved Legacy Litigation
In 2005, former employees filed a Fair Labor Standards Act (“FLSA”) collective action against MasTec in the Federal District Court in Tampa, Florida, alleging failure to pay overtime wages as required under the FLSA. While MasTec denied the allegations underlying the lawsuit, in October 2007 it agreed to a settlement to avoid significant legal fees, the uncertainty of a jury trial, other expenses and management time that would have to be devoted to protracted litigation. In April 2008, the settlement was approved by the court, and MasTec paid approximately $8.0 million in connection with this settlement in July 2008.
During 2003 and 2004, MasTec provided services to MSE Power Systems on two separate projects in Pennsylvania, New York and Georgia. In 2004, MasTec filed suit against MSE seeking payment and arbitration was held in August 2007. In January 2008, MasTec was awarded a $2.7 million judgment in connection therewith and collected approximately $2.7 million in September 2008.
MasTec filed a lawsuit against Consolidated Edison, Inc., Consolidated Edison Company of New York, Inc. and Con Edison Communications, Inc. (collectively, “Con Edison”) in May 2002 in connection with a telecommunication project MasTec worked on for Telergy, Inc. (“Telergy”). The lawsuit alleged that Con Edison directly interfered with MasTec’s work for Telergy and that this interference resulted in Telergy’s bankruptcy and resulted in Con Edison obtaining MasTec’s work on the Telergy project without paying for it. The matter was settled in December 2009 with the parties releasing each other from liability, and Con Edison agreeing to pay MasTec $6 million, of which $3 million was paid in December 2009. The $3 million remaining is due in December 2014 but it shall be reduced by a certain percentage of any payments received by MasTec for services it performs for Con Edison. MasTec recorded a gain of $2.0 million, net of legal fees, in 2009 in connection with the settlement.
Hugh O’Kane Electric filed a claim against MasTec for subcontract work done in 2001 on a telecommunication project for Telergy in New York. Telergy went bankrupt and did not pay MasTec for this work. In June 2008 MasTec paid approximately $3.4 million to Hugh O’Kane to resolve the dispute.
On January 24, 2008, MasTec entered into a settlement agreement with the buyer of its state Department of Transportation projects and assets to settle warranty, indemnification and other claims primarily relating to work it had performed on the state Department of Transportation projects MasTec sold. Under the terms of the settlement agreement, MasTec paid $6 million in cash, which was previously accrued, and obtained from the buyer a covenant not to sue and general release from nearly all obligations owed by MasTec to the buyer under the purchase agreement, including warranty and other indemnification obligations.
During 2003, MasTec contracted to construct a natural gas pipeline for Coos County, Oregon (“Coos County”). In February 2004 MasTec sued Coos County and Coos County subsequently counterclaimed. In April 2008, MasTec entered into a settlement agreement to settle its dispute with Coos County, which provided for $8.7 million in payments to Coos County, which was paid in two installments in March and June of 2009. The settlement agreement was subject to MasTec not being penalized greater than $1.5 million in the Corps of Engineers case. In February 2009, the Federal District Court entered a judgment in favor of the Corps of Engineers in the amount of $1.5 million thus making the settlement effective.
In March 2006, the United States Army Corps of Engineers (“Corps of Engineers”) brought a complaint in a federal district court against MasTec for environmental violations in connection with the above referenced project in Coos County and sought damages in excess of $16 million. The matter went to trial in February 2008, and in February 2009, the Federal District Court entered a judgment in favor of the Corps of Engineers in the amount of $1.5 million. The Corps of Engineers filed a notice of appeal but subsequently dismissed its appeal in September 2009. The judgment was paid in January 2010.
In June 2005, MasTec posted a $2.3 million bond in order to pursue the appeal of a $2.0 million final judgment entered against MasTec for damages plus attorney’s fees resulting from a break in a Citgo Products Pipeline Company (“Citgo”) pipeline that occurred in 1999. In October 2008, the appellate court reduced the total award to $1.9 million, and MasTec requested a rehearing, which was denied by the appellate court. In February 2009, the parties settled the dispute for $1.6 million. A portion of the total award will be reimbursed by insurance.
77
Table of Contents
MasTec, Inc.
Notes To Consolidated Financial Statements - continued
Outstanding Legacy Litigation
In April 2006, MasTec settled, without payment to the plaintiffs by MasTec, several complaints for purported securities class actions filed against MasTec and certain officers in the second quarter of 2004. As part of the settlement, MasTec’s excess insurance carrier retained rights to seek reimbursement of up to $2.0 million from MasTec based on its claim that notice was not properly given under the policy. Upon exhausting MasTec’s legal recourse, MasTec paid the insurance carrier $2.0 million to resolve the dispute. MasTec is now vigorously pursuing claims of up to $5 million against Aon Risk Services of Florida, Inc., the insurance broker, for breach of contract and breach of fiduciary duty for the losses arising from a denial of insurance coverage.
MasTec provided telecommunication infrastructure services to Adesta Communications, Inc. (“Adesta”) in 2000 and 2001. Adesta filed for bankruptcy in 2001. Adesta’s bankruptcy trustee sold Adesta’s assets in the trust, and MasTec is waiting for a distribution from that trust. Based on MasTec’s current understanding of the expected distribution, MasTec has reduced its receivable to approximately $1.0 million, which is recorded in other current assets on its consolidated balance sheet at December 31, 2009.
The labor union representing the workers of Sistemas e Instalaciones de Telecomunicación S.A. (“Sintel”), a former MasTec subsidiary, filed a claim that initiated an investigative action with the Audiencia Nacional, a Spanish federal court, against Telefonica and dozens of other defendants including former officers and directors of MasTec (including a current director) relating to Sintel’s 2000 bankruptcy. The union alleged Sintel and its creditors were damaged in the approximate amount of 300 million euros (approximately $430 million as of December 31, 2009). In June 2009, the Audiencia Nacional issued an order that the trial phase was commencing against the MasTec defendants and other defendants. The MasTec defendants believe the claims are frivolous and are vigorously defending the matter. MasTec will vigorously defend any potential liability. MasTec was not directly involved in any of the transactions which the Spanish prosecutor alleges led to Sintel’s bankruptcy. MasTec’s directors’ and officers’ insurance carrier has agreed to fund legal expenses under a reservation of rights. The amount of loss to MasTec, if any, relating to this matter cannot presently be determined.
Resolved Litigation
In July 2008, MasTec filed a claim in arbitration against its investment advisor (“Investment Advisor”) with the Financial Industry Regulatory Authority, Inc. (“FINRA”) for negligence, unsuitability, negligent supervision, negligent misrepresentations and omissions of material fact, breach of fiduciary duty, breach of contract and violations of state securities laws in connection with the sale by the Investment Advisor to MasTec of certain auction rate securities in the aggregate principal amount of $33.7 million. MasTec sought, among other relief, rescission of the purchase of the auction rate securities and the Investment Advisors denied MasTec’s claims. In October 2009, MasTec settled its claim against the Investment Advisor that sold MasTec the auction rate securities. The investment advisor paid MasTec a one-time payment of $7.0 million, before legal expenses, which was recorded in other income, and MasTec retained the auction rate securities.
In addition to the matters discussed above, MasTec is also subject to a variety of legal cases, claims and other disputes that arise from time to time in the ordinary course of its business. MasTec cannot provide assurance that it will be successful in recovering all or any of the potential damages it has claimed or in defending claims against it.
Accrued aggregate liabilities related to the matters described above and other litigation matters amounted to $2.2 million at December 31, 2009.
Other Commitments and Contingencies. MasTec is required to provide payment and performance bonds for some of the Company’s contractual commitments related to projects in process. At December 31, 2009, the cost to complete projects secured by our $598.7 million in performance and payment bonds are outstanding was $69.9 million.
Included in the $598.7 million of outstanding performance and payment bonds at December 31, 2009 are $159.7 million of performance and payment bonds relating to the sale of the state Department of Transportation related projects and assets in 2007. In connection with the sale of these assets, MasTec remains contingently liable for certain obligations, including liabilities associated with claims on these performance and payment bonds. The buyer of the Department of Transportation related projects and assets filed for bankruptcy protection in October 2009 which increases the likelihood that MasTec will be required to assume certain obligations associated with these projects. MasTec estimates that the remaining cost to complete these state Department of Transportation projects at December 31, 2009 was $0.7 million.
78
Table of Contents
MasTec, Inc.
Notes To Consolidated Financial Statements - continued
Certain of MasTec’s subsidiaries are party to collective bargaining agreements with unions representing certain of their employees. The agreements require such subsidiaries to pay specified wages and provide certain benefits to their union employees. These agreements expire at various times and have typically been renegotiated and renewed on terms that are similar to the ones contained in the expiring agreements.
Note 18 - Concentrations of Risk
The Company is subject to certain risk factors, including, but not limited to risks related to economic downturns in the industries it serves, collectibility of receivables, competition within its industry, the nature of its contracts, which do not obligate its customers to undertake any infrastructure projects and may be canceled on short notice, acquisition integration and financing, seasonality, availability of qualified employees, recoverability of goodwill, and potential exposures to environmental liabilities.
The Company has approximately 360 customers as of December 31, 2009, which include some of the largest and most prominent companies in the communications, utilities and government sectors. The Company’s customers include public and private energy providers incumbent local exchange carriers, broadband and satellite operators, long distance carriers, financial institutions and wireless service providers.
The Company grants credit, generally without collateral, to its customers. Consequently, the Company is subject to potential credit risk related to changes in business and economic factors. However, MasTec generally has certain lien rights on that work and concentrations of credit risk are limited due to the diversity of the customer base. The Company believes its billing and collection policies are adequate to minimize potential credit risk. During the year ended December 31, 2009, DIRECTV® and AT&T each accounted for 30% and 16% of total revenue, respectively. During the year ended December 31, 2008, DIRECTV® and AT&T accounted for 34% and 12% of total revenue, respectively. During the year ended December 31, 2007, DIRECTV® accounted for 44% of total revenue. No other customers accounted for more than 10% of revenues during the three years ended December 31, 2009.
The Company maintains an allowance for doubtful accounts for estimated losses resulting from the inability of customers to make required payments. Management analyzes the aging of account balances, historical bad debt experience, customer concentrations, customer credit-worthiness, customer financial condition and credit reports, the availability of mechanics and other liens, the existence of payment bonds and other sources of payment, and current economic trends when evaluating the adequacy of the allowance for doubtful accounts. If judgments regarding the collectibility of accounts receivables were incorrect, adjustments to the allowance may be required, which would reduce profitability. As of December 31, 2009, the Company had remaining receivables from customers undergoing bankruptcy reorganization totaling $1.6 million net of $0.6 million in specific reserves. As of December 31, 2008, the Company had remaining receivables from customers undergoing bankruptcy reorganization totaling $1.6 million, net of $0.3 million in specific reserves. Based on the analytical process described above, management believes that it will recover the net amounts recorded. The Company maintains an allowance for doubtful accounts of $10.2 million and $11.6 million as of December 31, 2009 and December 31, 2008, respectively, for both specific customers and as a reserve against other past due balances. Should additional customers file for bankruptcy or experience difficulties, or should anticipated recoveries in existing bankruptcies and other workout situations fail to materialize, the Company could experience reduced cash flows and losses in excess of the current allowance.
Note 19 - Related Party Transactions
MasTec purchases, rents and leases equipment used in its business from a number of different vendors, on a non-exclusive basis, including Neff Corp. (“Neff”), in which Jorge Mas, Chairman of MasTec’s Board of Directors, and Jose Mas, MasTec’s Chief Executive Officer, were directors and owners of a controlling interest through June 4, 2006. Juan Carlos Mas, the brother of Jorge and Jose Mas, was the Chairman, Chief Executive Officer, a director and a shareholder of Neff until May 31, 2007 when he sold his Neff shares and resigned as its chief executive officer. Juan Carlos Mas remains as chairman of the Neff Board of Directors. During the years ended December 31, 2009, 2008 and 2007, MasTec paid Neff approximately $0.9 million, $0.8 million and $2.4 million, respectively, for equipment purchases, rentals and leases. MasTec believes the amount paid to Neff is equivalent to the payments that would have been made between unrelated parties for similar transactions acting at arm’s length.
During the years ended December 31, 2009, 2008 and 2007, MasTec paid $48,000, $48,000 and $76,000 to Irma S. Mas, the mother of Jorge Mas and Jose Mas, for the lease of certain property located in Florida.
79
Table of Contents
MasTec, Inc.
Notes To Consolidated Financial Statements - continued
During the years ended December 31, 2009, 2008 and 2007, MasTec had an arrangement with a customer whereby MasTec leased employees to that customer and charged approximately $426,000, $390,000 and $430,000, respectively, to the customer in each year. As of December 31, 2009 and 2008, approximately $832,000 and $659,000, respectively, of related receivables are included within other current assets. The Company also has an agreement with the customer whereby the Company provides satellite communication services. During the years ended December 31, 2009, 2008 and 2007, revenues relating to this customer were approximately $887,000, $583,000 and $274,000, respectively. Jorge Mas and Jose Mas are minority owners of this customer. As December 31, 2009 and 2008, approximately $445,000 and $348,000, respectively, is included as trade accounts receivable from this customer.
The Company charters aircraft from a third party who leases two of its aircraft from entities in which Jorge Mas and Jose Mas have an ownership interest. The Company paid this unrelated chartering company approximately $475,000, $341,000 and $753,000 during the years ended December 31, 2009, 2008 and 2007, respectively.
Effective as of August 27, 2002, MasTec and Jorge Mas entered into a split dollar agreement, as subsequently amended, wherein MasTec agreed to pay the premiums due on two life insurance policies with an aggregate face amount of $50.0 million. Mr. Mas and his spouse are the insured under the policies. Under the terms of this agreement, MasTec is the sole owner and beneficiary of the policies and is entitled to recover the greater of (i) all premiums it pays on the policies plus interest equal to four percent, compounded annually, or (ii) the aggregate cash value of the life insurance policy immediately before the death of the insureds. The remainder of the policies’ proceeds will be paid in accordance with Mr. Mas’ designations. MasTec will make the premium payments until the agreement is terminated, which occurs upon any of the following events: (i) bankruptcy, or dissolution of MasTec, or (ii) a change of control of MasTec.
Additionally, effective as of September 13, 2002, MasTec and Jorge Mas entered into a second split dollar agreement, as subsequently amended, wherein the Company agreed to pay the premiums due on a life insurance policy with a face amount of $80 million, $60 million of which is subject to the agreement and the remaining $20 million is deemed to be key-man insurance payable to MasTec and falls outside of the agreement. Jorge Mas is the insured under this policy. Under the terms of this agreement, MasTec is the sole owner and beneficiary of the policy and is entitled to recover the greater of (i) all premiums it pays on the portion of the policy subject to the agreement, plus interest equal to four percent, compounded annually, or (ii) the aggregate cash value of the life insurance policy immediately before the death of the insured. The Company will make the premium payments until the agreement is terminated, which occurs upon any of the following events: (i) bankruptcy, or dissolution of MasTec, or (ii) a change of control of MasTec. An amount equal to $60 million of the policy’s proceeds will be paid in accordance with Jorge Mas’ designations. Any remainder of the proceeds will be paid to the Company. In 2009, 2008 and 2007, the Company paid approximately $0.6 million, $1.1 million and $1.1 million, respectively, in premiums in connection with the split dollar agreements for Jorge Mas.
On November 1, 2002, MasTec and Jorge Mas entered into a deferred bonus agreement in which the Company agreed to pay Mr. Mas a bonus in the event that the split dollar agreements Mr. Mas had entered into with MasTec were terminated due to a change of control of MasTec. The amount of the bonus is equal to the total premiums made by MasTec under the terms of the split dollar agreements, plus interest of four percent, compounded annually. The bonus is to be paid within 60 days after termination of the split dollar agreement. The deferred bonus agreement was subsequently amended to comply with Section 409A of the Internal Revenue Code.
On October 28, 2009, the three split dollar agreements between Jorge Mas and the Company were restated into a single agreement and the deferred bonus agreements between Jorge Mas and the Company was amended and restated in its entirety. Under the amended and restated split dollar agreement, MasTec remains the sole owner and beneficiary of each of the policies subject to the agreement and upon the death of the insured or insureds under the applicable policy, MasTec is entitled to receive a portion of the death benefit under such policy equal to the greater of (i) all premiums paid by the Company on such policy or (ii) the then cash value of such policy immediately before the death of the insured or insureds, excluding surrender charges. Upon termination of the agreement, Jorge Mas, or in the case of a second to die policy, the second to die of Jorge Mas and his wife, have an option to purchase each policy subject to the agreement for a purchase price equal to the greater of those two amounts. Additionally, the designation of a portion of the policy as key-man insurance was removed, and therefore the entire policy is now subject to the split dollar agreement. The total maximum face amount of the insurance for all policies subject to the split dollar agreement was capped at $200,000,000. The amount of the deferred bonus under the amended and restated deferred bonus agreement is equal to the sum of the following amounts determined with respect to each policy subject to the split dollar agreement: the greater of (i) the total premiums paid by MasTec under such policy or (ii) the then cash value of such policy immediately prior to the change in control, excluding surrender charges. All other material provisions of the split dollar and deferred bonus agreements remain unchanged.
80
Table of Contents
MasTec, Inc.
Notes To Consolidated Financial Statements - continued
Effective as of August 3, 2004, MasTec and Jose Mas entered into a split dollar agreement wherein the Company agreed to pay premiums on a life insurance policy with an aggregate face amount of $11.0 million. Under the terms of the agreement, MasTec is the sole owner and beneficiary of the policy and is entitled to recover the greater of (i) all premiums it pays on the policy plus interest equal to four percent, compounded annually, or (ii) the aggregate cash value of the life insurance policy immediately prior to the death of the survivor of the insured. The remainder of the policy’s proceeds will be paid in accordance with Jose Mas’ designations. MasTec will make the premium payments until the agreement is terminated, which occurs upon any of the following events: (i) bankruptcy, or dissolution of MasTec, or (ii) a change of control of MasTec. As of December 31, 2009, the policy’s premiums have been paid in full. In 2009, 2008 and 2007, the Company paid approximately $150,000, $0 and $150,000, respectively, in premiums in connection with the split dollar agreement for Jose Mas.
On April 3, 2007, MasTec and Jose Mas entered into a deferred bonus agreement in which MasTec agreed to pay Jose Mas a bonus in the event the split dollar agreement Mr. Mas had entered into with MasTec were terminated due to a change of control. The amount of the bonus is equal to the total premium payments made by MasTec under the terms of the split dollar agreements, plus interest of four percent, compounded annually. The bonus is to be paid within 60 days after termination of the split dollar agreement.
On October 28, 2009, the split dollar and deferred bonus agreements between Jose Mas and the Company were amended and restated in their entirety. The amended and restated split dollar agreement provides that one or more life insurance policies may be subject to the agreement. At this time, however, the only policy subject to the agreement is the one acquired pursuant to the original agreement. MasTec remains the sole owner and beneficiary of any policy subject to the agreement, and upon the death of the insured, MasTec is entitled to receive a portion of the death benefit equal to the greater of (i) all premiums paid by the Company on such policy or (ii) the then cash value of such policy immediately before the death of the insured, excluding surrender charges. Upon termination of the agreement, Jose Mas has an option to purchase each policy subject to the agreement for a purchase price equal to the greater of those two amounts. The amount of the deferred bonus under the amended and restated deferred bonus agreement that is payable upon termination of the split dollar agreement is equal to the sum of the following amounts determined with respect to each policy subject to the split dollar agreement: the greater of (i) the total premiums paid by MasTec under the terms of such policy or (ii) the then cash value of such policy immediately prior to the change in control, excluding surrender charges. All other material provisions of the split dollar and deferred bonus agreements remain unchanged.
The Company accounts for these policies under the fair value method and marks to market the value of the policies each period based on their current cash surrender value. The fair value of these policies at December 31, 2009 and 2008 of $8.1 million and $7.8 million, respectively, is included in other assets on the consolidated balance sheets.
In December 2006, MasTec sold a property used in its operations for $3.5 million to an entity whose principal is also a principal of MasTec’s then 51% owned subsidiary. MasTec received a note in the amount of $2.8 million due December 2007, and guaranteed by the principal noted above. Concurrent with the sale of this property, MasTec entered into a month-to-month lease agreement at $25,000 per month. In the second quarter of 2007, MasTec terminated this lease. MasTec recognized a gain on this sale of approximately $2.5 million in the first quarter of 2007. In October of 2007, MasTec collected the amount due on the note receivable of $2.8 million plus accrued interest.
Note 20 – Discontinued Operations
Canadian Operations. In March 2007, after evaluation of short and long term prospects, the Company’s Board of Directors voted to sell substantially all of MasTec’s Canadian operations. During the year ended December 31, 2007, the Company wrote-off $0.4 million in goodwill and recorded a non-cash impairment charge of $0.6 million in connection with the decision to sell substantially all of its Canadian operations. In April 2007, substantially all of the net assets of MasTec’s Canadian operations were sold for approximately $1 million.
The following table summarizes the results of the Canadian operations that are considered to be discontinued for the years ended December 31 (in thousands). No activity was recorded in the year ended December 31, 2009.
| 2008 | 2007 | |||||||
| Revenue |
$ | — | $ | 675 | ||||
| Cost of revenue |
— | (824 | ) | |||||
| Operating and other expenses |
(814 | ) | (1,090 | ) | ||||
| Loss from operations before benefit for income taxes |
(814 | ) | (1,239 | ) | ||||
| Benefit for income taxes |
— | (15 | ) | |||||
| Net loss |
$ | (814 | ) | $ | (1,254 | ) | ||
81
Table of Contents
MasTec, Inc.
Notes To Consolidated Financial Statements - continued
Department of Transportation. On December 31, 2005, after evaluation of short and long term prospects, the Company’s Board of Directors voted to sell substantially all of MasTec’s state Department of Transportation related projects and assets. MasTec recorded impairment charges totaling $2.9 million during the year ended December 31, 2007 related to its state Department of Transportation operations. Effective February 2007, the state Department of Transportation related projects and net assets were sold for $1 million in cash. MasTec agreed to keep certain assets and liabilities related to the state Department of Transportation related projects
On January 24, 2008, MasTec entered into a settlement with the buyer of its state Department of Transportation projects and assets to settle previously disclosed warranty, indemnification and other claims primarily relating to work MasTec had performed on the projects which were sold. Under the terms of the Settlement Agreement, MasTec paid $6 million in cash and obtained a covenant not to sue and general release from nearly all obligations owed by MasTec to the buyer under the purchase agreement including warranty and other indemnification obligations. As a result of the settlement, MasTec recorded a charge of $6 million reflected in its loss from discontinued operations for the year ended December 31, 2007. In October 2009, the buyer filed for bankruptcy protection.
The following table summarizes the results of the discontinued state Department of Transportation operations for the years ended December 31, 2007 (in thousands). No activity was recorded in the years ended December 31, 2008 and 2009.
| 2007 | ||||
| Revenue |
$ | 5,663 | ||
| Cost of revenue |
(6,892 | ) | ||
| Operating and other expenses |
(11,070 | ) | ||
| Net loss |
$ | (12,299 | ) | |
Note 21 - Quarterly Information (Unaudited)
The following table presents unaudited quarterly operating results for the years ended December 31, 2009 and 2008. The Company believes that all necessary adjustments have been included in the amounts stated below to present fairly the quarterly results when read in conjunction with the Consolidated Financial Statements and Notes for the years ended December 31, 2009 and 2008. The quarterly information reflects the results of operations of the Company’s Canadian and state Department of Transportation operations as discontinued operations in all periods for which there was activity.
| 2009 Quarter Ended | 2008 Quarter Ended | |||||||||||||||||||||||||||
| Mar 31 | Jun 30 | Sep 30 | Dec 31 | Mar 31 | Jun 30 | Sep 30 | Dec 31 | |||||||||||||||||||||
| (In thousands, except per share data) | (In thousands, except per share data) | |||||||||||||||||||||||||||
| Revenue |
$ | 342,119 | $ | 387,854 | $ | 397,248 | $ | 496,281 | $ | 261,992 | $ | 305,034 | $ | 397,754 | $ | 413,883 | ||||||||||||
| Income from continuing operations |
$ | 11,929 | $ | 18,991 | $ | 21,644 | $ | 18,183 | $ | 7,936 | $ | 15,821 | $ | 24,296 | $ | 18,549 | ||||||||||||
| Loss from discontinued operations |
$ | — | $ | — | $ | — | $ | — | $ | (155 | ) | $ | (85 | ) | $ | (182 | ) | $ | (392 | ) | ||||||||
| Net income |
$ | 11,929 | $ | 18,991 | $ | 21,644 | $ | 18,183 | $ | 7,781 | $ | 15,736 | $ | 24,114 | $ | 18,157 | ||||||||||||
| Basic net income per share: |
||||||||||||||||||||||||||||
| Continuing operations |
$ | 0.16 | $ | 0.25 | $ | 0.29 | $ | 0.24 | $ | 0.12 | $ | 0.23 | $ | 0.36 | $ | 0.27 | ||||||||||||
| Discontinued operations |
$ | — | $ | — | $ | — | $ | — | $ | — | $ | — | $ | — | $ | (0.01 | ) | |||||||||||
| Total basic net income per share |
$ | 0.16 | $ | 0.25 | $ | 0.29 | $ | 0.24 | $ | 0.12 | $ | 0.23 | $ | 0.36 | $ | 0.26 | ||||||||||||
| Diluted net income per share: |
||||||||||||||||||||||||||||
| Continuing operations |
$ | 0.16 | $ | 0.25 | $ | 0.27 | $ | 0.22 | $ | 0.12 | $ | 0.23 | $ | 0.36 | $ | 0.27 | ||||||||||||
| Discontinued operations |
$ | — | $ | — | $ | — | $ | — | $ | — | $ | — | $ | (0.01 | ) | $ | (0.01 | ) | ||||||||||
| Total diluted net income per share |
$ | 0.16 | $ | 0.25 | $ | 0.27 | $ | 0.22 | $ | 0.12 | $ | 0.23 | $ | 0.35 | $ | 0.26 | ||||||||||||
See Note 4 - Acquisitions for a discussion of acquisitions during each of the three years ended December 31, 2009.
82
Table of Contents
| Item 9. | Changes in and Disagreements with Accountants on Accounting and Financial Disclosure |
None
| Item 9A. | Controls and Procedures |
Evaluation of Disclosure Controls and Procedures. As of the end of the period covered by this Annual Report on Form 10-K, we carried out an evaluation, under the supervision and with the participation of our management, including our Chief Executive Officer and our Chief Financial Officer, of the effectiveness of the design and operation of our disclosure controls and procedures (as defined in Rule 13a-15(e) under the Securities Exchange Act of 1934, as amended (“the Exchange Act”). We maintain disclosure controls and procedures designed to ensure that information required to be disclosed in reports filed under the Exchange Act is recorded, processed, summarized and reported within specified time periods. Disclosure controls and procedures include, without limitation, controls and procedures designed to ensure that information required to be disclosed by us in the reports that we file or submit under the Exchange Act is accumulated and communicated to management, including our Chief Executive Officer and Chief Financial Officer, or persons performing similar functions, as appropriate to allow timely decisions regarding required disclosure.
Our management has designed our disclosure controls and procedures to provide “reasonable assurance” of achieving our control objectives. In designing and evaluating our disclosure controls and procedures, our management recognizes that any controls and procedures, no matter how well designed and operated, can provide only reasonable assurance of achieving the desired control objectives and are subject to certain limitations, including the exercise of judgment by individuals, the difficulty in identifying unlikely future events, and the difficulty in eliminating misconduct completely.
In connection with this annual report on Form 10-K, our Chief Executive Officer and Chief Financial Officer evaluated, with the participation of our management, the effectiveness of our disclosure controls and procedures as of the end of the period covered by this report. Based on management’s evaluation, our Chief Executive Officer and Chief Financial Officer each concluded that our disclosure controls and procedures were effective at the reasonable assurance level as of December 31, 2009.
Management’s Report on Internal Control Over Financial Reporting. Our management is responsible for establishing and maintaining adequate internal control over financial reporting, as such term is defined in Exchange Act Rules 13a-15(f). Under the supervision and with the participation of our management, including our principal executive officer and principal financial officer, we conducted an evaluation of the effectiveness of our internal control over financial reporting based on the framework in Internal Control – Integrated Framework issued by the Committee of Sponsoring Organizations of the Treadway Commission. Our internal control over financial reporting is designed to provide reasonable assurance to management and to our Board of Directors regarding the reliability of financial reporting and the preparation and fair presentation of financial statements for external purposes in accordance with generally accepted accounting principles. MasTec’s internal control over financial reporting includes those policies and procedures that:
(i) pertain to the maintenance of records that, in reasonable detail, accurately and fairly reflect the transactions and dispositions of our assets;
(ii) provide reasonable assurance that transactions are recorded as necessary to permit preparation of financial statements in accordance with generally accepted accounting principles, and that receipts and expenditures are being made only in accordance with authorizations of management and directors of MasTec; and
(iii) provide reasonable assurance regarding prevention or timely detection of unauthorized acquisition, use or disposition of our assets that could have a material effect on the financial statements.
In connection with this annual report on Form 10-K, our Chief Executive Officer and Chief Financial Officer evaluated, with the participation of our management, the effectiveness of our internal control over financial reporting as of the end of the period covered by this report. Based on management’s evaluation, our Chief Executive Officer and Chief Financial Officer each concluded that our internal control over financial reporting was effective as of December 31, 2009.
Management assessed the effectiveness of the Company’s internal control over financial reporting as of December 31, 2009. Management’s assessment on internal controls did not include the internal controls of Precision Pipeline, LLC which is included in the 2009 consolidated financial statements of the Company and constituted 10% of total assets, as of December 31, 2009 and 7% of total revenues for the year then ended. Management did not assess the effectiveness of
83
Table of Contents
internal control over financial reporting at this entity because the Company did not have the ability to conduct an assessment of the acquired entities’ internal controls over financial reporting during the time period from November 1, 2009, the effective date of acquisition, through December 31, 2009, the date of management’s assessment. The scope of management’s assessment on internal control over financial reporting for the year ended December 31, 2010 will include the internal controls of Precision. In making its assessment of the effectiveness of internal control, management used the criteria set forth by the Committee of Sponsoring Organizations of the Treadway Commission (COSO) in Internal Control-Integrated Framework. Based on our assessment and those criteria, management believes that the Company maintained effective internal control over financial reporting as of December 31, 2009.
BDO SEIDMAN LLP, the independent registered public accounting firm who audits our financial statements, has audited our internal control over financial reporting as of December 31, 2009 and has expressed an unqualified opinion thereon.
Changes in Internal Controls over Financial Reporting. There have been no changes in the Company’s internal control over financial reporting during the quarter ended December 31, 2009 that have materially affected, or are reasonably likely to materially affect, the Company’s internal control over financial reporting.
Report of Independent Registered Public Accounting Firm
Board of Directors and Shareholders
MasTec, Inc.
Coral Gables, Florida
We have audited MasTec, Inc.’s internal control over financial reporting as of December 31, 2009, based on criteria established in Internal Control – Integrated Framework issued by the Committee of Sponsoring Organizations of the Treadway Commission (the COSO criteria). MasTec, Inc.’s management is responsible for maintaining effective internal control over financial reporting and for its assessment of the effectiveness of internal control over financial reporting, included in the accompanying “Management’s Report on Internal Control Over Financial Reporting.” Our responsibility is to express an opinion on the company’s internal control over financial reporting based on our audit.
We conducted our audit in accordance with the standards of the Public Company Accounting Oversight Board (United States). Those standards require that we plan and perform the audit to obtain reasonable assurance about whether effective internal control over financial reporting was maintained in all material respects. Our audit included obtaining an understanding of internal control over financial reporting, assessing the risk that a material weakness exists, and testing and evaluating the design and operating effectiveness of internal control based on the assessed risk. Our audit also included performing such other procedures as we considered necessary in the circumstances. We believe that our audit provides a reasonable basis for our opinion.
A company’s internal control over financial reporting is a process designed to provide reasonable assurance regarding the reliability of financial reporting and the preparation of financial statements for external purposes in accordance with generally accepted accounting principles. A company’s internal control over financial reporting includes those policies and procedures that (1) pertain to the maintenance of records that, in reasonable detail, accurately and fairly reflect the transactions and dispositions of the assets of the company; (2) provide reasonable assurance that transactions are recorded as necessary to permit preparation of financial statements in accordance with generally accepted accounting principles, and that receipts and expenditures of the company are being made only in accordance with authorizations of management and directors of the company; and (3) provide reasonable assurance regarding prevention or timely detection of unauthorized acquisition, use, or disposition of the company’s assets that could have a material effect on the financial statements.
Because of its inherent limitations, internal control over financial reporting may not prevent or detect misstatements. Also, projections of any evaluation of effectiveness to future periods are subject to the risk that controls may become inadequate because of changes in conditions, or that the degree of compliance with the policies or procedures may deteriorate.
As indicated in the accompanying Management’s Report on Internal Control Over Financial Reporting, management’s assessment of and conclusion on the effectiveness of internal control over financial reporting did not include the internal controls of Precision Pipeline, LLC which was acquired in November 2009 and is included in the consolidated balance sheet of MasTec, Inc. as of December 31, 2009, and the related consolidated statements of operations, changes in shareholders’ equity, and cash flows for the year then ended. Precision Pipeline, LLC constituted 10% of total assets as of December 31, 2009, and 7% of revenues, and 9% of net income, respectively for the year then ended. Management did not assess the effectiveness of internal
84
Table of Contents
control over financial reporting of Precision Pipeline, LLC because of the timing of the acquisition which was completed in November 2009.
In our opinion, MasTec, Inc. maintained, in all material respects, effective internal control over financial reporting as of December 31, 2009, based on the COSO criteria.
We also have audited, in accordance with the standards of the Public Company Accounting Oversight Board (United States), the consolidated balance sheets of MasTec, Inc. as of December 31, 2009 and 2008, and the related consolidated statements of operations, shareholders’ equity, and cash flows for each of the three years in the period ended December 31, 2009 and our report dated February 24, 2010, expressed an unqualified opinion thereon.
/s/ BDO Seidman, LLP
Certified Public Accountants
Miami, Florida
February 24, 2010
| Item 9B. | Other Information |
None.
| Item 10. | Directors, Executive Officers and Corporate Governance |
The information about directors required for this item is incorporated by reference from our Proxy Statement to be filed in connection with our 2010 Annual Meeting of Shareholders.
We have adopted a code of ethics that applies to our principal officer, principal financial officer, principal accounting officer, or persons performing similar functions. We have posted our code of ethics on our website (www.mastec.com) as Appendix E to the MasTec Personal Responsibility Code, and it is available to any shareholder upon request. We intend to post any amendments to, or any waivers from, a provision of the code of ethics that applies to the principal executive officer, principal financial officer, principal accounting officer or controller, or any other person performing a similar function, on our website. See also, Item 1. Business – Available Information.”
| Item 11. | Executive Compensation |
The information required for this item is incorporated by reference from our Proxy Statement to be filed in connection with our 2010 Annual Meeting of Shareholders.
| Item 12. | Security Ownership of Certain Beneficial Owners and Management and Related Stockholder Matters |
During the year ended December 31, 2009, there were no stock options awarded. The following table sets forth information about our common stock that may be issued under all of our existing equity compensation plans as of December 31, 2009 which include the 1994 Stock Incentive Plan, 1994 Stock Option Plan for Non-Employee Directors, 1997 Annual Incentive Compensation Plan, 1997 Non-Qualified Employee Stock Purchase Plan, Non-Employee Directors’ Stock Plan, 1999 Non-Qualified Employee Stock Option Plan, 2003 Employee Stock Incentive Plan, Amended and Restated 2003 Stock Incentive Plan for Non-Employees and individual option agreements. The 1994 Stock Incentive Plan, 1994 Stock Option Plan for Non-Employee Directors, the 1997 Annual Incentive Compensation Plan, 2003 Employee Stock Incentive Plan and the Amended and Restated 2003 Stock Incentive Plan for Non-Employees were approved by our shareholders.
85
Table of Contents
| Plan Category |
Number of Securities to be Issued Upon Exercise of Outstanding Options, Warrants and Rights (a) |
Weighted Average Exercise Price Outstanding Options, Warrants and Rights (b) |
Number of Securities Remaining Available for Future Issuance Under Equity Compensation (Excluding Securities Reflected in Column (a) (c) |
||||||
| Equity compensation plans approved by security holders |
2,875,669 | (1) | $ | 10.42 | 3,819,248 | (2) | |||
| Equity compensation plans not approved by security holders |
— | $ | 0 | — | |||||
| Total |
2,875,669 | 3,819,248 | |||||||
| (1) | Represents 90,000 shares issuable under the 1994 Stock Option Plan for Non-Employee Directors, 2,183,169 shares issuable under the 2003 Employee Stock Incentive Plan, and 602,500 shares issuable under the Amended and Restated 2003 Stock Incentive Plan for Non-Employees. |
| (2) | Under the 2003 Employee Stock Incentive Plan and the Amended and Restated 2003 Stock Incentive Plan for Non-Employees 2,171,923 shares and 1,647,325 shares, respectively, remain available for future issuance. We are no longer issuing options under the 1994 Stock Option Plan for Non-Employee Directors and the 1994 Stock Incentive Plan. We have never issued any shares under the 1997 Annual Incentive Compensation Plan and have no current plans to do so. |
Summaries of Plans Not Approved by Our Shareholders
1997 Non-Qualified Employee Stock Purchase Plan. The MasTec, Inc. 1997 Non-Qualified Employee Stock Purchase Plan is administered by the Compensation Committee, and permits employees of MasTec who meet certain criteria set by the Committee to purchase our common stock at a 15% discount to the market price at the time of purchase. Such purchases are made through regular payroll deductions or lump sum investments. Employees are limited to a maximum investment of $25,000 in the plan each year. The total amount of common stock reserved under the plan is approximately 1,300,750 shares, substantially all of which has been purchased.
Non-Employee Directors’ Stock Plan. The MasTec, Inc. Non-Employee Directors’ Stock Plan adopted in 1999 permits non-employee directors to elect to receive all or a specified percentage of any director fees paid for each year of service on the board in shares of our common stock. The number of shares issued to each non-employee director is determined by dividing the director’s fees owed to such director by the fair-market value of a share of common stock on the date of the issue. The shares issued are delivered to the non-employee director and the non-employee director has all the rights and privileges of a stockholder as to the shares. The shares are immediately vested upon grant and are not forfeitable to us. The maximum number of shares of common stock that may be issued under the plan is 150,000. As of December 31, 2009, there were no shares available for issuance under this plan.
1999 Non-Qualified Employee Stock Option Plan. The 1999 Non-Qualified Employee Stock Option Plan is administered by the Compensation Committee of the Board and permits the Committee to grant non-qualified options to purchase up to 2,000,000 shares of common stock to any MasTec employee. The Compensation Committee determines the recipient of options, the number of shares covered by each option, and the terms and conditions of options within the parameters of the plan (including the exercise price, vesting schedule, and the expiration date) and may adopt rules and regulations necessary to carry out the plan. Options may no longer be granted pursuant to this plan. The Compensation Committee has the authority to change or discontinue the plan or the options issued pursuant thereto at any time without the holders consent so long as the holders’ rights would not be impaired. The plan permits the Compensation Committee to determine and accept different forms of payment pursuant to the exercise of options.
The plan provides for the termination of all outstanding options whether or not vested in the event of a termination of employment, and permits the Committee to take certain actions in the event of a change of control to ensure fair and equitable treatment of the employees who hold options granted under the plan, including accelerating the vesting of any outstanding option, offering to purchase any outstanding option and making other changes to the terms of the outstanding options. As of December 31, 2009, 1,300,750 shares remained available for issuance under this plan.
Deferred Fee Plan. The Deferred Fee Plan became effective on January 1, 2007. Under the terms of the Deferred Fee Plan, directors may elect to defer the receipt of cash and stock fees for their services as directors. Each director may elect the type of fees to be deferred, the percentage of such fees to be deferred, and the form in which the deferred fees and any earnings thereon are to be paid. Deferred cash fees may be directed to a deferred cash account or a deferred stock account (or both). Deferred stock fees may only be directed to a deferred stock account. Elections to defer fees remain in force, unless amended or revoked within the required time periods.
86
Table of Contents
The deferred cash account will be credited with interest on the cash balance at the end of each calendar quarter. The interest rate is equal to the rate of interest payable by us on our revolving credit facility, as determined as of the first day of each calendar quarter. The deferred stock account will be credited with stock dividends (or with cash dividends that are converted to deferred stock credits pursuant to the plan.)
Distribution of a director’s cash and stock accounts will begin on January 15 of the year following the directors’ termination of all services with us. Distributions from the deferred stock account will be made in cash. Distribution will either be made in a lump-sum payment or in up to five consecutive installments as elected by the director.
Individual Option Grants. We have entered into various option agreements with non-employee directors, advisors and other parties in connection with providing certain services, acquisitions and other matters. Such options have various vesting schedules and exercise prices and have been included in the equity compensation plan table above.
The other information required for this item is incorporated by reference from our Proxy Statement to be filed in connection with our Annual Meeting of Shareholders.
| Item 13. | Certain Relationships and Related Transactions, and Director Independence |
The information required for this item is incorporated by reference from our Proxy Statement to be filed in connection with our 2010 Annual Meeting of Shareholders.
| Item 14. | Principal Accounting Fees and Services |
The information required for this item is incorporated by reference from our Proxy Statement to be filed in connection with our 2010 Annual Meeting of Shareholders.
| Item 15. | Exhibits and Financial Statement Schedules |
| (a) 1. | Financial Statements – the consolidated financial statements and the reports of the Independent Registered Public Accounting firms are listed on page 47 through 82. |
| 2. | Financial Statement Schedules – Schedule II – Valuation and Qualifying Accounts. |
| 3. | Exhibits including those incorporated by reference: |
| Exhibits |
Description | |
| 3.1 |
Composite Articles of Incorporation of MasTec, Inc.* | |
| 3.2 |
Amended and Restated By-laws of MasTec, Inc., amended and restated as of January 22, 2010, filed as Exhibit 3.1 to our Current Report on Form 8-K filed with the SEC on January 28, 2010 and incorporated by reference herein. | |
| 4.1 |
Indenture, dated January 31, 2007, by and among MasTec, Inc., certain of MasTec’s subsidiaries and U.S. Bank National Association, as trustee filed as Exhibit 4.1 to our Current Report on Form 8–K filed with the SEC on February 2, 2007 and incorporated by reference herein. | |
| 4.2 |
Supplemental Indenture dated as of May 2, 2007 among MasTec, Inc., U.S. Bank National Association and each of the MasTec subsidiary guarantors set forth therein filed as Exhibit 4.1 to our Quarterly Report on Form 10-Q filed with the SEC on May 2, 2007 and incorporated by reference herein. | |
| 4.3 |
Form of 4.0% Senior Convertible Note due 2014 filed as Exhibit 4.1 to our Current Report on Form 8-K filed with the SEC on June 5, 2009 and incorporated by reference herein. | |
| 4.4 |
Indenture, dated June 5, 2009, by and among MasTec, Inc., MasTec Inc.’s subsidiaries party thereto, as guarantors, and U.S. Bank National Association, as trustee filed as Exhibit 4.2 to our Current Report on Form 8-K filed with the SEC on June 5, 2009 and incorporated by reference herein. | |
87
Table of Contents
| 4.5 |
Supplemental Indenture, dated June 5, 2009, by and among MasTec, Inc., MasTec Inc.’s subsidiaries party thereto, as guarantors, and U.S. Bank National Association, as trustee filed as Exhibit 4.3 to our Current Report on Form 8-K filed with the SEC on June 5, 2009 and incorporated by reference herein. | |
| 4.6 |
Form of 4.25% Senior Convertible Note due 2014 (incorporated by reference to Exhibit A to the Supplemental Indenture) filed as Exhibit 4.3 to our Current Report on Form 8-K filed with the SEC on November 10, 2009 and incorporated by reference herein. | |
| 4.7 |
Supplemental Indenture, dated November 10, 2009, by and among MasTec, Inc., MasTec Inc.’s subsidiaries party thereto, as guarantors, and U.S. Bank National Association, as trustee filed as Exhibit 4.3 to our Current Report on Form 8-K filed with the SEC on November 10, 2009 and incorporated by reference herein. | |
| 10.1+ |
1999 Non–Qualified Employee Stock Option Plan filed as Exhibit 10.5 to our Registration Statement on Form S-1 (Registration No. 333-129790) and incorporated by reference herein. | |
| 10.2+ |
Non–Employee Directors’ Stock Plan filed as Exhibit 10.6 to our Registration Statement on Form S-1 (Registration No. 333-129790) and incorporated by reference herein. | |
| 10.3+ |
2003 Employee Stock Incentive Plan as amended and restated as of January 1, 2006, filed as Exhibit 10.5 to our Current Report on Form 8-K filed with the SEC on April 6, 2006 and incorporated by reference herein. | |
| 10.4+ |
Amended and Restated 2003 Stock Incentive Plan for Non–Employees as amended and restated as of January 1, 2006, filed as Exhibit 10.4 to our Current Report on Form 8-K filed with SEC on April 6, 2006 and incorporated by reference herein. | |
| 10.5+ |
1997 Annual Incentive Compensation Plan filed as Exhibit 10.37 to our Registration Statement on Form S-1 (Registration No. 333-129790) and incorporated by reference herein. | |
| 10.6+ |
Deferred Fee Plan for Directors dated December 19, 2005, filed as Exhibit 10.38 to our Form 8–K filed with the SEC on December 23, 2005 and incorporated by reference herein. | |
| 10.7 |
Asset Purchase Agreement dated December 30, 2006, by and among MasTec North America AC, LLC, MasTec, Inc., Ronald E. Phillips, Dawn M. Phillips, Digital Satellite Services Employee Stock Ownership Trust and Digital Satellite Services, Inc filed as Exhibit 10.39 to our Registration Statement on Form S-1 (Registration No. 333-129790) and incorporated by reference herein. | |
| 10.8+ |
Form of Restricted Stock Agreement for the MasTec, Inc. Amended and Restated 2003 Stock Incentive Plan for Employees filed as Exhibit 10.7 to our Current Report on Form 8-K filed with the SEC on April 6, 2006 and incorporated by reference herein. | |
| 10.9+ |
Form of Stock Option Agreement for the MasTec, Inc. Amended and Restated 2003 Stock Incentive Plan for Employees filed as Exhibit 10.8 to our Current Report on Form 8-K filed with the SEC on April 6, 2006 and incorporated by reference herein. | |
| 10.10+ |
Form of Restricted Stock Agreement for the MasTec, Inc. Amended and Restated 2003 Stock Incentive Plan for Non-Employees filed as Exhibit 10.9 to our Current Report on Form 8-K filed with the SEC on April 6, 2006 and incorporated by reference herein. | |
| 10.11+ |
Form of Stock Option Agreement for the MasTec, Inc. Amended and Restated 2003 Stock Incentive Plan for Non-Employees filed as Exhibit 10.10 to our Current Report on Form 8-K filed with the SEC on April 6, 2006 and incorporated by reference herein. | |
| 10.12 |
Asset Purchase Agreement dated as of November 9, 2006 between MasTec North America, Inc. and LM-ITS Acquisition LLC filed as Exhibit 10.54 to our Quarterly Report on Form 10–Q for the quarter ended September 30, 2006 and filed with the SEC on November 9, 2006, and incorporated by reference herein. | |
| 10.13 |
Amended and Restated Asset Purchase Agreement dated February 14, 2007, by and between MasTec North America and Atlas Traffic Management Systems, LLC, filed as Exhibit 10.1 to our Current Report on Form 8-K filed with the SEC on February 20, 2007 and incorporated by reference herein. | |
| 10.14 |
Stipulation and Settlement Agreement filed at Exhibit 10.55 to the Form 10-Q filed with the SEC on November 6, 2007 and incorporated by reference herein | |
| 10.15+ |
Employment Agreement dated April 18, 2007 by and between MasTec, Inc. and Jose Mas filed as Exhibit 10.1 to our Current Report on Form 8-K filed with the SEC on April 20, 2007 and incorporated by reference herein. | |
| 10.16 |
Settlement Agreement dated January 24, 2008 by and between MasTec North America, Inc. and Atlas filed as Exhibit 10.1 to our Current Report on Form 8-K filed with the SEC on January 30, 2008 and incorporated by reference herein. | |
| 10.17 |
Revised Amended and Restated Asset Purchase Agreement dated January 24, 2008 by and between MasTec North America, Inc. and Atlas filed as Exhibit 10.2 to our Current Report on Form 8-K filed with the SEC on January 30, 2008 and incorporated by reference herein. | |
| 10.18+ |
MasTec, Inc. Deferred Compensation Plan filed as Exhibit 99.1 to our Current Report on Form 8-K filed with the SEC on April 4, 2008 and incorporated by reference herein. | |
| 10.19 |
Stock Purchase Agreement executed on May 30, 2008 and dated as of May 1, 2008, between MasTec North America, Inc., as buyer, and Alan B. Roberts, as seller filed as Exhibit 10.1 to our Current Report on Form 8-K filed with the SEC on June 5, 2008 and incorporated by reference herein. | |
88
Table of Contents
| 10.20 |
Form of Promissory Note for the Equipment Term Loan dated May 30, 2008 between Pumpco, Inc. and General Electric Capital Corporation filed as Exhibit 10.2 to our Current Report on Form 8-K filed with the SEC on June 5, 2008 and incorporated by reference herein. | |
| 10.21 |
Master Security Agreement dated May 30, 2008 between Pumpco, Inc. and General Electric Capital Corporation filed as Exhibit 10.3 to our Current Report on Form 8-K filed with the SEC on June 5, 2008 and incorporated by reference herein. | |
| 10.22 |
Corporate Guaranty dated May 30, 2008 from MasTec, Inc. to General Electric Capital Corporation filed as Exhibit 10.4 to our Current Report on Form 8-K filed with the SEC on June 5, 2008 and incorporated by reference herein. | |
| 10.23 |
Second Amended and Restated Loan and Security Agreement dated July 29, 2008, by and among MasTec, Inc., certain of its subsidiaries, Bank of America, N.A., as collateral and administrative agent and General Electric Capital Corporation, as syndication agent filed as Exhibit 10.7 to our Quarterly Report on Form 10-Q filed with the SEC on July 30, 2008 and incorporated by reference herein. | |
| 10.24 |
Stock Purchase Agreement dated October 4, 2008 among MasTec, Inc., MasTec North America, Inc., Wanzek Construction, Inc., and the shareholders of Wanzek filed as Exhibit 10.1 to our Current Report on Form 8-K filed with the SEC on October 6, 2008 and incorporated by reference herein. | |
| 10.25 |
First Amendment to Stock Purchase Agreement dated December 2, 2008 among MasTec, Inc., MasTec North America, Inc., Wanzek Construction, Inc., and the shareholders of Wanzek filed as Exhibit 10.1 to our Current Report on Form 8-K with the SEC on December 3, 2008 and incorporated by reference herein. | |
| 10.26 |
Second Amendment to Stock Purchase Agreement, dated December 16, 2008, among MasTec, Inc., MasTec North America, Inc., Wanzek Construction, Inc. and the shareholders of Wanzek as Exhibit 10.1 to our Current Report on Form 8-K filed with SEC on December 18, 2008 and incorporated by reference herein. | |
| 10.27 |
Registration Rights Agreement, dated December 16, 2008 among MasTec, Inc. and the shareholders of Wanzek filed as Exhibit 10.2 to our Current Report on Form 8-K filed with the SEC on December 18, 2008 and incorporated by reference herein. | |
| 10.28 |
Letter Amendment to the Second Amended and Restated Loan and Security Agreement dated December 16, 2008 among MasTec, Inc. and the other borrowers signatory thereto and Bank of America, as agent and a lender, and the other lenders signatory thereto filed as Exhibit 10.3 to our Current Report on Form 8-K filed with the SEC on December 18, 2008 and incorporated by reference herein. | |
| 10.29 |
Third Amendment to Stock Purchase Agreement, dated June 1, 2009, among MasTec, Inc., MasTec North America, Inc., Wanzek Construction, Inc. and the shareholders of Wanzek Construction, Inc. filed as Exhibit 10.1 to our Current Report on Form 8-K filed with the SEC on June 2, 2009 and incorporated by reference herein. | |
| 10.30 |
First Amendment to Registration Rights Agreement, dated June 1, 2009, among MasTec, Inc. and the shareholders of Wanzek Construction, Inc. filed as Exhibit 10.2 to our Current Report on Form 8-K filed with the SEC on June 2, 2009 and incorporated by reference herein. | |
| 10.31 |
Letter Amendment, dated June 1, 2009, among MasTec, Inc. and the other borrowers signatory thereto and Bank of America, as agent and a lender, and the other lenders signatory thereto filed as Exhibit 10.4 to our Current Report on Form 8-K filed with the SEC on June 2, 2009 and incorporated by reference herein. | |
| 10.32+ |
Employment Agreement between MasTec, Inc. and C. Robert Campbell executed on October 27, 2009 filed as Exhibit 10.69 to our Quarterly Report on Form 10-Q filed with the SEC on October 28, 2009 and incorporated by reference herein. | |
| 10.33+ |
Split-Dollar Agreement between MasTec, Inc. and Jorge Mas dated October 28, 2009 filed as Exhibit 10.70 to our Quarterly Report on Form 10-Q filed with the SEC on October 28, 2009 and incorporated by reference herein | |
| 10.34+ |
Deferred Bonus Agreement between MasTec, Inc. and Jorge Mas dated October 28, 2009 filed as Exhibit 10.71 to our Quarterly Report on Form 10-Q filed with the SEC on October 28, 2009 and incorporated by reference herein | |
| 10.35+ |
Split-Dollar Agreement between MasTec, Inc. and Jose Mas dated October 28, 2009 filed as Exhibit 10.72 to our Quarterly Report on Form 10-Q filed with the SEC on October 28, 2009 and incorporated by reference herein. | |
| 10.36+ |
Deferred Bonus Agreement between MasTec, Inc. and Jose Mas dated October 28, 2009 filed as Exhibit 10.73 to our Quarterly Report on Form 10-Q filed with the SEC on October 28, 2009 and incorporated by reference herein. | |
| 10.37 |
Purchase Agreement, dated November 3, 2009, by and among MasTec, Inc., Precision Acquisition, LLC, Precision Pipeline LLC, Precision Transport Company, LLC, PPL Management, Inc., Michael Daniel Murphy, Steven R. Rooney, Angela D. Murphy and Karen K. Rooney filed as Exhibit 10.1 to our Current Report on Form 8-K filed with the SEC on November 4, 2009 and incorporated by reference herein. | |
| 10.38 |
Letter Amendment dated November 3, 2009 to the Second Amended and Restated Loan and Security Agreement among the MasTec, Inc., the guarantors party thereto, Bank of America, N.A., as administrative agent, an the lenders party thereto filed as Exhibit 10.3 to our Current Report on Form 8-K filed with the SEC on November 10, 2009 and incorporated by reference herein. | |
| 10.39+ |
Employment Agreement executed on January 26, 2010 between MasTec, Inc. and Ray Harris filed as Exhibit 10.1 to our Current Report on Form 8-K filed with the SEC on January 28, 2010 and incorporated by reference herein. | |
89
Table of Contents
| 10.40+ |
Employment Agreement executed on January 26, 2010 between MasTec, Inc. and Robert Apple filed as Exhibit 10.2 to our Current Report on Form 8-K filed with the SEC on January 28, 2010 and incorporated by reference herein. | |
| 21* |
Subsidiaries of MasTec, Inc. | |
| 23.1* |
Consent of Independent Registered Public Accounting Firm. | |
| 23.2* |
Consent of Independent Valuation Firm. | |
| 31.1* |
Certifications required by Section 302(b) of the Sarbanes-Oxley Act of 2002. | |
| 31.2* |
Certifications required by Section 302(b) of the Sarbanes-Oxley Act of 2002. | |
| 32.1* |
Certifications required by Section 906 of the Sarbanes-Oxley Act of 2002. | |
| 32.2* |
Certifications required by Section 906 of the Sarbanes-Oxley Act of 2002. | |
| * | Filed herewith. |
| + | Management contract or compensation plan arrangement. |
90
Table of Contents
MASTEC, INC.
SCHEDULE II – VALUATION AND QUALIFYING ACCOUNTS
(In thousands)
| Balance at Beginning of Period |
Charges | (Deductions) | Balance at End of Period | |||||||||||
| Year ended December 31, 2009: |
||||||||||||||
| Deducted from asset accounts: |
||||||||||||||
| Allowance for doubtful accounts |
$ | 11,646 | $ | 2,414 | (1) | $ | (3,779 | )(3) | $ | 10,281 | ||||
| Unrealized losses on securities available for sale |
13,070 | — | (7,422 | )(5) | 5,648 | |||||||||
| Valuation allowance for deferred tax assets |
24,192 | (18,787 | )(4) | 5,405 | ||||||||||
| Total |
$ | 48,908 | $ | 2,414 | $ | (29,988 | ) | $ | 21,334 | |||||
| Year ended December 31, 2008: |
||||||||||||||
| Deducted from asset accounts: |
||||||||||||||
| Allowance for doubtful accounts |
$ | 15,276 | $ | 3,482 | (1) | $ | (7,112 | )(3) | $ | 11,646 | ||||
| Unrealized losses on securities available for sale |
4,790 | 8,280 | (2) | — | 13,070 | |||||||||
| Valuation allowance for deferred tax assets |
47,921 | — | (23,729 | )(4) | 24,192 | |||||||||
| Total |
$ | 67,987 | $ | 11,762 | $ | (30,841 | ) | $ | 48,908 | |||||
| Year ended December 31, 2007: |
||||||||||||||
| Deducted from asset accounts: |
||||||||||||||
| Allowance for doubtful accounts |
$ | 11,537 | $ | 17,473 | (1) | $ | (13,734 | )(3) | $ | 15,276 | ||||
| Unrealized losses on securities available for sale |
— | 4,790 | (2) | — | 4,790 | |||||||||
| Valuation allowance for deferred tax assets |
49,178 | 3,515 | (4,772 | ) | 47,921 | |||||||||
| Total |
$ | 60,715 | $ | 25,778 | $ | (18,506 | ) | $ | 67,987 | |||||
| (1) | Provision for doubtful accounts. |
| (2) | Unrealized losses recorded in other comprehensive income. |
| (3) | Write-offs and reversals of uncollectible accounts. |
| (4) | Decrease in valuation allowance for deferred tax assets is due primarily to the utilization of tax loss carryforwards and other tax benefits. |
| (5) | Change in unrealized losses on securities available for sale is comprised of $3,641 of unrealized gains, net of taxes, and $3,781 of other-than-temporary impairment losses, net of taxes, charged to earnings. |
91
Table of Contents
Pursuant to the requirements of Section 13 or 15(d) of the Securities Exchange Act of 1934, the Registrant has duly caused this report to be signed on its behalf by the undersigned, thereunto duly authorized, in the City of Miami, State of Florida, on February 24, 2010.
| MASTEC, INC. |
| /s/ JOSE R. MAS |
| Jose R. Mas |
| Chief Executive Officer |
| (Principal Executive Officer) |
| /s/ C. ROBERT CAMPBELL |
| C. Robert Campbell |
| Chief Financial Officer |
| (Principal Financial and Accounting Officer) |
Pursuant to the requirements of the Securities Exchange Act of 1934, this report has been signed below by the following persons on behalf of the Registrant and in the capacities indicated on February 24, 2010.
| /s/ JORGE MAS Jorge Mas |
Chairman of the Board of Directors | |
| /s/ JOSE R. MAS Jose R. Mas |
Chief Executive Officer and Director (Principal Executive Officer) | |
| /s/ C. ROBERT CAMPBELL C. Robert Campbell |
Chief Financial Officer (Principal Financial and Accounting Officer) | |
| /s/ ERNST N. CSISZAR Ernst N. Csiszar |
Director | |
| /s/ ROBERT J. DWYER Robert J. Dwyer |
Director | |
| /s/ FRANK E. JAUMOT Frank E. Jaumot |
Director | |
| /s/ JULIA L. JOHNSON Julia L. Johnson |
Director | |
| /s/ JOSE S. SORZANO Jose S. Sorzano |
Director | |
| /s/ JOHN VAN HEUVELEN John Van Heuvelen |
Director | |
92
Table of Contents
Exhibit Index
| Exhibit No. |
Description | |
| 3.1 |
Composite Articles of Incorporation of MasTec, Inc. | |
| 21 |
Subsidiaries of MasTec, Inc. | |
| 23.1 |
Consent of Independent Registered Public Accounting Firm. | |
| 23.2 |
Consent of Independent Valuation Firm. | |
| 31.1 |
Certifications required by Section 302(b) of the Sarbanes-Oxley Act of 2002. | |
| 31.2 |
Certifications required by Section 302(b) of the Sarbanes-Oxley Act of 2002. | |
| 32.1 |
Certifications required by Section 906 of the Sarbanes-Oxley Act of 2002. | |
| 32.2 |
Certifications required by Section 906 of the Sarbanes-Oxley Act of 2002. | |