Attached files
| file | filename |
|---|---|
| 8-K - 8-K - Westbury Bancorp, Inc. | form8-kinvestorpresentatio.htm |
245-245-245 1-85-129 84-185-72 Westbury Bancorp, Inc. WBB Investor Presentation February 2016 Greg J. Remus – President & CEO Kirk J. Emerich – EVP & Chief Financial Officer

245-245-245 1-85-129 84-185-72 Forward-Looking Statements This presentation contains forward-looking statements, which can be identified by the use of words such as “estimate,” “project,” “believe,” “intend,” “anticipate,” “assume,” “plan,” “seek,” “expect,” “will,” “may,” “should,” “indicate,” “would,” “believe,” “contemplate,” “continue,” “intend,” “target” and words of similar meaning. These forward-looking statements include, but are not limited to: • statements of our goals, intentions and expectations; • statements regarding our business plans, prospects, growth and operating strategies; • statements regarding the asset quality of our loan and investment portfolios; and • estimates of our risks and future costs and benefits. These forward-looking statements are based on our current beliefs and expectations and are inherently subject to significant business, economic and competitive uncertainties and contingencies, many of which are beyond our control. In addition, these forward-looking statements are subject to assumptions with respect to future business strategies and decisions that are subject to change. We are under no duty to and do not take any obligation to update any forward-looking statements after the date of this presentation. The following factors, among others, could cause actual results to differ materially from the anticipated results or other expectations expressed in the forward-looking statements: • our ability to manage our operations under current economic conditions nationally and in our market area; • adverse changes in the financial industry, securities, credit and national and local real estate markets (including real estate values); • significant increases in our loan losses, including as a result of our inability to resolve classified assets, and changes in management’s assumptions in determining the adequacy of the allowance for loan losses; • credit risks of lending activities, including changes in the level and trend of loan delinquencies and charge-offs and in our allowance for loan losses and provision for loan losses; • competition among depository and other financial institutions; • our success in increasing our commercial business, commercial real estate and multifamily lending while maintaining our asset quality; • our success in introducing new financial products; • our ability to attract and maintain deposits; 2
245-245-245 1-85-129 84-185-72 Forward-Looking Statements – Cont’d. The following factors, among others, could cause actual results to differ materially from the anticipated results or other expectations expressed in the forward-looking statements: • our ability to retain customer accounts, achieve increased operating efficiencies and enhance profitability following the closing of underperforming branch offices; • changes in interest rates generally, including changes in the relative differences between short term and long term interest rates and in deposit interest rates, that may affect our net interest margin and funding sources; • fluctuations in the demand for loans, which may be affected by the number of unsold homes, land and other properties in our market areas and by declines in the value of real estate in our market area; • changes in consumer spending, borrowing and savings habits; • further declines in the yield on our assets resulting from the current low interest rate environment; • risks related to a high concentration of loans secured by real estate located in our market area; • the results of examinations by our regulators, including the possibility that our regulators may, among other things, require us to increase our allowance for loan losses, write down assets, change our regulatory capital position, limit our ability to borrow funds or maintain or increase deposits; • changes in the level of government support of housing finance; • our ability to enter new markets successfully and capitalize on growth opportunities; • changes in consumer spending, borrowing and savings habits; • changes in laws or government regulations or policies affecting financial institutions, including changes in the regulations implementing the Dodd-Frank Act, the JOBS Act and similar future laws, which could result in, among other things, increased deposit insurance premiums and assessments, capital requirements (particularly the new capital regulations), and regulatory fees and compliance costs; • changes in accounting policies and practices, as may be adopted by the bank regulatory agencies, the Financial Accounting Standards Board, the Securities and Exchange Commission and the Public Company Accounting Oversight Board; • changes in our compensation and benefit plans; • our ability to retain key members of our senior management team and to address staffing needs to respond to demand or to implement our strategic plans; • loan delinquencies and changes in the underlying cash flows of our borrowers; • our ability to control costs and expenses, particularly those associated with operating as a publicly traded company; • changes in the financial condition or future prospects of issuers of securities that we own; • the ability of third-party service providers to perform their obligations to us; 3
245-245-245 1-85-129 84-185-72 Forward-Looking Statements – Cont’d. The following factors, among others, could cause actual results to differ materially from the anticipated results or other expectations expressed in the forward-looking statements: • the availability, effectiveness and security of our information technology systems and our ability to secure confidential information through the use of our computer and other technology systems and networks; • other economic, competitive, governmental, regulatory and operational factors affecting our operations, pricing, products and services described elsewhere in this annual report; and • the impact of reputational risk created by any of the foregoing developments on such matters such as business generation and retention, funding and liquidity. Because of these and a wide variety of other uncertainties, our actual future results may be materially different from the results indicated by these forward-looking statements. 4
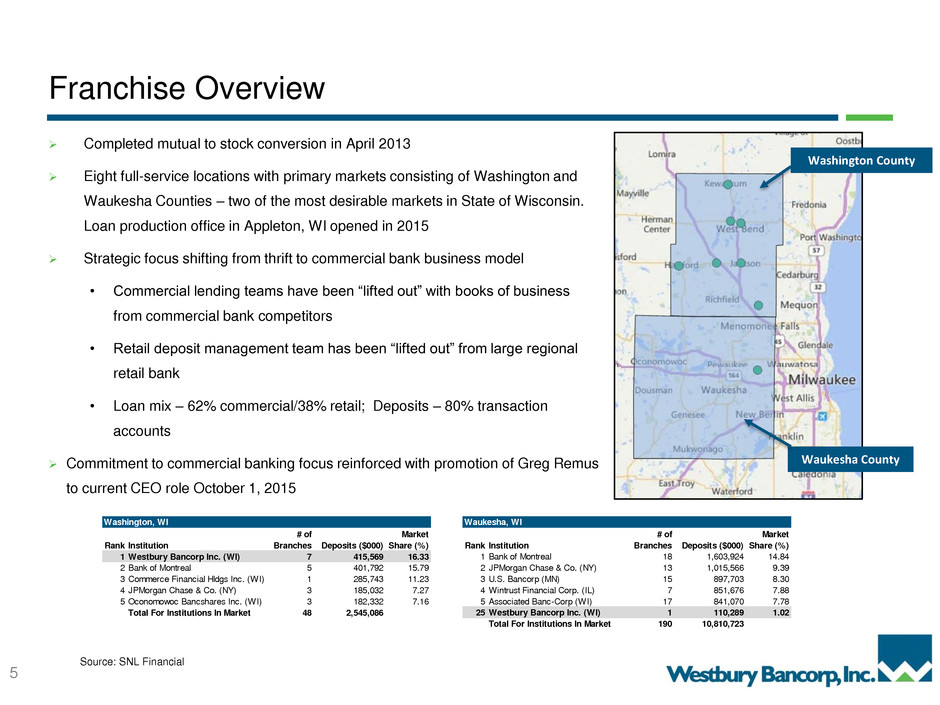
245-245-245 1-85-129 84-185-72 Franchise Overview Completed mutual to stock conversion in April 2013 Eight full-service locations with primary markets consisting of Washington and Waukesha Counties – two of the most desirable markets in State of Wisconsin. Loan production office in Appleton, WI opened in 2015 Strategic focus shifting from thrift to commercial bank business model • Commercial lending teams have been “lifted out” with books of business from commercial bank competitors • Retail deposit management team has been “lifted out” from large regional retail bank • Loan mix – 62% commercial/38% retail; Deposits – 80% transaction accounts Commitment to commercial banking focus reinforced with promotion of Greg Remus to current CEO role October 1, 2015 5 1 Source: SNL Financial Washingto , WI Rank Institution # of Branches Deposits ($000) Market Share (%) 1 Westbury Bancorp Inc. (WI) 7 415,569 16.33 2 Bank of Montreal 5 401,792 15.79 3 Commerce Financial Hldgs Inc. (WI) 1 285,743 11.23 4 JPMorgan Chase & Co. (NY) 3 185,032 7.27 5 Oconomowoc Bancshares Inc. (WI) 3 182,332 7.16 Total For Institutions In Market 48 2,545,086 Waukesha, WI Rank Institution # of Branches Deposits ($000) Market Share (%) 1 Bank of Montreal 18 1,603,924 14.84 2 JPMorgan Chase & Co. (NY) 13 1,015,566 9.39 3 U.S. Bancorp (MN) 15 8 7,703 8.30 4 Wintrust Financial Corp. (IL) 7 851,676 7.88 5 Ass ciated Banc-Corp (WI) 17 841,070 7.78 25 Westbury Bancorp Inc. (WI) 1 10,289 1.02 Total For Institutions In Market 190 10,810,723 Washington County Waukesha County
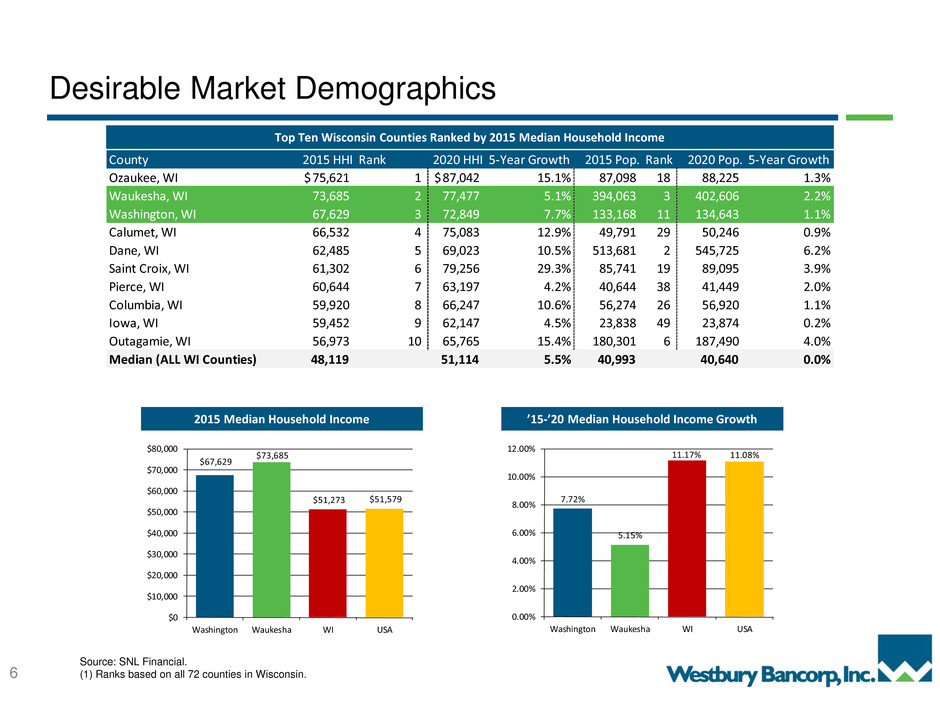
245-245-245 1-85-129 84-185-72 Desirable Market Demographics 6 Source: SNL Financial. (1) Ranks based on all 72 counties in Wisconsin. 2015 Median Household Income ’15-’20 Median Household Income Growth Top Ten Wisconsin Counties Ranked by 2015 Median Household Income $67,629 $73,685 $51,273 $51,579 $0 $10,000 $20,000 $30,000 $40,000 $50,000 $60,000 $70,000 $80,000 Washington Waukesha WI USA 7.72% 5.15% 11.17% 11.08% 0.00% 2.00% 4.00% 6.00% 8.00% 10.00% 12.00% Washington Waukesha WI USA County 2015 HHI Rank 2020 HHI 5-Year Growth 2015 Pop. Rank 2020 Pop. 5-Year Growth Ozaukee, WI 75,621$ 1 87,042$ 15.1% 87,098 18 88,225 1.3% Waukesha, WI 73,685 2 77,477 5.1% 394,063 3 402,606 2.2% Washington, WI 67,629 3 72,849 7.7% 133,168 11 134,643 1.1% Calumet, WI 66,532 4 75,083 12.9% 49,791 29 50,246 0.9% Dane, WI 62,485 5 69,023 10.5% 513,681 2 545,725 6.2% Saint roix, WI 61,302 6 79,256 29.3% 85,741 19 89,095 3.9% Pierce, WI 60,644 7 63,197 4.2% 40,644 38 41,449 2.0% Columbia, WI 59,920 8 66,247 10.6% 56,274 26 56,920 1.1% Iowa, WI 59,452 9 62,147 4.5% 23,838 49 23,874 0.2% Outagamie, WI 56,973 10 65,765 15.4% 180,301 6 187,490 4.0% Median (ALL WI Counties) 48,119 51,114 5.5% 40,993 40,640 0.0%
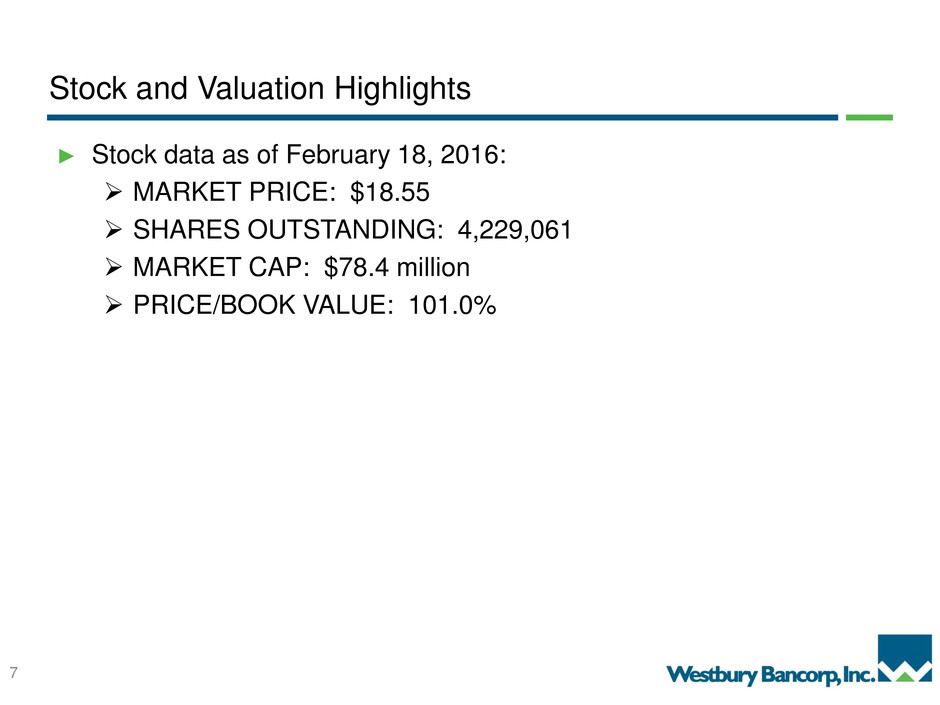
245-245-245 1-85-129 84-185-72 Stock and Valuation Highlights ► Stock data as of February 18, 2016: MARKET PRICE: $18.55 SHARES OUTSTANDING: 4,229,061 MARKET CAP: $78.4 million PRICE/BOOK VALUE: 101.0% 7

245-245-245 1-85-129 84-185-72 Stock Price Performance 8 SNL U.S. B&T (12.9)% WBB 13.3% SNL U.S. B&T 142.7% WBB 101.0% Source: SNL Financial. Market data as of 1/16/2015. One Year Relative Price Performance One Year Price-to-Tangible Book Value (25.00) (20.00) (15.00) (10.00) (5.00) 0.00 5.00 10.00 15.00 20.00 Feb-15 Mar-15 Apr-15 May-15 Jun-15 Jul-15 Aug-15 Sep-15 Oct-15 Nov-15 Dec-15 Jan-16 Feb-16 0.0 50.0 100.0 150.0 200.0 Feb-15 Mar-15 Apr-15 May-15 Jun-15 Jul-15 Aug-15 Sep-15 Oct-15 Nov-15 Dec-15 Jan-16 Feb-16
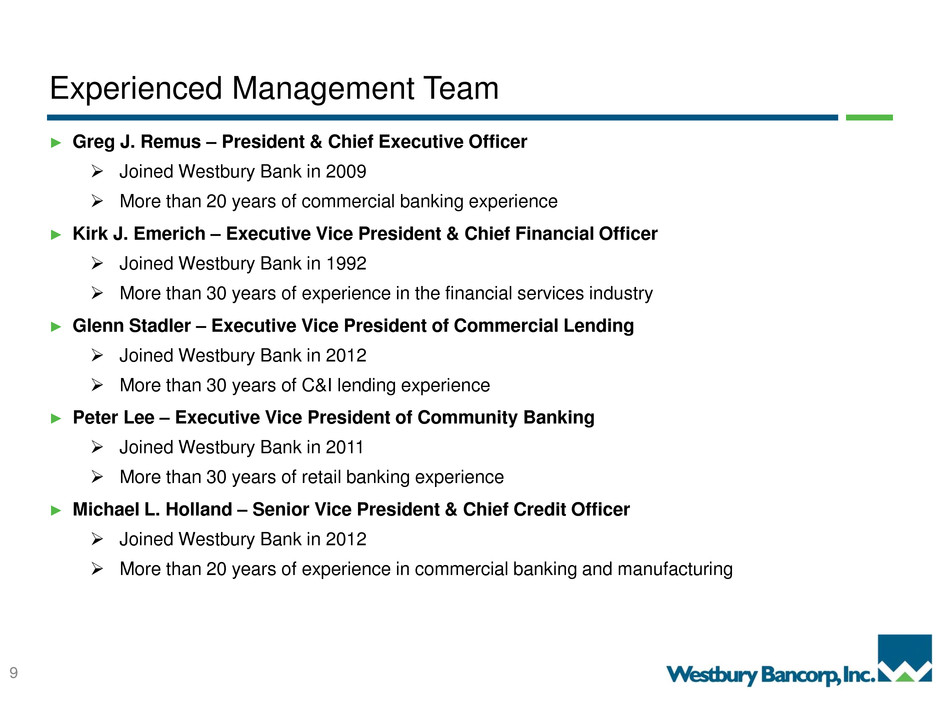
245-245-245 1-85-129 84-185-72 Experienced Management Team ► Greg J. Remus – President & Chief Executive Officer Joined Westbury Bank in 2009 More than 20 years of commercial banking experience ► Kirk J. Emerich – Executive Vice President & Chief Financial Officer Joined Westbury Bank in 1992 More than 30 years of experience in the financial services industry ► Glenn Stadler – Executive Vice President of Commercial Lending Joined Westbury Bank in 2012 More than 30 years of C&I lending experience ► Peter Lee – Executive Vice President of Community Banking Joined Westbury Bank in 2011 More than 30 years of retail banking experience ► Michael L. Holland – Senior Vice President & Chief Credit Officer Joined Westbury Bank in 2012 More than 20 years of experience in commercial banking and manufacturing 9
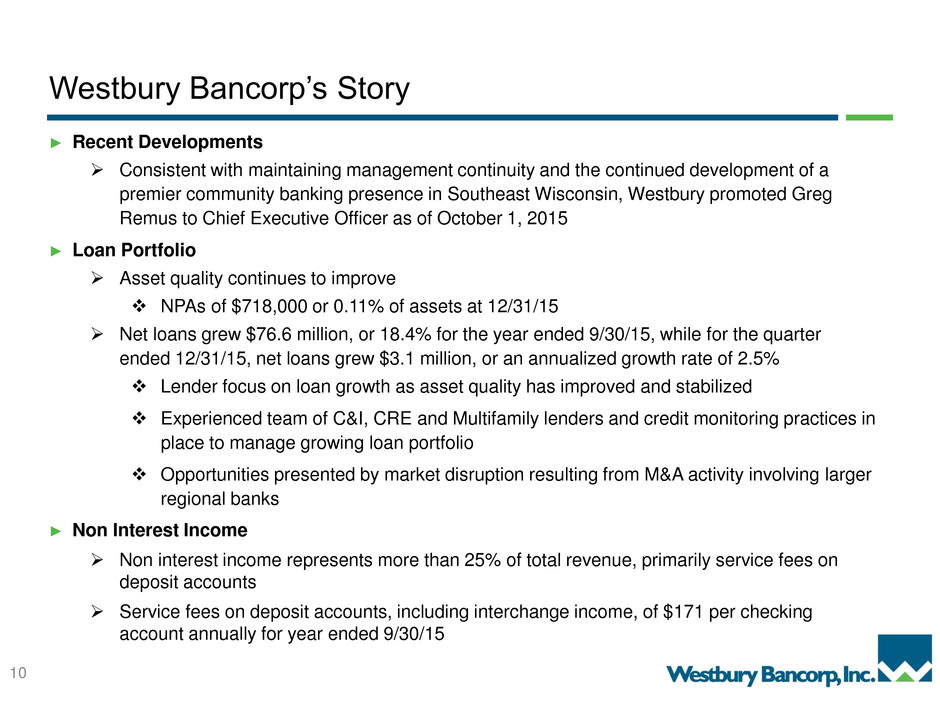
245-245-245 1-85-129 84-185-72 Westbury Bancorp’s Story ► Recent Developments Consistent with maintaining management continuity and the continued development of a premier community banking presence in Southeast Wisconsin, Westbury promoted Greg Remus to Chief Executive Officer as of October 1, 2015 ► Loan Portfolio Asset quality continues to improve NPAs of $718,000 or 0.11% of assets at 12/31/15 Net loans grew $76.6 million, or 18.4% for the year ended 9/30/15, while for the quarter ended 12/31/15, net loans grew $3.1 million, or an annualized growth rate of 2.5% Lender focus on loan growth as asset quality has improved and stabilized Experienced team of C&I, CRE and Multifamily lenders and credit monitoring practices in place to manage growing loan portfolio Opportunities presented by market disruption resulting from M&A activity involving larger regional banks ► Non Interest Income Non interest income represents more than 25% of total revenue, primarily service fees on deposit accounts Service fees on deposit accounts, including interchange income, of $171 per checking account annually for year ended 9/30/15 10
245-245-245 1-85-129 84-185-72 Westbury Bancorp’s Story – Cont’d. ► Deposits 77% of our deposits at 12/31/15 are transaction related (non CD) accounts, including over 26,000 checking accounts #1 market share in Washington County with 16.2% of total market deposits as of 12/31/15 Total deposits grew $76.1 million, or 16.7%, for year ended 9/30/15. For the quarter ended 12/31/15, deposits grew $25.1 million, or an annualized growth rate of 18.9% Opportunity for continued growth in Waukesha County market share with commercial banking presence focused in Waukesha County. Increased from $63.0 million (ranked #30) at 6/30/14 to $110.3 million (ranked #25) at 6/30/15 ► Capital Completed mutual to stock conversion in April 2013, raising gross proceeds of $50.9 million at $10.00 per share Focused on building shareholder value, as WBB repurchased 1,040,103 shares at an average price of $16.68 per share from May 2014 through December 31, 2015 Reduced Tangible Equity / Assets to 11.80% at 12/31/15 from 14.55% at 12/31/14 through stock repurchases and loan growth Price to tangible book increased from 59% at IPO to 80% in January 2014, to 101% at February 18, 2016. 11
245-245-245 1-85-129 84-185-72 Westbury Bancorp’s Story – Cont’d. ► Earnings/Efficiency Reduced operating expenses by $2.0 million in fiscal 2015 compared to fiscal 2014 Non-interest expense for the three months ended 12/31/15 of $4.7 million compared to $6.6 million (including $1.0 million related to valuation adjustments on real estate held for sale) for the three months ended 9/30/15 and $5.1 million for the three months ended 12/31/14. This is a 6% reduction year over year for the first quarter of 2016 Steady non-interest income of $1.6 to $1.8 million per quarter for the past five quarters Net interest margin has increased to $18.8 million in fiscal 2015 from $16.7 million for fiscal 2014, and to $4.9 million for the three months ended 12/31/15 from $4.1 million for the three months ended 12/31/14 Efficiency ratio of 72.3% for the three months ended 12/31/15, compared to 91.5% for the three months ended 12/31/14 Recorded recovery of deferred tax asset valuation allowance of $2.4 million in fiscal 2015 Management team will continue to focus on increasing net interest margin, improving expense control and continued improvement in efficiency ratio in 2016 12
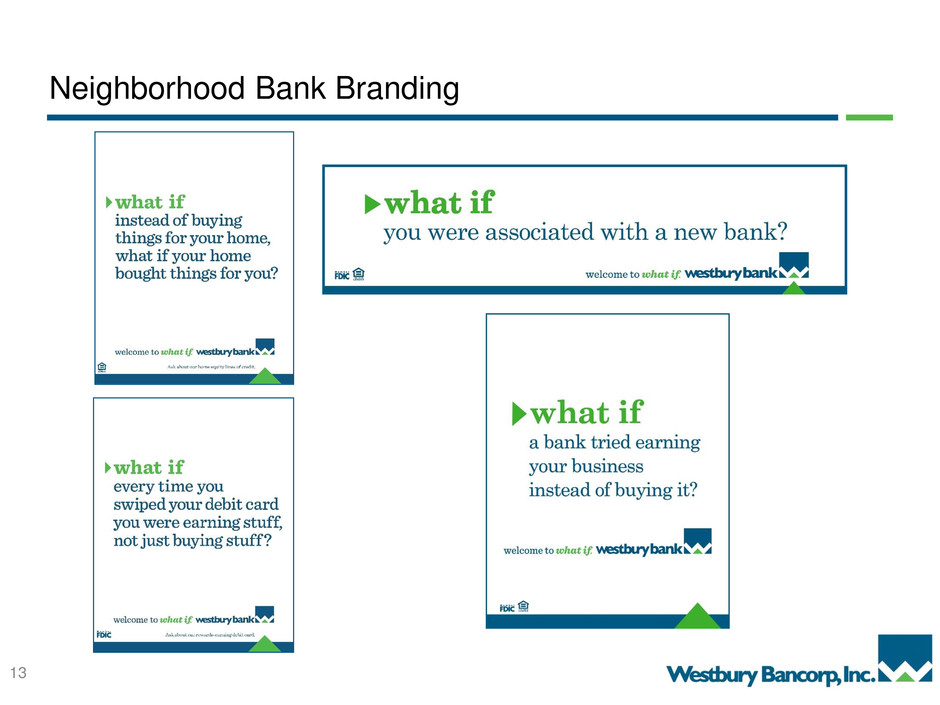
245-245-245 1-85-129 84-185-72 Neighborhood Bank Branding 13
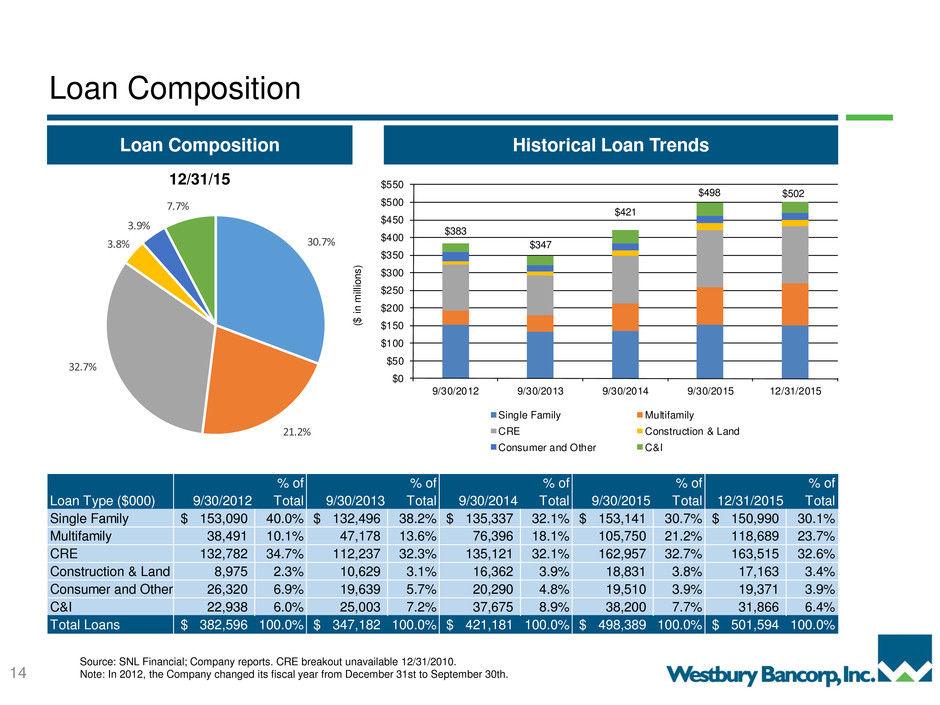
245-245-245 1-85-129 84-185-72 Loan Composition Historical Loan Trends Loan Composition Source: SNL Financial; Company reports. CRE breakout unavailable 12/31/2010. Note: In 2012, the Company changed its fiscal year from December 31st to September 30th. 14 12/31/15 30.7% 21.2% 32.7% 3.8% 3.9% 7.7% % of % of % of % of % of Loan Type ($000) 9/30/2012 Total 9/30/2013 Total 9/30/2014 Total 9/30/2015 Total 12/31/2015 Total Single Family 153,090$ 40.0% 132,496$ 38.2% 135,337$ 32.1% 153,141$ 30.7% 150,990$ 30.1% Multifamily 38,491 10.1 47,178 13.6 76,396 18.1 105,750 21.2 118,689 23.7 CRE 132,782 34.7% 112,237 32.3% 135,121 32.1% 162,957 32.7% 163,515 32.6% Construction & Land 8,975 2.3 10,629 3.1 16,362 3.9 18,831 3.8 17,163 3.4 Consumer and Other 26,320 6.9% 19,639 5.7% 20,290 4.8% 19,510 3.9% 19,371 3.9% C&I 22,938 6.0 25,003 7.2 37,675 8.9 38,200 7.7 31,866 6.4 Total Loans 382,596$ 100.0% 347,182$ 100.0% 421,181$ 100.0% 498,389$ 100.0% 501,594$ 100.0% $383 $347 $421 $498 $502 $0 $50 $100 $150 $200 $250 $300 $350 $400 $450 $500 $550 9/30/2012 9/30/2013 9/30/2014 9/30/2015 12/31/2015 ($ in mil lion s) Single Family Multifamily CRE Construction & Land Consumer and Other C&I

245-245-245 1-85-129 84-185-72 Deposit Composition Historical Deposit Trends Deposit Composition Source: SNL Financial; Company reports. Note: In 2012, the Company changed its fiscal year from December 31st to September 30th. 15 12/31/15 18.5% 58.0% 23.5% % of % of % of % of % of Deposit Type ($000) 9/30/2012 Total 9/30/2013 Total 9/30/2014 Total 9/30/2015 Total 12/31/2015 Total Non-interest Bearing 67,033$ 14.4% 72,331$ 16.4% 77,790$ 17.1% 101,486$ 19.1% 101,486$ 18.5% Savings, NOW, MMA 290,800 62.3 278,940 63.3 280,767 61.7 307,275 57.9 318,654 5 .0 CDs 108,925 23. % 89,707 20. % 96,371 2 .2% 122,259 23.0% 129,120 23.5% Total Deposits 466,758$ 100.0 440,978$ 10 .0 454,928$ 100.0 531,020$ 100. 549,260$ 100.0 $467 $441 $455 $531 $0 $100 $200 $300 $400 $500 $600 9/30/2012 9/30/2013 9/30/2014 9/30/2015 12/31/2015 ($ in mil lion s) Non-interest Bearing Savings, NOW, MMA CDs $549
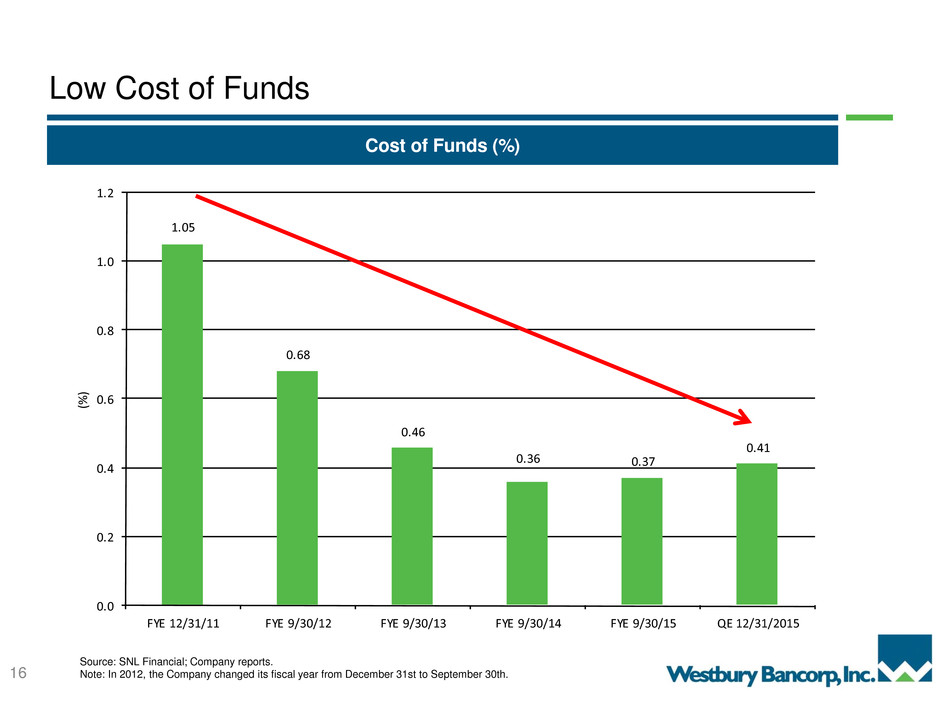
245-245-245 1-85-129 84-185-72 1.05 0.68 0.46 0.36 0.37 0.41 0.0 0.2 0.4 0.6 0.8 1.0 1.2 FYE 12/31/11 FYE 9/30/12 FYE 9/30/13 FYE 9/30/14 FYE 9/30/15 QE 12/31/2015 (% ) Low Cost of Funds Cost of Funds (%) Source: SNL Financial; Company reports. Note: In 2012, the Company changed its fiscal year from December 31st to September 30th. 16
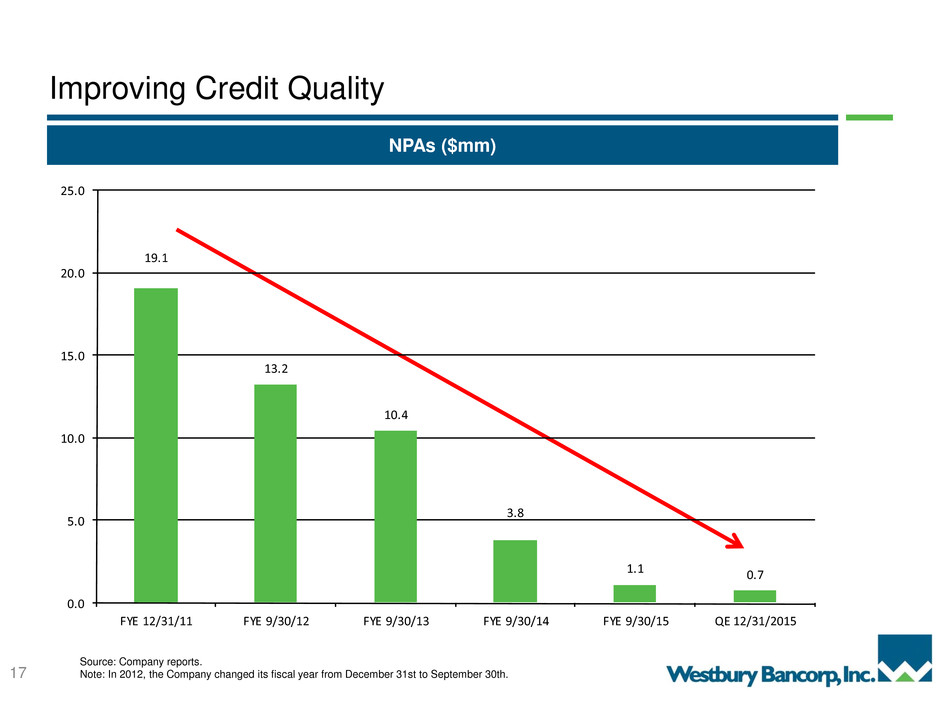
245-245-245 1-85-129 84-185-72 NPAs ($mm) Improving Credit Quality Source: Company reports. Note: In 2012, the Company changed its fiscal year from December 31st to September 30th. 17 19.1 13.2 10.4 3.8 1.1 0.7 0.0 5.0 10.0 15.0 20.0 25.0 FYE 12/31/11 FYE 9/30/12 FYE 9/30/13 FYE 9/30/14 FYE 9/30/15 QE 12/31/2015
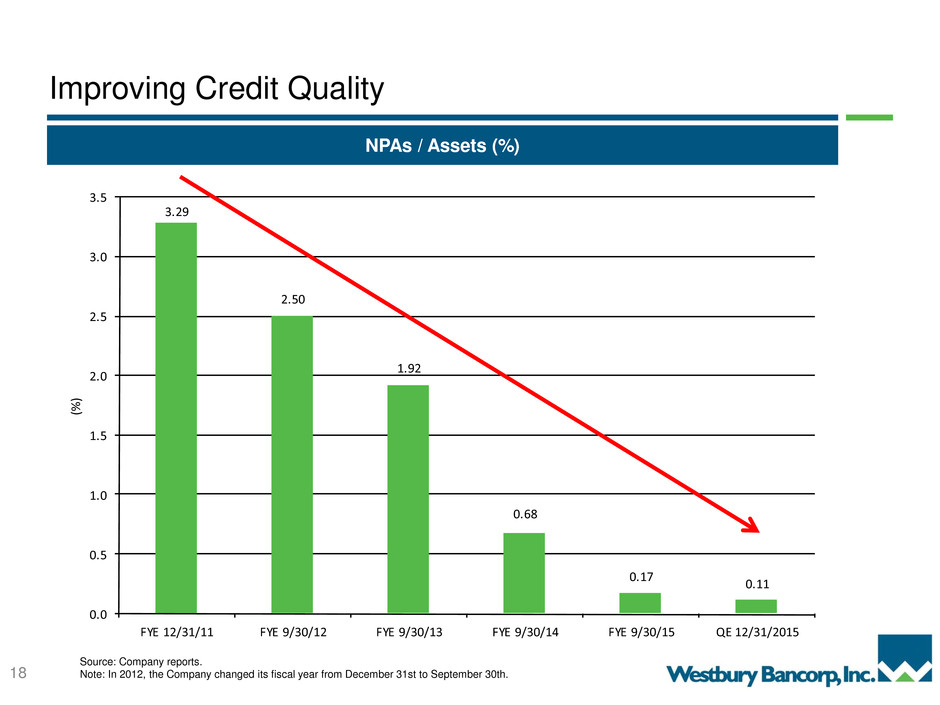
245-245-245 1-85-129 84-185-72 3.29 2.50 1.92 0.68 0.17 0.11 0.0 0.5 1.0 1.5 2.0 2.5 3.0 3.5 FYE 12/31/11 FYE 9/30/12 FYE 9/30/13 FYE 9/30/14 FYE 9/30/15 QE 12/31/2015 (% ) NPAs / Assets (%) Source: Company reports. Note: In 2012, the Company changed its fiscal year from December 31st to September 30th. Improving Credit Quality 18
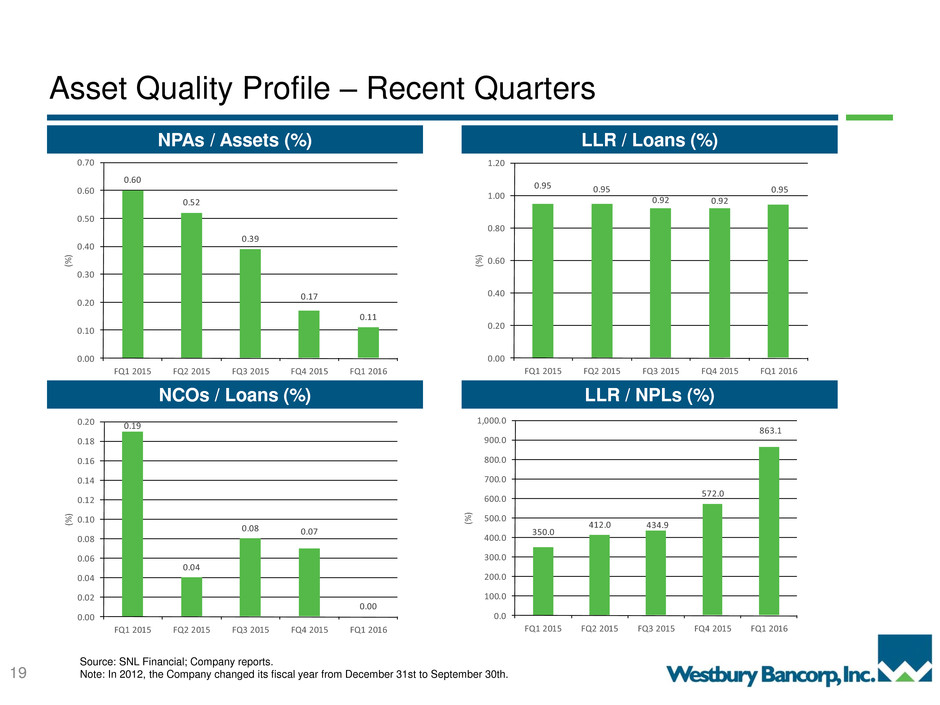
245-245-245 1-85-129 84-185-72 Asset Quality Profile – Recent Quarters NPAs / Assets (%) LLR / NPLs (%) NCOs / Loans (%) LLR / Loans (%) Source: SNL Financial; Company reports. Note: In 2012, the Company changed its fiscal year from December 31st to September 30th. 19 0.95 0.95 0.92 0.92 0.95 0.00 0.20 0.40 0.60 0.80 1.00 1.20 FQ1 2015 FQ2 2015 FQ3 2015 FQ4 2015 FQ1 2016 (% ) 0.19 0.04 0.08 0.07 0.00 0.00 0.02 0.04 0.06 0.08 0.10 0.12 0.14 0.16 0.18 0.20 FQ1 2015 FQ2 2015 FQ3 2015 FQ4 2015 FQ1 2016 (% ) 0.60 0.52 0.39 0.17 0.11 .0 0.10 0.20 0.30 0.40 0.50 0.60 0.70 FQ1 2015 FQ2 2015 FQ3 2015 FQ4 2015 FQ1 2016 (% ) 350.0 412.0 434.9 572.0 863.1 0.0 100.0 200.0 300.0 400.0 500.0 600.0 700.0 800.0 900.0 1,000.0 FQ1 2015 FQ2 2015 FQ3 20 5 FQ4 2015 FQ1 2016 (% )

245-245-245 1-85-129 84-185-72 Strong Capital Position ► Westbury maintains a low risk profile with strong capital levels Strong Capital Levels Source: SNL Financial; Company reports. Note: In 2012, the Company changed its fiscal year from December 31st to September 30th. 20 8.0 8.9 16.7 15.2 12.3 11.8 0.0 2.0 4.0 6.0 8.0 10.0 12.0 14.0 16.0 18.0 FYE 12/31/11 FYE 9/30/2012 FYE 9/30/2013 FYE 9/30/2014 FYE 9/30/15 QE 12/31/15 Ta ng . C om mo n E qu ity / Ta ng . A sse ts (% )
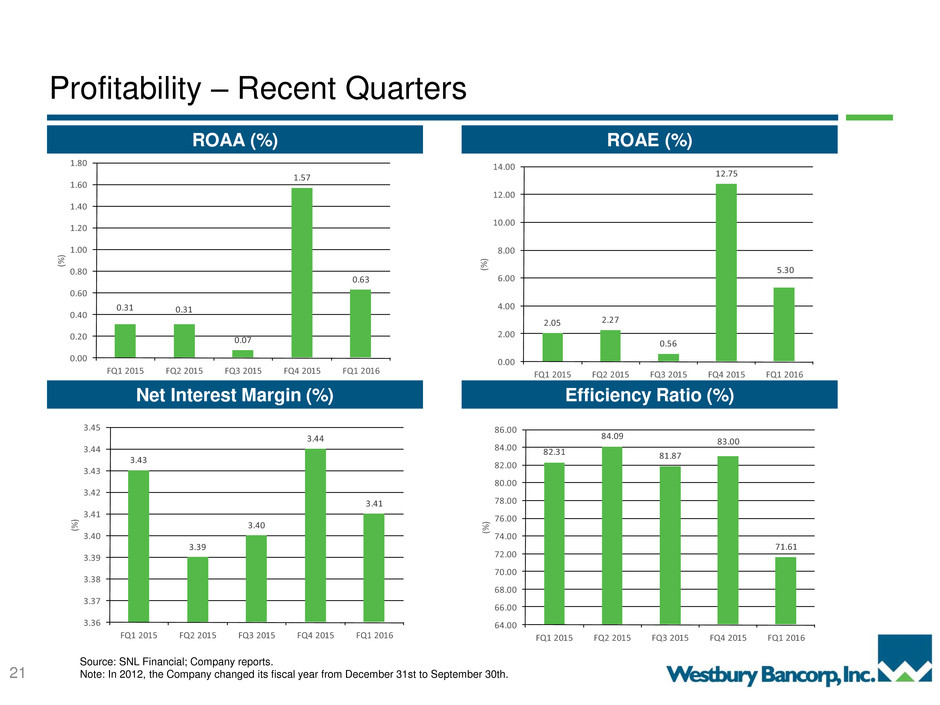
245-245-245 1-85-129 84-185-72 Profitability – Recent Quarters ROAA (%) Efficiency Ratio (%) Net Interest Margin (%) ROAE (%) Source: SNL Financial; Company reports. Note: In 2012, the Company changed its fiscal year from December 31st to September 30th. 21 0.31 0.31 0.07 1.57 0.63 0.00 0.20 0.40 0.60 0.80 1.00 1.20 1.40 1.60 1.80 FQ1 2015 FQ2 2015 FQ3 2015 FQ4 2015 FQ1 2016 (% ) 2.05 2.27 0.56 12.75 5.30 0.00 2.00 4.00 6.00 8.00 10.00 12.00 14.00 FQ1 2015 FQ2 2015 FQ3 2015 FQ4 2015 FQ1 2016 (% ) 3.43 3.39 3.40 3.44 3.41 3.36 3.37 3.38 3.39 3.40 3.41 3.42 3.43 3.44 3.45 FQ1 2015 FQ2 2015 FQ3 2015 FQ4 2015 FQ1 2016 (% ) 82.31 84.09 81.87 83.00 71.61 64.00 66.00 68.00 70.00 72.00 74.00 76.00 78 80.00 82.00 84.00 86.00 FQ1 2015 FQ2 2015 FQ3 20 5 FQ4 2015 FQ1 2016 (% )
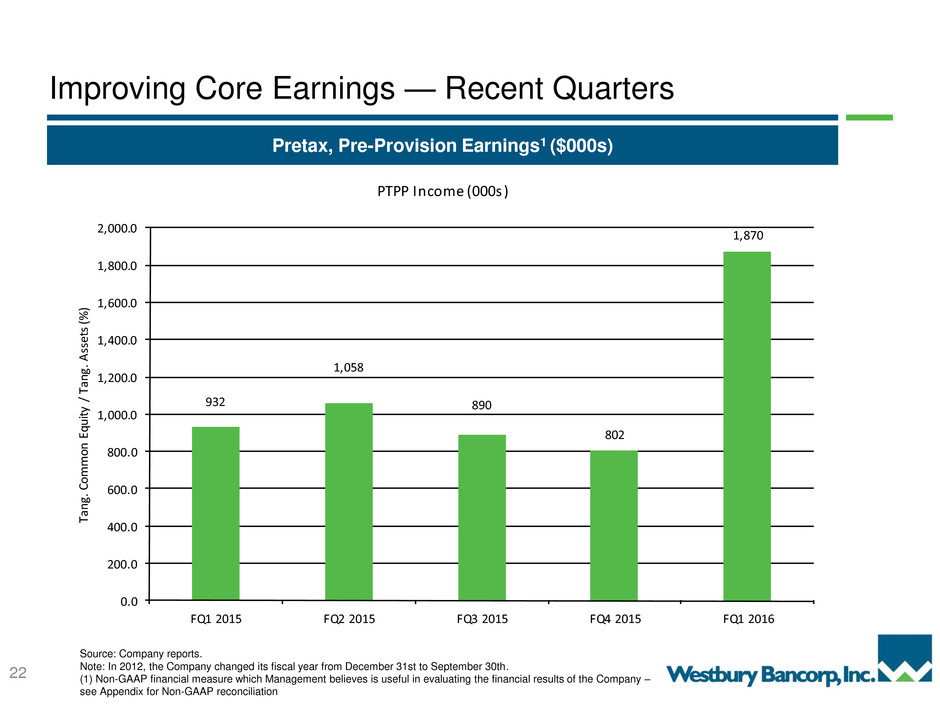
245-245-245 1-85-129 84-185-72 Pretax, Pre-Provision Earnings1 ($000s) Source: Company reports. Note: In 2012, the Company changed its fiscal year from December 31st to September 30th. (1) Non-GAAP financial measure which Management believes is useful in evaluating the financial results of the Company – see Appendix for Non-GAAP reconciliation Improving Core Earnings — Recent Quarters 22 932 1,058 890 802 1,870 0.0 200.0 400.0 600.0 800.0 1,000.0 1,200.0 1,400.0 1,600.0 1,800.0 2,000.0 FQ1 2015 FQ2 2015 FQ3 2015 FQ4 2015 FQ1 2016 Ta ng . C om mo n E qu ity / Ta ng . A sse ts (% ) PTPP Income (000s)

245-245-245 1-85-129 84-185-72 Shareholder Focus ► Grow earnings organically Infrastructure/leadership team in place/deep bench of talent Impact of loan growth and branch closings beginning to show in quarterly results Loyal local customer base including core deposits Located in two of Wisconsin’s higher growth markets impacted by disruption of large regional banks Strong market share Clean balance sheet ► Active capital management Focus on growth in book value per share Continuation of stock repurchase programs Board will continue to consider the possibility of implementing a quarterly cash dividend 23
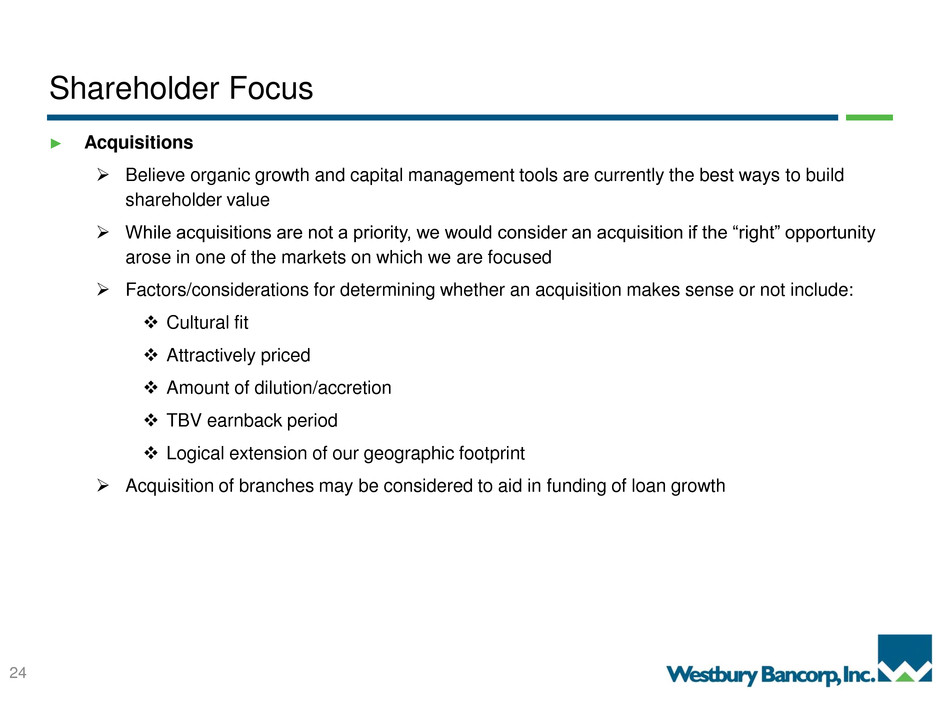
245-245-245 1-85-129 84-185-72 Shareholder Focus ► Acquisitions Believe organic growth and capital management tools are currently the best ways to build shareholder value While acquisitions are not a priority, we would consider an acquisition if the “right” opportunity arose in one of the markets on which we are focused Factors/considerations for determining whether an acquisition makes sense or not include: Cultural fit Attractively priced Amount of dilution/accretion TBV earnback period Logical extension of our geographic footprint Acquisition of branches may be considered to aid in funding of loan growth 24
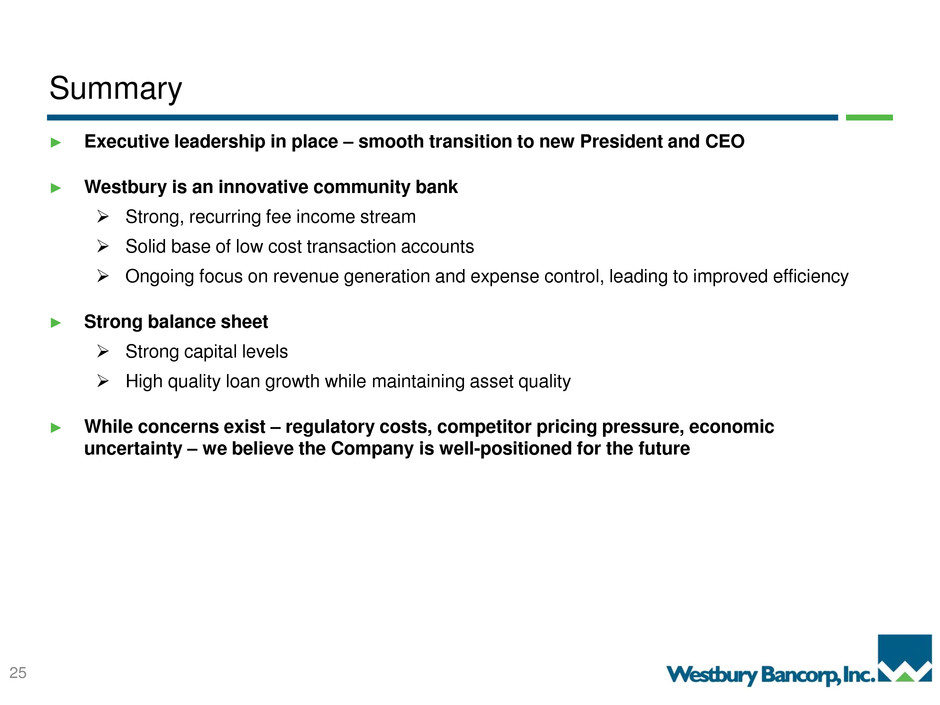
245-245-245 1-85-129 84-185-72 Summary ► Executive leadership in place – smooth transition to new President and CEO ► Westbury is an innovative community bank Strong, recurring fee income stream Solid base of low cost transaction accounts Ongoing focus on revenue generation and expense control, leading to improved efficiency ► Strong balance sheet Strong capital levels High quality loan growth while maintaining asset quality ► While concerns exist – regulatory costs, competitor pricing pressure, economic uncertainty – we believe the Company is well-positioned for the future 25

245-245-245 1-85-129 84-185-72 Questions?

245-245-245 1-85-129 84-185-72 Appendix
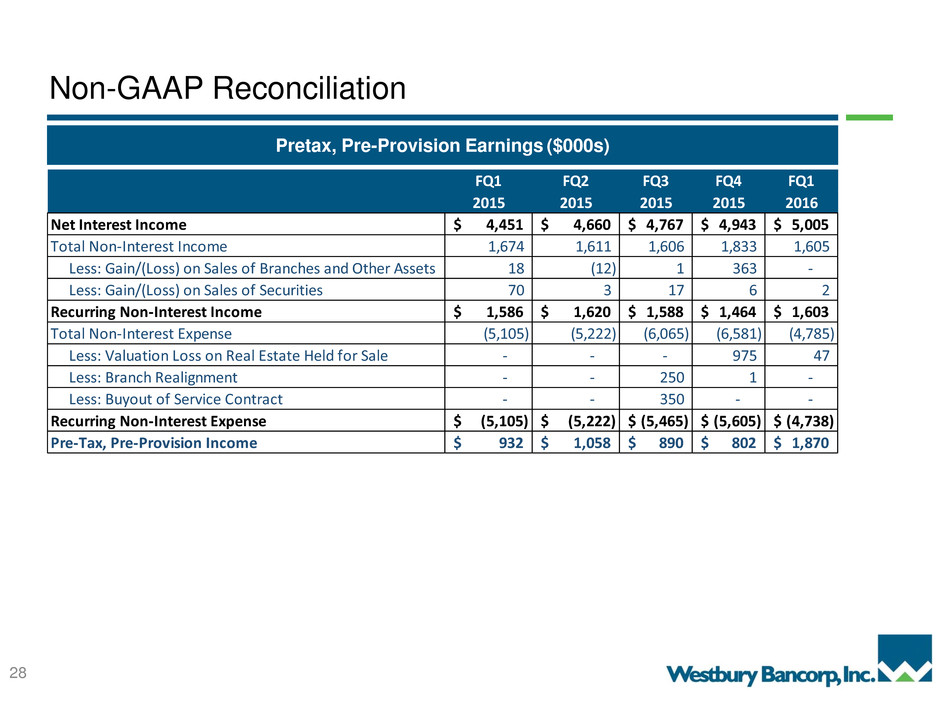
245-245-245 1-85-129 84-185-72 Pretax, Pre-Provision Earnings ($000s) Non-GAAP Reconciliation 28 FQ1 FQ2 FQ3 FQ4 FQ1 2015 2015 2015 2015 2016 Net Interest Income 4,451$ 4,660$ 4,767$ 4,943$ 5,005$ Total Non-Interest Income 1,674 1,611 1,606 1,833 1,605 Less: Gain/(Loss) on Sales of Branches and Other Assets 18 (12) 1 363 - Less: Gain/(Loss) on Sales of Securities 70 3 17 6 2 Recurring Non-Interest Income 1,586$ 1,620$ 1,588$ 1,464$ 1,603$ Total N -Interest Expense (5,105) (5,222) (6,065) (6,581) (4,785) Less: Valuation Loss on Real Estate Held for Sale - - - 975 47 Less: Branch Realignment - - 250 1 - Less: Buyout of Service Contract - - 350 - - Recurring Non-Interest Expense (5,105)$ (5,222)$ (5,465)$ (5,605)$ (4,738)$ Pre-Tax, Pre-Provision Income 932$ 1,058$ 890$ 802$ 1,870$
