Attached files
| file | filename |
|---|---|
| 8-K - KIMBALL INTERNATIONAL, INC. FORM 8-K - KIMBALL INTERNATIONAL INC | form8-k12102015.htm |
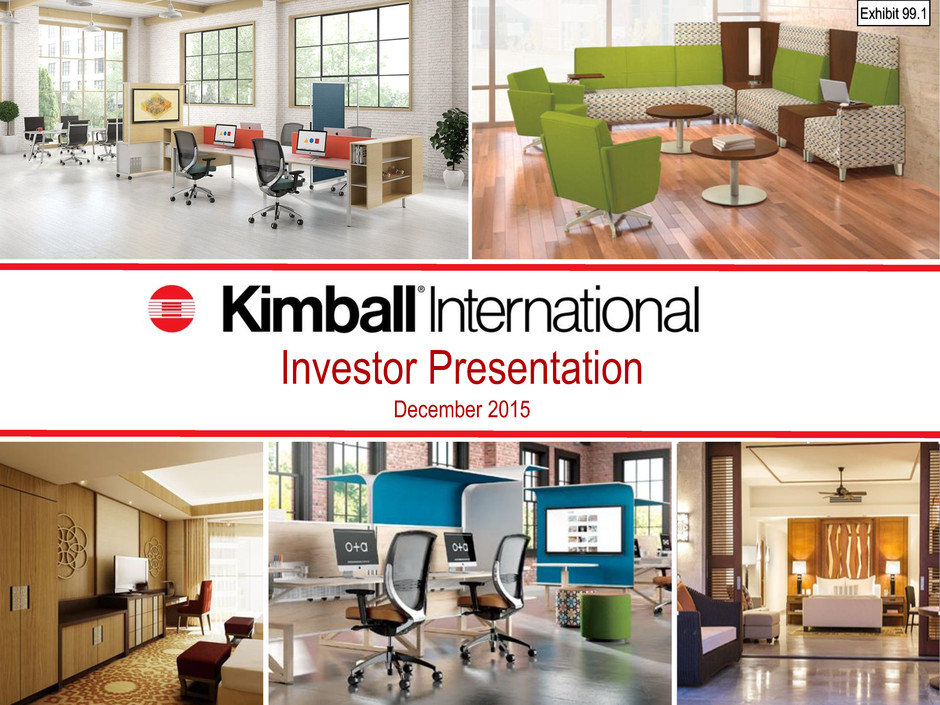
176 0 0 137 132 126 237 23 23 46 46 46 51 132 156 252 202 59 Investor Presentation December 2015 Exhibit 99.1
176 0 0 137 132 126 237 23 23 46 46 46 51 132 156 252 202 59 Page 2 Safe Harbor Statement Certain statements contained within this presentation may be considered forward-looking under the Private Securities Litigation Reform Act of 1995 and are subject to risks and uncertainties including, but not limited to, the risk that any projections or guidance, including revenues, margins, earnings, or any other financial results are not realized, the successful completion of the restructuring plan, our ability to fully realize the expected benefits of the restructuring plan, adverse changes in the global economic conditions, significant volume reductions from key contract customers, significant reduction in customer order patterns, financial stability of key customers and suppliers, and availability or cost of raw materials. Additional cautionary statements regarding other risk factors that could have an effect on the future performance of the Company are contained in the Company’s Form 10-K filing for the fiscal year ended June 30, 2015 and other filings with the Securities and Exchange Commission.
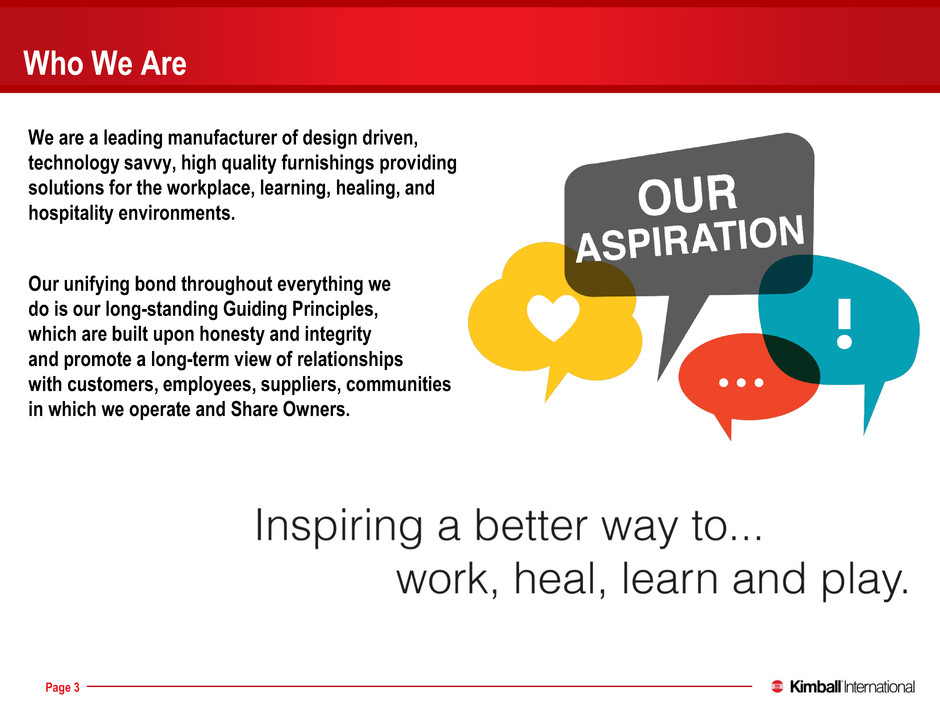
176 0 0 137 132 126 237 23 23 46 46 46 51 132 156 252 202 59 Page 3 We are a leading manufacturer of design driven, technology savvy, high quality furnishings providing solutions for the workplace, learning, healing, and hospitality environments. Our unifying bond throughout everything we do is our long-standing Guiding Principles, which are built upon honesty and integrity and promote a long-term view of relationships with customers, employees, suppliers, communities in which we operate and Share Owners. Who We Are
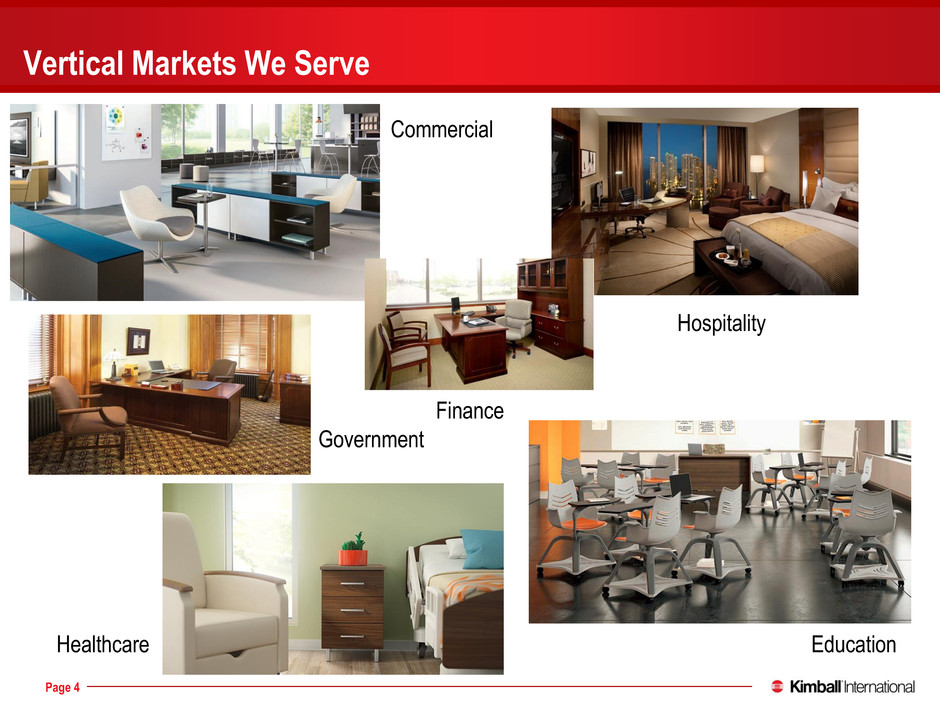
176 0 0 137 132 126 237 23 23 46 46 46 51 132 156 252 202 59 Page 4 Vertical Markets We Serve Commercial Government Hospitality Education Healthcare Finance
176 0 0 137 132 126 237 23 23 46 46 46 51 132 156 252 202 59 Page 5 Brands Representative Customers Design driven, tech savvy brand tailoring solutions that provide better workplace, learning and healing environments. Our broad product portfolio offers unlimited possibilities that are inspiring, productive, and environmentally responsible In-room and public space furniture solutions for hotel properties, condominiums, and mixed use developments. Largest hotel in-room casegoods and seating manufacturer in the US. Furniture solutions to address a variety of industries and price points, including private offices, open/collaborative, conference/training rooms, lobby and dining/lounge areas Our Brands and Who We Serve
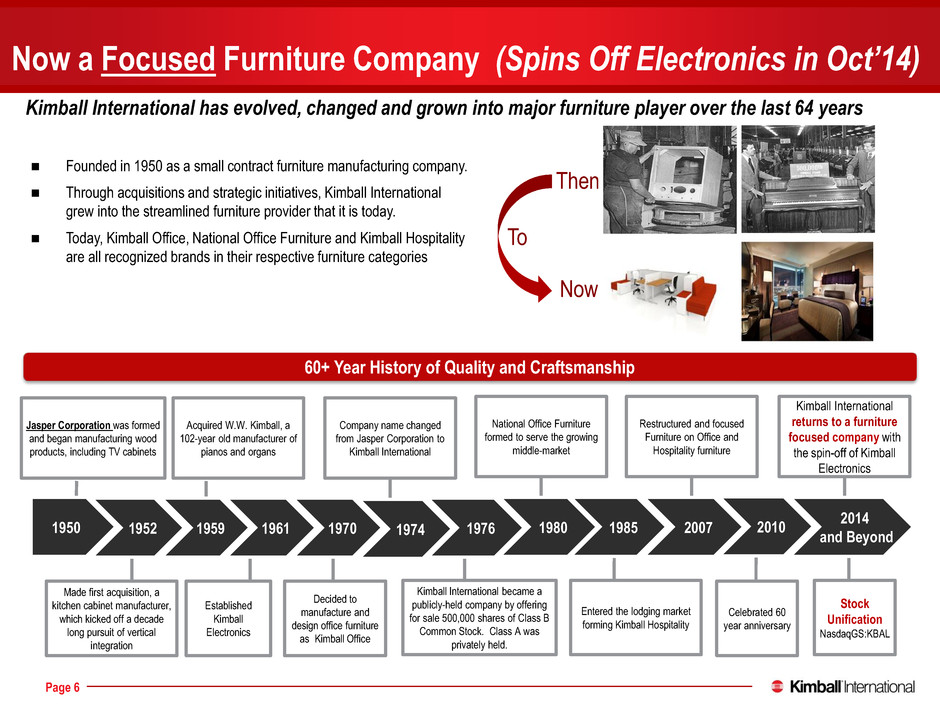
176 0 0 137 132 126 237 23 23 46 46 46 51 132 156 252 202 59 Page 6 Now a Focused Furniture Company (Spins Off Electronics in Oct’14) 60+ Year History of Quality and Craftsmanship Founded in 1950 as a small contract furniture manufacturing company. Through acquisitions and strategic initiatives, Kimball International grew into the streamlined furniture provider that it is today. Today, Kimball Office, National Office Furniture and Kimball Hospitality are all recognized brands in their respective furniture categories Celebrated 60 year anniversary Made first acquisition, a kitchen cabinet manufacturer, which kicked off a decade long pursuit of vertical integration Jasper Corporation was formed and began manufacturing wood products, including TV cabinets Acquired W.W. Kimball, a 102-year old manufacturer of pianos and organs Decided to manufacture and design office furniture as Kimball Office Company name changed from Jasper Corporation to Kimball International Kimball International became a publicly-held company by offering for sale 500,000 shares of Class B Common Stock. Class A was privately held. Restructured and focused Furniture on Office and Hospitality furniture National Office Furniture formed to serve the growing middle-market 1950 1952 1959 1974 1970 1985 1980 2007 2010 1976 Entered the lodging market forming Kimball Hospitality Kimball International returns to a furniture focused company with the spin-off of Kimball Electronics 2014 and Beyond Kimball International has evolved, changed and grown into major furniture player over the last 64 years Then Now To Stock Unification NasdaqGS:KBAL 1961 Established Kimball Electronics
176 0 0 137 132 126 237 23 23 46 46 46 51 132 156 252 202 59 Page 7 Award Winning and Recognized Furniture Brands – Now Focused on Furniture Favorable Industry Dynamics Increased Dividend 10% September, 2015 – Dividend Yield of 2.4% Restructuring Plan Announced – Expected Completion Sooner Than Planned Significant Increase In New Product Introductions – 33% NPI Sales Increase in Q1’16 Why Invest in Us Improving Financial Performance – Tracking to 8% Operating Income Goal
176 0 0 137 132 126 237 23 23 46 46 46 51 132 156 252 202 59 Page 8 Heightened Focus on Achieving 8% Operating Income Established Brand Presidents – Put Authority Closer to Markets Announced Restructuring Plan to Reduce Excess Capacity: – Post Falls Idaho Manufacturing Facility Exit - $5M Annual Savings Beginning FY Q1’17 – Sale Of Air Plane Focused on Executive Travel - $800K Annual Savings Being Realized Began Utilizing Office Furniture Mfg. Capacity For Hospitality Orders Adjusted Compensation – Established Relative Total Shareowner Return Plan for CEO, COO, and CFO – Adjusted Incentive Comp Plan to Increase Difficulty Began Cultural Change to Promote Collaboration, Teamwork, and Speed A New Day Key Operating Changes Since 10/31/14 Spin-off Of Electronics

176 0 0 137 132 126 237 23 23 46 46 46 51 132 156 252 202 59 Page 9 Established Lead Independent Director of the Board A New Day Key Governance Changes Since 10/31/14 Spin-off Of Electronics Unified Two-Class Stock Structure-All Shares Now With Equal Voting Established Resignation Policy for Board Members Not Receiving Majority Vote in an Uncontested Election Implemented Restrictions on Hedging/Pledging Company Shares Modernized Change-In-Control Agreements Retirements of Former CEO and Chairman at Spin
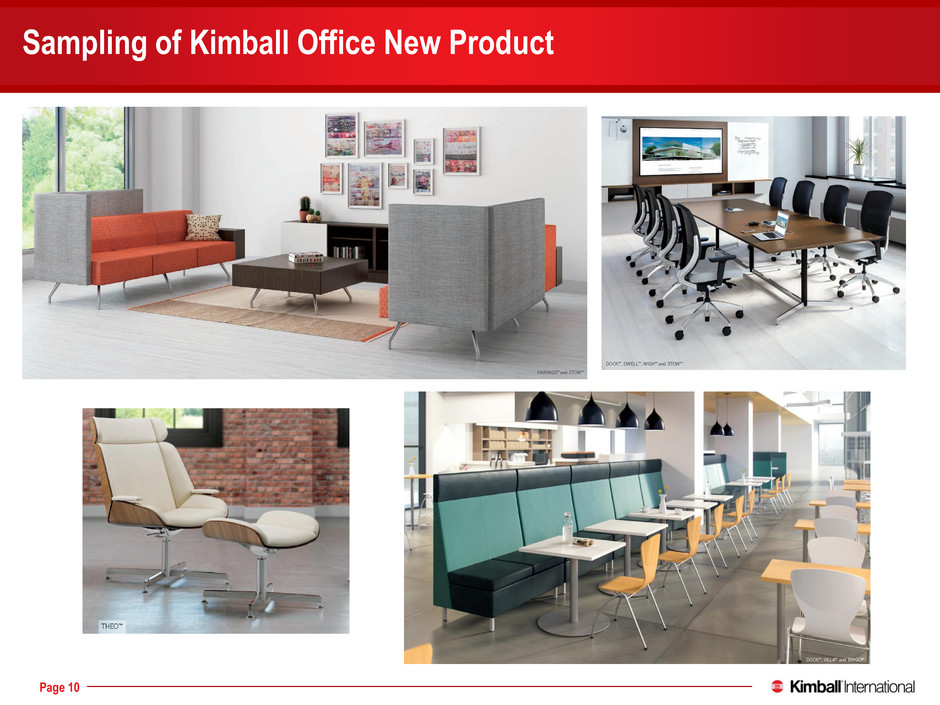
176 0 0 137 132 126 237 23 23 46 46 46 51 132 156 252 202 59 Page 10 Sampling of Kimball Office New Product
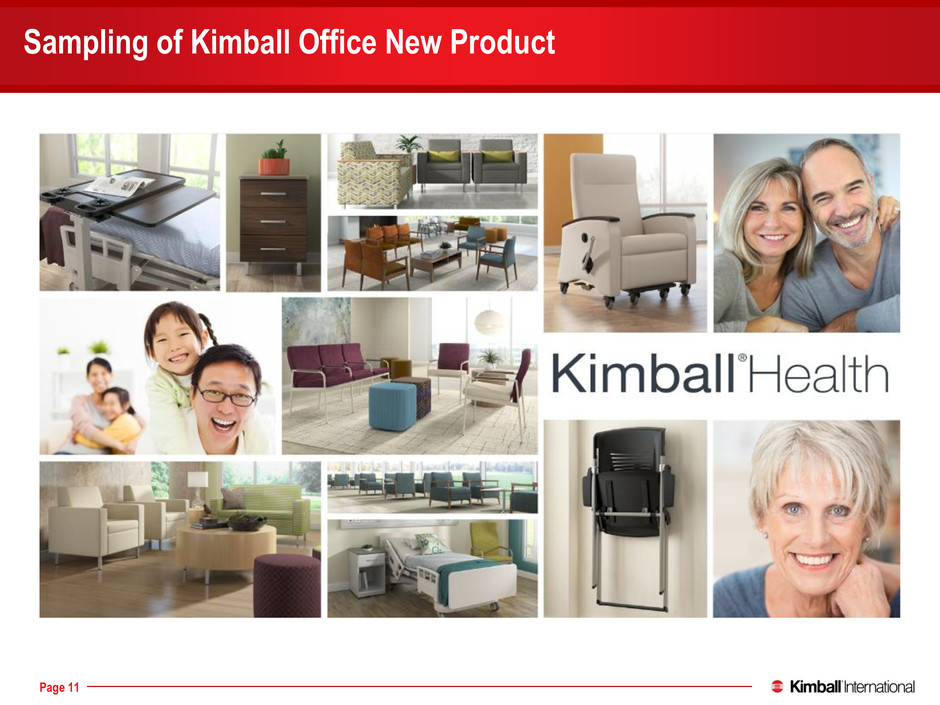
176 0 0 137 132 126 237 23 23 46 46 46 51 132 156 252 202 59 Page 11 Sampling of Kimball Office New Product
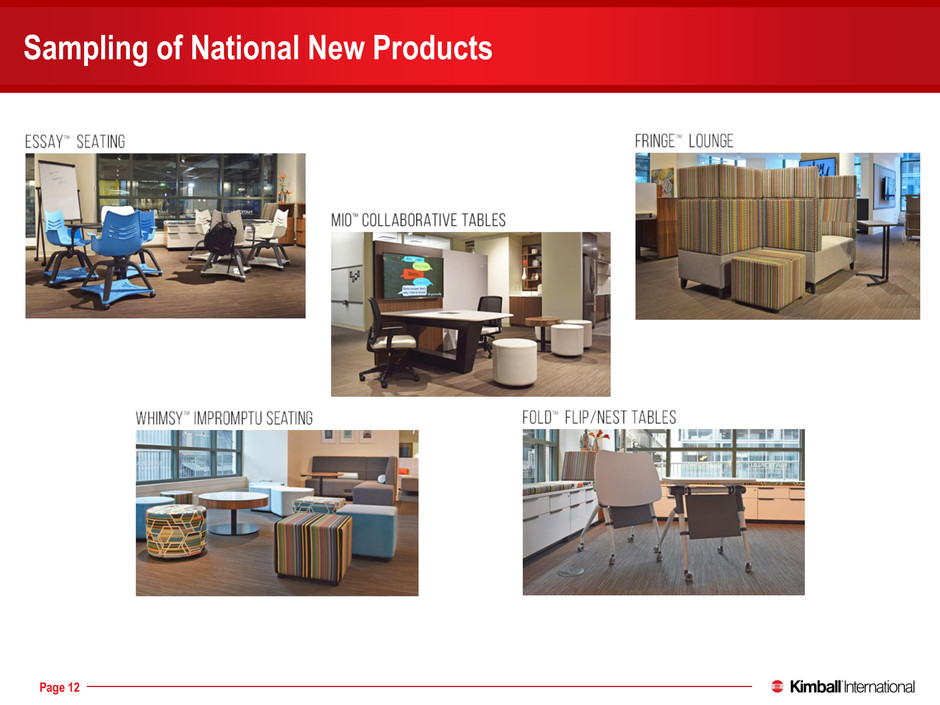
176 0 0 137 132 126 237 23 23 46 46 46 51 132 156 252 202 59 Page 12 Sampling of National New Products
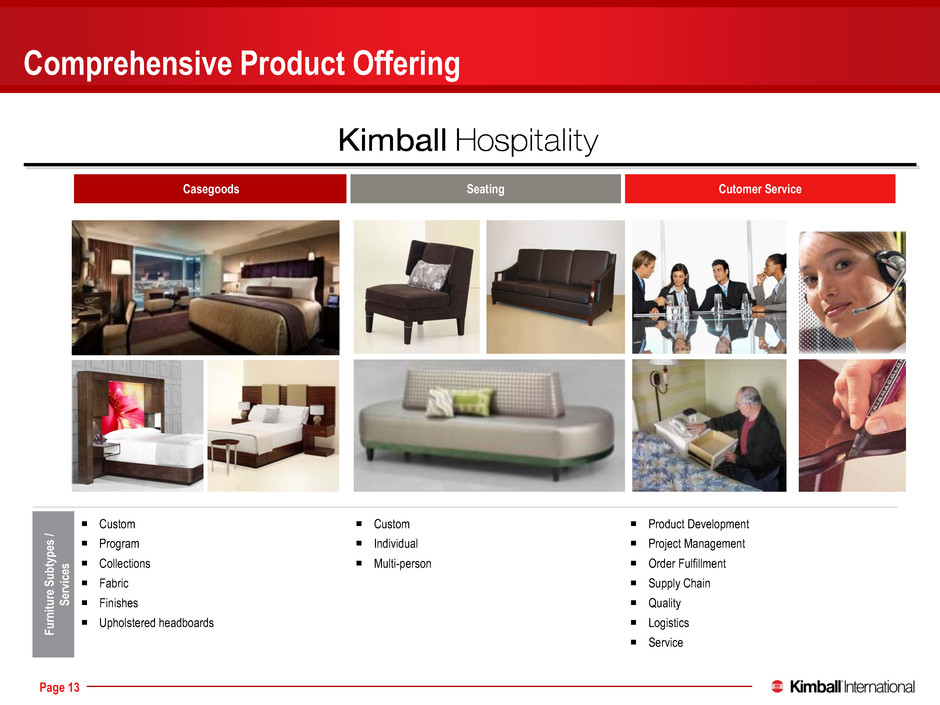
176 0 0 137 132 126 237 23 23 46 46 46 51 132 156 252 202 59 Page 13 Comprehensive Product Offering Casegoods Seating Cutomer Service Fu rni tur e Su bty pe s / Se rvi ce s Custom Program Collections Fabric Finishes Upholstered headboards Custom Individual Multi-person Product Development Project Management Order Fulfillment Supply Chain Quality Logistics Service
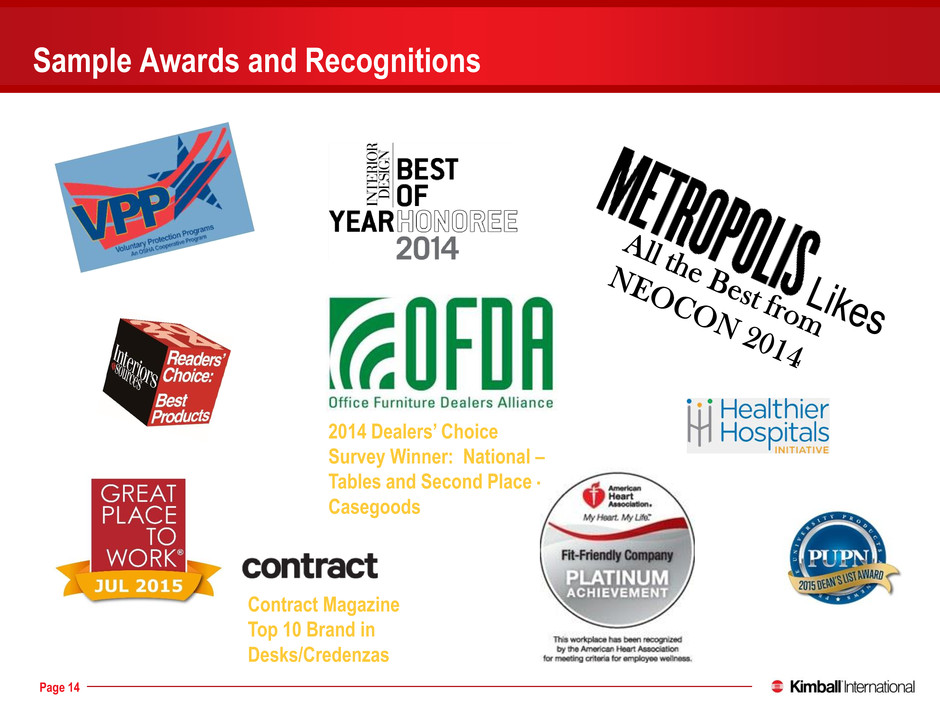
176 0 0 137 132 126 237 23 23 46 46 46 51 132 156 252 202 59 Page 14 2014 Dealers’ Choice Survey Winner: National – Tables and Second Place - Casegoods Sample Awards and Recognitions Contract Magazine Top 10 Brand in Desks/Credenzas

176 0 0 137 132 126 237 23 23 46 46 46 51 132 156 252 202 59 Furniture Industry Indicators
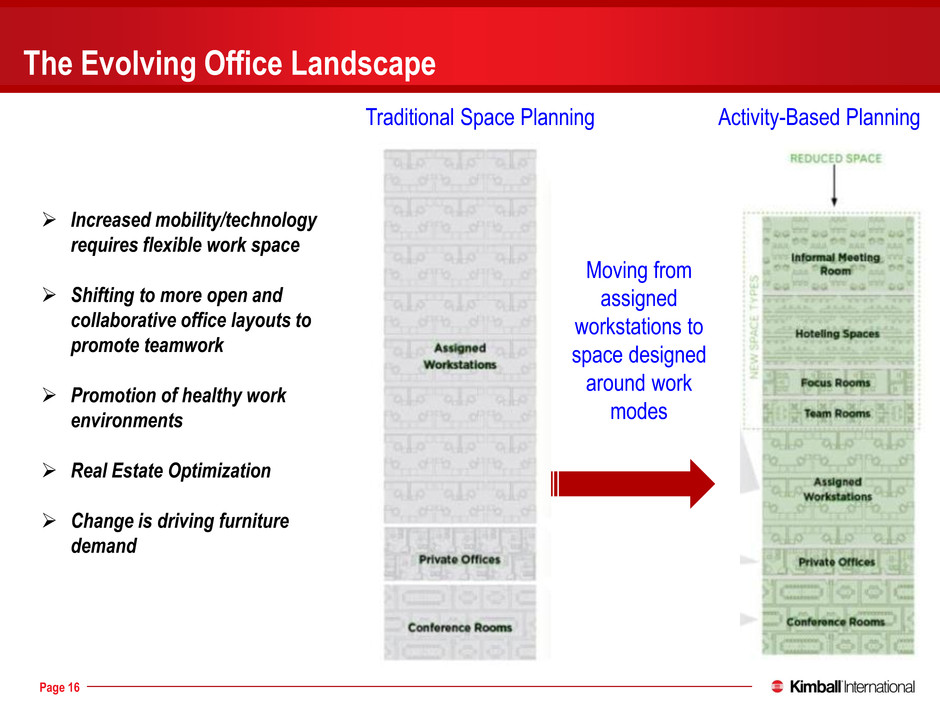
176 0 0 137 132 126 237 23 23 46 46 46 51 132 156 252 202 59 Page 16 The Evolving Office Landscape Increased mobility/technology requires flexible work space Shifting to more open and collaborative office layouts to promote teamwork Promotion of healthy work environments Real Estate Optimization Change is driving furniture demand Traditional Space Planning Activity-Based Planning Moving from assigned workstations to space designed around work modes
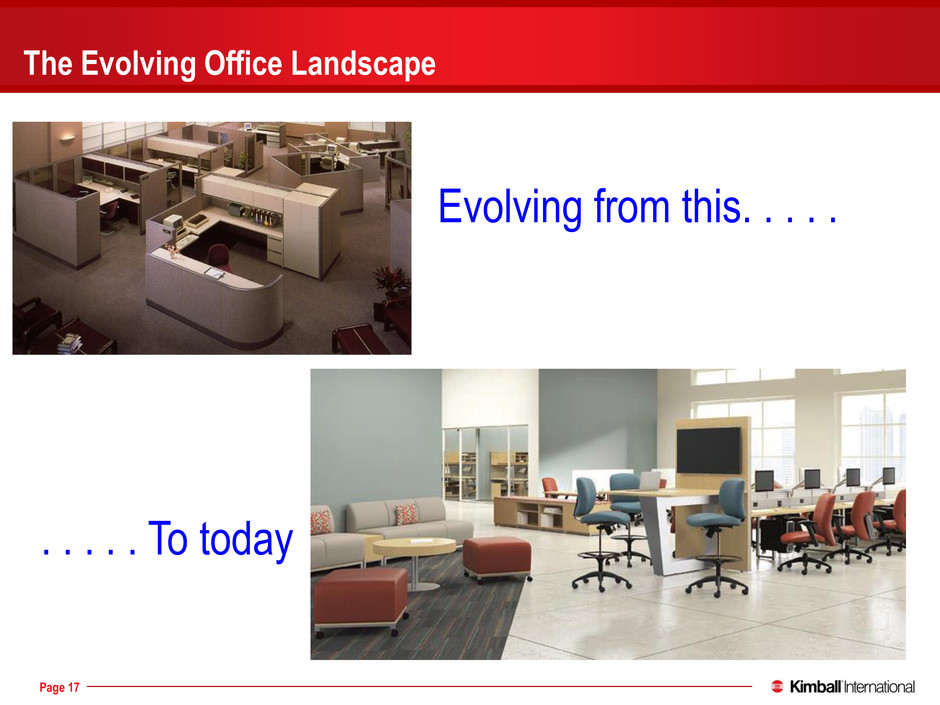
176 0 0 137 132 126 237 23 23 46 46 46 51 132 156 252 202 59 Page 17 The Evolving Office Landscape Evolving from this. . . . . . . . . . To today
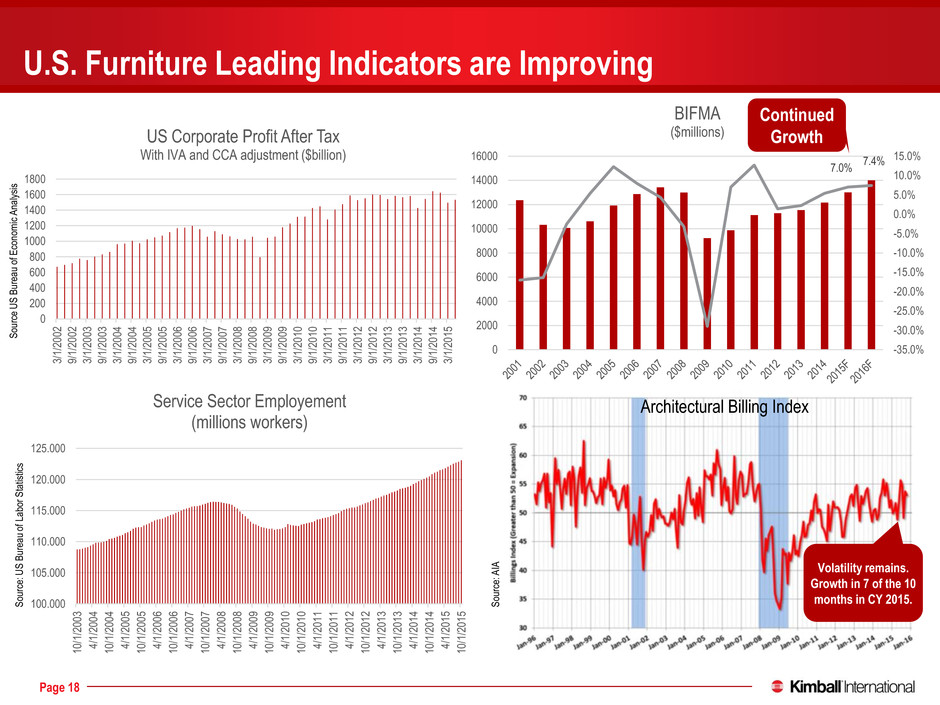
176 0 0 137 132 126 237 23 23 46 46 46 51 132 156 252 202 59 Page 18 U.S. Furniture Leading Indicators are Improving S ou rc e U S B ur ea u of E co no m ic A na ly si s S ou rc e: U S B ur ea u of L ab or S ta tis tic s S ou rc e: A IA Architectural Billing Index 7.0% 7.4% -35.0% -30.0% -25.0% -20.0% -15.0% -10.0% -5.0% 0.0% 5.0% 10.0% 15.0% 0 2000 4000 6000 8000 10000 12000 14000 16000 BIFMA ($millions) Continued Growth Volatility remains. Growth in 7 of the 10 months in CY 2015. 0 200 400 600 800 1000 1200 1400 1600 1800 3/ 1/ 20 02 9/ 1/ 20 02 3/ 1/ 20 03 9/ 1/ 20 03 3/ 1/ 20 04 9/ 1/ 20 04 3/ 1/ 20 05 9/ 1/ 20 05 3/ 1/ 20 06 9/ 1/ 20 06 3/ 1/ 20 07 9/ 1/ 20 07 3/ 1/ 20 08 9/ 1/ 20 08 3/ 1/ 20 09 9/ 1/ 20 09 3/ 1/ 20 10 9/ 1/ 20 10 3/ 1/ 20 11 9/ 1/ 20 11 3/ 1/ 20 12 9/ 1/ 20 12 3/ 1/ 20 13 9/ 1/ 20 13 3/ 1/ 20 14 9/ 1/ 20 14 3/ 1/ 20 15 US Corporate Profit After Tax With IVA and CCA adjustment ($billion) 100.000 105.000 110.000 115.000 120.000 125.000 10 /1 /2 00 3 4/ 1/ 20 04 10 /1 /2 00 4 4/ 1/ 20 05 10 /1 /2 00 5 4/ 1/ 20 06 10 /1 /2 00 6 4/ 1/ 20 07 10 /1 /2 00 7 4/ 1/ 20 08 10 /1 /2 00 8 4/ 1/ 20 09 10 /1 /2 00 9 4/ 1/ 20 10 10 /1 /2 01 0 4/ 1/ 20 11 10 /1 /2 01 1 4/ 1/ 20 12 10 /1 /2 01 2 4/ 1/ 20 13 10 /1 /2 01 3 4/ 1/ 20 14 10 /1 /2 01 4 4/ 1/ 20 15 10 /1 /2 01 5 Service Sector Employement (millions workers)
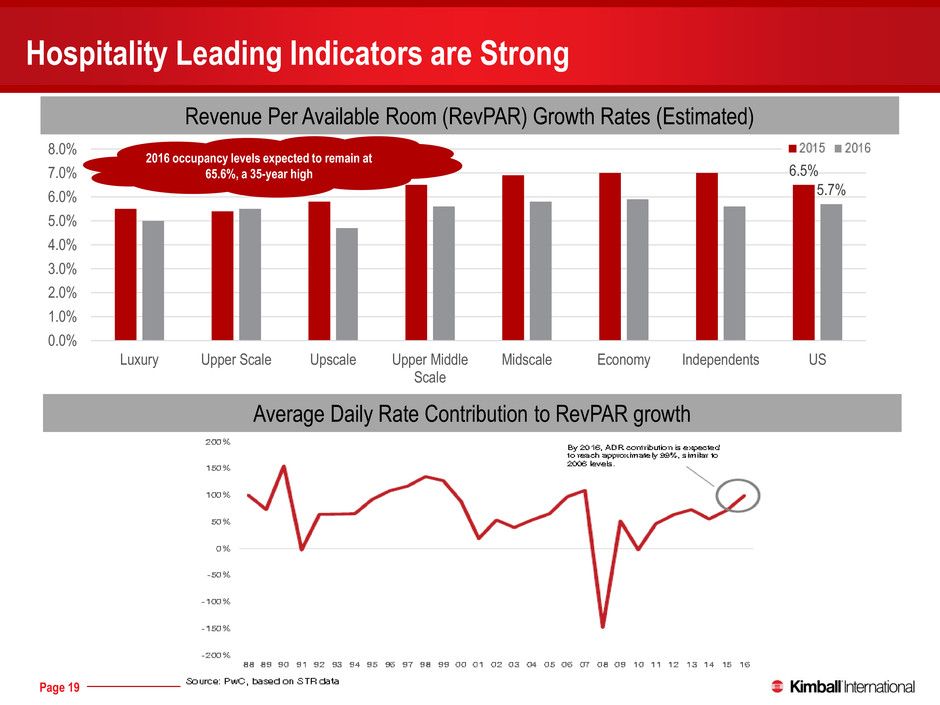
176 0 0 137 132 126 237 23 23 46 46 46 51 132 156 252 202 59 Page 19 Hospitality Leading Indicators are Strong 6.5% 5.7% 0.0% 1.0% 2.0% 3.0% 4.0% 5.0% 6.0% 7.0% 8.0% Luxury Upper Scale Upscale Upper Middle Scale Midscale Economy Independents US 2015 2016 Source: PWC Hospitality Directions May 2015 Revenue Per Available Room (RevPAR) Growth Rates (Estimated) 2016 occupancy levels expected to remain at 65.6%, a 35-year high Average Daily Rate Contribution to RevPAR growth
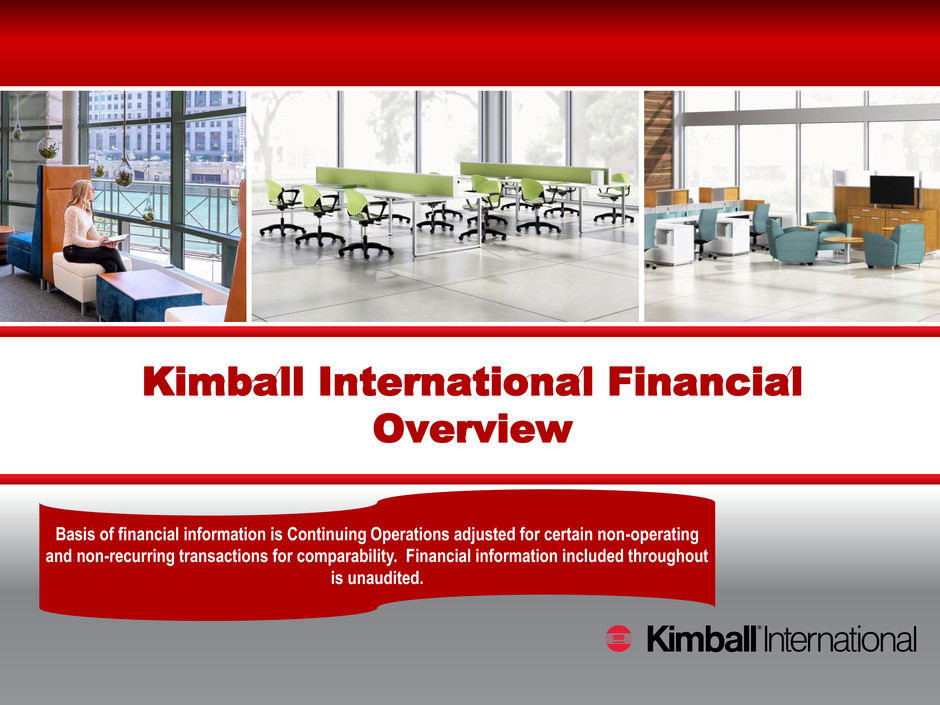
176 0 0 137 132 126 237 23 23 46 46 46 51 132 156 252 202 59 Kimball International Financial Overview Basis of financial information is Continuing Operations adjusted for certain non-operating and non-recurring transactions for comparability. Financial information included throughout is unaudited.
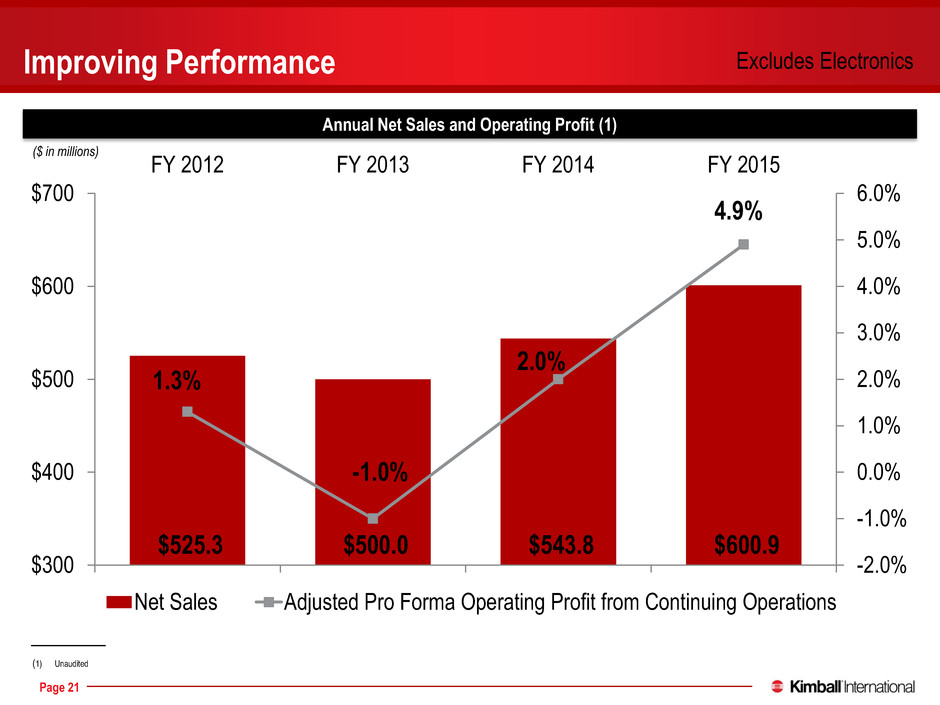
176 0 0 137 132 126 237 23 23 46 46 46 51 132 156 252 202 59 Page 21 Improving Performance Annual Net Sales and Operating Profit (1) ($ in millions) $525.3 $500.0 $543.8 $600.9 1.3% -1.0% 2.0% 4.9% -2.0% -1.0% 0.0% 1.0% 2.0% 3.0% 4.0% 5.0% 6.0% $300 $400 $500 $600 $700 FY 2012 FY 2013 FY 2014 FY 2015 Net Sales Adjusted Pro Forma Operating Profit from Continuing Operations Excludes Electronics (1) Unaudited
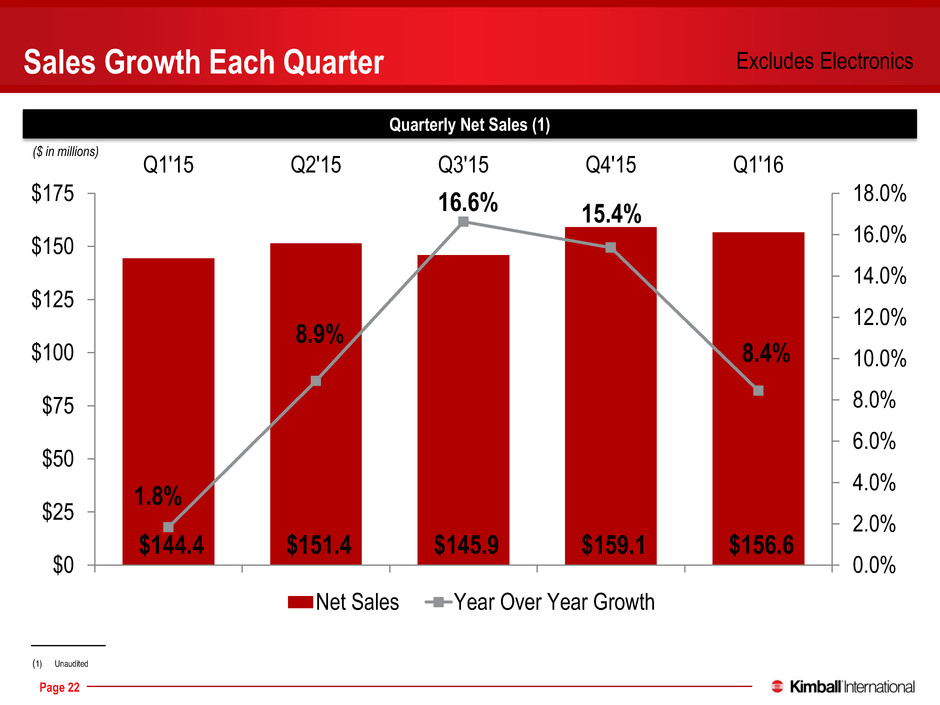
176 0 0 137 132 126 237 23 23 46 46 46 51 132 156 252 202 59 Page 22 Sales Growth Each Quarter Quarterly Net Sales (1) ($ in millions) $144.4 $151.4 $145.9 $159.1 $156.6 1.8% 8.9% 16.6% 15.4% 8.4% 0.0% 2.0% 4.0% 6.0% 8.0% 10.0% 12.0% 14.0% 16.0% 18.0% $0 $25 $50 $75 $100 $125 $150 $175 Q1'15 Q2'15 Q3'15 Q4'15 Q1'16 Net Sales Year Over Year Growth Excludes Electronics (1) Unaudited
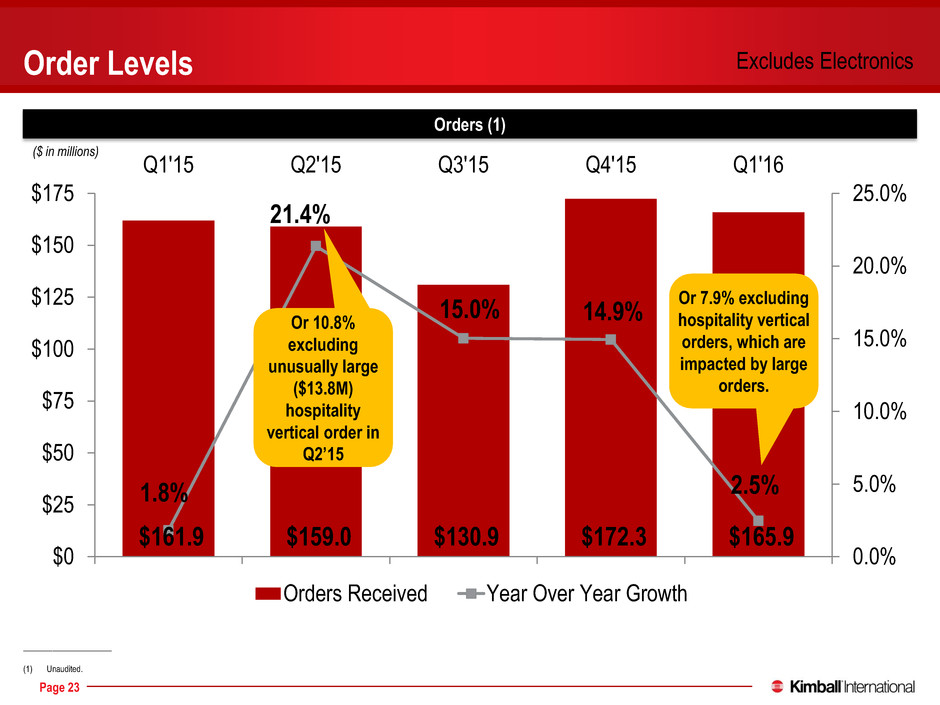
176 0 0 137 132 126 237 23 23 46 46 46 51 132 156 252 202 59 Page 23 Order Levels Orders (1) ($ in millions) $161.9 $159.0 $130.9 $172.3 $165.9 1.8% 21.4% 15.0% 14.9% 2.5% 0.0% 5.0% 10.0% 15.0% 20.0% 25.0% $0 $25 $50 $75 $100 $125 $150 $175 Q1'15 Q2'15 Q3'15 Q4'15 Q1'16 Orders Received Year Over Year Growth _____________________ (1) Unaudited. Excludes Electronics Or 10.8% excluding unusually large ($13.8M) hospitality vertical order in Q2’15 Or 7.9% excluding hospitality vertical orders, which are impacted by large orders.
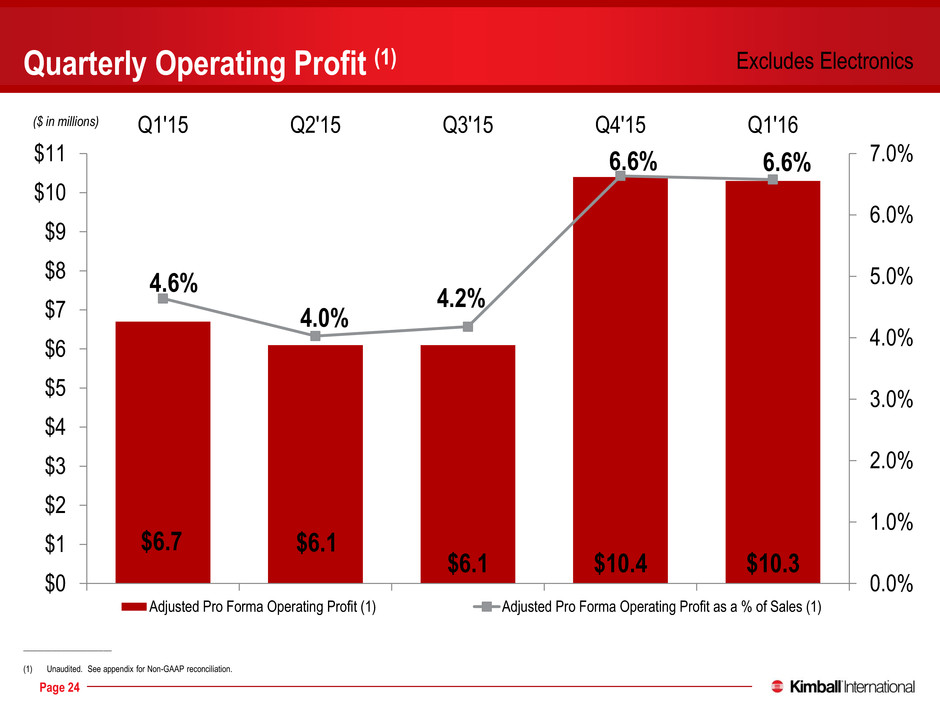
176 0 0 137 132 126 237 23 23 46 46 46 51 132 156 252 202 59 Page 24 $6.7 $6.1 $6.1 $10.4 $10.3 4.6% 4.0% 4.2% 6.6% 6.6% 0.0% 1.0% 2.0% 3.0% 4.0% 5.0% 6.0% 7.0% $0 $1 $2 $3 $4 $5 $6 $7 $8 $9 $10 $11 Q1'15 Q2'15 Q3'15 Q4'15 Q1'16 Adjusted Pro Forma Operating Profit (1) Adjusted Pro Forma Operating Profit as a % of Sales (1) Quarterly Operating Profit (1) ($ in millions) _____________________ (1) Unaudited. See appendix for Non-GAAP reconciliation. Excludes Electronics
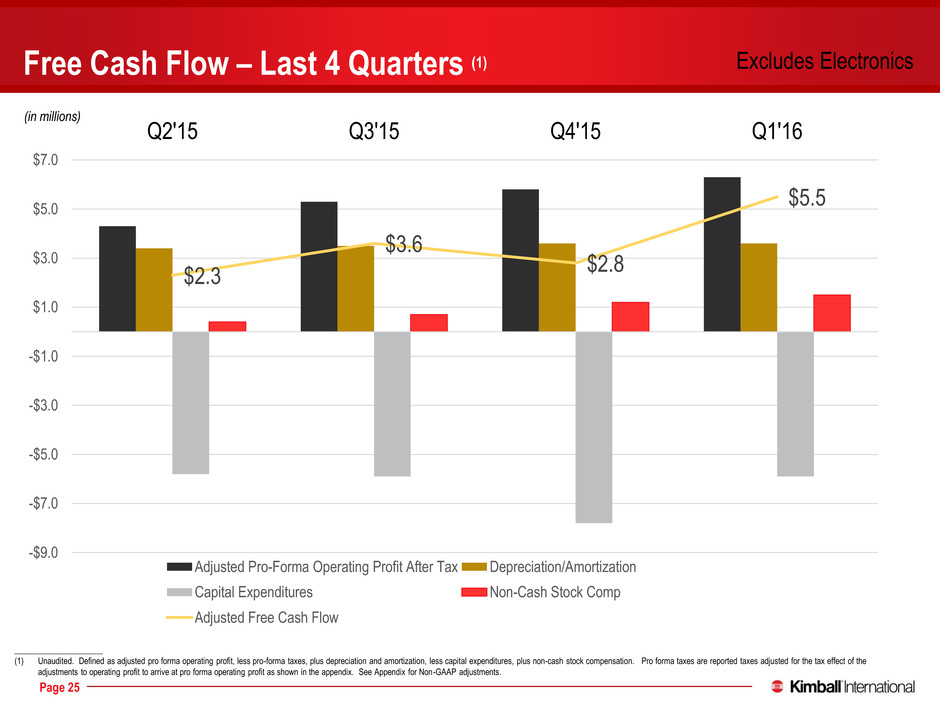
176 0 0 137 132 126 237 23 23 46 46 46 51 132 156 252 202 59 Page 25 Free Cash Flow – Last 4 Quarters (1) _____________________ (1) Unaudited. Defined as adjusted pro forma operating profit, less pro-forma taxes, plus depreciation and amortization, less capital expenditures, plus non-cash stock compensation. Pro forma taxes are reported taxes adjusted for the tax effect of the adjustments to operating profit to arrive at pro forma operating profit as shown in the appendix. See Appendix for Non-GAAP adjustments. $2.3 $3.6 $2.8 $5.5 Q2'15 Q3'15 Q4'15 Q1'16 -$9.0 -$7.0 -$5.0 -$3.0 -$1.0 $1.0 $3.0 $5.0 $7.0 Adjusted Pro-Forma Operating Profit After Tax Depreciation/Amortization Capital Expenditures Non-Cash Stock Comp Adjusted Free Cash Flow Excludes Electronics (in millions)
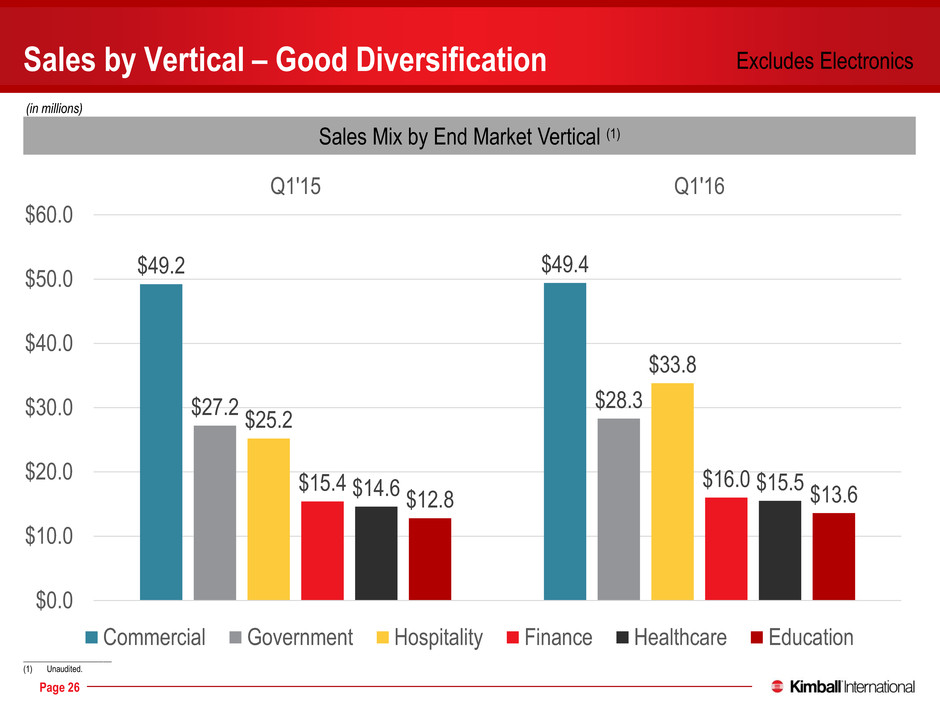
176 0 0 137 132 126 237 23 23 46 46 46 51 132 156 252 202 59 Page 26 Sales by Vertical – Good Diversification Sales Mix by End Market Vertical (1) _____________________ (1) Unaudited. Excludes Electronics $49.2 $49.4 $27.2 $28.3 $25.2 $33.8 $15.4 $16.0 $14.6 $15.5 $12.8 $13.6 $0.0 $10.0 $20.0 $30.0 $40.0 $50.0 $60.0 Q1'15 Q1'16 Commercial Government Hospitality Finance Healthcare Education (in millions)
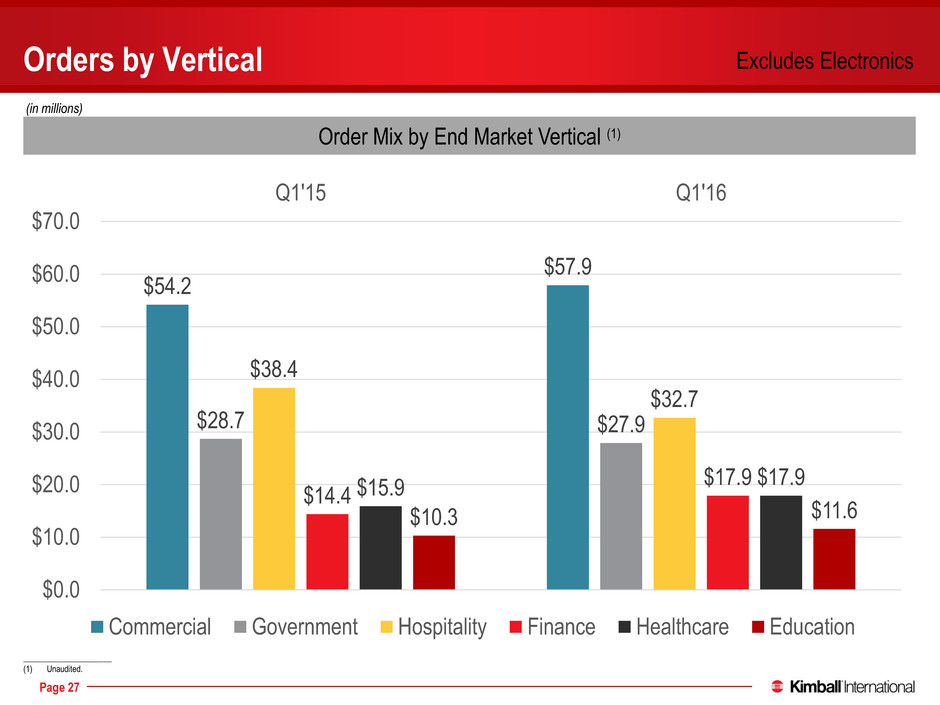
176 0 0 137 132 126 237 23 23 46 46 46 51 132 156 252 202 59 Page 27 Orders by Vertical Order Mix by End Market Vertical (1) _____________________ (1) Unaudited. Excludes Electronics $54.2 $57.9 $28.7 $27.9 $38.4 $32.7 $14.4 $17.9 $15.9 $17.9 $10.3 $11.6 $0.0 $10.0 $20.0 $30.0 $40.0 $50.0 $60.0 $70.0 Q1'15 Q1'16 Commercial Government Hospitality Finance Healthcare Education (in millions)
176 0 0 137 132 126 237 23 23 46 46 46 51 132 156 252 202 59 Financial Outlook
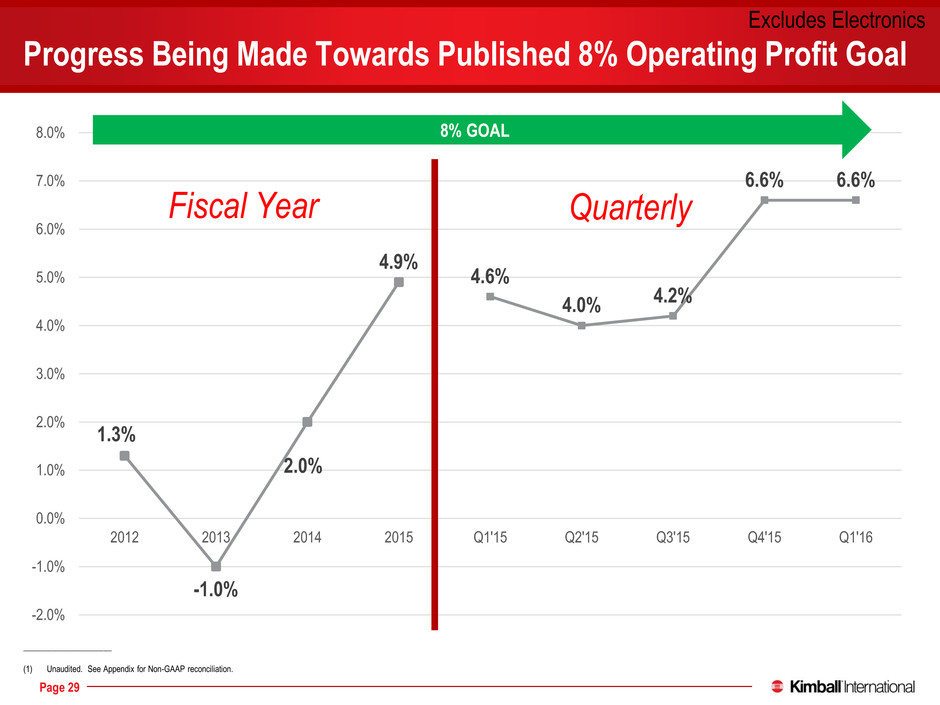
176 0 0 137 132 126 237 23 23 46 46 46 51 132 156 252 202 59 Page 29 Progress Being Made Towards Published 8% Operating Profit Goal _____________________ (1) Unaudited. See Appendix for Non-GAAP reconciliation. Excludes Electronics 1.3% -1.0% 2.0% 4.9% 4.6% 4.0% 4.2% 6.6% 6.6% -2.0% -1.0% 0.0% 1.0% 2.0% 3.0% 4.0% 5.0% 6.0% 7.0% 8.0% 2012 2013 2014 2015 Q1'15 Q2'15 Q3'15 Q4'15 Q1'16 Fiscal Year Quarterly 8% GOAL
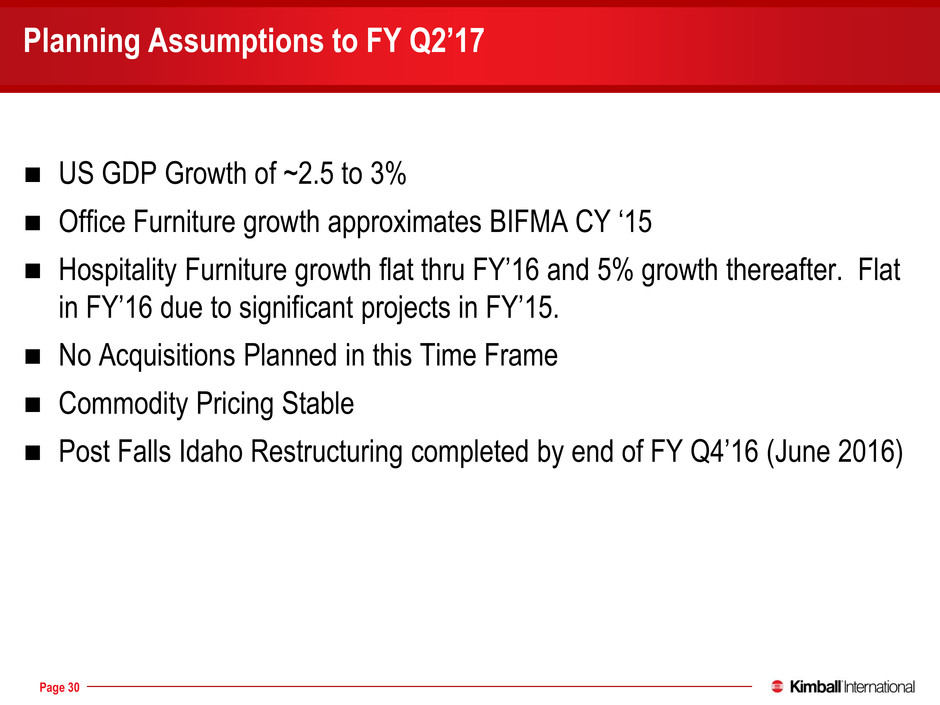
176 0 0 137 132 126 237 23 23 46 46 46 51 132 156 252 202 59 Page 30 Planning Assumptions to FY Q2’17 US GDP Growth of ~2.5 to 3% Office Furniture growth approximates BIFMA CY ‘15 Hospitality Furniture growth flat thru FY’16 and 5% growth thereafter. Flat in FY’16 due to significant projects in FY’15. No Acquisitions Planned in this Time Frame Commodity Pricing Stable Post Falls Idaho Restructuring completed by end of FY Q4’16 (June 2016)

176 0 0 137 132 126 237 23 23 46 46 46 51 132 156 252 202 59 Page 31 Targeting 7 to 8% Operating Profit by Q2’17 Q2’17 Outlook (Quarter Ending December 2016) Sales $170 to $180 million Operating Income 7.0 to 8.0% Operating Income $’s $12 to $14 million Tax Rate 35 to 38% Earnings Per Diluted Share $0.20 to $0.24 Return on Capital* Approaching 20% * Defined as Annualized Operating Income After Tax Divided by Capital. Capital is defined as Total Assets Minus Current Liabilities. Now planning to reach low end of operating income % range by Q1’17 with acceleration of Post Falls restructuring
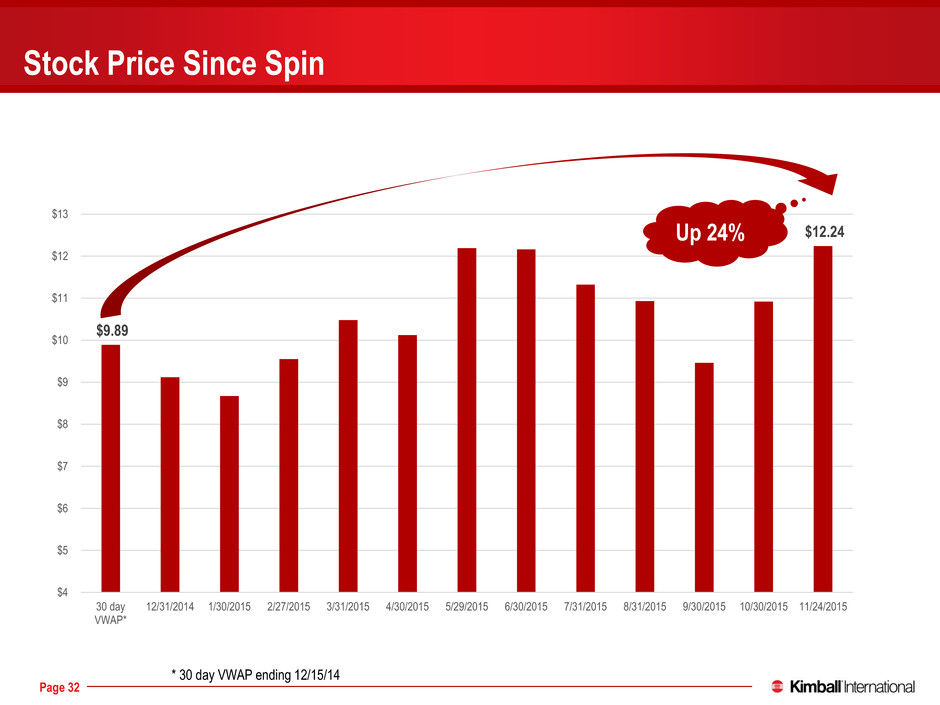
176 0 0 137 132 126 237 23 23 46 46 46 51 132 156 252 202 59 Page 32 $9.89 $12.24 $4 $5 $6 $7 $8 $9 $10 $11 $12 $13 30 day VWAP* 12/31/2014 1/30/2015 2/27/2015 3/31/2015 4/30/2015 5/29/2015 6/30/2015 7/31/2015 8/31/2015 9/30/2015 10/30/2015 11/24/2015 Stock Price Since Spin Up 24% * 30 day VWAP ending 12/15/14
176 0 0 137 132 126 237 23 23 46 46 46 51 132 156 252 202 59 Appendix
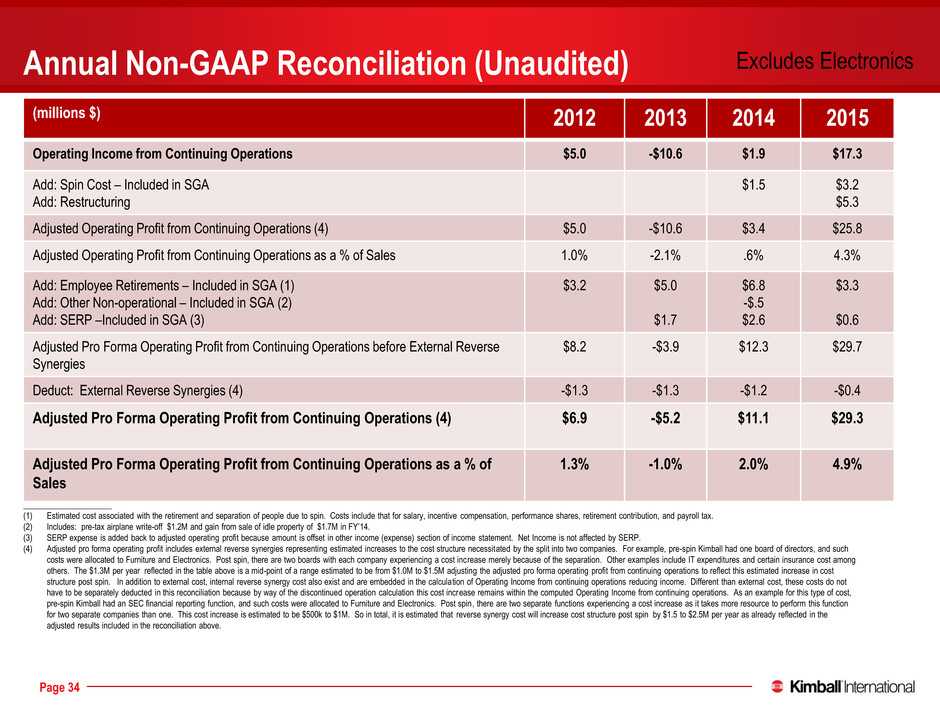
176 0 0 137 132 126 237 23 23 46 46 46 51 132 156 252 202 59 Page 34 Annual Non-GAAP Reconciliation (Unaudited) (millions $) 2012 2013 2014 2015 Operating Income from Continuing Operations $5.0 -$10.6 $1.9 $17.3 Add: Spin Cost – Included in SGA Add: Restructuring $1.5 $3.2 $5.3 Adjusted Operating Profit from Continuing Operations (4) $5.0 -$10.6 $3.4 $25.8 Adjusted Operating Profit from Continuing Operations as a % of Sales 1.0% -2.1% .6% 4.3% Add: Employee Retirements – Included in SGA (1) Add: Other Non-operational – Included in SGA (2) Add: SERP –Included in SGA (3) $3.2 $5.0 $1.7 $6.8 -$.5 $2.6 $3.3 $0.6 Adjusted Pro Forma Operating Profit from Continuing Operations before External Reverse Synergies $8.2 -$3.9 $12.3 $29.7 Deduct: External Reverse Synergies (4) -$1.3 -$1.3 -$1.2 -$0.4 Adjusted Pro Forma Operating Profit from Continuing Operations (4) $6.9 -$5.2 $11.1 $29.3 Adjusted Pro Forma Operating Profit from Continuing Operations as a % of Sales 1.3% -1.0% 2.0% 4.9% _____________________ (1) Estimated cost associated with the retirement and separation of people due to spin. Costs include that for salary, incentive compensation, performance shares, retirement contribution, and payroll tax. (2) Includes: pre-tax airplane write-off $1.2M and gain from sale of idle property of $1.7M in FY’14. (3) SERP expense is added back to adjusted operating profit because amount is offset in other income (expense) section of income statement. Net Income is not affected by SERP. (4) Adjusted pro forma operating profit includes external reverse synergies representing estimated increases to the cost structure necessitated by the split into two companies. For example, pre-spin Kimball had one board of directors, and such costs were allocated to Furniture and Electronics. Post spin, there are two boards with each company experiencing a cost increase merely because of the separation. Other examples include IT expenditures and certain insurance cost among others. The $1.3M per year reflected in the table above is a mid-point of a range estimated to be from $1.0M to $1.5M adjusting the adjusted pro forma operating profit from continuing operations to reflect this estimated increase in cost structure post spin. In addition to external cost, internal reverse synergy cost also exist and are embedded in the calculation of Operating Income from continuing operations reducing income. Different than external cost, these costs do not have to be separately deducted in this reconciliation because by way of the discontinued operation calculation this cost increase remains within the computed Operating Income from continuing operations. As an example for this type of cost, pre-spin Kimball had an SEC financial reporting function, and such costs were allocated to Furniture and Electronics. Post spin, there are two separate functions experiencing a cost increase as it takes more resource to perform this function for two separate companies than one. This cost increase is estimated to be $500k to $1M. So in total, it is estimated that reverse synergy cost will increase cost structure post spin by $1.5 to $2.5M per year as already reflected in the adjusted results included in the reconciliation above. Excludes Electronics
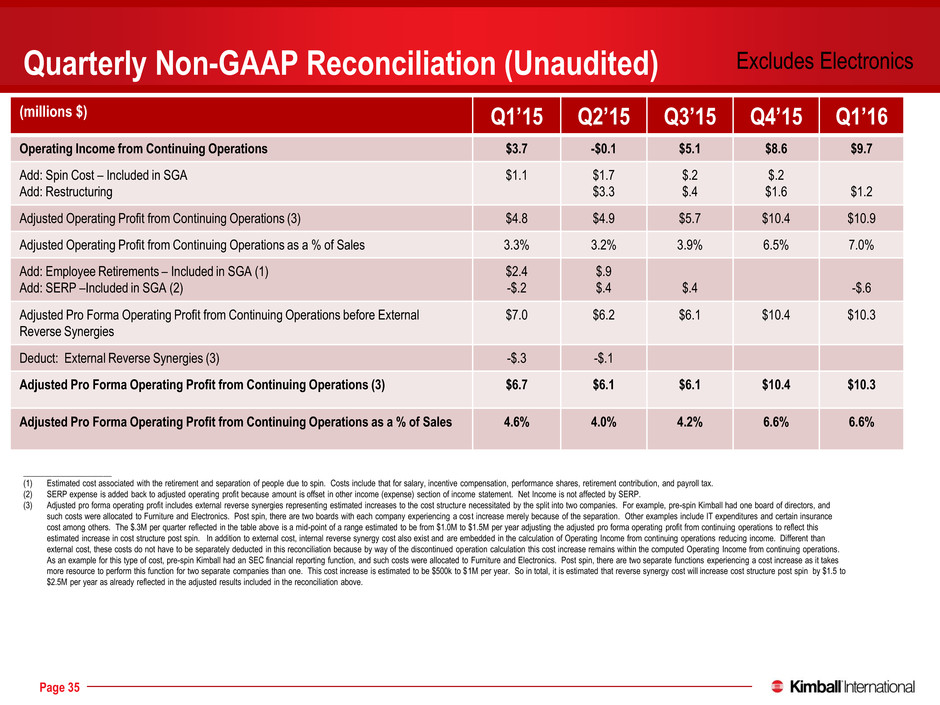
176 0 0 137 132 126 237 23 23 46 46 46 51 132 156 252 202 59 Page 35 Quarterly Non-GAAP Reconciliation (Unaudited) (millions $) Q1’15 Q2’15 Q3’15 Q4’15 Q1’16 Operating Income from Continuing Operations $3.7 -$0.1 $5.1 $8.6 $9.7 Add: Spin Cost – Included in SGA Add: Restructuring $1.1 $1.7 $3.3 $.2 $.4 $.2 $1.6 $1.2 Adjusted Operating Profit from Continuing Operations (3) $4.8 $4.9 $5.7 $10.4 $10.9 Adjusted Operating Profit from Continuing Operations as a % of Sales 3.3% 3.2% 3.9% 6.5% 7.0% Add: Employee Retirements – Included in SGA (1) Add: SERP –Included in SGA (2) $2.4 -$.2 $.9 $.4 $.4 -$.6 Adjusted Pro Forma Operating Profit from Continuing Operations before External Reverse Synergies $7.0 $6.2 $6.1 $10.4 $10.3 Deduct: External Reverse Synergies (3) -$.3 -$.1 Adjusted Pro Forma Operating Profit from Continuing Operations (3) $6.7 $6.1 $6.1 $10.4 $10.3 Adjusted Pro Forma Operating Profit from Continuing Operations as a % of Sales 4.6% 4.0% 4.2% 6.6% 6.6% _____________________ (1) Estimated cost associated with the retirement and separation of people due to spin. Costs include that for salary, incentive compensation, performance shares, retirement contribution, and payroll tax. (2) SERP expense is added back to adjusted operating profit because amount is offset in other income (expense) section of income statement. Net Income is not affected by SERP. (3) Adjusted pro forma operating profit includes external reverse synergies representing estimated increases to the cost structure necessitated by the split into two companies. For example, pre-spin Kimball had one board of directors, and such costs were allocated to Furniture and Electronics. Post spin, there are two boards with each company experiencing a cost increase merely because of the separation. Other examples include IT expenditures and certain insurance cost among others. The $.3M per quarter reflected in the table above is a mid-point of a range estimated to be from $1.0M to $1.5M per year adjusting the adjusted pro forma operating profit from continuing operations to reflect this estimated increase in cost structure post spin. In addition to external cost, internal reverse synergy cost also exist and are embedded in the calculation of Operating Income from continuing operations reducing income. Different than external cost, these costs do not have to be separately deducted in this reconciliation because by way of the discontinued operation calculation this cost increase remains within the computed Operating Income from continuing operations. As an example for this type of cost, pre-spin Kimball had an SEC financial reporting function, and such costs were allocated to Furniture and Electronics. Post spin, there are two separate functions experiencing a cost increase as it takes more resource to perform this function for two separate companies than one. This cost increase is estimated to be $500k to $1M per year. So in total, it is estimated that reverse synergy cost will increase cost structure post spin by $1.5 to $2.5M per year as already reflected in the adjusted results included in the reconciliation above. Excludes Electronics
