Attached files
| file | filename |
|---|---|
| 8-K - 8-K - TIDEWATER INC | d90261d8k.htm |
| EX-99.2 - EX-99.2 - TIDEWATER INC | d90261dex992.htm |
 Cowen and Company
5 th Annual Ultimate Energy Conference December 2, 2015 Joseph M. Bennett Executive Vice President and Chief Investor Relations Officer Exhibit 99.1 |
 FORWARD-LOOKING STATEMENTS In accordance with the safe harbor provisions of the Private Securities Litigation Reform Act of
1995, the Company notes that certain statements set forth in this presentation
provide other than historical information and are forward looking.
The actual achievement of any forecasted results, or the unfolding
of future economic or business developments in a way anticipated or projected by the Company, involve numerous risks and uncertainties that may cause the Company’s actual
performance to be materially different from that stated or implied in the
forward-looking statement. Among those risks and uncertainties,
many of which are beyond the control of the Company, include,
without limitation, fluctuations in worldwide energy demand and oil and gas prices; fleet additions by competitors and industry overcapacity; changes in capital spending by
customers in the energy industry for offshore exploration, development and
production; changing customer demands for different vessel
specifications, which may make some of our older vessels
technologically obsolete for certain customer projects or in certain markets;
uncertainty of global financial market conditions and difficulty
accessing credit or capital; acts of terrorism and piracy;
significant weather conditions; unsettled political conditions, war, civil unrest
and governmental actions, such as expropriation or enforcement of
customs or other laws that are not well- developed or
consistently enforced, especially in higher political risk countries where we operate; foreign currency fluctuations; labor changes proposed by international conventions; increased
regulatory burdens and oversight; and enforcement of laws related to the
environment, labor and foreign corrupt practices. Readers should
consider all of these risks factors, as well as other information
contained in the Company’s form 10-K’s and 10-Q’s.
TIDEWATER 601
Poydras Street, Suite 1500, New
Orleans, La. 70130 Cowen and Company 5th Annual Ultimate Energy
Conference 2
Phone: 504.568.1010 | Fax: 504.566.4580 Web site address: www.tdw.com Email: connect@tdw.com |
 Providing safe, efficient and compliant operations – TRIR to date this fiscal year is lowest in company history New fleet comprised of vessels that service all water depths – 222 active vessels at 9/30/15 with 8.2 year average age. Taking special care of stacked vessels. Geographic diversity – each of four reported geo markets reported vessel operating profit in recent quarters Staying close to our customers Prompt, proactive cost-cutting initiatives (“control what we can control”) – from 9/14 quarter, headcount down over 1,200 (15%), vessel opex down 25% and G&A cost down 20% Reducing CapEx – vessel construction commitments reduced by 10 vessels, providing ~$76 million in progress payment refunds and ~$145 million reduced future CapEx (if options are not exercised). Vessel construction program was in wind-down mode prior to oil
market collapse.
Maintaining a solid balance sheet (low leverage) and sufficient liquidity to deal with industry uncertainties & seize opportunities when presented - $88 million of cash and $600 million undrawn revolver. 37% net debt to net total book cap and minimal debt maturities until
FY2020. Experienced management team to lead the way Strategy and Focus in a Challenged Market, and Results Cowen and Company 5th Annual Ultimate Energy Conference 3 |
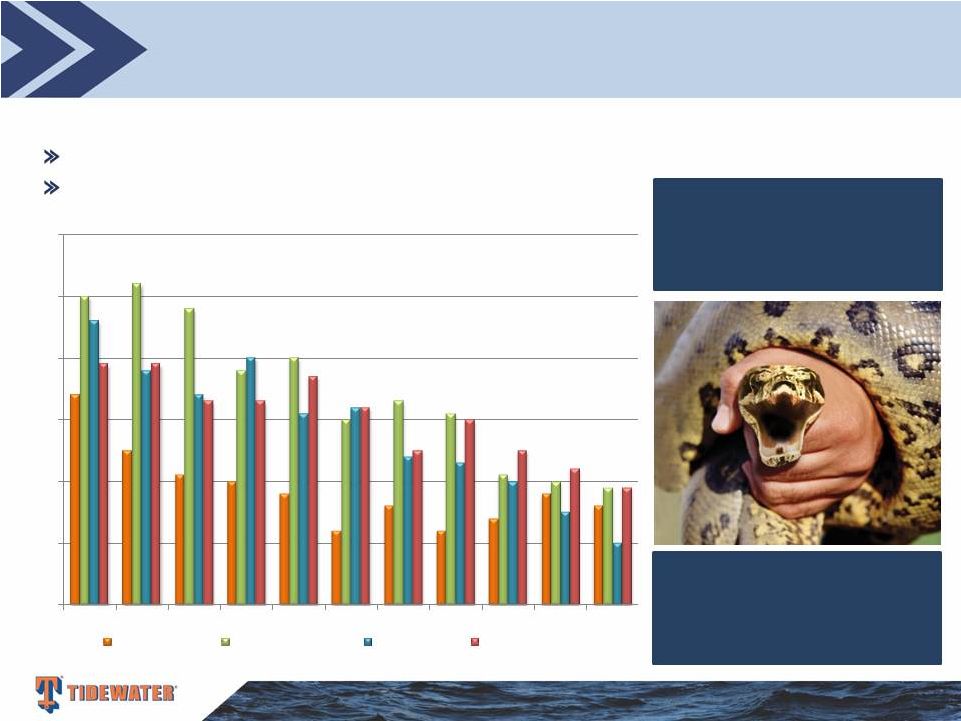 Stop Work Obligation
Safety performance is 25% of mgt. incentive comp
Safe Operations is Priority #1
Cowen and Company 5th Annual Ultimate Energy Conference
4 0.00 0.10 0.20 0.30 0.40 0.50 0.60 2004 2005 2006 2007 2008 2009 2010 2011 2012 2013 2014 TOTAL RECORDABLE INCIDENT RATES (per 200,000 Man Hours) TIDEWATER DOW CHEMICAL CHEVRON EXXON/MOBIL Operating safely offshore is like holding a snake by its head. It's a task that can't be turned
loose not for a microsecond or an accident will strike without pity.
|
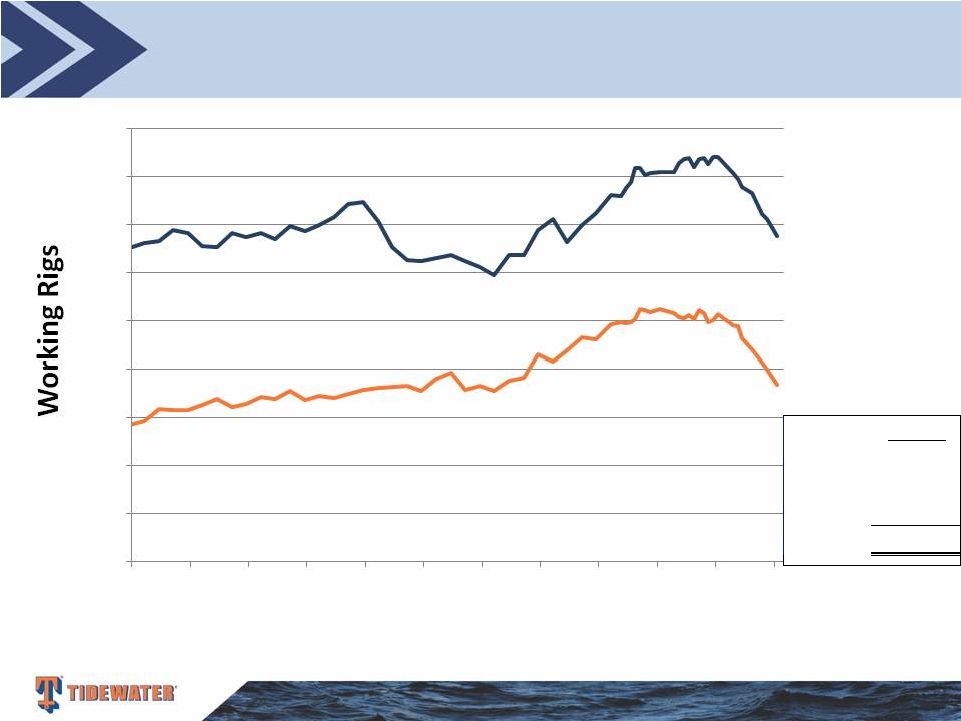 Plenty
Offshore Rigs, but Activity Levels Drive OSV Demand Cowen and
Company 5th Annual Ultimate Energy Conference 5
Source: IHS-Petrodata
Note: 33 “Other” rigs, along with the Jackups and Floaters, provide a total working rig count of 555 in November 2015. 338 184 Jackups Floaters Rig CIP Jackups 127 Floaters 69 Other 9 205 0 50 100 150 200 250 300 350 400 450 11/04 11/05 11/06 11/07 11/08 11/09 11/10 11/11 11/12 11/13 11/14 11/15 |
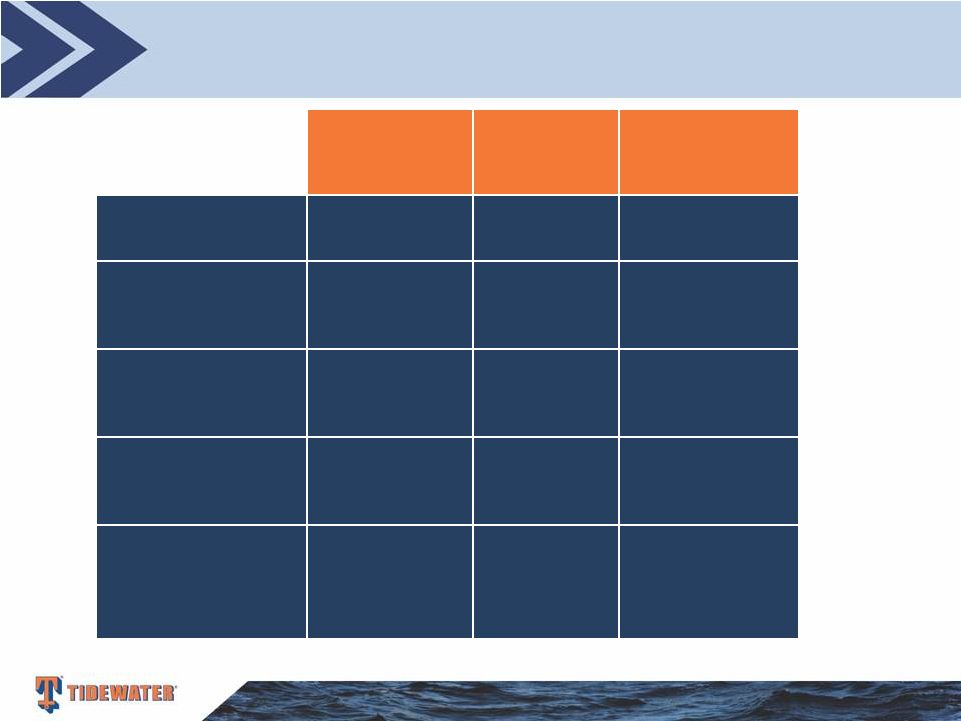 Drivers of our Business - “A View at Various Points in a Cycle” Cowen and Company 5th Annual Ultimate Energy Conference 6 July 2008 January 2011 November 2015 Working Rigs 603 538 555 Rigs Under Construction 186 118 205 OSV Global Population 2,033 2,599 3,394 OSV’s Under Construction 736 367 370 OSV/Rig Ratio 3.37 4.83 6.04 (4.98 without ~600 old vessels believed not available) Source: IHS-Petrodata and Tidewater Down ~165 rigs from prior peak How many will be delivered and how many incremental? Includes ~650 old vessels and hundreds of stacked vessels How many will be delivered? Over half being built in China. |
 Tidewater’s Active Fleet
As of September 30, 2015
Cowen and Company 5th Annual Ultimate Energy Conference
7 0 5 10 15 20 25 30 35 1970 1975 1980 1985 1990 1995 2000 2005 2010 2015 Year Built Deepwater vessels Towing Supply/Supply Other vessels 211 “New” vessels – 7.4 avg yrs 11 “Traditional” vessels – 25.0 avg yrs (only 2 OSVs) |
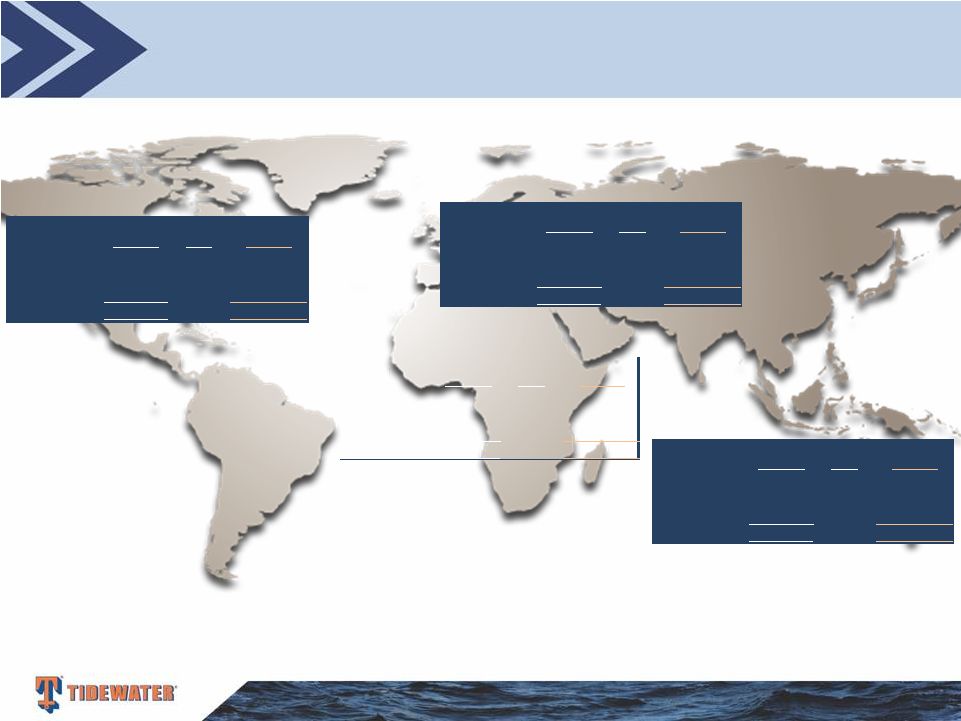
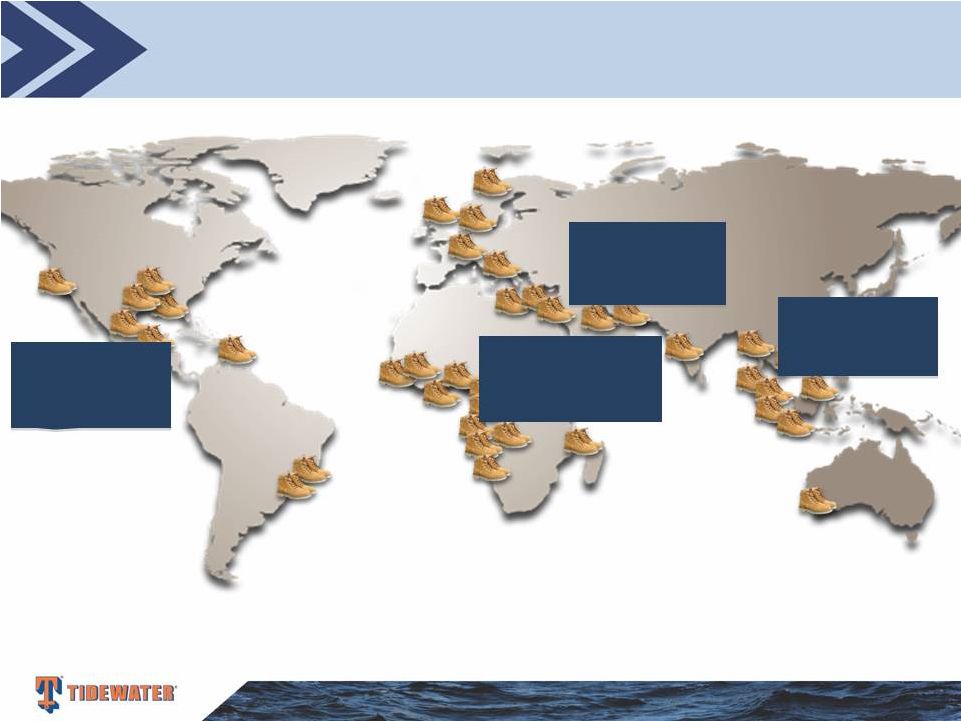 Geographic Diversity –
Active Vessel Count and
Vessel Operating Profit (VOP) by Region
(Active vessels as of 9/30/15, VOP for 9/30/15 qtr.)
Cowen and Company 5th Annual Ultimate Energy Conference
8 Americas 65 vessels (29%) $8.8m VOP SS Africa/Europe 94 vessels (42%) $3.2m VOP MENA 42 vessels (19%) $7.5m VOP Asia/Pac 21 vessels (10%) $6.2m VOP 51 additional Tidewater vessels were stacked as of 9/30/15. |
  A New Fleet
that Services All Water Depths Cowen and Company 5th Annual
Ultimate Energy Conference 9
New Avg. Traditional Vessels NBV Vessels Deepwater 7 $26.4M 0 Towing Supply 14 $10.4M 0 Other 0 0 0 21 0 New Avg. Traditional Vessels NBV Vessels Deepwater 27 $27.6M 0 Towing Supply 33 $12.8M 0 Other 30 $1.5M 4 90 4 New Avg. Traditional Vessels NBV Vessels Deepwater 37 21.3M 0 Towing Supply 18 $10.3M 2 Other 5 $2.5M 3 60 5 New Avg. Traditional Vessels NBV Vessels Deepwater 13 $16.8M 0 Towing Supply 27 $11.4M 0 Other 0 0 2 40 2 Americas SSAE MENA Asia/Pac Vessel count info is as of 9/30/15, and includes leased vessels. Avg NBV excludes the impact of leased vessels which have no NBV. Average NBV of the 11 Traditional vessels is ~$743,000 each at 9/30/15. (Excludes stacked vessels – as of 9/30/15) |
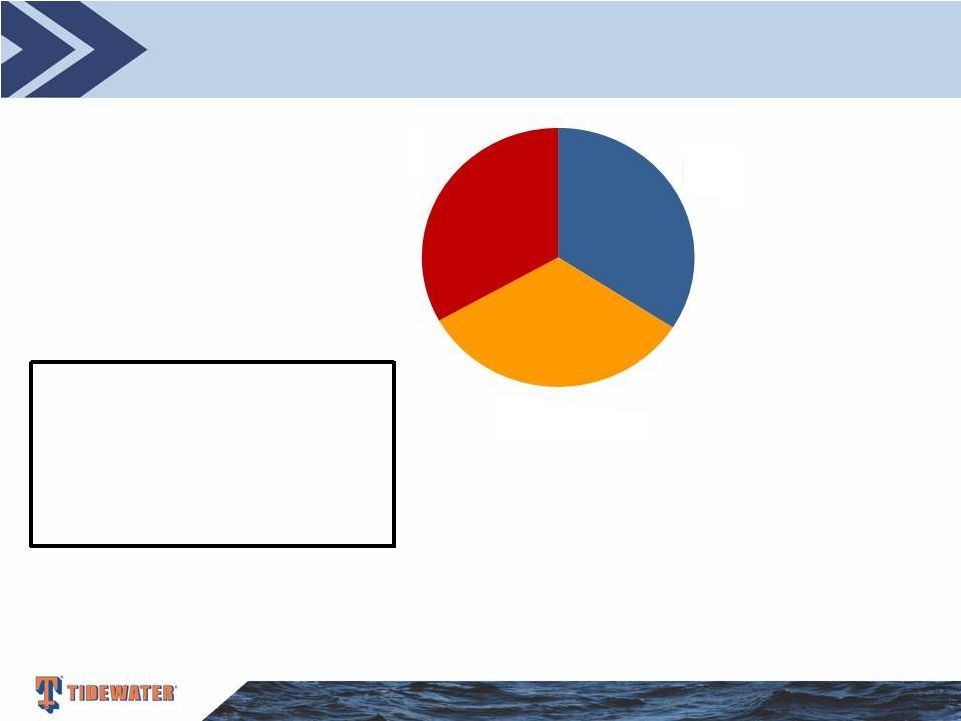 Staying Close to our Customers – Strong Customer Base Current Revenue Mix Cowen and Company 5th Annual Ultimate Energy Conference 10 Approximately 60% of our revenue is derived from drilling support activity and 40% from non-drilling related activity, such as support of production and construction activity Our top 10 customers in Fiscal 2015 (4 Super Majors, 5 NOC’s, and 1 IOC) accounted for 61% of our revenue Super Majors 34% NOC's 33% Others 33% |
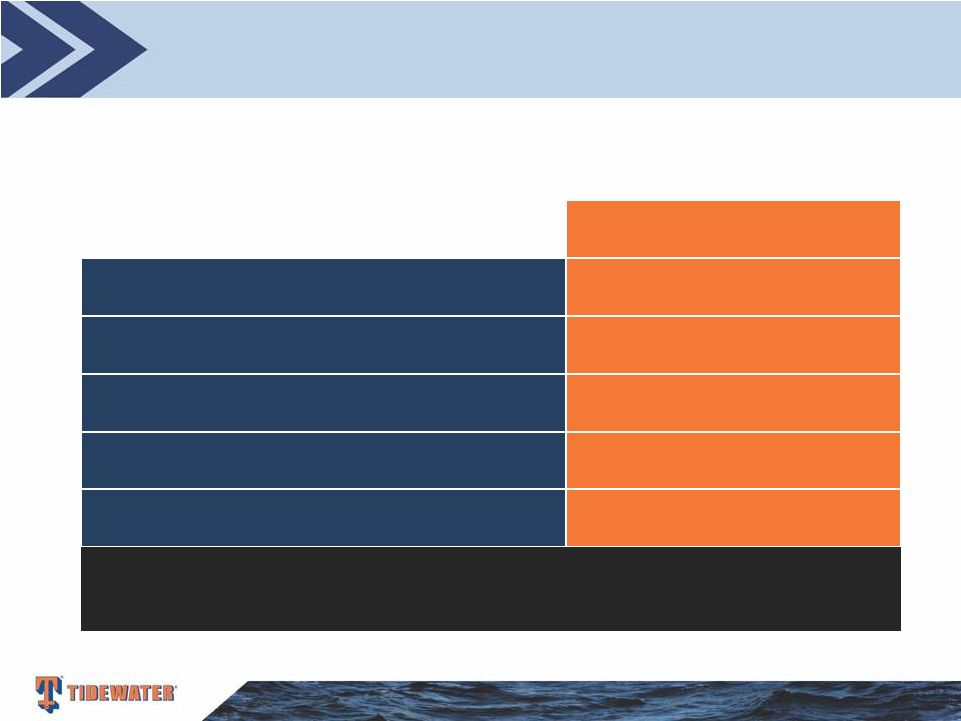 Our
Remaining Construction Backlog Cowen and Company 5th Annual
Ultimate Energy Conference 11
Count Deepwater PSVs 8 Deepwater AHTSs - Towing Supply/Supply 1 Other - Total 9 Vessels Under Construction As of September 30, 2015 (excludes vessels under option*)
Estimated delivery schedule –
4 remaining in FY ’16 and 5 in FY ‘17. CAPX of $57m remaining in FY
‘16 and $55m in FY ‘17.
* The Company has options on seven additional vessels under construction. If the options
are not exercised, ~$40 million of aggregate installment payments will be
refunded to the Company . These 7 option vessels are not included in the
table above. |
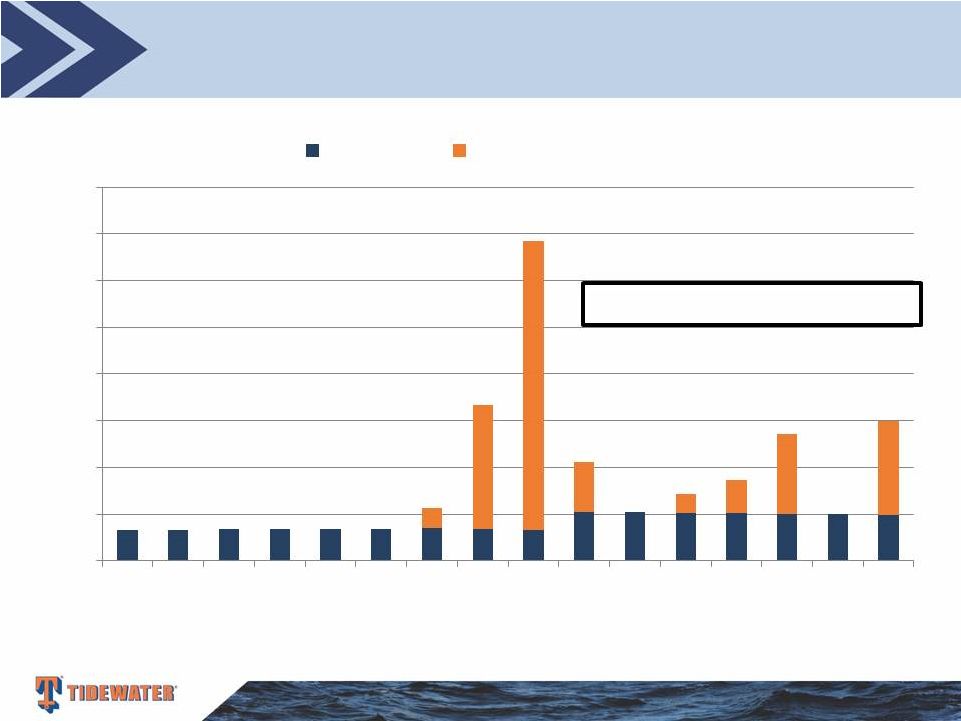
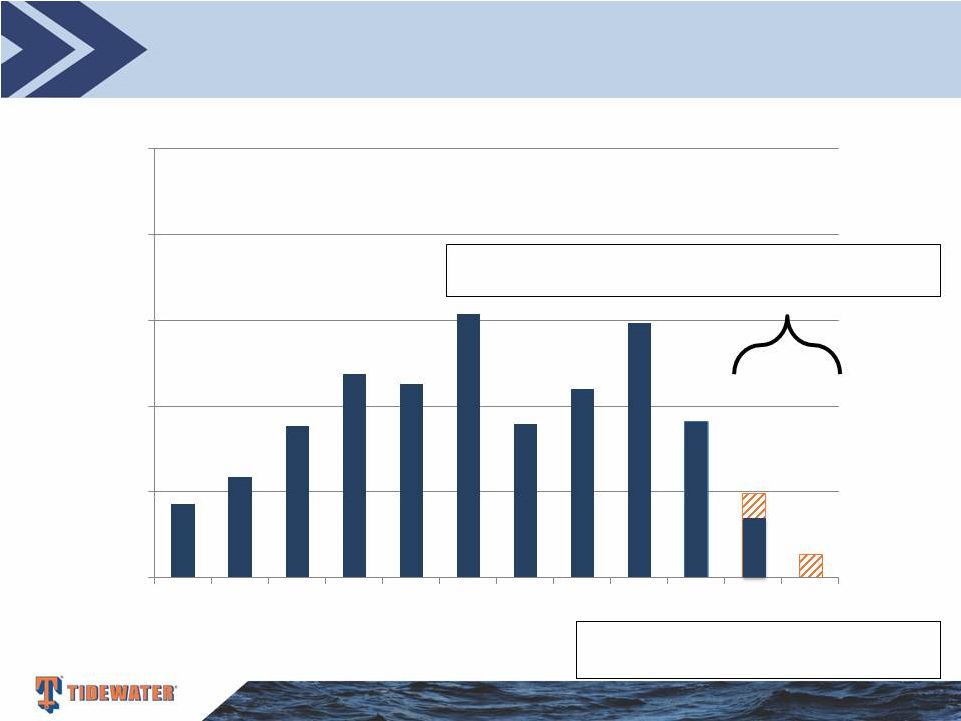 CapEx is Decreasing from Recent High Levels Cowen and Company 5th Annual Ultimate Energy Conference 12 $0 $200 $400 $600 $800 $1,000 2006 2007 2008 2009 2010 2011 2012 2013 2014 2015 2016 2017 Amounts in orange in Fiscal 2016 and 2017 include future expected CAPX on the 9 vessels under construction as of 9/30/15. Fiscal 2014 is exclusive of Troms acquisition NOTE: Fiscal 2016 and 2017 estimated CAPX above is exclusive of any refunds from possible cancelled vessel construction contracts (see note on previous slide re option vessels) Fiscal Year |
 Solid
Balance Sheet and Financial Flexibility Our Financial Position Provides Us
Strategic Optionality Cowen and Company 5th Annual Ultimate Energy
Conference 13
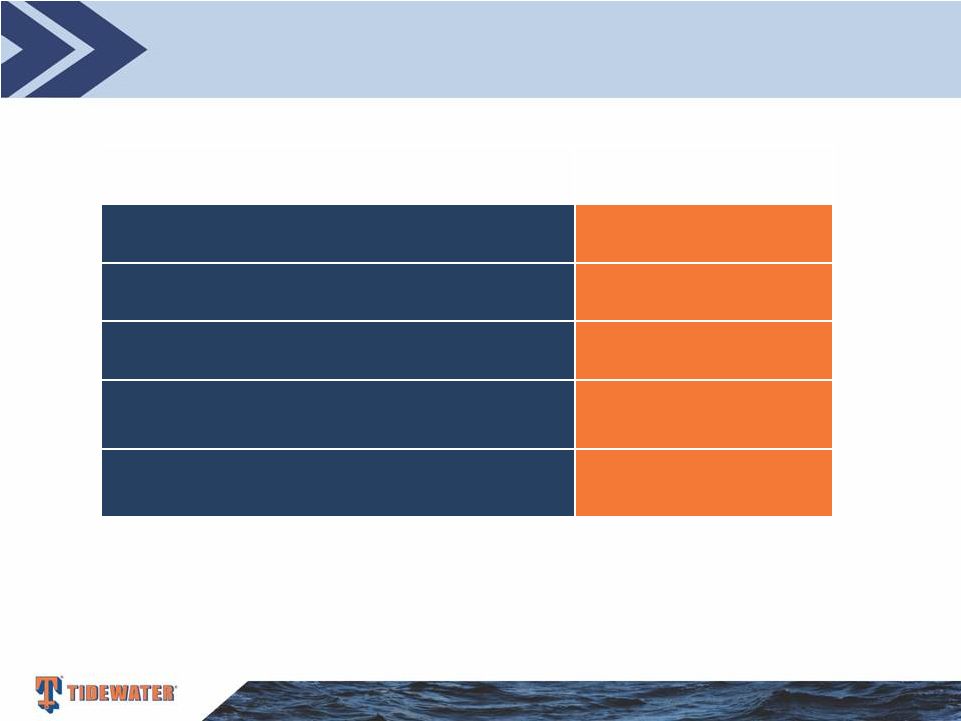
As of September 30, 2015
Cash & Cash Equivalents
$88 million Total Debt $1,498 million Shareholders Equity $2,398 million Net Debt / Net Capitalization 37% Total Debt / Capitalization 38% ~$700 million of available liquidity as of 9/30/15, including $600 million of unused capacity under the company’s revolving credit facility. |
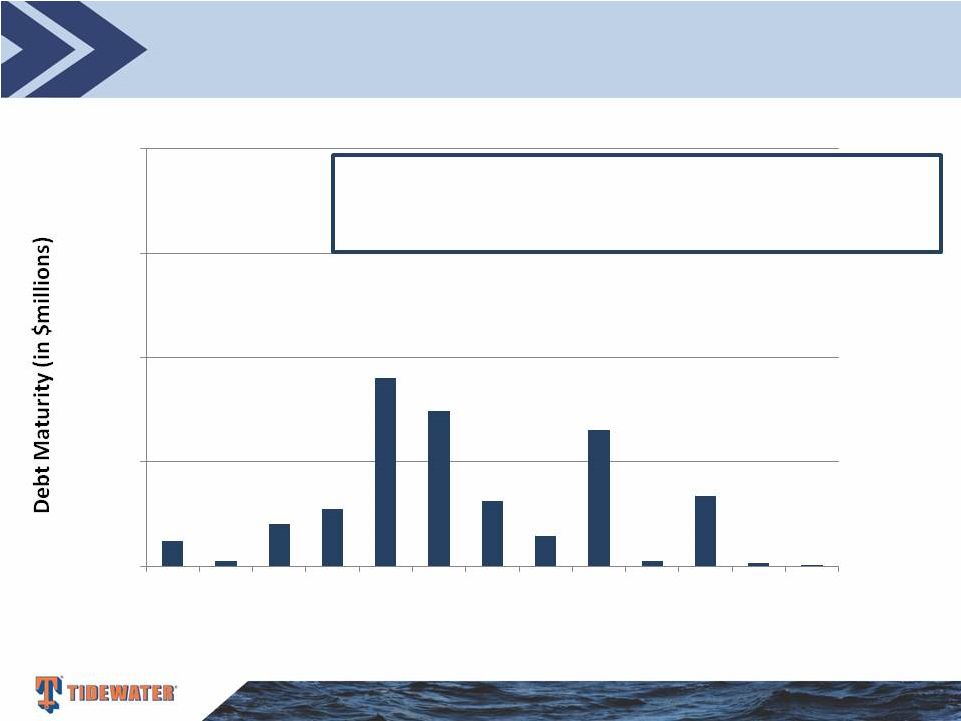 Debt
Maturities and Covenants as of 9/30/15 Maturities Limited for Several
Years Cowen and Company 5th Annual Ultimate Energy
Conference 14
Fiscal Year $0 $200 $400 $600 $800 2016 2017 2018 2019 2020 2021 2022 2023 2024 2025 2026 2027 2028 Debt Covenants: 1) Debt/Total Capitalization Ratio of not greater than 55% 2) EBITDA/Interest coverage of not less than 3.0X |
 Returning Capital to Shareholders
Consistent Dividends and Opportunistic Share Repurchases
Cowen and Company 5th Annual Ultimate Energy Conference
15 $0 $50 $100 $150 $200 $250 $300 $350 $400 2000 2001 2002 2003 2004 2005 2006 2007 2008 2009 2010 2011 2012 2013 2014 2015 Dividends Share Repurchases (in millions) Fiscal Years ~10% Current Dividend Yield During this 16-year period, $659 million of dividends were paid and $757 million of total stock repurchases were made.
|
 Tidewater’s Strategy
Cowen and Company 5th Annual Ultimate Energy Conference
16 Continue to improve upon stellar safety and compliance programs Stay close to our customers Monitor industry developments to adjust our playbook accordingly - Continue pro-active cost reduction initiatives - Maintain/protect liquidity Maintain solid balance sheet and financial flexibility to deal with industry uncertainties and seize opportunities when presented Return capital to shareholders as operating outlook improves |
 HOUSTON, TEXAS Tidewater Marine, L.L.C. 6002 Rogerdale Road Suite 600 Houston, Texas 77072-1655 P: +1 713 470 5300 NEW ORLEANS, LOUISIANA Worldwide Headquarters Tidewater Inc. Pan American Life Center 601 Poydras Street, Suite 1500 New Orleans, Louisiana 70130 P: +1 504 568 1010 Cowen and Company 5th Annual Ultimate Energy Conference 17 |
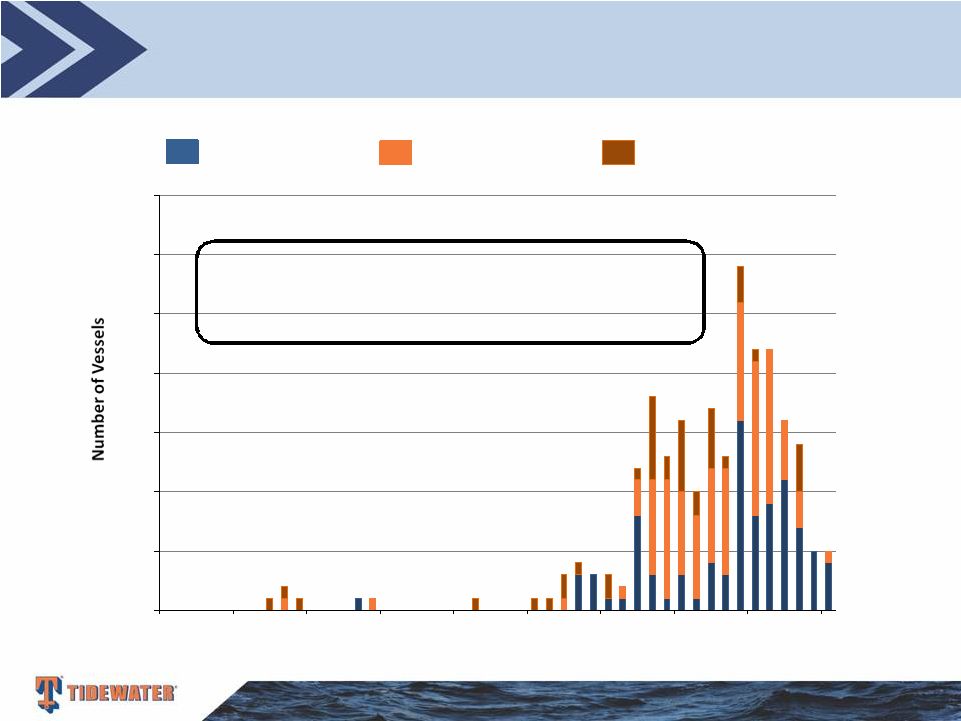
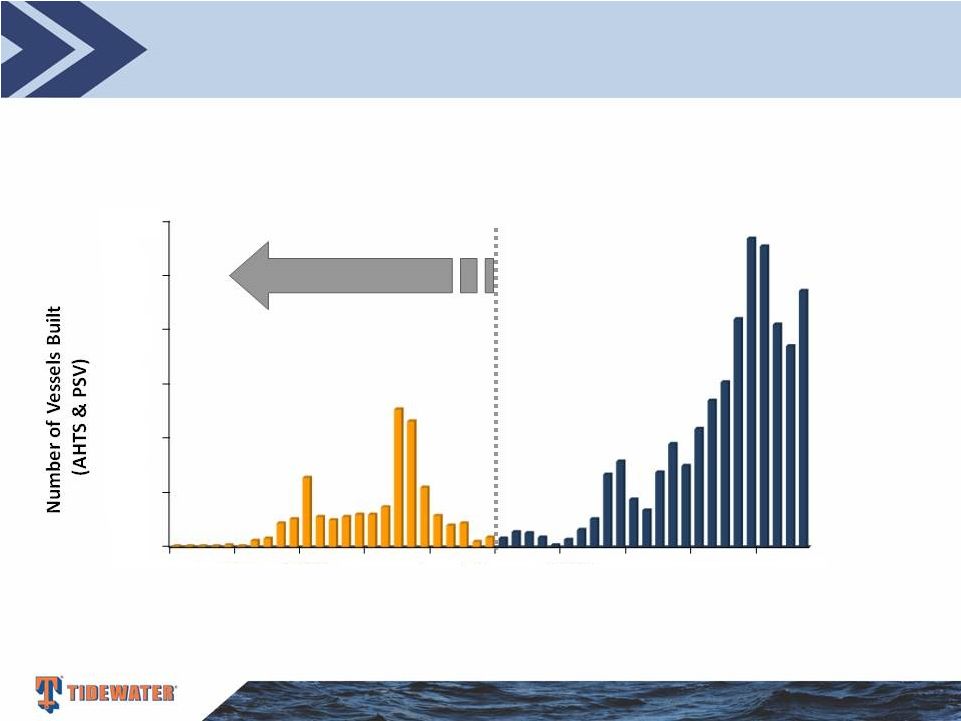 The
Worldwide OSV Fleet (Includes AHTS and PSVs only) Estimated as of November
2015 Cowen and Company 5th Annual Ultimate Energy
Conference 18
As of November 2015, there are approximately 370 additional
AHTS and PSV’s (~11% of the global fleet) under construction.
Some number of these, we believe, will not be completed and
delivered. Global fleet is estimated at ~3,394 vessels, including ~650 vessels that are 25+ yrs old (19%). Source: IHS-Petrodata and Tidewater 0 50 100 150 200 250 300 1965 1970 1975 1980 1985 1990 1995 2000 2005 2010 Vessels > 25 years old today |
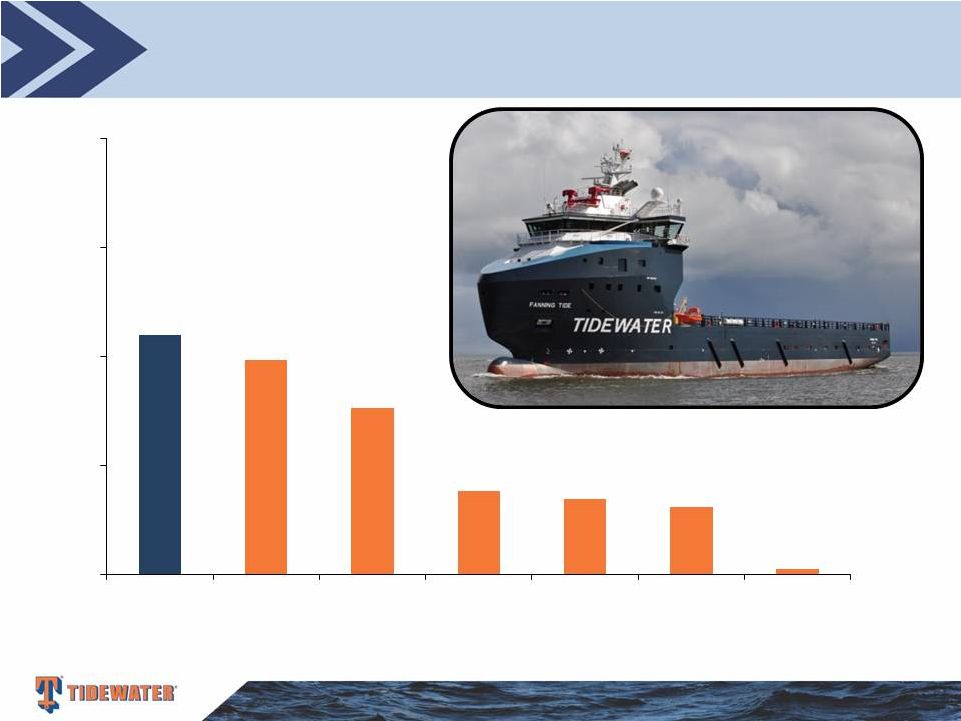 Vessel
Population by Owner (AHTS and PSVs only) Estimated as of November
2015 Cowen and Company 5th Annual Ultimate Energy
Conference 19
220 197 153 77 69 62 5 0 100 200 300 400 Tidewater Competitor #2 Competitor #3 Competitor #4 Competitor # 5 Competitor #1 Avg. All Others (~2,616 total vessels for 400+ owners) Source: IHS-Petrodata and Tidewater |
 Fleet
Renewal & Expansion Largely Funded by CFFO Cowen and Company
5th Annual Ultimate Energy Conference 20
Over a 16-year period, Tidewater has invested ~$5.5 billion in CapEx, and paid out
~$1.4 billion through dividends and share repurchases. Over the same
period, CFFO and proceeds from dispositions were ~$4.3 billion and ~$930
million, respectively. $ in millions
CFFO Fiscal Year $0 $100 $200 $300 $400 $500 $600 $700 2000 2001 2002 2003 2004 2005 2006 2007 2008 2009 2010 2011 2012 2013 2014 2015 CAPX Dividend Share Repurchase |
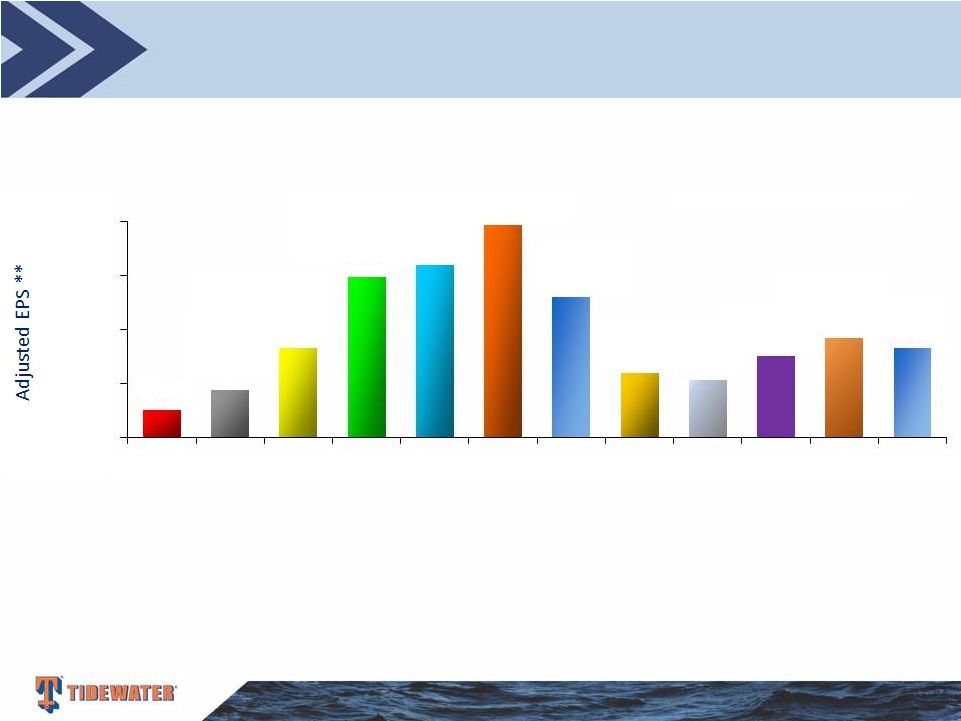 History
of Solid Earnings and Returns on a Through-Cycle Basis Cowen
and Company 5th Annual Ultimate Energy Conference 21
** EPS in Fiscal 2004 is exclusive of the $.30 per share after tax impairment charge. EPS in Fiscal 2006 is exclusive of the $.74 per share after tax
gain from the sale of six KMAR vessels. EPS in Fiscal 2007 is exclusive of
$.37 per share of after tax gains from the sale of 14 offshore tugs. EPS in Fiscal 2010 is exclusive of $.66 per share Venezuelan provision, a $.70 per share tax benefit related to favorable resolution of tax litigation and a $0.22
per share charge for the proposed settlement with the SEC of the
company’s FCPA matter. EPS in Fiscal 2011 is exclusive of total $0.21 per share charges for settlements with DOJ and Government of Nigeria for FCPA matters, a $0.08 per share charge related to participation in a multi-company U.K.-based pension
plan and a $0.06 per share impairment charge related to certain vessels.
EPS in Fiscal 2012 is exclusive of $0.43 per share goodwill impairment charge. EPS in Fiscal 2014 is exclusive of $0.87 per share goodwill impairment charge. EPS in Fiscal 2015 is exclusive of $4.67 per share of goodwill and other assets impairment
charges. Adjusted EPS**
$1.03 $1.78 $3.33 $5.94 $6.39 $7.89 $5.20 $2.40 $2.13 $3.03 $3.69 $3.33 $0.00 $2.00 $4.00 $6.00 $8.00 Fiscal 2004 Fiscal 2005 Fiscal 2006 Fiscal 2007 Fiscal 2008 Fiscal 2009 Fiscal 2010 Fiscal 2011 Fiscal 2012 Fiscal 2013 Fiscal 2014 Fiscal 2015 Adjusted Return On Avg. Equity 4.3% 7.2% 12.4% 18.9% 18.3% 19.5% 11.4% 5.0% 4.3% 5.9% 7.0% 6.3% |
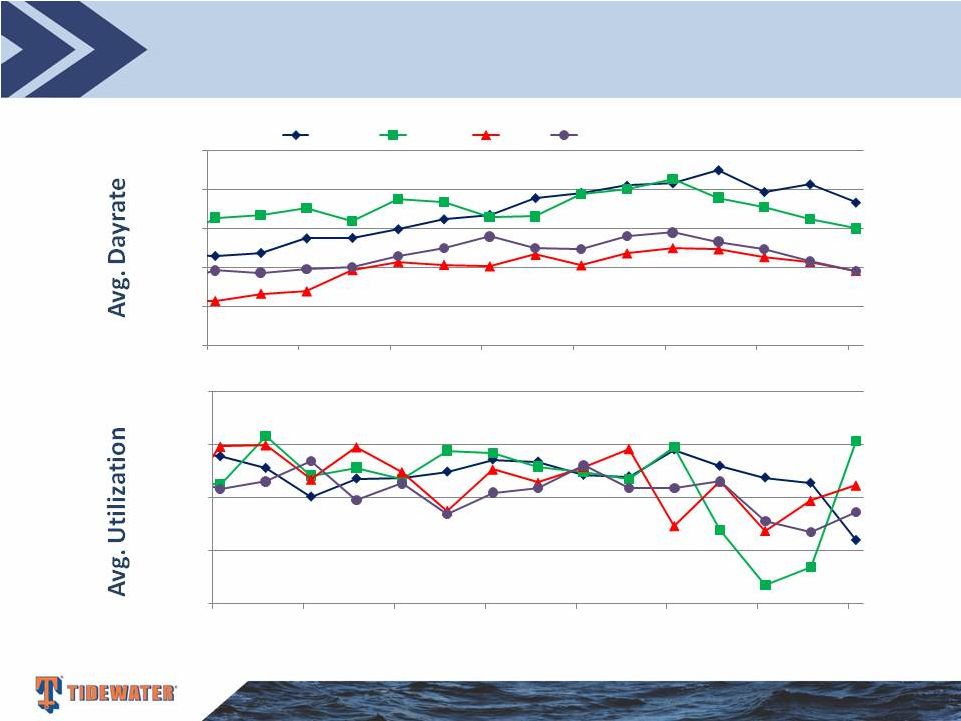 Active
Vessel Dayrates & Utilization by Segment
Cowen and Company 5th Annual Ultimate Energy Conference
22 Utilization stats exclude stacked vessels. 60% 70% 80% 90% 100% 3/12 9/12 3/13 9/13 3/14 9/14 3/15 9/15 $6,000 $10,000 $14,000 $18,000 $22,000 $26,000 3/12 9/12 3/13 9/13 3/14 9/14 3/15 9/15 Americas Asia/Pac MENA Sub Sah Africa/Eur. |
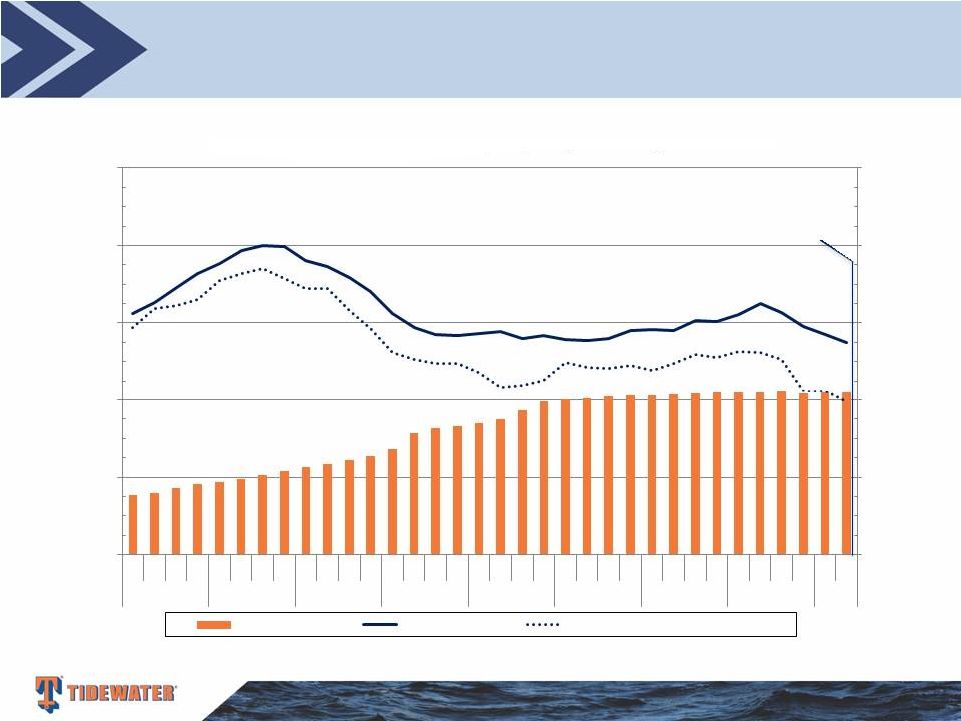
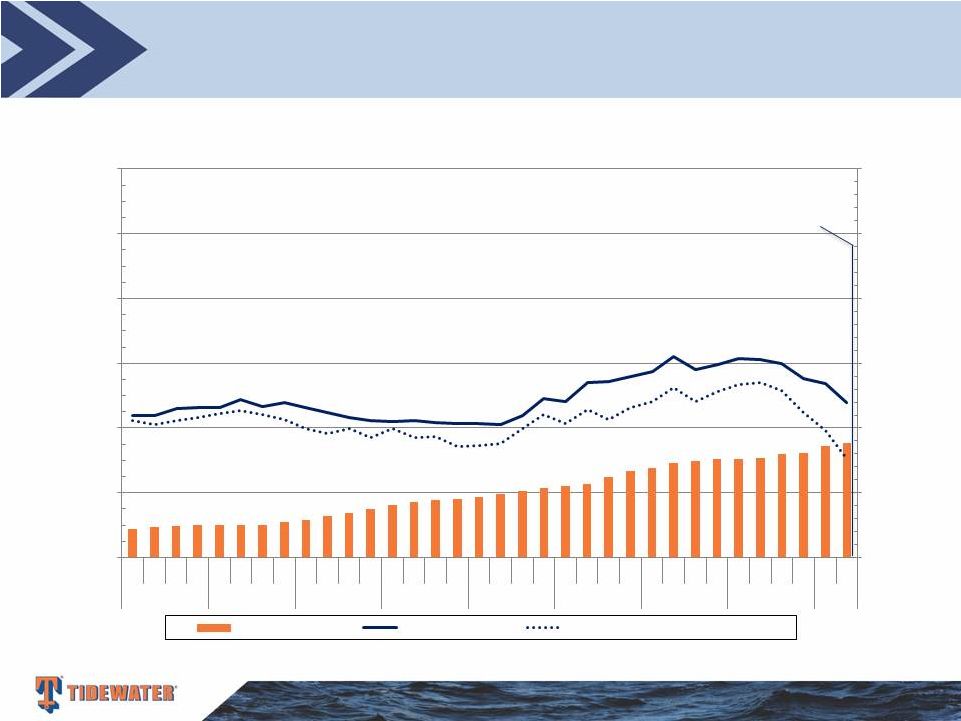 New
Vessel Trends by Vessel Type Deepwater PSVs
Cowen and Company 5th Annual Ultimate Energy Conference
23 $125 million, or 47%, of Vessel Revenue in Q2 Fiscal 2016 Q2 Fiscal 2016 Avg Day Rate: $23,864 Utilization: 64.0% 22 23 24 25 25 25 25 28 29 32 34 38 40 43 44 45 47 49 51 54 55 57 62 66 69 73 75 76 76 77 80 81 86 89 - 50 100 150 200 250 300 $0 $10,000 $20,000 $30,000 $40,000 $50,000 $60,000 Q1 Q2 Q3 Q4 Q1 Q2 Q3 Q4 Q1 Q2 Q3 Q4 Q1 Q2 Q3 Q4 Q1 Q2 Q3 Q4 Q1 Q2 Q3 Q4 Q1 Q2 Q3 Q4 Q1 Q2 Q3 Q4 Q1 Q2 FY08 FY09 FY10 FY11 FY12 FY13 FY14 FY15 FY16 Average Day Rate, Adjusted Average Day Rate, and Average Fleet Size Average Fleet Size Average Day Rate Utilization-Adjusted Average Day Rate |
 New
Vessel Trends by Vessel Type Deepwater AHTS
Cowen and Company 5th Annual Ultimate Energy Conference
24 Q2 Fiscal 2016 Avg Day Rate: $29,506 Utilization: 65.0% $21 million, or 8%, of Vessel Revenue in Q2 Fiscal 2016 5 5 5 5 5 5 5 6 8 9 9 11 11 11 11 11 11 11 11 11 11 11 11 11 11 12 12 12 12 12 12 12 12 - 50 100 150 200 250 300 $0 $10,000 $20,000 $30,000 $40,000 $50,000 $60,000 Q1 Q2 Q3 Q4 Q1 Q2 Q3 Q4 Q1 Q2 Q3 Q4 Q1 Q2 Q3 Q4 Q1 Q2 Q3 Q4 Q1 Q2 Q3 Q4 Q1 Q2 Q3 Q4 Q1 Q2 Q3 Q4 Q1 Q2 FY08 FY09 FY10 FY11 FY12 FY13 FY14 FY15 FY16 Average Day Rate, Adjusted Average Day Rate, and Average Fleet Size Average Fleet Size Average Day Rate Utilization-Adjusted Average Day Rate 5 |
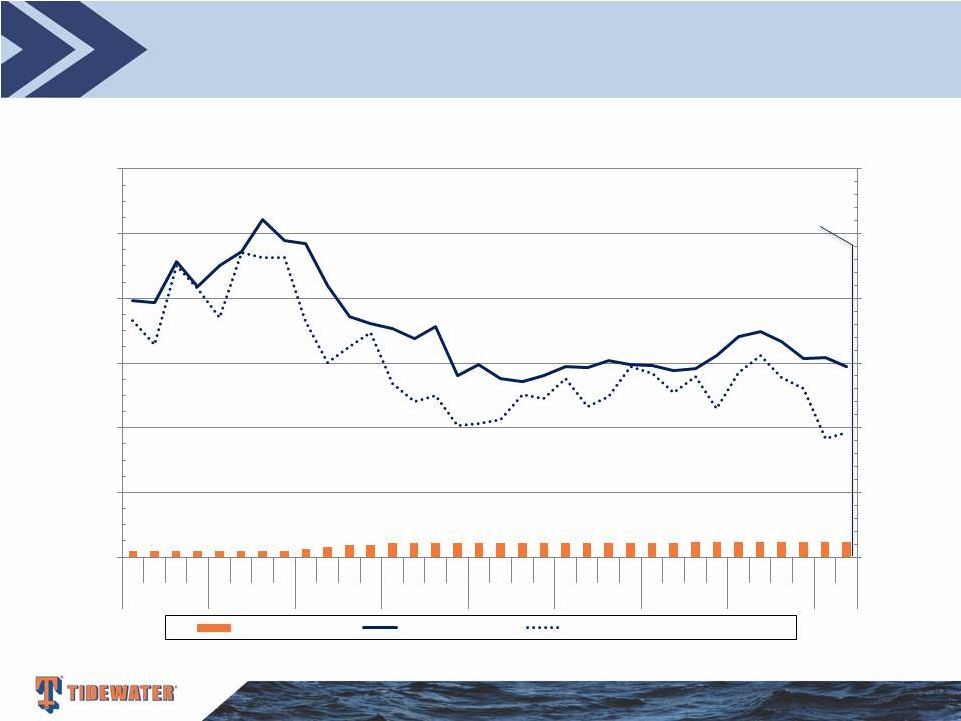
 New
Vessel Trends by Vessel Type Towing Supply/Supply Vessels
Cowen and Company 5th Annual Ultimate Energy Conference
25 Q2 Fiscal 2016 Avg Day Rate: $13,735 Utilization: 72.1% $96 million, or 36%, of Vessel Revenue in Q2 Fiscal 2016 39 43 47 51 57 61 68 81 85 93 101 102 103 104 105 105 105 105 - 50 100 150 200 250 $0 $5,000 $10,000 $15,000 $20,000 $25,000 Q1 Q2 Q3 Q4 Q1 Q2 Q3 Q4 Q1 Q2 Q3 Q4 Q1 Q2 Q3 Q4 Q1 Q2 Q3 Q4 Q1 Q2 Q3 Q4 Q1 Q2 Q3 Q4 Q1 Q2 Q3 Q4 Q1 Q2 FY08 FY09 FY10 FY11 FY12 FY13 FY14 FY15 FY16 Average Day Rate, Adjusted Average Day Rate, and Average Fleet Size Average Fleet Size Average Day Rate Utilization-Adjusted Average Day Rate |
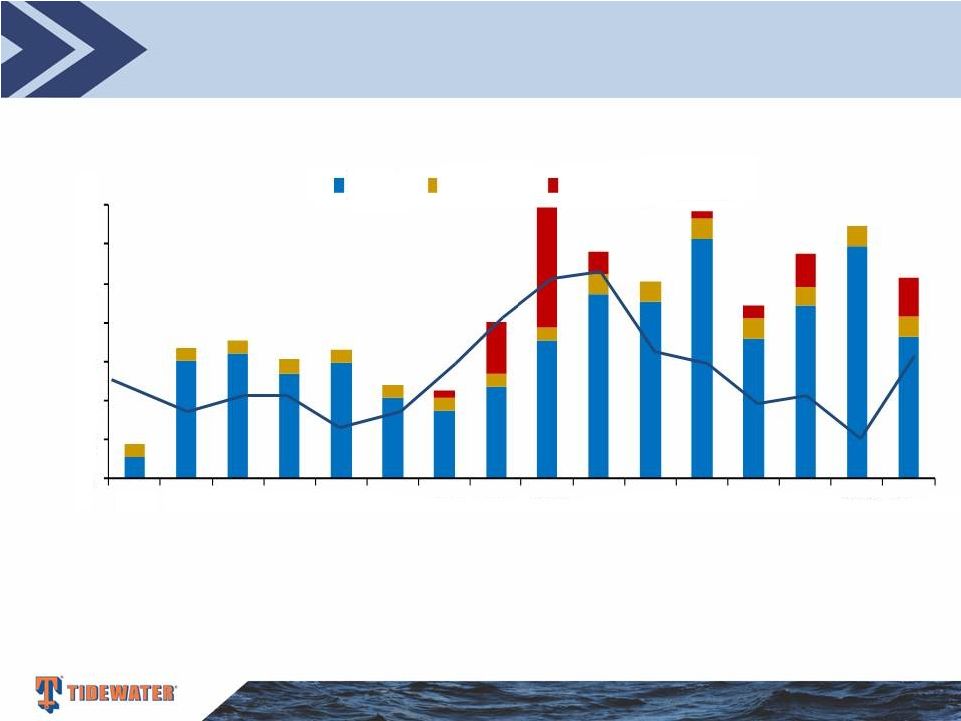
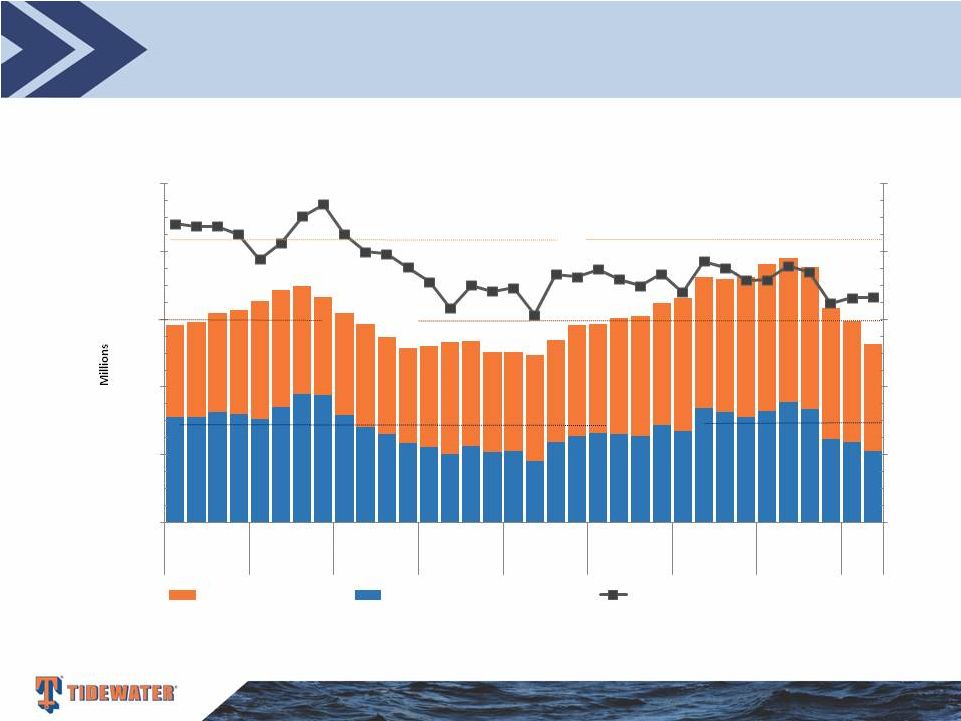 Vessel
Revenue and Vessel Operating Margin Fiscal 2008-2016
Cowen and Company 5th Annual Ultimate Energy Conference
26 Note: Vessel operating margin is defined as vessel revenue less vessel operating expenses
Prior peak period (FY2009)
averaged quarterly revenue of
$339M, quarterly operating
margin of $175.6M at 51.8%
$300 million $150 million 50.0% 53.0% 46.7% 56.4% 47.7% 38.0% 41.0% 36.9% 45.0% 44.1% 40.8% 46.3% 43.1% 45.6% 39.9% $ $100 $200 $300 $400 $500 Vessel Revenue ($) Vessel Operating Margin ($) Vessel Operating Margin (%) Q1 Q2 Q3 Q4 Q1 Q2 Q3 Q4 Q1 Q2 Q3 Q4 Q1 Q2 Q3 Q4 Q1 Q2 Q3 Q4 Q1 Q2 Q3 Q4 Q1 Q2 Q3 Q4 Q1 Q2 Q3 Q4 Q1 Q2 FY08 FY09 FY10 FY11 FY12 FY13 FY14 FY15 FY16 - |
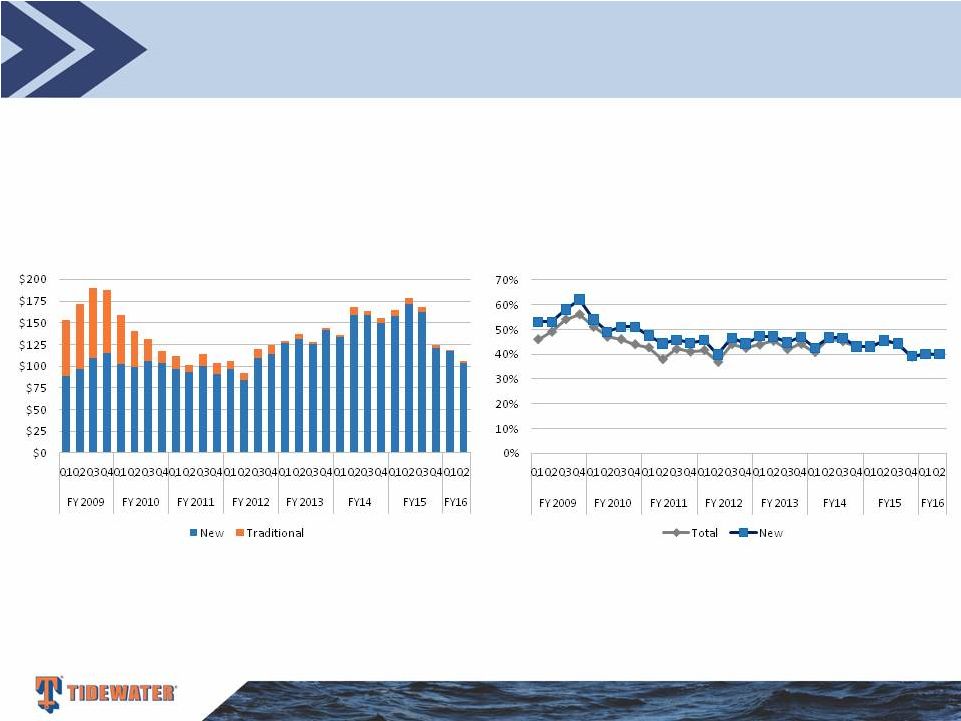 Historical Vessel Cash Operating Margins
Cowen and Company 5th Annual Ultimate Energy Conference
27 Vessel Cash Operating Margin ($) Vessel Cash Operating Margin (%) $106 million Vessel Margin in Q2 FY2016 (98% from New Vessels) Q2 FY2016 Vessel Margin: 40% |
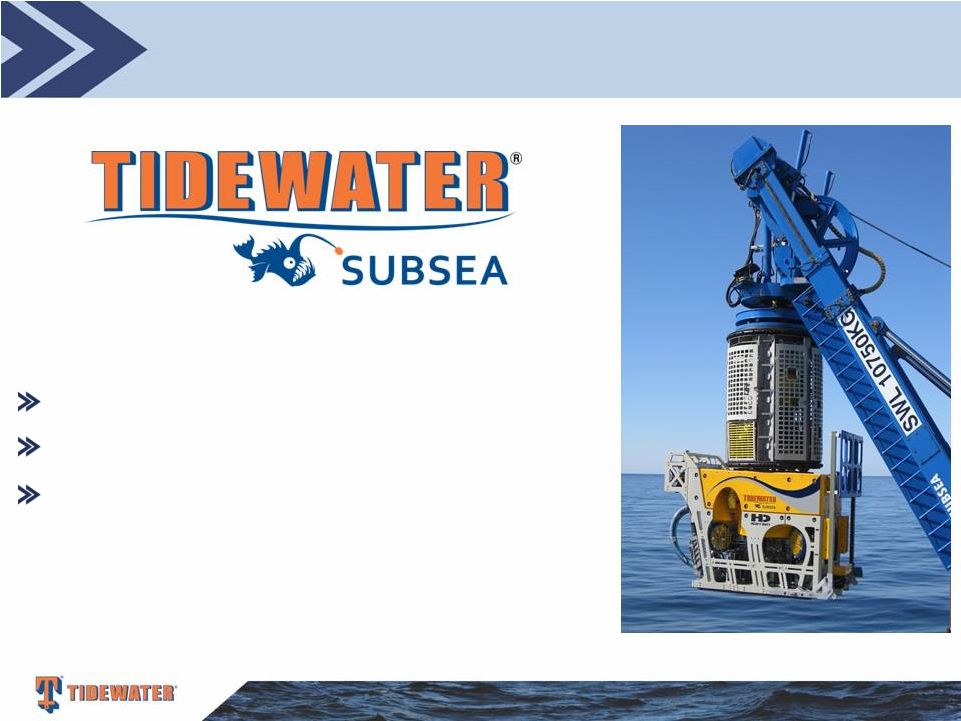 Tidewater’s Subsea Business
Cowen and Company 5th Annual Ultimate Energy Conference
28 Eight work-class ROVs in current fleet Commercial operations underway globally ROV capabilities generating potential for OSV pull through |