Attached files
Table of Contents
Index to Financial Statements
UNITED STATES
SECURITIES AND EXCHANGE COMMISSION
Washington, D.C. 20549
FORM 10-K
| x | ANNUAL REPORT PURSUANT TO SECTION 13 OR 15(d) OF THE SECURITIES EXCHANGE ACT OF 1934 |
For the fiscal year ended March 31, 2010
| ¨ | TRANSITION REPORT PURSUANT TO SECTION 13 OR 15(d) OF THE SECURITIES EXHANGE ACT OF 1934 |
For the transition period from to .
Commission file number: 1-6311
Tidewater Inc.
(Exact name of registrant as specified in its charter)
| Delaware |
|
72-048776 | ||
| (State of incorporation) | (I.R.S. Employer Identification No.) | |||
| 601 Poydras St., Suite 1900 | ||||
| New Orleans, Louisiana | 70130 | |||
| (Address of principal executive offices) | (Zip Code) |

Registrant’s telephone number, including area code: (504) 568-1010
Securities registered pursuant to Section 12(b) of the Act:
| Title of each class |
Name of each exchange on which registered | |
| Common Stock, par value $0.10 | New York Stock Exchange |
Securities registered pursuant to Section 12(g) of the Act: None
Indicate by check mark if the registrant is a well-known seasoned issuer, as defined in Rule 405 of the Securities Act. Yes x No ¨
Indicate by check mark if the registrant is not required to file reports pursuant to Section 13 or Section 15(d) of the Act. Yes ¨ No x
Indicate by check mark whether the registrant (1) has filed all reports required to be filed by Section 13 or 15(d) of the Securities Exchange Act of 1934 during the preceding 12 months (or for such shorter period that the registrant was required to file such reports), and (2) has been subject to such filing requirements for the past 90 days. Yes x No ¨
Indicate by check mark whether the registrant has submitted electronically and posted on its corporate Web site, if any, every Interactive Data File required to be submitted and posted pursuant to Rule 405 of Regulation S-T (§ 232.405 of this chapter) during the preceding 12 months (or for such shorter period that the registrant was required to submit and post such files). Yes ¨ No ¨
Indicate by check mark if disclosure of delinquent filers pursuant to Item 405 of Regulation S-K (§ 229.405 of this chapter) is not contained herein, and will not be contained, to the best of registrant’s knowledge, in definitive proxy or information statements incorporated by reference in Part III of this Form 10-K or any amendment to this Form 10-K. ¨
Table of Contents
Index to Financial Statements
Indicate by check mark whether the registrant is a large accelerated filer, an accelerated filer, a non-accelerated filer, or a smaller reporting company. See definition of “large accelerated filer,” “accelerated filer” and smaller reporting company in Rule 12b-2 of the Exchange Act.
| Large accelerated filer |
x |
Accelerated filer |
¨ | |||
| Non-accelerated filer |
¨ |
Smaller reporting company |
¨ | |||
Indicate by check mark whether the registrant is a shell company (as defined in Rule 12b-2 of the Exchange Act). Yes ¨ No x
As of September 30, 2009, the aggregate market value of the registrant’s voting common stock held by non-affiliates of the registrant was $2,418,405,274 based on the closing sales price as reported on the New York Stock Exchange of $47.09.
As of May 11, 2010, 51,858,527 shares of Tidewater Inc. common stock $0.10 par value per share were outstanding. Registrant has no other class of common stock outstanding.
DOCUMENTS INCORPORATED BY REFERENCE
Portions of the Registrant’s definitive proxy statement for its 2010 Annual Meeting of Stockholders to be filed with the Securities and Exchange Commission within 120 days after the end of the Registrant’s last fiscal year is incorporated by reference into Part III of this Annual Report on Form 10-K.
Table of Contents
Index to Financial Statements
Form 10-K
For the Fiscal Year Ended March 31, 2010
TABLE OF CONTENTS
| 4 | ||||
| 4 | ||||
| ITEM 1. |
4 | |||
| ITEM 1A. |
16 | |||
| ITEM 1B. |
22 | |||
| ITEM 2. |
22 | |||
| ITEM 3. |
22 | |||
| ITEM 4. |
23 | |||
| 24 | ||||
| ITEM 5. |
24 | |||
| ITEM 6. |
26 | |||
| ITEM 7. |
MANAGEMENT’S DISCUSSION AND ANALYSIS OF FINANCIAL CONDITION AND RESULTS OF OPERATIONS |
27 | ||
| ITEM 7A. |
60 | |||
| ITEM 8. |
62 | |||
| ITEM 9. |
CHANGES IN AND DISAGREEMENTS WITH ACCOUNTANTS ON ACCOUNTING AND FINANCIAL DISCLOSURE |
62 | ||
| ITEM 9A. |
62 | |||
| ITEM 9B. |
63 | |||
| 64 | ||||
| ITEM 10. |
64 | |||
| ITEM 11. |
64 | |||
| ITEM 12. |
SECURITY OWNERSHIP OF CERTAIN BENEFICIAL OWNERS AND MANAGEMENT AND RELATED STOCKHOLDER MATTERS |
64 | ||
| ITEM 13. |
CERTAIN RELATIONSHIPS AND RELATED TRANSACTIONS, AND DIRECTOR INDEPENDENCE |
64 | ||
| ITEM 14. |
64 | |||
| 65 | ||||
| ITEM 15. |
65 | |||
| 69 | ||||
| 69 | ||||
-3-
Table of Contents
Index to Financial Statements
In accordance with the safe harbor provisions of the Private Securities Litigation Reform Act of 1995, the company notes that this Annual Report on Form 10-K and the information incorporated herein by reference contain certain forward-looking statements which reflect the company’s current view with respect to future events and financial performance. All such forward-looking statements are subject to risks and uncertainties, and the company’s future results of operations could differ materially from its historical results or current expectations. Some of these risks are discussed in this report and include, without limitation, volatility in worldwide energy demand and oil and gas prices; fleet additions by competitors and industry overcapacity; changes in capital spending by customers in the energy industry for offshore exploration, field development and production; changing customer demands for vessel specifications, which may make some of our older vessels technologically obsolete for certain customer projects or in certain markets; uncertainty of global financial market conditions and difficulty in accessing credit or capital; acts of terrorism and piracy; significant weather conditions; unsettled political conditions, war, civil unrest and governmental actions, such as expropriation, especially in higher risk countries where we operate; foreign currency fluctuations; labor influences proposed by international conventions; and enforcement of laws related to the environment, labor and foreign corrupt practices.
Forward-looking statements, which can generally be identified by the use of such terminology as “may,” “expect,” “anticipate,” “estimate,” “forecast,” “believe,” “think,” “could,” “continue,” “intend,” “seek,” “plan,” and similar expressions contained in this report, are predictions and not guarantees of future performance or events. Any forward-looking statements are based on the company’s assessment of current industry, financial and economic information, which by its nature is dynamic and subject to rapid and possibly abrupt changes. The company’s actual results may differ materially from those stated or implied by such forward-looking statements due to risks and uncertainties associated with our business. While management believes that these forward-looking statements are reasonable when made, there can be no assurance that future developments that affect us will be those that we anticipate and have identified. The forward-looking statements should be considered in the context of the risk factors listed above and discussed in greater detail elsewhere in this Annual Report on Form 10-K. Investors and prospective investors are cautioned not to rely unduly on such forward-looking statements, which speak only as of the date hereof. Management disclaims any obligation to update or revise any forward-looking statements contained herein to reflect new information, future events or developments.
In certain places in this report, we refer to reports published by third parties that purport to describe trends or developments in energy production and drilling and exploration activity. The company does so for the convenience of our investors and potential investors and in an effort to provide information available in the market that will lead to a better understanding of the market environment in which the company operates. The company specifically disclaims any responsibility for the accuracy and completeness of such information and undertakes no obligation to update such information.
General
Tidewater Inc., a Delaware corporation that is listed on the New York Stock Exchange under the symbol “TDW”, provides offshore service vessels and marine support services to the global offshore energy industry through the operation of a diversified fleet of marine service vessels. The company was incorporated in 1956 and conducts its operations through wholly-owned subsidiaries and joint ventures. Unless otherwise required by the context, the term “company” as used herein refers to Tidewater Inc. and its consolidated subsidiaries.
The company provides services in support of all phases of offshore exploration, field development and production, including towing of (and anchor handling for) mobile offshore drilling units; transporting supplies and personnel necessary to sustain drilling, workover and production activities; offshore construction and seismic support; and a variety of specialized services such as pipe and cable laying. The size and
-4-
Table of Contents
Index to Financial Statements
composition of the company’s offshore service vessel fleet includes vessels that are operated under joint ventures, as well as vessels that are stacked or withdrawn from service.
The company has one of the most global operating footprints in the offshore energy industry with operations in most of the world’s significant crude oil and natural gas exploration and production regions. The company is also one of the most experienced international operators in the offshore energy industry with over five decades of international experience.
As of March 31, 2010, the company had 394 vessels (of which 10 were operated through joint ventures, 83 were stacked and seven were withdrawn from service) servicing the global energy industry. Please refer to Note 1 to Notes to Consolidated Financial Statements included in Item 8 of this report for additional information regarding our stacked vessels and vessels withdrawn from service.
The company also operates two shipyards, which construct, modify and repair vessels. The shipyards perform both repair work and new construction work for outside customers, as well as the construction, repair and modification of the company’s own vessels.
The company’s revenues, net earnings and cash flows from operations are largely dependent upon the activity level of its offshore marine vessel fleet. As is the case with other energy service companies, our business activity is driven by the level of drilling and exploration activity by our customers. Our customer’s business activity, in turn, is dependent on crude oil and natural gas prices, which fluctuate depending on expected future levels of supply and demand for crude oil and natural gas, and on estimates of the cost to find, develop and produce reserves.
Offices and Facilities
The company’s worldwide headquarters and principal executive offices are located at 601 Poydras Street, New Orleans, Louisiana 70130, and its telephone number is (504) 568-1010. The company’s United States (U.S.) marine operations are based in Amelia, Louisiana; Oxnard, California; and Houston, Texas. The company’s shipyards and shipyard operations are located in Houma, Louisiana. We conduct our international operations through facilities and offices located in over 30 countries. Our principal international offices and/or warehouse facilities, most of which are leased, are located in Rio de Janeiro and Macae, Brazil; Ciudad Del Carmen, Mexico; Port of Spain, Trinidad; Aberdeen, Scotland; Cairo, Egypt; Luanda and Cabinda, Angola; Lagos and Onne Port, Nigeria; Douala, Cameroon; Singapore; Perth, Australia; and Dubai, United Arab Emirates. The company’s operations generally do not require highly specialized facilities, and suitable facilities are generally available on a lease basis as required.
Business Segments
The company operates in two reportable segments: International and the United States. The principal customers for each business segment are major and independent oil and natural gas exploration, field development and production companies; drilling contractors; and other companies that provide various services to the offshore energy industry, including but not limited to, offshore construction companies, diving companies and well stimulation companies. The international business segment also has customers that are foreign government-owned or -controlled organizations and companies that explore and produce oil and natural gas.
The company’s vessels in its international segment are geographically dispersed in the major crude oil and natural gas exploration and development areas throughout the world. Although barriers such as mobilization costs, the availability of suitable vessels and cabotage rules in certain countries occasionally restrict the ability of the company to move vessels between international markets, the company’s diverse, mobile asset base and the wide geographic distribution of its vessel assets enable the company to respond relatively quickly to changes in market conditions. As such, significant variations between international regions tend to be of a short-term duration, as the company routinely moves vessel between and within geographic regions.
The company’s internationally based vessels operate in the shallow, intermediate and deepwater offshore markets around the world. The deepwater offshore market continues to be a growing sector of the international offshore crude oil and natural gas markets and is the one sector that has not experienced significant negative effects from the recent global economic recession, largely because the deepwater oil
-5-
Table of Contents
Index to Financial Statements
and gas development typically involves significant capital investment and multi-year development plans. As a result, such projects are generally underwritten by the participating exploration, development and production companies using relatively conservative assumptions in regards to crude oil and natural gas prices and these projects are, therefore, less susceptible to short-term fluctuations in the price of crude oil and natural gas.
The company’s international market segment revenue is derived primarily from vessel time charter contracts that are generally on a term basis (average three months to two years). The base rate of hire for a term contract is generally a fixed rate, though some charter arrangements include escalation clauses to recover specific additional costs.
The company’s vessels in its United States, or U.S., segment operate primarily in shallow, intermediate and deep waters of the U.S. Gulf of Mexico (GOM). A small percentage of the vessels in the U.S. segment operate in the U.S. coastal waters of the Pacific and Atlantic oceans. The deepwater offshore market has been a growing sector of the U.S. GOM and is the one domestic market that has yet to experience any significant negative effects from the global economic recession for the reasons cited above. However, the recent rig catastrophe in the U.S. GOM may have an impact on future drilling activity. Drilling in the shallow and intermediate waters of the U.S. GOM generally is less capital intensive and more susceptible to short-term fluctuations in the commodity prices of crude oil and natural gas.
The company’s U.S. market segment revenue is derived from vessel time charter contracts that are on a term basis and on a “spot” basis, which is a short-term agreement (one day to three months) to provide offshore marine services to a customer for a specific short-term job. The company’s U.S.-based deepwater class vessels are primarily contracted on a term basis.
Please refer to Item 7 “Management’s Discussion and Analysis of Financial Condition and Results of Operations” of this report for a greater discussion of the company’s International and U.S. segments, including the macroeconomic environment and market direction for each segment. In addition, please refer to Note 13 of Notes to Consolidated Financial Statement for segment, geographical data and major customer information.
Geographic Areas of Operation
The company’s fleet is deployed in the major global offshore oil and gas areas of the world. The principal areas of the company’s operations include the U.S. GOM, the Persian/Arabian Gulf, and areas offshore Australia, Brazil, Egypt, India, Indonesia, Malaysia, Mexico, Trinidad, and West Africa. The company regularly evaluates the deployment of its assets and repositions its vessels based on customer demand, relative markets conditions, and other considerations.
-6-
Table of Contents
Index to Financial Statements
Revenues and operating profit derived from International and United States marine operations and total marine assets for the International and United States segment for each of the fiscal years ended March 31 are summarized below:
| (In thousands) |
||||||||||
| 2010 | 2009 | 2008 | ||||||||
| Revenues: |
||||||||||
| Vessel revenues: |
||||||||||
| International |
$ | 1,048,553 | 1,209,426 | 1,055,339 | ||||||
| United States |
89,609 | 146,896 | 159,795 | |||||||
| Other marine revenues |
30,472 | 34,513 | 55,037 | |||||||
| $ | 1,168,634 | 1,390,835 | 1,270,171 | |||||||
| Marine operating profit: |
||||||||||
| Vessel activity: |
||||||||||
| International |
$ | 252,354 | 437,695 | 394,789 | ||||||
| United States |
9,196 | 34,797 | 29,985 | |||||||
| 261,550 | 472,492 | 424,774 | ||||||||
| Corporate expenses |
(51,432 | ) | (38,622 | ) | (40,974 | ) | ||||
| Gain on asset dispositions, net |
28,178 | 27,251 | 11,449 | |||||||
| Other marine services |
2,034 | 4,348 | 6,776 | |||||||
| Operating income |
$ | 240,330 | 465,469 | 402,025 | ||||||
| Total marine assets: |
||||||||||
| International |
$ | 2,822,058 | 2,575,637 | 2,117,373 | ||||||
| United States |
334,182 | 394,129 | 387,433 | |||||||
| Total marine assets |
$ | 3,156,240 | 2,969,766 | 2,504,806 | ||||||
Please refer to Item 7 of this report and Note 13 of Notes to Consolidated Financial Statements included in Item 8 of this report for further discussion of segment revenues, operating profit, and total asset by geographical areas in which the company operates.
Our Global Vessel Fleet
In calendar year 2000, the company embarked on a significant vessel construction and acquisition program. This program facilitated the company’s entrance into deepwater markets around the world and allowed the company to begin replacing its then existing fleet with fewer, larger, and more technologically sophisticated vessels. The vessel construction, acquisition and expansion program was initiated with the intent of strengthening the company’s presence in all major oil and gas producing regions of the world through the replacement of aging vessels in the company’s fleet. During this decade, the company purchased and/or constructed 185 vessels for approximately $2.4 billion. To date, the company has funded all of its vessel commitment programs from its available cash, operating cash flow, and funds provided by the private placement of $300.0 million in senior unsecured notes, revolving credit facilities, and various leasing arrangements.
The company’s strategy contemplates organic growth through the construction of vessels at a variety of shipyards worldwide and possible acquisitions of vessels and/or other owners and operators of offshore supply vessels. The company has the largest number of new vessels among its competitors in the industry, and it also has the largest fleet of older vessels in the industry. Management regularly evaluates alternatives for its older fleet. The company intends to pursue its long-term fleet replenishment and modernization strategy on a disciplined basis and, in each case, will carefully consider whether proposed investments and transactions have the appropriate risk/reward profile.
The average age of the company’s 377 owned or chartered vessel fleet (including stacked vessels but excluding joint-venture vessels and vessels withdrawn from service) at March 31, 2010 was approximately 17.8 years. The average age of the 170 vessels that the company acquired or constructed since calendar year 2000 as part of its new build and acquisition program was approximately 5.4 years. The remaining 207 vessels have an average age of 28.0 years. Of the company’s 377 vessels, 58 are deepwater class vessels, 224 are in the towing-supply/supply class vessels, 68 are crew/utility class vessels and 27 are offshore tugs.
At March 31, 2010, the company had commitments to acquire five vessels and build 31 vessels at a number of different shipyards around the world (one of which is being constructed in the United States by the
-7-
Table of Contents
Index to Financial Statements
company’s wholly-owned shipyard, Quality Shipyards, L.L.C.) at a total cost, including contract costs and other incidental costs, of approximately $742.4 million, including contract costs and other incidental costs, of which costs for the 31 new-build vessels totaled $681.8 million. In particular, the company is committed to the construction of 13 anchor handling towing supply vessels ranging between 5,150 and 13,570 brake horsepower (BHP), 16 platform supply vessels ranging between 2,965 and 5,400 deadweight tons of cargo capacity, and two crewboats. Scheduled delivery for these vessels began in April 2010 with delivery of the final vessel expected in July 2012. The company also had at such date binding agreements to purchase five anchor handling towing supply vessels for a total cost of approximately $60.6 million. In April 2010, the company took possession of three of these five anchor handling towing supply vessels, and plans to take possession of the fourth and fifth anchor handling towing supply vessels in May and June of 2010, respectively. At March 31, 2010, the company had invested $271.9 million in progress payments towards the construction of 31 vessels, and no payments have been made on the purchase of five anchor handling towing supply vessels. The remaining expenditures necessary to complete construction of the 31 vessels currently under construction (based on contract prices), and to fund the acquisition of the five anchor handling towing supply vessels was $470.5 million at March 31, 2010.
A full discussion of the company’s capital commitments, scheduled delivery dates and vessel sales is disclosed in the “Vessel Count, Dispositions, Acquisitions and Construction Programs” section of Item 7 and Note 10 of Notes to Consolidated Financial Statements included in Item 8 of this report. The “Vessel Count, Dispositions, Acquisitions and Construction Programs” section of Item 7 also contains a table comparing the actual March 31, 2010 vessel count and the average number of vessels by class and geographic distribution during the three years ended March 31, 2010, 2009 and 2008.
Between April 1999 and March 2010, the company also sold, primarily to buyers that operate outside of our industry, 508 vessels. Most of the vessel sales were at prices that exceeded their carrying values. In aggregate, proceeds from, and pre-tax gains on, vessel dispositions during this period approximated $746.0 million and $256.4 million, respectively.
Our Vessel Classifications
The company’s vessels regularly and routinely move from one operating area to another, often to and from offshore operating areas of different continents. The company discloses its vessel statistical information, such as revenue, utilization and average day rates, by vessel class. Listed below are the company’s five major vessel classes along with a description of the type of vessels categorized in each class and the services the respective vessels typically perform. Tables comparing the average size of the company’s marine fleet by class and geographic distribution for the last three fiscal years are included in Item 7 of this report.
Deepwater Vessels
Included in this vessel class are large, platform supply vessels (PSVs) and large, higher-horsepower (generally greater than 10,000 horsepower) anchor handling towing supply (AHTS) vessels. This vessel class is generally chartered to customers for use in transporting supplies and equipment from shore bases to deepwater and intermediate water depth offshore drilling rigs, platforms and other installations. Platform supply vessels, which have large cargo handling capabilities, serve drilling and production facilities and support offshore construction and maintenance work. The anchor handling towing supply vessels are equipped to tow drilling rigs and other marine equipment, as well as to set anchors for the positioning and mooring of drilling rigs. Also included in this vessel class are specialty vessels that can support offshore well stimulation, construction work, subsea services and/or have fire fighting capabilities and/or accommodation facilities. These vessels are generally available for routine supply and towing services but are outfitted and primarily intended for specialty services. Included in the specialty vessel category is the company’s one multi-purpose platform supply vessel (MPSV), which is designed for subsea service and construction support activities.
Towing-Supply and Supply Vessels
This is the company’s largest fleet class by number of vessels. Included in this class are anchor handling towing supply vessels and supply vessels with average horsepower below 10,000 BHP, and platform supply vessels that are generally less than 230 feet. The vessels in this class perform the same functions and
-8-
Table of Contents
Index to Financial Statements
services as their deepwater vessel class counterparts except they are generally chartered to customers for use in intermediate and shallow waters.
Crewboats and Utility Vessels
Crewboats and utility vessels are chartered to customers for use in transporting personnel and supplies from shore bases to offshore drilling rigs, platforms and other installations. These vessels are also often equipped for oil field security missions in markets where piracy or violence present concerns.
Offshore Tugs
Offshore tugs tow floating drilling rigs; assist in the docking of tankers; tow barges; assist pipe laying, cable laying and construction barges; and are used in a variety of other commercial towing operations, including towing barges carrying a variety of bulk cargoes and containerized cargo.
Other Vessels
The company’s vessels also include inshore tugs and production, line-handling and various other special purpose vessels. Inshore tugs, which are operated principally within inland waters, tow drilling rigs to and from their locations and tow barges carrying equipment and materials for use principally in inland waters for drilling and production operations. Barges are either used in conjunction with company tugs or are chartered to others. The company sold its remaining “other” type vessels during the first quarter of fiscal 2010.
Revenue Contribution of Main Classes of Vessels
Revenues from vessel operations were derived from the main classes of vessels in the following percentages:
| Year Ended March 31, |
|||||||||
| 2010 | 2009 | 2008 | |||||||
| Deepwater vessels |
31.9 | % | 24.0 | % | 24.7 | % | |||
| Towing-supply/supply |
56.9 | % | 61.9 | % | 59.7 | % | |||
| Crew/utility |
7.9 | % | 9.0 | % | 10.6 | % | |||
| Offshore tugs |
3.3 | % | 4.6 | % | 4.6 | % | |||
| Other |
0.0 | % | 0.5 | % | 0.4 | % | |||
Shipyard Operations
Quality Shipyards, L.L.C., a wholly-owned subsidiary of the company, operates two shipyards in Houma, Louisiana, which construct, modify and repair vessels. The shipyards perform repair work and new construction work for outside customers, as well as the construction, repair and modification of the company’s own vessels. During the last three fiscal years, Quality Shipyards, L.L.C. constructed and delivered two 220-foot deepwater platform supply vessels, two 266-foot platform supply vessels, and is currently constructing one additional 266-foot platform supply vessel for the company. The two 220-foot platform supply vessels were delivered to the company during fiscal 2008, while the two 266-foot platform supply vessels were delivered in December 2009 and late March 2010. The 266-foot deepwater, platform supply vessel that is currently under construction is expected to be delivered in February 2012.
Customers and Contracts
The company’s operations are materially dependent upon the levels of activity in offshore crude oil and natural gas exploration, field development and production throughout the world, which is affected by trends in worldwide crude oil and natural gas prices (including expectations of future commodity pricing) that are ultimately influenced by the supply and demand relationship for these natural resources. The activity levels of our customers are also influenced by the cost of exploring and producing crude oil and natural gas, which can be affected by environmental regulations, technological advances that affect energy production and consumption, significant weather conditions, the ability of our customers to raise capital, and local and international economic and political environments. A discussion of current market conditions and trends appears under “Macroeconomic Environment and Outlook” in Item 7 of this report.
-9-
Table of Contents
Index to Financial Statements
The company’s principal customers are major and independent oil and natural gas exploration, field development and production companies; foreign government-owned or-controlled organizations and companies that explore and produce oil and natural gas; drilling contractors; and companies that provide other services to the offshore energy industry, including but not limited to, offshore construction companies, diving companies and well stimulation companies.
In recent years, consolidation of exploration, field development, and production companies has occurred and this trend may continue in the future. Consolidation reduces the number of customers for the company’s equipment, and may negatively affect exploration, field development and production activity as consolidated companies generally focus on increasing efficiency and reducing costs and delay or abandon exploration activity with less promise. Such activity could adversely affect demand for the company’s vessels, and reduce the company’s revenues. In addition, consolidation could result in the absorption of an oil and gas company with whom the company has a strong commercial relationship into another company with which the company does not or vice-versa.
The company’s primary source of revenue is derived from time charter contracts of its vessels on a rate per day of service basis; therefore, vessel revenues are recognized on a daily basis throughout the contract period. As noted above, these time charter contracts are generally either on a term or “spot” basis. Vessel revenues are recognized on a daily basis throughout the contract period. There are no material differences in the cost structure of the company’s contracts based on whether the contracts are spot or term because the operating costs are generally the same without regard to the length of a contract.
For the year ended March 31, 2010, Chevron Corporation (including its worldwide subsidiaries and affiliates) accounted for approximately 18.3% and Petroleo Brasileiro SA accounted for approximately 13.1% of total revenues. In management’s opinion, the loss of these two significant customers could, at least in the short term, have a material adverse effect on the company’s results of operations. The five largest customers accounted for approximately 47.3% of the company’s total revenues, while the 10 largest customers accounted for approximately 61.8% of the company’s total revenues.
Competition
The principal competitive factors for the offshore vessel service industry are the suitability and availability of vessel equipment, price and quality of service. In addition, the ability to demonstrate a good safety record and attract and retain qualified and skilled personnel are also important competitive factors. The company has numerous competitors in all areas in which it operates around the world, and the business environment in all of these markets is highly competitive.
The company’s diverse, mobile asset base and the wide geographic distribution of its assets generally enable the company to respond relatively quickly to changes in market conditions and to provide a broad range of vessel services to its customers around the world. Management believes the company has a competitive advantage because of the size, diversity and geographic distribution of its vessel fleet. Economies of scale and experience level in the many areas of the world in which we operate, are also considered competitive advantages as is the company’s strong financial position.
According to ODS-Petrodata, the global offshore supply vessel market has approximately 450 new-build offshore support vessels (platform supply vessels and anchor handlers only) that are currently estimated to be under construction and that are expected to be delivered to the worldwide offshore vessel market over the next three years. The current worldwide fleet of these classes of vessels is estimated at approximately 2,450 vessels. An increase in vessel capacity could have the effect of lowering charter rates, particularly in the context of declining levels of exploration, field development and production activity. However, the worldwide offshore marine vessel industry also has a large number of aging vessels, including more than 800 vessels that are at least 25 years old, that are nearing or exceeding original expectations of their estimated economic lives. These older vessels could potentially be removed from the market within the next few years if the cost of extending the vessels’ lives is not economically justifiable. Although the future attrition rate of these aging vessels cannot be accurately predicted, the company believes that the retirement of a sizeable portion of these aging vessels would likely mitigate the potential combined negative effects of new-build vessels on vessel utilization and vessel pricing. Additional vessel demand could also be created with the addition of new drilling rigs and floating production units that are expected to be delivered and become operational over the next few years, which should help minimize the possible negative effects
-10-
Table of Contents
Index to Financial Statements
the new-build offshore support vessels (platform supply vessels and anchor handlers only) being added to the offshore support vessel fleet. It is unknown at this time the extent to which the recovery from the recent worldwide recession will influence the utilization of equipment currently in existence or the ultimate timing of delivery and placing into service of new drilling rigs, floating production units and vessels currently under construction. Analysts have reported some offshore vessel construction contract cancellations as a result of the foregoing factors, which may reduce the ultimate number of vessels built and delivered.
Challenges We Confront as an International Offshore Vessel Company
The company operates in many challenging operating environments around the world that present varying degrees of political, social, economic and other uncertainties. We operate in markets where the possibility exists of expropriation, confiscation or nationalization of our vessels or other assets, terrorism, piracy, civil unrest, changing foreign currency exchange rates and controls, and changing political conditions that may adversely affect our operations. Although the company takes what it believes to be prudent measures to safeguard its property and personnel against these risks to the extent practicable, it cannot be assured that the company will escape any of the aforementioned events, although the wide geographic dispersion of the company’s vessels helps substantially mitigate the impact of these risks.
In some international operating environments, local customs or laws may require the company to form joint ventures with local owners or use local agents. The company’s international operations are carried out with due regard to the rules and regulations of the Office of Foreign Assets Control (OFAC), the Trading with the Enemy Act, the Foreign Corrupt Practices Act (FCPA), and other applicable laws and regulations. Certain international environments in which the company operates are characterized by heightened levels of governmental corruption and local customs and practices that may conflict with the requirements of U.S. law. The company has adopted policies and procedures in an effort to mitigate these risks.
Sonatide
The company has previously reported in its periodic filings that it was in discussions with Sonangol, the national oil company of Angola, regarding a Sonangol proposal to increase its control over Sonatide Marine Services Ltd., an Angolan joint venture between Sonangol and a Tidewater subsidiary. The company currently has an indirect 49% ownership interest in Sonatide. The company also previously reported that it had reached agreement with Sonangol on certain amendments to the joint venture agreement that would increase Sonangol’s control over the operations of Sonatide. Thereafter, Sonangol and the company continued to have dialogue regarding additional changes proposed by Sonangol to Sonatide’s practices and procedures that, if adopted, would further Sonangol’s control over Sonatide’s day-to-day operations, including treasury functions. In December, 2009, Sonangol notified Tidewater that the existing joint venture agreement, which was scheduled to expire on July 31, 2010 unless renewed, would not be renewed by Sonangol, although Sonangol advised that it was willing to discuss a new joint venture agreement. The company is in constructive discussions with Sonangol regarding the terms of a new joint venture arrangement although no assurances can be given that these discussions will be successfully concluded or whether such terms will be advantageous to the company. In addition, over the course of the last several months Sonangol has been willing to extend the term of the Sonatide joint venture to fulfill several new or renewed charterparty agreements with customers for a substantial portion of the current fleet in Angola that extend beyond July 31, 2010. Failing to further extend the existing Sonatide joint venture or reach a new joint venture agreement with Sonangol could impair the company’s ability to continue to effectively compete for business in Angola in the future. More Tidewater vessels are deployed in Angola than in any of Tidewater’s other countries of operation, and a significant portion of revenues derived from the company’s largest customer, Chevron, are derived through the company’s operations in Angola.
International Labour Organization’s Maritime Labour Convention
The International Labour Organization’s Maritime Labour Convention, 2006 (the Convention) seeks to mandate globally, among other things, seafarer working conditions, ship accommodations, wages, conditions of employment, health and other benefits for all ships (and the seafarers on that ship) that are engaged in commercial activities. To date, this Convention has been ratified by five countries, namely, the Bahamas, Liberia, Marshall Islands, Norway and Panama, representing 33% of the world’s tonnage. If adopted by an additional 25 countries, then within 12 months thereof, the Convention will become law. Some believe that this Convention could become law in 2011. The company believes that the labor changes
-11-
Table of Contents
Index to Financial Statements
proposed by this Convention are unnecessary in light of existing international labor laws that govern many of these issues. The company is working with industry representatives to oppose ratification of this Convention. Should this Convention become law, the company and its customers’ operations may be negatively affected during the period of compliance.
Government Regulation
The company is subject to various United States federal, state and local statutes and regulations governing the operation and maintenance of its vessels. The company’s U.S. flag vessels are subject to the jurisdiction of the United States Coast Guard, the United States Customs Service, the United States Maritime Administration and the National Transportation Safety Board. The company is also subject to international laws and conventions and the laws of international jurisdictions where the company and its offshore vessels operate.
Under the citizenship provisions of the Merchant Marine Act of 1920 and the Shipping Act, 1916, as amended, the company would not be permitted to engage in the U.S. coastwise trade if more than 25% of the company’s outstanding stock were owned by non-U.S. citizens. For a company engaged in the U.S. coastwise trade to be deemed a U.S. citizen: (i) the company must be organized under the laws of the United States or of a state, territory or possession thereof, (ii) each of the chief executive officer and the chairman of the board of directors of such corporation must be a U.S. citizen, (iii) no more than a minority of the number of directors of such corporation necessary to constitute a quorum for the transaction of business can be non-U.S. citizens and (iv) at least 75% of the interest in such company must be owned by U.S. citizens. The company has a dual stock certificate system to protect against non-U.S. citizens owning more than 25% of its common stock. In addition, the company’s charter provides the company with certain remedies with respect to any transfer or purported transfer of shares of the company’s common stock that would result in the ownership by non-U.S. citizens of more than 24% of its common stock. Based on information supplied to the company by its transfer agent, approximately 10% of the company’s outstanding common stock was owned by non-U.S. citizens as of March 31, 2010.
The laws of the U.S. require that vessels engaged in the U.S. coastwise trade must be built in the U.S. In addition, once a U.S.-built vessel is registered under a non-U.S. flag, it cannot thereafter engage in U.S. coastwise trade. Therefore, the company’s non-U.S. flag vessels must operate outside of the U.S. coastwise trade. Of the total 394 vessels owned or operated by the company at March 31, 2010, 316 vessels were registered under flags other than the United States and 78 vessels were registered under the U.S. flag. If the company is not able to secure adequate numbers of charters abroad for its non-U.S. flag vessels, even if work would otherwise have been available for such vessels in the United States, these vessels cannot operate in the U.S. coastwise trade, and the company’s financial performance could be affected.
All of the company’s offshore vessels are subject to United States and international safety and classification standards. U.S. flag towing-supply, supply vessels and crewboats are required to undergo periodic inspections twice within every five year period pursuant to U.S. Coast Guard regulations. Vessels registered under flags other than the United States are subject to similar regulations and are governed by the laws of the applicable international jurisdictions and the rules and requirements of various classification societies, such as the American Bureau of Shipping.
The company is in compliance with the International Ship and Port Facility Security Code (ISPS), an amendment to the Safety of Life at Sea (SOLAS) Convention (1974/1988), and further mandated in the Maritime Transportation Security Act of 2002 to align United States regulations with those of SOLAS and the ISPS Code. Under the ISPS Code, the company performs worldwide security assessments, risk analyses, and develops vessel and required port facility security plans to enhance safe and secure vessel and facility operations. Additionally, the company has completed the process of installing automated identification systems, long range identification tracking system and ships security alert systems on all vessels that are required to have the respective systems.
Environmental Compliance
During the ordinary course of business, the company’s operations are subject to a wide variety of environmental laws and regulations that govern the discharge of oil and pollutants into navigable waters. Violations of these laws may result in civil and criminal penalties, fines, injunction and other sanctions.
-12-
Table of Contents
Index to Financial Statements
Compliance with the existing governmental regulations that have been enacted or adopted regulating the discharge of materials into the environment, or otherwise relating to the protection of the environment has not had, nor is expected to have, a material effect on the company. However, environmental laws and regulations are subject to change and may impose increasingly strict requirements and, as such, the company cannot estimate the ultimate cost of complying with such laws and regulations.
Further, the company is involved in various legal proceedings that relate to asbestos and other environmental matters. In the opinion of management, based on current information, the amount of ultimate liability, if any, with respect to these proceedings is not expected to have a material adverse effect on the company’s financial position, results of operations, or cash flows. The company is proactive in establishing policies and operating procedures for safeguarding the environment against any hazardous materials aboard its vessels and at shore base locations. Whenever possible, hazardous materials are maintained or transferred in confined areas in an attempt to ensure containment if accidents occur. In addition, the company has established operating policies that are intended to increase awareness of actions that may harm the environment.
Safety
The company is committed to ensuring the safety of its operations for both its employees and its customers. The company’s principal operations occur in offshore waters where the workplace environment presents safety challenges. Because the work environment presents these challenges, the company works diligently to maintain workplace safety. Management regularly communicates with its personnel to promote safety and instill safe work habits through company media and safety review sessions. The company also regularly conducts safety training meetings for its seamen and staff personnel. The company dedicates personnel and resources to ensure safe operations and regulatory compliance. The company’s Director of Health, Safety and Environmental Management is involved in proactive efforts to prevent accidents and injuries and reviews all incidents that occur throughout the company. In addition, the company employs safety personnel at every operating location who are responsible for administering the company’s safety programs and fostering the company’s safety culture.
Risk Management
The operation of any marine vessel involves an inherent risk of catastrophic marine disaster; adverse sea and weather conditions; mechanical failure; collisions and property losses to the vessel. In addition, the nature of our operations exposes the company to damage to and loss of drilling rigs and production facilities; war, sabotage, pirate and terrorism risks; and business interruption due to political action or inaction, including nationalization of assets by foreign governments. Any such event may result in a reduction in revenues or increased costs. The company’s vessels are generally insured for their estimated market value against damage or loss, including war, terrorism acts, and pollution risks, but the company does not fully insure for business interruption. The company also carries workers’ compensation, maritime employer’s liability, director and officer liability, general liability (including third party pollution) and other insurance customary in the industry.
The company seeks to secure appropriate insurance coverage at competitive rates by maintaining a self-retention layer up to certain limits on its marine package policies. The company carefully monitors claims and participates actively in claims estimates and adjustments. Estimated costs of self-insured claims, which include estimates for incurred but unreported claims, are accrued as liabilities on our balance sheet.
The continued threat of terrorist activity and other acts of war or hostility have significantly increased the risk of political, economic and social instability in some of the geographic areas in which the company operates. It is possible that further acts of terrorism may be directed against the United States domestically or abroad, and such acts of terrorism could be directed against properties and personnel of U.S.-owned companies such as ours. The resulting economic, political and social uncertainties, including the potential for future terrorist acts and war, could cause the premiums charged for our insurance coverage to increase. The company currently maintains war risk coverage on its entire fleet.
Management believes that the company’s insurance coverage is adequate. The company has not experienced a loss in excess of insurance policy limits; however, there is no assurance that the company’s liability coverage will be adequate to cover all potential claims that may arise. While the company believes
-13-
Table of Contents
Index to Financial Statements
that it should be able to maintain adequate insurance in the future at rates considered commercially acceptable, it cannot guarantee such with the current level of uncertainty in the markets the company operates.
Raw Materials
The company’s wholly-owned subsidiary, Quality Shipyards, L.L.C., performs both repair work and new construction work for outside customers, as well as the construction, repair and modification of the company’s own vessels. The shipyard operations require raw materials, such as alloy steels in various forms, welding gases, paint, fuels and lubricants, which are available from many sources. The shipyard does not depend on any one supplier or source for any of these materials. Although shortages for some of these materials and fuels have occurred from time to time, no material shortage currently exists nor does the shipyard anticipate any shortages. The commodity price for iron ore, the main component of steel, is typically volatile, and shortages may occur from time to time.
Seasonality
The company’s global vessel fleet generally has its highest utilization rates in the warmer months when the weather is more favorable for offshore exploration, field development and construction work. The company’s U.S. GOM operations can be impacted by the Atlantic hurricane season from the months of June through November, when offshore exploration, field development and construction work tends to slow or halt in an effort to mitigate potential losses and damage that may occur to the offshore oil and gas infrastructure should a hurricane enter the U.S. GOM. However, demand for offshore marine vessels typically increases in the U.S. GOM in connection with repair and remediation work that follows any hurricane damage to offshore crude oil and natural gas infrastructure. The company’s vessels that operate in Southeast Asia and Pacific are impacted by the monsoon season, which moves across the region between September and early March.
The company’s business volume is more dependent on crude oil and natural gas prices and global supply and demand conditions for the company’s offshore marine services than any seasonal variation.
Employees
As of March 31, 2010, the company had approximately 7,900 employees worldwide. The company strives to maintain excellent relations with its employees. The company is not a party to any union contract in the United States but through several subsidiaries is a party to union agreements covering local nationals in several countries other than the United States. In the past, the company has been the subject of a union organizing campaign for the U.S. GOM employees by maritime labor unions. These union organizing efforts have abated, although the threat has not been completely eliminated. If the employees in the U.S. GOM were to unionize, the company’s flexibility in managing industry changes in the domestic market could be adversely affected.
-14-
Table of Contents
Index to Financial Statements
Executive Officers of the Registrant
| Name |
Age | Position | ||
| Dean E. Taylor |
61 | Chairman of the Board of Directors since 2003. Chief Executive Officer since March 2002. President since October 2001. Executive Vice President from 2000 to 2001. Senior Vice President from 1998 to 2000. | ||
| Jeffrey M. Platt |
52 | Chief Operations Officer since March 2010. Executive Vice President since July 2006. Senior Vice President from 2004 to June 2006. Vice President from 2001 to 2004. | ||
| Stephen W. Dick |
60 | Executive Vice President since December 2001. Senior Vice President from 1999 to 2001. Vice President from 1990 to 1999. | ||
| Quinn P. Fanning |
46 | Chief Financial Officer since September 2008. Executive Vice President since July 2008. Prior to July 2008, Mr. Fanning was a Managing Director with Citigroup Global Markets Inc. In his 12 year investment banking career, all of which was with Citigroup or predecessor companies, Mr. Fanning generally focused on advisory services for the energy industry. | ||
| Joseph M. Bennett |
54 | Executive Vice President since June 2008. Chief Investor Relations Officer since 2005. Senior Vice President from 2005 to May 2008. Principal Accounting Officer from 2001 to May 2008. Vice President from 2001 to 2005. Controller from 1990 to 2005. | ||
| Bruce D. Lundstrom |
46 | Executive Vice President since August 2008. Senior Vice President from September 2007 to July 2008. General Counsel since September 24, 2007. | ||
There are no family relationships between the directors or executive officers of the company. The company’s officers are elected annually by the Board of Directors and serve for one-year terms or until their successors are elected.
Available Information
The company makes available free of charge, on or through its internet website (www.tdw.com), its annual reports on Form 10-K, Quarterly Reports on Form 10-Q, Current Reports on Form 8-K, and other filings pursuant to Section 13(a) or 15(d) of the Securities Exchange Act of 1934, and amendments to such filings, as soon as reasonably practicable after each is electronically filed with, or furnished to, the Securities and Exchange Commission (the “SEC”). The public may read and copy any materials the company has filed with the SEC at the SEC’s Public Reference Room at 100 F Street, NE, Washington, DC 20549. Information on the operation of the Public Reference Room may be obtained by calling the SEC at 1-800-SEC-0330. The SEC maintains an internet site that contains the company’s reports, proxy and information statements, and the company’s other SEC filings. The address of the SEC’s website is www.sec.gov. Information appearing on the company’s website is not part of any report that it files with the SEC.
The company also makes available its Code of Business Conduct and Ethics (Code), which is posted on our website, for its directors, chief executive officer, chief financial officer, principal accounting officer, and other officers and employees on matters of business conduct and ethics, including compliance standards and procedures. We will make timely disclosure by a Current Report on Form 8-K and on our website of any change to, or waiver from, the Code of Business Conduct and Ethics for our principal executive and senior financial officers. Any changes or waivers to the Code will be maintained on the company’s website for at least 12 months. A copy of the Code is also available in print to any stockholder upon written request addressed to Tidewater Inc., 601 Poydras Street, Suite 1900, New Orleans, Louisiana 70130.
-15-
Table of Contents
Index to Financial Statements
The company operates globally in many challenging and highly competitive markets. Listed below are some of the more critical or unique risk factors that we have identified as affecting or potentially affecting the company and the offshore marine service industry. You should consider these risks when evaluating any of the company’s forward-looking statements. The effect of any one risk factor or a combination of several risk factors could materially affect the company’s results of operations, financial condition and cash flows and the accuracy of any forward-looking statements made in this Annual Report on Form 10-K.
Oil and Gas Prices Are Highly Volatile
Commodity prices for crude oil and natural gas are highly volatile. Prices are extremely sensitive to the respective supply/demand relationship for crude oil and natural gas. High demand for crude oil and natural gas and/or low inventory levels for these resources as well as any perceptions about future supply interruptions can cause prices for crude oil and natural gas to rise, while generally, low demand for crude oil and natural gas and/or increases in crude oil and natural gas supplies cause prices for crude oil and natural gas to decrease.
Factors that affect the supply of crude oil and natural gas include, but are not limited to, the following: global demand for the natural resources; the Organization of Petroleum Exporting Countries’ (OPEC) ability to control crude oil production levels and pricing, as well as the level of production by non-OPEC countries; political and economic uncertainties (including wars, terrorist acts or security operations); advances in exploration and field development technologies; significant weather conditions; and governmental restrictions placed on exploration and production of natural resources.
Prolonged material economic downturn in crude oil and natural gas prices can negatively impact the development plans of exploration and production companies. In addition, a prolonged recession may result in a decrease in demand for offshore support vessel services and a reduction in charter rates and/or utilization rates, which would have a material adverse effect on the company’s results of operations, cash flows and financial condition.
Changes in the Level of Capital Spending by Our Customers
The company’s principal customers are major and independent oil and natural gas exploration, development and production companies; foreign government-owned or-controlled organizations and companies that explore and produce oil and natural gas; drilling contractors; and companies that provide other services to the offshore energy industry, such as, offshore construction companies, diving companies and well stimulation companies. The company’s results of operations are highly dependent on the level of capital spending for exploration and field development by the companies that operate in the energy industry. The energy industry’s level of capital spending is substantially related to the demand for natural resources and prevailing commodity prices of natural gas and crude oil. When commodity prices are low, the company’s customers generally reduce their capital spending budgets for onshore and offshore drilling, exploration and development. The level of offshore oil and natural gas exploration, development and production activity has historically been volatile, and that volatility is likely to continue.
Other factors that influence the level of capital spending by our customers that are beyond the control of the company include: worldwide demand for crude oil and natural gas; the cost of exploring and producing oil and natural gas, which can be affected by environmental regulations; significant weather conditions; technological advances that affect energy production and consumption; local and international economic and political environment; and the availability and cost of financing.
Unconventional Natural Gas Sources are Exerting Downward Pricing Pressures on the Price of Natural Gas
The rise in production of unconventional gas resources in North America and the commissioning of a number of new large Liquefied Natural Gas (LNG) export facilities around the world are contributing to an over-supplied natural gas market. While production of natural gas from unconventional sources is a relatively small portion of the worldwide natural gas production, it is expected to grow in the future. There is a significant oversupply of natural gas inventories in the Unites States in part due to the increase of
-16-
Table of Contents
Index to Financial Statements
unconventional gas in the market. Prolonged increases in the worldwide supply of natural gas, whether from conventional or unconventional sources, will exert downward pressure on natural gas prices. A prolonged downturn in natural gas pricing would likely have a negative impact on development plans of exploration and production companies, which in turn, may result in a decrease in demand for offshore support vessel services. This consequence could be particularly acute in the company’s U.S. operating segment, which is more oriented towards natural gas than crude oil production, and therefore more sensitive to the changes in the market pricing for natural gas than to changes in the market pricing of crude oil.
Difficult Economic Market Conditions
Uncertainty about future global economic market conditions makes it challenging for the company to forecast operating results and to make decisions about future investments. The success of the company’s business is both directly and indirectly dependent upon conditions in the global financial and commercial markets that are outside its control and difficult to predict. Uncertain economic conditions may lead our customers to postpone spending in response to tighter credit and reductions in income or asset values, which may lead many financial lenders and institutional investors to reduce, and in some cases, cease to provide funding to borrowers, which, in turn, will adversely affect the liquidity and financial condition of our customers. These factors may also adversely affect the company’s liquidity and financial condition. Factors such as interest rates, availability of credit, inflation rates, economic uncertainty, changes in laws (including laws relating to taxation), trade barriers, commodity prices, currency exchange rates and controls, and national and international political circumstances (including wars, terrorist acts or security operations) can have a material negative impact on the company’s business and operations, which in turn would reduce its revenues and profitability.
Prolonged material economic downturn in crude oil and natural gas prices can negatively impact the development plans of exploration and production companies. In addition, a prolonged recession may result in a decrease in demand for offshore support vessel services and a reduction in charter rates and/or utilization rates, which would have a material adverse effect on the company’s results of operations, cash flows and financial condition. Prior to mid-2008, oil and gas companies had increased their respective exploration and development activities in response to a very favorable pricing environment for oil and gas that existed at that time. Worldwide demand for oil and gas dropped precipitously and energy prices sharply declined during the last half of calendar 2008 as a result of a global economic recession. Over one year later, there are signs that economic improvement is underway; however, the pace of recovery and demand for energy and, in turn, offshore supply vessel services has been slow.
The Offshore Marine Service Industry is Highly Competitive
The company operates in a highly competitive industry, which could depress vessel charter rates and utilization and adversely affect the company’s financial performance. We compete for business with our competitors on the basis of price; reputation for quality service; quality, suitability and technical capabilities of vessels; availability of vessels; safety and efficiency; and cost of mobilizing vessels from one market to another. In addition, competition in international markets may be adversely affected by regulations requiring, among other things, the awarding of contracts to local contractors, the employment of local citizens and/or the purchase of supplies from local vendors that favor or require local ownership. In general, declines in the level of offshore drilling and development activity by the energy industry negatively affect the demand for the company’s vessels and result in downward pressure on day rates. Extended periods of low vessel demand and/or low day rates reduce the company’s revenues.
Potential Overcapacity in the Offshore Marine Industry
Over the past decade, construction of offshore vessels of the types the company operates has increased significantly. Excess offshore supply vessel capacity likewise exerts downward pressure on charter rates. Excess capacity can occur when newly constructed vessels enter the market and when vessels are mobilized between market areas. While the company is committed to the construction of additional vessels, it has also sold and/or scrapped a significant number of vessels over the last several years. A discussion about the aging of the company’s fleet, which has necessitated the company’s new vessel construction programs, appears in the “Vessel Count, Dispositions, Acquisitions and Construction Programs” section of Item 7 in this report. Also, please read “Potential Overcapacity in the Offshore Marine Industry” risk below for further information that can exert downward pricing pressures on charter rates.
-17-
Table of Contents
Index to Financial Statements
The offshore supply vessel market has approximately 450 new-build offshore support vessels (platform supply vessels and anchor handlers only) that are currently estimated to be under construction and that are expected to be delivered to the worldwide offshore vessel market over the next four years, according to ODS-Petrodata. The current worldwide fleet of these classes of vessels is estimated at approximately 2,450 vessels. An increase in vessel capacity could result in increased competition in the company’s industry which may have the effect of lowering charter rates and utilization rates, which, in turn, would result in lower revenues to the company. Also, please read “Potential Repeal or Amendment of the Shipping Act May Have an Adverse Impact on the Company’s U.S. Segment” risk below for additional information that can increase vessels overcapacity in our U.S. Segment.
Risks Associated with Operating Internationally
For the fiscal years ended March 31, 2010, 2009 and 2008, 92%, 89%, and 87%, respectively, of the company’s total revenues were generated by its international segment. The company’s international vessel operations are vulnerable to many risks inherent in doing business in countries other than the United States, some of which have recently become more pronounced. Our customary risks of operating internationally include political and economic instability within the host country; possible vessel seizures or nationalization of assets and other governmental actions by the host country (please refer to Item 7 in this report and Note 10 to Notes to Consolidated Financial Statements for a discussion of our Venezuelan operations regarding vessel seizures); foreign government regulations that favor or require the awarding of contracts to local competitors; an inability to recruit and retain management of overseas operations; currency fluctuations, revaluations, devaluations and restrictions on repatriation of currency; and import/export quotas and restrictions; most of which are beyond the control of the company.
The company is also subject to acts of piracy and kidnappings that put its assets and personnel at risk. The increase over the last few years in the level of these criminal or terrorist acts has been well-publicized. As a marine services company that usually operates in coastal or tidal waters, the company is particularly vulnerable to these kinds of illicit activities. Although the company takes what it considers to be prudent measures to protect its personnel and assets in markets that present these risks, it has confronted these issues in the past and there can be no assurance it will not be subjected to them in the future.
The continued threat of terrorist activity and other acts of war or hostility have significantly increased the risk of political, economic and social instability in some of the geographic areas in which the company operates. It is possible that further acts of terrorism may be directed against the United States domestically or abroad and such acts of terrorism could be directed against properties and personnel of U.S.-owned companies such as ours. To date, the company has not experienced any material adverse effects on its results of operations and financial condition as a result of terrorism, political instability or war.
Operational Hazards Inherent to the Offshore Marine Vessel Industry
The operation of any marine vessel involves inherent risk that could adversely affect our financial performance if we are not adequately insured or indemnified. Our operations are also subject to various operating hazards and risks, including risk of catastrophic marine disaster; adverse sea and weather conditions; mechanical failure; collisions and property losses to the vessel; damage to and loss of drilling rigs and production facilities; war, sabotage, pirate and terrorism risks; and business interruption due to political action or inaction, including nationalization of asset by foreign governments.
These risks present a threat to the safety of personnel and to our vessels, cargo, equipment under tow and other property, as well as the environment. Any such event may result in a reduction in revenues, increased costs, property damage, and additionally, third parties may have significant claims against us for damages due to personal injury, death, property damage, pollution and loss of business. Our vessels are generally insured for their estimated market value against damage or loss, including war, terrorism acts, and pollution risks, but the company does not fully insure for business interruption. Our insurance coverage is subject to deductibles and certain exclusions. We can provide no assurance, however, that our insurance coverage will be available beyond the renewal periods, that we will be able to obtain insurance for all operational risks and that our insurance policies will be adequate to cover future claims that may arise.
-18-
Table of Contents
Index to Financial Statements
Failure to Attract and Retain Key Management and Technical Personnel
The company’s success depends on the continued service of its executive officers and other key management and technical personnel (particularly the company’s area managers, fleet and information technology personnel) and the company’s ability to attract, retain, and motivate highly qualified personnel. The loss of the services of a number of the company’s executive officers, area managers, fleet personnel or other key employees, or the company’s ability to recruit replacements for such personnel or to otherwise attract, retain and motivate highly qualified personnel could harm the company. The company currently does not carry key employee life insurance payable to the company with respect to any of its management employees.
International Operations Exposed to Currency Devaluation and Fluctuation Risk
Due to the company’s international operations, the company is exposed to foreign currency exchange rate risks on all charter hire contracts denominated in foreign currencies. For some of our international contracts, a portion of the revenue and local expenses are incurred in local currencies with the result that the company is at risk of changes in the exchange rates between the U.S. Dollar and foreign currencies. The company generally does not hedge against any foreign currency rate fluctuations associated with foreign currency contracts that arise in the normal course of business. To minimize the financial impact of these items, the company attempts to contract a significant majority of its services in U.S. dollars. The company attempts to minimize its financial impact of these risks, by matching the currency of the company’s operating costs with the currency of the revenue streams when considered appropriate. The company continually monitors the currency exchange risks associated with all contracts not denominated in U.S. dollars.
Consolidation of the Company’s Customer Base
Oil and natural gas companies, energy companies and drilling contractors have undergone consolidation, and additional consolidation is possible. Consolidation reduces the number of customers for the company’s equipment, and may negatively affect exploration, development and production activity as consolidated companies focus on increasing efficiency and reducing costs and delay or abandon exploration activity with less promise. Such activity could adversely affect demand for the company’s vessels, and reduce the company’s revenues. In addition, consolidation could result in the absorption of an oil and gas company with whom the company has a strong commercial relationship into another company with which the company does not and vice-versa.
Risks Associated with Vessel Construction and Maintenance
The company has a number of vessels under construction, and it may construct additional vessels in response to current and future market conditions. In addition, the company routinely engages shipyards to drydock vessels for regulatory compliance and to provide repair and maintenance services. Construction projects and drydockings are subject to risks of delay and cost overruns, resulting from shortages of equipment, materials and skilled labor; lack of shipyard availability; unforeseen design and engineering problems; work stoppages; weather interference; unanticipated cost increases; unscheduled delays in the delivery of material and equipment; and inability to obtain necessary certifications and approvals.
A significant delay in either construction or drydockings of vessels could have a material adverse effect on contract commitments and revenues with respect to vessels under construction, conversion or other drydockings. Significant cost overruns or delays for vessels under construction could also adversely affect the company’s financial condition, results of operations or cash flows. The demand for vessels currently under construction may diminish from originally anticipated levels. If the company fails to obtain favorable contracts for newly constructed vessels, such failure could have a material adverse effect on the company’s revenues and profitability.
Also, difficult economic market conditions and/or prolonged distress in credit and capital markets may hamper the ability of shipyards to meet their scheduled deliveries of new vessels or the ability of the company to renew its fleet through new vessel construction or acquisitions. In addition, there is always the risk of insolvency of the shipyards that construct or drydock our vessels, which could adversely affect our new construction program, and consequently, adversely affect our financial condition, results of operations or cash flows.
-19-
Table of Contents
Index to Financial Statements
Compliance with the Foreign Corrupt Practices Act
In order to effectively compete in certain foreign jurisdictions, the company seeks to establish joint ventures with local operators or strategic partners. As a U.S. corporation, the company is subject to the regulations imposed by the Foreign Corrupt Practices Act (FCPA), which generally prohibits U.S. companies and their intermediaries from making improper payments to foreign officials for the purpose of obtaining or keeping business or obtaining an improper business benefit. The company has adopted proactive procedures to promote compliance with the FCPA, but it may be held liable for actions taken by its strategic or local partners or agents even though these partners or agents may not themselves be subject to the FCPA. Any determination that the company has violated the FCPA could have a material adverse effect on its business, results of operations, and cash flows.
Compliance with Complex and Developing Laws and Regulations
The company’s U.S. and International segment operations are subject to many complex and burdensome laws and regulations. Stringent federal, state, local and foreign laws and regulations governing worker health and safety and the manning, construction and operation of vessels significantly affect our operations. Many aspects of the marine industry are subject to extensive governmental regulation by the United States Coast Guard, the National Transportation Safety Board and the United States Customs Service and their foreign equivalents, and to regulation by private industry organizations such as the American Bureau of Shipping.
The company’s operations are also subject to federal, state, local and international laws and regulations that control the discharge of pollutants into the environment or otherwise relate to environmental protection. Compliance with such laws and regulations may require installation of costly equipment, increased manning or operational changes. Some environmental laws impose strict liability for remediation of spills and releases of oil and hazardous substances, which could subject the company to liability without regard to whether the company was negligent or at fault.
Further, many of the countries in which the company operates have laws, regulations and enforcement systems that are largely undeveloped, and the requirements of these systems are not always readily discernable even to experienced and proactive participants. Further, these laws, regulations and enforcement systems can be unpredictable and subject to frequent change. While the company endeavors to comply with applicable laws and regulations, the company’s compliance efforts might not always be wholly successful, and failure to comply may result in administrative and civil penalties, criminal sanctions, imposition of remedial obligations or the suspension or termination of the company’s operations. These laws and regulations may expose the company to liability for the conduct of or conditions caused by others, including charterers or third party agents. Moreover, these laws and regulations could be changed or be interpreted in new, unexpected ways that substantially increase costs that the company may not be able to pass along to its customers. Any changes in laws, regulations or standards that would impose additional requirements or restrictions could adversely affect the company’s financial condition, results of operations or cash flows.
In order to meet the continuing challenge of complying with applicable laws and regulations in jurisdictions where it operates, the company revitalized and strengthened its compliance training, makes available and uses a worldwide compliance reporting system and performs compliance auditing/monitoring. The company appointed its general counsel as its chief compliance officer in fiscal 2008 to help organize and lead these compliance efforts. This strengthened compliance program may from time to time identify past practices that need to be changed or remediated. Such corrective or remedial measures could involve significant expenditures or lead to changes in operational practices that could adversely affect the company’s financial condition, results of operations or cash flows.
We are subject to the Merchant Marine Act of 1936, which provides that, upon proclamation by the President of the United States of a national emergency or a threat to the security of the national defense, the Secretary of Transportation may requisition or purchase any vessel or other watercraft owned by U.S. citizens (including U.S. corporations), including vessels under construction in the United States. If our vessels were purchased or requisitioned by the U.S. federal government, we would be entitled to be paid the fair market value of the vessels in the case of a purchase or, in the case of a requisition, the fair market value of charter hire, but we would not be entitled to be compensated for any consequential damages
-20-
Table of Contents
Index to Financial Statements
suffered. Although the purchase or requisition of one or a few of our vessels for an extended period of time will not cause adverse material negative financial effects to our company, the purchase or requisition of several or a significant number of our vessels for an extended period of time may adversely affect our financial condition, results of operations, and cash flows.
Risk of Changes in Laws Governing U.S. Taxation of Foreign Source Income
Approximately 92% of the company’s revenues and net income is generated by its operations outside of the United States. The company has enjoyed an average effective tax rate of approximately 18% since fiscal 2006, primarily a result of the passage of The American Jobs Creation Act of 2004, which excluded from the company’s current taxable income in the U.S. income earned offshore through the company’s controlled foreign subsidiaries.
From time to time, legislative initiatives are proposed to effectively increase U.S. taxation of income with respect to foreign operations. Whether any such initiatives win congressional or executive approval and become law is presently unknown; however, if any such initiatives were to become law, and were such law to apply to the company’s international operations, it would result in a materially higher tax expense, which would have a material impact on the company’s financial condition, results of operations or cash flows.
Potential Repeal or Amendment of the Shipping Act May Have an Adverse Impact on the Company’s U.S. Segment
The provisions of the Shipping Act restricting coastwise trade to vessels controlled by U.S. citizens may from time to time be circumvented by foreign competitors that seek to engage in trade reserved for vessels controlled by U.S. citizens and otherwise qualifying for coastwise trade. There have also been attempts to repeal or amend the citizen provision of the Shipping Act, and these attempts are expected to continue. Legal challenges against such actions are difficult, costly to pursue and unpredictable.
To the extent foreign competition is permitted to engage in U.S. coastwise trade by vessels that are built in lower-cost shipyards, owned and manned by foreign nationals with favorable foreign tax incentives and with lower wages and benefits than U.S. citizens, such increased competition could have a material adverse effect on the company’s U.S. segment operations. However, for the fiscal years ended March 31, 2010, 2009 and 2008, 92%, 89%, and 87%, respectively, of the company’s total revenues were generated by its international segment.
Compliance with Environmental Regulations May Adversely Impact Our Operations and Markets
A variety of regulatory developments, proposals and requirements have been introduced in the U.S. and various other countries that are focused on restricting the emission of carbon dioxide, methane and other gases. If such legislation is enacted, increased energy, environmental and other costs and capital expenditures could be necessary to comply with the limitations. These developments may curtail production and demand for hydrocarbons such as crude oil and natural gas in areas of the world where our customers operate and thus adversely affect future demand for the company’s offshore supply vessels, which are highly dependent on the level of activity in offshore oil and natural gas exploration, development and production market. Although it is unlikely that demand for oil and gas will lessen dramatically over the short-term, in the long-term, demand for oil and gas or increased regulation of environmental regulations may create greater incentives for use of alternative energy sources. Unless and until legislation is enacted and its terms are known, we cannot reasonably or reliably estimate its impact on our financial condition, results of operations and ability to compete. However, any long term material adverse effect on the crude oil and natural gas industry may adversely affect on our financial condition, results of operations and cash flows.
The Recent Rig Catastrophe in the Gulf of Mexico Could Have a Significant Impact on Exploration and Production Activities in United States Coastal Waters that Could Adversely Affect the U. S. Operations of the Company.
The April 2010 catastrophic explosion of the Deepwater Horizon and the related oil spill in the U. S. GOM may have an adverse effect on drilling and exploration activities in the U. S. offshore waters, including the GOM. The Obama Administration has announced that no additional offshore drilling permits will be issued and no additional offshore leases for drilling and exploration will be awarded until an assessment has
-21-
Table of Contents
Index to Financial Statements
been completed of the causes of the catastrophe and appropriate safeguards have been implemented to reduce the likelihood of future similar occurrences. The Obama Administration has also proposed reorganizing the Mineral Management Service into two regulatory bodies, with one of the two bodies dedicated to regulatory oversight of offshore drilling operations. The ultimate effects of the rig catastrophe, and the governmental and industry response to these events, could have a significant impact on the offshore E&P industry and energy service companies that serve that industry. Among the possible future consequences of this event are additional regulatory oversight and control with respect to offshore drilling, a potential ban or restriction on oil and gas exploration in certain offshore areas, particularly deepwater drilling, and an increase in insurance premiums for casualty insurance that may be more difficult to obtain. Any such development could reduce demand for the company’s services in the U. S. GOM. The events in the U. S. GOM may also have ramifications in foreign exploration areas, which could adversely affect our international operations as well, although it is impossible to assess at this time.
ITEM 1B. UNRESOLVED STAFF COMMENTS
None.
Information on Properties is contained in Item 1 of this report.
Foreign Corrupt Practices Internal Investigation
The company has previously reported that special counsel engaged by the company’s Audit Committee had completed an internal investigation into certain FCPA matters and reported its findings to the Audit Committee. The substantive areas of the internal investigation have been reported publicly by the company in prior filings.
Special counsel has reported to the Department of Justice (DOJ) and the Securities and Exchange Commission (SEC) the results of the investigation, and has engaged in a series of cooperative discussions with the two federal agencies as to the potential legal ramifications of those findings. The following reflects the status of those discussions:
Securities and Exchange Commission
The company has reached an agreement in principle with the staff of the SEC to resolve its previously disclosed investigation of possible violations of the FCPA. Under the proposed resolution, the company would consent to the filing in federal district court of a complaint (“Complaint”) by the SEC, without admitting or denying the allegations in the Complaint, and to the imposition by the court of a final judgment against the company, including a permanent injunction against us. The Complaint would allege civil violations of the FCPA’s anti-bribery and accounting provisions with respect to certain previously discussed conduct involving tax authorities in Azerbaijan, and the FCPA’s accounting provisions with respect to amounts paid by a subsidiary of the company to a third party customs broker to procure certain permits necessary for the company’s vessels to operate in Nigeria. The final judgment would not take effect until it is confirmed by the court, and would permanently enjoin the company from future violations of those provisions.
The agreement in principle would require the company to pay a total of approximately $11.4 million, consisting of the sum of $8.4 million (principally representing disgorgement of profits and prejudgment interest) payable at the time of settlement and a contingent civil penalty of $3.0 million. The contingent civil penalty would be payable to the SEC in 18 months, to the extent that the company had not agreed to pay fines or penalties of at least that amount to another government authority (or authorities) in connection with the matters covered by the internal investigation. The financial charge associated with the proposed settlement with the SEC was recorded in the fourth quarter of fiscal 2010 and is included in general and administrative expenses.
The agreement in principle is contingent upon the parties’ agreement on the terms of the relevant documents, approval by the Securities and Exchange Commission, and confirmation by a federal district
-22-
Table of Contents
Index to Financial Statements
court. There can be no assurance that this settlement will be finalized, or finalized on the terms set forth above. If the settlement is not finalized, the SEC may bring an enforcement action against the company. The company’s current tolling arrangements with the SEC extend through June 15, 2010.
Department of Justice
To date, the company has not reached any agreement with the DOJ regarding a negotiated resolution of the previously disclosed internal investigation. Based on discussions with the DOJ regarding the possible disposition of this matter, it appears likely that any negotiated disposition would involve charges and sanctions imposed by the DOJ, although the company is unable to predict at this time the nature and scope of such charges and sanctions and upon whom they would be imposed. The timeframe for resolution of these matters is also uncertain. Given these uncertainties, the company is unable at this time to estimate the range of any monetary exposure that might arise from such a settlement. As a result, no accrual for potential additional liabilities associated with a negotiated resolution with the DOJ has been recorded as of March 31, 2010. Any fines or penalties paid to the DOJ would reduce the balance of the SEC contingent penalty referenced above under the company’s agreement in principle with the SEC. Should additional information be obtained that any potential liability in connection with the resolution of these matters with the DOJ is probable and reasonably estimable, the company will record such liability at that time. While uncertain, ultimate resolution with the DOJ could have a material adverse effect on the company’s results of operations or cash flows. It is possible that if agreement is not reached, the DOJ may bring enforcement action against the company.
Other Items
Various legal proceedings and claims are outstanding which arose in the ordinary course of business. In management’s opinion, the amount of ultimate liability, if any, with respect to these actions, will not have a material adverse effect on the company’s financial position, results of operations, or cash flows. Information related to various commitments and contingencies, including legal proceedings, is disclosed in Note 10 to Notes to Consolidated Financial Statements included in this report.
-23-
Table of Contents
Index to Financial Statements
ITEM 5. MARKET FOR THE REGISTRANT’S COMMON EQUITY, RELATED STOCKHOLDER MATTERS, AND ISSUER PURCHASES OF EQUITY SECURITIES
Common Stock Market Prices
The company’s common stock is traded on the New York Stock Exchange under the symbol TDW. At March 31, 2010, there were 862 record holders of the company’s common stock, based on the record holder list maintained by the company’s stock transfer agent. The closing price on the New York Stock Exchange Composite Tape on March 31, 2010 was $47.27. The following table sets forth for the periods indicated the high and low sales price of the company’s common stock as reported on the New York Stock Exchange Composite Tape and the amount of cash dividends per share declared on Tidewater common stock.
| Quarter ended |
June 30 | September 30 | December 31 | March 31 | ||||||||
| Fiscal 2010 common stock prices: |
||||||||||||
| High |
$ | 52.03 | $ | 48.95 | $ | 48.62 | $ | 51.43 | ||||
| Low |
35.65 | 40.45 | 40.78 | 42.96 | ||||||||
| Dividend |
.25 | .25 | .25 | .25 | ||||||||
| Fiscal 2009 common stock prices: |
||||||||||||
| High |
$ | 70.94 | $ | 65.86 | $ | 55.23 | $ | 45.42 | ||||
| Low |
54.31 | 50.64 | 31.40 | 31.09 | ||||||||
| Dividend |
.25 | .25 | .25 | .25 | ||||||||
Issuer Repurchases of Equity Securities
In July 2009, the company’s Board of Directors authorized the company to spend up to $200.0 million to repurchase shares of its common stock in open-market or privately-negotiated transactions. The company announced on May 14, 2010 that its Board of Directors has extended this program. The company will use its available cash and, when considered advantageous, borrowings under its revolving credit facility, or other borrowings, to fund any share repurchases. The repurchase program was scheduled to expire on June 30, 2010, but has now been extended to expire on the earlier of the date that all authorized funds have been expended or June 30, 2011 unless extended by the Board of Directors. No amounts have been expended under the July 2009 authorized program through March 31, 2010, and at March 31, 2010, $200.0 million remained available to repurchase shares under the 2009 program until it expires.
During fiscal 2010, the company did not repurchase shares of its common stock. The company will continue to evaluate share repurchase opportunities relative to other investment opportunities and in the context of current conditions in the credit and capital markets.
Dividend Program
In May 2008, the company’s Board of Directors authorized the increase of the company’s quarterly dividend from $0.15 per share to $0.25 per share, a 67% increase. The declaration of dividends is at the discretion of the company’s Board of Directors.
The Board of Directors declared dividends of $51.7 million, $51.5 million, and $32.7 million, or $1.00, $1.00 and $0.60 per share, respectively, for the year ended March 31, 2010, 2009 and 2008, respectively.
-24-
Table of Contents
Index to Financial Statements
Performance Graph
The following graph compares the cumulative total stockholder return on the company’s common stock against the cumulative total return of the Standard & Poor’s 500 Stock Index and the cumulative total return of the Value Line Oilfield Services Group Index (the “Peer Group”) over the last five fiscal years. The analysis assumes the investment of $100 on April 1, 2005, at closing prices on March 31, 2005, and the reinvestment of dividends. The Value Line Oilfield Services Group consists of 25 companies including Tidewater Inc.
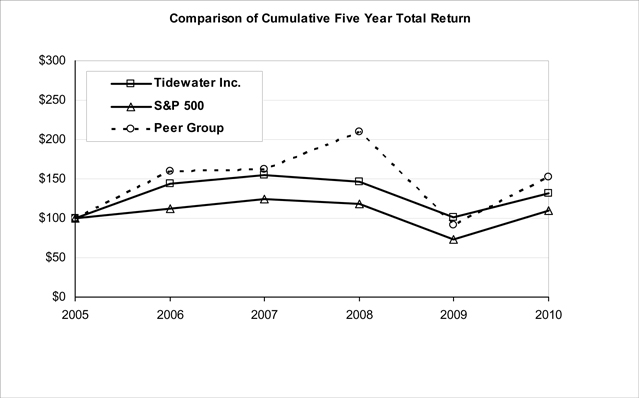
| Indexed returns Years ended March 31 |
||||||||||||
| Company name/Index |
2005 | 2006 | 2007 | 2008 | 2009 | 2010 | ||||||
| Tidewater Inc. |
100 | 144.06 | 154.53 | 146.86 | 101.11 | 131.53 | ||||||
| S&P 500 |
100 | 111.73 | 124.94 | 118.60 | 73.43 | 109.97 | ||||||
| Peer Group |
100 | 159.42 | 162.65 | 209.34 | 91.36 | 152.25 | ||||||
Investors are cautioned against drawing conclusions from the data contained in the graph, as past results are not necessarily indicative of future performance.
The above graph is being furnished pursuant to the Securities and Exchange Commission rules. It will not be incorporated by reference into any filing under the Securities Act of 1933 or the Securities Exchange Act of 1934, except to the extent that the company specifically incorporates it by reference.
-25-
Table of Contents
Index to Financial Statements
ITEM 6. SELECTED FINANCIAL DATA
The following table sets forth a summary of selected financial data for each of the last five fiscal years. This information should be read in conjunction with “Management’s Discussion and Analysis of Financial Condition and Results of Operations” in Item 7 and the Consolidated Financial Statements of the company included in Item 8 of this report.
| Years Ended March 31 (In thousands, except ratio and per share amounts) |
||||||||||||||||
| 2010(A) | 2009 | 2008 | 2007 (B) | 2006 (C) | ||||||||||||
| Statement of Earnings Data : |
||||||||||||||||
| Revenues: |
||||||||||||||||
| Vessel revenues |
$ | 1,138,162 | 1,356,322 | 1,215,134 | 1,097,582 | 846,982 | ||||||||||
| Other marine services revenues |
30,472 | 34,513 | 55,037 | 27,678 | 30,635 | |||||||||||
| $ | 1,168,634 | 1,390,835 | 1,270,171 | 1,125,260 | 877,617 | |||||||||||
| Gain on asset dispositions, net |
$ | 28,178 | 27,251 | 11,449 | 42,787 | 86,337 | ||||||||||
| Provision for Venezuelan operations |
$ | 43,720 | — | — | — | — | ||||||||||
| Net earnings |
$ | 259,476 | 406,898 | 348,763 | 356,646 | 235,756 | ||||||||||
| Basic earnings per common share |
$ | 5.04 | 7.92 | 6.43 | 6.38 | 4.11 | ||||||||||
| Diluted earnings per common share |
$ | 5.02 | 7.89 | 6.39 | 6.31 | 4.07 | ||||||||||
| Cash dividends declared per common share |
$ | 1.00 | 1.00 | .60 | .60 | .60 | ||||||||||
| Balance Sheet Data (at end of period): |
||||||||||||||||
| Cash and cash equivalents |
$ | 223,070 | 250,793 | 270,205 | 393,806 | 246,109 | ||||||||||
| Total assets |
$ | 3,293,357 | 3,073,804 | 2,751,780 | 2,649,298 | 2,364,540 | ||||||||||
| Current maturities of long-term debt |
$ | 25,000 | — | — | — | — | ||||||||||
| Long-term debt |
$ | 275,000 | 300,000 | 300,000 | 300,000 | 300,000 | ||||||||||
| Capitalized lease obligations |
$ | — | — | 10,059 | 19,712 | — | ||||||||||
| Stockholders’ equity |
$ | 2,464,030 | 2,244,678 | 1,930,084 | 1,886,010 | 1,659,121 | ||||||||||
| Working capital |
$ | 380,915 | 431,101 | 431,691 | 584,869 | 413,289 | ||||||||||
| Current ratio |
2.86 | 3.12 | 3.17 | 4.98 | 4.57 | |||||||||||
| Cash Flow Data: |
||||||||||||||||
| Net cash provided by operating activities |
$ | 328,261 | 526,435 | 489,491 | 435,095 | 297,378 | ||||||||||
| Net cash (used in) provided by investing activities |
$ | (298,482 | ) | (434,055 | ) | (272,001 | ) | (151,156 | ) | 53,208 | ||||||
| Net cash used in financing activities |
$ | (57,502 | ) | (111,792 | ) | (341,091 | ) | (136,242 | ) | (119,853 | ) | |||||
| (A) | In addition to the Provision for Venezuelan operations separately stated above, fiscal 2010 net earnings includes (1) the reversal of $36.1 million, or $0.70 per common share, of uncertain tax positions related to the resolution of a tax dispute with the U.S. IRS as disclosed in Note 3 to Notes to Consolidated Financial Statements, (2) an $11.4 million, or $0.22 per common share, proposed settlement with the SEC related to the internal investigation as disclosed in Note 10 of Notes to Consolidated Financial Statements, and (3) an $11.0 million, or $0.21 per common share, foreign exchange gain resulting for the devaluation of the Venezuelan bolivar fuerte relative to the U.S. dollar. |
| (B) | During fiscal 2007, the company sold 14 offshore tugs for a cash price of $43.7 million, resulting in a $34.0 million pre-tax financial gain, or approximately $20.8 million after-tax, or $0.37 per diluted common share. |
| (C) | In July 2005, the company sold six KMAR 404 class of anchor handling towing supply vessels for a cash price of $188.0 million, resulting in a $65.9 million pre-tax financial gain, or approximately $42.8 million after-tax, or $0.74 per diluted common share. |
-26-
Table of Contents
Index to Financial Statements
ITEM 7. MANAGEMENT’S DISCUSSION AND ANALYSIS OF FINANCIAL CONDITION AND RESULTS OF OPERATIONS
The following discussion and analysis of financial condition and results of operations should be read in conjunction with the accompanying consolidated financial statements as of March 31, 2010 and 2009 and for the years ended March 31, 2010, 2009 and 2008 that we included in Item 8 of this Annual Report on Form 10-K. The following discussion and analysis contains forward-looking statements that involve risks and uncertainties. The company’s future results of operations could differ materially from its historical results or those anticipated in its forward-looking statements as a result of certain factors, including those set forth under “Risk Factors” in Item 1A and elsewhere in this report. With respect to this section, the cautionary language applicable to such forward-looking statements described in “Forward-Looking Statements” found before Item 1 of this report is incorporated by reference into this Item 7. The following discussion should also be read in conjunction with the Selected Financial Data and the Consolidated Financial Statements and related disclosures of this report.
Fiscal 2010 Business Highlights and Key Focus
During fiscal 2010, the company continued its focus on maintaining its competitive advantages, sustained its presence in its international markets, and continued to modernize its vessel fleet to generate future earnings capacity while removing from active service certain traditional vessels that are not currently providing adequate returns. Key elements of the company’s strategy continue to be the preservation of its strong financial position and the maintenance of adequate liquidity to fund the expansion of its fleet of newer vessels. Operating management focused on safe operations and maintaining disciplined cost control.
The company’s strategy contemplates organic growth through the construction of vessels at a variety of shipyards worldwide and possible acquisitions of vessels and/or other owners and operators of offshore supply vessels. The company has the largest number of new vessels among its competitors in the industry, and it also has the largest fleet of older vessels in the industry. Management regularly evaluates alternatives for its older fleet. The company intends to pursue its long-term fleet replenishment and modernization strategy on a disciplined basis and, in each case, will carefully consider whether proposed investments and transactions have the appropriate risk/reward profile.
The company’s consolidated net earnings were $259.5 million during fiscal 2010 as compared to $406.9 million during fiscal 2009, a decrease of approximately 36%, or $147.4 million, due to a 16% decrease in total revenues during the comparative periods and to a $43.7 million, net provision for Venezuelan operations as disclosed below and in Note 10 of Notes to Consolidated Financial Statements, an $11.4 million, or $0.22 per common share, proposed settlement with the SEC related to the previously announced internal investigation as disclosed in Note 10 of Notes to Consolidated Financial Statements, partially offset by an approximate 8% reduction in vessel operating costs and the reversal of $36.1 million of accrued income tax liabilities as disclosed below and in Note 3 of Notes to Consolidated Financial Statements included in Item 8 of this report.
The company recorded $1.2 billion in revenue during fiscal 2010 as compared to the $1.4 billion recorded during fiscal 2009, a decrease of approximately 16%, or $222.2 million, primarily due to an approximate eight percentage point reduction in total worldwide fleet utilization resulting from a contraction in customer spending and activity, and due to the loss of revenue from the seizure of the company’s Venezuelan operations. The company’s Venezuelan operations contributed $11.3 million of revenues during fiscal 2010 as compared to $61.6 million of revenues contributed during fiscal 2009.
Vessel revenues generated by the company’s international segment decreased approximately $160.9 million, or 13%, during fiscal 2010 compared to fiscal 2009, while the vessel revenues generated by the United States (U.S.) segment decreased approximately $57.3 million, or 39%, during the same comparative periods. Other marine revenues decreased approximately 12%, or $4.0 million, during the same comparative periods. International segment vessel operating costs decreased approximately 5%, or $27.4 million, while the company’s U.S. segment vessel operating costs decreased approximately 34%, or $28.2 million, during fiscal 2010 as compared to fiscal 2009. The company reduced its vessel operating costs in reaction to the contraction in spending by our customers. Costs of other marine revenues decreased approximately 6%, or $1.9 million, during the same comparative periods. A significant portion of the company’s operations is conducted internationally, therefore, the company’s international vessel
-27-
Table of Contents
Index to Financial Statements
operations are the primary driver of its revenue and earnings. Revenues generated from international vessel operations as a percentage of the company’s total vessel revenues were 92% during fiscal 2010 compared to 89% during fiscal 2009.
In May 2009, a Venezuelan law was enacted directing the government of Venezuela to take possession of certain assets of oil service companies doing business in Venezuela, and pursuant to that legislation, Petróleos de Venezuela, S.A. (PDVSA), the Venezuelan national oil company, took possession of (a) 11 of the company’s vessels that were then supporting PDVSA operations in the Lake Maracaibo region, (b) the company’s shore-based facility adjacent to Lake Maracaibo and (c) certain other related assets. In July 2009, Petrosucre, S.A. (Petrosucre), a subsidiary of PDVSA, took control of four additional vessels. As a result of the May 2009 seizure of the 11 vessels and other assets discussed above, the company recorded a charge of $3.75 million ($2.9 million after tax, or $0.06 per common share), during the quarter ended June 30, 2009, to write off the net book value of the assets seized. As a result of the July 2009 vessel seizures, the company recorded a charge of $0.5 million ($0.4 million after tax, or $0.01 per common share) during the quarter ended September 30, 2009. In addition, as a result of the asset seizures referred to above, the lack of further vessel operations in Venezuela, and the continuing uncertainty about the timing and amount of the compensation that the company may collect in the future, the company recorded a $44.8 million ($44.8 million after tax, or $0.87 per common share) provision during the quarter ended June 30, 2009, to fully reserve accounts receivable payable by PDVSA and Petrosucre. The company insured the seized vessels and successfully recovered its insured vessel asset losses from insurance underwriters in March 2010, which resulted in a gain on disposition of vessels of $5.4 million ($3.5 million after tax, or $0.07 per common share). The company has yet to recover losses associated with other aspects of its Venezuelan business that were seized. The above charges and gain on disposition of vessels are included in the provision for Venezuelan operations in the accompanying consolidated statement of earnings. Please refer to Note 10 of Notes to Consolidated Financial Statements included in Item 8 of this report for more detailed discussion regarding the company’s Venezuelan operations.
In January 2008, the U.S. District Court for the Eastern District of Louisiana issued a final ruling in the company’s favor with respect to a motion for summary judgment concerning the IRS disallowance of the company’s tax deduction for foreign sales corporation commissions for fiscal years 1999 and 2000. In April 2009, the Fifth Circuit Court of Appeals affirmed the District Court’s judgment. The IRS did not appeal the Court of Appeals ruling, resulting in final resolution of the issue in the company’s favor in July 2009. The tax benefit related to the issue is approximately $36.1 million, or $0.70 per common share, during fiscal 2010, which primarily includes a reversal of previously recorded liabilities for uncertain tax positions and interest income on the judgment.
During fiscal 2010, the company continued its significant vessel construction and acquisition program that began in calendar year 2000. This program facilitated the company’s entrance into deepwater markets around the world in addition to allowing the company to begin to replace its core fleet with fewer, larger, and more technologically sophisticated vessels. The vessel construction and acquisition program were initiated with the intent of strengthening the company’s presence in all major oil and gas producing regions of the world through the replacement of aging vessels in the company’s core fleet. During this decade, the company purchased and/or constructed 185 vessels for approximately $2.4 billion. Between April 1999 and March 2010, the company also sold, primarily to buyers that operate outside of our industry, 508 vessels. Most of the vessel sales were at prices that exceeded their carrying values. In aggregate, proceeds from, and pre-tax gains on, vessel dispositions during this period approximated $746.0 million and $256.4 million, respectively.
In recent years, the company has funded all vessel additions from available cash, operating cash flow, and funds provided by the 2003 private placement of $300.0 million in senior unsecured notes, revolving credit facilities and various leasing arrangements. At March 31, 2010, the company had commitments to acquire five vessels and build 31 vessels at a number of different shipyards around the world (one of which is being constructed in the United States by the company’s wholly-owned shipyard, Quality Shipyards, L.L.C.) at a total cost, including contract costs and other incidental costs, of approximately $742.4 million, including contract costs and other incidental costs, of which costs for the 31 new-build vessels totaled $681.8 million. In particular, the company is committed to the construction of 13 anchor handling towing supply vessels ranging between 5,150 and 13,570 brake horsepower (BHP), 16 platform supply vessels, ranging between 2,965 and 5,400 deadweight tons of cargo capacity, and two crewboats. Scheduled delivery for these vessels began in April 2010 with delivery of the final vessel expected in July 2012. The company also had
-28-
Table of Contents
Index to Financial Statements
commitments to purchase five anchor handling towing supply vessels for a total cost of approximately $60.6 million at March 31, 2010. In April 2010, the company took possession of three of these five anchor handling towing supply vessels, and plans to take possession of the fourth and fifth anchor handling towing supply vessels in May and June of 2010, respectively. At March 31, 2010, the company had invested $271.9 million in progress payments towards the construction of 31 vessels, and no payments have been made on the purchase of five anchor handling towing supply vessels. The remaining expenditures necessary to complete construction of the 31 vessels currently under construction (based on contract prices) and to fund the acquisition of the five anchor handling towing supply vessels was $470.5 million at March 31, 2010. A full discussion of the company’s capital commitments, scheduled delivery dates and vessel sales is disclosed in the “Vessel Count, Dispositions, Acquisitions and Construction Programs” section of Item 7 and Note 10 of Notes to Consolidated Financial Statements included in Item 8 of this report.
In July 2009, the company’s Board of Directors authorized the company to spend up to $200.0 million to repurchase shares of its common stock in open-market or privately-negotiated transactions. The company announced on May 14, 2010 that its Board of Directors has extended this program. The company will use its available cash and, when considered advantageous, borrowings under its revolving credit facility, or other borrowings, to fund any share repurchases. The repurchase program was scheduled to expire on June 30, 2010, but has now been extended to expire on the earlier of the date that all authorized funds have been expended or June 30, 2011 unless extended by the Board of Directors. No amounts have been expended under the July 2009 authorized program through March 31, 2010, and at March 31, 2010, $200.0 million remained available to repurchase shares under the 2009 program until it expires. During fiscal 2010, the company did not repurchase shares of its common stock. The company will continue to evaluate share repurchase opportunities relative to other investment opportunities and in the context of its financial position and then existing conditions in the credit and capital markets
Macroeconomic Environment and Outlook
The primary driver of our business is our customers’ capital and operating expenditures dedicated to oil and natural gas exploration, field development and production. Our business is dependent upon our customers’ expectations for future oil and natural gas prices, economic growth, hydrocarbon demand and estimates of current and future oil and natural gas production. The prices of crude oil and natural gas are critical factors in exploration and production (E&P) companies’ decisions to contract drilling rigs in the United States (U.S.) Gulf of Mexico (GOM) market or to contract rigs in international markets. The company’s international results of operations are primarily dependent on the supply and demand relationship of crude oil; while the company’s U.S. results of operations are primarily dependent on the supply and demand relationship for natural gas. During late 2008 and early 2009, prices for crude oil and natural gas fell dramatically from their respective peaks achieved earlier in calendar year 2008 due to a global recession that caused a precipitous drop in worldwide demand for oil and gas.
During most of calendar year 2009, the global economy weakened, and many E&P customers reduced their capital spending budgets in response to lower demand and weaker commodity prices. During the company’s fiscal 2010, the global recession caused demand for offshore support vessel services to decline, particularly in the shallow waters of the U.S. GOM. This reduced demand has led to an industry-wide reduction in charter rates and utilization rates on vessels as our customers demanded pricing concessions. In late calendar 2009 and into 2010, there are some early signs of an economic recovery, although the pace of recovery has been slow and demand for energy continues to lag. Assessing the current market environment in the near term is challenging given the tenuous state of the global economy and of financial and commodity markets. The company is evaluating the current trends in the global economy to determine how these trends are affecting the development plans of E&P companies and global demand for its offshore vessels. The company is also evaluating the impact of developments over the last 18 months on the ability of shipyards to meet their scheduled deliveries of new vessels and the ability of the company to renew its fleet through new vessel construction and/or acquisitions.
In an effort to stabilize falling crude oil prices, OPEC cut approximately 6.8% of crude oil production over the last 18 months. As calendar year 2009 progressed, oil prices gradually recovered and stabilized in the range of $80 to $85 per barrel as of mid-April 2010. Although this price range is far below its all time closing high of approximately $147 per barrel in mid-July 2008, it is significantly higher than the low $30’s price levels experienced during the first quarter of calendar 2009. To date, OPEC’s market stabilization efforts have
-29-
Table of Contents
Index to Financial Statements
been successful, but OPEC officials warned at its March 2010 meeting that the strength in the global economic recovery was uncertain. OPEC officials decided against increasing OPEC production levels because crude oil market demand fundamentals are still weak and inventories for the resource are well over five-year averages. Given the historically strong correlation between commodity prices, drilling and exploration activity and demand for the company’s vessels in the various international markets, the company expects that utilization and day rates for its internationally based vessels may remain weak or weaken further if crude oil prices decrease and/or if capital spending by E&P companies is constrained by expectations for either lower crude oil prices or weak economic activity. During fiscal 2010, the company’s international customers, including some of our more significant clients, requested pricing concessions from the company, which the company has addressed on a case-by-case basis. In response to the weaker crude oil price and its effect on E&P spending, the company began stacking and removing from its active internationally based fleet those vessels that could not find attractive charter hire contracts.
Oil and gas industry analysts reported in their 2010 E&P expenditure surveys (both land-based and offshore) that global capital expenditures budgets for E&P are forecast to increase during 2010 by approximately 11% over calendar year 2009 levels. The surveys forecast that international capital spending budgets will increase approximately 11%. North American capital spending budgets are forecast to increase approximately 12%, although most of that increase is expected to be onshore rather than offshore. These budgets were based on an approximate $70 average price per barrel of oil and an approximate $5.20 per Mcf average natural gas price for calendar 2010. Given the long project lead times, the company believes that these spending increases will not take effect, in any significant way, until the latter part of calendar year 2010 and, as such, management does not anticipate a significant increase in our vessel demand until the later part of fiscal 2011 or sometime in fiscal 2012.
The number of operating drilling rigs in the U.S. offshore market is generally the primary driver of the company’s expected activity levels and future profitability in the U.S. market. The offshore rig count in the U.S. GOM remains at historically low levels, in part because the strength of the international drilling market has attracted numerous offshore drilling rigs from the U.S. to various international markets over the past few years. Exploration and field development activity in the U.S. GOM had fallen off significantly, particularly in non-deepwater areas. As a consequence, the demand for offshore marine vessels in the shallow water U.S. GOM diminished over the past few years and declined further in late calendar year 2008 and into 2009 due to the deterioration in the global business environment and economy, the significant reduction in commodity prices (particularly natural gas pricing) and the illiquidity in the credit and capital markets. Over the longer term, the company’s U.S.-based vessel fleet should be affected more by the active offshore rig count in the United States than by any other single outside influence.
By mid-April 2010, the number of active drilling rigs operating in the U.S. GOM had risen to approximately 79 rigs as compared to 52 rigs operating at the end of September 2009. The increase in the rig count is attributed to higher natural gas pricing, which at mid-April 2010 was trading in the $3.70 - $4.00 Mcf range due to a tightening of natural gas inventories resulting from a colder-than-normal North American winter season. Some drilling operators have expressed that the recent increase in U.S. GOM rig count is a result of the strengthening and stabilization of crude oil and natural gas commodity prices, a reduction in oilfield service pricing and improvements in the capital markets. Although the above positive trend bodes well for activity in the U.S. GOM market in the near-term, the rise in production of unconventional gas resources in North America and the commissioning of a number of new large Liquefied Natural Gas (LNG) exporting facilities around the world are contributing to an over-supplied natural gas market, which exerts downward pricing pressures on the resource. While production of natural gas from unconventional sources is a relatively small portion of the worldwide natural gas production, it is expected to grow in the future. During the greater part of calendar year 2009, natural gas inventories in the U.S. have been significantly oversupplied, which is attributed to the increase of unconventional gas in the market, as well as a reduction in demand for the resource due to the global recession. Prolonged increases in the supply of natural gas, whether the supply comes from conventional or unconventional production, will exert downward pricing pressures on commodity prices for natural gas. A prolonged downturn in natural gas prices can negatively impact the development plans of E&P companies, which in turn, would result in a decrease in demand for offshore support vessel services, primarily in the company’s U.S. segment, since it is more sensitive to the changes in natural gas pricing because it is more oriented towards natural gas than crude oil production.
Given the historically strong correlation among commodity prices, drilling and exploration activity and demand for the company’s vessels in the U.S. GOM, the company expects utilization rates and day rates for
-30-
Table of Contents
Index to Financial Statements
its vessels in the U.S. GOM market in the near term to remain relatively weak, particularly if natural gas prices deteriorate from current levels. As such, management anticipates the company’s U.S.-based results of operations during fiscal 2011 will likely be no more favorable than its fiscal 2010 results. During fiscal 2010, the company responded to the deterioration in the U.S. GOM market by stacking and removing from its active vessel fleet those vessels that could not find attractive charter hire contracts. In addition, drydockings associated with stacked vessels have been deferred. The impact of the recent rig catastrophe in the U.S. GOM may also have a negative impact on activity levels in fiscal 2011 and beyond. As a result of the reduced number of active vessels in the U.S. GOM, crew personnel reductions took place, and effective June 1, 2009, wages on the remaining crew personnel in the U.S. GOM were reduced by approximately 15%.
Historically, when the U.S. market weakened, the company would redeploy some of its highly mobile assets to international markets where, market conditions permitting, the vessels could benefit from stronger demand and average day rates and from statutory income tax rates that are generally lower than those in the U.S. Given the current challenges in international markets, the company’s ability to mitigate the effects of a weak U.S. GOM market by redeploying vessels to other markets has been significantly reduced. The company continues to assess the demand for vessels in the U.S. GOM and in the various international markets and may relocate additional vessels to international areas and between international areas. The cost of mobilizing vessels to a different market is sometimes for the account of the company and sometimes for the account of a contracting customer.
The deepwater offshore energy market is a growing segment of the global energy market and is one sector of the global energy market that has yet to experience any significant negative effects from the global economic recession. During the past few years, worldwide rig construction increased as rig owners capitalized on the high worldwide demand for drilling. Reports published during the most recently completed quarter suggest that over the next four years, the worldwide moveable drilling rig count (currently estimated at approximately 785 movable rigs worldwide, approximately thirty percent of which are designed to operate in deeper waters) will increase as approximately 135 new-build rigs that are currently on order and under construction are delivered. It is further estimated that approximately fifty percent of these new build rigs are intended to operate in deeper waters, suggesting that the number of rigs designed to operate in deeper waters could grow in the coming years by approximately one third. Investment is also being made in the floating production market, in which approximately 50 new floating production units are currently under construction and are expected to be delivered over the next four years to supplement the current approximately 325 floating production units worldwide. However, analysts have reported that several drilling rigs currently on order have been cancelled and/or delayed due to the uncertain economic outlook, which may reduce the number of rigs ultimately built and delivered. Moreover, to the extent the rigs are built and delivered, it is believed that the new build rigs will largely target international regions rather than the U.S. GOM due to longer contract durations, generally lower operating costs (including insurance costs) and higher drilling day rates available in the international markets.
According to ODS-Petrodata, the global offshore supply vessel market has approximately 450 new-build offshore support vessels (platform supply vessels and anchor handlers only) that are currently estimated to be under construction and that are expected to be delivered to the worldwide offshore vessel market over the next three years. The current worldwide fleet of these classes of vessels is estimated at approximately 2,450 vessels. An increase in vessel capacity could have the effect of lowering charter rates, particularly in the context of declining levels of exploration, field development and production activity. However, the worldwide offshore marine vessel industry also has a large number of aging vessels, including more than 800 vessels that are at least 25 years old, that are nearing or exceeding original expectations of their estimated economic lives. These older vessels could potentially be removed from the market within the next few years if the cost of extending the vessels’ lives is not economically justifiable. Although the future attrition rate of these aging vessels cannot be accurately predicted, the company believes that the retirement of a sizeable portion of these aging vessels would likely mitigate the potential combined negative effects of new-build vessels on vessel utilization and vessel pricing. Additional vessel demand could also be created with the addition of new drilling rigs and floating production units that are expected to be delivered and become operational over the next few years, which should help minimize the possible negative effects the new-build offshore support vessels (platform supply vessels and anchor handlers only) being added to the offshore support vessel fleet. It is unknown at this time the extent to which the recovery from the recent worldwide recession will influence the utilization of equipment currently in existence or the ultimate timing of delivery and placing into service of new drilling rigs, floating production units and vessels currently under
-31-
Table of Contents
Index to Financial Statements
construction. Analysts have reported some offshore vessel construction contract cancellations as a result of the foregoing factors, which may reduce the ultimate number of vessels built and delivered.
Principal Factors That Drive Our Revenues
The company’s revenues in both the International and United States segments are driven primarily by the company’s fleet size, vessel utilization and day rates. Because a sizeable portion of the company’s operating costs and its depreciation does not change proportionally with changes in revenue, the company’s operating profit is largely dependent on revenue levels.
Principal Factors That Drive Our Operating Costs
Operating costs consist primarily of crew costs, repair and maintenance, insurance and loss reserves, fuel, lube oil and supplies and vessel operating lease expense.
Fleet size, fleet composition, geographic areas of operation and the supply and demand for marine personnel are the major factors which affect overall crew costs in both the International and United States segments. In addition, the company’s newer, more technologically sophisticated anchor handling towing supply vessels and platform supply vessels generally require a greater number of specially trained fleet personnel than the company’s older, smaller vessels. The company believes that competition for skilled crew personnel may again intensify, particularly in international markets, as new-build support vessels currently under construction enter the worldwide vessel population. If competition for personnel intensifies, the company’s crew costs will likely increase.
The timing and amount of repair and maintenance costs are influenced by customer demand, vessel age and safety and inspection drydockings mandated by regulatory agencies. A certain number of drydockings are required within a given period to meet regulatory requirements. Drydocking costs are incurred only if the company believes a drydocking can be justified economically, taking into consideration the vessel’s age, physical condition and future marketability. If the company elects to forego a required drydocking, the company will stack and possibly sell the vessel, as it is not permitted to work without currently valid regulatory certifications. When the company drydocks a productive vessel, the company not only foregoes vessel revenues and incurs drydocking cost, but also continues to incur vessel operating costs and vessel depreciation. In any given period, downtime associated with drydockings and major repairs and maintenance can have a significant effect on the company’s revenues and operating costs.
At times, drydockings take on an increased importance to the company and its financial performance. The company’s older vessels require more frequent and more expensive repair and drydockings, while some of its vessels built after 2000 are now experiencing their first or second required regulatory drydockings. Size and complexities of many of the new vessels also result in expensive drydocking costs, even in the early years of the vessels lives. Conversely, when the company stacks vessels, the number of drydockings in any period could decline. The combination of these factors can affect drydocking costs and can incrementally increase the volatility of the company’s operating revenues and operating costs, thus making period-to-period comparisons more difficult. Although the company attempts to efficiently manage its fleet drydocking schedule to minimize any disruptive effect on its revenues and costs, inflationary pressures on shipyard pricing experienced in recent years, and the heavy workloads at the shipyards, resulted in increased drydocking costs and increased days off hire at shipyards (thereby, increasing the company’s loss of revenue on the drydocked vessel). The company cannot predict if the drydocking situation will improve in the foreseeable future. If there is no improvement, the company expects that the timing of drydockings in the future will result in continued quarterly volatility in repair and maintenance costs and loss in revenue. Fuel and lube costs can also fluctuate in any given period depending on the number and distance of vessel mobilizations that occur.
Insurance and loss reserves costs are dependent on a variety of factors, including the company’s safety record and the cost of insurance, and can fluctuate from time to time. The company’s vessels are generally insured for up to estimated fair market value in order to cover damage or loss resulting from marine casualties, adverse weather conditions, mechanical failure, collisions, and property losses to the vessel.
The company also incurs vessel operating costs which are aggregated under the “other” vessel operating cost heading. These costs consist of brokers’ commissions, training costs and other miscellaneous costs.
-32-
Table of Contents
Index to Financial Statements
Brokers’ commission costs are incurred primarily in the company’s international operations where brokers assist in obtaining work for the company’s vessels. Brokers generally are paid a percentage of day rates and, accordingly, commissions paid to brokers generally fluctuate in accordance with vessel revenue. Other costs include, but are not limited to, satellite communication fees, agent fees, port fees, canal transit fees, vessel certification fees and temporary vessel importation fees.
Results of Operations
The following table compares revenues and operating expenses (excluding general and administrative expenses, depreciation expense, provision for Venezuelan operations, and gains on asset dispositions) for the company’s vessel fleet and the related percentage of total revenue for the years ended March 31. Vessel revenues and operating costs relate to vessels owned and operated by the company, while other marine revenues relate to third-party activities of the company’s shipyards, brokered vessels and other miscellaneous marine-related activities.
| (In thousands) |
2010 | % | 2009 | % | 2008 | % | ||||||||||
| Revenues (A): |
||||||||||||||||
| Vessel revenues: |
||||||||||||||||
| International |
$ | 1,048,553 | 90 | % | 1,209,426 | 87 | % | 1,055,339 | 83 | % | ||||||
| United States |
89,609 | 8 | % | 146,896 | 11 | % | 159,795 | 13 | % | |||||||
| 1,138,162 | 97 | % | 1,356,322 | 98 | % | 1,215,134 | 96 | % | ||||||||
| Other marine revenues |
30,472 | 3 | % | 34,513 | 2 | % | 55,037 | 4 | % | |||||||
| Total revenues |
$ | 1,168,634 | 100 | % | 1,390,835 | 100 | % | 1,270,171 | 100 | % | ||||||
| Operating costs: |
||||||||||||||||
| Vessel operating costs: |
||||||||||||||||
| Crew costs |
$ | 320,229 | 27 | % | 357,249 | 26 | % | 314,330 | 25 | % | ||||||
| Repair and maintenance |
104,413 | 9 | % | 119,672 | 9 | % | 106,357 | 8 | % | |||||||
| Insurance and loss reserves |
12,948 | 1 | % | 12,817 | 1 | % | 23,667 | 2 | % | |||||||
| Fuel, lube and supplies |
56,637 | 5 | % | 65,249 | 5 | % | 50,933 | 4 | % | |||||||
| Vessel operating leases |
15,054 | 1 | % | 6,996 | 1 | % | 4,699 | <1 | % | |||||||
| Other |
95,978 | 8 | % | 98,893 | 7 | % | 84,760 | 7 | % | |||||||
| 605,259 | 52 | % | 660,876 | 48 | % | 584,746 | 46 | % | ||||||||
| Costs of other marine revenues |
27,387 | 2 | % | 29,282 | 2 | % | 47,423 | 4 | % | |||||||
| Total |
$ | 632,646 | 54 | % | 690,158 | 50 | % | 632,169 | 50 | % | ||||||
| (A) | For fiscal 2010, 2009 and 2008, Chevron Corporation (including its worldwide subsidiaries and affiliates) accounted for 18.3%, 19.1% and 16.3%, respectively, of total revenues while Petroleo Brasileiro SA accounted for 13.1%, 10.1% and 10.5% of total revenues, respectively. |
The following table subdivides vessel operating costs presented above by the company’s International and United States segments and its related percentage of total revenue for the fiscal years ended March 31.
| (In thousands) |
2010 | % | 2009 | % | 2008 | % | ||||||||||
| International vessel operating costs: |
||||||||||||||||
| Crew costs |
$ | 286,500 | 25 | % | 300,401 | 22 | % | 251,272 | 20 | % | ||||||
| Repair and maintenance |
94,882 | 8 | % | 108,115 | 8 | % | 91,089 | 7 | % | |||||||
| Insurance and loss reserves |
9,176 | 1 | % | 9,130 | 1 | % | 15,487 | 1 | % | |||||||
| Fuel, lube and supplies |
54,403 | 5 | % | 62,392 | 4 | % | 47,990 | 4 | % | |||||||
| Vessel operating leases |
11,907 | 1 | % | 3,849 | <1 | % | 2,613 | <1 | % | |||||||
| Other |
94,384 | 8 | % | 94,751 | 7 | % | 77,259 | 6 | % | |||||||
| 551,252 | 47 | % | 578,638 | 42 | % | 485,710 | 38 | % | ||||||||
| United States vessel operating costs: |
||||||||||||||||
| Crew costs |
$ | 33,729 | 3 | % | 56,848 | 4 | % | 63,058 | 5 | % | ||||||
| Repair and maintenance |
9,531 | 1 | % | 11,557 | 1 | % | 15,268 | 1 | % | |||||||
| Insurance and loss reserves |
3,772 | <1 | % | 3,687 | <1 | % | 8,180 | 1 | % | |||||||
| Fuel, lube and supplies |
2,234 | <1 | % | 2,857 | <1 | % | 2,943 | <1 | % | |||||||
| Vessel operating leases |
3,147 | <1 | % | 3,147 | <1 | % | 2,086 | <1 | % | |||||||
| Other |
1,594 | <1 | % | 4,142 | <1 | % | 7,501 | 1 | % | |||||||
| 54,007 | 5 | % | 82,238 | 6 | % | 99,036 | 8 | % | ||||||||
| Total vessel operating costs |
$ | 605,259 | 52 | % | 660,876 | 48 | % | 584,746 | 46 | % | ||||||
33
Table of Contents
Index to Financial Statements
As a result of the uncertainty of a certain customer to make payment of vessel charter hire, the company has deferred the recognition of approximately $9.2 million of billings as of March 31, 2010, $6.1 million of billings as of March 31, 2009 and $5.7 million of billings as of March 31, 2008, which would otherwise have been recognized as revenue. The company will recognize the amounts as revenue as cash is collected or at such time as the uncertainty has been significantly reduced. We currently have no ongoing business with this customer and we do not know if this lack of ongoing work will impact our ability to collect this receivable.
The following table compares operating income and other components of earnings before income taxes, and its related percentage of total revenues for the years ended March 31 consists of the following:
| (In thousands) |
2010 | % | 2009 | % | 2008 | % | |||||||||||||
| Marine operating profit: |
|||||||||||||||||||
| Vessel activity: |
|||||||||||||||||||
| International |
$ | 252,354 | 22 | % | 437,695 | 31 | % | 394,789 | 31 | % | |||||||||
| United States |
9,196 | 1 | % | 34,797 | 3 | % | 29,985 | 2 | % | ||||||||||
| 261,550 | 22 | % | 472,492 | 34 | % | 424,774 | 33 | % | |||||||||||
| Corporate expenses |
(51,432 | ) | (4 | %) | (38,622 | ) | (3 | %) | (40,974 | ) | (3 | %) | |||||||
| Gain on asset dispositions, net |
28,178 | 2 | % | 27,251 | 2 | % | 11,449 | 1 | % | ||||||||||
| Other marine services |
2,034 | <1 | % | 4,348 | <1 | % | 6,776 | 1 | % | ||||||||||
| Operating income |
240,330 | 21 | % | 465,469 | 33 | % | 402,025 | 32 | % | ||||||||||
| Foreign exchange gain (loss) |
4,094 | <1 | % | 2,695 | <1 | % | (891 | ) | (<1 | %) | |||||||||
| Equity in net earnings of unconsolidated companies |
18,107 | 2 | % | 16,978 | 1 | % | 14,470 | 1 | % | ||||||||||
| Interest income and other, net |
6,882 | 1 | % | 7,066 | 1 | % | 16,957 | 1 | % | ||||||||||
| Interest and other debt costs |
(1,679 | ) | (<1 | %) | (693 | ) | (<1 | %) | (6,992 | ) | (1 | %) | |||||||
| Earnings before income taxes |
$ | 267,734 | 23 | % | 491,515 | 35 | % | 425,569 | 34 | % | |||||||||
Fiscal 2010 Compared to Fiscal 2009
General Market Conditions
International Segment. The company’s international results of operations are primarily dependent on the supply and demand relationship for crude oil. During fiscal 2010, internationally based vessel utilization rates decreased approximately seven percentage points as compared to fiscal 2009 due to the global economic recession that began in the latter part of calendar year 2008. E&P customers reduced their capital spending budgets in response to lower hydrocarbon demand and weaker commodity prices. During the company’s fiscal 2010, the global recession resulted in a decrease in demand for offshore support vessel services. This reduced demand has led to an industry-wide reduction in charter rates and utilization rates on vessels as our customers demanded pricing concessions.
United States Segment. The company’s United States results of operations are primarily dependent on the supply and demand relationship for natural gas. The number of operating drilling rigs in the U.S. offshore market is generally the primary driver of activity, and the U.S. GOM remains at historically low levels due a reduction in exploration and field development activity in the U.S. GOM, particularly in non-deepwater areas. As a result of the deterioration of the macroeconomic environment in the U.S. GOM over the last few years and due to the global economic recession that began in the latter part of calendar year 2008, during fiscal 2010, the total U.S.-based vessel utilization decreased approximately 18 percentage points as compared to fiscal 2009.
Consolidated Results
The company’s consolidated net earnings were $259.5 million during fiscal 2010 as compared to $406.9 million during fiscal 2009, a decrease of approximately 36%, or $147.4 million, due to a 16% decrease in total revenues during the comparative periods and to a $43.7 million, net provision for Venezuelan operations, as disclosed in Note 10 of Notes to Consolidated Financial Statements, an $11.4 million, or $0.22 per common share, proposed settlement with the SEC related to the previously announced internal investigation as disclosed in Note 10 of Notes to Consolidated Financial Statements, partially offset by approximately 8% lower vessel operating costs and the reversal of $36.1 million of accrued income tax liabilities as disclosed in Note 3 of Notes to Consolidated Financial Statements.
The company recorded $1.2 billion in revenue during fiscal 2010 as compared to the $1.4 billion recorded during fiscal 2009, a decrease of approximately 16%, or $222.2 million, primarily due to the loss of revenue
-34-
Table of Contents
Index to Financial Statements
from the termination of the company’s Venezuelan operations and to an approximate eight percentage point reduction in total worldwide utilization. The company’s Venezuelan operations contributed $11.3 million of revenues during fiscal 2010 as compared to $61.6 million of revenues contributed during fiscal 2009. Vessel revenues generated by the company’s international segment decreased approximately $160.9 million, or 13%, during fiscal 2010 compared to fiscal 2009, while the vessel revenues generated by the U.S. segment decreased approximately $57.3 million, or 39%, during the same comparative periods. Other marine revenues decreased approximately 12%, or $4.0 million, during the same comparative periods. International segment vessel operating costs decreased approximately 5%, or $27.4 million, while the company’s U.S. segment vessel operating costs decreased approximately 34%, or $28.2 million, during fiscal 2010 as compared to fiscal 2009. The company reduced its vessel operating costs in reaction to the contraction in spending by our customers. Costs of other marine revenues decreased approximately 6%, or $1.9 million, during the same comparative periods. A significant portion of the company’s operations continue to be conducted internationally, therefore, the company’s international vessel operations continue to be the primary driver of its earnings. Revenues generated from international vessel operations, as a percentage of the company’s total vessel revenues, was 92% during fiscal 2010 compared to 89% during fiscal 2009.
At March 31, 2010, the company had 377 owned or chartered vessels (excluding joint-venture vessels and vessels withdrawn from service) in its fleet with an average age of 17.8 years. The average age of 170 newer vessels that have been acquired or constructed since calendar year 2000 as part of the company’s new build and acquisition program is 5.4 years. The remaining 207 vessels have an average age of 28.0 years. During fiscal 2010 and 2009, the company’s newer vessels generated $770.5 million and $712.0 million, respectively, of consolidated revenues and accounted for 79% and 59%, respectively, of total vessel margin (vessel revenues less vessel operating expenses less vessel depreciation of $76.2 million and $64.4 million, respectively), while the traditional vessels generated $367.7 million and $644.3 million of the consolidated revenues during the same comparative periods, respectively, and accounted for the remaining 21% and 41% of total vessel margin, respectively. Vessel depreciation on the company’s traditional vessels was $50.6 million and $58.0 million, respectively, during the same comparative periods.
International Segment Operations. Internationally based vessel revenues decreased $160.9 million, or 13%, during fiscal 2010 as compared to fiscal 2009, primarily due to an approximate seven percentage point decrease in utilization rates on vessels operating in international markets, reflecting weaker demand for the company’s vessels. Average day rates for internationally based vessels increased a relatively modest 2% during fiscal 2010 as compared to fiscal 2009. Higher average day rates for internationally based vessels reflect a change in the mix of vessels operating during fiscal 2010 compared to fiscal 2009. Leading edge day rates have generally been declining across vessel classes; however, the impact of this decline on average day rate statistics was mitigated by a change in the mix of vessels that were working in fiscal 2010 relative to fiscal 2009. In particular, the company stacked a number of traditional vessels in fiscal 2010 and the traditional vessels generally earn lower day rates than newer vessels. As a result, the average working vessel in fiscal 2010 earned a higher day rate than the average working vessel in fiscal 2009. In addition, the company’s revenues decreased during the comparative periods because of the loss of revenue from the seizure of its Venezuelan operations. The company’s Venezuelan operations contributed $11.3 million of revenues during fiscal 2010 as compared to $61.6 million of revenues contributed during fiscal 2009.
During fiscal 2010, the company continued to stack and remove from its internationally based active fleet vessels that could not find attractive charter hire contracts. At the beginning of fiscal 2010, the company had 46 internationally based stacked vessels. During fiscal 2010, the company stacked 52 additional vessels, sold 32 vessels from the previously stacked vessel fleet, and returned to international service three vessels, resulting in a total of 63 internationally based stacked vessels as of March 31, 2010. Vessel utilization rates are calculated by dividing the number of days a vessel works by the number of days the vessel is available to work. Stacked internationally based vessels depressed international utilization rates during the comparative periods because stacked vessels are considered available to work, and as such, are included in the calculation of utilization rates.
The company’s towing supply/supply class of vessels were responsible for approximately 95%, or $153.1 million, of the loss in revenue during fiscal 2010 as compared to fiscal 2009, primarily due to a decrease in the number of towing-supply/supply vessels operating in the international market because of vessel sales, the seizure of vessels by the Venezuelan government, and because of lower utilization rates resulting from weaker demand for the company vessels that continued to operate internationally. The company’s crew/utility class of vessels were responsible for approximately 10%, or $16.5 million, of the loss
-35-
Table of Contents
Index to Financial Statements
in revenue during the same comparative periods due to lower utilization and average day rates because of weaker demand for the company’s crew/utility class of vessels. The company’s internationally based offshore tugs were responsible for approximately 15%, or $24.3 million, of the loss in revenue during fiscal 2010 as compared to fiscal 2009 due to lower utilization and average day rates and to a decrease in the number of offshore tugs operating in the international market because of vessel sales and the seizure of vessels by the Venezuelan government.
Increases in revenues generated by the company’s deepwater class of vessels offset some of the revenue losses of the other vessel classes operating in the international segment. Revenues earned by the deepwater class of vessels increased approximately 15%, or $39.5 million during fiscal 2010 as compared to fiscal 2009, despite decreases in utilization and average day rates, due to an increase in the number of deepwater vessels operating in the international market following the addition of newly-built deepwater vessels to the fleet and to vessels transferring from the U.S. GOM market. Vessel revenues, utilization percentages and average day rates by vessel class for the international segment are disclosed in the “Vessel Class Revenues and Statistics by Segment” section of this report.
Operating profit for internationally based vessels decreased approximately 42%, or $185.3 million, during fiscal 2010 as compared to fiscal 2009, primarily due to 13% lower revenues from internationally based vessels, a $43.7 million provision for Venezuelan operations, as disclosed in Note 10 of Notes to Consolidated Financial Statements, and approximately 8%, or $9.2 million, higher depreciation expense. Excluding the provision for Venezuelan operations, the company’s operating profit from internationally based vessels decreased approximately 32%, or $141.6 million, during fiscal 2010 as compared to fiscal 2009, due to lower revenues from internationally based vessels, which were partially offset by an approximate 5%, or $27.4 million, reduction in operating costs from internationally based vessels (primarily crew costs, repair and maintenance and fuel, lube and supply costs). Depreciation expense associated with internationally based vessels increased during the comparative periods because of the transfer of vessels from the U.S. GOM to international markets and to newly-constructed vessels that were added to the international fleet during fiscal 2010 and 2009.
International crew costs were lower by approximately 5%, or $13.9 million, during fiscal 2010 as compared to fiscal 2009, because of fewer vessels operating internationally as a result of vessels sales, stacking of vessels, and the seizing of vessels by the Venezuelan government. Repair and maintenance costs for internationally based vessels decreased approximately 12%, or $13.2 million, because there were fewer drydockings performed during the same comparative periods. Fuel, lube and supply costs were lower by approximately 13%, or $8.0 million, during the same comparative periods, due to the same reasons listed above for lower crew costs.
International vessel operating lease costs increased approximately $8.1 million, or 209%, during fiscal 2010 as compared to fiscal 2009, because of six additional vessel operating leases initiated during fiscal 2010, as disclosed in Note 9 of Notes to Consolidated Financial Statements.
United States Segment Operations. Vessel revenues from U.S.-based vessels decreased approximately 39%, or $57.3 million, during fiscal 2010 as compared to fiscal 2009, primarily due to an approximate 18 percentage point decrease in total U.S. utilization rates, which reflect the deterioration of the macroeconomic environment in the U.S. GOM market during the comparative periods. Average day rates increased approximately 9% during the same comparative time periods, but the increase in average day rates was insufficient to mitigate the negative effects that lower utilization rates had on U.S. segment revenues. Higher average U.S. day rates reflect a change in the mix of vessels operating during fiscal 2010 compared to fiscal 2009. As was the case with international operations, leading edge day rates in the U.S. segment generally declined across vessel classes; however, the impact of this decline on average day rate statistics was mitigated by the company stacking traditional vessels. Vessel revenues also decreased during the comparative periods because of the transfer of approximately three vessels to international markets.
In response to the deteriorating U.S. GOM market conditions, the company stacked and removed from its active fleet vessels that could not find attractive charter hire contracts. At the beginning of fiscal 2010, the U.S. GOM had 15 stacked vessels. During fiscal 2010, the company stacked 11 additional vessels, sold five vessels from the previously stacked vessel fleet, and returned to domestic service one vessel, resulting in a total of 20 U.S.-based stacked vessels as of March 31, 2010. The depressed utilization rates during fiscal
-36-
Table of Contents
Index to Financial Statements
2010 are reflective of the reduced demand for vessels in the U.S. GOM and the stacking of additional vessels.
The company’s deepwater class of vessels was responsible for approximately $2.9 million, or 5%, of the loss in revenue during fiscal 2010 as compared to fiscal 2009, because three deepwater vessels required drydockings during fiscal 2010. Average day rates on the deepwater class of vessels increased approximately 8%, during the comparative periods because one deepwater vessel performed short-term charter assignments periodically during fiscal 2010 at contract rates substantially higher than the otherwise average day rate. The company’s towing supply/supply class of vessels were responsible for approximately 68%, or $39.2 million, of the loss in revenue during fiscal 2010 as compared to fiscal 2009, due to an approximate 10 percentage point decrease in utilization, an approximate 30% decrease in average day rates resulting from the transfer of vessels to international markets, vessel sales and weak demand for the company’s vessels in the shallow waters of the U.S. GOM market. The company’s crew/utility class of vessels was responsible for approximately $15.1 million, or 26%, of the loss in revenue during the same comparative periods due to the transfer of crewboats to international markets. Vessel revenues, utilization percentages and average day rates by vessel class for the U.S. segment are disclosed in the “Vessel Class Revenues and Statistics by Segment” section of this report.
U.S.-based operating profit decreased approximately $25.6 million, or 74%, during fiscal 2010 compared to fiscal 2009, primarily due to lower revenues. Reductions in revenues were somewhat offset by an approximate $28.2 million, or 34%, decrease in vessel operating costs (primarily crew costs and repair and maintenance costs) and an approximate $5.1 million, or 32%, decrease in depreciation expense resulting from fewer vessels operating in the U.S. GOM market during fiscal 2010 compared to fiscal 2009. Crew costs decreased approximately 41%, or $23.1 million during fiscal 2010 compared to fiscal 2009, due to the transfer of vessels to international markets, reductions in crew personnel and wage reductions on crews staffing the remaining active vessels. Repair and maintenance costs were approximately 18%, or $2.0 million lower during fiscal 2010 as compared to fiscal 2009 because comparatively fewer drydocks were performed in fiscal 2010 versus fiscal 2009 and, because fewer vessels were operating in the U.S. GOM, comparatively lower expenditures were required for routine maintenance and repairs.
Other Items. Foreign exchange gains increased approximately $1.4 million, or 52%, during fiscal 2010 as compared to fiscal 2009, primarily due to an $11.0 million, or $0.21 per common share, foreign exchange gain related to the 50% devaluation of the Venezuelan bolivar fuerte relative to U.S. dollar. Excluding this gain, foreign exchange gains decreased approximately $9.6 million, or 356%, due to the devaluation of the U.S. dollar relative to other currencies.
Fiscal 2010 insurance and loss reserves were comparable to fiscal 2009.
Gain on asset dispositions, net, during fiscal 2010 increased approximately 3%, or $0.9 million, as compared to fiscal 2009, due to higher gains earned on the mix of vessels sold. Dispositions of vessels can vary from quarter to quarter; therefore, gains on sales of assets may fluctuate significantly from period to period. The company recorded impairment charges of $3.1 million and $1.4 million during fiscal 2010 and 2009, respectively, on certain stacked vessels, which are included in gains on asset dispositions, net.
Fiscal 2009 Compared to Fiscal 2008
General Market Conditions
International Segment. Vessel day rates for the international segment moved higher during fiscal 2009, largely due to an increase in drilling activity in the international markets. In 2008, capital spending budgets for exploration and production were based on strong crude oil pricing that occurred during the first half of calendar year 2008. The price of crude oil peaked at $147 per barrel in mid-July 2008 but fell to around the $48 to $52 price range around mid-April 2009. OPEC responded to falling crude prices by cutting production in an effort to stabilize prices. It was unknown at the time whether crude oil prices would stabilize at levels that would support significant levels of exploration and production spending by oil and gas companies. Demand for the company’s vessels in the various international markets was strong during most of fiscal 2009 and began showing some signs of weakening as the fiscal year ended.
-37-
Table of Contents
Index to Financial Statements
United States Segment. Demand for the company’s vessels in the shallow water U.S. GOM offshore vessel market steadily diminished between calendar year 2006 to 2009 as numerous drilling rigs migrated to international areas to capitalize on strong market fundamentals that existed at that time. In response to the departure of drilling rigs from the U.S. GOM, the company relocated 10 vessels (including two deepwater vessels) to international locations during fiscal 2009, where the vessels secured more attractive term contracts at generally higher day rates. A net seven vessels were transferred to international locations during fiscal 2008. Although the number of drilling rigs in the U.S. GOM was low, the market for offshore vessels tightened during the summer of 2008 due to an increase in E&P drilling activity resulting from high natural gas prices, which reached the $13.00 per Mcf range in July 2008, but which fell to the $3.45 to $3.60 range by mid-April 2009. Damage to the energy infrastructure caused by Hurricanes Gustav and Ike, which hit the Louisiana and Texas coasts in September 2008, strengthened an already strong offshore support vessel market. The resulting offshore vessels supply/demand fundamentals pushed vessel day rates higher in the U.S. GOM. At the time, the U.S. GOM supply boat market had a significant number of vessels previously stacked that could have resumed active status after drydocking and recertification. All of the company’s available-for-work U.S.-based vessels were working at relatively full utilization prior to the storms, and, after the storms, two of the company’s stacked vessels were drydocked and re-certificated to respond to increased post-hurricane market demand. Demand for the company’s vessels was brisk for the majority of the company’s fiscal 2009 second and third quarters. Demand waned throughout the fourth quarter due partially to the winding down of repair work on the offshore energy infrastructure and due to day rate and utilization weakness on the U.S.-based vessels that operated in the shallow and mid-water depths of the U.S. GOM.
Consolidated Results
The company’s fiscal 2009 consolidated net earnings increased approximately 17%, or $58.1 million, over the net earnings generated during fiscal 2008, primarily due to higher average day rates. During fiscal 2009, the company recorded $1.4 billion in revenues, an increase of approximately $120.7 million, or 9%, over its fiscal 2008 revenues. Revenues generated by the company’s international segment increased approximately 15%, or $154.1 million, during fiscal 2009 as compared to fiscal 2008, while revenues generated by the company’s U.S. segment decreased approximately 8%, or $12.9 million, during the same comparative period. International segment vessel operating costs increased approximately 19%, or $92.9 million, while U.S. segment vessel operating costs decreased approximately 17%, or $16.8 million, during the same comparative period. A significant portion of the company’s operations are conducted internationally. Revenues generated from international vessel operations as a percentage of the company’s total revenues were 87% during fiscal 2009 compared to 84% in fiscal 2008.
At March 31, 2009, the company had 409 owned or chartered vessels (excluding joint-venture vessels and vessels withdrawn from service) in its fleet with an average age of 19.5 years. The average age of the 142 newer vessels at that time was 5.2 years. The remaining 267 vessels had an average age of 27.1 years. During fiscal 2009, the company’s newer vessels generated $712.0 million, or 52%, of vessel revenues and accounted for 59% of total vessel margin (vessel revenues less vessel operating expenses less vessel depreciation) while the older vessels generated $644.3 million, or 48%, of vessel revenues and accounted for the remaining 41% of vessel margin.
International Segment Operations. Vessel revenues for the company’s international segment increased approximately 15%, or $154.1 million, during fiscal 2009 as compared to fiscal 2008, due to an approximate 19% increase in total average day rates. Even though vessel revenues for the international segment improved during fiscal 2009, the revenues were adversely affected by an increased number of maintenance days on several of the company’s larger deepwater class of vessels resulting from a higher level of drydockings that occurred during fiscal 2009. The increased number of maintenance days lowered the utilization and average day rates on the deepwater class of vessels during fiscal 2009 compared to fiscal 2008.
The company’s international deepwater class, towing-supply/supply class and offshore tug class of vessels generated approximately 15%, 80% and 4%, respectively, of the revenue growth during fiscal 2009 as compared to fiscal 2008. The company’s deepwater and towing-supply/supply class of vessels generated increases in revenue during the comparative periods due to an increase in the number of vessels operating internationally (approximately four additional deepwater vessels and 15 additional towing-supply/supply vessels, excluding vessel dispositions) and due to higher average day rates. The average day rate on the
-38-
Table of Contents
Index to Financial Statements
deepwater vessels and towing supply/supply class of vessels increased approximately 10% and 20%, respectively, during the comparative periods. Revenues on the company’s internationally based offshore tugs increased due to a two percentage point increase in utilization and an approximate 21% increase in average day rates during the comparative periods, despite a decrease in the number of offshore tugs operating internationally due to vessel dispositions. Revenues earned during fiscal 2009 on the company’s crew/utility class of vessels were comparable to the revenues earned in fiscal 2008. Vessel revenues, utilization percentages and average day rates by vessel class for the international segment are disclosed in the “Vessel Class Revenues and Statistics by Segment” section of this report.
International segment vessel operating costs increased approximately 19%, or $92.9 million, during fiscal 2009 as compared to fiscal 2008, primarily due to higher crew costs, repair and maintenance costs and depreciation expense related to an increase in the number of vessels operating internationally. International segment crew costs increased approximately 20% during the comparative years due to inflationary increases in labor costs, the transfer of 10 vessels from the U.S. GOM and the addition of 17 newly-constructed vessels to the international segment fleet at various times during fiscal 2009. Repair and maintenance costs increased approximately 19% during the comparative years due to an increase in the number of scheduled drydockings performed during fiscal 2009, including several relatively expensive drydockings performed on the newer, deepwater vessels. Depreciation expense was approximately 8% higher during the comparative periods because vessels were transferred from the U.S. GOM to international areas of operation and newly-constructed vessels were added to the internationally based fleet during fiscal 2009.
International segment vessel operating profit increased approximately 11%, or $42.9 million, during fiscal 2009 compared to fiscal 2008, primarily due to higher revenues, which were partially offset by increases in vessel operating costs as discussed above.
United States Segment Operations. The company’s vessel revenues generated by its U.S. segment decreased approximately 8%, or $12.9 million, during fiscal 2009 as compared to fiscal 2008, due to fewer vessels operating in the U.S. GOM (because vessels had been transferred to international markets) and to a four percentage point decrease in total utilization rates on the remaining U.S. segment vessels, which were somewhat offset by an approximate 11% increase in average day rates. The company transferred 10 vessels to international markets (including two deepwater vessels) during fiscal 2009 because of a weak U.S. GOM market. The weak macroeconomic environment in the U.S. GOM resulted in lower U.S.-based vessel utilization during fiscal 2009 as compared to fiscal 2008.
The company’s deepwater class of vessels was responsible for approximately 7%, or $0.9 million, of the loss in revenue during fiscal 2009 as compared to fiscal 2008, because two deepwater vessels were transferred to international markets. The company’s towing supply/supply class of vessels was responsible for approximately 46%, or $5.9 million, of the loss in revenue during fiscal 2009 as compared to fiscal 2008, due to an approximate five percentage point drop in utilization and the transfer of four towing-supply/supply vessels to international markets. Average day rates, however, increased approximately 14% on the towing-supply/supply class of vessels. The company’s crew/utility class of vessels was responsible for approximately 47%, or $6.0 million, of the loss in revenue during the same comparative periods due to the transfer of four crewboats to international markets and because of an approximate five percentage point decrease in utilization and approximately 6% lower average day rates. Vessel revenues, utilization percentages and average day rates by vessel class for the U.S. segment are disclosed in the “Vessel Class Revenues and Statistics by Segment” section of this report.
U.S.-based vessel operating profit increased approximately 16%, or $4.8 million, during fiscal 2009 as compared to fiscal 2008, due to approximately 17%, or $16.8 million, lower U.S. segment vessel operating costs (primarily crew costs, repair and maintenance costs, and insurance and loss reserves) and approximately 8%, or $8.3 million, lower depreciation expense during the comparative periods resulting from fewer vessels operating in the U.S. GOM market. Crew costs decreased approximately 10%, or $6.2 million, during fiscal 2009 as compared to fiscal 2008, due to the transfer of vessels to international markets. Repair and maintenance costs decreased approximately 24%, or $3.7 million, due to fewer drydockings performed during fiscal 2009 and to a decrease in the average cost per drydock performed and to lower routine repair and maintenance costs during fiscal 2009 as compared to fiscal 2008.
-39-
Table of Contents
Index to Financial Statements
Other Items. Foreign exchange gains increased approximately $3.6 million during fiscal 2009 as compared to fiscal 2008 due to a stronger U.S. dollar relative to other currencies.
Insurance and loss reserves decreased approximately 46%, or $10.9 million, during fiscal 2009 as compared to 2008, due to lower premiums and loss reserves recorded as a result of a better safety record during fiscal 2009 as compared to fiscal 2008.
Gain on asset dispositions, net, increased approximately $15.8 million, or 138%, during fiscal 2009 as compared to fiscal 2008, due to a higher number of vessels sold during fiscal 2009 and due to larger gains earned on the mix of vessels sold.
Vessel Class Revenue and Statistics by Segment
Vessel utilization is determined primarily by market conditions and to a lesser extent by drydocking requirements. Vessel day rates are determined by the demand created largely through the level of offshore exploration, field development and production spending by energy companies relative to the supply of offshore service vessels. Suitability of equipment and the degree of service provided also influence vessel day rates. Vessel utilization rates are calculated by dividing the number of days a vessel works during a reporting period by the number of days the vessel is available to work in the reporting period. Average day rates are calculated by dividing the revenue a vessel earns during a reporting period by the number of days the vessel worked in the reporting period. Vessel utilization and average day rates are calculated only on vessels in service and, as such, do not include vessels withdrawn from service or joint venture vessels. The following tables compare revenues, day-based utilization percentages and average day rates by vessel class and in total for each of the quarters in the years ended March 31:
-40-
Table of Contents
Index to Financial Statements
REVENUE BY VESSEL CLASS:
(In thousands)
| Fiscal Year 2010 |
First | Second | Third | Fourth | Year | ||||||
| International-based fleet: |
|||||||||||
| Deepwater vessels |
$ | 69,113 | 73,696 | 81,670 | 82,284 | 306,763 | |||||
| Towing-supply/supply |
180,181 | 166,471 | 144,500 | 125,088 | 616,240 | ||||||
| Crew/utility |
25,570 | 22,393 | 19,812 | 19,528 | 87,303 | ||||||
| Offshore tugs |
10,557 | 9,338 | 8,604 | 9,181 | 37,680 | ||||||
| Other |
567 | — | — | — | 567 | ||||||
| Total |
$ | 285,988 | 271,898 | 254,586 | 236,081 | 1,048,553 | |||||
| United States-based fleet: |
|||||||||||
| Deepwater vessels |
$ | 13,297 | 14,714 | 12,554 | 15,160 | 55,725 | |||||
| Towing-supply/supply |
9,515 | 7,342 | 6,931 | 6,990 | 30,778 | ||||||
| Crew/utility |
1,636 | 609 | 436 | 425 | 3,106 | ||||||
| Total |
$ | 24,448 | 22,665 | 19,921 | 22,575 | 89,609 | |||||
| Worldwide fleet: |
|||||||||||
| Deepwater vessels |
$ | 82,410 | 88,410 | 94,224 | 97,444 | 362,488 | |||||
| Towing-supply/supply |
189,696 | 173,813 | 151,431 | 132,078 | 647,018 | ||||||
| Crew/utility |
27,206 | 23,002 | 20,248 | 19,953 | 90,409 | ||||||
| Offshore tugs |
10,557 | 9,338 | 8,604 | 9,181 | 37,680 | ||||||
| Other |
567 | — | — | — | 567 | ||||||
| Total |
$ | 310,436 | 294,563 | 274,507 | 258,656 | 1,138,162 | |||||
| Fiscal Year 2009 |
First | Second | Third | Fourth | Year | ||||||
| International-based fleet: |
|||||||||||
| Deepwater vessels |
$ | 58,284 | 67,642 | 69,740 | 71,553 | 267,219 | |||||
| Towing-supply/supply |
184,959 | 193,415 | 199,580 | 191,342 | 769,296 | ||||||
| Crew/utility |
27,369 | 26,709 | 25,627 | 24,145 | 103,850 | ||||||
| Offshore tugs |
15,826 | 14,993 | 15,467 | 15,688 | 61,974 | ||||||
| Other |
1,831 | 1,876 | 1,655 | 1,725 | 7,087 | ||||||
| Total |
$ | 288,269 | 304,635 | 312,069 | 304,453 | 1,209,426 | |||||
| United States-based fleet: |
|||||||||||
| Deepwater vessels |
$ | 16,932 | 16,099 | 12,795 | 12,818 | 58,644 | |||||
| Towing-supply/supply |
17,675 | 18,644 | 19,945 | 13,742 | 70,006 | ||||||
| Crew/utility |
5,495 | 5,259 | 4,372 | 3,120 | 18,246 | ||||||
| Total |
$ | 40,102 | 40,002 | 37,112 | 29,680 | 146,896 | |||||
| Worldwide fleet: |
|||||||||||
| Deepwater vessels |
$ | 75,216 | 83,741 | 82,535 | 84,371 | 325,863 | |||||
| Towing-supply/supply |
202,634 | 212,059 | 219,525 | 205,084 | 839,302 | ||||||
| Crew/utility |
32,864 | 31,968 | 29,999 | 27,265 | 122,096 | ||||||
| Offshore tugs |
15,826 | 14,993 | 15,467 | 15,688 | 61,974 | ||||||
| Other |
1,831 | 1,876 | 1,655 | 1,725 | 7,087 | ||||||
| Total |
$ | 328,371 | 344,637 | 349,181 | 334,133 | 1,356,322 | |||||
| Fiscal Year 2008 |
First | Second | Third | Fourth | Year | ||||||
| International-based fleet: |
|||||||||||
| Deepwater vessels |
$ | 60,958 | 56,842 | 63,024 | 59,991 | 240,815 | |||||
| Towing-supply/supply |
145,526 | 157,185 | 171,132 | 175,945 | 649,788 | ||||||
| Crew/utility |
26,954 | 25,641 | 25,349 | 26,278 | 104,222 | ||||||
| Offshore tugs |
14,974 | 13,536 | 13,034 | 13,781 | 55,325 | ||||||
| Other |
1,407 | 981 | 1,429 | 1,372 | 5,189 | ||||||
| Total |
$ | 249,819 | 254,185 | 273,968 | 277,367 | 1,055,339 | |||||
| United States-based fleet: |
|||||||||||
| Deepwater vessels |
$ | 12,255 | 14,847 | 15,488 | 16,972 | 59,562 | |||||
| Towing-supply/supply |
24,960 | 21,696 | 15,090 | 14,192 | 75,938 | ||||||
| Crew/utility |
5,857 | 6,640 | 6,124 | 5,674 | 24,295 | ||||||
| Total |
$ | 43,072 | 43,183 | 36,702 | 36,838 | 159,795 | |||||
| Worldwide fleet: |
|||||||||||
| Deepwater vessels |
$ | 73,213 | 71,689 | 78,512 | 76,963 | 300,377 | |||||
| Towing-supply/supply |
170,486 | 178,881 | 186,222 | 190,137 | 725,726 | ||||||
| Crew/utility |
32,811 | 32,281 | 31,473 | 31,952 | 128,517 | ||||||
| Offshore tugs |
14,974 | 13,536 | 13,034 | 13,781 | 55,325 | ||||||
| Other |
1,407 | 981 | 1,429 | 1,372 | 5,189 | ||||||
| Total |
$ | 292,891 | 297,368 | 310,670 | 314,205 | 1,215,134 | |||||
-41-
Table of Contents
Index to Financial Statements
UTILIZATION:
| Fiscal Year 2010 |
First | Second | Third | Fourth | Year | ||||||
| International-based fleet: |
|||||||||||
| Deepwater vessels |
78.8 | % | 78.5 | 78.8 | 78.5 | 78.6 | |||||
| Towing-supply/supply |
73.9 | 71.1 | 63.8 | 56.7 | 66.6 | ||||||
| Crew/utility |
75.7 | 71.3 | 70.4 | 72.3 | 72.4 | ||||||
| Offshore tugs |
54.2 | 60.4 | 56.0 | 56.8 | 56.8 | ||||||
| Other |
79.2 | — | — | — | 79.2 | ||||||
| Total |
73.2 | % | 71.3 | 66.5 | 62.7 | 68.5 | |||||
| United States-based fleet: |
|||||||||||
| Deepwater vessels |
92.4 | % | 76.7 | 83.7 | 92.0 | 86.1 | |||||
| Towing-supply/supply |
39.4 | 32.2 | 35.8 | 41.8 | 37.3 | ||||||
| Crew/utility |
45.4 | 18.7 | 14.3 | 14.2 | 23.8 | ||||||
| Total |
49.0 | % | 37.7 | 39.5 | 46.0 | 43.1 | |||||
| Worldwide fleet: |
|||||||||||
| Deepwater vessels |
80.8 | % | 78.2 | 79.4 | 80.2 | 79.6 | |||||
| Towing-supply/supply |
70.1 | 66.8 | 60.7 | 55.1 | 63.3 | ||||||
| Crew/utility |
72.6 | 66.4 | 65.0 | 66.4 | 67.7 | ||||||
| Offshore tugs |
54.2 | 60.4 | 56.0 | 56.8 | 56.8 | ||||||
| Other |
79.2 | — | — | — | 79.2 | ||||||
| Total |
70.7 | % | 67.8 | 63.8 | 61.0 | 65.9 | |||||
| Fiscal Year 2009 |
First | Second | Third | Fourth | Year | ||||||
| International-based fleet: |
|||||||||||
| Deepwater vessels |
83.6 | % | 85.8 | 85.7 | 82.1 | 84.2 | |||||
| Towing-supply/supply |
77.2 | 75.7 | 76.1 | 74.4 | 75.8 | ||||||
| Crew/utility |
86.1 | 79.5 | 75.5 | 71.0 | 78.0 | ||||||
| Offshore tugs |
53.4 | 60.4 | 65.2 | 66.8 | 61.1 | ||||||
| Other |
41.8 | 59.1 | 95.1 | 97.7 | 64.6 | ||||||
| Total |
76.6 | % | 75.8 | 76.0 | 74.0 | 75.6 | |||||
| United States-based fleet: |
|||||||||||
| Deepwater vessels |
94.9 | % | 98.0 | 96.7 | 98.5 | 96.9 | |||||
| Towing-supply/supply |
49.8 | 48.1 | 49.0 | 42.3 | 47.5 | ||||||
| Crew/utility |
77.3 | 75.5 | 84.1 | 73.9 | 77.7 | ||||||
| Total |
63.0 | % | 61.4 | 62.4 | 56.3 | 61.0 | |||||
| Worldwide fleet: |
|||||||||||
| Deepwater vessels |
85.9 | % | 88.0 | 87.3 | 84.5 | 86.4 | |||||
| Towing-supply/supply |
73.6 | 72.2 | 72.7 | 70.7 | 72.3 | ||||||
| Crew/utility |
84.7 | 78.9 | 76.6 | 71.4 | 78.0 | ||||||
| Offshore tugs |
53.4 | 60.4 | 65.2 | 66.8 | 61.1 | ||||||
| Other |
41.8 | 59.1 | 95.1 | 97.7 | 64.6 | ||||||
| Total |
74.8 | % | 74.0 | 74.4 | 72.1 | 73.9 | |||||
| Fiscal Year 2008 |
First | Second | Third | Fourth | Year | ||||||
| International-based fleet: |
|||||||||||
| Deepwater vessels |
96.3 | % | 91.9 | 91.4 | 83.5 | 90.7 | |||||
| Towing-supply/supply |
77.4 | 76.9 | 79.2 | 76.7 | 77.6 | ||||||
| Crew/utility |
86.2 | 89.0 | 84.8 | 85.1 | 86.3 | ||||||
| Offshore tugs |
63.4 | 59.7 | 54.7 | 56.8 | 58.7 | ||||||
| Other |
54.7 | 48.2 | 54.8 | 58.8 | 54.1 | ||||||
| Total |
79.0 | % | 78.3 | 78.5 | 76.7 | 78.1 | |||||
| United States-based fleet: |
|||||||||||
| Deepwater vessels |
91.3 | % | 95.1 | 90.5 | 97.5 | 93.7 | |||||
| Towing-supply/supply |
61.0 | 56.6 | 46.1 | 46.2 | 52.7 | ||||||
| Crew/utility |
88.3 | 88.6 | 80.8 | 73.0 | 82.4 | ||||||
| Total |
70.3 | % | 69.1 | 60.9 | 60.1 | 65.1 | |||||
| Worldwide fleet: |
|||||||||||
| Deepwater vessels |
95.5 | % | 92.5 | 91.2 | 86.4 | 91.3 | |||||
| Towing-supply/supply |
75.0 | 74.1 | 74.9 | 72.7 | 74.2 | ||||||
| Crew/utility |
86.5 | 88.9 | 84.2 | 83.1 | 85.7 | ||||||
| Offshore tugs |
63.4 | 59.7 | 54.7 | 56.8 | 58.7 | ||||||
| Other |
54.7 | 48.2 | 54.8 | 58.8 | 54.1 | ||||||
| Total |
77.8 | % | 77.0 | 76.2 | 74.5 | 76.4 | |||||
-42-
Table of Contents
Index to Financial Statements
AVERAGE DAY RATES:
| Fiscal Year 2010 |
First | Second | Third | Fourth | Year | ||||||
| International-based fleet: |
|||||||||||
| Deepwater vessels |
$ | 25,522 | 24,222 | 24,406 | 23,924 | 24,470 | |||||
| Towing-supply/supply |
12,488 | 12,399 | 12,164 | 12,259 | 12,340 | ||||||
| Crew/utility |
5,224 | 4,935 | 4,642 | 4,856 | 4,926 | ||||||
| Offshore tugs |
7,744 | 7,059 | 6,654 | 6,769 | 7,062 | ||||||
| Other |
9,679 | — | — | — | 9,679 | ||||||
| Total |
$ | 12,194 | 12,177 | 12,247 | 12,411 | 12,251 | |||||
| United States-based fleet: |
|||||||||||
| Deepwater vessels |
$ | 24,178 | 29,792 | 26,683 | 25,799 | 26,511 | |||||
| Towing-supply/supply |
10,071 | 9,627 | 8,417 | 7,413 | 8,860 | ||||||
| Crew/utility |
4,997 | 5,045 | 4,749 | 4,757 | 4,936 | ||||||
| Total |
$ | 13,418 | 16,456 | 14,375 | 13,936 | 14,441 | |||||
| Worldwide fleet: |
|||||||||||
| Deepwater vessels |
$ | 25,295 | 25,000 | 24,687 | 24,198 | 24,763 | |||||
| Towing-supply/supply |
12,339 | 12,250 | 11,921 | 11,849 | 12,114 | ||||||
| Crew/utility |
5,210 | 4,938 | 4,644 | 4,853 | 4,926 | ||||||
| Offshore tugs |
7,744 | 7,059 | 6,654 | 6,769 | 7,062 | ||||||
| Other |
9,679 | — | — | — | 9,679 | ||||||
| Total |
$ | 12,282 | 12,426 | 12,380 | 12,531 | 12,399 | |||||
| Fiscal Year 2009 |
First | Second | Third | Fourth | Year | ||||||
| International-based fleet: |
|||||||||||
| Deepwater vessels |
$ | 24,728 | 26,841 | 26,677 | 27,057 | 26,364 | |||||
| Towing-supply/supply |
11,660 | 12,375 | 12,723 | 12,736 | 12,368 | ||||||
| Crew/utility |
4,965 | 5,183 | 5,155 | 5,316 | 5,147 | ||||||
| Offshore tugs |
8,931 | 8,304 | 8,149 | 8,454 | 8,453 | ||||||
| Other |
9,893 | 10,588 | 9,066 | 9,812 | 9,835 | ||||||
| Total |
$ | 11,221 | 12,048 | 12,309 | 12,559 | 12,026 | |||||
| United States-based fleet: |
|||||||||||
| Deepwater vessels |
$ | 24,514 | 25,239 | 23,967 | 24,094 | 24,492 | |||||
| Towing-supply/supply |
11,633 | 12,865 | 13,951 | 12,397 | 12,713 | ||||||
| Crew/utility |
6,010 | 6,020 | 5,595 | 5,357 | 5,789 | ||||||
| Total |
$ | 12,835 | 13,511 | 13,520 | 13,352 | 13,290 | |||||
| Worldwide fleet: |
|||||||||||
| Deepwater vessels |
$ | 24,679 | 26,517 | 26,218 | 26,560 | 26,006 | |||||
| Towing-supply/supply |
11,658 | 12,417 | 12,826 | 12,713 | 12,396 | ||||||
| Crew/utility |
5,114 | 5,305 | 5,214 | 5,321 | 5,233 | ||||||
| Offshore tugs |
8,931 | 8,304 | 8,149 | 8,454 | 8,453 | ||||||
| Other |
9,893 | 10,588 | 9,066 | 9,812 | 9,835 | ||||||
| Total |
$ | 11,396 | 12,201 | 12,427 | 12,626 | 12,151 | |||||
| Fiscal Year 2008 |
First | Second | Third | Fourth | Year | ||||||
| International-based fleet: |
|||||||||||
| Deepwater vessels |
$ | 23,175 | 22,421 | 24,971 | 25,465 | 23,973 | |||||
| Towing-supply/supply |
9,478 | 10,080 | 10,455 | 11,118 | 10,291 | ||||||
| Crew/utility |
4,663 | 4,584 | 4,660 | 4,819 | 4,681 | ||||||
| Offshore tugs |
7,044 | 6,512 | 7,091 | 7,410 | 7,001 | ||||||
| Other |
5,653 | 4,424 | 5,671 | 5,130 | 5,241 | ||||||
| Total |
$ | 9,557 | 9,768 | 10,369 | 10,767 | 10,114 | |||||
| United States-based fleet: |
|||||||||||
| Deepwater vessels |
$ | 23,432 | 23,363 | 23,253 | 23,914 | 23,502 | |||||
| Towing-supply/supply |
11,951 | 11,857 | 10,398 | 9,865 | 11,154 | ||||||
| Crew/utility |
5,992 | 6,269 | 6,095 | 6,201 | 6,141 | ||||||
| Total |
$ | 12,001 | 12,252 | 11,756 | 12,025 | 12,016 | |||||
| Worldwide fleet: |
|||||||||||
| Deepwater vessels |
$ | 23,218 | 22,610 | 24,612 | 25,106 | 23,878 | |||||
| Towing-supply/supply |
9,774 | 10,267 | 10,450 | 11,013 | 10,375 | ||||||
| Crew/utility |
4,855 | 4,852 | 4,884 | 5,017 | 4,901 | ||||||
| Offshore tugs |
7,044 | 6,512 | 7,091 | 7,410 | 7,001 | ||||||
| Other |
5,653 | 4,442 | 5,671 | 5,130 | 5,241 | ||||||
| Total |
$ | 9,852 | 10,064 | 10,516 | 10,900 | 10,329 | |||||
-43-
Table of Contents
Index to Financial Statements
The following tables compare vessel day-based utilization percentages and average day rates for the company’s internationally based fleet and U.S.-based fleet and in total for the company’s new vessels (defined as vessels acquired or constructed since calendar year 2000 as part of its new build and acquisition program) and its older, more traditional vessels for each of the quarters in the year ended March 31:
UTILIZATION:
| Fiscal Year 2010 |
First | Second | Third | Fourth | Year | ||||||
| International-based fleet: |
|||||||||||
| New vessels |
86.5 | % | 86.8 | 86.6 | 85.1 | 86.2 | |||||
| Traditional vessels |
65.3 | 60.5 | 51.0 | 43.7 | 55.7 | ||||||
| Total International-based fleet |
73.2 | % | 71.3 | 66.5 | 62.7 | 68.5 | |||||
| United States-based fleet: |
|||||||||||
| New vessels |
66.5 | % | 49.2 | 52.7 | 57.6 | 56.7 | |||||
| Traditional vessels |
41.0 | 32.7 | 34.1 | 40.8 | 37.1 | ||||||
| Total U.S.-based fleet |
49.0 | % | 37.7 | 39.5 | 46.0 | 43.1 | |||||
| Worldwide fleet: |
|||||||||||
| New vessels |
84.7 | % | 83.8 | 84.2 | 83.1 | 83.9 | |||||
| Traditional vessels |
62.6 | 57.2 | 49.0 | 43.3 | 53.5 | ||||||
| Total Worldwide Fleet |
70.7 | % | 67.8 | 63.8 | 61.0 | 65.9 | |||||
| Fiscal Year 2009 |
First | Second | Third | Fourth | Year | ||||||
| International-based fleet: |
|||||||||||
| New vessels |
91.1 | % | 91.0 | 91.9 | 87.6 | 90.3 | |||||
| Traditional vessels |
70.7 | 69.2 | 68.5 | 67.0 | 68.9 | ||||||
| Total International-based fleet |
76.6 | % | 75.8 | 76.0 | 74.0 | 75.6 | |||||
| United States-based fleet: |
|||||||||||
| New vessels |
83.9 | % | 82.7 | 88.1 | 83.2 | 84.4 | |||||
| Traditional vessels |
50.4 | 49.6 | 50.6 | 44.0 | 48.8 | ||||||
| Total U.S.-based fleet |
63.0 | % | 61.4 | 62.4 | 56.3 | 61.0 | |||||
| Worldwide fleet: |
|||||||||||
| New vessels |
89.9 | % | 89.8 | 91.5 | 87.2 | 89.6 | |||||
| Traditional vessels |
68.4 | 66.9 | 66.4 | 64.5 | 66.6 | ||||||
| Total Worldwide Fleet |
74.8 | % | 74.0 | 74.4 | 72.1 | 73.9 | |||||
| Fiscal Year 2008 |
First | Second | Third | Fourth | Year | ||||||
| International-based fleet: |
|||||||||||
| New vessels |
94.0 | % | 94.9 | 92.8 | 89.7 | 92.8 | |||||
| Traditional vessels |
73.9 | 72.5 | 73.3 | 71.6 | 72.8 | ||||||
| Total International-based fleet |
79.0 | % | 78.3 | 78.5 | 76.7 | 78.1 | |||||
| United States-based fleet: |
|||||||||||
| New vessels |
89.6 | % | 90.5 | 83.8 | 82.1 | 86.4 | |||||
| Traditional vessels |
60.9 | 56.8 | 47.4 | 46.7 | 53.1 | ||||||
| Total U.S.-based fleet |
70.3 | % | 69.1 | 60.9 | 60.1 | 65.1 | |||||
| Worldwide fleet: |
|||||||||||
| New vessels |
93.3 | % | 94.1 | 91.2 | 88.4 | 91.7 | |||||
| Traditional vessels |
72.3 | 70.7 | 70.3 | 68.7 | 70.5 | ||||||
| Total Worldwide Fleet |
77.8 | % | 77.0 | 76.2 | 74.5 | 76.4 | |||||
-44-
Table of Contents
Index to Financial Statements
AVERAGE DAY RATES:
| Fiscal Year 2010 |
First | Second | Third | Fourth | Year | ||||||
| International-based fleet: |
|||||||||||
| New vessels |
$ | 16,452 | 16,160 | 15,807 | 15,441 | 15,946 | |||||
| Traditional vessels |
8,819 | 8,193 | 7,584 | 7,402 | 8,120 | ||||||
| Total International-based fleet |
$ | 12,194 | 12,177 | 12,247 | 12,411 | 12,251 | |||||
| United States-based fleet: |
|||||||||||
| New vessels |
$ | 17,896 | 21,955 | 20,843 | 20,689 | 20,122 | |||||
| Traditional vessels |
10,055 | 12,874 | 10,269 | 9,666 | 10,633 | ||||||
| Total U.S.-based fleet |
$ | 13,418 | 16,456 | 14,375 | 13,936 | 14,441 | |||||
| Worldwide fleet: |
|||||||||||
| New vessels |
$ | 16,554 | 16,429 | 16,027 | 15,705 | 16,165 | |||||
| Traditional vessels |
8,910 | 8,518 | 7,815 | 7,678 | 8,332 | ||||||
| Total Worldwide Fleet |
$ | 12,282 | 12,426 | 12,380 | 12,531 | 12,399 | |||||
| Fiscal Year 2009 |
First | Second | Third | Fourth | Year | ||||||
| International-based fleet: |
|||||||||||
| New vessels |
$ | 16,242 | 17,090 | 17,124 | 17,343 | 16,965 | |||||
| Traditional vessels |
8,608 | 9,163 | 9,288 | 9,361 | 9,091 | ||||||
| Total International-based fleet |
$ | 11,221 | 12,048 | 12,309 | 12,559 | 12,026 | |||||
| United States-based fleet: |
|||||||||||
| New vessels |
$ | 14,647 | 14,732 | 13,669 | 15,074 | 14,526 | |||||
| Traditional vessels |
11,017 | 12,386 | 13,400 | 11,863 | 12,177 | ||||||
| Total U.S.-based fleet |
$ | 12,835 | 13,511 | 13,520 | 13,352 | 13,290 | |||||
| Worldwide fleet: |
|||||||||||
| New vessels |
$ | 16,001 | 16,775 | 16,740 | 17,125 | 16,666 | |||||
| Traditional vessels |
8,812 | 9,445 | 9,654 | 9,550 | 9,351 | ||||||
| Total Worldwide Fleet |
$ | 11,396 | 12,201 | 12,427 | 12,626 | 12,151 | |||||
| Fiscal Year 2008 |
First | Second | Third | Fourth | Year | ||||||
| International-based fleet: |
|||||||||||
| New vessels |
$ | 14,324 | 14,284 | 15,651 | 15,921 | 15,063 | |||||
| Traditional vessels |
7,493 | 7,711 | 7,913 | 8,258 | 7,839 | ||||||
| Total International-based fleet |
$ | 9,557 | 9,768 | 10,369 | 10,767 | 10,114 | |||||
| United States-based fleet: |
|||||||||||
| New vessels |
$ | 12,862 | 13,446 | 13,465 | 14,468 | 13,567 | |||||
| Traditional vessels |
11,380 | 11,156 | 9,970 | 9,399 | 10,587 | ||||||
| Total U.S.-based fleet |
$ | 12,001 | 12,252 | 11,756 | 12,025 | 12,016 | |||||
| Worldwide fleet: |
|||||||||||
| New vessels |
$ | 14,090 | 14,140 | 15,302 | 15,691 | 14,820 | |||||
| Traditional vessels |
7,891 | 8,032 | 8,074 | 8,348 | 8,082 | ||||||
| Total Worldwide Fleet |
$ | 9,852 | 10,064 | 10,516 | 10,900 | 10,329 | |||||
-45-
Table of Contents
Index to Financial Statements
Vessel Count, Dispositions, Acquisitions and Construction Programs
The average age of the company’s 377 owned or chartered vessel fleet at March 31, 2010 is approximately 17.8 years. The average age of the 170 newer vessels that the company acquired or constructed since calendar year 2000 as part of its new build and acquisition program (discussed below) is approximately 5.4 years. The remaining 207 vessels have an average age of 28.0 years. The following table compares the average number of vessels by class and geographic distribution during the years ended March 31 and the actual March 31, 2010 vessel count:
| Actual Vessel Count at March 31, |
Average Number of Vessels During Year Ended March 31, | |||||||
| 2010 | 2010 | 2009 | 2008 | |||||
| International-based fleet: |
||||||||
| Deepwater vessels |
50 | 44 | 33 | 30 | ||||
| Towing-supply/supply |
201 | 206 | 224 | 222 | ||||
| Crew/utility |
61 | 67 | 71 | 71 | ||||
| Offshore tugs |
27 | 26 | 33 | 37 | ||||
| Other |
— | — | 3 | 5 | ||||
| Total |
339 | 343 | 364 | 365 | ||||
| United States-based fleet: |
||||||||
| Deepwater vessels |
8 | 6 | 7 | 7 | ||||
| Towing-supply/supply |
23 | 26 | 32 | 36 | ||||
| Crew/utility |
7 | 7 | 11 | 13 | ||||
| Total |
38 | 39 | 50 | 56 | ||||
| Owned or chartered vessels included in marine revenues |
377 | 382 | 414 | 421 | ||||
| Vessels withdrawn from service |
7 | 8 | 15 | 23 | ||||
| Joint-venture and other |
10 | 10 | 13 | 14 | ||||
| Total |
394 | 400 | 442 | 458 | ||||
Included in owned or chartered vessels are vessels that were stacked by the company. The company considers a vessel to be stacked if the vessel crew is off hire and limited maintenance is being performed on the vessel. The company reduces operating costs by stacking vessels when management does not foresee adequate marketing possibilities for the vessel in the near future. Vessels are added to this list when market conditions warrant and they are removed from this list when they are returned to active service, sold or otherwise disposed. When economically practical marketing opportunities arise, the stacked vessels can be returned to service by performing any necessary maintenance on the vessel and returning fleet personnel to operate the vessel. Although not currently fulfilling charters, stacked vessels are considered to be in service and are included in the calculation of the company’s utilization statistics. The company had 83, 61 and 53 stacked vessels at March 31, 2010, 2009 and 2008, respectively. The vast majority of vessels stacked at March 31, 2010 are currently being marketed for sale and are not expected to return to the active fleet, primarily due to their mature age.
Vessels withdrawn from service represent those vessels that management has determined are unlikely to return to active service and are currently marketed for sale. Vessels withdrawn from service are not included in the company’s utilization statistics.
Vessel Dispositions
The company seeks opportunities to sell and/or scrap its older vessels when market conditions warrant and opportunities arise. The majority of the company’s vessels are sold to buyers who do not compete with the company in the offshore energy industry.
Fiscal 2010. The company disposed of 70 vessels in fiscal 2010, including 25 anchor handling towing supply vessels, 21 platform supply vessels, 10 crewboats, seven offshore tugs, five utility vessels and two other type vessels. Five of the 70 vessels disposed of were from the U.S. GOM vessel fleet while 61 vessels were from the international fleet. The remaining four vessels were disposed of from vessels previously withdrawn from service. Six of the platform supply vessels that were disposed of were sold and leased back by subsidiaries of the company during fiscal 2010. A complete discussion regarding the sale/leaseback transactions is disclosed in the Note 9 of Notes to Consolidated Financial Statements.
-46-
Table of Contents
Index to Financial Statements
Included in the above vessel dispositions, are 15 vessels that were expropriated by the Venezuelan government as disclosed in Note 10 of Notes to Consolidated Financial Statements. Of the 15 expropriated vessels, one was an anchor handling towing supply vessel, three were platform supply vessels, one was a crewboat, five were offshore tugs, three were utility vessels, and two were other type vessels.
Fiscal 2009. The company disposed of 47 vessels during fiscal 2009, including 12 anchor handling towing supply vessels, 11 platform supply vessels, seven crewboats, six utility vessels, eight offshore tugs and three other type vessels. Five of the 47 vessels disposed of were from the U.S. GOM vessel fleet while 33 vessels were from the internationally based fleet. The remaining nine vessels were disposed of from vessels previously withdrawn from service.
Fiscal 2008. The company disposed of 26 vessels during fiscal 2008, including six anchor handling towing supply vessels, nine platform supply vessels, one crewboat, six utility vessels and four offshore tugs. Seven of the 26 vessels disposed of were from the U.S. GOM fleet while 14 vessels were from the internationally based fleet. The remaining five vessels were disposed of from the vessels previously withdrawn from service.
Vessel Deliveries and Acquisitions
The table below summarizes the number of vessels that have been added to the company’s fleet during fiscal 2010, 2009 and 2008 by vessel class and vessel type:
| Number of vessels added | ||||||
| Vessel class and type |
2010 | 2009 | 2008 | |||
| Deepwater vessels: |
||||||
| Anchor handling towing supply |
4 | 1 | — | |||
| Platform supply vessels |
11 | 3 | 3 | |||
| Towing-supply/supply vessels: |
||||||
| Anchor handling towing supply |
8 | 9 | 7 | |||
| Platform supply vessels |
— | — | 2 | |||
| Crewboats and offshore tugs: |
||||||
| Crewboats |
1 | 3 | 4 | |||
| Offshore tugs |
4 | 1 | 3 | |||
| Total number of vessels added to the fleet |
28 | 17 | 19 | |||
Fiscal 2010. The company took delivery of nine anchor handling towing supply vessels, 11 platform supply vessels, one crewboat and two offshore tugs. The nine anchor handing towing supply vessels were constructed at four different international shipyards for a total approximate cost of $180.0 million, and the vessels varied in size from 5,000 to 13,750 BHP. All 11 platform supply vessels are deepwater class vessels, of which three are 230-foot long, five are 240-foot long, two are 266-foot long and one is 311-foot long in size. Nine of the 11 platform supply vessels were constructed at four different international shipyards for a total approximate cost of $208.6 million. The two 266-foot deepwater class platform supply vessels, were constructed at the company’s own shipyard, Quality Shipyards, L.L.C., for a total approximate cost of $61.1 million. The crewboat was constructed at an international shipyard and had a total approximate cost of $1.3 million. The two offshore tugs were constructed at an international shipyard and had a total approximate cost of $29.3 million. The company also acquired three anchor handling towing supply vessels for a total cost of $42.5 million and two offshore tugs for a total approximate cost of $13.3 million during fiscal 2010.
Fiscal 2009. The company took delivery of 10 anchor handling towing supply vessels that varied in size from 5,000 to 13,750 BHP. The 10 anchor handing towing supply vessels were constructed by four different international shipyards for a total approximate cost of $181.9 million. The company also took delivery of two 230-foot and one 240-foot deepwater class platform supply vessels for approximately $44.3 million. Two different international shipyards built the three deepwater class platform supply vessels. The company also delivered to the market three water jet crewboats, constructed at an international shipyard, for a total approximate cost of $4.7 million. Lastly, one internationally built offshore tug was delivered to the company for an approximate total cost of $13.4 million.
Fiscal 2008. The company took delivery of five anchor handling towing supply vessels, which varied in size from 7,000 to 10,000 BHP. The vessels were delivered by two different international shipyards for a total approximate cost of $86.6 million. The company also entered into two capital lease transactions during fiscal
-47-
Table of Contents
Index to Financial Statements
2008 for a total $34.5 million and, accordingly, increased its anchor handling towing supply vessel count by two vessels. Both vessels have a BHP of 10,000 and were built by an international shipyard. The company also delivered two 220-foot and three 250-foot platform supply vessels for an approximate total cost of $82.3 million. The company’s shipyard, Quality Shipyards, L.L.C, constructed the two 220-foot vessels, which are capable of working in domestic and international markets, and a different U.S. shipyard constructed the three 250-foot vessels, which are capable of working in most deepwater markets of the world. The company also delivered to the market two 175-foot, state-of-the-art, fast, crew/supply boat from a U.S. shipyard and two water jet crewboats from a shipyard in Holland for a total approximate cost of $17.3 million. Lastly, three offshore tugs, which were built by three separate international shipyards, were delivered to the company for an approximate total cost of $17.0 million.
Vessel Construction and Acquisition Expenditures at March 31, 2010
At March 31, 2010, the company had 13 anchor handling towing supply vessels under construction, varying in size from 5,150 brake horsepower (BHP) to 13,570 BHP, for a total capital commitment of approximately $231.3 million. Four different international shipyards are constructing the vessels. One anchor handling towing supply vessel is a large, deepwater class vessel. Scheduled deliveries for the 13 vessels began in April 2010, with the last vessel scheduled for delivery in January 2012. As of March 31, 2010, the company had expended $106.1 million for the construction of these vessels.
The company is also committed to the construction of one 230-foot, two 240-foot, one 266-foot and twelve 286-foot platform supply vessels for a total aggregate investment of approximately $432.4 million. The company’s shipyard, Quality Shipyards, L.L.C., is constructing the 266-foot deepwater class vessel. One international shipyard is constructing the 230-foot vessel and the twelve 286-foot vessels. A different international shipyard is constructing the two 240-foot deepwater class vessels. The 230-foot vessel was delivered in April 2010. One of the two 240-foot vessels was delivered in April 2010 and the second is expected to be delivered in May 2010. The 266-foot deepwater class vessel is scheduled for delivery in February 2012. The twelve 286-foot deepwater class vessels are expected to be delivered to the market beginning in November 2010 with final delivery of the twelfth 286-foot vessel scheduled for July of 2012. As of March 31, 2010, $150.2 million has been expended on these 16 vessels.
The company is also committed to the construction of two 175-foot, fast, crew/supply boats for an aggregate cost of approximately $18.1 million. The vessels are being constructed at an international shipyard and are expected to be delivered in June and October of 2010. As of March 31, 2010, the company had expended $15.6 million for the construction of these two vessels.
The company is also committed to acquire five anchor handling towing supply vessels for an approximate cost of $60.6 million. The company took possession of three of these five anchor handling towing supply vessels in April 2010 for a total cost of $36.1 million, and plans to acquire the remaining two anchor handling towing supply vessels for a total cost of $24.5 million in May and June 2010. No monies were expended on these five vessels as of March 31, 2010.
Vessel Commitments Summary at March 31, 2010
The table below summarizes the various vessel commitments, including vessels under construction and vessel acquisition, by vessel class and type as of March 31, 2010:
| International Built | U.S. Built | |||||||||||||||
| Vessel class and type |
Number of Vessels |
Total Cost |
Expended Through 03/31/10 |
Number of Vessels |
Total Cost |
Expended Through 03/31/10 | ||||||||||
| (In thousands) | (In thousands) | |||||||||||||||
| Deepwater vessels: |
||||||||||||||||
| Anchor handling towing supply |
1 | $ | 34,278 | $ | 26,459 | — | — | — | ||||||||
| Platform supply vessels |
15 | $ | 401,920 | $ | 141,732 | 1 | $ | 30,504 | $ | 8,508 | ||||||
| Towing-supply/supply vessels: |
||||||||||||||||
| Anchor handling towing supply |
17 | $ | 257,636 | $ | 79,618 | — | — | — | ||||||||
| Platform supply vessels |
— | — | — | — | — | — | ||||||||||
| Crewboats |
2 | $ | 18,071 | $ | 15,622 | — | — | — | ||||||||
| Totals |
35 | $ | 711,905 | $ | 263,431 | 1 | $ | 30,504 | $ | 8,508 | ||||||
-48-
Table of Contents
Index to Financial Statements
The table below summarizes by vessel class and vessel type the number of vessels expected to be delivered by quarter along with the expected cash outlay (in thousands) of the various vessel commitments as discussed above:
| Quarter Period Ended | ||||||||||||||
| Vessel class and type |
06/10 | 09/10 | 12/10 | 03/11 | 06/11 | Thereafter | ||||||||
| Deepwater vessels: |
||||||||||||||
| Anchor handling towing supply |
1 | — | — | — | — | — | ||||||||
| Platform supply vessels |
2 | 1 | 1 | 2 | 1 | 9 | ||||||||
| Towing-supply/supply vessels: |
||||||||||||||
| Anchor handling towing supply |
8 | 1 | 2 | 1 | 2 | 3 | ||||||||
| Platform supply vessels |
— | — | — | — | — | — | ||||||||
| Crewboats |
— | 1 | 1 | — | — | — | ||||||||
| Totals |
11 | 3 | 4 | 3 | 3 | 12 | ||||||||
| (In thousands) |
||||||||||||||
| Expected quarterly cash outlay |
$ | 162,060 | 66,836 | 51,991 | 52,969 | 47,547 | 89,067 | (A) | ||||||
| (A) | The $89,067 of ‘Thereafter’ vessel construction obligations is expected to be paid out as follows: $87,815 in the remaining quarters of fiscal 2012 and $1,252 during fiscal 2013. |
The company believes that it has sufficient financial capacity to support a continued investment in new vessels for the intermediate term, assuming customer demand, acquisition and shipyard economics and other considerations justify such an investment. The company continues to evaluate its fleet renewal program, whether through new construction or acquisitions, relative to other investment opportunities and uses of cash, including the current share repurchase authorization, and in the context of its financial position and then existing conditions in the credit and capital markets. In recent years, the company has funded vessel additions with available cash, operating cash flow, and funds provided by the 2003 private placement of $300.0 million in senior unsecured notes, revolving credit facilities, and various leasing arrangements. The company has $470.3 million remaining capital commitments on the 31 vessels currently under construction and the five vessel purchase commitments at March 31, 2010.
General and Administrative Expenses
Consolidated general and administrative expenses and its related percentage of total revenues for the years ended March 31 consists of the following components:
| (In thousands) |
2010 | % | 2009 | % | 2008 | % | ||||||||||
| Personnel |
$ | 80,824 | 7 | % | 80,051 | 6 | % | 69,567 | 5 | % | ||||||
| Office and property |
19,326 | 2 | % | 19,452 | 1 | % | 16,910 | 1 | % | |||||||
| Sales and marketing |
7,553 | 1 | % | 8,226 | 1 | % | 7,389 | 1 | % | |||||||
| Professional services |
21,603 | 2 | % | 17,137 | 1 | % | 24,223 | 2 | % | |||||||
| Other |
20,626 | 2 | % | 11,362 | 1 | % | 8,500 | 1 | % | |||||||
| $ | 149,932 | 13 | % | 136,228 | 10 | % | 126,589 | 10 | % | |||||||
General and administrative expenses were higher by approximately $13.7 million, or 10%, during fiscal 2010 as compared to fiscal 2009, primarily due to a $3.6 million settlement loss related to the July 2009 supplemental retirement plan lump sum distributions, as disclosed in Note 5 of Notes to Consolidated Financial Statements, to higher legal costs associated with internal investigation matters along with an $11.4 million proposed settlement with the SEC regarding the internal investigation matter, and to the expropriation of the company’s Venezuelan assets as disclosed in Note 10 of Notes to Consolidated Financial Statements, partially offset by lower aviation costs.
General and administrative expenses during fiscal 2009 were approximately $9.6 million, or 8%, higher as compared to the fiscal 2008 due to higher personnel costs (resulting from the amortization of restricted stock and phantom stock awards granted during the last two fiscal years); costs associated with accelerating the vesting of restricted stock awards for one retiring senior executive; and higher salary and administrative benefit expenses. Higher personnel costs were slightly offset by lower professional service costs (primarily legal fees) related to the internal investigation. General and administrative expenses were also higher due to
-49-
Table of Contents
Index to Financial Statements
general cost increases related to a higher volume of business activity especially in the company’s international markets during fiscal 2009.
Liquidity, Capital Resources and Other Matters
The company’s current ratio, level of working capital and amount of cash flows from operations for any year are primarily related to fleet activity, vessel day rates and the timing of collections and disbursements. Vessel activity levels and vessel day rates are, among other things, dependent upon oil and natural gas production and ultimately the supply/demand relationship for crude oil and natural gas. Variations from year-to-year in these items are primarily the result of market conditions. Cash and cash equivalents, future net cash provided by operating activities and the company’s available line of credit provide the company, in management’s opinion, with adequate resources to meet its current liquidity requirements, including required payments on vessel construction currently in progress.
Debt
In July 2009, the company executed an amended and restated revolving credit agreement increasing its size to $450.0 million and extending its maturity to July 2012. Borrowings under the amended revolving credit facility bear interest at the company’s option at the greater of (i) prime or the federal funds rate plus 2.0 to 3.0%, or (ii) Eurodollar rates plus margins ranging from 3.0 to 4.0%, based on the company’s consolidated funded debt to total capitalization ratio. Commitment fees on the unused portion of this facility are in the range of 0.50 to 0.75% based on the company’s funded debt to total capitalization ratio. The amended facility provides for a maximum ratio of consolidated debt to consolidated total capitalization of 0.45 as compared to a maximum ratio of consolidated debt to total capitalization of 0.55 with the prior agreement. All other terms, including the financial and negative covenants, are customary for facilities of its type and consistent with the prior agreement in all material respects. There were no borrowings outstanding under the revolving credit agreement at March 31, 2010 and 2009, and the full $450.0 million was available at March 31, 2010.
At March 31, 2010, the company had $300.0 million outstanding of senior unsecured notes that were issued in July 2003. The multiple series of notes were originally issued with maturities ranging from seven years to 12 years and had a weighted average remaining life of 2.85 years as of March 31, 2010. These notes can be retired in whole or in part prior to maturity for a redemption price equal to the principal amount of the notes redeemed plus a make-whole premium. The weighted average interest rate on the notes is 4.35%. The terms of the notes provide for a maximum ratio of consolidated debt to total capitalization of 55%. The fair value of this debt at March 31, 2010 and 2009 was estimated to be $314.8 million and $289.4 million, respectively. The first note matures July 2010 in the amount of $25 million.
For additional disclosure regarding the company’s debt, refer to Note 4 of Notes to Consolidated Financial Statements included in Item 8 of this report.
Share Repurchases
In July 2009, the company’s Board of Directors authorized the company to spend up to $200.0 million to repurchase shares of its common stock in open-market or privately-negotiated transactions. The company announced on May 14, 2010 that its Board of Directors has extended this program. The company will use its available cash and, when considered advantageous, borrowings under its revolving credit facility, or other borrowings, to fund any share repurchases. The repurchase program was scheduled to expire on June 30, 2010, but has now been extended to expire on the earlier of the date that all authorized funds have been expended or June 30, 2011 unless extended by the Board of Directors. No amounts have been expended under the July 2009 authorized program through March 31, 2010, and at March 31, 2010, $200.0 million remained available to repurchase shares under the 2009 program until it expires. During fiscal 2010, the company did not repurchase shares of its common stock. The company will continue to evaluate share repurchase opportunities relative to other investment opportunities and in the context of current conditions in the credit and capital markets
The company’s Board of Directors had previously authorized the company in July 2008 to repurchase up to $200.0 million in shares of its common stock in open-market or privately-negotiated transactions. The Board of Directors’ authorization for this repurchase program expired on June 30, 2009. Given the credit markets
-50-
Table of Contents
Index to Financial Statements
volatility over the past year and a half, the company focused on preserving cash. As a result, no amounts were expended from inception of the July 2008 authorized program through its conclusion on June 30, 2009.
During fiscal 2009, the company expended $53.6 million to repurchase and cancel 915,900 common shares, or an average price paid per common share of $58.56 pursuant to a repurchase program authorized by the Board of Directors in July 2007.
During fiscal 2008, the company expended $310.0 million to repurchase and cancel 5,279,600 common shares, or an average price paid per common shares of $58.73. Of the 5,279,600 shares cancelled, 3,586,200 were pursuant to the July 2007 share repurchase program ($196.4 million, or $54.76 average price per share), while 1,693,400 were pursuant to the July 2006 share repurchase program ($113.7 million, or $67.13 average price per share).
Dividends
In May 2008, the company’s Board of Directors authorized the increase of the company’s quarterly dividend from $0.15 per share to $0.25 per share, a 67% increase. The declaration of dividends is at the discretion of the company’s Board of Directors.
The Board of Directors declared dividends of $51.7 million, $51.5 million, and $32.7 million, or $1.00, $1.00 and $0.60 per share, respectively, for the year ended March 31, 2010, 2009 and 2008, respectively.
Operating Activities
Net cash provided by operating activities for any period will fluctuate according to the level of business activity for the applicable period. Fiscal 2010 net cash from operating activities was $328.3 million. Significant components of cash provided by operating activities during fiscal 2010 include net earnings of $259.5 million, adjusted for non-cash items and gain on disposition of assets, net of $115.5 million and changes in working capital balances of $46.7 million.
Fiscal 2009 net cash from operating activities was $523.9 million. Significant components of cash provided by operating activities during fiscal 2009 include net earnings of $406.9 million, adjusted for non-cash items and gain on asset dispositions, net of $113.2 million and changes in working capital balances of $3.8 million.
Fiscal 2008 net cash from operating activities was $486.8 million. Significant components of cash provided by operating activities during fiscal 2008 include net earnings of $348.8 million, adjusted for non-cash items and gain on asset dispositions, net of $114.0 million and changes in working capital balances of $24.0 million.
Investing Activities
Investing activities in fiscal 2010 used $298.5 million of cash, which is attributed to $452.0 million of additions to properties and equipment, offset by approximately $153.5 million in proceeds received from the sales of assets (of which $101.8 million resulted from the sale and leaseback of six vessels). Additions to properties and equipment were comprised of approximately $25.6 million in capitalized major repair costs, $423.4 million for the construction, purchase and/or modification of offshore marine vessels and $3.0 million of other properties and equipment purchases.
Investing activities in fiscal 2009 used $434.1 million of cash, which is attributed to $473.7 million of additions to properties and equipment, offset by approximately $39.4 million in proceeds from the sales of assets. Additions to properties and equipment were comprised of approximately $61.2 million in capitalized major repair costs, $410.6 million for the construction of offshore marine vessels and $1.9 million of other properties and equipment purchases.
Investing activities in fiscal 2008 used $272.0 million, which is attributed to the $354.0 million additions to properties and equipment partially offset by approximately $82.0 million of proceeds from the sales of assets. Additions to properties and equipment were comprised of approximately $49.8 million in capitalized major repair costs, $285.8 million for the construction of offshore marine vessels, $5.0 million for vessel
-51-
Table of Contents
Index to Financial Statements
enhancements, $11.1 million for the construction of an aircraft and $2.3 million of other properties and equipment purchases.
Financing Activities
Fiscal 2010 financing activities used $57.5 million of cash, which is primarily the result of $51.7 million used for the payment of common stock dividends of $1.00 per common share and $7.7 million of debt issuance costs related to the company’s new revolving credit agreement. Uses of cash were slightly offset by $1.8 million of proceeds from the issuance of common stock resulting from stock option exercises and $0.1 million tax benefit on stock options exercised during the year.
Fiscal 2009 financing activities used $109.2 million of cash, which is primarily the result of $53.6 million used to repurchase the company’s common stock, $51.5 million used for the payment of common stock dividends of $1.00 per common share, $10.1 million of principal payments on capitalized lease obligations and $0.6 million tax liability on stock option exercises. Uses of cash were partially offset by $6.6 million of proceeds from the issuance of common stock resulting stock option exercises during the year.
Fiscal 2008 financing activities used $338.4 million of cash, which is primarily the result of $310.0 million used to repurchase the company’s common stock, $32.7 million used for the payment of common stock dividends of $0.60 per common share and $45.7 million of principal payments on capitalized lease obligations. Uses of cash were partially offset by $46.3 million of proceeds from the issuance of common stock resulting from stock option exercises and $3.7 million tax benefit on stock options exercised.
Interest and Debt Costs
The company capitalizes a portion of its interest costs incurred on borrowed funds used to construct vessels. Interest and debt costs incurred, net of interest capitalized for fiscal 2010, 2009 and 2008 was approximately $1.7 million, $0.7 million, and $7.0 million, respectively. Interest costs capitalized during fiscal 2010, 2009 and 2008 was approximately $15.6 million, $13.8 million, and $10.5 million, respectively.
Total interest and debt costs incurred during fiscal 2010 was higher than in fiscal 2009 due to higher commitment fees on the unused portion of the company’s amended and restated revolving credit agreement which increased from $300.0 million to $450.0 million in July 2009. Total interest and debt costs incurred in fiscal 2009 was lower than in fiscal 2008 because the relative-portion of interest cost capitalized during fiscal 2009 was higher than in fiscal 2008 due to a increase in the level of investment in the company’s new construction program.
Other Liquidity Matters
Vessel Construction. The company’s vessel construction program has been designed to replace over time the company’s older fleet of vessels with fewer, larger and more efficient vessels, while also opportunistically revamping the size and capabilities of the company’s fleet. The majority of the company’s older vessels, its supply and towing-supply vessels, were constructed between 1976 and 1983. As such, virtually all of this class exceeds 25 years of age and could require replacement within the next several years, depending on the strength of the market during this time frame. In addition to age, market conditions also help determine when a vessel is no longer economically viable. The company anticipates using future operating cash flows, existing borrowing capacity, new borrowings or lease arrangements to fund current and future commitments in connection with the fleet renewal and modernization program. The company continues to evaluate its fleet renewal program, whether through new construction or acquisitions, relative to other investment opportunities and uses of cash, including the current share repurchase authorization, and in the context of current conditions in the credit and capital markets.
At March 31, 2010, the company had approximately $223.1 million of cash and cash equivalents. In addition, at March 31, 2010, the entire amount of the company’s $450.0 million revolving credit facility was available for future financing needs.
The company has experienced occasional delays in the expected deliveries of equipment for vessels currently under construction (as has the offshore supply vessel industry in general). While the frequency of these equipment delays has abated, similar delays in the future are possible. Currently, the company is
-52-
Table of Contents
Index to Financial Statements
experiencing more pronounced delays in vessel construction progress at shipyards in Brazil (two crewboats vessels under construction) and India (one platform supply vessel under construction). The company continues to work diligently to ensure as timely delivery as possible of these vessels, but further delay is possible. The shipyard in India has previously completed and delivered three vessels for the company.
The company generally requires shipyards to provide third party credit support in the event that vessels are not ultimately completed and delivered. That third party credit support typically guarantees the return of amounts paid by the company, and generally takes the form of refundment guarantees issued by major financial institutions located in the country of the shipyard. While the company endeavors to reduce its shipyard credit risk by requiring these instruments, the ultimate return of amounts paid by the company in the event of shipyard default is still subject to the creditworthiness of the shipyard and the provider of the credit support, as well as the company’s ability to successfully pursue legal action to compel payment of these instruments. When third party credit support is not available or cost effective, the company endeavors to limit its credit risk through payment and other contract terms with the shipyard and other counterparties.
Certain of the company’s vessels under construction are committed to work under customer contracts that provide for the payment of liquidated damages by the company or its subsidiaries in certain cases of late delivery. Delays in the expected deliveries of any of these vessels could result in penalties being imposed by our customers. In the opinion of management, the amount of ultimate liability, if any, with respect to these penalties, will not have a material adverse effect on the company’s financial position, results of operations, or cash flows.
Merchant Navy Officers Pension Fund. Certain current and former subsidiaries of the company are, or have been, participating employers in an industry-wide multi-employer retirement fund in the United Kingdom, the Merchant Navy Officers Pension Fund (MNOPF). The company has been informed of a fund deficit that will require contributions from the participating employers. The amount and timing of the company’s share of the fund’s deficit will depend ultimately on a number of factors, including updated calculations of the total fund deficit, theories of contribution imposed as determined by and within the scope of the Trustee’s authority, the number of then participating solvent employers, and the final method used in allocating the required contribution among such participating employers. While there were no amounts expensed in fiscal years 2010 and 2008 related to this matter, the company recorded an additional liability of $1.2 million during fiscal 2009. As of March 31, 2010, $4.0 million remains payable to MNOPF based on current assessments, all of which has been fully accrued. In the future, the fund’s trustee will likely claim that the company owes additional amounts for various reasons, including negative fund investment returns in a depressed global market as reflected in a preliminary future actuarial valuation, and the inability of other assessed parties to contribute their share of respective allocations, failing which, the company and other solvent participating employers will be asked for additional contributions. The company anticipates receiving a final evaluation from actuaries during the second quarter of fiscal 2011.
Supplemental Retirement Plan. Effective December 10, 2008, the supplemental plan was amended to allow participants the option to elect a lump sum benefit in lieu of other payment options currently provided by the plan. As a result of the amendment, certain participants received lump sum distributions in July 2009 in settlement of the supplemental plan obligation. The aggregate payment to those participants electing the lump sum distribution in July 2009 was $8.7 million. A settlement loss of $3.6 million was recorded during the second quarter of fiscal 2010.
Included in other assets at March 31, 2010, is $16.1 million of investments held in a Rabbi Trust for the benefit of participants in the supplemental plan. The trust assets are recorded at fair value as of March 31, 2010, with unrealized gains or losses included in other comprehensive income. The carrying value of the trust assets at March 31, 2010 is after the effect of $0.8 million of after-tax unrealized losses ($1.3 million pre-tax), which are included in accumulated other comprehensive income (other stockholders’ equity). To the extent that trust assets are liquidated to fund benefit payments, gains or losses, if any, will be recognized at that time.
Venezuelan Operations. The company has previously reported that in May 2009 the Venezuelan National Assembly enacted a law (the Reserve Law) whereby the Bolivarian Republic of Venezuela (the Republic) reserved to itself assets and services related to maritime activities on Lake Maracaibo. The company has also previously reported that in May 2009, Petróleos de Venezuela, S.A. (PDVSA), the Venezuelan national oil company, invoking the Reserve Law, took possession of (a) 11 of the company’s vessels that were then
-53-
Table of Contents
Index to Financial Statements
supporting PDVSA operations in the Lake Maracaibo region, (b) the company’s shore-based facility adjacent to Lake Maracaibo and (c) certain other related assets. The company has also previously reported that in July 2009, Petrosucre, S.A. (Petrosucre), a subsidiary of PDVSA, took control of four additional company vessels. As a consequence of these measures, the company (i) no longer has possession or control of those assets, (ii) no longer operates them or provides support for their operations, and (iii) no longer has any other vessels or operations in Venezuela.
As a result of the May 2009 seizure of the 11 vessels and other assets discussed above, the company recorded a charge of $3.75 million ($2.9 million after tax, or $0.06 per common share), during the quarter ended June 30, 2009, to write off the net book value of the assets seized. As a result of the July 2009 vessel seizures, the company recorded a charge of $0.5 million ($0.4 million after tax, or $0.01 per common share) during the quarter ended September 30, 2009, to write off the net book value of those assets. Both of these charges are included in the provision for Venezuelan operations in the accompanying consolidated statement of earnings.
As a result of the asset seizures referred to above, the lack of further operations in Venezuela, and the continuing uncertainty about the timing and amount of the compensation that the company may collect in the future (including compensation for the taking of the accounts receivable payable by PDVSA and Petrosucre), the company recorded a $44.8 million ($44.8 million after tax, or $0.87 per common share) provision during the quarter ended June 30, 2009, to fully reserve accounts receivable payable by PDVSA and Petrosucre.
As the company has previously reported on Form 8-K, on February 16, 2010, the company filed with the International Centre for Settlement of Investment Disputes (ICSID) a Request for Arbitration against the Republic of Venezuela seeking compensation for the expropriation of the company’s Venezuelan investments. That request has been registered by ICSID and the company continues diligently to prosecute the arbitration. While the company believes, based on consultations with its advisors, that it is entitled to full reparation for the losses suffered as a result of the actions taken by the Republic, there can be no assurances that the company will prevail in the arbitration.
On March 31, 2010, the company entered into a Settlement and Release with its marine underwriters to resolve the claim the company had made under its marine insurance policy for the total loss of the 15 vessels seized by the Republic. Under the Settlement and Release, the underwriters paid, subject to certain conditions, $8.2 million (the Settlement Payment) in full and final settlement of the claim. Those conditions include, among others, that the company must continue to prosecute the ICSID arbitration and must reimburse the underwriters the Settlement Payment (less certain expenses) if and when the company receives payment from the Republic. Under the Settlement and Release, the company continues to retain legal title to the claims in arbitration and the underwriters have waived any and all subrogation rights. The Settlement Payment does not represent full reparation of the losses suffered by the company as a consequence of the expropriation of its investments in Venezuela. The $8.2 million payment by the underwriters triggered an obligation by the company under the company’s insurance program to pay an additional $2.8 million in insurance premium to its underwriters and the company has paid that amount. Both the $8.2 million payment from the underwriters and the $2.8 million payment to the underwriters were made in fiscal 2011.
Legal Proceedings. Various legal proceedings and claims are outstanding which arose in the ordinary course of business. In management’s opinion, the amount of ultimate liability, if any, with respect to these actions will not have a material adverse effect on the company’s financial position, results of operations, or cash flows. Information related to various commitments and contingencies, including legal proceedings, is disclosed in Note 10 of Notes to Consolidated Financial Statements included in Item 8 of this report.
Internal Investigation
For a full discussion on the company’s internal investigation into certain FCPA matters on its Nigerian and selected other countries operations, refer to Item 3 of this report.
-54-
Table of Contents
Index to Financial Statements
Contractual Obligations and Contingent Commitments
Contractual Obligations
The following table summarizes the company’s consolidated contractual obligations as of March 31, 2010 and the effect such obligations, inclusive of interest costs, are expected to have on the company’s liquidity and cash flows in future periods.
| (In thousands) |
Payments Due by Fiscal Year | ||||||||||||||
| Total | 2011 | 2012 | 2013 | 2014 | 2015 | More Than 5 Years | |||||||||
| Principal payments on long-term debt |
$ | 300,000 | 25,000 | 40,000 | 60,000 | 140,000 | — | 35,000 | |||||||
| Interest payments on long-term debt |
37,904 | 12,405 | 10,970 | 8,692 | 3,686 | 1,613 | 538 | ||||||||
| Uncertain tax positions (A) |
16,119 | 1,580 | 1,951 | 6,933 | 2,544 | 2,650 | 461 | ||||||||
| Operating leases |
10,028 | 4,911 | 3,159 | 1,628 | 205 | 125 | — | ||||||||
| Bareboat charter leases |
80,871 | 17,626 | 17,626 | 17,627 | 17,609 | 10,383 | — | ||||||||
| Purchase obligations |
60,606 | 60,606 | — | — | — | — | — | ||||||||
| Vessel construction obligations |
409,864 | 273,250 | 135,362 | 1,252 | — | — | — | ||||||||
| Pension and post-retirement obligations |
77,911 | 5,991 | 6,499 | 6,943 | 7,597 | 7,977 | 42,904 | ||||||||
| Total obligations |
$ | 993,303 | 401,369 | 215,567 | 103,075 | 171,641 | 22,748 | 78,903 | |||||||
| (A) | These amounts represent the liability for unrecognized tax benefits under FIN 48. |
Letters of Credit and Surety Bonds
In the ordinary course of business, the company had other commitments that the company is contractually obligated to fulfill with cash should the obligations be called. These obligations include standby letters of credit and surety bonds that guarantee our performance as it relates to our vessel contracts, insurance, customs and other obligations in various jurisdictions. While these obligations are not normally called, the obligation could be called by the beneficiaries at any time before the expiration date should the company breach certain contractual and/or performance or payment obligation. As of March 31, 2010, the company had $52.1 million of outstanding standby letters of credit and surety bonds. The obligations that are the subject of these surety bonds and standby letters of credit are geographically concentrated in Nigeria and Mexico.
Off-Balance Sheet Arrangements
Fiscal 2010 Sale/Leaseback
In June 2009, the company sold five vessels to four unrelated third-party companies, and simultaneously entered into bareboat charter agreements with the respective companies. In July 2009, the company sold an additional vessel to an unrelated third-party company, and simultaneously entered into bareboat charter agreements with the respective company.
The sale/leaseback transactions resulted in proceeds of approximately $101.8 million and a deferred gain of $39.6 million. The carrying value of the six vessels was $62.2 million at the dates of sale. The leases on the five vessels sold in June 2009 will expire on June 30, 2014, and the lease on the vessel sold in July 2009 will expire on July 30, 2014. The company is accounting for the transactions as sale/leaseback transactions with operating lease treatment and will expense periodic lease payments over the five year charter hire operating lease terms.
Under the sale/leaseback agreements, the company has the option to purchase the six vessels at 75% of the original sales price or cause the owners to sell the vessels whereby the company guarantees approximately 84% of the original lease value to the third-party companies. The company may repurchase the vessels prior to the end of the charter term with penalties of up to 5% assessed if purchased in years
-55-
Table of Contents
Index to Financial Statements
one and two of the five year lease. The company will recognize the deferred gain as income if it does not exercise its option to purchase the six vessels at the end of the operating lease term. If the company exercises its option to purchase these vessels, the deferred gain will reduce the vessel’s stated cost after exercising the purchase option.
Fiscal 2006 Sale/Leaseback
In March 2006, the company entered into agreements to sell five of its vessels that were under construction at the time to Banc of America Leasing & Capital LLC (BOAL&C), an unrelated third party, for $76.5 million and simultaneously enter into bareboat charter agreements with BOAL&C upon the vessels’ delivery to the market. Construction on these five vessels was completed at various times between March 2006 and March 2008, at which time the company sold the respective vessels and simultaneously entered into bareboat charter agreements.
The company accounted for all five transactions as sale/leaseback transactions with operating lease treatment. Accordingly, the company did not record the assets on its books and the company is expensing periodic lease payments.
The bareboat charter agreements on the first two vessels expire in calendar year 2014 unless extended. The company has the option to extend the respective bareboat charter agreements three times, each for a period of 12 months, which would provide the company the opportunity to extend the operating leases through calendar year 2017. The bareboat charter agreements on the third and fourth vessels expire in 2015 and the company has the option to extend the bareboat charter agreements three times, each for a period of 12 months, which would provide the company the opportunity to extend the operating leases through calendar year 2018. The bareboat charter agreements on the fifth vessel expires in 2016 and the company has the option to extend the bareboat charter agreements three times, each for a period of 12 months, which would provide the company the opportunity to extend the operating leases through calendar year 2019. At the end of the basic term (or extended option periods), the company has an option to purchase each of the vessels at its then fair market value or to redeliver the vessel to its owner. The company may also purchase each of the vessels at their fixed amortized values, as outlined in the bareboat charter agreements, at the end of the fifth year, and again at the end of the seventh year, from the commencement dates of the respective charter agreements.
Future Minimum Lease Payments
As of March 31, 2010, the future minimum lease payments for the vessels under the operating lease terms are as follows:
| Fiscal year ending (In thousands) |
Fiscal 2010 Sale/Leaseback |
Fiscal 2006 Sale/Leaseback |
Total | ||||
| 2011 |
$ | 10,702 | 6,924 | 17,626 | |||
| 2012 |
10,702 | 6,924 | 17,626 | ||||
| 2013 |
10,703 | 6,924 | 17,627 | ||||
| 2014 |
10,703 | 6,906 | 17,609 | ||||
| 2015 |
2,836 | 7,547 | 10,383 | ||||
| Thereafter |
— | — | — | ||||
| Total future lease payments |
$ | 45,646 | 35,225 | 80,871 | |||
The company expensed approximately $15.1 million, $7.0 million, and $4.7 million on these bareboat charter arrangements during fiscal 2010, 2009 and 2008, respectively. For more disclosure on the company’s sale-leaseback arrangement refer to Note 9 of Notes to Consolidated Financial Statements included in Item 8 of this report.
Application of Critical Accounting Policies and Estimates
The preparation of our consolidated financial statements in accordance with accounting principles generally accepted in the United States of America requires management to make estimates and assumptions that affect the recorded amounts of assets and liabilities and disclosure of an contingent assets and liabilities at the date of the financial statements and the revenues recognized and expenses incurred during the reporting period. The company evaluates the reasonableness of these estimates and assumptions
-56-
Table of Contents
Index to Financial Statements
continually based on a combination of historical information and other information that comes to its attention that may vary its outlook for the future. Actual results may differ from these estimates under different assumptions.
Management suggests that the company’s Nature of Operations and Summary of Significant Accounting Policies, as described in Note 1 of Notes to Consolidated Financial Statements included in Item 8 of this report, be read in conjunction with this Management’s Discussion and Analysis of Financial Condition and Results of Operations. The company believes the following critical accounting policies affect our more significant judgments and estimates used in the preparation of the company’s consolidated financial statements are described below.
Revenue Recognition
The company’s primary source of revenue is derived from time charter contracts of its vessels on a rate per day of service basis; therefore, vessel revenues are recognized on a daily basis throughout the contract period. These time charter contracts are generally either on a term basis (average three months to two years) or on a “spot” basis. The base rate of hire for a term contract is generally a fixed rate, provided, however, that term contracts at times include escalation clauses to recover increases in specific costs. A spot contract is a short-term agreement to provide offshore marine services to a customer for a specific short-term job. Spot contract terms generally range from one day to three months. Vessel revenues are recognized on a daily basis throughout the contract period. There are no material differences in the costs structure of the company’s contracts based on whether the contracts are spot or term, for the operating costs are generally the same without regard to the length of a contract.
Receivables
In the normal course of business, the company extends credit to its customers on a short-term basis. The company’s principal customers are major oil and natural gas exploration, field development and production companies. The company routinely reviews and evaluates its accounts receivable balances for collectability. When the company becomes aware of any uncollectible receivables, provisions for doubtful accounts is estimated and recorded, which reduces the company’s receivable balance. The company believes its provisions for doubtful accounts to be adequate. During fiscal 2010, the company recorded a $44.8 million provision to fully reserve accounts receivable payable by two of the company’s customers located in Venezuela. Please refer to Note 10 of Notes to Consolidated Financial Statements included in Item 8 of this report for a detailed discussion regarding the company’s Venezuelan operations.
Goodwill
The company tests goodwill for impairment annually at a reporting unit level, as required, utilizing carrying amounts as of December 31. The company considers its reporting units to be its International and United States operations. The estimated fair value of the reporting unit is determined by discounting the projected future operating cash flows for the remaining average useful life of the assets within the reporting units by the company’s estimated weighted average cost of capital. Impairment is deemed to exist if the implied fair value of the reporting unit goodwill is less than the respective book value of the reporting unit goodwill, and in such case, an impairment loss would be recognized equal to the difference. There are many assumptions and estimates underlying the determination of the fair value of each reporting unit, such as, future expected utilization and average day rates for the vessels, vessel additions and attrition, operating expenses and tax rates. Although the company believes its assumptions and estimates are reasonable, deviations from the assumptions and estimates could produce a materially different result.
The company performed its annual impairment test as of December 31, 2009, and the test determined there was no goodwill impairment. At March 31, 2010, the company’s goodwill balance represented 10% of total assets and 13% of stockholders’ equity. Interim testing will be performed if events occur or circumstances indicate that the carrying amount of goodwill may be impaired. Examples of events or circumstances that might give rise to interim goodwill impairment testing include prolonged adverse industry or economic changes; significant business interruption due to political unrest or terrorism; unanticipated competition that has the potential to dramatically reduce the company’s earning potential; legal issues; or the loss of key personnel.
-57-
Table of Contents
Index to Financial Statements
Impairment of Long-Lived Assets
The company reviews long-lived assets for impairment whenever events occur or changes in circumstances indicate that the carrying amount of an asset group may not be recoverable. In such evaluation, the estimated future undiscounted cash flows generated by an asset group are compared with the carrying amount of the asset group to determine if a write-down may be required. The company estimates cash flows based upon historical data adjusted for the company’s best estimate of future market performance that is based on industry trends. If impairment exists, the carrying value of the asset group is reduced to its estimated fair value. Vessels with similar operating and marketing characteristics are grouped for asset impairment testing.
Although the company believes its assumptions and estimates are reasonable, deviations from the assumptions and estimates could produce materially different results. Management estimates may vary considerably from actual outcomes due to future adverse market conditions or poor operating results that could result in the inability to recover the current carrying value of an asset group, thereby possibly requiring an impairment charge in the future. As the company’s fleet continues to age, management closely monitors the estimates and assumptions used in the impairment analysis to properly identify evolving trends and changes in market conditions that could impact the results of the impairment evaluation.
In addition to the periodic review of long-lived assets for impairment when circumstances warrant, the company also performs a review of its stacked vessels and vessels withdrawn from service every six months. This review considers items such as the vessel’s age, length of time stacked and likelihood of a return to active service, among others. The company records an impairment charge when the carrying value of a vessel withdrawn from service or stacked vessel that is unlikely to return to service exceeds its estimated fair value. The company recorded $3.1 million and $1.4 million impairment during fiscal 2010 and 2009, respectively, which was included in gain on disposition of assets, net. No impairment was recorded in fiscal 2008.
Income Taxes
The company determines its effective tax rate by estimating its permanent differences resulting from differing treatment of items for tax and accounting purposes. The company is periodically audited by taxing authorities in the United States and by the respective tax agencies in the countries in which it operates internationally. The tax audits generally include questions regarding the calculation of taxable income. Audit adjustments affecting permanent differences could have an impact on the company’s effective tax rate.
The carrying value of the company’s net deferred tax assets is based on the company’s present belief that it is more likely than not that it will be able to generate sufficient future taxable income in certain tax jurisdictions to utilize such deferred tax assets, based on estimates and assumptions. If these estimates and related assumptions change in the future, the company may be required to record or adjust valuation allowances against its deferred tax assets resulting in additional income tax expense in the company’s consolidated statement of operations. Management evaluates the realizability of the deferred tax assets and assesses the need for changes to valuation allowances on a quarterly basis. While the company has considered future taxable income and ongoing prudent and feasible tax planning strategies in assessing the present need for a valuation allowance, in the event the company were to determine that it would be able to realize its deferred tax assets in the future in excess of its net recorded amount, an adjustment to the valuation allowance would increase income in the period such determination was made. Should the company determine that it would not be able to realize all or part of its net deferred tax asset in the future, an adjustment to the deferred tax asset would be charged to income in the period such determination was made.
Drydocking Costs
The company expenses maintenance and repair costs as incurred during the asset’s original estimated useful life (its original depreciable life). Major repair costs incurred after the original depreciable life that also have the effect of extending the useful life of the asset are capitalized and amortized over 30 months. Major vessel modifications are capitalized and amortized over the remaining life of the equipment. Vessel modifications that are performed for a specific customer contract are capitalized and amortized over the firm contract term. The majority of the company’s vessels require a drydocking inspection twice in each five year
-58-
Table of Contents
Index to Financial Statements
period, and the company schedules these drydockings when it is anticipated that the work can be performed. The company’s net earnings can fluctuate quarter to quarter due to the timing of scheduled drydockings.
Accrued Property and Liability Losses
The company self-insures a portion of potential hull damage and personal injury claims that may arise in the normal course of business. The company is exposed to insurance risks related to the company’s reinsurance contracts with various insurance entities. The reinsurance recoverable amount can vary depending on the size of a loss. The exact amount of the reinsurance recoverable is not known until all losses are settled. The company estimates the reinsurance recoverable amount it expects to receive and also estimates losses for claims that have occurred but have not been reported or not fully developed. The company also monitors its reinsurance recoverable balances regularly for possible reinsurance exposure and makes adequate provisions for doubtful reinsurance receivables. It is the company’s opinion that its accounts and reinsurance receivables have no impairment other than that for which provisions have been made.
Pension and Other Postretirement Benefits
The company sponsors a defined benefit pension plan and a supplemental executive retirement plan covering eligible employees of Tidewater Inc. and participating subsidiaries. The accounting for these plans is subject to guidance regarding employers’ accounting for pensions and employers’ accounting for postretirement benefits other than pensions. Net periodic pension costs and accumulated benefit obligations are determined using a number of assumptions including the discount rates used to measure future obligations and expenses, the rate of compensation increases, retirement ages, mortality rates and expected long-term return on plan assets, health care cost trends, and other assumptions, all of which have a significant impact on the amounts reported. The company’s pension cost consists of service costs, interest costs, expected returns on plan assets, amortization of prior service costs or benefits and, in part, on a market-related valuation of assets. The company considers a number of factors in developing its pension assumptions, including an evaluation of relevant discount rates, expected long-term returns on plan assets, plan asset allocations, expected changes in wages and retirement benefits, analyses of current market conditions and input from actuaries and other consultants.
The company also sponsors a post retirement plan that provides limited health care and life insurance benefits to qualified retired employees. Costs of the program are based on actuarially determined amounts and are accrued over the period from the date of hire to the full eligibility date of employees who are expected to qualify for these benefits. This plan is not funded.
New Accounting Pronouncements
For information regarding the effect of new accounting pronouncements, refer to Note 1 of Notes to Consolidated Financial Statements included in Item 8 of this report.
Effects of Inflation
Day-to-day operating costs are generally affected by inflation. However, because the energy services industry requires specialized goods and services, general economic inflationary trends may not affect the company’s operating costs. The major impact on operating costs is the level of offshore exploration, field development and production spending by energy exploration and production companies. As spending increases, prices of goods and services used by the energy industry and the energy services industry will increase. Future increases in vessel day rates may shield the company from the inflationary effects on operating costs.
The company’s newer technically sophisticated anchor handling towing supply vessels and platform supply vessels generally require a greater number of specially trained fleet personnel than the company’s older smaller vessels. Competition for skilled crews may intensify, particularly in international markets, as new build vessels currently under construction enter the global fleet. If competition for personnel intensifies, the market for experienced crews could exert upward pressure on wages, which would likely increase the company’s crew costs.
-59-
Table of Contents
Index to Financial Statements
Strong fundamentals in the global energy industry experienced in the past few years have also increased the activity levels at shipyards worldwide, and until the recent global recession, the price of steel had increased dramatically due to increased worldwide demand for the metal. The price of steel is high by historical standards. Although prices have recently eased with the reduced global demand of all commodities, availability of iron ore, the main component of steel, is tighter today than in 2005 when prices for iron ore increased dramatically. If the price of steel rises, the cost of new vessels will result in higher capital expenditures and depreciation expenses which will reduce the company’s future operating profits, unless day rates increase commensurately. During calendar year 2009, steel market participants announced that they would reduce steel output in an effort to stabilize steel prices. The stabilization of steel prices will depend upon many factors that will ultimately relate to worldwide demand for the product.
Environmental Compliance
During the ordinary course of business, the company’s operations are subject to a wide variety of environmental laws and regulations that govern the discharge of oil and pollutants into navigable waters. Violations of these laws may result in civil and criminal penalties, fines, injunction and other sanctions. Compliance with the existing governmental regulations that have been enacted or adopted regulating the discharge of materials into the environment, or otherwise relating to the protection of the environment has not had, nor is expected to have, a material effect on the company. However, environmental laws and regulations are subject to change and may impose increasingly strict requirements and, as such, the company cannot estimate the ultimate cost of complying with such laws and regulations.
Further, the company is involved in various legal proceedings that relate to asbestos and other environmental matters. In the opinion of management, based on current information, the amount of ultimate liability, if any, with respect to these proceedings is not expected to have a material adverse effect on the company’s financial position, results of operations, or cash flows. The company is proactive in establishing policies and operating procedures for safeguarding the environment against any hazardous materials aboard its vessels and at shore base locations. Whenever possible, hazardous materials are maintained or transferred in confined areas in an attempt to ensure containment if accidents occur. In addition, the company has established operating policies that are intended to increase awareness of actions that may harm the environment.
ITEM 7A. QUANTITATIVE AND QUALITATIVE DISCLOSURES ABOUT MARKET RISK
Market risk refers to the potential losses arising from changes in interest rates, foreign currency fluctuations and exchange rates, equity prices and commodity prices including the correlation among these factors and their volatility. The company is primarily exposed to interest rate risk and foreign currency fluctuations and exchange risk. The company enters into derivative instruments only to the extent considered necessary to meet its risk management objectives and does not use derivative contracts for speculative purposes.
Interest Rate Risk
Changes in interest rates may result in changes in the fair market value of the company’s financial instruments, interest income and interest expense. The company’s financial instruments that are exposed to interest rate risk are its cash equivalents and long-term borrowings. Due to the short duration and conservative nature of the cash equivalent investment portfolio, the company does not expect any material loss with respect to its investments. The book value for cash equivalents is considered to be representative of its fair value.
At March 31, 2010, the company had $300.0 million outstanding of senior unsecured notes that were issued in July 2003. The multiple series of notes were originally issued with maturities ranging from seven years to 12 years and had a weighted average remaining life of 2.85 years as of March 31, 2010. These notes can be retired in whole or in part prior to maturity for a redemption price equal to the principal amount of the notes redeemed plus a make-whole premium. The weighted average interest rate on the notes is 4.35%. The terms of the notes provide for a maximum ratio of consolidated debt to total capitalization of 55%. The fair value of this debt at March 31, 2010 was estimated to be $314.8 million. Because the debt outstanding at March 31, 2010 bears interest at fixed rates, interest expense would not be impacted by changes in market interest rates. A 100 basis-point increase in market interest rates would result in a decrease in the estimated fair value of this debt at March 31, 2010 of approximately $8.2 million. A 100 basis-point decrease
-60-
Table of Contents
Index to Financial Statements
in market interest rates would result in an increase in the estimated fair value of this debt at March 31, 2010 of approximately $8.5 million.
In July 2009, the company executed an amended and restated revolving credit agreement increasing its size to $450.0 million and extending its maturity to July 2012. Borrowings under the amended revolving credit facility bear interest at the company’s option at the greater of (i) prime or the federal funds rate plus 2.0 to 3.0%, or (ii) Eurodollar rates plus margins ranging from 3.0 to 4.0%, based on the company’s consolidated funded debt to total capitalization ratio. Commitment fees on the unused portion of this facility are in the range of 0.50 to 0.75% based on the company’s funded debt to total capitalization ratio. The amended facility provides for a maximum ratio of consolidated debt to consolidated total capitalization of 0.45 as compared to a maximum ratio of consolidated debt to total capitalization of 0.55 with the prior agreement. All other terms, including the financial and negative covenants, are customary for facilities of its type and consistent with the prior agreement in all material respects. There were no borrowings outstanding under the amended and restated revolving credit agreement at March 31, 2010, and the full $450.0 million was available at March 31, 2010 for future financing needs.
Foreign Exchange Risk
The company’s financial instruments that can be affected by foreign currency fluctuations and exchange risks consist primarily of cash and cash equivalents, trade receivables and trade payables denominated in currencies other than the U.S. dollar. The company periodically enters into spot and forward derivative financial instruments as a hedge against foreign currency denominated assets and liabilities, currency commitments, or to lock in desired interest rates. Spot derivative financial instruments are short-term in nature and settle within two business days. The fair value approximates the carrying value due to the short-term nature of this instrument, and as a result, no gains or losses are recognized. Forward derivative financial instruments are generally longer-term in nature but generally do not exceed one year. The accounting for gains or losses on forward contracts is dependent on the nature of the risk being hedged and the effectiveness of the hedge.
The company had 10 foreign exchange spot contracts outstanding at March 31, 2010, which totaled $4.7 million. All 10 spot contracts settled by April 6, 2010. The company had no spot derivative financial instruments outstanding at March 31, 2009.
The company had no forward contracts outstanding at March 31, 2010 or March 31, 2009. At March 31, 2008 the company had one Singapore dollar and six Euro forward contracts outstanding. The Singapore dollar forward contract hedged the company’s foreign exchange exposure related to the final payment of a capital lease obligation, which totaled $12.0 million. The company was required, per the lease obligation, to make its remaining commitment, which totaled a U.S. dollar equivalent of approximately $11.3 million, in Singapore dollars. The six outstanding Euro forward contracts, which totaled $2.5 million, hedged the company’s foreign exchange exposure related to the construction of two crewboats. The construction commitment totaled a U.S. dollar equivalent of approximately $3.4 million. The combined change in fair value of these seven forward contracts was approximately $0.2 million at March 31, 2008, and was recorded as an increase to earnings during fiscal 2008 because the forward contracts did not qualify as hedge instruments.
Due to the company’s international operations, the company is exposed to foreign currency exchange rate fluctuations and exchange rate risks on all charter hire contracts denominated in foreign currencies. The company generally does not hedge against any foreign currency rate fluctuations associated with foreign currency contracts that arise in the normal course of business. To minimize the financial impact of these items the company attempts to contract a significant majority of its services in U.S. dollars. The company continually monitors the currency exchange risks associated with all contracts not denominated in U.S. dollars. In addition, where possible, the company attempts to minimize its financial impact of these risks, by matching the currency of the company’s operating costs with the currency of the revenue streams. Discussions related to the company’s currency risk associated with receivables generated by the Venezuelan operations are disclosed in the “Liquidity, Capital Resources and Other Matters” section of this report and in Note 10 of Notes to Consolidated Financial Statements included in Item 8 of this report.
-61-
Table of Contents
Index to Financial Statements
Devaluation of Venezuelan Bolivar Fuerte
The company accounts for its operations in Venezuela using the U.S. dollar as its functional currency. In January 2010, the Venezuelan government announced a devaluation of the Venezuelan bolivar fuerte which modified the official fixed rate from 2.15 Venezuelan bolivar fuerte per U.S. dollar to 4.3 bolivar fuertes per U.S. dollar. In connection with the revaluation of its Venezuelan bolivar fuerte denominated net liability position, the company recorded an $11.0 million foreign exchange gain in its fiscal 2010 fourth quarter.
For additional disclosure on the company’s currency exchange risk, including a discussion on the company’s Venezuelan operations, refer to Note 10 of Notes to Consolidated Financial Statements included in Item 8 of this report. For additional disclosure on the company’s derivative financial instruments refer to Note 11 of Notes to Consolidated Financial Statements included in Item 8 of this report.
ITEM 8. FINANCIAL STATEMENTS AND SUPPLEMENTARY DATA
The information required by this Item is included in Part IV of this report.
ITEM 9. CHANGES IN AND DISAGREEMENTS WITH ACCOUNTANTS ON ACCOUNTING AND FINANCIAL DISCLOSURE
None.
ITEM 9A. CONTROLS AND PROCEDURES
Evaluation of Disclosure Controls and Procedures
Disclosure controls and procedures are designed with the objective of ensuring that all information required to be disclosed in our reports filed under the Securities Exchange Act of 1934 (“Exchange Act”), such as this report, is recorded, processed, summarized and reported within the time periods specified in the Securities and Exchange Commission rules. Disclosure controls and procedures include, without limitation, controls and procedures designed to ensure that information required to be disclosed by an issuer in the reports that it files or submits under the Exchange Act is accumulated and communicated to the issuer’s management, including its chief executive and chief financial officers, or person performing similar functions, as appropriate to allow timely decisions regarding required disclosure. However, any control system, no matter how well conceived and followed, can provide only reasonable, and not absolute, assurance that the objectives of the control system are met.
The company evaluated, under the supervision and with the participation of the company’s management, including the company’s Chairman of the Board, President and Chief Executive Officer and Chief Financial Officer, the effectiveness of the design and operation of the company’s disclosure controls and procedures (as defined in Rule 13a-15(e) and 15d-15(e) under the Securities Exchange Act of 1934, as amended (the “Exchange Act”)) as of the end of the period covered by this report. Based on that evaluation, the company’s Chairman of the Board, President and Chief Executive Officer along with the company’s Chief Financial Officer concluded that the company’s disclosure controls and procedures are effective in timely alerting them to material information relating to the company (including its consolidated subsidiaries) required to be disclosed in the reports the company files and submits under the Exchange Act.
Management’s Annual Report on Internal Control Over Financial Reporting
Management’s assessment of the effectiveness of the company’s internal control over financial reporting is discussed in “Management’s Report on Internal Control Over Financial Reporting” which is included in Item 15. “Exhibits, Financial Statement Schedules” to this Annual Report on Form 10-K and appears on page F-2.
-62-
Table of Contents
Index to Financial Statements
Audit Report of Deloitte & Touche LLP
Our independent registered public accounting firm has issued an audit report on the company’s internal control over financial reporting. This report is also included in Item 15. “Exhibits, Financial Statement Schedules” to this Annual Report on Form 10-K and appears on page F-3.
Changes in Internal Control Over Financial Reporting
There was no change in the company’s internal control over financial reporting that occurred during the quarter ended March 31, 2010 that has materially affected, or is reasonably likely to materially affect, the company’s internal control over financial reporting.
None.
-63-
Table of Contents
Index to Financial Statements
ITEM 10. DIRECTORS, EXECUTIVE OFFICERS AND CORPORATE GOVERNANCE
Information required by this item is incorporated herein by reference to the 2010 Proxy Statement, which will be filed with the SEC not later than 120 days subsequent to March 31, 2010.
ITEM 11. EXECUTIVE COMPENSATION
Information required by this item is incorporated herein by reference to the 2010 Proxy Statement, which will be filed with the SEC not later than 120 days subsequent to March 31, 2010.
ITEM 12. SECURITY OWNERSHIP OF CERTAIN BENEFICIAL OWNERS AND MANAGEMENT AND RELATED STOCKHOLDER MATTERS
Information required by this item is incorporated herein by reference to the 2010 Proxy Statement, which will be filed with the SEC not later than 120 days subsequent to March 31, 2010.
Securities Authorized for Issuance under Equity Compensation Plans
The following table provides information as of March 31, 2010 about equity compensation plans of the company under which shares of common stock of the company are authorized for issuance:
| Plan category |
Number of securities to be issued upon exercise of outstanding options, warrants and rights (A) |
Weighted-average exercise price of outstanding options, warrants and rights (B) |
Number of securities remaining available for future issuance under equity compensation plans (excluding securities reflected in column (A) (C) |
||||||
| Equity compensation plans approved by shareholders |
2,192,267 | $ | 43.94 | 1,583,534 | (1) | ||||
| Equity compensation plans not approved by shareholders |
— | — | — | ||||||
| Balance at March 31, 2010 |
2,192,267 | (2) | $ | 43.94 | 1,583,534 | ||||
| (1) | As of March 31, 2010, all of such remaining shares are issuable as stock options or restricted stock or other stock-based awards under the company’s 2009 Stock Incentive Plan. |
| (2) | If the exercise of these outstanding options and issuance of additional common shares had occurred as of March 31, 2010, these shares would represent 4.1% of the then total outstanding common shares of the company. |
ITEM 13. CERTAIN RELATIONSHIPS AND RELATED TRANSACTIONS, AND DIRECTOR INDEPENDENCE
Information required by this item is incorporated herein by reference to the 2010 Proxy Statement, which will be filed with the SEC not later than 120 days subsequent to March 31, 2010.
ITEM 14. PRINCIPAL ACCOUNTING FEES AND SERVICES
Information required by this item is incorporated herein by reference to the 2010 Proxy Statement, which will be filed with the SEC not later than 120 days subsequent to March 31, 2010.
-64-
Table of Contents
Index to Financial Statements
ITEM 15. EXHIBITS, FINANCIAL STATEMENT SCHEDULES
| (a) | The following documents are filed as part of this report: |
(1) Financial Statements
A list of the consolidated financial statements of the company filed as a part of this report is set forth in Part II, Item 8 beginning on page F-1 of this report and is incorporated herein by reference.
(2) Financial Statement Schedules
The financial statement schedule included in Part II, Item 8 of this document is filed as part of this report which begins on page F-1. All other schedules are omitted as the required information is inapplicable or the information is included in the consolidated financial statements or related notes.
(3) Exhibits
The index below describes each exhibit filed as a part of this report. Exhibits not incorporated by reference to a prior filing are designated by an asterisk; all exhibits not so designated are incorporated herein by reference to a prior filing as indicated.
| 3.1 |
Restated Certificate of Incorporation of Tidewater Inc. (filed with the Commission as Exhibit 3(a) to the company’s quarterly report on Form 10-Q for the quarter ended September 30, 1993, File No. 1-6311). | |
| 3.2 |
Tidewater Inc. Amended and Restated Bylaws dated January 14, 2010 (filed with the Commission as Exhibit 3.2 to the company’s current report on Form 8-K on January 20, 2010, File No. 1-6311). | |
| 10.1 |
Second Amended and Restated Revolving Credit Agreement dated as of July 24, 2009 (filed with the Commission as Exhibit 10.1 to the company’s current report on Form 8-K on July 27, 2009, File No. 1-6311). | |
| 10.2+ |
Amended and Restated Tidewater Inc. 1997 Stock Incentive Plan dated November 21, 2002 (filed with the Commission as Exhibit 10(a) to the company’s quarterly report on Form 10-Q for the quarter ended December 31, 2002, File No. 1-6311). | |
| 10.3+ |
Tidewater Inc. 2001 Stock Incentive Plan dated November 21, 2002 (filed with the Commission as Exhibit 10.5 to the company’s annual report on Form 10-K for the fiscal year ended March 31, 2005, File No. 1-6311). | |
| 10.4+ |
Form of Stock Option and Restricted Stock Agreement for the Grant of Incentive Stock Options and Non-Qualified Stock Options Under the Tidewater Inc. 2001 Stock Incentive Plan, and the Grant of Restricted Stock Under the Tidewater Inc. 1997 Stock Incentive Plan (filed with the Commission as Exhibit 10.4 to the company’s quarterly report on Form 10-Q for the quarter ended December 31, 2004, File no. 1-6311). | |
| 10.5+ |
Form of Stock Option and Restricted Stock Agreement for the Grant of Incentive Stock Options and Non-Qualified Stock Options Under the Tidewater Inc. 2001 Stock Incentive Plan and the Grant of Restricted Stock Under the Tidewater Inc. 1997 Stock Incentive Plan (filed with the Commission as Exhibit 10.10 to the company’s annual report on Form 10-K for the fiscal year ended March 31, 2005, File No. 1-6311). | |
| 10.6+ |
Form of Stock Option and Restricted Stock Agreement for the Grant of Incentive Stock Options, Non-Qualified Stock Options and Restricted Stock Under the Tidewater Inc. 2001 Stock | |
-65-
Table of Contents
Index to Financial Statements
| Incentive Plan (filed with the Commission as Exhibit 10.11 to the company’s annual report on Form 10-K for the fiscal year ended March 31, 2005, File No. 1-6311). | ||
| 10.7+ |
Form of Stock Option and Restricted Stock Agreement for the Grant of Incentive Stock Options and Non-Qualified Stock Options Under the Tidewater Inc. 2001 Stock Incentive Plan and the Grant of Restricted Stock Under the Tidewater Inc. Employee Restricted Stock Plan (filed with the Commission as Exhibit 10.12 to the company’s annual report on Form 10-K for the fiscal year ended March 31, 2005, File No. 1-6311). | |
| 10.8+ |
Form of Stock Option and Restricted Stock Agreement for the Grant of Incentive Stock Options, Non-Qualified Stock Options and Restricted Stock Under the Tidewater Inc. 2001 Stock Incentive Plan (filed with the Commission as Exhibit 10.14 to the company’s annual report on Form 10-K for the fiscal year ended March 31, 2006, File No. 1-6311). | |
| 10.9+ |
Form of Stock Option and Restricted Stock Agreement for the Grant of Incentive Stock Options and Non-Qualified Stock Options Under the Tidewater Inc. 2001 Stock Incentive Plan and the Grant of Restricted Stock Under the Tidewater Inc. 1997 Stock Incentive Plan (filed with the Commission as Exhibit 10.15 to the company’s annual report on Form 10-K for the fiscal year ended March 31, 2006, File No. 1-6311). | |
| 10.10+ |
2006 Stock Incentive Plan effective July 20, 2006, (filed as Exhibit 99.1 to the company’s current report on Form 8-K on March 27, 2007, File No. 1-6311). | |
| 10.11+ |
Form of Stock Option and Restricted Stock Agreement for the Grant of Incentive Stock Options, Non-Qualified Stock Options and Restricted Stock Under the Tidewater Inc. 2006 Stock Incentive Plan (filed with the Commission as Exhibit 10.20 to the company’s annual report on Form 10-K for the fiscal year ended March 31, 2008, File No. 1-6311). | |
| 10.12+ |
Amended and Restated Directors Deferred Stock Units Plan effective January 30, 2008 (filed with the Commission as Exhibit 10.21 to the company’s annual report on Form 10-K for the fiscal year ended March 31, 2008, File No. 1-6311). | |
| 10.13+ |
Stock Option and Restricted Stock Agreement for the Grant of Incentive Stock Options, Non-Qualified Stock Options and Restricted Stock Under the Tidewater Inc. 2006 Stock Incentive Plan between Tidewater Inc. and Quinn P. Fanning dated effective as of July 31, 2008 (filed with the Commission as Exhibit 10.8 to the company’s quarterly report on Form 10-Q for the quarter ended September 30, 2008, File No. 1-6311). | |
| 10.14+ |
Form of Stock Option and Restricted Stock Agreement for the Grant of Incentive Stock Options, Non-Qualified Stock Options and Restricted Stock Under the Tidewater Inc. 2006 Stock Incentive Plan applicable to 2009 grants (filed with the Commission as Exhibit 10.19 to the company’s annual report on Form 10-K for the year ended March 31, 2009, File No. 1-6311). | |
| 10.15+ |
Tidewater Inc. Executive Medical Benefit Plan dated January 1, 2000 (filed with the Commission as Exhibit 10.16 to the company’s annual report on Form 10-K for the fiscal year ended March 31, 2005, File No. 1-6311). | |
| 10.16+ |
Amended and Restated Non-Qualified Pension Plan for Outside Directors of Tidewater Inc. effective March 31, 2005, (filed with the Commission as Exhibit 10.23 to the company’s annual report on Form 10-K for the fiscal year ended March 31, 2006, File No. 1-6311). | |
| 10.17+ |
Amendment to the Amended and Restated Non-Qualified Pension Plan for Outside Directors of Tidewater Inc. effective December 13, 2006 (filed with the Commission as Exhibit 10.1 to the company’s quarterly report on Form 10-Q for the quarter ended December 31, 2006, File No. 1-6311). | |
| 10.18+ |
Restated Non-Qualified Deferred Compensation Plan and Trust Agreement as Restated October 1, 1999 between Tidewater Inc. and Merrill Lynch Trust Company of America (filed | |
-66-
Table of Contents
Index to Financial Statements
| with the Commission as Exhibit 10(e) to the company’s quarterly report on Form 10-Q for the quarter ended December 31, 1999, File No. 1-6311). | ||
| 10.19+ |
Second Restated Executives Supplemental Retirement Trust as Restated October 1, 1999 between Tidewater Inc. and Hibernia National Bank (filed with the Commission as Exhibit 10(j) to the company’s quarterly report on Form 10-Q for the quarter ended December 31, 1999, File No. 1-6311). | |
| 10.20+ |
Tidewater Inc. Company Performance Executive Officer Annual Incentive Plan for Fiscal Years 2010, 2011, and 2012 (filed with the Commission as Exhibit 10.2 to the company’s quarterly report on Form 10-Q for the quarter ended September 30, 2009, File No. 1-6311). | |
| 10.21+ |
Tidewater Inc. Individual Performance Executive Officer Annual Incentive Plan for Fiscal Years 2010, 2011, and 2012 (filed with the Commission as Exhibit 10.3 to the company’s quarterly report on Form 10-Q for the quarter ended September 30, 2009, File No. 1-6311). | |
| 10.22+ |
Tidewater Inc. Management Annual Incentive Plan for Fiscal Years 2010, 2011 and 2012 (filed with the Commission as Exhibit 10.3 to the company’s quarterly report on Form 10-Q for the quarter ended September 30, 2009, File No. 1-6311). | |
| 10.23*+ |
Clarification of Management Annual Incentive Plan dated March 3, 2010. | |
| 10.24+ |
Amendment to the Amended and Restated Non-Qualified Pension Plan for Outside Directors of Tidewater Inc. effective January 30, 2008 (filed with the Commission as Exhibit 10.35 to the company’s annual report on Form 10-K for the fiscal year ended March 31, 2008, and 2009 File No. 1-6311). | |
| 10.25+ |
Tidewater Inc. Amended and Restated Supplemental Executive Retirement Plan executed on December 10, 2008 (filed with the Commission as Exhibit 10.1 to the company’s quarterly report on Form 10-Q for the quarter ended December 31, 2008, File No. 1-6311). | |
| 10.26+ |
Tidewater Inc. Amended and Restated Employees’ Supplemental Savings Plan executed on December 10, 2008 (filed with the Commission as Exhibit 10.3 to the company’s quarterly report on Form 10-Q for the quarter ended December 31, 2008, File No. 1-6311). | |
| 10.27+ |
Amendment to the Tidewater Inc. Amended and Restated Supplemental Executive Retirement Plan dated December 10, 2008 (filed with the Commission as Exhibit 10.4 to the company’s quarterly report on Form 10-Q for the quarter ended December 31, 2008, File No. 1-6311). | |
| 10.28+ |
Amendment Number One to the Tidewater Employees’ Supplemental Savings Plan, effective January 22, 2009 (filed with the Commission as Exhibit 10.43 to the company’s annual report on Form 10-K for the year ended March 31, 2009, File No. 1-6311). | |
| 10.29+ |
Amendment Number Two to the Tidewater Inc. Supplemental Executive Retirement Plan, effective January 22, 2009 (filed with the Commission as Exhibit 10.44 to the company’s annual report on Form 10-K for the year ended March 31, 2009, File No. 1-6311). | |
| 10.30+ |
Summary of Compensation Arrangements with Directors (filed with the Commission as Exhibit 10.45 to the company’s annual report on Form 10-K for the year ended March 31, 2009, File No. 1-6311). | |
| 10.31+ |
Summary of Fiscal 2009 and 2010 Executive Officers Base Salaries (filed with the Commission as Exhibit 10.19 to the company’s annual report on Form 10-K for the year ended March 31, 2009, File No. 1-6311). | |
| 10.32+ |
Amended and Restated Change of Control Agreement between Tidewater Inc. and Dean Taylor dated effective as of September 26, 2007 (filed with the Commission as Exhibit 10.1 to the company’s quarterly report on Form 10-Q for the quarter ended September 30, 2008, File No. 1-6311). | |
-67-
Table of Contents
Index to Financial Statements
| 10.33+ |
Amendment No.1 to Amended and Restated Change of Control Agreement between Tidewater Inc. and Dean Taylor dated effective as of June 1, 2008 (filed with the Commission as Exhibit 10.2 to the company’s quarterly report on Form 10-Q for the quarter ended September 30, 2008, File No. 1-6311). | |
| 10.34+ |
Amended and Restated Change of Control Agreement between Tidewater Inc. and Stephen Dick dated effective as of June 1, 2008 (filed with the Commission as Exhibit 10.3 to the company’s quarterly report on Form 10-Q for the quarter ended September 30, 2008, File No. 1-6311). | |
| 10.35+ |
Amended and Restated Change of Control Agreement between Tidewater Inc. and Jeffrey Platt dated effective as of June 1, 2008 (filed with the Commission as Exhibit 10.4 to the company’s quarterly report on Form 10-Q for the quarter ended September 30, 2008, File No. 1-6311). | |
| 10.36+ |
Amended and Restated Change of Control Agreement between Tidewater Inc. and Joseph Bennett dated effective as of June 1, 2008 (filed with the Commission as Exhibit 10.5 to the company’s quarterly report on Form 10-Q for the quarter ended September 30, 2008, File No. 1-6311). | |
| 10.37+ |
Amended and Restated Change of Control Agreement between Tidewater Inc. and Bruce D. Lundstrom dated effective as of July 31, 2008 (filed with the Commission as Exhibit 10.6 to the company’s quarterly report on Form 10-Q for the quarter ended September 30, 2008, File No. 1-6311). | |
| 10.38+ |
Change of Control Agreement between Tidewater Inc. and Quinn P. Fanning dated effective as of July 31, 2008 (filed with the Commission as Exhibit 10.7 to the company’s quarterly report on Form 10-Q for the quarter ended September 30, 2008, File No. 1-6311). | |
| 10.39+ |
2009 Stock Incentive Plan (filed as Exhibit 99.1 to the company’s current report on Form 8-K on July 10, 2009, File No. 1-6311). | |
| 10.40+ |
Form of Indemnification Agreement entered into with each member of the Board of Directors, each executive officer and the principal accounting officer (filed as Exhibit 99.1 to the company’s current report on Form 8-K on December 15, 2009, File No. 1-6311). | |
| 10.41*+ |
Form of Stock Option and Restricted Stock Agreement for the Grant of Incentive Stock Options, Non-Qualified Stock Options and Restricted Stock Under the Tidewater Inc. 2009 Stock Incentive Plan. | |
| 21* |
Subsidiaries of the company. | |
| 23* |
Consent of Independent Registered Accounting Firm – Deloitte & Touche LLP. | |
| 31.1* |
Certification of Chief Executive Officer pursuant to Rule 13a-14 or 15d-14 of the Securities Exchange Act of 1934, as adopted pursuant to Section 302 of the Sarbanes-Oxley Act of 2002. | |
| 31.2* |
Certification of Chief Financial Officer pursuant to Rule 13a-14 or 15d-14 of the Securities Exchange Act of 1934, as adopted pursuant to Section 302 of the Sarbanes-Oxley Act of 2002. | |
| 32.1* |
Certification of Chief Executive Officer and Chief Financial Officer Pursuant to 18 U.S.C. Section 1350, as adopted pursuant to Section 906 of the Sarbanes-Oxley Act of 2002. | |
| * | Filed herewith. |
| + | Indicates a management contract or compensatory plan or arrangement. |
-68-
Table of Contents
Index to Financial Statements
Pursuant to the requirements of Section 13 of the Securities Exchange Act of 1934, the Registrant has duly caused this report to be signed on its behalf by the undersigned, thereunto duly authorized on May 20, 2010.
| TIDEWATER INC. | ||
| (Registrant) | ||
| By: |
/s/ Dean E. Taylor | |
| Dean E. Taylor | ||
| Chairman of the Board of Directors, President and Chief Executive Officer | ||
| By: |
/s/ Quinn P. Fanning | |
| Quinn P. Fanning | ||
| Executive Vice President and Chief Financial Officer | ||
| By: |
/s/ Craig J. Demarest | |
| Craig J. Demarest | ||
| Vice President, Principal Accounting Officer and Controller | ||
Pursuant to the requirements of the Securities Exchange Act of 1934, this report has been signed below by the following persons on behalf of the Registrant and in the capacities indicated on May 20, 2010.
| /s/ Dean E. Taylor |
/s/ Richard T. du Moulin | |||
| Dean E. Taylor, Chairman of the Board of |
Richard T. du Moulin, Director | |||
| Directors, President and Chief Executive Officer |
||||
| /s/ Jon C. Madonna |
/s/ Richard A. Pattarozzi | |||
| Jon C. Madonna, Director |
Richard A. Pattarozzi, Director | |||
| /s/ J. Wayne Leonard |
/s/ Jack E. Thompson | |||
| J. Wayne Leonard, Director |
Jack E. Thompson, Director | |||
| /s/ Nicholas J. Sutton |
/s/ Miles J. Allison | |||
| Nicholas J. Sutton, Director |
Miles J. Allison, Director | |||
| /s/ James C. Day |
/s/ Cindy B. Taylor | |||
| James C. Day, Director |
Cindy B. Taylor, Director | |||
| /s/ Joseph H. Netherland |
||||
| Joseph H. Netherland, Director |
||||
-69-
Table of Contents
Index to Financial Statements
Annual Report on Form 10-K
Items 8, 15(a), and 15(c)
Index to Financial Statements and Schedule
All other schedules are omitted as the required information is inapplicable or the information is presented in the financial statements or the related notes.
F-1
Table of Contents
Index to Financial Statements
MANAGEMENT’S REPORT ON INTERNAL CONTROL OVER FINANCIAL REPORTING
The company’s management is responsible for establishing and maintaining adequate internal control over financial reporting (as defined in Exchange Act Rules 13a-15(f)). The company’s internal control system was designed to provide reasonable assurance to the company’s management and Board of Directors regarding the preparation and fair presentation of published financial statements. All internal control systems, no matter how well designed, have inherent limitations. Therefore, even those systems determined to be effective can provide only reasonable assurance with respect to financial statement preparation and presentation.
The company’s management assessed the effectiveness of the company’s internal control over financial reporting as of March 31, 2010. In making this assessment, management used the criteria set forth by the Committee of Sponsoring Organizations of the Treadway Commission (COSO) in Internal Control—Integrated Framework. Based on our assessment we believe that, as of March 31, 2010, the company’s internal control over financial reporting is effective based on those criteria.
Deloitte & Touche LLP, the company’s registered public accounting firm that audited the company’s financial statements included in this Annual Report on Form 10-K, has issued an audit report on the effectiveness of the company’s internal control over financial reporting which appears on page F-3.
F-2
Table of Contents
Index to Financial Statements
REPORT OF INDEPENDENT REGISTERED PUBLIC ACCOUNTING FIRM
To the Board of Directors and Stockholders of Tidewater Inc.
New Orleans, Louisiana
We have audited the internal control over financial reporting of Tidewater Inc. and subsidiaries (the “Company”) as of March 31, 2010, based on criteria established in Internal Control—Integrated Framework issued by the Committee of Sponsoring Organizations of the Treadway Commission. The Company’s management is responsible for maintaining effective internal control over financial reporting and for its assessment of the effectiveness of internal control over financial reporting, included in the accompanying Management’s Report on Internal Control over Financial Reporting. Our responsibility is to express an opinion on the Company’s internal control over financial reporting based on our audit.
We conducted our audit in accordance with the standards of the Public Company Accounting Oversight Board (United States). Those standards require that we plan and perform the audit to obtain reasonable assurance about whether effective internal control over financial reporting was maintained in all material respects. Our audit included obtaining an understanding of internal control over financial reporting, assessing the risk that a material weakness exists, testing and evaluating the design and operating effectiveness of internal control based on the assessed risk, and performing such other procedures as we considered necessary in the circumstances. We believe that our audit provides a reasonable basis for our opinion.
A company’s internal control over financial reporting is a process designed by, or under the supervision of, the company’s principal executive and principal financial officers, or persons performing similar functions, and effected by the company’s board of directors, management, and other personnel to provide reasonable assurance regarding the reliability of financial reporting and the preparation of financial statements for external purposes in accordance with generally accepted accounting principles. A company’s internal control over financial reporting includes those policies and procedures that (1) pertain to the maintenance of records that, in reasonable detail, accurately and fairly reflect the transactions and dispositions of the assets of the company; (2) provide reasonable assurance that transactions are recorded as necessary to permit preparation of financial statements in accordance with generally accepted accounting principles, and that receipts and expenditures of the company are being made only in accordance with authorizations of management and directors of the company; and (3) provide reasonable assurance regarding prevention or timely detection of unauthorized acquisition, use, or disposition of the company’s assets that could have a material effect on the financial statements.
Because of the inherent limitations of internal control over financial reporting, including the possibility of collusion or improper management override of controls, material misstatements due to error or fraud may not be prevented or detected on a timely basis. Also, projections of any evaluation of the effectiveness of the internal control over financial reporting to future periods are subject to the risk that the controls may become inadequate because of changes in conditions, or that the degree of compliance with the policies or procedures may deteriorate.
In our opinion, the Company maintained, in all material respects, effective internal control over financial reporting as of March 31, 2010, based on the criteria established in Internal Control—Integrated Framework issued by the Committee of Sponsoring Organizations of the Treadway Commission.
We have also audited, in accordance with the standards of the Public Company Accounting Oversight Board (United States), the consolidated financial statements and financial statement schedule as of and for the year ended March 31, 2010 of the Company and our report dated May 20, 2010 expressed an unqualified opinion on those financial statements and financial statement schedule.
/s/ DELOITTE & TOUCHE LLP
New Orleans, Louisiana
May 20, 2010
F-3
Table of Contents
Index to Financial Statements
REPORT OF INDEPENDENT REGISTERED PUBLIC ACCOUNTING FIRM
To the Board of Directors and Stockholders of Tidewater Inc.
New Orleans, Louisiana
We have audited the accompanying consolidated balance sheets of Tidewater Inc. and subsidiaries (the “Company”) as of March 31, 2010 and 2009, and the related consolidated statements of earnings, stockholders’ equity and other comprehensive income, and cash flows for each of the three years in the period ended March 31, 2010. Our audits also included the financial statement schedules listed in the Index at Item 15(a)(2). These financial statements and financial statement schedule are the responsibility of the Company’s management. Our responsibility is to express an opinion on the financial statements and financial statement schedule based on our audits.
We conducted our audits in accordance with the standards of the Public Company Accounting Oversight Board (United States). Those standards require that we plan and perform the audit to obtain reasonable assurance about whether the financial statements are free of material misstatement. An audit includes examining, on a test basis, evidence supporting the amounts and disclosures in the financial statements. An audit also includes assessing the accounting principles used and significant estimates made by management, as well as evaluating the overall financial statement presentation. We believe that our audits provide a reasonable basis for our opinion.
In our opinion, such consolidated financial statements present fairly, in all material respects, the financial position of Tidewater Inc. and subsidiaries as of March 31, 2010 and 2009, and the results of their operations and their cash flows for each of the three years in the period ended March 31, 2010, in conformity with accounting principles generally accepted in the United States of America. Also, in our opinion, such financial statement schedule when considered in relation to the basic consolidated financial statements taken as a whole, presents fairly, in all material respects, the information set forth therein.
We have also audited, in accordance with the standards of the Public Company Accounting Oversight Board (United States), the Company’s internal control over financial reporting as of March 31, 2010, based on the criteria established in Internal Control—Integrated Framework issued by the Committee of Sponsoring Organizations of the Treadway Commission and our report dated May 20, 2010 expressed an unqualified opinion on the Company’s internal control over financial reporting.
/s/ DELOITTE & TOUCHE LLP
New Orleans, Louisiana
May 20, 2010
F-4
Table of Contents
Index to Financial Statements
CONSOLIDATED BALANCE SHEETS
March 31, 2010 and 2009
(In thousands, except share and par value data)
| 2010 | 2009 | ||||||
| ASSETS |
|||||||
| Current assets: |
|||||||
| Cash and cash equivalents |
$ | 223,070 | 250,793 | ||||
| Trade and other receivables, less allowance for doubtful accounts of $38,632 in 2010 and $5,773 in 2009 |
311,617 | 328,566 | |||||
| Marine operating supplies |
44,237 | 48,727 | |||||
| Other current assets |
6,703 | 6,365 | |||||
| Total current assets |
585,627 | 634,451 | |||||
| Investments in, at equity, and advances to unconsolidated companies |
40,614 | 37,221 | |||||
| Properties and equipment: |
|||||||
| Vessels and related equipment |
3,455,322 | 3,238,674 | |||||
| Other properties and equipment |
82,007 | 81,689 | |||||
| 3,537,329 | 3,320,363 | ||||||
| Less accumulated depreciation and amortization |
1,283,505 | 1,307,038 | |||||
| Net properties and equipment |
2,253,824 | 2,013,325 | |||||
| Goodwill |
328,754 | 328,754 | |||||
| Other assets |
84,538 | 60,053 | |||||
| Total assets |
$ | 3,293,357 | 3,073,804 | ||||
| LIABILITIES AND STOCKHOLDERS’ EQUITY |
|||||||
| Current liabilities: |
|||||||
| Current maturities on long-term debt |
25,000 | — | |||||
| Accounts payable |
41,673 | 51,530 | |||||
| Accrued expenses |
119,485 | 111,153 | |||||
| Accrued property and liability losses |
4,809 | 5,521 | |||||
| Other current liabilities |
13,745 | 35,146 | |||||
| Total current liabilities |
204,712 | 203,350 | |||||
| Long-term debt |
275,000 | 300,000 | |||||
| Deferred income taxes |
211,504 | 201,200 | |||||
| Accrued property and liability losses |
12,809 | 8,035 | |||||
| Other liabilities and deferred credits |
125,302 | 116,541 | |||||
| Commitments and Contingencies (Note 10) |
|||||||
| Stockholders’ equity: |
|||||||
| Common stock of $0.10 par value, 125,000,000 shares authorized, issued 51,830,048 shares at March 31, 2010 and 51,696,245 shares at March 31, 2009 |
5,183 | 5,169 | |||||
| Additional paid-in capital |
88,173 | 79,333 | |||||
| Retained earnings |
2,402,575 | 2,194,842 | |||||
| Deferred compensation – restricted stock |
(14,970 | ) | (14,953 | ) | |||
| Accumulated other comprehensive loss |
(16,931 | ) | (19,713 | ) | |||
| Total stockholders’ equity |
2,464,030 | 2,244,678 | |||||
| Total liabilities and stockholders’ equity |
$ | 3,293,357 | 3,073,804 | ||||
See accompanying Notes to Consolidated Financial Statements.
F-5
Table of Contents
Index to Financial Statements
CONSOLIDATED STATEMENTS OF EARNINGS
Years Ended March 31, 2010, 2009, and 2008
(In thousands, except share and per share data)
| 2010 | 2009 | 2008 | ||||||||
| Revenues: |
||||||||||
| Vessel revenues |
$ | 1,138,162 | 1,356,322 | 1,215,134 | ||||||
| Other marine revenues |
30,472 | 34,513 | 55,037 | |||||||
| 1,168,634 | 1,390,835 | 1,270,171 | ||||||||
| Costs and expenses: |
||||||||||
| Vessel operating costs |
605,259 | 660,876 | 584,746 | |||||||
| Costs of other marine revenues |
27,387 | 29,282 | 47,423 | |||||||
| Depreciation and amortization |
130,184 | 126,231 | 120,837 | |||||||
| General and administrative |
149,932 | 136,228 | 126,589 | |||||||
| Provision for Venezuelan operations, net |
43,720 | — | — | |||||||
| Gain on asset dispositions, net |
(28,178 | ) | (27,251 | ) | (11,449 | ) | ||||
| 928,304 | 925,366 | 868,146 | ||||||||
| Operating income |
240,330 | 465,469 | 402,025 | |||||||
| Other income (expenses): |
||||||||||
| Foreign exchange gain (loss) |
4,094 | 2,695 | (891 | ) | ||||||
| Equity in net earnings of unconsolidated companies |
18,107 | 16,978 | 14,470 | |||||||
| Interest income and other, net |
6,882 | 7,066 | 16,957 | |||||||
| Interest and other debt costs |
(1,679 | ) | (693 | ) | (6,992 | ) | ||||
| 27,404 | 26,046 | 23,544 | ||||||||
| Earnings before income taxes |
267,734 | 491,515 | 425,569 | |||||||
| Income tax expense |
8,258 | 84,617 | 76,806 | |||||||
| Net earnings |
$ | 259,476 | 406,898 | 348,763 | ||||||
| Basic earnings per common share |
$ | 5.04 | 7.92 | 6.43 | ||||||
| Diluted earnings per common share |
$ | 5.02 | 7.89 | 6.39 | ||||||
| Weighted average common shares outstanding |
51,447,077 | 51,364,237 | 54,259,495 | |||||||
| Incremental common shares from stock options |
241,953 | 182,620 | 347,311 | |||||||
| Adjusted weighted average common shares |
51,689,030 | 51,546,857 | 54,606,806 | |||||||
| Cash dividends declared per common share |
$ | 1.00 | 1.00 | .60 | ||||||
See accompanying Notes to Consolidated Financial Statements.
F-6
Table of Contents
Index to Financial Statements
CONSOLIDATED STATEMENTS OF STOCKHOLDERS’ EQUITY AND OTHER COMPREHENSIVE INCOME
Years Ended March 31, 2010, 2009 and 2008
(In thousands)
| Common stock |
Additional paid-in capital |
Retained earnings |
Deferred compensation- restricted stock |
Accumulated other comprehensive loss |
Grantor Trust Stock Ownership Program (GSOP) |
Total | ||||||||||||||||
| Balance at March 31, 2007 |
$ | 5,748 | 205,425 | 1,740,568 | (19,172 | ) | (20,607 | ) | (25,952 | ) | 1,886,010 | |||||||||||
| Adoption of FIN 48 |
— | — | (23,637 | ) | — | — | — | (23,637 | ) | |||||||||||||
| Net earnings |
— | — | 348,763 | — | — | — | 348,763 | |||||||||||||||
| Other Comprehensive Income: |
||||||||||||||||||||||
| Unrealized gain/(losses) on available-for-sale securities |
— | — | — | — | (144 | ) | — | (144 | ) | |||||||||||||
| Changes in Supplemental Executive Retirement Plan minimum liability |
— | — | — | — | 597 | — | 597 | |||||||||||||||
| Changes in Pension Plan minimum liability |
— | — | — | — | 943 | — | 943 | |||||||||||||||
| Changes in Other Benefit Plan minimum liability |
— | — | — | — | 443 | — | 443 | |||||||||||||||
| Changes in fair value of derivative instruments |
— | — | — | — | 494 | — | 494 | |||||||||||||||
| Total Comprehensive income |
351,096 | |||||||||||||||||||||
| Issuance of restricted stock |
10 | 5,860 | — | (5,870 | ) | — | — | — | ||||||||||||||
| Stock option activity |
9 | 28,665 | — | — | — | 25,780 | 54,454 | |||||||||||||||
| Cash dividends declared |
— | — | (32,687 | ) | — | — | — | (32,687 | ) | |||||||||||||
| Issuance of common shares |
— | 338 | — | 172 | 510 | |||||||||||||||||
| Retirement of common stock |
(528 | ) | (169,519 | ) | (140,000 | ) | — | — | — | (310,047 | ) | |||||||||||
| Amortization/cancellation of restricted stock |
(7 | ) | (3,708 | ) | — | 8,100 | — | — | 4,385 | |||||||||||||
| Balance at March 31, 2008 |
$ | 5,232 | 67,061 | 1,893,007 | (16,942 | ) | (18,274 | ) | — | 1,930,084 | ||||||||||||
| Net earnings |
— | — | 406,898 | — | — | — | 406,898 | |||||||||||||||
| Other Comprehensive Income: |
||||||||||||||||||||||
| Unrealized gain/(losses) on available-for-sale securities |
— | — | — | — | (3,758 | ) | — | (3,758 | ) | |||||||||||||
| Changes in Supplemental Executive Retirement Plan minimum liability |
— | — | — | — | 686 | — | 686 | |||||||||||||||
| Changes in Pension Plan minimum liability |
— | — | — | — | (1,342 | ) | — | (1,342 | ) | |||||||||||||
| Changes in Other Benefit Plan minimum liability |
— | — | — | — | 2,975 | — | 2,975 | |||||||||||||||
| Total Comprehensive income |
405,459 | |||||||||||||||||||||
| Issuance of restricted stock |
17 | 6,287 | — | (6,304 | ) | — | — | — | ||||||||||||||
| Stock option activity |
17 | 9,110 | — | — | — | 9,127 | ||||||||||||||||
| Cash dividends declared |
— | — | (51,521 | ) | — | — | — | (51,521 | ) | |||||||||||||
| Retirement of common stock |
(92 | ) | — | (53,542 | ) | — | — | — | (53,634 | ) | ||||||||||||
| Amortization/cancellation of restricted stock |
(5 | ) | (3,125 | ) | — | 8,293 | — | — | 5,163 | |||||||||||||
| Balance at March 31, 2009 |
$ | 5,169 | 79,333 | 2,194,842 | (14,953 | ) | (19,713 | ) | — | 2,244,678 | ||||||||||||
| Net earnings |
— | — | 259,476 | — | — | — | 259,476 | |||||||||||||||
| Other Comprehensive Income: |
||||||||||||||||||||||
| Currency translation adjustment |
— | — | — | — | 767 | — | 767 | |||||||||||||||
| Unrealized gain/(losses) on available-for-sale securities |
— | — | — | — | 2,622 | — | 2,622 | |||||||||||||||
| Changes in Supplemental Executive Retirement Plan minimum liability |
— | — | — | — | 414 | — | 414 | |||||||||||||||
| Changes in Pension Plan minimum liability |
— | — | — | — | (1,244 | ) | — | (1,244 | ) | |||||||||||||
| Changes in Other Benefit Plan minimum liability |
— | — | — | — | 223 | — | 223 | |||||||||||||||
| Total Comprehensive income |
262,258 | |||||||||||||||||||||
| Issuance of restricted stock |
11 | 5,185 | — | (5,196 | ) | — | — | — | ||||||||||||||
| Stock option activity |
7 | 5,554 | — | — | — | — | 5,561 | |||||||||||||||
| Cash dividends declared |
— | — | (51,743 | ) | — | — | — | (51,743 | ) | |||||||||||||
| Amortization/cancellation of restricted stock |
(4 | ) | (1,899 | ) | — | 5,179 | — | — | 3,276 | |||||||||||||
| Balance at March 31, 2010 |
$ | 5,183 | 88,173 | 2,402,575 | (14,970 | ) | (16,931 | ) | — | 2,464,030 | ||||||||||||
See accompanying Notes to Consolidated Financial Statements.
F-7
Table of Contents
Index to Financial Statements
CONSOLIDATED STATEMENTS OF CASH FLOWS
Years Ended March 31, 2010, 2009 and 2008
(In thousands)
| 2010 | 2009 | 2008 | ||||||||
| Operating activities: |
||||||||||
| Net earnings |
$ | 259,476 | 406,898 | 348,763 | ||||||
| Adjustments to reconcile net earnings to net cash provided by operating activities: |
||||||||||
| Depreciation and amortization |
130,184 | 126,231 | 120,837 | |||||||
| Provision (benefit) for deferred income taxes |
569 | 12,889 | 6,680 | |||||||
| Reversal of liabilities for uncertain tax positions |
(36,110 | ) | — | — | ||||||
| Gain on asset dispositions, net |
(28,178 | ) | (27,251 | ) | (11,449 | ) | ||||
| Provision for Venezuelan operations, net |
43,720 | — | — | |||||||
| Equity in earnings of unconsolidated companies, less dividends |
(3,336 | ) | (10,048 | ) | (9,788 | ) | ||||
| Compensation expense – stock based |
8,740 | 10,868 | 11,473 | |||||||
| Excess tax (benefit) liability on stock options exercised |
(72 | ) | 555 | (3,721 | ) | |||||
| Changes in assets and liabilities, net: |
||||||||||
| Trade and other receivables |
(20,458 | ) | (16,833 | ) | (24,726 | ) | ||||
| Marine operating supplies |
4,490 | (2,358 | ) | (1,467 | ) | |||||
| Other current assets |
(338 | ) | (1,157 | ) | 825 | |||||
| Accounts payable |
(12,657 | ) | (289 | ) | 16,003 | |||||
| Accrued expenses |
6,119 | 13,280 | 9,944 | |||||||
| Accrued property and liability losses |
(712 | ) | (751 | ) | 149 | |||||
| Other current liabilities |
(21,889 | ) | 2,733 | 17,824 | ||||||
| Other liabilities and deferred credits |
(3,115 | ) | 5,369 | 8,130 | ||||||
| Other, net |
1,828 | 3,753 | (2,635 | ) | ||||||
| Net cash provided by operating activities |
328,261 | 523,889 | 486,842 | |||||||
| Cash flows from investing activities: |
||||||||||
| Proceeds from sales of assets |
51,735 | 39,360 | 82,021 | |||||||
| Proceeds from sales/leaseback of assets |
101,755 | — | — | |||||||
| Additions to properties and equipment |
(451,973 | ) | (473,675 | ) | (354,022 | ) | ||||
| Other |
1 | 260 | — | |||||||
| Net cash used in investing activities |
(298,482 | ) | (434,055 | ) | (272,001 | ) | ||||
| Cash flows from financing activities: |
||||||||||
| Principal payments on debt |
— | — | — | |||||||
| Principal payments on capitalized lease obligations |
— | (10,059 | ) | (45,723 | ) | |||||
| Debt borrowings |
— | — | — | |||||||
| Debt issuance costs |
(7,712 | ) | (65 | ) | (65 | ) | ||||
| Proceeds from exercise of stock options |
1,872 | 6,588 | 46,359 | |||||||
| Cash dividends |
(51,734 | ) | (51,521 | ) | (32,687 | ) | ||||
| Excess tax benefit (liability) on stock options exercised |
72 | (555 | ) | 3,721 | ||||||
| Stock repurchases |
— | (53,634 | ) | (310,047 | ) | |||||
| Net cash used in financing activities |
(57,502 | ) | (109,246 | ) | (338,442 | ) | ||||
| Net change in cash and cash equivalents |
(27,723 | ) | (19,412 | ) | (123,601 | ) | ||||
| Cash and cash equivalents at beginning of year |
250,793 | 270,205 | 393,806 | |||||||
| Cash and cash equivalents at end of year |
$ | 223,070 | 250,793 | 270,205 | ||||||
| Supplemental disclosure of cash flow information: |
||||||||||
| Cash paid during the year for: |
||||||||||
| Interest |
$ | 14,951 | 13,967 | 17,025 | ||||||
| Income taxes |
$ | 57,571 | 59,977 | 56,084 | ||||||
| Non-cash financing activities: |
||||||||||
| Capital leases |
$ | — | — | 33,876 | ||||||
See accompanying Notes to Consolidated Financial Statements.
F-8
Table of Contents
Index to Financial Statements
NOTES TO CONSOLIDATED FINANCIAL STATEMENTS
Years ended March 31, 2010, 2009, and 2008
| (1) | NATURE OF OPERATIONS AND SUMMARY OF SIGNIFICANT ACCOUNTING POLICIES |
Nature of Operations
The company provides offshore service vessels and marine support services to the global offshore energy industry through the operation of a diversified fleet of offshore marine service vessels. The company’s revenues, net earnings and cash flows from operations are dependent upon the activity level of the vessel fleet. Like other energy service companies, the level of the company’s business activity is driven by the level of drilling and exploration activity by our customers. Our customers’ activity, in turn, is dependent on crude oil and natural gas prices, which fluctuate depending on respective levels of supply and demand for crude oil and natural gas.
Principles of Consolidation
The consolidated financial statements include the accounts of Tidewater Inc. and its subsidiaries. Intercompany balances and transactions are eliminated in consolidation.
Use of Estimates
The preparation of financial statements in conformity with accounting principles generally accepted in the United States of America requires management to make estimates and assumptions that affect the reported amounts of assets and liabilities and disclosure of contingent assets and liabilities at the date of the consolidated financial statements and the reported amounts of revenues and expenses during the reporting period. The accompanying consolidated financial statements include estimates for allowance for doubtful accounts, useful lives of property and equipment, valuation of goodwill, income tax provisions, deferred revenues, impairments, commitments and contingencies and certain accrued liabilities. The company evaluates its estimates and assumptions on an ongoing basis based on a combination of historical information and various other assumptions that are considered reasonable under the particular circumstances. Actual results may differ from these estimates under different assumptions.
Cash Equivalents
The company considers all highly liquid investments with maturities of three months or less when purchased to be cash equivalents.
Marine Operating Supplies
Marine operating supplies, which consist primarily of operating parts and supplies for the company’s vessels, are stated at the lower of weighted-average cost or market.
Properties and Equipment
Properties and equipment are stated at cost. Depreciation is computed primarily on the straight-line basis beginning with the date construction is completed, with salvage values of 5%-10% for marine equipment, using estimated useful lives of 15 - 25 years for marine equipment (from date of construction) and 3 - 30 years for other properties and equipment. Depreciation is provided for all vessels unless a vessel meets the criteria to be classified as held for sale. Estimated remaining useful lives are reviewed when there has been a change in circumstances that indicates the original estimated useful life may no longer be appropriate. Upon retirement or disposal of a fixed asset, the costs and related accumulated depreciation are removed from the respective accounts and any gains or losses are included in our consolidated statements of earnings.
Depreciation and amortization expense for the years ended March 31, 2010, 2009 and 2008 was $130.2 million, $126.2 million and $120.8 million, respectively.
Used equipment is depreciated in accordance with the above policy; however, no life less than six years is used for marine equipment regardless of the date constructed.
F-9
Table of Contents
Index to Financial Statements
TIDEWATER INC.
NOTES TO CONSOLIDATED FINANCIAL STATEMENTS
Years ended March 31, 2010, 2009, and 2008
Maintenance and repairs are expensed as incurred during the asset’s original estimated useful life (its original depreciable life). Major repair costs incurred after the original estimated depreciable life that also have the effect of extending the useful life of the asset are capitalized and amortized over 30 months. Vessel modifications that are performed for a specific customer contract are capitalized and amortized over the firm contract term. Major modifications to equipment are capitalized and amortized over the remaining life of the equipment. The majority of the company’s vessels require drydocking inspection twice in each five year period, and the company schedules vessel drydockings when it is anticipated that the work can be performed.
The following is a summary of net properties and equipment at March 31, 2010 and 2009:
| 2010 | 2009 | ||||||||
| Number Of Vessels |
Carrying Value |
Number Of Vessels |
Carrying Value | ||||||
| (In thousands) | (In thousands) | ||||||||
| Vessels in active service |
282 | 1,891,322 | 342 | $ | 1,549,118 | ||||
| Stacked vessels |
83 | 47,959 | 61 | 18,436 | |||||
| Vessels withdrawn from service |
7 | 440 | 11 | 1,340 | |||||
| Marine equipment under construction |
275,578 | 403,253 | |||||||
| Other property and equipment |
38,525 | 41,178 | |||||||
| Totals |
372 | 2,253,824 | 414 | $ | 2,013,325 | ||||
The company considers a vessel to be stacked if its crew is removed from the vessel and limited maintenance is being performed on the vessel. This action is taken to reduce operating costs when management does not foresee adequate marketing possibilities in the near future. Vessels are added to this list when market conditions warrant, and they are removed from this list when sold or otherwise disposed of or when returned to active service. As economically practical opportunities arise to use the vessels to provide marine services, the stacked vessels can be returned to service by performing any necessary maintenance on the vessel and returning fleet personnel to operate the vessel. Although not currently fulfilling charters, stacked vessels are considered to be in service and are included in the calculation of the company’s utilization statistics. Stacked vessels at March 31, 2010 and 2009 have an average age of 28.3 and 28.0 years, respectively. The vast majority of vessels stacked at March 31, 2010 are currently being marketed for sale and are not expected to return to the active fleet, primarily due to their mature age.
Vessels withdrawn from service represent those vessels which management has determined are unlikely to return to active service and are currently marketed for sale. Vessels withdrawn from service are not included in the company’s utilization statistics. Vessels withdrawn from service at March 31, 2010 and 2009 have an average age of 31.1 and 29.7 years, respectively.
All vessels are classified in the company’s consolidated balance sheets in Properties and Equipment. No vessels are classified as held for sale because no vessel meets the criteria. Stacked vessels and vessels withdrawn from service are reviewed for impairment semiannually.
Valuation of Long-Lived Assets
The company reviews long-lived assets for impairment whenever events occur or changes in circumstances indicate that the carrying amount of assets may not be recoverable. In such evaluation, the estimated future undiscounted cash flows generated by an asset group are compared with the carrying amount of the asset group to determine if a write-down may be required. The company estimates cash flows based upon historical data adjusted for the company’s best estimate of future market performance that is based on industry trends. If impairment exists, the carrying value of the asset group is reduced to its estimated fair value. Vessels with similar operating and marketing characteristics, including stacked vessels that have not been withdrawn from service, are grouped for asset impairment testing.
Although the company believes its assumptions and estimates are reasonable, material deviations from the assumptions and estimates could produce a materially different result. Management estimates may vary considerably from actual outcomes due to future adverse market conditions or poor operating results that
F-10
Table of Contents
Index to Financial Statements
TIDEWATER INC.
NOTES TO CONSOLIDATED FINANCIAL STATEMENTS
Years ended March 31, 2010, 2009, and 2008
could result in the inability to recover the current carrying value of an asset group, thereby possibly requiring an impairment charge in the future. As the company’s fleet continues to age, management closely monitors the estimates and assumptions used in the impairment analysis to properly identify evolving trends and changes in market conditions that could impact the results of the impairment evaluation.
The company performs a periodic impairment review of its stacked vessels and vessels withdrawn from service. This review is undertaken every six months, or more often if considered necessary, and considers items such as the vessel’s age, length of time stacked and likelihood of a return to service, among others. The company records an impairment charge when the carrying value of a vessel withdrawn from service or a stacked vessel that is unlikely to return to service exceeds its estimated fair value. The company recorded impairment charges of $3.1 million and $1.4 million during fiscal 2010 and 2009, respectively, which is included in gain on asset dispositions, net. No impairment was recorded during fiscal 2008.
Goodwill
Goodwill represents the cost in excess of fair value of the net assets of companies acquired. The company does not amortize goodwill, but tests goodwill annually for impairment (or on a more frequent basis if events or changes in circumstances indicated that the carrying amount of the reporting unit exceeds its fair value) using a fair value-based approach. An impairment loss would be recorded if the recorded goodwill exceeds its implied fair value. Goodwill primarily relates to the fiscal 1998 acquisition of O.I.L. Ltd., a British company. Goodwill of $279.4 million and $49.4 million, respectively, is assigned to the International and United States reporting units. Although the assets and liabilities acquired in the acquisition of O. I. L., Ltd. were primarily assigned to the International reporting unit, a portion of the goodwill was allocated to the United States reporting unit following the acquisition based on the estimated increase in the fair value of that reporting unit. At March 31, 2010, the company’s goodwill represented 10% of total assets and 13% of stockholders’ equity. No impairment of goodwill was recorded during fiscal 2010, 2009 and 2008.
Accrued Property and Liability Losses
The company’s insurance subsidiary establishes case-based reserves for estimates of reported losses on direct business written, estimates received from ceding reinsurers, and reserves based on past experience of unreported losses. Such losses principally relate to the company’s marine operations and are included as a component of costs of marine operations in the consolidated statements of earnings. The liability for such losses and the related reimbursement receivable from reinsurance companies are classified in the consolidated balance sheets into current and noncurrent amounts based upon estimates of when the liabilities will be settled and when the receivables will be collected.
Pension and Other Postretirement Benefits
The company follows the provisions of Compensation – Retirement Benefits, ASC Topic 715, and uses a March 31 measurement date for determining net periodic benefit costs, benefit obligations and the fair value of plan assets. Net periodic pension costs and accumulated benefit obligations are determined using a number of assumptions including the discount rates used to measure future obligations and expenses, the rate of compensation increases, retirement ages, mortality rates, expected long-term return on plan assets, health care cost trends, and other assumptions, all of which have a significant impact on the amounts reported.
The company’s pension cost consists of service costs, interest costs, expected returns on plan assets, amortization of prior service costs or benefits and, in part, on a market-related valuation of assets. The company considers a number of factors in developing its pension assumptions, including an evaluation of relevant discount rates, expected long-term returns on plan assets, plan asset allocations, expected changes in wages and retirement benefits, analyses of current market conditions and input from actuaries and other consultants.
Net periodic benefit costs are based on a market-related valuation of assets equal to the fair value of assets. For the long-term rate of return, assumptions are developed regarding the expected rate of return on plan assets based on historical experience and projected long-term investment returns, which consider the plan’s
F-11
Table of Contents
Index to Financial Statements
TIDEWATER INC.
NOTES TO CONSOLIDATED FINANCIAL STATEMENTS
Years ended March 31, 2010, 2009, and 2008
target asset allocation and long-term asset class return expectations. Assumptions for the discount rate use the equivalent single discount rate based on discounting expected plan benefit cash flows using the Citigroup Pension Discount Curve. For the projected compensation trend rate, short-term and long-term compensation expectations for participants, including salary increases and performance bonus payments are considered. For the health care cost trend rate for other postretirement benefits, assumptions are established for health care cost trends, applying an initial trend rate that reflects recent historical experience and broader national statistics with an ultimate trend rate that assumes that the portion of gross domestic product devoted to health care eventually becomes constant.
Income Taxes
Income taxes are accounted for in accordance with the provisions of Income Taxes Topic, ASC 740. Deferred tax assets and liabilities are recognized for the future tax consequences attributable to differences between the financial statement carrying amounts of existing assets and liabilities and their respective tax bases. Deferred tax assets and liabilities are measured using enacted tax rates expected to apply to taxable income in the years in which those temporary differences are expected to be recovered or settled. The effect on deferred tax assets and liabilities of a change in tax rates is recognized in income in the period that includes the enactment date. Deferred taxes are not provided on undistributed earnings of certain non-U.S. subsidiaries and business ventures because the company considers those earnings to be permanently invested abroad.
Revenue Recognition
The company’s primary source of revenue is derived from time charter contracts of its vessels on a rate per day of service basis; therefore, vessel revenues are recognized on a daily basis throughout the contract period. These vessel time charter contracts are generally either on a term basis (average three months to two years) or on a “spot” basis. The base rate of hire for a term contract is generally a fixed rate, provided, however, that term contracts at times include escalation clauses to recover specific additional costs. A spot contract is a short-term agreement to provide offshore marine services to a customer for a specific short-term job. Spot contract terms generally range from one day to three months. Vessel revenues are recognized on a daily basis throughout the contract period. There are no material differences in the cost structure of the company’s contracts based on whether the contracts are spot or term for the operating costs are generally the same without regard to the length of a contract.
Operating Costs
Vessel operating costs are incurred on a daily basis and consist primarily of costs such as crew wages, repair and maintenance, insurance and loss reserves, fuel, lube oil and supplies, vessel operating leases and other vessel expenses, which include but are not limited to costs such as brokers commissions, training costs, agent fees, port fees, canal transit fees, temporary importation fees, vessel certification fees, and satellite communication fees. Repair and maintenance costs include both routine costs and major drydocking repair costs. Vessel operating costs are recognized as incurred on a daily basis.
Foreign Currency Translation
The U.S. dollar is the functional currency for all of the company’s existing international operations, as transactions in these operations are predominately denominated in U.S. dollars. Foreign currency exchange gains and losses are included in the consolidated statements of earnings.
Earnings Per Share
The company reports both basic earnings per share and diluted earnings per share. The calculation of basic earnings per share is based on the weighted average number of shares outstanding and therefore excludes the dilutive effect of stock options and restricted stock grants. Diluted earnings per share includes the dilutive effect of stock options and restricted stock grants. Per share amounts disclosed in these Notes to Consolidated Financial Statements, unless otherwise indicated, are on a diluted basis.
F-12
Table of Contents
Index to Financial Statements
TIDEWATER INC.
NOTES TO CONSOLIDATED FINANCIAL STATEMENTS
Years ended March 31, 2010, 2009, and 2008
Concentrations of Credit Risk
The company’s financial instruments that are exposed to concentrations of credit risk consist primarily of trade and other receivables from a variety of domestic, international and national energy companies, including reinsurance companies for recoverable insurance losses. The company manages its exposure to risk by performing ongoing credit evaluations of its customers’ financial condition and generally does not require collateral. The company maintains an allowance for doubtful accounts for potential losses based on expected collectability and does not believe it is generally exposed to concentrations of credit risk that are likely to have a material adverse impact on the company’s financial position, results of operations, or cash flows.
Stock-Based Compensation
The company follows Compensation – Stock Compensation, Topic ASC 718, for the expensing of stock options and other share-based payments. This topic requires that stock-based compensation transactions be accounted for using a fair-value-based method. The company uses the Black-Scholes option-pricing model to determine the fair-value of stock-based awards under the Topic. Refer to Note 7 of Notes to Consolidated Financial Statements for a complete discussion on stock-based compensation.
Comprehensive Income
The company reports total comprehensive income and its components in the financial statements in accordance with Comprehensive Income, Topic ASC 220. Total comprehensive income represents the net change in stockholders’ equity during a period from sources other than transactions with stockholders and, as such, includes net earnings. For the company, accumulated other comprehensive income is comprised of unrealized gains and losses on available-for-sale securities and derivative financial instruments, currency translation adjustment and any minimum pension liability for the company’s U.S. Defined Benefits Pension Plan and Supplemental Executive Retirement Plan.
Derivative Instruments and Hedging Activities
The company periodically utilizes derivative financial instruments to hedge against foreign currency denominated assets and liabilities and currency commitments. These transactions generally include forward currency contracts or interest rate swaps that are entered into with major financial institutions. Derivative financial instruments are intended to reduce the company’s exposure to foreign currency exchange risk and interest rate risk.
The company records derivative financial instruments in its consolidated balance sheets at fair value as either assets or liabilities. The accounting for changes in the fair value of a derivative instrument depends on the intended use of the derivative and the resulting designation, which is established at the inception of a derivative. The company formally documents, at the inception of a hedge, the hedging relationship and the entity’s risk management objective and strategy for undertaking the hedge, including identification of the hedging instrument, the hedged item or transaction, the nature of the risk being hedged, the method used to assess effectiveness and the method that will be used to measure hedge ineffectiveness of derivative instruments that receive hedge accounting treatment.
For derivative instruments designated as foreign currency or interest rate hedges (cash flow hedge), changes in fair value, to the extent the hedge is effective, are recognized in other comprehensive income until the hedged item is recognized in earnings. Hedge effectiveness is assessed quarterly based on the total change in the derivative’s fair value. Amounts representing hedge ineffectiveness are recorded in earnings. Any change in fair value of derivative financial instruments that are speculative in nature and do not qualify for hedge accounting treatment is also recognized immediately in earnings. Proceeds received upon termination of derivative financial instruments qualifying as fair value hedges are deferred and amortized into income over the remaining life of the hedged item using the effective interest rate method.
F-13
Table of Contents
Index to Financial Statements
TIDEWATER INC.
NOTES TO CONSOLIDATED FINANCIAL STATEMENTS
Years ended March 31, 2010, 2009, and 2008
Fair Value Measurements
The company follows the provisions of Fair Value Measurements and Disclosures, ASC Topic 820, for financial assets and liabilities that are measured and reported at fair value on a recurring basis. The topic establishes a hierarchy for inputs used in measuring fair value. Fair value is calculated based on assumptions that market participants would use in pricing assets and liabilities and not on assumptions specific to the entity. The statement requires that each asset and liability carried at fair value be classified into one of the following categories:
| Level 1: |
Quoted market prices in active markets for identical assets or liabilities | |
| Level 2: |
Observable market based inputs or unobservable inputs that are corroborated by market data | |
| Level 3: |
Unobservable inputs that are not corroborated by market data | |
Reclassifications
The company made certain reclassifications to prior period amounts to conform to the current year presentation. These reclassifications did not have a material effect on the consolidated statement of financial position, results of operations or cash flows.
Subsequent Events
The company evaluates subsequent events through the time of our filing on the date we issue financial statements.
Accounting Pronouncements
From time to time, new accounting pronouncements are issued by the FASB that are adopted by the company as of the specified effective date. Unless otherwise discussed, management believes that the impact of recently issued standards, which are not yet effective, will not have a material impact on the company’s consolidated financial statements upon adoption.
In June 2009, the Financial Accounting Standards Board (FASB) revised Accounting Standards Codification (ASC) 105, Generally Accepted Accounting Principles (GAAP), to establish a hierarchy of GAAP to identify the sources of accounting principles and the framework for selecting the principles used in the preparation of financial statements of nongovernmental entities that are presented in conformity with GAAP in the United States. Rules and interpretive releases of the SEC under federal securities laws are also sources of authoritative GAAP for SEC registrants. All guidance contained in the codification carries an equal level of authority. The amended provisions of ASC 105 are effective for interim and annual periods ending after September 15, 2009. The company adopted the provisions of ASC 105 effective September 30, 2009, and it did not have a material impact on the company’s consolidated financial position, results of operations or cash flows; however, the company is disclosing codification citations in place of corresponding references to legacy accounting pronouncements.
In May 2009, the FASB issued ASC 855, Subsequent Events, which establishes general standards of accounting for and disclosure of events that occur after the balance sheet date but before financial statements are issued or are available to be issued. ASC 855 requires disclosure of the date through which an entity has evaluated subsequent events and the basis for that date, and is effective for interim and annual periods ending after June 15, 2009. The company adopted the provisions of ASC 855 effective June 30, 2009, and it did not have a material impact on the company’s consolidated financial position, results of operations or cash flows.
F-14
Table of Contents
Index to Financial Statements
TIDEWATER INC.
NOTES TO CONSOLIDATED FINANCIAL STATEMENTS
Years ended March 31, 2010, 2009, and 2008
In April 2009, the FASB revised ASC 825, Financial Instruments, to require disclosures about fair value of financial instruments in interim financial statements. ASC 825-10-65 is effective for interim and annual periods ending after June 15, 2009 with early adoption permitted for periods ending after March 15, 2009. The company adopted the disclosure requirements of ASC 825-10-65 on June 30, 2009. The adoption of ASC 825-10-65 resulted in increased disclosures in our interim periods and had no impact on the company’s consolidated financial position, results of operations or cash flows.
In December 2008, the FASB issued additional guidance on the disclosure of the fair value of plan assets held in an employer’s defined benefit pension or other postretirement plan (included within ASC 715, Compensation - Retirement Benefits). The new guidance requires more detailed disclosures about the assets of a defined benefit pension or other postretirement plan including how investment allocation decisions are made, inputs and valuation techniques used to measure fair value, significant concentrations of risk within plan assets and major categories of plan assets. The disclosure guidance is effective for fiscal years ending after December 15, 2009. Since the guidance only requires enhanced disclosures, the adoption of the new provisions of ASC 715 will not have a financial impact on the company’s consolidated financial statements.
In December 2007, the FASB revised ASC 810, Consolidation, to establish new accounting and reporting standards for the noncontrolling interest in a subsidiary and for the deconsolidation of a subsidiary. Specifically, ASC 810 requires the recognition of a noncontrolling interest as equity in the consolidated financial statements and separate from the parent’s equity. The amount of net income attributable to the noncontrolling interest will be included in consolidated net income on the face of the income statement. ASC 810 also includes expanded disclosure requirements regarding the interests of the parent and its noncontrolling interest. The company adopted the provisions of ASC 810 effective April 1, 2009, and it did not have a material impact on the company’s results of operations, cash flows or financial position.
In December 2007, the FASB revised ASC 805, Business Combinations, to establish principles and requirements for the reporting entity in a business combination, including recognition and measurement in the financial statements of the identifiable assets acquired, the liabilities assumed, and any noncontrolling interest in the acquiree. This topic also established disclosure requirements to enable financial statement users to evaluate the nature and financial effects of the business combination. In April 2009, the FASB revised ASC 805-20 to establish a model to account for certain pre-acquisition contingencies. Under the revised ASC 805-20, an acquirer is required to recognize at fair value an asset acquired or a liability assumed in a business combination that arises from a contingency if the acquisition-date fair value of that asset or liability can be determined during the measurement period. If the acquisition-date fair value cannot be determined, then the acquirer should follow the recognition criteria in the Contingencies Topic, ASC 450. The company adopted the revised provisions of ASC 805 effective April 1, 2009, and it did not have a material impact on the company’s financial position, results of operations or cash flows. The company adopted the provisions of ASC 805-20 effective July 1, 2009, which applies prospectively to business combinations completed on or after that date. The impact of the adoption ASC 805-20 will depend on the nature of acquisitions completed after the date of adoption.
| (2) | INVESTMENT IN UNCONSOLIDATED COMPANIES |
Investments in unconsolidated affiliates, generally 50% or less owned partnerships and corporations, are accounted for by the equity method. Under the equity method, the assets and liabilities of the unconsolidated joint venture companies are not consolidated in the company’s consolidated balance sheet.
Investments in, at equity, and advances to unconsolidated joint-venture companies at March 31, 2010 and 2009 were $40.6 million and $37.2 million, respectively, which primarily represents the activities of Sonatide Marine Ltd., a 49%-owned joint venture company located in Luanda, Angola.
During fiscal 2008, the company sold one of its newly constructed offshore tugboats to Sonatide Marine Ltd. for $8.4 million. The transaction resulted in a net gain on sale of assets of $0.4 million.
F-15
Table of Contents
Index to Financial Statements
TIDEWATER INC.
NOTES TO CONSOLIDATED FINANCIAL STATEMENTS
Years ended March 31, 2010, 2009, and 2008
| (3) | INCOME TAXES |
Earnings before income taxes derived from International and United States operations for the years ended March 31 are as follows:
| (In thousands) |
2010 | 2009 | 2008 | |||||
| International |
$ | 280,040 | 461,446 | 413,420 | ||||
| United States |
(12,306 | ) | 30,069 | 12,149 | ||||
| $ | 267,734 | 491,515 | 425,569 | |||||
Income tax expense (benefit) for the years ended March 31 consists of the following:
| U.S. | ||||||||||||
| (In thousands) |
Federal | State | International | Total | ||||||||
| 2010 |
||||||||||||
| Current |
$ | (38,353 | ) | (71 | ) | 44,779 | 6,355 | |||||
| Deferred |
2,079 | — | (176 | ) | 1,903 | |||||||
| $ | (36,274 | ) | (71 | ) | 44,603 | 8,258 | ||||||
| 2009 |
||||||||||||
| Current |
$ | 5,919 | 127 | 65,682 | 71,728 | |||||||
| Deferred |
13,044 | — | (155 | ) | 12,889 | |||||||
| $ | 18,963 | 127 | 65,527 | 84,617 | ||||||||
| 2008 |
||||||||||||
| Current |
$ | 7,640 | 243 | 62,243 | 70,126 | |||||||
| Deferred |
7,405 | — | (725 | ) | 6,680 | |||||||
| $ | 15,045 | 243 | 61,518 | 76,806 | ||||||||
Included in other current liabilities at March 31, 2010 and 2009 are income taxes payable of $2.6 million and $24.8 million, respectively.
The actual income tax expense for the years ended March 31, 2010, 2009, and 2008 differs from the amounts computed by applying the U.S. federal statutory tax rate of 35% to pre-tax earnings as a result of the following:
| (In thousands) |
2010 | 2009 | 2008 | |||||||
| Computed “expected” tax expense |
$ | 93,707 | 172,030 | 148,949 | ||||||
| Increase (reduction) resulting from: |
||||||||||
| Resolution of uncertain tax positions |
(38,423 | ) | — | — | ||||||
| Foreign income taxed at different rates |
(54,352 | ) | (89,803 | ) | (74,641 | ) | ||||
| Foreign tax credits not previously recognized |
(176 | ) | (155 | ) | (725 | ) | ||||
| Current foreign earnings not subject to taxation |
— | (540 | ) | (197 | ) | |||||
| Expenses which are not deductible for tax purposes |
4,335 | 421 | 479 | |||||||
| State taxes |
(46 | ) | 83 | 158 | ||||||
| Other, net |
3,213 | 2,581 | 2,783 | |||||||
| $ | 8,258 | 84,617 | 76,806 | |||||||
The company is not liable for U.S. taxes on future undistributed earnings of most of its non-U.S. subsidiaries and business ventures that it considers indefinitely reinvested abroad because the company adopted the provisions of the American Jobs Creation Act of 2004 (the Act) effective April 1, 2005. All previously recorded deferred tax assets and liabilities related to temporary differences, foreign tax credits, or prior undistributed earnings of these entities whose future and prior earnings were anticipated to be indefinitely reinvested abroad were reversed in March 2005. The company’s fiscal 2010, 2009 and 2008 effective tax rate was 3.08%, 17.22% and 18.05%, respectively.
F-16
Table of Contents
Index to Financial Statements
TIDEWATER INC.
NOTES TO CONSOLIDATED FINANCIAL STATEMENTS
Years ended March 31, 2010, 2009, and 2008
The tax effects of temporary differences that give rise to significant portions of the deferred tax assets and deferred tax liabilities at March 31, 2010 and 2009 are as follows:
| (In thousands) |
2010 | 2009 | |||||
| Deferred tax assets: |
|||||||
| Financial provisions not deducted for tax purposes |
$ | 24,043 | 27,462 | ||||
| Net operating loss and tax credit carryforwards |
11,469 | 1,816 | |||||
| Other |
123 | 558 | |||||
| Gross deferred tax assets |
35,635 | 29,836 | |||||
| Less valuation allowance |
— | — | |||||
| Net deferred tax assets |
35,635 | 29,836 | |||||
| Deferred tax liabilities: |
|||||||
| Depreciation and amortization |
(211,355 | ) | (200,856 | ) | |||
| Other |
(149 | ) | (344 | ) | |||
| Gross deferred tax liabilities |
(211,504 | ) | (201,200 | ) | |||
| Net deferred tax liabilities |
$ | (175,869 | ) | (171,364 | ) | ||
The company has not recognized a U.S. deferred tax liability associated with temporary differences related to investments in foreign subsidiaries that are essentially permanent in duration. The differences relate primarily to undistributed earnings and stock basis differences. Though the company does not anticipate repatriation of funds, a current U.S. tax liability would be recognized when the company receives those foreign funds in a taxable manner such as through receipt of dividends or sale of investments. As of March 31, 2010, the total amount for which U.S. deferred taxes have not been recognized is approximately $1.5 billion. A determination of the unrecognized deferred tax liability for temporary differences related to investments in foreign subsidiaries is not practicable due to uncertainty regarding the use of foreign tax credits which would become available as a result of a transaction.
As of March 31, 2010, the company has foreign tax credit carry-forwards approximating $3.0 million that expire in 2020 and net operating loss carry-forwards approximating $8.4 million that expire in 2030.
Effective April 1, 2007, the company adopted the revised provisions of ASC 740, Income Taxes, relating to uncertain tax positions which clarifies the accounting and reporting for uncertainties in income tax law. This interpretation prescribes a comprehensive model for the financial statement recognition, measurement, presentation and disclosure of uncertain tax positions taken or expected to be taken in income tax returns. In connection with the adoption of the new guidance, the company recording an additional $18.9 million of tax liabilities, including penalty and interest of $3.8 million, a reduction to equity method investments of $5.4 million, including penalties and interest of $2.6 million, and a corresponding decrease to stockholders’ equity of $24.3 million during fiscal 2008. The liabilities are attributable to the IRS disallowance of all claimed deductions from taxable income related to the company’s Foreign Sales Corporation and the Extraterritorial Income Exclusion for fiscal years 1999 through 2007, a permanent establishment issue related to a foreign joint venture and a tax audit of a foreign subsidiary. In addition, the company has $7.8 million of unrecognized tax benefits related to a state tax issue. The unrecognized tax benefits would affect the effective tax rate if realized. Penalties and interest related to income tax liabilities are included in income tax expense.
In January 2008, the U.S. District Court for the Eastern District of Louisiana issued its final ruling in the company’s favor with respect to a motion for summary judgment concerning the IRS disallowance of the company’s tax deduction for foreign sales corporation commissions for fiscal years 1999 and 2000. In April 2009, the Fifth Circuit Court of Appeals affirmed the District Court’s judgment. The IRS did not appeal the Court of Appeals ruling, resulting in final resolution of the issue in the company’s favor in July 2009. The tax benefit related to the issue is approximately $36.1 million, or $0.70 per common share, for fiscal year ended March 31, 2010, which primarily includes a reversal of previously recorded liabilities for uncertain tax positions and interest income on the judgment.
In March 2010, the company settled a state tax issue for fiscal years 2001 through 2003, which resulted in a tax benefit of $2.9 million, including interest of $0.8 million.
F-17
Table of Contents
Index to Financial Statements
TIDEWATER INC.
NOTES TO CONSOLIDATED FINANCIAL STATEMENTS
Years ended March 31, 2010, 2009, and 2008
A reconciliation of the beginning and ending amount of unrecognized tax benefits is as follows:
| (In thousands) |
2010 | 2009 | 2008 | |||||||
| Balance at April 1, |
$ | 44,875 | 43,474 | 41,156 | ||||||
| Additions based on tax positions related to the current year |
2,198 | 2,060 | 2,659 | |||||||
| Reductions for tax positions of prior years |
(2,774 | ) | (254 | ) | — | |||||
| Exchange rate fluctuation |
(930 | ) | — | — | ||||||
| Settlement and lapse of statute of limitations |
(28,678 | ) | (405 | ) | (341 | ) | ||||
| Balance at March 31, |
$ | 14,691 | 44,875 | 43,474 | ||||||
With limited exceptions, the company is no longer subject to tax audits by state, local or foreign taxing authorities for years prior to 2002. The company has ongoing examinations by various state and foreign tax authorities and does not believe that the results of these examinations will have a material adverse effect on the company’s financial position or results of operations.
The company receives a tax benefit that is generated by certain employee stock benefit plan transactions. This benefit is recorded directly to additional paid-in-capital and does not reduce the company’s effective income tax rate. The tax benefit for the years ended March 31, 2010, 2009 and 2008 totaled approximately $0.1 million, $1.7 million and $5.8 million, respectively.
| (4) | LONG-TERM DEBT |
Senior Notes
At March 31, 2010 and 2009, the company had $300.0 million outstanding of senior unsecured notes that were issued in July 2003. The multiple series of notes were originally issued with maturities ranging from seven years to 12 years and had a weighted average remaining life of 2.85 years as of March 31, 2010. These notes can be retired in whole or in part prior to maturity for a redemption price equal to the principal amount of the notes redeemed plus a make-whole premium. The weighted average interest rate on the notes is 4.35%. The terms of the notes provide for a maximum ratio of consolidated debt to total capitalization of 55%. The fair value of this debt at March 31, 2010 and 2009 was estimated to be $314.8 million and $289.4 million, respectively. The first note matures July 2010 in the amount of $25 million.
The following table summarizes long-term debt outstanding at March 31, 2010 and 2009:
| (In thousands) |
2010 | 2009 | ||||
| 3.91% Senior notes due fiscal 2011 |
$ | 25,000 | 25,000 | |||
| 4.16% Senior notes due fiscal 2012 |
40,000 | 40,000 | ||||
| 4.31% Senior notes due fiscal 2013 |
60,000 | 60,000 | ||||
| 4.44% Senior notes due fiscal 2014 |
140,000 | 140,000 | ||||
| 4.61% Senior notes due fiscal 2016 |
35,000 | 35,000 | ||||
| $ | 300,000 | 300,000 | ||||
| Less: Current maturities of long-term debt |
(25,000 | ) | — | |||
| Total |
$ | 275,000 | 300,000 | |||
Revolving Credit Agreement
In July 2009, the company executed an amended and restated revolving credit agreement increasing its borrowing capacity to $450.0 million and extending its maturity to July 2012. Borrowings under the amended revolving credit facility bear interest at the company’s option at the greater of (i) prime or the federal funds rate plus 2.0 to 3.0%, or (ii) Eurodollar rates plus margins ranging from 3.0 to 4.0%, based on the company’s consolidated funded debt to total capitalization ratio. Commitment fees on the unused portion of this facility are in the range of 0.50 to 0.75% based on the company’s funded debt to total capitalization ratio. The amended facility provides for a maximum ratio of consolidated debt to consolidated total
F-18
Table of Contents
Index to Financial Statements
TIDEWATER INC.
NOTES TO CONSOLIDATED FINANCIAL STATEMENTS
Years ended March 31, 2010, 2009, and 2008
capitalization of 0.45 as compared to a maximum ratio of consolidated debt to total capitalization of 0.55 with the prior agreement. All other terms, including the financial and negative covenants, are customary for facilities of its type and consistent with the prior agreement in all material respects.
The revolving credit facility provides, among other things, for the issuance of letters of credit that the company may utilize to guarantee performance under some of our operating contracts, as well as insurance, tax and other obligations in various jurisdictions. The facility also provides for customary fees and expense reimbursements and includes other covenants (including limitations on the incurrence of debt, mergers and other fundamental changes, limits on the company’s ability to encumber its assets for the benefit of others and asset sales) and events of default (including a change of control) that are customary for similar facilities.
There were no borrowings outstanding under the amended and restated revolving credit agreement at March 31, 2010, and the full $450.0 million was available at March 31, 2010. There were no outstanding borrowings under the company’s previous revolving credit agreement at March 31, 2009.
Debt Costs
The company capitalizes a portion of its interest costs incurred on borrowed funds used to construct vessels. Interest and debt costs incurred, net of interest capitalized for fiscal 2010, 2009, and 2008 and was approximately $1.7 million, $0.7 million, and $7.0 million, respectively. Interest costs capitalized during fiscal 2010, 2009 and 2008 was approximately $15.6 million, $13.8 million, and $10.5 million, respectively.
| (5) | EMPLOYEE RETIREMENT PLANS |
U.S. Defined Benefit Pension Plan
A defined benefit pension plan (pension plan) covers certain U.S. citizen employees and employees who are permanent residents of the United States. Benefits are based on years of service and employee compensation. Approximately 99% of the pension plan assets are invested in fixed income securities with the balance invested in cash and cash equivalents. The plan does not invest in Tidewater stock. The company’s policy is to contribute no less than the minimum required contribution by law and no more than the maximum deductible amount. The company contributed $4.7 million and $4.4 million to the defined benefit pension trust during fiscal 2010 and 2009, respectively. The company does not expect to contribute to the plan during fiscal 2011.
In December 2009, the Board of Directors adopted amendments to the pension plan whereby effective December 31, 2010, the accrual of benefits would be discontinued. On that date, previously accrued pension benefits under the pension plan will be frozen for the approximately 70 active employees who participate in the plan. This change will not affect benefits earned by participants prior to January 1, 2011. Because future benefit accruals under the pension plan will be eliminated, the active employees who are participants in the pension plan will become participants in the company’s defined contribution retirement plan effective January 1, 2011. These changes will provide the company more predictable retirement plan costs and cash flows. By freezing the benefits, the company’s future benefit obligations and requirements for cash contributions for the frozen pension plan will be reduced. Any gains or losses associated with the curtailment of the pension plan were immaterial.
Supplemental Executive Retirement Plan
The company also offers a supplemental retirement plan (supplemental plan) that provides pension benefits to certain employees in excess of those allowed under the company’s tax-qualified pension plan. Assets of this non-contributory defined benefit plan are held in a Rabbi Trust, invested in a variety of marketable securities, none of which is Tidewater stock. The Trust assets, which are included in “other assets” in the company’s consolidated balance sheet, are recorded at fair value with unrealized gains or losses included in other comprehensive income. Included in other assets at March 31, 2010 and 2009, is $16.2 million and $12.4 million, respectively, of investments held in a Rabbi Trust for the benefit of participants in the
F-19
Table of Contents
Index to Financial Statements
TIDEWATER INC.
NOTES TO CONSOLIDATED FINANCIAL STATEMENTS
Years ended March 31, 2010, 2009, and 2008
supplemental plan. The carrying value of the trust assets at March 31, 2010 and 2009, is after the effect of $0.8 million and $3.4 million, respectively, of after-tax unrealized losses ($1.3 million and $5.3 million pre-tax, respectively), which are included in accumulated other comprehensive income (other stockholders’ equity). To the extent that trust assets are liquidated to fund benefit payments, gains or losses, if any, will be recognized at that time. The company’s obligation under the supplemental plan, which is included in “other current liabilities” and “other liabilities and deferred credits” on the consolidated balance sheet, amounted to $24.0 million and $27.7 million, respectively, at March 31, 2010 and 2009.
The supplemental plan was amended in December 2008 to allow participants the option to elect a lump sum benefit in lieu of other payment options currently provided by the plan. As a result of the amendment, certain participants received a lump sum distribution in July 2009 in settlement of the supplemental plan obligation. The aggregate payment to those participants electing the lump sum distribution in July 2009 was $8.7 million. A settlement loss of $3.6 million was recorded in general and administrative expenses during the quarter ended September 30, 2009.
The company did not contribute to the supplemental trust during fiscal 2010 and 2009. No decision has been made as to any funding to be completed during fiscal 2011. The supplemental plan is a non-qualified plan and, as such, the company is not required to make contributions to the supplemental plan.
Postretirement Benefit Plan
Qualified retired employees currently are covered by a program which provides limited health care and life insurance benefits. Costs of the program are based on actuarially determined amounts and are accrued over the period from the date of hire to the full eligibility date of employees who are expected to qualify for these benefits. This plan is funded through payments as benefits are required.
Investment Strategies
Pension Plan
The obligations of our pension plan are supported by assets held in a trust for the payment of future benefits. The company is obligated to adequately fund the trust. For the pension plan assets, the company has the following primary investment objectives: (1) closely match the cash flows from the plan’s investments from interest payments and maturities with the payment obligations from the plan’s liabilities; (2) closely match the duration of plan assets with the duration of plan liabilities and (3) enhance the plan’s investment returns without taking on undue risk by industries, maturities or geographies of the underlying investment holdings.
If the plan assets are less than the plan liabilities, the pension plan assets will be invested exclusively in fixed income debt securities. Any investments in corporate bonds shall be at least investment grade, while mortgage and asset-backed securities must be rated “A” or better. If an investment is placed on credit watch, or is downgraded to a level below the investment grade, the holding will be liquidated, even at a loss, in a reasonable time period. The plan will only hold investments in equity securities if the plan assets exceed the estimated plan liabilities.
The cash flow requirements of the pension plan will be analyzed at least annually. Portfolio repositioning will be required when material changes to the plan liabilities are identified and when opportunities arise to better match cash flows with the known liabilities. Additionally, trades will occur when opportunities arise to improve the yield-to-maturity or credit quality of the portfolio.
Supplemental Plan
The investment policy of the supplemental plan is to assess the historical returns and risk associated with alternative investment strategies to achieve an expected rate of return of 5% to 7% for equity securities, 1% to 3% for debt securities and up to 1% for cash and cash equivalent investments. The objectives of the plan are designed to maximize total returns within prudent parameters of risk for a retirement plan of this type.
F-20
Table of Contents
Index to Financial Statements
TIDEWATER INC.
NOTES TO CONSOLIDATED FINANCIAL STATEMENTS
Years ended March 31, 2010, 2009, and 2008
Whereas fluctuating rates of return are characteristic of the securities markets, the investment objective of the supplemental plan is to achieve investment returns sufficient to meet the actuarial assumptions. This is defined as an investment return greater than the current actuarial discount rate assumption of 5.5%, which is subject to annual upward or downward revisions. All objectives are based upon a five to ten year investment horizon.
Equity securities may represent up to 75% of the market value of the plan assets with a minimum requirement of 55% of the market value of the plan. Equity holdings shall be restricted to issues of corporations that are actively traded on the major U.S. exchanges and NASDAQ. Debt securities will represent a maximum of 45% and a minimum of 25% of the market value of the plan. Debt security investments may include all securities issued by the U.S. Treasury or other federal agencies and investment grade corporate bonds. Up to 20% of the fixed income portfolio may be invested in bonds rated below investment grade. Cash and cash equivalent investments may represent a small portion of the plan market value, generally less than 10%. When a particular asset class exceeds its minimum or maximum allocation ranges, rebalancing will be addressed upon review of the quarterly performance reports and as cash contributions and withdrawals are made.
The following table provides the target and actual asset allocations for the pension plan and the supplemental plan:
| Target | Actual as of 2010 |
Actual as of 2009 |
|||||||
| Pension plan: |
|||||||||
| Equity securities |
— | — | 9 | % | |||||
| Debt securities |
100 | % | 99 | % | 61 | % | |||
| Cash and other |
— | 1 | % | 30 | % | ||||
| Total |
100 | % | 100 | % | 100 | % | |||
| Supplemental plan: |
|||||||||
| Equity securities |
65 | % | 61 | % | 48 | % | |||
| Debt securities |
35 | % | 36 | % | 46 | % | |||
| Cash and other |
— | 3 | % | 6 | % | ||||
| Total |
100 | % | 100 | % | 100 | % | |||
Significant Concentration Risks
The pension plan and the supplemental plan assets are periodically evaluated for concentration risks. As of March 31, 2010, the company did not have any individual asset investments that comprised 10% or more of each plan’s overall assets.
The pension plan assets will primarily be invested in debt securities with no more than the greater of 5% of the fixed income portfolio or $2.5 million being invested in the securities of a single issuer, except investments in U.S. Treasury and other federal agency obligations. In the event that plan assets exceed the estimated plan liabilities for the pension plan, up to 15% of the market value of the assets will be invested in equity securities. The investment policy sets forth that the maximum single investment of the equity portfolio is 5% of the portfolio market value. Further, investments in foreign securities are restricted to American Depository Receipts (ADR) and stocks listed on the U.S. stock exchanges and may not exceed 10% of the equity portfolio.
The current diversification policy for the supplemental plan sets forth that equity securities in any single industry sector shall not exceed 25% of the equity portfolio market value and shall not exceed 10% market value of the equity portfolio for equity holdings in any single corporation. Additionally, debt securities should be diversified between issuers within each sector with no one issuer comprising more than 10% of the aggregate fixed income portfolio, excluding issues of the U.S. Treasury or other federal agencies.
F-21
Table of Contents
Index to Financial Statements
TIDEWATER INC.
NOTES TO CONSOLIDATED FINANCIAL STATEMENTS
Years ended March 31, 2010, 2009, and 2008
Fair Value of Pension Plan and Supplemental Plan Assets
The fair value of the pension plan assets and the supplemental plan assets as of March 31, 2010 and 2009 were as follows:
| Defined Benefit Plan | Supplemental Plan | ||||||||||
| (In thousands) |
2010 | 2009 | 2010 | 2009 | |||||||
| Equity securities: |
|||||||||||
| Common stock |
$ | — | 3,247 | 7,323 | 4,439 | ||||||
| Preferred stock |
— | — | 11 | 2 | |||||||
| Foreign stock |
— | 18 | 432 | 321 | |||||||
| American depository receipts |
— | — | 2,049 | 1,226 | |||||||
| Real estate investment trusts |
— | 172 | 27 | 8 | |||||||
| Debt securities: |
|||||||||||
| Government agency securities |
3,826 | 3,998 | 3,267 | 3,408 | |||||||
| Corporate debt securities |
46,119 | 20,861 | — | — | |||||||
| Open ended mutual funds |
— | — | 2,595 | 2,288 | |||||||
| Cash and cash equivalents |
376 | 12,295 | 553 | 796 | |||||||
| Total investments |
$ | 50,321 | 40,591 | 16,257 | 12,488 | ||||||
| Accrued income |
923 | 567 | — | — | |||||||
| Other pending transactions |
— | — | (58 | ) | (55 | ) | |||||
| Total fair value of plan assets |
$ | 51,244 | 41,158 | 16,199 | 12,433 | ||||||
The following table provides the fair value hierarchy for the pension plan assets and the supplemental plan assets measured at fair value as of March 31, 2010:
| (In thousands) |
Total | Quoted prices in active markets (Level 1) |
Significant observable inputs (Level 2) |
Significant unobservable inputs (Level 3) | |||||
| Pension plan measured at fair value: |
|||||||||
| Debt securities: |
|||||||||
| Government securities |
$ | 3,826 | 1,482 | 2,344 | — | ||||
| Corporate debt securities |
46,119 | — | 46,119 | — | |||||
| Cash and cash equivalents |
376 | 376 | — | — | |||||
| Total |
$ | 50,321 | 1,858 | 48,463 | — | ||||
| Supplemental plan measured at fair value: |
|||||||||
| Equity securities: |
|||||||||
| Common stock |
$ | 7,323 | 7,323 | — | — | ||||
| Preferred stock |
11 | 11 | — | — | |||||
| Foreign stock |
432 | 432 | — | — | |||||
| American depository receipts |
2,049 | 2,021 | 28 | — | |||||
| Real estate investment trusts |
27 | 27 | — | — | |||||
| Debt securities: |
|||||||||
| Government debt securities |
3,267 | 1,243 | 2,024 | — | |||||
| Open ended mutual funds |
2,595 | 2,595 | — | — | |||||
| Cash and cash equivalents |
553 | 53 | 500 | — | |||||
| Total |
$ | 16,257 | 13,705 | 2,552 | — | ||||
F-22
Table of Contents
Index to Financial Statements
TIDEWATER INC.
NOTES TO CONSOLIDATED FINANCIAL STATEMENTS
Years ended March 31, 2010, 2009, and 2008
Plan Assets and Obligations
Changes in plan assets and obligations during the years ended March 31, 2010 and 2009 and the funded status of the U.S. defined benefit pension plan and the supplemental plan (referred to collectively as “Pension Benefits”) and the postretirement health care and life insurance plan (referred to as “Other Benefits”) at March 31, 2010 and 2009 were as follows:
| Pension Benefits | Other Benefits | ||||||||||||
| (In thousands) |
2010 | 2009 | 2010 | 2009 | |||||||||
| Change in benefit obligation |
|||||||||||||
| Benefit obligation at beginning of year |
$ | 74,022 | 75,363 | 30,513 | 33,507 | ||||||||
| Service cost |
900 | 1,061 | 1,005 | 1,124 | |||||||||
| Interest cost |
4,700 | 4,598 | 2,145 | 2,056 | |||||||||
| Participant contributions |
— | — | 458 | 411 | |||||||||
| Plan amendments |
— | — | — | 2,010 | |||||||||
| Benefits paid |
(3,374 | ) | (3,820 | ) | (1,015 | ) | (1,097 | ) | |||||
| Plan settlements |
(8,635 | ) | — | — | — | ||||||||
| Actuarial (gain) loss |
11,944 | (3,180 | ) | (1,892 | ) | (7,498 | ) | ||||||
| Benefit obligation at end of year |
79,557 | 74,022 | 31,214 | 30,513 | |||||||||
| Change in plan assets |
|||||||||||||
| Fair value of plan assets at beginning of year |
$ | 41,158 | 42,909 | — | — | ||||||||
| Actual return |
7,923 | (3,600 | ) | — | — | ||||||||
| Employer contributions |
14,172 | 5,669 | 557 | 686 | |||||||||
| Participant contributions |
— | — | 458 | 411 | |||||||||
| Benefits paid |
(3,374 | ) | (3,820 | ) | (1,015 | ) | (1,097 | ) | |||||
| Settlement paid |
(8,635 | ) | — | — | — | ||||||||
| Fair value of plan assets at end of year |
51,244 | 41,158 | — | — | |||||||||
| Reconciliation of funded status |
|||||||||||||
| Fair value of plan assets |
$ | 51,244 | 41,158 | — | — | ||||||||
| Benefit obligation |
79,557 | 74,022 | 31,214 | 30,513 | |||||||||
| Unfunded status |
$ | (28,313 | ) | (32,864 | ) | (31,214 | ) | (30,513 | ) | ||||
| Net amount recognized in the balance sheet consists of: |
|||||||||||||
| Current liabilities |
$ | (940 | ) | (9,687 | ) | (1,702 | ) | (1,973 | ) | ||||
| Noncurrent liabilities |
(27,373 | ) | (23,177 | ) | (29,512 | ) | (28,540 | ) | |||||
| Net amount recognized |
$ | (28,313 | ) | (32,864 | ) | (31,214 | ) | (30,513 | ) | ||||
The following table provides the projected benefit obligation and accumulated benefit obligation for the pension plans:
| (In thousands) |
2010 | 2009 | |||
| Projected benefit obligation |
$ | 79,557 | 74,022 | ||
| Accumulated benefit obligation |
78,257 | 69,884 | |||
The following table provides information for pension plans with an accumulated benefit obligation in excess of plan assets (includes both the pension plan and supplemental plan):
| (In thousands) |
2010 | 2009 | |||
| Projected benefit obligation |
$ | 79,557 | 74,022 | ||
| Accumulated benefit obligation |
78,257 | 69,884 | |||
| Fair value of plan assets |
51,244 | 41,158 | |||
F-23
Table of Contents
Index to Financial Statements
TIDEWATER INC.
NOTES TO CONSOLIDATED FINANCIAL STATEMENTS
Years ended March 31, 2010, 2009, and 2008
Net periodic pension cost for the pension plan and the supplemental plan for 2010, 2009 and 2008 include the following components:
| (In thousands) |
2010 | 2009 | 2008 | |||||||
| Service cost |
$ | 900 | 1,061 | 1,186 | ||||||
| Interest cost |
4,700 | 4,598 | 4,207 | |||||||
| Expected return on plan assets |
(2,305 | ) | (2,540 | ) | (2,551 | ) | ||||
| Amortization of prior service cost |
38 | 13 | 24 | |||||||
| Recognized actuarial loss |
1,352 | 1,598 | 1,953 | |||||||
| Curtailment |
3,658 | — | — | |||||||
| Net periodic pension cost |
$ | 8,343 | 4,730 | 4,819 | ||||||
Net periodic postretirement health care and life insurance costs for 2010, 2009 and 2008 include the following components:
| (In thousands) |
2010 | 2009 | 2008 | |||||||
| Service cost |
$ | 1,005 | 1,124 | 1,367 | ||||||
| Interest cost |
2,145 | 2,056 | 1,831 | |||||||
| Amortization of prior service cost |
(2,006 | ) | (1,985 | ) | (2,187 | ) | ||||
| Recognized actuarial loss |
457 | 1,074 | 1,357 | |||||||
| Net periodic postretirement benefit cost |
$ | 1,601 | 2,269 | 2,368 | ||||||
Other changes in plan assets and benefit obligations recognized in other comprehensive income for fiscal 2010 and 2009 include the following components:
| Pension Benefits | Other Benefits | ||||||||||||
| (In thousands) |
2010 | 2009 | 2010 | 2009 | |||||||||
| Change in benefit obligation |
|||||||||||||
| Transition obligation |
$ | — | — | — | — | ||||||||
| Prior service cost |
— | — | — | 2,010 | |||||||||
| Net loss (gain) |
6,326 | 2,620 | (1,892 | ) | (7,498 | ) | |||||||
| Settlement of net transition obligation |
(3,634 | ) | — | — | — | ||||||||
| Amortization of transition obligation |
— | — | — | — | |||||||||
| Amortization of prior service cost |
(54 | ) | (13 | ) | 2,006 | 1,985 | |||||||
| Amortization of net (loss) gain |
(1,352 | ) | (1,598 | ) | (457 | ) | (1,074 | ) | |||||
| Total recognized in other comprehensive income (loss) |
$ | 1,277 | 1,009 | (343 | ) | (4,577 | ) | ||||||
| Net of 35% tax rate |
830 | 656 | (223 | ) | (2,975 | ) | |||||||
Amounts recognized as a component of accumulated other comprehensive (income) loss as of March 31, 2010 are as follows:
| (In thousands) |
Pension Benefits | Other Benefits | ||||
| Unrecognized actuarial loss |
$ | 19,944 | 4,579 | |||
| Unrecognized prior service cost (benefit) |
14 | (14,833 | ) | |||
| Pre-tax amount included in accumulated other comprehensive loss (income) |
$ | 19,958 | (10,254 | ) | ||
The company expects to recognize the following amounts as a component of net periodic benefit costs during the next fiscal year:
| (In thousands) |
Pension Benefits | Other Benefits | ||||
| Unrecognized actuarial loss |
$ | 1,638 | 167 | |||
| Unrecognized prior service cost (benefit) |
14 | (2,044 | ) | |||
Assumptions used to determine net benefit obligations for the fiscal years ended March 31 were as follows:
| Pension Benefits | Other Benefits | |||||||||||
| 2010 | 2009 | 2010 | 2009 | |||||||||
| Discount rate |
5.75 | % | 7.25 | % | 5.75 | % | 7.25 | % | ||||
| Rates of annual increase in compensation levels |
3.00 | % | 3.00 | % | N/A | N/A | ||||||
F-24
Table of Contents
Index to Financial Statements
TIDEWATER INC.
NOTES TO CONSOLIDATED FINANCIAL STATEMENTS
Years ended March 31, 2010, 2009, and 2008
Assumptions used to determine net periodic benefit costs for the fiscal years ended March 31 were as follows:
| Pension Benefits | Other Benefits | |||||||||||||||||
| 2010 | 2009 | 2008 | 2010 | 2009 | 2008 | |||||||||||||
| Discount rate |
7.25 | % | 6.25 | % | 5.75 | % | 7.25 | % | 6.25 | % | 5.75 | % | ||||||
| Expected long-term rate of return on assets |
5.75 | % | 6.00 | % | 6.25 | % | N/A | N/A | N/A | |||||||||
| Rates of annual increase in compensation levels |
3.00 | % | 3.00 | % | 3.00 | % | N/A | N/A | N/A | |||||||||
To develop the expected long-term rate of return on assets assumption, the company considered the current level of expected returns on various asset classes. The expected return for each asset class was then weighted based on the target asset allocation to develop the expected return on plan assets assumption for the portfolio.
Based upon the assumptions used to measure the company’s qualified pension and postretirement benefit obligation at March 31, 2010, including pension and postretirement benefits attributable to estimated future employee service, the company expects that benefits to be paid over the next ten years will be as follows:
| (In thousands) | |||||
| Year ending March 31, |
Pension Benefits | Other Benefits | |||
| 2011 |
$ | 4,289 | 1,702 | ||
| 2012 |
4,677 | 1,822 | |||
| 2013 |
4,987 | 1,956 | |||
| 2014 |
5,580 | 2,017 | |||
| 2015 |
5,849 | 2,128 | |||
| 2016 – 2020 |
31,090 | 11,814 | |||
| Total 10-year estimated future benefit payments |
$ | 56,472 | 21,439 | ||
The assumed health care cost trend rate used in measuring the accumulated postretirement benefit obligation at March 31, 2010 was 10% for pre-65 medical and prescription drug coverage and 7% for post-65 medical coverage; gradually declining to 4.5% in the year 2029. The assumed health care cost trend rate used in measuring the net periodic postretirement benefit cost for the year ended March 31, 2010 was 10% for pre-65 medical and prescription drug coverage and 7% for post-65 medical coverage; gradually declining to 4.5% in the year 2029. The health care cost trend rate used in measuring the net periodic postretirement benefit cost for fiscal 2011 is expected to be 9.5% for pre-65 medical and prescription drug coverage and 7% for post-65 medical coverage. A 1% increase in the assumed health care cost trend rates for each year would increase the accumulated postretirement benefit obligation by approximately $3.6 million at March 31, 2010 and increase the total of service and interest cost for the year ended March 31, 2010 by $0.4 million. A 1% decrease in the assumed health care cost trend rates for each year would decrease the accumulated postretirement benefit obligation by approximately $3.0 million at March 31, 2010 and decrease the total of service and interest cost for the year ended March 31, 2010 by $0.3 million.
Defined Contribution Plans
Upon meeting various citizenship, age and service requirements, employees are eligible to participate in a defined contribution savings plan and can contribute from 2% to 75% of their base salary to an employee benefit trust. The company matches with company common stock 50% of the first 6% of eligible compensation deferred by the employee. The plan held 264,194 shares and 263,458 shares of the company’s common stock at March 31, 2010 and 2009, respectively. Amounts charged to expense for the plan for 2010, 2009 and 2008 were $1.6 million, $1.9 million and $2.0 million, respectively. Forfeitures totaling approximately $0.2 million, $0.2 million and $0.1 million reduced the costs of the plan for fiscal 2010, 2009 and 2008, respectively.
A non-qualified supplemental savings plan is provided to executive officers and designated employees who have the opportunity to defer up to 50% of their eligible compensation that cannot be deferred under the existing 401(k) plan due to IRS limitations. A company match is provided on these contributions equal to 50% of the first 6% of eligible compensation deferred by the employee. The plan also allows participants to
F-25
Table of Contents
Index to Financial Statements
TIDEWATER INC.
NOTES TO CONSOLIDATED FINANCIAL STATEMENTS
Years ended March 31, 2010, 2009, and 2008
defer up to 100% of their bonuses. In addition, an amount equal to any refunds that must be made due to the failure of the 401(k) nondiscrimination test may be deferred into this plan.
Certain benefits programs are maintained in several other countries that provide retirement income for covered employees.
Defined Contribution Retirement Plan
A defined contribution retirement plan covers all eligible U.S. fleet personnel, along with all new eligible employees of the company hired after December 31, 1995. This plan is noncontributory by the employee, but the company has contributed in cash 3% of an eligible employee’s compensation to an employee benefit trust. The cost of the plan for fiscal 2010, 2009 and 2008 was $1.6 million, $1.8 million and $2.2 million, respectively. Forfeitures totaling approximately $0.4 million and $0.1 million reduced the costs of the plan for fiscal 2010 and 2009, respectively. No amounts were forfeited during fiscal 2008.
| (6) | OTHER ASSETS, ACCRUED EXPENSES, OTHER CURRENT LIABILITIES, AND OTHER LIABILITIES AND DEFERRED CREDITS |
A summary of Other Assets at March 31 follows:
| (In thousands) |
2010 | 2009 | |||
| Recoverable insurance losses |
$ | 12,809 | 8,035 | ||
| Deferred income tax assets |
35,635 | 29,836 | |||
| Other |
36,094 | 22,182 | |||
| $ | 84,538 | 60,053 | |||
A summary of Accrued Expenses at March 31 follows:
| (In thousands) |
2010 | 2009 | |||
| Payroll and related payables |
$ | 31,385 | 36,769 | ||
| Commissions payable |
15,783 | 16,364 | |||
| Accrued vessel major repairs and maintenance costs |
3,924 | 4,755 | |||
| Other accrued vessel expenses |
39,454 | 31,169 | |||
| Accrued fuel expense |
10,143 | 9,571 | |||
| Incentive plans |
4,910 | 9,892 | |||
| Accrued interest expense |
2,182 | 2,177 | |||
| Proposed SEC settlement |
11,396 | — | |||
| Other accrued expenses |
308 | 456 | |||
| $ | 119,485 | 111,153 | |||
A summary of Other Current Liabilities at March 31 follows:
| (In thousands) |
2010 | 2009 | |||
| Income tax payables |
$ | 1,177 | 24,679 | ||
| Deferred credits – current |
12,559 | 10,467 | |||
| Dividend Payable |
9 | — | |||
| $ | 13,745 | 35,146 | |||
A summary of Other Liabilities and Deferred Credits at March 31 follows:
| (In thousands) |
2010 | 2009 | |||
| Postretirement benefits liability |
$ | 29,512 | 28,540 | ||
| Pension liability |
33,146 | 37,497 | |||
| Deferred gain on vessel sales |
39,568 | — | |||
| Income taxes |
4,450 | 35,474 | |||
| Other |
18,626 | 15,030 | |||
| $ | 125,302 | 116,541 | |||
F-26
Table of Contents
Index to Financial Statements
TIDEWATER INC.
NOTES TO CONSOLIDATED FINANCIAL STATEMENTS
Years ended March 31, 2010, 2009, and 2008
| (7) | STOCK-BASED COMPENSATION AND INCENTIVE PLANS |
General
The company’s employee stock option, restricted stock, and phantom stock plans are long-term retention plans that are intended to attract, retain and provide incentives for talented employees, including officers and non-employee directors, and to align stockholder and employee interests. The company believes its employee stock option plans are critical to its operations and productivity. The employee stock option plans allow the company to grant, on a discretionary basis, both incentive and non-qualified stock options as well as restricted stock.
Under the company’s stock option and restricted stock plans, the Compensation Committee of the Board of Directors has the authority to grant stock options and restricted shares of the company’s stock to officers and other key employees. At March 31, 2010, 3,775,801 shares of common stock are reserved for issuance under the plans of which 1,583,534 shares are available for future grants. Under the terms of the plans, stock options are granted with an exercise price equal to the stock’s closing fair market value on the date of grant.
Stock Option Plans
The company has granted stock options to its directors and employees, including officers, over the last several years under several different stock incentive plans. Generally, options granted vest annually over a one to three-year vesting period measured from the date of grant. Options not previously exercised expire at the earlier of either three months after termination of the grantee’s employment or ten years after the date of grant. All of the stock options are classified as equity awards.
The company uses the Black-Scholes option-pricing model to determine the fair value of options granted and to calculate the share-based compensation expense. The fair value and assumptions used during fiscal 2010, 2009 and 2008 are as follows:
| 2010 | 2009 | 2008 | ||||||||||
| Weighted average fair value of stock options granted |
$ | 14.87 | $ | 10.42 | $ | 18.11 | ||||||
| Risk-free interest rate |
2.66 | % | 2.20 | % | 2.64 | % | ||||||
| Expected dividend yield |
2.19 | % | 2.90 | % | 1.05 | % | ||||||
| Expected stock price volatility |
38.40 | % | 39.88 | % | 33.39 | % | ||||||
| Expected stock option life |
6.0 years | 5.5 years | 5.5 years | |||||||||
The following table sets forth a summary of stock option activity of the company for fiscal years 2010, 2009 and 2008:
| Weighted-average Exercise Price |
Number of Shares |
|||||
| Outstanding at March 31, 2007 |
$ | 39.13 | 2,462,671 | |||
| Granted |
57.14 | 293,241 | ||||
| Exercised |
35.62 | (1,297,483 | ) | |||
| Expired or cancelled/forfeited |
59.95 | (20,666 | ) | |||
| Outstanding at March 31, 2008 |
45.67 | 1,437,763 | ||||
| Granted |
35.06 | 545,417 | ||||
| Exercised |
38.87 | (169,506 | ) | |||
| Expired or cancelled/forfeited |
55.76 | (1,667 | ) | |||
| Outstanding at March 31, 2009 |
43.10 | 1,812,007 | ||||
| Granted |
45.75 | 463,305 | ||||
| Exercised |
30.13 | (62,112 | ) | |||
| Expired or cancelled/forfeited |
51.96 | (20,933 | ) | |||
| Outstanding at March 31, 2010 |
$ | 43.94 | 2,192,267 | |||
F-27
Table of Contents
Index to Financial Statements
TIDEWATER INC.
NOTES TO CONSOLIDATED FINANCIAL STATEMENTS
Years ended March 31, 2010, 2009, and 2008
The intrinsic value of options exercised during fiscal 2010, 2009 and 2008 was $1.1 million, $4.6 million and $39.2 million, respectively. There were 256,550, 230,493 and 229,664 stock options that vested during fiscal 2010, 2009 and 2008, respectively, and the fair value of the stock options that vested was $3.3 million, $4.5 million and $4.8 million, respectively.
Information regarding the 2,192,267 options outstanding at March 31, 2010 can be grouped into three general exercise-price ranges as follows:
| Exercise Price Range | |||||||||
| At March 31, 2010 |
$25.84 - $33.83 | $35.29 - $45.75 | $55.76 - $65.69 | ||||||
| Options outstanding |
751,225 | 713,466 | 727,576 | ||||||
| Weighted average exercise price |
$ | 31.96 | $ | 43.61 | $ | 56.64 | |||
| Weighted average remaining contractual life |
7.1 years | 6.8 years | 7.0 years | ||||||
| Options exercisable |
403,593 | 250,161 | 624,771 | ||||||
| Weighted average exercise price of options exercisable |
$ | 30.35 | $ | 39.64 | $ | 56.52 | |||
| Weighted average remaining contractual life of exercisable shares |
5.5 years | 2.6 years | 6.8 years | ||||||
The aggregate intrinsic value of the options outstanding at March 31, 2010 was $14.1 million. The aggregate intrinsic value of options exercisable at March 31, 2010 was $8.7 million.
At March 31, 2010, 2009, and 2008, the number of options exercisable under the stock option plans was 1,278,525, 1,095,581 and 1,036,261, respectively; and the weighted average exercise price of those options was $44.96, $44.98 and $41.44, respectively.
The compensation expense related to stock-options was $3.6 million, $3.1 million and $4.7 million during fiscal 2010, 2009 and 2008, respectively, in accordance with ASC 718, which had the effect of reducing basic and diluted earnings per share by $0.05, $0.05 and $0.07, respectively. No stock-option compensation costs were capitalized as part of the cost of an asset during fiscal 2010, 2009 and 2008.
As of March 31, 2010, total unrecognized stock-option compensation costs amounted to $12.0 million or $8.6 million net of tax. Compensation costs for stock options that have not yet vested will be recognized as the underlying stock options vest over the appropriate future period. The level of unrecognized stock-option compensation will be affected by any future stock option grants and by the termination of any employee who has received stock options that are unvested as of their termination date.
Restricted Stock
The company has granted restricted shares to key employees, including officers, under several different employee stock plans. These plans provide for the granting of restricted stock and/or performance awards to officers and key employees. The company awards both time-based shares and performance-based shares of restricted stock. The restrictions on the time-based restricted stock lapse generally over a four year period and require no goals to be achieved other than the passage of time and continued employment. The restrictions on the performance-based restricted stock lapse if the company meets specific targets. During the restricted period, the restricted shares may not be transferred or encumbered, but the recipient has the right to vote and receive dividends on the restricted shares. All of the restricted shares are classified as equity awards in stockholders’ equity as deferred compensation – restricted stock. The deferred amount is generally amortized by equal monthly charges to earnings over the respective four-year vesting periods.
F-28
Table of Contents
Index to Financial Statements
TIDEWATER INC.
NOTES TO CONSOLIDATED FINANCIAL STATEMENTS
Years ended March 31, 2010, 2009, and 2008
The following table sets forth a summary of restricted stock activity of the company for fiscal 2010, 2009 and 2008:
| Weighted-average Grant-Date Fair Value |
Time Based Shares |
Performance Based Shares |
|||||||
| Non-vested balance at March 31, 2007 |
$ | 50.38 | 96,095 | 385,987 | |||||
| Granted |
58.32 | — | 100,652 | ||||||
| Vested |
45.47 | (59,177 | ) | (76,241 | ) | ||||
| Cancelled/forfeited |
53.30 | (5,450 | ) | (25,620 | ) | ||||
| Non-vested balance at March 31, 2008 |
53.67 | 31,468 | 384,778 | ||||||
| Granted |
34.89 | 112,248 | 62,767 | ||||||
| Vested |
48.96 | (13,527 | ) | (153,274 | ) | ||||
| Cancelled/forfeited |
54.23 | (4,436 | ) | (1,500 | ) | ||||
| Non-vested balance at March 31, 2009 |
47.69 | 125,753 | 292,771 | ||||||
| Granted |
45.75 | 75,722 | 37,861 | ||||||
| Vested |
52.53 | (40,833 | ) | (116,950 | ) | ||||
| Cancelled/forfeited |
56.51 | (204 | ) | (797 | ) | ||||
| Non-vested balance at March 31, 2010 |
$ | 45.03 | 160,438 | 212,885 | |||||
The total grant date fair value of restricted stock vested during fiscal 2010, 2009 and 2008 was $8.3 million, $8.2 million and $6.2 million, respectively. Also, restrictions on approximately 43,464 time-based shares and 54,128 performance-based shares outstanding at March 31, 2010 would lapse during fiscal 2011 should performance-based targets be achieved.
The compensation expense related to restricted stock totaled $5.1 million, $7.8 million and $7.1 million during fiscal 2010, 2009 and 2008, respectively. No restricted stock compensation costs were capitalized as part of the cost of an asset. As of March 31, 2010, total unrecognized restricted stock compensation costs amounted to $15.0 million, or $10.1 million net of tax. The amount of unrecognized restricted stock compensation will be affected by any future restricted stock grants and by the separation of an employee from the company who has received restricted stock grants that are unvested as of their separation date. There were no modifications to the restricted stock awards during fiscal 2010.
Phantom Stock Plan
The Compensation Committee of the Board of Directors approved the creation of the Phantom Stock Plan in September 2006 to provide additional incentive compensation to certain key employees who are not officers of the company. The plan awards stock units to participants who have the right to receive the value of a share of common stock in cash from the company. Participants have no voting or other rights as a shareholder with respect to any common stock as a result of participation in the phantom stock plan. The phantom shares generally have a three or four-year vesting period from the grant date of the award provided the employee remains employed by the company during the vesting period. Participants receive dividend equivalents at the same rate as dividends on the company’s common stock.
F-29
Table of Contents
Index to Financial Statements
TIDEWATER INC.
NOTES TO CONSOLIDATED FINANCIAL STATEMENTS
Years ended March 31, 2010, 2009, and 2008
The following table sets forth a summary of phantom stock activity of the company for fiscal 2010, 2009 and 2008:
| Weighted-average Grant-Date Fair Value |
Time Based Shares |
Performance Based Shares |
|||||||
| Non-vested balance at March 31, 2007 |
$ | 58.50 | 5,445 | 41,600 | |||||
| Granted |
56.77 | 25,904 | 40,847 | ||||||
| Vested |
55.76 | (652 | ) | — | |||||
| Cancelled/forfeited |
58.58 | — | (4,500 | ) | |||||
| Non-vested balance at March 31, 2008 |
57.45 | 30,697 | 77,947 | ||||||
| Granted |
34.48 | 118,629 | 3,500 | ||||||
| Vested |
47.42 | (13,493 | ) | (9,622 | ) | ||||
| Cancelled/forfeited |
57.23 | (3,906 | ) | (1,500 | ) | ||||
| Non-vested balance at March 31, 2009 |
44.73 | 131,927 | 70,325 | ||||||
| Granted |
45.69 | 77,004 | — | ||||||
| Vested |
45.34 | (36,841 | ) | (19,875 | ) | ||||
| Cancelled/forfeited |
43.14 | (2,779 | ) | (748 | ) | ||||
| Non-vested balance at March 31, 2010 |
$ | 44.94 | 169,311 | 49,702 | |||||
The total grant date fair value of phantom stock vested during fiscal 2010, 2009 and 2008 was $2.6 million, $1.1 million, and $36,356, respectively. Also, restrictions on 53,667 time-based shares and 8,969 performance-based shares outstanding at March 31, 2010 would lapse during fiscal 2011 should performance-based targets be achieved. The fair value of the non-vested phantom shares at March 31, 2010 is $47.27 per unit.
The compensation expense related to the Phantom Stock Plan was $2.5 million, $1.4 million, and $0.7 million during fiscal 2010, 2009 and 2008, respectively. No phantom stock compensation costs were capitalized as part of the cost of an asset. As of March 31, 2010, total unrecognized phantom stock compensation costs amounted to $8.8 million, or $7.6 million net of tax. The liability for this plan will be adjusted in the future until paid to the participant to reflect the value of the units at the respective quarter end Tidewater stock price.
Non-Employee Board of Directors Deferred Stock Unit Plan
The company began providing a Deferred Stock Unit Plan to its non-employee Board of Directors during fiscal 2007. The plan provides that each non-employee director is granted a number of stock units having an aggregate value of $100,000 on the date of grant. Dividend equivalents are paid on the stock units at the same rate as dividends on the company’s common stock and are re-invested as additional stock units based upon the fair market value of a share of company common stock on the date of payment of the dividend. A stock unit represents the right to receive from the company the equivalent value of one share of company’s common stock in cash. Payment of the value of the stock unit shall be made upon the earlier of the date that is 15 days following the date the participant ceases to be a director for any reason or upon a change of control of the company. The participant can elect to receive five annual installments or a lump sum.
F-30
Table of Contents
Index to Financial Statements
TIDEWATER INC.
NOTES TO CONSOLIDATED FINANCIAL STATEMENTS
Years ended March 31, 2010, 2009, and 2008
The following table sets forth a summary of deferred stock unit activity of the company for fiscal 2010, 2009 and 2008:
| Weighted-average Grant-Date Fair Value |
Number Of Units |
|||||
| Balance at March 31, 2007 |
$ | 58.58 | 15,755 | |||
| Dividend equivalents reinvested |
56.34 | 141 | ||||
| Retirement distribution |
61.62 | (4,170 | ) | |||
| Granted |
56.02 | 16,621 | ||||
| Balance at March 31, 2008 |
56.50 | 28,347 | ||||
| Dividend equivalents reinvested |
44.88 | 636 | ||||
| Granted |
37.13 | 27,966 | ||||
| Balance at March 31, 2009 |
46.90 | 56,949 | ||||
| Dividend equivalents reinvested |
45.10 | 1,167 | ||||
| Retirement distribution |
42.05 | (7,000 | ) | |||
| Granted |
47.11 | 21,812 | ||||
| Balance at March 31, 2010 |
$ | 47.40 | 72,928 | |||
Deferred stock units are fully vested at the time of grant. The company expensed $1.6 million, $0.6 million, and $1.0 million for the years ended March 31, 2010, 2009 and 2008 related to the deferred stock units plan which is reflected in general and administrative expenses. The liability for this plan will be adjusted in the future until paid to the participant to reflect the value of the units at the respective quarter end Tidewater stock price.
| (8) | STOCKHOLDERS’ EQUITY |
The company has 125 million shares of $0.10 par value common stock authorized. At March 31, 2010 and 2009, 51,830,048 shares and 51,696,245 shares, respectively, were issued. At March 31, 2010 and 2009, 3,000,000 shares of no par value preferred stock were authorized and unissued.
Common Stock Repurchases
In July 2009, the company’s Board of Directors authorized the company to spend up to $200.0 million to repurchase shares of its common stock in open-market or privately-negotiated transactions. The company announced on May 14, 2010 that its Board of Directors has extended this program. The company will use its available cash and, when considered advantageous, borrowings under its revolving credit facility, or other borrowings, to fund any share repurchases. The repurchase program was scheduled to expire on June 30, 2010, but has now been extended to expire on the earlier of the date that all authorized funds have been expended or June 30, 2011 unless extended by the Board of Directors. No amounts have been expended under the July 2009 authorized program through March 31, 2010, and at March 31, 2010, $200.0 million remained available to repurchase shares under the 2009 program until it expires. During fiscal 2010, the company did not repurchase shares of its common stock. The company will continue to evaluate share repurchase opportunities relative to other investment opportunities and in the context of current conditions in the credit and capital markets
The company’s Board of Directors had previously authorized the company in July 2008 to repurchase up to $200.0 million in shares of its common stock in open-market or privately-negotiated transactions. The Board of Directors’ authorization for this repurchase program expired on June 30, 2009. Given the credit markets volatility over the past year and a half, the company focused on preserving cash. As a result, no amounts were expended from inception of the July 2008 authorized program through its conclusion on June 30, 2009.
During fiscal 2009, the company expended $53.6 million to repurchase and cancel 915,900 common shares, or an average price paid per common share of $58.56 pursuant to a repurchase program authorized by the Board of Directors in July 2007.
During fiscal 2008, the company expended $310.0 million to repurchase and cancel 5,279,600 common shares, or an average price paid per common shares of $58.73. Of the 5,279,600 shares cancelled,
F-31
Table of Contents
Index to Financial Statements
TIDEWATER INC.
NOTES TO CONSOLIDATED FINANCIAL STATEMENTS
Years ended March 31, 2010, 2009, and 2008
3,586,200 were pursuant to the July 2007 share repurchase program ($196.4 million, or $54.76 average price per share), while 1,693,400 were pursuant to the July 2006 share repurchase program ($113.7 million, or $67.13 average price per share).
Dividend Program
In May 2008, the company’s Board of Directors authorized the increase of the company’s quarterly dividend from $0.15 per share to $0.25 per share, a 67% increase. The declaration of dividends is at the discretion of the company’s Board of Directors.
The Board of Directors declared dividends of $51.7 million, $51.5 million, and $32.7 million, or $1.00, $1.00 and $0.60 per share, respectively, for the year ended March 31, 2010, 2009 and 2008, respectively.
Grantors Trust Stock Ownership Plan
The company established a Grantor Trust Stock Ownership Program on January 29, 1999 in connection with which the company entered into a trust agreement with a bank providing for the establishment of the related trust (the “trust”). The trust was designed to acquire, hold and distribute shares of the common stock of the company to provide for the payment of benefits and compensation under the company’s employee benefit plans, including its stock option plans and 401(k) plan. The trust did not increase or alter the amount of benefits or compensation that will be paid under these plans.
On January 29, 1999, the company sold at market value 5,000,000 shares (the “acquired shares”) of common stock to the trust for $107,187,500, or $21.4375 per share. In payment for the acquired shares, the trust paid $500,000 in cash and issued a promissory note payable to the company for the remaining balance. Acquired shares will be released to satisfy the company’s obligations to pay benefits under company benefit plans as the promissory note is paid down or forgiven. As of March 31, 2008, all shares in the trust were used to satisfy the company’s benefit obligations and accordingly, the trust was dissolved.
For financial reporting purposes the trust is consolidated with the company. Any dividend transactions between the company and the trust are eliminated. Acquired shares held by the trust remain valued at the market price at the date of purchase and are shown as a reduction to stockholders’ equity in the company’s consolidated financial statements. The difference between the trust share value and the fair market value on the date shares are released from the trust is included in additional paid-in capital. Common stock held in the trust is not considered outstanding in the computation of earnings per share. The trustee will vote or tender shares held by the trust in accordance with the confidential instructions of participants in the company’s stock option plans and 401(k) plan.
Accumulated Other Comprehensive Income
A summary of accumulated other comprehensive income and related tax effect at March 31 follows:
| (In thousands) |
2010 | 2009 | |||
| Currency translation adjustments |
$ | 9,811 | 10,578 | ||
| Unrealized gains on available-for-sale securities, net of tax of $438 in 2010 and $1,850 in 2009 |
813 | 3,435 | |||
| Benefit plans minimum liabilities, net of tax of $3,396 in 2010 and $3,069 in 2009 |
6,307 | 5,700 | |||
| $ | 16,931 | 19,713 | |||
Deferred Compensation – Restricted Stock
Refer to Note 7 to Notes to Consolidated Financial Statements for a discussion on the company’s Restricted Stock Plan.
F-32
Table of Contents
Index to Financial Statements
TIDEWATER INC.
NOTES TO CONSOLIDATED FINANCIAL STATEMENTS
Years ended March 31, 2010, 2009, and 2008
| (9) | SALE/LEASEBACK ARRANGEMENTS |
Fiscal 2010 Sale/Leaseback
In June 2009, the company sold five vessels to four unrelated third-party companies, and simultaneously entered into bareboat charter agreements with the respective companies. In July 2009, the company sold an additional vessel to an unrelated third-party company, and simultaneously entered into bareboat charter agreements with the respective company.
The sale/leaseback transactions resulted in proceeds of approximately $101.8 million and a deferred gain of $39.6 million. The carrying value of the six vessels was $62.2 million at the dates of sale. The leases on the five vessels sold in June 2009 will expire on June 30, 2014, and the lease on the vessel sold in July 2009 will expire on July 30, 2014. The company is accounting for the transactions as sale/leaseback transactions with operating lease treatment and will expense periodic lease payments over the five year charter hire operating lease terms.
Under the sale/leaseback agreements, the company has the option to purchase the six vessels at 75% of the original sales price or cause the owners to sell the vessels whereby the company guarantees approximately 84% of the original lease value to the third-party companies. The company may repurchase the vessels prior to the end of the charter term with penalties of up to 5% assessed if purchased in years one and two of the five year lease. The company will recognize the deferred gain as income if it does not exercise its option to purchase the six vessels at the end of the operating lease term. If the company exercises its option to purchase these vessels, the deferred gain will reduce the vessel’s stated cost after exercising the purchase option.
Fiscal 2006 Sale/Leaseback
In March 2006, the company entered into agreements to sell five of its vessels that were under construction at the time to Banc of America Leasing & Capital LLC (BOAL&C), an unrelated third party, for $76.5 million and simultaneously enter into bareboat charter agreements with BOAL&C upon the vessels’ delivery to the market. Construction on these five vessels was completed at various times between March 2006 and March 2008, at which time the company sold the respective vessels and simultaneously entered into bareboat charter agreements.
The company accounted for all five transactions as sale/leaseback transactions with operating lease treatment. Accordingly, the company did not record the assets on its books and the company is expensing periodic lease payments.
The bareboat charter agreements on the first two vessels expire in calendar year 2014 unless extended. The company has the option to extend the respective bareboat charter agreements three times, each for a period of 12 months, which would provide the company the opportunity to extend the operating leases through calendar year 2017. The bareboat charter agreements on the third and fourth vessels expire in 2015 and the company has the option to extend the bareboat charter agreements three times, each for a period of 12 months, which would provide the company the opportunity to extend the operating leases through calendar year 2018. The bareboat charter agreements on the fifth vessel expires in 2016 and the company has the option to extend the bareboat charter agreements three times, each for a period of 12 months, which would provide the company the opportunity to extend the operating leases through calendar year 2019. At the end of the basic term (or extended option periods), the company has an option to purchase each of the vessels at its then fair market value or to redeliver the vessel to its owner. The company may also purchase each of the vessels at their fixed amortized values, as outlined in the bareboat charter agreements, at the end of the fifth year, and again at the end of the seventh year, from the commencement dates of the respective charter agreements.
F-33
Table of Contents
Index to Financial Statements
TIDEWATER INC.
NOTES TO CONSOLIDATED FINANCIAL STATEMENTS
Years ended March 31, 2010, 2009, and 2008
Future Minimum Lease Payments
As of March 31, 2010, the future minimum lease payments for the vessels under the operating lease terms are as follows:
| Fiscal year ending (In thousands) |
Fiscal 2010 Sale/Leaseback |
Fiscal 2006 Sale/Leaseback |
Total | ||||
| 2011 |
$ | 10,702 | 6,924 | 17,626 | |||
| 2012 |
10,702 | 6,924 | 17,626 | ||||
| 2013 |
10,703 | 6,924 | 17,627 | ||||
| 2014 |
10,703 | 6,906 | 17,609 | ||||
| 2015 |
2,836 | 7,547 | 10,383 | ||||
| Thereafter |
— | — | — | ||||
| Total future lease payments |
$ | 45,646 | 35,225 | 80,871 | |||
The company expensed approximately $15.1 million, $7.0 million, and $4.7 million on these bareboat charter arrangements during fiscal 2010, 2009 and 2008, respectively.
| (10) | COMMITMENTS AND CONTINGENCIES |
Compensation Commitments
Compensation continuation agreements exist with all of the company’s officers whereby each receives compensation and benefits in the event that their employment is terminated following certain events relating to a change in control of the company. The maximum amount of cash compensation that could be paid under the agreements, based on present salary levels, is approximately $32.8 million.
Vessel Construction Commitments
At March 31, 2010, the company had commitments to acquire five vessels and build 31 vessels at a number of different shipyards around the world (one of which is being constructed in the United States by the company’s wholly-owned shipyard, Quality Shipyards, L.L.C.) at a total cost, including contract costs and other incidental costs, of approximately $742.4 million, including contract costs and other incidental costs, of which costs for the 31 new-build vessels totaled $681.8 million. In particular, the company is committed to the construction of 13 anchor handling towing supply vessels ranging between 5,150 and 13,570 brake horsepower (BHP), 16 platform supply vessels ranging between 2,965 and 5,400 deadweight tons of cargo capacity, and two crewboats. Scheduled delivery for these vessels began in April 2010 with delivery of the final vessel expected in July 2012. The company also had at such date binding agreements to purchase five anchor handling towing supply vessels for a total cost of approximately $60.6 million. In April 2010, the company took possession of three of these five anchor handling towing supply vessels, and plans to take possession of the fourth and fifth anchor handling towing supply vessels in May and June of 2010, respectively. At March 31, 2010, the company had invested $271.9 million in progress payments towards the construction of 31 vessels, and no payments have been made on the purchase of five anchor handling towing supply vessels. The remaining expenditures necessary to complete construction of the 31 vessels currently under construction (based on contract prices), and to fund the acquisition of the five anchor handling towing supply vessels was $470.5 million at March 31, 2010.
The company’s vessel construction program has been designed to replace over time the company’s older fleet of vessels with fewer, larger and more efficient vessels, while also opportunistically revamping the size and capabilities of the company’s fleet. The majority of the company’s older vessels, its supply and towing-supply vessels, were constructed between 1976 and 1983. As such, virtually all of this class exceeds 25 years of age and could require replacement within the next several years, depending on the strength of the market during this time frame. In addition to age, market conditions also help determine when a vessel is no longer economically viable. The company anticipates using future operating cash flows, existing borrowing capacity, new borrowings or lease arrangements to fund current and future commitments in connection with the fleet renewal and modernization program. The company continues to evaluate its fleet renewal program, whether through new construction or acquisitions, relative to other investment
F-34
Table of Contents
Index to Financial Statements
TIDEWATER INC.
NOTES TO CONSOLIDATED FINANCIAL STATEMENTS
Years ended March 31, 2010, 2009, and 2008
opportunities and uses of cash, including the current share repurchase authorization, and in the context of current conditions in the credit and capital markets.
The company has experienced occasional delays in the expected deliveries of equipment for vessels currently under construction (as has the offshore supply vessel industry in general). While the frequency of these equipment delays has abated, similar delays in the future are possible. Currently, the company is experiencing more pronounced delays in vessel construction progress at shipyards in Brazil (two crewboats vessels under construction) and India (one platform supply vessel under construction). The company continues to work diligently to ensure as timely delivery as possible of these vessels, but further delay is possible. The shipyard in India has previously completed and delivered three vessels for the company.
The company generally requires shipyards to provide third party credit support in the event that vessels are not ultimately completed and delivered. That third party credit support typically guarantees the return of amounts paid by the company, and generally takes the form of refundment guarantees issued by major financial institutions located in the country of the shipyard. While the company endeavors to reduce its shipyard credit risk by requiring these instruments, the ultimate return of amounts paid by the company in the event of shipyard default is still subject to the creditworthiness of the shipyard and the provider of the credit support, as well as the company’s ability to successfully pursue legal action to compel payment of these instruments. When third party credit support is not available or cost effective, the company endeavors to limit its credit risk through payment and other contract terms with the shipyard and other counterparties.
Certain of the company’s vessels under construction are committed to work under customer contracts that provide for the payment of liquidated damages by the company or its subsidiaries in certain cases of late delivery. Delays in the expected deliveries of any of these vessels could result in penalties being imposed by our customers. In the opinion of management, the amount of ultimate liability, if any, with respect to these penalties, will not have a material adverse effect on the company’s financial position, results of operations, or cash flows.
Merchant Navy Officers Pension Fund
Certain current and former subsidiaries of the company are, or have been, participating employers in an industry-wide multi-employer retirement fund in the United Kingdom, the Merchant Navy Officers Pension Fund (MNOPF). The company has been informed of a fund deficit that will require contributions from the participating employers. The amount and timing of the company’s share of the fund’s deficit will depend ultimately on a number of factors, including updated calculations of the total fund deficit, theories of contribution imposed as determined by and within the scope of the Trustee’s authority, the number of then participating solvent employers, and the final method used in allocating the required contribution among such participating employers. While there were no amounts expensed in fiscal years 2010 and 2008 related to this matter, the company recorded an additional liability of $1.2 million during fiscal 2009. As of March 31, 2010, $4.0 million remains payable to MNOPF based on current assessments, all of which has been fully accrued. In the future, the fund’s trustee will likely claim that the company owes additional amounts for various reasons, including negative fund investment returns in a depressed global market as reflected in a preliminary future actuarial valuation, and the inability of other assessed parties to contribute their share of respective allocations, failing which, the company and other solvent participating employers will be asked for additional contributions. The company anticipates receiving a final evaluation from actuaries during the second quarter of fiscal 2011.
Currency Devaluation and Fluctuation Risk
Due to the company’s international operations, the company is exposed to foreign currency exchange rate fluctuations and exchange rate risks on all charter hire contracts denominated in foreign currencies. The company generally does not hedge against any foreign currency rate fluctuations associated with foreign currency contracts that arise in the normal course of business. To minimize the financial impact of these items the company attempts to contract a significant majority of its services in U.S. dollars. The company continually monitors the currency exchange risks associated with all contracts not denominated in U.S.
F-35
Table of Contents
Index to Financial Statements
TIDEWATER INC.
NOTES TO CONSOLIDATED FINANCIAL STATEMENTS
Years ended March 31, 2010, 2009, and 2008
dollars. In addition, where possible, the company attempts to minimize its financial impact of these risks, by matching the currency of the company’s operating costs with the currency of the revenue streams.
Venezuelan Operations
The company has previously reported that in May 2009 the Venezuelan National Assembly enacted a law (the Reserve Law) whereby the Bolivarian Republic of Venezuela (the Republic) reserved to itself assets and services related to maritime activities on Lake Maracaibo. The company has also previously reported that in May 2009, Petróleos de Venezuela, S.A. (PDVSA), the Venezuelan national oil company, invoking the Reserve Law, took possession of (a) 11 of the company’s vessels that were then supporting PDVSA operations in the Lake Maracaibo region, (b) the company’s shore-based facility adjacent to Lake Maracaibo and (c) certain other related assets. The company has also previously reported that in July 2009, Petrosucre, S.A. (Petrosucre), a subsidiary of PDVSA, took control of four additional company vessels. As a consequence of these measures, the company (i) no longer has possession or control of those assets, (ii) no longer operates them or provides support for their operations, and (iii) no longer has any other vessels or operations in Venezuela.
As a result of the May 2009 seizure of the 11 vessels and other assets discussed above, the company recorded a charge of $3.75 million ($2.9 million after tax, or $0.06 per common share), during the quarter ended June 30, 2009, to write off the net book value of the assets seized. As a result of the July 2009 vessel seizures, the company recorded a charge of $0.5 million ($0.4 million after tax, or $0.01 per common share) during the quarter ended September 30, 2009, to write off the net book value of those assets. Both of these charges are included in the provision for Venezuelan operations in the accompanying consolidated statement of earnings.
As a result of the asset seizures referred to above, the lack of further operations in Venezuela, and the continuing uncertainty about the timing and amount of the compensation that the company may collect in the future (including compensation for the taking of the accounts receivable payable by PDVSA and Petrosucre), the company recorded a $44.8 million ($44.8 million after tax, or $0.87 per common share) provision during the quarter ended June 30, 2009, to fully reserve accounts receivable payable by PDVSA and Petrosucre.
As the company has previously reported on Form 8-K, on February 16, 2010, the company filed with the International Centre for Settlement of Investment Disputes (ICSID) a Request for Arbitration against the Republic of Venezuela seeking compensation for the expropriation of the company’s Venezuelan investments. That request has been registered by ICSID and the company continues diligently to prosecute the arbitration. While the company believes, based on consultations with its advisors, that it is entitled to full reparation for the losses suffered as a result of the actions taken by the Republic, there can be no assurances that the company will prevail in the arbitration.
On March 31, 2010, the company entered into a Settlement and Release with its marine underwriters to resolve the claim the company had made under its marine insurance policy for the total loss of the 15 vessels seized by the Republic. Under the Settlement and Release, the underwriters paid, subject to certain conditions, $8.2 million (the Settlement Payment) in full and final settlement of the claim. Those conditions include, among others, that the company must continue to prosecute the ICSID arbitration and must reimburse the underwriters the Settlement Payment (less certain expenses) if and when the company receives payment from the Republic. Under the Settlement and Release, the company continues to retain legal title to the claims in arbitration and the underwriters have waived any and all subrogation rights. The Settlement Payment does not represent full reparation of the losses suffered by the company as a consequence of the expropriation of its investments in Venezuela. The $8.2 million payment by the underwriters triggered an obligation by the company under the company’s insurance program to pay an additional $2.8 million in insurance premium to its underwriters and the company has paid that amount. Both the $8.2 million payment from the underwriters and the $2.8 million payment to the underwriters were made in fiscal 2011.
F-36
Table of Contents
Index to Financial Statements
TIDEWATER INC.
NOTES TO CONSOLIDATED FINANCIAL STATEMENTS
Years ended March 31, 2010, 2009, and 2008
Internal Investigation
The company has previously reported that special counsel engaged by the company’s Audit Committee had completed an internal investigation into certain FCPA matters and reported its findings to the Audit Committee. The substantive areas of the internal investigation have been reported publicly by the company in prior filings.
Special counsel has reported to the Department of Justice (DOJ) and the Securities and Exchange Commission (SEC) the results of the investigation, and has engaged in a series of cooperative discussions with the two federal agencies as to the potential legal ramifications of those findings. The following reflects the status of those discussions:
Securities and Exchange Commission
The company has reached an agreement in principle with the staff of the SEC to resolve its previously disclosed investigation of possible violations of the FCPA. Under the proposed resolution, the company would consent to the filing in federal district court of a complaint (“Complaint”) by the SEC, without admitting or denying the allegations in the Complaint, and to the imposition by the court of a final judgment against the company, including a permanent injunction against us. The Complaint would allege civil violations of the FCPA’s anti-bribery and accounting provisions with respect to certain previously discussed conduct involving tax authorities in Azerbaijan, and the FCPA’s accounting provisions with respect to amounts paid by a subsidiary of the company to a third party customs broker to procure certain permits necessary for the company’s vessels to operate in Nigeria. The final judgment would not take effect until it is confirmed by the court, and would permanently enjoin the company from future violations of those provisions.
The agreement in principle would require the company to pay a total of approximately $11.4 million, consisting of the sum of $8.4 million (principally representing disgorgement of profits and prejudgment interest) payable at the time of settlement and a contingent civil penalty of $3.0 million. The contingent civil penalty would be payable to the SEC in 18 months, to the extent that the company had not agreed to pay fines or penalties of at least that amount to another government authority (or authorities) in connection with the matters covered by the internal investigation. The financial charge associated with the proposed settlement with the SEC was recorded in the fourth quarter of fiscal 2010 and is included in general and administrative expenses.
The agreement in principle is contingent upon the parties’ agreement on the terms of the relevant documents, approval by the Securities and Exchange Commission, and confirmation by a federal district court. There can be no assurance that this settlement will be finalized, or finalized on the terms set forth above. If the settlement is not finalized, the SEC may bring an enforcement action against the company. The company’s current tolling arrangements with the SEC extend through June 15, 2010.
Department of Justice
To date, the company has not reached any agreement with the DOJ regarding a negotiated resolution of the previously disclosed internal investigation. Based on discussions with the DOJ regarding the possible disposition of this matter, it appears likely that any negotiated disposition would involve charges and sanctions imposed by the DOJ, although the company is unable to predict at this time the nature and scope of such charges and sanctions and upon whom they would be imposed. The timeframe for resolution of these matters is also uncertain. Given these uncertainties, the company is unable at this time to estimate the range of any monetary exposure that might arise from such a settlement. As a result, no accrual for potential additional liabilities associated with a negotiated resolution with the DOJ has been recorded as of March 31, 2010. Any fines or penalties paid to the DOJ would reduce the balance of the SEC contingent penalty referenced above under the company’s agreement in principle with the SEC. Should additional information be obtained that any potential liability in connection with the resolution of these matters with the DOJ is probable and reasonably estimable, the company will record such liability at that time. While uncertain, ultimate resolution with the DOJ could have a material adverse effect on the company’s results of
F-37
Table of Contents
Index to Financial Statements
TIDEWATER INC.
NOTES TO CONSOLIDATED FINANCIAL STATEMENTS
Years ended March 31, 2010, 2009, and 2008
operations or cash flows. It is possible that if agreement is not reached, the DOJ may bring enforcement action against the company.
Sonatide
The company has previously reported in its periodic filings that it was in discussions with Sonangol, the national oil company of Angola, regarding a Sonangol proposal to increase its control over Sonatide Marine Services Ltd., an Angolan joint venture between Sonangol and a Tidewater subsidiary. The company currently has an indirect 49% ownership interest in Sonatide. The company also previously reported that it had reached agreement with Sonangol on certain amendments to the joint venture agreement that would increase Sonangol’s control over the operations of Sonatide. Thereafter, Sonangol and the company continued to have dialogue regarding additional changes proposed by Sonangol to Sonatide’s practices and procedures that, if adopted, would further Sonangol’s control over Sonatide’s day-to-day operations, including treasury functions. In December, 2009, Sonangol notified Tidewater that the existing joint venture agreement, which was scheduled to expire on July 31, 2010 unless renewed, would not be renewed by Sonangol, although Sonangol advised that it was willing to discuss a new joint venture agreement. The company is in constructive discussions with Sonangol regarding the terms of a new joint venture arrangement although no assurances can be given that these discussions will be successfully concluded or whether such terms will be advantageous to the company. In addition, over the course of the last several months Sonangol has been willing to extend the term of the Sonatide joint venture to fulfill several new or renewed charterparty agreements with customers for a substantial portion of the current fleet in Angola that extend beyond July 31, 2010. Failing to further extend the existing Sonatide joint venture or reach a new joint venture agreement with Sonangol could impair the company’s ability to continue to effectively compete for business in Angola in the future. More Tidewater vessels are deployed in Angola than in any of Tidewater’s other countries of operation, and a significant portion of revenues derived from the company’s largest customer, Chevron, are derived through the company’s operations in Angola.
Legal Proceedings
Various legal proceedings and claims are outstanding which arose in the ordinary course of business. In the opinion of management, the amount of ultimate liability, if any, with respect to these actions will not have a material adverse effect on the company’s financial position, results of operations, or cash flows.
The company has been made a defendant in several lawsuits in various areas of the world where its marine vessel operations are conducted, including a class action styled suit in California, alleging certain labor and wage and hour law violations claimed by certain current and former employees. During the first quarter of fiscal 2008, the company provided $3.0 million for a court-approved settlement of the California wage issue during fiscal 2008, which was inclusive of interest and attorney fees. Plaintiffs to the class action suit had until January 2008 to submit a notice of claim. The majority of plaintiffs responded to the settlement and the matter closed in March 2008 when full and final settlements were paid. No additional accruals were needed for this matter.
| (11) | FAIR VALUE MEASUREMENTS |
Assets and Liabilities Measured at Fair Value on a Recurring Basis
The company measures on a recurring basis and records at fair value investments held by participants in a supplemental executive retirement plan, a deferred supplemental savings plan and a multinational savings plan. These investments are valued based on quoted market prices (Level 1) and significant observable inputs (Level 2) and were carried at $27.3 million and $19.7 million at March 31, 2010 and 2009, respectively.
Other Financial Instruments
The company’s primary financial instruments consist of cash and cash equivalents, trade receivables and trade payables whose book values are considered to be representative of their respective fair values. The
F-38
Table of Contents
Index to Financial Statements
TIDEWATER INC.
NOTES TO CONSOLIDATED FINANCIAL STATEMENTS
Years ended March 31, 2010, 2009, and 2008
company periodically utilizes derivative financial instruments to hedge against foreign currency denominated assets and liabilities, currency commitments, or to lock in desired interest rates. These transactions are generally spot or forward currency contracts or interest rate swaps that are entered into with major financial institutions. Derivative financial instruments are intended to reduce the company’s exposure to foreign currency exchange risk and interest rate risk. The company enters into derivative instruments only to the extent considered necessary to meet its risk management objectives and does not use derivative contracts for speculative purposes. The derivative instruments are recorded at fair value using quoted prices and quotes obtainable from the counterparties to the derivative instruments.
Spot Derivatives. Spot derivative financial instruments are short-term in nature and generally settle within two business days. The fair value approximates the carrying value due to the short-term nature of this instrument, and as a result, no gains or losses are recognized.
The company had 10 foreign exchange spot contracts outstanding at March 31, 2010, which totaled $4.7 million. All 10 spot contracts settled by April 6, 2010. The company had no spot derivative financial instruments outstanding at March 31, 2009.
Forward Derivatives. Forward derivative financial instruments are generally longer-term in nature but generally do not exceed one year. The accounting for gains or losses on forward contracts is dependent on the nature of the risk being hedged and the effectiveness of the hedge.
The company had no forward contracts outstanding at March 31, 2010 and 2009.
Assets and Liabilities Measured at Fair Value on a Nonrecurring Basis
Asset Impairments
The company accounts for long-lived assets in accordance with ASC 360-10-35, Impairment or Disposal of Long-lived Assets, and reviews long-lived assets for impairment whenever events occur or changes in circumstances indicate that the carrying amount of assets may not be recoverable. In such evaluation the estimated future undiscounted cash flows generated by an asset group are compared with the carrying amount of the asset group to determine if a write-down may be required. The company estimates cash flows based upon historical data adjusted for the company’s best estimate of future market performance that is based on industry trends. The company uses the discounted cash flow method to determine estimated fair value of each asset group and compares such estimated fair value, considered Level 3, to the carrying value of each asset group in order to determine if impairment exists. If impairment exists, the carrying value of the asset group is reduced to its estimated fair value. Vessels with similar operating and marketing characteristics are grouped for asset impairment testing. The combined fair value of the 17 and 10 vessels that incurred impairments totaling $3.1 million and $1.4 million during fiscal 2010 and 2009, respectively, was $10.6 million and $1.7 million, respectively. No impairment was recorded during fiscal 2008.
| (12) | GAIN ON DISPOSITION OF ASSETS, NET |
During fiscal 2010, the company sold and/or scrapped 55 vessels (excluding 15 vessel seized by the Venezuelan government) which resulted in gain on asset dispositions, net of approximately $30.6 million. During fiscal 2009, the company sold and/or scrapped 47 vessels which resulted in gain on asset dispositions, net of approximately $28.8 million. During fiscal 2008, the company sold and/or scrapped 26 vessels which resulted in gain on asset dispositions, net of approximately $10.6 million.
F-39
Table of Contents
Index to Financial Statements
TIDEWATER INC.
NOTES TO CONSOLIDATED FINANCIAL STATEMENTS
Years ended March 31, 2010, 2009, and 2008
| (13) | SEGMENT INFORMATION, GEOGRAPHICAL DATA AND MAJOR CUSTOMERS |
The company follows the disclosure requirements the Segment Reporting Topic, ASC 280, and operates in two business segments: International and United States. Operating business segments are defined as a component of an enterprise which separate financial information is available and is evaluated by the chief operating decision maker in deciding how to allocate resources and in assessing performance. The following table provides a comparison of revenues, operating profit, total assets, and depreciation and amortization and additions to properties and equipment for the years ended March 31. Vessel revenues and operating costs relate to vessels owned and operated by the company while other marine revenues relate to the activities of the company’s shipyards, brokered vessels and other miscellaneous marine-related businesses.
| (In thousands) |
2010 | 2009 | 2008 | |||||||
| Revenues: |
||||||||||
| Vessel revenues: |
||||||||||
| International (A) |
$ | 1,048,553 | 1,209,426 | 1,055,339 | ||||||
| United States |
89,609 | 146,896 | 159,795 | |||||||
| 1,138,162 | 1,356,322 | 1,215,134 | ||||||||
| Other marine revenues |
30,472 | 34,513 | 55,037 | |||||||
| $ | 1,168,634 | 1,390,835 | 1,270,171 | |||||||
| Vessel operating profit: |
||||||||||
| International |
$ | 252,354 | 437,695 | 394,789 | ||||||
| United States |
9,196 | 34,797 | 29,985 | |||||||
| 261,550 | 472,492 | 424,774 | ||||||||
| Corporate expenses |
(51,432 | ) | (38,622 | ) | (40,974 | ) | ||||
| Gain on asset dispositions, net |
28,178 | 27,251 | 11,449 | |||||||
| Other marine services |
2,034 | 4,348 | 6,776 | |||||||
| Operating income |
240,330 | 465,469 | 402,025 | |||||||
| Foreign exchange gain (loss) |
4,094 | 2,695 | (891 | ) | ||||||
| Equity in net earnings of unconsolidated companies |
18,107 | 16,978 | 14,470 | |||||||
| Interest income and other, net |
6,882 | 7,066 | 16,957 | |||||||
| Interest and other debt costs |
(1,679 | ) | (693 | ) | (6,992 | ) | ||||
| Earnings before income taxes |
$ | 267,734 | 491,515 | 425,569 | ||||||
| Total assets: |
||||||||||
| Marine: |
||||||||||
| International (B) |
$ | 2,781,444 | 2,538,417 | 2,089,941 | ||||||
| United States |
334,182 | 394,128 | 387,432 | |||||||
| 3,115,626 | 2,932,545 | 2,477,373 | ||||||||
| Investments in and advances to unconsolidated Marine companies |
40,614 | 37,221 | 27,433 | |||||||
| 3,156,240 | 2,969,766 | 2,504,806 | ||||||||
| General corporate |
137,117 | 104,038 | 246,974 | |||||||
| $ | 3,293,357 | 3,073,804 | 2,751,780 | |||||||
| Depreciation and amortization: |
||||||||||
| Marine equipment operations |
||||||||||
| International |
$ | 118,182 | 108,978 | 100,680 | ||||||
| United States |
10,746 | 15,855 | 18,675 | |||||||
| General corporate depreciation |
1,256 | 1,398 | 1,482 | |||||||
| $ | 130,184 | 126,231 | 120,837 | |||||||
| Additions to properties and equipment: |
||||||||||
| Marine equipment operations |
||||||||||
| International |
$ | 414,504 | 444,349 | 326,655 | ||||||
| United States |
35,956 | 29,072 | 50,154 | |||||||
| General corporate |
1,513 | 255 | 11,089 | |||||||
| $ | 451,973 | 473,676 | 387,898 | |||||||
| (A) | Marine support services are conducted worldwide with assets that are highly mobile. Revenues are principally derived from offshore service vessels, which regularly and routinely move from one operating area to another, often to and from offshore operating areas in different continents. Because of this asset mobility, revenues and long-lived assets attributable to the company’s international marine operations in any one country are not material. Equity in net assets of non-U.S. subsidiaries is $2.4 billion, $2.1 billion and $1.5 million at March 31, 2010, 2009 and 2008, respectively. Other international identifiable assets include accounts receivable and other balances denominated in currencies other than the U.S. dollar, which aggregate approximately $1.4 million, $1.4 million and $6.8 million at March 31, 2010, 2009, and 2008, respectively. These amounts are subject to the usual risks of fluctuating exchange rates and government-imposed exchange controls. |
F-40
Table of Contents
Index to Financial Statements
TIDEWATER INC.
NOTES TO CONSOLIDATED FINANCIAL STATEMENTS
Years ended March 31, 2010, 2009, and 2008
The following table discloses the amount of revenue in dollars for the company’s International and United States segments, and in total for the worldwide fleet, along with the respective percentage of vessel revenue:
| Revenue by vessel class: (In thousands): |
2010 | % of Vessel Revenue |
2009 | % of Vessel Revenue |
2008 | % of Vessel Revenue |
||||||||||
| International-based fleet: |
||||||||||||||||
| Deepwater vessels |
$ | 306,763 | 27 | % | 267,219 | 20 | % | 240,815 | 20 | % | ||||||
| Towing-supply/supply |
616,240 | 54 | % | 769,296 | 57 | % | 649,788 | 53 | % | |||||||
| Crew/utility |
87,303 | 8 | % | 103,850 | 8 | % | 104,222 | 9 | % | |||||||
| Offshore tugs |
37,680 | 3 | % | 61,974 | 5 | % | 55,325 | 5 | % | |||||||
| Other |
567 | <1 | % | 7,087 | 1 | % | 5,189 | <1 | % | |||||||
| Total |
$ | 1,048,553 | 92 | % | 1,209,426 | 89 | % | 1,055,339 | 87 | % | ||||||
| United States-based fleet: |
||||||||||||||||
| Deepwater vessels |
$ | 55,725 | 5 | % | 58,644 | 4 | % | 59,562 | 5 | % | ||||||
| Towing-supply/supply |
30,778 | 3 | % | 70,006 | 5 | % | 75,938 | 6 | % | |||||||
| Crew/utility |
3,106 | <1 | % | 18,246 | 1 | % | 24,295 | 2 | % | |||||||
| Total |
$ | 89,609 | 8 | % | 146,896 | 11 | % | 159,795 | 13 | % | ||||||
| Worldwide fleet: |
||||||||||||||||
| Deepwater vessels |
$ | 362,488 | 32 | % | 325,863 | 24 | % | 300,377 | 25 | % | ||||||
| Towing-supply/supply |
647,018 | 57 | % | 839,302 | 62 | % | 725,726 | 60 | % | |||||||
| Crew/utility |
90,409 | 8 | % | 122,096 | 9 | % | 128,517 | 11 | % | |||||||
| Offshore tugs |
37,680 | 3 | % | 61,974 | 5 | % | 55,325 | 5 | % | |||||||
| Other |
567 | <1 | % | 7,087 | 1 | % | 5,189 | <1 | % | |||||||
| Total |
$ | 1,138,162 | 100 | % | 1,356,322 | 100 | % | 1,215,134 | 100 | % | ||||||
For fiscal 2010, 2009 and 2008, Chevron Corporation (including its worldwide subsidiaries and affiliates) accounted for 18.3%, 19.1% and 16.3%, respectively, of total revenues while Petroleo Brasileiro SA accounted for 13.1%, 10.1% and 10.5% of total revenues, respectively.
F-41
Table of Contents
Index to Financial Statements
TIDEWATER INC.
NOTES TO CONSOLIDATED FINANCIAL STATEMENTS
Years ended March 31, 2010, 2009, and 2008
| (14) | QUARTERLY FINANCIAL DATA (UNAUDITED) |
Selected financial information for interim periods for the years ended March 31, 2010 and 2009 are as follows:
| Quarter | |||||||||
| (In thousands except per share data) |
First | Second | Third | Fourth | |||||
| Fiscal 2010 |
|||||||||
| Revenues |
$ | 326,609 | 295,524 | 286,505 | 259,996 | ||||
| Operating income (A, B) |
56,206 | 72,027 | 66,493 | 45,604 | |||||
| Net earnings (C) |
44,482 | 98,185 | 59,896 | 56,913 | |||||
| Basic earnings per share |
$ | 0.87 | 1.91 | 1.17 | 1.11 | ||||
| Diluted earnings per share |
$ | 0.86 | 1.90 | 1.16 | 1.10 | ||||
| Fiscal 2009 |
|||||||||
| Revenues |
$ | 340,054 | 346,829 | 362,335 | 341,617 | ||||
| Operating income (A) |
97,555 | 110,022 | 130,586 | 127,306 | |||||
| Net earnings |
84,776 | 95,431 | 116,965 | 109,726 | |||||
| Basic earnings per share |
$ | 1.65 | 1.86 | 2.28 | 2.14 | ||||
| Diluted earnings per share |
$ | 1.64 | 1.85 | 2.28 | 2.13 | ||||
| (A) | Operating income consists of revenues less operating costs and expenses, depreciation, general and administrative expenses and gain on asset dispositions, net, of the company’s operations. Gains on asset dispositions, net, by quarter for fiscal 2010 and 2009 are as follows: |
| First | Second | Third | Fourth | ||||||
| Fiscal 2010 Gain on asset dispositions, net |
$ | 12,538 | 5,374 | 5,151 | 5,115 | ||||
| Fiscal 2009 Gain on asset dispositions, net |
$ | 10,387 | 5,851 | 4,760 | 6,253 | ||||
| (B) | Included in fiscal 2010 operating income is a $43.7 million provision for the company’s Venezuelan operations. The provision for Venezuelan operations by quarter for fiscal 2010 is as follows: |
| First | Second | Third | Fourth | |||||||
| Provision for Venezuelan Operations |
$ | 48,553 | 517 | — | (5,350 | ) | ||||
| (C) | Included in fiscal 2010 net earnings is (1) a reversal of $36.1 million, or $0.70 per common share, of uncertain tax positions related to the resolution of a tax dispute with the U.S. IRS, (2) a $11.4 million, or $0.22 per common share, proposed settlement with the SEC related to the internal investigation, and (3) an $11.0 million, or $0.21 per common share, foreign exchange gain resulting for the devaluation of the Venezuelan bolivar fuerte relative to the U.S. dollar. The above matters by quarter for fiscal 2010 are as follows: |
| First | Second | Third | Fourth | |||||||
| Reversal of tax liabilities for uncertain tax positions |
$ | — | 34,284 | — | 1,826 | |||||
| Foreign exchange gain on devaluation of bolivar fuerte |
$ | — | — | — | 11,003 | |||||
| Proposed SEC settlement |
$ | — | — | — | (11,396 | ) | ||||
F-42
Table of Contents
Index to Financial Statements
TIDEWATER INC. AND SUBSIDIARIES
Valuation and Qualifying Accounts
Years Ended March 31, 2010, 2009 and 2008
(In thousands)
| Column A |
Column B | Column C | Column D | Column E | ||||||
| Description |
Balance at Beginning of period |
Additions at Cost |
Deductions | Balance at End of Period | ||||||
| Fiscal 2010 |
||||||||||
| Deducted in balance sheet from trade accounts receivables: Allowance for doubtful accounts |
$ | 5,773 | 45,267 | 12,408 | (A) | 38,632 | ||||
| Fiscal 2009 |
||||||||||
| Deducted in balance sheet from trade accounts receivables: Allowance for doubtful accounts |
$ | 5,319 | 825 | 371 | (B) | 5,773 | ||||
| Fiscal 2008 |
||||||||||
| Deducted in balance sheet from trade accounts receivable: Allowance for doubtful accounts |
$ | 5,890 | — | 571 | (B) | 5,319 | ||||
| (A) | Of this amount, $8 represents accounts receivable amounts considered uncollectible and removed from accounts receivable by reducing allowance for doubtful accounts and $12,400 represents the revaluation of the allowance for doubtful accounts provision on the company’s Venezuelan receivables due to the 50% devaluation of the Venezuelan bolivar fuerte relative to the U.S. Dollar. |
| (B) | Accounts receivable amounts considered uncollectible and removed from accounts receivable by reducing the allowance for doubtful accounts. |
F-43
Table of Contents
Index to Financial Statements
TIDEWATER INC.
EXHIBITS FOR THE
ANNUAL REPORT ON FORM 10-K
FISCAL YEAR ENDED MARCH 31, 2010
Table of Contents
Index to Financial Statements
EXHIBIT INDEX
The index below describes each exhibit filed as a part of this report. Exhibits not incorporated by reference to a prior filing are designated by an asterisk; all exhibits not so designated are incorporated herein by reference to a prior filing as indicated.
| 3.1 |
Restated Certificate of Incorporation of Tidewater Inc. (filed with the Commission as Exhibit 3(a) to the company’s quarterly report on Form 10-Q for the quarter ended September 30, 1993, File No. 1-6311). | |
| 3.2 |
Tidewater Inc. Amended and Restated Bylaws dated January 14, 2010 (filed with the Commission as Exhibit 3.2 to the company’s current report on Form 8-K on January 20, 2010, File No. 1-6311). | |
| 10.1 |
Second Amended and Restated Revolving Credit Agreement dated as of July 24, 2009 (filed with the Commission as Exhibit 10.1 to the company’s current report on Form 8-K on July 27, 2009, File No. 1-6311). | |
| 10.2+ |
Amended and Restated Tidewater Inc. 1997 Stock Incentive Plan dated November 21, 2002 (filed with the Commission as Exhibit 10(a) to the company’s quarterly report on Form 10-Q for the quarter ended December 31, 2002, File No. 1-6311). | |
| 10.3+ |
Tidewater Inc. 2001 Stock Incentive Plan dated November 21, 2002 (filed with the Commission as Exhibit 10.5 to the company’s annual report on Form 10-K for the fiscal year ended March 31, 2005, File No. 1-6311). | |
| 10.4+ |
Form of Stock Option and Restricted Stock Agreement for the Grant of Incentive Stock Options and Non-Qualified Stock Options Under the Tidewater Inc. 2001 Stock Incentive Plan, and the Grant of Restricted Stock Under the Tidewater Inc. 1997 Stock Incentive Plan (filed with the Commission as Exhibit 10.4 to the company’s quarterly report on Form 10-Q for the quarter ended December 31, 2004, File no. 1-6311). | |
| 10.5+ |
Form of Stock Option and Restricted Stock Agreement for the Grant of Incentive Stock Options and Non-Qualified Stock Options Under the Tidewater Inc. 2001 Stock Incentive Plan and the Grant of Restricted Stock Under the Tidewater Inc. 1997 Stock Incentive Plan (filed with the Commission as Exhibit 10.10 to the company’s annual report on Form 10-K for the fiscal year ended March 31, 2005, File No. 1-6311). | |
| 10.6+ |
Form of Stock Option and Restricted Stock Agreement for the Grant of Incentive Stock Options, Non-Qualified Stock Options and Restricted Stock Under the Tidewater Inc. 2001 Stock Incentive Plan (filed with the Commission as Exhibit 10.11 to the company’s annual report on Form 10-K for the fiscal year ended March 31, 2005, File No. 1-6311). | |
| 10.7+ |
Form of Stock Option and Restricted Stock Agreement for the Grant of Incentive Stock Options and Non-Qualified Stock Options Under the Tidewater Inc. 2001 Stock Incentive Plan and the Grant of Restricted Stock Under the Tidewater Inc. Employee Restricted Stock Plan (filed with the Commission as Exhibit 10.12 to the company’s annual report on Form 10-K for the fiscal year ended March 31, 2005, File No. 1-6311). | |
| 10.8+ |
Form of Stock Option and Restricted Stock Agreement for the Grant of Incentive Stock Options, Non-Qualified Stock Options and Restricted Stock Under the Tidewater Inc. 2001 Stock Incentive Plan (filed with the Commission as Exhibit 10.14 to the company’s annual report on Form 10-K for the fiscal year ended March 31, 2006, File No. 1-6311). | |
| 10.9+ |
Form of Stock Option and Restricted Stock Agreement for the Grant of Incentive Stock Options and Non-Qualified Stock Options Under the Tidewater Inc. 2001 Stock Incentive Plan and the Grant of Restricted Stock Under the Tidewater Inc. 1997 Stock Incentive Plan (filed with the | |
- 1 -
Table of Contents
Index to Financial Statements
| Commission as Exhibit 10.15 to the company’s annual report on Form 10-K for the fiscal year ended March 31, 2006, File No. 1-6311). | ||
| 10.10+ |
2006 Stock Incentive Plan effective July 20, 2006, (filed as Exhibit 99.1 to the company’s current report on Form 8-K on March 27, 2007, File No. 1-6311). | |
| 10.11+ |
Form of Stock Option and Restricted Stock Agreement for the Grant of Incentive Stock Options, Non-Qualified Stock Options and Restricted Stock Under the Tidewater Inc. 2006 Stock Incentive Plan (filed with the Commission as Exhibit 10.20 to the company’s annual report on Form 10-K for the fiscal year ended March 31, 2008, File No. 1-6311). | |
| 10.12+ |
Amended and Restated Directors Deferred Stock Units Plan effective January 30, 2008 (filed with the Commission as Exhibit 10.21 to the company’s annual report on Form 10-K for the fiscal year ended March 31, 2008, File No. 1-6311). | |
| 10.13+ |
Stock Option and Restricted Stock Agreement for the Grant of Incentive Stock Options, Non-Qualified Stock Options and Restricted Stock Under the Tidewater Inc. 2006 Stock Incentive Plan between Tidewater Inc. and Quinn P. Fanning dated effective as of July 31, 2008 (filed with the Commission as Exhibit 10.8 to the company’s quarterly report on Form 10-Q for the quarter ended September 30, 2008, File No. 1-6311). | |
| 10.14+ |
Form of Stock Option and Restricted Stock Agreement for the Grant of Incentive Stock Options, Non-Qualified Stock Options and Restricted Stock Under the Tidewater Inc. 2006 Stock Incentive Plan applicable to 2009 grants (filed with the Commission as Exhibit 10.19 to the company’s annual report on Form 10-K for the year ended March 31, 2009, File No. 1-6311). | |
| 10.15+ |
Tidewater Inc. Executive Medical Benefit Plan dated January 1, 2000 (filed with the Commission as Exhibit 10.16 to the company’s annual report on Form 10-K for the fiscal year ended March 31, 2005, File No. 1-6311). | |
| 10.16+ |
Amended and Restated Non-Qualified Pension Plan for Outside Directors of Tidewater Inc. effective March 31, 2005, (filed with the Commission as Exhibit 10.23 to the company’s annual report on Form 10-K for the fiscal year ended March 31, 2006, File No. 1-6311). | |
| 10.17+ |
Amendment to the Amended and Restated Non-Qualified Pension Plan for Outside Directors of Tidewater Inc. effective December 13, 2006 (filed with the Commission as Exhibit 10.1 to the company’s quarterly report on Form 10-Q for the quarter ended December 31, 2006, File No. 1-6311). | |
| 10.18+ |
Restated Non-Qualified Deferred Compensation Plan and Trust Agreement as Restated October 1, 1999 between Tidewater Inc. and Merrill Lynch Trust Company of America (filed with the Commission as Exhibit 10(e) to the company’s quarterly report on Form 10-Q for the quarter ended December 31, 1999, File No. 1-6311). | |
| 10.19+ |
Second Restated Executives Supplemental Retirement Trust as Restated October 1, 1999 between Tidewater Inc. and Hibernia National Bank (filed with the Commission as Exhibit 10(j) to the company’s quarterly report on Form 10-Q for the quarter ended December 31, 1999, File No. 1-6311). | |
| 10.20+ |
Tidewater Inc. Company Performance Executive Officer Annual Incentive Plan for Fiscal Years 2010, 2011, and 2012 (filed with the Commission as Exhibit 10.2 to the company’s quarterly report on Form 10-Q for the quarter ended September 30, 2009, File No. 1-6311). | |
| 10.21+ |
Tidewater Inc. Individual Performance Executive Officer Annual Incentive Plan for Fiscal Years 2010, 2011, and 2012 (filed with the Commission as Exhibit 10.3 to the company’s quarterly report on Form 10-Q for the quarter ended September 30, 2009, File No. 1-6311). | |
- 2 -
Table of Contents
Index to Financial Statements
| 10.22+ |
Tidewater Inc. Management Annual Incentive Plan for Fiscal Years 2010, 2011 and 2012 (filed with the Commission as Exhibit 10.3 to the company’s quarterly report on Form 10-Q for the quarter ended September 30, 2009, File No. 1-6311). | |
| 10.23*+ |
Clarification of Management Annual Incentive Plan dated March 3, 2010. | |
| 10.24+ |
Amendment to the Amended and Restated Non-Qualified Pension Plan for Outside Directors of Tidewater Inc. effective January 30, 2008 (filed with the Commission as Exhibit 10.35 to the company’s annual report on Form 10-K for the fiscal year ended March 31, 2008, and 2009 File No. 1-6311). | |
| 10.25+ |
Tidewater Inc. Amended and Restated Supplemental Executive Retirement Plan executed on December 10, 2008 (filed with the Commission as Exhibit 10.1 to the company’s quarterly report on Form 10-Q for the quarter ended December 31, 2008, File No. 1-6311). | |
| 10.26+ |
Tidewater Inc. Amended and Restated Employees’ Supplemental Savings Plan executed on December 10, 2008 (filed with the Commission as Exhibit 10.3 to the company’s quarterly report on Form 10-Q for the quarter ended December 31, 2008, File No. 1-6311). | |
| 10.27+ |
Amendment to the Tidewater Inc. Amended and Restated Supplemental Executive Retirement Plan dated December 10, 2008 (filed with the Commission as Exhibit 10.4 to the company’s quarterly report on Form 10-Q for the quarter ended December 31, 2008, File No. 1-6311). | |
| 10.28+ |
Amendment Number One to the Tidewater Employees’ Supplemental Savings Plan, effective January 22, 2009 (filed with the Commission as Exhibit 10.43 to the company’s annual report on Form 10-K for the year ended March 31, 2009, File No. 1-6311) | |
| 10.29+ |
Amendment Number Two to the Tidewater Inc. Supplemental Executive Retirement Plan, effective January 22, 2009 (filed with the Commission as Exhibit 10.44 to the company’s annual report on Form 10-K for the year ended March 31, 2009, File No. 1-6311). | |
| 10.30+ |
Summary of Compensation Arrangements with Directors (filed with the Commission as Exhibit 10.45 to the company’s annual report on Form 10-K for the year ended March 31, 2009, File No. 1-6311). | |
| 10.31+ |
Summary of Fiscal 2009 and 2010 Executive Officers Base Salaries (filed with the Commission as Exhibit 10.19 to the company’s annual report on Form 10-K for the year ended March 31, 2009, File No. 1-6311). | |
| 10.32+ |
Amended and Restated Change of Control Agreement between Tidewater Inc. and Dean Taylor dated effective as of September 26, 2007 (filed with the Commission as Exhibit 10.1 to the company’s quarterly report on Form 10-Q for the quarter ended September 30, 2008, File No. 1-6311). | |
| 10.33+ |
Amendment No. 1 to Amended and Restated Change of Control Agreement between Tidewater Inc. and Dean Taylor dated effective as of June 1, 2008 (filed with the Commission as Exhibit 10.2 to the company’s quarterly report on Form 10-Q for the quarter ended September 30, 2008, File No. 1-6311). | |
| 10.34+ |
Amended and Restated Change of Control Agreement between Tidewater Inc. and Stephen Dick dated effective as of June 1, 2008 (filed with the Commission as Exhibit 10.3 to the company’s quarterly report on Form 10-Q for the quarter ended September 30, 2008, File No. 1-6311). | |
| 10.35+ |
Amended and Restated Change of Control Agreement between Tidewater Inc. and Jeffrey Platt dated effective as of June 1, 2008 (filed with the Commission as Exhibit 10.4 to the company’s quarterly report on Form 10-Q for the quarter ended September 30, 2008, File No. 1-6311). | |
- 3 -
Table of Contents
Index to Financial Statements
| 10.36+ |
Amended and Restated Change of Control Agreement between Tidewater Inc. and Joseph Bennett dated effective as of June 1, 2008 (filed with the Commission as Exhibit 10.5 to the company’s quarterly report on Form 10-Q for the quarter ended September 30, 2008, File No. 1-6311). | |
| 10.37+ |
Amended and Restated Change of Control Agreement between Tidewater Inc. and Bruce D. Lundstrom dated effective as of July 31, 2008 (filed with the Commission as Exhibit 10.6 to the company’s quarterly report on Form 10-Q for the quarter ended September 30, 2008, File No. 1-6311). | |
| 10.38+ |
Change of Control Agreement between Tidewater Inc. and Quinn P. Fanning dated effective as of July 31, 2008 (filed with the Commission as Exhibit 10.7 to the company’s quarterly report on Form 10-Q for the quarter ended September 30, 2008, File No. 1-6311). | |
| 10.39+ |
2009 Stock Incentive Plan (filed as Exhibit 99.1 to the company’s current report on Form 8-K on July 10, 2009, File No. 1-6311). | |
| 10.40+ |
Form of Indemnification Agreement entered into with each member of the Board of Directors, each executive officer and the principal accounting officer (filed as Exhibit 99.1 to the company’s current report on Form 8-K on December 15, 2009, File No. 1-6311). | |
| 10.41*+ |
Form of Stock Option and Restricted Stock Agreement for the Grant of Incentive Stock Options, Non-Qualified Stock Options and Restricted Stock Under the Tidewater Inc. 2009 Stock Incentive Plan. | |
| 21* |
Subsidiaries of the company. | |
| 23* |
Consent of Independent Registered Accounting Firm – Deloitte & Touche LLP. | |
| 31.1* |
Certification of Chief Executive Officer pursuant to Rule 13a-14 or 15d-14 of the Securities Exchange Act of 1934, as adopted pursuant to Section 302 of the Sarbanes-Oxley Act of 2002. | |
| 31.2* |
Certification of Chief Financial Officer pursuant to Rule 13a-14 or 15d-14 of the Securities Exchange Act of 1934, as adopted pursuant to Section 302 of the Sarbanes-Oxley Act of 2002. | |
| 32.1* |
Certification Pursuant to 18 U.S.C. Section 1350, as Adopted Pursuant to Section 906 of the Sarbanes-Oxley Act of 2002. | |
| * | Filed herewith. |
| + | Indicates a management contract or compensatory plan or arrangement. |
- 4 -