Attached files
| file | filename |
|---|---|
| EX-23 - EX-23 - TIDEWATER INC | d861989dex23.htm |
| EX-21 - EX-21 - TIDEWATER INC | d861989dex21.htm |
| EX-32.1 - EX-32.1 - TIDEWATER INC | d861989dex321.htm |
| EX-31.2 - EX-31.2 - TIDEWATER INC | d861989dex312.htm |
| EX-31.1 - EX-31.1 - TIDEWATER INC | d861989dex311.htm |
| EXCEL - IDEA: XBRL DOCUMENT - TIDEWATER INC | Financial_Report.xls |
Table of Contents
Index to Financial Statements
UNITED STATES
SECURITIES AND EXCHANGE COMMISSION
Washington, D.C. 20549
FORM 10-K
x ANNUAL REPORT PURSUANT TO SECTION 13 OR 15(d) OF THE SECURITIES EXCHANGE ACT OF 1934
For the fiscal year ended March 31, 2015
¨ TRANSITION REPORT PURSUANT TO SECTION 13 OR 15(d) OF THE SECURITIES EXCHANGE ACT OF 1934
For the transition period from to .
Commission file number: 1-6311
Tidewater Inc.
(Exact name of registrant as specified in its charter)
| Delaware |
|
72-048776 | ||
| (State of incorporation) | (I.R.S. Employer Identification No.) | |||
|
601 Poydras St., Suite 1500 New Orleans, Louisiana |
70130 | |||
| (Address of principal executive offices) | (Zip Code) |

Registrant’s telephone number, including area code: (504) 568-1010
Securities registered pursuant to Section 12(b) of the Act:
| Title of each class |
Name of each exchange on which registered | |
| Common Stock, par value $0.10 | New York Stock Exchange | |
Securities registered pursuant to Section 12(g) of the Act: None
Indicate by check mark if the registrant is a well-known seasoned issuer, as defined in Rule 405 of the Securities Act. Yes x No ¨
Indicate by check mark if the registrant is not required to file reports pursuant to Section 13 or Section 15(d) of the Act. Yes ¨ No x
Indicate by check mark whether the registrant (1) has filed all reports required to be filed by Section 13 or 15(d) of the Securities Exchange Act of 1934 during the preceding 12 months (or for such shorter period that the registrant was required to file such reports), and (2) has been subject to such filing requirements for the past 90 days. Yes x No ¨
Indicate by check mark whether the registrant has submitted electronically and posted on its corporate Web site, if any, every Interactive Data File required to be submitted and posted pursuant to Rule 405 of Regulation S-T (§ 232.405 of this chapter) during the preceding 12 months (or for such shorter period that the registrant was required to submit and post such files). Yes x No ¨
Indicate by check mark if disclosure of delinquent filers pursuant to Item 405 of Regulation S-K (§ 229.405 of this chapter) is not contained herein, and will not be contained, to the best of registrant’s knowledge, in definitive proxy or information statements incorporated by reference in Part III of this Form 10-K or any amendment to this Form 10-K. ¨
Table of Contents
Index to Financial Statements
Indicate by check mark whether the registrant is a large accelerated filer, an accelerated filer, a non-accelerated filer, or a smaller reporting company. See the definition of “large accelerated filer,” “accelerated filer” and smaller reporting company in Rule 12b-2 of the Exchange Act.
Large accelerated filer x Accelerated filer ¨ Non-accelerated filer ¨ Smaller reporting company ¨
Indicate by check mark whether the registrant is a shell company (as defined in Rule 12b-2 of the Exchange Act). Yes ¨ No x
As of September 30, 2014, the aggregate market value of the registrant’s common stock held by non-affiliates of the registrant was $1,924,107,380 based on the closing sales price as reported on the New York Stock Exchange of $39.03.
As of April 30, 2015, 47,029,359 shares of the registrant’s common stock $0.10 par value per share were outstanding. Registrant has no other class of common stock outstanding.
DOCUMENTS INCORPORATED BY REFERENCE
Portions of the Registrant’s definitive proxy statement for its 2015 Annual Meeting of Stockholders to be filed with the Securities and Exchange Commission within 120 days after the end of the Registrant’s last fiscal year are incorporated by reference into Part III of this Annual Report on Form 10-K.
Table of Contents
Index to Financial Statements
TIDEWATER INC.
FORM 10-K
FOR THE FISCAL YEAR ENDED MARCH 31, 2015
| 4 | ||||||
| 4 | ||||||
| ITEM 1. |
4 | |||||
| ITEM 1A. |
19 | |||||
| ITEM 1B. |
27 | |||||
| ITEM 2. |
27 | |||||
| ITEM 3. |
27 | |||||
| ITEM 4. |
29 | |||||
| 30 | ||||||
| ITEM 5. |
MARKET FOR REGISTRANT’S COMMON EQUITY, RELATED STOCKHOLDER MATTERS AND ISSUER PURCHASES OF EQUITY SECURITIES | 30 | ||||
| ITEM 6. |
SELECTED FINANCIAL DATA | 32 | ||||
| ITEM 7. |
MANAGEMENT’S DISCUSSION AND ANALYSIS OF FINANCIAL CONDITION AND RESULTS OF OPERATIONS | 33 | ||||
| ITEM 7A. |
QUANTITATIVE AND QUALITATIVE DISCLOSURES ABOUT MARKET RISK | 79 | ||||
| ITEM 8. |
FINANCIAL STATEMENTS AND SUPPLEMENTARY DATA | 81 | ||||
| ITEM 9. |
CHANGES IN AND DISAGREEMENTS WITH ACCOUNTANTS ON ACCOUNTING AND FINANCIAL DISCLOSURE | 81 | ||||
| ITEM 9A. |
CONTROLS AND PROCEDURES | 81 | ||||
| ITEM 9B. |
OTHER INFORMATION | 82 | ||||
| 83 | ||||||
| ITEM 10. |
DIRECTORS, EXECUTIVE OFFICERS AND CORPORATE GOVERNANCE | 83 | ||||
| ITEM 11. |
EXECUTIVE COMPENSATION | 83 | ||||
| ITEM 12. |
SECURITY OWNERSHIP OF CERTAIN BENEFICIAL OWNERS AND MANAGEMENT AND RELATED STOCKHOLDER MATTERS | 83 | ||||
| ITEM 13. |
CERTAIN RELATIONSHIPS AND RELATED TRANSACTIONS, AND DIRECTOR INDEPENDENCE | 83 | ||||
| ITEM 14. |
PRINCIPAL ACCOUNTING FEES AND SERVICES | 83 | ||||
| 84 | ||||||
| ITEM 15. |
84 | |||||
3
Table of Contents
Index to Financial Statements
In accordance with the safe harbor provisions of the Private Securities Litigation Reform Act of 1995, the company notes that this Annual Report on Form 10-K and the information incorporated herein by reference contain certain forward-looking statements which reflect the company’s current view with respect to future events and future financial performance. All such forward-looking statements are subject to risks and uncertainties, and the company’s future results of operations could differ materially from its historical results or current expectations reflected by such forward-looking statements. Some of these risks are discussed in this Annual Report on Form 10-K including in Item 1A. “Risk Factors” and include, without limitation, volatility in worldwide energy demand and oil and gas prices; consolidation of our customer base: fleet additions by competitors and industry overcapacity; our views with respect to the need for and timing of the replenishment of our asset base, including through acquisitions or vessel construction; changes in capital spending by customers in the energy industry for offshore exploration, field development and production; loss of a major customer: changing customer demands for vessel specifications, which may make some of our older vessels technologically obsolete for certain customer projects or in certain markets; delays and other problems associated with vessel construction and maintenance: uncertainty of global financial market conditions and difficulty in accessing credit or capital; acts of terrorism and piracy; integration of acquired businesses and entry into new lines of business; disagreements with our joint venture partners; significant weather conditions; unsettled political conditions, war, civil unrest and governmental actions, such as expropriation or enforcement of customs or other laws that are not well developed or consistently enforced, or requirements that services provided locally be paid in local currency, in each case especially in higher political risk countries where we operate; foreign currency fluctuations; labor changes proposed by international conventions; increased regulatory burdens and oversight; changes in laws governing the taxation of foreign source income; retention of skilled workers; and enforcement of laws related to the environment, labor and foreign corrupt practices.
Forward-looking statements, which can generally be identified by the use of such terminology as “may,” “can,” “potential,” “expect,” “project,” “target,” “anticipate,” “estimate,” “forecast,” “believe,” “think,” “could,” “continue,” “intend,” “seek,” “plan,” and similar expressions contained in this Annual Report on Form 10-K, are not guarantees of future performance or events. Any forward-looking statements are based on the company’s assessment of current industry, financial and economic information, which by its nature is dynamic and subject to rapid and possibly abrupt changes, which the company may or may not be able to control. Further, the company may make changes to its business plans that could or will affect its results. While management believes that these forward-looking statements are reasonable when made, there can be no assurance that future developments that affect us will be those that we anticipate and have identified. The forward-looking statements should be considered in the context of the risk factors listed above and discussed in greater detail elsewhere in this Annual Report on Form 10-K. Investors and prospective investors are cautioned not to rely unduly on such forward-looking statements, which speak only as of the date hereof. Management disclaims any obligation to update or revise any forward-looking statements contained herein to reflect new information, future events or developments.
In certain places in this Annual Report on Form 10-K, the company may refer to reports published by third parties that purport to describe trends or developments in energy production and drilling and exploration activity. The company does so for the convenience of its investors and potential investors and in an effort to provide information available in the market that will lead to a better understanding of the market environment in which the company operates. The company specifically disclaims any responsibility for the accuracy and completeness of such information and undertakes no obligation to update such information.
Tidewater Inc., a Delaware corporation that is a listed company on the New York Stock Exchange under the symbol “TDW”, provides offshore service vessels and marine support services to the global offshore energy industry through the operation of a diversified fleet of marine service vessels. The company was incorporated in 1956 and conducts its operations through wholly-owned United States (U.S.) and international subsidiaries, as
4
Table of Contents
Index to Financial Statements
well as through joint ventures in which Tidewater has majority and sometimes non-controlling interests (generally where required to satisfy local ownership or local content requirements). Unless otherwise required by the context, the term “company” as used herein refers to Tidewater Inc. and its consolidated subsidiaries.
About Tidewater
The company’s vessels and associated vessel services provide support of all phases of offshore exploration, field development and production. These services include towing of, and anchor handling for, mobile offshore drilling units; transporting supplies and personnel necessary to sustain drilling, workover and production activities; offshore construction, remotely operated vehicle (ROV) operations, and seismic and subsea support; and a variety of specialized services such as pipe and cable laying. The company’s offshore support vessel fleet includes vessels that are operated under joint ventures, as well as vessels that have been stacked or withdrawn from service.
The company has one of the broadest geographic operating footprints in the offshore energy industry with operations in most of the world’s significant offshore crude oil and natural gas exploration and production offshore regions. Our global operating footprint allows us to react quickly to changing local market conditions and to respond to the changing requirements of the many customers with which we believe we have strong relationships. The company is also one of the most experienced international operators in the offshore energy industry with over five decades of international experience.
At March 31, 2015, the company owned or chartered 289 vessels (of which 10 were owned by joint ventures and 21 were stacked) and eight ROVs available to serve the global energy industry. Please refer to Note (1) of Notes to Consolidated Financial Statements included in Item 8 of this Annual Report on Form 10-K for additional information regarding our stacked vessels and vessels withdrawn from service.
Historically, the company operated two shipyards that performed repairs and new construction work for third-party customers, as well as the construction, repair and modification of the company’s own vessels. However, one of the two shipyards was sold during fiscal 2013 and the remaining shipyard was sold during the first quarter of fiscal 2014.
Our revenues, net earnings and cash flows from operations are largely dependent upon the activity level of our offshore support vessel fleet. As is the case with other energy service companies, our business activity is largely dependent on the level of crude oil and natural gas and exploration, field development and production activity by our customers. Our customers’ business activity, in turn, is dependent on crude oil and natural gas prices, which fluctuate depending on expected future levels of supply and demand for crude oil and natural gas, and on estimates of the cost to find, develop and produce reserves.
Offices and Facilities
The company’s worldwide headquarters and principal executive offices are located at 601 Poydras Street, Suite 1500, New Orleans, Louisiana 70130, and its telephone number is (504) 568-1010. The company’s U.S. marine operations are based in Amelia, Louisiana; Oxnard, California; and Houston, Texas. We conduct our international operations through facilities and offices located in over 30 countries. Our principal international offices and/or warehouse facilities, most of which are leased, are located in Rio de Janeiro and Macae, Brazil; Ciudad Del Carmen, Mexico; Port of Spain, Trinidad; Aberdeen, Scotland; Cairo, Egypt; Luanda and Cabinda, Angola; Lagos and Onne Port, Nigeria; Douala, Cameroon; Singapore; Perth, Australia; Shenzhen, China; Al Khobar, Kingdom of Saudi Arabia; Dubai, United Arab Emirates, and Oslo and Tromso, Norway. The company’s operations generally do not require highly specialized facilities, and suitable facilities are generally available on a lease basis as required.
Business Segments
We manage and measure our business performance in four distinct operating segments that we have established and that are based on our geographical organization: Americas, Asia/Pacific, Middle East/North Africa, and Sub-Saharan Africa/Europe. These segments are consistent with how the company’s chief operating decision maker (CODM) reviews operating results for the purposes of allocating resources and assessing performance. The company’s CODM is its Chief Executive Officer.
5
Table of Contents
Index to Financial Statements
Our Americas segment includes the activities of our North American operations, which include operations in the U.S. Gulf of Mexico (GOM) and U.S. and Canadian coastal waters of the Pacific and Atlantic oceans, as well as operations in Mexico, Trinidad and Brazil. The Asia/Pacific segment includes our Australian and Southeast Asian and Western Pacific operations. Middle East/North Africa includes our operations in the Mediterranean and Red Seas, the Black Sea, the Arabian Gulf and offshore India. Lastly, our Sub-Saharan Africa/Europe segment includes operations conducted along the East and West Coasts of Africa as well as operations in and around the Caspian Sea, the North Sea and certain other arctic/cold water markets.
Our principal customers in each of these business segments are large, international oil and natural gas exploration, field development and production companies (IOCs); select independent exploration and production (E&P) companies; foreign government-owned or government-controlled organizations and other companies that explore for, develop and produce oil and natural gas (NOCs); drilling contractors; and other companies that provide various services to the offshore energy industry, including but not limited to, offshore construction companies, diving companies and well stimulation companies.
The company’s vessels are dispersed throughout the major offshore crude oil and natural gas exploration, field development and production areas of the world. Although the company considers, among other things, mobilization costs and the availability of suitable vessels in its fleet deployment decisions, and cabotage rules in certain countries occasionally restrict the ability of the company to move vessels between markets, the company’s diverse, mobile asset base and the wide geographic distribution of its vessel assets generally enable the company to respond relatively quickly to changing market conditions and customer requirements.
Revenues in each of our segments are derived primarily from vessel time charter or similar contracts that are generally three months to four years in duration as determined by customer requirements, and, to a lesser extent, from vessel time charter contracts on a “spot” basis, which is a short-term (one day to three months) agreement to provide offshore marine services to a customer for a specific short-term job. The base rate of hire for a term contract is generally a fixed rate, though some charter arrangements allow the company to recover specific additional costs.
In each of our business segments, and depending on vessel capabilities and availability, our vessels operate in the shallow, intermediate and deepwater offshore markets of the respective regions. In recent years, the deepwater offshore market has been a growing sector in the offshore crude oil and natural gas markets due to technological developments that have made deepwater exploration and development feasible. It is the one sector that did not experience significant negative effects from the 2008-2009 global economic recession, largely because deepwater exploration and development projects involve significant capital investment and multi-year development plans. Such projects are generally underwritten by the participating exploration, development and production companies using relatively conservative assumptions in regards to crude oil and natural gas prices and, therefore, have not been as susceptible to short-term fluctuations in the price of crude oil and natural gas. However, the 2010 Deepwater Horizon incident did negatively affect the level of deepwater drilling activity of the U.S. GOM while the U.S. Department of the Interior, through the Bureau of Ocean Energy Management Regulation and Enforcement (BOEMRE), evaluated the causes of the incident and announced plans for enhanced regulatory and safety oversight as a condition to granting additional drilling and exploration permits. The BOEMRE resumed deepwater exploration and drilling permitting by February 2011, although the pace of permitting was initially slow. Within our Americas segment, in recent years, drilling activity in the shallow and intermediate waters of the U.S. GOM has also been negatively impacted by low natural gas prices. More broadly, the recent rapid and significant decline in crude oil and natural gas prices is expected to negatively impact exploration, development and possibly production activity, both in deepwater and non-deepwater markets, in 2015 and possibly beyond 2015.
As of March 31, 2015, there were approximately 85 deepwater offshore rigs under construction, however, there is uncertainty as to how many of those rigs, most of which are expected to enter service within the next two years, will increase the working fleet and how many of those rigs will replace older, less productive drilling units. The dayrates and the overall utilization of the worldwide deepwater offshore supply vessel fleet, which is also expected to increase in size, will, at least in part, depend upon the overall net growth in the number of working deepwater rigs.
6
Table of Contents
Index to Financial Statements
Please refer to Item 7 of this Annual Report on Form 10-K for a greater discussion of the company’s segments, including the macroeconomic environment in which we operate. In addition, please refer to Note (15) of Notes to Consolidated Financial Statements included in Item 8 of this Annual Report on Form 10-K for segment, geographical data and major customer information.
Geographic Areas of Operation
The company’s fleet is deployed in the major global offshore oil and gas areas of the world. The principal areas of the company’s operations include the U.S. GOM, the Arabian Gulf, the Mediterranean Sea and areas offshore Australia, Brazil, India, Malaysia, Mexico, Norway, the United Kingdom, Thailand, Trinidad, and West and East Africa.
Revenues and operating profit derived from our operations along with total marine assets for our segments for the fiscal years ended March 31 are summarized below:
| (In thousands) | ||||||||||||||
| 2015 | 2014 | 2013 | ||||||||||||
| Revenues: |
||||||||||||||
| Vessel revenues: |
||||||||||||||
| Americas |
$ | 505,699 | 410,731 | 327,059 | ||||||||||
| Asia/Pacific |
150,820 | 154,618 | 184,014 | |||||||||||
| Middle East/North Africa |
205,787 | 186,524 | 149,412 | |||||||||||
| Sub-Saharan Africa/Europe |
606,052 | 666,588 | 569,513 | |||||||||||
| Other operating revenues |
27,159 | 16,642 | 14,167 | |||||||||||
| $ | 1,495,517 | 1,435,103 | 1,244,165 | |||||||||||
|
| ||||||||||||||
| Vessel operating profit: |
||||||||||||||
| Americas |
$ | 122,988 | 90,936 | 40,318 | ||||||||||
| Asia/Pacific |
11,541 | 29,044 | 43,704 | |||||||||||
| Middle East/North Africa |
37,258 | 42,736 | 39,069 | |||||||||||
| Sub-Saharan Africa/Europe |
122,169 | 136,092 | 129,460 | |||||||||||
| 293,956 | 298,808 | 252,551 | ||||||||||||
| Other operating profit/(loss) |
(8,022 | ) | (1,930 | ) | (833 | ) | ||||||||
| 285,934 | 296,878 | 251,718 | ||||||||||||
| Corporate general and administrative expenses |
(40,621 | ) | (47,703 | ) | (48,704 | ) | ||||||||
| Corporate depreciation |
(4,014 | ) | (3,073 | ) | (3,391 | ) | ||||||||
| Corporate expenses |
(44,635 | ) | (50,776 | ) | (52,095 | ) | ||||||||
| Gain on asset dispositions, net |
9,271 | 11,722 | 6,609 | |||||||||||
| Goodwill impairment |
(283,699 | ) | (56,283 | ) | — | |||||||||
| Restructuring charge |
(4,052 | ) | — | — | ||||||||||
| Operating income/(loss) |
$ | (37,181 | ) | 201,541 | 206,232 | |||||||||
|
| ||||||||||||||
| Total marine assets: |
||||||||||||||
| Americas |
$ | 1,016,133 | 1,017,736 | 880,368 | ||||||||||
| Asia/Pacific |
506,265 | 421,379 | 607,546 | |||||||||||
| Middle East/North Africa |
666,983 | 613,303 | 507,124 | |||||||||||
| Sub-Saharan Africa/Europe |
2,064,010 | 2,383,507 | 1,706,355 | |||||||||||
| Other |
49,554 | 31,545 | 5,102 | |||||||||||
| Total marine assets |
$ | 4,302,945 | 4,467,470 | 3,706,495 | ||||||||||
|
| ||||||||||||||
Please refer to Item 7 of this Annual Report on Form 10-K and Note (15) of Notes to Consolidated Financial Statements included in Item 8 of this Annual Report on Form 10-K for further disclosure of segment revenues, operating profits, and total assets by geographical areas in which the company operates.
Our Global Vessel Fleet
Over the last 15 years, the company has maintained a vessel construction, acquisition and replacement program, with the intent of being able to operate in nearly all major oil and gas producing regions of the world by replacing older vessels in the company’s fleet with larger, more technologically sophisticated vessels. Since calendar 2000, the company has purchased and/or constructed 280 vessels at a total cost of approximately $4.7 billion (including 26 vessels at a cost of $270.8 million which were subsequently sold in transactions other than sale/lease transactions). Although the company is near the completion of its vessel construction, acquisition and replacement program, at March 31, 2015 the company had an additional 24 vessels under
7
Table of Contents
Index to Financial Statements
construction (including three that have since been cancelled) for a total cost of approximately $690.7 million. To date, the company has generally funded its vessel programs from its operating cash flows, together with funds provided by four private debt placements of senior unsecured notes and borrowings under bank credit facilities, proceeds from the disposition of (generally older) vessels, and various vessel sale-leaseback arrangements.
The company’s strategy contemplates both organic growth through the construction of vessels at a variety of shipyards worldwide and possible strategic acquisitions of recently built vessels and/or other vessel owners and operators. The company has the largest number of new offshore support vessels among its competitors in the industry. The company is nearing the successful completion of its long-term fleet replenishment and modernization strategy, and will continue to carefully consider whether future proposed investments and transactions have the appropriate risk/return-on-investment profile.
The average age of the company’s 279 owned or chartered vessels (excluding joint-venture vessels) at March 31, 2015 is approximately 9.5 years. The average age of 254 newer vessels in the fleet (defined as those that have been acquired or constructed since calendar year 2000 as part of the company’s new build and acquisition program as discussed below) is approximately 7.7 years. The remaining 25 vessels have an average age of 28.4 years. Of the company’s 279 vessels, 99 are deepwater platform supply vessels (PSVs) or deepwater anchor handling towing supply (AHTS) vessels, and 117 vessels are non-deepwater towing-supply vessels, which include both smaller PSVs and smaller AHTS vessels that primarily serve the jackup drilling market. Sixty-three vessels are included within our “other” vessel class, which is primarily comprised of crew boats and offshore tugs.
At March 31, 2015, the company had commitments to build 24 vessels at a number of different shipyards around the world at a total cost, including contract costs and other incidental costs, of approximately $690.7 million. At March 31, 2015, the company had invested approximately $310.6 million in progress payments towards the construction of the 24 vessels, and the remaining expenditures necessary to complete construction was estimated at $380.1 million. Of the 24 new construction commitment vessels, 17 were PSVs ranging between 3,800 and 6,000 deadweight tons of cargo capacity, six were non-deepwater towing supply class vessels with 7,145 brake horsepower (BHP) and one is a fast supply vessel. Scheduled delivery for these newbuild vessels began in April 2015, with delivery of the final vessel expected in September 2016.
In April 2015, the company notified an international shipyard that it was terminating three towing-supply vessel construction contracts as a result of late delivery and requested the return of approximately $36 million in aggregate installment payments together with interest on those installments. There was approximately $13 million in remaining expenditures to be made on these three vessels at the time of the termination. In May 2015, the company and another international shipyard that is constructing two of the 275-foot deepwater PSVs came to an agreement that provides the company an option to take delivery of one or both vessels at any time prior to June 30, 2016 or receive the return of installments aggregating $5.7 million per vessel at the end of this period. There were approximately $41 million of remaining costs to be incurred on these two vessels at the time of the agreement. Also, a partially constructed fast supply boat under construction in Brazil was originally scheduled to be delivered in September 2009 and has experienced substantial delay. Further discussions of these matters are disclosed in the “Vessel Count, Dispositions, Acquisitions and Construction Programs” section of Item 7 and Note (12) of Notes to Consolidated Financial Statements included in Item 8 of this Annual Report on Form 10-K.
A discussion of the company’s capital commitments, scheduled delivery dates and vessel sales is disclosed in the “Vessel Count, Dispositions, Acquisitions and Construction Programs” section of Item 7 and Note (12) of Notes to Consolidated Financial Statements included in Item 8 of this Annual report on Form 10-K. The “Vessel Count, Dispositions, Acquisitions and Construction Programs” section of Item 7 also contains a table comparing the actual March 31, 2015 vessel count and the average number of vessels by class and geographic distribution during the three years ended March 31, 2015, 2014 and 2013.
Between April 1999 and March 2015, the company also disposed of 696 vessels. Most of the vessels were sold at prices that exceeded their carrying values. In aggregate, proceeds from, and pre-tax gains on, vessel dispositions during this period approximated $784 million and $326 million, respectively.
8
Table of Contents
Index to Financial Statements
Our Vessel Classifications
Our vessels routinely move from one geographic region and reporting segment to another, and from one operating area to another operating area within the geographic regions and reporting segments. We disclose our vessel statistical information, including revenue, utilization and average day rates, by vessel class. Listed below are our three major vessel classes along with a description of the type of vessels categorized in each vessel class and the services the respective vessels typically perform. Tables comparing the average size of the company’s marine fleet by class and geographic distribution for the last three fiscal years are included in Item 7 of this Annual Report on Form 10-K.
Deepwater Vessels
Deepwater vessels, in the aggregate, are currently the company’s largest contributor to consolidated vessel revenue and vessel operating margin. Included in this vessel class are large (typically greater than 230-feet and/or with greater than 2,800 tons in dead weight cargo carrying capacity) PSVs and large, higher-horsepower (generally greater than 10,000 horsepower) AHTS vessels. These vessels are generally chartered to customers for use in transporting supplies and equipment from shore bases to deepwater and intermediate water depth offshore drilling rigs and production platforms and for otherwise supporting intermediate and deepwater drilling, production, construction and maintenance operations. Deepwater PSVs generally have large cargo capacities, both below deck (liquid mud tanks and dry bulk tanks) and above deck. Deepwater AHTS vessels are equipped to tow drilling rigs and other marine equipment, as well as to set anchors for the positioning and mooring of drilling rigs that generally are without dynamic positioning capabilities. Many of our deepwater PSVs and AHTS vessels are outfitted with dynamic positioning capabilities, which allow the vessel to maintain an absolute or relative position when mooring to an offshore installation, rig or another vessel is deemed unsafe, impractical or undesirable. Many of our deepwater vessels also have oil recovery, firefighting, standby rescue and/or other specialized equipment. Our customers demand a high level of safety and technological advancements to meet the more stringent regulatory standards, especially in the wake of the 2010 Deepwater Horizon incident.
Our deepwater class of vessel also includes specialty vessels that can support offshore well stimulation, construction work, subsea services and/or serve as remote accommodation facilities. These vessels are generally available for routine supply and towing services, but these vessels are also outfitted, and primarily intended, for specialty services. For example, these vessels can be equipped with a variety of lifting and deployment systems, including large capacity cranes, winches or reel systems. Included in the specialty vessel category is the company’s one multi-purpose platform supply vessel (MPSV). Our MPSV is approximately 311 feet in length, has a 100-ton active heave compensating crane, a moonpool and a helideck and is designed for subsea service and light construction support activities. This vessel is significantly larger in size, more versatile, and more specialized than the PSVs discussed above. The MPSV typically commands a higher day rate because the vessel has more capabilities, and because the vessel has a higher construction cost and higher operating costs.
Towing-Supply Vessels
This is currently the company’s largest fleet class by number of vessels. Included in this class are non-deepwater towing-supply vessels with horsepower below 10,000 BHP, and non-deepwater supply vessels that are generally less than 230 feet. The vessels in this class perform the same respective functions and services as deepwater AHTS vessels and deepwater PSVs except non-deepwater towing-supply vessels and non-deepwater supply vessels are generally chartered to customers for use in intermediate and shallow waters.
Other Vessels
The company’s “Other” vessels include crew boats, utility vessels and offshore tugs. Crew boats and utility vessels are chartered to customers for use in transporting personnel and supplies from shore bases to offshore drilling rigs, platforms and other installations. These vessels are also often equipped for oil field security missions in markets where piracy, kidnapping or other potential violence presents a concern. Offshore tugs are used to tow floating drilling rigs and barges; to assist in the docking of tankers; and to assist pipe laying, cable laying and construction barges.
9
Table of Contents
Index to Financial Statements
Revenue Contribution of Main Classes of Vessels
Revenues from vessel operations were derived from the following classes of vessels in the following percentages:
| Year Ended March 31, | ||||||||||||||
| 2015 | 2014 | 2013 | ||||||||||||
| Deepwater |
58.4% | 55.2% | 49.2% | |||||||||||
| Towing-supply |
34.5% | 37.1% | 42.4% | |||||||||||
| Other |
7.1% | 7.7% | 8.4% | |||||||||||
Subsea Services
Historically, the company’s subsea services were composed primarily of seismic and subsea vessel support. During fiscal 2014 the company expanded its subsea services capabilities by hiring a dedicated group of employees with substantial ROV and subsea expertise and by purchasing six work-class ROVs. Two additional higher specification work-class ROVs were added to the company’s fleet in fiscal 2015. Each ROV is capable of being deployed and redeployed worldwide on a variety of vessels and platforms and we began ROV deployment and operations in fiscal 2015. Our expanded subsea services capabilities include services and engineering solutions in all phases of the life of a subsea well, including exploration; construction and installation; and maintenance, repair and inspection, in water depths of up to 13,000 feet. In connection with the purchase of ROVs, the company has developed a proprietary operations management system customized for the operation of ROVs. Tidewater intends to continue expanding its subsea services capabilities to meet customer demand, and that expansion may include organic growth through commissioning the construction of additional ROVs or acquisitions of recently built ROVs and/or other ROV owners and operators.
Shipyard Operations
Quality Shipyards, L.L.C., a wholly-owned subsidiary of the company, operated two shipyards in Houma, Louisiana, that constructed, upgraded and repaired vessels. The shipyards performed repair work and new construction work for third-party customers, as well as the construction, repair and modification of the company’s own vessels. One of the two shipyards was sold during fiscal 2013, and the remaining shipyard was sold during the first quarter of fiscal 2014. During fiscal 2013, one partially constructed, deepwater PSV was transferred to another unaffiliated U.S. shipyard for completion. That vessel was delivered into the company’s owned and operated offshore support vessel fleet in March 2015.
Customers and Contracting
The company’s operations are materially dependent upon the levels of activity in offshore crude oil and natural gas exploration, field development and production throughout the world, which is affected by trends in global crude oil and natural gas pricing, including expectations of future commodity pricing, which is ultimately influenced by the supply and demand relationship for these natural resources. The activity levels of our customers are also influenced by the cost of exploring for and producing crude oil and natural gas, which can be affected by environmental regulations, technological advances that affect energy production and consumption, significant weather conditions, the ability of our customers to raise capital, and local and international economic and political environments, including government mandated moratoriums. A discussion of current market conditions and trends appears under “Macroeconomic Environment and Outlook” in Item 7 of this Annual Report on Form 10-K.
The company’s principal customers are IOCs; select independent E&P companies; NOCs; drilling contractors; and other companies that provide various services to the offshore energy industry, including but not limited to, offshore construction companies, diving companies and well stimulation companies.
Our primary source of revenue is derived from time charter contracts on our vessels on a rate per day of service basis; therefore, vessel revenues are recognized on a daily basis throughout the contract period. As noted above, these time charter contracts are generally either on a term or “spot” basis. There are no material differences in the cost structure of the company’s contracts based on whether the contracts are spot or term because the operating costs are generally the same without regard to the length of a contract.
10
Table of Contents
Index to Financial Statements
The following table discloses our customers that accounted for 10% or more of total revenues during any of our last three fiscal years:
| 2015 | 2014 | 2013 | ||||||||||||
| Chevron Corporation |
12.7 | % | 18.1 | % | 17.8 | % | ||||||||
| Petroleo Brasileiro SA |
11.8 | % | 8.6 | % | 8.6 | % | ||||||||
| BP plc |
10.1 | % | 8.9 | % | 7.9 | % | ||||||||
While it is normal for our customer base to change over time as our vessel time charter contracts turn over, the unexpected loss of either or both of these two significant customers could, at least in the short term, have a material adverse effect on the company’s vessel utilization and its results of operations. Our five largest customers in aggregate accounted for approximately 45% of our fiscal 2015 total revenues, while the 10 largest customers in aggregate accounted for approximately 62% of the company’s fiscal 2015 total revenues.
Consolidation activity amongst exploration, development, and production companies can reduce the number of customers for the company’s vessels and services and may negatively affect exploration, field development and production activity as consolidated companies generally focus, at least initially, on increasing efficiency and reducing costs and delay or abandon exploration activity with less promise. Such activity can adversely affect demand for our vessels, and reduce the company’s revenues.
Competition
The principal competitive factors for the offshore vessel service industry are the suitability and availability of vessel equipment, price and quality of service. In addition, the ability to demonstrate a strong safety record and attract and retain qualified and skilled personnel are also important competitive factors. The company has numerous competitors in all areas in which it operates around the world, and the business environment in all of these markets is highly competitive.
The company’s diverse, mobile asset base and the wide geographic distribution of its assets generally enable the company to respond relatively quickly to changes in market conditions and to provide a broad range of vessel services to its customers around the world. We believe the company has a competitive advantage because of the size, diversity and geographic distribution of our vessel fleet. Economies of scale and experience level in the many areas of the world in which we operate are also considered competitive advantages as is the company’s strong financial position.
An increase in worldwide vessel capacity could have the effect of lowering charter rates, particularly when there are lower levels of exploration, field development and production activity. According to IHS-Petrodata, the global offshore support vessel market at the end of March 2015 had approximately 540 new-build offshore support vessels (deepwater PSVs, deepwater AHTS vessels and towing-supply vessels only) either under construction (420 vessels), on order or planned as of April 2015, that are expected to be delivered into the worldwide offshore vessel market primarily over the next three years. The current worldwide fleet of these classes of vessels is estimated at approximately 3,270 vessels, of which Tidewater estimates more than 10% are stacked or are not being actively marketed by the vessels’ owners. The worldwide offshore marine vessel industry, however, also has a large number of aged vessels, including approximately 650 vessels, or 20%, of the worldwide offshore fleet, that are at least 25 years old and nearing or exceeding original expectations of their estimated economic lives. These older vessels, of which Tidewater estimates 40% to 50% are either already stacked or are not being actively marketed by the vessels’ owners, could potentially be removed from the market within the next few years as the cost of extending these vessels’ lives may not be economically justifiable. Although the future attrition rate of these aging vessels cannot be determined with absolute certainty, the company believes that the retirement of a sizeable portion of these aged vessels could mitigate the potential negative effects of new-build vessels on vessel utilization and vessel pricing.
11
Table of Contents
Index to Financial Statements
Challenges We Confront as an International Offshore Vessel Company
We operate in many challenging operating environments around the world that present varying degrees of political, social, economic and other uncertainties. We operate in markets where risks of expropriation, confiscation or nationalization of our vessels or other assets, terrorism, piracy, civil unrest, changing foreign currency exchange rates and controls, and changing political conditions may adversely affect our operations. Although the company takes what it believes to be prudent measures to safeguard its property, personnel and financial condition against these risks, it cannot eliminate entirely the foregoing risks, though the wide geographic dispersal of the company’s vessels helps reduce the overall potential impact of these risks. In addition, immigration, customs, tax and other regulations (and administrative and judicial interpretations thereof) can have a material impact on our ability to work in certain countries and on our operating costs.
In some international operating environments, local customs or laws may require or make it advisable that the company form joint ventures with local owners or use local agents. The company is dedicated to carrying out its international operations in compliance with the rules and regulations of the Office of Foreign Assets Control (OFAC), the Trading with the Enemy Act, the Foreign Corrupt Practices Act (FCPA), and other applicable laws and regulations. The company has adopted policies and procedures to mitigate the risks of violating these rules and regulations.
Sonatide Joint Venture
As previously reported, in November 2013, a subsidiary of the company and its joint venture partner in Angola, Sonangol Holdings Lda. (“Sonangol”), executed a new joint venture agreement for their joint venture, Sonatide. The new joint venture agreement is currently effective and will expire, unless extended, two years after an Angolan entity, which is intended to be one of the Sonatide group of companies, has been incorporated. The Angolan entity is expected to be incorporated by late 2015 after certain Angolan regulatory approvals have been obtained.
The challenges for the company to successfully operate in Angola remain significant. As the company has previously reported, on July 1, 2013, elements of new legislation (the “forex law”) became effective that generally require oil companies that engage in exploration and production activities offshore Angola through governmental concessions to pay for goods and services provided by foreign exchange residents in Angolan kwanzas that are initially deposited into an Angolan bank account. The forex law also imposes documentation and other requirements on service companies such as Sonatide in order to effect payments that are denominated in currencies other than Angolan kwanzas. The forex law has resulted in, and will likely continue to result in, substantial customer payments being made to Sonatide in Angolan kwanzas. This cumbersome payment process has imposed and could continue to impose a burden on Tidewater’s management of its cash and liquidity, because of the risks that the conversion of Angolan kwanzas into U.S. dollars and the subsequent expatriation of the funds could result in payment delays and currency devaluation prior to conversion of kwanzas to dollars, as well as burden the company with additional operating costs to convert kwanzas into dollars and potentially additional taxes.
In response to the new forex law, Tidewater and Sonangol negotiated and signed an agreement that is set to expire, unless extended, in November 2015 (the “consortium agreement”) that is intended to allow the Sonatide joint venture to enter into contracts with customers that allocate billings for services provided by Sonatide between (i) billings for local services that are provided by a foreign exchange resident (that must be paid in kwanzas), and (ii) billings for services provided by offshore residents (that can be paid in dollars). Sonatide successfully converted select customer contracts to this split billing arrangement during the quarter ended March 31, 2015 and continues to discuss this type of billing arrangement with other customers. We are unable to determine the impact that an inability to extend the consortium agreement would have on the existing split billing arrangements, and the ability to enter into new split billing arrangements. In addition, it is not clear if this type of contracting will be available to Sonatide over the longer term.
In November 2014, the National Bank of Angola issued new regulations controlling the sale of foreign currency. These regulations generally require oil companies to sell U.S. dollars to the National Bank of Angola to buy kwanzas that are required to be used to pay for goods and services provided by foreign exchange resident oilfield service companies. These foreign exchange resident oilfield service companies, in turn, are required to source U.S. dollars in order to pay for goods and services provided offshore. The regulations continue to permit tripartite agreements among oil companies, commercial banks and service companies that provide for
12
Table of Contents
Index to Financial Statements
the sale of U.S. dollars by an oil company to a commercial bank in exchange for kwanzas. These same U.S. dollars are then sold onward by the commercial bank to the service company. The implementing regulations do, however, place constraints on those tripartite agreements that did not previously exist, and the period of time that the tripartite agreements will be allowed remains uncertain. If tripartite agreements or similar arrangements are not available to service companies in Angola that have a need for dollars, then such service companies will be required to source dollars exclusively through the National Bank of Angola. Sonatide has had limited success to date negotiating tripartite agreements but it continues its discussions with customers, commercial banks and the National Bank of Angola regarding these arrangements.
For the fiscal year ended March 31, 2015, the company collected (primarily through Sonatide) approximately $338 million from its Angola operations, which is slightly less than the approximately $351 million of revenue recognized for the same period. Of the $338 million collected approximately $159 million represented U.S. dollars received by Sonatide on behalf of the company or dollars directly received by the company from customers. The balance of $179 million collected resulted from Sonatide’s converting kwanza into dollars and subsequently expatriating the dollars to Tidewater. Additionally, the company received an approximate $10 million dividend payment from the Sonatide joint venture during the third quarter of fiscal 2015.
Though Sonatide experienced a substantially reduced ability to convert kwanzas to dollars during parts of the quarter ended December 31, 2014 (possibly due to holiday season and/or the newly enhanced role of the National Bank of Angola from November 2014 in the conversion process), the company believes that the process for converting kwanzas has functioned reasonably well for much of fiscal 2015, particularly given that the conversion process was still developing. Sonatide continues to press its commercial bank relationships to increase the amount of dollars that are made available to Sonatide.
As of March 31, 2015, the company had approximately $420 million in amounts due from Sonatide, with approximately half of the balance reflecting invoiced but unpaid vessel revenue related to services performed by the company through the Sonatide joint venture. Remaining amounts due to the company from Sonatide include cash (primarily denominated in Angolan kwanzas) held by Sonatide that is pending conversion into U.S. dollars and the subsequent expatriation of such funds. Cash held by Sonatide began to accumulate in late calendar 2012, when the initial provisions of the forex law relating to payments for goods and services provided by foreign exchange residents took effect (and payments were required to be paid into local bank accounts). Beginning in July 2013, when the second provision of the forex law took effect (and the local payments had to be made in kwanza), Sonatide generally accrued for but did not deliver invoices to customers for vessel revenue related to Sonatide and the company’s collective Angolan operations in order to minimize the exposure that Sonatide would be paid for a substantial amount of charter hire in kwanzas and into an Angolan bank. During this time, the company began using its credit facility and other arrangements to fund the substantial working capital requirements related to its Angola operations.
Beginning in the first quarter of fiscal 2015, Sonatide began sending invoices to those customers that insisted on paying U.S. dollar denominated invoices in kwanza. As invoices are paid in kwanza, Sonatide seeks to convert those kwanzas into U.S. dollars and subsequently utilize those U.S. dollars to pay the amounts that Sonatide owes the company. This conversion and expatriation process is subject to those risks and considerations set forth above.
For the fiscal year ended March 31, 2015, Tidewater’s Angolan operations generated vessel revenues of approximately $351 million, or 23%, of its consolidated vessel revenue, from an average of approximately 80 Tidewater-owned vessels that are marketed through the Sonatide joint venture (8 of which were stacked on average during the year ended March 31, 2015), and, for the year ended March 31, 2014, generated vessel revenues of approximately $357 million, or 25%, of consolidated vessel revenue, from an average of approximately 90 Tidewater-owned vessels (five of which were stacked on average during the year ended March 31, 2014).
Sonatide joint venture owns nine vessels (three of which are currently stacked) and certain other assets, in addition to earning commission income from Tidewater-owned vessels marketed through the Sonatide joint venture (owned 49% by Tidewater). In addition, as of March 31, 2015, Sonatide maintained the equivalent of approximately $150 million of kwanza-denominated deposits in Angolan banks, largely related to customer receipts that had not yet been converted to U.S. dollars, expatriated and then remitted to the company. As of
13
Table of Contents
Index to Financial Statements
March 31, 2015 and March 31, 2014, the carrying value of Tidewater’s investment in the Sonatide joint venture, which is included in “Investments in, at equity, and advances to unconsolidated companies,” is approximately $67 million and $62 million, respectively.
Due from affiliate at March 31, 2015 and March 31, 2014 of approximately $420 million and $430 million, respectively, represents cash received by Sonatide from customers and due to the company, amounts due from customers that are expected to be remitted to the company through Sonatide and, finally, reimbursable costs paid by Tidewater on behalf of Sonatide. The collection of the amounts due from customers and the subsequent conversion and expatriation process are subject to those risks and considerations set forth above.
Due to affiliate at March 31, 2015 and March 31, 2014 of approximately $186 million and $86 million, respectively, represents amounts due to Sonatide for commissions payable (approximately $66 million and $43 million, respectively) and other costs paid by Sonatide on behalf of the company.
A new presidential decree regulating maritime transportation activities was enacted in Angola earlier this year. Following recent discussions with port state authorities and local counsel, the company is uncertain whether the authorities will interpret the decree to require one hundred percent Angolan ownership of local vessel operators such as Sonatide. This interpretation may result in the need to work with Sonangol to further restructure our Sonatide joint venture and our operations in Angola. The company has been informed by the authorities that the deadline for foreign vessel operators to comply with any rules implementing the decree has been set for June 2015. The company is seeking further clarification of the new decree and has been advised that a grace period for compliance will be granted until such clarifications are published. The company is exploring potential alternative structures in order to comply.
The Angolan government has included a proposal for a new levy in its most recent budget that could impose an additional 10-20% surcharge on foreign exchange transactions. We understand that a new decree imposing a levy could be published soon. The specific details of the levy have not yet been disclosed and it is not clear if this new decree would apply to Sonatide’s scope of operations. The company has undertaken efforts to mitigate the effects of the levy, in the event the levy is enacted into law, including successfully negotiating rate adjustments and termination rights with some of its customers. The company will be unlikely to completely mitigate the effects of the levy, resulting in increased costs and lower margins, if the levy is enacted.
Management continues to explore ways to profitably participate in the Angolan market while looking for opportunities to reduce the overall level of exposure to the increased risks that the company believes currently characterize the Angolan market. Included among mitigating measures taken by the company to address these risks is the redeployment of vessels from time to time to other markets where there is adequate demand for the company’s vessels. During the year ended March 31, 2014, the company redeployed vessels from its Angolan operations to other markets and also transferred vessels into its Angolan operations from other markets resulting in a net increase of one vessel operating in Angola. Redeployment of vessels to and from Angola in the year ended March 31, 2015 has resulted in a net 13 vessels transferred out of Angola, including four smaller crewboats that were stacked outside of Angola.
As the company considers the redeployment of additional vessels from Angola to other markets, there would likely be temporary negative financial effects associated with such redeployment, including mobilization costs and costs to redeploy Tidewater shore-based employees to other areas, in addition to lost revenues associated with potential downtime between vessel contracts. These financial impacts could, individually or in the aggregate, be material to our results of operations and cash flows for the periods when such costs would be incurred. The recent decline in crude oil and natural gas prices, the reduction in spending expectations among E&P companies, the number of new-build vessels which are expected to deliver within the next two years and the resulting potential overcapacity in the worldwide offshore support vessel market may exacerbate such negative financial effects, particularly if a large re-deployment were undertaken by the company in the near- to intermediate-term.
14
Table of Contents
Index to Financial Statements
International Labour Organization’s Maritime Labour Convention
The International Labour Organization’s Maritime Labour Convention, 2006 (the “Convention”) mandates globally, among other things, seafarer living and working conditions (accommodations, wages, conditions of employment, health and other benefits) aboard ships that are engaged in commercial activities. Since its initial entry into force on August 20, 2013, a total of 66 countries have ratified the Convention, with enforcement presently concentrated in Europe and Asia Pacific; however, a more diverse geographic footprint of enforcement is expected by the end of calendar 2015.
The company continues to work with its flag states to seek substantial equivalencies to comparable national and industry laws that meet the intent of the Convention. By seeking and obtaining these substantial equivalencies, the company is able to maintain its long-standing operational protocols that meet the requirements of the Convention and to mitigate changes in business processes that would offer no additional substantive benefits to crew members. The company continues prioritizing certification of its vessels to Convention requirements based on the dates of enforcement by countries in which the company has operations, performs maintenance and repairs at shipyards, or may make port calls during ocean voyages.
The company continues to assess its global seafarer labor relationships and fleet operational practices to not only ensure compliance with the Convention but also gauge the impact of effective enforcement as ratifications progress, the effects of which cannot be reasonably estimated at this time.
Government Regulation
The company is subject to various United States federal, state and local statutes and regulations governing the operation and maintenance of its vessels. The company’s U.S. flagged vessels are subject to the jurisdiction of the United States Coast Guard, the United States Customs and Border Protection, and the United States Maritime Administration. The company is also subject to international laws and conventions and the laws of international jurisdictions where the company and its offshore vessels operate.
Under the citizenship provisions of the Merchant Marine Act of 1920 and the Shipping Act, 1916, as amended, the company would not be permitted to engage in the U.S. coastwise trade if more than 25% of the company’s outstanding stock were owned by non-U.S. citizens. For a company engaged in the U.S. coastwise trade to be deemed a U.S. citizen: (i) the company must be organized under the laws of the United States or of a state, territory or possession thereof, (ii) each of the chief executive officer and the chairman of the board of directors of such corporation must be a U.S. citizen, (iii) no more than a minority of the number of directors of such corporation necessary to constitute a quorum for the transaction of business can be non-U.S. citizens and (iv) at least 75% of the interest in such company must be owned by U.S. citizens. The company has a dual stock certificate system to protect against non-U.S. citizens owning more than 25% of its common stock. In addition, the company’s charter provides the company with certain remedies with respect to any transfer or purported transfer of shares of the company’s common stock that would result in the ownership by non-U.S. citizens of more than 24% of its common stock. Based on information supplied to the company by its transfer agent, approximately 12% of the company’s outstanding common stock was owned by non-U.S. citizens as of March 31, 2015.
The company’s vessel operations in the U.S. GOM are considered to be coastwise trade. United States law requires that vessels engaged in the U.S. coastwise trade must be built in the U.S. and registered under U.S flag. In addition, once a U.S. built vessel is registered under a non-U.S. flag, it cannot thereafter engage in U.S. coastwise trade. Therefore, the company’s non-U.S. flagged vessels must operate outside of the U.S. coastwise trade zone. Of the total 289 vessels owned or operated by the company at March 31, 2015, 261 vessels were registered under flags other than the United States and 28 vessels were registered under the U.S. flag.
All of the company’s offshore vessels are subject to either United States or international safety and classification standards or sometimes both. U.S. flag deepwater PSVs, deepwater AHTS vessels, towing-supply vessels, supply vessels and crewboats are required to undergo periodic inspections twice within every five year period pursuant to U.S. Coast Guard regulations. Vessels registered under flags other than the United States are subject to similar regulations and are governed by the laws of the applicable international jurisdictions and the rules and requirements of various classification societies, such as the American Bureau of Shipping.
15
Table of Contents
Index to Financial Statements
The company is in compliance with the International Ship and Port Facility Security Code (ISPS), an amendment to the Safety of Life at Sea (SOLAS) Convention (1974/1988), and further mandated in the Maritime Transportation and Security Act of 2002 to align United States regulations with those of SOLAS and the ISPS Code. Under the ISPS Code, the company performs worldwide security assessments, risk analyses, and develops vessel and required port facility security plans to enhance safe and secure vessel and facility operations. Additionally, the company has developed security annexes for those U.S. flag vessels that transit or work in waters designated as high risk by the United States Coast Guard pursuant to the latest revision of Marsec Directive 104-6.
Environmental Compliance
During the ordinary course of business, the company’s operations are subject to a wide variety of environmental laws and regulations that govern the discharge of oil and pollutants into navigable waters. Violations of these laws may result in civil and criminal penalties, fines, injunctions and other sanctions. Compliance with the existing governmental regulations that have been enacted or adopted regulating the discharge of materials into the environment, or otherwise relating to the protection of the environment has not had, nor is expected to have, a material effect on the company. Environmental laws and regulations are subject to change, however, and may impose increasingly strict requirements, and, as such, the company cannot estimate the ultimate cost of complying with such potential changes to environmental laws and regulations.
The company is also involved in various legal proceedings that relate to asbestos and other environmental matters. The amount of ultimate liability, if any, with respect to these proceedings is not expected to have a material adverse effect on the company’s financial position, results of operations, or cash flows. The company is proactive in establishing policies and operating procedures for safeguarding the environment against any hazardous materials aboard its vessels and at shore-based locations.
Whenever possible, hazardous materials are maintained or transferred in confined areas in an attempt to ensure containment, if accidents were to occur. In addition, the company has established operating policies that are intended to increase awareness of actions that may harm the environment.
Safety
We are dedicated to ensuring the safety of our operations for both our employees and our customers. Tidewater’s principal operations occur in offshore waters where the workplace environment presents many safety challenges. Management communicates frequently with company personnel to promote safety and instill safe work habits through the use of company media directed at, and regular training of, both our seamen and shore-based personnel. Personnel and resources are dedicated to ensure safe operations and regulatory compliance. Our Director of Health, Safety, Environment and Security (HSES) Management is involved in numerous proactive efforts to prevent accidents and injuries from occurring. The HSES Director also reviews all incidents that occur throughout the company, focusing on lessons that can be learned from such incidents and opportunities to incorporate such lessons into the company’s on-going safety-related training. In addition, the company employs safety personnel in every operating region to be responsible for administering the company’s safety programs and fostering the company’s safety culture. We believe that every Tidewater employee is a safety supervisor, who has the authority and the obligation to stop any operation that they deem to be unsafe.
Risk Management
The operation of any marine vessel involves an inherent risk of marine losses (including physical damage to the vessel) attributable to adverse sea and weather conditions, mechanical failure, and collisions. In addition, the nature of our operations exposes the company to the potential risks of damage to and loss of drilling rigs and production facilities: hostile activities attributable to war, sabotage, piracy and terrorism, as well as business interruption due to political action or inaction, including nationalization of assets by foreign governments. Any such event may lead to a reduction in revenues or increased costs. The company’s vessels are generally insured for their estimated market value against damage or loss, including war, acts of terrorism, and pollution risks, but the company does not directly or fully insure for business interruption. The company also carries workers’ compensation, maritime employer’s liability, director and officer liability, general liability (including third party pollution) and other insurance customary in the industry.
16
Table of Contents
Index to Financial Statements
The company seeks to secure appropriate insurance coverage at competitive rates, in part, by maintaining self-insurance up to certain individual and aggregate loss limits. The company carefully monitors claims and participates actively in claims estimates and adjustments. Estimated costs of self-insured claims, which include estimates for incurred but unreported claims, are accrued as liabilities on our balance sheet.
The continued threat of terrorist activity and other acts of war or hostility have significantly increased the risk of political, economic and social instability in some of the geographic areas in which the company operates. It is possible that further acts of terrorism may be directed against the United States domestically or abroad, and such acts of terrorism could be directed against properties and personnel of U.S. headquartered companies such as ours. The resulting economic, political and social uncertainties, including the potential for future terrorist acts and war, could cause the premiums charged for our insurance coverage to increase. The company currently maintains war risk coverage on its entire fleet.
Management believes that the company’s insurance coverage is adequate. The company has not experienced a loss in excess of insurance policy limits; however, there is no assurance that the company’s liability coverage will be adequate to cover potential claims that may arise. While the company believes that it should be able to maintain adequate insurance in the future at rates considered commercially acceptable, it cannot guarantee that such insurance will continue to be available at commercially acceptable rates given the markets in which the company operates.
Seasonality
The company’s global vessel fleet generally has its highest utilization rates in the warmer months when the weather is more favorable for offshore exploration, field development and construction work. Hurricanes, cyclones, the monsoon season, and other severe weather can negatively or positively impact vessel operations. In particular, the company’s U.S. GOM operations can be impacted by the Atlantic hurricane season from the months of June through November, when offshore exploration, field development and construction work tends to slow or halt in an effort to mitigate potential losses and damage that may occur to the offshore oil and gas infrastructure should a hurricane enter the area. However, demand for offshore marine vessels typically increases in the U.S. GOM in connection with repair and remediation work that follows any hurricane damage to offshore crude oil and natural gas infrastructure. The company’s vessels that operate offshore India in Southeast Asia and in the Western Pacific are impacted by the monsoon season, which moves across the region from November to April. Vessels that operate in the North Sea can be impacted by a seasonal slowdown in the winter months, generally from November to March. Vessels that operate in Australia are impacted by cyclone season from November to April. Customers in this region, where possible, plan business activities around the cyclone season; however, Australia generally has high trade winds even during the non-cyclone season and, as such, the impact of the cyclone season on our operations is not significant. Although hurricanes, cyclones, monsoons and other severe weather can have a seasonal impact on operations, the company’s business volume is more dependent on crude oil and natural gas pricing, global supply of crude oil and natural gas, and demand for the company’s offshore support vessel and other services than on any seasonal variation.
Employees
As of March 31, 2015, the company had approximately 8,500 employees worldwide. The company strives to maintain excellent relations with its employees. The company is not a party to any union contract in the United States but through several subsidiaries is a party to union agreements covering local nationals in several countries other than the United States. In the past, the company has been the subject of a union organizing campaign for the U.S. GOM employees by maritime labor unions. These union organizing efforts have abated, although the threat has not been completely eliminated. If the employees in the U.S. GOM were to unionize, the company’s flexibility in managing industry changes in the domestic market could be adversely affected.
17
Table of Contents
Index to Financial Statements
Executive Officers of the Registrant
The name of each of our executive officers, together with their respective age and all offices held as of March 31, 2015 is as follows:
| Name |
Age |
Position | ||
| Jeffrey M. Platt | 57 | President and Chief Executive Officer since June 2012. Chief Operating Officer since March 2010. Executive Vice President since July 2006. Senior Vice President from 2004 to June 2006. Vice President from 2001 to 2004. | ||
| Jeffrey A. Gorski | 54 | Chief Operating Officer and Executive Vice President since June 2012. Senior Vice President from January 2012 to May 2012. Prior to January 2012, Mr. Gorski was a Vice-President of Global Accounts with Schlumberger Inc., a publicly-held oilfield services company. | ||
| Quinn P. Fanning | 51 | Chief Financial Officer since September 2008. Executive Vice President since July 2008. Prior to July 2008, Mr. Fanning was a Managing Director with Citigroup Global Markets Inc. and generally focused on advisory services for the energy industry. | ||
| Bruce D. Lundstrom | 51 | Executive Vice President since August 2008. Senior Vice President from September 2007 to July 2008. General Counsel and Secretary since September 2007. | ||
| Joseph M. Bennett | 59 | Executive Vice President since June 2008. Chief Investor Relations Officer since 2005. Senior Vice President from 2005 to May 2008. Principal Accounting Officer from 2001 to May 2008. Vice President from 2001 to 2005. | ||
There are no family relationships between any of the directors or executive officers of the company or any arrangements or understandings between any of the executive officers and any other person pursuant to which any of the executive officers were selected as an officer. The company’s executive officers are elected annually by the Board of Directors and serve for one-year terms or until their successors are elected.
Available Information
We make available free of charge, on or through our website (www.tdw.com), our Annual Reports on Form 10-K, Quarterly Reports on Form 10-Q, Current Reports on Form 8-K, and other filings pursuant to Section 13(a) or 15(d) of the Securities Exchange Act of 1934, and amendments to such filings, as soon as reasonably practicable after each is electronically filed with, or furnished to, the Securities and Exchange Commission (the “SEC”). You may read and copy any materials we file with the SEC at the SEC’s Public Reference Room at 100 F Street, N.E., Washington, DC 20549. Information on the operation of the Public Reference Room may be obtained by calling the Commission at 1-800-SEC-0330. The SEC maintains a website that contains the company’s reports, proxy and information statements, and the company’s other SEC filings. The address of the SEC’s website is www.sec.gov. Information appearing on the company’s website is not part of any report that it files with the SEC.
The company has adopted a Code of Business Conduct and Ethics (Code), which is applicable to its directors, chief executive officer, chief financial officer, principal accounting officer, and other officers and employees on matters of business conduct and ethics, including compliance standards and procedures. The Code is publicly available on our website at www.tdw.com. We will make timely disclosure by a Current Report on Form 8-K and on our website of any change to, or waiver from, the Code for our chief executive officer, chief financial officer and principal accounting officer. Any changes or waivers to the Code will be maintained on the company’s website for at least 12 months. A copy of the Code is also available in print to any stockholder upon written request addressed to Tidewater Inc., 601 Poydras Street, Suite 1500, New Orleans, Louisiana 70130.
18
Table of Contents
Index to Financial Statements
We operate globally in challenging and highly competitive markets and thus our business is subject to a variety of risks. Listed below are some of the more critical or unique risk factors that we have identified as affecting or potentially affecting our company and the offshore marine service industry which could cause our actual results to differ materially from those anticipated, projected or assumed in the forward-looking statement. You should consider all risks when evaluating any of the company’s forward-looking statements. The effect of any one risk factor or a combination of several risk factors could materially affect the company’s results of operations, financial condition and cash flows and the accuracy of any forward-looking statements made in this Annual Report on Form 10-K.
Volatility of Oil and Gas Prices; Recent Depressed Prices for Oil and Gas
Even in a more favorable commodity pricing climate, prices for crude oil and natural gas are highly volatile and extremely sensitive to the respective supply/demand relationship for crude oil and natural gas. High demand for crude oil and natural gas, reductions in supplies and/or low inventory levels for these resources, as well as any perceptions about future supply interruptions can cause prices for crude oil and natural gas to rise. Conversely, low demand for crude oil and natural gas, increases in supplies and/or increases in crude oil and natural gas inventories can cause prices for crude oil and natural gas to decrease. In addition, global military, political, and economic events, including civil unrest in the oil producing and exporting countries of the Middle East and North Africa, have historically contributed to crude oil and natural gas price volatility.
Factors that affect the supply of crude oil and natural gas include, but are not limited to, the following: global demand for hydrocarbons; the Organization of Petroleum Exporting Countries’ (OPEC) ability to control crude oil production levels and pricing, as well as the level of production by non-OPEC countries; sanctions imposed by the U.S., the European Union, or other governments against oil producing countries; political and economic uncertainties (including wars, terrorist acts or security operations); advances in exploration and field development technologies (such as fracking); increased availability of shale gas and other non-traditional energy resources; significant weather conditions; and governmental policies/restrictions placed on the exploration and production of natural resources.
The significant recent decrease in oil and natural gas prices is expected to cause a reduction in many of our customers’ drilling, completion and other production activities and related spending on our services in 2015. If oil and natural gas prices remain at their current levels or decline further, this reduction in activity levels and spending could persist and accelerate through 2015 and beyond. It is difficult to predict how long the current commodity price conditions will continue, or to what extent low commodity prices will affect our business. Because a prolonged material downturn in crude oil and natural gas prices and/or perceptions of long-term lower commodity prices can negatively impact the development plans of exploration and production companies given the long-term nature of large-scale development projects, a downturn of any such duration would likely result in a significant decline in demand for offshore support services. In such event, we could experience further erosion in charter rates and/or utilization rates, which would have a material adverse effect on our results of operations, cash flows and financial condition. Higher commodity prices, however, do not necessarily translate into increased demand for offshore support services or sustained higher pricing for offshore support vessel services. Increased commodity demand can be satisfied by land-based energy resources and increased demand for offshore support vessel services can be more than offset by an increased supply of offshore support vessels resulting from the construction of additional offshore support vessels.
Crude oil pricing volatility has increased in recent years as crude oil has emerged as a widely-traded financial asset class. To the extent speculative trading of crude oil causes excessive crude oil pricing volatility, our results of operations could potentially be negatively impacted if such price volatility affects spending and investment decisions of offshore exploration, development and production companies.
Changes in the Level of Capital Spending by Our Customers
Demand for our offshore services, and thus our results of operations, are highly dependent on the level of spending and investment in regards to offshore exploration, development and production by the companies that operate in the energy industry. The energy industry’s level of capital spending is substantially related to current and expected future demand for hydrocarbons and the prevailing commodity prices of crude oil and, to a lesser extent, natural gas. Demand for hydrocarbons has softened while supply has steadily increased, resulting in
19
Table of Contents
Index to Financial Statements
significant declines in crude oil prices. When commodity prices are low, or when our customers believe that they will be low in the future, our customers generally reduce their capital spending budgets for onshore and offshore drilling, exploration and field development. The recent, precipitous decline in crude oil prices has already resulted in a decrease in the energy industry’s level of capital spending and, if prices continue to decline or remain depressed for a sustained period of time, capital spending and demand for our services may remain similarly depressed. Indications are that certain major oil producing nations do not intend to reduce crude oil output. As a result, the current environment of over-supply may continue for the foreseeable future unless there is a significant increase in worldwide demand, which may not occur. The level of offshore crude oil and natural gas exploration, development and production activity has historically been volatile, and that volatility is likely to continue.
Other factors that influence the level of capital spending by our customers that are beyond our control include: worldwide demand for crude oil and natural gas; the cost of offshore exploration and production of crude oil and natural gas, which can be affected by environmental regulations; significant weather conditions; technological advances that affect energy production and consumption; the local and international economic and political environment; the technological feasibility and relative cost of developing non-hydrocarbon based energy resources; the relative cost of developing offshore and onshore crude oil and natural gas resources; and the availability and cost of financing.
Consolidation of the Company’s Customer Base
Oil and natural gas companies and other energy companies and energy services companies have undergone consolidation, and additional consolidation is possible. Consolidation reduces the number of customers for the company’s equipment, and may negatively affect exploration, development and production activity as consolidated companies focus, at least initially, on increasing efficiency and reducing costs and delay or abandon exploration activity with less promise. Such activity could adversely affect demand for the company’s offshore services.
High Level of Competition in the Offshore Marine Service Industry
We operate in a highly competitive industry, which could depress charter and utilization rates and adversely affect our financial performance. We compete for business with our competitors on the basis of price; reputation for quality service; quality, suitability and technical capabilities of our vessels and ROVs; availability of vessels and ROVs; safety and efficiency; cost of mobilizing vessels and ROVs from one market to a different market; and national flag preference. In addition, competition in international markets may be adversely affected by regulations requiring, among other things, local construction, flagging, ownership or control of vessels, the awarding of contracts to local contractors, the employment of local citizens and/or the purchase of supplies from local vendors.
Loss of a Major Customer
We derive a significant amount of revenue from a relatively small number of customers. For the fiscal years ended March 31, 2015, 2014 and 2013, the five largest customers accounted for approximately 45%, 45%, and 42%, respectively, of the company’s total revenues, while the 10 largest customers accounted for approximately 62%, 62%, and 57%, respectively, of our total revenues. While it is normal for our customer base to change over time as our time charter contracts expire and are replaced, our results of operations, financial condition and cash flows could be materially adversely affected if one or more of these customers were to decide to interrupt or curtail their activities, in general, or their activities with us; terminate their contracts with us; fail to renew existing contracts; and/or refuse to award new contracts.
Unconventional Crude Oil and Unconventional Natural Gas Production Can Exert Downward Pricing Pressures on the Price of Crude Oil and Natural Gas
The rise in production of unconventional crude oil and gas resources in North America and the commissioning of a number of new large Liquefied Natural Gas (LNG) export facilities around the world are, at least to date, primarily contributing to an over-supplied natural gas market. While production of crude oil and natural gas from unconventional sources is still a relatively small portion of the worldwide crude oil and natural gas production, production from unconventional resources is increasing because improved drilling efficiencies are lowering the costs of extraction. There is an oversupply of natural gas inventories in the United States in part due to the increased development of unconventional crude oil and natural gas resources. Prolonged increases in the
20
Table of Contents
Index to Financial Statements
worldwide supply of crude oil and natural gas, whether from conventional or unconventional sources, will likely continue to weigh crude oil and natural gas prices. A prolonged period of low natural gas prices would likely have a negative impact on development plans of exploration and production companies), which in turn, may result in a decrease in demand for offshore support vessel services.
Challenging Macroeconomic Conditions
Uncertainty about future global economic market conditions makes it challenging to forecast operating results and to make decisions about future investments. The success of our business is both directly and indirectly dependent upon conditions in the global financial and credit markets that are outside of our control and difficult to predict. Uncertain economic conditions may lead our customers to postpone capital spending in response to tighter credit and reductions in our customers’ income or asset values. Similarly, when lenders and institutional investors reduce, and in some cases, cease to provide funding to corporate and other industrial borrowers, the liquidity and financial condition of our customers can be adversely impacted. These factors may also adversely affect our liquidity and financial condition. Factors such as interest rates, availability of credit, inflation rates, economic uncertainty, changes in laws (including laws relating to taxation), trade barriers, commodity prices, currency exchange rates and controls, and national and international political circumstances (including wars, terrorist acts, security operations, and seaborne refugee issues) can have a material negative effect on our business, revenues and profitability.
Prolonged material downturns in crude oil and natural gas prices can negatively affect the development plans of exploration and production companies. In addition, a prolonged recession may result in a decrease in demand for offshore support vessel services and a reduction in charter rates and/or utilization rates, which would have a material adverse effect on the company’s results of operations, cash flows and financial condition.
Potential Overcapacity in the Offshore Marine Industry
Over the past decade, as offshore exploration and production activities increasingly focused on deepwater exploration, field development and production, offshore service companies, such as ours, constructed specialized offshore vessels that are capable of supporting complex deepwater and deep well (defined by well depth rather than water depth) projects that are generally located in challenging environments. During this time, construction of offshore vessels increased significantly in order to meet projected requirements of customers and potential customers. Excess offshore support vessel capacity usually exerts downward pressure on charter day rates. Excess capacity can occur when newly constructed vessels enter the worldwide offshore support vessel market and also when vessels migrate between markets. The company has also sold and/or scrapped a significant number of vessels over the last several years. A discussion about the aging of the company’s fleet, which has necessitated the company’s new vessel construction programs, appears in the “Vessel Count, Dispositions, Acquisitions and Construction Programs” section of Item 7 in this Annual Report on Form 10-K.
The offshore support vessel market has approximately 540 new-build offshore support vessels (deepwater PSVs, deepwater AHTS vessels and towing-supply vessels only) either under construction (420 vessels), on order or planned as of April 2015, which are expected to be delivered to the worldwide offshore support vessel market primarily over the next two years, according to IHS-Petrodata. The current worldwide fleet of these classes of vessels is estimated at approximately 3,270 vessels, according to the same source. An increase in vessel capacity without a corresponding increase in the working offshore rig count could exacerbate the industry’s currently oversupplied condition which may have the effect of lowering charter rates and utilization rates, which, in turn, would result in lower revenues to the company.
In addition, the provisions U.S. shipping laws restricting engagement of U.S. coastwise trade to vessels controlled by U.S. citizens may from time to time be circumvented by foreign competitors that seek to engage in trade reserved for vessels controlled by U.S. citizens and otherwise qualifying for coastwise trade. A repeal, suspension or significant modification of U.S. shipping laws, or the administrative erosion of their benefits, permitting vessels that are either foreign-flagged, foreign-built, foreign-owned, foreign-controlled or foreign-operated to engage in the U.S. coastwise trade, could also result in excess vessel capacity and increased competition, especially for our vessels that operate in North America.
21
Table of Contents
Index to Financial Statements
Vessel Construction and Maintenance
The company has a number of vessels currently under construction, and it may construct additional vessels in response to future market conditions. In addition, the company routinely engages shipyards to drydock vessels for regulatory compliance and to provide repair and maintenance services. Construction projects and drydockings are subject to risks of delays and cost overruns, resulting from shortages and/or delivery delays in regards to equipment, materials and skilled labor, including third-party service technicians. In addition, the cost, timing and duration of drydockings and repairs and maintenance can be negatively impacted by lack of shipyard availability, unforeseen design and engineering problems, work stoppages, weather, financial, labor and other difficulties at shipyards, including the inability to obtain necessary certifications and approvals.
A significant delay in either construction or drydockings of vessels could negatively impact our ability to fulfill contractual commitments. Significant cost overruns or delays for vessels under construction could also adversely affect the company’s financial condition, results of operations or cash flows. The demand for vessels currently under construction may also diminish from levels originally anticipated. If the company fails to obtain favorable contracts for newly constructed vessels, such failure could have a negative impact on the company’s revenues and profitability.
Difficult economic market conditions and/or prolonged distress in credit and capital markets may also hamper the ability of shipyards to meet their scheduled deliveries of new vessels or the ability of the company to renew its fleet through new vessel construction or acquisitions. In addition, while we seek some form of security to safeguard progress payments made to shipbuilders, there is a risk of insolvency of the shipyards that construct, repair or drydock our vessels, which could adversely affect our new construction or repair programs, and consequently, could adversely affect our financial condition, results of operations or cash flows.
Operating Internationally
We operate in various regions throughout the world and are exposed to many risks inherent in doing business in countries other than the United States, some of which risks have recently become more pronounced. Our customary risks of operating internationally include political and economic instability within the host country; possible vessel seizures or nationalization of assets and other governmental actions by the host country (please refer to Item 7 in this Annual Report on Form 10-K and Note (12) of Notes to Consolidated Financial Statements included in Item 8 of this Annual Report on Form 10-K for a discussion of our Venezuelan operations regarding vessel seizures and Item 1 and Note (12) of Notes to Consolidated Financial Statements included in Item 8 in this Annual Report on Form 10-K for a discussion of our Sonatide joint venture in Angola), including enforcement of customs, immigration or other laws that are not well developed or consistently enforced; foreign government regulations that favor or require the awarding of contracts to local competitors; an inability to recruit, retain or obtain work visas for managers of international operations; difficulties or delays in collecting customer and other accounts receivable; changing taxation policies; fluctuations in currency exchange rates; foreign currency revaluations and devaluations; restrictions on converting foreign currencies into U.S. dollars; expatriating customer and other payments made in jurisdictions outside of the United States; and import/export quotas and restrictions or other trade barriers, most of which are beyond the control of the company.
The company is also subject to acts of piracy and kidnappings that put its assets and personnel at risk. The increase in the level of these criminal or terrorist acts over the last several years has been well-publicized. As a marine services company that operates in offshore, coastal or tidal waters in challenging areas, the company is particularly vulnerable to these kinds of unlawful activities. Although the company takes what it considers to be prudent measures to protect its personnel and assets in markets that present these risks, it has confronted these kinds of incidents in the past, and there can be no assurance it will not be subjected to them in the future.
The continued threat of terrorist activity, other acts of war or hostility and civil unrest have significantly increased the risk of political, economic and social instability in some of the geographic areas in which the company operates. It is possible that further acts of terrorism or civil unrest may be directed against the United States domestically or abroad, and such acts of terrorism or civil unrest could be directed against properties and personnel of U.S. headquartered companies such as ours. To date, the company has not experienced any material adverse effects on its results of operations and financial condition as a result of terrorism, political instability, civil unrest or war.
22
Table of Contents
Index to Financial Statements
Risks Inherent in Acquiring Businesses
Acquisitions have been and we believe will continue to be, an element of our business strategy. We cannot assure that we will be able to identify and acquire acceptable acquisition candidates on terms favorable to us in the future. We may be required to incur substantial indebtedness or issue equity to finance future acquisitions. Such additional debt service requirements may impose a significant burden on our results of operations and financial condition, and any equity issuance could have a dilutive impact on our stockholders. We cannot be certain that we will be able to successfully consolidate the operations and assets of any acquired business with our own business. Acquisitions may not perform as expected when the transaction was consummated and may be dilutive to our overall operating results. In addition, our management may not be able to effectively manage a substantially larger business or successfully operate a new line of business.
Entry into New Lines of Business
Historically, the company’s operations and acquisitions focused primarily on offshore marine vessel services for the oil and gas industry. We have recently expanded our capability to provide subsea services through the acquisition of employees with specialized subsea skills and ROVs. The company may expand its subsea capabilities further and enter into additional lines of business. Entry into, or further development of, lines of business in which the company has not historically operated may expose us to business and operational risks that are different from those we have experienced historically. Our management may not be able to effectively manage these additional risks or implement successful business strategies in new lines of business. Additionally, our competitors in these lines of business may possess substantially greater operational knowledge, resources and experience than the company.
Doing Business through Joint Venture Operations
The company operates in several foreign areas through a joint venture with a local company, in some cases as a result of local laws requiring local company ownership. While the joint venture partner may provide local knowledge and experience, entering into joint ventures often requires us to surrender a measure of control over the assets and operations devoted to the joint venture, and occasions may arise when we do not agree with the business goals and objectives of our partner, or other factors may arise that make the continuation of the relationship unwise or untenable. Any such disagreements or discontinuation of the relationship could disrupt our operations, put assets dedicated to the joint venture at risk, or affect the continuity of our business. If we are unable to resolve issues with a joint venture partner, we may decide to terminate the joint venture and either locate a different partner and continue to work in the area or seek opportunities for our assets in another market. The unwinding of an existing joint venture could prove to be difficult or time-consuming, and the loss of revenue related to the termination or unwinding of a joint venture and costs related to the sourcing of a new partner or the mobilization of assets to another market could adversely affect our financial condition, results of operations or cash flows. Please refer to Part 1, Item 1 and Part 1, Item 3 in this Annual Report on Form 10-K for additional discussion of our Sonatide joint venture in Angola and our joint venture in Nigeria, respectively.
International Operations Exposed to Currency Devaluation and Fluctuation Risk
Since we are a global company, our international operations are exposed to foreign currency exchange rate risks on all charter hire contracts denominated in foreign currencies. For some of our international contracts, a portion of the revenue and local expenses is incurred in local currencies and the company is at risk of changes in the exchange rates between the U.S. dollar and foreign currencies. In some instances, we receive payments in currencies which are not easily traded and may be illiquid. We generally do not hedge against any foreign currency rate fluctuations associated with foreign currency contracts that arise in the normal course of business, which exposes us to the risk of exchange rate losses. Gains and losses from the revaluation of our monetary assets and liabilities denominated in currencies other than the U.S. dollar are included in our consolidated statements of operations. Foreign currency fluctuations may cause the U.S. dollar value of our non-U.S. results of operations and net assets to vary with exchange rate fluctuations. This could have a negative impact on our results of operations and financial position. In addition, fluctuations in currencies relative to currencies in which the earnings are generated may make it more difficult to perform period-to-period comparisons of our reported results of operations.
23
Table of Contents
Index to Financial Statements
To minimize the financial impact of these items, we attempt to contract a significant majority of our services in U.S. dollars and, when feasible, the company attempts to not maintain large, non-U.S. dollar-denominated cash balances. In addition, the company attempts to minimize the financial impact of these risks by matching the currency of the company’s operating costs with the currency of revenue streams when considered appropriate. We monitor the currency exchange risks associated with all contracts not denominated in U.S. dollars. As of March 31, 2015, Sonatide maintained the equivalent of approximately $150 million of Angola kwanza-denominated deposits in Angolan banks, largely related to customer receipts that had not yet been converted to U.S. dollars, expatriated and then remitted to the company. Any devaluation in the Angolan kwanza relative to the U.S. dollar will result in foreign exchange losses for Sonatide, a portion of which will be borne by the company as a 49% owner of Sonatide.
Operational Hazards Inherent to the Offshore Marine Vessel Industry
The operation of any offshore marine asset involves inherent risks that could adversely affect our financial performance if we are not adequately insured or indemnified. Our operations are also subject to various operating hazards and risks, including risk of catastrophic marine disaster; adverse sea and weather conditions; mechanical failure; navigation and operational errors; collisions and property losses to our marine assets; damage to and loss of drilling rigs and production facilities owned by others; war, sabotage, piracy and terrorism risks; and business interruption due to political action or inaction, including nationalization of assets by foreign governments.
These risks present a threat to the safety of our personnel and assets, cargo, equipment under tow and other property, as well as the environment. Any such event may result in a reduction in our revenues, increased costs, property damage, and additionally, third parties may have significant claims against us for damages due to personal injury, death, property damage, pollution and loss of business. We carry what we consider to be prudent levels of liability insurance, and our vessels and ROVs are generally insured for their estimated market value against damage or loss, including war, terrorism acts, and pollution risks, but the company does not directly or fully insure for business interruption. Our insurance coverages are subject to deductibles and certain exclusions. Further, we can provide no assurance that our insurance coverages will be available beyond current contractual terms, that we will be able to obtain insurance for all operational risks and that our insurance policies will be adequate to cover future claims that may arise.
Our offshore oilfield operations involve a variety of operating hazards and risks that could cause losses.
The company’s operations are subject to the hazards inherent in the offshore oilfield business. These include blowouts, explosions, fires, collisions, capsizings, sinkings, groundings and severe weather conditions. These hazards could result in personal injury and loss of life, severe damage to or destruction of property and equipment (including to the property and equipment of third parties), pollution or environmental damage and suspension of operations. Damages arising from such occurrences may result in lawsuits alleging large claims, and the company may incur substantial liabilities or losses as a result of these hazards.
Our exposure to operating hazards may increase significantly with the expansion of its subsea operations, including through the ownership and operation of ROVs. For example, the company may lose equipment, including ROVs, in the course of our subsea operations. This equipment may be difficult or costly to replace, and such losses may result in work stoppages or the loss of customers. Additionally, many of our subsea operations will be performed on or near existing oil and gas infrastructure. These operations may expose us to new or increased liability relating to explosions, blowouts and cratering; mechanical problems, including pipe failure; and environmental accidents, including oil spills, gas leaks or ruptures, uncontrollable flows of oil, gas, brine or well fluids, or other discharges of toxic gases or other pollutants.
While we maintain insurance protection against some of these risks, and seeks to obtain indemnity agreements from our customers requiring the customers to hold the company harmless from some of these risks, the company’s insurance and contractual indemnity protection may not be sufficient or effective to protect us under all circumstances or against all risks. The occurrence of a significant event not fully insured or indemnified against or the failure of a customer to meet its indemnification obligations to the company could materially and adversely affect our results of operations and financial condition. Additionally, while we believe that we should
24
Table of Contents
Index to Financial Statements
be able to maintain adequate insurance in the future at rates considered commercially acceptable, we cannot guarantee that such insurance will continue to be available at commercially acceptable rates given the markets in which the company operates.
Compliance with the Foreign Corrupt Practices Act and Similar Worldwide Anti-Bribery Laws
Our global operations require us to comply with a number of U.S. and international laws and regulations, including those involving anti-bribery and anti-corruption. As a U.S. corporation, we are subject to the regulations imposed by the Foreign Corrupt Practices Act (FCPA), which generally prohibits U.S. companies and their intermediaries from making improper payments to foreign officials for the purpose of obtaining or keeping business or obtaining an improper business benefit. We have adopted proactive procedures to promote compliance with the FCPA, but we may be held liable for actions taken by local partners or agents even though these partners or agents may themselves not be subject to the FCPA. Any determination that we have violated the FCPA (or any other applicable anti-bribery laws in countries in which the company does business) could have a material adverse effect on our business and business reputation, as well as our results of operations, and cash flows.
Compliance with Complex and Developing Laws and Regulations
Our operations are subject to many complex and burdensome laws and regulations. Stringent federal, state, local and foreign laws and regulations governing worker health and safety and the manning, construction and operation of vessels significantly affect our operations. Many aspects of the marine industry are subject to extensive governmental regulation by the United States Coast Guard and the United States Customs and Border Protection and their foreign equivalents and to standards imposed by private industry organizations such as the American Bureau of Shipping, the Oil Companies International Marine Forum, and the International Marine Contractors Association.
Our operations are also subject to federal, state, local and international laws and regulations that control the discharge of pollutants into the environment or otherwise relate to environmental protection. Compliance with such laws and regulations may require installation of costly equipment, increased manning or operational changes. Some environmental laws impose strict liability for remediation of spills and releases of oil and hazardous substances, which could subject the company to liability without regard to whether the company was negligent or at fault.
Further, many of the countries in which we operate have laws, regulations and enforcement systems that are largely undeveloped, and the requirements of these systems are not always readily discernible even to experienced and proactive participants. Further, these laws, the application and enforcement of these laws and regulations can be unpredictable and subject to frequent change or reinterpretation, sometimes with retroactive effect, and with associated taxes, fees, fines or penalties sought from the company based on that reinterpretation or retroactive effect. While the company endeavors to comply with applicable laws and regulations, our compliance efforts might not always be wholly successful, and failure to comply may result in administrative and civil penalties, criminal sanctions, imposition of remedial obligations or the suspension or termination of the company’s operations. These laws and regulations may expose the company to liability for the conduct of, or conditions caused by, others, including charterers or third party agents. Moreover, these laws and regulations could be changed or be interpreted in new, unexpected ways that substantially increase costs that the company may not be able to pass along to its customers. Any changes in laws, regulations or standards that would impose additional requirements or restrictions could adversely affect the company’s financial condition, results of operations or cash flows.
In order to meet the continuing challenge of complying with applicable laws and regulations in jurisdictions where it operates, several years ago we revitalized and strengthened our compliance training, making available and using a worldwide compliance reporting system and performing compliance auditing/monitoring. We appointed our general counsel as our chief compliance officer in fiscal 2008 to help organize and lead these compliance efforts. This strengthened compliance program may from time to time identify past practices that need to be changed or remediated. Such corrective or remedial measures could involve significant expenditures or lead to changes in operational practices that could adversely affect the company’s financial condition, results of operations or cash flows.
25
Table of Contents
Index to Financial Statements
Changes in Laws Governing U.S. Taxation of Foreign Source Income
We operate globally through various subsidiaries which are subject to changes in applicable tax laws, treaties or regulations in the jurisdictions in which we conduct our business, including laws or policies directed toward companies organized in jurisdictions with low tax rates. We determine our income tax expense based on our interpretation of the applicable tax laws and regulations in effect in each jurisdiction for the period during which we operate and earn income. A material change in the tax laws, tax treaties, regulations or accounting principles, or interpretation thereof, in one or more countries in which we conduct business, or in which we are incorporated or a resident of, could result in a higher effective tax rate on our worldwide earnings, and such change could be significant to our financial results. In addition, our overall effective tax rate could be adversely and suddenly affected by lower than anticipated earnings in countries with lower statutory rates and higher than anticipated earnings in countries with higher statutory rates, or by changes in the valuation of our deferred tax assets and liabilities.
Approximately 88% of the company’s revenues and a majority of the company’s net income are generated by its operations outside of the United States. The company’s effective tax rate has averaged approximately 20% since fiscal 2006, primarily a result of the passage of The American Jobs Creation Act of 2004, which excluded from the company’s current taxable income in the U.S. income earned offshore through our controlled foreign subsidiaries.
Periodically, tax legislative initiatives are proposed to effectively increase U.S. taxation of income with respect to foreign operations. Whether any such initiatives will win congressional or executive approval and become law is presently unknown; however, if any such initiatives were to become law, and were such law to apply to the company’s international operations, it could result in a materially higher tax expense, which would have a material impact on the company’s financial condition, results of operations or cash flows, and which could cause the company to review the utility of continued U.S. domicile.
In addition, our income tax returns are subject to review and examination by the U.S. Internal Revenue Service and other tax authorities where tax returns are filed. The company routinely evaluates the likelihood of adverse outcomes resulting from these examinations to determine the adequacy of our provision for taxes. We do not recognize the benefit of income tax positions we believe are more likely than not to be disallowed upon challenge by a tax authority. If any tax authority successfully challenges our operational structure or intercompany transfer pricing policies, or if the terms of certain income tax treaties were to be interpreted in a manner that is adverse to our structure, or if we lose a material tax dispute in any country, our effective tax rate on our worldwide earnings could increase, and our financial condition and results of operations could be materially and adversely affected.
Compliance with Environmental Regulations
A variety of regulatory developments, proposals and requirements have been introduced (and in some cases enacted) in the U.S. and various other countries that are focused on restricting the emission of carbon dioxide, methane and other gases. Any such regulations could result in the increased cost of energy as well as environmental and other costs, and capital expenditures could be necessary to comply with the limitations. These developments may curtail production and demand for hydrocarbons such as crude oil and natural gas in areas of the world where our customers operate and thus adversely affect future demand for the company’s offshore support vessels, ROVs and other assets, which are highly dependent on the level of activity in offshore oil and natural gas exploration, development and production markets. Although it is unlikely that demand for oil and gas will lessen dramatically over the short-term, in the long-term, increased regulation of environmental emissions may create greater incentives for use of alternative energy sources. Unless and until regulations are implemented and their effects are known, we cannot reasonably or reliably estimate their impact on our financial condition, results of operations and ability to compete. However, any long term material adverse effect on the crude oil and natural gas industry may adversely affect our financial condition, results of operations and cash flows.
26
Table of Contents
Index to Financial Statements
Retention of a Sufficient Number of Skilled Workers
Our operations require personnel with specialized skills and experience. As a result, our ability to remain productive and profitable will, in part, depend upon our ability to employ and retain skilled workers. In addition, our ability to expand our operations depends in part on our ability to increase the size of our skilled labor force. The demand for skilled workers in our industry is high, and the supply is limited. We could be faced with shortages of experienced personnel as we expand our operations and enter new markets. In developed countries, many senior engineers, managers and other professionals are reaching retirement age, with no assurance that enough highly skilled graduates and younger workers will be available to replace them.
Unionization Efforts and Collective Bargaining Negotiations
Where locally required, the company has union workers, subject to collective bargaining agreements, that are periodically in negotiation. These negotiations could result in higher personnel expenses, other increased costs, or increased operational restrictions. Further, efforts have been made from time to time to unionize other portions of our workforce, including our U.S. GOM employees. We have also been subjected to threatened strikes or work stoppages and other labor disruptions in certain countries. Additional unionization efforts, new collective bargaining agreements or work stoppages could materially increase our costs and operating restrictions, reduce our revenues, or limit our flexibility.
ITEM 1B. UNRESOLVED STAFF COMMENTS
None.
Information on Properties is contained in Item 1 of this Annual Report on Form 10-K.
Arbitral Award for the Taking of the Company’s Venezuelan Operations
On March 13, 2015, the three member tribunal constituted under the rules of the World Bank’s International Centre for the Settlement of Investment Disputes (“ICSID”) has awarded subsidiaries of the company more than $62 million in compensation, including accrued interest and costs, for the Bolivarian Republic of Venezuela’s (“Venezuela”) expropriation of the investments of those subsidiaries in Venezuela. The award, issued in accordance with the provisions of the Venezuela-Barbados Bilateral Investment Treaty (“BIT”), represented $46.4 million for the fair market value of the company’s principal Venezuelan operating subsidiary, plus interest from May 8, 2009 to the date of payment of that amount accruing at an annual rate of 4.5% compounded quarterly ($13.9 million as of March 13, 2015) and $2.5 million for reimbursement of legal and other costs expended by the company in connection with the arbitration.
As previously reported by the company, on February 16, 2010, Tidewater and certain of its subsidiaries (collectively, the “Claimants”) filed with ICSID a Request for Arbitration against Venezuela. In May 2009, Petróleos de Venezuela, S.A. (“PDVSA”), the national oil company of Venezuela, took possession and control of (a) eleven of the Claimants’ vessels that were then supporting PDVSA operations in Lake Maracaibo, (b) the Claimants’ shore-based headquarters adjacent to Lake Maracaibo, (c) the Claimants’ operations in Lake Maracaibo, and (d) certain other related assets. In July 2009, Petrosucre, S.A., a subsidiary of PDVSA, took possession and control of the Claimants’ four vessels, operations, and related assets in the Gulf of Paria. It was Tidewater’s position that, through those measures, Venezuela directly or indirectly expropriated the Claimants’ Venezuela investments, including the capital stock of the Claimants’ principal operating subsidiary in Venezuela. As a result of the seizures, the lack of further operations in Venezuela, and the continuing uncertainty about the timing and amount of the compensation the company might collect in the future, the company recorded a charge during the year ended March 31, 2010 to write off substantially all of the assets associated with the company’s Venezuelan operations.
The Claimants alleged in the Request for Arbitration that the measures taken by Venezuela against the Claimants violated Venezuela’s obligations under the BIT and rules and principles of Venezuelan law and international law. In the first phase of the case, the tribunal addressed Venezuela’s objections to the tribunal’s jurisdiction over the dispute. On February 8, 2013, the tribunal issued its decision on jurisdiction and found that
27
Table of Contents
Index to Financial Statements
it had jurisdiction over the claims under the BIT, including the claim for compensation for the expropriation of Tidewater’s principal operating subsidiary, but that it did not have jurisdiction based on Venezuela’s investment law. The practical effect of the tribunal’s decision was to exclude from the ICSID arbitration proceeding the Claimants’ claims for expropriation of the fifteen vessels described above. While the tribunal determined that it did not have jurisdiction over the claim for the seizure of the fifteen vessels, Tidewater received during fiscal 2011 insurance proceeds for the insured value of those vessels (less an additional premium payment triggered by those proceeds).
The Company will take appropriate steps to enforce and collect the award, which is enforceable in any of the 150 member states that are party to the ICSID Convention. As an initial step, the company was successful in having the award recognized and entered on March 16, 2015 as a final judgment by the United States District Court for the Southern District of New York. The Company notes that Venezuela may seek annulment of the award and other post-award relief under the ICSID Convention and may seek a stay of enforcement of the award while those post-award remedial proceedings are pending. Even in the absence of a stay of enforcement, the company recognizes that collection of the award may present significant practical challenges, particularly in the short term. Because the award has yet to be satisfied and post-award relief may be sought by Venezuela, the net impact of these matters on the company cannot be reasonably estimated at this time and the company has not recognized a gain related to these matters as of March 31, 2015.
Nana Tide Sinking
On December 21, 2012, one of the company’s anchor handling tugs, the NANA TIDE, sunk in shallow waters off the coast of the Democratic Republic of Congo (DRC). The cause of the loss is not certain. The NANA TIDE was raised and recovered in early February 2014. On November 3, 2014, the NANA TIDE departed DRC waters after receiving proper clearances. The NANA TIDE was towed to a scrapping facility in a nearby country and sold for scrap in December 2014.
Beginning in 2013 and through 2014, the company received correspondence from various DRC agencies fining the company or otherwise requesting the company to pay amounts aggregating several million dollars. The company vigorously opposed these fines/requests. Based on more recent DRC agency correspondence, the company believes that those DRC agencies will not seek to collect the majority of those fines or otherwise require the majority of those payments to be made. To the extent any amounts remain at issue with DRC agencies, the company believes they aggregate less than $1 million. Given the changing position of the DRC agencies and the fact that the company is still evaluating the legal basis for any remaining claims, the company has not concluded that any potential liability is both probable and reasonably estimable and thus no accrual been recorded as of March 31, 2015.
Nigeria Marketing Agent Litigation
On March 1, 2013, Tidewater filed suit in the London Commercial Court against Tidewater’s Nigerian marketing agent for breach of the agent’s obligations under contractual agreements between the parties. The alleged breach involves actions of the Nigerian marketing agent to discourage various affiliates of TOTAL S.A. from paying approximately $16 million (including U.S. dollar denominated invoices and Naira denominated invoices which have been adjusted for the devaluation of the Naira relative to the U.S. dollar) due to the company for vessel services performed in Nigeria. Shortly after the London Commercial Court filing, TOTAL commenced interpleader proceedings in Nigeria naming the Nigerian agent and the company as respondents and seeking an order which would allow TOTAL to deposit those monies with a Nigerian court for the respondents to resolve. On April 25, 2013, Tidewater filed motions in the Nigerian Federal High Court to stop the interpleader proceedings in Nigeria or alternatively stay them until the resolution of the suit filed in London. The company will continue to actively pursue the collection of those monies. On April 30, 2013, the Nigerian marketing agent filed a separate suit in the Nigerian Federal High Court naming Tidewater and certain TOTAL affiliates as defendants. The suit seeks various declarations and orders, including a claim for the monies that are subject to the above interpleader proceedings, and other relief. The company is seeking dismissal of this suit and otherwise intends to vigorously defend against the claims made. The company has not reserved for this receivable and believes that the ultimate resolution of this matter will not have a material effect on the consolidated financial statements. On or about December 30, 2014, the company received notice that the
28
Table of Contents
Index to Financial Statements
Nigerian marketing agent had filed an action in the Nigerian Federal High court seeking to prevent the continuation of the proceedings initiated by Tidewater in the London Commercial Court. The company intends to vigorously defend that action.
In October, 2012, Tidewater had notified the Nigerian marketing agent that it was discontinuing its relationship with the Nigerian marketing agent. The company has entered into a new strategic relationship with a different Nigerian counterparty that it believes will better serve the company’s long term interests in Nigeria. This new strategic relationship is currently functioning as the company intended.
Other Items
Various legal proceedings and claims are outstanding which arose in the ordinary course of business. In the opinion of management, the amount of ultimate liability, if any, with respect to these actions, will not have a material adverse effect on the company’s financial position, results of operations, or cash flows. Information related to various commitments and contingencies, including legal proceedings, is disclosed in Note (12) of Notes to Consolidated Financial Statements included in Item 8 of this Annual Report on Form 10-K.
ITEM 4. MINE SAFETY DISCLOSURES
None
29
Table of Contents
Index to Financial Statements
ITEM 5. MARKET FOR THE REGISTRANT’S COMMON EQUITY, RELATED STOCKHOLDER MATTERS, AND ISSUER PURCHASES OF EQUITY SECURITIES
Common Stock Market Prices
The company’s common stock is traded on the New York Stock Exchange under the symbol “TDW.” At March 31, 2015, there were 681 record holders of the company’s common stock, based on the record holder list maintained by the company’s stock transfer agent. The closing price on the New York Stock Exchange Composite Tape on March 31, 2015 (last business day of the month) was $19.14. The following table sets forth for the periods indicated the high and low sales price of the company’s common stock as reported on the New York Stock Exchange Composite Tape and the amount of cash dividends per share declared on Tidewater common stock.
| Quarter ended | June 30 | September 30 | December 31 | March 31 | ||||||||||||||
| Fiscal 2015 common stock prices: |
||||||||||||||||||
| High |
$ 56.95 | $ 56.46 | $ 40.05 | $ 33.82 | ||||||||||||||
| Low |
47.41 | 38.96 | 28.40 | 18.85 | ||||||||||||||
| Dividend |
.25 | .25 | .25 | .25 | ||||||||||||||
| Fiscal 2014 common stock prices: |
||||||||||||||||||
| High |
$ 61.57 | $ 62.25 | $ 63.20 | $ 60.46 | ||||||||||||||
| Low |
46.90 | 53.11 | 54.34 | 45.51 | ||||||||||||||
| Dividend |
.25 | .25 | .25 | .25 | ||||||||||||||
|
| ||||||||||||||||||
Issuer Repurchases of Equity Securities
In May 2015, the company’s Board of Directors authorized an extension of its current common stock repurchase program from its original expiration date of June 30, 2015 to June 30, 2016. If shares are purchased in open market or privately-negotiated transactions pursuant to this share repurchase program, the Company will use its available cash and/or borrowings under its revolving credit facility or other borrowings to fund any share repurchases. As of March 31, 2015, the Company had $100 million remaining authorized under this repurchase program available to repurchase shares. The company evaluates share repurchase opportunities relative to other investment opportunities and in the context of current conditions in the credit and capital markets.
In May 2014, the company’s Board of Directors authorized the company to spend up to $200 million to repurchase shares of its common stock in open-market or privately-negotiated transactions. The effective period for this authorization is July 1, 2014 through June 30, 2015. At March 31, 2015, $100 million remains available to repurchase shares under the May 2014 share repurchase program.
In May 2013, the company’s Board of Directors authorized the company to spend up to $200 million to repurchase shares of its common stock in open-market or privately-negotiated transactions. The effective period for this authorization is July 1, 2013 through June 30, 2014. No shares were repurchased under the May 2013 program.
The value of common stock repurchased, along with number of shares repurchased, and average price paid per share for the years ended March 31, are as follows:
| (In thousands, except share and per share data) | 2015 | 2014 | 2013 | |||||||||||
| Aggregate cost of common stock repurchased |
$ | 99,999 | — | 85,034 | ||||||||||
| Shares of common stock repurchased |
2,841,976 | — | 1,856,900 | |||||||||||
| Average price paid per common share |
$ | 35.19 | — | 45.79 | ||||||||||
30
Table of Contents
Index to Financial Statements
Dividend Program
The declaration of dividends is at the discretion of the company’s Board of Directors. The Board of Directors declared the following dividends for each of the last three years ended March 31, as follows:
| (In thousands, except per share data) | 2015 | 2014 | 2013 | |||||||||||
| Dividends declared |
$ | 49,127 | 49,973 | 49,766 | ||||||||||
| Dividend per share |
1.00 | 1.00 | 1.00 | |||||||||||
Performance Graph
The following graph compares the cumulative total stockholder return on the company’s common stock against the cumulative total return of the Standard & Poor’s 500 Stock Index and the cumulative total return of the Value Line Oilfield Services Group Index (the “Peer Group”) over the last five fiscal years. The analysis assumes the investment of $100 on April 1, 2010, at closing prices on March 31, 2010, and the reinvestment of dividends into additional shares of the same class of equity securities at the frequency with which dividends are paid on such securities during the applicable fiscal year. The Value Line Oilfield Services Group consists of 26 companies including Tidewater Inc.
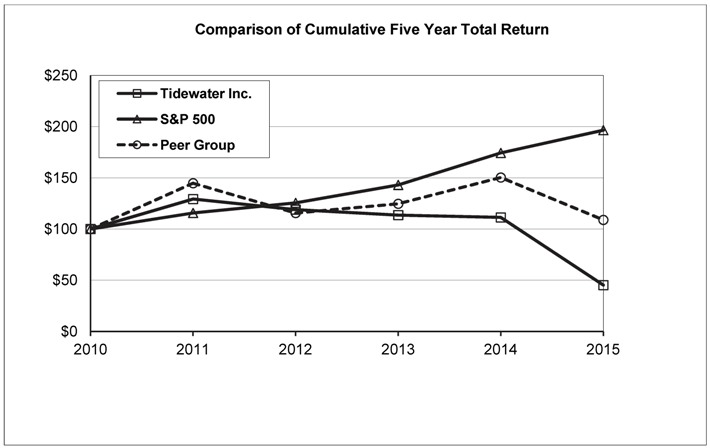
| Indexed returns Years ended March 31 |
||||||||||||||||||||||||||
| Company name/Index | 2010 | 2011 | 2012 | 2013 | 2014 | 2015 | ||||||||||||||||||||
| Tidewater Inc. |
100 | 129.27 | 118.92 | 113.54 | 111.31 | 45.22 | ||||||||||||||||||||
| S&P 500 |
100 | 115.65 | 125.52 | 143.05 | 174.31 | 196.51 | ||||||||||||||||||||
| Peer Group |
100 | 144.71 | 115.60 | 124.60 | 150.28 | 108.87 | ||||||||||||||||||||
Investors are cautioned against drawing conclusions from the data contained in the graph, as past results are not necessarily indicative of future performance.
The above graph is being furnished pursuant to the Securities and Exchange Commission rules. It will not be incorporated by reference into any filing under the Securities Act of 1933 or the Securities Exchange Act of 1934, except to the extent that the company specifically incorporates it by reference.
31
Table of Contents
Index to Financial Statements
ITEM 6. SELECTED FINANCIAL DATA
The following table sets forth a summary of selected financial data for each of the last five fiscal years. This information should be read in conjunction with “Management’s Discussion and Analysis of Financial Condition and Results of Operations” in Item 7 and the Consolidated Financial Statements of the company included in Item 8 of this Annual Report on Form 10-K.
| Years Ended March 31 (In thousands, except ratio and per share amounts) |
||||||||||||||||||||||
| 2015 (A) | 2014 (B) | 2013 (D) | 2012 | 2011 (E) | ||||||||||||||||||
| Statement of Earnings Data : |
||||||||||||||||||||||
| Revenues: |
||||||||||||||||||||||
| Vessel revenues |
$ | 1,468,358 | 1,418,461 | 1,229,998 | 1,060,468 | 1,051,213 | ||||||||||||||||
| Other operating revenues |
27,159 | 16,642 | 14,167 | 6,539 | 4,175 | |||||||||||||||||
| $ | 1,495,517 | 1,435,103 | 1,244,165 | 1,067,007 | 1,055,388 | |||||||||||||||||
|
| ||||||||||||||||||||||
| Gain on asset dispositions, net |
$ | 9,271 | 11,722 | 6,609 | 17,657 | 13,228 | ||||||||||||||||
|
| ||||||||||||||||||||||
| Goodwill Impairment (C) |
$ | 283,699 | 56,283 | — | 30,932 | — | ||||||||||||||||
|
| ||||||||||||||||||||||
| Loss on early extinguishment of debt |
$ | — | 4,144 | — | — | — | ||||||||||||||||
|
| ||||||||||||||||||||||
| Restructuring charge |
$ | 4,052 | — | — | — | — | ||||||||||||||||
|
| ||||||||||||||||||||||
| Operating income (loss) |
$ | (37,181 | ) | 201,541 | 206,232 | 113,554 | 139,336 | |||||||||||||||
|
| ||||||||||||||||||||||
| Net earnings (loss) |
$ | (65,190 | ) | 140,255 | 150,750 | 87,411 | 105,616 | |||||||||||||||
|
| ||||||||||||||||||||||
| Basic earnings per common share |
$ | (1.34 | ) | 2.84 | 3.04 | 1.71 | 2.06 | |||||||||||||||
|
| ||||||||||||||||||||||
| Diluted earnings per common share |
$ | (1.34 | ) | 2.82 | 3.03 | 1.70 | 2.05 | |||||||||||||||
|
| ||||||||||||||||||||||
| Cash dividends declared per common share |
$ | 1.00 | 1.00 | 1.00 | 1.00 | 1.00 | ||||||||||||||||
|
| ||||||||||||||||||||||
| Balance Sheet Data (at end of period): |
||||||||||||||||||||||
| Cash and cash equivalents |
$ | 78,568 | 60,359 | 40,569 | 320,710 | 245,720 | ||||||||||||||||
|
| ||||||||||||||||||||||
| Total assets |
$ | 4,756,162 | 4,885,829 | 4,168,055 | 4,061,618 | 3,748,116 | ||||||||||||||||
|
| ||||||||||||||||||||||
| Current maturities of long-term debt |
$ | 10,181 | 9,512 | — | — | — | ||||||||||||||||
|
| ||||||||||||||||||||||
| Long-term debt |
$ | 1,524,295 | 1,505,358 | 1,000,000 | 950,000 | 700,000 | ||||||||||||||||
|
| ||||||||||||||||||||||
| Total stockholders’ equity |
$ | 2,474,488 | 2,679,384 | 2,561,756 | 2,526,357 | 2,513,944 | ||||||||||||||||
|
| ||||||||||||||||||||||
| Working capital (F) |
$ | 386,581 | 418,528 | 241,461 | 455,171 | 395,558 | ||||||||||||||||
|
| ||||||||||||||||||||||
| Current ratio (F) |
1.80 | 2.04 | 1.91 | 2.91 | 3.15 | |||||||||||||||||
|
| ||||||||||||||||||||||
| Cash Flow Data: |
||||||||||||||||||||||
| Net cash provided by operating activities |
$ | 358,713 | 104,617 | 213,923 | 222,421 | 264,206 | ||||||||||||||||
|
| ||||||||||||||||||||||
| Net cash used in investing activities |
$ | (231,418 | ) | (403,685 | ) | (413,487 | ) | (315,081 | ) | (569,943 | ) | |||||||||||
|
| ||||||||||||||||||||||
| Net cash (used in) provided by financing activities |
$ | (109,086 | ) | 318,858 | (80,577 | ) | 167,650 | 328,387 | ||||||||||||||
|
| ||||||||||||||||||||||
| (A) | During fiscal 2015, the company recorded a $23.8 million ($23.8 million after-tax, or $0.51 per common share) non-cash adjustment related to the valuation of deferred tax assets. |
| (B) | During fiscal 2014, the company incurred transaction costs of $3.7 million ($2.4 million after tax, or $0.05 per common share) related to the purchase of Troms Offshore and a loss on early extinguishment of debt that was issued by Troms Offshore and retired by the company of $4.1 million, ($3 million after tax, or $0.06 per common share). |
| (C) | During fiscal 2015, 2014 and 2012, the company recorded a $283.7 million ($214.9 million after-tax, or $4.43 per share), a $56.3 million ($43.4 million after-tax, or $0.87 per share) and a $30.9 million ($22.1 million after-tax, or $0.43 per share) non-cash goodwill impairment charge respectively, as disclosed in Note 16 of Notes to Consolidated Financial Statements included in Item 8 of this Annual Report on Form 10-K. |
| (D) | During fiscal 2013, the company recorded a settlement charge of $5.2 million ($3.4 million after tax, or $0.07 per commons share) related to the payment of retirement benefits to a former Chief Executive Officer. |
| (E) | Fiscal 2011 net earnings includes a $4.4 million, or $0.08 per common share, final settlement with the DOJ and a $6.3 million, or $0.12 per common share, settlement with the Federal Government of Nigeria related to the internal investigation as disclosed in Note (12) of Notes to Consolidated Financial Statements included in Item 8 of this Annual Report on Form 10-K. |
| (F) | Working capital and current ratio includes amounts due to and from affiliates, as disclosed in Note (12) of Notes to Consolidated Financial Statements included in Item 8 of this Annual Report on Form 10-K. |
32
Table of Contents
Index to Financial Statements
ITEM 7. MANAGEMENT’S DISCUSSION AND ANALYSIS OF FINANCIAL CONDITION AND RESULTS OF OPERATIONS
The following discussion and analysis of financial condition and results of operations should be read in conjunction with the accompanying consolidated financial statements as of March 31, 2015 and 2014 and for the years ended March 31, 2015, 2014 and 2013 that we included in Item 8 of this Annual Report on Form 10-K. The following discussion and analysis contains forward-looking statements that involve risks and uncertainties. The company’s future results of operations could differ materially from its historical results or those anticipated in its forward-looking statements as a result of certain factors, including those set forth under “Risk Factors” in Item 1A and elsewhere in this Annual Report on Form 10-K. With respect to this section, the cautionary language applicable to such forward-looking statements described under “Forward-Looking Statements” found before Item 1 of this Annual Report on Form 10-K is incorporated by reference into this Item 7.
Fiscal 2015 Business Highlights and Key Focus
During fiscal 2015 the company continued to focus on enhancing its competitive advantages and its market share in U.S. and international markets and continued to modernize its vessel fleet to increase future earnings capacity while removing from active service certain older vessels that had more limited market opportunities. Key elements of the company’s strategy continue to be the preservation of its strong financial position and the maintenance of adequate liquidity to fund the possible expansion of its fleet of newer vessels and the development of the company’s subsea business, and to withstand the depressed business environment resulting from the precipitous drop in oil prices and E&P spending. Operating management focused on safe operations, minimizing unscheduled vessel downtime, improving the oversight over major repairs and maintenance projects and drydockings, maintaining disciplined cost control and identifying potential cost savings that could be realized in the context of lower crude oil prices and reduced spending plans of E&P companies.
The company’s strategy includes the continuing assessment of opportunities to acquire vessels and/or companies that own and operate offshore support vessels as well as organic growth through the construction of vessels at a variety of shipyards worldwide. The company has the largest number of new offshore support vessels (PSVs and AHTS vessels only), including deepwater PSVs and AHTS vessels and towing-supply vessels, among its competitors in the industry.
While the company only committed to the construction or purchase of three deepwater PSVs in early fiscal 2015, we continued to execute our vessel construction program that had begun in calendar year 2000, most notably through the delivery of nine new vessels during fiscal 2015. More broadly, the company’s vessel construction and acquisition program has facilitated the company’s entrance into deepwater markets around the world and allowed the company to begin to replace its non-deepwater towing-supply fleet with fewer, larger, and more technologically sophisticated vessels. The vessel construction and acquisition program was initiated with the intent of strengthening the company’s presence in all major oil and gas producing regions of the world and of meeting deepwater and non-deepwater offshore support vessel requirements of the company’s key customers. In addition to the construction and acquisition of vessels, the company acquired two ultra-deepwater remotely operated vehicles (ROV) during the fourth quarter of fiscal 2015 in order to further enhance the range of offshore services provided to customers.
In recent years, the company has generally funded vessel additions with operating cash flow, together with asset sale proceeds, funds provided by the various private placements of unsecured notes, borrowings under its credit facilities and various leasing arrangements.
The company intends to continue to pursue its fleet modernization strategy on a disciplined basis and, in each case, will carefully consider whether proposed investment opportunities have the appropriate risk/return-on- investment profile.
At March 31, 2015, the company had commitments to build 24 vessels at a number of different shipyards around the world at a total cost, including contract costs and other incidental costs, of approximately $690.7 million. At March 31, 2015, the company had invested approximately $310.6 million in progress
33
Table of Contents
Index to Financial Statements
payments towards the construction of these 24 vessels. At March 31, 2015, the remaining expenditures necessary to complete construction of the 24 vessels currently under construction (based on contract prices) was $380.1 million.
In April 2015, the company notified an international shipyard that it was terminating three towing-supply vessel contracts, as a result of late delivery and requested the return of approximately $36 million in aggregate installment payments together with interest on these installments. There was approximately $13 million in remaining expenditures to be made on these three vessels at the time of the termination. In May 2015, the company and another international shipyard that is constructing two of the 275-foot deepwater PSVs came to an agreement that provides the company an option to take delivery of one or both vessels at any time prior to June 30, 2016 or receive the return of installments aggregating $5.7 million per vessel at the end of this period. There were approximately $41 million of remaining costs to be incurred on these two vessels at the time of the agreement. Additionally, a partially constructed fast supply boat under construction in Brazil is experiencing substantial delay. This fast supply boat was originally scheduled to be delivered in September of 2009. Further discussions of these matters are disclosed in the “Vessel Count, Dispositions, Acquisitions and Construction Programs” section of Item 7 and Note (12) of Notes to Consolidated Financial Statements included in Item 8 of this Annual Report on Form 10-K.
A full discussion of the company’s capital commitments, scheduled delivery dates and vessel sales is disclosed in the “Vessel Count, Dispositions, Acquisitions and Construction Programs” section of Item 7 and Note (12) of Notes to Consolidated Financial Statements included in Item 8 of this Annual Report on Form 10-K.
The company’s outstanding receivable from Sonatide for work in Angola stabilized in fiscal 2015 and was approximately $420 million at March 31, 2015. The company’s outstanding payable to Sonatide (including commissions payable) was approximately $186 million at March 31, 2015. The company’s outstanding receivable from Sonatide and outstanding payable to Sonatide (including commissions payable) at March 31, 2014 was approximately $430 million and approximately $86 million, respectively. The company has funded net working capital related to Sonatide with debt.
The company has had some success in obtaining contracts that allow for a portion of services to be paid in dollars and has initiated some conversion of kwanzas into dollars. For additional disclosure regarding the Sonatide Joint Venture, refer to Part 1, Item 1, of this Annual Report on Form 10-K. Excluding the goodwill impairment charges taken in fiscal 2015 and fiscal 2014 (net of associated tax benefits), net earnings decreased approximately 19%, or approximately $34 million, during fiscal 2015.
Despite the industry downturn which occurred over the latter half of fiscal 2015, the company’s revenue during fiscal 2015 increased $60.4 million, or 4%, over the revenues earned during fiscal 2014, even in a more challenged business environment, primarily driven by the overall increases in utilization and average day rates experienced in fiscal 2015 due to the increased number of newer and more sophisticated vessels in the company’s fleet. The company’s consolidated net earnings decreased 130%, or $181.6 million during fiscal 2015, as fiscal 2015 net earnings reflect, in part, a $283.7 million non-cash goodwill impairment charge ($214.9 million after-tax, or $4.43 per share) recorded during the third quarter of fiscal 2015 related to the company’s remaining goodwill as disclosed in Note (16) of Notes to Consolidated Financial Statements included in Item 8 of this Annual Report on Form 10-K
The increases in revenues were accompanied by increases in vessel operating costs which increased 5%, or $38.5 million, during fiscal 2015 as compared to fiscal 2014. Crew costs increased approximately 8%, or $31.8 million, during fiscal 2015 as compared to fiscal 2014, primarily because the average size of the vessels that the company operated increased during fiscal 2015 (due to the delivery or acquisition of newer, larger vessels and the disposition of older, smaller vessels) and because of the overall higher cost of personnel necessary to operate the company’s vessels. Supplies and fuel cost increased 15%, or $11.7 million, during the same comparative periods, and is attributable to a greater number of vessels repositioned during fiscal 2015. These increases were partially offset by decreases in repair and maintenance costs of $3.5 million, or 2%, and insurance costs of $1.9 million, or 10% during the same comparative periods.
The company also experienced a 5%, or $7.7 million, increase in depreciation and amortization expense due to the higher costs associated with acquiring and constructing the company’s newer, more sophisticated vessels.
34
Table of Contents
Index to Financial Statements
General and administrative expenses increased 1%, or $1.8 million, primarily due to the ramp up of shore-based personnel to support the company’s subsea operations, larger vessel operations in the Americas and Middle East/North Africa regions and the inclusion of Troms’ for a full fiscal year in 2015 versus ten months in fiscal 2014. Additionally, gains on asset dispositions, net, decreased by 21%, or $2.5 million, due a fewer number of vessels sold compared to the prior year as well as a greater amount of impairments of vessels and other assets. The reduction in the number of vessels sold and the increase in impairments during fiscal 2015 was partially offset by an increase in gains recognized related to amortization of deferred gains from sale/leasebacks.
Increases to borrowings, including the revolver and obligations of Troms Offshore, resulted in higher interest and other debt expenses of $6.2 million, or 14%, as disclosed in Note (5) of Notes to Consolidated Financial Statements included in Item 8 of this Annual Report on Form 10-K. The overall decrease to pre-tax earnings contributed to a 176%, or $57.7 million decrease to income tax expense.
Macroeconomic Environment and Outlook
The primary driver of our business (and revenues) is the level of our customers’ capital and operating expenditures for offshore oil and natural gas exploration, field development and production. These expenditures, in turn, generally reflect our customers’ expectations for future oil and natural gas prices, economic growth, hydrocarbon demand, estimates of current and future oil and natural gas production, the relative cost of exploring, developing and producing onshore and offshore oil and natural gas, and our customers’ ability to access exploitable oil and natural gas resources. The prices of crude oil and natural gas are critical factors in our customers’ investment and spending decisions, including their decisions to contract drilling rigs and offshore support vessels in support of offshore exploration, field development and production activities in the various global geographic markets, most of which the company already operates.
Although it has stabilized in recent weeks, the price of crude oil has declined significantly over the last twelve months, a trend that accelerated sharply in the third fiscal quarter, primarily due to a less optimistic forecast of worldwide economic growth and increased global oil and gas production. In particular, oil and gas production in the U.S. has increased significantly in recent years, but collectively there has been no offsetting production decline in other countries, including OPEC member countries. Some analysts believe that lower oil prices and increased volatility in commodity markets in recent months also reflect the impact of speculators reducing their long positions in futures markets. During the most recent quarter, the global economy experienced modest growth, led by China, the U.S. and India; however, some analysts have scaled back their original growth forecasts as a result of a slower than expected Euro-zone recovery, recent developments in Russia, and continuing geopolitical concerns in the Middle East. The demand for crude oil typically follows economic growth expectations and as analysts have scaled back their economic growth forecasts they have generally revised their worldwide crude oil demand forecasts downward.
Tidewater anticipates that its longer-term utilization and day rate trends for its vessels will be correlated with demand for, and the price of, crude oil, which during May 2015, was trading around $60 per barrel for West Texas Intermediate (WTI) crude and around $65 per barrel for Intercontinental Exchange (ICE) Brent crude. The current pricing outlook and recent trend in crude oil prices could adversely affect additional drilling and exploration activity as prices for WTI and ICE Brent are significantly below the average prices per barrel reportedly used in exploration and production (E&P) companies’ capital expenditure budgets as reported in 2015 E&P spending surveys.
The continuing rise in production of unconventional gas resources in North America and the commissioning of a number of new, large, Liquefied Natural Gas (LNG) export facilities around the world have contributed to an oversupplied natural gas market. Earlier in the year, natural gas inventories in the U.S. declined from historic highs primarily due to increased consumption during a colder than average winter. More recently, however, natural gas inventories have risen, once again exerting downward pressure on natural gas prices in the U.S. Prolonged periods of oversupply of natural gas (whether from conventional or unconventional natural gas production or gas produced as a byproduct of conventional or unconventional crude oil production) will likely continue to suppress prices for natural gas, although over the longer term, relatively low natural gas prices may also lead to increased demand for the resource. High levels of onshore gas production along with a prolonged downturn in natural gas prices would be expected over the short and intermediate term to negatively impact the offshore exploration and development plans of energy companies, which in turn would suppress demand for offshore support vessel services. The impact of lower gas prices in recent years has been most pronounced in
35
Table of Contents
Index to Financial Statements
our Americas segment and specifically in our U.S. operations where natural gas is a more prevalent, exploitable hydrocarbon resource. In May 2015, natural gas was trading in the U.S. at approximately $2.70 per Mcf.
Certain oil and gas industry analysts have reported in their surveys of estimated 2015 E&P expenditures (both land-based and offshore) that global capital expenditure budgets for E&P companies are forecast to decrease in calendar year 2015 between approximately 5% and 17% from calendar year 2014 levels; however, these analysts recognize that the capital expenditure budgets included in their surveys were based on an approximate $65-$70 WTI average price per barrel of crude oil, with current prices significantly lower and the possibility that actual 2015 oil prices could average well below the prices assumed in their initial capital spending budgets, therefore resulting in even lower expected levels of capital spending in 2015. These surveys also indicate that most E&P companies are assuming an approximate $3.50-$4.00 per Mcf average natural gas price for their 2015 capital budgets. The surveys further note that international capital spending budgets will decrease approximately 2%-15% while North American capital spending budgets are forecast to decrease between 11%-22% as compared to calendar 2014 levels.
Deepwater activity continues to be a significant segment of the global offshore crude oil and natural gas markets, and it is also believed to be a source of potential long-term growth for the company. Deepwater oil and gas development typically involves significant capital investment and multi-year development plans. Such projects are generally underwritten by the participating exploration, field development and production companies using relatively conservative assumptions relating to crude oil and natural gas prices. These projects are, therefore, considered to be less susceptible to short-term fluctuations in the price of crude oil and natural gas though it is possible that the recent pullback in crude oil prices may also cause E&P companies to reevaluate their future capital expenditures in regards to deepwater projects.
Reports published by IHS-Petrodata in April of 2015 indicate that the worldwide movable offshore drilling rig count is estimated at approximately 950 rigs, of which approximately 675 offshore rigs were working as of April 2015. While the supply of, and demand for, offshore drilling rigs that meet the technical requirements of end user exploration and development companies may be key drivers of pricing for contract drilling services, the company believes that the number of rigs working offshore rather than the total population of moveable offshore drilling rigs is a better indicator of overall offshore activity levels and the demand for offshore support vessel services.
Of the estimated 950 movable rigs worldwide, approximately 35%, or approximately 320 rigs, are designed to operate in deeper waters. Of the approximately 675 working offshore rigs in April 2015, approximately 235 rigs are designed to operate in deeper waters. As of April 2015, the number of working rigs that are designed to operate in deeper waters was approximately 5% less than the number of deepwater rigs working a year ago. It is further estimated that approximately 40% of the approximate 220 new-build rig total, or approximately 85 rigs, are being built to operate in deeper waters, suggesting that newbuild deepwater rigs represent 35% of the approximately 235 deepwater rigs working in April 2015.
Recognizing that 85 newbuild rigs designed to operate in deeper waters represent approximately 35% of the approximate 235 deepwater rigs working in April 2015, there is some uncertainty as to whether the deepwater rigs currently under construction will, at least in the near- to intermediate-term, increase the working fleet or merely replace older, less productive drilling units. As a result, it is not clear what impact the delivery of additional rigs (deepwater and otherwise) within the next several years will have on the working rig count, especially in an environment of expected reduced E&P spending.
Investment is also being made in the floating production unit market, with approximately 100 new floating production units under construction and expected to be delivered primarily over the next three years to supplement the approximately 350 floating production units already installed worldwide, however, given the current economic environment, the risk of cancellation of some new build contracts or the stacking of installed but underutilized rigs increases.
36
Table of Contents
Index to Financial Statements
In addition to the relatively stable deepwater drilling activity levels, worldwide shallow-water exploration and production activity has remained stable during the last twelve months. According to IHS-Petrodata, there were approximately 390 working jack-up rigs as of April 2015, which is approximately the same number of jack-up rigs working a year ago. The construction backlog for new jack-up rigs has decreased approximately 15% over the last twelve months to approximately 125 jack-up rigs, nearly all of which are scheduled for delivery in the next three years. As discussed above with regards to the deepwater rig market and recognizing that 125 newbuild jackup rigs represent 30% of the approximately 390 jack up rigs working in April 2015, there is also uncertainty as to how many of the jack-up rigs currently under construction will either increase the working fleet or replace older, less productive jack-up rigs.
Also according to IHS-Petrodata, there are approximately 540 new-build offshore support vessels (deepwater PSVs, deepwater AHTS vessels and towing-supply vessels only) either under construction (420 vessels), on order or planned as of April 2015. Most of the vessels under construction are expected to be delivered to the worldwide offshore vessel market within the next two years.
Also, as of April 2015, the worldwide fleet of these classes of vessels is estimated at approximately 3,270 vessels, of which Tidewater estimates more than 10% are currently stacked or are not being actively marketed by the vessels’ owners.
Further increases in worldwide vessel capacity would tend to have the effect of lowering charter rates, particularly when there are lower levels of exploration, field development and production activity.
The worldwide offshore marine vessel industry has a large number of aged vessels, including approximately 650 vessels, or 20%, of the worldwide offshore fleet, that are at least 25 years old and nearing or exceeding original expectations of their estimated economic lives. These older vessels, of which Tidewater estimates 40% to 50% are already either stacked or are not being actively marketed by the vessels’ owners, could potentially be removed from the market within the next few years if the cost of extending the vessels’ lives is not economically justifiable. Although the future attrition rate of these aging vessels cannot be determined with certainty, the company believes that the retirement of a sizeable portion of these aged vessels could mitigate the potential negative effects of new-build vessels on vessel utilization and vessel pricing. As discussed above, additional vessel demand, which could mitigate the possible negative effects of the new-build vessels being added to the offshore support vessel fleet, could also be created by the delivery of new drilling rigs and floating production units to the extent such new drilling rigs and/or floating production units both become operational and are not offset by the idling or retirement of existing active drilling rigs and floating production units.
Excluding the vessels that the company estimates to already be stacked or not actively being marketed by the vessels’ owners, the company estimates that the number of offshore support vessels under construction (420 vessels) represents approximately 12% to 13% of the existing worldwide fleet of these vessels. Excluding all of the 650 vessels that are at least 25 years old, the company estimates that the number of offshore support vessels under construction (420 vessels) represents approximately 16% of the existing worldwide fleet of these vessels.
Although we believe investment in additional rigs, especially those capable of operating in deeper waters, indicates offshore rig owner’s longer-term expectation for high levels of activity, the recent decline in crude oil and natural gas prices, the reduction in spending expectations among E&P companies and the number of new-build vessels which are expected to deliver within the next two years indicates that there may be, at least in the short-term, a period of potential overcapacity in the worldwide offshore support vessel fleet which may lead to lower utilization and average day rates across the offshore support vessel industry.
Principal Factors That Drive Our Revenues
The company’s revenues, net earnings and cash flows from operations are largely dependent upon the activity level of its offshore marine vessel fleet. As is the case with the many other vessel operators in our industry, our business activity is largely dependent on the level of exploration, field development and production activity of our customers. Our customers’ business activity, in turn, is dependent on crude oil and natural gas prices, which fluctuate depending on expected future levels of supply and demand for crude oil and natural gas, and on estimates of the cost to find, develop and produce reserves.
37
Table of Contents
Index to Financial Statements
The company’s revenues in all segments are driven primarily by the company’s fleet size, vessel utilization and day rates. Because a sizeable portion of the company’s operating costs and its depreciation does not change proportionally with changes in revenue, the company’s operating profit is largely dependent on revenue levels.
Principal Factors That Drive Our Operating Costs
Operating costs consist primarily of crew costs, repair and maintenance costs, insurance costs and loss reserves, fuel, lube oil and supplies costs and other vessel operating costs.
Fleet size, fleet composition, geographic areas of operation, supply and demand for marine personnel, and local labor requirements are the major factors which affect overall crew costs in all segments. In addition, the company’s newer, more technologically sophisticated PSVs and AHTS vessels generally require a greater number of specially trained, more highly compensated fleet personnel than the company’s older, smaller and less sophisticated vessels. The delivery of new-build offshore rigs and support vessels currently under construction may further increase the number of technologically sophisticated offshore rigs and support vessels operating worldwide. Crew costs may continue to increase as competition for skilled personnel intensifies, through a weaker offshore energy market should somewhat mitigate the upward trend in crew costs experienced in recent years. Overall labor costs will also be impacted by the company’s operation of remotely operated vehicles (ROVs), which generally require more highly compensated personnel than the company’s existing fleet.
The timing and amount of repair and maintenance costs are influenced by expectations of future customer demand for our vessels, as well as vessel age and drydockings and other major repairs and maintenance mandated by regulatory agencies. A certain number of periodic drydockings are required to meet regulatory requirements. The company will generally incur drydocking and other major repairs and maintenance costs only if economically justified, taking into consideration the vessel’s age, physical condition, contractual obligations, current customer requirements and future marketability. When the company elects to forego a required regulatory drydock or major or repairs and maintenance, it stacks and occasionally sells the vessel because it is not permitted to work without valid regulatory certifications. When the company drydocks a productive vessel, the company not only foregoes vessel revenues and incurs drydocking and other major repairs and maintenance costs, but it also generally continues to incur vessel operating and depreciation costs. In any given period, vessel downtime associated with drydockings and major repairs and maintenance can have a significant effect on the company’s revenues and operating costs.
At times, major repairs and maintenance and drydockings take on an increased significance to the company and its financial performance. Older vessels may require frequent and expensive repairs and maintenance. Newer vessels (generally those built after 2000), which now account for a majority of the company’s revenues and vessel margin (vessel revenues less vessel operating costs), can also require expensive major repairs and maintenance, even in the early years of a vessel’s useful life, due to the larger relative size and greater relative complexity of these vessels. Conversely, when the company stacks vessels, repair and maintenance expense in any period could decline. The combination of these factors can create volatility in period to period repairs and maintenance expense, and incrementally increase the volatility of the company’s revenues and operating income, thus making period-to-period comparisons of financial results more difficult.
Although the company attempts to efficiently manage its major repairs and maintenance and drydocking schedule, changes in the demand for (and supply of) shipyard services can result in heavy workloads at shipyards and inflationary pressure on shipyard pricing. In recent years, increases in major repair and maintenance and drydocking costs and days off hire (due to vessels being drydocked) have contributed to volatility in repair and maintenance costs and vessel revenue. In addition, some of the more recently constructed vessels are now experiencing their first or second required regulatory drydockings and associated major repairs and maintenance.
Insurance and loss reserves costs are dependent on a variety of factors, including the company’s safety record and pricing in the insurance markets, and can fluctuate over time. The company’s vessels are generally insured for up to their estimated fair market value in order to cover damage or loss resulting from marine casualties, adverse weather conditions, mechanical failure, collisions, and property losses to the vessel. The company also purchases coverage for potential liabilities stemming from third-party losses with limits that it believes are reasonable for its operations. Insurance limits are reviewed annually, and third-party coverage is purchased based on the expected scope of ongoing operations and the cost of third-party coverage.
38
Table of Contents
Index to Financial Statements
Fuel and lube costs can also fluctuate in any given period depending on the number and distance of vessel mobilizations, the number of active vessels off charter, drydockings, and changes in fuel prices.
The company also incurs vessel operating costs that are aggregated as “other” vessel operating costs. These costs consist of brokers’ commissions, including commissions paid to unconsolidated joint venture companies, training costs and other miscellaneous costs. Brokers’ commissions are incurred primarily in the company’s non-United States operations where brokers sometimes assist in obtaining work for the company’s vessels. Brokers generally are paid a percentage of day rates and, accordingly, commissions paid to brokers generally fluctuate in accordance with vessel revenue. Other costs include, but are not limited to, satellite communication fees, agent fees, port fees, canal transit fees, vessel certification fees, temporary vessel importation fees and any fines or penalties.
Results of Operations
Tidewater manages and measures its business performance in four distinct operating segments which are based on our geographical organization: Americas, Asia/Pacific, Middle East/North Africa, and Sub-Saharan Africa/Europe. The following table compares vessel revenues and vessel operating costs (excluding general and administrative expenses, depreciation expense, vessel operating leases, goodwill impairment, and gains on asset dispositions) for the company’s vessel fleet and the related percentage of vessel revenue for the years ended March 31. Vessel revenues and operating costs relate to vessels owned and operated by the company.
| (In thousands) | 2015 | % | 2014 | % | 2013 | % | ||||||||||||||||||||
| Vessel revenues: |
||||||||||||||||||||||||||
| Americas |
$ | 505,699 | 35 | % | 410,731 | 29 | % | 327,059 | 27 | % | ||||||||||||||||
| Asia/Pacific |
150,820 | 10 | % | 154,618 | 11 | % | 184,014 | 15 | % | |||||||||||||||||
| Middle East/North Africa |
205,787 | 14 | % | 186,524 | 13 | % | 149,412 | 12 | % | |||||||||||||||||
| Sub-Saharan Africa/Europe |
606,052 | 41 | % | 666,588 | 47 | % | 569,513 | 46 | % | |||||||||||||||||
| Total vessel revenues |
$ | 1,468,358 | 100 | % | 1,418,461 | 100 | % | 1,229,998 | 100 | % | ||||||||||||||||
|
| ||||||||||||||||||||||||||
| Vessel operating costs: |
||||||||||||||||||||||||||
| Crew costs |
$ | 428,131 | 29 | % | 396,332 | 28 | % | 356,165 | 29 | % | ||||||||||||||||
| Repair and maintenance |
173,788 | 12 | % | 177,331 | 13 | % | 132,587 | 11 | % | |||||||||||||||||
| Insurance and loss reserves |
17,683 | 1 | % | 19,628 | 1 | % | 20,765 | 2 | % | |||||||||||||||||
| Fuel, lube and supplies |
88,272 | 6 | % | 76,609 | 5 | % | 79,023 | 6 | % | |||||||||||||||||
| Other |
126,494 | 9 | % | 125,990 | 9 | % | 104,041 | 8 | % | |||||||||||||||||
| Total vessel operating costs |
$ | 834,368 | 57 | % | 795,890 | 56 | % | 692,581 | 56 | % | ||||||||||||||||
|
| ||||||||||||||||||||||||||
|
The following table compares other operating revenues and costs related to the company’s ROV and related subsea services operations, third-party activities of the company’s shipyards, brokered vessels and other miscellaneous marine-related activities for the years ended March 31.
| ||||||||||||||||||||||||||
| (In thousands) | 2015 | 2014 | 2013 | |||||||||||||||||||||||
| Other operating revenues |
$ | 27,159 | 16,642 | 14,167 | ||||||||||||||||||||||
| Costs of other operating revenues |
26,505 | 15,745 | 12,216 | |||||||||||||||||||||||
39
Table of Contents
Index to Financial Statements
The following table presents vessel operating costs by the company’s segments, the related segment vessel operating costs as a percentage of segment vessel revenues, total vessel operating costs and the related total vessel operating costs as a percentage of total vessel revenues for each for the fiscal years ended March 31.
| (In thousands) | 2015 | % | 2014 | % | 2013 | % | ||||||||||||||||||||
| Vessel operating costs: |
||||||||||||||||||||||||||
| Americas: |
||||||||||||||||||||||||||
| Crew costs |
$ | 148,034 | 29 | % | 122,790 | 30 | % | 112,339 | 34 | % | ||||||||||||||||
| Repair and maintenance |
57,782 | 12 | % | 49,693 | 12 | % | 44,798 | 14 | % | |||||||||||||||||
| Insurance and loss reserves |
5,095 | 1 | % | 5,530 | 1 | % | 5,171 | 1 | % | |||||||||||||||||
| Fuel, lube and supplies |
26,792 | 5 | % | 20,045 | 5 | % | 19,081 | 6 | % | |||||||||||||||||
| Other |
33,494 | 7 | % | 29,078 | 7 | % | 23,015 | 7 | % | |||||||||||||||||
| 271,197 | 54 | % | 227,136 | 55 | % | 204,404 | 62 | % | ||||||||||||||||||
| Asia/Pacific: |
||||||||||||||||||||||||||
| Crew costs |
$ | 62,660 | 41 | % | 59,075 | 38 | % | 69,726 | 38 | % | ||||||||||||||||
| Repair and maintenance |
19,582 | 13 | % | 11,772 | 8 | % | 10,469 | 6 | % | |||||||||||||||||
| Insurance and loss reserves |
2,181 | 1 | % | 1,691 | 1 | % | 2,510 | 1 | % | |||||||||||||||||
| Fuel, lube and supplies |
11,330 | 8 | % | 9,370 | 6 | % | 10,887 | 6 | % | |||||||||||||||||
| Other |
8,667 | 6 | % | 9,824 | 6 | % | 9,313 | 5 | % | |||||||||||||||||
| 104,420 | 69 | % | 91,732 | 59 | % | 102,905 | 56 | % | ||||||||||||||||||
| Middle East/North Africa: |
||||||||||||||||||||||||||
| Crew costs |
$ | 62,517 | 31 | % | 49,844 | 27 | % | 39,227 | 26 | % | ||||||||||||||||
| Repair and maintenance |
25,228 | 12 | % | 19,316 | 10 | % | 11,530 | 8 | % | |||||||||||||||||
| Insurance and loss reserves |
3,822 | 2 | % | 3,138 | 2 | % | 2,869 | 2 | % | |||||||||||||||||
| Fuel, lube and supplies |
14,372 | 7 | % | 15,780 | 8 | % | 11,598 | 8 | % | |||||||||||||||||
| Other |
15,183 | 7 | % | 13,145 | 7 | % | 9,653 | 7 | % | |||||||||||||||||
| 121,122 | 59 | % | 101,223 | 54 | % | 74,877 | 51 | % | ||||||||||||||||||
| Sub-Saharan Africa/Europe: |
||||||||||||||||||||||||||
| Crew costs |
$ | 154,920 | 26 | % | 164,623 | 25 | % | 134,873 | 24 | % | ||||||||||||||||
| Repair and maintenance |
71,196 | 12 | % | 96,550 | 14 | % | 65,790 | 11 | % | |||||||||||||||||
| Insurance and loss reserves |
6,585 | 1 | % | 9,269 | 1 | % | 10,215 | 2 | % | |||||||||||||||||
| Fuel, lube and supplies |
35,778 | 6 | % | 31,414 | 5 | % | 37,457 | 7 | % | |||||||||||||||||
| Other |
69,150 | 11 | % | 73,943 | 11 | % | 62,060 | 11 | % | |||||||||||||||||
| 337,629 | 56 | % | 375,799 | 56 | % | 310,395 | 55 | % | ||||||||||||||||||
| Total vessel operating costs |
$ | 834,368 | 57 | % | 795,890 | 56 | % | 692,581 | 56 | % | ||||||||||||||||
|
| ||||||||||||||||||||||||||
|
The following table compares operating income and other components of earnings before income taxes, and its related percentage of total revenues for the years ended March 31.
| ||||||||||||||||||||||||||
| (In thousands) | 2015 | % | 2014 | % | 2013 | % | ||||||||||||||||||||
| Vessel operating profit: |
||||||||||||||||||||||||||
| Americas |
$ | 122,988 | 8 | % | 90,936 | 6 | % | 40,318 | 3 | % | ||||||||||||||||
| Asia/Pacific |
11,541 | 1 | % | 29,044 | 2 | % | 43,704 | 4 | % | |||||||||||||||||
| Middle East/North Africa |
37,258 | 3 | % | 42,736 | 3 | % | 39,069 | 3 | % | |||||||||||||||||
| Sub-Saharan Africa/Europe |
122,169 | 8 | % | 136,092 | 10 | % | 129,460 | 10 | % | |||||||||||||||||
| 293,956 | 20 | % | 298,808 | 21 | % | 252,551 | 20 | % | ||||||||||||||||||
| Other operating loss |
(8,022 | ) | (1 | %) | (1,930 | ) | (<1 | %) | (833 | ) | (<1 | %) | ||||||||||||||
| 285,934 | 19 | % | 296,878 | 21 | % | 251,718 | 20 | % | ||||||||||||||||||
| Corporate general and administrative expenses |
(40,621 | ) | (3 | %) | (47,703 | ) | (4 | %) | (48,704 | ) | (4 | %) | ||||||||||||||
| Corporate depreciation |
(4,014 | ) | (<1 | %) | (3,073 | ) | (<1 | %) | (3,391 | ) | (<1 | %) | ||||||||||||||
| Corporate expenses |
(44,635 | ) | (3 | %) | (50,776 | ) | (4 | %) | (52,095 | ) | (4 | %) | ||||||||||||||
| Gain on asset dispositions, net |
9,271 | <1 | % | 11,722 | 1 | % | 6,609 | 1 | % | |||||||||||||||||
| Goodwill impairment |
(283,699 | ) | (19 | %) | (56,283 | ) | (4 | %) | — | — | ||||||||||||||||
| Restructuring charge |
(4,052 | ) | (<1 | %) | — | — | — | — | ||||||||||||||||||
| Operating income (loss) |
(37,181 | ) | (3 | %) | 201,541 | 14 | % | 206,232 | 17 | % | ||||||||||||||||
| Foreign exchange gain |
8,678 | 1 | % | 1,541 | <1 | % | 3,011 | <1 | % | |||||||||||||||||
| Equity in net earnings of unconsolidated companies |
10,179 | 1 | % | 15,801 | 1 | % | 12,189 | 1 | % | |||||||||||||||||
| Interest income and other, net |
1,927 | <1 | % | 2,123 | <1 | % | 3,476 | <1 | % | |||||||||||||||||
| Loss on early extinguishment of debt |
— | — | (4,144 | ) | (<1 | %) | — | — | ||||||||||||||||||
| Interest and other debt costs |
(50,029 | ) | (3 | %) | (43,814 | ) | (3 | %) | (29,745 | ) | (2 | %) | ||||||||||||||
| Earnings (loss) before income taxes |
$ | (66,426 | ) | (4 | %) | 173,048 | 12 | % | 195,163 | 16 | % | |||||||||||||||
|
| ||||||||||||||||||||||||||
40
Table of Contents
Index to Financial Statements
Fiscal 2015 Compared to Fiscal 2014
Consolidated Results. Despite the decrease in day rates and utilization towards the end of fiscal 2015, the company’s revenue increased $60.4 million, or 4%, over the revenues earned during fiscal 2014 and were primarily attributable to increases in demand in certain markets and the additions of new vessels delivered or acquired during the current fiscal year. The company’s consolidated net earnings decreased 130%, or $181.6 million during fiscal 2015 largely due to a $283.7 million non-cash goodwill impairment charge ($214.9 million after-tax, or $4.43 per share) recorded during the third quarter of fiscal 2015 as disclosed in Note (16) of Notes to Consolidated Financial Statements included in Item 8 of this Annual Report on Form 10-K. Excluding the goodwill impairment charges taken in fiscal 2015 and fiscal 2014 (net of associated tax benefits), net earnings decreased approximately 19%, or approximately $34 million, during fiscal 2015.
Vessel operating costs increased 5%, or $38.5 million, during fiscal 2015 as compared to fiscal 2014. Crew costs increased approximately 8%, or $31.8 million, during fiscal 2015 as compared to fiscal 2014, primarily because of the new vessels delivered or acquired in the current fiscal year and the overall higher cost of personnel. Fuel, lube and supplies costs increased 15%, or $11.7 million, during fiscal 2015 as compared to fiscal 2014, primarily due to the repositioning of vessels to areas with more attractive contract opportunities.
Depreciation and amortization expense increased 5%, or $7.7 million, in fiscal 2015 as compared to fiscal 2014 due to delivery of additional new vessels into the fleet and the higher acquisition/construction costs of the company’s newer, more sophisticated vessels. General and administrative costs increased 1%, or $1.8 million, primarily due to the ramp up of shore-based personnel to support the company’s subsea operations and vessel operations in the Americas and Middle East/North Africa regions and the inclusion of Troms’ administrative related costs for a full fiscal year.
Interest and other debt costs also increased $6.2 million, or 14%, due to an increase in borrowings during fiscal 2015. The overall decrease to pre-tax earnings and a decrease in the effective tax rate, contributed to a 103%, or $33.9 million decrease to income tax expense. The decrease in the effective tax rate for the year ended March 31, 2015 as compared to the year ended March 31, 2014 is primarily due to a $17.8 million valuation allowance recorded against the company’s net deferred tax assets. Cumulative losses in recent years and losses expected in the near term result in it being more likely than not that the net deferred tax assets will not be realized in the foreseeable future. A $283.7 million goodwill impairment charge, of which $45.2 million was non-deductible for U.S. income tax purposes, further decreased the effective tax rate for the year ended March 31, 2015.
At March 31, 2015, the company had 279 owned or chartered vessels (excluding joint-venture vessels and vessels withdrawn from service) in its fleet with an average age of 9.5 years. At March 31, 2015, the average age of 254 newer vessels in the fleet (defined as those that have been acquired or constructed since calendar year 2000 as part of the company’s new build and acquisition program) is 7.7 years. The remaining 25 vessels, of which 9 are stacked at fiscal year-end, have an average age of 28.4 years.
During fiscal 2015 and 2014, the company’s newer vessels generated $1,419 million and $1,342 million, respectively, of consolidated vessel revenue and accounted for 97%, or $615.1 million, and 96%, or $602.2 million, respectively, of total vessel margin (vessel revenues less vessel operating costs). Vessel operating costs during fiscal 2015 and 2014 for the company’s new vessels excludes depreciation expense of $170.3 million and $152.9 million, and vessel operating lease expense of $28.3 million and $21.9 million respectively.
Americas Segment Operations. Vessel revenues in the Americas segment increased approximately 23%, or $95 million, during fiscal 2015 as compared to fiscal 2014, primarily due to higher revenues earned on both the deepwater and towing-supply vessel classes. Revenues from the deepwater vessel class increased 34%, or $89.5 million, during the same comparative periods, due to a nine percentage point increase in utilization, and due to an increased number of deepwater vessels operating in the region as a result of newly delivered vessels and vessels transferred into the Americas region from other regions primarily as a result of the increased demand for deepwater drilling services in Brazil and the U.S. GOM during fiscal 2015. Revenues from the towing-supply vessels increased 9%, or $10 million, during the same comparative periods, due to an increase in utilization of 16 percentage points.
Within the Americas segment, the company continued to stack, and in some cases, dispose of, vessels that
41
Table of Contents
Index to Financial Statements
could not find attractive charters. At the beginning of fiscal 2015, the company had 10 stacked Americas-based vessels. During fiscal 2015, the company stacked seven additional vessels and disposed of six vessels from the previously stacked vessel fleet, resulting in a total of 11 stacked Americas-based vessels as of March 31, 2015.
Operating profit for the Americas segment increased approximately 35%, or $32.1 million, during fiscal 2015 as compared to fiscal 2014, primarily due to higher revenues, which were offset by a 19%, or $44.1 million, increase in vessel operating costs (primarily crew costs, repair and maintenance costs, fuel, lube and supplies costs and other vessel costs), an increase in vessel operating lease costs, an increase in depreciation expense and an increase in general and administrative expenses.
Crew costs increased 21%, or $25.2 million, during fiscal 2015 as compared to fiscal 2014, primarily due to an increase in the number of vessels operating in this segment. Repair and maintenance costs increased 16%, or $8.1 million, during the same comparative periods, due to an increase in the number and cost of drydockings performed. Fuel, lube and supplies costs increased 34%, or $6.7 million, during the same comparative periods, due to the mobilization of larger deepwater vessel into the region. Other vessel costs increased 15%, or $4.4 million, during the same comparative periods, due to the number of vessel deliveries into the segment during fiscal 2015. Vessel operating lease costs increased 146%, or $12.4 million, during fiscal 2015 as compared to fiscal 2014, due to the increase in the number of vessels operated by the company in the U.S. GOM pursuant to leasing arrangements. Depreciation expense increased 10%, or $4.4 million, during the same comparative periods, due to the increase in the number of deepwater vessels operating in the area, which was partially offset by the disposition of vessels in the Americas segment pursuant to sale/lease transactions. General and administrative expenses increased 5%, or $2 million, during the same comparative periods in order to support the higher levels of activity in the segment during fiscal 2015.
Asia/Pacific Segment Operations. Vessel revenues in the Asia/Pacific segment decreased approximately 3%, or $3.8 million, during fiscal 2015 as compared to fiscal 2014 primarily due to decreases in revenues from the towing-supply vessel class. Revenues earned on the towing-supply vessels decreased $9.3 million, or 15%, during the same comparative periods, due to a number of towing-supply vessels transferring out of the non-Australia areas within the Asia/Pacific segment to other segments where charter opportunities for this class of vessel are currently considered by the company to be more attractive. The decrease in revenues earned on the towing-supply vessels were offset by an increase in revenues earned on the deepwater vessels. Deepwater vessels revenues increased $6.3 million, or 7%, during the comparative periods, due to a net increase in the number of deepwater vessels operating the in the area, most notably in Australia.
At the beginning of fiscal 2015, the company did not have any stacked Asia/Pacific vessels. During fiscal 2015, the company stacked two vessels and reactivated one stacked vessel, resulting in a total of 1 stacked Asia/Pacific-based vessel as of March 31, 2015.
Operating profit for the Asia/Pacific segment decreased $17.5 million, or 60%, during fiscal 2015 as compared to fiscal 2014, primarily due a $12.7 million, or 14%, increase in vessel operating costs (primarily crew costs, repair and maintenance costs and fuel, lube and supplies costs) and an increase in depreciation expense.
Crew costs increased 6% or $3.6 million, during fiscal 2015 as compared to fiscal 2014, due to increased headcount on vessels manned for certain projects and ramp up of crew work on new contracts in Australia. Repair and maintenance costs increased 66%, or $7.8 million, during the same comparative periods, due to an increase in the number of scheduled drydocks and additional inspections performed to prepare vessels for certain projects (also in Australia). Fuel, lube and supplies costs increased 21%, or $2 million, and depreciation expense increased 7%, or $1.2 million during the same comparative periods, as a result of a larger number of deepwater vessels operating the in region for most of the fiscal year.
Middle East/North Africa Segment Operations. Vessel revenues in the Middle East/North Africa segment increased approximately 10%, or $19.3 million, during fiscal 2015 as compared to fiscal 2014 primarily due to increases in revenues from the deepwater vessel class. Deepwater vessel revenue increased 28%, or $18.8 million, during the comparative periods, due to an increase in the number of deepwater vessels operating in the segment and a 9% increase in average day rates. Increases in vessel revenues in the Middle East/North Africa segment is primarily the result of increased scale of operations in the Black Sea and offshore Saudi Arabia (which, in turn was primarily driven by an increase in the number of jack up rigs working in these areas).
42
Table of Contents
Index to Financial Statements
Increases in dayrates in Middle East/North Africa reflect the transfer of larger, higher specification vessels from other regions into the Middle East/North Africa region and lump sum mobilization fees.
At the beginning of fiscal 2015, the company had one stacked Middle East/North Africa-based vessel. During fiscal 2015, the company stacked two additional vessels and disposed of one vessel previously stacked, resulting in a total of 2 stacked Middle East/North Africa-based vessels as of March 31, 2015.
Operating profit for the Middle East/North Africa segment decreased $5.5 million, or 13%, during fiscal 2015 as compared to fiscal 2014, primarily due to a 20%, or $19.9 million, increase in vessel operating costs (primarily crew costs, repair and maintenance costs and other vessel costs), an increase in depreciation expense and an increase in general and administrative expenses, which were partially offset by higher revenues.
Crew costs increased 25%, or $12.7 million; other vessel costs increased 16%, or $2 million; and depreciation expense increased 13%, or $3.1 million, during fiscal 2015 as compared to fiscal 2014, primarily due to an increase in the number of vessels operating in the segment. Repair and maintenance costs increased 31%, or $5.9 million, during the same comparative periods, due to an increase in the number of drydockings performed in fiscal 2015 and the outfitting of vessels in preparation for the start of new term contracts. General and administrative expenses increased 21%, or $3.5 million, due to the increase in shore passed personnel, primarily to support a higher level of activity in Saudi Arabia and in the Black Sea.
Sub-Saharan Africa/Europe Segment Operations. Vessel revenues in the Sub-Saharan Africa/Europe segment decreased approximately 9%, or $60.5 million, during fiscal 2015 as compared to fiscal 2014, primarily due to a decrease in revenues from both the deepwater and towing-supply vessel classes. Revenues earned on the deepwater vessels decreased 11%, or $38.4 million, and revenues earned on the towing-supply vessels decreased 10%, or $22.9 million, during the comparative periods, primarily due to a reduction in the number of vessels in Sub-Saharan Africa due to transfers of vessels from Sub-Saharan Africa (in particular, Angola) to other regions. These decreases were somewhat offset by increases in vessel revenues generated by the company’s European operations driven by the acquisition of Troms Offshore which occurred during fiscal 2014.
At the beginning of fiscal 2015, the company had four stacked Sub-Saharan Africa/Europe-based vessels. During fiscal 2015, the company stacked nine additional vessels, reactivated one vessel and disposed of five vessels from the previously stacked vessel fleet, resulting in a total of seven stacked Sub-Saharan Africa/Europe-based vessels as of March 31, 2015.
Operating profit for the Sub-Saharan Africa/Europe segment decreased approximately 10%, or $13.9 million, during fiscal 2015 as compared to fiscal 2014, primarily due to lower revenues, partially offset by a 10%, or $38.2 million, decrease in vessel operating costs (primarily crew costs, repair and maintenance costs and other vessel costs), a decrease in vessel operating lease costs and a decrease in depreciation expense.
Crew costs decreased 6%, or $9.7 million; other vessel costs decreased 7%, or $4.8 million; and depreciation expense decreased 7%, or $5.6 million, during fiscal 2015 as compared to fiscal 2014, due to a decrease in the number of vessels operating in the segment. Repair and maintenance costs decreased 26%, or $25.4 million, during the same comparative periods, due to a fewer number of drydockings performed during the current period. Vessel operating lease costs decreased 37%, or $4.3 million, during the same comparative periods, as vessels operated under lease arrangements transferred to other segments.
Other Items. A goodwill impairment charge of $283.7 million was recorded during the quarter ended December 31, 2014. Please refer to the “Goodwill” section of Management Discussion and Analysis of this report for a discussion on the company’s goodwill impairment.
In the fourth quarter of fiscal 2015 the Company’s management initiated a plan to begin reorganizing its operations worldwide as a result of the continuing decline in oil prices and the resulting softening demand for the company’s vessels. This plan consists of select employee terminations and early retirements that are intended to eliminate redundant or unneeded positions, reduce costs, and better align our workforce with anticipated activity levels in the geographic areas in which the company presently operates. In connection with these efforts, the company recognized a $4.1 million restructuring charge during the quarter ended March 31, 2015.
43
Table of Contents
Index to Financial Statements
Reorganization efforts to date most significantly included the redeployment of vessels from our Australian operation to other international markets where opportunities to profitably operate such vessels are considered more robust. The departure of these vessels from the Australian market and the associated reductions in onshore and offshore staffing resulted in the termination of a number of mariners who were entitled to severance payments under the terms of the enterprise bargaining agreement and in accordance with Australian labor laws.
Insurance and loss reserves expense decreased $1.9 million, or 10%, during fiscal 2015 as compared to fiscal 2014, primarily due to downward adjustments to case-based and other reserves.
Gain on asset dispositions, net during fiscal 2015 decreased $2.5 million, or 21%, as compared to fiscal 2014. This decrease is primarily due to a decrease in the number of vessels sold during the current fiscal year as well as an increase in impairments related to vessels and other assets. Included in gain on asset dispositions, net for fiscal year 2015 are $17.7 million of deferred gain amortization related to sale/leaseback transactions. Also included in gain on asset dispositions, net is a gain related to the reversal of an accrued $3 million liability related to contingent consideration potentially payable to the former owners of Troms Offshore based on the achievement by the Troms operation of certain performance metrics subsequent to the acquisition by the company. The company’s current expectation is that such performance metrics will not be achieved.
The company performed reviews of its assets for impairment during fiscal 2015 and 2014. The below table summarizes the combined fair value of the assets that incurred impairments along with the amount of impairment during the years ended March 31. The impairment charges were recorded in gain on asset dispositions, net.
| (In thousands) | 2015 | 2014 | ||||||||
| Amount of impairment incurred |
$ | 14,525 | 9,341 | |||||||
| Combined fair value of assets incurring impairment |
28,509 | 11,149 | ||||||||
Fiscal 2014 Compared to Fiscal 2013
Consolidated Results. The company’s revenue during fiscal 2014 increased $190.9 million, or 15%, over the revenues earned during fiscal 2013 and were primarily attributable to increases in demand in certain markets and the additions of new vessels delivered or acquired during the current fiscal year. The company’s consolidated net earnings decreased 7%, or $10.5 million during fiscal 2014 partially due to a $56.3 million non-cash goodwill impairment charge ($43.4 million after-tax, or $0.87 per share) recorded during the third quarter of fiscal 2014 in the company’s Asia/Pacific segment as disclosed in Note (16) of Notes to Consolidated Financial Statements included in Item 8 of this Annual Report on Form 10-K, a $4.1 million loss on the early extinguishment of Norwegian Kroner denominated public bonds that were issued by Troms Offshore and retired by the company in fiscal 2014 and approximately $3.7 million in transaction expenses incurred in connection with the Troms Offshore acquisition, which is included in general and administrative expenses.
Vessel operating costs increased 15%, or $103.3 million, during fiscal 2014 as compared to fiscal 2013. Crew costs increased approximately 11%, or $40.2 million, during fiscal 2014 as compared to fiscal 2013, primarily because of the new vessels delivered or acquired in the current fiscal year and the overall higher cost of personnel. Repair and maintenance costs increased 34%, or $44.7 million, during fiscal 2014, because a greater number and higher average cost of drydockings that were performed during fiscal year 2014. Other vessel operating costs increased $21.9 million, or 21%, during the same comparative periods primarily due to an increase in broker fees (primarily in our Sub-Saharan Africa/Europe region) and costs related to an increased number of vessels transferring to and operating in certain other areas (in particular, the Americas and Middle East/North Africa regions).
Depreciation and amortization increased 14%, or $20.2 million, in fiscal 2014 as compared to fiscal 2013 due to delivery of additional new vessels into the fleet and the higher acquisition/construction costs of the company’s newer, more sophisticated vessels. General and administrative costs increased 7%, or $12.4 million, primarily due to approximately $3.7 million in professional services incurred in connection with the Troms Offshore acquisition, arbitration activities related to our historical operations in Venezuela and legal fees associated with the placing into administration a subsidiary company based in the United Kingdom.
44
Table of Contents
Index to Financial Statements
Interest and other debt expense also increased $14.1 million, or 47%, due to an increase in borrowings during 2014. The company also recorded a $4.1 million loss on the early extinguishment of Norwegian Kroner denominated public bonds that were issued by Troms Offshore and retired by the company in fiscal 2014. The overall decrease to pre-tax earnings, and certain discrete items recognized in fiscal 2013 and fiscal 2014 contributed to a 26%, or $11.6 million decrease to income tax expense.
At March 31, 2014, the company had 283 owned or chartered vessels (excluding joint-venture vessels and vessels withdrawn from service) in its fleet with an average age of 9.9 years. At March 31, 2014, the average age of 245 newer vessels in the fleet (defined as those that have been acquired or constructed since calendar year 2000 as part of the company’s new build and acquisition program) is 6.9 years. The remaining 38 vessels, of which 15 are stacked at fiscal year-end, have an average age of 28.8 years.
During fiscal 2014 and 2013, the company’s newer vessels generated $1,342 million and $1,128 million, respectively, of consolidated vessel revenue and accounted for 96%, or $602.2 million, and 98%, or $524.7 million, respectively, of total vessel margin (vessel revenues less vessel operating costs). Vessel operating costs during fiscal 2014 and 2013 for the company’s new vessels excludes depreciation expense of $152.9 million and $127.5 million, and vessel operating lease expense of $21.9 million and $16.8 million respectively.
Americas Segment Operations. Vessel revenues in the Americas segment increased approximately 26%, or $83.7 million, during fiscal 2014 as compared to fiscal 2013, primarily due to higher revenues earned on the deepwater vessels. Revenues from the deepwater vessel class increased 47%, or $84.7 million, during the same comparative periods, due to a 9% increase in average day rates, and due to an increased number of deepwater vessels operating in the region as a result of newly delivered vessels and because deepwater vessels transferred into the Americas region from other regions primarily as a result of the increased demand for deepwater drilling services in Brazil and the U.S. GOM during fiscal 2014.
Utilization for the Americas-based vessels increased seven percentage points, during fiscal 2014 as compared to fiscal 2013; however, this increase is partially a result of the sale of 18 older, stacked vessels from the Americas fleet during fiscal 2014. Vessel utilization rates are calculated by dividing the number of days a vessel works by the number of days the vessel is available to work. As such, stacked vessels depressed utilization rates during the comparative periods because stacked vessels are considered available to work and are included in the calculation of utilization rates.
Within the Americas segment, the company stacked, and in some cases, disposed of, vessels that could not find attractive charters. At the beginning of fiscal 2014, the company had 26 Americas-based stacked vessels. During fiscal 2014, the company stacked three additional vessels, reactivated one vessel and disposed of 18 vessels from the previously stacked vessel fleet, resulting in a total of 10 stacked Americas-based vessels as of March 31, 2014.
Operating profit for the Americas segment increased approximately 126%, or $50.6 million, during fiscal 2014 as compared to fiscal 2013, primarily due to higher revenues, which were offset by an 11%, or $22.7 million, increase in vessel operating costs (primarily crew costs, repair and maintenance costs and other vessel costs), an increase in vessel operating lease costs and an increase in depreciation expense. Fiscal 2014 general and administrative expenses were comparable to the prior period.
Crew costs increased 9%, or $10.5 million, during fiscal 2014 as compared to fiscal 2013, primarily due to an increase in the number of vessels operating in this segment. Repair and maintenance costs increased 11%, or $4.9 million, during the same comparative periods, due to an increase in the number and cost of drydockings performed, and the outfitting of vessels which transferred into the segment for work on new contracts in fiscal 2014. Other vessel costs increased 26%, or $6.1 million, during the same comparative periods, due to the number of vessel deliveries into the segment during fiscal 2014. Vessel operating lease costs increased 220%, or $5.8 million, during fiscal 2014 as compared to fiscal 2013, due to the increase in the number of vessels operated by the company in the U.S. GOM pursuant to leasing arrangements. Depreciation expense increased 7%, or $2.8 million, during the same comparative periods, due to the increase in the number of deepwater vessels operating in the area, which was partially offset by the disposition of vessels in the Americas segment pursuant to sale/lease transactions.
45
Table of Contents
Index to Financial Statements
Asia/Pacific Segment Operations. Vessel revenues in the Asia/Pacific segment decreased approximately 16%, or $29.4 million, during fiscal 2014 as compared to fiscal 2013, primarily due to lower revenues earned on the towing-supply and deepwater vessel classes. Revenues on the towing-supply class decreased $21.6 million, or 26%, and revenues on the deepwater vessel class decreased $7.9 million, or 8%, during the same comparative periods. Decreases in vessel revenue for both vessel classes are attributable to the transfer of vessels to other segments where market opportunities are currently considered to be more attractive. The company believes that the Asia/Pacific region continues to be challenged with an excess capacity of vessels as a result of the significant number of vessels that have been built in this region over the past 10 years, without a commensurate increase in working rig count within the region. Please refer to the Goodwill disclosure in Item 7 of this Annual Report on Form 10-K for a discussion of a $56.3 million impairment charge related to the Asia/Pacific segment recorded in the quarter ended December 31, 2013.
Within the Asia/Pacific segment, the company also disposed of vessels that could not find attractive charters. At the beginning of fiscal 2014, the company had nine Asia/Pacific-based stacked vessels, all of which were sold during fiscal 2014.
Operating profit for the Asia/Pacific segment decreased $14.7 million, or 34%, during fiscal 2014 as compared to fiscal 2013, primarily due to lower revenues which were partially offset by an $11.2 million, or 11%, decrease in vessel operating costs (primarily crew costs) and a decrease in depreciation expense.
Crew costs decreased 15% or $10.7 million, and depreciation expense decreased 12%, or $2.2 million, during fiscal 2014 as compared to fiscal 2013, due to a decrease in the number of vessels operating in the segment.
Middle East/North Africa Segment Operations. Vessel revenues in the Middle East/North Africa segment increased approximately 25%, or $37.1 million, during fiscal 2014 as compared to fiscal 2013 primarily due to increases in revenues from the towing-supply class of vessels of 30%, or $26.8 million, due to a 16% increase in average day rates and a seven percentage point increase in utilization rates. In addition, deepwater vessel revenue increased 19%, or $10.6 million, during the same comparative periods, due to a 10% increase in average day rates. Increases in dayrates and overall utilization in Middle East/North Africa segment is primarily the result of increased operations in the Mediterranean Sea and offshore Saudi Arabia, which in turn has primarily been driven by an increase in the number of jack up rigs working in this region.
At the beginning of fiscal 2014, the company had six Middle East/North Africa-based stacked vessels. During fiscal 2014, the company stacked one additional vessel and disposed of six vessels from the previously stacked vessel fleet, resulting in a total of one stacked Middle East/North Africa-based vessel as of March 31, 2014.
Operating profit for the Middle East/North Africa segment increased $3.7 million, or 9%, during fiscal 2014 as compared to fiscal 2013, primarily due to higher revenues which were partially offset by a 35%, or $26.3 million, increase in vessel operating costs (primarily crew costs, repair and maintenance costs, fuel, lube and supplies costs and other vessel costs), an increase in depreciation expense and an increase in general and administrative expenses.
Crew costs increased 27%, or $10.6 million; fuel, lube and supplies costs increased 36%, or $4.2 million; other vessel costs increased 36%, or $3.5 million; and depreciation expense increased 30%, or $5.7 million during fiscal 2014 as compared to fiscal 2013, primarily due to an increase in the number of vessels operating in the segment. Repair and maintenance costs increased 68%, or $7.8 million, during the same comparative periods, due to an increase in the number and cost of major repairs and maintenance and drydockings performed in fiscal 2014 and the outfitting of vessels in preparation for the start of new term contracts. General and administrative expenses increased 12%, or $1.8 million, during the same comparative periods as a result of the increase in shore-based personnel, primarily to support our growing operations in Saudi Arabia.
Sub-Saharan Africa/Europe Segment Operations. Vessel revenues in the Sub-Saharan Africa/Europe segment increased approximately 17%, or $97.1 million, during fiscal 2014 as compared to fiscal 2013, primarily due to an increase in revenues from the deepwater vessel class. Revenues attributable to deepwater vessels increased 33%, or $91.2 million, due to a 16% increase in average day rates and a five percentage point increase in utilization rates. Average day rates on the deepwater vessels and towing-supply vessels increased due to the replacement of older vessels operating in the area with the higher specification vessels
46
Table of Contents
Index to Financial Statements
that are generally required by our customers in the region. Revenues from deepwater vessels during fiscal 2014 also include $55.6 million from vessels added to the company’s fleet with the June 2013 acquisition of Troms Offshore. Towing-supply vessel revenue increased 2%, or $4.9 million, during the same comparative periods, due to an 8% increase in average day rates and a four percentage point increase in utilization.
At the beginning of fiscal 2014, the company had 10 Sub-Saharan Africa/Europe-based stacked vessels. During fiscal 2014, the company stacked four additional vessels, reactivated one vessel and disposed of nine vessels from the previously stacked vessel fleet, resulting in a total of four stacked Sub-Saharan Africa/Europe-based vessels as of March 31, 2014.
Operating profit for the Sub-Saharan Africa/Europe segment increased approximately 5%, or $6.6 million, during fiscal 2014 as compared to fiscal 2013, primarily due to higher revenues, partially offset by a 21%, or $65.4 million, increase in vessel operating costs (primarily crew costs and repair and maintenance costs and other vessel operating costs), an increase in depreciation expense and an increase in general and administrative expenses.
Crew costs increased approximately 22%, or $29.8 million, during fiscal 2014 as compared to fiscal 2013, due to an increase in the number of vessels operating in the segment. Additionally, $15.6 million of the increase in crew costs is directly attributable to the June 2013 acquisition of Troms Offshore. Repair and maintenance cost increased 47%, or $30.8 million, during the same comparative periods, due to an increase in the number and cost of major repairs and maintenance and drydockings performed during the current period. Other vessel costs also increased 19%, or $11.9 million, during fiscal 2014 as compared to fiscal 2013, primarily due to commissions paid to brokers, including commissions to unconsolidated joint venture companies. Depreciation expense increased 21%, or $14 million, during the same comparative periods, due to an increase in the number of vessels operating in this segment. General and administrative expenses increased 22%, or $11.5 million, during the same comparative periods, due to increases in administrative payroll in part, related to the acquisition of Troms Offshore.
Other Items. Insurance and loss reserves expense decreased $1.1 million, or 6%, during fiscal 2014 as compared to fiscal 2013, primarily due to downward adjustments to case-based and other reserves and to additional insurance costs incurred in fiscal 2013 associated with the sinking of a vessel.
Gain on asset dispositions, net during fiscal 2014 increased $5.1 million, or 77%, as compared to fiscal 2013, due, in part, to a $7.9 million gain recognized on the sale of a vessel to an unconsolidated joint venture (a gain was recognized based on the company’s proportional ownership of the joint venture) and a $4.6 million gain recognized on the disposition of the company’s remaining shipyard during fiscal 2014. Also included in gain on asset dispositions, net for fiscal year 2014 are $3.7 million of deferred gain amortization related to sale/leaseback transactions. Dispositions of vessels can vary from quarter to quarter; therefore, gains on sales of assets may fluctuate significantly from period to period.
The company performed reviews of its assets for impairment during fiscal 2014 and 2013. The table below summarizes the combined fair value of the assets that incurred impairments along with the amount of impairment during the years ended March 31. The impairment charges were recorded in gain on asset dispositions, net.
| (In thousands) | 2014 | 2013 | ||||||||
| Amount of impairment incurred |
$ | 9,341 | 8,078 | |||||||
| Combined fair value of assets incurring impairment |
11,149 | 14,733 | ||||||||
Vessel Class Revenue and Statistics by Segment
Vessel utilization is determined primarily by market conditions and to a lesser extent by major repairs and maintenance and drydocking requirements. Vessel day rates are determined by the demand created largely through the level of offshore exploration, field development and production spending by energy companies relative to the supply of offshore support vessels. Suitability of available equipment and the degree of service provided may also influence vessel day rates. Vessel utilization rates are calculated by dividing the number of days a vessel works during a reporting period by the number of days the vessel is available to work in the reporting period. As such, stacked vessels depress utilization rates because stacked vessels are considered
47
Table of Contents
Index to Financial Statements
available to work, and as such, are included in the calculation of utilization rates. Average day rates are calculated by dividing the revenue a vessel earns during a reporting period by the number of days the vessel worked in the reporting period.
Vessel utilization and average day rates are calculated on all vessels in service (which includes stacked vessels and vessels undergoing major repairs and maintenance and/or in drydock) but do not include vessels owned by joint ventures (10 vessels at March 31, 2015). The following tables compare revenues, day-based utilization percentages and average day rates by vessel class and in total for each of the quarters in the years ended March 31:
| REVENUE BY VESSEL CLASS: (In thousands) |
||||||||||||||||||||||
| Fiscal Year 2015 | First | Second | Third | Fourth | Year | |||||||||||||||||
| Americas fleet: |
||||||||||||||||||||||
| Deepwater |
$ | 82,282 | 91,403 | 94,298 | 85,249 | 353,232 | ||||||||||||||||
| Towing-supply |
29,517 | 34,387 | 33,607 | 27,518 | 125,029 | |||||||||||||||||
| Other |
8,184 | 8,223 | 6,649 | 4,382 | 27,438 | |||||||||||||||||
| Total |
$ | 119,983 | 134,013 | 134,554 | 117,149 | 505,699 | ||||||||||||||||
| Asia/Pacific fleet: |
||||||||||||||||||||||
| Deepwater |
$ | 24,242 | 27,675 | 20,575 | 22,046 | 94,538 | ||||||||||||||||
| Towing-supply |
15,037 | 17,338 | 13,487 | 7,419 | 53,281 | |||||||||||||||||
| Other |
970 | 976 | 984 | 71 | 3,001 | |||||||||||||||||
| Total |
$ | 40,249 | 45,989 | 35,046 | 29,536 | 150,820 | ||||||||||||||||
| Middle East/North Africa fleet: |
||||||||||||||||||||||
| Deepwater |
$ | 19,467 | 19,254 | 25,615 | 20,943 | 85,279 | ||||||||||||||||
| Towing-supply |
35,279 | 28,715 | 29,441 | 23,797 | 117,232 | |||||||||||||||||
| Other |
793 | 868 | 869 | 746 | 3,276 | |||||||||||||||||
| Total |
$ | 55,539 | 48,837 | 55,925 | 45,486 | 205,787 | ||||||||||||||||
| Sub-Saharan Africa/Europe fleet: |
||||||||||||||||||||||
| Deepwater |
$ | 91,691 | 89,193 | 81,129 | 64,302 | 326,315 | ||||||||||||||||
| Towing-supply |
55,436 | 54,617 | 52,532 | 45,739 | 208,324 | |||||||||||||||||
| Other |
18,612 | 18,303 | 18,940 | 15,558 | 71,413 | |||||||||||||||||
| Total |
$ | 165,739 | 162,113 | 152,601 | 125,599 | 606,052 | ||||||||||||||||
| Worldwide fleet: |
||||||||||||||||||||||
| Deepwater |
$ | 217,682 | 227,525 | 221,617 | 192,540 | 859,364 | ||||||||||||||||
| Towing-supply |
135,269 | 135,057 | 129,067 | 104,473 | 503,866 | |||||||||||||||||
| Other |
28,559 | 28,370 | 27,442 | 20,757 | 105,128 | |||||||||||||||||
| Total |
$ | 381,510 | 390,952 | 378,126 | 317,770 | 1,468,358 | ||||||||||||||||
|
| ||||||||||||||||||||||
| Fiscal Year 2014 | First | Second | Third | Fourth | Year | |||||||||||||||||
| Americas fleet: | ||||||||||||||||||||||
| Deepwater |
$ | 55,032 | 61,811 | 72,048 | 74,859 | 263,750 | ||||||||||||||||
| Towing-supply |
27,670 | 30,861 | 30,451 | 26,073 | 115,055 | |||||||||||||||||
| Other |
7,542 | 9,257 | 7,349 | 7,778 | 31,926 | |||||||||||||||||
| Total |
$ | 90,244 | 101,929 | 109,848 | 108,710 | 410,731 | ||||||||||||||||
| Asia/Pacific fleet: |
||||||||||||||||||||||
| Deepwater |
$ | 24,292 | 19,923 | 20,142 | 23,834 | 88,191 | ||||||||||||||||
| Towing-supply |
17,722 | 16,559 | 15,235 | 13,114 | 62,630 | |||||||||||||||||
| Other |
942 | 948 | 948 | 959 | 3,797 | |||||||||||||||||
| Total |
$ | 42,956 | 37,430 | 36,325 | 37,907 | 154,618 | ||||||||||||||||
| Middle East/North Africa fleet: |
||||||||||||||||||||||
| Deepwater |
$ | 15,852 | 15,732 | 18,805 | 16,114 | 66,503 | ||||||||||||||||
| Towing-supply |
24,497 | 28,763 | 31,481 | 31,979 | 116,720 | |||||||||||||||||
| Other |
864 | 875 | 872 | 690 | 3,301 | |||||||||||||||||
| Total |
$ | 41,213 | 45,370 | 51,158 | 48,783 | 186,524 | ||||||||||||||||
| Sub-Saharan Africa/Europe fleet: |
||||||||||||||||||||||
| Deepwater |
$ | 87,251 | 106,541 | 84,866 | 86,064 | 364,722 | ||||||||||||||||
| Towing-supply |
54,860 | 56,772 | 59,789 | 59,803 | 231,224 | |||||||||||||||||
| Other |
15,106 | 15,626 | 18,727 | 21,183 | 70,642 | |||||||||||||||||
| Total |
$ | 157,217 | 178,939 | 163,382 | 167,050 | 666,588 | ||||||||||||||||
| Worldwide fleet: |
||||||||||||||||||||||
| Deepwater |
$ | 182,427 | 204,007 | 195,861 | 200,871 | 783,166 | ||||||||||||||||
| Towing-supply |
124,749 | 132,955 | 136,956 | 130,969 | 525,629 | |||||||||||||||||
| Other |
24,454 | 26,706 | 27,896 | 30,610 | 109,666 | |||||||||||||||||
| Total |
$ | 331,630 | 363,668 | 360,713 | 362,450 | 1,418,461 | ||||||||||||||||
|
| ||||||||||||||||||||||
48
Table of Contents
Index to Financial Statements
REVENUE BY VESSEL CLASS - continued:
| (In thousands) | ||||||||||||||||||||||
| Fiscal Year 2013 | First | Second | Third | Fourth | Year | |||||||||||||||||
| Americas fleet: |
||||||||||||||||||||||
| Deepwater |
$ | 36,280 | 44,747 | 48,089 | 49,916 | 179,032 | ||||||||||||||||
| Towing-supply |
34,352 | 31,109 | 29,418 | 25,938 | 120,817 | |||||||||||||||||
| Other |
7,018 | 6,460 | 7,025 | 6,707 | 27,210 | |||||||||||||||||
| Total |
$ | 77,650 | 82,316 | 84,532 | 82,561 | 327,059 | ||||||||||||||||
| Asia/Pacific fleet: |
||||||||||||||||||||||
| Deepwater |
$ | 25,337 | 24,592 | 21,862 | 24,327 | 96,118 | ||||||||||||||||
| Towing-supply |
25,500 | 20,229 | 19,277 | 19,211 | 84,217 | |||||||||||||||||
| Other |
905 | 917 | 918 | 939 | 3,679 | |||||||||||||||||
| Total |
$ | 51,742 | 45,738 | 42,057 | 44,477 | 184,014 | ||||||||||||||||
| Middle East/North Africa fleet: |
||||||||||||||||||||||
| Deepwater |
$ | 11,284 | 12,275 | 15,407 | 16,979 | 55,945 | ||||||||||||||||
| Towing-supply |
20,000 | 18,859 | 25,870 | 25,173 | 89,902 | |||||||||||||||||
| Other |
1,166 | 917 | 750 | 732 | 3,565 | |||||||||||||||||
| Total |
$ | 32,450 | 32,051 | 42,027 | 42,884 | 149,412 | ||||||||||||||||
| Sub-Saharan Africa/Europe fleet: |
||||||||||||||||||||||
| Deepwater |
$ | 62,615 | 67,696 | 64,509 | 78,724 | 273,544 | ||||||||||||||||
| Towing-supply |
49,012 | 63,548 | 54,816 | 58,981 | 226,357 | |||||||||||||||||
| Other |
16,625 | 18,473 | 17,102 | 17,412 | 69,612 | |||||||||||||||||
| Total |
$ | 128,252 | 149,717 | 136,427 | 155,117 | 569,513 | ||||||||||||||||
| Worldwide fleet: |
||||||||||||||||||||||
| Deepwater |
$ | 135,516 | 149,310 | 149,867 | 169,946 | 604,639 | ||||||||||||||||
| Towing-supply |
128,864 | 133,745 | 129,381 | 129,303 | 521,293 | |||||||||||||||||
| Other |
25,714 | 26,767 | 25,795 | 25,790 | 104,066 | |||||||||||||||||
| Total |
$ | 290,094 | 309,822 | 305,043 | 325,039 | 1,229,998 | ||||||||||||||||
|
| ||||||||||||||||||||||
| UTILIZATION: | ||||||||||||||||||||||
| Fiscal Year 2015 |
First | Second | Third | Fourth | Year | |||||||||||||||||
| Americas fleet: |
||||||||||||||||||||||
| Deepwater |
88.7 | % | 91.9 | 87.3 | 88.3 | 89.0 | ||||||||||||||||
| Towing-supply |
62.7 | 70.3 | 74.5 | 65.7 | 68.2 | |||||||||||||||||
| Other |
69.3 | 76.9 | 56.7 | 50.2 | 63.3 | |||||||||||||||||
| Total |
74.8 | % | 80.9 | 77.2 | 73.2 | 76.5 | ||||||||||||||||
| Asia/Pacific fleet: |
||||||||||||||||||||||
| Deepwater |
70.6 | % | 82.4 | 66.9 | 66.6 | 71.4 | ||||||||||||||||
| Towing-supply |
90.7 | 93.6 | 76.6 | 63.2 | 81.1 | |||||||||||||||||
| Other |
100.0 | 100.0 | 100.0 | 7.5 | 77.2 | |||||||||||||||||
| Total |
83.5 | % | 89.6 | 73.9 | 62.5 | 77.2 | ||||||||||||||||
| Middle East/North Africa fleet: |
||||||||||||||||||||||
| Deepwater |
72.1 | % | 80.4 | 89.3 | 81.8 | 81.1 | ||||||||||||||||
| Towing-supply |
93.6 | 71.1 | 79.6 | 68.7 | 78.3 | |||||||||||||||||
| Other |
91.9 | 100.0 | 100.0 | 100.0 | 98.0 | |||||||||||||||||
| Total |
87.8 | % | 74.7 | 83.2 | 73.7 | 79.9 | ||||||||||||||||
| Sub-Saharan Africa/Europe fleet: |
||||||||||||||||||||||
| Deepwater |
86.3 | % | 85.5 | 85.7 | 76.5 | 83.7 | ||||||||||||||||
| Towing-supply |
75.3 | 78.5 | 78.8 | 71.5 | 76.0 | |||||||||||||||||
| Other |
78.1 | 71.3 | 73.3 | 67.2 | 72.5 | |||||||||||||||||
| Total |
79.5 | % | 77.9 | 78.7 | 71.3 | 76.9 | ||||||||||||||||
| Worldwide fleet: |
||||||||||||||||||||||
| Deepwater |
83.8 | % | 87.0 | 84.9 | 80.7 | 84.1 | ||||||||||||||||
| Towing-supply |
78.4 | 76.2 | 77.7 | 68.3 | 75.2 | |||||||||||||||||
| Other |
76.9 | 73.9 | 71.0 | 63.4 | 71.4 | |||||||||||||||||
| Total |
79.8 | % | 79.3 | 78.6 | 71.4 | 77.3 | ||||||||||||||||
|
| ||||||||||||||||||||||
49
Table of Contents
Index to Financial Statements
UTILIZATION - continued:
| Fiscal Year 2014 | First | Second | Third | Fourth | Year | |||||||||||||||||
| Americas fleet: |
||||||||||||||||||||||
| Deepwater |
77.8 | % | 72.3 | 85.3 | 83.7 | 80.0 | ||||||||||||||||
| Towing-supply |
43.2 | 49.5 | 60.9 | 59.5 | 51.9 | |||||||||||||||||
| Other |
82.2 | 91.6 | 78.0 | 78.4 | 82.6 | |||||||||||||||||
| Total |
60.1 | % | 63.9 | 73.9 | 73.2 | 67.4 | ||||||||||||||||
| Asia/Pacific fleet: |
||||||||||||||||||||||
| Deepwater |
92.7 | % | 80.1 | 77.2 | 84.7 | 83.5 | ||||||||||||||||
| Towing-supply |
64.5 | 73.0 | 70.6 | 82.7 | 71.6 | |||||||||||||||||
| Other |
100.0 | 100.0 | 100.0 | 100.0 | 100.0 | |||||||||||||||||
| Total |
72.2 | % | 75.8 | 73.6 | 84.1 | 76.0 | ||||||||||||||||
| Middle East/North Africa fleet: |
||||||||||||||||||||||
| Deepwater |
91.3 | % | 81.2 | 71.0 | 71.3 | 77.6 | ||||||||||||||||
| Towing-supply |
72.1 | 86.1 | 84.8 | 88.2 | 82.8 | |||||||||||||||||
| Other |
44.7 | 81.8 | 100.0 | 98.1 | 73.0 | |||||||||||||||||
| Total |
73.3 | % | 84.7 | 81.7 | 84.0 | 80.9 | ||||||||||||||||
| Sub-Saharan Africa/Europe fleet: |
||||||||||||||||||||||
| Deepwater |
79.3 | % | 88.8 | 83.0 | 83.1 | 83.6 | ||||||||||||||||
| Towing-supply |
67.6 | 66.8 | 73.8 | 77.9 | 71.3 | |||||||||||||||||
| Other |
70.2 | 72.5 | 76.8 | 89.2 | 77.1 | |||||||||||||||||
| Total |
71.8 | % | 75.0 | 77.3 | 83.3 | 76.7 | ||||||||||||||||
| Worldwide fleet: |
||||||||||||||||||||||
| Deepwater |
81.2 | % | 81.9 | 81.7 | 81.9 | 81.7 | ||||||||||||||||
| Towing-supply |
60.8 | 66.3 | 72.8 | 76.6 | 68.6 | |||||||||||||||||
| Other |
71.5 | 77.3 | 78.1 | 87.3 | 78.5 | |||||||||||||||||
| Total |
68.8 | % | 73.2 | 76.7 | 80.8 | 74.7 | ||||||||||||||||
|
| ||||||||||||||||||||||
| Fiscal Year 2013 | First | Second | Third | Fourth | Year | |||||||||||||||||
| Americas fleet: |
||||||||||||||||||||||
| Deepwater |
73.7 | % | 70.7 | 73.1 | 80.4 | 74.4 | ||||||||||||||||
| Towing-supply |
53.4 | 48.2 | 48.0 | 41.9 | 48.0 | |||||||||||||||||
| Other |
80.5 | 72.5 | 82.4 | 81.0 | 79.0 | |||||||||||||||||
| Total |
63.3 | % | 58.6 | 60.9 | 59.1 | 60.5 | ||||||||||||||||
| Asia/Pacific fleet: |
||||||||||||||||||||||
| Deepwater |
92.6 | % | 81.2 | 89.2 | 83.6 | 86.8 | ||||||||||||||||
| Towing-supply |
54.9 | 52.2 | 52.4 | 54.5 | 53.5 | |||||||||||||||||
| Other |
58.7 | 100.0 | 100.0 | 100.0 | 85.1 | |||||||||||||||||
| Total |
62.5 | % | 58.7 | 60.5 | 62.4 | 61.0 | ||||||||||||||||
| Middle East/North Africa fleet: |
||||||||||||||||||||||
| Deepwater |
93.6 | % | 91.8 | 89.8 | 98.6 | 93.5 | ||||||||||||||||
| Towing-supply |
77.2 | 71.2 | 80.1 | 74.7 | 75.8 | |||||||||||||||||
| Other |
42.2 | 34.5 | 28.6 | 29.3 | 33.7 | |||||||||||||||||
| Total |
75.0 | % | 69.9 | 75.1 | 73.4 | 73.3 | ||||||||||||||||
| Sub-Saharan Africa/Europe fleet: |
||||||||||||||||||||||
| Deepwater |
84.1 | % | 83.0 | 70.3 | 76.3 | 78.2 | ||||||||||||||||
| Towing-supply |
60.3 | 67.8 | 66.9 | 73.3 | 66.9 | |||||||||||||||||
| Other |
76.6 | 79.9 | 77.2 | 78.7 | 78.1 | |||||||||||||||||
| Total |
71.3 | % | 75.4 | 71.1 | 75.9 | 73.4 | ||||||||||||||||
| Worldwide fleet: |
||||||||||||||||||||||
| Deepwater |
83.1 | % | 79.8 | 75.2 | 80.6 | 79.6 | ||||||||||||||||
| Towing-supply |
60.0 | 59.9 | 61.1 | 61.2 | 60.6 | |||||||||||||||||
| Other |
74.2 | 74.7 | 74.5 | 75.2 | 74.6 | |||||||||||||||||
| Total |
68.4 | % | 67.8 | 67.5 | 69.4 | 68.3 | ||||||||||||||||
|
| ||||||||||||||||||||||
50
Table of Contents
Index to Financial Statements
| AVERAGE DAY RATES: | ||||||||||||||||||||||
| Fiscal Year 2015 | First | Second | Third | Fourth | Year | |||||||||||||||||
| Americas fleet: |
||||||||||||||||||||||
| Deepwater |
$ | 31,175 | 31,233 | 32,612 | 28,972 | 30,986 | ||||||||||||||||
| Towing-supply |
16,559 | 17,309 | 16,890 | 15,482 | 16,590 | |||||||||||||||||
| Other |
8,856 | 8,304 | 9,314 | 6,777 | 8,378 | |||||||||||||||||
| Total |
$ | 22,443 | 22,701 | 24,048 | 21,830 | 22,768 | ||||||||||||||||
| Asia/Pacific fleet: |
||||||||||||||||||||||
| Deepwater |
$ | 41,948 | 39,841 | 35,821 | 33,443 | 37,723 | ||||||||||||||||
| Towing-supply |
13,017 | 14,387 | 13,664 | 9,362 | 12,870 | |||||||||||||||||
| Other |
10,658 | 10,609 | 10,692 | 10,609 | 10,652 | |||||||||||||||||
| Total |
$ | 22,066 | 23,090 | 21,195 | 20,252 | 21,771 | ||||||||||||||||
| Middle East/North Africa fleet: |
||||||||||||||||||||||
| Deepwater |
$ | 25,081 | 23,078 | 24,586 | 22,558 | 23,816 | ||||||||||||||||
| Towing-supply |
13,366 | 14,171 | 12,870 | 12,526 | 13,242 | |||||||||||||||||
| Other |
4,742 | 4,719 | 4,723 | 4,145 | 4,581 | |||||||||||||||||
| Total |
$ | 15,502 | 16,040 | 15,918 | 15,121 | 15,650 | ||||||||||||||||
| Sub-Saharan Africa/Europe fleet: |
||||||||||||||||||||||
| Deepwater |
$ | 30,414 | 30,928 | 28,675 | 27,239 | 29,428 | ||||||||||||||||
| Towing-supply |
16,867 | 16,911 | 16,859 | 16,600 | 16,817 | |||||||||||||||||
| Other |
5,562 | 5,937 | 5,976 | 5,605 | 5,771 | |||||||||||||||||
| Total |
$ | 17,179 | 17,628 | 16,743 | 15,916 | 16,905 | ||||||||||||||||
| Worldwide fleet: |
||||||||||||||||||||||
| Deepwater |
$ | 31,061 | 31,001 | 30,205 | 27,942 | 30,074 | ||||||||||||||||
| Towing-supply |
15,261 | 15,987 | 15,401 | 14,460 | 15,307 | |||||||||||||||||
| Other |
6,306 | 6,523 | 6,598 | 5,752 | 6,316 | |||||||||||||||||
| Total |
$ | 18,701 | 19,415 | 19,024 | 17,928 | 18,792 | ||||||||||||||||
|
| ||||||||||||||||||||||
| Fiscal Year 2014 | First | Second | Third | Fourth | Year | |||||||||||||||||
| Americas fleet: |
||||||||||||||||||||||
| Deepwater |
$ | 29,786 | 31,953 | 29,779 | 31,066 | 30,629 | ||||||||||||||||
| Towing-supply |
15,161 | 15,520 | 17,247 | 16,220 | 16,010 | |||||||||||||||||
| Other |
6,965 | 7,843 | 7,320 | 7,868 | 7,502 | |||||||||||||||||
| Total |
$ | 18,977 | 19,974 | 21,169 | 21,718 | 20,482 | ||||||||||||||||
| Asia/Pacific fleet: |
||||||||||||||||||||||
| Deepwater |
$ | 39,291 | 37,812 | 33,937 | 39,072 | 37,549 | ||||||||||||||||
| Towing-supply |
13,022 | 12,430 | 12,687 | 12,383 | 12,645 | |||||||||||||||||
| Other |
10,353 | 10,300 | 10,300 | 10,661 | 10,402 | |||||||||||||||||
| Total |
$ | 20,749 | 19,184 | 19,257 | 21,550 | 20,167 | ||||||||||||||||
| Middle East/North Africa fleet: |
||||||||||||||||||||||
| Deepwater |
$ | 21,202 | 22,195 | 23,708 | 20,524 | 21,913 | ||||||||||||||||
| Towing-supply |
12,567 | 12,440 | 13,375 | 13,000 | 12,862 | |||||||||||||||||
| Other |
4,750 | 4,750 | 4,738 | 3,912 | 4,543 | |||||||||||||||||
| Total |
$ | 14,316 | 14,156 | 15,358 | 14,258 | 14,531 | ||||||||||||||||
| Sub-Saharan Africa/Europe fleet: |
||||||||||||||||||||||
| Deepwater |
$ | 27,514 | 30,244 | 28,664 | 29,158 | 28,932 | ||||||||||||||||
| Towing-supply |
15,386 | 15,737 | 15,764 | 16,542 | 15,858 | |||||||||||||||||
| Other |
4,883 | 4,779 | 5,409 | 5,392 | 5,136 | |||||||||||||||||
| Total |
$ | 15,993 | 17,206 | 15,994 | 15,917 | 16,282 | ||||||||||||||||
| Worldwide fleet: |
||||||||||||||||||||||
| Deepwater |
$ | 28,572 | 30,481 | 28,944 | 29,730 | 29,441 | ||||||||||||||||
| Towing-supply |
14,338 | 14,389 | 15,029 | 14,982 | 14,684 | |||||||||||||||||
| Other |
5,496 | 5,651 | 5,883 | 5,905 | 5,741 | |||||||||||||||||
| Total |
$ | 16,976 | 17,603 | 17,492 | 17,525 | 17,405 | ||||||||||||||||
|
| ||||||||||||||||||||||
51
Table of Contents
Index to Financial Statements
AVERAGE DAY RATES - continued:
| Fiscal Year 2013 | First | Second | Third | Fourth | Year | |||||||||||||||||
| Americas fleet: |
||||||||||||||||||||||
| Deepwater |
$ | 25,829 | 28,450 | 28,721 | 29,480 | 28,216 | ||||||||||||||||
| Towing-supply |
14,135 | 14,103 | 13,721 | 14,330 | 14,064 | |||||||||||||||||
| Other |
5,987 | 6,094 | 6,181 | 6,132 | 6,097 | |||||||||||||||||
| Total |
$ | 15,508 | 17,012 | 17,060 | 17,960 | 16,861 | ||||||||||||||||
| Asia/Pacific fleet: |
||||||||||||||||||||||
| Deepwater |
$ | 32,225 | 42,037 | 35,453 | 37,370 | 36,424 | ||||||||||||||||
| Towing-supply |
14,229 | 12,663 | 12,592 | 13,976 | 13,378 | |||||||||||||||||
| Other |
9,945 | 9,972 | 9,972 | 10,432 | 10,079 | |||||||||||||||||
| Total |
$ | 19,384 | 20,109 | 18,779 | 21,024 | 19,789 | ||||||||||||||||
| Middle East/North Africa fleet: |
||||||||||||||||||||||
| Deepwater |
$ | 18,920 | 18,359 | 20,710 | 21,259 | 19,926 | ||||||||||||||||
| Towing-supply |
9,812 | 9,857 | 12,020 | 12,689 | 11,116 | |||||||||||||||||
| Other |
5,056 | 4,812 | 4,750 | 4,628 | 4,836 | |||||||||||||||||
| Total |
$ | 11,325 | 11,561 | 13,761 | 14,583 | 12,844 | ||||||||||||||||
| Sub-Saharan Africa/Europe fleet: |
||||||||||||||||||||||
| Deepwater |
$ | 22,643 | 25,235 | 25,853 | 26,468 | 25,056 | ||||||||||||||||
| Towing-supply |
13,572 | 15,721 | 14,318 | 14,996 | 14,684 | |||||||||||||||||
| Other |
4,884 | 5,236 | 5,054 | 5,300 | 5,118 | |||||||||||||||||
| Total |
$ | 13,113 | 14,602 | 14,053 | 15,218 | 14,261 | ||||||||||||||||
| Worldwide fleet: |
||||||||||||||||||||||
| Deepwater |
$ | 24,406 | 27,102 | 27,100 | 27,782 | 26,626 | ||||||||||||||||
| Towing-supply |
13,054 | 13,705 | 13,399 | 14,207 | 13,580 | |||||||||||||||||
| Other |
5,250 | 5,496 | 5,407 | 5,573 | 5,430 | |||||||||||||||||
| Total |
$ | 14,275 | 15,384 | 15,286 | 16,378 | 15,325 | ||||||||||||||||
|
| ||||||||||||||||||||||
The day-based utilization percentages, average day rates and the average number of the company’s new vessels (defined as vessels acquired or constructed since calendar year 2000 as part of its new build and acquisition program) by vessel class and in total for each of the quarters in the years ended March 31:
| Fiscal Year 2015 | First | Second | Third | Fourth | Year | |||||||||||||||||
| UTILIZATION: | ||||||||||||||||||||||
| Deepwater |
||||||||||||||||||||||
| PSVs |
86.8 | % | 88.6 | 86.1 | 80.8 | 85.6 | ||||||||||||||||
| AHTS vessels |
83.5 | 89.0 | 83.0 | 84.7 | 85.1 | |||||||||||||||||
| Towing-supply |
84.9 | 80.8 | 80.8 | 71.7 | 79.6 | |||||||||||||||||
| Other |
76.9 | 73.6 | 72.6 | 64.7 | 72.0 | |||||||||||||||||
| Total |
83.7 | % | 82.1 | 80.9 | 73.8 | 80.1 | ||||||||||||||||
|
| ||||||||||||||||||||||
| AVERAGE VESSEL DAY RATES: | ||||||||||||||||||||||
| Deepwater |
||||||||||||||||||||||
| PSVs |
$ | 30,802 | 30,575 | 29,929 | 27,703 | 29,773 | ||||||||||||||||
| AHTS vessels |
34,116 | 34,937 | 33,375 | 30,710 | 33,315 | |||||||||||||||||
| Towing-supply |
15,519 | 16,235 | 15,647 | 14,764 | 15,568 | |||||||||||||||||
| Other |
6,706 | 6,963 | 6,925 | 5,951 | 6,660 | |||||||||||||||||
| Total |
$ | 19,627 | 20,303 | 19,765 | 18,621 | 19,605 | ||||||||||||||||
|
| ||||||||||||||||||||||
| AVERAGE VESSEL COUNT: | ||||||||||||||||||||||
| Deepwater |
||||||||||||||||||||||
| PSVs |
76 | 77 | 79 | 79 | 78 | |||||||||||||||||
| AHTS vessels |
12 | 12 | 12 | 12 | 12 | |||||||||||||||||
| Towing-supply |
105 | 105 | 105 | 105 | 105 | |||||||||||||||||
| Other |
52 | 48 | 46 | 45 | 47 | |||||||||||||||||
| Total |
245 | 242 | 242 | 241 | 242 | |||||||||||||||||
|
| ||||||||||||||||||||||
52
Table of Contents
Index to Financial Statements
| Fiscal Year 2014 | First | Second | Third | Fourth | Year | |||||||||||||||||
| UTILIZATION: | ||||||||||||||||||||||
| Deepwater |
||||||||||||||||||||||
| PSVs |
84.0 | % | 84.6 | 82.7 | 86.1 | 84.4 | ||||||||||||||||
| AHTS vessels |
95.9 | 87.9 | 95.8 | 73.9 | 88.2 | |||||||||||||||||
| Towing-supply |
81.7 | 85.7 | 85.5 | 84.4 | 84.3 | |||||||||||||||||
| Other |
73.3 | 73.2 | 81.8 | 91.8 | 80.0 | |||||||||||||||||
| Total |
81.2 | % | 82.7 | 84.3 | 86.0 | 83.6 | ||||||||||||||||
|
| ||||||||||||||||||||||
| AVERAGE VESSEL DAY RATES: | ||||||||||||||||||||||
| Deepwater |
||||||||||||||||||||||
| PSVs |
$ | 28,689 | 31,053 | 29,092 | 29,735 | 29,659 | ||||||||||||||||
| AHTS vessels |
29,561 | 28,885 | 29,141 | 31,158 | 29,628 | |||||||||||||||||
| Towing-supply |
14,595 | 14,484 | 15,144 | 15,126 | 14,840 | |||||||||||||||||
| Other |
5,843 | 5,635 | 6,036 | 6,126 | 5,924 | |||||||||||||||||
| Total |
$ | 17,955 | 18,637 | 18,209 | 18,287 | 18,275 | ||||||||||||||||
|
| ||||||||||||||||||||||
| AVERAGE VESSEL COUNT: | ||||||||||||||||||||||
| Deepwater |
||||||||||||||||||||||
| PSVs |
69 | 73 | 75 | 76 | 73 | |||||||||||||||||
| AHTS vessels |
11 | 11 | 12 | 12 | 11 | |||||||||||||||||
| Towing-supply |
103 | 103 | 104 | 105 | 104 | |||||||||||||||||
| Other |
53 | 52 | 52 | 52 | 52 | |||||||||||||||||
| Total |
236 | 239 | 243 | 245 | 240 | |||||||||||||||||
|
| ||||||||||||||||||||||
| Fiscal Year 2013 | First | Second | Third | Fourth | Year | |||||||||||||||||
| UTILIZATION: | ||||||||||||||||||||||
| Deepwater |
||||||||||||||||||||||
| PSVs |
85.9 | % | 84.6 | 78.3 | 82.9 | 82.8 | ||||||||||||||||
| AHTS vessels |
93.7 | 79.3 | 81.8 | 99.0 | 88.4 | |||||||||||||||||
| Towing-supply |
89.3 | 87.6 | 86.3 | 84.8 | 87.0 | |||||||||||||||||
| Other |
78.7 | 80.3 | 78.6 | 79.5 | 79.3 | |||||||||||||||||
| Total |
86.2 | % | 84.7 | 82.1 | 83.8 | 84.2 | ||||||||||||||||
|
| ||||||||||||||||||||||
| AVERAGE VESSEL DAY RATES: | ||||||||||||||||||||||
| Deepwater |
||||||||||||||||||||||
| PSVs |
$ | 24,062 | 27,224 | 27,223 | 27,889 | 26,652 | ||||||||||||||||
| AHTS vessels |
28,908 | 30,226 | 30,366 | 29,779 | 29,787 | |||||||||||||||||
| Towing-supply |
13,663 | 14,456 | 13,969 | 14,490 | 14,141 | |||||||||||||||||
| Other |
5,657 | 5,868 | 5,765 | 6,004 | 5,823 | |||||||||||||||||
| Total |
$ | 15,466 | 16,660 | 16,503 | 17,458 | 16,526 | ||||||||||||||||
|
| ||||||||||||||||||||||
| AVERAGE VESSEL COUNT: | ||||||||||||||||||||||
| Deepwater |
||||||||||||||||||||||
| PSVs |
55 | 57 | 62 | 67 | 60 | |||||||||||||||||
| AHTS vessels |
11 | 11 | 11 | 11 | 11 | |||||||||||||||||
| Towing-supply |
101 | 101 | 102 | 103 | 102 | |||||||||||||||||
| Other |
50 | 49 | 49 | 48 | 49 | |||||||||||||||||
| Total |
217 | 218 | 224 | 229 | 222 | |||||||||||||||||
|
| ||||||||||||||||||||||
53
Table of Contents
Index to Financial Statements
Vessel Count, Dispositions, Acquisitions and Construction Programs
The average age of the company’s 279 owned or chartered vessels (excluding joint-venture vessels and vessels withdrawn from service) in its fleet at March 31, 2015 is approximately 9.5 years. The average age of 254 newer vessels in the fleet (defined as those that have been acquired or constructed since calendar year 2000 as part of the company’s new build and acquisition program as discussed below) is 7.7 years. The remaining 25 vessels have an average age of 28.4 years. The following table compares the average number of vessels by class and geographic distribution during the fiscal years ended March 31 and the actual March 31, 2015 vessel count:
| Actual Vessel Count at March 31, |
Average Number of Vessels During Year Ended March 31, |
|||||||||||||||||
| 2015 | 2015 | 2014 | 2013 | |||||||||||||||
| Americas fleet: |
||||||||||||||||||
| Deepwater |
38 | 35 | 29 | 23 | ||||||||||||||
| Towing-supply |
29 | 30 | 38 | 50 | ||||||||||||||
| Other |
14 | 14 | 14 | 15 | ||||||||||||||
| Total |
81 | 79 | 81 | 88 | ||||||||||||||
| Less stacked vessels |
11 | 9 | 18 | 25 | ||||||||||||||
| Active vessels |
70 | 70 | 63 | 63 | ||||||||||||||
| Asia/Pacific fleet: |
||||||||||||||||||
| Deepwater |
12 | 10 | 8 | 8 | ||||||||||||||
| Towing-supply |
14 | 14 | 19 | 32 | ||||||||||||||
| Other |
1 | 1 | 1 | 1 | ||||||||||||||
| Total |
27 | 25 | 28 | 41 | ||||||||||||||
| Less stacked vessels |
1 | — | 4 | 12 | ||||||||||||||
| Active vessels |
26 | 25 | 24 | 29 | ||||||||||||||
| Middle East/North Africa fleet: |
||||||||||||||||||
| Deepwater |
14 | 12 | 11 | 8 | ||||||||||||||
| Towing-supply |
31 | 31 | 30 | 29 | ||||||||||||||
| Other |
2 | 2 | 3 | 6 | ||||||||||||||
| Total |
47 | 45 | 44 | 43 | ||||||||||||||
| Less stacked vessels |
2 | 1 | 1 | 7 | ||||||||||||||
| Active vessels |
45 | 44 | 43 | 36 | ||||||||||||||
| Sub-Saharan Africa/Europe fleet: |
||||||||||||||||||
| Deepwater |
35 | 36 | 41 | 38 | ||||||||||||||
| Towing-supply |
43 | 45 | 56 | 63 | ||||||||||||||
| Other |
46 | 47 | 49 | 48 | ||||||||||||||
| Total |
124 | 128 | 146 | 149 | ||||||||||||||
| Less stacked vessels |
7 | 6 | 9 | 17 | ||||||||||||||
| Active vessels |
117 | 122 | 137 | 132 | ||||||||||||||
| Active owned or chartered vessels |
258 | 261 | 267 | 260 | ||||||||||||||
| Stacked vessels |
21 | 16 | 32 | 61 | ||||||||||||||
| Total owned or chartered vessels |
279 | 277 | 299 | 321 | ||||||||||||||
| Vessels withdrawn from service |
— | — | 1 | 2 | ||||||||||||||
| Joint-venture and other |
10 | 11 | 10 | 10 | ||||||||||||||
| Total |
289 | 288 | 310 | 333 | ||||||||||||||
|
| ||||||||||||||||||
Owned or chartered vessels include vessels that were stacked by the company. The company considers a vessel to be stacked if the vessel crew is disembarked and limited maintenance is being performed on the vessel. The company reduces operating costs by stacking vessels when management does not foresee opportunities to profitably or strategically operate the vessels in the near future. Vessels are stacked when market conditions warrant and they are no longer considered stacked when they are returned to active service, sold or otherwise disposed. When economically practical marketing opportunities arise, the stacked vessels can be returned to service by performing any necessary maintenance on the vessel and either rehiring or returning fleet personnel to operate the vessel. Although not currently fulfilling charters, stacked vessels are considered to be in service and are included in the calculation of the company’s utilization statistics.
54
Table of Contents
Index to Financial Statements
The company had 21, 15 and 51 stacked vessels at March 31, 2015, 2014 and 2013, respectively. Most of the vessels stacked at March 31, 2015 are being marketed for sale and are not expected to return to the active fleet, primarily due to their age.
Vessels withdrawn from service are not included in the company’s utilization statistics.
Vessel Dispositions
The company seeks opportunities to sell and/or scrap its older vessels when market conditions warrant and opportunities arise. The majority of the company’s vessels are sold to buyers who do not compete with the company in the offshore energy industry. The number of vessels disposed by vessel type and segment during the fiscal years ended March 31, are as follows:
| 2015 (A) | 2014 (A) | 2013 | ||||||||||||
| Number of vessels disposed by vessel type: |
||||||||||||||
| Deepwater: |
||||||||||||||
| AHTS vessels |
1 | — | — | |||||||||||
| PSVs |
1 | 3 | 1 | |||||||||||
| Towing-supply: |
||||||||||||||
| AHTS vessels |
— | 27 | 15 | |||||||||||
| PSVs |
9 | 12 | 8 | |||||||||||
| Other |
2 | 6 | 8 | |||||||||||
| Total |
13 | 48 | 32 | |||||||||||
|
| ||||||||||||||
| Number of vessels disposed by segment: | ||||||||||||||
| Americas |
7 | 19 | 2 | |||||||||||
| Asia/Pacific |
— | 9 | 8 | |||||||||||
| Middle East/North Africa |
1 | 8 | 3 | |||||||||||
| Sub-Saharan Africa/Europe |
5 | 11 | 19 | |||||||||||
| Vessels withdrawn from service |
— | 1 | — | |||||||||||
| Total |
13 | 48 | 32 | |||||||||||
|
| ||||||||||||||
| (A) | Excluded from fiscal 2015 and 2014 vessel dispositions are 6 and 10 vessels, respectively that were sold and leased back by the company as disclosed in Note (11) of Notes to Consolidated Financial Statements included in Item 8 of this Annual Report on Form 10-K. |
Vessel and Other Deliveries and Acquisitions
The table below summarizes the number of vessels and ROVs added to the company’s fleet during the fiscal years ended March 31 by vessel class and vessel type:
| Number of vessels added |
||||||||||||||
| Vessel class and type | 2015 (A) | 2014 (B) | 2013 (C) | |||||||||||
| Deepwater: |
||||||||||||||
| AHTS vessels |
— | 1 | — | |||||||||||
| PSVs |
9 | 10 | 13 | |||||||||||
| Towing-supply: |
||||||||||||||
| AHTS vessels |
— | — | 2 | |||||||||||
| PSVs |
— | 2 | 1 | |||||||||||
| Other: |
||||||||||||||
| Crewboats |
— | 2 | 2 | |||||||||||
| Total number of vessels added to the fleet |
9 | 15 | 18 | |||||||||||
| Total remotely operated vehicles |
2 | 6 | — | |||||||||||
|
| ||||||||||||||
| (A) | Excluded from fiscal 2015 vessel deliveries and acquisitions is one deepwater class PSV that was originally sold to a third party and leased back in fiscal 2010. The company elected to repurchase this vessel from its lessor during fiscal 2015 as disclosed in Note (11) of Notes to Consolidated Financial Statements included in Item 8 of this Annual Report on Form 10-K. |
| (B) | Excluded from fiscal 2014 vessel deliveries and acquisitions are two deepwater class PSVs and six towing-supply PSVs that were originally sold to a third party and leased back in fiscal 2006 and 2010. The company elected to repurchase these vessels from the lessors during fiscal 2014 as disclosed in Note (11) of Notes to Consolidated Financial Statements included in Item 8 of this Annual Report on Form 10-K. |
| (C) | Excluded from fiscal 2013 vessel deliveries and acquisitions are two towing-supply class PSVs that were originally sold to a third party and leased back in fiscal 2006 and 2007. The company elected to repurchase these vessels from the lessors during fiscal 2013 as disclosed in Note (11) of Notes to Consolidated Financial Statements included in Item 8 of this Annual Report on Form 10-K. |
55
Table of Contents
Index to Financial Statements
Fiscal 2015. The company took delivery of nine newly-built deepwater PSVs. Two 246-foot deepwater PSVs were constructed at an international shipyard for a total aggregate cost of $34.8 million. Five 275-foot deepwater PSVs were constructed at two international shipyards for a total cost of $144.9 million. One 268-feet deepwater PSV was constructed at another international shipyard for a total cost of $38.4 million. One 261-feet deepwater PSV was constructed at a U.S. shipyard for a total cost of $49.8 million. The company also acquired two ROVs for a total cost of $12.4 million.
In addition to the 11 vessel and ROV deliveries noted above, we acquired one additional deepwater class PSV during fiscal 2015 which had been sold and leased back during fiscal 2006. The company elected to repurchase this vessel from the lessor for a total cost of $11.2 million. Please refer to the “Off-Balance Sheet Arrangements” section of Item 7 for a discussion on the company’s sale/leaseback vessels and to Note (11) of Notes to Consolidated Financial Statements included in Item 8 of this Annual Report on Form 10-K.
Fiscal 2014. The company took delivery of six newly-built vessels and acquired nine vessels from third parties. Two of the delivered vessels are deepwater PSVs, which are both 303-feet in length. The 303-feet PSVs were constructed at a U.S. shipyard for a total aggregate cost of $123.3 million. The company also took delivery of two towing-supply PSVs, of which one is 220-feet in length, and one is 217-feet in length. These two vessels were constructed at an international shipyard for a total aggregate cost of $51.4 million. The company also took delivery of two waterjet crewboats at an international shipyard for $6 million. In addition, the company acquired from third parties, two 290-feet deepwater PSVs for a total cost of $93.9 million and a 247-feet deepwater AHTS vessel for $29 million. The company also acquired a fleet of four deepwater PSVs, ranging from 280-feet to 285-feet, as a result of the Troms Offshore Supply AS acquisition. The purchase price allocated to these four vessels totals an aggregate $234.9 million. Two Troms vessel construction projects (related to a 270-foot, deepwater PSV and a 310-foot, deepwater PSVs) were also completed in fiscal 2014 for a total cost of $112.4 million. The company also acquired six ROVs for a total cost of $31.9 million.
In addition to the 21 vessels and ROV deliveries noted above, we acquired two additional deepwater class PSVs and six towing-supply class PSVs during fiscal 2014 which had been sold and leased back during fiscal 2008 and fiscal 2010. The company elected to repurchase these vessels from the lessors for an aggregate total of $78.8 million. Please refer to the “Off-Balance Sheet Arrangements” section of Item 7 for a discussion on the company’s sale/leaseback vessels and to Note (11) of Notes to Consolidated Financial Statements included in Item 8 of this Annual Report on Form 10-K.
Fiscal 2013. The company took delivery of eleven newly-built vessels and acquired seven vessels from third parties. Seven of the delivered vessels are deepwater PSVs, six of which are 286-feet in length and one is 249-feet in length. The six 286-feet PSVs were constructed at an international shipyard for a total aggregate cost of $175.9 million. The 249-feet PSV was built at a different international shipyard for $19.2 million. The company also took delivery of two towing-supply class vessels that have 8,200 brake horse power (BHP). These two vessels were constructed at an international shipyard for a total aggregate cost of $47.6 million. The company also took delivery of two waterjet crewboats that were built at an international shipyard for $6 million. In addition, the company acquired six deepwater PSVs for a total cost of $170 million (which range between 220-feet to 250-feet in length) and one towing-supply class PSV for a total cost of $13 million.
In addition to the 18 deliveries noted above, we acquired two additional towing-supply class PSVs during fiscal 2013 which were originally taken delivery of, then sold and leased back during fiscal 2006 and 2007. The company elected to repurchase these vessels from the lessors for an aggregate total of $17.2 million. Please refer to the “Off-Balance Sheet Arrangements” section of Item 7 for a discussion on the company’s sale/leaseback vessels and to Note (11) of Notes to Consolidated Financial Statements included in Item 8 of this Annual Report on Form 10-K.
56
Table of Contents
Index to Financial Statements
Vessel and Other Commitments at March 31, 2015
The table below summarizes the various commitments to acquire and construct new vessels, by vessel type, as of March 31, 2015:
| (In thousands) | Number of Vessels/ROVs |
Shipyard Location |
Delivery Dates |
Total Cost |
Amount Invested 03/31/15 |
Remaining Balance 03/31/15 |
||||||||||||||||
| Towing-supply: |
||||||||||||||||||||||
| 7,145 BHP (A) |
6 | International | 5/2015 - 7/2016 | $ | 105,804 | 79,297 | 26,507 | |||||||||||||||
| Deepwater: |
||||||||||||||||||||||
| 261-foot PSV |
6 | International | 10/2015 – 9/2016 | |||||||||||||||||||
| 268-foot PSV |
1 | International | 4/2015 | |||||||||||||||||||
| 275-foot PSV (B) |
5 | International | 5/2015 – 8/2015 | |||||||||||||||||||
| 292-foot PSV |
1 | International | 5/2016 | |||||||||||||||||||
| 300-foot PSV |
2 | United States | 9/2015, 1/2016 | |||||||||||||||||||
| 310-foot PSV |
2 | United States | 11/2015, 2/2016 | |||||||||||||||||||
| Total Deepwater PSVs |
17 | 576,847 | 223,301 | 353,546 | ||||||||||||||||||
| Other: |
||||||||||||||||||||||
| Fast supply boat |
1 | International | — | 8,014 | 8,014 | — | ||||||||||||||||
| Total commitments |
24 | $ | 690,665 | 310,612 | 380,053 | |||||||||||||||||
|
| ||||||||||||||||||||||
| (A) | In April 2015, the company cancelled the construction contracts for three towing-supply vessels. The accumulated carrying value of costs incurred through March 31, 2015 and the remaining costs to be incurred on these three vessels at the time of termination was approximately $40 million and $13 million, respectively. |
| (B) | Two different international shipyards are constructing three and two 275-foot PSVs, respectively. In May 2015, the company and the Chinese shipyard that is constructing two 275-foot deepwater PSVs came to an agreement that provides the company an option to take delivery of one or both vessels at any time prior to June 30, 2016, or receive the return of installments aggregating $5.7 million per vessel at the end of this period. The agreement requires the shipyard to maintain/extend the Bank of China refundment guarantees that secure the return of milestone payments made to date. The accumulated carrying value of costs incurred through March 31, 2015 and the remaining costs to be incurred on these two vessels at time of the agreement was approximately $14 million and $41 million, respectively. |
On April 23, 2015, the company notified the international shipyard constructing the six 7,145 BHP towing-supply-class vessels that it was terminating the first three of the six towing-supply vessels as a result of late delivery and requested the return of $36.1 million in aggregate installment payments together with interest on these installments, or all but approximately $1 million of the carrying value of the accumulated costs through March 31, 2015. In May 2015, the company made a demand on the Bank of China refundment guarantees that secure the return of these installments. It is uncertain whether this shipyard or the Bank of China will contest the return of these installments. There was an aggregate $12.7 million in estimated remaining costs to be incurred on these three vessels at the time of the termination.
After March 31, 2015, the company entered into negotiations with the Chinese shipyard constructing two of the 275-foot deepwater PSVs to resolve issues associated with the delivery of these vessels. In May 2015, the parties settled these issues to their mutual satisfaction. (While the settlement is subject to the issuance by the Bank of China of modified refundment guarantees, the company believes this condition will likely be satisfied.) Under the terms of the settlement, the company can elect to take delivery of one or both completed vessels at any time prior to June 30, 2016. That date is subject to two six month extension periods, each extension requiring the mutual consent of the company and shipyard. If the company does not elect to take delivery of one or both vessels prior to June 30, 2016 (as that date may be extended), (a) the company is entitled to receive the return of $5.4 million in aggregate installment payments per vessel together with interest on these installments (or all but approximately $1.0 million of the company’s carrying value of the accumulated costs per vessel through March 31, 2015) and (b) the company will be relieved of the obligation to pay to the shipyard the $21.7 million remaining payment per vessel. The shipyard’s obligation to return the $5.4 million (plus interest) per vessel if the company elects not to take delivery of one or both vessels will continue to be secured by Bank of China refundment guarantees.
Currently the company is experiencing substantial delay with one fast supply boat under construction in Brazil that was originally scheduled to be delivered in September 2009. On April 5, 2011, pursuant to the vessel construction contract, the company sent the subject shipyard a letter initiating arbitration in order to resolve disputes of such matters as the shipyard’s failure to achieve payment milestones, its failure to follow the construction schedule, and its failure to timely deliver the vessel. The company has suspended construction on
57
Table of Contents
Index to Financial Statements
the vessel and both parties continue to pursue that arbitration. The company has third party credit support in the form of insurance coverage for 90% of the progress payments made on this vessel, or all but approximately $2.4 million of the carrying value of the accumulated costs through March 31, 2015. The company had committed and invested $8 million as of March 31, 2015.
In December 2013, the company took delivery of the second of two deepwater PSVs constructed in a U.S. shipyard. In connection with the delivery of those vessels, the company and the shipyard agreed to hold $11.7 million in escrow with a financial institution pending resolution of disputes over whether all or a portion of those funds are due to the shipyard as the shipyard has claimed. In October 2014, the parties resolved their pending disputes subject to a confidentiality provision and agreed on the split of the funds held in escrow. The amounts returned from the escrow to the company resulted in a reduction in the cost of the two acquired vessels, one of which was subsequently sold to an unaffiliated financial institution in connection with a sale/lease transaction that closed in the third quarter of fiscal 2014. The portion of the returned funds attributed to the vessel that was sold was recorded as a deferred gain that is being amortized over the 10-year lease term.
Vessel Commitments Summary at March 31, 2015
The table below summarizes by vessel class and vessel type the number of vessels that were expected to be delivered by quarter along with the expected cash outlay (in thousands) of the various vessel commitments as discussed above:
| Quarter Period Ended | ||||||||||||||||||||||||||
| Vessel class and type | 06/15 | 09/15 | 12/15 | 03/16 | 06/16 | Thereafter | ||||||||||||||||||||
| Deepwater PSVs (A) |
4 | 3 | 3 | 3 | 2 | 2 | ||||||||||||||||||||
| Towing-supply vessels (A) |
1 | 1 | 1 | 1 | 1 | 1 | ||||||||||||||||||||
| Other |
— | — | — | — | — | 1 | ||||||||||||||||||||
| Totals |
5 | 4 | 4 | 4 | 3 | 4 | ||||||||||||||||||||
|
| ||||||||||||||||||||||||||
| (In thousands) |
||||||||||||||||||||||||||
| Expected quarterly cash outlay |
$ | 179,583 | 81,076 | 32,522 | 23,791 | 48,123 | 14,958 | (B) | ||||||||||||||||||
|
| ||||||||||||||||||||||||||
| (A) | In April 2015, the company cancelled the construction contracts for three towing-supply vessels. There were approximately $13 million of remaining costs to be incurred on these three vessels at the time of termination. In May 2015, the company and the Chinese shipyard that is constructing two 275-foot deepwater PSVs came to an agreement that provides the company an option to take delivery of one or both vessels at any time prior to June 30, 2016 or receive the return of installments aggregating $5.7 million per vessel at the end of this period. There were approximately $41 million of remaining costs to be incurred on these two vessels at the time of the agreement. |
| (B) | The $15 million of ‘Thereafter’ vessel construction obligations are expected to be paid out during the remaining quarters of fiscal 2017. |
The company believes it has sufficient liquidity and financial capacity to support the continued investment in new vessels, assuming customer demand, acquisition and shipyard economics and other considerations justify such an investment. In recent years, the company has funded vessel additions with available cash, operating cash flow, proceeds from the disposition of (generally older) vessels, revolving bank credit facility borrowings, a bank term loan, various leasing arrangements, and funds provided by the sale of senior unsecured notes as disclosed in Note (5) of Notes to Consolidated Financial Statements included in Item 8 of this Annual Report on Form 10-K. The company has $380.1 million in unfunded capital commitments associated with the 24 vessels currently under construction at March 31, 2015.
General and Administrative Expenses
Consolidated general and administrative expenses and its related percentage of total revenues for the years ended March 31 consist of the following components:
| (In thousands) | 2015 | % | 2014 | % | 2013 | % | ||||||||||||||||||||
| Personnel |
$ | 115,450 | 8 | % | 109,943 | 8% | 109,058 | 9% | ||||||||||||||||||
| Office and property |
29,219 | 2 | % | 27,121 | 2% | 26,270 | 2% | |||||||||||||||||||
| Sales and marketing |
11,839 | 1 | % | 11,645 | 1% | 9,819 | 1% | |||||||||||||||||||
| Professional services |
20,381 | 1 | % | 29,035 | 1% | 19,510 | 1% | |||||||||||||||||||
| Other |
12,930 | 1 | % | 10,232 | 1% | 10,952 | 1% | |||||||||||||||||||
| $ | 189,819 | 13 | % | 187,976 | 13% | 175,609 | 14% | |||||||||||||||||||
|
| ||||||||||||||||||||||||||
58
Table of Contents
Index to Financial Statements
Segment and corporate general and administrative expenses and the related percentage of total general and administrative expenses for the years ended March 31 were as follows:
| (In thousands) | 2015 | % | 2014 | % | 2013 | % | ||||||||||||||||||||
| Vessel operations |
$ | 144,495 | 76 | % | 137,741 | 74% | 124,132 | 71% | ||||||||||||||||||
| Other operating activities |
4,703 | 2 | % | 2,532 | 1% | 2,773 | 1% | |||||||||||||||||||
| Corporate |
40,621 | 22 | % | 47,703 | 25 | % | 48,704 | 28% | ||||||||||||||||||
| $ | 189,819 | 100 | % | 187,976 | 100% | 175,609 | 100% | |||||||||||||||||||
|
| ||||||||||||||||||||||||||
General and administrative expenses were higher by approximately 1%, or $1.8 million, during fiscal 2015 as compared to fiscal 2014. Increases in administrative payroll, other general and administrative costs and office and property costs of $5.5 million, $2.7 million and $2.1 million respectively, were partially offset by decreases in professional services of $8.7 million. Incremental increases in personnel, office and property, other and sales and marketing costs are primarily related to the ramp up of shore-based personnel to support the company’s subsea operations and vessel operations in the Americas and Middle East/North Africa regions and the inclusion of Troms’ administrative related costs for a full year versus ten months in fiscal 2014. Additionally, professional services costs were higher during fiscal 2014 year due to legal fees associated with arbitration activities related to our historical operations in Venezuela, the administration of a subsidiary company based in the United Kingdom and transaction costs related to the acquisition of Troms offshore.
General and administrative expenses were higher by approximately 7%, or $12.4 million, during fiscal 2014 as compared to fiscal 2013, primarily due to increases in professional services costs of 49%, or $9.5 million, which were related the acquisition of Troms Offshore, arbitration activities related to our historical operations in Venezuela, and legal fees associated with the placing into administration of a subsidiary company based in the United Kingdom.
Liquidity, Capital Resources and Other Matters
The company’s current ratio, level of working capital and amount of cash flows from operations for any year are primarily related to fleet activity, vessel day rates and the timing of collections and disbursements. Vessel activity levels and vessel day rates are, among other things, dependent upon the supply/demand relationship for offshore support vessels, which tend to follow the level of oil and natural gas exploration and production. Variations from year-to-year in these items are primarily the result of market conditions.
Availability of Cash
At March 31, 2015, the company had $78.6 million in cash and cash equivalents, of which $57.1 million was held by foreign subsidiaries. The company currently intends that earnings by foreign subsidiaries will be indefinitely reinvested in foreign jurisdictions in order to fund strategic initiatives (such as investment, expansion and acquisitions), fund working capital requirements and repay debt (both third-party and intercompany) of its foreign subsidiaries in the normal course of business. Moreover, the company does not currently intend to repatriate earnings of foreign subsidiaries to the United States because cash generated from the company’s domestic businesses and credit available under its domestic financing facilities, as well as the repayment of intercompany receivables due from foreign subsidiaries, are currently sufficient (and are expected to continue to be sufficient for the foreseeable future) to fund the cash needs of its operations in the United States including continuing to pay the quarterly dividend. However, if, in the future, cash and cash equivalents held by foreign subsidiaries are needed to fund the company’s operations in the United States, the repatriation of such amounts to the United States could result in a significant incremental tax liability in the period in which the decision to repatriate occurs. Payment of any incremental tax liability would reduce the cash available to the company to fund its operations by the amount of taxes paid.
Our objective in financing our business is to maintain adequate financial resources and access to sufficient levels of liquidity. Cash and cash equivalents, future net cash provided by operating activities and the company’s credit facilities provide the company, in our opinion, with sufficient liquidity to meet our near and longer term requirements, including payments on vessel construction currently in progress and payments required to be made in connection with current vessel purchase commitments.
59
Table of Contents
Index to Financial Statements
Indebtedness
Revolving Credit and Term Loan Agreement
In May 2015, the company amended and extended its existing credit facility. The amended credit agreement matures in June 2019 (the “Maturity Date”) and provides for a $900 million, five-year credit facility (“credit facility”) consisting of a (i) $600 million revolving credit facility (the “revolver”) and a (ii) $300 million term loan facility (“term loan”).
In June 2013, the company amended and extended its existing credit facility. The amended credit agreement matures in June 2018 and provides for a $900 million, five-year credit facility consisting of a (i) $600 million revolving credit facility and a (ii) $300 million term loan facility (“term loan”).
Borrowings under the credit facility are unsecured and bear interest at the company’s option at (i) the greater of prime or the federal funds rate plus 0.25 to 1.00%, or (ii) Eurodollar rates, plus margins ranging from 1.25 to 2.00% based on the company’s consolidated funded debt to capitalization ratio. Commitment fees on the unused portion of the facilities range from 0.15 to 0.30% based on the company’s funded debt to total capitalization ratio. The credit facility requires that the company maintain a ratio of consolidated debt to consolidated total capitalization that does not exceed 55%, and maintain a consolidated interest coverage ratio (essentially consolidated earnings before interest, taxes, depreciation and amortization, or EBITDA, for the four prior fiscal quarters to consolidated interest charges, including capitalized interest, for such period) of not less than 3.0 to 1.0. All other terms, including the financial and negative covenants, are customary for facilities of its type and consistent with the prior agreement in all material respects.
The company had $300 million in term loan borrowings and $20 million of revolver borrowings outstanding at March 31, 2015 (whose fair value approximates the carrying value because the borrowings bear interest at variable rates). The company had $580 million available under the revolver at March 31, 2015.
Senior Debt Notes
The determination of fair value includes an estimated credit spread between our long term debt and treasuries with similar matching expirations. The credit spread is determined based on comparable publicly traded companies in the oilfield service segment with similar credit ratings. These estimated fair values are based on Level 2 inputs.
September 2013 Senior Notes
On September 30, 2013, the company executed a note purchase agreement for $500 million and issued $300 million of senior unsecured notes to a group of institutional investors. The company issued the remaining $200 million of senior unsecured notes on November 15, 2013. A summary of these outstanding notes at March 31, is as follows:
| (In thousands, except weighted average data) | 2015 | 2014 | ||||||
| Aggregate debt outstanding |
$ | 500,000 | 500,000 | |||||
| Weighted average remaining life in years |
8.4 | 9.4 | ||||||
| Weighted average coupon rate on notes outstanding |
4.86 | % | 4.86 | % | ||||
| Fair value of debt outstanding |
516,879 | 520,979 |
The multiple series of notes totaling $500 million were issued with maturities ranging from approximately seven to 12 years. The notes may be retired before their respective scheduled maturity dates subject only to a customary make-whole provision. The terms of the notes require that the company maintain a ratio of consolidated debt to consolidated total capitalization that does not exceed 55% and maintain a ratio of consolidated EBITDA to consolidated interest charges, including capitalized interest, of not less than 3.0 to 1.0.
60
Table of Contents
Index to Financial Statements
August 2011 Senior Notes
On August 15, 2011, the company issued $165 million of senior unsecured notes to a group of institutional investors. A summary of these outstanding notes at March 31, is as follows:
| (In thousands, except weighted average data) | 2015 | 2014 | ||||||||
| Aggregate debt outstanding |
$ | 165,000 | 165,000 | |||||||
| Weighted average remaining life in years |
5.6 | 6.6 | ||||||||
| Weighted average coupon rate on notes outstanding |
4.42 | % | 4.42 | % | ||||||
| Fair value of debt outstanding |
167,910 | 168,653 | ||||||||
The multiple series of notes were originally issued with maturities ranging from approximately eight to 10 years. The notes may be retired before their respective scheduled maturity dates subject only to a customary make-whole provision. The terms of the notes require that the company maintain a ratio of consolidated debt to consolidated total capitalization that does not exceed 55%.
September 2010 Senior Notes
In fiscal 2011, the company completed the sale of $425 million of senior unsecured notes. A summary of the aggregate amount of these outstanding notes at March 31, is as follows:
| (In thousands, except weighted average data) | 2015 | 2014 | ||||||||
| Aggregate debt outstanding |
$ | 425,000 | 425,000 | |||||||
| Weighted average remaining life in years |
4.6 | 5.6 | ||||||||
| Weighted average coupon rate on notes outstanding |
4.25 | % | 4.25 | % | ||||||
| Fair value of debt outstanding |
431,296 | 436,254 | ||||||||
The multiple series of these notes were originally issued with maturities ranging from five to 12 years. The notes may be retired before their respective scheduled maturity dates subject only to a customary make-whole provision. The terms of the notes require that the company maintain a ratio of consolidated debt to consolidated total capitalization that does not exceed 55%.
Included in accumulated other comprehensive income at March 31, 2015 and 2014, is an after-tax loss of $1.8 million ($2.6 million pre-tax), and $2.4 million ($3.7 million pre-tax), respectively, relating to the purchase of interest rate hedges, which are cash flow hedges, in July 2010 in connection with the September 2010 senior notes offering. The interest rate hedges settled in August 2010 concurrent with the pricing of the senior unsecured notes. The hedges met the effectiveness criteria and their acquisition costs are being amortized to interest expense over the term of the individual notes matching the term of the hedges to interest expense.
Notes totaling $42.5 million will mature in December 2015 but are not classified as current maturities of long-term debt because the company has the ability, if necessary, to fund this maturity with borrowings under its credit facility.
July 2003 Senior Notes
In July 2003, the company completed the sale of $300 million of senior unsecured notes. A summary of the aggregate amount of these outstanding notes at March 31, is as follows:
| (In thousands, except weighted average data) | 2015 | 2014 | ||||||||
| Aggregate debt outstanding |
$ | 35,000 | 35,000 | |||||||
| Weighted average remaining life in years |
0.3 | 1.3 | ||||||||
| Weighted average coupon rate on notes outstanding |
4.61 | % | 4.61 | % | ||||||
| Fair value of debt outstanding |
35,197 | 36,018 | ||||||||
61
Table of Contents
Index to Financial Statements
The multiple series of notes were originally issued with maturities ranging from seven to 12 years. These notes can be retired in whole or in part prior to maturity for a redemption price equal to the principal amount of the notes redeemed plus a customary make-whole premium. The terms of the notes require that the company maintain a ratio of consolidated debt to consolidated total capitalization that does not exceed 55%.
Notes totaling $35 million will mature in July 2015 but are not classified as current maturities of long-term debt because the company has the ability, if necessary, to fund this maturity with borrowings under its credit facility.
Troms Offshore Debt
In May 2015, Troms Offshore entered into a $31.3 million, U.S. dollar denominated, 12 year unsecured borrowing agreement which matures in April 2027 and is secured by a company guarantee. The loan requires semi-annual principal payments of $1.3 million (plus accrued interest) and bears interest at a fixed rate of 2.92% plus a premium based on Tidewater Inc.’s consolidated funded indebtedness to total capitalization ratio (currently equal to 1.30% for total rate of 4.22%).
In March 2015, Troms Offshore entered into a $29.5 million, 12 year unsecured borrowing agreement which matures in January 2027 and is secured by a company guarantee. The loan requires semi-annual principal payments of $1.2 million (plus accrued interest) and bears interest at a fixed rate of 2.91% plus a premium based on Tidewater Inc.’s consolidated funded indebtedness to total capitalization ratio (currently equal to 1.30% for a total all-in rate of 4.21%). As of March 31, 2015, $29.5 million is outstanding under this agreement.
In January 2014, Troms Offshore entered into a 300 million NOK, 12 year unsecured borrowing agreement which matures in January 2026 and is secured by a company guarantee. The loan requires semi-annual principal payments of 12.5 million NOK (plus accrued interest) and bears interest at a fixed rate of 2.31% plus a premium based on Tidewater Inc.’s consolidated funded indebtedness to total capitalization ratio (currently equal to 1.50% for a total all-in rate of 3.81%). As of March 31, 2015, 275 million NOK (approximately $34.2 million) is outstanding under this agreement.
In May 2012, Troms Offshore entered into a 204.4 million NOK denominated borrowing agreement which matures in May 2024. The loan requires semi-annual principal payments of 8.5 million NOK (plus accrued interest), bears interest at a fixed rate of 6.38% and is secured by certain guarantees and various types of collateral, including a vessel. In January 2014, the loan was amended to, among other things, change the interest rate to a fixed rate equal to 3.88% plus a premium based on Tidewater’s funded indebtedness to capitalization ratio (currently equal to 1.50% for a total all-in rate of 5.38%), change the borrower, change the export creditor guarantor, and to replace the vessel security with a company guarantee. As of March 31, 2015, 161.9 million NOK (approximately $20.2 million) is outstanding under this agreement.
In May 2012, Troms Offshore entered into a 35 million NOK denominated borrowing agreement with a shipyard which had one payment of 15 million NOK repaid in May 2014 and the remaining 20 million NOK maturity will be repaid in May 2015. In June 2013, Troms Offshore entered into a 25 million NOK denominated borrowing agreement a Norwegian Bank, which matures in June 2019. These borrowings bear interest based on three month NIBOR plus a credit spread of 2.0% to 3.5%. As of March 31, 2015 45 million NOK (approximately $5.6 million) is outstanding under these agreements.
Troms Offshore had 45 million NOK, or approximately $5.6 million, outstanding in floating rate debt at March 31, 2015 (whose fair value approximates the carrying value because the borrowings bear interest at variable NIBOR rates plus a margin). Troms Offshore also had 436.9 million NOK, or $54.4 million, of outstanding fixed rate debt at March 31, 2015, which has an estimated fair value of 435 million NOK, or $54.1 million as well as $29.5 million, of U.S. dollar denominated outstanding fixed rate debt at March 31, 2015, which has an estimated fair value of $29.5 million. These estimated fair values are based on Level 2 inputs.
In June 2013, Troms Offshore repaid a 188.9 million NOK loan (approximately $32.5 million), plus accrued interest that was secured with various guarantees and collateral, including a vessel.
62
Table of Contents
Index to Financial Statements
During the second quarter of fiscal 2014, the company repaid prior to maturity 500 million Norwegian Kroner (NOK) denominated (approximately $82.1 million) public bonds (plus accrued interest) that had been issued by Troms Offshore in April 2013. The repayment of these bonds, at an average price of approximately 105.0% of par value, resulted in the recognition of a loss on early extinguishment of debt of approximately 26 million NOK (approximately $4.1 million).
For additional disclosure regarding the company’s debt, refer to Note 5 of Notes to Consolidated Financial Statements included in Item 8 of this Annual Report on Form 10-K.
Interest and Debt Costs
The company capitalizes a portion of its interest costs incurred on borrowed funds used to construct vessels. Interest and debt costs incurred, net of interest capitalized, for the years ended March 31, are as follows:
| (In thousands) | 2015 | 2014 | 2013 | |||||||||||
| Interest and debt costs incurred, net of interest capitalized |
$ | 50,029 | 43,814 | 29,745 | ||||||||||
| Interest costs capitalized |
13,673 | 11,497 | 10,602 | |||||||||||
| Total interest and debt costs |
$ | 63,702 | 55,311 | 40,347 | ||||||||||
|
| ||||||||||||||
Total interest and debt costs incurred during fiscal 2015 were higher than those incurred during fiscal 2014 due primarily to a full fiscal year of interest charges related to the 300 million NOK borrowing agreement which was funded in January of 2014 and increased revolver borrowings during fiscal 2015.
Total interest and debt costs incurred during fiscal 2014 were higher than those incurred during fiscal 2013 due to the issuance of $500 million senior notes during fiscal 2014, the inheritance of Norwegian Kroner denominated debt obligations owed by Troms Offshore when it was acquired by the company in June 2013, the funding of approximately $50 million in additional NOK denominated notes in January 2014, and higher commitment fees on the unused portion of the company’s credit facilities.
Share Repurchases
Please refer to Item 5, Market for the Registrant’s Common Equity, Related Stockholder Matters and Issuer Purchases of Equity Securities, of this Annual Report on Form 10-K for a discussion of the company’s share repurchase programs for the years ended March 31, 2015, 2014 and 2013.
Dividends
Please refer to Item 5, Market for the Registrant’s Common Equity, Related Stockholder Matters and Issuer Purchases of Equity Securities, of this Annual Report on Form 10-K for a discussion of the company’s dividends declared for the years ended March 31, 2015, 2014 and 2013.
Operating Activities
Net cash provided by operating activities for any period will fluctuate according to the level of business activity for the applicable period.
Net cash provided by operating activities for the years ended March 31, is as follows:
| (In thousands) | 2015 | Change | 2014 | Change | 2013 | |||||||||||||||||
| Net earnings |
$ (65,349) | (205,604 | ) | 140,255 | (10,495 | ) | 150,750 | |||||||||||||||
| Depreciation and amortization |
175,204 | 7,724 | 167,480 | 20,181 | 147,299 | |||||||||||||||||
| Benefit for deferred income taxes |
(72,389 | ) | (37,680 | ) | (34,709 | ) | (22,976 | ) | (11,733 | ) | ||||||||||||
| Gain on asset dispositions, net |
(9,271 | ) | 2,451 | (11,722 | ) | (5,113 | ) | (6,609 | ) | |||||||||||||
| Goodwill impairment |
283,699 | 227,416 | 56,283 | 56,283 | — | |||||||||||||||||
| Changes in operating assets and liabilities |
(83,011 | ) | (127,174 | ) | 44,163 | 73,038 | (28,875 | ) | ||||||||||||||
| Changes in due to/from affiliate, net |
108,588 | 369,263 | (260,675 | ) | (204,598 | ) | (56,077 | ) | ||||||||||||||
| Other non-cash items |
21,242 | 17,700 | 3,542 | (15,626 | ) | 19,168 | ||||||||||||||||
| Net cash provided by operating activities |
$ 358,713 | 254,096 | 104,617 | (109,306 | ) | 213,923 | ||||||||||||||||
|
| ||||||||||||||||||||||
63
Table of Contents
Index to Financial Statements
Cash flows from operations increased $254.1 million, or 243%, to $358.7 million, during fiscal 2015 as compared to $104.6 million during fiscal 2014, due primarily to a reversal of the significant growth during fiscal 2014 to a decrease during fiscal 2015 in the net due to/from affiliate balance. These increases were partially offset by a $127.2 million decrease in cash flow from changes in operating assets and liabilities (primarily due to the increase in trade receivables of $43.5 million and the decrease in accounts payable and accrued expenses of $34.4 million), and a decrease in the benefit for deferred income taxes. The decrease in due to/from affiliate is attributable to improved collections from our Angolan operation and growth in the due to affiliate balance, which is included within our Sub-Saharan Africa/Europe segment. For additional disclosure regarding the Sonatide Joint Venture, refer to Part 1, Item 1, of this Annual Report on Form 10-K.
Cash flows from operations decreased $109.3 million, or 51%, to $104.6 million, during fiscal 2014 as compared to $213.9 million during fiscal 2013, due primarily to changes in net operating assets and liabilities; most significantly, an increase in net amounts due from affiliate of $260.7 million. This increase in net amounts due from affiliates for the period ending March 31, 2014, is attributable to our Angolan operation, which is included within our Sub-Saharan Africa/Europe segment. Changes in local laws in Angola have resulted in key customers making payments for goods and services into local bank accounts of an unconsolidated affiliate beginning in the third quarter of fiscal 2013 and the deferral of our billing certain customers for vessel charters beginning in the second quarter of fiscal 2014. For additional disclosure regarding the Sonatide Joint Venture, refer to Part 1, Item 1, of this Annual Report on Form 10-K.
Investing Activities
Net cash used in investing activities for the years ended March 31, is as follows:
| (In thousands) | 2015 | Change | 2014 | Change | 2013 | |||||||||||||||||
| Proceeds from sales of assets |
$ 8,310 | (43,020 | ) | 51,330 | 24,052 | 27,278 | ||||||||||||||||
| Proceeds from sale/leaseback of assets |
123,950 | (146,625 | ) | 270,575 | 270,575 | — | ||||||||||||||||
| Additions to properties and equipment |
(364,194 | ) | 230,501 | (594,695 | ) | (154,123 | ) | (440,572 | ) | |||||||||||||
| Payments for acquisition, net of cash acquired |
— | 127,737 | (127,737 | ) | (127,737 | ) | — | |||||||||||||||
| Other |
516 | 3,674 | (3,158 | ) | (2,965 | ) | (193 | ) | ||||||||||||||
| Net cash used in investing activities |
$ (231,418 | ) | 172,267 | (403,685 | ) | 9,802 | (413,487 | ) | ||||||||||||||
|
| ||||||||||||||||||||||
Investing activities for fiscal 2015 used $231.4 million of cash, which is primarily attributed to $364.2 million of additions to properties and equipment partially offset by $124 million in proceeds from the sale/leaseback of vessels. Additions to properties and equipment included $17.9 million in capitalized upgrades to existing vessels and equipment, $326.3 million for the construction and purchase of offshore support vessels, $14.4 million for ROV’s, and $5.6 million in other properties and equipment purchases.
Investing activities for fiscal 2014 used $403.7 million of cash, which is primarily attributed to $594.7 million of additions to properties and equipment as well as $127.7 million used in the Troms Offshore acquisition partially offset by $270.6 million in proceeds from the sale/leaseback of vessels. Additions to properties and equipment included $33.2 million in capitalized upgrades to existing vessels and equipment, $523 million, for the construction and purchase of offshore support vessels (including $62.7 million for the repurchase of vessels under lease agreements), $32.2 million for ROV’s, and $6.3 million in other properties and equipment purchases.
Investing activities in fiscal 2013 used $413.5 million of cash, which is attributed to $440.6 million of additions to properties and equipment, partially offset by $27.3 million in proceeds from the sales of assets. Additions to properties and equipment were comprised of $38.3 million in capitalized upgrades to existing vessels and equipment, $400.5 million for the construction and purchase of offshore marine vessels, including $17.8 million for the repurchase of vessels under lease agreements, and $1.8 million in other properties and equipment purchases.
64
Table of Contents
Index to Financial Statements
Financing Activities
Net cash provided by (used in) financing activities for the years ended March 31, is as follows:
| (In thousands) | 2015 | Change | 2014 | Change | 2013 | |||||||||||||||||
| Principal payments on debt |
$ | (97,823 | ) | 1,005,231 | (1,103,054 | ) | (1,043,054 | ) | (60,000 | ) | ||||||||||||
| Debt borrowings |
138,488 | (1,326,874 | ) | 1,465,362 | 1,355,362 | 110,000 | ||||||||||||||||
| Debt issuance costs |
(556 | ) | 4,791 | (5,347 | ) | (5,296 | ) | (51 | ) | |||||||||||||
| Proceeds from exercise of stock options |
1,023 | (5,840 | ) | 6,863 | 3,045 | 3,818 | ||||||||||||||||
| Cash dividends |
(48,834 | ) | 982 | (49,816 | ) | (228 | ) | (49,588 | ) | |||||||||||||
| Excess tax (liability) benefit on stock options exercised |
(1,784 | ) | (2,083 | ) | 299 | 21 | 278 | |||||||||||||||
| Cash received from noncontrolling interests, net |
399 | (4,152 | ) | 4,551 | 4,551 | — | ||||||||||||||||
| Stock repurchases |
(99,999 | ) | (99,999 | ) | — | 85,034 | (85,034 | ) | ||||||||||||||
| Net cash (used in) provided by financing activities |
$ | (109,086 | ) | (427,944 | ) | 318,858 | 399,435 | (80,577 | ) | |||||||||||||
|
| ||||||||||||||||||||||
Financing activities for fiscal 2015 used $109.1 million of cash, which included $97.8 million used to repay debt, $48.8 million used for the quarterly payment of common stock dividends of $0.25 per common share, and $100 million used to repurchase the company’s common stock. These uses of cash in financing activities were partially offset by an increase in debt borrowings of $138.5 million, which in part, was used to fund vessel and ROV construction and purchase commitments, to pay the quarterly common stock dividends, and to repurchase the company’s common stock.
Financing activities for fiscal 2014 provided $318.9 million of cash, primarily from $362.3 million in net debt financings, which include $500 million of funding from the September 2013 senior notes, a $175 million increase in a bank term loan and $50 million of NOK denominated debt related to a Troms Offshore vessel delivery. The additional debt was used to fund the Troms Offshore acquisition, to repay $140 million of 2003 senior notes, to repay $114.6 million of Troms Offshore debt obligations, to fund vessel and ROV construction and purchase commitments, to pay $49.8 million of quarterly common stock dividends of $0.25 per common share and to fund the increase in working capital caused by our Angolan operations. Refer to Item 1 of this Annual Report on Form 10-K for a greater discussion of the company’s Angolan operations.
Fiscal 2013 financing activities used $80.6 million of cash, which included $60 million used to repay debt, $49.6 million used for the quarterly payment of common stock dividends of $0.25 per common share, and $85 million used to repurchase the company’s common stock. These uses of cash were partially offset by $110 million of bank line of credit borrowings, and $3.8 million of proceeds from the issuance of common stock resulting from stock option exercises.
Other Liquidity Matters
At March 31, 2015, the company had approximately $78.6 million of cash and cash equivalents, of which $57.1 million was held by foreign subsidiaries and is not expected to be repatriated. In addition, there was $580 million of committed credit facilities available to the company at March 31, 2015.
Vessel Construction. With its commitment to modernizing its fleet through its vessel construction and acquisition program over the past decade, the company has successfully replaced the vast majority of the older vessels in its fleet with fewer, larger and more efficient vessels that have a more extensive range of capabilities. These efforts are expected to continue through the delivery of the 24 vessels currently under construction, with the company anticipating that it will use some portion of its future operating cash flows and existing borrowing capacity as well as possible new borrowings or lease finance arrangements in order to fund current and future commitments in connection with the completion of the fleet renewal and modernization program. The company continues to evaluate its fleet renewal program, whether through new construction or acquisitions, relative to other investment opportunities and uses of cash, including the current share repurchase authorization, and in the context of current conditions in the E&P industry as well as credit and capital markets.
On April 23, 2015, the company notified the international shipyard constructing the six 7,145 BHP towing-supply-class vessels that it was terminating the first three of the six towing-supply vessels as a result of late delivery and requested the return of $36.1 million in aggregate installment payments together with interest on these installments, or all but approximately $1.5 million of the carrying value of the accumulated costs through March 31, 2015. In May 2015, the company made a demand on the Bank of China refundment guarantees that
65
Table of Contents
Index to Financial Statements
secure the return of these installments. It is uncertain whether this shipyard or the Bank of China will contest the return of these installments. There was an aggregate $12.7 million in estimated remaining costs to be incurred on these three vessels at the time of the termination.
After March 31, 2015, the company entered into negotiations with the Chinese shipyard constructing two of the 275-foot deepwater PSVs to resolve issues associated with the delivery of these vessels. In May 2015, the parties settled these issues to their mutual satisfaction. (While the settlement is subject to the issuance by the Bank of China of modified refundment guarantees, the company believes this condition will likely be satisfied.) Under the terms of the settlement, the company can elect to take delivery of one or both completed vessels at any time prior to June 30, 2016. That date is subject to two six month extension periods, each extension requiring the mutual consent of the company and shipyard. If the company does not elect to take delivery of one or both vessels prior to June 30, 2016 (as that date may be extended), (a) the company is entitled to receive the return of $5.4 million in aggregate installment payments per vessel together with interest on these installments (or all but approximately $1 million of the company’s carrying value of the accumulated costs per vessel through March 31, 2015) and (b) the company will be relieved of the obligation to pay to the shipyard the $21.7 million remaining payment per vessel. The shipyard’s obligation to return the $5.4 million (plus interest) per vessel if the company elects not to take delivery of one or both vessels will continue to be secured by Bank of China refundment guarantees.
Currently the company is experiencing substantial delay with one fast supply boat under construction in Brazil that was originally scheduled to be delivered in September 2009. On April 5, 2011, pursuant to the vessel construction contract, the company sent the subject shipyard a letter initiating arbitration in order to resolve disputes of such matters as the shipyard’s failure to achieve payment milestones, its failure to follow the construction schedule, and its failure to timely deliver the vessel. The company has suspended construction on the vessel and both parties continue to pursue that arbitration. The company has third party credit support inthe form of insurance coverage for 90% of the progress payments made on this vessel, or all but approximately $2.4 million of the carrying value of the accumulated costs through December 31, 2014. The company had committed and invested $8 million as of March 31, 2015.
The company generally requires shipyards to provide third party credit support in the event that vessels are not completed and delivered in accordance with the terms of the shipbuilding contracts. That third party credit support typically guarantees the return of amounts paid by the company, and generally takes the form of refundment guarantees or standby letters of credit issued by major financial institutions located in the country of the shipyard. While the company seeks to minimize its shipyard credit risk by requiring these instruments, the ultimate return of amounts paid by the company in the event of shipyard default is still subject to the creditworthiness of the shipyard and the provider of the credit support, as well as the company’s ability to successfully pursue legal action to compel payment of these instruments. When third party credit support is not available or cost effective, the company endeavors to limit its credit risk by requiring cash deposits and through other contract terms with the shipyard and other counterparties.
In December 2013, the company took delivery of the second of two deepwater PSVs constructed in a U.S. shipyard. In connection with the delivery of those vessels, the company and the shipyard agreed to hold $11.7 million in escrow with a financial institution pending resolution of disputes over whether all or a portion of the escrowed funds were due to the shipyard as the shipyard has claimed. In October 2014, the parties resolved their pending disputes subject to a confidentiality provision and agreed on the split of the funds held in escrow. The amounts returned from the escrow to the company resulted in a reduction in the cost of the two acquired vessels, one of which was subsequently sold to an unaffiliated financial institution in connection with a sale/lease transaction that closed in the third quarter of fiscal 2014. The portion of the returned funds attributed to the vessel that was sold was recorded as a deferred gain that is being amortized over the 10-year lease term.
Sale of Shipyard. On June 30, 2013, the company completed the sale of the company’s remaining shipyard to a third party for $9.5 million and recognized a gain of $4 million. The company no longer owns or operates shipyards.
66
Table of Contents
Index to Financial Statements
Merchant Navy Officers Pension Fund. On July 15, 2013, a subsidiary of the company was placed into administration in the United Kingdom. Joint administrators were appointed to administer and distribute the subsidiary’s assets to the subsidiary’s creditors. The vessels owned by the subsidiary had become aged and were no longer economical to operate, which has caused the subsidiary’s main business to decline in recent years. Only one vessel generated revenue as of the date of the administration. As part of the administration, the company agreed to acquire seven vessels from the subsidiary (in exchange for cash) and to waive certain intercompany claims. The purchase price valuation for the vessels, all but one of which were stacked, was based on independent, third party appraisals of the vessels.
The company previously reported that a subsidiary of the company is a participating employer in an industry-wide multi-employer retirement fund in the United Kingdom, known as the Merchant Navy Officers Pension Fund (MNOPF). The subsidiary that participates in the MNOPF is the entity that was placed into administration in the U.K. The MNOPF is that subsidiary’s largest creditor, and has claimed as an unsecured creditor in the administration. The Company believed that the administration was in the best interests of the subsidiary and its principal stakeholders, including the MNOPF. The MNOPF indicated that it did not object to the insolvency process and that, aside from asserting its claim in the subsidiary’s administration and based on the company’s representations of the financial status and other relevant aspects of the subsidiary, the MNOPF will not pursue the subsidiary in connection with any amounts due or which may become due to the fund.
In December 2013, the administration was converted to a liquidation. That conversion allowed for an interim cash liquidation distribution to be made to the MNOPF. The conversion is not expected to have any impact on the company and the liquidation is expected to be completed in calendar 2015. The company believes that the liquidation will resolve the subsidiary’s participation in the MNOPF. The company also believes that the ultimate resolution of this matter will not have a material effect on the consolidated financial statements.
Brazilian Customs. In April 2011, two Brazilian subsidiaries of Tidewater were notified by the Customs Office in Macae, Brazil that they were jointly and severally being assessed fines of 155 million Brazilian reais (approximately $48.5 million as of March 31, 2015). The assessment of these fines is for the alleged failure of these subsidiaries to obtain import licenses with respect to 17 Tidewater vessels that provided Brazilian offshore vessel services to Petrobras, the Brazilian national oil company, over a three-year period ending December 2009. After consultation with its Brazilian tax advisors, Tidewater and its Brazilian subsidiaries believe that vessels that provide services under contract to the Brazilian offshore oil and gas industry are deemed, under applicable law and regulations, to be temporarily imported into Brazil, and thus exempt from the import license requirement. The Macae Customs Office has, without a change in the underlying applicable law or regulations, taken the position that the temporary importation exemption is only available to new, and not used, goods imported into Brazil and therefore it was improper for the company to deem its vessels as being temporarily imported. The fines have been assessed based on this new interpretation of Brazilian customs law taken by the Macae Customs Office.
After consultation with its Brazilian tax advisors, the company believes that the assessment is without legal justification and that the Macae Customs Office has misinterpreted applicable Brazilian law on duties and customs. The company is vigorously contesting these fines (which it has neither paid nor accrued) and, based on the advice of its Brazilian counsel, believes that it has a high probability of success with respect to the overturn of the entire amount of the fines, either at the administrative appeal level or, if necessary, in Brazilian courts. In December 2011, an administrative board issued a decision that disallowed 149 million Brazilian reais (approximately $46.6 million as of March 31, 2015) of the total fines sought by the Macae Customs Office. In two separate proceedings in 2013, a secondary administrative appeals board considered fines totaling 127 million Brazilian reais (approximately $39.7 million as of March 31, 2015) and rendered decisions that disallowed all of those fines. The remaining fines totaling 28 million Brazilian reais (approximately $8.8 million as of March 31, 2015) are still subject to a secondary administrative appeals board hearing, but the company believes that both decisions will be helpful in that upcoming hearing. The secondary board decisions disallowing the fines totaling 127 million Brazilian reais are, however, still subject to the possibility of further administrative appeal by the authorities that imposed the initial fines. The company believes that the ultimate resolution of this matter will not have a material effect on the consolidated financial statements.
Repairs to U.S. Flagged Vessels Operating Abroad. The Company recently became aware that we may not have been following all applicable laws and regulations in documenting and declaring upon re-entry to U.S. waters all repairs done on our U.S. flagged vessels while they were working outside the United States. When a
67
Table of Contents
Index to Financial Statements
U.S. flagged vessel operates abroad, any repairs made abroad must be declared to U.S. Customs. Duties must be paid for certain of those repairs upon return to U.S. waters. During our examination of our most recent filings with U.S. Customs, we determined that it was necessary to file amended forms with U.S. Customs. We continue to evaluate the return of other U.S. flagged vessels to the United States to determine whether it is necessary to adjust our responses in any of those instances. To the extent that further evaluation requires us to file amended entries, we do not yet know the magnitude of any duties, fines or interest associated with amending the entries for these vessels. We are committed to bolstering our processes, procedures and training to ensure that we correctly identify all repairs made abroad if and when U.S. flagged vessels return to the United States in the future.
Supplemental Retirement Plan. As a result of the May 31, 2012 retirement of Dean E. Taylor, former President and Chief Executive Officer of Tidewater Inc., Mr. Taylor received in December 2012 a $13 million lump sum distribution in full settlement and discharge of his supplemental executive retirement plan benefit. A settlement loss of $5.2 million related to this distribution was recorded in general and administrative expenses during the quarter ended December 31, 2012. The settlement loss is the result of the recognition of previously unrecognized actuarial losses that were being amortized over time from accumulated other comprehensive income to pension expense. As a result of the lump sum distribution, a portion of the previously unrecognized actuarial losses was required to be recognized in earnings in the December 2012 quarter in accordance with ASC 715.
Legal Proceedings
Nigeria Marketing Agent Litigation
On March 1, 2013, Tidewater filed suit in the London Commercial Court against Tidewater’s Nigerian marketing agent for breach of the agent’s obligations under contractual agreements between the parties. The alleged breach involves actions of the Nigerian marketing agent to discourage various affiliates of TOTAL S.A. from paying approximately $16 million (including Naira and U.S. dollar denominated invoices) due to the company for vessel services performed in Nigeria. Shortly after the London Commercial Court filing, TOTAL commenced interpleader proceedings in Nigeria naming the Nigerian agent and the company as respondents and seeking an order which would allow TOTAL to deposit those monies with a Nigerian court for the respondents to resolve. On April 25, 2013, Tidewater filed motions in the Nigerian Federal High Court to stop the interpleader proceedings in Nigeria or alternatively stay them until the resolution of the suit filed in London. The company will continue to actively pursue the collection of those monies. On April 30, 2013, the Nigerian marketing agent filed a separate suit in the Nigerian Federal High Court naming Tidewater and certain TOTAL affiliates as defendants. The suit seeks various declarations and orders, including a claim for the monies that are subject to the above interpleader proceedings, and other relief. The company is seeking dismissal of this suit and otherwise intends to vigorously defend against the claims made. The company has not reserved for this receivable and believes that the ultimate resolution of this matter will not have a material effect on the consolidated financial statements. On or about December 30, 2014, the company received notice that the Nigerian marketing agent had filed an action in the Nigerian Federal High court seeking to prevent the continuation of the proceedings initiated by Tidewater in the London Commercial Court. The company intends to vigorously defend that action.
In October, 2012, Tidewater had notified the Nigerian marketing agent that it was discontinuing its relationship with the Nigerian marketing agent. The company has entered into a new strategic relationship with a different Nigerian counterparty that it believes will better serve the company’s long term interests in Nigeria. This new strategic relationship is currently functioning as the company intended.
Nana Tide Sinking
On December 21, 2012, one of the company’s anchor handling tugs, the NANA TIDE, sunk in shallow waters off the coast of the Democratic Republic of Congo (DRC). The cause of the loss is not certain. The NANA TIDE was raised and recovered in early February 2014. On November 3, 2014, the NANA TIDE departed DRC waters after receiving proper clearances. The NANA TIDE was towed to a scrapping facility in a nearby country and sold for scrap in December 2014.
68
Table of Contents
Index to Financial Statements
Beginning in 2013 and through 2014, the company received correspondence from various DRC agencies fining the company or otherwise requesting the company to pay amounts aggregating several million dollars. The company vigorously opposed these fines/requests. Based on more recent DRC agency correspondence, the company believes that those DRC agencies will not seek to collect the majority of those fines or otherwise require the majority of those payments to be made. To the extent any amounts remain at issue with DRC agencies, the company believes they aggregate less than $1 million. Given the changing position of the DRC agencies and the fact that the company is still evaluating the legal basis for any remaining claims, the company has not concluded that any potential liability is both probable and reasonably estimable and thus no accrual been recorded as of March 31, 2015.
Various legal proceedings and claims are outstanding which arose in the ordinary course of business. In the opinion of management, the amount of ultimate liability, if any, with respect to these actions, will not have a material adverse effect on the company’s financial position, results of operations, or cash flows.
Information related to various commitments and contingencies, including legal proceedings, is disclosed in Note (12) of Notes to Consolidated Financial Statements included in Item 8 of this Annual Report on Form 10-K.
Arbitral Award for the Taking of the Company’s Venezuelan Operations
On March 13, 2015, the three member tribunal constituted under the rules of the World Bank’s International Centre for the Settlement of Investment Disputes (“ICSID”) has awarded subsidiaries of the company more than $62 million in compensation, including accrued interest and costs, for the Bolivarian Republic of Venezuela’s (“Venezuela”) expropriation of the investments of those subsidiaries in Venezuela. The award, issued in accordance with the provisions of the Venezuela-Barbados Bilateral Investment Treaty (“BIT”), represented $46.4 million for the fair market value of the company’s principal Venezuelan operating subsidiary, plus interest from May 8, 2009 to the date of payment of that amount accruing at an annual rate of 4.5% compounded quarterly ($13.9 million as of March 13, 2015) and $2.5 million for reimbursement of legal and other costs expended by the Company in connection with the arbitration.
As previously reported by the company, on February 16, 2010, Tidewater and certain of its subsidiaries (collectively, the “Claimants”) filed with ICSID a Request for Arbitration against Venezuela. In May 2009, Petróleos de Venezuela, S.A. (“PDVSA”), the national oil company of Venezuela, took possession and control of (a) eleven of the Claimants’ vessels that were then supporting PDVSA operations in Lake Maracaibo, (b) the Claimants’ shore-based headquarters adjacent to Lake Maracaibo, (c) the Claimants’ operations in Lake Maracaibo, and (d) certain other related assets. In July 2009, Petrosucre, S.A., a subsidiary of PDVSA, took possession and control of the Claimants’ four vessels, operations, and related assets in the Gulf of Paria. It was Tidewater’s position that, through those measures, Venezuela directly or indirectly expropriated the Claimants’ Venezuela investments, including the capital stock of the Claimants’ principal operating subsidiary in Venezuela. As a result of the seizures, the lack of further operations in Venezuela, and the continuing uncertainty about the timing and amount of the compensation the company might collect in the future, the company recorded a charge during the year ended March 31, 2010 to write off substantially all of the assets associated with the company’s Venezuelan operations.
The Claimants alleged in the Request for Arbitration that the measures taken by Venezuela against the Claimants violated Venezuela’s obligations under the BIT and rules and principles of Venezuelan law and international law. In the first phase of the case, the tribunal addressed Venezuela’s objections to the tribunal’s jurisdiction over the dispute. On February 8, 2013, the tribunal issued its decision on jurisdiction and found that it had jurisdiction over the claims under the BIT, including the claim for compensation for the expropriation of Tidewater’s principal operating subsidiary, but that it did not have jurisdiction based on Venezuela’s investment law. The practical effect of the tribunal’s decision was to exclude from the ICSID arbitration proceeding the Claimants’ claims for expropriation of the fifteen vessels described above. While the tribunal determined that it did not have jurisdiction over the claim for the seizure of the fifteen vessels, Tidewater received during fiscal 2011 insurance proceeds for the insured value of those vessels (less an additional premium payment triggered by those proceeds).
69
Table of Contents
Index to Financial Statements
The company will take appropriate steps to enforce and collect the award, which is enforceable in any of the 150 member states that are party to the ICSID Convention. As an initial step, the company was successful in having the award recognized and entered on March 16, 2015 as a final judgment by the United States District Court for the Southern District of New York. The company notes that Venezuela may seek annulment of the award and other post-award relief under the ICSID Convention and may seek a stay of enforcement of the award while those post-award remedial proceedings are pending. Even in the absence of a stay of enforcement, the company recognizes that collection of the award may present significant practical challenges, particularly in the short term. Because the award has yet to be satisfied and post-award relief may be sought by Venezuela, the net impact of these matters on the company cannot be reasonably estimated at this time and the company has not recognized a gain related to these matters as of March 31, 2015.
70
Table of Contents
Index to Financial Statements
Contractual Obligations and Contingent Commitments
Contractual Obligations
The following table summarizes the company’s consolidated contractual obligations as of March 31, 2015 and the effect such obligations, inclusive of interest costs, are expected to have on the company’s liquidity and cash flows in future periods.
| (In thousands) | Payments Due by Fiscal Year | |||||||||||||||||||||||||||||
| Total | 2016 | 2017 | 2018 | 2019 | 2020 | More Than 5 Years |
||||||||||||||||||||||||
| Term loan |
$ | 300,000 | — | — | — | 300,000 | — | — | ||||||||||||||||||||||
| Term loan interest |
16,522 | 5,089 | 5,089 | 5,089 | 1,255 | — | — | |||||||||||||||||||||||
| Revolver loan |
20,000 | — | — | — | 20,000 | — | — | |||||||||||||||||||||||
| Revolver loan interest |
1,104 | 340 | 340 | 340 | 84 | — | — | |||||||||||||||||||||||
| September 2013 senior notes |
500,000 | — | — | — | — | — | 500,000 | |||||||||||||||||||||||
| September 2013 senior notes interest |
208,143 | 24,318 | 24,318 | 24,318 | 24,318 | 24,318 | 86,553 | |||||||||||||||||||||||
| August 2011 senior notes |
165,000 | — | — | — | 50,000 | — | 115,000 | |||||||||||||||||||||||
| August 2011 senior notes interest |
38,512 | 7,301 | 7,301 | 7,301 | 5,271 | 5,271 | 6,067 | |||||||||||||||||||||||
| September 2010 senior notes |
425,000 | 42,500 | — | 69,500 | 50,000 | 50,000 | 213,000 | |||||||||||||||||||||||
| September 2010 senior notes interest |
86,715 | 17,693 | 16,647 | 15,967 | 13,406 | 11,311 | 11,691 | |||||||||||||||||||||||
| July 2003 senior notes |
35,000 | 35,000 | — | — | — | — | — | |||||||||||||||||||||||
| July 2003 senior notes interest |
538 | 538 | — | — | — | — | — | |||||||||||||||||||||||
| Troms debt |
89,477 | 10,181 | 7,691 | 7,691 | 7,691 | 10,803 | 45,420 | |||||||||||||||||||||||
| Troms debt interest |
20,520 | 3,632 | 3,280 | 2,944 | 2,607 | 2,156 | 5,901 | |||||||||||||||||||||||
| Uncertain tax positions (A) |
16,305 | 7,122 | 2,659 | 2,195 | 2,291 | 1,534 | 504 | |||||||||||||||||||||||
| Operating leases |
17,640 | 4,216 | 2,990 | 2,108 | 1,674 | 1,666 | 4,986 | |||||||||||||||||||||||
| Bareboat charter leases |
236,478 | 30,364 | 30,364 | 33,090 | 35,034 | 37,016 | 70,610 | |||||||||||||||||||||||
| Vessel construction obligations (B) |
380,053 | 316,972 | 63,081 | — | — | — | — | |||||||||||||||||||||||
| Pension and post-retirement obligations |
76,905 | 6,486 | 6,800 | 7,123 | 7,471 | 8,606 | 40,419 | |||||||||||||||||||||||
| Total obligations |
$ 2,633,912 | 511,752 | 170,560 | 177,666 | 521,102 | 152,681 | 1,100,151 | |||||||||||||||||||||||
|
| ||||||||||||||||||||||||||||||
(A) These amounts represent the liability for unrecognized tax benefits under FIN 48. The estimated income tax liabilities for uncertain tax positions will be settled as a result of expiring statutes, audit activity, competent authority proceedings related to transfer pricing, or final decisions in matters that are the subject of litigation in various taxing jurisdictions in which we operate. The timing of any particular settlement will depend on the length of the tax audit and related appeals process, if any, or an expiration of a statute. If a liability is settled due to a statute expiring or a favorable audit result, the settlement of the tax liability would not result in a cash payment.
(B) In April 2015, the company cancelled the construction contracts for three towing-supply vessels. There are approximately $13 million of remaining costs to be incurred on these three vessels at the time of termination. In May 2015, the company and the Chinese shipyard that is constructing two 275-foot deepwater PSVs came to an agreement that provides the company an option to take delivery of one or both vessels at any time prior to June 30, 2016 or receive the return of installments aggregating $5.7 million per vessel at the end of this period. There were approximately $41 million of remaining costs to be incurred on these two vessels at the time of the agreement.
71
Table of Contents
Index to Financial Statements
Letters of Credit and Surety Bonds
In the ordinary course of business, the company had other commitments that the company is contractually obligated to fulfill with cash should the obligations be called. These obligations include standby letters of credit, surety bonds and performance bonds that guarantee our performance as it relates to our vessel contracts, insurance, customs and other obligations in various jurisdictions. While these obligations are not normally called, the obligation could be called by the beneficiaries at any time before the expiration date should the company breach certain contractual and/or performance or payment obligations. As of March 31, 2015, the company had $45 million of outstanding standby letters of credit, surety bonds and performance bonds. These obligations are geographically concentrated in Mexico.
Off-Balance Sheet Arrangements
The company is accounting for its sale/leaseback transactions as operating leases and will record the payments as vessel operating lease expense on a straight-line basis over the lease term. The deferred gains will be amortized to gain on asset dispositions, net ratably over the respective lease term. Any deferred gain balance remaining upon the repurchase of the vessels would reduce the vessels’ stated cost if the company elects to exercise the purchase options.
Fiscal 2015 Sale/Leasebacks
During fiscal 2015, the company sold six vessels to unrelated third parties, and simultaneously entered into bareboat charter agreements with the purchasers. Under the sale/leaseback agreements the company has the right to re-acquire the vessel for a fixed percentage of the original sales price at a defined date during the lease, deliver the vessel to the owners at the end of the lease term, purchase the vessel at its then fair market value at the end of the lease term or extend the leases for 24 months at mutually agreeable lease rates.
The following table provides the number of vessels, total proceeds, carrying values at the time of sale, deferred gains recognized, lease expirations, and contractual purchase option timing for the vessels sold and leased back by the company during fiscal 2015:
| Fiscal 2015 Quarter | Number of Vessels |
Total Proceeds |
Carrying Value at time of Sale |
Deferred Gain at time of Sale |
Lease Term in years |
Purchase Option Percentage |
Purchase at end of: |
|||||||||||||||
| First |
1 | $ 13,400 | $ 4,002 | $ 9,398 | 7 | 61% | 6th Year | |||||||||||||||
| Second |
1 | 19,350 | 8,214 | 11,136 | 8.5 | 47% | 8th Year | |||||||||||||||
| Third |
3 | 78,200 | 33,233 | 44,967 | 8 – 9 | 60% | 7th or 8th Year | |||||||||||||||
| Fourth |
1 | 13,000 | 5,115 | 7,885 | 7 | 50% | 6th Year | |||||||||||||||
| 6 | $ 123,950 | $ 50,564 | $ 73,386 | |||||||||||||||||||
|
| ||||||||||||||||||||||
Fiscal 2014 Sale/Leasebacks
During fiscal 2014, the company sold ten vessels to unrelated third parties, and simultaneously entered into bareboat charter agreements with the purchasers. Under the sale/leaseback agreements the company has the right to re-acquire the vessel for a fixed percentage of the original sales price at a defined date during the lease, deliver the vessel to the owners at the end of the lease term, purchase the vessel at its then fair market value at the end of the lease term or extend the leases for 24 months at mutually agreeable lease rates.
72
Table of Contents
Index to Financial Statements
The following table provides the number of vessels, total proceeds, carrying values at the time of sale, deferred gains recognized, lease expirations, and contractual purchase option timing for the vessels sold and leased back by the company during fiscal 2014:
| Fiscal 2014 Quarter | Number of Vessels |
Total Proceeds |
Carrying Value at time of Sale |
Deferred Gain at time of Sale |
Lease Term in years |
Purchase Option Percentage |
Purchase Option at at end of: |
|||||||||||||||
| Second |
2 | $ 65,550 | $ 34,325 | $ 31,225 | 7 | 55% | 6th Year | |||||||||||||||
| Third |
4 | 141,900 | 105,649 | 36,251 | 7 - 9 | 54 - 68% | 6th or 8th Year | |||||||||||||||
| Fourth |
4 | 63,305 | 32,845 | 30,460 | 7 – 10 | 53 - 59% | 6th or 9th Year | |||||||||||||||
| 10 | $ 270,755 | $ 172,819 | $ 97,936 | |||||||||||||||||||
|
| ||||||||||||||||||||||
Fiscal 2010 Sale/Leaseback
In June and July 2009, the company sold six vessels to unrelated third-party companies, and simultaneously entered into bareboat charter agreements for the vessels with the purchasers.
The sale/leaseback transactions resulted in proceeds to the company of approximately $101.8 million and a deferred gain of $39.6 million. The aggregate carrying value of the six vessels was $62.2 million at the dates of sale. The company accounted for the transactions as sale/leaseback transactions with operating lease treatment and expensed lease payments over the charter terms.
During the fourth quarter of fiscal 2014, the company elected to repurchase all six vessels from their respective lessors for an aggregate price of $78.8 million. Three of these were subsequently sold and leased back in March 2014. The carrying value of these purchased vessels was reduced by the previously unrecognized deferred gain of $39.6 million. Two additional vessels were sold and leased back in April 2014 and March 2015, respectively. Refer to “Fiscal 2014 Sale/Leasebacks” above.
Fiscal 2006 Sale/Leaseback
In March 2006, the company entered into agreements to sell five vessels under construction at the time to an unrelated third party, for $76.5 million and simultaneously entered into bareboat charter agreements with the same unrelated third party upon the vessels’ delivery to the market. Construction on these five vessels was completed at various times between March 2006 and March 2008, at which time the company sold the respective vessels and simultaneously entered into bareboat charter agreements.
The company accounted for all five transactions as sale/leaseback transactions with operating lease treatment. In September 2012, the company elected to repurchase one of its leased vessels from the lessor for $8.8 million. During October 2012, the company repurchased a second leased vessel, for $8.4 million. In March 2014, the company repurchased a third and fourth leased vessel for a total cost of $22.8 million. In November 2014, the company repurchased a fifth leased vessel for a total cost of $11.2 million. Three of these vessels were sold and leased back in fiscal 2015.
Future Minimum Lease Payments
As of March 31, 2015, the future minimum lease payments for the vessels under the operating lease terms are as follows:
| Fiscal year ending (In thousands) | Fiscal 2015 Sale/Leaseback |
Fiscal 2014 Sale/Leaseback |
Total | |||||||||||
| 2016 |
$ | 9,485 | 20,879 | 30,364 | ||||||||||
| 2017 |
9,485 | 20,879 | 30,364 | |||||||||||
| 2018 |
9,605 | 23,485 | 33,090 | |||||||||||
| 2019 |
10,234 | 24,800 | 35,034 | |||||||||||
| 2020 |
11,497 | 25,519 | 37,016 | |||||||||||
| Thereafter |
30,866 | 39,744 | 70,610 | |||||||||||
| Total future lease payments |
$ | 81,172 | 155,306 | 236,478 | ||||||||||
|
| ||||||||||||||
73
Table of Contents
Index to Financial Statements
Application of Critical Accounting Policies and Estimates
The preparation of our consolidated financial statements in accordance with accounting principles generally accepted in the United States of America requires us to make estimates and assumptions that affect the reported amounts of assets, liabilities, revenues and expenses and related disclosures and disclosures of any contingent assets and liabilities at the date of the financial statements. We evaluate the reasonableness of these estimates and assumptions continually based on a combination of historical experience and other assumptions and information that comes to our attention that may vary the outlook for the future. Estimates and assumptions about future events and their effects are subject to uncertainty, and accordingly, these estimates may change as new events occur, as more experience is acquired, as additional information is obtained and as the business environment in which we operate changes. As a result, actual results may differ from estimates under different assumptions.
We suggest that the company’s Nature of Operations and Summary of Significant Accounting Policies, as described in Note (1) of Notes to Consolidated Financial Statements included in Item 8 of this Annual Report on Form 10-K, be read in conjunction with this Management’s Discussion and Analysis of Financial Condition and Results of Operations. We have defined a critical accounting estimate as one that is important to the portrayal of our financial condition or results of operations and requires us to make difficult, subjective or complex judgments or estimates about matters that are uncertain. The company believes the following critical accounting policies that affect our more significant judgments and estimates used in the preparation of the company’s consolidated financial statements are described below. There are other items within our consolidated financial statements that require estimation and judgment, but they are not deemed critical as defined above.
Revenue Recognition
Our primary source of revenue is derived from time charter contracts of our vessels on a rate per day of service basis; therefore, vessel revenues are recognized on a daily basis throughout the contract period. These time charter contracts are generally either on a term basis (generally three months to three years) or on a “spot” basis. The base rate of hire for a term contract is generally a fixed rate; provided, however, that term contracts at times include escalation clauses to recover increases in specific costs. A spot contract is a short-term agreement to provide offshore marine services to a customer for a specific short-term job. Spot contract terms generally range from one day to three months. Vessel revenues are recognized on a daily basis throughout the contract period. There are no material differences in the costs structure of the company’s contracts based on whether the contracts are spot or term, for the operating costs are generally the same without regard to the length of a contract.
Receivables and Allowance for Doubtful Accounts
In the normal course of business, we extend credit to our customers on a short-term basis. Our principal customers are major oil and natural gas exploration, field development and production companies. We routinely review and evaluate our accounts receivable balances for collectability. The determination of the collectability of amounts due from our customers requires us to use estimates and make judgments regarding future events and trends, including monitoring our customers’ payment history and current credit worthiness to determine that collectability is reasonably assured, as well as consideration of the overall business climate in which our customers operate. Provisions for doubtful accounts are recorded when it becomes evident that our customer will not make the required payments, which results in a reduction in our receivable balance. We believe that our allowance for doubtful accounts is adequate to cover potential bad debt losses under current conditions; however, uncertainties regarding changes in the financial condition of our customers, either adverse or positive, could impact the amount and timing of any additional provisions for doubtful accounts that may be required.
Goodwill
Goodwill represents the cost in excess of fair value of the net assets of companies acquired. The company tests goodwill for impairment annually at the reporting unit level using carrying amounts as of December 31 or more frequently if events and circumstances indicate that goodwill might be impaired. The company has the option of assessing qualitative factors to determine whether it is more likely than not that the fair value of a reporting unit exceeds its carrying amount. In the event that a qualitative assessment indicates that the fair value of a reporting unit exceeds its carrying value, the two step impairment test is not necessary. If, however,
74
Table of Contents
Index to Financial Statements
the assessment of qualitative factors indicates otherwise, the standard two-step method for evaluating goodwill for impairment as prescribed by Financial Accounting Standards Board (FASB) Accounting Standards Codification (ASC) 350, Intangibles-Goodwill and Other must be performed. Step one involves comparing the estimated fair value of the reporting unit to its carrying amount. The estimated fair value of the reporting unit is determined by discounting the projected future operating cash flows for the remaining average useful life of the assets within the reporting units by the company’s estimated weighted average cost of capital. If the fair value of the reporting unit is greater than its carrying amount, there is no impairment. If the reporting unit’s carrying amount is greater than the fair value, the second step must be completed to measure the amount of impairment, if any. Step two involves calculating the implied fair value of goodwill by deducting the fair value of all tangible and intangible assets, excluding goodwill, of the reporting unit from the fair value of the reporting unit as determined in step one. The implied fair value of goodwill determined in this step is compared to the carrying value of goodwill. Impairment is deemed to exist if the implied fair value of the reporting unit goodwill is less than the respective carrying value of the reporting unit goodwill, and in such case, an impairment loss would be recognized equal to the difference. There are many assumptions and estimates underlying the determination of the fair value of each reporting unit, such as, future expected utilization and average day rates for the vessels, vessel additions and attrition, operating expenses and tax rates. Although the company believes its assumptions and estimates are reasonable, deviations from the assumptions and estimates could produce a materially different result.
During the quarter ended December, 31, 2014 the company performed its annual goodwill impairment assessment and determined that the rapid and significant decline in crude oil and natural gas prices (which occurred and accelerated throughout the latter part of the company’s third fiscal quarter), and the expected short to intermediate term effect that the downturn might have on levels of exploration and production activity would likely have a negative effect on average day rates and utilization levels of the company’s vessels. Expected future cash flow analyses using the projected average day rates and utilization levels in this new commodity pricing environment were included in the company’s valuation models and indicated that the carrying value of the Americas and Sub-Saharan Africa/Europe reporting units were less than their respective fair values. A goodwill impairment charge of $283.7 million, to write-off the company’s remaining goodwill, was recorded during the quarter ended December 31, 2014.
During the quarter ended December, 31, 2013 the company performed its annual goodwill impairment assessment and determined that the carrying value of its Asia/Pacific unit exceeded its fair value as a result of the general decline in the level of business and, therefore, expected future cash flow for the company in this region. At the time of the December 2013 goodwill impairment assessment, the Asia/Pacific region continued to be challenged with excess vessel capacity as a result of the significant number of vessels that had been built in this region over the previous 10 years. These additional newbuilds had not been met by a commensurate increase in exploration, development or other activity within the region. In recent years, the company has disposed of older vessels that had worked in the region and transferred vessels out of the region to other regions where market opportunities are currently more robust. In accordance with ASC 350 goodwill is not reallocated based on vessel movements. A goodwill impairment charge of $56.3 million was recorded during the quarter ended December 31, 2013.
During the first quarter of fiscal 2014, $42.2 million of goodwill related to the acquisition of Troms Offshore was allocated to the Sub-Saharan Africa/Europe segment.
Impairment of Long-Lived Assets
The company reviews the vessels in its active fleet for impairment whenever events occur or changes in circumstances indicate that the carrying amount of an asset group may not be recoverable. In such evaluation, the estimated future undiscounted cash flows generated by an asset group are compared with the carrying amount of the asset group to determine if a write-down may be required. With respect to vessels that have not been stacked, we group together for impairment testing purposes vessels with similar operating and marketing characteristics. We also subdivide our groupings of assets with similar operating and marketing characteristics between our older vessels and newer vessels.
The company estimates cash flows based upon historical data adjusted for the company’s best estimate of expected future market performance, which, in turn, is based on industry trends. If an asset group fails the undiscounted cash flow test, the company uses the discounted cash flow method to determine the estimated
75
Table of Contents
Index to Financial Statements
fair value of each asset group and compares such estimated fair value, considered Level 3, as defined by ASC 360, Impairment or Disposal of Long-lived Assets, to the carrying value of each asset group in order to determine if impairment exists. If impairment exists, the carrying value of the asset group is reduced to its estimated fair value.
The primary estimates and assumptions used in reviewing active vessel groups for impairment include utilization rates, average dayrates, and average daily operating expenses. These estimates are made based on recent actual trends in utilization, dayrates and operating costs and reflect management’s best estimate of expected market conditions during the period of future cash flows. These assumptions and estimates have changed considerably as market conditions have changed, and they are reasonably likely to continue to change as market conditions change in the future. Although the company believes its assumptions and estimates are reasonable, deviations from the assumptions and estimates could produce materially different results. Management estimates may vary considerably from actual outcomes due to future adverse market conditions or poor operating results that could result in the inability to recover the current carrying value of an asset group, thereby possibly requiring an impairment charge in the future. As the company’s fleet continues to age, management closely monitors the estimates and assumptions used in the impairment analysis in order to properly identify evolving trends and changes in market conditions that could impact the results of the impairment evaluation.
In addition to the periodic review of its active long-lived assets for impairment when circumstances warrant, the company also performs a review of its stacked vessels and vessels withdrawn from service every six months or whenever changes in circumstances indicate that the carrying amount of a vessel may not be recoverable. Management estimates each stacked vessel’s fair value by considering items such as the vessel’s age, length of time stacked, likelihood of a return to active service, actual recent sales of similar vessels, among others. In certain situations we obtain an estimate of the fair value of the stacked vessel from third-party appraisers or brokers. The company records an impairment charge when the carrying value of a vessel withdrawn from service or a stacked vessel exceeds its estimated fair value. The estimates of fair value of stacked vessels are also subject to significant variability, are sensitive to changes in market conditions, and are reasonably likely to change in the future. The company has consistently recorded modest gains on the sale of stacked vessels.
Income Taxes
The liability method is used for determining the company’s income tax provisions, under which current and deferred tax liabilities and assets are recorded in accordance with enacted tax laws and rates. Under this method, the amounts of deferred tax liabilities and assets at the end of each period are determined using the tax rate expected to be in effect when taxes are actually paid or recovered. In addition, the company determines its effective tax rate by estimating its permanent differences resulting from differing treatment of items for tax and accounting purposes.
As a global company, we are subject to the jurisdiction of taxing authorities in the United States and by the respective tax agencies in the countries in which we operate internationally, as well as to tax agreements and treaties among these governments. Our operations in these different jurisdictions are taxed on various bases: actual income before taxes, deemed profits (which are generally determined using a percentage of revenue rather than profits) and withholding taxes based on revenue. Determination of taxable income in any tax jurisdiction requires the interpretation of the related tax laws and regulations and the use of estimates and assumptions regarding significant future events such as the amount, timing and character of deductions, permissible revenue recognition methods under the tax law and the sources and character of income and tax credits. Changes in tax laws, regulations, agreements and treaties, foreign currency exchange restrictions or our level of operations or profitability in each taxing jurisdiction could have an impact on the amount of income taxes that we provide during any given year. The company is periodically audited by various taxing authorities in the United States and by the respective tax agencies in the countries in which it operates internationally. The tax audits generally include questions regarding the calculation of taxable income. Audit adjustments affecting permanent differences could have an impact on the company’s effective tax rate.
The carrying value of the company’s net deferred tax assets is based on the company’s present belief that it is more likely than not that it will be able to generate sufficient future taxable income in certain tax jurisdictions to utilize such deferred tax assets, based on estimates and assumptions. If these estimates and related assumptions change in the future, the company may be required to record or adjust valuation allowances
76
Table of Contents
Index to Financial Statements
against its deferred tax assets resulting in additional income tax expense in the company’s consolidated statement of operations. Management evaluates the realizability of the deferred tax assets and assesses the need for changes to valuation allowances on a quarterly basis. While the company has considered future taxable income and ongoing prudent and feasible tax planning strategies in assessing the present need for a valuation allowance, in the event the company were to determine that it would be able to realize its deferred tax assets in the future in excess of its net recorded amount, an adjustment to the valuation allowance would increase income in the period such determination was made. Should the company determine that it would not be able to realize all or part of its net deferred tax asset in the future, an adjustment to the deferred tax asset would be charged to income in the period such determination was made.
Drydocking Costs
The company expenses maintenance and repair costs as incurred during the asset’s original estimated useful life (its original depreciable life). Vessel modifications that are performed for a specific customer contract are capitalized and amortized over the firm contract term. Major vessel modifications are capitalized and amortized over the remaining life of the equipment. The majority of the company’s vessels require certification inspections twice in every five year period, and the company schedules major repairs and maintenance, including time the vessel will be in a dry dock, when it is anticipated that the work can be performed. While the actual length of time between drydockings and major repairs and maintenance can vary, in the case of major repairs incurred after a vessel’s original estimated useful life, we use a 30 month amortization period for these costs as an average time between the required certifications. The company’s net earnings can fluctuate quarter to quarter due to the timing of scheduled drydockings.
Accrued Property and Liability Losses
The company self-insures a portion of potential hull damage and personal injury claims that may arise in the normal course of business. We are exposed to insurance risks related to the company’s reinsurance contracts with various insurance entities. The reinsurance recoverable amount can vary depending on the size of a loss. The exact amount of the reinsurance recoverable is not known until losses are settled. The company estimates the reinsurance recoverable amount we expect to receive and utilizes third party actuaries to estimate losses for claims that have occurred but have not been reported or not fully developed. Reinsurance recoverable balances are monitored regularly for possible reinsurance exposure and we record adequate provisions for doubtful reinsurance receivables. It is the company’s opinion that its accounts and reinsurance receivables have no impairment other than that for which provisions have been made.
Pension and Other Postretirement Benefits
The company sponsors a defined benefit pension plan and a supplemental executive retirement plan covering eligible employees of Tidewater Inc. and participating subsidiaries. The accounting for these plans is subject to guidance regarding employers’ accounting for pensions and employers’ accounting for postretirement benefits other than pensions. Net periodic pension costs and accumulated benefit obligations are determined using a number of assumptions, of which the discount rates used to measure future obligations, expenses and expected long-term return on plan assets are most critical. Less critical assumptions, such as, the rate of compensation increases, retirement ages, mortality rates, health care cost trends, and other assumptions, also have a significant impact on the amounts reported. The company’s pension costs consists of service costs, interest costs, expected returns on plan assets, amortization of prior service costs or benefits and, in part, on a market-related valuation of assets. The company considers a number of factors in developing its pension assumptions, which are evaluated at least annually, including an evaluation of relevant discount rates, expected long-term returns on plan assets, plan asset allocations, expected changes in wages and retirement benefits, analyses of current market conditions and input from actuaries and other consultants.
The company also sponsors a post retirement plan that provides limited health care and life insurance benefits to qualified retired employees. Costs of the program are based on actuarially determined amounts and are accrued over the period from the date of hire to the full eligibility date of employees who are expected to qualify for these benefits. This plan is not funded.
77
Table of Contents
Index to Financial Statements
New Accounting Pronouncements
For information regarding the effect of new accounting pronouncements, refer to Note (1) of Notes to Consolidated Financial Statements included in Item 8 of this Annual Report on Form 10-K.
Effects of Inflation
Day-to-day operating costs are generally affected by inflation. Because the energy services industry requires specialized goods and services, general economic inflationary trends may not affect the company’s operating costs. The major impact on operating costs is the level of offshore exploration, field development and production spending by energy exploration and production companies. As spending increases, prices of goods and services used by the energy industry and the energy services industry will increase. Future increases in vessel day rates may shield the company from the inflationary effects on operating costs.
The company’s newer technologically sophisticated AHTS vessels and PSVs generally require a greater number of specially trained fleet personnel than the company’s older, smaller vessels.
The price of steel peaked in 2011 due to increased worldwide demand for the metal, which demand has since declined due to the weakening of steel consumption and global economic industrial activity as a whole. If the price of steel declines, the cost of new vessels will result in lower capital expenditures and depreciation expenses, which taken by themselves would increase our future operating profits.
Environmental Compliance
During the ordinary course of business, the company’s operations are subject to a wide variety of environmental laws and regulations that govern the discharge of oil and pollutants into navigable waters. Violations of these laws may result in civil and criminal penalties, fines, injunction and other sanctions. Compliance with the existing governmental regulations that have been enacted or adopted regulating the discharge of materials into the environment, or otherwise relating to the protection of the environment has not had, nor is expected to have, a material effect on the company. Environmental laws and regulations are subject to change however, and may impose increasingly strict requirements and, as such, the company cannot estimate the ultimate cost of complying with such potential changes to environmental laws and regulations.
The company is also involved in various legal proceedings that relate to asbestos and other environmental matters. The amount of ultimate liability, if any, with respect to these proceedings is not expected to have a material adverse effect on the company’s financial position, results of operations, or cash flows. The company is proactive in establishing policies and operating procedures for safeguarding the environment against any hazardous materials aboard its vessels and at shore-based locations. Whenever possible, hazardous materials are maintained or transferred in confined areas in an attempt to ensure containment if an accident was to occur.
In addition, the company has established operating policies that are intended to increase awareness of actions that may harm the environment.
78
Table of Contents
Index to Financial Statements
ITEM 7A. QUANTITATIVE AND QUALITATIVE DISCLOSURES ABOUT MARKET RISK
Market risk refers to the potential losses arising from changes in interest rates, foreign currency fluctuations and exchange rates, equity prices and commodity prices including the correlation among these factors and their volatility. The company is primarily exposed to interest rate risk and foreign currency fluctuations and exchange risk. The company enters into derivative instruments only to the extent considered necessary to meet its risk management objectives and does not use derivative contracts for speculative purposes.
Interest Rate Risk and Indebtedness
Changes in interest rates may result in changes in the fair market value of the company’s financial instruments, interest income and interest expense. The company’s financial instruments that are exposed to interest rate risk are its cash equivalents and long-term borrowings. Due to the short duration and conservative nature of the cash equivalent investment portfolio, the company does not expect any material loss with respect to its investments. The book value for cash equivalents is considered to be representative of its fair value.
Revolving Credit and Term Loan Agreement
Please refer to the “Liquidity, Capital Resources and Other Matters” section of Item 7 of this Annual Report on Form 10-K for a discussion on the company’s revolving credit and term loan agreement and required cash payments for our indebtedness.
At March 31, 2015, the company had a $300 million term loan outstanding and $20 million outstanding borrowings from the revolver loan. The fair market value of this debt approximates the carrying value because the borrowings bear interest at variable Eurodollar rates plus a margin based on leverage, which together currently approximate 1.68% percent (1.5% margin plus 0.18% Eurodollar rate). A one percentage point change in the Eurodollar interest rate on the combined $320 million term loan and revolver borrowings at March 31, 2015 would change the company’s interest costs by approximately $3.2 million annually.
Senior Notes
Please refer to the “Liquidity, Capital Resources and Other Matters” section of Item 7 of this Annual Report on Form 10-K for a discussion on the company’s outstanding senior notes debt.
Because the senior notes outstanding at March 31, 2015 bear interest at fixed rates, interest expense would not be impacted by changes in market interest rates. The following table discloses how the estimated fair value of our respective senior notes, as of March 31, 2015, would change with a 100 basis-point increase or decrease in market interest rates.
| (In thousands) | Outstanding Value |
Estimated Fair Value |
100 Basis Point Increase |
100 Basis Point Decrease |
||||||||
| September 2013 |
$ | 500,000 | 516,879 | 480,022 | 555,281 | |||||||
| August 2011 |
165,000 | 167,910 | 160,004 | 176,295 | ||||||||
| September 2010 |
425,000 | 431,296 | 414,339 | 449,661 | ||||||||
| July 2003 |
35,000 | 35,197 | 35,082 | 35,314 | ||||||||
| Total |
$ | 1,125,000 | 1,151,282 | 1,089,447 | 1,216,551 | |||||||
|
| ||||||||||||
Troms Offshore Debt
Troms Offshore had 45 million NOK, or approximately $5.6 million, outstanding in floating rate debt at March 31, 2015 (whose fair value approximates the carrying value because the borrowings bear interest at variable NIBOR rates plus a margin). Troms Offshore also had 436.9 million NOK, or $54.4 million, as well as $29.5 million, of U.S. dollar denominated outstanding fixed rate debt at March 31, 2015. The following table discloses the estimated fair value of the fixed rate Troms Offshore notes, as of March 31, 2015, and how the estimated fair value would change with a 100 basis-point increase or decrease in market interest rates:
| (In thousands) | Outstanding Value |
Estimated Fair Value |
100 Basis Point Increase |
100 Basis Point Decrease |
||||||||
| Total |
$ | 83,874 | 83,651 | 79,843 | 87,743 | |||||||
|
| ||||||||||||
79
Table of Contents
Index to Financial Statements
Foreign Exchange Risk
The company’s financial instruments that can be affected by foreign currency fluctuations and exchange risks consist primarily of cash and cash equivalents, trade receivables and trade payables denominated in currencies other than the U.S. dollar. The company periodically enters into spot and forward derivative financial instruments as a hedge against foreign currency denominated assets and liabilities, currency commitments, or to lock in desired interest rates. Spot derivative financial instruments are short-term in nature and settle within two business days. The fair value of spot derivatives approximates the carrying value due to the short-term nature of this instrument, and as a result, no gains or losses are recognized. Forward derivative financial instruments are generally longer-term in nature but generally do not exceed one year. The accounting for gains or losses on forward contracts is dependent on the nature of the risk being hedged and the effectiveness of the hedge.
As of March 31, 2015, Sonatide maintained the equivalent of approximately $150 million of Angola kwanza-denominated deposits in Angolan banks, largely related to customer receipts that had not yet been converted to U.S. dollars, expatriated and then remitted to the company. Any devaluation in the Angolan kwanza relative to the U.S. dollar would result in foreign exchange losses for Sonatide to the extent the Angolan kwanza-denominated asset balances were in excess of kwanza-denominated liabilities, a portion of which will be borne by the company as a 49% owner of Sonatide. Sonatide may be able to mitigate this exposure, but a hypothetical ten percent devaluation of the kwanza relative to the U.S. dollar on a net kwanza-denominated asset balance of $100 million would cause our equity in net earnings of unconsolidated companies to be reduced by $4.9 million.
Derivatives
The company had two foreign exchange spot contracts outstanding at March 31, 2015, which had a notional value of $2.3 million. The spot contracts settled by April 1, 2015. The company had four foreign exchange spot contracts outstanding at March 31, 2014, which had a notional value of $2.3 million. The spot contracts settled by April 2, 2014.
At March 31, 2015, and 2014 the company did not have any forward contracts outstanding.
Other
Due to the company’s international operations, the company is exposed to foreign currency exchange rate fluctuations and exchange rate risks on all charter hire contracts denominated in foreign currencies. For some of our international contracts, a portion of the revenue and local expenses are incurred in local currencies with the result that the company is at risk of changes in the exchange rates between the U.S. dollar and foreign currencies. In certain countries in which we operate such as Norway, Australia and Saudi Arabia, charter hire contracts are generally denominated in the respective local currencies. We generally do not hedge against any foreign currency rate fluctuations associated with foreign currency contracts that arise in the normal course of business, which exposes us to the risk of exchange rate losses. To minimize the financial impact of these items the company attempts to contract a significant majority of its services in U.S. dollars. In addition, the company attempts to minimize its financial impact of these risks by matching the currency of the company’s operating costs with the currency of the revenue streams when considered appropriate. The company continually monitors the currency exchange risks associated with all contracts not denominated in U.S. dollars. Discussions related to the company’s Angolan operations are disclosed in the “Liquidity, Capital Resources and Other Matters” section of this Item 7 and in Note (12) of Notes to Consolidated Financial Statements included in Item 8 of this Annual Report on Form 10-K.
Devaluation of Venezuelan Bolivar Fuerte in February 2013
The company accounted for its operations in Venezuela using the U.S. dollar as its functional currency. In February 2013, the Venezuelan government announced a devaluation of the Venezuelan bolivar fuerte which modified the official fixed rate from 4.3 Venezuelan bolivar fuerte per U.S. dollar to 6.3 bolivar fuertes per U.S. dollar. In connection with the revaluation of its Venezuelan bolivar fuerte denominated net liability position, the company recorded a $3.6 million foreign exchange gain related to this devaluation in its fiscal 2013 fourth quarter.
80
Table of Contents
Index to Financial Statements
For additional disclosure on the company’s currency exchange risk, including a discussion on the company’s Venezuelan operations, refer to Note (12) of Notes to Consolidated Financial Statements included in Item 8 of this Annual Report on Form 10-K. For additional disclosure on the company’s derivative financial instruments refer to Note (13) of Notes to Consolidated Financial Statements included in Item 8 of this Annual Report on Form 10-K.
ITEM 8. FINANCIAL STATEMENTS AND SUPPLEMENTARY DATA
The information required by this Item is included in Part IV of this report.
ITEM 9. CHANGES IN AND DISAGREEMENTS WITH ACCOUNTANTS ON ACCOUNTING AND FINANCIAL DISCLOSURE
None.
ITEM 9A. CONTROLS AND PROCEDURES
Evaluation of Disclosure Controls and Procedures
Disclosure controls and procedures are designed with the objective of ensuring that all information required to be disclosed in our reports filed under the Securities Exchange Act of 1934 (“Exchange Act’), such as this report, is recorded, processed, summarized and reported within the time periods specified in the Securities and Exchange Commission rules and forms. Disclosure controls and procedures include, without limitation, controls and procedures designed to ensure that information required to be disclosed by us in the reports that we file or submit under the Exchange Act is accumulated and communicated to our management, including our chief executive and chief financial officers, as appropriate, to allow timely decisions regarding required disclosure. However, any control system, no matter how well conceived and followed, can provide only reasonable, and not absolute, assurance that the objectives of the control system are met.
As of the end of the period covered by this annual report, we have evaluated, under the supervision and with the participation of the company’s management, including the company’s President and Chief Executive Officer and Chief Financial Officer, the effectiveness of the design and operation of the company’s disclosure controls and procedures (as defined in Rule 13a-15(e) and 15d-15(e) under the Exchange Act, as amended). Based on that evaluation, the company’s President and Chief Executive Officer, along with our Chief Financial Officer concluded that our disclosure controls and procedures are effective in timely alerting them to material information relating to the company (including its consolidated subsidiaries) required to be disclosed in the reports the company files and submits under the Exchange Act.
Management’s Annual Report on Internal Control Over Financial Reporting
Management’s assessment of the effectiveness of the company’s internal control over financial reporting is discussed in “Management’s Report on Internal Control Over Financial Reporting” which is included in Item 15 of this Annual Report on Form 10-K and appears on page F-2.
Audit Report of Deloitte & Touche LLP
Our independent registered public accounting firm has issued an audit report on the company’s internal control over financial reporting. This report is also included in Item 15 of this Annual Report on Form 10-K and appears on page F-3.
Changes in Internal Control Over Financial Reporting
There was no change in the company’s internal control over financial reporting that occurred during the quarter ended March 31, 2015 that has materially affected, or is reasonably likely to materially affect, the company’s internal control over financial reporting.
81
Table of Contents
Index to Financial Statements
In May 2015, the company amended and extended its existing credit facility. The credit agreement matures in June 2019 and provides for a $900 million, five-year credit facility consisting of a (i) $600 million revolving credit facility and (ii) $300 million term loan facility. A copy of the amendment will be filed as an exhibit to the company’s Quarterly Report on Form 10-Q for the quarter ended June 30, 2015.
82
Table of Contents
Index to Financial Statements
ITEM 10. DIRECTORS, EXECUTIVE OFFICERS AND CORPORATE GOVERNANCE
Information required by this item is incorporated herein by reference to the 2015 Proxy Statement, which will be filed with the SEC not later than 120 days subsequent to March 31, 2015
ITEM 11. EXECUTIVE COMPENSATION
Information required by this item is incorporated herein by reference to the 2015 Proxy Statement, which will be filed with the SEC not later than 120 days subsequent to March 31, 2015.
ITEM 12. SECURITY OWNERSHIP OF CERTAIN BENEFICIAL OWNERS AND MANAGEMENT AND RELATED STOCKHOLDER MATTERS
Information required by this item is incorporated herein by reference to the 2015 Proxy Statement, which will be filed with the SEC not later than 120 days subsequent to March 31, 2015.
Securities Authorized for Issuance under Equity Compensation Plans
The following table provides information as of March 31, 2015 about the company’s equity compensation plans under which shares of common stock of the company are authorized for issuance:
| Plan category |
Number of securities to (A) |
Weighted-average exercise price of outstanding options, warrants and rights (B) |
Number of securities (C) |
|||||||||||
| Equity compensation plans approved by stockholders |
1,709,206 | $41.69 | 615,373 | (1) | ||||||||||
| Equity compensation plans not approved by stockholders |
— | — | — | |||||||||||
| Balance at March 31, 2015 |
1,709,206 | (2) | $41.69 | 615,373 | ||||||||||
|
| ||||||||||||||
| (1) | As of March 31, 2015, all such remaining shares are issuable as stock options or restricted stock or other stock-based awards under the company’s 2009 Stock Incentive Plan and 2006 Stock Incentive Plan. |
| (2) | If the exercise of these outstanding options and issuance of additional common shares had occurred as of March 31, 2015, these shares would represent 3.5% of the then total outstanding common shares of the company. |
ITEM 13. CERTAIN RELATIONSHIPS AND RELATED TRANSACTIONS, AND DIRECTOR INDEPENDENCE
Information required by this item is incorporated herein by reference to the 2015 Proxy Statement, which will be filed with the SEC not later than 120 days subsequent to March 31, 2015.
ITEM 14. PRINCIPAL ACCOUNTING FEES AND SERVICES
Information required by this item is incorporated herein by reference to the 2015 Proxy Statement, which will be filed with the SEC not later than 120 days subsequent to March 31, 2015.
83
Table of Contents
Index to Financial Statements
ITEM 15. EXHIBITS, FINANCIAL STATEMENT SCHEDULES
| (a) | The following documents are filed as part of this report: |
(1) Financial Statements
A list of the consolidated financial statements of the company filed as a part of this report is set forth in Part II, Item 8 beginning on page F-1 of this report and is incorporated herein by reference.
(2) Financial Statement Schedules
The financial statement schedule included in Part II, Item 8 of this document is filed as part of this report which begins on page F-1. All other schedules are omitted as the required information is inapplicable or the information is included in the consolidated financial statements or related notes.
| (3) Exhibits |
The index below describes each exhibit filed as a part of this report. Exhibits not incorporated by reference to a prior filing are designated by an asterisk; all exhibits not so designated are incorporated herein by reference to a prior filing as indicated.
| 3.1 | Restated Certificate of Incorporation of Tidewater Inc. (filed with the Commission as Exhibit 3(a) to the company’s quarterly report on Form 10-Q for the quarter ended September 30, 1993, File No. 1- 6311). | |
| 3.2 | Amended and Restated Bylaws of Tidewater Inc. dated May 17, 2012 (filed with the Commission as Exhibit 3.2 to the company’s current report on Form 8-K on May 22, 2012, File No. 1-6311). | |
| 4.1 | Note Purchase Agreement, dated July 1, 2003, by and among Tidewater Inc., certain of its subsidiaries, and certain institutional investors (filed with the Commission as Exhibit 4 to the company’s quarterly report on Form 10-Q for the quarter ended June 30, 2003, File No. 1-6311). | |
| 4.2 | Note Purchase Agreement, dated September 9, 2010, by and among Tidewater Inc., certain of its subsidiaries, and certain institutional investors (filed with the Commission as Exhibit 10.1 to the company’s current report on Form 8-K on September 15, 2010, File No. 1-6311). | |
| 4.3 | Note Purchase Agreement, dated September 30, 2013, by and among Tidewater Inc., certain of its subsidiaries, and certain institutional investors (filed with the Commission as Exhibit 10.1 to the company’s current report on Form 8-K on October 3, 2013, File No. 1-6311). | |
| 10.1 | Fourth Amended and Restated Credit Agreement, dated June 21, 2013, among Tidewater Inc. and its domestic subsidiaries, Bank of America, N.A., as Administrative Agent, L/C Issuer and Swing Line Lender, Wells Fargo Bank, N.A., as Syndication Agent, and JPMorgan Chase Bank, N.A., DNB Bank ASA, New York Branch, The Bank of Tokyo-Mitsubishi UFJ, Ltd., BBVA Compass, Sovereign Bank, N.A., Regions Bank, and U.S. Bank National Association, as Co-Documentation Agents, and the lenders party thereto (filed with the Commission as Exhibit 10.1 to the company’s current report on Form 8-K on June 25, 2013, File No. 1-6311). | |
| 10.2 | Series A and B Note Purchase Agreement, dated August 15, 2011, by and among Tidewater Inc., certain of its subsidiaries, and certain institutional investors (filed with the Commission as Exhibit 10.1 to the company’s current report on Form 8-K on August 17, 2011, File No. 1-6311). | |
| 10.3 | Series C Note Purchase Agreement, dated August 15, 2011, by and among Tidewater Inc., certain of its subsidiaries, and certain institutional investors (filed with the Commission as Exhibit 10.2 to the company’s current report on Form 8-K on August 17, 2011, File No. 1-6311). | |
84
Table of Contents
Index to Financial Statements
| 10.4+ | Tidewater Inc. 2001 Stock Incentive Plan effective November 21, 2001 (filed with the Commission as Exhibit 10.5 to the company’s annual report on Form 10-K for the fiscal year ended March 31, 2005, File No. 1-6311). | |
| 10.5+ | Form of Stock Option and Restricted Stock Agreement for the Grant of Incentive Stock Options, Non- Qualified Stock Options and Restricted Stock Under the Tidewater Inc. 2001 Stock Incentive Plan (filed with the Commission as Exhibit 10.14 to the company’s annual report on Form 10-K for the fiscal year ended March 31, 2006, File No. 1-6311). | |
| 10.6+ | Form of Stock Option and Restricted Stock Agreement for the Grant of Incentive Stock Options and Non-Qualified Stock Options Under the Tidewater Inc. 2001 Stock Incentive Plan and the Grant of Restricted Stock Under the Tidewater Inc. Employee Restricted Stock Plan (filed with the Commission as Exhibit 10.15 to the company’s annual report on Form 10-K for the fiscal year ended March 31, 2006, File No. 1-6311). | |
| 10.7+ | Tidewater Inc. 2006 Stock Incentive Plan effective July 20, 2006 (filed with the Commission as Exhibit 99.1 to the company’s current report on Form 8-K on March 27, 2007, File No. 1-6311). | |
| 10.8+ | Form of Stock Option and Restricted Stock Agreement for the Grant of Incentive Stock Options, Non- Qualified Stock Options and Restricted Stock Under the Tidewater Inc. 2006 Stock Incentive Plan (filed with the Commission as Exhibit 10.20 to the company’s annual report on Form 10-K for the fiscal year ended March 31, 2008, File No. 1-6311). | |
| 10.9+ | Amended and Restated Directors Deferred Stock Units Plan effective January 30, 2008 (filed with the Commission as Exhibit 10.21 to the company’s annual report on Form 10-K for the fiscal year ended March 31, 2008, File No. 1-6311). | |
| 10.10+ | Amendment to the Amended and Restated Tidewater Inc. Directors Deferred Stock Units Plan effective November 15, 2012 (filed with the Commission as Exhibit 10.1 to the company’s quarterly report on Form 10-Q for the quarter ended December 31, 2012, File No. 1-6311). | |
| 10.11+ | Second Amendment to the Amended and Restated Tidewater Inc. Directors Deferred Stock Units Plan (filed with the Commission as Exhibit 10.1 to the company’s quarterly report on From 10-Q for the quarter ended September 30, 2014, File No. 1-6311). | |
| 10.12+ | Stock Option and Restricted Stock Agreement for the Grant of Incentive Stock Options, Non- Qualified Stock Options and Restricted Stock Under the Tidewater Inc. 2006 Stock Incentive Plan between Tidewater Inc. and Quinn P. Fanning effective as of July 30, 2008 (filed with the Commission as Exhibit 10.8 to the company’s quarterly report on Form 10-Q for the quarter ended September 30, 2008, File No. 1-6311). | |
| 10.13+ | Form of Stock Option and Restricted Stock Agreement for the Grant of Incentive Stock Options, Non- Qualified Stock Options and Restricted Stock Under the Tidewater Inc. 2006 Stock Incentive Plan applicable to 2009 grants (filed with the Commission as Exhibit 10.19 to the company’s annual report on Form 10-K for the fiscal year ended March 31, 2009, File No. 1-6311). | |
| 10.14+ | Amended and Restated Non-Qualified Pension Plan for Outside Directors of Tidewater Inc. amended through March 31, 2005 (filed with the Commission as Exhibit 10.23 to the company’s annual report on Form 10-K for the fiscal year ended March 31, 2006, File No. 1-6311). | |
| 10.15+ | Amendment to the Amended and Restated Non-Qualified Pension Plan for Outside Directors of Tidewater Inc. effective December 13, 2006 (filed with the Commission as Exhibit 10.1 to the company’s quarterly report on Form 10-Q for the quarter ended December 31, 2006, File No. 1- 6311). | |
85
Table of Contents
Index to Financial Statements
| 10.16+ | Restated Non-Qualified Deferred Compensation Plan and Trust Agreement as Restated October 1, 1999 between Tidewater Inc. and Merrill Lynch Trust Company of America (filed with the Commission as Exhibit 10(e) to the company’s quarterly report on Form 10-Q for the quarter ended December 31, 1999, File No. 1-6311). | |
| 10.17+ | Second Restated Executives Supplemental Retirement Trust as Restated October 1, 1999 between Tidewater Inc. and Hibernia National Bank (filed with the Commission as Exhibit 10(j) to the company’s quarterly report on Form 10-Q for the quarter ended December 31, 1999, File No. 1- 6311). | |
| 10.18+ | Tidewater Inc. Individual Performance Executive Officer Annual Incentive Plan for Fiscal Year 2015 (filed with the Commission as Exhibit 10.2 to the company’s quarterly report on Form 10-Q for the quarter ended June 30, 2014, File No. 1-6311). | |
| 10.19+ | Tidewater Inc. Company Performance Executive Officer Annual Incentive Plan for Fiscal Year 2015 (filed with the Commission as Exhibit 10.1 to the company’s quarterly report on Form 10-Q for the quarter ended June 30, 2014, File No. 1-6311). | |
| 10.20+ | Amendment to the Amended and Restated Non-Qualified Pension Plan for Outside Directors of Tidewater Inc. effective January 30, 2008 (filed with the Commission as Exhibit 10.35 to the company’s annual report on Form 10-K for the fiscal year ended March 31, 2008, File No. 1-6311). | |
| 10.21+ | Tidewater Inc. Amended and Restated Supplemental Executive Retirement Plan executed on December 10, 2008 (filed with the Commission as Exhibit 10.1 to the company’s quarterly report on Form 10-Q for the quarter ended December 31, 2008, File No. 1-6311). | |
| 10.22+ | Tidewater Inc. Amended and Restated Employees’ Supplemental Savings Plan executed on December 10, 2008 (filed with the Commission as Exhibit 10.3 to the company’s quarterly report on Form 10-Q for the quarter ended December 31, 2008, File No. 1-6311). | |
| 10.23+ | Amendment to the Tidewater Inc. Amended and Restated Supplemental Executive Retirement Plan dated December 10, 2008 (filed with the Commission as Exhibit 10.4 to the company’s quarterly report on Form 10-Q for the quarter ended December 31, 2008, File No. 1-6311). | |
| 10.24+ | Amendment Number One to the Tidewater Employees’ Supplemental Savings Plan, effective January 22, 2009 (filed with the Commission as Exhibit 10.43 to the company’s annual report on Form 10-K for the fiscal year ended March 31, 2009, File No. 1-6311). | |
| 10.25+ | Amendment Number Two to the Tidewater Inc. Supplemental Executive Retirement Plan, effective January 22, 2009 (filed with the Commission as Exhibit 10.44 to the company’s annual report on Form 10-K for the fiscal year ended March 31, 2009, File No. 1-6311). | |
| 10.26+ | Summary of Compensation Arrangements with Directors (filed with the Commission as Exhibit 10.29 to the company’s annual report on Form 10-K for the fiscal year ended March 31, 2014, File No. 1- 6311). | |
| 10.27+ | Amended and Restated Change of Control Agreement between Tidewater Inc. and Jeffrey A. Gorski effective as of June 1, 2012 (filed with the Commission as Exhibit 10.30 to the company’s annual report on Form 10-K for the fiscal year ended March 31, 2013, File No. 1-6311). | |
| 10.28+ | Amended and Restated Change of Control Agreement between Tidewater Inc. and Jeffrey Platt dated effective as of June 1, 2008 (filed with the Commission as Exhibit 10.4 to the company’s quarterly report on Form 10-Q for the quarter ended September 30, 2008, File No. 1-6311). | |
| 10.29+ | Amended and Restated Change of Control Agreement between Tidewater Inc. and Joseph Bennett dated effective as of June 1, 2008 (filed with the Commission as Exhibit 10.5 to the company’s quarterly report on Form 10-Q for the quarter ended September 30, 2008, File No. 1-6311). | |
86
Table of Contents
Index to Financial Statements
| 10.30+ | Amended and Restated Change of Control Agreement between Tidewater Inc. and Bruce D. Lundstrom dated effective as of July 31, 2008 (filed with the Commission as Exhibit 10.6 to the company’s quarterly report on Form 10-Q for the quarter ended September 30, 2008, File No. 1- 6311). | |
| 10.31+ | Change of Control Agreement between Tidewater Inc. and Quinn P. Fanning dated effective as of July 31, 2008 (filed with the Commission as Exhibit 10.7 to the company’s quarterly report on Form 10-Q for the quarter ended September 30, 2008, File No. 1-6311). | |
| 10.32+ | Tidewater Inc. 2009 Stock Incentive Plan (filed with the Commission as Exhibit 99.1 to the company’s current report on Form 8-K on July 10, 2009, File No. 1-6311). | |
| 10.33+ | Form of Tidewater Inc. Indemnification Agreement entered into with each member of the Board of Directors, each executive officer and the principal accounting officer (filed with the Commission as Exhibit 99.1 to the company’s current report on Form 8-K on December 15, 2009, File No. 1-6311). | |
| 10.34+ | Form of Stock Option and Restricted Stock Agreement for the Grant of Incentive Stock Options, Non- Qualified Stock Options and Restricted Stock Under the Tidewater Inc. 2009 Stock Incentive Plan (filed with the Commission as Exhibit 10.41 to the company’s annual report on Form 10-K for the fiscal year ended March 31, 2010, File No. 1-6311). | |
| 10.35+ | Amendment Number Two to the Tidewater Employees’ Supplemental Savings Plan (filed with the Commission as Exhibit 10.43 to the company’s annual report on Form 10-K for the fiscal year ended March 31, 2011, File No. 1-6311). | |
| 10.36+ | Amendment Number Three to the Tidewater Inc. Supplemental Executive Retirement Plan (filed with the Commission as Exhibit 10.44 to the company’s annual report on Form 10-K for the fiscal year ended March 31, 2011, File No. 1-6311). | |
| 10.37+ | Amendment Number Three to the Tidewater Employees’ Supplemental Savings Plan (filed with the Commission as Exhibit 10.1 to the company’s quarterly report on Form 10-Q for the quarter ended December 31, 2010, File No. 1-6311). | |
| 10.38+ | Amendment Number Four to the Tidewater Inc. Supplemental Executive Retirement Plan (filed with the Commission as Exhibit 10.2 to the company’s quarterly report on Form 10-Q for the quarter ended December 31, 2010, File No. 1-6311). | |
| 10.39+ | Form of Restricted Stock Units Agreement under the Tidewater Inc. 2009 Stock Incentive Plan (2012 and 2013 awards) (filed with the Commission as Exhibit 10.46 to the company’s annual report on Form 10-K for the fiscal year ended March 31, 2012, File No. 1-6311). | |
| 10.40+ | Form of Restricted Stock Units Agreement under the Tidewater Inc. 2009 Stock Incentive Plan (2014 awards) (filed with the Commission as Exhibit 10.44 to the company’s annual report on Form 10-K for the fiscal year ended March 31, 2014, File No. 1-6311). | |
| 10.41+ | Tidewater Inc. 2014 Stock Incentive Plan (filed with the Commission as Exhibit 10.3 to the company’s current report on Form 8-K on August 4, 2014, File No. 1-6311). | |
| 10.42+ | Form of Incentive Agreement under the Tidewater Inc. 2014 Stock Incentive Plan (filed with the Commission as Exhibit 10.2 to the company’s current report on Form 8-K on March 23, 2015, File No. 1-6311). | |
| 10.43+ | Second Amended and Restated Tidewater Inc. Phantom Stock Plan (filed with the Commission as Exhibit 10.3 to the company’s current report on Form 8-K on March 23, 2015, File No. 1-6311). | |
87
Table of Contents
Index to Financial Statements
| 10.44+ | Form of Officer Agreement under the Second Amended and Restated Tidewater Inc. Phantom Stock Plan (filed with the Commission as Exhibit 10.4 to the company’s current report on Form 8-K on March 23, 2015, File No. 1-6311). | |
| 21* | Subsidiaries of the company. | |
| 23* | Consent of Independent Registered Accounting Firm – Deloitte & Touche LLP. | |
| 31.1* | Certification of Chief Executive Officer pursuant to Rule 13a-14(a) or 15d-14(a) of the Securities Exchange Act of 1934, as adopted pursuant to Section 302 of the Sarbanes-Oxley Act of 2002. | |
| 31.2* | Certification of Chief Financial Officer pursuant to Rule 13a-14(a) or 15d-14(a) of the Securities Exchange Act of 1934, as adopted pursuant to Section 302 of the Sarbanes-Oxley Act of 2002. | |
| 32.1* | Certification of Chief Executive Officer and Chief Financial Officer Pursuant to 18 U.S.C. Section 1350, as adopted pursuant to Section 906 of the Sarbanes-Oxley Act of 2002. | |
| 101.INS* | XBRL Instance Document. | |
| 101.SCH* | XBRL Taxonomy Extension Schema. | |
| 101.CAL* | XBRL Taxonomy Extension Calculation Linkbase. | |
| 101.DEF* | XBRL Taxonomy Extension Definition Linkbase. | |
| 101.LAB* | XBRL Taxonomy Extension Label Linkbase. | |
| 101.PRE* | XBRL Taxonomy Extension Presentation Linkbase. | |
* Filed herewith.
+ Indicates a management contract or compensatory plan or arrangement.
88
Table of Contents
Index to Financial Statements
SIGNATURES
Pursuant to the requirements of Section 13 of the Securities Exchange Act of 1934, the Registrant has duly caused this report to be signed on its behalf by the undersigned, thereunto duly authorized on May 28, 2015.
| TIDEWATER INC. | ||
| (Registrant) | ||
| By: |
/s/ Jeffrey M. Platt | |
| Jeffrey M. Platt | ||
| President and Chief Executive Officer | ||
Pursuant to the requirements of the Securities Exchange Act of 1934, this report has been signed below by the following persons on behalf of the Registrant and in the capacities indicated on May 28, 2015.
| /s/ Jeffrey M. Platt |
/s/ Quinn P. Fanning | |||
| Jeffrey M. Platt, President, Chief Executive Officer and Director |
Quinn P. Fanning, Executive Vice President and Chief Financial Officer | |||
| /s/ Craig J. Demarest |
/s/ Morris E. Foster | |||
| Craig J. Demarest, Vice President, Principal Accounting Officer and Controller |
Morris E. Foster, Director | |||
| /s/ Richard A. Pattarozzi |
/s/ Richard T. du Moulin | |||
| Richard A. Pattarozzi, Chairman of the Board of Directors |
Richard T. du Moulin, Director | |||
| /s/ Robert L. Potter |
/s/ Cindy B. Taylor | |||
| Robert L. Potter, Director |
Cindy B. Taylor, Director | |||
| /s/ J. Wayne Leonard |
/s/ Jack E. Thompson | |||
| J. Wayne Leonard, Director |
Jack E. Thompson, Director | |||
| /s/ Richard D. Paterson |
/s/ M. Jay Allison | |||
| Richard D. Paterson, Director |
M. Jay Allison, Director | |||
| /s/ James C. Day |
||||
| James C. Day, Director |
||||
89
Table of Contents
Index to Financial Statements
TIDEWATER INC.
Annual Report on Form 10-K
Items 8, 15(a), and 15(c)
Index to Financial Statements and Schedule
All other schedules are omitted as the required information is inapplicable or the information is presented in the financial statements or the related notes.
F-1
Table of Contents
Index to Financial Statements
MANAGEMENT’S REPORT ON INTERNAL CONTROL OVER FINANCIAL REPORTING
The company’s management is responsible for establishing and maintaining adequate internal control over financial reporting (as defined in Rule 13a-15(f) under the Securities Exchange Act of 1934). The company’s internal control system was designed to provide reasonable assurance to the company’s management and Board of Directors regarding the reliability of financial reporting and the preparation and fair presentation of published financial statements. All internal control systems, no matter how well designed, have inherent limitations. Therefore, even those systems determined to be effective can provide only reasonable assurance with respect to financial statement preparation and presentation.
The company’s management assessed the effectiveness of the company’s internal control over financial reporting as of March 31, 2015. In making this assessment, management used the criteria set forth by the Committee of Sponsoring Organizations of the Treadway Commission (COSO) in Internal Control—Integrated Framework (2013). Based on our assessment we believe that, as of March 31, 2015, the company’s internal control over financial reporting is effective based on those criteria.
Deloitte & Touche LLP, the company’s registered public accounting firm that audited the company’s financial statements included in this Annual Report on Form 10-K, has issued an audit report on the effectiveness of the company’s internal control over financial reporting as of March 31, 2015, which appears on page F-3.
F-2
Table of Contents
Index to Financial Statements
REPORT OF INDEPENDENT REGISTERED PUBLIC ACCOUNTING FIRM
To the Board of Directors and Stockholders of
Tidewater Inc.
New Orleans, Louisiana
We have audited the internal control over financial reporting of Tidewater Inc. and subsidiaries (the “Company”) as of March 31, 2015, based on criteria established in Internal Control—Integrated Framework (2013) issued by the Committee of Sponsoring Organizations of the Treadway Commission. The Company’s management is responsible for maintaining effective internal control over financial reporting and for its assessment of the effectiveness of internal control over financial reporting, included in the accompanying Management’s Report on Internal Control over Financial Reporting. Our responsibility is to express an opinion on the Company’s internal control over financial reporting based on our audit.
We conducted our audit in accordance with the standards of the Public Company Accounting Oversight Board (United States). Those standards require that we plan and perform the audit to obtain reasonable assurance about whether effective internal control over financial reporting was maintained in all material respects. Our audit included obtaining an understanding of internal control over financial reporting, assessing the risk that a material weakness exists, testing and evaluating the design and operating effectiveness of internal control based on the assessed risk, and performing such other procedures as we considered necessary in the circumstances. We believe that our audit provides a reasonable basis for our opinion.
A company’s internal control over financial reporting is a process designed by, or under the supervision of, the company’s principal executive and principal financial officers, or persons performing similar functions, and effected by the company’s board of directors, management, and other personnel to provide reasonable assurance regarding the reliability of financial reporting and the preparation of financial statements for external purposes in accordance with generally accepted accounting principles. A company’s internal control over financial reporting includes those policies and procedures that (1) pertain to the maintenance of records that, in reasonable detail, accurately and fairly reflect the transactions and dispositions of the assets of the company; (2) provide reasonable assurance that transactions are recorded as necessary to permit preparation of financial statements in accordance with generally accepted accounting principles, and that receipts and expenditures of the company are being made only in accordance with authorizations of management and directors of the company; and (3) provide reasonable assurance regarding prevention or timely detection of unauthorized acquisition, use, or disposition of the company’s assets that could have a material effect on the financial statements.
Because of the inherent limitations of internal control over financial reporting, including the possibility of collusion or improper management override of controls, material misstatements due to error or fraud may not be prevented or detected on a timely basis. Also, projections of any evaluation of the effectiveness of the internal control over financial reporting to future periods are subject to the risk that the controls may become inadequate because of changes in conditions, or that the degree of compliance with the policies or procedures may deteriorate.
In our opinion, the Company maintained, in all material respects, effective internal control over financial reporting as of March 31, 2015, based on the criteria established in Internal Control—Integrated Framework (2013) issued by the Committee of Sponsoring Organizations of the Treadway Commission.
We have also audited, in accordance with the standards of the Public Company Accounting Oversight Board (United States), the consolidated financial statements and financial statement schedule as of and for the year ended March 31, 2015 of the Company and our report dated May 28, 2015 expressed an unqualified opinion on those financial statements and financial statement schedule.
/s/ DELOITTE & TOUCHE LLP
New Orleans, Louisiana
May 28, 2015
F-3
Table of Contents
Index to Financial Statements
REPORT OF INDEPENDENT REGISTERED PUBLIC ACCOUNTING FIRM
To the Board of Directors and Stockholders of
Tidewater Inc.
New Orleans, Louisiana
We have audited the accompanying consolidated balance sheets of Tidewater Inc. and subsidiaries (the “Company”) as of March 31, 2015 and 2014, and the related consolidated statements of earnings, comprehensive income, equity and cash flows for each of the three years in the period ended March 31, 2015. Our audits also included the financial statement schedule listed in the Index at Item 15. These financial statements and financial statement schedule are the responsibility of the Company’s management. Our responsibility is to express an opinion on the financial statements and financial statement schedule based on our audits.
We conducted our audits in accordance with the standards of the Public Company Accounting Oversight Board (United States). Those standards require that we plan and perform the audit to obtain reasonable assurance about whether the financial statements are free of material misstatement. An audit includes examining, on a test basis, evidence supporting the amounts and disclosures in the financial statements. An audit also includes assessing the accounting principles used and significant estimates made by management, as well as evaluating the overall financial statement presentation. We believe that our audits provide a reasonable basis for our opinion.
In our opinion, such consolidated financial statements present fairly, in all material respects, the financial position of Tidewater Inc. and subsidiaries as of March 31, 2015 and 2014, and the results of their operations and their cash flows for each of the three years in the period ended March 31, 2015, in conformity with accounting principles generally accepted in the United States of America. Also, in our opinion, such financial statement schedule, when considered in relation to the basic consolidated financial statements taken as a whole, presents fairly, in all material respects, the information set forth therein.
We have also audited, in accordance with the standards of the Public Company Accounting Oversight Board (United States), the Company’s internal control over financial reporting as of March 31, 2015, based on the criteria established in Internal Control—Integrated Framework (2013) issued by the Committee of Sponsoring Organizations of the Treadway Commission and our report dated May 28, 2015 expressed an unqualified opinion on the Company’s internal control over financial reporting.
/s/ DELOITTE & TOUCHE LLP
New Orleans, Louisiana
May 28, 2015
F-4
Table of Contents
Index to Financial Statements
CONSOLIDATED BALANCE SHEETS
| March 31, 2015 and 2014 |
||||||||||
| (In thousands, except share and par value data) |
||||||||||
| ASSETS | 2015 | 2014 | ||||||||
| Current assets: |
||||||||||
| Cash and cash equivalents |
$ | 78,568 | 60,359 | |||||||
| Trade and other receivables, less allowance for doubtful accounts of $37,634 in 2015 and $35,737 in 2014 |
303,096 | 252,421 | ||||||||
| Due from affiliate |
420,365 | 429,450 | ||||||||
| Marine operating supplies |
49,005 | 57,392 | ||||||||
| Other current assets |
17,781 | 20,587 | ||||||||
| Total current assets |
868,815 | 820,209 | ||||||||
| Investments in, at equity, and advances to unconsolidated companies |
65,844 | 63,928 | ||||||||
| Properties and equipment: |
||||||||||
| Vessels and related equipment |
4,717,132 | 4,521,102 | ||||||||
| Other properties and equipment |
119,879 | 97,714 | ||||||||
| 4,837,011 | 4,618,816 | |||||||||
| Less accumulated depreciation and amortization |
1,090,704 | 997,208 | ||||||||
| Net properties and equipment |
3,746,307 | 3,621,608 | ||||||||
| Goodwill |
— | 283,699 | ||||||||
| Other assets |
75,196 | 96,385 | ||||||||
| Total assets |
$ | 4,756,162 | 4,885,829 | |||||||
|
| ||||||||||
| LIABILITIES AND EQUITY |
||||||||||
| Current liabilities: |
||||||||||
| Accounts payable |
$ | 54,011 | 74,515 | |||||||
| Accrued expenses |
146,255 | 157,302 | ||||||||
| Due to affiliate |
185,657 | 86,154 | ||||||||
| Accrued property and liability losses |
3,669 | 3,631 | ||||||||
| Current portion of long-term debt |
10,181 | 9,512 | ||||||||
| Other current liabilities |
82,461 | 70,567 | ||||||||
| Total current liabilities |
482,234 | 401,681 | ||||||||
| Long-term debt |
1,524,295 | 1,505,358 | ||||||||
| Deferred income taxes |
23,276 | 108,929 | ||||||||
| Accrued property and liability losses |
10,534 | 5,286 | ||||||||
| Other liabilities and deferred credits |
235,108 | 179,204 | ||||||||
| Commitments and Contingencies (Note 12) |
||||||||||
| Equity: |
||||||||||
| Common stock of $0.10 par value, 125,000,000 shares authorized, issued 47,029,359 shares at March 31, 2015 and 49,730,442 shares at March 31, 2014 |
4,703 | 4,973 | ||||||||
| Additional paid-in capital |
159,940 | 142,381 | ||||||||
| Retained earnings |
2,330,223 | 2,544,255 | ||||||||
| Accumulated other comprehensive loss |
(20,378 | ) | (12,225 | ) | ||||||
| Total stockholders’ equity |
2,474,488 | 2,679,384 | ||||||||
| Noncontrolling interests |
6,227 | 5,987 | ||||||||
| Total equity |
2,480,715 | 2,685,371 | ||||||||
| Total liabilities and equity |
$ | 4,756,162 | 4,885,829 | |||||||
|
| ||||||||||
See accompanying Notes to Consolidated Financial Statements.
F-5
Table of Contents
Index to Financial Statements
CONSOLIDATED STATEMENTS OF EARNINGS
| Years Ended March 31, 2015, 2014, and 2013 |
||||||||||||||
| (In thousands, except share and per share data) | 2015 | 2014 | 2013 | |||||||||||
| Revenues: |
||||||||||||||
| Vessel revenues |
$ | 1,468,358 | 1,418,461 | 1,229,998 | ||||||||||
| Other operating revenues |
27,159 | 16,642 | 14,167 | |||||||||||
| 1,495,517 | 1,435,103 | 1,244,165 | ||||||||||||
| Costs and expenses: |
||||||||||||||
| Vessel operating costs |
834,368 | 795,890 | 692,581 | |||||||||||
| Costs of other operating revenues |
26,505 | 15,745 | 12,216 | |||||||||||
| General and administrative |
189,819 | 187,976 | 175,609 | |||||||||||
| Vessel operating leases |
28,322 | 21,910 | 16,837 | |||||||||||
| Depreciation and amortization |
175,204 | 167,480 | 147,299 | |||||||||||
| Gain on asset dispositions, net |
(9,271 | ) | (11,722 | ) | (6,609 | ) | ||||||||
| Goodwill impairment |
283,699 | 56,283 | — | |||||||||||
| Restructuring charge |
4,052 | — | — | |||||||||||
| 1,532,698 | 1,233,562 | 1,037,933 | ||||||||||||
| Operating income (loss) |
(37,181 | ) | 201,541 | 206,232 | ||||||||||
| Other income (expenses): |
||||||||||||||
| Foreign exchange gain |
8,678 | 1,541 | 3,011 | |||||||||||
| Equity in net earnings of unconsolidated companies |
10,179 | 15,801 | 12,189 | |||||||||||
| Interest income and other, net |
1,927 | 2,123 | 3,476 | |||||||||||
| Loss on early extinguishment of debt |
— | (4,144 | ) | — | ||||||||||
| Interest and other debt costs, net |
(50,029 | ) | (43,814 | ) | (29,745 | ) | ||||||||
| (29,245 | ) | (28,493 | ) | (11,069 | ) | |||||||||
| Earnings (loss) before income taxes |
(66,426 | ) | 173,048 | 195,163 | ||||||||||
| Income tax (benefit) expense |
(1,077 | ) | 32,793 | 44,413 | ||||||||||
| Net earnings (loss) |
$ | (65,349 | ) | 140,255 | 150,750 | |||||||||
| Less: Net loss attributable to noncontrolling interests |
(159 | ) | — | — | ||||||||||
| Net earnings (loss) attributable to Tidewater Inc. |
$ | (65,190 | ) | 140,255 | 150,750 | |||||||||
|
| ||||||||||||||
| Basic (loss) earnings per common share |
$ | (1.34 | ) | 2.84 | 3.04 | |||||||||
|
| ||||||||||||||
| Diluted (loss) earnings per common share |
$ | (1.34 | ) | 2.82 | 3.03 | |||||||||
|
| ||||||||||||||
| Weighted average common shares outstanding |
48,658,840 | 49,392,749 | 49,550,391 | |||||||||||
| Dilutive effect of stock options and restricted stock |
— | 287,365 | 183,649 | |||||||||||
| Adjusted weighted average common shares |
48,658,840 | 49,680,114 | 49,734,040 | |||||||||||
|
| ||||||||||||||
See accompanying Notes to Consolidated Financial Statements.
F-6
Table of Contents
Index to Financial Statements
CONSOLIDATED STATEMENTS OF COMPREHENSIVE INCOME
| (In thousands) | 2015 | 2014 | 2013 | |||||||||||
| Net (loss) earnings |
$ | (65,349 | ) | 140,255 | 150,750 | |||||||||
| Other comprehensive income (loss): |
||||||||||||||
| Unrealized gains (losses) on available for sale securities, net of tax of $0, $115 and ($200), respectively |
143 | 213 | (372 | ) | ||||||||||
| Amortization of loss on derivative contract, net of tax of $0, $251 and $251, respectively |
717 | 466 | 466 | |||||||||||
| Change in supplemental executive retirement plan pension liability, net of tax of $0, $409 and $1,306 respectively |
(1,845 | ) | 760 | 2,427 | ||||||||||
| Change in pension plan minimum liability, net of tax of $0, $763 and ($290), respectively |
(5,739 | ) | 1,417 | (539 | ) | |||||||||
| Change in other benefit plan minimum liability, net of tax of $(769), $1,109 and $111, respectively |
(1,429 | ) | 2,060 | 207 | ||||||||||
| Total comprehensive (loss) income |
$ | (73,502 | ) | 145,171 | 152,939 | |||||||||
|
| ||||||||||||||
See accompanying Notes to Consolidated Financial Statements.
F-7
Table of Contents
Index to Financial Statements
CONSOLIDATED STATEMENTS OF EQUITY
| Years Ended March 31, 2015, 2014 and 2013 |
||||||||||||||||||||||||||
| (In thousands) |
||||||||||||||||||||||||||
| Common stock |
Additional in capital |
Retained earnings |
Accumulated other comprehensive loss |
Non controlling interest |
Total | |||||||||||||||||||||
| Balance at March 31, 2012 |
$ | 5,125 | 102,726 | 2,437,836 | (19,330 | ) | — | 2,526,357 | ||||||||||||||||||
| Total comprehensive income |
— | — | 150,750 | 2,189 | — | 152,939 | ||||||||||||||||||||
| Stock option activity |
14 | 6,131 | — | — | — | 6,145 | ||||||||||||||||||||
| Cash dividends declared ($1.00 per share) |
— | — | (49,766 | ) | — | — | (49,766 | ) | ||||||||||||||||||
| Retirement of common stock |
(187 | ) | — | (84,847 | ) | — | — | (85,034 | ) | |||||||||||||||||
| Amortization of restricted stock units |
6 | 6,705 | — | — | — | 6,711 | ||||||||||||||||||||
| Amortization/cancellation of restricted stock |
(9 | ) | 4,413 | — | — | — | 4,404 | |||||||||||||||||||
| Balance at March 31, 2013 |
$ | 4,949 | 119,975 | 2,453,973 | (17,141 | ) | — | 2,561,756 | ||||||||||||||||||
| Total comprehensive income |
— | — | 140,255 | 4,916 | — | 145,171 | ||||||||||||||||||||
| Stock option activity |
20 | 9,445 | — | — | — | 9,465 | ||||||||||||||||||||
| Cash dividends declared ($1.00 per share) |
— | — | (49,973 | ) | — | — | (49,973 | ) | ||||||||||||||||||
| Amortization of restricted stock units |
10 | 9,923 | — | — | — | 9,933 | ||||||||||||||||||||
| Amortization/cancellation of restricted stock |
(6 | ) | 3,038 | — | — | — | 3,032 | |||||||||||||||||||
| Noncontrolling interests |
— | — | — | — | 5,987 | 5,987 | ||||||||||||||||||||
| Balance at March 31, 2014 |
$ | 4,973 | 142,381 | 2,544,255 | (12,225 | ) | 5,987 | 2,685,371 | ||||||||||||||||||
| Total comprehensive loss |
— | — | (65,190 | ) | (8,153 | ) | (159 | ) | (73,502 | ) | ||||||||||||||||
| Stock option activity |
3 | (691 | ) | — | — | — | (688 | ) | ||||||||||||||||||
| Cash dividends declared ($1.00 per share) |
— | — | (49,127 | ) | — | — | (49,127 | ) | ||||||||||||||||||
| Retirement of common stock |
(284 | ) | — | (99,715 | ) | — | — | (99,999 | ) | |||||||||||||||||
| Amortization of restricted stock units |
17 | 15,270 | — | — | — | 15,287 | ||||||||||||||||||||
| Amortization/cancellation of restricted stock |
(6 | ) | 2,980 | — | — | — | 2,974 | |||||||||||||||||||
| Cash received from non-controlling interests, net |
— | — | — | — | 399 | 399 | ||||||||||||||||||||
| Balance at March 31, 2015 |
$ | 4,703 | 159,940 | 2,330,223 | (20,378 | ) | 6,227 | 2,480,715 | ||||||||||||||||||
|
| ||||||||||||||||||||||||||
See accompanying Notes to Consolidated Financial Statements.
F-8
Table of Contents
Index to Financial Statements
CONSOLIDATED STATEMENTS OF CASH FLOWS
| Years Ended March 31, 2015, 2014 and 2013 |
||||||||||||||
| (In thousands) | 2015 | 2014 | 2013 | |||||||||||
| Operating activities: |
||||||||||||||
| Net (loss) earnings |
$ (65,349) | 140,255 | 150,750 | |||||||||||
| Adjustments to reconcile net (loss) earnings to net cash provided by operating activities: |
||||||||||||||
| Depreciation and amortization |
175,204 | 167,480 | 147,299 | |||||||||||
| Benefit for deferred income taxes |
(72,389 | ) | (34,709 | ) | (11,733 | ) | ||||||||
| Gain on asset dispositions, net |
(9,271 | ) | (11,722 | ) | (6,609 | ) | ||||||||
| Goodwill impairment |
283,699 | 56,283 | — | |||||||||||
| Equity in earnings of unconsolidated companies, net of dividends |
(1,916 | ) | (15,801 | ) | 30 | |||||||||
| Compensation expense – stock based |
21,374 | 19,642 | 19,416 | |||||||||||
| Excess tax (benefit) liability on stock options exercised |
1,784 | (299 | ) | (278 | ) | |||||||||
| Changes in assets and liabilities, net: |
||||||||||||||
| Trade and other receivables |
(43,537 | ) | 13,485 | (38,438 | ) | |||||||||
| Changes in due to/from affiliate, net |
108,588 | (260,675 | ) | (56,077 | ) | |||||||||
| Marine operating supplies |
6,148 | 5,715 | (8,498 | ) | ||||||||||
| Other current assets |
2,794 | (7,600 | ) | (1,663 | ) | |||||||||
| Accounts payable |
(22,989 | ) | (1,395 | ) | (5,888 | ) | ||||||||
| Accrued expenses |
(11,435 | ) | 34,458 | 9,098 | ||||||||||
| Accrued property and liability losses |
38 | (429 | ) | 497 | ||||||||||
| Other current liabilities |
118 | 10,373 | 4,846 | |||||||||||
| Other liabilities and deferred credits |
4,875 | (11,842 | ) | 822 | ||||||||||
| Other, net |
(19,023 | ) | 1,398 | 10,349 | ||||||||||
| Net cash provided by operating activities |
358,713 | 104,617 | 213,923 | |||||||||||
| Cash flows from investing activities: |
||||||||||||||
| Proceeds from sales of assets |
8,310 | 51,330 | 27,278 | |||||||||||
| Proceeds from sale/leaseback of assets |
123,950 | 270,575 | — | |||||||||||
| Additions to properties and equipment |
(364,194 | ) | (594,695 | ) | (440,572 | ) | ||||||||
| Payments for acquisition, net of cash acquired |
— | (127,737 | ) | — | ||||||||||
| Other |
516 | (3,158 | ) | (193 | ) | |||||||||
| Net cash used in investing activities |
(231,418 | ) | (403,685 | ) | (413,487 | ) | ||||||||
| Cash flows from financing activities: |
||||||||||||||
| Debt issuance costs |
(556 | ) | (5,347 | ) | (51 | ) | ||||||||
| Principal payments on long-term debt |
(97,823 | ) | (1,103,054 | ) | (60,000 | ) | ||||||||
| Debt borrowings |
138,488 | 1,465,362 | 110,000 | |||||||||||
| Proceeds from exercise of stock options |
1,023 | 6,863 | 3,818 | |||||||||||
| Cash dividends |
(48,834 | ) | (49,816 | ) | (49,588 | ) | ||||||||
| Excess tax benefit (liability) on stock options exercised |
(1,784 | ) | 299 | 278 | ||||||||||
| Cash contributions from noncontrolling interests, net |
399 | 4,551 | — | |||||||||||
| Repurchases of common stock |
(99,999 | ) | — | (85,034 | ) | |||||||||
| Net cash (used in) provided by financing activities |
(109,086 | ) | 318,858 | (80,577 | ) | |||||||||
| Net change in cash and cash equivalents |
18,209 | 19,790 | (280,141 | ) | ||||||||||
| Cash and cash equivalents at beginning of year |
60,359 | 40,569 | 320,710 | |||||||||||
| Cash and cash equivalents at end of year |
$ 78,568 | 60,359 | 40,569 | |||||||||||
|
| ||||||||||||||
| Supplemental disclosure of cash flow information: |
||||||||||||||
| Cash paid during the year for: |
||||||||||||||
| Interest, net of amounts capitalized |
$ 49,390 | 34,190 | 27,443 | |||||||||||
| Income taxes |
$ 74,310 | 59,266 | 54,722 | |||||||||||
| Supplemental disclosure of noncash investing activities: |
||||||||||||||
| Additions to properties and equipment |
$ 2,068 | 5,751 | 12,010 | |||||||||||
|
| ||||||||||||||
See accompanying Notes to Consolidated Financial Statements.
F-9
Table of Contents
Index to Financial Statements
| (1) | NATURE OF OPERATIONS AND SUMMARY OF SIGNIFICANT ACCOUNTING POLICIES |
Nature of Operations
The company provides offshore service vessels and marine support services to the global offshore energy industry through the operation of a diversified fleet of offshore marine service vessels. The company’s revenues, net earnings and cash flows from operations are dependent upon the activity level of the vessel fleet. Like other energy service companies, the level of the company’s business activity is driven by the level of drilling and exploration activity by our customers. Our customers’ activity, in turn, is dependent on crude oil and natural gas prices, which fluctuate depending on respective levels of supply and demand for crude oil and natural gas.
Principles of Consolidation
The consolidated financial statements include the accounts of Tidewater Inc. and its subsidiaries. Intercompany balances and transactions are eliminated in consolidation.
Use of Estimates in Preparation of Financial Statements
The preparation of financial statements in conformity with accounting principles generally accepted in the United States of America requires management to make estimates and assumptions that affect the reported amounts of assets and liabilities and disclosure of contingent assets and liabilities at the date of the consolidated financial statements and the reported amounts of revenues and expenses during the reporting period. The accompanying consolidated financial statements include estimates for allowance for doubtful accounts, useful lives of property and equipment, valuation of goodwill, income tax provisions, impairments, commitments and contingencies and certain accrued liabilities. We evaluate our estimates and assumptions on an ongoing basis based on a combination of historical information and various other assumptions that are considered reasonable under the particular circumstances, the results of which form the basis for making judgments about carrying values of assets and liabilities that are not readily apparent from other sources. These accounting policies involve judgment and uncertainties to such an extent that there is reasonable likelihood that materially different amounts could have been reported under different conditions or if different assumptions had been used, as such, actual results may differ from these estimates.
Cash Equivalents
The company considers all highly liquid investments with maturities of three months or less when purchased to be cash equivalents.
Marine Operating Supplies
Marine operating supplies, which consist primarily of operating parts and supplies for the company’s vessels, are stated at the lower of weighted-average cost or market.
Properties and Equipment
Depreciation and Amortization
Properties and equipment are stated at cost. Depreciation is computed primarily on the straight-line basis beginning with the date construction is completed, with salvage values of 5%-10% for marine equipment, using estimated useful lives of 15 - 25 years for marine equipment (from date of construction) and 3 - 30 years for other properties and equipment. Depreciation is provided for all vessels unless a vessel meets the criteria to be classified as held for sale. Estimated remaining useful lives are reviewed when there has been a change in circumstances that indicates the original estimated useful life may no longer be appropriate. Upon retirement or disposal of a fixed asset, the costs and related accumulated depreciation are removed from the respective accounts and any gains or losses are included in our consolidated statements of earnings. Used equipment is depreciated in accordance with this above policy; however, no life less than six years is used for marine equipment regardless of the date constructed.
F-10
Table of Contents
Index to Financial Statements
Maintenance and Repairs
Maintenance and repairs (including major repair costs) are expensed as incurred during the asset’s original estimated useful life (its original depreciable life). Major repair costs incurred after the original estimated depreciable life that also have the effect of extending the useful life (for example, the complete overhaul of main engines, the replacement of mechanical components, or the replacement of steel in the vessel’s hull) of the asset are capitalized and amortized over 30 months. Vessel modifications that are performed for a specific customer contract are capitalized and amortized over the firm contract term. Major modifications to equipment that are being performed not only for a specific customer contract are capitalized and amortized over the remaining life of the equipment. The majority of the company’s vessels require certification inspections twice in every five year period, and the company schedules major repairs and maintenance, including time the vessel will be in a dry dock, when it is anticipated that the work can be performed. While the actual length of time between major repairs and maintenance and drydockings can vary, in the case of major repairs incurred after a vessel’s original estimated useful life, we use a 30 month amortization period for depreciating the capitalized costs of these major repairs and maintenance and drydockings.
Net Properties and Equipment
The following is a summary of net properties and equipment at March 31:
| 2015 | 2014 | |||||||||||||||||
| Number Of Vessels |
Carrying Value |
Number Of Vessels |
Carrying Value |
|||||||||||||||
| (In thousands) | (In thousands) | |||||||||||||||||
| Owned vessels in active service |
242 | $ | 3,310,476 | 257 | $ | 3,281,391 | ||||||||||||
| Stacked vessels |
21 | 38,489 | 15 | 9,743 | ||||||||||||||
| Marine equipment and other assets under construction |
315,552 | 268,189 | ||||||||||||||||
| Other property and equipment (A) |
81,790 | 62,285 | ||||||||||||||||
| Totals |
263 | $ | 3,746,307 | 272 | $ | 3,621,608 | ||||||||||||
|
| ||||||||||||||||||
| (A) | Other property and equipment includes six remotely operated vehicles the company took delivery of in fiscal 2014 and two remotely operated vehicles the company took delivery of in fiscal 2015. |
The company considers a vessel to be stacked if the vessel crew is disembarked and limited maintenance is being performed on the vessel. The company reduces operating costs by stacking vessels when management does not foresee opportunities to profitably or strategically operate the vessels in the near future. Vessels are added to this list when market conditions warrant and they are removed from this list when they are returned to active service, sold or otherwise disposed. When economically practical marketing opportunities arise, the stacked vessels can be returned to service by performing any necessary maintenance on the vessel and returning fleet personnel to operate the vessel. Although not currently fulfilling charters, stacked vessels are considered to be in service and are included in the calculation of the company’s utilization statistics. Stacked vessels at March 31, 2015 and 2014 have an average age of 20.7 and 32.2 years, respectively.
All vessels are classified in the company’s consolidated balance sheets in Properties and Equipment. No vessels are classified as held for sale because no vessel meets the criteria. Stacked vessels and vessels withdrawn from service are reviewed for impairment semiannually or whenever changes in circumstances indicate that the carrying amount of a vessel may not be recoverable.
Impairment of Long-Lived Assets
The company reviews the vessels in its active fleet for impairment whenever events occur or changes in circumstances indicate that the carrying amount of an asset group may not be recoverable. In such evaluation, the estimated future undiscounted cash flows generated by an asset group are compared with the carrying amount of the asset group to determine if a write-down may be required. With respect to vessels that have not been stacked, we group together for impairment testing purposes vessels with similar operating and marketing characteristics. We also subdivide our groupings of assets with similar operating and marketing characteristics between our older vessels and newer vessels.
The company estimates cash flows based upon historical data adjusted for the company’s best estimate of expected future market performance, which, in turn, is based on industry trends. If an asset group fails the
F-11
Table of Contents
Index to Financial Statements
undiscounted cash flow test, the company uses the discounted cash flow method to determine the estimated fair value of each asset group and compares such estimated fair value (considered Level 3), as defined by Financial Accounting Standards Board (FASB) Accounting Standards Codification (ASC) 360 Impairment or Disposal of Long-lived Assets, to the carrying value of each asset group in order to determine if impairment exists. If impairment exists, the carrying value of the asset group is reduced to its estimated fair value.
The primary estimates and assumptions used in reviewing active vessel groups for impairment include utilization rates, average dayrates, and average daily operating expenses. These estimates are made based on recent actual trends in utilization, dayrates and operating costs and reflect management’s best estimate of expected market conditions during the period of future cash flows. These assumptions and estimates have changed considerably as market conditions have changed and they are reasonably likely to continue to change as market conditions change in the future. Although the company believes its assumptions and estimates are reasonable, deviations from the assumptions and estimates could produce materially different results. Management estimates may vary considerably from actual outcomes due to future adverse market conditions or poor operating results that could result in the inability to recover the current carrying value of an asset group, thereby possibly requiring an impairment charge in the future. As the company’s fleet continues to age, management closely monitors the estimates and assumptions used in the impairment analysis in order to properly identify evolving trends and changes in market conditions that could impact the results of the impairment evaluation.
In addition to the periodic review of its active long-lived assets for impairment when circumstances warrant, the company also performs a review of its stacked vessels and vessels withdrawn from service every six months or whenever changes in circumstances indicate that the carrying amount of a vessel may not be recoverable. Management estimates each stacked vessel’s fair value by considering items such as the vessel’s age, length of time stacked, likelihood of a return to active service, actual recent sales of similar vessels, among others. In certain situations we obtain an estimate of the fair value of the stacked vessel from third-party appraisers or brokers. The company records an impairment charge when the carrying value of a vessel withdrawn from service or a stacked vessel exceeds its estimated fair value. The estimates of fair value of stacked vessels are also subject to significant variability, are sensitive to changes in market conditions, and are reasonably likely to change in the future. The company has consistently recorded modest gains on the sale of stacked vessels. Refer to Note (13) for a discussion on asset impairments.
Goodwill
Goodwill represents the cost in excess of fair value of the net assets of companies acquired. Goodwill primarily relates to the fiscal 1998 acquisition of O.I.L. Ltd. and the fiscal 2014 acquisition of Troms Offshore. The company tests goodwill for impairment annually at the reporting unit level using carrying amounts as of December 31 or more frequently if events and circumstances indicate that goodwill might be impaired. The company has the option of assessing qualitative factors to determine whether it is more likely than not that the fair value of a reporting unit exceeds its carrying amount. In the event that a qualitative assessment indicates that the fair value of a reporting unit exceeds its carrying value the two step impairment test is not necessary. If, however, the assessment of qualitative factors indicates otherwise, the standard two-step method for evaluating goodwill for impairment as prescribed by Financial Accounting Standards Board (FASB) Accounting Standards Codification (ASC) 350, Intangibles-Goodwill and Other must be performed. Step one involves comparing the fair value of the reporting unit to its carrying amount. If the fair value of the reporting unit is greater than its carrying amount, there is no impairment. If the reporting unit’s carrying amount is greater than the fair value, the second step must be completed to measure the amount of impairment, if any. Step two involves calculating the implied fair value of goodwill by deducting the fair value of all tangible and intangible assets, excluding goodwill, of the reporting unit from the fair value of the reporting unit as determined in step one. The implied fair value of goodwill determined in this step is compared to the carrying value of goodwill. If the implied fair value of goodwill is less than the carrying value of goodwill, an impairment loss is recognized equal to the difference.
The company performed its annual goodwill impairment assessment as of December 31, 2014 and 2013 and recorded goodwill impairment charges of $283.7 million and $56.3 million, respectively. The December 31, 2014 impairment charge was due to the likely negative effect on average day rates and utilization levels of the company’s vessels as a result of the rapid and significant decline in crude oil and natural gas prices which occurred and accelerated throughout the latter part of the company’s third quarter of fiscal 2015. The December 31, 2013 impairment charge related to the company’s Asia/Pacific segment. During the quarter
F-12
Table of Contents
Index to Financial Statements
ended June 30, 2013, $42.2 million of goodwill related to the acquisition of Troms Offshore was allocated to the Sub-Saharan Africa/Europe segment. Refer to Note (16) for a complete discussion of Goodwill.
Accrued Property and Liability Losses
The company’s insurance subsidiary establishes case-based reserves for estimates of reported losses on direct business written, estimates received from ceding reinsurers, and reserves based on past experience of unreported losses. Such losses principally relate to the company’s vessel operations and are included as a component of vessel operating costs in the consolidated statements of earnings. The liability for such losses and the related reimbursement receivable from reinsurance companies are classified in the consolidated balance sheets into current and noncurrent amounts based upon estimates of when the liabilities will be settled and when the receivables will be collected.
The following table discloses the total amount of current and long-term liabilities related to accrued property and liability losses not subject to reinsurance recoverability, but considered currently payable as of March 31:
| (In thousands) | 2015 | 2014 | ||||||||
| Accrued property and liability losses |
$ | 14,203 | 8,917 | |||||||
Pension and Other Postretirement Benefits
The company follows the provisions of ASC 715, Compensation – Retirement Benefits, and uses a March 31 measurement date for determining net periodic benefit costs, benefit obligations and the fair value of plan assets. Net periodic pension costs and accumulated benefit obligations are determined using a number of assumptions including the discount rates used to measure future obligations and expenses, the rate of compensation increases, retirement ages, mortality rates, expected long-term return on plan assets, health care cost trends, and other assumptions, all of which have a significant impact on the amounts reported.
The company’s pension cost consists of service costs, interest costs, expected returns on plan assets, amortization of prior service costs or benefits and actuarial gains and losses. The company considers a number of factors in developing its pension assumptions, including an evaluation of relevant discount rates, expected long-term returns on plan assets, plan asset allocations, expected changes in wages and retirement benefits, analyses of current market conditions and input from actuaries and other consultants.
Net periodic benefit costs are based on a market-related valuation of assets equal to the fair value of assets. For the long-term rate of return, assumptions are developed regarding the expected rate of return on plan assets based on historical experience and projected long-term investment returns, which consider the plan’s target asset allocation and long-term asset class return expectations. Assumptions for the discount rate use the equivalent single discount rate based on discounting expected plan benefit cash flows using the Mercer Bond Index Curve. For the projected compensation trend rate, short-term and long-term compensation expectations for participants, including salary increases and performance bonus payments are considered. For the health care cost trend rate for other postretirement benefits, assumptions are established for health care cost trends, applying an initial trend rate that reflects recent historical experience and broader national statistics with an ultimate trend rate that assumes that the portion of gross domestic product devoted to health care eventually becomes constant. Refer to Note (6) for a complete discussion on compensation – retirement benefits.
Income Taxes
Income taxes are accounted for in accordance with the provisions of ASC 740, Income Taxes. Deferred tax assets and liabilities are recognized for the future tax consequences attributable to differences between the financial statement carrying amounts of existing assets and liabilities and their respective tax bases. Deferred tax assets and liabilities are measured using enacted tax rates expected to apply to taxable income in the years in which those temporary differences are expected to be recovered or settled. The effect on deferred tax assets and liabilities of a change in tax rates is recognized in income in the period that includes the enactment date. Deferred taxes are not provided on undistributed earnings of certain non-U.S. subsidiaries and business ventures because the company considers those earnings to be permanently invested abroad. Refer to Note (4) for a complete discussion on income taxes.
Revenue Recognition
F-13
Table of Contents
Index to Financial Statements
The company’s primary source of revenue is derived from time charter contracts of its vessels on a rate per day of service basis; therefore, vessel revenues are recognized on a daily basis throughout the contract period. These vessel time charter contracts are generally either on a term basis (average three months to three years) or on a “spot” basis. The base rate of hire for a term contract is generally a fixed rate, provided, however, that term contracts at times include escalation clauses to recover specific additional costs. A spot contract is a short-term agreement to provide offshore marine services to a customer for a specific short-term job. Spot contract terms generally range from one day to three months. Vessel revenues are recognized on a daily basis throughout the contract period. There are no material differences in the cost structure of the company’s contracts based on whether the contracts are spot or term for the operating costs are generally the same without regard to the length of a contract.
Operating Costs
Vessel operating costs are incurred on a daily basis and consist primarily of costs such as crew wages; repair and maintenance; insurance and loss reserves; fuel, lube oil and supplies; and other vessel expenses, which include but are not limited to costs such as brokers’ commissions, training costs, agent fees, port fees, canal transit fees, temporary importation fees, vessel certification fees, and satellite communication fees. Repair and maintenance costs include both routine costs and major drydocking repair costs, which occur during the initial economic useful life of the vessel. Vessel operating costs are recognized as incurred on a daily basis.
Foreign Currency Translation
The U.S. dollar is the functional currency for all of the company’s existing international operations, as transactions in these operations are predominately denominated in U.S. dollars. Foreign currency exchange gains and losses from the revaluation of the company’s foreign currency denominated monetary assets and liabilities are included in the consolidated statements of earnings.
Earnings Per Share
The company follows ASC 260, Earnings Per Share and reports both basic earnings per share and diluted earnings per share. The calculation of basic earnings per share is computed based on the weighted average number of shares of common stock outstanding. Dilutive earnings per share is computed based on the weighted average number of shares of common stock plus the effect of dilutive potential common shares outstanding during the period using the treasury stock method. Diluted earnings per share includes the dilutive effect of stock options and restricted stock grants (both time and performance based) awarded as part of the company’s share-based compensation and incentive plans. Per share amounts disclosed in these Notes to Consolidated Financial Statements, unless otherwise indicated, are on a diluted basis. Refer to Note (10), Earnings Per Share.
Concentrations of Credit Risk
The company’s financial instruments that are exposed to concentrations of credit risk consist primarily of trade and other receivables from a variety of domestic, international and national energy companies, including reinsurance companies for recoverable insurance losses. The company manages its exposure to risk by performing ongoing credit evaluations of its customers’ financial condition and generally does not require collateral. The company maintains an allowance for doubtful accounts for potential losses based on expected collectability and does not believe it is generally exposed to concentrations of credit risk that are likely to have a material adverse impact on the company’s financial position, results of operations, or cash flows.
Stock-Based Compensation
The company follows ASC 718, Compensation – Stock Compensation, for the expensing of stock options and other share-based payments. This topic requires that stock-based compensation transactions be accounted for using a fair-value-based method. The company uses the Black-Scholes option-pricing model to determine the fair-value of stock-based awards. Refer to Note (8) for a complete discussion on stock-based compensation.
F-14
Table of Contents
Index to Financial Statements
Comprehensive Income
The company reports total comprehensive income and its components in the financial statements in accordance with ASC 220, Comprehensive Income. Total comprehensive income represents the net change in stockholders’ equity during a period from sources other than transactions with stockholders and, as such, includes net earnings. For the company, accumulated other comprehensive income is comprised of unrealized gains and losses on available-for-sale securities and derivative financial instruments, currency translation adjustment and any minimum pension liability for the company’s U.S. Defined Benefits Pension Plan and Supplemental Executive Retirement Plan. Refer to Note (9) for a complete discussion on comprehensive income.
Derivative Instruments and Hedging Activities
The company periodically utilizes derivative financial instruments to hedge against foreign currency denominated assets and liabilities and currency commitments. These transactions generally include forward currency contracts or interest rate swaps that are entered into with major financial institutions. Derivative financial instruments are intended to reduce the company’s exposure to foreign currency exchange risk and interest rate risk.
The company records derivative financial instruments in its consolidated balance sheets at fair value as either assets or liabilities. The accounting for changes in the fair value of a derivative instrument depends on the intended use of the derivative and the resulting designation, which is established at the inception of a derivative. The company formally documents, at the inception of a hedge, the hedging relationship and the entity’s risk management objective and strategy for undertaking the hedge, including identification of the hedging instrument, the hedged item or transaction, the nature of the risk being hedged, the method used to assess effectiveness and the method that will be used to measure hedge ineffectiveness of derivative instruments that receive hedge accounting treatment.
For derivative instruments designated as foreign currency or interest rate hedges (cash flow hedge), changes in fair value, to the extent the hedge is effective, are recognized in other comprehensive income until the hedged item is recognized in earnings. Hedge effectiveness is assessed quarterly based on the total change in the derivative’s fair value. Amounts representing hedge ineffectiveness are recorded in earnings. Any change in fair value of derivative financial instruments that are speculative in nature and do not qualify for hedge accounting treatment is also recognized immediately in earnings. Proceeds received upon termination of derivative financial instruments qualifying as fair value hedges are deferred and amortized into income over the remaining life of the hedged item using the effective interest rate method.
Fair Value Measurements
The company follows the provisions of ASC 820, Fair Value Measurements and Disclosures, for financial assets and liabilities that are measured and reported at fair value on a recurring basis. ASC 820 establishes a hierarchy for inputs used in measuring fair value. Fair value is calculated based on assumptions that market participants would use in pricing assets and liabilities and not on assumptions specific to the entity. The statement requires that each asset and liability carried at fair value be classified into one of the following categories:
| Level 1: | Quoted market prices in active markets for identical assets or liabilities |
| Level 2: | Observable market based inputs or unobservable inputs that are corroborated by market data |
| Level 3: | Unobservable inputs that are not corroborated by market data |
F-15
Table of Contents
Index to Financial Statements
Reclassifications
The company made certain reclassifications to prior period amounts to conform to the current year presentation. These reclassifications did not have a material effect on the consolidated statement of financial position, results of operations or cash flows.
Subsequent Events
The company evaluates subsequent events through the time of our filing on the date we issue financial statements.
Accounting Pronouncements
From time to time, new accounting pronouncements are issued by the FASB that are adopted by the company as of the specified effective date. Unless otherwise discussed, management believes that the impact of recently issued standards, which are not yet effective, will not have a material impact on the company’s consolidated financial statements upon adoption.
In May 2014, the FASB issued Accounting Standard Update (ASU) 2014-09 Revenue from Contracts with Customers. ASU 2014-09 supersedes prior revenue recognition guidance and provides a five step recognition framework that will require entities to recognize the amount of revenue to which it expects to be entitled for the transfer of goods and services. This new revenue recognition guidance is effective for the company in the first quarter of fiscal 2018 and may be implemented retrospectively to all years presented or in the period of adoption through a cumulative adjustment. The company believes that the impact of the implementation of this new guidance on its consolidated financial statements and disclosures will not be significant.
In August 2014, the FASB issued ASU 2014-15 Presentation of Financial Statements - Going Concern (Subtopic 205-40): Disclosure of Uncertainties about an Entity’s Ability to Continue as a Going Concern. ASU 2014-15 requires management to assess the entity’s ability to continue as a going concern, and to provide related disclosures in certain circumstances. ASU 2014-15 is effective for annual and interim periods beginning after December 15, 2016. The company believes that the impact of the implementation of this new guidance on its consolidated financial statements and disclosures will not be significant.
| (2) | ACQUISITION |
Troms Offshore Supply AS
On June 4, 2013, the company, through a subsidiary, acquired Troms Offshore Supply AS, a Norwegian company (Troms Offshore). At the time of the acquisition, Troms Offshore owned four deepwater PSVs, and had two additional deepwater PSVs under construction, one delivered shortly after the acquisition and the other delivered in January 2014. The purchase price (not including transaction costs) consisted of a $150.0 million cash payment to the shareholders of Troms Offshore and the assumption of approximately $261.3 million of combined Troms Offshore obligations, comprised of net interest-bearing debt and the remaining installment payments due on vessels under construction. The company has performed a fair value analysis and the purchase price was allocated to the acquired assets and liabilities based on their fair values resulting in $42.2 million of goodwill, all of which was allocated to our Sub-Saharan Africa/Europe segment.
The following table summarizes the allocation of the purchase price for the acquisition of Troms Offshore:
| (In thousands) | ||||||
| Cash |
$ | 22,263 | ||||
| Trade receivables and other current assets |
9,816 | |||||
| Vessels (A) |
245,605 | |||||
| Goodwill (B) |
42,160 | |||||
| Payable and other liabilities |
(13,020 | ) | ||||
| Notes payable |
(156,824 | ) | ||||
| Total purchase price |
$ | 150,000 | ||||
|
| ||||||
| (A) | Includes $10.7 million in costs attributed to vessels under construction. |
| (B) | Subsequently written off in December 2014. |
F-16
Table of Contents
Index to Financial Statements
The effect of the acquisition on pro forma results of operations and the consolidated statement of operations for the years ended March 31, 2014 and 2013 are immaterial and therefore not presented.
| (3) | INVESTMENT IN UNCONSOLIDATED COMPANIES |
Investments in unconsolidated affiliates, generally 50% or less owned partnerships and corporations, are accounted for by the equity method. Under the equity method, the assets and liabilities of the unconsolidated joint venture companies are not consolidated in the company’s consolidated balance sheet.
Investments in, at equity, and advances to unconsolidated joint venture companies at March 31, were as follows:
| (In thousands) |
|
Percentage Ownership |
|
2015 | 2014 | |||||||||
| Sonatide Marine, Ltd. (Angola) |
49 | % | $ | 63,893 | 62,126 | |||||||||
| DTDW Holdings, Ltd. (Nigeria) |
40 | % | 1,951 | 1,802 | ||||||||||
| Investments in, at equity, and advances to unconsolidated companies |
$ | 65,844 | 63,928 | |||||||||||
|
| ||||||||||||||
During the third quarter of fiscal 2014, the company advanced $1.9 million to a 40%-owned unconsolidated joint venture company located in Nigeria. The company also sold a vessel to this unconsolidated joint venture company for $23.3 million, and recognized a gain in the third quarter of fiscal 2014 of $7.9 million and a deferred gain of $5.2 million based on proportional ownership of the joint venture.
| (4) | INCOME TAXES |
We recognize deferred tax assets to the extent that we believe that these assets are more likely than not to be realized. In making such a determination, we consider all available positive and negative evidence, including future reversals of existing taxable temporary differences, projected future taxable income, tax-planning strategies, and results of recent operations. If we determine that we would be able to realize our deferred tax assets in the future in excess of their net recorded amount, we would make an adjustment to the deferred tax asset valuation allowance, which would reduce the provision for income taxes.
We record uncertain tax positions in accordance with ASC 740 on the basis of a two-step process in which (1) we determine whether it is more likely than not that the tax positions will be sustained on the basis of the technical merits of the position and (2) for those tax positions that meet the more-likely-than-not recognition threshold, we recognize the largest amount of tax benefit that is more than 50 percent likely to be realized upon ultimate settlement with the related tax authority.
Earnings before income taxes derived from United States and non-U.S. operations for the years ended March 31, are as follows:
| (In thousands) |
2015 | 2014 | 2013 | |||||||||||
| Non-U.S. |
$ | (38,282 | ) | 217,816 | 246,863 | |||||||||
| United States |
(27,985 | ) | (44,768 | ) | (51,700 | ) | ||||||||
| $ | (66,267 | ) | 173,048 | 195,163 | ||||||||||
|
| ||||||||||||||
F-17
Table of Contents
Index to Financial Statements
Income tax expense (benefit) for the years ended March 31, consists of the following:
| U.S. | ||||||||||||||||||
| (In thousands) |
Federal | State | International | Total | ||||||||||||||
| 2015 |
||||||||||||||||||
| Current |
$ | 4,869 | (9 | ) | 66,452 | 71,312 | ||||||||||||
| Deferred |
(72,389 | ) | — | — | (72,389 | ) | ||||||||||||
| $ | (67,520 | ) | (9 | ) | 66,452 | (1,077 | ) | |||||||||||
|
| ||||||||||||||||||
| 2014 |
||||||||||||||||||
| Current |
$ | (602 | ) | 4 | 68,100 | 67,502 | ||||||||||||
| Deferred |
(34,226 | ) | — | (483 | ) | (34,709 | ) | |||||||||||
| $ | (34,828 | ) | 4 | 67,617 | 32,793 | |||||||||||||
|
| ||||||||||||||||||
| 2013 |
||||||||||||||||||
| Current |
$ | (7,633 | ) | (313 | ) | 64,092 | 56,146 | |||||||||||
| Deferred |
(11,335 | ) | — | (398 | ) | (11,733 | ) | |||||||||||
| $ | (18,968 | ) | (313 | ) | 63,694 | 44,413 | ||||||||||||
|
| ||||||||||||||||||
The actual income tax expense above differs from the amounts computed by applying the U.S. federal statutory tax rate of 35% to pre-tax earnings as a result of the following for the years ended March 31:
| (In thousands) |
2015 | 2014 | 2013 | |||||||||||
| Computed “expected” tax expense |
$ | (23,193 | ) | 60,567 | 68,307 | |||||||||
| Increase (reduction) resulting from: |
||||||||||||||
| Foreign income taxed at different rates |
(13,570 | ) | (18,536 | ) | (23,965 | ) | ||||||||
| Foreign tax credits not previously recognized |
— | (483 | ) | (398 | ) | |||||||||
| Expenses which are not deductible for tax purposes |
472 | 720 | 498 | |||||||||||
| Non-deductible goodwill |
15,811 | 2,941 | — | |||||||||||
| Reversal of basis difference – sale leaseback |
— | (3,369 | ) | — | ||||||||||
| Valuation allowance – deferred tax assets |
17,829 | (5,821 | ) | 5,821 | ||||||||||
| Amortization of deferrals associated with intercompany sales to foreign tax jurisdictions |
(2,358 | ) | (1,475 | ) | (6,232 | ) | ||||||||
| Expenses which are not deductible for book purposes |
(832 | ) | (2,144 | ) | — | |||||||||
| Foreign taxes |
5,688 | |||||||||||||
| State taxes |
(6 | ) | 3 | (203 | ) | |||||||||
| Other, net |
(918 | ) | 390 | 585 | ||||||||||
| $ | (1,077 | ) | 32,793 | 44,413 | ||||||||||
|
| ||||||||||||||
Income taxes resulting from intercompany vessel sales, as well as the tax effect of any reversing temporary differences resulting from the sales, are deferred and amortized on a straight-line basis over the remaining useful lives of the vessels.
The company is not liable for U.S. taxes on undistributed earnings of most of its non-U.S. subsidiaries and business ventures that it considers indefinitely reinvested abroad because the company adopted the provisions of the American Jobs Creation Act of 2004 (the Act) effective April 1, 2005. All previously recorded deferred tax assets and liabilities related to temporary differences, foreign tax credits, or prior undistributed earnings of these entities whose future and prior earnings were anticipated to be indefinitely reinvested abroad were reversed in March 2005.
F-18
Table of Contents
Index to Financial Statements
The effective tax rate applicable to pre-tax earnings for the years ended March 31, is as follows:
| 2015 | 2014 | 2013 | ||||||||||||
| Effective tax rate applicable to pre-tax earnings |
1.63 | % | 18.95 | % | 22.76 | % |
The tax effects of temporary differences that give rise to significant portions of the deferred tax assets and deferred tax liabilities at March 31, is as follows:
| (In thousands) |
2015 | 2014 | ||||||||
| Deferred tax assets: |
||||||||||
| Accrued employee benefit plan costs |
$ | 21,874 | 21,423 | |||||||
| Stock based compensation |
8,731 | 7,162 | ||||||||
| Net operating loss and tax credit carryforwards |
2,327 | 2,895 | ||||||||
| Other |
3,901 | 2,896 | ||||||||
| Gross deferred tax assets |
36,833 | 34,376 | ||||||||
| Less valuation allowance |
(17,829 | ) | — | |||||||
| Net deferred tax assets |
19,004 | 34,376 | ||||||||
| Deferred tax liabilities: |
||||||||||
| Depreciation and amortization |
(19,004 | ) | (108,929 | ) | ||||||
| Gross deferred tax liabilities |
(19,004 | ) | (108,929 | ) | ||||||
| Net deferred tax assets (liabilities) |
$ | — | (74,553 | ) | ||||||
|
| ||||||||||
Management assesses the available positive and negative evidence to estimate whether sufficient future U.S. taxable income will be generated to permit use of the existing deferred tax assets. A significant piece of objective negative evidence evaluated was the cumulative loss for financial reporting purposes of domestic corporations that was incurred over the three-year period ended March 31, 2015. Such objective evidence limits the ability to consider other subjective evidence, such as our projections for future growth and tax planning strategies.
On the basis of this evaluation, as of March 31, 2015, a valuation allowance of $17,829 has been recorded against net deferred tax assets which are not more likely than not to be realized. The amount of the deferred tax asset considered realizable, however, could be adjusted if estimates of future U.S. taxable income during the carryforward period are reduced or increased or if objective negative evidence in the form of cumulative losses is no longer present and additional weight is given to subjective evidence such as our projections for growth and/or tax planning strategies.
The company has not recognized a U.S. deferred tax liability associated with temporary differences related to investments in foreign subsidiaries that are essentially permanent in duration. The differences relate primarily to undistributed earnings and stock basis differences. Though the company does not anticipate repatriation of funds, a current U.S. tax liability would be recognized when the company receives those foreign funds in a taxable manner such as through receipt of dividends or sale of investments. A determination of the unrecognized deferred tax liability for temporary differences related to investments in foreign subsidiaries is not practicable due to uncertainty regarding the use of foreign tax credits which would become available as a result of a transaction.
The amount of foreign income that U.S. deferred taxes has not been recognized upon, as of March 31, is as follows:
| (In thousands) |
2015 | |||||
| Foreign income not recognized for U.S. deferred taxes |
$ | 2,578,133 |
The company has the following foreign tax credit carry-forwards that expire in 2022.
| (In thousands) |
2015 | |||||
| Foreign tax credit carry-forwards |
$ | 2,327 |
F-19
Table of Contents
Index to Financial Statements
The company’s balance sheet reflects the following in accordance with ASC 740, Income Taxes at March 31:
| (In thousands) |
2015 | 2014 | ||||||||
| Tax liabilities for uncertain tax positions |
$ | 16,305 | 18,008 | |||||||
| Income tax payable |
44,607 | 36,472 |
Included in the liability balances for uncertain tax positions above are $8.3 million of penalties and interest. The tax liabilities for uncertain tax positions are primarily attributable to a permanent establishment issue related to a foreign joint venture. Penalties and interest related to income tax liabilities are included in income tax expense. Income tax payable is included in other current liabilities.
Unrecognized tax benefits, which are not included in the liability for uncertain tax positions above as they have not been recognized in previous tax filings, and which would lower the effective tax rate if realized, at March 31, are as follows:
| (In thousands) |
2015 | |||||
| Unrecognized tax benefit related to state tax issues |
$ | 11,685 | ||||
| Interest receivable on unrecognized tax benefit related to state tax issues |
32 |
A reconciliation of the beginning and ending amount of all unrecognized tax benefits, including the unrecognized tax benefit related to state tax issues and the liability for uncertain tax positions (but excluding related penalties and interest) for the years ended March 31, are as follows:
| (In thousands) |
2015 | 2014 | 2013 | |||||||||||
| Balance at April 1, |
$ | 20,066 | 14,868 | 15,727 | ||||||||||
| Additions based on tax positions related to the current year |
1,342 | 4,393 | 2,041 | |||||||||||
| Additions based on tax positions related to prior years |
— | 2,217 | — | |||||||||||
| Reductions for tax positions of prior years |
— | — | — | |||||||||||
| Exchange rate fluctuation |
— | — | — | |||||||||||
| Settlement and lapse of statute of limitations |
(1,710 | ) | (1,412 | ) | (2,900 | ) | ||||||||
| Balance at March 31, |
$ | 19,698 | 20,066 | 14,868 | ||||||||||
|
| ||||||||||||||
With limited exceptions, the company is no longer subject to tax audits by United States (U.S.) federal, state, local or foreign taxing authorities for years prior to 2007. The company has ongoing examinations by various state and foreign tax authorities and does not believe that the results of these examinations will have a material adverse effect on the company’s financial position or results of operations.
The company receives a tax benefit that is generated by certain employee stock benefit plan transactions. This benefit is recorded directly to additional paid-in-capital and does not reduce the company’s effective income tax rate. The tax benefit for the years ended March 31, are as follows:
| (In thousands) |
2015 | 2014 | 2013 | |||||||||||
| Excess tax benefits on stock benefit transactions |
$ | (1,784 | ) | 301 | 359 |
| (5) | INDEBTEDNESS |
Revolving Credit and Term Loan Agreement
In June 2013, the company amended and extended its existing credit facility. The amended credit agreement matures in June 2018 (the “Maturity Date”) and provides for a $900 million, five-year credit facility (“credit facility”) consisting of a (i) $600 million revolving credit facility (the “revolver”) and a (ii) $300 million term loan facility (“term loan”).
Borrowings under the credit facility are unsecured and bear interest at the company’s option at (i) the greater of prime or the federal funds rate plus 0.25 to 1.00%, or (ii) Eurodollar rates, plus margins ranging from 1.25 to 2.00% based on the company’s consolidated funded debt to capitalization ratio. Commitment fees on the unused portion of the facilities range from 0.15 to 0.30% based on the company’s funded debt to total capitalization ratio. The credit facility requires that the company maintain a ratio of consolidated debt to consolidated total capitalization that does not exceed 55%, and maintain a consolidated interest coverage ratio
F-20
Table of Contents
Index to Financial Statements
(essentially consolidated earnings before interest, taxes, depreciation and amortization, or EBITDA, for the four prior fiscal quarters to consolidated interest charges, including capitalized interest, for such period) of not less than 3.0 to 1.0. All other terms, including the financial and negative covenants, are customary for facilities of its type and consistent with the prior agreement in all material respects.
The company had $300 million in term loan borrowings and $20 million of revolver borrowings outstanding at March 31, 2015 (whose fair value approximates the carrying value because the borrowings bear interest at variable rates). The company had $580 million available under the revolver at March 31, 2015.
Senior Debt Notes
The determination of fair value includes an estimated credit spread between our long term debt and treasuries with similar matching expirations. The credit spread is determined based on comparable publicly traded companies in the oilfield service segment with similar credit ratings. These estimated fair values are based on Level 2 inputs.
September 2013 Senior Notes
On September 30, 2013, the company executed a note purchase agreement for $500 million and issued $300 million of senior unsecured notes to a group of institutional investors. The company issued the remaining $200 million of senior unsecured notes on November 15, 2013. A summary of these outstanding notes at March 31, is as follows:
| (In thousands, except weighted average data) | 2015 | 2014 | ||||||||
| Aggregate debt outstanding |
$ | 500,000 | 500,000 | |||||||
| Weighted average remaining life in years |
8.4 | 9.4 | ||||||||
| Weighted average coupon rate on notes outstanding |
4.86 | % | 4.86 | % | ||||||
| Fair value of debt outstanding |
516,879 | 520,979 | ||||||||
The multiple series of notes totaling $500 million were issued with maturities ranging from approximately seven to 12 years. The notes may be retired before their respective scheduled maturity dates subject only to a customary make-whole provision. The terms of the notes require that the company maintain a ratio of consolidated debt to consolidated total capitalization that does not exceed 55% and maintain a ratio of consolidated EBITDA to consolidated interest charges, including capitalized interest, of not less than 3.0 to 1.0.
August 2011 Senior Notes
On August 15, 2011, the company issued $165 million of senior unsecured notes to a group of institutional investors. A summary of these outstanding notes at March 31, is as follows:
| (In thousands, except weighted average data) |
2015 | 2014 | ||||||||
| Aggregate debt outstanding |
$ | 165,000 | 165,000 | |||||||
| Weighted average remaining life in years |
5.6 | 6.6 | ||||||||
| Weighted average coupon rate on notes outstanding |
4.42 | % | 4.42 | % | ||||||
| Fair value of debt outstanding |
167,910 | 168,653 |
The multiple series of notes were originally issued with maturities ranging from approximately eight to 10 years. The notes may be retired before their respective scheduled maturity dates subject only to a customary make-whole provision. The terms of the notes require that the company maintain a ratio of consolidated debt to consolidated total capitalization that does not exceed 55%.
F-21
Table of Contents
Index to Financial Statements
September 2010 Senior Notes
In fiscal 2011, the company completed the sale of $425 million of senior unsecured notes. A summary of the aggregate amount of these outstanding notes at March 31, is as follows:
| (In thousands, except weighted average data) |
2015 | 2014 | ||||||||
| Aggregate debt outstanding |
$ | 425,000 | 425,000 | |||||||
| Weighted average remaining life in years |
4.6 | 5.6 | ||||||||
| Weighted average coupon rate on notes outstanding |
4.25 | % | 4.25 | % | ||||||
| Fair value of debt outstanding |
431,296 | 436,254 |
The multiple series of these notes were originally issued with maturities ranging from five to 12 years. The notes may be retired before their respective scheduled maturity dates subject only to a customary make-whole provision. The terms of the notes require that the company maintain a ratio of consolidated debt to consolidated total capitalization that does not exceed 55%.
Included in accumulated other comprehensive income at March 31, 2015 and 2014, is an after-tax loss of $1.8 million ($2.6 million pre-tax), and $2.4 million ($3.7 million pre-tax), respectively, relating to the purchase of interest rate hedges, which are cash flow hedges, in July 2010 in connection with the September 2010 senior notes offering. The interest rate hedges settled in August 2010 concurrent with the pricing of the senior unsecured notes. The hedges met the effectiveness criteria and their acquisition costs are being amortized to interest expense over the term of the individual notes matching the term of the hedges to interest expense.
Notes totaling $42.5 million will mature in December 2015 but are not classified as current maturities of long-term debt because the company has the ability, if necessary, to fund this maturity with its credit facility.
July 2003 Senior Notes
In July 2003, the company completed the sale of $300 million of senior unsecured notes. A summary of the aggregate amount of these outstanding notes at March 31, is as follows:
| (In thousands, except weighted average data) |
2015 | 2014 | ||||||||
| Aggregate debt outstanding |
$ | 35,000 | 35,000 | |||||||
| Weighted average remaining life in years |
0.3 | 1.3 | ||||||||
| Weighted average coupon rate on notes outstanding |
4.61 | % | 4.61 | % | ||||||
| Fair value of debt outstanding |
35,197 | 36,018 |
The multiple series of notes were originally issued with maturities ranging from seven to 12 years. These notes can be retired in whole or in part prior to maturity for a redemption price equal to the principal amount of the notes redeemed plus a customary make-whole premium. The terms of the notes require that the company maintain a ratio of consolidated debt to consolidated total capitalization that does not exceed 55%.
Notes totaling $35 million will mature in July 2015 but are not classified as current maturities of long-term debt because the company has the ability, if necessary, to fund this maturity with its credit facility.
Troms Offshore Debt
In March 2015, Troms Offshore entered into a $29.5 million, U.S. dollar denominated, 12 year unsecured borrowing agreement which matures in January 2027 and is secured by a company guarantee. The loan requires semi-annual principal payments of $1.2 million (plus accrued interest) and bears interest at a fixed rate of 2.91% plus a premium based on Tidewater Inc.’s consolidated funded indebtedness to total capitalization ratio (currently equal to 1.30% for a total all-in rate of 4.21%). As of March 31, 2015, $29.5 million is outstanding under this agreement.
In January 2014, Troms Offshore entered into a 300 million NOK, 12 year unsecured borrowing agreement which matures in January 2026 and is secured by a company guarantee. The loan requires semi-annual principal payments of 12.5 million NOK (plus accrued interest) and bears interest at a fixed rate of 2.31% plus a premium based on Tidewater Inc.’s consolidated funded indebtedness to total capitalization ratio (currently equal to 1.50% for a total all-in rate of 3.81%). As of March 31, 2015, 275 million NOK (approximately $34.2 million) is outstanding under this agreement.
F-22
Table of Contents
Index to Financial Statements
In May 2012, Troms Offshore entered into a 204.4 million NOK denominated borrowing agreement which matures in May 2024. The loan requires semi-annual principal payments of 8.5 million NOK (plus accrued interest), bears interest at a fixed rate of 6.38% and is secured by certain guarantees and various types of collateral, including a vessel. In January 2014, the loan was amended to, among other things, change the interest rate to a fixed rate equal to 3.88% plus a premium based on Tidewater’s funded indebtedness to capitalization ratio (currently equal to 1.50% for a total all-in rate of 5.38%), change the borrower, change the export creditor guarantor, and to replace the vessel security with a company guarantee. As of March 31, 2015, 161.9 million NOK (approximately $20.2 million) is outstanding under this agreement.
In May 2012, Troms Offshore entered into a 35 million NOK denominated borrowing agreement with a shipyard which had one payment of 15 million NOK repaid in May 2014 and the remaining 20 million NOK maturity will be repaid in May 2015. In June 2013, Troms Offshore entered into a 25 million NOK denominated borrowing agreement a Norwegian Bank, which matures in June 2019. These borrowings bear interest based on three month NIBOR plus a credit spread of 2.0% to 3.5%. As of March 31, 2015 45 million NOK (approximately $5.6 million) is outstanding under these agreements.
Troms Offshore had 45 million NOK, or approximately $5.6 million, outstanding in floating rate debt at March 31, 2015 (whose fair value approximates the carrying value because the borrowings bear interest at variable NIBOR rates plus a margin). Troms Offshore also had 436.9 million NOK, or $54.4 million, of outstanding fixed rate debt at March 31, 2015, which has an estimated fair value of 435 million NOK, or $54.1 million as well as $29.5 million, of U.S. dollar denominated outstanding fixed rate debt at March 31, 2015, which has an estimated fair value of $29.5 million. These estimated fair values are based on Level 2 inputs.
In June 2013, Troms Offshore repaid a 188.9 million NOK loan (approximately $32.5 million), plus accrued interest that was secured with various guarantees and collateral, including a vessel.
During the second quarter of fiscal 2014, the company repaid prior to maturity 500 million Norwegian Kroner (NOK) denominated (approximately $82.1 million) public bonds (plus accrued interest) that had been issued by Troms Offshore in April 2013. The repayment of these bonds, at an average price of approximately 105.0% of par value, resulted in the recognition of a loss on early extinguishment of debt of approximately 26 million NOK (approximately $4.1 million).
F-23
Table of Contents
Index to Financial Statements
Summary of Long-Term Debt Outstanding
The following table summarizes debt outstanding at March 31:
| (In thousands) |
2015 | 2014 | ||||||||
| 4.61% July 2003 senior notes due fiscal 2016 |
$ | 35,000 | 35,000 | |||||||
| 3.28% September 2010 senior notes due fiscal 2016 |
42,500 | 42,500 | ||||||||
| 3.90% September 2010 senior notes due fiscal 2018 |
44,500 | 44,500 | ||||||||
| 3.95% September 2010 senior notes due fiscal 2018 |
25,000 | 25,000 | ||||||||
| 4.12% September 2010 senior notes due fiscal 2019 |
25,000 | 25,000 | ||||||||
| 4.17% September 2010 senior notes due fiscal 2019 |
25,000 | 25,000 | ||||||||
| 4.33% September 2010 senior notes due fiscal 2020 |
50,000 | 50,000 | ||||||||
| 4.51% September 2010 senior notes due fiscal 2021 |
100,000 | 100,000 | ||||||||
| 4.56% September 2010 senior notes due fiscal 2021 |
65,000 | 65,000 | ||||||||
| 4.61% September 2010 senior notes due fiscal 2023 |
48,000 | 48,000 | ||||||||
| 4.06% August 2011 senior notes due fiscal 2019 |
50,000 | 50,000 | ||||||||
| 4.54% August 2011 senior notes due fiscal 2022 |
65,000 | 65,000 | ||||||||
| 4.64% August 2011 senior notes due fiscal 2022 |
50,000 | 50,000 | ||||||||
| 4.26% September 2013 senior notes due fiscal 2021 |
123,000 | 123,000 | ||||||||
| 5.01% September 2013 senior notes due fiscal 2024 |
250,000 | 250,000 | ||||||||
| 5.16% September 2013 senior notes due fiscal 2026 |
127,000 | 127,000 | ||||||||
| NOK denominated notes due fiscal 2025 |
20,152 | 29,837 | ||||||||
| NOK denominated notes due fiscal 2026 |
34,234 | 50,028 | ||||||||
| NOK denominated borrowing agreement due fiscal 2016 |
2,490 | 5,837 | ||||||||
| NOK denominated borrowing agreement due fiscal 2019 |
3,112 | 4,168 | ||||||||
| USD denominated notes due fiscal 2027 |
29,488 | — | ||||||||
| Bank term loan due fiscal 2019 (A) |
300,000 | 300,000 | ||||||||
| Revolving line of credit due fiscal 2019 (A) |
20,000 | — | ||||||||
| $ | 1,534,476 | 1,514,870 | ||||||||
| Less: Current maturities of long-term debt |
10,181 | 9,512 | ||||||||
| Total |
$ | 1,524,295 | 1,505,358 | |||||||
|
| ||||||||||
| (A) | In May 2015, the company amended its existing credit facility, extending the due dates of the bank term loan and revolving line of credit until fiscal 2020. Refer to Note (19) for additional information regarding the amended and extended credit facility. |
Debt Costs
The company capitalizes a portion of its interest costs incurred on borrowed funds used to construct vessels. Interest and debt costs incurred, net of interest capitalized, for the years ended March 31, are as follows:
| (In thousands) | 2015 | 2014 | 2013 | |||||||||||
| Interest and debt costs incurred, net of interest capitalized |
$ | 50,029 | 43,814 | 29,745 | ||||||||||
| Interest costs capitalized |
13,673 | 11,497 | 10,602 | |||||||||||
| Total interest and debt costs |
$ | 63,702 | 55,311 | 40,347 | ||||||||||
|
| ||||||||||||||
| (6) | EMPLOYEE RETIREMENT PLANS |
U.S. Defined Benefit Pension Plan
The company has a defined benefit pension plan (pension plan) that covers certain U.S. citizen employees and other employees who are permanent residents of the United States. Benefits are based on years of service and employee compensation. In December 2009, the Board of Directors amended the pension plan to discontinue the accrual of benefits once the plan was frozen on December 31, 2010. On that date, previously accrued pension benefits under the pension plan were frozen for the approximately 60 active employees who participated in the plan. As of March 31, 2015, approximately 45 employees are covered by this plan. This change did not affect benefits earned by participants prior to January 1, 2011. Active employees who previously accrued benefits under the pension plan continue to accrue benefits as participants in the company’s defined contribution retirement plan effective January 1, 2011. The transfer of employee benefits from a defined benefit pension plan to a defined contribution plan have provided the company with more predictable retirement plan costs and cash flows. The company’s future benefit obligations and requirements for cash contributions for the frozen pension plan have also been reduced. Losses associated with the curtailment of the pension plan were immaterial. No amounts were contributed to the defined benefit pension plan during fiscal 2015 and 2014. Management is working with its actuary to determine if a contribution will be necessary during fiscal 2016.
F-24
Table of Contents
Index to Financial Statements
Supplemental Executive Retirement Plan
The company also offers a non-contributory, defined benefit supplemental executive retirement plan (supplemental plan) that provides pension benefits to certain employees in excess of those allowed under the company’s tax-qualified pension plan. A Rabbi Trust has been established for the benefit of participants in the supplemental plan. The Rabbi Trust assets, which are invested in a variety of marketable securities (but not Tidewater stock) are recorded at fair value with unrealized gains or losses included in other comprehensive income. Effective March 4, 2010, the supplemental plan was closed to new participation. The supplemental plan is a non-qualified plan and, as such, the company is not required to make contributions to the supplemental plan. The company did not contribute to the supplemental plan during fiscal 2015 and 2014. Management has not made any decision on funding the plan during fiscal 2016.
As a result of the May 31, 2012 retirement of Dean E. Taylor, former President and Chief Executive Officer of Tidewater Inc., Mr. Taylor received in December 2012 a $13 million lump sum distribution in full settlement and discharge of his supplemental executive retirement plan benefit. A settlement loss of $5.2 million related to this distribution was recorded in general and administrative expenses during the quarter ended December 31, 2012. The settlement loss is the result of the recognition of previously unrecognized actuarial losses that were being amortized over time from accumulated other comprehensive income to pension expense. As a result of the December 2012 lump sum distribution, a portion of the previously unrecognized actuarial losses was required to be recognized in earnings in the current quarter in accordance with ASC 715.
Investments held in a Rabbi Trust in the supplemental plan are included in other assets at fair value. The following table summarizes the carrying value of the trust assets, including unrealized gains or losses at March 31:
| (In thousands) | 2015 | 2014 | ||||||||
| Investments held in Rabbi Trust |
$ | 9,915 | 10,285 | |||||||
| Unrealized (loss) gains in carrying value of trust assets |
235 | 92 | ||||||||
| Unrealized (loss) gains in carrying value of trust assets are net of income tax expense of |
126 | 49 | ||||||||
| Obligations under the supplemental plan |
25,510 | 21,918 | ||||||||
The unrealized gains or losses in the carrying value of the trust assets, net of income tax expense, are included in accumulated other comprehensive income (other stockholders’ equity). To the extent that trust assets are liquidated to fund benefit payments, gains or losses, if any, will be recognized at that time. The company’s obligations under the supplemental plan are included in ‘accrued expenses’ and ‘other liabilities and deferred credits’ on the consolidated balance sheet.
Postretirement Benefit Plan
Qualified retired employees currently are covered by a program which provides limited health care and life insurance benefits. Costs of the program are based on actuarially determined amounts and are accrued over the period from the date of hire to the full eligibility date of employees who are expected to qualify for these benefits. This plan is funded through payments as benefits are required.
Investment Strategies
Pension Plan
The obligations of our pension plan are supported by assets held in a trust for the payment of future benefits. The company is obligated to adequately fund the trust. For the pension plan assets, the company has the following primary investment objectives: (1) closely match the cash flows from the plan’s investments from interest payments and maturities with the payment obligations from the plan’s liabilities; (2) closely match the duration of plan assets with the duration of plan liabilities and (3) enhance the plan’s investment returns without taking on undue risk by industries, maturities or geographies of the underlying investment holdings.
F-25
Table of Contents
Index to Financial Statements
If the plan assets are less than the plan liabilities, the pension plan assets will be invested exclusively in fixed income debt securities. Any investments in corporate bonds shall be at least investment grade, while mortgage and asset-backed securities must be rated “A” or better. If an investment is placed on credit watch, or is downgraded to a level below the investment grade, the holding will be liquidated, even at a loss, in a reasonable time period. The plan will only hold investments in equity securities if the plan assets exceed the estimated plan liabilities.
The cash flow requirements of the pension plan will be analyzed at least annually. Portfolio repositioning will be required when material changes to the plan liabilities are identified and when opportunities arise to better match cash flows with the known liabilities. Additionally, trades will occur when opportunities arise to improve the yield-to-maturity or credit quality of the portfolio.
The company’s policy for the pension plan is to contribute no less than the minimum required contribution by law and no more than the maximum deductible amount. The plan does not invest in Tidewater stock.
Supplemental Plan
The investment policy of the supplemental plan is to assess the historical returns and risk associated with alternative investment strategies to achieve an expected rate of return on plan assets. The objectives of the plan are designed to maximize total returns within prudent parameters of risk for a retirement plan of this type. The below table summarizes the supplemental plan’s minimum and maximum rate of return objectives for plan assets:
| Minimum Expected Rate of Return on Plan Assets |
Maximum Expected Rate of Return on Plan Assets |
|||||
| Equity securities |
5% | 7% | ||||
| Debt securities |
1% | 3% | ||||
| Cash and cash equivalents |
0% | 1% |
Whereas fluctuating rates of return are characteristic of the securities markets, the investment objective of the supplemental plan is to achieve investment returns sufficient to meet the actuarial assumptions. This is defined as an investment return greater than the current actuarial discount rate assumption of 4.00%, which is subject to annual upward or downward revisions.
The below table summarizes the supplemental plan’s minimum and maximum market value objectives for plan assets, which are based upon a five to ten year investment horizon:
| Minimum Market Value Objective for Plan Assets |
Maximum Market Value Objective for Plan Assets |
|||||
| Equity securities |
55% | 75% | ||||
| Debt securities |
25% | 45% | ||||
| Percentage of debt securities allowed in below investment grade bonds |
0% | 20% | ||||
| Cash and cash equivalents |
0% | 10% |
Equity holdings shall be restricted to issues of corporations that are actively traded on the major U.S. exchanges and NASDAQ. Debt security investments may include all securities issued by the U.S. Treasury or other federal agencies and investment grade corporate bonds. When a particular asset class exceeds its minimum or maximum allocation ranges, rebalancing will be addressed upon review of the quarterly performance reports and as cash contributions and withdrawals are made.
F-26
Table of Contents
Index to Financial Statements
Pension and Supplemental Plan Asset Allocations
The following table provides the target and actual asset allocations for the pension plan and the supplemental plan:
| Target | Actual as of 2015 |
Actual as of 2014 |
||||||||||||
| Pension plan: |
||||||||||||||
| Equity securities |
— | — | — | |||||||||||
| Debt securities |
100 | % | 95 | % | 96 | % | ||||||||
| Cash and other |
— | 5 | % | 4 | % | |||||||||
| Total |
100 | % | 100 | % | 100 | % | ||||||||
|
| ||||||||||||||
| Supplemental plan: |
||||||||||||||
| Equity securities |
65 | % | 58 | % | 60 | % | ||||||||
| Debt securities |
35 | % | 39 | % | 37 | % | ||||||||
| Cash and other |
— | 3 | % | 3 | % | |||||||||
| Total |
100 | % | 100 | % | 100 | % | ||||||||
|
| ||||||||||||||
Significant Concentration Risks
The pension plan and the supplemental plan assets are periodically evaluated for concentration risks. As of March 31, 2015, the company did not have any individual asset investments that comprised 10% or more of each plan’s overall assets.
The pension plan assets are primarily invested in debt securities with no more than the greater of 5% of the fixed income portfolio or $2.5 million being invested in the securities of a single issuer, except investments in U.S. Treasury and other federal agency obligations. In the event that plan assets exceed the estimated plan liabilities for the pension plan, up to two times the difference between the plan assets and plan liabilities may be invested in equity securities, and so long as equities do not exceed 15% of the market value of the assets. The investment policy sets forth that the maximum single investment of the equity portfolio is 5% of the portfolio market value. Further, investments in foreign securities are restricted to American Depository Receipts (ADR) and stocks listed on the U.S. stock exchanges and may not exceed 10% of the equity portfolio.
The current diversification policy for the supplemental plan sets forth that equity securities in any single industry sector shall not exceed 25% of the equity portfolio market value and shall not exceed 10% market value of the equity portfolio for equity holdings in any single corporation. Additionally, debt securities should be diversified between issuers within each sector with no one issuer comprising more than 10% of the aggregate fixed income portfolio, excluding issues of the U.S. Treasury or other federal agencies.
F-27
Table of Contents
Index to Financial Statements
Fair Value of Pension Plan and Supplemental Plan Assets
The fair value hierarchy for the pension plan and supplemental plan assets measured at fair value as of March 31, 2015, are as follows:
| (In thousands) | Fair Value | Quoted prices in markets (Level 1) |
Significant observable inputs (Level 2) |
Significant unobservable inputs (Level 3) |
||||||||||||||
| Pension plan measured at fair value: |
||||||||||||||||||
| Debt securities: |
||||||||||||||||||
| Government securities |
$ | 3,116 | 3,116 | — | — | |||||||||||||
| Collateralized mortgage securities |
400 | — | 400 | — | ||||||||||||||
| Corporate debt securities |
51,758 | — | 51,758 | — | ||||||||||||||
| Foreign debt securities |
1,529 | — | 1,529 | — | ||||||||||||||
| Cash and cash equivalents |
1,816 | — | 1,816 | — | ||||||||||||||
| Total |
$ | 58,619 | 3,116 | 55,503 | — | |||||||||||||
| Accrued income |
866 | 866 | — | — | ||||||||||||||
| Total fair value of plan assets |
$ | 59,485 | 3,982 | 55,503 | — | |||||||||||||
|
| ||||||||||||||||||
| Supplemental plan measured at fair value: |
||||||||||||||||||
| Equity securities: |
||||||||||||||||||
| Common stock |
$ | 3,859 | 3,859 | — | — | |||||||||||||
| Preferred stock |
— | — | — | — | ||||||||||||||
| Foreign stock |
201 | 201 | — | — | ||||||||||||||
| American depository receipts |
1,685 | 1,685 | — | — | ||||||||||||||
| Preferred American depository receipts |
15 | 15 | — | — | ||||||||||||||
| Real estate investment trusts |
59 | 59 | — | — | ||||||||||||||
| Debt securities: |
||||||||||||||||||
| Government debt securities |
1,926 | 1,377 | 549 | — | ||||||||||||||
| Open ended mutual funds |
1,916 | 1,916 | — | — | ||||||||||||||
| Cash and cash equivalents |
377 | 72 | 305 | — | ||||||||||||||
| Total |
$ | 10,038 | 9,184 | 854 | — | |||||||||||||
| Other pending transactions |
(123 | ) | (123 | ) | — | — | ||||||||||||
| Total fair value of plan assets |
$ | 9,915 | 9,061 | 854 | — | |||||||||||||
|
| ||||||||||||||||||
F-28
Table of Contents
Index to Financial Statements
The following table provides the fair value hierarchy for the pension plan and supplemental plan assets measured at fair value as of March 31, 2014:
| (In thousands) | Fair Value | Quoted prices in markets (Level 1) |
Significant observable inputs (Level 2) |
Significant unobservable inputs (Level 3) |
||||||||||||||
| Pension plan measured at fair value: |
||||||||||||||||||
| Debt securities: |
||||||||||||||||||
| Government securities |
$ | 2,935 | 2,935 | — | — | |||||||||||||
| Corporate debt securities |
50,113 | — | 50,113 | — | ||||||||||||||
| Foreign debt securities |
1,443 | — | 1,443 | — | ||||||||||||||
| Cash and cash equivalents |
1,511 | — | 1,511 | — | ||||||||||||||
| Total |
$ | 56,002 | 2,935 | 53,067 | — | |||||||||||||
| Accrued income |
894 | 894 | — | — | ||||||||||||||
| Total fair value of plan assets |
$ | 56,896 | 3,829 | 53,067 | — | |||||||||||||
|
| ||||||||||||||||||
| Supplemental plan measured at fair value: |
||||||||||||||||||
| Equity securities: |
||||||||||||||||||
| Common stock |
$ | 4,141 | 4,141 | — | — | |||||||||||||
| Preferred stock |
— | — | — | — | ||||||||||||||
| Foreign stock |
231 | 231 | — | — | ||||||||||||||
| American depository receipts |
1,809 | 1,809 | — | — | ||||||||||||||
| Preferred American depository receipts |
15 | 15 | — | — | ||||||||||||||
| Real estate investment trusts |
38 | 38 | — | — | ||||||||||||||
| Debt securities: |
||||||||||||||||||
| Government debt securities |
1,975 | 1,363 | 612 | — | ||||||||||||||
| Open ended mutual funds |
1,797 | 1,797 | — | — | ||||||||||||||
| Cash and cash equivalents |
369 | 57 | 312 | — | ||||||||||||||
| Total |
$ | 10,375 | 9,451 | 924 | — | |||||||||||||
| Other pending transactions |
(90 | ) | (90 | ) | — | — | ||||||||||||
| Total fair value of plan assets |
$ | 10,285 | 9,361 | 924 | — | |||||||||||||
|
| ||||||||||||||||||
F-29
Table of Contents
Index to Financial Statements
Plan Assets and Obligations
Changes in plan assets and obligations during the years ended March 31, 2015 and 2014 and the funded status of the U.S. defined benefit pension plan and the supplemental plan (referred to collectively as “Pension Benefits”) and the postretirement health care and life insurance plan (referred to as “Other Benefits”) at March 31, are as follows:
| Pension Benefits | Other Benefits | |||||||||||||||||
| (In thousands) | 2015 | 2014 | 2015 | 2014 | ||||||||||||||
| Change in benefit obligation: |
||||||||||||||||||
| Benefit obligation at beginning of year |
$ | 84,067 | 88,238 | 24,114 | 29,006 | |||||||||||||
| Service cost |
825 | 790 | 273 | 405 | ||||||||||||||
| Interest cost |
3,873 | 3,581 | 904 | 1,048 | ||||||||||||||
| Participant contributions |
— | — | 430 | 436 | ||||||||||||||
| ERRP reimbursement |
— | — | — | (26 | ) | |||||||||||||
| Plan settlement |
— | — | — | — | ||||||||||||||
| Benefits paid |
(4,405 | ) | (4,250 | ) | (863 | ) | (962 | ) | ||||||||||
| Actuarial (gain) loss |
11,948 | (4,292 | ) | (932 | ) | (5,793 | ) | |||||||||||
| Benefit obligation at end of year |
96,308 | 84,067 | 23,926 | 24,114 | ||||||||||||||
|
| ||||||||||||||||||
| Change in plan assets: |
||||||||||||||||||
| Fair value of plan assets at beginning of year |
$ | 56,896 | 59,431 | — | — | |||||||||||||
| Actual return |
6,069 | 776 | — | — | ||||||||||||||
| Employer contributions |
925 | 939 | 433 | 552 | ||||||||||||||
| Participant contributions |
— | — | 430 | 436 | ||||||||||||||
| ERRP reimbursement |
— | — | — | (26 | ) | |||||||||||||
| Plan settlement |
— | — | — | — | ||||||||||||||
| Benefits paid |
(4,405 | ) | (4,250 | ) | (863 | ) | (962 | ) | ||||||||||
| Fair value of plan assets at end of year |
59,485 | 56,896 | — | — | ||||||||||||||
|
| ||||||||||||||||||
| Reconciliation of funded status: |
||||||||||||||||||
| Fair value of plan assets |
$ | 59,485 | 56,896 | — | — | |||||||||||||
| Benefit obligation |
96,308 | 84,067 | 23,926 | 24,114 | ||||||||||||||
| Unfunded status |
$ | (36,823 | ) | (27,171 | ) | (23,926 | ) | (24,114 | ) | |||||||||
|
| ||||||||||||||||||
| Net amount recognized in the balance sheet consists of: |
||||||||||||||||||
| Current liabilities |
$ | (1,306 | ) | (1,162 | ) | (908 | ) | (1,129 | ) | |||||||||
| Noncurrent liabilities |
(35,517 | ) | (26,009 | ) | (23,018 | ) | (22,985 | ) | ||||||||||
| Net amount recognized |
$ | (36,823 | ) | (27,171 | ) | (23,926 | ) | (24,114 | ) | |||||||||
|
| ||||||||||||||||||
The following table provides the projected benefit obligation and accumulated benefit obligation for the pension plans:
| (In thousands) | 2015 | 2014 | ||||||||
| Projected benefit obligation |
$ | 96,308 | 84,067 | |||||||
| Accumulated benefit obligation |
92,808 | 81,223 | ||||||||
F-30
Table of Contents
Index to Financial Statements
The following table provides information for pension plans with an accumulated benefit obligation in excess of plan assets (includes both the pension plan and supplemental plan):
| (In thousands) | 2015 | 2014 | ||||||||
| Projected benefit obligation |
$ | 96,308 | 84,067 | |||||||
| Accumulated benefit obligation |
92,808 | 81,223 | ||||||||
| Fair value of plan assets |
59,485 | 56,896 | ||||||||
Net periodic benefit cost for the pension plan and the supplemental plan for the fiscal years ended March 31 include the following components:
| (In thousands) | 2015 | 2014 | 2013 | |||||||||||
| Service cost |
$ | 825 | 790 | 983 | ||||||||||
| Interest cost |
3,873 | 3,581 | 4,098 | |||||||||||
| Expected return on plan assets |
(2,741 | ) | (2,871 | ) | (2,748 | ) | ||||||||
| Amortization of prior service cost |
50 | 50 | 50 | |||||||||||
| Recognized actuarial loss |
988 | 1,103 | 1,648 | |||||||||||
| Settlement loss |
— | — | 5,161 | |||||||||||
| Net periodic pension cost |
$ | 2,995 | 2,653 | 9,192 | ||||||||||
|
| ||||||||||||||
Net periodic benefit cost for the postretirement health care and life insurance plan for the fiscal years ended March 31 include the following components:
| (In thousands) | 2015 | 2014 | 2013 | |||||||||||
| Service cost |
$ | 273 | 405 | 475 | ||||||||||
| Interest cost |
904 | 1,048 | 1,235 | |||||||||||
| Amortization of prior service cost |
(2,032 | ) | (2,032 | ) | (2,032 | ) | ||||||||
| Recognized actuarial loss |
(1,299 | ) | (396 | ) | — | |||||||||
| Net periodic postretirement benefit |
$ | (2,154 | ) | (975 | ) | (322 | ) | |||||||
|
| ||||||||||||||
Other changes in plan assets and benefit obligations recognized in other comprehensive income for the fiscal years ended March 31 include the following components:
| Pension Benefits | Other Benefits | |||||||||||||||||
| (In thousands) | 2015 | 2014 | 2015 | 2014 | ||||||||||||||
| Change in benefit obligation |
||||||||||||||||||
| Net loss (gain) |
$ 8,621 | (2,196 | ) | (932 | ) | (5,793 | ) | |||||||||||
| Settlement loss |
— | — | — | — | ||||||||||||||
| Amortization of prior service cost |
(50 | ) | (50 | ) | 2,032 | 2,032 | ||||||||||||
| Amortization of net (loss) gain |
(988 | ) | (1,103 | ) | 1,299 | 395 | ||||||||||||
| Other |
— | — | — | 197 | ||||||||||||||
| Total recognized in other comprehensive income (loss) |
$ 7,583 | (3,349 | ) | 2,399 | (3,169 | ) | ||||||||||||
| Net of tax |
7,583 | (2,177 | ) | 1,559 | (2,060 | ) | ||||||||||||
|
| ||||||||||||||||||
Amounts recognized as a component of accumulated other comprehensive (income) loss as of March 31, 2015 are as follows:
| (In thousands) | Pension Benefits | Other Benefits | ||||||||
| Unrecognized actuarial (gain) loss |
$ 21,781 | (6,620 | ) | |||||||
| Unrecognized prior service cost (benefit) |
36 | (4,588 | ) | |||||||
| Pre-tax amount included in accumulated other comprehensive loss (income) |
$ 21,817 | (11,208 | ) | |||||||
|
| ||||||||||
The company expects to recognize the following amounts as a component of net periodic benefit costs during the next fiscal year:
| (In thousands) | Pension Benefits | Other Benefits | ||||||||
| Unrecognized actuarial loss |
$ (2,213) | 582 | ||||||||
| Unrecognized prior service cost (benefit) |
(36) | 2,041 | ||||||||
F-31
Table of Contents
Index to Financial Statements
Assumptions used to determine net benefit obligations for the fiscal years ended March 31, are as follows:
| Pension Benefits | Other Benefits | |||||||||||||||||
| 2015 | 2014 | 2015 | 2014 | |||||||||||||||
| Discount rate |
4.00% | 4.75% | 4.00% | 4.75% | ||||||||||||||
| Rates of annual increase in compensation levels |
3.00% | 3.00% | N/A | N/A | ||||||||||||||
Assumptions used to determine net periodic benefit costs for the fiscal years ended March 31, are as follows:
| Pension Benefits | Other Benefits | |||||||||||||||||||||||||
| 2015 | 2014 | 2013 | 2015 | 2014 | 2013 | |||||||||||||||||||||
| Discount rate |
4.75% | 4.25% | 4.75% | 4.75% | 4.25% | 4.75% | ||||||||||||||||||||
| Expected long-term rate of return on assets |
5.00% | 5.00% | 5.00% | N/A | N/A | N/A | ||||||||||||||||||||
| Rates of annual increase in compensation levels |
3.00% | 3.00% | 3.00% | N/A | N/A | N/A | ||||||||||||||||||||
To develop the expected long-term rate of return on assets assumption, the company considered the current level of expected returns on various asset classes. The expected return for each asset class was then weighted based on the target asset allocation to develop the expected return on plan assets assumption for the portfolio.
Based upon the assumptions used to measure the company’s qualified pension and postretirement benefit obligations at March 31, 2015, including pension and postretirement benefits attributable to estimated future employee service, the company expects that benefits to be paid over the next ten years will be as follows:
| (In thousands) | ||||||||||
| Year ending March 31, | Pension Benefits |
Other Benefits |
||||||||
| 2016 |
$ 5,578 | 908 | ||||||||
| 2017 |
5,818 | 982 | ||||||||
| 2018 |
6,077 | 1,046 | ||||||||
| 2019 |
6,343 | 1,128 | ||||||||
| 2020 |
7,419 | 1,187 | ||||||||
| 2021 – 2025 |
33,918 | 6,501 | ||||||||
| Total 10-year estimated future benefit payments |
$ 65,153 | 11,752 | ||||||||
|
| ||||||||||
Health Care Cost Trends
The following table discloses the assumed health care cost trends used in measuring the accumulated postretirement benefit obligation and net periodic postretirement benefit cost at March 31, 2015 for pre-65 medical and prescription drug coverage and for post-65 medical coverage, including expected future trend rates.
| Pre-65 | Post-65 | |||||||||
| Year ending March 31, 2015 |
||||||||||
| Accumulated postretirement benefit obligation |
7.9 | % | 6.9 | % | ||||||
| Net periodic postretirement benefit obligation |
8.2 | % | 6.9 | % | ||||||
| Ultimate health care cost trend |
4.5 | % | 4.5 | % | ||||||
| Ultimate year health care cost trend rate is achieved |
2029 | 2029 | ||||||||
| Year ending March 31, 2016 |
||||||||||
| Net periodic postretirement benefit obligation |
7.9 | % | 6.9 | % | ||||||
A one-percentage rate increase (decrease) in the assumed health care cost trend rates has the following effects on the accumulated postretirement benefit obligation as of March 31:
| (In thousands) | 1% Increase |
1% Decrease |
||||||||
| Accumulated postretirement benefit obligation |
$ | 3,702 | 2,978 | |||||||
| Aggregate service and interest cost |
170 | 138 | ||||||||
F-32
Table of Contents
Index to Financial Statements
Defined Contribution Plans
Prior to February 2013, the company maintained the below two defined contribution plans. The plans were merged in February 2013 to provide administrative efficiencies, potential savings on service provider fees and to simplify the participant experience. Following the merger, the provisions of the two plans remained substantially similar with the exception of cost neutral changes that were approved to simplify the administration of the combined plan.
Retirement Contributions
All eligible U.S. fleet personnel, along with all new eligible employees of the company hired after December 31, 1995 are eligible to receive retirement contributions. Effective January 1, 2011, the active employees who participated in the now frozen defined benefit pension plan also became eligible for retirement contributions. This benefit is noncontributory by the employee, but the company contributes, in cash, 3% of an eligible employee’s compensation to a trust on behalf of the employees. The active employees who participated in the now frozen defined benefit pension plan may receive an additional 1% to 8% depending on age and years of service. Company contributions vest over five years.
401(k) Savings Contribution
Upon meeting various citizenship, age and service requirements, employees are eligible to participate in a defined contribution savings plan and can contribute from 2% to 75% of their base salary to an employee benefit trust. The company matches with company common stock 50% of the first 8% of eligible compensation deferred by the employee. Company contributions vest over five years.
The plan held the following number of shares of Tidewater common stock as of March 31:
| 2015 | 2014 | |||||||||
| Number of shares of Tidewater common stock held by 401(k) plan |
299,256 | 273,662 | ||||||||
The amounts charged to expense related to the above defined contribution plans, for the fiscal years ended March 31, are as follows:
| (In thousands) | 2015 | 2014 | 2013 | |||||||||||
| Defined contribution plans expense, net of forfeitures |
$ 4,216 | 3,854 | 3,356 | |||||||||||
| Defined contribution plans forfeitures |
52 | 82 | 115 | |||||||||||
Other Plans
A non-qualified supplemental savings plan is provided to executive officers who have the opportunity to defer up to 50% of their eligible compensation that cannot be deferred under the existing 401(k) plan due to IRS limitations. A company match may be provided on these contributions equal to 50% of the first 8% of eligible compensation deferred by the employee to the extent the employee is not able to receive the full amount of company match to the 401(k) plan due to IRS limitations. The plan also allows participants to defer up to 100% of their bonuses. In addition, an amount equal to any refunds that must be made due to the failure of the 401(k) nondiscrimination test may be deferred into this plan.
Effective March 4, 2010, the non-qualified supplemental savings plan was modified to allow the company to contribute restoration benefits to eligible employees. Employees who do not accrue a benefit in the supplemental executive retirement plan and who are eligible for a contribution in the defined contribution retirement plan automatically become eligible for the restoration benefit when the employee’s eligible retirement compensation exceeds the section 401(a)(17) limit. The restoration benefit is noncontributory by the employee, but the company contributes, in cash, 3% of an eligible employee’s compensation above the 401(a)(17) limit to a trust on behalf of the employees. The active employees who participated in the now frozen defined benefit pension plan may receive an additional 1% to 8% depending on age and years of service.
F-33
Table of Contents
Index to Financial Statements
The company also provides a multinational savings plan to eligible non-U.S. citizen employees working outside their respective country of origin and who have been employed for one year of continuous service with the company. Participants of the plan may contribute 1% to 15% of their base salary. The company matches, in cash, 50% of the first 6% of eligible compensation deferred by the employee. Company contributions vest over six years.
The amounts charged to expense related to the multinational pension savings plan contributions, for the fiscal years ended March 31, are as follows:
| (In thousands) | 2015 | 2014 | 2013 | |||||||||||
| Multinational pension savings plan expense |
$ | 494 | 465 | 420 | ||||||||||
The company also provides certain benefits programs which are maintained in several other countries that provide retirement income for covered employees.
| (7) | OTHER ASSETS, ACCRUED EXPENSES, OTHER CURRENT LIABILITIES, AND OTHER LIABILITIES AND DEFERRED CREDITS |
A summary of other assets at March 31, is as follows:
| (In thousands) | 2015 | 2014 | ||||||||
| Recoverable insurance losses |
$ 10,468 | 5,219 | ||||||||
| Deferred income tax assets |
19,004 | 34,376 | ||||||||
| Deferred finance charges – revolver |
7,396 | 8,728 | ||||||||
| Savings plans and supplemental plan |
23,208 | 23,212 | ||||||||
| Noncurrent tax receivable |
— | 9,106 | ||||||||
| Other |
15,120 | 15,744 | ||||||||
| $ 75,196 | 96,385 | |||||||||
|
| ||||||||||
A summary of accrued expenses at March 31, is as follows:
| (In thousands) | 2015 | 2014 | ||||||||
| Payroll and related payables |
$ 32,041 | 27,248 | ||||||||
| Commissions payable |
8,282 | 8,263 | ||||||||
| Accrued vessel expenses |
79,549 | 96,468 | ||||||||
| Accrued interest expense |
14,514 | 14,816 | ||||||||
| Other accrued expenses |
11,869 | 10,507 | ||||||||
| $ 146,255 | 157,302 | |||||||||
|
| ||||||||||
A summary of other current liabilities at March 31, is as follows:
| (In thousands) | 2015 | 2014 | ||||||||
| Taxes payable |
$ | 56,620 | 56,080 | |||||||
| Deferred gain on vessel sales - current |
25,057 | 13,996 | ||||||||
| Other |
784 | 491 | ||||||||
| $ | 82,461 | 70,567 | ||||||||
|
| ||||||||||
A summary of other liabilities and deferred credits at March 31, is as follows:
| (In thousands) | 2015 | 2014 | ||||||||
| Postretirement benefits liability |
$ | 23,018 | 23,185 | |||||||
| Pension liabilities |
41,279 | 35,234 | ||||||||
| Deferred gain on vessel sales |
136,238 | 85,316 | ||||||||
| Other |
34,573 | 35,469 | ||||||||
| $ | 235,108 | 179,204 | ||||||||
|
| ||||||||||
F-34
Table of Contents
Index to Financial Statements
| (8) | STOCK-BASED COMPENSATION AND INCENTIVE PLANS |
The company’s employee stock option, restricted stock awards, restricted stock units (that settle in Tidewater common stock), phantom stock, and cash-based performance unit plans, are long-term retention plans that are intended to attract, retain and provide incentives for talented employees, including officers and non-employee directors, and to align stockholder and employee interests. The company believes its employee restricted stock, stock unit and stock option plans are critical to its operations and productivity. The employee stock option plans allow the company to grant, on a discretionary basis, both incentive and non-qualified stock options as well as restricted stock. The restricted stock and stock unit awards include performance shares.
Under the company’s stock option and restricted stock plans, the Compensation Committee of the Board of Directors has the authority to grant stock options, restricted shares and restricted stock units of the company’s stock to officers and other key employees. Under the terms of the plans, stock options are granted with an exercise price equal to the stock’s closing fair market value on the date of grant.
The number of common stock shares reserved for issuance under the plans and the number of shares available for future grants at March 31, are as follows:
| March 31, 2015 |
||||||
| Shares of common stock reserved for issuance under the plans |
2,580,880 | |||||
| Shares of common stock available for future grants |
871,674 | |||||
Stock Option Plans
The company has granted stock options to its directors and employees, including officers, under several different stock incentive plans. Generally, options granted vest annually over a three-year vesting period measured from the date of grant. Options not previously exercised expire at the earlier of either three months after termination of the grantee’s employment or ten years after the date of grant. Upon retirement, unvested stock options are forfeited. The retiree has two years post retirement to exercise vested options. All of the stock options are classified as equity awards.
The company uses the Black-Scholes option-pricing model to determine the fair value of options granted and to calculate the share-based compensation expense. Stock options were granted in fiscal 2015 but not during fiscal 2014 and 2013. The fair value and assumptions used for the stock options issued during the year ended March 31, 2015, are as follows:
| 2015 | ||||||
| Weighted average fair value of stock options granted |
$5.54 | |||||
| Risk-free interest rate |
1.82% | |||||
| Expected dividend yield |
2.4% | |||||
| Expected stock price volatility |
30% | |||||
| Expected stock option life |
6.5 years | |||||
F-35
Table of Contents
Index to Financial Statements
The following table sets forth a summary of stock option activity of the company for fiscal years 2015, 2014 and 2013:
| Weighted-average Exercise Price |
Number of Shares |
|||||||||
| Outstanding at March 31, 2012 |
$ 44.93 | 1,725,424 | ||||||||
| Granted |
— | — | ||||||||
| Exercised |
29.09 | (141,542 | ) | |||||||
| Expired or cancelled/forfeited |
52.47 | (27,607 | ) | |||||||
| Outstanding at March 31, 2013 |
46.24 | 1,556,275 | ||||||||
| Granted |
— | — | ||||||||
| Exercised |
36.86 | (186,219 | ) | |||||||
| Expired or cancelled/forfeited |
— | — | ||||||||
| Outstanding at March 31, 2014 |
47.51 | 1,370,056 | ||||||||
| Granted |
22.80 | 428,326 | ||||||||
| Exercised |
35.21 | (29,118 | ) | |||||||
| Expired or cancelled/forfeited |
42.97 | (60,058 | ) | |||||||
| Outstanding at March 31, 2015 |
$ 41.69 | 1,709,206 | ||||||||
|
| ||||||||||
Information regarding the 1,709,206 options outstanding at March 31, 2015 can be grouped into three general exercise-price ranges as follows:
| Exercise Price Range | ||||||||||||||
| At March 31, 2015 | $22.80 - $33.83 | $45.75 - $48.96 | $55.76 - $65.69 | |||||||||||
| Options outstanding |
728,287 | 394,515 | 586,404 | |||||||||||
| Weighted average exercise price of options outstanding |
$27.34 | $45.86 | $56.70 | |||||||||||
| Weighted average remaining contractual life of options outstanding |
7.5 years | 5.0 years | 2.0 years | |||||||||||
| Options exercisable |
307,488 | 394,515 | 586,404 | |||||||||||
| Weighted average exercise price of options exercisable |
$33.56 | $45.86 | $56.70 | |||||||||||
| Weighted average remaining contractual life of options exercisable |
4.1 years | 5.0 years | 2.0 years | |||||||||||
|
| ||||||||||||||
Additional information regarding stock options for the years ended March 31, are as follows:
| (In thousands, except number of stock options and weighted average price) | 2015 | 2014 | 2013 | |||||||||||
| Intrinsic value of options exercised |
$ | 475 | 4,059 | 2,544 | ||||||||||
| Number of stock options vested |
7,527 | 8,926 | 144,537 | |||||||||||
| Fair value of stock options vested |
$ | 40 | 115 | 2,154 | ||||||||||
| Number of options exercisable |
1,288,407 | 1,370,056 | 1,547,349 | |||||||||||
| Weighted average exercise price of options exercisable |
$ | 47.86 | 47.51 | 46.27 | ||||||||||
|
There was no intrinsic value of any options outstanding or exercisable at March 31, 2015.
Stock option compensation expense along with the reduction effect on basic and diluted earnings per share, and stock option compensation expense for the years ended March 31, are as follows:
| ||||||||||||||
| (In thousands, except per share data) | 2015 | 2014 | 2013 | |||||||||||
| Stock option compensation expense |
$ | 71 | 12 | 2,049 | ||||||||||
| Basic earnings per share reduced by |
0.00 | 0.00 | 0.03 | |||||||||||
| Diluted earnings per share reduced by |
0.00 | 0.00 | 0.03 | |||||||||||
As of March 31, 2015, total unrecognized stock-option compensation costs amounted to $2.3 million or $1.3 million net of tax. No stock option compensation costs were capitalized as part of the cost of an asset. Compensation costs for stock options that have not yet vested will be recognized as the underlying stock options vest over the appropriate future period. The level of unrecognized stock-option compensation will be affected by any future stock option grants and by the termination of any employee who has received stock options that are unvested as of the employee’s termination date.
F-36
Table of Contents
Index to Financial Statements
Restricted Stock Awards
The company has granted restricted stock awards to key employees, including officers, under several different employee stock plans, which provide for the granting of restricted stock and/or performance awards to officers and key employees. The company awards both time-based and performance-based shares of restricted stock awards. The restrictions on the time-based restricted stock awards lapse generally over a four year period and require no goals to be achieved other than the passage of time and continued employment. The restrictions on the performance-based restricted stock award lapse if the company meets specific targets. During the restricted period, the restricted shares may not be transferred or encumbered, but the recipient has the right to vote the restricted shares and receive dividends on the time-based restricted shares. Dividends are accrued on performance-based restricted shares and ultimately paid only if the performance criteria are achieved. All of the restricted stock awards are classified as equity awards in stockholders’ equity. The value of restricted stock awards is generally amortized on a straight-line basis to earnings over the respective vesting periods and is net of forfeitures.
The following table sets forth a summary of restricted stock award activity of the company for fiscal 2015, 2014 and 2013:
|
Weighted-average Fair Value |
Time Based Shares |
Performance Based Shares |
||||||||||||
| Non-vested balance at March 31, 2012 |
51.43 | 266,418 | 223,641 | |||||||||||
| Granted |
— | — | — | |||||||||||
| Vested |
49.53 | (110,802 | ) | — | ||||||||||
| Cancelled/forfeited |
56.84 | (7,067 | ) | (59,503 | ) | |||||||||
| Non-vested balance at March 31, 2013 |
50.95 | 148,549 | 164,138 | |||||||||||
| Granted |
55.04 | 28,963 | — | |||||||||||
| Vested |
56.71 | (93,739 | ) | (1,749 | ) | |||||||||
| Cancelled/forfeited |
35.76 | (4,949 | ) | (56,123 | ) | |||||||||
| Non-vested balance at March 31, 2014 |
$ 54.75 | 78,824 | 106,266 | |||||||||||
| Granted |
— | — | — | |||||||||||
| Vested |
57.46 | (48,574 | ) | — | ||||||||||
| Cancelled/forfeited |
47.09 | (5,959 | ) | (37,861 | ) | |||||||||
| Non-vested balance at March 31, 2015 |
$ 56.94 | 24,291 | 68,405 | |||||||||||
|
| ||||||||||||||
Restrictions on approximately 24,291 time-based restricted stock awards outstanding at March 31, 2015 will lapse during fiscal 2016, and restrictions on 68,405 performance-based restricted stock awards outstanding at March 31, 2015 will lapse during fiscal 2016 if performance-based targets are achieved.
Restricted stock award compensation expense and grant date fair value for the years ended March 31, is as follows:
| (In thousands) | 2015 | 2014 | 2013 | |||||||||||
| Grant date fair value of restricted stock vested |
$ | 2,791 | 4,671 | 5,488 | ||||||||||
| Restricted stock compensation expense |
2,855 | 4,633 | 5,987 | |||||||||||
As of March 31, 2015, total unrecognized restricted stock compensation costs amounted to $0.5 million, or $0.5 million net of tax. No restricted stock award compensation costs were capitalized as part of the costs of an asset. The amount of unrecognized restricted stock compensation will be affected by any future restricted stock grants and by the separation of an employee from the company who has received restricted stock grants that are unvested as of their separation date. There were no modifications to the restricted stock awards during fiscal 2015, 2014 and 2013.
Restricted Stock Units
The company has granted restricted stock units (RSUs) to key employees, including officers, under the company’s employee stock plan, which provide for the granting of restricted stock units to officers and key employees. The company awards time-based units, where each unit represents the right to receive, at the end of a vesting period, one unrestricted share of Tidewater common stock with no exercise price. The company also awards performance-based RSUs, where each unit represents the right to receive, at the end of a vesting period, up to two shares of Tidewater common stock with no exercise price. Vesting of the various
F-37
Table of Contents
Index to Financial Statements
performance-based restricted stock units is based on metrics such as a three year Total Shareholder Return (TSR) as measured against a three year TSR of a defined peer group and Return on Total Capital (ROTC) for the company over a three year performance period. The company uses assumptions underlying the Black-Scholes methodology to produce a Monte Carlo simulation model to value the TSR performance-based restricted stock units. The fair value of the ROTC performance-based RSUs and time-based RSUs is based on the market price of our common stock on the date of grant. The restrictions on the time-based RSUs lapse over a three year period from the date of the award and require no goals to be achieved other than the passage of time and continued employment. The restrictions on the performance-based restricted stock units lapse if the company meets specific targets as defined. During the restricted period, the RSUs may not be transferred or encumbered, but the recipient has the right to receive dividend equivalents on the restricted stock units, but have no voting rights until the units vest. Dividend equivalents are accrued on performance-based restricted shares and ultimately paid only if the performance criteria are achieved. Upon retirement, the Compensation Committee of the Board of Directors will take into consideration the accelerated vesting of the restricted stock units after certain age and service criteria are met. Restricted stock unit compensation costs are recognized on a straight-line basis over the vesting period, and are net of forfeitures.
The following table sets forth a summary of restricted stock unit activity of the company for fiscal 2015, 2014, and 2013:
|
Weighted-average Fair Value |
Time Based Units |
Weight-average Fair Value |
Performance Based Units |
|||||||||||||||
| Non-vested balance at March 31, 2012 |
$ 54.18 | 248,288 | 72.23 | 84,394 | ||||||||||||||
| Granted |
50.16 | 259,158 | 67.11 | 84,323 | ||||||||||||||
| Vested |
54.17 | (79,507) | — | — | ||||||||||||||
| Cancelled/forfeited |
54.18 | (10,274) | 72.23 | (3,476) | ||||||||||||||
| Non-vested balance at March 31, 2013 |
$ 51.69 | 417,665 | 69.62 | 165,241 | ||||||||||||||
| Granted |
49.37 | 265,937 | 56.44 | 91,132 | ||||||||||||||
| Vested |
52.22 | (175,673) | — | — | ||||||||||||||
| Cancelled/forfeited |
52.43 | (12,720) | — | — | ||||||||||||||
| Non-vested balance at March 31, 2014 |
$ 50.24 | 495,209 | 53.58 | 256,373 | ||||||||||||||
| Granted |
54.48 | 551 | — | — | ||||||||||||||
| Vested |
50.92 | (237,229) | — | — | ||||||||||||||
| Cancelled/forfeited |
49.62 | (7,381) | — | — | ||||||||||||||
| Non-vested balance at March 31, 2015 |
$ 49.50 | 251,150 | 53.58 | 256,373 | ||||||||||||||
|
| ||||||||||||||||||
Restrictions on approximately 156,772 time-based units and 92,194 performance-based units outstanding at March 31, 2015 will vest during fiscal 2016.
Restricted stock unit compensation expense and grant date fair value for the year ended March 31, is as follows:
| (In thousands) | 2015 | 2014 | 2013 | |||||||||||
| Grant date fair value of restricted stock units vested |
$ | 12,080 | 9,176 | 4,307 | ||||||||||
| Restricted stock unit compensation expense |
17,214 | 12,664 | 7,836 | |||||||||||
As of March 31, 2015, total unrecognized restricted stock unit compensation costs amounted to $16.6 million, or $11.4 million net of tax. No restricted stock unit compensation costs were capitalized as part of the costs of an asset. The amount of unrecognized restricted stock unit compensation costs will be affected by any future restricted stock unit grants and by the separation of an employee from the company who has received restricted stock units that are unvested as of their separation date. There were no modifications to the restricted stock units during fiscal 2015, 2014 and 2013.
F-38
Table of Contents
Index to Financial Statements
Phantom Stock Plan
The company provides a Phantom Stock Plan to provide additional incentive compensation to key employees including officers of the company. The plan awards phantom stock units to participants who have the right to receive the value of a share of common stock in cash from the company. Participants have no voting or other rights as a shareholder with respect to any common stock as a result of participation in the phantom stock plan. The phantom shares generally have a three or four-year vesting period from the grant date of the award provided the employee remains employed by the company during the vesting period. Participants receive dividend equivalents at the same rate as dividends on the company’s common stock.
The following table sets forth a summary of phantom stock activity of the company for fiscal 2015, 2014 and 2013:
| Weighted-average Grant-Date Fair Value |
Time Based Shares |
Performance Based Shares |
||||||||||||
| Non-vested balance at March 31, 2012 |
49.23 | 103,311 | 28,059 | |||||||||||
| Granted |
50.76 | 27,100 | — | |||||||||||
| Vested |
43.60 | (54,823 | ) | — | ||||||||||
| Cancelled/forfeited |
54.26 | (6,993 | ) | (28,059 | ) | |||||||||
| Non-vested balance at March 31, 2013 |
51.74 | 68,595 | — | |||||||||||
| Granted |
48.81 | 31,736 | 1,291 | |||||||||||
| Vested |
51.45 | (35,095 | ) | — | ||||||||||
| Cancelled/forfeited |
50.93 | (4,354 | ) | — | ||||||||||
| Non-vested balance at March 31, 2014 |
$ | 50.94 | 60,882 | 1,291 | ||||||||||
| Granted |
22.80 | 546,058 | — | |||||||||||
| Vested |
48.47 | (33,987 | ) | — | ||||||||||
| Cancelled/forfeited |
50.70 | (5,482 | ) | |||||||||||
| Non-vested balance at March 31, 2015 |
$ | 24.07 | 567,471 | 1,291 | ||||||||||
|
| ||||||||||||||
Restrictions on 196,047 time-based shares will lapse in fiscal 2016. The fair value of the non-vested phantom shares at March 31, 2015 is $19.14 per unit.
Phantom stock compensation expense and grant date fair value of phantom stock vested for the years ended March 31, are as follows:
| (In thousands) | 2015 | 2014 | 2013 | |||||||||||
| Grant date fair value of phantom stock vested |
$ | 1,647 | 1,806 | 2,390 | ||||||||||
| Phantom stock compensation expense |
933 | 1,706 | 2,507 | |||||||||||
| Phantom stock compensation costs capitalized as part of an asset |
— | — | — | |||||||||||
As of March 31, 2015, total unrecognized phantom stock compensation costs amounted to $13.4 million, or $10.8 million net of tax. The liability for this plan will be adjusted in the future until paid to the participant to reflect the value of the units at the respective quarter end Tidewater stock price.
Cash-based Performance Plan
The company provides a Cash-based Performance Plan as additional incentive compensation to officers of the company. The plan awards units equal to cash to participants where each unit represents the right to receive, at the end of a vesting period, up to two dollars.
Vesting of the various cash-based performance units (CBU) is based on metrics such as a three year TSR as measured against a three year TSR of a defined peer group and ROTC for the company over a three year performance period. The company uses assumptions underlying the Black-Scholes methodology to produce a Monte Carlo simulation model to value the TSR cash-based performance units. The fair value of the ROTC CBUs is based on the market price of our common stock on the date of grant less dividends associated with the ROTC component. The CBUs do not receive dividend equivalents. The restrictions on the CBU’s lapse if the company meets specific targets as defined. Upon retirement, the Compensation Committee of the Board of Directors will take into consideration the accelerated vesting of the CBUs after certain age and service criteria are met. Cash-based performance unit compensation costs are recognized on a straight-line basis over the vesting period, and are net of forfeitures.
F-39
Table of Contents
Index to Financial Statements
The following table sets forth a summary of cash-based performance plan unit activity of the company for fiscal 2015:
|
Weighted-average Grant-Date Fair Value |
Performance Based Units |
|||||||||
| Non-vested balance at March 31, 2014 |
— | — | ||||||||
| Granted |
1.10 | 4,519,703 | ||||||||
| Vested |
— | — | ||||||||
| Cancelled/forfeited |
— | — | ||||||||
| Non-vested balance at March 31, 2015 |
$ | 1.10 | 4,519,703 | |||||||
|
| ||||||||||
No cash-based performance units outstanding at March 31, 2015 will vest during fiscal 2016.
Cash-based performance unit compensation expense and grant date fair value for the year ended March 31, is as follows:
| (In thousands) | 2015 | |||||
| Grant date fair value of cash-based performance units |
$ | — | ||||
| Cash-based performance unit compensation expense |
72 | |||||
As of March 31, 2015, total unrecognized cash-based performance plan compensation costs amounted to $4.9 million, or $3.3 million net of tax. No cash-based performance plan compensation costs were capitalized as part of the costs of an asset. The amount of unrecognized cash-based performance plan compensation costs will be affected by any future cash-based unit grants and by the separation of an employee from the company who has received cash-based performance plan units that are unvested as of their separation date. There were no modifications to the cash-based performance plan units during fiscal 2015.
Non-Employee Board of Directors Deferred Stock Unit Plan
The company provides a Deferred Stock Unit Plan to its non-employee directors. The plan provides that each non-employee director is granted annually a number of stock units having an aggregate value of $115,000 beginning fiscal 2013 and $100,000 prior to fiscal 2013 on the date of grant. Dividend equivalents are paid on the stock units at the same rate as dividends on the company’s common stock and are re-invested as additional stock units based upon the fair market value of a share of company common stock on the date of payment of the dividend. A stock unit represents the right to receive from the company the equivalent value of one share of company’s common stock in cash. Payment of the value of the stock unit granted from inception of the plan to March 2013 shall be made upon the earlier of the date that is 15 days following the date the participant ceases to be a director for any reason or upon a change of control of the company. For these units, the participant can elect to receive five annual installments or a lump sum. Beginning with deferred stock units granted in fiscal 2014, participants have the additional option of electing a distribution made upon the earlier of the date that is 15 days following the date the participant ceases to be a director for any reason or upon a change of control of the company or distribution date commencing on an anniversary of the grant date, whichever is earlier. For the units granted in fiscal 2015 and 2014, the participant can elect to receive annual installments of two to ten years or a lump sum distribution.
F-40
Table of Contents
Index to Financial Statements
The following table sets forth a summary of deferred stock unit activity of the company for fiscal 2015, 2014 and 2013:
|
Weighted-average Grant-Date Fair Value |
Number Of Units |
|||||||||
| Balance at March 31, 2012 |
50.56 | 114,580 | ||||||||
| Dividend equivalents reinvested |
46.73 | 2,472 | ||||||||
| Retirement distribution |
— | — | ||||||||
| Granted |
50.48 | 26,955 | ||||||||
| Balance at March 31, 2013 |
50.48 | 144,007 | ||||||||
| Dividend equivalents reinvested |
53.82 | 2,492 | ||||||||
| Retirement distribution |
59.65 | (26,661 | ) | |||||||
| Granted |
49.47 | 26,550 | ||||||||
| Balance at March 31, 2014 |
$ | 48.68 | 146,388 | |||||||
| Dividend equivalents reinvested |
34.63 | 3,794 | ||||||||
| Retirement distribution |
47.50 | (21,492 | ) | |||||||
| Granted |
19.14 | 56,370 | ||||||||
| Balance at March 31, 2015 |
$ | 39.53 | 185,060 | |||||||
|
| ||||||||||
Deferred stock units are fully vested at the time of grant. The liability for this plan will be adjusted in the future until paid to the participant to reflect the value of the units at the respective quarter end Tidewater stock price.
Deferred stock unit compensation expense, which is reflected in general and administrative expenses, for the years ended March 31, are as follows:
| (In thousands) | 2015 | 2014 | 2013 | |||||||||||
| Deferred stock units compensation expense (benefit) |
$ | (2,477) | 1,737 | 1,085 | ||||||||||
| (9) | STOCKHOLDERS’ EQUITY |
Common Stock
The number of authorized and issued common stock and preferred stock at March 31, are as follows:
| 2015 | 2014 | |||||||
| Common stock shares authorized |
125,000,000 | 125,000,000 | ||||||
| Common stock par value |
$0.10 | $0.10 | ||||||
| Common stock shares issued |
47,029,359 | 49,730,442 | ||||||
| Preferred stock shares authorized |
3,000,000 | 3,000,000 | ||||||
| Preferred stock par value |
No par | No par | ||||||
| Preferred stock shares issued |
— | — | ||||||
Common Stock Repurchases
In May 2015, the company’s Board of Directors authorized an extension of its current common stock repurchase program from its original expiration date of June 30, 2015 to June 30, 2016. If shares are purchased in open market or privately-negotiated transactions pursuant to this share repurchase program, the company will use its available cash and/or borrowings under its revolving credit facility or other borrowings to fund any share repurchases. As of March 31, 2015, the company had $100 million remaining authorized under this repurchase program available to repurchase shares. The company evaluates share repurchase opportunities relative to other investment opportunities and in the context of current conditions in the credit and capital markets.
In May 2014, the company’s Board of Directors authorized the company to spend up to $200 million to repurchase shares of its common stock in open-market or privately-negotiated transactions. The effective period for this authorization is July 1, 2014 through June 30, 2015. The company uses its available cash and, when considered advantageous, borrowings under its revolving credit facility or other borrowings, to fund any share repurchases. The company evaluates share repurchase opportunities relative to other investment opportunities and in the context of current conditions in the credit and capital markets. At March 31, 2015, $100 million remains available to repurchase shares under the May 2014 share repurchase program.
F-41
Table of Contents
Index to Financial Statements
In May 2013, the company’s Board of Directors authorized the company to spend up to $200 million to repurchase shares of its common stock in open-market or privately-negotiated transactions. The effective period for this authorization is July 1, 2013 through June 30, 2014. No shares were repurchased under the May 2013 program.
The value of common stock repurchased, along with number of shares repurchased, and average price paid per share for the years ended March 31, are as follows:
| (In thousands, except share and per share data) | 2015 | 2014 | 2013 | |||||||||||
| Aggregate cost of common stock repurchased |
$ | 99,999 | — | 85,034 | ||||||||||
| Shares of common stock repurchased |
2,841,976 | — | 1,856,900 | |||||||||||
| Average price paid per common share |
$ | 35.19 | — | 45.79 | ||||||||||
Dividend Program
The declaration of dividends is at the discretion of the company’s Board of Directors. The Board of Directors declared the following dividends for the years ended March 31, are as follows:
| (In thousands, except per share data) | 2015 | 2014 | 2013 | |||||||||||
| Dividends declared |
$ | 49,127 | 49,973 | 49,766 | ||||||||||
| Dividend per share |
1.00 | 1.00 | 1.00 | |||||||||||
Accumulated Other Comprehensive Loss
The changes in accumulated other comprehensive income by component, net of tax for the years ended March 31, are as follows:
| For the year ended March 31, 2014 | For the year ended March 31, 2015 | |||||||||||||||||||||||||||||||||||||||||
| (in thousands) | Balance at 3/31/13 |
Gains/(losses) in OCI |
Reclasses from OCI to net income |
Net period OCI |
Remaining balance 3/31/14 |
Balance at 3/31/14 |
Gains/(losses) in OCI |
Reclasses from OCI to net income |
Net period OCI |
Remaining balance 3/31/15 |
||||||||||||||||||||||||||||||||
| Available for sale securities |
(121 | ) | (92 | ) | 305 | 213 | 92 | 92 | (64 | ) | 207 | 143 | 235 | |||||||||||||||||||||||||||||
| Currency translation adjustment |
(9,811 | ) | — | — | — | (9,811 | ) | (9,811 | ) | — | — | — | (9,811 | ) | ||||||||||||||||||||||||||||
| Pension/Post-retirement benefits |
(4,353 | ) | 4,237 | — | 4,237 | (116 | ) | (116 | ) | (9,013 | ) | — | (9,013 | ) | (9,129 | ) | ||||||||||||||||||||||||||
| Interest rate swap |
(2,856 | ) | — | 466 | 466 | (2,390 | ) | (2,390 | ) | — | 717 | 717 | (1,673 | ) | ||||||||||||||||||||||||||||
| Total |
(17,141 | ) | 4,145 | 771 | 4,916 | (12,225 | ) | (12,225 | ) | (9,077 | ) | 924 | (8,153 | ) | (20,378 | ) | ||||||||||||||||||||||||||
|
| ||||||||||||||||||||||||||||||||||||||||||
The following table summarizes the reclassifications from accumulated other comprehensive loss to the condensed consolidated statement of income for the years ended March 31,
| Year Ended March 31, |
Affected line item in the condensed consolidated statements of income |
|||||||||||
| (In thousands) | 2015 | 2014 | ||||||||||
| Realized gains on available for sale securities |
$ | 207 | 469 | Interest income and other, net | ||||||||
| Amortization of interest rate swap |
717 | 717 | Interest and other debt costs | |||||||||
| Total pre-tax amounts |
924 | 1,186 | ||||||||||
| Tax effect |
— | 415 | ||||||||||
| Total gains for the period, net of tax |
$ | 924 | 771 | |||||||||
|
| ||||||||||||
Included in accumulated other comprehensive loss for the year ended March 31, 2015, is an after-tax loss of $1.8 million ($2.6 million pre-tax) relating to interest rate hedges, which are cash flow hedges, entered into in July 2010 in connection with the September 2010 senior notes offering as disclosed in Note 5. The interest rate hedges settled in August 2010 concurrent with the pricing of the senior unsecured notes. The hedges met the effectiveness criteria and will be amortized over the term of the individual notes matching the term of the hedges to interest expense.
F-42
Table of Contents
Index to Financial Statements
| (10) | EARNINGS PER SHARE |
The components of basic and diluted earnings per share for the years ended March 31, are as follows:
| (In thousands, except share and per share data) | 2015 | 2014 | 2013 | |||||||||||
| Net earnings (loss) available to common shareholders (A) |
$ | (65,190 | ) | 140,255 | 150,750 | |||||||||
| Weighted average outstanding shares of common stock, basic (B) |
48,658,840 | 49,392,749 | 49,550,391 | |||||||||||
| Dilutive effect of options and restricted stock awards |
— | 287,365 | 183,649 | |||||||||||
| Weighted average common stock and equivalents (C) |
48,658,840 | 49,680,114 | 49,734,040 | |||||||||||
| Earnings per share, basic (A/B) |
$ | (1.34 | ) | 2.84 | 3.04 | |||||||||
| Earnings per share, diluted (A/C) |
$ | (1.34 | ) | 2.82 | 3.03 | |||||||||
| Additional information: |
||||||||||||||
| Antidilutive options and restricted stock shares |
284,635 | 34,486 | 82,758 | |||||||||||
| (11) | SALE/LEASBACK ARRANGEMENTS |
Fiscal 2015 Sale/Leasebacks
During fiscal 2015, the company sold six vessels to unrelated third parties, and simultaneously entered into bareboat charter agreements with the purchasers. Under the sale/leaseback agreements the company has the right to re-acquire the vessel for a fixed percentage of the original sales price at a defined date during the lease, deliver the vessel to the owners at the end of the lease term, purchase the vessel at its then fair market value at the end of the lease term or extend the leases for 24 months at mutually agreeable lease rates.
The company is accounting for these transactions as sale/leasebacks with operating lease treatment and will record the payments as vessel operating lease expense on a straight-line basis over the lease term. The deferred gains will be amortized to gain on asset dispositions, net ratably over the respective lease term. Any deferred gain balance remaining upon the repurchase of the vessels would reduce the vessels’ stated cost if the company elects to exercise the purchase options.
The following table provides the number of vessels, total proceeds, carrying values at the time of sale, deferred gains recognized, lease expirations, and contractual purchase option timing for the vessels sold and leased back by the company during fiscal 2015:
| Fiscal 2015 Quarter | Number of Vessels |
Total Proceeds |
Carrying Value at time of Sale |
Deferred Gain at time |
Lease Term in Years |
Purchase Option Percentage |
Purchase at end of: |
|||||||||||||||
| First |
1 | $ | 13,400 | $ | 4,002 | $ | 9,398 | 7 | 61% | 6th Year | ||||||||||||
| Second |
1 | 19,350 | 8,214 | 11,136 | 8.5 | 47% | 8th Year | |||||||||||||||
| Third |
3 | 78,200 | 33,233 | 44,967 | 8 – 9 | 60% | 7th or 8th Year | |||||||||||||||
| Fourth |
1 | 13,000 | 5,115 | 7,885 | 7 | 50% | 6th Year | |||||||||||||||
| 6 | $ | 123,950 | $ | 50,564 | $ | 73,386 | ||||||||||||||||
|
| ||||||||||||||||||||||
Fiscal 2014 Sale/Leasebacks
During fiscal 2014, the company sold ten vessels to unrelated third parties, and simultaneously entered into bareboat charter agreements with the purchasers. Under the sale/leaseback agreements the company has the right to re-acquire the vessel for a fixed percentage of the original sales price at a defined date during the lease, deliver the vessel to the owners at the end of the lease term, purchase the vessel at its then fair market value at the end of the lease term or extend the leases for 24 months at mutually agreeable lease rates.
The company is accounting for these transactions as sale/leasebacks with operating lease treatment and will record the payments as vessel operating lease expense on a straight-line basis over the lease term. The deferred gains will be amortized to gain on asset dispositions, net ratably over the respective lease term. Any deferred gain balance remaining upon the repurchase of the vessels would reduce the vessels’ stated cost if
F-43
Table of Contents
Index to Financial Statements
the company elects to exercise the purchase options.
The following table provides the number of vessels, total proceeds, carrying values at the time of sale, deferred gains recognized, lease expirations, and contractual purchase option timing for the vessels sold and leased back by the company during fiscal 2014:
| Fiscal 2014 Quarter | Number of Vessels |
Total Proceeds |
Carrying Value at time of Sale |
Deferred Gain at time of Sale |
Lease Term in Years |
Purchase Option Percentage |
Purchase at end of: |
|||||||||||||||
| Second |
2 | $ | 65,550 | $ | 34,325 | $ | 31,225 | 7 | 55% | 6th Year | ||||||||||||
| Third |
4 | 141,900 | 105,649 | 36,251 | 7 - 9 | 54 - 68% | 6th or 8th Year | |||||||||||||||
| Fourth |
4 | 63,305 | 32,845 | 30,460 | 7 – 10 | 53 - 59% | 6th or 9th Year | |||||||||||||||
| 10 | $ | 270,755 | $ | 172,819 | $ | 97,936 | ||||||||||||||||
|
| ||||||||||||||||||||||
Fiscal 2010 Sale/Leaseback
In June and July 2009, the company sold six vessels to unrelated third-party companies, and simultaneously entered into bareboat charter agreements for the vessels with the purchasers.
The sale/leaseback transactions resulted in proceeds to the company of approximately $101.8 million and a deferred gain of $39.6 million. The aggregate carrying value of the six vessels was $62.2 million at the dates of sale. The company accounted for the transactions as sale/leaseback transactions with operating lease treatment and expenses lease payments over the five year charter hire operating lease terms.
During the fourth quarter of fiscal 2014, the company elected to repurchase all six vessels from their respective lessors for an aggregate price of $78.8 million. Three of these were subsequently sold and leased back in March 2014. Two additional vessels were sold and leased back in April 2014 and March 2015, respectively. The carrying value of these purchased vessels has been reduced by the previously unrecognized deferred gain of $39.6 million. Refer to “Fiscal 2014 Sale/Leasebacks” above.
Fiscal 2006 Sale/Leaseback
In March 2006, the company entered into agreements to sell five of its vessels that were under construction at the time to an unrelated third party, for $76.5 million and simultaneously entered into bareboat charter agreements with the same unrelated third party upon the vessels’ delivery to the market. Construction on these five vessels was completed at various times between March 2006 and March 2008, at which time the company sold the respective vessels and simultaneously entered into bareboat charter agreements.
The company accounted for all five transactions as sale/leaseback transactions with operating lease treatment. Accordingly, the company did not record the assets on its books and the company is expensing periodic lease payments. The operating lease for all five charter hire agreements were for eight year terms.
In September 2012, the company elected to repurchase one of its leased vessels from the lessor for $8.8 million. During October 2012, the company repurchased a second leased vessel, for $8.4 million. In March 2014, the company repurchased a third and fourth leased vessel for a total cost of $22.8 million. In November 2014, the company repurchased a fifth leased vessel for a total cost of $11.2 million. Three of these vessels were sold and leased back in fiscal 2015.
F-44
Table of Contents
Index to Financial Statements
Future Minimum Lease Payments
As of March 31, 2015, the future minimum lease payments for the vessels under the operating lease terms are as follows:
| Fiscal year ending (In thousands) | Fiscal 2015 Sale/Leaseback |
Fiscal 2014 Sale/Leaseback |
Total | |||||||||||
| 2016 |
$ 9,485 | 20,879 | 30,364 | |||||||||||
| 2017 |
9,485 | 20,879 | 30,364 | |||||||||||
| 2018 |
9,605 | 23,485 | 33,090 | |||||||||||
| 2019 |
10,234 | 24,800 | 35,034 | |||||||||||
| 2020 |
11,497 | 25,519 | 37,016 | |||||||||||
| Thereafter |
30,866 | 39,744 | 70,610 | |||||||||||
| Total future lease payments |
$ 81,172 | 155,306 | 236,478 | |||||||||||
|
| ||||||||||||||
| (12) | COMMITMENTS AND CONTINGENCIES |
Compensation Commitments
Compensation continuation agreements exist with all of the company’s officers whereby each receives compensation and benefits in the event that their employment is terminated following certain events relating to a change in control of the company. The maximum amount of cash compensation that could be paid under the agreements, based on present salary levels, is approximately $43 million.
Vessel Commitments
The table below summarizes the company’s various vessel commitments to acquire and construct new vessels, by vessel type, as of March 31, 2015:
| (In thousands, except vessel count) | Number of Vessels |
Total Cost | Invested Through 3/31/15 |
Remaining Balance 3/31/15 |
||||||||||||||
| Vessels under construction: |
||||||||||||||||||
| Deepwater PSVs (A) |
17 | $ | 576,847 | 223,301 | 353,546 | |||||||||||||
| Towing supply vessels (A) |
6 | 105,804 | 79,297 | 26,507 | ||||||||||||||
| Other |
1 | 8,014 | 8,014 | — | ||||||||||||||
| Total vessel commitments |
24 | $ | 690,665 | 310,612 | 380,053 | |||||||||||||
|
| ||||||||||||||||||
| (A) | In April 2015, the company cancelled the construction contracts for three towing-supply vessels. There were approximately $13 million of remaining costs to be incurred on these three vessels at the time of termination. In May 2015, the company and the Chinese shipyard that is constructing two 275-foot deepwater PSVs came to an agreement that provides the company an option to take delivery of one or both vessels at any time prior to June 30, 2016 or receive the return of installments aggregating $5.7 million per vessel at the end of this period. There were approximately $41 million of remaining costs to be incurred on these two vessels at the time of the agreement. Refer to Note (19) for a discussion of these vessel construction contract modifications. |
The total cost of the various vessel new-build commitments includes contract costs and other incidental costs. The company has vessels under construction at a number of different shipyards around the world. The deepwater PSVs under construction range between 3,800 and 6,000 deadweight tons (DWT) of cargo capacity while the towing-supply/supply vessels under construction have 7,145 brake horsepower (BHP). The new-build vessels began to deliver in April 2015, with delivery of the final new-build vessel expected in September 2016.
With its commitment to modernizing its fleet through its vessel construction and acquisition program over the past decade, the company has successfully replaced the vast majority of the older vessels in its fleet with fewer, larger and more efficient vessels that have a more extensive range of capabilities. These efforts are expected to continue through the delivery of the remaining 21 vessels currently under construction, with the company anticipating that it will use some portion of its future operating cash flows and existing borrowing capacity as well as possible new borrowings or lease finance arrangements in order to fund current and future commitments in connection with the completion of the fleet renewal and modernization program.
F-45
Table of Contents
Index to Financial Statements
The company is experiencing substantial delay with one fast supply boat under construction in Brazil that was originally scheduled to be delivered in September 2009. On April 5, 2011, pursuant to the vessel construction contract, the company sent the subject shipyard a letter initiating arbitration in order to resolve disputes of such matters as the shipyard’s failure to achieve payment milestones, its failure to follow the construction schedule, and its failure to timely deliver the vessel. The company has suspended construction on the vessel and both parties continue to pursue that arbitration. The company has third party credit support in the form of insurance coverage for 90% of the progress payments made on this vessel, or all but approximately $2.4 million of the carrying value of the accumulated costs through March 31, 2015. The company had committed and invested $8 million as of March 31, 2015.
In December 2013, the company took delivery of the second of two deepwater PSVs constructed in a U.S. shipyard. In connection with the delivery of those vessels, the company and the shipyard agreed to hold $11.7 million in escrow with a financial institution pending resolution of disputes over whether all or a portion of the escrowed funds were due to the shipyard as the shipyard has claimed. In October 2014, the parties resolved their pending disputes subject to a confidentiality provision and agreed on the split of the funds held in escrow. The amounts returned from the escrow to the company resulted in a reduction in the cost of the two acquired vessels, one of which was subsequently sold to an unaffiliated financial institution in connection with a sale/lease transaction that closed in the third quarter of fiscal 2014. The portion of the returned funds attributed to the vessel that was sold was recorded as a deferred gain that is being amortized over the 10-year lease term.
The company generally requires shipyards to provide third party credit support in the event that vessels are not completed and delivered timely and in accordance with the terms of the shipbuilding contracts. That third party credit support typically guarantees the return of amounts paid by the company and generally takes the form of refundment guarantees or standby letters of credit issued by major financial institutions generally located in the country of the shipyard. While the company seeks to minimize its shipyard credit risk by requiring these instruments, the ultimate return of amounts paid by the company in the event of shipyard default is still subject to the creditworthiness of the shipyard and the provider of the credit support, as well as the company’s ability to successfully pursue legal action to compel payment of these instruments. When third party credit support that is acceptable to the company is not available or cost effective, the company endeavors to limit its credit risk by minimizing pre-delivery payments and through other contract terms with the shipyard.
Merchant Navy Officers Pension Fund
On July 15, 2013, a subsidiary of the company was placed into administration in the United Kingdom. Joint administrators were appointed to administer and distribute the subsidiary’s assets to the subsidiary’s creditors. The vessels owned by the subsidiary had become aged and were no longer economical to operate, which has caused the subsidiary’s main business to decline in recent years. Only one vessel generated revenue as of the date of the administration. As part of the administration, the company agreed to acquire seven vessels from the subsidiary (in exchange for cash) and to waive certain intercompany claims. The purchase price valuation for the vessels, all but one of which were stacked, was based on independent, third party appraisals of the vessels.
The company previously reported that a subsidiary of the company is a participating employer in an industry-wide multi-employer retirement fund in the United Kingdom, known as the Merchant Navy Officers Pension Fund (MNOPF). The subsidiary that participates in the MNOPF is the entity that was placed into administration in the U.K. The MNOPF is that subsidiary’s largest creditor, and has claimed as an unsecured creditor in the administration. The Company believed that the administration was in the best interests of the subsidiary and its principal stakeholders, including the MNOPF. The MNOPF indicated that it did not object to the insolvency process and that, aside from asserting its claim in the subsidiary’s administration and based on the company’s representations of the financial status and other relevant aspects of the subsidiary, the MNOPF will not pursue the subsidiary in connection with any amounts due or which may become due to the fund.
In December 2013, the administration was converted to a liquidation. That conversion allowed for an interim cash liquidation distribution to be made to the MNOPF. The conversion is not expected to have any impact on the company and the liquidation is expected to be completed in calendar 2015. The company believes that the liquidation will resolve the subsidiary’s participation in the MNOPF. The company also believes that the ultimate resolution of this matter will not have a material effect on the consolidated financial statements.
F-46
Table of Contents
Index to Financial Statements
Sonatide Joint Venture
As previously reported, in November 2013, a subsidiary of the company and its joint venture partner in Angola, Sonangol Holdings Lda. (“Sonangol”), executed a new joint venture agreement for their joint venture, Sonatide. The new joint venture agreement is currently effective and will expire, unless extended, two years after an Angolan entity, which is intended to be one of the Sonatide group of companies, has been incorporated. The Angolan entity is expected to be incorporated by late 2015 after certain Angolan regulatory approvals have been obtained.
The challenges for the company to successfully operate in Angola remain significant. As the company has previously reported, on July 1, 2013, elements of new legislation (the “forex law”) became effective that generally require oil companies that engage in exploration and production activities offshore Angola through governmental concessions to pay for goods and services provided by foreign exchange residents in Angolan kwanzas that are initially deposited into an Angolan bank account. The forex law also imposes documentation and other requirements on service companies such as Sonatide in order to effect payments that are denominated in currencies other than Angolan kwanzas. The forex law has resulted in, and will likely continue to result in, substantial customer payments being made to Sonatide in Angolan kwanzas. This cumbersome payment process has imposed and could continue to impose a burden on Tidewater’s management of its cash and liquidity, because of the risks that the conversion of Angolan kwanzas into U.S. dollars and the subsequent expatriation of the funds could result in payment delays and currency devaluation prior to conversion of kwanzas to dollars, as well as burden the company with additional operating costs to convert kwanzas into dollars and potentially additional taxes.
In response to the new forex law, Tidewater and Sonangol negotiated and signed an agreement that is set to expire, unless extended, in November 2015 (the “consortium agreement”) that is intended to allow the Sonatide joint venture to enter into contracts with customers that allocate billings for services provided by Sonatide between (i) billings for local services that are provided by a foreign exchange resident (that must be paid in kwanzas), and (ii) billings for services provided by offshore residents (that can be paid in dollars). Sonatide successfully converted select customer contracts to this split billing arrangement during the quarter ended March 31, 2015 and continues to discuss this type of billing arrangement with other customers. We are unable to determine the impact that an inability to extend the consortium agreement would have on the existing split billing arrangements, and the ability to enter into new split billing arrangements. In addition, it is not clear if this type of contracting will be available to Sonatide over the longer term.
In November 2014, the National Bank of Angola issued new regulations controlling the sale of foreign currency. These regulations generally require oil companies to sell U.S. dollars to the National Bank of Angola to buy kwanzas that are required to be used to pay for goods and services provided by foreign exchange resident oilfield service companies. These foreign exchange resident oilfield service companies, in turn, are required to source U.S. dollars in order to pay for goods and services provided offshore. The regulations continue to permit tripartite agreements among oil companies, commercial banks and service companies that provide for the sale of U.S. dollars by an oil company to a commercial bank in exchange for kwanzas. These same U.S. dollars are then sold onward by the commercial bank to the service company. The implementing regulations do, however, place constraints on those tripartite agreements that did not previously exist, and the period of time that the tripartite agreements will be allowed remains uncertain. If tripartite agreements or similar arrangements are not available to service companies in Angola that have a need for dollars, then such service companies will be required to source dollars exclusively through the National Bank of Angola. Sonatide has had limited success to date negotiating tripartite agreements but it continues its discussions with customers, commercial banks and the National Bank of Angola regarding these arrangements.
For the fiscal year ended March 31, 2015, the company collected (primarily through Sonatide) approximately $338 million from its Angola operations, which is slightly less than the approximately $351 million of revenue recognized for the same period. Of the $338 million collected approximately $159 million represented U.S. dollars received by Sonatide on behalf of the company or dollars directly received by the company from customers. The balance of $179 million collected resulted from Sonatide’s converting kwanza into dollars and subsequently expatriating the dollars to Tidewater. Additionally, the company received an approximate $10 million dividend payment from the Sonatide joint venture during the third quarter of fiscal 2015.
F-47
Table of Contents
Index to Financial Statements
Though Sonatide experienced a substantially reduced ability to convert kwanzas to dollars during parts of the quarter ended December 31, 2014 (possibly due to holiday season and/or the newly enhanced role of the National Bank of Angola from November 2014 in the conversion process), the company believes that the process for converting kwanzas has functioned reasonably well for much of fiscal 2015, particularly given that the conversion process was still developing. Sonatide continues to press its commercial bank relationships to increase the amount of dollars that are made available to Sonatide.
As of March 31, 2015, the company had approximately $420 million in amounts due from Sonatide, with approximately half of the balance reflecting invoiced but unpaid vessel revenue related to services performed by the company through the Sonatide joint venture. Remaining amounts due to the company from Sonatide generally reflect cash (primarily denominated in Angolan kwanzas) held by Sonatide that is pending conversion into U.S. dollars and the subsequent expatriation of such funds. Cash held by Sonatide began to accumulate in late calendar 2012, when the initial provisions of the forex law relating to payments for goods and services provided by foreign exchange residents took effect (and payments were required to be paid into local bank accounts). Beginning in July 2013, when the second provision of the forex law took effect (and the local payments had to be made in kwanza), Sonatide generally accrued for but did not deliver invoices to customers for vessel revenue related to Sonatide and the company’s collective Angolan operations in order to minimize the exposure that Sonatide would be paid for a substantial amount of charter hire in kwanzas and into an Angolan bank. During this time, the company began using its credit facility and other arrangements to fund the substantial working capital requirements related to its Angola operations.
Beginning in the first quarter of fiscal 2015, Sonatide began sending invoices to those customers that insisted on paying U.S. dollar denominated invoices in kwanza. As invoices are paid in kwanza, Sonatide seeks to convert those kwanzas into U.S. dollars and subsequently utilize those U.S. dollars to pay the amounts that Sonatide owes the company. This conversion and expatriation process is subject to those risks and considerations set forth above.
For the fiscal year ended March 31, 2015, Tidewater’s Angolan operations generated vessel revenues of approximately $351 million, or 23%, of its consolidated vessel revenue, from an average of approximately 80 Tidewater-owned vessels that are marketed through the Sonatide joint venture (8 of which were stacked on average during the year ended March 31, 2015), and, for the year ended March 31, 2014, generated vessel revenues of approximately $357 million, or 25%, of consolidated vessel revenue, from an average of approximately 90 Tidewater-owned vessels (five of which were stacked on average during the year ended March 31, 2014).
Sonatide joint venture owns nine vessels (three of which are currently stacked) and certain other assets, in addition to earning commission income from Tidewater-owned vessels marketed through the Sonatide joint venture (owned 49% by Tidewater). In addition, as of March 31, 2015, Sonatide maintained the equivalent of approximately $150 million of kwanza-denominated deposits in Angolan banks, largely related to customer receipts that had not yet been converted to U.S. dollars, expatriated and then remitted to the company. As of March 31, 2015 and March 31, 2014, the carrying value of Tidewater’s investment in the Sonatide joint venture, which is included in “Investments in, at equity, and advances to unconsolidated companies,” is approximately $67 million and $62 million, respectively.
Due from affiliate at March 31, 2015 and March 31, 2014 of approximately $420 million and $430 million, respectively, represents cash received by Sonatide from customers and due to the company, amounts due from customers that are expected to be remitted to the company through Sonatide and, finally, reimbursable costs paid by Tidewater on behalf of Sonatide. The collection of the amounts due from customers and the subsequent conversion and expatriation process are subject to those risks and considerations set forth above.
Due to affiliate at March 31, 2015 and March 31, 2014 of approximately $186 million and $86 million, respectively, represents amounts due to Sonatide for commissions payable (approximately $66 million and $43 million, respectively) and other costs paid by Sonatide on behalf of the company.
A new presidential decree regulating maritime transportation activities was enacted in Angola earlier this year. Following recent discussions with port state authorities and local counsel, the company is uncertain whether the authorities will interpret the decree to require one hundred percent Angolan ownership of local vessel operators such as Sonatide. This interpretation may result in the need to work with Sonangol to further
F-48
Table of Contents
Index to Financial Statements
restructure our Sonatide joint venture and our operations in Angola. The company has been informed by the authorities that the deadline for foreign vessel operators to comply with any rules implementing the decree has been set for June 2015. The company is seeking further clarification of the new decree and has been advised that a grace period for compliance will be granted until such clarifications are published. The company is exploring potential alternative structures in order to comply.
The Angolan government has included a proposal for a new levy in its most recent budget that could impose an additional 10-20% surcharge on foreign exchange transactions. We understand that a new decree imposing a levy could be published soon. The specific details of the levy have not yet been disclosed and it is not clear if this new decree would apply to Sonatide’s scope of operations. The company has undertaken efforts to mitigate the effects of the levy, in the event the levy is enacted into law, including successfully negotiating rate adjustments and termination rights with some of its customers. The company will be unlikely to completely mitigate the effects of the levy, resulting in increased costs and lower margins, if the levy is enacted.
Management continues to explore ways to profitably participate in the Angolan market while looking for opportunities to reduce the overall level of exposure to the increased risks that the company believes currently characterize the Angolan market. Included among mitigating measures taken by the company to address these risks is the redeployment of vessels from time to time to other markets where there is adequate demand for the company’s vessels. During the year ended March 31, 2014, the company redeployed vessels from its Angolan operations to other markets and also transferred vessels into its Angolan operations from other markets resulting in a net increase of one vessel operating in Angola. Redeployment of vessels to and from Angola in the year ended March 31, 2015 has resulted in a net 13 vessels transferred out of Angola, including four smaller crewboats that were stacked outside of Angola.
As the company considers the redeployment of additional vessels from Angola to other markets, there would likely be temporary negative financial effects associated with such redeployment, including mobilization costs and costs to redeploy Tidewater shore-based employees to other areas, in addition to lost revenues associated with potential downtime between vessel contracts. These financial impacts could, individually or in the aggregate, be material to our results of operations and cash flows for the periods when such costs would be incurred. The recent decline in crude oil and natural gas prices, the reduction in spending expectations among E&P companies, the number of new-build vessels which are expected to deliver within the next two years and the resulting potential overcapacity in the worldwide offshore support vessel market may exacerbate such negative financial effects, particularly if a large re-deployment were undertaken by the company in the near- to intermediate-term.
Brazilian Customs
In April 2011, two Brazilian subsidiaries of Tidewater were notified by the Customs Office in Macae, Brazil that they were jointly and severally being assessed fines of 155 million Brazilian reais (approximately $48.5 million as of March 31, 2015). The assessment of these fines is for the alleged failure of these subsidiaries to obtain import licenses with respect to 17 Tidewater vessels that provided Brazilian offshore vessel services to Petrobras, the Brazilian national oil company, over a three-year period ending December 2009. After consultation with its Brazilian tax advisors, Tidewater and its Brazilian subsidiaries believe that vessels that provide services under contract to the Brazilian offshore oil and gas industry are deemed, under applicable law and regulations, to be temporarily imported into Brazil, and thus exempt from the import license requirement. The Macae Customs Office has, without a change in the underlying applicable law or regulations, taken the position that the temporary importation exemption is only available to new, and not used, goods imported into Brazil and therefore it was improper for the company to deem its vessels as being temporarily imported. The fines have been assessed based on this new interpretation of Brazilian customs law taken by the Macae Customs Office.
After consultation with its Brazilian tax advisors, the company believes that the assessment is without legal justification and that the Macae Customs Office has misinterpreted applicable Brazilian law on duties and customs. The company is vigorously contesting these fines (which it has neither paid nor accrued) and, based on the advice of its Brazilian counsel, believes that it has a high probability of success with respect to the overturn of the entire amount of the fines, either at the administrative appeal level or, if necessary, in Brazilian courts. In December 2011, an administrative board issued a decision that disallowed 149 million Brazilian reais (approximately $46.6 million as of March 31, 2015) of the total fines sought by the Macae Customs Office. In two separate proceedings in 2013, a secondary administrative appeals board considered fines totaling 127
F-49
Table of Contents
Index to Financial Statements
million Brazilian reais (approximately $39.7 million as of March 31, 2015) and rendered decisions that disallowed all of those fines. The remaining fines totaling 28 million Brazilian reais (approximately $8.8 million as of March 31, 2015) are still subject to a secondary administrative appeals board hearing, but the company believes that both decisions will be helpful in that upcoming hearing. The secondary board decisions disallowing the fines totaling 127 million Brazilian reais are, however, still subject to the possibility of further administrative appeal by the authorities that imposed the initial fines. The company believes that the ultimate resolution of this matter will not have a material effect on the consolidated financial statements.
Nigeria Marketing Agent Litigation
On March 1, 2013, Tidewater filed suit in the London Commercial Court against Tidewater’s Nigerian marketing agent for breach of the agent’s obligations under contractual agreements between the parties. The alleged breach involves actions of the Nigerian marketing agent to discourage various affiliates of TOTAL S.A. from paying approximately $16 million (including U.S. dollar denominated invoices and Naira denominated invoices which have been adjusted for the devaluation of the Naira relative to the U.S. dollar) due to the company for vessel services performed in Nigeria. Shortly after the London Commercial Court filing, TOTAL commenced interpleader proceedings in Nigeria naming the Nigerian agent and the company as respondents and seeking an order which would allow TOTAL to deposit those monies with a Nigerian court for the respondents to resolve. On April 25, 2013, Tidewater filed motions in the Nigerian Federal High Court to stop the interpleader proceedings in Nigeria or alternatively stay them until the resolution of the suit filed in London. The company will continue to actively pursue the collection of those monies. On April 30, 2013, the Nigerian marketing agent filed a separate suit in the Nigerian Federal High Court naming Tidewater and certain TOTAL affiliates as defendants. The suit seeks various declarations and orders, including a claim for the monies that are subject to the above interpleader proceedings, and other relief. The company is seeking dismissal of this suit and otherwise intends to vigorously defend against the claims made. The company has not reserved for this receivable and believes that the ultimate resolution of this matter will not have a material effect on the consolidated financial statements. On or about December 30, 2014, the company received notice that the Nigerian marketing agent had filed an action in the Nigerian Federal High court seeking to prevent the continuation of the proceedings initiated by Tidewater in the London Commercial Court. The company intends to vigorously defend that action.
In October, 2012, Tidewater had notified the Nigerian marketing agent that it was discontinuing its relationship with the Nigerian marketing agent. The company has entered into a new strategic relationship with a different Nigerian counterparty that it believes will better serve the company’s long term interests in Nigeria. This new strategic relationship is currently functioning as the company intended.
Arbitral Award for the Taking of the Company’s Venezuelan Operations
On March 13, 2015, the three member tribunal constituted under the rules of the World Bank’s International Centre for the Settlement of Investment Disputes (“ICSID”) has awarded subsidiaries of the company more than $62 million in compensation, including accrued interest and costs, for the Bolivarian Republic of Venezuela’s (“Venezuela”) expropriation of the investments of those subsidiaries in Venezuela. The award, issued in accordance with the provisions of the Venezuela-Barbados Bilateral Investment Treaty (“BIT”), represented $46.4 million for the fair market value of the company’s principal Venezuelan operating subsidiary, plus interest from May 8, 2009 to the date of payment of that amount accruing at an annual rate of 4.5% compounded quarterly ($13.9 million as of March 13, 2015) and $2.5 million for reimbursement of legal and other costs expended by the company in connection with the arbitration.
As previously reported by the company, on February 16, 2010, Tidewater and certain of its subsidiaries (collectively, the “Claimants”) filed with ICSID a Request for Arbitration against Venezuela. In May 2009, Petróleos de Venezuela, S.A. (“PDVSA”), the national oil company of Venezuela, took possession and control of (a) eleven of the Claimants’ vessels that were then supporting PDVSA operations in Lake Maracaibo, (b) the Claimants’ shore-based headquarters adjacent to Lake Maracaibo, (c) the Claimants’ operations in Lake Maracaibo, and (d) certain other related assets. In July 2009, Petrosucre, S.A., a subsidiary of PDVSA, took possession and control of the Claimants’ four vessels, operations, and related assets in the Gulf of Paria. It was Tidewater’s position that, through those measures, Venezuela directly or indirectly expropriated the Claimants’ Venezuela investments, including the capital stock of the Claimants’ principal operating subsidiary in Venezuela. As a result of the seizures, the lack of further operations in Venezuela, and the continuing
F-50
Table of Contents
Index to Financial Statements
uncertainty about the timing and amount of the compensation the company might collect in the future, the company recorded a charge during the year ended March 31, 2010 to write off substantially all of the assets associated with the company’s Venezuelan operations.
The Claimants alleged in the Request for Arbitration that the measures taken by Venezuela against the Claimants violated Venezuela’s obligations under the BIT and rules and principles of Venezuelan law and international law. In the first phase of the case, the tribunal addressed Venezuela’s objections to the tribunal’s jurisdiction over the dispute. On February 8, 2013, the tribunal issued its decision on jurisdiction and found that it had jurisdiction over the claims under the BIT, including the claim for compensation for the expropriation of Tidewater’s principal operating subsidiary, but that it did not have jurisdiction based on Venezuela’s investment law. The practical effect of the tribunal’s decision was to exclude from the ICSID arbitration proceeding the Claimants’ claims for expropriation of the fifteen vessels described above. While the tribunal determined that it did not have jurisdiction over the claim for the seizure of the fifteen vessels, Tidewater received during fiscal 2011 insurance proceeds for the insured value of those vessels (less an additional premium payment triggered by those proceeds).
The company will take appropriate steps to enforce and collect the award, which is enforceable in any of the 150 member states that are party to the ICSID Convention. As an initial step, the company was successful in having the award recognized and entered on March 16, 2015 as a final judgment by the United States District Court for the Southern District of New York. The Company notes that Venezuela may seek annulment of the award and other post-award relief under the ICSID Convention and may seek a stay of enforcement of the award while those post-award remedial proceedings are pending. Even in the absence of a stay of enforcement, the company recognizes that collection of the award may present significant practical challenges, particularly in the short term. Because the award has yet to be satisfied and post-award relief may be sought by Venezuela, the net impact of these matters on the company cannot be reasonably estimated at this time and the company has not recognized a gain related to these matters as of March 31, 2015.
Repairs to U.S. Flagged Vessels Operating Abroad
The company recently became aware that we may not have been following all applicable laws and regulations in documenting and declaring upon re-entry to U.S. waters all repairs done on our U.S. flagged vessels while they were working outside the United States. When a U.S. flagged vessel operates abroad, any repairs made abroad must be declared to U.S. Customs. Duties must be paid for certain of those repairs upon return to U.S. waters. During our examination of our most recent filings with U.S. Customs, we determined that it was necessary to file amended forms with U.S. Customs. We continue to evaluate the return of other U.S. flagged vessels to the United States to determine whether it is necessary to adjust our responses in any of those instances. To the extent that further evaluation requires us to file amended entries, we do not yet know the magnitude of any duties, fines or interest associated with amending the entries for these vessels. We are committed to bolstering our processes, procedures and training to ensure that we correctly identify all repairs made abroad if and when U.S. flagged vessels return to the United States in the future.
Currency Devaluation and Fluctuation Risk
Due to the company’s global operations, the company is exposed to foreign currency exchange rate fluctuations and exchange rate risks on all charter hire contracts denominated in foreign currencies. For some of our non-U.S. contracts, a portion of the revenue and local expenses are incurred in local currencies with the result that the company is at risk of changes in the exchange rates between the U.S. dollar and foreign currencies. We generally do not hedge against any foreign currency rate fluctuations associated with foreign currency contracts that arise in the normal course of business, which exposes us to the risk of exchange rate losses. To minimize the financial impact of these items, the company attempts to contract a significant majority of its services in U.S. dollars. In addition, the company attempts to minimize its financial impact of these risks, by matching the currency of the company’s operating costs with the currency of the revenue streams when considered appropriate. The company continually monitors the currency exchange risks associated with all contracts not denominated in U.S. dollars. Discussions related to the company’s Angolan operations are disclosed in Note (12) of Notes to Consolidated Financial Statements included in Item 8 of this Annual Report on Form 10-K.
F-51
Table of Contents
Index to Financial Statements
Legal Proceedings
Various legal proceedings and claims are outstanding which arose in the ordinary course of business. In the opinion of management, the amount of ultimate liability, if any, with respect to these actions, will not have a material adverse effect on the company’s financial position, results of operations, or cash flows.
| (13) | FAIR VALUE MEASUREMENTS AND DISCLOSURES |
Assets and Liabilities Measured at Fair Value on a Recurring Basis
Other Financial Instruments
The company’s primary financial instruments consist of cash and cash equivalents, trade receivables and trade payables with book values that are considered to be representative of their respective fair values. The company periodically utilizes derivative financial instruments to hedge against foreign currency denominated assets and liabilities, currency commitments, or to lock in desired interest rates. These transactions are generally spot or forward currency contracts or interest rate swaps that are entered into with major financial institutions. Derivative financial instruments are intended to reduce the company’s exposure to foreign currency exchange risk and interest rate risk. The company enters into derivative instruments only to the extent considered necessary to address its risk management objectives and does not use derivative contracts for speculative purposes. The derivative instruments are recorded at fair value using quoted prices and quotes obtainable from the counterparties to the derivative instruments.
Cash Equivalents. The company’s cash equivalents, which are securities with maturities less than 90 days, are held in money market funds or time deposit accounts with highly rated financial institutions. The carrying value for cash equivalents is considered to be representative of its fair value due to the short duration and conservative nature of the cash equivalent investment portfolio.
Spot Derivatives. Spot derivative financial instruments are short-term in nature and generally settle within two business days. The fair value of spot derivatives approximates the carrying value due to the short-term nature of this instrument, and as a result, no gains or losses are recognized.
The company had two foreign exchange spot contracts outstanding at March 31, 2015, which had a notional value of $2.3 million. The spot contracts settled by April 1, 2015. The company had four foreign exchange spot contracts outstanding at March 31, 2014, which had a notional value of $2.3 million. The spot contracts settled by April 2, 2014.
Forward Derivatives. Forward derivative financial instruments are generally longer-term in nature but generally do not exceed one year. The accounting for gains or losses on forward contracts is dependent on the nature of the risk being hedged and the effectiveness of the hedge. Forward contracts are valued using counterparty quotations, and we validate the information obtained from the counterparties in calculating the ultimate fair values using the market approach and obtaining broker quotations. As such, these derivative contracts are classified as Level 2.
At March 31, 2015, and 2014 the company did not have any forward contracts outstanding.
The following table provides the fair value hierarchy for the company’s other financial instruments measured as of March 31, 2015:
| (In thousands) | Total | Quoted prices in active markets (Level 1) |
Significant (Level 2) |
Significant (Level 3) |
||||||||||||||
| Money market cash equivalents |
$ | 3,007 | 3,007 | — | — | |||||||||||||
| Total fair value of assets |
$ | 3,007 | 3,007 | — | — | |||||||||||||
|
| ||||||||||||||||||
F-52
Table of Contents
Index to Financial Statements
The following table provides the fair value hierarchy for the company’s other financial instruments measured as of March 31, 2014:
| (In thousands) | Total | Quoted prices in active markets (Level 1) |
Significant (Level 2) |
Significant (Level 3) |
||||||||||||||
| Money market cash equivalents |
$ | 16,559 | 16,559 | — | — | |||||||||||||
| Total fair value of assets |
$ | 16,559 | 16,559 | — | — | |||||||||||||
|
| ||||||||||||||||||
Assets and Liabilities Measured at Fair Value on a Nonrecurring Basis
Asset Impairments
The company accounts for long-lived assets in accordance with ASC 360-10-35, Impairment or Disposal of Long-Lived Assets. The company reviews the vessels in its active fleet for impairment whenever events occur or changes in circumstances indicate that the carrying amount of an asset group may not be recoverable. In such evaluation the estimated future undiscounted cash flows generated by an asset group are compared with the carrying amount of the asset group to determine if a write-down may be required. Active, non-stacked vessels are grouped together for impairment testing purposes with vessels of similar operating and marketing characteristics. Active vessel groupings are also subdivided between older vessels and newer vessels.
The company estimates cash flows based upon historical data adjusted for the company’s best estimate of expected future market performance, which, in turn, is based on industry trends. If an asset group fails the undiscounted cash flow test, the company uses the discounted cash flow method to determine the estimated fair value of each asset group and compares such estimated fair value (considered Level 3, as defined by ASC 360) to the carrying value of each asset group in order to determine if impairment exists. If impairment exists, the carrying value of the asset group is reduced to its estimated fair value.
In addition to the periodic review of its active long-lived assets for impairment when circumstances warrant, the company also performs a review of its stacked vessels and vessels withdrawn from service every six months or whenever changes in circumstances indicate that the carrying amount of a vessel may not be recoverable. Management estimates each stacked vessel’s fair value by considering items such as the vessel’s age, length of time stacked, likelihood of a return to active service, actual recent sales of similar vessels, which are unobservable inputs. In certain situations we obtain an estimate of the fair value of the stacked vessel from third-party appraisers or brokers. The company records an impairment charge when the carrying value of a vessel withdrawn from service or a stacked vessel exceeds its estimated fair value. The estimates of fair value of stacked vessels are also subject to significant variability, are sensitive to changes in market conditions, and are reasonably likely to change in the future.
The below table summarizes the combined fair value of the assets that incurred impairments along with the amount of impairment during the years ended March 31. The fair values of impaired assets are based on expected net proceeds from asset sales or appraisals performed by third parties. The impairment charges were recorded in gain on asset dispositions, net.
| (In thousands) | 2015 | 2014 | 2013 | |||||||||||
| Amount of impairment incurred |
$ | 14,525 | 9,341 | 8,078 | ||||||||||
| Combined fair value of assets incurring impairment |
28,509 | 11,149 | 14,733 | |||||||||||
| (14) | GAIN ON DISPOSITION OF ASSETS, NET |
The company seeks opportunities to dispose its older vessels when market conditions warrant and opportunities arise. As such, vessel dispositions vary from year to year, and gains on sales of assets may also fluctuate significantly from period to period. The majority of the company’s vessels are sold to buyers who do not compete with the company in the offshore energy industry.
F-53
Table of Contents
Index to Financial Statements
The number of vessels disposed along with the gain on the dispositions for the years ended March 31, are as follows:
| (In thousands, except number of vessels disposed) | 2015 | 2014 | 2013 | |||||||||
| Gain on vessels disposed |
$ | 2,988 | 12,247 | 12,191 | ||||||||
| Number of vessels disposed |
13 | 48 | 32 | |||||||||
Also included in gain on dispositions of assets, net in fiscal 2015 are amortized gains on sale/leaseback transactions of $17.7 million as well as a gain related to the reversal of an accrued $3 million liability related to contingent consideration potentially payable to the former owners of Troms Offshore based on the achievement by the Troms operation of certain performance metrics subsequent to its acquisition by the company. The company’s current expectation is that such performance metrics will not be achieved. Included in gain on dispositions of assets, net in fiscal 2014 and fiscal 2013 are gains of $4 million and $2.3 million, respectively related to the sale of the company’s two shipyards. Please refer to Note (13) above for a discussion on asset impairment.
| (15) | SEGMENT INFORMATION, GEOGRAPHICAL DATA AND MAJOR CUSTOMERS |
The company follows the disclosure requirements of ASC 280, Segment Reporting. Operating business segments are defined as a component of an enterprise for which separate financial information is available and is evaluated by the chief operating decision maker in deciding how to allocate resources and in assessing performance.
We manage and measure our business performance in four distinct operating segments: Americas, Asia/Pacific, Middle East/North Africa, and Sub-Saharan Africa/Europe. These segments are reflective of how the company’s chief operating decision maker (CODM) reviews operating results for the purposes of allocating resources and assessing performance. The company’s CODM is its Chief Executive Officer.
F-54
Table of Contents
Index to Financial Statements
The following table provides a comparison of revenues, vessel operating profit, depreciation and amortization, and additions to properties and equipment for the years ended March 31. Vessel revenues and operating costs relate to vessels owned and operated by the company while other operating revenues relate to the activities of the company’s shipyards, brokered vessels and other miscellaneous marine-related businesses.
| (In thousands) | 2015 | 2014 | 2013 | |||||||||||
| Revenues: |
||||||||||||||
| Vessel revenues: |
||||||||||||||
| Americas |
$ | 505,699 | 410,731 | 327,059 | ||||||||||
| Asia/Pacific |
150,820 | 154,618 | 184,014 | |||||||||||
| Middle East/North Africa |
205,787 | 186,524 | 149,412 | |||||||||||
| Sub-Saharan Africa/Europe |
606,052 | 666,588 | 569,513 | |||||||||||
| 1,468,358 | 1,418,461 | 1,229,998 | ||||||||||||
| Other operating revenues |
27,159 | 16,642 | 14,167 | |||||||||||
| $ | 1,495,517 | 1,435,103 | 1,244,165 | |||||||||||
|
| ||||||||||||||
| Vessel operating profit: |
||||||||||||||
| Americas |
$ | 122,988 | 90,936 | 40,318 | ||||||||||
| Asia/Pacific |
11,541 | 29,044 | 43,704 | |||||||||||
| Middle East/North Africa |
37,258 | 42,736 | 39,069 | |||||||||||
| Sub-Saharan Africa/Europe |
122,169 | 136,092 | 129,460 | |||||||||||
| 293,956 | 298,808 | 252,551 | ||||||||||||
| Other operating loss |
(8,022 | ) | (1,930 | ) | (833 | ) | ||||||||
| 285,934 | 296,878 | 251,718 | ||||||||||||
| Corporate general and administrative expenses (A) |
(40,621 | ) | (47,703 | ) | (48,704 | ) | ||||||||
| Corporate depreciation |
(4,014 | ) | (3,073 | ) | (3,391 | ) | ||||||||
| Corporate expenses |
(44,635 | ) | (50,776 | ) | (52,095 | ) | ||||||||
| Gain on asset dispositions, net |
9,271 | 11,722 | 6,609 | |||||||||||
| Goodwill impairment |
(283,699 | ) | (56,283 | ) | — | |||||||||
| Restructuring charge |
(4,052 | ) | — | — | ||||||||||
| Operating income (loss) |
(37,181 | ) | 201,541 | 206,232 | ||||||||||
| Foreign exchange gain |
8,678 | 1,541 | 3,011 | |||||||||||
| Equity in net earnings of unconsolidated companies |
10,179 | 15,801 | 12,189 | |||||||||||
| Interest income and other, net |
1,927 | 2,123 | 3,476 | |||||||||||
| Loss on early extinguishment of debt |
— | (4,144 | ) | — | ||||||||||
| Interest and other debt costs |
(50,029 | ) | (43,814 | ) | (29,745 | ) | ||||||||
| Earnings (loss) before income taxes |
$ | (66,426 | ) | 173,048 | 195,163 | |||||||||
|
| ||||||||||||||
| Depreciation and amortization: |
||||||||||||||
| Americas |
$ | 47,682 | 43,298 | 40,454 | ||||||||||
| Asia/Pacific |
18,383 | 17,174 | 19,416 | |||||||||||
| Middle East/North Africa |
27,538 | 24,441 | 18,784 | |||||||||||
| Sub-Saharan Africa/Europe |
73,614 | 79,199 | 65,241 | |||||||||||
| 167,217 | 164,112 | 143,895 | ||||||||||||
| Other |
3,973 | 295 | 13 | |||||||||||
| Corporate |
4,014 | 3,073 | 3,391 | |||||||||||
| $ | 175,204 | 167,480 | 147,299 | |||||||||||
|
| ||||||||||||||
| Additions to properties and equipment: |
||||||||||||||
| Americas |
$ | 94,137 | 99,798 | 52,299 | ||||||||||
| Asia/Pacific |
91,497 | 2,586 | 19,858 | |||||||||||
| Middle East/North Africa |
1,842 | 8,042 | 3,833 | |||||||||||
| Sub-Saharan Africa/Europe (B) |
36,105 | 488,984 | 197,534 | |||||||||||
| 223,581 | 599,410 | 273,524 | ||||||||||||
| Other |
18,571 | 31,841 | — | |||||||||||
| Corporate (C) |
124,411 | 175,233 | 179,058 | |||||||||||
| $ | 366,563 | 806,484 | 452,582 | |||||||||||
|
| ||||||||||||||
| Total assets (D): |
||||||||||||||
| Americas |
$ | 1,016,133 | 1,017,736 | 880,368 | ||||||||||
| Asia/Pacific |
506,265 | 421,379 | 607,546 | |||||||||||
| Middle East/North Africa |
666,983 | 613,303 | 507,124 | |||||||||||
| Sub-Saharan Africa/Europe |
2,064,010 | 2,383,507 | 1,706,355 | |||||||||||
| 4,253,391 | 4,435,925 | 3,701,393 | ||||||||||||
| Other |
49,554 | 31,545 | 5,102 | |||||||||||
| 4,302,945 | 4,467,470 | 3,706,495 | ||||||||||||
| Investments in and advances to unconsolidated companies |
65,844 | 63,928 | 46,047 | |||||||||||
| 4,368,789 | 4,531,398 | 3,752,542 | ||||||||||||
| Corporate (E) |
387,373 | 354,431 | 415,513 | |||||||||||
| $ | 4,756,162 | 4,885,829 | 4,168,055 | |||||||||||
|
| ||||||||||||||
F-55
Table of Contents
Index to Financial Statements
| (A) | Included in Corporate general and administrative expenses for the year ended March 31, 2014 and 2013 are transaction costs of $3.7 million related to the acquisition of Troms Offshore and a settlement charge of $5.2 million related to the payment of retirement benefits to a former Chief Executive Officer, respectively. |
| (B) | Included in Sub-Saharan Africa/Europe for the year ended March 31, 2014 is $245.6 million related to vessels acquired through the acquisition of Troms Offshore. |
| (C) | Included in Corporate are additions to properties and equipment relating to vessels currently under construction which have not yet been assigned to a non-corporate reporting segment as of the dates presented. |
| (D) | Marine support services are conducted worldwide with assets that are highly mobile. Revenues are principally derived from offshore service vessels, which regularly and routinely move from one operating area to another, often to and from offshore operating areas in different continents. Because of this asset mobility, revenues and long-lived assets attributable to the company’s international marine operations in any one country are not material. |
| (E) | Included in Corporate are vessels currently under construction which have not yet been assigned to a non-corporate reporting segment. The vessel construction costs will be reported in Corporate until the earlier of the vessels being assigned to a non-corporate reporting segment or the vessels’ delivery. At March 31, 2015, 2014 and 2013, $235.2 million, $228.9 million and $229.3 million, respectively, of vessel construction costs are included in Corporate. |
The following table discloses the amount of revenue by segment, and in total for the worldwide fleet, along with the respective percentage of total vessel revenue for the years ended March 31,:
| Revenue by vessel class: (In thousands): |
2015 | % of Vessel Revenue |
2014 | % of Vessel Revenue |
2013 | % of Vessel Revenue |
||||||||||||||||||||
| Americas fleet: |
||||||||||||||||||||||||||
| Deepwater |
$ | 353,232 | 24 | % | 263,750 | 18 | % | 179,032 | 15 | % | ||||||||||||||||
| Towing-supply |
125,029 | 9 | % | 115,055 | 8 | % | 120,817 | 10 | % | |||||||||||||||||
| Other |
27,438 | 2 | % | 31,926 | 3 | % | 27,210 | 2 | % | |||||||||||||||||
| Total |
$ | 505,699 | 35 | % | 410,731 | 29 | % | 327,059 | 27 | % | ||||||||||||||||
| Asia/Pacific fleet: |
||||||||||||||||||||||||||
| Deepwater |
$ | 94,538 | 6 | % | 88,191 | 6 | % | 96,118 | 8 | % | ||||||||||||||||
| Towing-supply |
53,281 | 4 | % | 62,630 | 5 | % | 84,217 | 7 | % | |||||||||||||||||
| Other |
3,001 | <1 | % | 3,797 | <1 | % | 3,679 | <1 | % | |||||||||||||||||
| Total |
$ | 150,820 | 10 | % | 154,618 | 11 | % | 184,014 | 15 | % | ||||||||||||||||
| Middle East/North Africa fleet: |
||||||||||||||||||||||||||
| Deepwater |
$ | 85,279 | 6 | % | 66,503 | 5 | % | 55,945 | 5 | % | ||||||||||||||||
| Towing-supply |
117,232 | 8 | % | 116,720 | 8 | % | 89,902 | 7 | % | |||||||||||||||||
| Other |
3,276 | <1 | % | 3,301 | <1 | % | 3,565 | <1 | % | |||||||||||||||||
| Total |
$ | 205,787 | 14 | % | 186,524 | 13 | % | 149,412 | 12 | % | ||||||||||||||||
| Sub-Saharan Africa/Europe fleet: |
||||||||||||||||||||||||||
| Deepwater |
$ | 326,315 | 22 | % | 364,722 | 26 | % | 273,544 | 22 | % | ||||||||||||||||
| Towing-supply |
208,324 | 14 | % | 231,224 | 16 | % | 226,357 | 18 | % | |||||||||||||||||
| Other |
71,413 | 5 | % | 70,642 | 5 | % | 69,612 | 6 | % | |||||||||||||||||
| Total |
$ | 606,052 | 41 | % | 666,588 | 47 | % | 569,513 | 46 | % | ||||||||||||||||
| Worldwide fleet: |
||||||||||||||||||||||||||
| Deepwater |
$ | 859,364 | 58 | % | 783,166 | 55 | % | 604,639 | 50 | % | ||||||||||||||||
| Towing-supply |
503,866 | 35 | % | 525,629 | 37 | % | 521,293 | 42 | % | |||||||||||||||||
| Other |
105,128 | 7 | % | 109,666 | 8 | % | 104,066 | 8 | % | |||||||||||||||||
| Total |
$ | 1,468,358 | 100 | % | 1,418,461 | 100 | % | 1,229,998 | 100 | % | ||||||||||||||||
|
| ||||||||||||||||||||||||||
The following table discloses our customers that accounted for 10% or more of total revenues during the years ended March 31:
| 2015 | 2014 | 2013 | ||||||||||||
| Chevron Corporation |
12.7 | % | 18.1 | % | 17.8 | % | ||||||||
| Petroleo Brasileiro SA |
11.8 | % | 8.6 | % | 8.6 | % | ||||||||
| BP plc |
10.1 | % | 8.9 | % | 7.9 | % | ||||||||
F-56
Table of Contents
Index to Financial Statements
| (16) | GOODWILL |
The company tests goodwill for impairment annually at the reporting unit level using carrying amounts as of December 31 or more frequently if events and circumstances indicate that goodwill might be impaired.
During the quarter ended December, 31, 2014 the company performed its annual goodwill impairment assessment and determined that the rapid and significant decline in crude oil and natural gas prices (which occurred and accelerated throughout the latter part of the company’s third fiscal quarter), and the expected short to intermediate term effect that the downturn might have on levels of exploration and production activity would likely have a negative effect on average day rates and utilization levels of the company’s vessels. Expected future cash flow analyses using the projected average day rates and utilization levels in this new commodity pricing environment were included in the company’s valuation models and indicated that the carrying value of the Americas and Sub-Saharan Africa/Europe reporting units were less than their respective fair values. A goodwill impairment charge of $283.7 million, to write-off the company’s remaining goodwill, was recorded during the quarter ended December 31, 2014.
During the quarter ended December, 31, 2013 the company performed its annual goodwill impairment assessment and determined that the carrying value of its Asia/Pacific unit exceeded its fair value as a result of the general decline in the level of business and, therefore, expected future cash flow for the company in this region. At the time of the December 2013 goodwill impairment assessment, the Asia/Pacific region continued to be challenged with excess vessel capacity as a result of the significant number of vessels that had been built in this region over the previous 10 years. These additional newbuilds had not been met by a commensurate increase in exploration, development or other activity within the region. In recent years, the company has disposed of older vessels that had worked in the region and transferred vessels out of the region to other regions where market opportunities are currently more robust. In accordance with ASC 350 goodwill is not reallocated based on vessel movements. A goodwill impairment charge of $56.3 million was recorded during the quarter ended December 31, 2013.
During the first quarter of fiscal 2014, $42.2 million of goodwill related to the acquisition of Troms Offshore was allocated to the Sub-Saharan Africa/Europe segment.
Goodwill by reportable segment at March 31, 2015 and 2014 is as follows:
| (In thousands) | March 31, 2014 |
Goodwill acquired | Impairments | March 31, 2015 |
||||||||||||||
| Americas |
$ | 114,237 | — | 114,237 | — | |||||||||||||
| Sub-Saharan Africa/Europe |
169,462 | — | 169,462 | — | ||||||||||||||
| Total carrying amount (A) |
$ | 283,699 | — | 283,699 | — | |||||||||||||
|
| ||||||||||||||||||
| (In thousands) | March 31, 2013 |
Goodwill acquired | Impairments | March 31, 2014 |
||||||||||||||
| Americas |
$ | 114,237 | — | — | 114,237 | |||||||||||||
| Asia/Pacific |
56,283 | — | 56,283 | — | ||||||||||||||
| Sub-Saharan Africa/Europe |
127,302 | 42,160 | — | 169,462 | ||||||||||||||
| Total carrying amount (B) |
$ | 297,822 | 42,160 | — | 283,699 | |||||||||||||
|
| ||||||||||||||||||
| (A) | The total carrying amount of goodwill at December 31, 2014 is net of accumulated impairment charges of $370.9 million. |
| (B) | The total carrying amount of goodwill at December 31, 2013 is net of accumulated impairment charges $30.9 million and $56.3 million related to the Middle East/North Africa and Asia/Pacific segments, respectively. |
Goodwill, as a percentage of total assets and stockholders’ equity, at March 31, is as follows:
| 2015 | 2014 | |||||||||
| Goodwill as a percentage of total assets |
— | 6 | % | |||||||
| Goodwill as a percentage of stockholders’ equity |
— | 11 | % | |||||||
F-57
Table of Contents
Index to Financial Statements
| (17) | RESTRUCTURING CHARGE |
In the fourth quarter of fiscal 2015 the Company’s management initiated a plan to begin reorganizing its operations worldwide as a result of the continuing decline in oil prices and the resulting softening demand for the company’s vessels. This plan consists of select employee terminations and early retirements that are intended to eliminate redundant or unneeded positions, reduce costs, and better align our workforce with anticipated activity levels in the geographic areas in which the company presently operates. In connection with these efforts, the company recognized a $4.1 million restructuring charge during the quarter ended March 31, 2015.
Reorganization efforts to date most significantly included the redeployment of vessels from our Australian operation to other international markets where opportunities to profitably operate such vessels are considered more robust. The departure of these vessels from the Australian market and the associated reductions in onshore and offshore staffing resulted in the termination of a number of mariners who were entitled to severance payments under the terms of the enterprise bargaining agreement and in accordance with Australian labor laws.
| (18) | QUARTERLY FINANCIAL DATA (UNAUDITED) |
Selected financial information for interim periods for the years ended March 31, is as follows:
| Quarter | ||||||||||||||||||
| (In thousands except per share data) | First | Second | Third | Fourth | ||||||||||||||
| Fiscal 2015 |
||||||||||||||||||
| Revenues |
$ | 385,677 | 397,524 | 387,554 | 324,762 | |||||||||||||
| Operating income(A) |
66,004 | 84,723 | (213,580 | ) | 25,672 | |||||||||||||
| Net earnings attributable to Tidewater Inc. |
43,673 | 60,907 | (160,694 | ) | (9,076 | ) | ||||||||||||
| Basic earnings per share attributable to Tidewater Inc. |
$ | .88 | 1.23 | (3.31 | ) | (.19 | ) | |||||||||||
| Diluted earnings per share attributable to Tidewater Inc. |
$ | .88 | 1.22 | (3.31 | ) | (.19 | ) | |||||||||||
| Fiscal 2014 |
||||||||||||||||||
| Revenues |
$ | 334,085 | 367,937 | 365,248 | 367,833 | |||||||||||||
| Operating income(A) |
43,425 | 76,565 | 20,488 | 61,063 | ||||||||||||||
| Net earnings attributable to Tidewater Inc. |
30,083 | 54,172 | 12,583 | 43,417 | ||||||||||||||
| Basic earnings per share attributable to Tidewater Inc. |
$ | .61 | 1.10 | .25 | .88 | |||||||||||||
| Diluted earnings per share attributable to Tidewater Inc. |
$ | .61 | 1.09 | .25 | .88 | |||||||||||||
| (A) | Operating income consists of revenues less operating costs and expenses, depreciation, vessel operating leases, goodwill impairment, general and administrative expenses and gain on asset dispositions, net, of the company’s operations. Goodwill impairment by quarter for fiscal 2015 and 2014 and gain on asset dispositions, net, by quarter for fiscal 2015 and 2014, are as follows: |
| (In thousands) | First | Second | Third | Fourth | ||||||||||||||
| Fiscal 2015: |
||||||||||||||||||
| Goodwill impairment |
$ | — | — | (283,699 | ) | — | ||||||||||||
| Gain on asset dispositions, net |
$ | 2,943 | 3,590 | (1,537 | ) | 4,275 | ||||||||||||
| Fiscal 2014: |
||||||||||||||||||
| Goodwill impairment |
$ | — | — | (56,283 | ) | — | ||||||||||||
| Gain on asset dispositions, net |
$ | 2,140 | 49 | 7,170 | 2,363 | |||||||||||||
| (19) | SUBSEQUENT EVENTS |
In May 2015, the company’s Board of Directors authorized an extension of its current common stock repurchase program from its original expiration date of June 30, 2015 to June 30, 2016. If shares are purchased in open market or privately-negotiated transactions pursuant to this share repurchase program, the company will use its available cash and/or borrowings under its revolving credit facility or other borrowings to fund any share repurchases. As of March 31, 2015, the company had $100 million remaining authorized under this repurchase program available to repurchase shares. The company evaluates share repurchase opportunities relative to other investment opportunities and in the context of current conditions in the credit and capital markets.
In May 2015, the company amended and extended its existing credit facility. The amended credit agreement matures in June 2019 and provides for a $900 million, five-year credit facility consisting of a (i) $600 million revolving credit facility and a (ii) $300 million term loan facility.
F-58
Table of Contents
Index to Financial Statements
In May 2015, Troms Offshore entered into a $31.3 million, U.S. dollar denominated, 12 year unsecured borrowing agreement which matures in April 2027 and is secured by a company guarantee. The loan requires semi-annual principal payments of $1.3 million (plus accrued interest) and bears interest at a fixed rate of 2.92% plus a premium based on Tidewater Inc.’s consolidated funded indebtedness to total capitalization ratio (currently equal to 1.30% for a total rate of 4.22%).
On April 23, 2015, the company notified the international shipyard constructing the six 7,145 BHP towing-supply-class vessels that it was terminating the first three of the six towing-supply vessels as a result of late delivery and requested the return of $36.1 million in aggregate installment payments together with interest on these installments, or all but approximately $1 million of the carrying value of the accumulated costs through March 31, 2015. In May 2015, the company made a demand on the Bank of China refundment guarantees that secure the return of these installments. It is uncertain whether this shipyard or the Bank of China will contest the return of these installments. There was an aggregate $12.7 million in estimated remaining costs to be incurred on these three vessels at the time of the termination.
After March 31, 2015, the company entered into negotiations with the Chinese shipyard constructing two of the 275-foot deepwater PSVs to resolve issues associated with the delivery of these vessels. In May 2015, the parties settled these issues to their mutual satisfaction. (While the settlement is subject to the issuance by the Bank of China of modified refundment guarantees, the company believes this condition will likely be satisfied.) Under the terms of the settlement, the company can elect to take delivery of one or both completed vessels at any time prior to June 30, 2016. That date is subject to two six month extension periods, each extension requiring the mutual consent of the company and shipyard. If the company does not elect to take delivery of one or both vessels prior to June 30, 2016 (as that date may be extended), (a) the company is entitled to receive the return of $5.4 million in aggregate installment payments per vessel together with interest on these installments (or all but approximately $1 million of the company’s carrying value of the accumulated costs per vessel through March 31, 2015) and (b) the company will be relieved of the obligation to pay to the shipyard the $21.7 million remaining payment per vessel. The shipyard’s obligation to return the $5.4 million (plus interest) per vessel if the company elects not to take delivery of one or both vessels will continue to be secured by Bank of China refundment guarantees.
F-59
Table of Contents
Index to Financial Statements
TIDEWATER INC. AND SUBSIDIARIES
Valuation and Qualifying Accounts
Years Ended March 31, 2015, 2014 and 2013
(In thousands)
| Description | Balance at Beginning of period |
Additions at Cost |
Deductions | Balance End of |
||||||||||||||
| Fiscal 2015 |
||||||||||||||||||
| Deducted in balance sheet from Trade accounts receivables: |
||||||||||||||||||
| Allowance for doubtful accounts |
$ | 35,737 | 2,405 | 508 | 37,634 | |||||||||||||
|
| ||||||||||||||||||
| Fiscal 2014 |
||||||||||||||||||
| Deducted in balance sheet from Trade accounts receivables: |
||||||||||||||||||
| Allowance for doubtful accounts |
$ | 46,332 | 1,399 | 11,994 | (A) | 35,737 | ||||||||||||
|
| ||||||||||||||||||
| Fiscal 2013 |
||||||||||||||||||
| Deducted in balance sheet from Trade accounts receivables: |
||||||||||||||||||
| Allowance for doubtful accounts |
$ | 49,921 | 900 | 4,489 | (B) | 46,332 | ||||||||||||
|
| ||||||||||||||||||
| (A) | Of this amount, $3,151 represents the collections from one customer located in Mexico and $8,843 represents accounts receivable amounts considered uncollectible and removed from accounts receivable with an offsetting reduction to the allowance for doubtful accounts. |
| (B) | Of this amount, $3,852 is related to the revaluation of the allowance for doubtful accounts related to Venezuelan receivables and $637 related to receivables considered uncollectible and removed from accounts receivable by reducing the allowance for doubtful accounts. |
F-60
Table of Contents
Index to Financial Statements
TIDEWATER INC.
EXHIBITS FOR THE
ANNUAL REPORT ON FORM 10-K
FISCAL YEAR ENDED MARCH 31, 2015
Table of Contents
Index to Financial Statements
EXHIBIT INDEX
The index below describes each exhibit filed as a part of this report. Exhibits not incorporated by reference to a prior filing are designated by an asterisk; all exhibits not so designated are incorporated herein by reference to a prior filing as indicated.
| 3.1 | Restated Certificate of Incorporation of Tidewater Inc. (filed with the Commission as Exhibit 3(a) to the company’s quarterly report on Form 10-Q for the quarter ended September 30, 1993, File No. 1-6311). | |
| 3.2 | Amended and Restated Bylaws of Tidewater Inc. dated May 17, 2012 (filed with the Commission as Exhibit 3.2 to the company’s current report on Form 8-K on May 22, 2012, File No. 1-6311). | |
| 4.1 | Note Purchase Agreement, dated July 1, 2003, by and among Tidewater Inc., certain of its subsidiaries, and certain institutional investors (filed with the Commission as Exhibit 4 to the company’s quarterly report on Form 10-Q for the quarter ended June 30, 2003, File No. 1-6311). | |
| 4.2 | Note Purchase Agreement, dated September 9, 2010, by and among Tidewater Inc., certain of its subsidiaries, and certain institutional investors (filed with the Commission as Exhibit 10.1 to the company’s current report on Form 8-K on September 15, 2010, File No. 1-6311). | |
| 4.3 | Note Purchase Agreement, dated September 30, 2013, by and among Tidewater Inc., certain of its subsidiaries, and certain institutional investors (filed with the Commission as Exhibit 10.1 to the company’s current report on Form 8-K on October 3, 2013, File No. 1-6311). | |
| 10.1 | Fourth Amended and Restated Credit Agreement, dated June 21, 2013, among Tidewater Inc. and its domestic subsidiaries, Bank of America, N.A., as Administrative Agent, L/C Issuer and Swing Line Lender, Wells Fargo Bank, N.A., as Syndication Agent, and JPMorgan Chase Bank, N.A., DNB Bank ASA, New York Branch, The Bank of Tokyo-Mitsubishi UFJ, Ltd., BBVA Compass, Sovereign Bank, N.A., Regions Bank, and U.S. Bank National Association, as Co-Documentation Agents, and the lenders party thereto (filed with the Commission as Exhibit 10.1 to the company’s current report on Form 8-K on June 25, 2013, File No. 1-6311). | |
| 10.2 | Series A and B Note Purchase Agreement, dated August 15, 2011, by and among Tidewater Inc., certain of its subsidiaries, and certain institutional investors (filed with the Commission as Exhibit 10.1 to the company’s current report on Form 8-K on August 17, 2011, File No. 1-6311). | |
| 10.3 | Series C Note Purchase Agreement, dated August 15, 2011, by and among Tidewater Inc., certain of its subsidiaries, and certain institutional investors (filed with the Commission as Exhibit 10.2 to the company’s current report on Form 8-K on August 17, 2011, File No. 1-6311). | |
| 10.4+ | Tidewater Inc. 2001 Stock Incentive Plan effective November 21, 2001 (filed with the Commission as Exhibit 10.5 to the company’s annual report on Form 10-K for the fiscal year ended March 31, 2005, File No. 1-6311). | |
| 10.5+ | Form of Stock Option and Restricted Stock Agreement for the Grant of Incentive Stock Options, Non-Qualified Stock Options and Restricted Stock Under the Tidewater Inc. 2001 Stock Incentive Plan (filed with the Commission as Exhibit 10.14 to the company’s annual report on Form 10-K for the fiscal year ended March 31, 2006, File No. 1-6311). | |
| 10.6+ | Form of Stock Option and Restricted Stock Agreement for the Grant of Incentive Stock Options and Non-Qualified Stock Options Under the Tidewater Inc. 2001 Stock Incentive Plan and the Grant of Restricted Stock Under the Tidewater Inc. Employee Restricted Stock Plan (filed with the Commission as Exhibit 10.15 to the company’s annual report on Form 10-K for the fiscal year ended March 31, 2006, File No. 1-6311). | |
- 1 -
Table of Contents
Index to Financial Statements
| 10.7+ | Tidewater Inc. 2006 Stock Incentive Plan effective July 20, 2006 (filed with the Commission as Exhibit 99.1 to the company’s current report on Form 8-K on March 27, 2007, File No. 1-6311). | |
| 10.8+ | Form of Stock Option and Restricted Stock Agreement for the Grant of Incentive Stock Options, Non- Qualified Stock Options and Restricted Stock Under the Tidewater Inc. 2006 Stock Incentive Plan (filed with the Commission as Exhibit 10.20 to the company’s annual report on Form 10-K for the fiscal year ended March 31, 2008, File No. 1-6311). | |
| 10.9+ | Amended and Restated Directors Deferred Stock Units Plan effective January 30, 2008 (filed with the Commission as Exhibit 10.21 to the company’s annual report on Form 10-K for the fiscal year ended March 31, 2008, File No. 1-6311). | |
| 10.10+ | Amendment to the Amended and Restated Tidewater Inc. Directors Deferred Stock Units Plan effective November 15, 2012 (filed with the Commission as Exhibit 10.1 to the company’s quarterly report on Form 10-Q for the quarter ended December 31, 2012, File No. 1-6311). | |
| 10.11+ | Second Amendment to the Amended and Restated Tidewater Inc. Directors Deferred Stock Units Plan (filed with the Commission as Exhibit 10.1 to the company’s quarterly report on From 10-Q for the quarter ended September 30, 2014, File No. 1-6311). | |
| 10.12+ | Stock Option and Restricted Stock Agreement for the Grant of Incentive Stock Options, Non-Qualified Stock Options and Restricted Stock Under the Tidewater Inc. 2006 Stock Incentive Plan between Tidewater Inc. and Quinn P. Fanning effective as of July 30, 2008 (filed with the Commission as Exhibit 10.8 to the company’s quarterly report on Form 10-Q for the quarter ended September 30, 2008, File No. 1-6311). | |
| 10.13+ | Form of Stock Option and Restricted Stock Agreement for the Grant of Incentive Stock Options, Non- Qualified Stock Options and Restricted Stock Under the Tidewater Inc. 2006 Stock Incentive Plan applicable to 2009 grants (filed with the Commission as Exhibit 10.19 to the company’s annual report on Form 10-K for the fiscal year ended March 31, 2009, File No. 1-6311). | |
| 10.14+ | Amended and Restated Non-Qualified Pension Plan for Outside Directors of Tidewater Inc. amended through March 31, 2005 (filed with the Commission as Exhibit 10.23 to the company’s annual report on Form 10-K for the fiscal year ended March 31, 2006, File No. 1-6311). | |
| 10.15+ | Amendment to the Amended and Restated Non-Qualified Pension Plan for Outside Directors of Tidewater Inc. effective December 13, 2006 (filed with the Commission as Exhibit 10.1 to the company’s quarterly report on Form 10-Q for the quarter ended December 31, 2006, File No. 1-6311). | |
| 10.16+ | Restated Non-Qualified Deferred Compensation Plan and Trust Agreement as Restated October 1, 1999 between Tidewater Inc. and Merrill Lynch Trust Company of America (filed with the Commission as Exhibit 10(e) to the company’s quarterly report on Form 10-Q for the quarter ended December 31, 1999, File No. 1-6311). | |
| 10.17+ | Second Restated Executives Supplemental Retirement Trust as Restated October 1, 1999 between Tidewater Inc. and Hibernia National Bank (filed with the Commission as Exhibit 10(j) to the company’s quarterly report on Form 10-Q for the quarter ended December 31, 1999, File No. 1-6311). | |
| 10.18+ | Tidewater Inc. Individual Performance Executive Officer Annual Incentive Plan for Fiscal Year 2015 (filed with the Commission as Exhibit 10.2 to the company’s quarterly report on Form 10-Q for the quarter ended June 30, 2014, File No. 1-6311). | |
| 10.19+ | Tidewater Inc. Company Performance Executive Officer Annual Incentive Plan for Fiscal Year 2015 (filed with the Commission as Exhibit 10.1 to the company’s quarterly report on Form 10-Q for the quarter ended June 30, 2014, File No. 1-6311). | |
- 2 -
Table of Contents
Index to Financial Statements
| 10.20+ | Amendment to the Amended and Restated Non-Qualified Pension Plan for Outside Directors of Tidewater Inc. effective January 30, 2008 (filed with the Commission as Exhibit 10.35 to the company’s annual report on Form 10-K for the fiscal year ended March 31, 2008, File No. 1-6311). | |
| 10.21+ | Tidewater Inc. Amended and Restated Supplemental Executive Retirement Plan executed on December 10, 2008 (filed with the Commission as Exhibit 10.1 to the company’s quarterly report on Form 10-Q for the quarter ended December 31, 2008, File No. 1-6311). | |
| 10.22+ | Tidewater Inc. Amended and Restated Employees’ Supplemental Savings Plan executed on December 10, 2008 (filed with the Commission as Exhibit 10.3 to the company’s quarterly report on Form 10-Q for the quarter ended December 31, 2008, File No. 1-6311). | |
| 10.23+ | Amendment to the Tidewater Inc. Amended and Restated Supplemental Executive Retirement Plan dated December 10, 2008 (filed with the Commission as Exhibit 10.4 to the company’s quarterly report on Form 10-Q for the quarter ended December 31, 2008, File No. 1-6311). | |
| 10.24+ | Amendment Number One to the Tidewater Employees’ Supplemental Savings Plan, effective January 22, 2009 (filed with the Commission as Exhibit 10.43 to the company’s annual report on Form 10-K for the fiscal year ended March 31, 2009, File No. 1-6311). | |
| 10.25+ | Amendment Number Two to the Tidewater Inc. Supplemental Executive Retirement Plan, effective January 22, 2009 (filed with the Commission as Exhibit 10.44 to the company’s annual report on Form 10-K for the fiscal year ended March 31, 2009, File No. 1-6311). | |
| 10.26+ | Summary of Compensation Arrangements with Directors (filed with the Commission as Exhibit 10.29 to the company’s annual report on Form 10-K for the fiscal year ended March 31, 2014, File No. 1-6311). | |
| 10.27+ | Amended and Restated Change of Control Agreement between Tidewater Inc. and Jeffrey A. Gorski effective as of June 1, 2012 (filed with the Commission as Exhibit 10.30 to the company’s annual report on Form 10-K for the fiscal year ended March 31, 2013, File No. 1-6311). | |
| 10.28+ | Amended and Restated Change of Control Agreement between Tidewater Inc. and Jeffrey Platt dated effective as of June 1, 2008 (filed with the Commission as Exhibit 10.4 to the company’s quarterly report on Form 10-Q for the quarter ended September 30, 2008, File No. 1-6311). | |
| 10.29+ | Amended and Restated Change of Control Agreement between Tidewater Inc. and Joseph Bennett dated effective as of June 1, 2008 (filed with the Commission as Exhibit 10.5 to the company’s quarterly report on Form 10-Q for the quarter ended September 30, 2008, File No. 1-6311). | |
| 10.30+ | Amended and Restated Change of Control Agreement between Tidewater Inc. and Bruce D. Lundstrom dated effective as of July 31, 2008 (filed with the Commission as Exhibit 10.6 to the company’s quarterly report on Form 10-Q for the quarter ended September 30, 2008, File No. 1-6311). | |
| 10.31+ | Change of Control Agreement between Tidewater Inc. and Quinn P. Fanning dated effective as of July 31, 2008 (filed with the Commission as Exhibit 10.7 to the company’s quarterly report on Form 10-Q for the quarter ended September 30, 2008, File No. 1-6311). | |
| 10.32+ | Tidewater Inc. 2009 Stock Incentive Plan (filed with the Commission as Exhibit 99.1 to the company’s current report on Form 8-K on July 10, 2009, File No. 1-6311). | |
| 10.33+ | Form of Tidewater Inc. Indemnification Agreement entered into with each member of the Board of Directors, each executive officer and the principal accounting officer (filed with the Commission as Exhibit 99.1 to the company’s current report on Form 8-K on December 15, 2009, File No. 1-6311). | |
| 10.34+ | Form of Stock Option and Restricted Stock Agreement for the Grant of Incentive Stock Options, Non- Qualified Stock Options and Restricted Stock Under the Tidewater Inc. 2009 Stock Incentive Plan | |
- 3 -
Table of Contents
Index to Financial Statements
| (filed with the Commission as Exhibit 10.41 to the company’s annual report on Form 10-K for the fiscal year ended March 31, 2010, File No. 1-6311). | ||
| 10.35+ | Amendment Number Two to the Tidewater Employees’ Supplemental Savings Plan (filed with the Commission as Exhibit 10.43 to the company’s annual report on Form 10-K for the fiscal year ended March 31, 2011, File No. 1-6311). | |
| 10.36+ | Amendment Number Three to the Tidewater Inc. Supplemental Executive Retirement Plan (filed with the Commission as Exhibit 10.44 to the company’s annual report on Form 10-K for the fiscal year ended March 31, 2011, File No. 1-6311). | |
| 10.37+ | Amendment Number Three to the Tidewater Employees’ Supplemental Savings Plan (filed with the Commission as Exhibit 10.1 to the company’s quarterly report on Form 10-Q for the quarter ended December 31, 2010, File No. 1-6311). | |
| 10.38+ | Amendment Number Four to the Tidewater Inc. Supplemental Executive Retirement Plan (filed with the Commission as Exhibit 10.2 to the company’s quarterly report on Form 10-Q for the quarter ended December 31, 2010, File No. 1-6311). | |
| 10.39+ | Form of Restricted Stock Units Agreement under the Tidewater Inc. 2009 Stock Incentive Plan (2012 and 2013 awards) (filed with the Commission as Exhibit 10.46 to the company’s annual report on Form 10-K for the fiscal year ended March 31, 2012, File No. 1-6311). | |
| 10.40+ | Form of Restricted Stock Units Agreement under the Tidewater Inc. 2009 Stock Incentive Plan (2014 awards) (filed with the Commission as Exhibit 10.44 to the company’s annual report on Form 10-K for the fiscal year ended March 31, 2014, File No. 1-6311). | |
| 10.41+ | Tidewater Inc. 2014 Stock Incentive Plan (filed with the Commission as Exhibit 10.3 to the company’s current report on Form 8-K on August 4, 2014, File No. 1-6311). | |
| 10.42+ | Form of Incentive Agreement under the Tidewater Inc. 2014 Stock Incentive Plan (filed with the Commission as Exhibit 10.2 to the company’s current report on Form 8-K on March 23, 2015, File No. 1-6311). | |
| 10.43+ | Second Amended and Restated Tidewater Inc. Phantom Stock Plan (filed with the Commission as Exhibit 10.3 to the company’s current report on Form 8-K on March 23, 2015, File No. 1-6311). | |
| 10.44+ | Form of Officer Agreement under the Second Amended and Restated Tidewater Inc. Phantom Stock Plan (filed with the Commission as Exhibit 10.4 to the company’s current report on Form 8-K on March 23, 2015, File No. 1-6311). | |
| 21* | Subsidiaries of the company. | |
| 23* | Consent of Independent Registered Accounting Firm – Deloitte & Touche LLP. | |
| 31.1* | Certification of Chief Executive Officer pursuant to Rule 13a-14(a) or 15d-14(a) of the Securities Exchange Act of 1934, as adopted pursuant to Section 302 of the Sarbanes-Oxley Act of 2002. | |
| 31.2* | Certification of Chief Financial Officer pursuant to Rule 13a-14(a) or 15d-14(a) of the Securities Exchange Act of 1934, as adopted pursuant to Section 302 of the Sarbanes-Oxley Act of 2002. | |
| 32.1* | Certification of Chief Executive Officer and Chief Financial Officer Pursuant to 18 U.S.C. Section 1350, as adopted pursuant to Section 906 of the Sarbanes-Oxley Act of 2002. | |
| 101.INS* | XBRL Instance Document. | |
- 4 -
Table of Contents
Index to Financial Statements
| 101.SCH* | XBRL Taxonomy Extension Schema. | |
| 101.CAL* | XBRL Taxonomy Extension Calculation Linkbase. | |
| 101.DEF* | XBRL Taxonomy Extension Definition Linkbase. | |
| 101.LAB* | XBRL Taxonomy Extension Label Linkbase. | |
| 101.PRE* | XBRL Taxonomy Extension Presentation Linkbase. | |
| * | Filed herewith. |
| + | Indicates a management contract or compensatory plan or arrangement. |
- 5 -