Attached files
| file | filename |
|---|---|
| EX-21.1 - EX-21.1 - Wesco Aircraft Holdings, Inc | a15-19986_5ex21d1.htm |
| EX-32.1 - EX-32.1 - Wesco Aircraft Holdings, Inc | a15-19986_5ex32d1.htm |
| EX-31.1 - EX-31.1 - Wesco Aircraft Holdings, Inc | a15-19986_5ex31d1.htm |
| EX-31.2 - EX-31.2 - Wesco Aircraft Holdings, Inc | a15-19986_5ex31d2.htm |
| EX-10.27 - EX-10.27 - Wesco Aircraft Holdings, Inc | a15-19986_5ex10d27.htm |
| EX-10.12 - EX-10.12 - Wesco Aircraft Holdings, Inc | a15-19986_5ex10d12.htm |
| EX-23.1 - EX-23.1 - Wesco Aircraft Holdings, Inc | a15-19986_5ex23d1.htm |
UNITED STATES
SECURITIES AND EXCHANGE COMMISSION
Washington, D.C. 20549
FORM 10-K
(Mark One)
x ANNUAL REPORT PURSUANT TO SECTION 13 OR 15(d) OF THE SECURITIES EXCHANGE ACT OF 1934
For the fiscal year ended September 30, 2015
or
o TRANSITION REPORT PURSUANT TO SECTION 13 OR 15(d) OF THE SECURITIES EXCHANGE ACT OF 1934
For the transition period from to
Commission File No. 001-35253
WESCO AIRCRAFT HOLDINGS, INC.
(Exact Name of Registrant as Specified in Its Charter)
|
Delaware |
20-5441563 |
|
(State of Incorporation) |
(I.R.S. Employer |
24911 Avenue Stanford
Valencia, California 91355
(Address of Principal Executive Offices and Zip Code)
(661) 775-7200
(Registrant’s Telephone Number, Including Area Code)
Securities Registered pursuant to Section 12(b) of the Act:
|
Title of Each Class |
|
Name of Each Exchange on Which Registered |
|
Common Stock, par value $0.001 per share |
|
New York Stock Exchange |
Securities Registered pursuant to Section 12(g) of the Act: None
Indicate by check mark if the registrant is a well-known seasoned issuer, as defined in Rule 405 of the Securities Act. Yes x No o
Indicate by check mark if the registrant is not required to file reports pursuant to Section 13 or Section 15(d) of the Act. Yes o No x
Indicate by check mark whether the registrant (1) has filed all reports required to be filed by Section 13 or 15(d) of the Securities Exchange Act of 1934 during the preceding 12 months (or for such shorter period that the registrant was required to file such reports), and (2) has been subject to such filing requirements for the past 90 days. Yes x No o
Indicate by check mark whether the registrant has submitted electronically and posted on its corporate Website, if any, every Interactive Data File required to be submitted and posted pursuant to Rule 405 of Regulation S-T during the preceding 12 months (or shorter period that the registrant was required to submit and post such files). Yes x No o
Indicate by check mark if disclosure of delinquent filers pursuant to Item 405 of Regulation S-K is not contained herein, and will not be contained, to the best of the registrant’s knowledge, in definitive proxy or information statements incorporated by reference in Part III of this Form 10-K or any amendment to this Form 10-K. o
Indicate by check mark whether the registrant is a large accelerated filer, an accelerated filer, or a non-accelerated filer, or a smaller reporting company. See definitions of “large accelerated filer,” “accelerated filer” and “smaller reporting company” in Rule 12b-2 of the Securities Exchange Act of 1934.
|
Large accelerated filer x |
Accelerated filer o |
Non-accelerated filer o |
Smaller reporting company o |
Indicate by check mark whether the registrant is a shell company (as defined in Rule 12b-2 of the Act). Yes o No x
As of March 31, 2015, the aggregate market value of the voting and non-voting common equity held by non-affiliates based on the closing price as of that day was approximately $1,127,358,000.
The number of shares of common stock (par value $0.001 per share) of the registrant outstanding as of November 23, 2015, was 97,930,525.
Documents Incorporated by Reference
Part III of this Annual Report on Form 10-K incorporates by reference certain information from the registrants’ definitive proxy statement for the 2016 annual meeting of stockholders, which the registrant intends to file pursuant to Regulation 14A with the Securities and Exchange Commission not later than 120 days after the registrant’s fiscal year end of September 30, 2015. With the exception of the sections of the definitive proxy statement specifically incorporated herein by reference, the definitive proxy statement is not deemed to be filed as part of this Annual Report on Form 10-K.
CERTAIN DEFINITIONS
Unless otherwise noted in this Annual Report, the term “Wesco Aircraft” means Wesco Aircraft Holdings, Inc., our top-level holding company, and the terms “Wesco,” “the Company,” “we,” “us,” “our” and “our Company” mean Wesco Aircraft and its subsidiaries, including (1) Wesco Aircraft Hardware Corp. (Wesco Aircraft Hardware), which is our primary historical domestic operating company and the sole member of Haas Group International, LLC, which we acquired, along with Haas Group, Inc. (now Haas Group, LLC) and its direct and indirect subsidiaries (collectively, Haas), on February 28, 2014, and (2) Wesco Aircraft Europe, Ltd. (Wesco Aircraft Europe), our primary historical foreign operating company. References to “fiscal year” mean the year ending or ended September 30. For example, “fiscal year 2015” or “fiscal 2015” means the period from October 1, 2014 to September 30, 2015.
CAUTIONARY NOTE REGARDING FORWARD-LOOKING STATEMENTS
This Annual Report on Form 10-K contains forward-looking statements (including within the meaning of the Private Securities Litigation Reform Act of 1995) concerning Wesco and other matters. These statements may discuss goals, intentions and expectations as to future plans, trends, events, results of operations or financial condition, or otherwise, based on current beliefs of management, as well as assumptions made by, and information currently available to, such management. Forward-looking statements may be accompanied by words such as “aim,” “anticipate,” “believe,” “plan,” “could,” “would,” “should,” “estimate,” “expect,” “forecast,” “future,” “guidance,” “intend,” “may,” “will,” “possible,” “potential,” “predict,” “project” or similar words, phrases or expressions. These forward-looking statements are subject to various risks and uncertainties, many of which are outside our control. Therefore, you should not place undue reliance on such statements. Factors that could cause actual results to differ materially from those in the forward-looking statements include:
· general economic and industry conditions;
· conditions in the credit markets;
· changes in military spending;
· risks unique to suppliers of equipment and services to the U.S. government;
· risks associated with our long-term, fixed-price agreements that have no guarantee of future sales volumes;
· risks associated with the loss of significant customers, a material reduction in purchase orders by significant customers or the delay, scaling back or elimination of significant programs on which we rely;
· our ability to effectively compete in our industry;
· our ability to effectively manage our inventory;
· our ability to fully integrate the Haas business and realize anticipated benefits of the combined operations;
· risks related to unanticipated costs of integration;
· our suppliers’ ability to provide us with the products we sell in a timely manner, in adequate quantities and/or at a reasonable cost;
· our ability to maintain effective information technology systems;
· our ability to retain key personnel;
· risks associated with our international operations, including exposure to foreign currency movements;
· risks associated with assumptions we make in connection with our critical accounting estimates (including goodwill) and legal proceedings;
· our dependence on third-party package delivery companies;
· fuel price risks;
· our ability to establish and maintain effective internal control over financial reporting;
· fluctuations in our financial results from period-to-period;
· environmental risks;
· risks related to the handling, transportation and storage of chemical products;
· risks related to the aerospace industry and the regulation thereof;
· risks related to our indebtedness; and
· other risks and uncertainties.
The foregoing list of factors is not exhaustive. You should carefully consider the foregoing factors and the other risks and uncertainties that affect our business, including those described under Part I, Item 1A. “Risk Factors” and the other documents we file from time to time with the Securities and Exchange Commission. All forward-looking statements included in this Annual Report on Form 10-K (including information included or incorporated by reference herein) are based upon information available to us as of the date hereof, and we undertake no obligation to update or revise publicly any forward-looking statements, whether as a result of new information, future events or otherwise.
Company Overview
We are one of the world’s largest distributors and providers of comprehensive supply chain management services to the global aerospace industry on an annual sales basis. Our services range from traditional distribution to the management of supplier relationships, quality assurance, kitting, just-in-time (JIT) delivery and point-of-use inventory management. We supply over 575,000 active stock-keeping units (SKUs), including C-class hardware, chemicals, electronic components, bearings, tools and machined parts. In fiscal 2015, sales of hardware represented 49% of our net sales, sales of chemicals represented 40% of our net sales and sales of electronic components represented 7% of our net sales. We serve our customers under both (1) long-term contractual arrangements (Contracts), which include JIT contracts, that govern the provision of comprehensive outsourced supply chain management services and long-term agreements, or LTAs, that typically set prices for specific products, and (2) ad hoc sales. In February 2014, we acquired 100% of the outstanding stock of Haas, a provider of chemical supply chain management services to the commercial aerospace, airline, military, automotive, energy, pharmaceutical and electronics sectors. In July 2012, we acquired substantially all of the assets of Interfast, Inc. (Interfast), a Toronto-based value-added distributor of specialty fasteners, fastening systems and production installation tooling for the aerospace, electronics and general industrial markets.
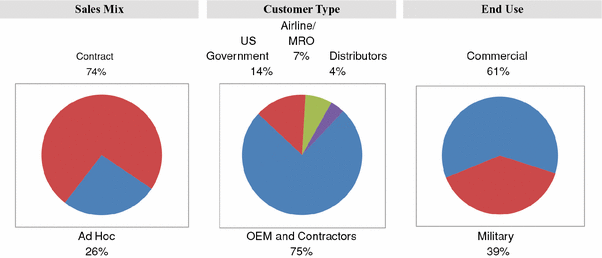
Founded in 1953 by the father of our current Chairman of the Board of Directors, we have grown to serve over 8,200 customers, which are primarily in the commercial, military and general aviation sectors, including the leading original equipment manufacturers (OEMs) and their subcontractors, through which we support nearly all major Western aircraft programs. We also service industrial customers, which include customers in the automotive, energy, pharmaceutical and electronics sectors. We have approximately 2,670 employees and operate across 88 locations in 20 countries. The following charts illustrate the composition of our fiscal year 2015 net sales based on our sales data.
For additional information about our segment reporting, see Note 21 of the Notes to Consolidated Financial Statements in Part II, Item 8 of this Annual Report on Form 10-K.
Our Products and Services
We conduct our operations through two reportable segments: North America and Rest of World.
The following is a summary of revenues for each of our segments:
|
|
|
Year Ended September 30, |
| |||||||||||||
|
|
|
2015 |
|
2014 |
|
2013 |
| |||||||||
|
|
|
Revenue |
|
% of Revenue |
|
Revenue |
|
% of Revenue |
|
Revenue |
|
% of Revenue |
| |||
|
North America |
|
$ |
1,198,201 |
|
80 |
% |
$ |
1,030,511 |
|
76 |
% |
$ |
713,725 |
|
79 |
% |
|
Rest of World |
|
299,414 |
|
20 |
% |
325,366 |
|
24 |
% |
187,883 |
|
21 |
% | |||
|
Total |
|
$ |
1,497,615 |
|
100 |
% |
$ |
1,355,877 |
|
100 |
% |
$ |
901,608 |
|
100 |
% |
Our Products
We offer more than 575,000 active SKUs, which fall into the following product categories during the year ended September 30, 2015 (dollars in thousands):
|
|
|
|
|
|
|
Electronic |
|
|
|
Machined Parts |
|
|
|
Hardware |
|
Chemicals |
|
Components |
|
Bearings |
|
and Other |
|
Net product sales |
|
$738,496 |
|
$591,840 |
|
$107,918 |
|
$33,602 |
|
$25,759 |
|
|
|
|
|
|
|
|
|
|
|
|
|
% of net product sales |
|
49% |
|
40% |
|
7% |
|
2% |
|
2% |
|
|
|
|
|
|
|
|
|
|
|
|
|
Types of products offered |
|
• Blind fasteners |
|
• Adhesives |
|
• Connectors |
|
• Airframe control bearings |
|
• Brackets |
|
|
|
• Panel fasteners |
|
• Sealants and tapes |
|
• Relays |
|
• Rod ends |
|
• Milled parts |
|
|
|
• Bolts and screws |
|
• Lubricants |
|
• Switches |
|
• Spherical bearings |
|
• Shims |
|
|
|
• Clamps |
|
• Oil and grease |
|
• Circuit breakers |
|
• Ball bearing rod ends |
|
• Stampings |
|
|
|
• Hi lok pins and collars |
|
• Paints and coatings |
|
• Lighted products |
|
• Roller bearings |
|
• Turned parts |
|
|
|
• Hose assemblies |
|
• Industrial gases |
|
|
|
• Bushings |
|
• Welded assemblies |
|
|
|
• Hydraulic fittings |
|
• Coolants and metalworking fluids |
|
|
|
|
|
• Installation tooling |
|
|
|
• Inserts |
|
• Cleaners and cleaning solvents |
|
|
|
|
|
|
|
|
|
• Lockbolts and collars |
|
|
|
|
|
|
|
|
|
|
|
• Nuts |
|
|
|
|
|
|
|
|
|
|
|
• Rivets |
|
|
|
|
|
|
|
|
|
|
|
• Springs |
|
|
|
|
|
|
|
|
|
|
|
• Valves |
|
|
|
|
|
|
|
|
|
|
|
• Washers |
|
|
|
|
|
|
|
|
Hardware
Sales of C-class aerospace hardware represented 49%, 62% and 83% of our fiscal 2015, 2014 and 2013 product sales, respectively. Fasteners, our largest category of hardware products, include a wide range of highly engineered aerospace parts that are designed to hold together two or more components, such as rivets (both blind and solid), bolts (including blind bolts), screws, nuts and washers. Many of these fasteners are designed for use in specific aircraft platforms and others can be used across multiple platforms. Materials used in the manufacture of these fasteners range from standard alloys, such as aluminum, steel or stainless steel, to more advanced materials, such as titanium, Inconel and Waspalloy.
Chemicals
On February 28, 2014, we acquired Haas, a provider of chemical supply chain management services to the commercial aerospace, airline, military, automotive, energy, pharmaceutical and electronics sectors. Chemical sales represented 40%, 26% and 0% of our fiscal 2015, 2014 and 2013 product sales, respectively. As a result of our acquisition of Haas, our chemical product offerings include adhesives; sealants and tapes; lubricants; oil and grease; paints and coatings; industrial gases; coolants and metalworking fluids; and cleaners and cleaning solvents.
Electronic Components
We offer highly reliable interconnect and electro-mechanical products, including connectors, relays, switches, circuit breakers and lighted products. We also offer value-added assembled products including mil-circular and rack and panel connectors and illuminated push button switches. We maintain large quantities of connector components in inventory, which allows us to respond quickly to customer orders. In addition, our lighted switch assembly operation affords customers same day service, including engraving capabilities in multiple languages.
Bearings
Our product offering includes a variety of standard anti-friction products designed to both commercial and military aircraft specifications, such as airframe control bearings, rod ends, spherical bearings, ball bearing rod ends, roller bearings and bushings.
Machined Parts and Other
Machined parts are designed for a specific customer and are assigned unique OEM-specific SKUs. The machined parts we distribute include laser cut or stamped brackets, milled parts, shims, stampings, turned parts and welded assemblies made of materials ranging from high-grade steel or titanium to nickel based alloys.
We stock a full range of tools needed for the installation of many of our products, including air and hydraulic tools as well as drill motors, and we also offer factory authorized maintenance and repair services for these tools. In addition to selling these tools, we also rent or lease these tools to our customers.
Our Services
In addition to our traditional distribution services, we have developed innovative value-added services, such as quality assurance, kitting and JIT supply chain management for our customers, and also sell products to airline-affiliated and independent maintenance, repair and overhaul (MRO) providers.
Quality Assurance
Our quality assurance (QA) function is a key component of our service offering, with 6% of our employees dedicated to this area. We believe we offer an industry-leading QA function as a result of our rigorous processes, sophisticated testing equipment and dedicated QA staff. Our superior QA performance is demonstrated by a comparison of our customers’ aggregate rejection rate of the products we deliver, which was 0.11% during fiscal 2015, to our rejection rate of the products we receive from our suppliers, which was 2.94% during fiscal 2015.
Our QA department inspects the inventory we purchase to ensure the accuracy and completeness of documentation. For many of our customers, these inspections are conducted at our in-house laboratory, where we operate sophisticated testing equipment. We also maintain an electronic copy of the relevant certifications for the inventory, which can include a manufacturer certificate of conformance, test reports, process certifications, material distributor certifications and raw material mill certifications. Our industry-leading QA capabilities also allow our JIT customers to reduce the number of personnel dedicated to the QA function and reduce the delays caused by the rejection of improperly inspected products.
Kitting
Kitting involves the packaging of an entire bill of materials or a complete “ship-set” of products, which reduces the amount of time workers spend retrieving products from storage locations. Kits can be customized in varying configurations and sizes and can contain up to several hundred different products. All of our kits and components contain fully certified and traceable products and are assembled by our full-service kitting department at our Central Stocking Locations (CSLs), or at our customer sites.
JIT Supply Chain Management
JIT supply chain management involves the delivery of products on an as-needed basis to the point-of-use at a customer’s manufacturing line. JIT programs are designed to prevent excess inventory build-up and shortages and improve manufacturing efficiency. Each JIT contract requires us to maintain an efficient inventory tracking, analysis and replenishment program and is designed to provide high levels of stock availability and on-time delivery. We believe customers that utilize our comprehensive JIT supply chain management services are frequently able to realize significant benefits including:
· reduced inventory levels and lower inventory excess and obsolescence (E&O) expense, in part because such customers only purchase what they need, and make more efficient use of their floor space;
· increased accuracy in forecasting and planning, resulting in substantially improved on-time delivery, reduced expediting costs and fewer disruptions of production schedules;
· improved quality assurance resulting in a substantial reduction in customer product rejection rates; and
· reduced administrative and overhead costs relating to procurement, QA, supplier management and stocking functions.
Before signing a JIT contract, our customers typically experience outages of many SKUs and, in some cases, have up to a year’s worth of inventory on hand. As part of our JIT programs, we generally assume the customer’s existing inventory at the onset of the contract, immediately reducing their inventory on-hand and the associated management costs. Customer inventory is generally assumed on a consignment basis and is entered in our database in a distinct customer-specific “virtual warehouse.” Software protocol in our IT systems requires the system to first “look” to a customer’s consigned inventory when parts replenishment is required. In certain cases, we can sell this consigned inventory to our base of over 8,200 other active customers around the world, gradually drawing down the customer’s inventory. As the consigned inventory for each SKU is exhausted, our stock of Wesco-sourced product reserve is then used for replenishment.
Another key strength of our JIT programs is our ability to utilize highly scalable and customizable point-of-use systems to develop an efficient supply chain management system and automated replenishment solution for any number of SKUs. In order to minimize inventory on hand, certain indicators are used to trigger the replenishment of product from a supplying location to the location of consumption. Our “Twin-Bin” system is an example of such an indicator. A JIT program designed around a Twin-Bin system utilizes a specially-manufactured unit composed of two bins stacked on top of one another. In this system, a clear plastic bag, typically containing a 30-day supply of parts, is loaded in each bin. Production workers use all of the parts within the bottom bin before drawing a pullout slide between the two bins that drops the full plastic bag of parts from the top bin into the bottom bin. An empty top bin indicates the need to initiate replenishment of the parts and provides a clear visual management process on the manufacturing floor. All replenishment activity is done via hand-held scanners that transmit orders to our stocking locations.
In certain circumstances, we also provide our JIT customers with additional value-added services, including the implementation of process control and usage reduction programs; support for environmental, health and safety compliance (EHS) and reporting; and assistance with the development of waste management strategies.
MRO Sales
We sell products to airline-affiliated, OEM-affiliated and independent MRO providers on both a Contract and ad hoc basis. We have recently expanded our efforts to increase our presence in both the commercial and military aerospace MRO markets, particularly as a result of our acquisition of Interfast in 2012, our acquisition of Haas in 2014 and through the introduction of our Wesco e-commerce sales platform, which we believe provides us with a cost-effective way to further penetrate the MRO market. In addition, we have targeted domestic and international airlines and maintenance centers that we believe are assuming an expanded role within the MRO market.
Going forward, we expect commercial MRO providers to benefit from the same trends as those impacting the commercial OEM market, including increased revenue passenger miles, which in turn should drive growth in the commercial fleet and greater utilization of existing aircraft. The commercial MRO market may also benefit from directives or notifications announced by international industry regulators and trade associations. Such directives or notifications can serve to bolster required maintenance, and thus the demand for new and existing aerospace products. In addition, the retirement of certain older and less fuel-efficient aircraft models has been deferred as a result of the recent decrease in global oil prices, which we believe could drive growth in the MRO market. Furthermore, we expect demand in the military MRO market to be driven by requirements to maintain aging military fleets, changes in the overall fleet size and the level of U.S. military activity overseas. We believe that our presence in this market helps us mitigate the volatility of new military aircraft sales with sales to the aftermarket.
Customer Contracts
We sell products to our customers under two types of arrangements: (1) Contracts, which include JIT supply chain management contracts and LTAs, and (2) ad hoc sales.
Contracts
JIT Contracts. JIT contracts are typically three to five years in length and are structured to supply the product requirement for specific SKUs, production lines or facilities. Given our direct involvement with JIT customers, volume requirements and purchasing frequency under these contracts is highly predictable. Under JIT contracts, customers commit to purchase specified products from us at a fixed price or a pass-through price, on an if-and-when needed basis, and we are responsible for maintaining high levels of stock availability of those products. JIT contracts typically contain termination for
convenience provisions, which generally allow our customers to terminate their contracts on short notice without meaningful penalties, provided that we are reimbursed for the cost of any inventory specifically procured for the customer. JIT customers often purchase products from us that are not covered under their contracts on an ad hoc basis. For additional information about our JIT supply chain management services, see “—Our Products and Services—Our Services—JIT Supply Chain Management.”
LTAs. Like JIT contracts, LTAs also typically run for three to five years. LTAs are essentially negotiated price lists for customers or individual customer sites that cover a range of pre-determined products, purchased on an as-needed basis. LTAs generally obligate the customer to buy contracted SKUs from us and may obligate us to maintain stock availability for those products. Once an LTA is in place, the customer is then able to place individual purchase orders with us for any of the contractually specified products. LTAs typically contain termination for convenience provisions, which generally allow for our customers to terminate their contracts on short notice without meaningful penalties, provided that we are reimbursed for the cost of any inventory specifically procured for the customer. LTA customers also frequently purchase products from us on an ad hoc basis, which are not captured under the pricing arrangement.
Ad Hoc Sales
Ad hoc customers purchase products from us on an as-needed basis and are generally supplied out of our existing inventory. Typically, ad hoc orders are for smaller quantities of products than those ordered under Contracts, and are often urgent in nature. Given our breadth and volume of inventory, it is not uncommon for even our competitors to purchase products from us on an ad hoc basis when their own stocks prove to be inadequate. In an environment of increasing aircraft production, product shortages can become increasingly common for OEMs, subcontractors, MRO providers and distributors with less sophisticated forecasting abilities and procurement organizations.
Under each of the sales arrangements described above we typically warrant that the products we sell conform to the drawings and specifications that are in effect at the time of delivery in the applicable contract, and that we will replace defective or non-conforming products for a period of time that varies from contract to contract. The product manufacturer, in turn, typically indemnifies us for liabilities resulting from defective or non-conforming products. We do not accrue for warranty expenses as our claims related to defective and non-conforming products have been nominal.
We believe that backlog is not a relevant measure of our business, given the long-term nature of our Contracts with our customers.
Customers
We sell to over 8,200 active customers worldwide. During fiscal 2015, no single customer represented more than 10% of our net sales, and only two customers accounted for over 5% of our net sales, with each consisting of multiple independent programs. Our top 10 customers collectively accounted for 44% of our net sales during fiscal 2015.
Seventy-five percent of our fiscal 2015 net sales were derived from major OEMs, such as Airbus, Alenia, Boeing, BAE Systems, Bell Helicopter, Bombardier, Cessna, Embraer, Gulfstream, Lockheed Martin, Northrop Grumman and Raytheon, and certain of their subcontractors. Government sales comprised 14% of our net sales during fiscal 2015 and were derived from various military parts procurement agencies such as the U.S. Defense Logistics Agency, or from defense contractors buying on their behalf. Aftermarket sales to airline-affiliated or independent MRO providers made up 7% of our fiscal 2015 net sales. The remaining 4% of our net sales are to other distributors on an ad hoc basis.
During fiscal 2015, 61% of our net sales were derived from customers supporting commercial programs and 39% of our net sales were derived from customers supporting military programs. Our customers are principally located in the United States, with shipments to customers in the United States comprising 74% of our net sales during fiscal 2015. We also service international customers in markets that include Australia, Canada, China, France, Germany, India, Ireland, Israel, Italy, Malaysia, Mexico, Philippines, Poland, Saudi Arabia, Singapore, South Korea, Turkey and the United Kingdom. For additional information about our net sales and long-lived assets by geographic area, see Note 21 of the Notes to Consolidated Financial Statements in Part II, Item 8 of this Annual Report on Form 10-K.
Procurement
We source our inventory from over 4,290 suppliers, including Precision Castparts Corp., Alcoa Fastening Systems, PPG, Monogram Aerospace Fasteners, Henkel Corp., 3M, Lisi Aerospace, Cass Information Systems Inc., Chemtura Corporation and Bristol Industries. During fiscal 2015, Precision Castparts Corp. and Alcoa Fastening Systems supplied 13% and 9%, respectively, of
the products we purchased. Suppliers typically prefer to deal with a relatively small number of large and sophisticated distributors in order to improve machine utilization; reduce finished goods inventory and related obsolescence costs; maintain pricing discipline; improve performance in meeting on-time-delivery targets to end customers; and consolidate customer accounts, which can reduce administrative and overhead costs relating to sales and marketing, customer service and other functions. As a result of the scale of our operations and our long-standing relationships with many of our suppliers, we are often able to take advantage of significant volume-based discounts when purchasing inventory. Given our industry position, financial strength and philosophy of cooperation with suppliers, we believe we are in an excellent position to become a distributor for new product lines as they become available.
Our management analyzes supply, demand, cost and pricing factors to make inventory investment decisions, which are facilitated by our highly customized IT systems, and we maintain close relationships with the leading suppliers in the industry. Our strong understanding of the global aerospace industry is derived from our long-term relationships with major OEMs, subcontractors and suppliers. In addition, our direct insight into our customers’ production rates often allows us to detect industry trends. Furthermore, our ability to forecast demand and place purchase orders with our suppliers well in advance of our customer requirements can provide us with a distinct advantage in an industry where inventory availability is critical for customers that need specific products within a stipulated timeframe to meet their own production and delivery commitments. However, despite our expertise in this area, effective inventory management is an ongoing challenge, and we continue to take steps to enhance the sophistication of our procurement practices and mitigate the negative impact of inventory builds on our cash flow. For additional information about the impact of inventory on our business, including our cash flows, see Part I, Item 1A. “Risk Factors—Risks Related to Our Business and Industry—We may be unable to effectively manage our inventory, which could have a material adverse effect on our business, financial condition and results of operations,” Part II, Item 7. “Management’s Discussion and Analysis of Financial Condition and Results of Operations—Other Factors Affecting Our Financial Results—Fluctuations in Cash Flow,” and Part II, Item 7. “Management’s Discussion and Analysis of Financial Condition and Results of Operations—Critical Accounting Policies and Estimates—Inventories.”
Information Technology Systems
We have invested to build integrated, highly customized IT systems that enable our purchasing and sales organization to make more informed decisions, our inventory management system to operate in an efficient manner and certain of our customers to make online purchases directly from us. Our primary scalable IT infrastructure is based on IBM and Oracle servers, the Oracle Enterprise database and the Oracle JD Edwards EnterpriseOne (JDE), enterprise resource planning (ERP) system. Our chemical supply chain management system, tcmIS, is a proprietary system, developed using the Oracle Enterprise database. These customized IT systems provide us visibility into inventory quantities, stocking locations and purchases across our customer base by individual SKU, enabling us to accurately fill 16,000 orders per day and provide an exceptional level of customer service. These systems are fully capable of interfacing with external business systems, including Oracle, SAP, Microsoft and others, and we have developed additional functionality for JIT delivery and direct line feed of certain of the products we sell. This functionality includes recognition of signals and actions to fill customer bins from hand-held scanners, min/max data or proprietary signals from a customer’s ERP system. JDE and tcmIS also support our EDI functionality, which allows our system to interface with customers and suppliers, regardless of technology, data format or connectivity. TcmIS also supports additional chemical-specific functionality, such as product labeling and Global Harmonized System compliance.
For our shipping logistics and export compliance support, we employ Precision Software’s TRA/X. TRA/X enables us to ship globally while maintaining tracking numbers and rating information for each customer shipment. In addition, at several of our distribution facilities, we use Minerva’s AIMS inventory management system in order to provide the best possible warehouse flow and cycle times. AIMS is tailored to fit our global warehouse operational needs and allows us to provide an expandable warehouse management system that can also incorporate transaction processing, work-in-progress and other manufacturing operations. AIMS interfaces with a broad range of material handling equipment, including horizontal and vertical carousels, conveyors, sorting equipment, pick systems and cranes.
Competition
The industry in which we operate is highly competitive and fragmented. We believe the principal competitive factors in our industry include the ability to provide superior customer service and support, on-time delivery, sufficient inventory availability, competitive pricing and an effective QA program. Our competitors include both U.S. and foreign companies, including divisions of larger companies and certain of our suppliers, some of which have significantly greater financial resources than we do, and therefore may be able to adapt more quickly to changes in customer requirements than we can. In addition to facing competition for Contract customers from our primary competitors, Contract customers or potential Contract customers may also determine that it is more cost effective to establish or re-establish an in-house supply chain management system. Under
these circumstances, we may be unable to sufficiently reduce our costs in order to provide competitive pricing while also maintaining acceptable operating margins.
Employees
As of September 30, 2015, we employed approximately 2,670 personnel worldwide, 865 of which were located at customer sites. We have 799 employees located outside of North America. We are not a party to any collective bargaining agreements with our employees.
Regulatory Matters
Governmental agencies throughout the world, including the U.S. Federal Aviation Administration (the FAA), prescribe standards for aircraft components, including virtually all commercial airline and general aviation products, as well as regulations regarding the repair and overhaul of airframes and engines. Specific regulations vary from country to country, although compliance with FAA requirements generally satisfies regulatory requirements in other countries. In addition, the products we distribute must also be certified by aircraft and engine OEMs. If any of the material authorizations or approvals that allow us to supply products is revoked or suspended, then the sale of the related products would be prohibited by law, which would have an adverse effect on our business, financial condition and results of operations.
From time to time, the FAA or equivalent regulatory agencies in other countries propose new regulations or changes to existing regulations, which are usually more stringent than existing regulations. If these proposed regulations are adopted and enacted, we could incur significant additional costs to achieve compliance, which could have a material adverse effect on our business, financial condition and results of operations.
We are also subject to government rules and regulations that include the U.S. Foreign Corrupt Practices Act (the FCPA), the Bribery Act 2010 (the Bribery Act), the International Traffic in Arms Regulations (ITAR), the Export Administration Regulations (EAR), economic sanctions and the False Claims Act. See “Risk Factors—Risks Related to Our Business and Industry—We are subject to unique business risks as a result of supplying equipment and services to the U.S. government directly and as a subcontractor, which could lead to a reduction in our net sales from, or the profitability of our supply arrangements with, the U.S. government” and “—Our international operations require us to comply with numerous applicable anti-corruption and trade control laws and regulations, including those of the U.S. government and various other jurisdictions, and our failure to comply with these laws and regulations could adversely affect our reputation, business, financial condition and results of operations.”
Environmental Matters
We are subject to extensive federal, state, local and foreign laws, regulations, rules and ordinances relating to pollution, protection of the environment and human health and safety, and the handling, transportation, storage, treatment, disposal and remediation of hazardous substances, including potentially with respect to historical chemical blending and other activities that pre-dated our purchase of Haas. Actual or alleged violations of EHS laws, or permit requirements could result in restrictions or prohibitions on operations and substantial civil or criminal sanctions, as well as, under some EHS laws, the assessment of strict liability and/or joint and several liability.
Furthermore, we may be liable for the costs of investigating and cleaning up environmental contamination on or from our operations or at off-site locations, including potentially with respect to historical chemical blending and other activities that pre-dated our purchase of our businesses. We may therefore incur additional costs and expenditures beyond those currently anticipated to address all such known and unknown situations under existing and future EHS laws.
In addition, governmental, regulatory and societal demands for increasing levels of product safety and environmental protection could result in increased pressure for more stringent regulatory control with respect to the chemical industry. For example, the Hazard Communication Standard promulgated by the U.S. Occupational Safety and Health Administration is now aligned with the Globally Harmonized System of Classification and Labeling of Chemicals, which requires our suppliers to make revisions to labels and safety data sheets. Changes in the regulatory environment, particularly, but not limited to, in the United States, the European Union, Canada and China, could lead to heightened regulatory scrutiny and could adversely impact our ability to supply certain products and/to provide chemical management services to our customers. For instance, the August 2015 explosion at the port of Tianjin, China, may lead to stricter chemical safety standards in that country. The European Union’s Registration, Authorization and Restriction of Chemicals (“REACH” and analogous non-E.U. laws and regulations), or other similar laws and regulations, also could result in compliance obligations, fines, ongoing monitoring and other future
business activity restrictions, which could have a material adverse effect on the Company’s liquidity, financial position and results of operations.
Available Information
We file annual, quarterly and current reports and other information with the SEC. You may read and copy any documents that we file at the SEC’s public reference room at 100 F Street, N.E., Washington, D.C. 20549. You may call the SEC at 1-800-SEC-0330 to obtain further information about the public reference room. In addition, the SEC maintains an Internet website (www.sec.gov) that contains reports, proxy and information statements and other information regarding registrants that file electronically with the SEC, including us. You may also access, free of charge, our reports filed with the SEC (for example, our Annual Report on Form 10-K, our Quarterly Reports on Form 10-Q and our Current Reports on Form 8-K and any amendments to those forms) through the “Investor Relations” portion of our website (www.wescoair.com). We also make available on our website our (1) Corporate Governance Guidelines, (2) Code of Business Conduct and Ethics, which applies to our directors, officers and employees, (3) Whistleblower Policy and (4) the charters of the Audit, Compensation and Nominating and Corporate Governance Committees. Reports filed with or furnished to the SEC will be available as soon as reasonably practicable after they are filed with or furnished to the SEC. Our website is included in this Annual Report as an inactive textual reference only. The information found on our website is not part of this or any other report filed with or furnished to the SEC.
You should consider and read carefully all of the risks and uncertainties described below, as well as other information included in this Annual Report, including our consolidated financial statements and related notes. The risks described below are not the only ones facing us. The occurrence of any of the following risks or additional risks and uncertainties not presently known to us or that we currently believe to be immaterial could materially and adversely affect our business, financial condition or results of operations. This Annual Report also contains forward-looking statements and estimates that involve risks and uncertainties. Our actual results could differ materially from those anticipated in the forward-looking statements as a result of specific factors, including the risks and uncertainties described below.
Risks Related to Our Business and Industry
We are directly dependent upon the condition of the aerospace industry, which is closely tied to global economic conditions, and if the volatility in the global financial markets were to result in a slowdown in the current economic recovery or a return to a recession, our business, financial condition and results of operations could be negatively impacted.
Demand for the products and services we offer are directly tied to the delivery of new aircraft, aircraft utilization, and repair of existing aircraft, which, in turn, are impacted by global economic conditions. For example 2009, revenue passenger miles (RPMs) on commercial aircraft declined due to the global recession. During the same period, the industry experienced declines in large commercial, regional and business jet deliveries. While demand for commercial and regional jets has fully recovered, business jet orders and deliveries have recovered more slowly. A slowdown in the global economy, or a return to a recession, would negatively impact the aerospace industry, and could negatively impact our business, financial condition and results of operations.
Military spending, including spending on the products we sell, is dependent upon national defense budgets, and a reduction in military spending could have a material adverse effect on our business, financial condition and results of operations.
During the year ended September 30, 2015, 39% of our net sales were related to military aircraft. The military market is significantly dependent upon government budget trends, particularly the U.S. Department of Defense (DoD) budget. Future DoD budgets could be negatively impacted by several factors, including, but not limited to, a change in defense spending policy by the current and future presidential administrations and Congress, the U.S. government’s budget deficits, spending priorities, the cost of sustaining the U.S. military presence in overseas operations and possible political pressure to reduce U.S. Government military spending, each of which could cause the DoD budget to decline. A decline in U.S. military expenditures could result in a reduction in military aircraft production, which could have a material adverse effect on our business, financial condition and results of operations.
In particular, military spending may be negatively impacted by the Budget Control Act of 2011 (the Budget Control Act), which was passed in August 2011. The Budget Control Act established limits on U.S. government discretionary spending, including a reduction of defense spending by approximately $490 billion between the 2012 and 2021 U.S. government fiscal
years, and also provided that the defense budget would face “sequestration” cuts of up to an additional $500 billion during that same period to the extent that discretionary spending limits were exceeded. The impact of sequestration was reduced with respect to the government’s 2014 and 2015 fiscal years, in exchange for extending sequestration into fiscal years 2022 and 2023, following the enactment of the Bipartisan Budget Act of 2013 in December 2013. The impact of sequestration was further reduced with respect to the government’s 2016 and 2017 fiscal years, following the enactment of the Bipartisan Budget Act of 2015 in November 2015. Sequestration is currently scheduled to resume in the government’s 2018 fiscal year. We are unable to predict the impact the cuts associated with Sequestration will ultimately have on funding for the military programs which we support. However, such cuts could result in reductions, delays or cancellations of these programs, which could have a material adverse effect on our business, financial condition and results of operations.
We are subject to unique business risks as a result of supplying equipment and services to the U.S. government directly and as a subcontractor, which could lead to a reduction in our net sales from, or the profitability of our supply arrangements with, the U.S. government.
Companies engaged in supplying defense-related equipment and services to U.S. government agencies are subject to business risks specific to the defense industry. We contract directly with the U.S. government and are also a subcontractor to customers contracting with the U.S. government. Accordingly, the U.S. government may unilaterally suspend or prohibit us from receiving new contracts pending resolution of alleged violations of procurement laws or regulations, reduce the value of existing contracts or audit our contract-related costs and fees. In addition, most of our U.S. government contracts and subcontracts can be terminated by the U.S. government or the contracting party, as applicable, at its convenience. Termination for convenience provisions provide only for our recovery of costs incurred or committed, settlement expenses and profit on the work completed prior to termination.
In addition, we are subject to U.S. government inquiries and investigations, including periodic audits of costs that we determine are reimbursable under government contracts. U.S. government agencies routinely audit government contractors to review performance under contracts, cost structure and compliance with applicable laws, regulations, and standards, as well as the adequacy of and compliance with internal control systems and policies. Any costs found to be misclassified or inaccurately allocated to a specific contract are not reimbursable, and to the extent already reimbursed, must be refunded. Also, any inadequacies in our systems and policies could result in payments being withheld, penalties and reduced future business.
We are also subject to the federal False Claims Act, which provides for substantial civil penalties and treble damages where a contractor presents a false or fraudulent claim to the government for payment. Actions under the False Claims Act may be brought by the government or by other persons on behalf of the government (who may then share in any recovery).
We do not have guaranteed future sales of the products we sell and when we enter into Contracts with our customers we generally take the risk of cost overruns, and our business, financial condition, results of operations and operating margins may be negatively affected if we purchase more products than our customers require, product costs increase unexpectedly, we experience high start-up costs on new Contracts or our Contracts are terminated.
A majority of our Contracts are long-term, fixed-price agreements with no guarantee of future sales volumes, and they may be terminated for convenience on short notice by our customers, often without meaningful penalties, provided that we are reimbursed for the cost of any inventory specifically procured for the customer. In addition, we purchase inventory based on our forecasts of anticipated future customer demand. As a result, we may take the risk of having excess inventory in the event that our customers do not place orders consistent with our forecasts, particularly with respect to inventory that has a more limited shelf-life. We also run the risk of not being able to pass along or otherwise recover unexpected increases in our product costs, including as a result of commodity price increases, which may increase above our established prices at the time we entered into the Contract and established prices for products we provide. When we are awarded new Contracts, particularly JIT contracts, we may incur high costs, including salary and overtime costs to hire and train on-site personnel, in the start-up phase of our performance. In the event that we purchase more products than our customers require, product costs increase unexpectedly, we experience high start-up costs on new Contracts or our Contracts are terminated, our business, financial condition, results of operations and operating margins could be negatively affected.
If we lose significant customers, significant customers materially reduce their purchase orders or significant programs on which we rely are delayed, scaled back or eliminated, our business, financial condition and results of operations may be adversely affected.
Our top ten customers for the year ended September 30, 2015 accounted for 44% of our net sales. A reduction in purchasing by or loss of one of our larger customers for any reason, including changes in manufacturing or procurement practices, loss of a customer as a result of the acquisition of such customer by a purchaser who does not fully utilize a distribution model or uses a competitor, in-sourcing by customers, a transfer of business to a competitor, an economic downturn, failure to adequately service our clients, decreased production or a strike, could have a material adverse effect on our business, financial condition and results of operations.
As an example of changes in manufacturing practices that could impact us, OEMs such as Boeing and Airbus are currently incorporating an increasing amount of composite materials in the aircraft they manufacture. Aircraft utilizing composite materials generally require the use of significantly fewer C-class aerospace parts than new aircraft made of more traditional non-composite materials, although the parts used are generally higher priced than C-class aerospace parts used in non-composite aircraft structures. As Boeing, Airbus and other customers increase their reliance on composite materials, they may materially reduce their purchase orders from us.
As an example of the potential loss of business due to customer in-sourcing, a major OEM is undertaking an initiative to cause its first and second tier suppliers to source certain OEM-specific materials, including fasteners, directly from the OEM itself, rather than through distributors such as us. If such initiative is broadly implemented by the OEM, or if other OEMs pursue similar initiatives, a portion of our sales to their suppliers, and consequently our business, financial condition and results of operations, could be adversely affected.
We expect to derive a significant portion of our net sales from certain aerospace programs in their early production stages. In particular, our future growth will be dependent, in part, upon our sales to various OEMs and subcontractors. If production of any of the programs we support is terminated or delayed, or if our sales to customers affiliated with these programs are reduced or eliminated, our business, financial condition and results of operations could be adversely affected.
In addition, during fiscal 2014, we modified and extended a contract with an existing customer that resulted in a $66.3 million reduction in net sales to the customer during fiscal 2015 compared to fiscal 2014.
We operate in a highly competitive market and our failure to compete effectively may negatively impact our results of operations.
We operate in a highly competitive global industry and compete against a number of companies, including divisions of larger companies and certain of our suppliers, some of which may have significantly greater financial resources than we do, and therefore may be able to adapt more quickly to changes in customer requirements than we can. Our competitors consist of both U.S. and foreign companies and range in size from divisions of large public corporations to small privately held entities. We believe that our ability to compete depends on superior customer service and support, on-time delivery, sufficient inventory availability, competitive pricing and effective quality assurance programs. In order to remain competitive, we may have to adjust the prices of some of the products and services we sell and continue investing in our procurement, supply-chain management and sales and marketing functions, the costs of which could negatively impact our results of operations.
In addition, we face competition for our Contract customers from both competitors in our industry and the in-sourcing of supply-chain management by our customers themselves. If any of our Contract customers decides to in-source the services we provide or switch to one of our competitors, we would be adversely affected.
We may be unable to effectively manage our inventory, which could have a material adverse effect on our business, financial condition and results of operations.
Due to the lead times required by many of our suppliers, we typically order products, particularly hardware products, in advance of expected sales, and the volume of such orders may be significant. Lead times generally range from several weeks up to two years, depending on industry conditions, which makes it difficult to successfully manage our inventory as we plan for future demand. In addition, demand for our products can fluctuate significantly, which can also negatively impact our cash flows and inventory management. For example, we believe that the strategic inventory purchases we made during fiscal 2013, 2014 and 2015, combined with lower than expected demand and a lack of discipline around our inventory planning process, negatively impacted our cash flows. In addition, we may choose to dispose of slow-moving inventory in the future if we
determine that the market and economics make it prudent to do so. For example, in the three months ended September 30, 2015, we determined that inventory previously purchased in connection with a specific program which was subsequently terminated, to have no alternative use, and we recorded a reserve of $33.0 million for such inventory. In the fourth quarter of 2015, management implemented a new strategy of providing integrated supply chain services more tailored to customer demand through long-term contracts and focused forecasted consumption, including changes to our inventory purchasing strategy, holding inventory for shorter periods and the planned scrapping of long dated inventory. The new strategy and updates for fiscal 2015 sales activities led to changes in the sell through rates, holding period of aged inventory and others estimates used in the E&O reserve for our hardware inventory, which increased our E&O inventory reserves by $43.8 million. If we are unable to effectively manage our inventory, our cash flows may be negatively affected, which could have a material adverse effect on our business, financial condition and results of operations.
If suppliers are unable to supply us with the products we sell in a timely manner, in adequate quantities and/or at a reasonable cost, we may be unable to meet the demands of our customers, which could have a material adverse effect on our business, financial condition and results of operations.
Our inventory is primarily sourced directly from producers and manufacturing firms, and we depend on the availability of large supplies of the products we sell. Our largest supplier for the year ended September 30, 2015 was Precision Castparts Corp. During fiscal 2015, 13% of the products we purchased were from Precision Castparts Corp. and 9% were purchased from Alcoa Fastening Systems. In addition, our ten largest suppliers during fiscal 2015 accounted for 32% of our purchases. These manufacturers and producers may experience capacity constraints that result in their being unable to supply us with products in a timely manner, in adequate quantities and/or at a reasonable cost. Contributing factors to manufacturer capacity constraints include, among other things, industry or customer demands in excess of machine capacity, labor shortages and changes in raw material flows. Any significant interruption in the supply of these products or termination of our relationship with any of our suppliers could result in us being unable to meet the demands of our customers, which would have a material adverse effect on our business, financial condition and results of operations.
We may be unable to fully integrate the Haas business and may encounter significant unexpected difficulties as we work to fully integrate the two businesses.
On February 28, 2014, we completed the Haas acquisition. Prior to the acquisition, Wesco and Haas were independent organizations, each utilizing different systems, controls, processes and procedures. Following completion of the Haas acquisition, our ability to fully realize the anticipated benefits of the acquisition of Haas depends, to a large extent, on our ability to fully integrate the Haas business. The combination of two independent enterprises is a complex, costly and time-consuming process. The complexion of the overall integration may result in unanticipated problems, expenses, liabilities, loss of client relationships, expenditure of resources and distraction of management and personnel. The difficulties of completing the combination of the operations include:
· we may not realize any or all of the potential benefits of the acquisition of Haas that could result from combining the businesses of Wesco and Haas;
· the acquisition of Haas could have an adverse impact on our relationships with employees, customers and suppliers, and prospective customers or other third parties may delay or decline entering into agreements with us as a result of the acquisition;
· management’s attention may be diverted to integration matters;
· we may continue to devote significant additional resources to integration;
· we may not be able to achieve anticipated cost savings and synergies;
· we may have additional difficulties integrating financial accounting systems, internal controls and standards, procedures and policies (including with respect to Sarbanes-Oxley Act compliance);
· the assumptions both Wesco and Haas have made regarding critical accounting estimates could be incorrect;
· integration of our IT systems; and
· integration of our trade compliance function.
Our business is highly dependent on complex information technology.
The provision and application of IT is an increasingly critical aspect of our business. Among other things, our IT systems must frequently interact with those of our customers, suppliers and logistics providers. Our future success will depend
on our continued ability to employ IT systems that meet our customers’ demands. The failure or disruption of the hardware or software that supports our IT systems, including redundancy systems, could significantly harm our ability to service our customers and cause economic losses for which we could be held liable and which could damage our reputation.
Our competitors may have or may develop IT systems that permit them to be more cost effective and otherwise better situated to meet customer demands than IT systems we are able to acquire or develop. Larger competitors may be able to develop or license IT systems more cost effectively than we can by spreading the cost across a larger revenue base, and competitors with greater financial resources may be able to acquire or develop IT systems that we cannot afford. If we fail to meet the demands of our customers or protect against disruptions of our IT systems, we may lose customers, which could seriously harm our business and adversely affect our operating results and operating cash flow.
We may be unable to retain personnel who are key to our operations.
Our success, among other things, is dependent on our ability to attract, develop and retain highly qualified senior management and other key personnel. Competition for key personnel is intense, and our ability to attract and retain key personnel is dependent on a number of factors, including prevailing market conditions and compensation packages offered by companies competing for the same talent. The inability to hire, develop and retain these key employees may adversely affect our operations.
There are risks inherent in international operations that could have a material adverse effect on our business, financial condition and results of operations.
While the majority of our operations are based in the United States, we have significant international operations, with facilities in Australia, Canada, China, France, Germany, India, Ireland, Israel, Italy, Malaysia, Mexico, Philippines, Poland, Saudi Arabia, Singapore, South Korea, Turkey and the United Kingdom, and customers throughout North America, Latin America, Europe, Asia and the Middle East. For the years ended September 30, 2015 and 2014, 34% and 43%, respectively, of our net sales were derived from customers located outside the United States.
Our international operations are subject to, without limitation, the following risks:
· the burden of complying with multiple and possibly conflicting laws and any unexpected changes in regulatory requirements;
· political risks, including risks of loss due to civil disturbances, acts of terrorism, acts of war, guerilla activities and insurrection;
· unstable economic, financial and market conditions and increased expenses as a result of inflation, or higher interest rates;
· difficulties in enforcement of third-party contractual obligations and collecting receivables through foreign legal systems;
· difficulties in staffing and managing international operations and the application of foreign labor regulations;
· differing local product preferences and product requirements; and
· potentially adverse tax consequences from changes in tax laws, requirements relating to withholding taxes on remittances and other payments by subsidiaries and restrictions on our ability to repatriate dividends from our subsidiaries.
In addition, fluctuations in the value of foreign currencies affect the dollar value of our net investment in foreign subsidiaries, with these fluctuations being included in a separate component of stockholders’ equity. At September 30, 2015, we reported a cumulative foreign currency translation adjustment of $36.1 million in stockholders’ equity as a result of foreign currency translation adjustments, and we may incur additional adjustments in future periods. In addition, operating results of foreign subsidiaries are translated into U.S. dollars for purposes of our statements of comprehensive income at average monthly exchange rates. Moreover, to the extent that our net sales are not denominated in the same currency as our expenses, our net earnings could be materially adversely affected. For example, a portion of labor, material and overhead costs for our facilities in the United Kingdom, Germany, France and Italy are incurred in British Pounds or Euros, but in certain cases the related net sales are denominated in U.S. dollars. Changes in the value of the U.S. dollar or other currencies could result in material fluctuations in foreign currency translation amounts or the U.S. dollar value of transactions and, as a result, our net earnings could be materially adversely affected. At times we engage in hedging transactions to manage or reduce our foreign currency exchange risk, but these transactions may not be successful and, as a result, our business, financial condition and results of operations could be materially adversely affected. During fiscal 2015 and 2014, fluctuations in foreign currency exchange rates had a negative impact on net sales of $25.4 million and a positive impact on net sales of $29.6 million, respectively.
Our international operations also cause our business to be subject to the U.S. Export Control regime and similar regulations in other countries, in particular in the United Kingdom. In the United States, items of a commercial nature are generally subject to regulatory control by the U.S. Department of Commerce’s Bureau of Industry and Security and its Export Administration Regulations, and the International Traffic in Arms Regulations and other international trade regulations may apply as well. Additionally, we are not permitted to export some of the products we sell. In the future, regulatory authorities may require us to obtain export licenses or other export authorizations to export the products we sell abroad, depending upon the nature of items being exported, as well as the country to which the export is to be made. We cannot assure you that any of our applications for export licenses or other authorizations will be granted or approved. Furthermore, the export license and export authorization process is often time-consuming. Violation of export control regulations could subject us to fines and other penalties, such as losing the ability to export for a period of years, which would limit our sales and significantly hinder our attempts to expand our business internationally.
Our total assets include substantial intangible assets, and the write-off of a significant portion of our intangible assets would negatively affect our financial results.
Our total assets reflect substantial intangible assets. At September 30, 2015, goodwill and intangible assets, net represented 40% of our total assets. Goodwill represents the excess of the purchase price of acquired businesses over the fair value of the assets acquired and liabilities assumed resulting from acquisitions, including the acquisition of our Company by affiliates of The Carlyle Group (Carlyle) and the acquisition of Haas. Intangible assets represent trademarks, backlogs, non-compete agreements, technology and customer relationships. On at least an annual basis, we assess whether there has been impairment in the value of goodwill and indefinite-lived intangible assets. If our testing identifies impairment under generally accepted accounting principles in the United States (GAAP), the impairment charge we calculate would result in a charge to income from operations. For example, during the three months ended September 30, 2015, we recorded a non-cash goodwill impairment of $263.8 million. Any determination requiring the write-off of a significant portion of goodwill and unamortized identified intangible assets would negatively affect our results of operations and total capitalization, which could be material.
Our international operations require us to comply with numerous applicable anti-corruption and trade control laws and regulations, including those of the U.S. government and various other jurisdictions, and our failure to comply with these laws and regulations could adversely affect our reputation, business, financial condition and results of operations.
Doing business on a worldwide basis requires us and our subsidiaries to comply with the laws and regulations of the U.S. government and various other jurisdictions, and our failure to successfully comply with these rules and regulations may expose us to liabilities. These laws and regulations apply to companies, individual directors, officers, employees and agents, and may restrict our operations, trade practices, investment decisions and partnering activities.
In particular, our international operations are subject to U.S. and foreign anti-corruption laws and regulations, such as the FCPA, the Bribery Act and other applicable anti-corruption regimes. These laws generally prohibit us from corruptly providing anything of value, directly or indirectly, to government officials for the purposes of improperly influencing official decisions, improperly obtaining or retaining business, or otherwise obtaining favorable treatment. As part of our business, we may deal with governments and state-owned business enterprises, the employees and representatives of which may be considered government officials for purposes of the FCPA, the Bribery Act or other applicable anti-corruption laws. Some anti-corruption laws, such as the Bribery Act, also prohibit commercial bribery and the acceptance of bribes, and the FCPA further requires publicly traded companies to maintain adequate record-keeping and internal accounting practices to accurately reflect the transactions of the company. In addition, some of the international locations in which we operate lack a developed legal system and have elevated levels of corruption, and our industry is highly regulated, which increases our risk of violating anti-corruption laws.
As an exporter, we must comply with various laws and regulations relating to the export of products, services and technology from the United States and other countries having jurisdiction over our operations. In the U.S., these laws include, among others, the EAR administered by the U.S. Department of Commerce, Bureau of Industry and Security, the ITAR administered by the U.S. Department of State, Directorate of Defense Trade Controls (DDTC), and trade sanctions, regulations and embargoes administered by the U.S. Department of the Treasury, Office of Foreign Assets Control. These laws and regulations may require us to obtain individual validated licenses from the relevant agency to export, re-export, or transfer commodities, software, technology, or services to certain jurisdictions.
Violations of these legal requirements are punishable by criminal fines and imprisonment, civil penalties, disgorgement of profits, injunctions, debarment from government contracts, seizure and forfeiture of unlawful attempted exports, and/or denial of export privileges, as well as other remedial measures. We have established policies and procedures designed to assist us, our personnel and our agents to comply with applicable U.S. and international laws and regulations. However, there can be no
assurance that our policies and procedures will effectively prevent us, our employees and our agents from violating these regulations in every transaction in which we may engage, and violations, allegations or investigations of such violations could materially adversely affect our reputation, business, financial condition and results of operations.
If any of our customers were to become insolvent or experience substantial financial difficulties, our business, financial condition and results of operations may be adversely affected.
If any of the customers with whom we do business becomes insolvent or experiences substantial financial difficulties we may be unable to timely collect amounts owed to us by such customers and may not be able to sell the inventory we have purchased for such customers, which could have a material adverse effect on our business, financial condition and results of operations.
Our suppliers or our customers may experience damage to or disruptions at our or their facilities caused by natural disasters and other factors, which may result in our business, financial condition and results of operations being adversely affected.
Several of our facilities or those of our suppliers and customers could be subject to a catastrophic loss caused by earthquakes, tornadoes, floods, hurricanes, fire, power loss, telecommunication and information systems failure or other similar events. Should insurance be insufficient to recover all such losses or should we be unable to reestablish our operations, or if our customers or suppliers were to experience material disruptions in their operations as a result of such events, our business, financial condition and results of operations could be adversely affected.
We are dependent on access to and the performance of third-party package delivery companies.
Our ability to provide efficient distribution of the products we sell to our customers is an integral component of our overall business strategy. We do not maintain our own delivery networks, and instead rely on third-party package delivery companies. We cannot assure you that we will always be able to ensure access to preferred delivery companies or that these companies will continue to meet our needs or provide reasonable pricing terms. In addition, if the package delivery companies on which we rely experience delays resulting from inclement weather or other disruptions, we may be unable to maintain products in inventory and deliver products to our customers on a timely basis, which may adversely affect our business, financial condition and results of operations.
A significant labor dispute involving us or one or more of our customers or suppliers, or a labor dispute that otherwise affects our operations, could reduce our net sales and harm our profitability.
Labor disputes involving us or one or more of our customers or suppliers could affect our operations. If our customers or suppliers are unable to negotiate new labor agreements and our customers’ or suppliers’ plants experience slowdowns or closures as a result, our net sales and profitability could be negatively impacted.
While our employees are not currently unionized, they may attempt to form unions in the future, and the employees of our customers, suppliers and other service providers may be, or may in the future be, unionized. We cannot assure you that there will not be any strike, lock out or material labor dispute with respect to our business or those of our customers or suppliers in the future that materially affects our business, financial condition and results of operations.
We may be materially adversely affected by high fuel prices.
Fluctuations in the global supply of crude oil and the possibility of changes in government policies on the production, transportation and marketing of jet fuel make it impossible to predict the future availability and price of jet fuel. In the event there is an outbreak or escalation of hostilities or other conflicts or significant disruptions in oil production or delivery in oil-producing areas or elsewhere, there could be reductions in the production or importation of crude oil and significant increases in the cost of jet fuel. If there were major reductions in the availability of jet fuel or significant increases in its cost, commercial airlines would face increased operating costs. Due to the competitive nature of the airline industry, airlines are often unable to pass on increases in fuel prices to customers by increasing fares. As a result, an increase in jet fuel could result in a decrease in net income from either lower margins or, if airlines increase ticket fares, lower net sales from reduced airline travel. Decreases in airline profitability could decrease the demand for new commercial aircraft, resulting in delays of or reductions in deliveries of commercial aircraft that utilize the products we sell, and, as a result, our business, financial condition and results of operations could be materially adversely affected.
We have identified material weaknesses in our internal control over financial reporting, which could result in a material misstatement to our annual or interim consolidated financial statements that would not be prevented or detected.
In connection with the audit of our consolidated financial statements as of and for the year ended September 30, 2015, we have concluded that there are three material weaknesses relating to our internal control over financial reporting. The existing material weakness that we initially identified as of September 30, 2014 relates to a lack of a sufficient complement of accounting and financial reporting personnel with an appropriate level of accounting knowledge and experience commensurate with our financial reporting requirements as of September 30, 2015. We have concluded this material weakness was a direct result of the heightened level of activity associated with the integration of the Haas acquisition, combined with increased attrition attributable to the integration as well as openings at senior financial and organizational positions for part of the fiscal year. This material weakness contributed to the following two material weaknesses: (i) we did not maintain effective controls over the preparation and review of account reconciliation; specifically, our controls over the reconciliation of our balance sheet accounts did not operate effectively, and (ii) we did not maintain effective controls over the integration of policies, practices and controls over the Haas business unit.
A material weakness is a deficiency, or a combination of deficiencies, in internal control over financial reporting, such that there is a reasonable possibility that a material misstatement of our annual or interim financial statements will not be prevented or detected on a timely basis. As a result of these material weaknesses, management has concluded that our internal control over financial reporting and disclosure controls and procedures were not effective as of September 30, 2015.
As described in “Part II—Item 9A —Controls and Procedures” we have begun, and are currently in the process of, remediating the material weaknesses. However, the measures we have taken and expect to take to improve our internal controls may not be sufficient to address these issues, and we may need to take additional measures to ensure that our internal controls are effective or to ensure that the identified material weaknesses will not result in a material misstatement of our annual or interim consolidated financial statements.
If we fail to establish and maintain adequate internal control over financial reporting, including any failure to implement remediation measures and enhancements for internal controls, or if we experience difficulties in their implementation, our business, financial condition and operating results could be harmed. Further, any material weakness or unsuccessful remediation could affect investor confidence in the accuracy and completeness of our financial statements. As a result, our ability to obtain additional financing on favorable terms or at all could be materially and adversely affected, which in turn could materially and adversely affect our business, our strategic alternatives, our financial condition and the market value of our securities. In addition, perceptions of us among customers, lenders, investors, securities analysts and others could also be adversely affected.
We can give no assurances that the measures we have taken to date, or any future measures we may take, will remediate the material weaknesses identified or that any additional material weaknesses will not arise in the future. In addition, even if we are successful in strengthening our controls and procedures, those controls and procedures may not be adequate to prevent or identify irregularities or ensure the fair and accurate presentation of our financial statements included in our periodic reports filed with the SEC.
Our financial results may fluctuate from period-to-period, making quarter-to-quarter comparisons of our business, financial condition and results of operations less reliable indicators of our future performance.
There are many factors, such as the cyclical nature of the aerospace industry, fluctuations in our ad hoc sales, delays in major aircraft programs, downward pressure on sales prices and changes in the volume of our customers’ orders that could cause our financial results to fluctuate from period-to-period. For example, during the year ended September 30, 2015, 26% of our net sales were derived from ad hoc sales. The prices we charge for ad hoc sales are typically higher than the prices under our Contract sales. However, ad hoc customers may not continue to purchase the same amount of products from us as they have in the past, so we cannot assure you that in any given year we will be able to generate similar net sales from our ad hoc customers as we did in the past. We are also actively working to transition customers from ad hoc purchases to Contracts, which may also result in a reduction in ad hoc purchases. In addition, our acquisition of Haas has contributed to lower our ad hoc sales as a percentage of net sales. A significant diminution in our ad hoc sales in any given period could result in fluctuations in our financial results and operating margins. As a result of these factors, we believe that quarter-to-quarter comparisons of our financial results are not necessarily meaningful and that these comparisons cannot be relied upon as indicators of future performance.
We will continue to incur a significant increase in costs as a result of operating as a publicly traded company, and our management will be required to devote substantial time to new compliance requirements and investor needs.
As a publicly traded company, we will continue to incur significant legal, accounting and other expenses. In addition, the Sarbanes-Oxley Act of 2002 (the Sarbanes-Oxley Act) and the rules of the Securities and Exchange Commission (the SEC) and the New York Stock Exchange have imposed various requirements on public companies. Our management and other personnel will continue to devote a substantial amount of time to these compliance initiatives. Moreover, these rules and regulations will continue to result in increased legal and financial compliance costs and make some activities more time-consuming and costly. For example, we believe these rules and regulations make it more difficult and more expensive for us to maintain appropriate levels of director and officer liability insurance.
We are subject to health, safety and environmental laws and regulations, any violation of which could subject us to significant liabilities and penalties.
We are subject to extensive federal, state, local and foreign laws, regulations, rules and ordinances relating to pollution, protection of the environment and human health and safety, and the handling, transportation, storage, treatment, disposal and
remediation of hazardous substances, including potentially with respect to historical chemical blending and other activities that pre-dated the purchase of the Haas business by us. Actual or alleged violations of EHS laws, or permit requirements could result in restrictions or prohibitions on operations and substantial civil or criminal sanctions, as well as, under some EHS laws, the assessment of strict liability and/or joint and several liability.
Furthermore, we may be liable for the costs of investigating and cleaning up environmental contamination on or from our operations or at off-site locations, including potentially with respect to historical chemical blending and other activities that pre-dated the purchase of the Haas business by us. We may therefore incur additional costs and expenditures beyond those currently anticipated to address all such known and unknown situations under existing and future EHS laws.
Governmental, regulatory and societal demands for increasing levels of product safety and environmental protection could result in increased pressure for more stringent regulatory control with respect to the chemical industry. For example, the Hazard Communication Standard promulgated by the U.S. Occupational Safety and Health Administration is now aligned with the Globally Harmonized System of Classification and Labeling of Chemicals, which requires our suppliers to make revisions to labels and safety data sheets. Changes in the regulatory environment, particularly, but not limited to, in the United States, the European Union, Canada and China, could lead to heightened regulatory scrutiny and could adversely impact our ability to supply certain products to and provide supply chain management services to our customers. For instance, the August 2015 explosion at the port of Tianjin, China, may lead to stricter chemical safety standards in that country. The European Union’s Registration, Authorization and Restriction of Chemicals and analogous non-European Union laws and regulations, or other similar laws and regulations, also could result in compliance obligations, fines, ongoing monitoring and other future business activity restrictions, which could have a material adverse effect on our business, financial condition and results of operations.
In addition, these concerns could influence public perceptions regarding our operations and our ability to attract and retain customers and employees. Moreover, changes in EHS regulations could inhibit or interrupt our operations, or require us to modify our facilities or operations. Accordingly, environmental or regulatory matters may cause us to incur significant unanticipated losses, costs, capital expenditures or liabilities, which could reduce our profitability. Such losses, costs, capital expenditures or liabilities will be subject to evolving regulatory requirements and will depend on the timing of the promulgation and enforcement of specific standards which impose requirements on our operations. As a result, these losses, costs, capital expenditures or liabilities may be more than currently anticipated.
Our operations involve risks associated with the handling, transportation, storage and disposal of chemical products that may increase our operating costs and reduce our profitability.
Our business is subject to hazards inherent in the handling, transportation, storage and disposal of chemical products. These hazards include: chemical spills, storage tank leaks, discharges or releases of toxic or hazardous substances or gases and other hazards incident to the handling, transportation, storage and disposal of dangerous chemicals. We are also potentially subject to other hazards, including natural disasters and severe weather; explosions and fires; transportation problems, including interruptions, spills and leaks; mechanical failures; unscheduled downtimes; labor difficulties; and other risks. Many potential hazards can cause bodily injury and loss of life, severe damage to or destruction of property and equipment and environmental damage, and may result in suspension of our own or our customers’ operations and the imposition of civil or criminal penalties and liabilities. Furthermore, we are subject to present and future claims with respect to our employees when working within our own operations or when supplying chemicals to and/or providing chemical management services at our customer’s operations, other persons, including potentially our customers and their employees, workers’ compensation and other matters.
We maintain property, business interruption, products liability and casualty insurance policies which we believe are in accordance with customary industry practices, as well as insurance policies covering other types of risks, including pollution legal liability insurance, but we are not fully insured against all potential hazards and risks incident to our business. Each of these insurance policies is subject to customary exclusions, deductibles and coverage limits, in accordance with industry standards and practices. As a result of market conditions, premiums and deductibles for certain insurance policies can increase substantially and, in some instances, certain insurance may become unavailable or available only for reduced amounts of coverage. If we were to incur a significant liability for which we were not fully insured, it could have a material adverse effect on our business, results of operations, financial condition and liquidity.
If the temperature control systems on which we rely fail, certain of the chemical products we sell may become “non-conforming” while in storage or in transit, and as a result, we may be responsible for providing replacement products to our customers, which could have a material adverse effect on our business, financial condition and results of operations.
Many of the chemical products we sell are sensitive to temperature. Our storage facilities and the vehicles maintained by the third-party delivery companies on whom we rely utilize sophisticated temperature control systems to ensure safe storage and handling of these products. If these temperature control systems fail, products that are sensitive to temperature may become
non-conforming to the customer’s specifications, and we may be responsible for providing replacement products, which could have a material adverse effect on our business, financial condition and results of operations.
Our reputation and/or our business, financial condition and results of operations could be adversely affected if one of the products we sell causes an aircraft to crash.
We may be exposed to liabilities for personal injury, death or property damage as a result of the failure of a product we have sold. We typically agree to indemnify our customers against certain liabilities resulting from the products we sell, and any third party indemnification we seek from our suppliers and our liability insurance may not fully cover our indemnification obligations to customers. We also may not be able to maintain insurance coverage in the future at an acceptable cost. Any liability for which third-party indemnification is not available that is not covered by insurance could have a material adverse effect on our business, financial condition and results of operations.
In addition, a crash caused by one of the products we have sold could damage our reputation for selling quality products. We believe our customers consider safety and reliability as key criteria in selecting a provider of aircraft products and believe our reputation for quality assurance is a significant competitive strength. If a crash were to be caused by one of the products we sold, or if we were to otherwise fail to maintain a satisfactory record of safety and reliability, our ability to retain and attract customers may be materially adversely affected.
We sell products to a highly regulated industry and our business may be adversely affected if our suppliers or customers lose government approvals, if more stringent government regulations are enacted or if industry oversight is increased.
The aerospace industry is highly regulated in the United States and in other countries. The FAA prescribes standards and other requirements for aircraft components in the U.S. and comparable agencies, such as the European Aviation Safety Agency, the Civil Aviation Administration of China and the Japanese Civil Aviation Bureau, regulate these matters in other countries. Our suppliers and customers must generally be certified by the FAA, the DoD and similar agencies in foreign countries. If any of our suppliers’ government certifications are revoked, we would be less likely to buy such supplier’s products, and, as a result, would need to locate a suitable alternate supply of such products, which we may be unable to accomplish on commercially reasonable terms or at all. If any of our customers’ government certifications are revoked, their demand for the products we sell would decline. In each case, our business, financial condition and results of operations may be adversely affected.
In addition, if new and more stringent government regulations are adopted or if industry oversight increases, our suppliers and customers may incur significant expenses to comply with such new regulations or heightened industry oversight. In the case of our suppliers, these expenses may be passed on to us in the form of price increases, which we may be unable to pass along to our customers. In the case of our customers, these expenses may limit their ability to purchase products from us. In each case, our business, financial condition and results of operations may be adversely affected.
We may be unable to successfully consummate or integrate future acquisitions, which could negatively impact our business, financial condition and results of operations.
We may consider future acquisitions, some of which could be material to us. Depending upon the acquisition opportunities available, we may need to raise additional funds through the capital markets or arrange for additional debt financing in order to consummate such acquisitions. We may be unable to raise the capital required for future acquisitions on satisfactory terms or at all, which could adversely affect our business, financial condition and results of operations.
Our substantial indebtedness could adversely affect our financial health and could harm our ability to react to changes to our business.
As of September 30, 2015, our total long-term indebtedness outstanding under our Credit Facilities (as defined in Part II, Item 7, “Management’s Discussion and Analysis of Financial Condition and Results of Operations—Liquidity and Capital Resources—Credit Facilities—Senior Secured Credit Facilities”) was $952.9 million, which was 53.8% of our total capitalization.
In addition, we may incur substantial additional indebtedness in the future. Our Credit Facilities contain a number of significant qualifications and exceptions that allow us to incur additional indebtedness, and the indebtedness incurred in compliance with these qualifications and exceptions could be substantial. If we incur additional debt, the risks associated with our substantial leverage would increase.
Our substantial indebtedness could have important consequences to investors. For example, it could:
· increase our vulnerability to general economic downturns and industry conditions;
· require us to dedicate a substantial portion of our cash flow from operations to payments on our indebtedness, thereby reducing the availability of our cash flow to fund working capital, capital expenditures and other general corporate requirements;
· limit our flexibility in planning for, or reacting to, changes in our business and the industry in which we operate;
· place us at a competitive disadvantage compared to competitors that have less debt; and
· limit, along with the financial and other restrictive covenants contained in the documents governing our indebtedness, among other things, our ability to borrow additional funds, make investments and incur liens.
In addition, all of our debt under the Credit Facilities bears interest at floating rates, causing us to enter into interest rate swap derivative instruments to partially offset our exposure to interest rate fluctuations, which result in additional risks. As of September 30, 2015, we had a current interest rate hedge liability and a long-term interest rate hedge liability of $1.9 million and $2.2 million, respectively. If our interest rate hedge was determined ineffective partially or entirely as defined by GAAP, the ineffective portion or the entire amount of our interest rate hedge liabilities would adversely affect our earnings. Our derivatives also expose us to credit risk to the extent that the counterparties may be unable to meet the terms of the agreement, which could negate the intended protection from our hedge instruments. See further discussion on our derivative financial instruments in Note 12 of the Notes to Consolidated Financial Statements in Part II, Item 8 of this Annual Report on Form 10-K.
Our level of indebtedness increases the possibility that we may be unable to generate cash sufficient to pay, when due, the principal of, interest on or other amounts due in respect of our indebtedness. We cannot assure you that our business will generate sufficient cash flow from operations or that future borrowings will be available to us under the Credit Facilities or otherwise in amounts sufficient to enable us to service our indebtedness. If we cannot service our debt, we will have to take actions such as reducing or delaying capital investments, selling assets, restructuring or refinancing our debt or seeking additional equity capital and cannot assure you that we will be successful in implementing any such actions or that any actions we take will allow us to stay in compliance with the terms of our indebtedness.
The terms of the Credit Facilities and other debt instruments may restrict our current and future operations, particularly our ability to respond to changes or to take certain actions.
The Credit Facilities contain a number of restrictive covenants that impose significant operating and financial restrictions on us and may limit our ability to engage in acts that may be in our long-term best interests. The Credit Facilities include covenants restricting, among other things, our ability to:
· incur or guarantee additional indebtedness or issue preferred stock;
· pay distributions on, redeem or repurchase our capital stock or redeem or repurchase our subordinated debt;
· make investments;
· sell assets;
· enter into agreements that restrict distributions or other payments from our restricted subsidiaries to us;
· incur or allow existing liens;
· consolidate, merge or transfer all or substantially all of our assets;
· engage in transactions with affiliates;
· enter into sale leaseback transactions;
· change fiscal periods;
· enter into agreements that restrict the granting of liens or the making of subsidiary distributions;
· create unrestricted subsidiaries; and
· engage in certain business activities.
In addition, the Credit Facilities contain financial maintenance covenants, including a maximum leverage ratio covenant and a minimum interest coverage ratio covenant. A breach of any of these covenants could result in a default under the Credit Facilities. If any such default occurs, the lenders under the Credit Facilities may elect to declare all outstanding borrowings, together with accrued interest and other amounts payable thereunder, to be immediately due and payable. The lenders under the Credit Facilities also have the right in these circumstances to terminate any commitments they have to provide further borrowings. In addition, following an event of default under the Credit Facilities, the lenders under those facilities will have the right to proceed against the collateral granted to them to secure the debt, which includes our available cash. If the debt under the Credit Facilities was to be accelerated, we cannot assure you that our assets would be sufficient to repay in full our debt. See Part II, Item 7. “Management’s Discussion and Analysis of Financial Condition and Results of Operations—Liquidity and Capital Resources—Credit Facilities—Senior Secured Credit Facilities” for additional information about the Company’s compliance with the financial maintenance covenants contained in the Credit Facilities, in particular the Consolidated Total Leverage Ratio (as such ratio is defined in the Credit Facilities).
Risks Related to our Common Stock
The price of our common stock may fluctuate significantly, and you could lose all or part of your investment.
Volatility in the market price of our common stock may prevent you from being able to sell your common stock at or above the price you paid for your common stock. The market price of our common stock could fluctuate significantly for various reasons, including:
· our operating and financial performance and prospects;
· our quarterly or annual earnings or those of other companies in our industry;
· the public’s reaction to our press releases, our other public announcements and our filings with the SEC;
· changes in, or failure to meet, earnings estimates or recommendations by research analysts who track our common stock or the stock of other companies in our industry;
· the failure of analysts to cover our common stock;
· credit ratings downgrades or other negative actions by ratings agencies for us or our subsidiaries;
· strategic actions by us or our competitors, such as acquisitions or restructurings;
· new laws or regulations or new interpretations of existing laws or regulations applicable to our business;
· changes in accounting standards, policies, guidance, interpretations or principles;
· the impact on our profitability temporarily caused by the time lag between when we experience cost increases until these increases flow through cost of sales because of our method of accounting for inventory, or the impact from our inability to pass on such price increases to our customers;
· material litigation or government investigations;
· changes in general conditions in the United States and global economies or financial markets, including those resulting from war, incidents of terrorism or responses to such events;
· changes in key personnel;
· sales of common stock by us or members of our management team;
· the granting or exercise of employee stock options or other equity awards;
· the volume of trading in our common stock; and
· the realization of any risks described under “Risk Factors.”
In addition, in recent years, the U.S. stock market has experienced significant price and volume fluctuations. This volatility has had a significant impact on the market price of securities issued by many companies, including companies in our industry. The changes have often been unrelated or disproportionate to the operating performance of the affected companies. Hence, the price of our common stock could fluctuate based upon factors that have little or nothing to do with our Company, and these fluctuations could materially reduce our share price and cause you to lose all or part of your investment. Further, in the past, market fluctuations and price declines in a company’s stock have led to securities class action litigations. If such a suit were to arise, it could have a substantial cost and divert our resources regardless of the outcome.
If securities analysts do not publish research or reports about our business or if they downgrade our stock, the price of our stock could decline.
The research and reports that industry or financial analysts publish about us or our business may vary widely and may not predict accurate results, but will likely have an effect on the trading price of our common stock. If an industry analyst decides not to cover our Company, or if an industry analyst decides to cease covering our Company at some point in the future, we could lose visibility in the market, which in turn could cause our stock price to decline. If an industry analyst downgrades our stock, our stock price would likely decline rapidly in response.
We have no plans to pay regular dividends on our common stock, so you may not receive funds without selling your common stock.
We have no plans to pay regular dividends on our common stock. We generally intend to invest our future earnings, if any, to fund our growth. Any payment of future dividends will be at the discretion of our Board of Directors and will depend on, among other things, our earnings, financial condition, capital requirements, level of indebtedness, statutory and contractual restrictions applying to the payment of dividends and other considerations that our Board of Directors deems relevant. The Credit Facilities also effectively limit our ability to pay dividends. Accordingly, you may have to sell some or all of your common stock in order to generate cash flow from your investment. You may not receive a gain on your investment when you sell your common stock and you may lose the entire amount of the investment.
Provisions of our amended and restated certificate of incorporation and amended and restated bylaws and Delaware law might discourage, delay or prevent a change of control of our company or changes in our management and, as a result, depress the trading price of our common stock.
Our amended and restated certificate of incorporation and amended and restated bylaws contain provisions that could discourage, delay or prevent a change in control of our Company or changes in our management that the stockholders of our Company may deem advantageous. These provisions:
· establish a classified Board of Directors, with three classes of directors;
· authorize the issuance of blank check preferred stock that our Board of Directors could issue to increase the number of outstanding shares and to discourage a takeover attempt;
· limit the ability of stockholders to remove directors;
· prohibit our stockholders from calling a special meeting of stockholders;
· prohibit stockholder action by written consent, which requires all stockholder actions to be taken at a meeting of our stockholders;
· provide that our Board of Directors is expressly authorized to adopt, or to alter or repeal our bylaws; and
· establish advance notice requirements for nominations for election to our Board of Directors or for proposing matters that can be acted upon by stockholders at stockholder meetings.
These anti-takeover defenses could discourage, delay or prevent a transaction involving a change in control of our Company. These provisions could also discourage proxy contests and make it more difficult for you and other stockholders to elect directors of your choosing and cause us to take corporate actions other than those you desire.
Future sales of our common stock in the public market could lower our share price, and any additional capital raised by us through the sale of equity or convertible debt securities may dilute your ownership in us and may adversely affect the market price of our common stock.
We and our existing stockholders may sell additional shares of common stock in subsequent public offerings. We may also issue additional shares of common stock or convertible debt securities to finance future acquisitions. As of September 30, 2015, we had 950,000,000 shares of common stock authorized and 97,538,124 shares of common stock outstanding. In addition, we have 3,242,018 shares of common stock issuable upon the exercise of options outstanding as of September 30, 2015 and 5,514,078 available shares of common stock reserved for issuance under the Wesco Aircraft Holdings, Inc. 2014 Incentive Award Plan (the 2014 Plan).
We cannot predict the size of future issuances of our common stock or the effect, if any, that future issuances and sales of our common stock will have on the market price of our common stock. Sales of substantial amounts of our common stock (including sales pursuant to Carlyle’s registration rights and shares issued in connection with an acquisition), or the perception that such sales could occur, may adversely affect prevailing market prices for our common stock.
ITEM 1B. UNRESOLVED STAFF COMMENTS
None.
Our global headquarters is located at 24911 Avenue Stanford, Valencia, California 91355. As of September 30, 2015, we have a total of 88 administrative, sales and/or stocking facilities, all of which are either leased or located at a customer site, except for our global headquarters, which is owned by us. These facilities, including one in Wichita, Kansas, one in Toronto, Ontario and one in Clayton West, United Kingdom, are located in 20 countries, including the U.S., Canada, China, France, Germany, India, Israel, Italy, Singapore and the United Kingdom.
Our warehouse operations are divided between CSLs and Forward Stocking Locations (FSLs). Our CSLs serve as the primary supply warehouses for most of our net sales and also house our procurement, customer service, document control, IT, material support and quality assurance functions. Our CSLs are supported by sales offices throughout the U.S., Canada, China, France, Germany, India, Israel, Italy, Singapore and the United Kingdom.
Complementing our CSLs and sales offices are FSLs. An FSL is a specialized stocking point for one or more Contracts located within a geographic region. FSLs are typically located either near or within a customer facility and are established to support large Contracts. In certain instances, FSLs initially established to service a single customer are expanded to service other regional customers.
We believe that our existing facilities, including both owned and leased, are in good condition and suitable for the conduct of our business. For additional information regarding obligations under operating leases, see Note 17 of the Notes to Consolidated Financial Statements in Part II, Item 8 of this Annual Report on Form 10-K.
We are involved in various legal matters that arise in the ordinary course of our business. We believe that the ultimate outcome of such matters will not have a material adverse effect on our business, financial condition or results of operations. However, there can be no assurance that such actions will not be material or adversely affect our business, financial condition or results of operations. For more information see Note 17 of the Notes to Consolidated Financial Statements in Part II, Item 8 of this Annual Report on Form 10-K.
ITEM 4. MINE SAFETY DISCLOSURES
Not applicable.
ITEM 5. MARKET FOR REGISTRANT’S COMMON EQUITY, RELATED STOCKHOLDER MATTERS AND ISSUER PURCHASES OF EQUITY SECURITIES
Market Information About Our Common Stock
Our common stock began trading on the New York Stock Exchange under the symbol “WAIR” on July 28, 2011. Before then, there was no public market for our common stock. The following table sets forth, for the periods indicated, the high and low sales prices of our common stock as reported by the New York Stock Exchange:
|
|
|
High |
|
Low |
| ||
|
Fiscal 2015 |
|
|
|
|
| ||
|
4th Quarter |
|
$ |
15.54 |
|
$ |
12.20 |
|
|
3rd Quarter |
|
$ |
16.39 |
|
$ |
14.64 |
|
|
2nd Quarter |
|
$ |
15.73 |
|
$ |
12.98 |
|
|
1st Quarter |
|
$ |
18.12 |
|
$ |
13.48 |
|
|
Fiscal 2014 |
|
|
|
|
| ||
|
4th Quarter |
|
$ |
20.09 |
|
$ |
17.25 |
|
|
3rd Quarter |
|
$ |
22.74 |
|
$ |
19.83 |
|
|
2nd Quarter |
|
$ |
22.53 |
|
$ |
20.86 |
|
|
1st Quarter |
|
$ |
22.27 |
|
$ |
18.27 |
|
Stockholders
On September 30, 2015, the closing price reported on the New York Stock Exchange of our common stock was $12.20 per share. As of November 23, 2015, we had approximately103 holders of record of our common stock.
Dividends
We have not paid dividends in the past and we do not intend to pay any cash dividends for the foreseeable future. We intend to retain earnings, if any, for the future operation and expansion of our business and the repayment of debt. Any determination to pay dividends in the future will be at the discretion of our Board of Directors and will depend upon our results of operations, cash requirements, financial condition, contractual restrictions, restrictions imposed by applicable laws and other factors that our Board of Directors may deem relevant. Our existing indebtedness effectively limits our ability to pay dividends and make distributions to our stockholders.
Recent Sales of Unregistered Securities
None.
Performance
The graph set forth below compares the cumulative total shareholder return on our common stock between July 28, 2011 (our first trading day on the New York Stock Exchange) and September 30, 2015 to (1) the cumulative total return of U.S. companies listed on the New York Stock Exchange and (2) the cumulative total return of a peer group selected by the Company (BE Aerospace, Inc. (BEAV), Esterline Technologies Corporatoin (ESL), Fastenal Company (FAST), HEICO Corporation (HEI), KLX Inc. (KLXI), MSC Industrial Direct Co., Inc. (MSM), Transdigm Group Incorporated (TDG) and W.W. Grainger, Inc. (GWW)) over the same period. The peer group reflects a mix of companies that we believe is reflective of our broader industry and line-of-business. This graph assumes an initial investment of $100 on July 28, 2011, in our common stock, the market index and the peer group and assumes the reinvestment of dividends, if any. The graph also assumes that the price of our common stock on July 28, 2011 was equal to the closing price of $14.92. The historical information set forth below is not necessarily indicative of future price performance.
|
Company/Market/Peer |
|
07/28/2011 |
|
09/30/2011 |
|
03/31/2012 |
|
09/30/2012 |
|
03/31/2013 |
|
09/30/2013 |
|
03/31/2014 |
|
09/30/2014 |
|
03/31/2015 |
|
09/30/2015 |
| ||||||||||
|
Wesco Aircraft Holdings, Inc. |
|
$ |
100.00 |
|
$ |
73.26 |
|
$ |
108.58 |
|
$ |
91.55 |
|
$ |
98.66 |
|
$ |
140.28 |
|
$ |
147.52 |
|
$ |
116.62 |
|
$ |
102.68 |
|
$ |
81.77 |
|
|
New York Stock Exchange (U.S. Companies) |
|
100.00 |
|
86.06 |
|
107.72 |
|
111.13 |
|
126.24 |
|
135.05 |
|
151.30 |
|
156.98 |
|
165.68 |
|
151.00 |
| ||||||||||
|
Peer Group |
|
100.00 |
|
93.51 |
|
137.41 |
|
126.16 |
|
151.57 |
|
166.72 |
|
180.20 |
|
177.57 |
|
184.80 |
|
160.87 |
| ||||||||||
ITEM 6. SELECTED FINANCIAL DATA
The selected income statement and other data for each of the years ended September 30, 2015, 2014 and 2013 and the selected balance sheet data as of September 30, 2015 and 2014 have been derived from our audited consolidated financial statements that are included in this Annual Report. The selected income statement and other data for the years ended September 30, 2012, and 2011 and the selected balance sheet data as of September 30, 2013, 2012 and 2011 have been derived from audited consolidated financial statements that are not included in this Annual Report on Form 10-K.
The financial data set forth below are not necessarily indicative of future results of operations. This data should be read in conjunction with, and is qualified in its entirety by reference to, Part II, Item 7. “Management’s Discussion and Analysis of Financial Condition and Results of Operations” and our financial statements and notes thereto included elsewhere in this Annual Report.
|
|
|
Years Ended September 30, |
| |||||||||||||
|
|
|
2015 |
|
2014 |
|
2013 |
|
2012 |
|
2011 |
| |||||
|
|
|
(in thousands except per share data) |
| |||||||||||||
|
Consolidated statements of income data: |
|
|
|
|
|
|
|
|
|
|
| |||||
|
Net sales |
|
$ |
1,497,615 |
|
$ |
1,355,877 |
|
$ |
901,608 |
|
$ |
776,206 |
|
$ |
710,886 |
|
|
|
|
|
|
|
|
|
|
|
|
|
| |||||
|
(Loss) income from operations |
|
$ |
(206,365 |
) |
$ |
183,934 |
|
$ |
180,802 |
|
$ |
158,832 |
|
$ |
161,610 |
|
|
Interest expense, net |
|
(37,092 |
) |
(29,225 |
) |
(25,178 |
) |
(24,646 |
) |
(34,491 |
) | |||||
|
Other income (expense), net |
|
1,841 |
|
2,199 |
|
2,003 |
|
(524 |
) |
1,005 |
| |||||
|
(Loss) income before income taxes |
|
(241,616 |
) |
156,908 |
|
157,627 |
|
133,662 |
|
128,124 |
| |||||
|
Income tax benefit (provision) |
|
86,872 |
|
(54,806 |
) |
(52,815 |
) |
(41,487 |
) |
(52,526 |
) | |||||
|
Net (loss) income |
|
$ |
(154,744 |
) |
$ |
102,102 |
|
$ |
104,812 |
|
$ |
92,175 |
|
$ |
75,598 |
|
|
|
|
|
|
|
|
|
|
|
|
|
| |||||
|
Per share data: |
|
|
|
|
|
|
|
|
|
|
| |||||
|
Net (loss) income per share |
|
|
|
|
|
|
|
|
|
|
| |||||
|
Basic |
|
$ |
(1.60 |
) |
$ |
1.06 |
|
$ |
1.12 |
|
$ |
1.00 |
|
$ |
0.83 |
|
|
Diluted |
|
$ |
(1.60 |
) |
$ |
1.05 |
|
$ |
1.09 |
|
$ |
0.96 |
|
$ |
0.81 |
|
|
Weighted average shares outstanding |
|
|
|
|
|
|
|
|
|
|
| |||||
|
Basic |
|
96,955 |
|
95,951 |
|
93,285 |
|
92,058 |
|
90,697 |
| |||||
|
Diluted |
|
96,955 |
|
97,606 |
|
95,844 |
|
95,712 |
|
93,182 |
| |||||
|
|
|
|
|
|
|
|
|
|
|
|
| |||||
|
Consolidated Balance Sheet Data: |
|
|
|
|
|
|
|
|
|
|
| |||||
|
Cash and cash equivalents |
|
$ |
82,866 |
|
$ |
104,775 |
|
$ |
78,716 |
|
$ |
60,856 |
|
$ |
45,525 |
|
|
Total assets (1), (2) |
|
2,020,973 |
|
2,412,274 |
|
1,631,153 |
|
1,537,416 |
|
1,301,385 |
| |||||
|
Long-term debt and capital lease obligations (3) |
|
954,730 |
|
1,081,825 |
|
569,414 |
|
626,205 |
|
556,712 |
| |||||
|
Total stockholders’ equity (4) |
|
817,573 |
|
992,290 |
|
865,436 |
|
744,915 |
|
628,471 |
| |||||
(1) We acquired Haas in February 2014.
(2) We acquired Interfast in July 2012.
(3) Total long-term debt and capital lease obligations excludes current portion.
(4) We revised the total stockholders’ equity as of September 30, 2012 (see revision disclosure in Note 2 of the Notes to Consolidated Financial Statements in Part II, Item 8 of this Annual Report on Form 10-K).
ITEM 7. MANAGEMENT’S DISCUSSION AND ANALYSIS OF FINANCIAL CONDITION AND RESULTS OF OPERATIONS
The following discussion and analysis is intended to help the reader understand our business, financial condition, results of operations, liquidity and capital resources. You should read this discussion in conjunction with our consolidated financial statements and the related notes contained elsewhere in this Annual Report on Form 10-K.
The statements in this discussion regarding industry trends, our expectations regarding our future performance, liquidity and capital resources and other non-historical statements are forward-looking statements. These forward-looking statements are subject to numerous risks and uncertainties, including, but not limited to, the risks and uncertainties described in Part I, Item 1A. “Risk Factors” and “Cautionary Note Regarding Forward- Looking Statements.” Our actual results may differ materially from those contained in or implied by any forward-looking statements.
Industry Trends Affecting Our Business
We rely on demand for new commercial and military aircraft for a significant portion of our sales. Commercial aircraft demand is driven by many factors, including the global economy, passenger volumes, airline profitability, introduction of new aircraft models, and the lifecycle of current fleets. Demand for business jets is closely correlated to regional economic conditions and corporate profits, but also influenced by new models and changes in ownership dynamics. Military aircraft demand is primarily driven by government spending, the timing of orders and evolving DoD strategies and policies.
Aftermarket demand benefits from many of the same trends as those in OEM channels, but is also impacted by requirements to maintain aging aircraft and the cost of fuel, which can lead to greater utilization of existing planes. Demand in the military aftermarket is further driven by changes in overall fleet size and the level of U.S. military activity overseas.
Supply chain service providers and distributors have been aided by these trends along with an increase in outsourcing activities, as OEMs and their suppliers focus on reducing costs.
Commercial Aerospace Market
Over the past three years, major airlines have ordered new aircraft at a robust pace, aided by strong profits and increasing passenger volumes. At the same time, volatile fuel prices have led to greater demand for fuel-efficient models and new engine options for existing aircraft designs. As a result, large commercial OEMs have reported increased deliveries and unprecedented backlog levels. The rise of emerging markets has added to this growth at a stronger pace than seen historically. Business aviation has lagged the larger commercial market, reflecting a deeper downturn in the recession. Production levels remain well below their pre-recession peak, though this has been offset somewhat by stronger demand for large, more expensive aircraft.
Military Aerospace Market
Military build-rates have declined recently (and may continue to decline going forward), negatively impacting this portion of our business. We believe the diversity of the military aircraft programs we support can help mitigate the impact of program delays, changes or cancellations. Increased sales to other active programs that directly benefit from such changes also help moderate build-rate declines. In addition, we believe the services we provide the Joint Strike Fighter program will benefit our future business as production increases.
Goodwill Impairment
We performed our Step 1 goodwill impairment tests on July 1, 2015. The results of these tests indicated that the estimated fair values of our reporting units exceeded their carrying values, with the exception of the North America Hardware reporting unit within our North America segment. The impact of market pressures such as decreasing revenue and underperformance relative to forecast adversely impacted the fair value of this reporting unit. Additionally, lower projected revenue growth and operating results reflected changes in assumptions related to organic growth rates, market trends, business mix, cost structure and other expectations about the anticipated short-term and long-term operating results of this reporting unit. As a result, we proceeded to Step 2 of the goodwill impairment analysis, and compared the implied value of North America Hardware’s goodwill with the
carrying value of its goodwill, and since the carrying value exceeded the implied fair value, we recorded a non-cash impairment charge of $263.8 million in the three months ended September 30, 2015.
Other Factors Affecting Our Financial Results
Fluctuations in Revenue
There are many factors, such as fluctuations in ad hoc sales, timing of aircraft deliveries, changes in selling prices, the amount of new customers’ consigned inventory and the volume or timing of customer orders that can cause fluctuations in our financial results from quarter-to-quarter. To normalize for short-term fluctuations, we tend to look at our performance over several quarters or years of activity rather than discrete short-term periods. As such, it can be difficult to determine longer-term trends in our business based on quarterly comparisons.
We will continue our strategy of seeking to expand our relationships with existing customers by transitioning them to Contracts, as well as expanding relationships with our existing Contract customers to include additional customer sites, additional SKUs and additional levels of service. We believe this strategy serves to mitigate fluctuations in our net sales. However, our sales to Contract customers may fail to meet our expectations for a variety of reasons, in particular if industry build rates are lower than expected or, for certain newer JIT customers, if their consigned inventory, which must be exhausted before corresponding products are purchased directly from us, is larger than we expected.
During the year ended September 30, 2014, we modified and extended a contract with an existing customer that resulted in a $66.3 million reduction in net sales to the customer during the year ended September 30, 2015.
If any of our customers are acquired or controlled by a company that elects not to utilize our services, or attempt to implement in-sourcing initiatives, it could have a negative effect on our strategy to mitigate fluctuations in our net sales. Additionally, although we derive a significant portion of our net sales from the building of new commercial and military aircraft, we have not typically experienced extreme fluctuations in our net sales when sales for an individual aircraft program decrease, which we believe is attributable to our diverse base of customers and programs. In addition, we believe our substantial sales under Contracts helps to mitigate fluctuations in our financial results, as Contract customers tend to have steadier purchasing patterns than ad hoc customers. However, as mentioned above, our sales to Contract customers may fail to meet our expectations for a variety of reasons, in particular if industry build rates are lower than expected or, for certain newer JIT customers, if their consigned inventory, which must be exhausted before corresponding products are purchased directly from us, is larger than we expected or if estimated usage rates are actually lower. In addition, we believe that during industry growth cycles, our customer’s demand may begin to exceed supplier lead times, which could result in an increase in our ad hoc sales.
Fluctuations in Margins
We added chemicals to our product offerings in connection with our Haas acquisition on February 28, 2014. Gross profit margins on chemicals are lower than the gross profit margins on many of the products we sold prior to the Haas acquisition, which resulted in a reduction in our overall gross profit margins. In addition, we believe our gross profit margins may also be negatively impacted to the extent other lower-margin product lines, such as electronic components, exceed the growth rates of higher margin product lines. In addition, there continues to be pricing pressure throughout the supply chain.
We also believe that our strategy of growing our Contract sales and converting ad hoc customers into Contract customers could negatively affect our gross profit margins, as gross profit margins tend to be higher on ad hoc sales than they are on Contract-related sales. However, we believe any potential adverse impact on our gross profit margins is outweighed by the benefits of a more stable long-term revenue stream attributable to Contract customers.
During the years ended September 30, 2014 and 2013, we saw increased competition in the ad hoc market, which has slightly reduced our typically higher ad hoc margins, which remained relatively consistent through fiscal 2015. We expect the current margins to remain relatively consistent throughout fiscal 2016. However, we believe that as industry build rates and manufacturer lead times increase, margins on ad hoc sales will begin to increase.
Our Contracts generally provide for fixed prices, which can expose us to risks if prices we pay to our suppliers rise due to increased raw material or other costs. However, we believe our expansive product offerings and inventories, our ad hoc sales and, where possible, our longer-term agreements with suppliers have enabled us to mitigate this risk.
Fluctuations in Cash Flow
We believe our cash flows may be affected by fluctuations in our inventory that can occur over time. When we are awarded new programs, we have generally increased our inventory to account for expected sales related to the new program, which often take time to materialize. As a result, if certain programs for which we have procured inventory are delayed or if certain newer JIT customers’ consigned inventory is larger than we expected, we may experience a more sustained inventory increase. For example, we increased our inventory in anticipation of deliveries of the Boeing 787, which experienced significant delays.
Inventory fluctuations may also be attributable to general industry trends. Factors that may contribute to fluctuations in inventory levels in the future could include (1) strategic purchases (a) to take advantage of favorable pricing, (b) made in anticipation of the expected industry growth cycle, (c) to support new customer Contracts or (d) to acquire high-volume products that are typically difficult to obtain in sufficient quantities, (2) changes in supplier lead times and the timing of inventory deliveries, (3) purchases made in anticipation of future growth (particularly growth in our MRO business) and (4) purchases made in connection with the expansion of existing Contracts. While effective inventory management is an ongoing challenge, we continue to take steps to enhance the sophistication of our procurement practices to mitigate the negative impact of inventory buildups on our cash flow.
Our accounts receivable balance as a percentage of net sales may fluctuate from quarter-to-quarter. These fluctuations are primarily driven by changes, from quarter-to-quarter, in the timing of sales and the current average days’ sales outstanding. The completion of customer Contracts with accelerated payment terms can also contribute to these quarter-to-quarter fluctuations. Similarly, our accounts payable may fluctuate from quarter-to-quarter, which is primarily driven by the timing of purchases or payments made to our suppliers.
Segment Presentation
We conduct our business through two reportable segments: North America and Rest of World. We evaluate segment performance based on segment income or loss from operations. Each segment reports its results of operations and makes requests for capital expenditures and acquisition funding to our chief operating decision maker (CODM). Our chief executive officer serves as our CODM.
Change in Estimate — Inventory Excess and Obsolescence (E&O) Reserve
In the three months ended September 30, 2015, management implemented a new strategy of providing integrated supply chain services more tailored to customer demand through long-term contracts and focused forecasted consumption, including changes to our inventory purchasing strategy, holding inventory for shorter periods and the planned scrapping of long dated inventory. The new strategy and updates for fiscal 2015 sales activities led to changes in the sell through rates, holding period of aged inventory and others estimates used in the E&O reserve for our hardware inventory, which increased our E&O inventory reserves by $43.8 million.
Revision of Statements of Comprehensive Income
In the three months ended September 30, 2015, we determined that certain personnel costs incurred pursuant to certain service contracts were charged to selling, general and administrative expenses rather than to cost of sales. We have revised our statements of comprehensive income to properly state such selling, general and administrative expenses as cost of sales. We misclassified expenses of $15.4 million, and $4.7 million for the years ended September 30, 2014 and 2013, respectively. The expenses misclassified for North America were $14.0 million, and $3.6 million for the years ended September 30, 2014 and 2013, respectively. The expenses misclassified for Rest of World were $1.4 million and $1.0 million for the years ended September 30, 2014 and 2013, respectively. These misclassifications had no effect on previously reported income from operations, net income or cash flows for the years ended September 30, 2014 and 2013 and the interim periods within those years. We have evaluated these misclassifications and do not believe they are material to any prior periods.
Key Components of Our Results of Operations
The following is a discussion of the key line items included in our financial statements for the periods presented below under the heading “Results of Operations.” These are the measures that management utilizes to assess our results of operations, anticipate future trends and evaluate risks in our business.
Net Sales
Our net sales include sales of hardware, chemicals, electronic components, bearings, tools and machined parts, and eliminate all intercompany sales. We also provide certain services to our customers, including quality assurance, kitting, JIT delivery and point-of-use inventory management. However, these services are provided by us contemporaneously with the delivery of the product, and as such, once the product is delivered, we do not have a post-delivery obligation to provide services to the customer. Accordingly, the price of such services is generally included in the price of the products delivered to the customer, and revenue is recognized upon delivery of the product, at which point, we have satisfied our obligations to the customer. We do not account for these services as a separate element, as the services generally do not have stand-alone value and cannot be separated from the product element of the arrangement.
We serve our customers under both Contracts, which include JIT contracts and LTAs, and ad hoc sales. Under JIT contracts, customers typically commit to purchase specified products from us at a fixed price, on an if-and-when needed basis, and we are responsible for maintaining high levels of stock availability of those products. LTAs are typically negotiated price lists for customers or individual customer sites that cover a range of pre-determined products, purchased on an as-needed basis. Ad hoc customers purchase products from us on an as-needed basis and are generally supplied out of our existing inventory. In addition, Contract customers often purchase products that are not captured under their Contract on an ad hoc basis.
Income from Operations
Income from operations is the result of subtracting the cost of sales and selling, general, and administrative expenses from net sales, and is used primarily to evaluate our performance and profitability.
The principal component of our cost of sales is product cost, which was 94.8% of our total cost of sales for the year ended September 30, 2015. The remaining components are freight and expediting fees, import duties, tooling repair charges, packaging supplies and physical inventory adjustment charges, which collectively were 5.2% of our total cost of sales for the year ended September 30, 2015.
Product cost is determined by the current weighted average cost of each inventory item, except for chemical parts for which the first-in, first-out method is used, and the adjustment to the reserve, if any, for excess and obsolete inventory. The inventory reserve is calculated to estimate the amount of excess and obsolete inventory we currently have on-hand. We review inventory for excess quantities and obsolescence quarterly and adjust the reserve and future forecasted sell-through rates as necessary. For a description of our E&O reserve policy, see “—Critical Accounting Policies and Estimates—Inventories.” Charges to cost of sales for the increase om our E&O reserve and related items of $95.1 million, $17.7 million and $8.7 million were recorded during the years ended September 30, 2015, 2014 and 2013, respectively. We believe that these amounts appropriately reflect the risk of E&O inventory inherent in our business. The increase in the year ended September 30, 2015 as compared to the year ended September 30, 2014 is primarily due to a $76.8 million charge relating to inventory previously purchased in connection with a specific program which was subsequently terminated and deemed to have no alternative use, and our change in the estimation methodology by which we determine the E&O reserve for our hardware inventory from an aging methodology to a consumption methodology, see “— Change in Estimate — Inventory E&O Reserve”. The increase in the year ended September 30, 2014 as compared to the year ended September 30, 2013 is primarily due to inventory growth during the year. For a more detailed description of the E&O reserves, see Note 5 of the Notes to Consolidated Financial Statements in Part II, Item 8 of this Annual Report on Form 10-K.
The principal components of our selling, general and administrative expenses are salaries, wages, benefits and bonuses paid to our employees; stock-based compensation; commissions paid to outside sales representatives; travel and other business expenses; training and recruitment costs; marketing, advertising and promotional event costs; rent; bad debt expense; professional services fees (including legal, audit and tax); and ordinary day-to-day business expenses. Depreciation and amortization expense is also included in selling, general and administrative expenses, and consists primarily of scheduled depreciation for leasehold improvements, machinery and equipment, vehicles, computers, software and furniture and fixtures. Depreciation and amortization also includes intangible asset amortization expense.
Other Expenses
Interest Expense, Net. Interest expense, net consists of the interest we pay on our long-term debt, fees on our revolving facility (as defined below under “—Liquidity and Capital Resources—Credit Facilities—Senior Secured Credit Facilities”) and our line-of-credit and deferred financing costs, net of interest income.
Other Income (Expense), Net. Other income (expense), net is primarily comprised of unrealized foreign exchange gain or loss associated with transactions denominated in currencies other than the respective functional currency of the reporting subsidiary.
Critical Accounting Policies and Estimates
The methods, estimates and judgments we use in applying our most critical accounting policies have a significant impact on the results we report in our financial statements. We evaluate our estimates and judgments on an on-going basis. We base our estimates on historical experience and on assumptions that we believe to be reasonable under the circumstances. Our experience and assumptions form the basis for our judgments about the carrying value of assets and liabilities that are not readily apparent from other sources. Actual results may vary from what we anticipate, and different assumptions or estimates about the future could change our reported results. We believe the following accounting policies are the most critical in that they significantly affect our financial statements, and they require our most significant estimates and complex judgments.
Inventories
Our inventory is comprised solely of finished goods. Inventories are stated at the lower of cost or market. The method by which amounts are removed from inventory are weighted average cost for all inventory, except for chemical parts for which the first-in, first-out method is used.
We record provisions, as appropriate, to write-down E&O inventory to estimated net realizable value. We charge cost of sales for inventory provisions to write down our inventory to the lower of cost or estimated market value or to completely write-off obsolete or excess inventory. Most of our inventory provisions relate to the write-off of excess quantities of products, based on our inventory levels compared to assumptions about future demand and market conditions. Once inventory has been written-off or written-down, it creates a new cost basis for the inventory that is not subsequently written-up. The process for evaluating E&O inventory often requires us to make subjective judgments and estimates concerning future sales levels, quantities and prices at which such inventories will be able to be sold in the normal course of business.
The components of our inventory are subject to different risks of excess quantities or obsolescence. Our hardware inventory, which does not expire or have a pre-determined shelf life, bears a higher risk of excess quantities than of becoming obsolete. However, our chemical inventory becomes obsolete when it has aged past its shelf-life, cannot be recertified and is no longer usable or able to be sold, or the inventory has been damaged on-site or in-transit. In such instances, a full reserve is taken against such inventory.
In the three months ended September 30, 2015, we determined that inventory previously purchased in connection with a specific program which was subsequently terminated, had no alternative use. During the year ended September 30, 2015, we continued to negotiate a sale of such inventory with our customer for whom such inventory was purchased, as well as market the inventory through other channels, and believed the full cost of this inventory was recoverable. However, in the fourth quarter of 2015, we determined such inventory was not marketable and recorded a reserve of $33.0 million.
Demand for our products can fluctuate significantly. Our estimates of future product demand and selling prices may prove to be inaccurate, in which case we may have understated or overstated the write-down required for E&O inventories. In the future, if our inventories are determined to be overvalued, we would be required to recognize such costs in our cost of goods sold at the time of such determination. Conversely, if our inventories are determined to be undervalued, we may have over-reported our costs of goods sold in previous periods and would be required to recognize such additional operating income at the time of sale. As of September 30, 2015 and 2014, our E&O reserve was $264.1 million and $197.2 million, respectively. We have revised the previously reported E&O reserve as of September 30, 2014 of $143.7 million that was not correct due to a clerical error in the prior year footnote. This immaterial revision does not change the inventory amount reported on the balance sheet or the amount of E&O charges recorded in the statement of comprehensive income. Charges to cost of sales for the increase in our E&O reserves and related items were $95.1 million, $17.7 million, and $8.7 million in the years ended September 30, 2015, 2014 and 2013, respectively. We believe that these amounts appropriately reflect the risk of E&O inventory inherent in our business.
Change in Methodology
During the year ended September 30, 2015, management changed the methodology by which we determine the E&O reserve for our hardware inventory from an aging methodology to a consumption methodology. In the three months ended September 30, 2015, we implemented this new strategy of providing integrated supply chain services more tailored to customer demand through long-term contracts and focused forecasted consumption, including changes to our inventory purchasing strategy, holding inventory for shorter periods and the planned scrapping of long dated inventory. The new strategy and updates for fiscal 2015 sales activities led to changes in the sell through rates, holding period of aged inventory and others estimates used in the E&O reserve for our hardware inventory, which increased our E&O inventory reserves by $43.8 million.
The Year Ended September 30, 2015
In conducting our E&O reserve for our hardware inventory, we consider a variety of factors, including historical sales over a five year period which we utilize to forecast future demand. E&O inventory is identified by comparing current inventory levels to future demand, and is reserved appropriately. We also stratify the inventory population in order to identify inventory which is sold to a single customer, and we therefore have increased risk of holding excess or obsolete inventory should the underlying contracts with that customer be terminated or otherwise not renewed.
We also consider a variety of factors, including shelf-life expiration, damage to products, rights we have with certain manufacturers to exchange unsold products for new products and open customer orders.
The Years Ended September 30, 2014 and 2013
The E&O reserve included both excess and slow-moving inventory which typically included inventory held by us after strategic purchases were made to take advantage of favorable pricing terms, speculative purchases based on current market trends or purchases timed to take supplier lead times into account, which may have resulted in us maintaining excess and slow-moving quantities of inventories.
In conducting our reserve analysis with respect to slow-moving inventory, we considered a variety of factors, including historical sell-through rates, selling and buying patterns, inventory quantities and aging, shelf-life expiration, damage to products, rights we had with certain manufacturers to exchange unsold products for new products and open customer orders. Furthermore, although our customers were not required to purchase a specific quantity of inventory from us, we forecasted future sales by monitoring and tracking our customers’ production cycles, which was taken into account when conducting our reserve analysis.
Goodwill and Indefinite-Lived Intangible Assets
Goodwill represents the excess of the consideration paid over the fair value of the net assets acquired in a business combination. Goodwill and indefinite-lived intangible assets acquired in a business combination are not amortized, but instead tested for impairment at least annually or more frequently should an event occur or circumstances indicate that the carrying amount may be impaired. Such events or circumstances may be a significant change in business climate, economic and industry trends, legal factors, negative operating performance indicators, significant competition, changes in strategy, or disposition of a reporting unit or a portion thereof. Goodwill and indefinite lived intangibles impairment testing is performed at the reporting unit level on July 1 of each year and when circumstances change that might indicate impairment.
We test goodwill for impairment by performing a qualitative assessment process, or using a two-step quantitative assessment process. If we choose to perform a qualitative assessment process and determine it is more likely than not (that is, a likelihood of more than 50 percent) that the carrying value of the net assets is more than the fair value of the reporting unit, the two-step quantitative assessment process is then performed; otherwise, no further testing is required. Factors utilized in the qualitative assessment may include the following: macroeconomic conditions; industry and market considerations; cost factors; overall financial performance; Wesco entity specific operating results and other relevant Wesco entity specific events. We may elect not to perform the qualitative assessment process and, instead, proceed directly to the two step quantitative assessment process. For reporting units where the two-step quantitative assessment process is performed, the first step involves comparing the carrying value of net assets, including goodwill, to the fair value of the reporting unit. If the fair value exceeds its carrying amount, goodwill is not considered impaired and the second step of the process is unnecessary. If the carrying amount of a reporting unit’s goodwill exceeds its fair value, the second step measures the impairment loss, if any.
The first step identifies potential impairment by comparing the fair value of a reporting unit with its carrying amount, including goodwill. For periods prior to the Haas acquisition, our reporting units were consistent with our operating segments (North America Hardware and Rest of World Hardware). Subsequent to the Haas acquisition, we added two additional reporting units (North America Chemical and Rest of World Chemical). The estimates of fair value of a reporting unit are determined based on a discounted cash flow analysis and market earnings multiples. A discounted cash flow analysis requires us to make various judgmental assumptions, including assumptions about future cash flows, growth rates and discount rates. The
assumptions about future cash flows and growth rates are based on the forecast and long-term business plans of each reporting unit. Discount rate assumptions are based on an assessment of the risk inherent in the future cash flows of the respective reporting units. If the fair value exceeds the carrying value of a reporting unit, goodwill is not considered impaired and the second step of the test is unnecessary. If the carrying amount of a reporting unit’s goodwill exceeds the fair value of a reporting unit, the second step measures the impairment loss, if any.
The second step compares the implied fair value of goodwill with the carrying amount of that goodwill. The implied fair value of goodwill is determined in the same manner as the amount of goodwill recognized in a business combination. The implied fair value of the reporting unit’s goodwill is calculated by creating a hypothetical balance sheet as if the reporting unit had just been acquired. This balance sheet contains all assets and liabilities recorded at fair value (including any intangible assets that may not have any corresponding carrying value in our balance sheet). The implied value of the reporting unit’s goodwill is calculated by subtracting the fair value of the net assets from the fair value of the reporting unit. If the carrying amount of goodwill exceeds the implied fair value of that goodwill, an impairment loss is recognized in an amount equal to that excess. We performed qualitative assessments for the year ended September 30, 2014, and on a quarterly basis, as needed, during the year ended September 30, 2015.
For the North America Hardware reporting unit, we performed a Step 1 goodwill impairment test on July 1, 2012, which reflected fair value in excess of carrying value of 38.5%. Since 2012, North America Hardware has underperformed relative to the forecasts included in the Step 1 analysis; however, our Step 0 impairment tests performed on July 1, 2013 and 2014 did not indicate it was more likely than not that the carrying value exceeded the fair value of the reporting unit. Through June 30, 2015, we continued to monitor Wesco North America’s performance relative to these forecasts.
We performed our Step 1 goodwill impairment tests on July 1, 2015. The results of these tests indicated that the estimated fair values of our reporting units exceeded their carrying values, with the exception of the North America Hardware reporting unit within our North America segment reflecting management’s reduced sales and earnings outlook. The impact of market pressures such as decreasing revenue and underperformance relative to forecast adversely impacted the fair value of this reporting unit. As a result, we proceeded to Step 2 of the goodwill impairment analysis, and compared the implied value of North America Hardware’s goodwill with the carrying value of its goodwill, and since the carrying value exceeded the implied fair value, we recorded a non-cash impairment charge of $263.8 million in the three months ended September 30, 2015.
The preparation of our internal forecasts requires significant judgments, including the estimation of the long-term rate of growth for our business, estimation of the useful life over which cash flows will occur, cost containment activities, changes in working capital, growth rates, discount rates, and other factors. Changes in these factors could significantly change our internal forecasts, which could significantly change the amount of impairment recorded, if any.
Revenue Recognition
We recognize product and service revenue when (1) persuasive evidence of an arrangement exists, (2) title transfers to the customer, (3) the sales price charged is fixed or determinable and (4) collection is reasonably assured. In instances where title does not pass to the customer upon shipment, we recognize revenue upon delivery or customer acceptance, depending on the terms of the sales contract.
We report revenue on a gross or net basis based on management’s assessment of whether we act as a principal or agent in the transaction. We assess whether we act as a principal in the transaction or as an agent acting on behalf of others by considering such factors as to whether or not we obtain control of the product, the form of consideration we receive, our ability to influence pricing, and our performance obligations. Based upon these criteria, if we are the principal in the transaction and have the risks and rewards of ownership, the transactions are recorded as gross in the consolidated statements of comprehensive income. If we do not act as a principal in the transaction, the transactions are recorded on a net basis in the consolidated statements of comprehensive income. The majority of our revenue is recorded on a gross basis with the exception of certain gas, energy and chemical manager service contracts that are recorded as net revenue.
We also enter into sales rebate and profit sharing arrangements with our customers. Such customer incentives are accounted for as a reduction to gross sales and recorded based upon estimates at the time products are sold. These estimates are based upon historical experience for similar programs and products. We review such rebates and profit sharing arrangements on an ongoing basis and accruals are adjusted, if necessary, as additional information becomes available.
Management provides allowances for credits and returns, based on historic experience, and adjusts such allowances as considered necessary. To date, such provisions have been within the range of management’s expectations and the allowance established.
Income Taxes
We recognize deferred tax liabilities and assets for the expected future tax consequences of temporary differences between the carrying amounts and the tax bases of assets and liabilities. Deferred income tax assets and liabilities are measured using enacted tax rates expected to apply to taxable income in the years in which these temporary differences are expected to be recovered or settled. The effect of a change in tax rates on deferred tax assets and liabilities is recognized in income in the period that includes the enactment date. A valuation allowance is established, when necessary, to reduce net deferred tax assets to the amount expected to be realized. The ultimate realization of deferred tax assets depends upon the generation of future taxable income during the periods in which temporary differences become deductible or includible in taxable income. We consider projected future taxable income and tax planning strategies in our assessment. Our foreign subsidiaries are taxed in local jurisdictions at local statutory rates.
We determine whether it is more likely than not that some or all of the deferred tax assets will not be realized. We have recorded valuation allowances of $6.0 million and $4.9 million as of September 30, 2015 and 2014, respectively, against certain deferred tax assets, which consist primarily of temporary differences related to certain Haas foreign tax credits and Haas foreign net operating losses. The valuation allowances are based on our estimates of taxable income by jurisdictions in which we operate and the period over which our deferred tax assets will be recoverable. If actual results differ from these estimates or if we revise these estimates in future periods, we may need to adjust the valuation allowances which could materially impact our financial position and results of operations.
Stock-Based Compensation
We account for all stock-based compensation awards to employees and members of our Board of Directors based upon their fair values as of the date of grant using a fair value method and recognize the fair value of each award as an expense over the requisite service period using the graded vesting method for awards with performance conditions and the straight line method for awards with service conditions only.
For purposes of calculating stock-based compensation, we estimate the fair value of stock options using a Black-Scholes option pricing model, which requires the use of certain subjective assumptions including expected term, volatility, expected dividend, risk-free interest rate, and the fair value of our common stock. These assumptions generally require significant judgment.
We estimate the expected term of employee options using the average of the time-to-vesting and the contractual term. We derive our expected volatility from the historical volatilities of several unrelated public companies within our industry because we have little information on the volatility of the price of our common stock since we have limited trading history. When making the selections of our industry peer companies to be used in the volatility calculation, we also consider the size and financial leverage of potential comparable companies. These historical volatilities are weighted based on certain qualitative factors and combined to produce a single volatility factor. Our expected dividend rate is zero, as we have never paid any dividends on our common stock and do not anticipate any dividends in the foreseeable future. We base the risk-free interest rate on the U.S. Treasury yield in effect at the time of grant for zero coupon U.S. Treasury notes with maturities approximately equal to each grant’s expected life. For awards with performance conditions, we estimate the probability that the performance condition will be met.
We estimate our forfeiture rate based on an analysis of our actual forfeitures and will continue to evaluate the appropriateness of the forfeiture rate based on actual forfeiture experience, analysis of employee turnover behavior and other factors. Quarterly changes in the estimated forfeiture rate can have a significant effect on reported stock-based compensation expense, as the cumulative effect of adjusting the rate for all expense amortization is recognized in the period the forfeiture estimate is changed.
The following table summarizes the amount of stock-based compensation expense recognized in our consolidated statements of comprehensive income (in thousands):
|
|
|
2015 |
|
2014 |
|
2013 |
| |||
|
Stock-based compensation expense |
|
$ |
7,891 |
|
$ |
5,507 |
|
$ |
3,394 |
|
For the years ending September 30, 2016 and 2017, we expect to incur stock-based compensation expense of $5.5 million and $3.6 million, respectively.
If any of the factors change and/or we employ different assumptions, stock-based compensation expense may differ significantly from what we have recorded in the past. If there is a difference between the assumptions used in determining stock-based compensation expense and the actual factors that become known over time, we may change the input factors used in determining stock-based compensation costs for future grants. Additionally, we may change the estimates that the performance obligations may be met. These changes, if any, may materially impact our results of operations in the period such changes are made. We expect to continue to grant stock options in the future, and to the extent that we do, our actual stock-based compensation expense recognized in future periods will likely increase.
Results of Operations
Consolidated
|
|
|
Years Ended September 30, |
| |||||||
|
Consolidated Result of Operations |
|
2015 |
|
2014 |
|
2013 |
| |||
|
|
|
(dollars in thousands) |
| |||||||
|
|
|
|
| |||||||
|
Net sales |
|
$ |
1,497,615 |
|
$ |
1,355,877 |
|
$ |
901,608 |
|
|
|
|
|
|
|
|
|
| |||
|
(Loss) income from operations |
|
$ |
(206,365 |
) |
$ |
183,934 |
|
$ |
180,802 |
|
|
Interest expense, net |
|
(37,092 |
) |
(29,225 |
) |
(25,178 |
) | |||
|
Other income, net |
|
1,841 |
|
2,199 |
|
2,003 |
| |||
|
(Loss) income before income taxes |
|
(241,616 |
) |
156,908 |
|
157,627 |
| |||
|
Income tax benefit (provision) |
|
86,872 |
|
(54,806 |
) |
(52,815 |
) | |||
|
Net (loss) income |
|
$ |
(154,744 |
) |
$ |
102,102 |
|
$ |
104,812 |
|
|
|
|
(as a percentage of net sales, numbers rounded) |
| ||||
|
|
|
|
|
|
|
|
|
|
Net sales |
|
100 |
% |
100 |
% |
100 |
% |
|
|
|
|
|
|
|
|
|
|
(Loss) income from operations |
|
(13.8 |
)% |
13.6 |
% |
20.1 |
% |
|
Interest expense, net |
|
(2.4 |
)% |
(2.2 |
)% |
(2.8 |
)% |
|
Other income, net |
|
0.1 |
% |
0.2 |
% |
0.2 |
% |
|
(Loss) income before income taxes |
|
(16.1 |
)% |
11.6 |
% |
17.5 |
% |
|
Income tax (benefit) provision |
|
5.8 |
% |
(4.1 |
)% |
(5.9 |
)% |
|
Net (loss) income |
|
(10.3 |
)% |
7.5 |
% |
11.6 |
% |
Year ended September 30, 2015 compared with the year ended September 30, 2014
Net Sales
Net sales for the year ended September 30, 2015 increased $141.7 million, or 10.5%, to $1,497.6 million compared to the year ended September 30, 2014, driven by the Haas acquisition completed on February 28, 2014, offset by the impact of a customer contract renegotiation, as described below, and foreign currency movements. Sales attributable to the acquired Haas business increased $235.7 million for the year ended September 30, 2015 as compared to the year ended September 30, 2014, which was a result of having a full year and seven months of Haas results included in the years ended September 30, 2015 and 2014, respectively. During the year ended September 30, 2014, we modified and extended a contract with an existing customer that resulted in a $66.3 million reduction in net sales to the customer during the year ended September 30, 2015 as compared to the year ended September 30, 2014. The year ended September 30, 2014 also included a $6.4 million settlement related to the termination of a separate contract. During the year ended September 30, 2015, foreign currency movements negatively impacted sales by $25.4 million. Ad hoc and Contract sales as a percentage of consolidated net sales represented 26% and 74%, respectively, for the year ended September 30, 2015, as compared to 28% and 72%, respectively, for the year ended September 30, 2014. The decrease in ad hoc sales as a percentage of net revenue was a result of adding a full year of Haas sales, which has a higher percentage of Contract sales.
(Loss) income from Operations
Loss from operations for the year ended September 30, 2015 was $206.4 million, compared to income from operations of $183.9 million for the year ended September 30, 2014. Loss from operations was 13.8% of net sales for the year ended September 30, 2015, compared to income from operations of 13.6% of net sales for the year ended September 30, 2014. The dollar decrease in income from operations was comprised of a decrease in gross profit of $78.5 million, an increase in selling, general and administrative expenses of $48.0 million and a goodwill impairment charge of $263.8
million. The decrease in gross profit was primarily driven by a $95.1 million increase in E&O inventory reserve, which was largely the result of our change of E&O reserve estimation methodologies (see further discussion under “—Critical Accounting Policies and Estimates—Inventories”), and lower-margin Contract sales partially offset by additional gross profit as a result of the Haas acquisition. The increase in selling, general and administrative expenses was primarily driven by $32.6 million of additional expenses as a result of the Haas acquisition and increases in professional fees, payroll costs, stock-based compensation, restructuring costs and depreciation expense of $8.2 million, $4.7 million, $2.4 million, $4.5 million and $1.3 million, respectively. These increases were partially offset by lower integration related costs of $5.8 million.
Other Expenses
Interest Expense, Net
Interest expense, net was $37.1 million for the year ended September 30, 2015, which increased $7.9 million, or 26.9%, compared to the year ended September 30, 2014. $7.1 million of this increase resulted from having a full year of interest during fiscal 2015 compared to seven months of interest during fiscal 2014 on the term loan B facility (as defined below under “—Credit Facilities—Senior Secured Credit Facilities”), which was used to fund the Haas acquisition in February 2014.
Other Income, Net
Other income, net was $1.8 million for the year ended September 30, 2015, which decreased by $0.4 million compared to the year ended September 30, 2014. This change was primarily due to unrealized foreign currency exchange losses associated with transactions denominated in currencies other than the respective functional currency of the reporting subsidiary.
Benefit (Provision) for Income Taxes
The income tax benefit was $86.9 million for the year ended September 30, 2015, compared to the income tax provision of $54.8 million for the year ended September 30, 2014. Our effective tax rate was 36.0% and 34.9% for the years ended September 30, 2015 and 2014, respectively. The increase in our effective tax rate resulted primarily from an impairment of certain goodwill and adjustments to our E&O inventory reserve. Refer to Note 15 of the Notes to Consolidated Financial Statements in Part II, Item 8 of this Annual Report on Form 10-K for additional information about our benefit for income taxes for the year ended September 30, 2015.
Net (Loss) Income
We reported a net loss of $154.7 million for the year ended September 30, 2015, compared to a net income of $102.1 million for the year ended September 30, 2014. Net loss was 10.3% of net sales for the year ended September 30, 2015, as compared to net income of 7.5% of net sales for the year ended September 30, 2014. This decrease is primarily due to loss from operations as a percentage of net sales for fiscal 2015, as discussed above, which was partially offset by income tax benefit for operating losses.
Year ended September 30, 2014 compared with the year ended September 30, 2013
Net Sales
Net sales of $1,355.9 million for the year ended September 30, 2014 increased $454.3 million, or 50.4%, compared to the year ended September 30, 2013. Ad hoc and Contract sales as a percentage of net sales represented 28% and 72%, respectively, for the year ended September 30, 2014, as compared to 40% and 60%, respectively, for the year ended September 30, 2013. The increase in Contract sales as a percentage of net sales for fiscal 2014 was resulted from Haas sales, which had a higher percentage of Contract sales. The year ended September 30, 2014 reflects $356.2 million of net sales related to the Haas acquisition, and exclusive of these net sales the increase in net sales would have been $98.1 million, or 10.9%.
Income from Operations
Income from operations of $183.9 million for the year ended September 30, 2014 increased $3.1 million, or 1.7%, compared to the year ended September 30, 2013. Income from operations as a percentage of net sales was 13.6% for the year ended September 30, 2014, compared to 20.1% for the year ended September 30, 2013. The dollar increase in income from operations was comprised of an increase in gross profit of $85.3 million offset by an increase in selling, general and administrative expenses of $82.2 million. The increase in gross profit was primarily driven by additional gross profit as a result of the Haas acquisition, partially offset by a $8.6 million increase in the E&O inventory reserve (exclusive of the impact of the Haas acquisition) as well as the impact of increased lower-margin Contract sales and discounts provided to customers in
exchange for long-term contract extensions. The increase in selling, general and administrative expenses was primarily driven by $58.6 million of additional expenses as a result of the Haas acquisition, $12.6 million of integration related costs associated with the Haas acquisition and increases in payroll costs, stock-based compensation, group insurance, depreciation and commissions of $4.3 million, $2.1 million, $1.3 million, $1.0 million and $1.0 million, respectively.
Other Expenses
Interest Expense, Net
Interest expense, net of $29.2 million for the year ended September 30, 2014 increased $4.0 million, or 16.1%, compared to the year ended September 30, 2013. This increase was driven by $12.1 million of interest incurred for the year ended September 30, 2014 associated with the term loan B facility and the revolving facility that were used to fund the Haas acquisition. This increase was partially offset by lower interest due to a reduction in the average term loan A facility balance of $26.7 million for the year ended September 30, 2014 as compared to September 30, 2013, as well as $5.0 million write-off of deferred financing charges related to the refinancing of the old senior secured credit facilities (as defined below under “—Liquidity and Capital Resources—Credit Facilities—Old Senior Secured Credit Facilities”) during the year ended September 30, 2013.
Other Income (Expense), Net
Other income, net of $2.2 million for the year ended September 30, 2014 increased by $0.2 million compared to the year ended September 30, 2013. This change was primarily due to unrealized foreign exchange gains associated with transactions denominated in currencies other than the respective functional currency of the reporting subsidiary.
Provision for Income Taxes
Provision for income taxes of $54.8 million for the year ended September 30, 2014 increased by $2.0 million compared to the year ended September 30, 2013. Our effective tax rate was 34.9% and 33.5% for the years ended September 30, 2014 and 2013, respectively. The increase in our effective tax rate resulted primarily from an increase in certain expenses related to the Haas acquisition which are not tax deductible. Refer to Note 15 of the Notes to Consolidated Financial Statements in Part II, Item 8 of this Annual Report on Form 10-K for additional information about our provision for income taxes for the year ended September 30, 2014.
Net Income
We reported net income of $102.1 million for the year ended September 30, 2014, compared to net income of $104.8 million for the year ended September 30, 2013. Net income as a percent of net sales decreased 4.1% for the year ended September 30, 2014, as compared to the year ended September 30, 2013, due to lower income from operations as a percentage of net sales, as discussed above, partially offset by lower interest expense as a percent of net sales and a lower provision for income taxes as a percent of net sales.
North America Segment
|
|
|
Years Ended September 30, |
| |||||||
|
North America Results of Operations |
|
2015 |
|
2014 |
|
2013 |
| |||
|
|
|
(dollars in thousands) |
| |||||||
|
|
|
|
|
|
|
|
| |||
|
Net sales |
|
$ |
1,198,201 |
|
$ |
1,030,511 |
|
$ |
713,725 |
|
|
|
|
|
|
|
|
|
| |||
|
(Loss) income from operations |
|
$ |
(222,719 |
) |
$ |
145,357 |
|
$ |
150,587 |
|
|
|
|
(as a percentage of net sales, numbers rounded) |
| ||||
|
|
|
|
|
|
|
|
|
|
Net sales |
|
100 |
% |
100 |
% |
100 |
% |
|
|
|
|
|
|
|
|
|
|
(Loss) income from operations |
|
(18.6 |
)% |
14.1 |
% |
21.1 |
% |
Year ended September 30, 2015 compared with the year ended September 30, 2014
Net Sales
Net sales of $1,198.2 million from our North America segment for the year ended September 30, 2015 increased $167.7 million, or 16.3%, compared to the year ended September 30, 2014, reflecting an increase of $189.7 million driven by the Haas acquisition, partially offset by a customer contract modification and the settlement related to the termination of a contract that took place during the year ended September 30, 2014.
Ad hoc sales decreased by $4.0 million, or 1.1%, and Contract sales increased by $171.8 million, or 25.3%, primarily due to the addition of Haas, which has a higher percentage of Contract sales than ad hoc sales.
(Loss) Income from Operations
Loss from operations of our North America segment for the year ended September 30, 2015 was $222.7 million, compared to an income from operations of $145.4 million for the year ended September 30, 2014. Loss from operations was 18.6% of net sales for the year ended September 30, 2015, compared to an income from operations of 14.1% of net sales for the year ended September 30, 2014. The dollar decrease in income from operations was comprised of a decrease in gross profit of $67.7 million, an increase in selling, general and administrative expenses of $36.6 million and a goodwill impairment charge of $263.8 million. The decrease in gross profit was primarily driven by an $83.7 million inventory adjustment and increased lower-margin Contract sales, partially offset by additional gross profit as a result of the Haas acquisition. The increase in selling, general and administrative expenses was primarily driven by $22.8 million of additional expenses as a result of the Haas acquisition and increases in professional fees, payroll costs, stock-based compensation, restructuring costs and depreciation expense of $8.3 million, $3.9 million, $2.4 million, $2.6 million and $1.5 million, respectively. These increases were partially offset by lower integration related costs of $6.0 million.
Year ended September 30, 2014 compared with the year ended September 30, 2013
Net Sales
Net sales of $1,030.5 million from our North America segment for the year ended September 30, 2014 increased $316.8 million, or 44.4%, compared to the year ended September 30, 2013. The year ended September 30, 2014 reflects $266.3 million of net sales related to the Haas acquisition, and exclusive of these net sales North America net sales would have increased by $50.6 million, or 7.1%. Excluding the Haas acquisition, ad hoc and Contract net sales increased by $7.1 million or 2.3% and $46.9 million or 11.7%, respectively, for the year ended September 30, 2014 as compared to the year ended September 30, 2013. The increase in ad hoc net sales was primarily due to general growth across numerous customers. The increase in Contract net sales was primarily driven by a transition of a contract from Rest of World to North America, a settlement related to the termination of a contract, increases in commercial build rates for existing Contracts and scope expansion on existing Contracts.
Income from Operations
Income from operations in our North America segment for the year ended September 30, 2014 was $145.4 million, which decreased $5.2 million, or 3.5%, compared to the year ended September 30, 2013. Income from operations as a percentage of net sales in our North America segment was 14.1% for the year ended September 30, 2014, compared to 21.1% for the year ended September 30, 2013, a decrease of 7.0%. The dollar decrease in income from operations was comprised of an increase in gross profit of $56.6 million offset by an increase in selling, general and administrative expenses of $61.8 million. The increase in gross profit was primarily driven by additional gross profit as a result of the Haas acquisition, partially offset by a $8.6 million increase in the E&O inventory reserve (exclusive of the impact of the Haas acquisition), as well as the impact of increased lower-margin Contract sales and discounts provided to customers in exchange for long-term contracts extensions. The increase in selling, general and administrative expenses was primarily driven by $41.4 million of additional expenses as a result of the Haas acquisition, $12.6 million of integration -related costs associated with the Haas acquisition and increases in payroll costs, stock-based compensation, group insurance and depreciation of $2.8 million, $2.1 million, $1.3 million and $0.9 million, respectively.
Rest of World Segment
|
|
|
Years Ended September 30, |
| |||||||
|
Rest of World Results of Operations |
|
2015 |
|
2014 |
|
2013 |
| |||
|
|
|
(dollars in thousands) |
| |||||||
|
|
|
|
|
|
|
|
| |||
|
Net sales |
|
$ |
299,414 |
|
$ |
325,366 |
|
$ |
187,883 |
|
|
|
|
|
|
|
|
|
| |||
|
Income from operations |
|
$ |
16,354 |
|
$ |
38,577 |
|
$ |
30,215 |
|
|
|
|
(as a percentage of net sales, numbers rounded) |
| ||||
|
|
|
|
|
|
|
|
|
|
Net sales |
|
100 |
% |
100 |
% |
100 |
% |
|
|
|
|
|
|
|
|
|
|
Income from operations |
|
5.5 |
% |
11.9 |
% |
16.1 |
% |
Year ended September 30, 2015 compared with the year ended September 30, 2014
Net Sales
Net sales of $299.4 million from our Rest of World segment for the year ended September 30, 2015 decreased $26.0 million, or 8.0%, compared to the year ended September 30, 2014, reflecting negative foreign currency impacts of $25.4 million and a customer contract modification, partially offset by additional Haas sales of $46.1 million. Ad hoc sales decreased by $0.4 million, or 0.9%, and Contract sales decreased by $25.6 million, or 9.1%, primarily due to the customer contract modification and foreign currency impacts.
Income from Operations
Income from operations of our Rest of World segment for the year ended September 30, 2015 was $16.4 million, which decreased $22.2 million, or 57.6%, compared to the year ended September 30, 2014. Income from operations as a percentage of net sales in our Rest of World segment was 5.5% for the year ended September 30, 2015, compared to 11.9% for the year ended September 30, 2014. The dollar decrease in income from operations was comprised of a decrease in gross profit of $10.8 million and an increase in selling, general and administrative expenses of $11.4 million. The decrease in gross profit was primarily driven by an $11.3 million inventory adjustment and increased lower-margin Contract sales, partially offset by $12.4 million of additional gross profit as a result of the Haas acquisition. The increase in selling, general and administrative expenses was primarily driven by $10.8 million of additional expenses as a result of the Haas acquisition and increases in payroll costs and commissions of $0.8 million and $0.6 million, respectively.
Year ended September 30, 2014 compared with the year ended September 30, 2013
Net Sales
Net sales of $325.4 million from our Rest of World segment for the year ended September 30, 2014 increased $137.5 million, or 73.2%, compared to the year ended September 30, 2013. The year ended September 30, 2014 reflects $90.0 million of net sales related to the Haas acquisition, and exclusive of these net sales Rest of World net sales would have increased by $47.5 million, or 25.3%. Excluding the Haas acquisition, ad hoc and Contract net sales increased by $3.0 million or 6.7% and $45.3 million or 31.8%, respectively, for the year ended September 30, 2014 as compared to the year ended September 30, 2013. The ad hoc net sales growth was attributable to increases in European production and growth across the customer base due to build rate increases and expansion of the MRO market. The drivers of the increase in Contract sales were a one-time inventory sale in conjunction with the modification and extension of a contract with an existing customer as well as further growth of the Boeing 787 production and higher build rates with European commercial customers. These increases were partially offset by a transition of a contract to North America.
Income from Operations
Income from operations of our Rest of World segment for the year ended September 30, 2014 was $38.6 million, which increased $8.4 million, or 27.7%, compared to the year ended September 30, 2013. Income from operations as a percentage of net sales in our Rest of World segment was 11.9% for the year ended September 30, 2014, compared to 16.1% for the year ended September 30, 2013, a decrease of 4.2%. The dollar increase in income from operations was comprised of an increase in gross profit of $28.8 million, partially offset by an increase in selling, general and administrative expenses of $20.4 million. The increase in gross profit was primarily driven by additional gross profit as a result of the Haas acquisition, partially offset by the impact of strong growth in lower-margin Contracts sales. The increase in selling, general and administrative expenses was primarily driven by $17.1 million of additional expenses as a result of the Haas acquisition and increases in payroll costs and commissions of $1.5 million and $1.0 million, respectively.
Liquidity and Capital Resources
Overview
Our primary sources of liquidity are cash flow from operations and available borrowings under our revolving facility (as defined below under “—Credit Facilities—Senior Secured Credit Facilities”). We have historically funded our operations, debt payments, capital expenditures and discretionary funding needs from our cash from operations. We had total available cash and cash equivalents of $82.9 million and $104.8 million as of September 30, 2015 and 2014, respectively, of which $30.8 million, or 37.2%, and $56.0 million, or 53.5%, was held by our foreign subsidiaries as of September 30, 2015 and 2014, respectively. None of our cash and cash equivalents consisted of restricted cash and cash equivalents as of September 30, 2015 or 2014. All of our foreign cash and cash equivalents are readily convertible into U.S. dollars or other foreign currencies. Our strategic plan does not require the repatriation of foreign cash in order to fund our operations in the U.S. and it is our current intention to permanently reinvest our foreign cash and cash equivalents outside of the U.S. If we were to repatriate foreign cash to the U.S., we may be required to accrue and pay U.S. taxes in accordance with applicable U.S. tax rules and regulations as a result of the repatriation. Our primary uses of cash are for:
· operating expenses;
· working capital requirements to fund the growth of our business;
· capital expenditures that primarily relate to IT equipment and our warehouse operations;
· debt service requirements for borrowings under the Credit Facilities (as defined below under “—Credit Facilities—Senior Secured Credit Facilities”); and
· strategic acquisitions.
Generally, cash provided by operating activities has been adequate to fund our operations. Due to fluctuations in our cash flows and the growth in our operations, it may be necessary from time to time in the future to borrow under our revolving facility to meet cash demands. We anticipate that cash provided by operating activities, cash and cash equivalents and borrowing
capacity under our revolving facility will be sufficient to meet our cash requirements for the next twelve months. As of September 30, 2015, we did not have any material capital expenditure commitments.
Credit Facilities
Senior Secured Credit Facilities
Our amended credit agreement provides for (1) a $625.0 million term loan A facility (the term loan A facility), (2) a $200.0 million revolving credit facility (the revolving facility), and (3) a $525.0 million senior secured term loan B facility (the term loan B facility). We refer to the term loan B facility, together with the term loan A facility and the revolving facility, as the Credit Facilities. The Credit Facilities allowed us to acquire Haas and for Wesco Aircraft Hardware Corp. to incur additional first lien indebtedness and corresponding liens in the form of the term loan B facility and to reset certain ratios with respect to the Consolidated Total Leverage Ratio covenant applicable to the term loan A facility and the revolving facility, as further described below.
As of September 30, 2015, our outstanding indebtedness under our Credit Facilities was $952.9 million, which consisted of (1) $477.3 million of indebtedness under the term loan A facility, and (2) $475.6 million of indebtedness under the term loan B facility. As of September 30, 2015, $200.0 million was available for borrowing under the revolving facility without breaching any covenants contained in the agreements governing our indebtedness.
The interest rate for the term loan A facility is based on our Consolidated Total Leverage Ratio (as such ratio is defined in the Credit Facilities) as determined in the most recently delivered financial statements, with the respective margins ranging from 1.75% to 2.50% for Eurocurrency loans and 0.75% to 1.50% for alternate base rate (ABR) loans. The term loan A facility amortizes in equal quarterly installments of 1.25% of the original principal amount of $625.0 million for the first year, escalating to quarterly installments of 2.50% of the original principal amount of $625.0 million by the fifth year, with the balance due at maturity on December 7, 2017. As of September 30, 2015, the interest rate for borrowings under the term loan A facility was 2.72%.
The interest rate for the term loan B facility has a margin of 2.50% per annum for Eurocurrency loans (subject to a minimum Eurocurrency rate floor of 0.75% per annum) or 1.50% per annum for ABR loans (subject to a minimum ABR floor of 1.75% per annum). The term loan B facility amortizes in equal quarterly installments of 0.25% of the original principal amount of $525.0 million, with the balance due at maturity on February 28, 2021. As of September 30, 2015, the interest rate for borrowings under the term loan B facility was 3.25%. In July 2015, we entered into interest rate swap agreements relating to this indebtedness, which are described in greater detail in Note 12 of the Notes to Consolidated Financial Statements in Part II, Item 8 of this Annual Report on Form 10-K.
The interest rate for the revolving facility is based on our Consolidated Total Leverage Ratio as determined in the most recently delivered financial statements, with the respective margins ranging from 1.75% to 2.50% for Eurocurrency loans and 0.75% to 1.50% for ABR loans. The revolving facility expires on December 7, 2017.
Our borrowings under the Credit Facilities are guaranteed by us and all of our direct and indirect, wholly-owned, domestic restricted subsidiaries (subject to certain exceptions) and secured by a first lien on substantially all of our assets and the assets of our guarantor subsidiaries, including capital stock of the subsidiaries (in each case, subject to certain exceptions).
During the year ended September 30, 2015, we made voluntary prepayments totaling $50.0 million on our term loan A facility and $36.3 million on our term loan B facility, which have been applied to future required quarterly payments, and we therefore have no required payments in fiscal 2016.
Under the terms and definitions applicable to the Credit Facilities as of September 30, 2015, our Consolidated Total Leverage Ratio (as such ratio is defined in the Credit Facilities) cannot exceed 4.75 (with step-downs on such ratio during future periods) and our Consolidated Net Interest Coverage Ratio (as such ratio is defined in the Credit Facilities) cannot be less than 2.25. The Credit Facilities also contain customary negative covenants, including restrictions on our and our restricted subsidiaries’ ability to merge and consolidate with other companies, incur indebtedness, grant liens or security interests on assets, make acquisitions, loans, advances or investments, pay dividends, sell or otherwise transfer assets, optionally prepay or modify terms of any junior indebtedness or enter into transactions with affiliates. As of September 30, 2015, we were in compliance with all of the foregoing covenants, and our Consolidated Total Leverage Ratio was 4.35 and our Consolidated Net Interest Coverage Ratio was 6.13. As noted above, our Consolidated Total Leverage Ratio will step-down during future periods, decreasing to 4.50 for the quarter ending December 31, 2015, 4.00 for the quarter ending March 31, 2016 and 3.75 for the quarter ending June 30, 2016 and thereafter.
Although our sales and earnings outlook meets the projected requirements for these covenants by a narrow margin, ongoing analysis of forecast projections will be utilized to assess when and if actions and countermeasures are necessary, including potentially seeking an appropriate covenant waiver or amendment. A breach of any of these covenants could result in an event of default under the Credit Facilities. If any such event of default occurs, the lenders under the Credit Facilities may elect to declare all outstanding borrowings, together with accrued interest and other amounts payable thereunder, to be immediately due and payable. The lenders under the Credit Facilities also have the right in these circumstances to terminate any commitments they have to provide further borrowings. In addition, following an event of default under the Credit Facilities, the lenders under those facilities will have the right to proceed against the collateral granted to them to secure the debt, which includes our available cash. If the debt under the Credit Facilities was to be accelerated, our assets would not be sufficient to repay in full our debt.
Old Senior Secured Credit Facilities
Our old senior secured credit facilities, which were repaid on December 7, 2012 in connection with our entry into the Credit Facilities described above, consisted of a (1) $150.0 million revolving facility (the old revolving credit facility), (2) $265.0 million term loan A facility (the old term loan A facility), and (3) $350.0 million term loan B facility (the old term loan B facility).
The interest rate for the old term loan A facility was based on our total consolidated net leverage ratio as determined in the most recently delivered financial statements at such time, with the respective margins ranging from 2.25% to 3.25% for Eurocurrency loans and 1.25% to 2.25% for ABR loans. The old term loan A facility amortized in equal quarterly installments of 1.25% of the original principal amount of $265.0 million for the first year, escalating to quarterly installments of 3.75% of the original principal amount of $265.0 million by the fifth year, with the final payment due on April 7, 2016. The applicable margin for the old term loan B facility was based on our total consolidated net leverage ratio as determined in the most recently delivered financial statements at such time, with the respective margins ranging from 2.75% to 3.00% for Eurocurrency loans and 1.75% to 2.00% for ABR loans. However, at no time could the Eurocurrency Rate or the ABR be less than 1.25%. The old term loan B facility amortized in equal quarterly installments of 0.25% of the original principal amount of $350.0 million. The remaining balance was due on April 7, 2017.
The old revolving credit facility would have expired on April 7, 2016. The applicable margin was based on the total net leverage ratio as determined in the most recently delivered financial statements at such time, with the respective margins ranging from 1.25% to 2.25% for the ABR loans and 2.25% to 3.25% for the Eurocurrency loans. From September 30, 2012 through December 7, 2012, we paid $0.1 million in commitment fees for this line of credit.
UK Line of Credit
As of September 30, 2015, our subsidiary, Wesco Aircraft Europe, Ltd, has available a £7.0 million ($10.6 million based on the September 30, 2015 exchange rate) line of credit that automatically renews annually on October 1. The line of credit bears interest based on the base rate plus an applicable margin of 1.65%. As of September 30, 2015, the full £7.0 million was available for borrowing under the UK Line of Credit without breaching any covenants contained in the agreements governing our indebtedness.
Cash Flows
A summary of our operating, investing and financing activities are shown in the following table (in thousands):
|
|
|
Years Ended September 30, |
| |||||||
|
Consolidated statements of cash flows data: |
|
2015 |
|
2014 |
|
2013 |
| |||
|
|
|
|
|
|
|
|
| |||
|
Net cash provided by operating activities |
|
$ |
141,172 |
|
$ |
53,689 |
|
$ |
84,829 |
|
|
|
|
|
|
|
|
|
| |||
|
Net cash used in investing activities |
|
(9,864 |
) |
(571,503 |
) |
(7,882 |
) | |||
|
|
|
|
|
|
|
|
| |||
|
Net cash (used in) provided by financing activities |
|
(150,696 |
) |
543,035 |
|
(58,098 |
) | |||
Operating Activities
Our operating activities generated $141.7 million of cash in the year ended September 30, 2015, an increase of $88.0 million as compared to the year ended September 30, 2014. During the year ended September 30, 2015, net loss adjusted for non-cash items provided cash of $119.8 million. During the year ended September 30, 2014, net income adjusted for non-cash items provided cash of $143.4 million. This decrease of $23.6 million of cash generated from results of operations is due primarily to a lower gross profit and higher selling, general and administrative expenses. The $23.6 million decrease is more than offset by higher cash generated by working capital of $93.0 million, taxes of $10.3 million, and accrued expenses and other liabilities of $12.3 million, partially offset by a use of cash of $4.5 million from prepaid expenses.
Working capital improvement was due primarily to higher cash generated by accounts receivable of $82.4 million, driven by improved cash collections and lower net sales, and $23.7 million lower in inventory investment during the year ended September 30, 2015 as compared to the year ended September 30, 2014, partially offset by a use of cash of $13.1 million from accounts payable.
Our operating activities generated $53.7 million of cash in the year ended September 30, 2014, a decrease of $31.1 million as compared to the year ended September 30, 2013. This decrease was primarily the result of a $16.2 million use of cash related to accounts payable due to the timing of payments and inventory receipts, as well as $16.9 million use of cash related to income tax receivable as a result of the prior year receivable being depleted and consequently requiring payments to be made in the year ended September 30, 2015. Other drivers of the decrease in cash from operating activities were a $11.6 million increase in the change in accounts receivables driven by an increase in sales of $22.9 million, or 9.8%, during the three months ended September 30, 2014 (exclusive of the Haas acquisition) as compared to the three months ended September 30, 2013. Offsetting these decreases was a $17.6 million decrease in the change in inventory driven by higher sales during the three months ended September 30, 2014 as compared to the three months ended September 30, 2013.
Investing Activities
Our investing activities used $9.9 million, $571.5 million and $7.9 million of cash in the years ended September 30, 2015, 2014 and 2013, respectively. During the year ended September 30, 2014, $560.2 million was used for the Haas acquisition. The remaining amounts in the years ended September 30, 2015, 2014, and 2013 were primarily used for investments in various capital expenditures and to purchase property and equipment.
Financing Activities
Our financing activities used $150.7 million of cash in the year ended September 30, 2015. This was primarily due to $149.8 million repayments of our long-term debt and $1.5 million repayment of our capital lease obligations.
Our financing activities generated $543.0 million of cash in the year ended September 30, 2014. This was primarily due to $565.0 million of borrowings to fund the Haas acquisition. Other drivers were $10.2 million in excess tax benefit related to stock options exercised and $9.6 million of proceeds received in connection with the exercise of stock options. These amounts were partially offset by $10.2 million of financing fees paid in connection with the borrowings to fund the Haas acquisition, $30.3 million used to repay principal against the Credit Facilities and $1.3 million used to make principal payments under our capital lease obligations.
Our financing activities used $58.1 million of cash in the year ended September 30, 2013. These cash outflows were driven by the repayment of long-term debt of $683.0 million, $7.3 million in financing fees related to new borrowings and the cash settlement of restricted stock tax withholding of $8.5 million. The cash outflow was partially offset by $625.0 million in
new borrowings, $9.9 million related to proceeds from stock options exercised and a $6.9 million excess tax benefit related to vested restricted stock units and stock options exercised.
Contractual Obligations
The following table is a summary of contractual cash obligations at September 30, 2015 (in thousands):
|
|
|
|
|
Payments Due by Period |
| |||||||||||
|
|
|
Total |
|
< 1 Year |
|
1 - 3 Years |
|
3 - 5 Years |
|
> 5 Years |
| |||||
|
|
|
|
|
|
|
|
|
|
|
|
| |||||
|
Long-term debt obligations (1) |
|
$ |
1,063,634 |
|
$ |
28,440 |
|
$ |
522,280 |
|
$ |
30,912 |
|
$ |
482,002 |
|
|
Capital lease obligations |
|
3,285 |
|
1,072 |
|
1,413 |
|
467 |
|
333 |
| |||||
|
Operating lease obligations |
|
43,536 |
|
11,105 |
|
16,273 |
|
8,954 |
|
7,204 |
| |||||
|
|
|
|
|
|
|
|
|
|
|
|
| |||||
|
Total by period |
|
|
1,110,455 |
|
$ |
40,617 |
|
$ |
539,966 |
|
$ |
40,333 |
|
$ |
489,539 |
|
|
|
|
|
|
|
|
|
|
|
|
|
| |||||
|
Other long-term liabilities (uncertainty in the timing of future payments) (2) |
|
37,853 |
|
|
|
|
|
|
|
|
| |||||
|
|
|
|
|
|
|
|
|
|
|
|
| |||||
|
Total |
|
$ |
1,148,308 |
|
|
|
|
|
|
|
|
| ||||
(1) Includes both principal and estimated variable interest expense payments. The interest rate used to calculate the estimated future variable interest expense is based on the actual interest rate applicable to the Company’s indebtedness as of September 30, 2015, which was 2.72% for the term loan A and 3.25% for the term loan B. The actual variable interest expense paid by the Company in the future may vary from what is presented above. Investors should refer to the “Management’s Discussion and Analysis of Financial Condition and Results of Operations—Liquidity and Capital Resources—Credit Facilities—Senior Secured Credit Facilities” and “Quantitative and Qualitative Disclosures About Market Risk—Interest Rate Risk” for additional information.
(2) Other long-term liabilities primarily include long-term hedge liabilities, noncurrent income taxes payable and noncurrent deferred tax liabilities. Due to the uncertainty in the timing of future payments, long-term hedge liabilities of approximately $4.1 million, uncertain tax positions of approximately $3.1 million and noncurrent deferred tax liabilities of approximately $30.7 million were presented as one aggregated amount in the total column on a separate line in this table.
Off-Balance Sheet Arrangements
We are not a party to any off-balance sheet arrangements.
Recently Issued and Adopted Accounting Pronouncements
See Note 3 of the Notes to Consolidated Financial Statements in Part II, Item 8 of this Annual Report on Form 10-K for a summary of recently issued and adopted accounting pronouncements.
ITEM 7A. QUANTITATIVE AND QUALITATIVE DISCLOSURES ABOUT MARKET RISKS
Our exposure to market risk consists of foreign currency exchange rate fluctuations, changes in interest rates and fluctuations in fuel prices.
Foreign Currency Exposure
Foreign Currency Translation
During the years ended September 30, 2015 and 2014, 20% of our net sales were made by our foreign subsidiaries, and our total non-U.S. net sales represented 34% and 43%, respectively, of our total net sales. As a result of these international operating activities, we are exposed to risks associated with changes in foreign currency exchange rates, principally foreign currency exchange rates between the U.S. dollar, British pound, the Euro, Canadian dollar and the Mexican peso.
The results of operations of our foreign subsidiaries are translated into U.S. dollars at the average foreign currency exchange rate for each relevant period. This translation has no impact on our cash flow. However, as foreign currency exchange rates change, there are changes to the U.S. dollar equivalent of sales and expenses denominated in foreign currencies. Any adjustments resulting from the translation are recorded in accumulated other comprehensive income on our statements of changes in stockholders’ equity. We do not consider the risk associated with foreign currency exchange rate fluctuations to be material to our financial condition or results of operations.
A hypothetical 10% decrease in the value of the British pound, the Euro, the Canadian dollar and the Mexican peso relative to the U.S. dollar would have impacted our consolidated net loss with an increase of $1.5 million, a decrease of $0.4 million, no change and an increase of $0.2 million, respectively, during the year ended September 30, 2015. A hypothetical 10% increase in the value of the British pound, the Euro, the Canadian dollar and the Mexican peso relative to the U.S. dollar would have impacted our consolidated net loss with a decrease of $1.5 million, an increase of $0.4 million, no change and an decrease of $0.2 million, respectively, during the year ended September 30, 2015.
Foreign Currency Transactions
Foreign currency transaction exposure arises where actual sales and purchases are made by a company in a currency other than its own functional currency. During the year ended September 30, 2015, our subsidiaries in the United Kingdom had sales in U.S. dollars and Euros of $161.3 million and €7.6 million (equivalent of $8.7 million), respectively, and had purchases in U.S. dollars and Euros of $91.1 million and €26.1 million (equivalent of $30.0 million), respectively. During the year ended September 30, 2014, our subsidiaries in the United Kingdom had sales in U.S. dollars and Euros of $231.0 million and €9.5 million (equivalent of $12.9 million), respectively, and had purchases in U.S. dollars and Euros of $128.0 million and €32.2 million (equivalent of $43.7 million), respectively. During the year ended September 30, 2015, our subsidiary in Canada had sales in Canadian dollars of $5.4 million (equivalent of $4.4 million) and had purchases in Canadian dollars of $0.5 million (equivalent of $0.4 million). During the year ended September 30, 2014, our subsidiary in Canada had sales in Canadian dollars of $4.8 million (equivalent of $4.4 million) and had purchases in Canadian dollars of $0.3 million (equivalent of $0.3 million). During the year ended September 30, 2015, our subsidiaries in Mexico and Israel had purchases in U.S. dollars of $71.9 million and purchases in Israeli shekels of $27.7 million (equivalent of $7.1 million). During the year ended September 30, 2014, our subsidiaries in Mexico and Israel had purchases in U.S. dollars of $8.0 million and purchases in Israeli shekels of 20.4 million (equivalent of $5.8 million). To the extent possible, we structure arrangements where the purchase transactions are denominated in U.S. dollars in order to minimize near-term exposure to foreign currency exchange rate fluctuations.
From September 30, 2014 to September 30, 2015, the U.S. dollar strengthened slightly against the pound by $0.15 (from $1.66 to $1.51). From September 30, 2013 to September 30, 2014, the U.S. dollar weakened against the pound by $0.10 (from $1.56 to $1.66). A strengthening of the U.S. dollar means we realize a lesser amount of U.S. dollar revenue on sales that were denominated in British pounds, whereas a weakening of the U.S. dollar means we realize a greater amount of U.S. dollar revenue on sales that were denominated in British pounds. As a result of the slight movement of the U.S. dollar during the years ended September 30, 2015 and 2014, transactions denominated in foreign currencies did not have a material impact on our financial results during those periods. A hypothetical 10% increase or decrease in the value of the British pound relative to the U.S. dollar would have resulted in an increase or decrease in our net income of $1.3 million, during the year ended September 30, 2015, attributable to our transactions denominated in foreign currencies.
We have historically entered into currency forward and option contracts to limit exposure to foreign currency exchange rate changes and will continue to monitor our exposure to foreign currency exchange rate changes. Gains and losses on these contracts are deferred until the transaction being hedged is finalized. As of September 30, 2015, we had no outstanding currency forward and option contracts. We do not enter into currency forward and option contracts for trading or speculative purposes.
Interest Rate Risk
Our principal interest rate exposure relates to our Credit Facilities, which bear interest at a variable rate. See Part II, Item 7. “Management’s Discussion and Analysis of Financial Condition and Results of Operations—Liquidity and Capital Resources—Credit Facilities—Senior Secured Credit Facilities.” If interest rates rise, our debt service obligations on the borrowings under the Credit Facilities would increase even though the amount borrowed remained the same, which would affect our results of operations, financial condition and liquidity. At our debt level and borrowing rates for the years ended September 30, 2015 and 2014, our interest expense, including fees under our revolving facility, was $29.1 million and $32.9 million, respectively. If variable interest rates were to change by 1.0%, our interest expense would fluctuate $9.5 million per year, without taking into account the effect of any hedging instruments.
We periodically enter into interest rate swap agreements to manage interest rate risk on our borrowing activities. In July 2015, we entered into interest rate swap agreements which effectively fix our interest rate on variable rate debt of $475.0 million to 1.21% plus the applicable margin. See further discussion on our derivative financial instruments in Note 12 of the Notes to Consolidated Financial Statements in Part II, Item 8 of this Annual Report on Form 10-K.
We do not hold or issue derivative financial instruments for trading or speculative purposes.
Fuel Price Risk
Our principal direct exposure to increases in fuel prices is as a result of potential increased freight costs caused by fuel surcharges or other fuel cost-driven price increases implemented by the third-party package delivery companies on which we rely. We estimate that our annual freight costs (which consists of in-bound and out-bound freight-related costs, net of freight revenue) during the years ended September 30, 2015 and 2014 was $23.6 million and $18.1 million, respectively, and as a result, we do not believe the impact of these potential fuel surcharges or fuel cost-driven price increases would have a material impact on our business, financial condition and results of operations. In addition, increases in fuel prices may have an indirect material adverse effect on our business, financial condition and results of operations, as such increases may contribute to decreased airline profitability and, as a result, decreased demand for new commercial aircraft that utilize the products we sell. See Part I, Item 1A. “Risk Factors—We may be materially adversely affected by high fuel prices.” We do not use derivatives to manage our exposure to fuel prices.
ITEM 8. FINANCIAL STATEMENTS AND SUPPLEMENTARY DATA
INDEX TO CONSOLIDATED FINANCIAL STATEMENTS
|
|
Page |
|
Audited Consolidated Financial Statements: |
|
|
51 | |
|
53 | |
|
54 | |
|
55 | |
|
56 | |
|
57 |
Report of Independent Registered Public Accounting Firm
To the Board of Directors and Stockholders of Wesco Aircraft Holdings, Inc.
In our opinion, the accompanying consolidated balance sheets and the related consolidated statements of comprehensive income, stockholders’ equity and cash flows present fairly, in all material respects, the financial position of Wesco Aircraft Holdings, Inc. and its subsidiaries at September 30, 2015 and September 30, 2014, and the results of their operations and their cash flows for each of the three years in the period ended September 30, 2015 in conformity with accounting principles generally accepted in the United States of America. Also in our opinion, the Company did not maintain, in all material respects, effective internal control over financial reporting as of September 30, 2015, based on criteria established in Internal Control - Integrated Framework (2013) issued by the Committee of Sponsoring Organizations of the Treadway Commission (COSO) because material weaknesses in internal control over financial reporting existed as of that date. One material weakness relates to a lack of a sufficient complement of accounting and financial reporting personnel with an appropriate level of accounting knowledge and experience commensurate with the Company’s financial reporting requirements. This material weakness contributed to additional material weaknesses as: 1) the Company did not maintain effective controls over account reconciliations and 2) the Company did not maintain controls over the integration of policies, practices and controls over the Haas business unit. A material weakness is a deficiency, or a combination of deficiencies, in internal control over financial reporting, such that there is a reasonable possibility that a material misstatement of the annual or interim financial statements will not be prevented or detected on a timely basis. The material weaknesses referred to above are described in Management’s Report on Internal Control over Financial Reporting appearing under Item 9A. We considered these material weaknesses in determining the nature, timing, and extent of audit tests applied in our audit of the September 30, 2015 consolidated financial statements, and our opinion regarding the effectiveness of the Company’s internal control over financial reporting does not affect our opinion on those consolidated financial statements. The Company’s management is responsible for these financial statements, for maintaining effective internal control over financial reporting and for its assessment of the effectiveness of internal control over financial reporting included in management’s report referred to above. Our responsibility is to express opinions on these financial statements and on the Company’s internal control over financial reporting based on our integrated audits. We conducted our audits in accordance with the standards of the Public Company Accounting Oversight Board (United States). Those standards require that we plan and perform the audits to obtain reasonable assurance about whether the financial statements are free of material misstatement and whether effective internal control over financial reporting was maintained in all material respects. Our audits of the financial statements included examining, on a test basis, evidence supporting the amounts and disclosures in the financial statements, assessing the accounting principles used and significant estimates made by management, and evaluating the overall financial statement presentation. Our audit of internal control over financial reporting included obtaining an understanding of internal control over financial reporting, assessing the risk that a material weakness exists, and testing and evaluating the design and operating effectiveness of internal control based on the assessed risk. Our audits also included performing such other procedures as we considered necessary in the circumstances. We believe that our audits provide a reasonable basis for our opinions.
A company’s internal control over financial reporting is a process designed to provide reasonable assurance regarding the reliability of financial reporting and the preparation of financial statements for external purposes in accordance with generally accepted accounting principles. A company’s internal control over financial reporting includes those policies and procedures that (i) pertain to the maintenance of records that, in reasonable detail, accurately and fairly reflect the transactions and dispositions of the assets of the company; (ii) provide reasonable assurance that transactions are recorded as necessary to permit preparation of financial statements in accordance with generally accepted accounting principles, and that receipts and expenditures of the company are being made only in accordance with authorizations of management and directors of the company; and (iii) provide reasonable assurance regarding prevention or timely detection of unauthorized acquisition, use, or disposition of the company’s assets that could have a material effect on the financial statements.
Because of its inherent limitations, internal control over financial reporting may not prevent or detect misstatements. Also, projections of any evaluation of effectiveness to future periods are subject to the risk that controls may become inadequate because of changes in conditions, or that the degree of compliance with the policies or procedures may deteriorate.
/s/ PricewaterhouseCoopers LLP
Los Angeles, California
November 30, 2015
Wesco Aircraft Holdings, Inc. and Subsidiaries
(dollars in thousands, except share and per share data)
|
|
|
As of September 30, |
| ||||
|
|
|
2015 |
|
2014 |
| ||
|
Assets |
|
|
|
|
| ||
|
Current assets: |
|
|
|
|
| ||
|
Cash and cash equivalents |
|
$ |
82,866 |
|
$ |
104,775 |
|
|
Accounts receivable, net of allowance for doubtful accounts of $5,892 and $5,332 at September 30, 2015 and 2014, respectively |
|
253,348 |
|
301,668 |
| ||
|
Inventories |
|
701,535 |
|
754,400 |
| ||
|
Prepaid expenses and other current assets |
|
10,004 |
|
11,701 |
| ||
|
Income taxes receivable |
|
187 |
|
16,314 |
| ||
|
Deferred income taxes |
|
89,401 |
|
49,188 |
| ||
|
Total current assets |
|
1,137,341 |
|
1,238,046 |
| ||
|
Property and equipment, net |
|
46,976 |
|
49,264 |
| ||
|
Deferred financing costs, net |
|
11,248 |
|
15,602 |
| ||
|
Goodwill |
|
590,587 |
|
861,575 |
| ||
|
Intangible assets, net |
|
215,389 |
|
234,945 |
| ||
|
Deferred tax assets |
|
6,844 |
|
272 |
| ||
|
Other assets |
|
12,588 |
|
12,570 |
| ||
|
Total assets |
|
$ |
2,020,973 |
|
$ |
2,412,274 |
|
|
|
|
|
|
|
| ||
|
Liabilities and Stockholders’ Equity |
|
|
|
|
| ||
|
Current liabilities: |
|
|
|
|
| ||
|
Accounts payable |
|
$ |
149,615 |
|
$ |
159,608 |
|
|
Accrued expenses and other current liabilities |
|
38,896 |
|
31,596 |
| ||
|
Income taxes payable |
|
21,442 |
|
5,884 |
| ||
|
Capital lease obligations, current portion |
|
1,044 |
|
1,578 |
| ||
|
Long-term debt, current portion |
|
— |
|
23,437 |
| ||
|
Total current liabilities |
|
210,997 |
|
222,103 |
| ||
|
Capital lease obligations, less current portion |
|
1,824 |
|
2,606 |
| ||
|
Long-term debt, less current portion |
|
952,906 |
|
1,079,219 |
| ||
|
Deferred income taxes |
|
30,693 |
|
113,218 |
| ||
|
Other liabilities |
|
6,980 |
|
2,838 |
| ||
|
Total liabilities |
|
1,203,400 |
|
1,419,984 |
| ||
|
Commitments and contingencies |
|
|
|
|
| ||
|
Stockholders’ equity: |
|
|
|
|
| ||
|
Preferred stock, $0.001 par value per share: 50,000,000 shares authorized; no shares issued and outstanding |
|
— |
|
— |
| ||
|
Common stock, class A, $0.001 par value, 950,000,000 shares authorized, 97,538,124 and 97,010,286 shares issued and outstanding at September 30, 2015 and 2014, respectively |
|
98 |
|
97 |
| ||
|
Additional paid-in capital |
|
412,492 |
|
404,567 |
| ||
|
Accumulated other comprehensive loss |
|
(38,721 |
) |
(10,822 |
) | ||
|
Retained earnings |
|
443,704 |
|
598,448 |
| ||
|
Total stockholders’ equity |
|
817,573 |
|
992,290 |
| ||
|
Total liabilities and stockholders’ equity |
|
$ |
2,020,973 |
|
$ |
2,412,274 |
|
See the accompanying notes to the consolidated financial statements.
Wesco Aircraft Holdings, Inc. and Subsidiaries
Consolidated Statements of Comprehensive (Loss) Income
(in thousands, except per share data)
|
|
|
Years Ended September 30, |
| |||||||
|
|
|
2015 |
|
2014 |
|
2013 |
| |||
|
|
|
|
|
|
|
|
| |||
|
Net sales |
|
$ |
1,497,615 |
|
$ |
1,355,877 |
|
$ |
901,608 |
|
|
Cost of sales |
|
1,173,120 |
|
952,877 |
|
583,960 |
| |||
|
Gross profit |
|
324,495 |
|
403,000 |
|
317,648 |
| |||
|
Selling, general and administrative expenses |
|
267,089 |
|
219,066 |
|
136,846 |
| |||
|
Goodwill impairment charge |
|
263,771 |
|
— |
|
— |
| |||
|
(Loss) income from operations |
|
(206,365 |
) |
183,934 |
|
180,802 |
| |||
|
Interest expense, net |
|
(37,092 |
) |
(29,225 |
) |
(25,178 |
) | |||
|
Other income, net |
|
1,841 |
|
2,199 |
|
2,003 |
| |||
|
(Loss) income before income taxes |
|
(241,616 |
) |
156,908 |
|
157,627 |
| |||
|
Benefit (provision) for income taxes |
|
86,872 |
|
(54,806 |
) |
(52,815 |
) | |||
|
Net (loss) income |
|
(154,744 |
) |
102,102 |
|
104,812 |
| |||
|
Other comprehensive loss, net of income taxes |
|
(27,899 |
) |
(633 |
) |
(4,459 |
) | |||
|
Comprehensive (loss) income |
|
$ |
(182,643 |
) |
$ |
101,469 |
|
$ |
100,353 |
|
|
|
|
|
|
|
|
|
| |||
|
Net (loss) income per share: |
|
|
|
|
|
|
| |||
|
Basic |
|
$ |
(1.60 |
) |
$ |
1.06 |
|
$ |
1.12 |
|
|
Diluted |
|
$ |
(1.60 |
) |
$ |
1.05 |
|
$ |
1.09 |
|
|
|
|
|
|
|
|
|
| |||
|
Weighted average shares outstanding: |
|
|
|
|
|
|
| |||
|
Basic |
|
96,955,043 |
|
95,950,994 |
|
93,285,490 |
| |||
|
Diluted |
|
96,955,043 |
|
97,605,783 |
|
95,843,749 |
| |||
See the accompanying notes to the consolidated financial statements.
Wesco Aircraft Holdings, Inc. and Subsidiaries
Consolidated Statements of Stockholders’ Equity
(dollars in thousands)
|
|
|
|
|
|
|
|
|
Accumulated |
|
|
|
|
| |||||
|
|
|
|
|
|
|
Additional |
|
Other |
|
|
|
Total |
| |||||
|
|
|
Common Stock |
|
Paid-in |
|
Comprehensive |
|
Retained |
|
Shareholders’ |
| |||||||
|
|
|
Shares |
|
Amount |
|
Capital |
|
Loss |
|
Earnings |
|
Equity |
| |||||
|
Balance at September 30, 2012 |
|
92,460,824 |
|
$ |
93 |
|
$ |
359,018 |
|
$ |
(5,730 |
) |
$ |
391,534 |
|
$ |
744,915 |
|
|
Issuance of common stock |
|
2,315,859 |
|
2 |
|
9,893 |
|
— |
|
— |
|
9,895 |
| |||||
|
Excess tax benefit related to restricted stock units and stock options exercised |
|
— |
|
— |
|
6,879 |
|
— |
|
— |
|
6,879 |
| |||||
|
Stock-based compensation expense |
|
— |
|
— |
|
3,394 |
|
— |
|
— |
|
3,394 |
| |||||
|
Net income |
|
— |
|
— |
|
— |
|
— |
|
104,812 |
|
104,812 |
| |||||
|
Other comprehensive loss |
|
— |
|
— |
|
— |
|
(4,459 |
) |
— |
|
(4,459 |
) | |||||
|
Balance at September 30, 2013 |
|
94,776,683 |
|
95 |
|
379,184 |
|
(10,189 |
) |
496,346 |
|
865,436 |
| |||||
|
Issuance of common stock |
|
2,233,603 |
|
2 |
|
9,641 |
|
— |
|
— |
|
9,643 |
| |||||
|
Excess tax benefit related to restricted stock units and stock options exercised |
|
— |
|
— |
|
10,235 |
|
— |
|
— |
|
10,235 |
| |||||
|
Stock-based compensation expense |
|
— |
|
— |
|
5,507 |
|
— |
|
— |
|
5,507 |
| |||||
|
Net income |
|
— |
|
— |
|
— |
|
— |
|
102,102 |
|
102,102 |
| |||||
|
Other comprehensive loss |
|
— |
|
— |
|
— |
|
(633 |
) |
— |
|
(633 |
) | |||||
|
Balance at September 30, 2014 |
|
97,010,286 |
|
97 |
|
404,567 |
|
(10,822 |
) |
598,448 |
|
992,290 |
| |||||
|
Issuance of common stock |
|
527,838 |
|
1 |
|
822 |
|
— |
|
— |
|
823 |
| |||||
|
Settlement on restricted stock tax withholding |
|
— |
|
— |
|
(701 |
) |
— |
|
— |
|
(701 |
) | |||||
|
Excess tax shortfall related to restricted units and stock options exercised |
|
— |
|
— |
|
(87 |
) |
— |
|
— |
|
(87 |
) | |||||
|
Stock-based compensation expense |
|
— |
|
— |
|
7,891 |
|
— |
|
— |
|
7,891 |
| |||||
|
Net loss |
|
— |
|
— |
|
— |
|
— |
|
(154,744 |
) |
(154,744 |
) | |||||
|
Other comprehensive loss |
|
— |
|
— |
|
— |
|
(27,899 |
) |
— |
|
(27,899 |
) | |||||
|
Balance at September 30, 2015 |
|
97,538,124 |
|
$ |
98 |
|
$ |
412,492 |
|
$ |
(38,721 |
) |
$ |
443,704 |
|
$ |
817,573 |
|
See the accompanying notes to the consolidated financial statements.
Wesco Aircraft Holdings, Inc. and Subsidiaries
Consolidated Statements of Cash Flows
(dollars in thousands)
|
|
|
Years Ended September 30, |
| |||||||
|
|
|
2015 |
|
2014 |
|
2013 |
| |||
|
Operating activities |
|
|
|
|
|
|
| |||
|
Net (loss) income |
|
$ |
(154,744 |
) |
$ |
102,102 |
|
$ |
104,812 |
|
|
Adjustments to reconcile net income to net cash provided by operating activities: |
|
|
|
|
|
|
| |||
|
Depreciation and amortization |
|
27,726 |
|
21,402 |
|
11,380 |
| |||
|
Deferred financing costs |
|
4,354 |
|
3,300 |
|
7,788 |
| |||
|
Bad debt and sales return reserve |
|
354 |
|
965 |
|
411 |
| |||
|
Stock-based compensation expense |
|
7,891 |
|
5,507 |
|
3,394 |
| |||
|
Inventory reserves |
|
95,052 |
|
17,700 |
|
8,710 |
| |||
|
Goodwill impairment charge |
|
263,771 |
|
— |
|
— |
| |||
|
Excess tax benefit related to stock-based incentive plans |
|
(443 |
) |
(10,235 |
) |
(6,879 |
) | |||
|
Income from equity investment |
|
(596 |
) |
(141 |
) |
— |
| |||
|
Deferred income taxes |
|
(127,035 |
) |
8,273 |
|
9,941 |
| |||
|
Other non-cash items |
|
3,491 |
|
(5,489 |
) |
(321 |
) | |||
|
Changes in assets and liabilities: |
|
|
|
|
|
|
| |||
|
Accounts receivable |
|
43,841 |
|
(38,545 |
) |
(26,972 |
) | |||
|
Income tax receivable |
|
16,036 |
|
19,003 |
|
35,952 |
| |||
|
Inventories |
|
(48,977 |
) |
(72,702 |
) |
(81,273 |
) | |||
|
Prepaid expenses and other assets |
|
1,250 |
|
5,799 |
|
(3,335 |
) | |||
|
Accounts payable |
|
(9,992 |
) |
3,099 |
|
19,330 |
| |||
|
Accrued expenses and other liabilities |
|
3,425 |
|
(8,830 |
) |
1,071 |
| |||
|
Income tax payable |
|
15,768 |
|
2,481 |
|
820 |
| |||
|
Net cash provided by operating activities |
|
141,172 |
|
53,689 |
|
84,829 |
| |||
|
|
|
|
|
|
|
|
| |||
|
Investing activities |
|
|
|
|
|
|
| |||
|
Purchase of property and equipment |
|
(9,631 |
) |
(10,517 |
) |
(7,882 |
) | |||
|
Proceeds from sales of property, plant and equipment |
|
17 |
|
— |
|
— |
| |||
|
Acquisitions of business, net of cash acquired |
|
(250 |
) |
(560,986 |
) |
— |
| |||
|
Net cash used in investing activities |
|
(9,864 |
) |
(571,503 |
) |
(7,882 |
) | |||
|
|
|
|
|
|
|
|
| |||
|
Financing activities |
|
|
|
|
|
|
| |||
|
Proceeds from issuance of long-term debt |
|
— |
|
565,000 |
|
625,000 |
| |||
|
Repayments of long-term debt |
|
(149,750 |
) |
(30,344 |
) |
(683,000 |
) | |||
|
Financing fees |
|
— |
|
(10,161 |
) |
(7,274 |
) | |||
|
Repayment of capital lease obligations |
|
(1,511 |
) |
(1,338 |
) |
(1,146 |
) | |||
|
Excess tax benefit related to stock-based incentive plans |
|
443 |
|
10,235 |
|
6,879 |
| |||
|
Net proceeds from issuance of common stock |
|
823 |
|
9,643 |
|
9,895 |
| |||
|
Settlement on restricted stock tax withholding |
|
(701 |
) |
— |
|
(8,452 |
) | |||
|
Net cash (used in) provided by financing activities |
|
(150,696 |
) |
543,035 |
|
(58,098 |
) | |||
|
|
|
|
|
|
|
|
| |||
|
Effect of foreign currency exchange rate on cash and cash equivalents |
|
(2,521 |
) |
838 |
|
(989 |
) | |||
|
Net (decrease) increase in cash and cash equivalents |
|
(21,909 |
) |
26,059 |
|
17,860 |
| |||
|
Cash and cash equivalents, beginning of period |
|
104,775 |
|
78,716 |
|
60,856 |
| |||
|
Cash and cash equivalents, end of period |
|
$ |
82,866 |
|
$ |
104,775 |
|
$ |
78,716 |
|
Supplemental disclosure of cash flow information (see Note 19)
See the accompanying notes to the consolidated financial statements.
Wesco Aircraft Holdings, Inc. & Subsidiaries
Notes to the Consolidated Financial Statements
Note 1. Organization and Business
Our company, Wesco Aircraft Holdings, Inc., is a distributor and provider of comprehensive supply chain management services to the global aerospace industry. Our services range from traditional distribution to the management of supplier relationships, quality assurance, kitting, just-in-time (JIT) delivery, and point-of-use inventory management.
In addition to the central stocking facilities, we use a network of forward-stocking locations to service its customers in a JIT and or ad hoc manner. There are over 60 stocking locations around the world with concentrations in North America and Europe. In addition to product fulfillment, we also provide comprehensive supply chain management services for selected customers. These services include procurement and JIT inventory management and delivery services.
On February 28, 2014, we acquired 100% of the outstanding stock of Haas. The acquired assets and liabilities assumed have been recorded at fair value for the interests acquired.
Note 2. Basis of Presentation and Summary of Significant Accounting Policies
Principles of Consolidation
The accompanying consolidated financial statements include the accounts of Wesco Aircraft Hardware, Wesco Aircraft Europe, Flintbrook Limited, Wesco Aircraft Germany GmbH, Wesco Aircraft France SAS, Wesco Aircraft Israel Limited, Wesco Aircraft Italy SRL, Wesco Aircraft Hardware India Pvt., Limited, Wesco Aircraft Trading Shanghai Co., Limited, Interfast Europe Limited, Interfast USA Inc., Interfast USA Holdings Inc. and Haas. All intercompany accounts and transactions have been eliminated. When we do not have a controlling interest in an entity, but exert significant influence over the entity, we apply the equity method of accounting.
Use of Estimates in Preparation of Financial Statements
The preparation of financial statements, in conformity with accounting principles generally accepted in the United States of America, requires management to make estimates and assumptions that affect the reported amounts of assets and liabilities and the disclosure of contingent assets and liabilities at the date of the financial statements and the reported amounts of revenues and expenses during the reporting period. Estimates are used for, but not limited to, receivable valuations and allowance for sales returns, inventory valuations of excess and obsolescence (E&O) inventories, the useful lives of long-lived assets including property, equipment and intangible assets, annual goodwill impairment assessment, stock-based compensation, income taxes and contingencies. Actual results could differ from such estimates.
Revision of Consolidated Statements of Stockholders’ Equity
On September 28, 2012, we were scheduled to deliver 5,604,338 shares of our common stock to certain employees and former employees in satisfaction of the terms of restricted stock unit awards (RSU’s) that had been granted in connection with our Company’s recapitalization with The Carlyle Group in 2006. We elected to pay $8,452,000 in cash, in lieu of the delivery of 626,225 shares, pursuant to the terms of the applicable equity incentive plan. The $8,452,000 was remitted to satisfy a portion of the RSU holders’ minimum tax withholding liabilities on October 3, 2012 and recorded as our treasury stock, which reduced our stockholders’ equity balance.
In connection with this transaction, we reported an addition to our shareholders’ common stock shares of 5,604,338 for the year ended September 30, 2012, resulting in an overstatement of our common stock by 626,225 shares, an understatement of our current liability and an overstatement of our additional paid in capital (APIC) by $8,452,000, and an overstatement of our total stockholders’ equity by $8,452,000 in our consolidated balance sheet and consolidated statement of stockholders’ equity as of September 30, 2012. This error had no effect on our consolidated total assets and consolidated total liabilities and stockholders’ equity as of September 30, 2012, and no effect on our consolidated statements of comprehensive income and consolidated statement of cash flow for the year ended September 30, 2012.
After remitting the $8,452,000 to satisfy the RSU holders’ minimum tax withholding liabilities on October 3, 2012, we recorded the $8,452,000 as our treasury stock, which reduced our total stockholders’ equity by such amount in our consolidated balance sheet and consolidated statement of stockholders’ equity as of September 30, 2013. As a result, our total stockholders’ equity was correctly stated with an overstated APIC offset by an overstated treasury stock.
We have revised the balance of our consolidated statement of equity as of September 30, 2012 and reduced our treasury stock to zero. The treasury stock transaction was eliminated to correctly state the shareholders’ equity as of September 30, 2013, which was rolled forward to correctly present our consolidated statement of equity as of September 30, 2014.
Revision of Statements of Comprehensive Income
In the three months ended September 30, 2015, we determined that certain personnel costs incurred pursuant to certain service contracts were charged to selling, general and administrative expenses rather than to cost of sales. We have revised our statements of comprehensive income to properly state such selling, general and administrative expenses as cost of sales. We misclassified expenses of $15,432,000, and $4,651,000 for the years ended September 30, 2014 and 2013, respectively. The expenses misclassified for North America were $14,046,000, and $3,637,000 for the years ended September 30, 2014 and 2013, respectively. The expenses misclassified for Rest of World were $1,386,000, and $1,014,000 for the years ended September 30, 2014 and 2013, respectively. These misclassifications had no effect on previously reported income from operations, net income or cash flows for the years ended September 30, 2014 and 2013 and the interim periods within those years. We have evaluated these misclassifications and do not believe they are material to any prior periods.
Cash and Cash Equivalents
We consider all highly liquid investments with original maturities from date of purchase of three months or less to be cash equivalents.
Accounts Receivable
Accounts receivable consist of amounts owed to us by customers. We perform periodic credit evaluations of the financial condition of our customers, monitor collections and payments from customers, and generally do not require collateral. Accounts receivable are generally due within 30 to 60 days. We provide for the possible inability to collect accounts receivable by recording an allowance for doubtful accounts. We reserve for an account when it is considered to be uncollectible. We estimate our allowance for doubtful accounts based on historical experience, aging of accounts receivable and information regarding the creditworthiness of our customers. To date, losses have been within the range of management’s expectations. If the estimated allowance for doubtful accounts subsequently proves to be insufficient, additional allowances may be required.
Our allowance for doubtful accounts activity consists of the following (in thousands):
|
Allowance for Doubtful Accounts |
|
Balance at |
|
Charges to |
|
Write-offs |
|
Balance at |
| ||||
|
Year ended as of September 30, 2015 |
|
$ |
5,332 |
|
$ |
1,121 |
|
$ |
(561 |
) |
$ |
5,892 |
|
|
Year ended as of September 30, 2014 |
|
4,464 |
|
1,159 |
|
(291 |
) |
5,332 |
| ||||
|
Year ended as of September 30, 2013 |
|
4,067 |
|
714 |
|
(317 |
) |
4,464 |
| ||||
Inventories
Inventories are stated at the lower of cost or market. The method by which amounts are removed from inventory are weighted average cost for all inventory, except for chemical parts for which the first-in, first-out method is used. In-bound freight-related costs of $1,662,000, $1,440,000 and $0 as of September 30, 2015, 2014, and 2013, respectively, are included as part of the cost of inventory held for resale. We record provisions, as appropriate, to write-down E&O inventory to estimated net realizable value. The process for evaluating E&O inventory utilizes factors such as historical demand and current inventory quantities, and subjective judgments and estimates concerning future sales levels, quantities and prices at which such inventories will be able to be sold in the normal course of business. During the year ended September 30, 2015, we charged $33,000,000 and $62,052,000 to cost of sales for impairment of inventory to net realizable value and for increases in our E&O reserve and related items, respectively, as further described below.
In the fourth quarter of 2015, we determined that inventory previously purchased in connection with a specific program which was subsequently terminated, to have no alternative use. During the year ended September 30, 2015, we continued to negotiate a sale of such inventory with our customer for whom such inventory was purchased, as well as market the inventory through other channels, and believed the full cost of this inventory was recoverable. However, in the fourth quarter of 2015, we determined such inventory was not marketable and recorded a reduction in net realizable value of $33,000,000.
In the fourth quarter of 2015, management implemented a new strategy of providing integrated supply chain services more tailored to customer demand through long-term contracts and focused forecasted consumption including changes to our inventory purchasing strategy, holding inventory for shorter periods and the planned scrapping of long dated inventory. The new strategy and updates for fiscal 2015 sales activities led to changes in the sell through rates, holding period of aged inventory and others estimates used in the E&O reserve for our hardware inventory, which increased our E&O inventory reserves by $43,800,000.
Property and Equipment
Property and equipment are stated at cost, less accumulated amortization and depreciation, computed using the straight-line method over the estimated useful life of each asset. Leasehold improvements are amortized over the lesser of the remaining lease term or the estimated useful life of the assets. Expenditures for repair and maintenance costs are expensed as incurred, and expenditures for major renewals and improvements are capitalized. When assets are retired or otherwise disposed of, the cost and accumulated depreciation and amortization are removed from the accounts and any gain or loss is reflected in the consolidated statements of comprehensive income. The useful lives for depreciable assets are as follows:
|
Buildings and improvements |
|
1 - 39.5 years |
|
Machinery and equipment |
|
5 - 7 years |
|
Furniture and fixtures |
|
7 years |
|
Vehicles |
|
5 years |
|
Computer hardware and software |
|
3 years |
Impairment of Long-Lived Assets
We assess potential impairments of our long-lived assets whenever events or changes in circumstances indicate that the carrying value of the assets may not be recoverable. Factors we consider include, but are not limited to: significant underperformance relative to expected historical or projected future operating results; significant changes in the manner of use of the acquired assets or the strategy for the overall business; and significant negative industry or economic trends. We have determined that our asset group for impairment testing is comprised of the assets and liabilities of each of our reporting units, which consists of North America Hardware, Rest of World Hardware, North America Chemical and Rest of World Chemical, as this is the lowest level of identifiable cash flows. We have identified customer relationships as the primary asset because it is the principal asset from which the reporting units derive their cash flow generating capacity and has the longest remaining useful life. Recoverability is assessed by comparing the carrying value of the asset group to the undiscounted cash flows expected to be generated by these assets. Impairment losses are measured as the amount by which the carrying values of the primary assets exceed their fair values. To date, we have not recognized an impairment charge related to the write-down of long-lived assets.
Deferred Financing Costs
Deferred financing costs are amortized using the effective interest method over the term of the related credit arrangement; such amortization is included in interest expense in the consolidated statements of comprehensive income. Amortization of deferred financing costs was $4,354,000, $3,300,000 and $7,788,000 for the years ended September 30, 2015, 2014 and 2013, respectively. As of September 30, 2015 and 2014, the remaining unamortized deferred financing costs are $11,248,000 and $15,602,000, respectively.
Goodwill and Indefinite-Lived Intangible Assets
Goodwill, which represents the excess of the consideration paid over the fair value of the net assets acquired in a business combination, and other acquired intangible assets with indefinite lives are not amortized, but are tested for impairment at least annually or more frequently when an event occurs or circumstances change such that it is more likely than not that the carrying amount may be impaired. Such events or circumstances may be a significant change in business climate, economic and industry trends, legal factors, negative operating performance indicators, significant competition, changes in strategy, or disposition of a reporting unit or a portion thereof. Goodwill and indefinite-lived intangibles asset impairment testing is performed at the reporting unit level on July 1 of each year. Our reporting units are one level below our operating segments.
We test goodwill for impairment by performing a qualitative process, or a two-step quantitative assessment process. The first step of the quantitative process involves comparing the carrying value of net assets, including goodwill, to the fair value of the reporting unit. If the fair value exceeds its carrying amount, goodwill is not considered impaired and the second step of the process is unnecessary. If the carrying amount of a reporting unit’s goodwill exceeds its fair value, the second step measures the impairment loss, if any.
The second step compares the implied fair value of goodwill with the carrying amount of that goodwill. The implied fair value of goodwill is determined in the same manner as the amount of goodwill recognized in a business combination. The implied fair value of the reporting unit’s goodwill is calculated by creating a hypothetical balance sheet as if the reporting unit had just been acquired. This balance sheet contains all assets and liabilities recorded at fair value (including any intangible assets that may not have any corresponding carrying value in our balance sheet). The implied value of the reporting unit’s goodwill is calculated by subtracting the fair value of the net assets from the fair value of the reporting unit. If the carrying value of goodwill exceeds the implied fair value of that goodwill, an impairment loss is recognized in an amount equal to that excess. We performed our goodwill impairment tests for the years ended September 30, 2015, 2014 and 2013, which resulted in a goodwill impairment charge of $263,771,000 in the year ended September 30, 2015 for our North America Hardware reporting unit. Refer to Note 8 for additional information.
Indefinite-lived intangibles consist of a trademark, for which we estimate fair value and compare such fair value to the carrying amount. If the carrying amount of the trademark exceeds its fair value, an impairment loss is recognized in an amount equal to that excess.
Fair Value of Financial Instruments
Fair value is the price that would be received to sell an asset or paid to transfer a liability in an orderly transaction between market participants at the measurement date. To determine fair value, we primarily utilize reported market transactions and discounted cash flow analyses. We use a three tier fair value hierarchy that maximizes the use of observable inputs and minimizes the use of unobservable inputs. Observable inputs are inputs that reflect the assumptions market participants would use in pricing the asset or liability developed based on market data obtained from sources independent of us. Unobservable inputs are inputs that reflect our own assumptions about the assumptions market participants would use in pricing the asset or liability developed based on the best information available in the circumstances. The fair value hierarchy prioritizes the inputs to valuation techniques into three broad levels whereby the highest priority is given to Level 1 inputs and the lowest to Level 3 inputs. The three broad categories are:
|
Level 1: |
|
Quoted prices in active markets for identical assets or liabilities. |
|
Level 2: |
|
Inputs other than quoted prices that are observable for the asset or liability, either directly or indirectly. |
|
Level 3: |
|
Unobservable inputs for the asset or liability. |
The definition of fair value includes the consideration of nonperformance risk. Nonperformance risk refers to the risk that an obligation (either by a counterparty or us) will not be fulfilled. For financial assets traded in an active market (Level 1),
the nonperformance risk is included in the market price. For certain other financial assets and liabilities (Level 2 and 3), our fair value calculations have been adjusted accordingly.
Fair value measurements are classified according to the lowest level input or value-driver that is significant to the valuation. A measurement may therefore be classified within Level 3 even though there may be significant inputs that are readily observable.
We use observable market-based inputs to calculate fair value of our interest rate swap agreements and outstanding debt instruments, in which case the measurements are classified within Level 2. If quoted or observable market prices are not available, fair value is based upon internally developed models that use, where possible, current market-based parameters such as interest rates, yield curves and currency rates. These measurements are classified within Level 3.
Where available, we utilize quoted market prices or observable inputs rather than unobservable inputs to determine fair value.
Derivative Financial Instruments
We periodically enter into cash flow derivative transactions, such as interest rate swap agreements, to hedge exposure to various risks related to interest rates. We recognize all derivatives at their fair value as either assets or liabilities. For cash flow designated hedges, the effective portion of the changes in fair value of the derivative contract are recorded in accumulated other comprehensive income (loss), net of taxes, and are recognized in net earnings at the time earnings are affected by the hedged transaction. Adjustments to record changes in fair values of the derivative contracts that are attributable to the ineffective portion of the hedges, if any, are recognized in earnings. We present derivative instruments in our consolidated statements of cash flows’ operating, investing, or financing activities consistent with the cash flows of the hedged item.
Comprehensive Loss or Income
Comprehensive loss or income generally represents all changes in stockholders’ equity, except those resulting from investments by or distributions to stockholders. Our comprehensive loss or income consists of foreign currency translation adjustments and fair value adjustments for cash flow hedges.
Revenue Recognition
We recognize product and service revenue when (1) persuasive evidence of an arrangement exists, (2) title transfers to the customer, (3) the sales price charged is fixed or determinable, and (4) collection is reasonably assured. In instances where title does not pass to the customer upon shipment, we recognize revenue upon delivery or customer acceptance, depending on the terms of the sales contract.
In connection with the sales of our products, we often provide certain supply chain management services to our JIT customers. These services include the timely replenishment of products at the customer site, while also minimizing the customer’s on-hand inventory. We provide these services contemporaneously with the delivery of the product, and as such, once the product is delivered, we do not have a post-delivery obligation to provide services to the customer. Accordingly, the price of such services is generally included in the price of the products delivered to the customer, and revenue is recognized upon delivery of the product, at which point we have satisfied our obligations to the customer. We do not account for these services as a separate element, as the services do not have stand-alone value and cannot be separated from the product element of the arrangement. Additionally, we do not present service revenues apart from product revenues, as the service revenues represent less than 10% of our consolidated net sales.
We report revenue on a gross or net basis, based on management’s assessment of whether we act as a principal or agent in the transaction, in our presentation of net sales and costs of sales. If we are the principal in the transaction and have the risks and rewards of ownership, the transactions are recorded as gross in the consolidated statements of comprehensive income. If we do not act as a principal in the transaction, the transactions are recorded on a net basis in the consolidated statements of comprehensive income. The majority of our revenue is recorded on a gross basis with the exception of certain gas, energy and chemical manager service contracts that are recorded as net revenue.
We also enter into sales rebates and profit sharing arrangements. Such customer incentives are accounted for as a reduction to gross sales and recorded based upon estimates at the time products are sold. These estimates are based upon
historical experience for similar programs and products. We review such rebates and profit sharing arrangements on an ongoing basis and accruals are adjusted, if necessary, as additional information becomes available.
We provide allowances for credits and returns based on historic experience and adjust such allowances as considered necessary. To date, such provisions have been within the range of our expectations and the allowance established. Sales tax collected from customers is excluded from net sales in the consolidated statements of comprehensive income.
In connection with our JIT supply chain management programs, at times, we assume customer inventory on a consignment basis. This consigned inventory remains the property of the customer but is managed and distributed by us. We earn a fixed fee per unit on each shipment of the consigned inventory; such amounts represent less than 1% of consolidated net sales.
Shipping and Handling Costs
We record revenue for shipping and handling billed to our customers. Shipping and handling revenues were $7,825,000, $6,951,000 and $1,304,000 for the years ended September 30, 2015, 2014 and 2013, respectively.
Shipping and handling costs are primarily included in cost of sales. Total shipping and handling costs were $33,173,000, $24,801,000 and $8,330,000 for the years ended September 30, 2015, 2014 and 2013, respectively.
Income Taxes
We recognize deferred tax liabilities and assets for the expected future tax consequences of temporary differences between the carrying amounts and the tax bases of assets and liabilities. Deferred income tax assets and liabilities are measured using enacted tax rates expected to apply to taxable income in the years in which these temporary differences are expected to be recovered or settled. The effect of a change in tax rates on deferred tax assets and liabilities is recognized in income in the period that includes the enactment date. A valuation allowance is established, when necessary, to reduce net deferred tax assets to the amount expected to be realized. The ultimate realization of deferred tax assets depends upon the generation of future taxable income during the periods in which temporary differences become deductible or includible in taxable income. We consider projected future taxable income and tax planning strategies in our assessment. Our foreign subsidiaries are taxed in local jurisdictions at local statutory rates.
Concentration of Credit Risk and Significant Vendors and Customers
We maintain our cash and cash equivalents in bank deposit accounts which, at times, may exceed federally insured limits. We have not experienced any losses in such accounts and do not believe we are exposed to any significant credit risk from cash and cash equivalents.
We purchase our products on credit terms from vendors located throughout North America and Europe. For the years ended September 30, 2015, 2014 and 2013, we made 13%, 15%, and 20%, respectively, of our purchases from Precision Castparts Corp. and the amounts payable to this vendor were 7% and 6% of total accounts payable at September 30, 2015 and 2014, respectively. Additionally, for the years ended September 30, 2015, 2014 and 2013, we made 9%, 15%, and 19%, respectively, of our purchases from Alcoa Fastening Systems and the amounts payable to this vendor were 6% and 10% of total accounts payable at September 30, 2015 and 2014, respectively. The majority of the products we sell are available through multiple channels and, therefore, this reduces the risk related to any vendor relationship.
For the years ended September 30, 2015, 2014 and 2013, we did not derive 10% or more of our total net sales from any individual customer. Government sales, which were derived from various military parts procurement agencies such as the U.S. Defense Logistics Agency, or from defense contractors buying on their behalf, comprised 14%, 9% and 2% of our net sales during fiscal 2015, 2014 and 2013, respectively.
Foreign Currency Translation and Transactions
The financial statements of foreign subsidiaries and affiliates where the local currency is the functional currency are translated into U.S. Dollars using exchange rates in effect at each period-end for assets and liabilities and average exchange rates during the period for results of operations. The adjustment resulting from translating the financial statements of such foreign subsidiaries is reflected as a separate component of stockholders’ equity. Foreign currency transaction gains and losses are reported as other income (expense), net in the consolidated statements of comprehensive income. For the years ended
September 30, 2015, 2014 and 2013, realized foreign currency transaction gains were $614,000, $1,555,000 and $1,748,000, respectively.
Stock-Based Compensation
We recognize all stock-based awards to employees and directors as stock-based compensation expense based upon their fair values on the date of grant.
We estimate the fair value of stock-based payment awards on the date of grant. The value of the portion of the award that is ultimately expected to vest is recognized as an expense during the requisite service periods. We have estimated the fair value for each option award as of the date of grant using the Black-Scholes option pricing model. The Black-Scholes option pricing model considers, among other factors, the expected life of the award and the expected volatility of our stock price. We recognize the stock-based compensation expense over the requisite service period (generally a vesting term of three years) using the graded vesting method for performance condition awards and the straight line method for service condition only awards, which is generally a vesting term of three years. Stock options typically have a contractual term of 10 years. The stock options granted have an exercise price equal to the closing stock price of our common stock on the grant date. Compensation expense for restricted stock units and awards are based on the market price of the shares underlying the awards on the grant date. Compensation expense for performance based awards reflects the estimated probability that the performance condition will be met.
Net Loss or Net Income Per Share
Basic net loss or net income per share is computed by dividing net loss or net income available to common stockholders by the weighted average number of common shares outstanding during the period. Diluted net loss or net income per share includes the dilutive effect of both outstanding stock options and restricted shares, calculated using the treasury stock method. Assumed proceeds from the in-the-money options include the tax benefits, net of shortfalls, calculated under the “as-if” method.
Note 3. Recent Accounting Pronouncements
Changes to generally accepted accounting principles in the United States (GAAP) are established by the Financial Accounting Standards Board (FASB), in the form of Accounting Standards Updates (ASUs), to the FASB’s Accounting Standards Codification.
We consider the applicability and impact of all ASUs. ASUs not listed below were assessed and determined to be either not applicable or are expected to have minimal impact on our consolidated financial position and results of operations.
New Accounting Standards Updates
In September 2015, FASB issued ASU No. 2015-16, Business Combinations (Topic 805): Simplifying the Accounting for Measurement-Period Adjustments. ASU 2015-16 requires that an acquirer recognize adjustments to provisional amounts that are identified during the measurement period in the reporting period in which the adjustment amounts are determined. ASU 2015-16 is effective for fiscal years beginning after December 15, 2015, including interim periods within those fiscal years. ASU 2015-16 should be applied prospectively to adjustments to provisional amounts that occur after the effective date of this update with earlier application permitted for financial statements that have not been issued. We are currently evaluating the impact of the adoption of ASU 2015-16 on our financial statements and disclosures.
In August 2015, the FASB issued ASU 2015-15, Interest — Imputation of Interest: Presentation and Subsequent Measurement of Debt Issuance Costs Associated with Line-of-Credit Arrangements. ASU 2015-15 states entities should present debt issuance costs as an asset, and subsequently amortize the deferred debt issuance costs ratably over the term of the line-of-credit arrangement, regardless of whether there are any outstanding borrowings on the line-of-credit arrangement. We are currently evaluating the impact of the adoption of ASU 2015-15 on our financial statements and disclosures.
In July 2015, the FASB issued ASU 2015-11, Simplifying the Measurement of Inventory, which requires an entity to measure inventory at the lower of cost and net realizable value, and eliminates current GAAP options for measuring market value. ASU 2015-11 defines realizable value as the estimated selling prices in the ordinary course of business, less reasonably predictable costs of completion, disposal, and transportation. ASU 2015-11 is effective for annual reporting periods beginning after December 15, 2016, and interim periods within those fiscal years. Early adoption is permitted for financial statements that have not been previously issued. ASU 2015-11 can only be applied prospectively. We are currently evaluating the impact of the adoption of ASU 2015-11 on our financial statements and disclosures.
In April 2015, the FASB issued ASU 2015-05, Intangibles - Goodwill and Other - Internal-Use Software (Subtopic 350-40): Customer’s Accounting for Fees Paid in a Cloud Computing Arrangement. ASU 2015-05 provides explicit guidance to help companies evaluate the accounting for fees paid by a customer in a cloud computing arrangement. The new guidance clarifies that if a cloud computing arrangement includes a software license, the customer should account for the license consistent with its accounting for other software licenses. If the arrangement does not include a software license, the customer should account for the arrangement as a service contract. ASU 2015-05 is effective for public business entities for annual periods, including interim periods within those annual periods, beginning after December 15, 2015. An entity can elect to adopt the amendments either prospectively for all arrangements entered into or materially modified after the effective date, or retrospectively. Early adoption is permitted. We are currently evaluating the impact of the adoption of ASU 2015-05 on our financial statements and disclosures.
In April 2015, the FASB issued ASU 2015-03, Interest — Imputation of Interest (Subtopic 835-30): Simplifying the Presentation of Debt Issuance Cost. The amendments in ASU 2015-03 are intended to simplify the presentation of debt issuance costs. These amendments require that debt issuance costs related to a recognized debt liability be presented in the balance sheet as a direct deduction from the carrying amount of that debt liability, consistent with debt discounts. The recognition and measurement guidance for debt issuance costs are not affected by the amendments in ASU 2015-03. ASU 2105-03 is effective for annual reporting periods beginning after December 15, 2015, and interim periods within those fiscal years. Early adoption is permitted for financial statements that have not been previously issued. We are currently evaluating the impact of the adoption of ASU 2015-03 on our financial statements and disclosures.
In August 2014, the FASB issued ASU 2014-15, Disclosure of Uncertainties about an Entity’s Ability to Continue as a Going Concern, which amends ASC Subtopic 205-40 to provide guidance about management’s responsibility to evaluate whether there is substantial doubt about an entity’s ability to continue as a going concern and to provide related disclosures. Specifically, ASU 2014-15 (1) provides a definition of the term “substantial doubt,” (2) requires an evaluation every reporting period, (3) provides principles for considering the mitigating effect of management’s plans, (4) requires certain disclosures when substantial doubt is alleviated as a result of consideration of management’s plans, (5) requires an express statement and other disclosures when substantial doubt is not alleviated, and (6) requires an assessment for a period of one year after the date that financial statements are issued. ASU 2014-15 is effective for fiscal years ending after December 15, 2016, and for annual periods and interim periods thereafter. We do not anticipate the adoption of ASU 2014-15 will have a significant impact on our consolidated financial statements.
In June 2014, the FASB issued ASU 2014-12, Compensation—Stock Compensation (Topic 718): Accounting for Share-Based Payments when the Terms of an Award Provide that a Performance Target Could Be Achieved After the Requisite Service Period. ASU 2014-12 requires that a performance target that affects vesting and that could be achieved after the requisite service period be treated as a performance condition. ASU 2014-12 is effective for annual periods and interim periods within those annual periods beginning after December 15, 2015. Earlier adoption is permitted. Entities may apply ASU 2014-12 either prospectively to all awards granted or modified after the effective date or retrospectively to all awards with performance targets that are outstanding as of the beginning of the earliest annual period presented in the financial statements and to all new or modified awards thereafter. If retrospective transition is adopted, the cumulative effect of applying this ASU as of the beginning of the earliest annual period presented in the financial statements should be recognized as an adjustment to the opening retained earnings balance at that date. Additionally, if retrospective transition is adopted, an entity may use hindsight in measuring and recognizing the compensation cost. We are currently evaluating the impact of the adoption of ASU 2014-12 on our financial statements and disclosures.
In May 2014, the FASB issued ASU 2014-09, Revenue from Contracts with Customers (Topic 606). ASU 2014-09 provides comprehensive guidance on the recognition of revenue from customers arising from the transfer of goods and services. ASU 2014-09 also provides guidance on accounting for certain contract costs, and requires new disclosures. In August 2015, the FASB issued ASU 2015-14, Revenue from Contracts with Customers (Topic 606): Deferral of the Effective Date, which deferred the effective date of ASU 2014-09 for all entities by one year. Accordingly, ASU 2014-09 is effective for annual reporting periods beginning after December 15, 2017, including interim reporting periods within that reporting period. Early adoption is permitted for annual reporting periods beginning after December 15, 2016, including interim reporting periods within that reporting period. We are currently evaluating the effect of the adoption of ASU 2014-09 on our consolidated financial statements and the implementation approach to be used.
Adopted Accounting Standards Updates
Effective July 1, 2015, we adopted ASU 2014-08, Presentation of Financial Statements and Property, Plant, and Equipment, which addresses revised guidance on reporting discontinued operations. This revised guidance defines a
discontinued operation as a disposal of a component or a group of components of an entity that represents a strategic shift that has (or will have) a major effect on the entity’s operations and financial results. ASU 2014-08 also requires additional disclosures for discontinued operations and new disclosures for individually material disposal transactions that do not meet the definition of a discontinued operation. Our adoption of ASU 2014-08 did not have a material impact on our consolidated financial statements.
Effective November 18, 2014, we adopted ASU 2014-17, Business Combinations (Topic 805): Pushdown Accounting. ASU 2014-17 provides an acquired entity with the option to apply pushdown accounting in its separate financial statements upon occurrence of an event in which an acquirer obtains control of the acquired entity. The election to apply pushdown accounting can be made either in the period in which the change of control occurred, or in a subsequent period. Our adoption of ASU 2014-08 did not have a material impact on our consolidated financial statements.
Note 4. Acquisitions
2014 Acquisition
On February 28, 2014, through our wholly owned subsidiary, Flyer Acquisition Corp., we acquired 100% of the outstanding shares of Haas, for a purchase price of $560,450,000, including the payment of an additional $250,000 in the three months ended December 31, 2014 as a result of a working capital adjustment.
The Haas acquisition was financed through a combination of a new $525,000,000 term loan B facility, cash on hand and drawings under our revolving facility. As a result of the acquisition, Haas became our wholly-owned subsidiary. We incurred transaction related costs of $6,700,000 and such costs were expensed as incurred.
Haas is a provider of chemical supply chain management services to the commercial aerospace, airline, military, energy, and other markets, helping its customers reduce costs and comply with increasingly complex regulatory requirements for chemical usage. The Haas acquisition expands our existing customer base and active stock-keeping units, while also providing us with opportunities to increase sales by leveraging and cross-selling into Wesco’s and Haas’ respective customer bases. In addition, we believe the addition of Haas’ proprietary information technology system (tcmIS), which interfaces directly with customer and supplier enterprise resource planning systems, and its experienced senior management team, will benefit Wesco going forward.
The goodwill related to the Haas acquisition represents the value paid for assembled workforce, its international geographic presence and synergies expected to arise after the acquisition. None of the goodwill resulting from the Haas acquisition is deductible for income tax purposes. On the date of acquisition, the goodwill was allocated to our reporting units based on the proportion of cash flows generated in the North America and the Rest of World segments.
We revised the purchase price allocation during the three months ended December 31, 2014 to reflect a $250,000 payment to Haas’ former owners as a result of a working capital adjustment. This adjustment resulted in an increase to goodwill of $250,000. The preliminary fair values of assets acquired and liabilities assumed on the acquisition date and the final allocations were as follows (in thousands):
|
|
|
Preliminary |
|
Final |
|
Adjustment |
| |||
|
Current assets |
|
$ |
195,351 |
|
$ |
191,232 |
|
$ |
(4,119 |
) |
|
Property and equipment |
|
20,121 |
|
19,306 |
|
(815 |
) | |||
|
Other assets |
|
13,061 |
|
11,061 |
|
(2,000 |
) | |||
|
Trademarks |
|
15,200 |
|
16,100 |
|
900 |
| |||
|
Customer relationships |
|
77,400 |
|
97,400 |
|
20,000 |
| |||
|
Technology |
|
32,400 |
|
34,400 |
|
2,000 |
| |||
|
Goodwill |
|
316,311 |
|
299,289 |
|
(17,022 |
) | |||
|
Total assets acquired |
|
669,844 |
|
668,788 |
|
(1,056 |
) | |||
|
Total liabilities assumed |
|
(109,644 |
) |
(108,338 |
) |
1,306 |
| |||
|
Purchase price, net of liabilities assumed |
|
$ |
560,200 |
|
$ |
560,450 |
|
$ |
250 |
|
The excess purchase price over the fair value of the net identifiable assets acquired was recorded as goodwill. The fair value assigned to the identifiable intangible assets acquired was based on an income approach method using assumptions and estimates derived by our management. It was determined that the Haas trademark has a 15-year estimated useful life, customer relationships have a 15-year estimated useful life and Haas’ technology has a 10-year estimated useful life. Factors considered in the determination of its useful lives include customer attrition rates, technology life cycles, and patent and trademark laws.
The results of Haas since the acquisition have been included in the consolidated financial statements and are included in the North America and Rest of World segments based on actual results of the reporting units.
Haas consolidated net sales included in the financial statements since the acquisition date were $591,824,000 and $356,154,000 in the years ended September 30, 2015 and 2014, respectively. Haas consolidated net loss or income included in the financial statements since the acquisition date was a net loss of $565,000 and a net income of $2,850,000 in the years ended September 30, 2015 and 2014, respectively.
Pro Forma Consolidated Results
The following pro forma information presents the financial results as if the acquisition of Haas had occurred on October 1, 2012. The pro forma results do not include any anticipated cost synergies, costs or other effects of the planned integration of the acquisition. Accordingly, such pro forma amounts are not necessarily indicative of the results that actually would have occurred had the acquisitions been completed on the dates indicated, nor are they indicative of future operating results. We did not have any material, nonrecurring pro forma adjustments directly attributable to the business combination in the reported pro-forma net sales and earnings (in thousands except per share data).
|
|
|
Year ended September 30, |
| ||||
|
|
|
2014 |
|
2013 |
| ||
|
Pro forma net sales |
|
$ |
1,591,538 |
|
$ |
1,462,164 |
|
|
Pro forma net income |
|
$ |
102,652 |
|
$ |
109,781 |
|
|
|
|
|
|
|
| ||
|
Pro forma net income per common share amounts: |
|
|
|
|
| ||
|
Basic net income |
|
$ |
1.07 |
|
$ |
1.18 |
|
|
Diluted net income |
|
$ |
1.05 |
|
$ |
1.15 |
|
Note 5. Inventory
Our inventory is comprised solely of finished goods.
As of September 30, 2015 and 2014, our E&O reserve was $264,114,000 and $197,188,000, respectively. We have revised the previously reported E&O reserve as of September 30, 2014 of $143,736,000 that was not correct due to a clerical error in the prior year footnote. This immaterial revision does not change the inventory amount reported on the balance sheet or the amount of E&O charges recorded in the statement of comprehensive income. Charges to cost of sales for increase in our E&O reserves and related items were $95,052,000, $17,700,000 and $8,710,000 in the years ended September 30, 2015, 2014 and 2013, respectively. We believe that these amounts appropriately reflect the risk of E&O inventory inherent in our business.
In the fourth quarter of 2015, management implemented a new strategy of providing integrated supply chain services more tailored to customer demand through long-term contracts and focused forecasted consumption including changes to our inventory purchasing strategy, holding inventory for shorter periods and the planned scrapping of long dated inventory. The new strategy and updates for fiscal 2015 sales activities led to changes in the sell through rates, holding period of aged inventory and others estimates used in the E&O reserve for our hardware inventory, which increased our E&O inventory reserves by $43,800,000.
Note 6. Related Party Transactions
We entered into a management agreement with The Carlyle Group to provide certain financial, strategic advisory and consultancy services. Under this management agreement, we are obligated to pay The Carlyle Group, or a designee thereof, an annual management fee of $1,000,000 plus fees and expenses associated with company-related meetings. We incurred expense of $1,145,000, $1,077,000 and $1,053,000 for the years ended September 30, 2015, 2014 and 2013, respectively, related to this
management agreement. These amounts were paid to The Carlyle Group during the years ended September 30, 2015, 2014 and 2013.
We lease several office and warehouse facilities under operating lease agreements from entities controlled by our former chief executive officer, who is also our Chairman of the Board. Rent expense on these facilities was $1,692,000, $1,826,000 and $1,754,000 for the years ended September 30, 2015, 2014 and 2013, respectively (see Note 17).
Note 7. Property and Equipment, net
Property and equipment, net, consist of the following at September 30 (in thousands):
|
|
|
2015 |
|
2014 |
| ||
|
Land, buildings and improvements |
|
$ |
27,152 |
|
$ |
25,817 |
|
|
Machinery and equipment |
|
17,874 |
|
16,133 |
| ||
|
Furniture and fixtures |
|
5,768 |
|
5,002 |
| ||
|
Vehicles |
|
1,339 |
|
951 |
| ||
|
Computer hardware and software |
|
33,226 |
|
26,688 |
| ||
|
Construction in progress |
|
2,186 |
|
4,347 |
| ||
|
|
|
87,545 |
|
78,938 |
| ||
|
Less: accumulated depreciation |
|
(40,569 |
) |
(29,674 |
) | ||
|
Property and equipment, net |
|
$ |
46,976 |
|
$ |
49,264 |
|
At September 30, 2015 and 2014, property and equipment included assets of $7,084,000, and $6,845,000 respectively, acquired under capital lease arrangements. Accumulated amortization of assets acquired under capital leases was $4,131,000 and $2,713,000 as of September 30, 2015 and 2014, respectively.
Depreciation and amortization expense for property and equipment was $11,777,000, $8,766,000 and $4,781,000 during the years ended September 30, 2015, 2014 and 2013, respectively (including amortization expense of $1,544,000, $1,427,000 and $1,020,000 on assets acquired under capital leases for the years ended September 30, 2015, 2014 and 2013, respectively).
Note 8. Goodwill and Intangible Assets, net
A reconciliation of our goodwill balance is as follows (in thousands):
|
|
|
North America |
|
Rest of World |
|
Consolidated |
| ||||||||||||
|
|
|
September 30, |
|
September 30, |
|
September 30, |
| ||||||||||||
|
|
|
2015 |
|
2014 |
|
2015 |
|
2014 |
|
2015 |
|
2014 |
| ||||||
|
Beginning balance |
|
$ |
779,395 |
|
$ |
555,714 |
|
$ |
82,180 |
|
$ |
6,779 |
|
$ |
861,575 |
|
$ |
562,493 |
|
|
Foreign currency translation |
|
65 |
|
— |
|
(7,532 |
) |
43 |
|
(7,467 |
) |
43 |
| ||||||
|
Haas acquisition |
|
187 |
|
223,681 |
|
63 |
|
75,358 |
|
250 |
|
299,039 |
| ||||||
|
Goodwill impairment |
|
(263,771 |
) |
— |
|
— |
|
— |
|
(263,771 |
) |
— |
| ||||||
|
Ending balance |
|
$ |
515,876 |
|
$ |
779,395 |
|
$ |
74,711 |
|
$ |
82,180 |
|
$ |
590,587 |
|
$ |
861,575 |
|
We test goodwill for impairment using a qualitative assessment process or a two-step quantitative assessment process. The first step of the quantitative assessment process involves comparing the carrying value of net assets, including goodwill, to the fair value of the reporting unit. If the fair value exceeds its carrying amount, goodwill is not considered impaired and the second step of the process is unnecessary. If the carrying amount of a reporting unit’s goodwill exceeds its fair value, the second step measures the impairment loss, if any.
The estimates of fair value of a reporting unit are determined based on a discounted cash flow analysis and market earnings multiples. A discounted cash flow analysis requires us to make various judgmental assumptions, including assumptions about future cash flows, growth rates and discount rates. The assumptions about future cash flows and growth rates are based on the forecast and long-term business plans of each reporting unit. Discount rate assumptions are based on an assessment of the risk inherent in the future cash flows of the respective reporting units. If the fair value exceeds the carrying value of a reporting unit, goodwill is not considered impaired and the second step of the test is unnecessary. If the carrying amount of a reporting unit’s goodwill exceeds the fair value of a reporting unit, the second step measures the impairment loss, if any.
The second step compares the implied fair value of goodwill with the carrying amount of that goodwill. The implied fair value of goodwill is determined in the same manner as the amount of goodwill recognized in a business combination. If the carrying amount of goodwill exceeds the implied fair value of that goodwill, an impairment loss is recognized in an amount equal to that excess.
For the North America Hardware reporting unit, we performed a Step 1 goodwill impairment test on July 1, 2012, which reflected fair value in excess of carrying value of 38.5%. Since 2012, North America Hardware has underperformed relative to the forecasts included in the Step 1 analysis; however, our Step 0 impairment test performed on July 1, 2013 and 2014 did not indicate it was more likely than not that the carrying value exceeded the fair value of the reporting unit. Through June 30, 2015, we continued to monitor North America Hardware performance relative to these forecasts.
We performed our Step 1 goodwill impairment test on July 1, 2015. The results of these tests indicated that the estimated fair values of our reporting units exceeded their carrying values, with the exception of the North America Hardware reporting unit within our North America segment. The impact of market pressures such as decreasing revenue and underperformance relative to forecast adversely impacted the fair value of this reporting unit. As a result, we proceeded to Step 2 of the goodwill impairment analysis using the most appropriate valuation methods including the income approach, and compared the implied value of North America Hardware’s goodwill with the carrying value of its goodwill, and since the carrying value exceeded the implied fair value, we recorded a non-cash impairment charge of $263,771,000 in the three months ended September 30, 2015.
As of September 30, 2015 and 2014, the gross amounts and accumulated amortization of intangible assets is as follows (in thousands):
|
|
|
2015 |
|
2014 |
| ||||||||
|
|
|
Gross |
|
Accumulated |
|
Gross |
|
Accumulated |
| ||||
|
|
|
Amount |
|
Amortization |
|
Amount |
|
Amortization |
| ||||
|
Customer relationships (12 to 20 year life) |
|
$ |
178,858 |
|
$ |
(45,057 |
) |
$ |
181,687 |
|
$ |
(33,401 |
) |
|
Trademarks (5 years to indefinite life) |
|
56,153 |
|
(3,661 |
) |
56,524 |
|
(2,372 |
) | ||||
|
Backlog (2 year life) |
|
4,327 |
|
(4,327 |
) |
4,327 |
|
(4,327 |
) | ||||
|
Non-compete agreements (3 to 4 year life) |
|
1,457 |
|
(1,457 |
) |
1,457 |
|
(1,343 |
) | ||||
|
Technology (10 year life) |
|
33,607 |
|
(4,511 |
) |
34,400 |
|
(2,007 |
) | ||||
|
Total intangible assets |
|
$ |
274,402 |
|
$ |
(59,013 |
) |
$ |
278,395 |
|
$ |
(43,450 |
) |
Estimated future intangible amortization expense at September 30, 2015 is as follows (in thousands):
|
2016 |
|
$ |
15,538 |
|
|
2017 |
|
15,538 |
| |
|
2018 |
|
15,538 |
| |
|
2019 |
|
15,538 |
| |
|
2020 |
|
15,538 |
| |
|
Thereafter |
|
99,866 |
| |
|
|
|
$ |
177,556 |
|
Amortization expense included in the statements of comprehensive income for the years ended September 30, 2015, 2014 and 2013 was $15,948,000, $12,636,000 and $6,599,000, respectively. In addition to amortizing intangibles, we assigned
an indefinite life to the Wesco Aircraft trademark. As of September 30, 2015 and 2014, the trademark had a carrying value of $37,833,000.
Note 9. Accrued Expenses and Other Current Liabilities
Accrued expenses and other current liabilities consist of the following (in thousands):
|
|
|
September 30, |
| ||||
|
|
|
2015 |
|
2014 |
| ||
|
Accrued compensation and related expenses |
|
$ |
16,054 |
|
$ |
13,894 |
|
|
Accrued commissions |
|
2,127 |
|
930 |
| ||
|
Accrual for professional fees |
|
2,438 |
|
1,417 |
| ||
|
Accrued customer rebates |
|
640 |
|
2,874 |
| ||
|
Accrued taxes (property, sales and use) |
|
1,046 |
|
3,345 |
| ||
|
Accrued interest |
|
1,241 |
|
1,434 |
| ||
|
Accrual for undermarket contracts |
|
575 |
|
3,232 |
| ||
|
Accrued profit sharing |
|
370 |
|
600 |
| ||
|
Accrued freight and duty |
|
732 |
|
867 |
| ||
|
Accrual for restructuring |
|
4,490 |
|
— |
| ||
|
Interest rate swap |
|
1,903 |
|
— |
| ||
|
Other accruals |
|
7,280 |
|
3,003 |
| ||
|
Accrued expenses and other current liabilities |
|
$ |
38,896 |
|
$ |
31,596 |
|
Note 10. Fair Value of Financial Instruments
Our financial instruments include cash and cash equivalents, accounts receivable and payable, accrued and other current liabilities and a revolving facility. The carrying amounts of these instruments approximate fair value because of their short-term maturities. The fair value of interest rate swap agreements is determined using pricing models that use observable market inputs as of the balance sheet date, a Level 2 measurement. The fair value of the long-term debt instruments is determined using current applicable rates for similar instruments as of the balance sheet date, a Level 2 measurement.
The carrying amounts and fair values of the debt instruments and interest rate swap hedge instrument were as follows (in thousands):
|
|
|
September 30, 2015 |
|
September 30, 2014 |
| ||||||||
|
|
|
Carrying Amount |
|
Fair Value |
|
Carrying Amount |
|
Fair Value |
| ||||
|
$625,000 term loan A |
|
$ |
477,344 |
|
$ |
476,150 |
|
$ |
550,781 |
|
$ |
550,781 |
|
|
$525,000 term loan B |
|
475,562 |
|
467,002 |
|
511,875 |
|
511,875 |
| ||||
|
$200,000 revolving facility |
|
— |
|
— |
|
40,000 |
|
40,000 |
| ||||
|
Interest rate swap hedge |
|
4,088 |
|
4,088 |
|
— |
|
— |
| ||||
Note 11. Long-Term Debt
Long-term debt consists of the following (in thousands):
|
|
|
September 30, |
| ||||
|
|
|
2015 |
|
2014 |
| ||
|
|
|
|
|
|
| ||
|
$625,000 term loan A |
|
$ |
477,344 |
|
$ |
550,781 |
|
|
$525,000 term loan B |
|
475,562 |
|
511,875 |
| ||
|
$200,000 revolving facility |
|
— |
|
40,000 |
| ||
|
|
|
952,906 |
|
1,102,656 |
| ||
|
Less: current portion |
|
— |
|
(23,437 |
) | ||
|
Long-term debt |
|
$ |
952,906 |
|
$ |
1,079,219 |
|
Aggregate maturities of long-term debt as of September 30, 2015 are as follows (in thousands):
|
Years Ended September 30, |
|
|
| |
|
2016 |
|
$ |
— |
|
|
2017 |
|
55,469 |
| |
|
2018 |
|
421,875 |
| |
|
2019 |
|
— |
| |
|
2020 & thereafter |
|
475,562 |
| |
|
|
|
$ |
952,906 |
|
Senior Secured Credit Facilities
Our amended credit agreement provides for (1) a $625,000,000 term loan A facility, (2) a $200,000,000 revolving credit facility and (3) a $525,000,000 senior secured term loan B facility. We refer to the term loan B facility, together with the term loan A facility and the revolving facility, as the Credit Facilities. The Credit Facilities allowed us to acquire Haas and for Wesco Aircraft Hardware to incur additional first lien indebtedness and corresponding liens to permit the incurrence of the term loan B facility and to reset certain ratios with respect to the Consolidated Total Leverage Ratio covenant applicable to the term loan A facility and the revolving facility, as further described below.
As of September 30, 2015, our outstanding indebtedness under the Credit Facilities was $952,906,000, which consisted of (1) $477,344,000 of indebtedness under the term loan A facility and (2) $475,562,000 of indebtedness under the term loan B facility. As of September 30, 2015, $200,000,000 was available for borrowing under the revolving facility without breaching any covenants contained in the agreements governing our indebtedness.
The interest rate for the term loan A facility is based on the Consolidated Total Leverage Ratio (as such ratio is defined in the Credit Facilities) as determined in the most recently delivered financial statements, with the respective margins ranging from 1.75% to 2.50% for Eurocurrency loans and 0.75% to 1.50% for alternate base rate (ABR) loans. The term loan A facility amortizes in equal quarterly installments of 1.25% of the original principal amount of $625,000,000 for the first year, escalating to quarterly installments of 2.50% of the original principal amount of $625,000,000 by the fifth year, with the balance due at maturity on December 7, 2017. As of September 30, 2015, the interest rate for borrowings under the term loan A facility was 2.72%.
The interest rate for the term loan B facility has a margin of 2.50% per annum for Eurocurrency loans (subject to a minimum Eurocurrency rate floor of 0.75% per annum) or 1.50% per annum for ABR loans (subject to a minimum ABR floor of 1.75% per annum). The term loan B facility amortizes in equal quarterly installments of 0.25% of the original principal amount of $525,000,000, with the balance due at maturity on February 28, 2021. As of September 30, 2015, the interest rate for borrowings under the term loan B facility was 3.25%.
The interest rate for the revolving facility is based on our Consolidated Total Leverage Ratio as determined in the most recently delivered financial statements, with the respective margins ranging from 1.75% to 2.50% for Eurocurrency loans and 0.75% to 1.50% for ABR loans. The revolving facility expires on December 7, 2017.
Under the terms and definitions applicable to the Credit Facilities as of September 30, 2015, our Consolidated Total Leverage Ratio (as such ratio is defined in the Credit Facilities cannot exceed 4.75 (with step-downs on such ratio during future periods) and our Consolidated Net Interest Coverage Ratio (as such ratio is defined in the Credit Facilities) cannot be less than 2.25. The Credit Facilities also contain customary negative covenants, including restrictions on our and our restricted subsidiaries’ ability to merge and consolidate with other companies, incur indebtedness, grant liens or security interests on assets, make acquisitions, loans, advances or investments, pay dividends, sell or otherwise transfer assets, optionally prepay or modify terms of any junior indebtedness or enter into transactions with affiliates. As of September 30, 2015, we were in compliance with all the foregoing covenants. Our borrowings under our Credit Facilities are guaranteed by us and all of our direct and indirect, wholly-owned, domestic restricted subsidiaries (subject to certain exceptions) and secured by a first lien on substantially all of our assets and the assets of our guarantor subsidiaries, including capital stock of the subsidiaries (in each case, subject to certain exceptions).
During the year ended September 30, 2015, we made voluntary prepayments totaling $50,000,000 on our term loan A facility and $36,313,000 on our term loan B facility, which have been applied to future required quarterly payments. We also paid off our line of credit borrowing of $40,000,000.
Our subsidiary, Wesco Aircraft Europe, Ltd, has a £7,000,000 ($10,592,000 based on the September 30, 2015 exchange rate) line of credit that automatically renews annually on October 1. The line of credit bears interest based on the base rate plus an applicable margin of 1.65%. There was no outstanding borrowing under this line of credit as of September 30, 2015.
As a result of the refinancing of our old senior secured credit facilities on December 7, 2012, we recorded a loss on extinguishment of debt in the amount of $4,960,000. The loss on early debt extinguishment was recorded as a component of interest expense, net in the consolidated statements of comprehensive income. The refinancing costs are being amortized over the term of the debt using the effective interest rate method. The deferred financing costs at the close of the transaction on December 7, 2012 totaled $11,168,000.
Note 12. Derivative Financial Instruments
We use derivative instruments primarily to manage exposures to interest rates. Our primary objective in holding derivatives is to reduce the volatility of earnings and cash flows associated with changes in interest rates. Our derivatives expose us to credit risk to the extent that the counterparties may be unable to meet the terms of the agreement. We, however, seek to mitigate such risks by limiting our counterparties to major financial institutions. In addition, the potential risk of loss with any one counterparty resulting from this type of credit risk is monitored. Management does not expect material losses as a result of defaults by counterparties.
On July 30, 2015, we entered into interest rate swap agreements, which we designated as cash flow hedges, in order to reduce our exposure to variability in cash flows related to interest payments on a portion of our outstanding debt. The first interest rate swap agreement has a notional amount of $475,000,000 giving us the contractual right to pay a fixed interest rate of 1.21% plus the applicable margin for term loan B (see Note 11 for the applicable margin), which is effective on September 30, 2015 and matures on September 30, 2017. The second interest rate swap agreement has a notional amount of $375,000,000 giving us the contractual right to pay a fixed interest rate of 2.2625% plus the applicable margin for term loan B, which is effective on September 29, 2017 and matures on September 30, 2019.
The following table provides the location and fair value amounts of our hedge instruments, which are reported in our consolidated balance sheets as of September 30, 2015 and 2014 (in thousands). We did not have any hedge instruments in the year ended September 30, 2014.
|
|
|
|
|
Fair Value as of September 30, |
| ||||
|
Liability Derivatives |
|
Balance Sheet Locations |
|
2015 |
|
2014 |
| ||
|
|
|
|
|
|
|
|
| ||
|
Interest rate swap contracts |
|
Acccrued expenses and other current liabilities |
|
$ |
1,902 |
|
$ |
— |
|
|
|
|
|
|
|
|
|
| ||
|
|
|
Other liabilities |
|
2,186 |
|
— |
| ||
The following table provides the losses of our cash flow hedge instruments which are transferred from our accumulated other comprehensive income to our consolidated statement of comprehensive (loss) income for the years ended September 30, 2015, 2014 and 2013 (in thousands). We did not have any hedge instruments in the years ended September 30, 2014 and 2013.
|
|
|
Location in Consolidated Statement |
|
Year ended September 30, |
| |||||||
|
Cash Flow Derivatives |
|
Of Comprehensive (Loss) Income |
|
2015 |
|
2014 |
|
2013 |
| |||
|
|
|
|
|
|
|
|
|
|
| |||
|
Interest rate swap contracts |
|
Interest expense, net |
|
$ |
(4 |
) |
$ |
— |
|
$ |
— |
|
The following table provides the effective portion of the losses of our cash flow hedge instruments which are recognized (net of income taxes) in other comprehensive income for the years ended September 30, 2015, 2014 and 2013 (in thousands).
|
|
|
Year ended September 30, |
| |||||||
|
Cash Flow Devivatives |
|
2015 |
|
2014 |
|
2013 |
| |||
|
|
|
|
|
|
|
|
| |||
|
Interest rate swap contracts |
|
$ |
(2,581 |
) |
$ |
— |
|
$ |
— |
|
We experienced no material hedge ineffectiveness with respect to our interest swap agreements, and expect to reclassify approximately $1,199,000 out of Accumulated other comprehensive loss and into earnings in the next 12 months when the underlying hedged item impacts earnings.
Note 13. Accumulated Other Comprehensive Loss
Changes in Accumulated other comprehensive loss by component consist of the following (in thousands):
|
|
|
Foreign |
|
Unrealized |
|
Total |
| |||
|
|
|
|
|
|
|
|
| |||
|
Balance at September 30, 2012 |
|
$ |
(5,730 |
) |
$ |
— |
|
$ |
(5,730 |
) |
|
Other Comprehensive Income |
|
(4,459 |
) |
— |
|
(4,459 |
) | |||
|
Balance at September 30, 2013 |
|
(10,189 |
) |
— |
|
(10,189 |
) | |||
|
Other Comprehensive Income |
|
(633 |
) |
— |
|
(633 |
) | |||
|
Balance at September 30, 2014 |
|
(10,822 |
) |
— |
|
(10,822 |
) | |||
|
Other Comprehensive Income before reclassifications |
|
(25,322 |
) |
(2,581 |
) |
(27,903 |
) | |||
|
Amounts reclassified from AOCI to earnings |
|
— |
|
4 |
|
4 |
| |||
|
Net current period other comprehensive income |
|
(25,322 |
) |
(2,577 |
) |
(27,899 |
) | |||
|
Balance at September 30, 2015 |
|
$ |
(36,144 |
) |
$ |
(2,577 |
) |
$ |
(38,721 |
) |
Note 14. Net (Loss) Income Per Share
The following table presents net (loss) income per share and related information (dollars in thousands):
|
|
|
Years Ended September 30, |
| |||||||
|
|
|
2015 |
|
2014 |
|
2013 |
| |||
|
|
|
|
|
|
|
|
| |||
|
Net (loss) income |
|
$ |
(154,744 |
) |
$ |
102,102 |
|
$ |
104,812 |
|
|
Basic weighted average shares outstanding |
|
96,955,043 |
|
95,950,994 |
|
93,285,490 |
| |||
|
Dilutive effect of stock options and restricted shares |
|
— |
|
1,654,789 |
|
2,558,259 |
| |||
|
Dilutive weighted average shares outstanding |
|
96,955,043 |
|
97,605,783 |
|
95,843,749 |
| |||
|
Basic net (loss) income per share |
|
$ |
(1.60 |
) |
$ |
1.06 |
|
$ |
1.12 |
|
|
Diluted net (loss) income per share |
|
$ |
(1.60 |
) |
$ |
1.05 |
|
$ |
1.09 |
|
Shares of common stock equivalents of 2,292,770, 510,800, and zero for the years ended September 30, 2015, 2014 and 2013, respectively, were excluded from the diluted calculation due to their anti-dilutive effect.
Note 15. Income Taxes
(Loss) income before benefit or provision for income taxes for the years ended September 30, 2015, 2014 and 2013 was as follows (in thousands):
|
|
|
2015 |
|
2014 |
|
2013 |
| |||
|
U.S. (loss) income |
|
$ |
(242,864 |
) |
$ |
112,841 |
|
$ |
115,194 |
|
|
Foreign income |
|
1,248 |
|
44,067 |
|
42,433 |
| |||
|
Total |
|
$ |
(241,616 |
) |
$ |
156,908 |
|
$ |
157,627 |
|
The components of our income tax (benefit) provision for the years ended September 30, 2015, 2014 and 2013 were as follows (in thousands):
|
|
|
2015 |
|
2014 |
|
2013 |
| |||
|
Current provision |
|
|
|
|
|
|
| |||
|
Federal |
|
$ |
24,797 |
|
$ |
32,204 |
|
$ |
29,366 |
|
|
State and local |
|
1,726 |
|
1,920 |
|
3,943 |
| |||
|
Foreign |
|
13,247 |
|
9,625 |
|
9,566 |
| |||
|
Subtotal |
|
39,770 |
|
43,749 |
|
42,875 |
| |||
|
Deferred provision (benefit) |
|
|
|
|
|
|
| |||
|
Federal |
|
(105,748 |
) |
9,756 |
|
8,901 |
| |||
|
State and local |
|
(12,543 |
) |
1,497 |
|
1,022 |
| |||
|
Foreign |
|
(8,351 |
) |
(196 |
) |
17 |
| |||
|
Subtotal |
|
(126,642 |
) |
11,057 |
|
9,940 |
| |||
|
(Benefit) provision for income taxes |
|
$ |
(86,872 |
) |
$ |
54,806 |
|
$ |
52,815 |
|
The tax impact associated with the exercise of employee stock options and vesting of restricted stock units were recognized in the current tax return. During the year ended September 30, 2015, a reduction to additional paid in capital of $87,000 was recorded to reflect the tax impact associated with the exercise of employee stock options and vesting of restricted stock units. During the years ended September 30, 2014 and 2013, $10,235,000 and $6,879,000 of tax benefit has been credited to additional paid in capital, respectively.
A reconciliation of our (benefit) provision for income taxes to the U.S. federal statutory rate is as follows for the years ended September 30, 2015, 2014 and 2013 (in thousands):
|
|
|
2015 |
|
2014 |
|
2013 |
| |||||||||
|
(Benefit) provision for income taxes at statutory rate |
|
$ |
(84,566 |
) |
35.00 |
% |
$ |
54,917 |
|
35.00 |
% |
$ |
55,169 |
|
35.00 |
% |
|
State taxes, net of tax benefit |
|
(7,002 |
) |
2.90 |
|
2,221 |
|
1.42 |
|
3,228 |
|
2.05 |
| |||
|
Deemed foreign dividends |
|
4,289 |
|
(1.78 |
) |
7,091 |
|
4.52 |
|
5,358 |
|
3.40 |
| |||
|
Nondeductible items |
|
(642 |
) |
0.27 |
|
1,114 |
|
0.71 |
|
(48 |
) |
(0.03 |
) | |||
|
Other |
|
2,357 |
|
(0.98 |
) |
1,176 |
|
0.75 |
|
(2,670 |
) |
(1.70 |
) | |||
|
Impact of foreign operations |
|
2,125 |
|
(0.88 |
) |
(5,707 |
) |
(3.64 |
) |
(4,910 |
) |
(3.11 |
) | |||
|
Foreign tax credit |
|
(4,205 |
) |
1.74 |
|
(5,329 |
) |
(3.40 |
) |
(3,312 |
) |
(2.10 |
) | |||
|
Tax contingencies |
|
772 |
|
(0.32 |
) |
(677 |
) |
(0.43 |
) |
— |
|
— |
| |||
|
Actual (benefit) provision for income taxes |
|
$ |
(86,872 |
) |
35.95 |
% |
$ |
54,806 |
|
34.93 |
% |
$ |
52,815 |
|
33.51 |
% |
As of September 30, 2015 and 2014, the components of deferred income tax assets (liabilities) were as follows (in thousands):
|
|
|
2015 |
|
2014 |
| ||
|
Current deferred tax assets/(liabilities) |
|
|
|
|
| ||
|
Inventories |
|
$ |
86,812 |
|
$ |
44,688 |
|
|
Reserves and other accruals |
|
417 |
|
3,188 |
| ||
|
Net operating losses and tax credits |
|
— |
|
1 |
| ||
|
Compensation accruals |
|
2,965 |
|
1,927 |
| ||
|
Other |
|
1,123 |
|
(616 |
) | ||
|
Total current deferred tax assets |
|
91,317 |
|
49,188 |
| ||
|
Non-current deferred tax assets/(liabilities) |
|
|
|
|
| ||
|
Property and equipment |
|
(1,937 |
) |
(4,926 |
) | ||
|
Goodwill and intangible assets |
|
(36,069 |
) |
(116,804 |
) | ||
|
Stock options |
|
3,256 |
|
2,018 |
| ||
|
Deferred financing costs |
|
4 |
|
51 |
| ||
|
Net operating losses and tax credits |
|
14,523 |
|
11,138 |
| ||
|
Other |
|
419 |
|
507 |
| ||
|
Total non-current deferred tax liabilities |
|
(19,804 |
) |
(108,016 |
) | ||
|
Valuation allowance |
|
(5,961 |
) |
(4,930 |
) | ||
|
Net deferred tax assets (liabilities) |
|
$ |
65,552 |
|
$ |
(63,758 |
) |
As of September 30, 2015, we had state net operating loss carryforwards of $3,429,000 which will begin to expire in 2024, and foreign net operating loss carryforwards of $14,592,000, $10,000 of which will begin to expire in 2017. As of September 30, 2015, we had U.S. foreign tax credit carryforwards of $11,049,000 which will begin to expire in 2021.
We are subject to U.S. federal income tax as well as income taxes in various state and foreign jurisdictions. The earliest tax year still subject to examination by a significant taxing jurisdiction is September 30, 2011.
The undistributed earnings of our foreign subsidiaries, which amount to $144,250,000 are considered to be indefinitely reinvested and no provision for federal or state and local taxes or foreign withholding taxes has been provided on such earnings. The taxes associated with the undistributed earnings would be between $15,000,000 and $20,000,000.
We determine whether it is more likely than not that a tax position will be sustained upon examination. If a tax position meets the more-likely-than-not recognition threshold it is then measured to determine the amount of benefit to recognize in the financial statements. The tax position is measured as the largest amount of benefit that is greater than 50% likely of being realized upon ultimate settlement. We classify gross interest and penalties and unrecognized tax benefits that are not expected to result in payment or receipt of cash within one year as non-current liabilities in the consolidated balance sheets. As of September 30, 2015, the total amount of gross unrecognized tax benefits was $3,072,000, including $299,000 of interest and $48,000 of penalties, all of which would impact the effective tax rate if recognized. It is reasonably possible that within the next twelve months $250,000 may be recognized as a result of the lapsing of the statute of limitations.
The unrecognized tax benefits, which exclude interest and penalties, for the years ended September 30, 2015, 2014 and 2013 are as follows (in thousands):
|
|
|
2015 |
|
2014 |
|
2013 |
| |||
|
Beginning balance |
|
$ |
1,901 |
|
$ |
— |
|
$ |
— |
|
|
Increases related to tax positions taken during a prior year |
|
1,716 |
|
2,491 |
|
— |
| |||
|
Decreases related to tax positions taken during a prior year |
|
— |
|
(590 |
) |
— |
| |||
|
Increases related to tax positions taken during the current year |
|
— |
|
— |
|
— |
| |||
|
Decreases related to expiration of statute of limitations |
|
(892 |
) |
— |
|
— |
| |||
|
Ending balance |
|
$ |
2,725 |
|
$ |
1,901 |
|
$ |
— |
|
We determine whether it is more likely than not that some or all of our deferred tax assets will not be realized. The ultimate realization of deferred tax assets depends upon the generation of future taxable income during the periods in which temporary differences become deductible or includible in taxable income. We consider projected future taxable income and tax planning strategies in our assessment. Based upon the level of historical income and projections for future taxable income, we believe it is more likely than not that we will not realize the benefits of the temporary differences related to certain Haas foreign tax credits and Haas foreign net operating losses. Therefore, a valuation allowance has been recorded against these deferred tax assets (in thousands).
|
|
|
|
|
Valuation |
|
|
| |||
|
|
|
|
|
Allowance |
|
|
| |||
|
|
|
|
|
Recorded |
|
|
| |||
|
|
|
Beginning |
|
During |
|
Ending |
| |||
|
|
|
Balance |
|
The Period |
|
Balance |
| |||
|
Valuation allowance for deferred tax assets: |
|
|
|
|
|
|
| |||
|
Year ended September 30, 2015 |
|
$ |
4,930 |
|
$ |
1,031 |
|
$ |
5,961 |
|
|
|
|
|
|
|
|
|
| |||
|
Year ended September 30, 2014 |
|
— |
|
4,930 |
|
4,930 |
| |||
|
|
|
|
|
|
|
|
| |||
|
Year ended September 30, 2013 |
|
— |
|
— |
|
— |
| |||
Note 16. Stock-Based and Other Compensation Arrangements
On January 27, 2015, our stockholders approved the 2014 Plan, which amended and restated our 2011 Equity Incentive Award Plan and authorized the issuance of a total of 5,717,584 shares. As of September 30, 2015, there were 5,514,078 shares remaining available for issuance under the 2014 Plan.
Stock Options
Our stock options are eligible to vest over three years in three equal annual installments, subject to continued employment on each vesting date. Vested options are exercisable at any time until 10 years from the date of the option grant, subject to earlier expirations under certain terminations of service and other conditions. The stock options granted have an exercise price equal to the closing stock price of our common stock on the grant date.
Continuous Employment Conditions
At September 30, 2015, we have outstanding 628,684 unvested time-based stock options under the 2014 Plan or our prior equity incentive plans (collectively, the Plans), which will vest on the basis of continuous employment. All of the time-based options vest ratably during the period of service.
The following table sets forth the summary of options activity under the Plans (dollars in thousands except per share data):
|
|
|
|
|
|
|
Weighted |
|
|
| ||
|
|
|
|
|
|
|
Average |
|
|
| ||
|
|
|
|
|
Weighted |
|
Remaining |
|
|
| ||
|
|
|
|
|
Average |
|
Contractual |
|
Aggregate |
| ||
|
|
|
Number |
|
Exercise |
|
Life |
|
Intrinsic |
| ||
|
|
|
of Shares |
|
Price |
|
(in years) |
|
Value(1) |
| ||
|
Options outstanding at September 30, 2014 |
|
2,638,256 |
|
$ |
10.54 |
|
5.80 |
|
$ |
19,589 |
|
|
Granted |
|
1,017,160 |
|
$ |
16.45 |
|
|
|
|
| |
|
Exercised |
|
(156,118 |
) |
$ |
5.26 |
|
|
|
|
| |
|
Forfeited options |
|
(257,280 |
) |
$ |
17.56 |
|
|
|
|
| |
|
Options outstanding at September 30, 2015 |
|
3,242,018 |
|
$ |
12.09 |
|
5.15 |
|
$ |
8,954 |
|
|
|
|
|
|
|
|
|
|
|
| ||
|
Options exercisable at September 30, 2015 |
|
2,613,334 |
|
$ |
10.77 |
|
4.27 |
|
$ |
8,954 |
|
(1) Aggregate intrinsic value is calculated based on the difference between our closing stock price at year end and the exercise price, multiplied by the number of in-the-money options and represents the pre-tax amount that would have been received by the option holders, had they all exercised all their options on the fiscal year end date.
The total intrinsic value of options exercised during the years ended September 30, 2015, 2014 and 2013 was $1,540,000, $34,593,000 and $25,519,000, respectively. For the years ended September 30, 2015, 2014 and 2013, we recorded $3,618,000, $2,946,000 and $1,713,000, respectively, of stock-based compensation expense related to these options that is included within selling, general and administrative expenses. At September 30, 2015, the unrecognized stock-based compensation related to these options was $4,242,000 and is expected to be recognized over a weighted-average period of 1.7 years. Cash received from the exercise of stock options by us during the years ended September 30, 2015, 2014 and 2013 was $822,000, $9,643,000 and $9,893,000, respectively.
Restricted Stock Units and Restricted Stock
In the year ended September 30, 2015, we granted 472,412 shares of restricted common stock to employees. These shares are eligible to vest over three years in three equal annual installments, subject to continued employment on each vesting date. During the years ended September 30, 2015, 2014 and 2013, we granted 73,662, 26,874 and 44,286, respectively, of restricted common shares to our directors. During fiscal year 2015, we granted performance-related restricted stock to certain executives, which vest after three years based on the achievement of a certain operational goal. The stock-based compensation expense for the performance awards is determined based on the probability of achieving the performance goal which is assessed by management on a quarterly basis until vesting. For the years ended September 30, 2015, 2014 and 2013, we recorded $4,273,000, $2,561,000 and $1,681,000, respectively, of stock-based compensation expense related to restricted stock that is included within selling, general and administrative expenses. The restricted stock awards do not contain any redemption provisions that are not within our control. Accordingly, these restricted stock awards have been accounted for as our stockholders’ equity. At September 30, 2015, the unrecognized stock-based compensation related to restricted stock awards was $5,731,000 and is expected to be recognized over a weighted-average period of 2.1 years.
Restricted share activity during the year ended September 30, 2015 was as follows:
|
|
|
|
|
Weighted |
| |
|
|
|
|
|
Average |
| |
|
|
|
Shares |
|
Fair Value |
| |
|
Outstanding at September 30, 2014 |
|
165,403 |
|
$ |
18.18 |
|
|
Granted(1) |
|
546,074 |
|
16.05 |
| |
|
Vested |
|
(248,002 |
) |
16.22 |
| |
|
Forfeited |
|
(92,080 |
) |
17.35 |
| |
|
Outstanding at September 30, 2015 |
|
371,395 |
|
$ |
16.56 |
|
(1) Under the terms of their respective restricted stock award agreements, holders of restricted stock have the same voting rights as common stock shareholders; such rights exist even if the shares of restricted stock have not vested.
Fair value of our restricted shares is based on our closing stock price on the date of grant. The fair value of shares that were vested during the years ended September 30, 2015, 2014 and 2013 was $3,126,000, $2,807,000 and $1,764,000, respectively. The fair value of shares that were granted during the years ended September 30, 2015, 2014 and 2013 was $8,766,000, $4,294,000 and $3,426,000, respectively. The weighted average fair value at the grant date for restricted shares issued during the years ended September 30, 2015, 2014 and 2013 was $16.05, $20.88 and $13.52, respectively. Due to tax deductions associated with option exercises and restricted share activities, we realized a tax shortfall of $87,000 for the year ended September 30, 2015 and tax benefits of $10,235,000 and $6,879,000 for the years ended September 30, 2014 and 2013, respectively. The realized tax shortfall and tax benefits were recorded to the additional paid in capital account in our stockholders’ equity.
Stock-Based Compensation
We use the Black-Scholes option pricing model to determine the fair value of stock options. The determination of the fair value of stock-based payment awards on the date of grant using an option-pricing model is affected by our stock price as well as assumptions regarding complex and subjective variables. These variables include the expected stock price volatility over the term of the awards, risk-free interest rate and expected dividends.
We estimated expected volatility based on historical data of comparable public companies. The expected term, which represents the period of time that options granted are expected to be outstanding, is estimated based on guidelines provided in U.S. Securities and Exchange Commission Staff Accounting Bulletin No. 110 and represents the average of the vesting tranches and contractual terms. The risk-free rate assumed in valuing the options is based on the U.S. Treasury rate in effect at the time of grant for the expected term of the option. We do not anticipate paying any cash dividends in the foreseeable future and, therefore, used an expected dividend yield of zero in the option pricing model. Compensation expense is recognized only for those options expected to vest with forfeitures estimated based on our historical experience and future expectations. Stock-based compensation awards are amortized on a straight line basis over a three year period.
The weighted average assumptions used to value the option grants are as follows:
|
|
|
2015 |
|
2014 |
|
2013 |
|
|
Expected life (in years) |
|
5.93 |
|
6.00 |
|
5.97 |
|
|
Volatility |
|
38.51 |
% |
45.00 |
% |
46.50 |
% |
|
Risk free interest rate |
|
1.87 |
% |
1.72 |
% |
1.04 |
% |
|
Dividend yield |
|
— |
|
— |
|
— |
|
The weighted average fair value per option at the grant date for options issued during the years ended September 30, 2015, 2014, and 2013 was $6.52, $9.36 and $6.08, respectively.
Note 17. Commitments and Contingencies
Operating Leases
We lease office and warehouse facilities (certain of which are from related parties) and warehouse equipment under various non-cancelable operating leases that expire at various dates through February 29, 2024. Certain leases contain escalation clauses based on the Consumer Price Index. We are also committed under the terms of certain of these operating lease agreements to pay property taxes, insurance, utilities and maintenance costs.
Future minimum rental payments under operating leases as of September 30, 2015 are as follows (dollars in thousands):
|
|
|
Third |
|
Related |
|
|
| |||
|
|
|
Party |
|
Party |
|
Total |
| |||
|
Years Ended September 30, |
|
|
|
|
|
|
| |||
|
2016 |
|
$ |
9,409 |
|
$ |
1,696 |
|
$ |
11,105 |
|
|
2017 |
|
7,266 |
|
1,696 |
|
|
8,962 |
| ||
|
2018 |
|
5,614 |
|
1,696 |
|
|
7,310 |
| ||
|
2019 |
|
4,079 |
|
1,638 |
|
|
5,717 |
| ||
|
2020 |
|
3,056 |
|
182 |
|
|
3,238 |
| ||
|
Thereafter |
|
7,159 |
|
45 |
|
7,204 |
| |||
|
|
|
$ |
36,583 |
|
$ |
6,953 |
|
$ |
43,536 |
|
Total rent expense for the years ended September 30, 2015, 2014 and 2013 was $11,430,000, $6,648,000 and $4,654,000, respectively.
Capital Lease Commitments
We lease certain equipment under capital lease agreements that require minimum monthly payments that expire at various dates through December 31, 2019. The gross amount of these leases at September 30, 2015 and September 30, 2014 are $3,285,000 and $4,857,000, respectively.
Future minimum lease payments as of September 30, 2015 are as follows (in thousands):
|
2016 |
|
$ |
1,072 |
|
|
2017 |
|
791 |
| |
|
2018 |
|
622 |
| |
|
2019 |
|
365 |
| |
|
2020 |
|
102 |
| |
|
Thereafter |
|
333 |
| |
|
|
|
3,285 |
| |
|
Less: Interest |
|
(417 |
) | |
|
Total |
|
$ |
2,868 |
|
Indemnifications
In the normal course of business, we provide indemnifications to our customers with regard to certain products and enter into contracts and agreements that may contain representations and warranties and provide for general indemnifications. Our maximum exposure under many of these agreements is not quantifiable as we have a limited history of prior indemnification claims and payments. Payments we have made under such agreements have not had a material adverse effect on our results of operations, cash flows, or financial position. However, we could incur costs in the future as a result of indemnification obligations.
Litigation
We are involved in various legal matters that arise in the ordinary course of business. Management, after consulting with outside legal counsel, believes that the ultimate outcome of such matters will not have a material adverse effect on our financial position, results of operations or cash flows. There can be no assurance, however, that such actions will not be material or adversely affect our business, financial position and results of operations or cash flows.
Note 18. Employee Benefit Plan
We maintain a 401(k) defined contribution plan and a retirement saving plan for the benefit of our eligible employees. All U.S. full-time employees who have completed at least one full month of service and are at least 20 years of age are eligible to participate in the plans. Eligible employees may elect to contribute up to 60% of their eligible compensation. We made contributions of $2,138,000, $1,580,000 and $945,000 during the years ended September 30, 2015, 2014 and 2013, respectively.
Note 19. Supplemental Cash Flow Information
|
|
|
Year Ended September 30, |
| |||||||
|
|
|
2015 |
|
2014 |
|
2013 |
| |||
|
|
|
(in thousands) |
| |||||||
|
Cash payments for: |
|
|
|
|
|
|
| |||
|
Interest |
|
$ |
15,655 |
|
$ |
24,440 |
|
$ |
16,343 |
|
|
Income taxes |
|
$ |
16,996 |
|
$ |
24,457 |
|
$ |
5,977 |
|
|
|
|
|
|
|
|
|
| |||
|
Schedule of non-cash investing and financing activities: |
|
|
|
|
|
|
| |||
|
Property and equipment acquired pursuant to capital leases |
|
$ |
333 |
|
$ |
1,528 |
|
$ |
2,923 |
|
|
Property and equipment disposed of pursuant to termination of capital leases |
|
$ |
— |
|
$ |
(5,414 |
) |
$ |
— |
|
Note 20. Quarterly Financial Data (unaudited)
Summarized unaudited quarterly financial data for quarters ended December 31, 2013 through September 30, 2015 is as follows (in thousands except per share data):
|
|
|
September 30, |
|
June 30, |
|
March 31, |
|
December 31, |
| ||||
|
|
|
2015 |
|
2015 |
|
2015 |
|
2014 |
| ||||
|
Quarter Ended: |
|
|
|
|
|
|
|
|
| ||||
|
Net sales |
|
$ |
369,654 |
|
$ |
368,706 |
|
$ |
385,559 |
|
$ |
373,696 |
|
|
Gross profit |
|
6,131 |
|
103,355 |
|
109,086 |
|
105,923 |
| ||||
|
Net (loss) income (1) |
|
(213,999 |
) |
16,479 |
|
23,046 |
|
19,730 |
| ||||
|
Basic net (loss) income per share (2) |
|
$ |
(2.21 |
) |
$ |
0.17 |
|
$ |
0.24 |
|
$ |
0.20 |
|
|
Diluted net (loss) income per share (2) |
|
$ |
(2.21 |
) |
$ |
0.17 |
|
$ |
0.24 |
|
$ |
0.20 |
|
|
|
|
September 30, |
|
June 30, |
|
March 31, |
|
December 31, |
| ||||
|
|
|
2014 |
|
2014 |
|
2014 |
|
2013 |
| ||||
|
Quarter Ended: |
|
|
|
|
|
|
|
|
| ||||
|
Net sales |
|
$ |
408,167 |
|
$ |
395,628 |
|
$ |
327,360 |
|
$ |
224,722 |
|
|
Gross profit |
|
113,638 |
|
115,972 |
|
96,560 |
|
76,830 |
| ||||
|
Net income |
|
24,647 |
|
28,772 |
|
24,312 |
|
24,370 |
| ||||
|
Basic net income per share (2) |
|
$ |
0.25 |
|
$ |
0.30 |
|
$ |
0.25 |
|
$ |
0.26 |
|
|
Diluted net income per share (2) |
|
$ |
0.25 |
|
$ |
0.29 |
|
$ |
0.25 |
|
$ |
0.25 |
|
(1) During the three months ended September 30, 2015, we recorded charges to cost of sales of $83,400,000 for the increase in our E&O reserve and related items, and a non-cash goodwill impairment charge of $263,771,000. See Note 2, Note 5 and Note 8 for additional information.
(2) Net (loss) income per share calculations for each quarter are based on the weighted average diluted shares outstanding for that quarter and may not total to the full year amount.
Note 21. Segment Reporting
We are organized based on geographic location. Our reportable segments are North America and Rest of World.
We evaluate segment performance based on segment operating earnings or loss. Each segment reports its results of operations and makes requests for capital expenditures and acquisition funding to our chief operating decision-maker (CODM). Our chief executive officer serves as our CODM.
The following table presents net sales and other financial information by business segment (in thousands):
|
|
|
Year Ended September 30, 2015 |
| |||||||
|
|
|
North |
|
Rest of |
|
|
| |||
|
|
|
America |
|
World |
|
Consolidated |
| |||
|
Net sales |
|
$ |
1,198,201 |
|
$ |
299,414 |
|
$ |
1,497,615 |
|
|
(Loss) income from operations |
|
(222,719 |
) |
16,354 |
|
(206,365 |
) | |||
|
Interest expense, net |
|
(32,912 |
) |
(4,180 |
) |
(37,092 |
) | |||
|
Benefit (provision) for income taxes |
|
94,450 |
|
(7,578 |
) |
86,872 |
| |||
|
Total assets |
|
1,709,904 |
|
311,069 |
|
2,020,973 |
| |||
|
Goodwill |
|
515,876 |
|
74,711 |
|
590,587 |
| |||
|
Capital expenditures |
|
(8,300 |
) |
(1,331 |
) |
(9,631 |
) | |||
|
Depreciation and amortization |
|
23,548 |
|
4,178 |
|
27,726 |
| |||
Changes in the goodwill balance in the year ended September 30, 2015 include a non-cash impairment charge of $263,771,000 related to the North America segment. See Note 8 for further information.
|
|
|
Year Ended September 30, 2014 |
| |||||||
|
|
|
North |
|
Rest of |
|
|
| |||
|
|
|
America |
|
World |
|
Consolidated |
| |||
|
Net sales |
|
$ |
1,030,511 |
|
$ |
325,366 |
|
$ |
1,355,877 |
|
|
Income from operations |
|
145,357 |
|
38,577 |
|
183,934 |
| |||
|
Interest expense, net |
|
(25,836 |
) |
(3,389 |
) |
(29,225 |
) | |||
|
Provision for income taxes |
|
(47,459 |
) |
(7,347 |
) |
(54,806 |
) | |||
|
Total assets |
|
2,093,384 |
|
406,988 |
|
2,412,274 |
| |||
|
Goodwill |
|
779,395 |
|
82,180 |
|
861,575 |
| |||
|
Capital expenditures |
|
(9,763 |
) |
(754 |
) |
(10,517 |
) | |||
|
Depreciation and amortization |
|
18,317 |
|
3,085 |
|
21,402 |
| |||
Changes in the goodwill balance in the year ended September 30, 2014 are related to the Haas acquisition, of which $223,681,000 and $75,358,000 relate to the North America and Rest of World segments, respectively.
|
|
|
Year Ended September 30, 2013 |
| |||||||
|
|
|
North |
|
Rest of |
|
|
| |||
|
|
|
America |
|
World |
|
Consolidated |
| |||
|
Net sales |
|
$ |
713,725 |
|
$ |
187,883 |
|
$ |
901,608 |
|
|
Income from operations |
|
150,587 |
|
30,215 |
|
180,802 |
| |||
|
Interest expense, net |
|
(25,355 |
) |
177 |
|
(25,178 |
) | |||
|
Provision for income taxes |
|
(45,102 |
) |
(7,713 |
) |
(52,815 |
) | |||
|
Capital expenditures |
|
(7,220 |
) |
(662 |
) |
(7,882 |
) | |||
|
Depreciation and amortization |
|
10,425 |
|
955 |
|
11,380 |
| |||
Geographic Information
We operated principally in three geographic areas, North America, Europe and emerging markets, such as Asia, Pacific Rim and the Middle East.
Net sales by geographic area, for the years ended September 30, 2015, 2014, and 2013, were as follows (dollars in thousands):
|
|
|
Year Ended September 30, |
| |||||||||||||
|
|
|
2015 |
|
2014 |
|
2013 |
| |||||||||
|
|
|
|
|
% of |
|
|
|
% of |
|
|
|
% of |
| |||
|
|
|
Sales |
|
Sales |
|
Sales |
|
Sales |
|
Sales |
|
Sales |
| |||
|
United States of America |
|
$ |
1,101,385 |
|
73.5 |
% |
$ |
950,058 |
|
70.1 |
% |
$ |
628,220 |
|
69.7 |
% |
|
United Kingdom |
|
190,661 |
|
12.7 |
% |
180,535 |
|
13.3 |
% |
134,943 |
|
15.0 |
% | |||
|
Other foreign counties |
|
205,569 |
|
13.8 |
% |
225,284 |
|
16.6 |
% |
138,445 |
|
15.3 |
% | |||
|
All foreign counties |
|
396,230 |
|
26.5 |
% |
405,819 |
|
29.9 |
% |
273,388 |
|
30.3 |
% | |||
|
Total |
|
$ |
1,497,615 |
|
100.0 |
% |
$ |
1,355,877 |
|
100.0 |
% |
$ |
901,608 |
|
100.0 |
% |
We determine the geographic area based on the origin of the sale.
Long-lived assets by geographic area, for the years ended September 30, 2015 and 2014, were as follows (in thousands):
|
|
|
Year Ended September 30, |
| ||||
|
|
|
2015 |
|
2014 |
| ||
|
United States of America |
|
$ |
39,900 |
|
$ |
42,162 |
|
|
All foreign countries |
|
7,076 |
|
7,102 |
| ||
|
|
|
$ |
46,976 |
|
$ |
49,264 |
|
Product and Services Information
Net sales by product categories, for the years ended September 30, 2015, 2014 and 2013 were as follows (dollars in thousands):
|
|
|
Year Ended September 30, |
| |||||||||||||
|
|
|
2015 |
|
2014 |
|
2013 |
| |||||||||
|
|
|
|
|
% of |
|
|
|
% of |
|
|
|
% of |
| |||
|
|
|
Sales |
|
Sales |
|
Sales |
|
Sales |
|
Sales |
|
Sales |
| |||
|
Hardware |
|
$ |
738,496 |
|
49.3 |
% |
$ |
837,615 |
|
61.8 |
% |
$ |
744,741 |
|
82.6 |
% |
|
Chemicals(1) |
|
591,840 |
|
39.5 |
% |
356,154 |
|
26.3 |
% |
— |
|
— |
| |||
|
Electronic components |
|
107,918 |
|
7.2 |
% |
109,616 |
|
8.1 |
% |
104,383 |
|
11.6 |
% | |||
|
Bearings |
|
33,602 |
|
2.3 |
% |
31,729 |
|
2.3 |
% |
32,218 |
|
3.6 |
% | |||
|
Machined parts and other |
|
25,759 |
|
1.7 |
% |
20,763 |
|
1.5 |
% |
20,266 |
|
2.2 |
% | |||
|
|
|
$ |
1,497,615 |
|
100.0 |
% |
$ |
1,355,877 |
|
100.0 |
% |
$ |
901,608 |
|
100.0 |
% |
(1) We did not sell inventory classified as “Chemicals” prior to the acquisition of Haas in the year ended September 30, 2014.
Note 22. Restructuring Activities
We record costs associated with involuntary separation programs when management has approved the plan for separation, the affected employees are identified, and it is unlikely that actions required to complete the separation plan will change significantly.
In September 2015, we committed to a Global Restructuring Plan, which involved the immediate elimination of redundant positions and the closure and consolidation of various facilities in order to realign our workforce to the growth areas of our business and to streamline our operations in order to increase efficiency and effectiveness. We anticipate that actions under the Global Restructuring Plan will continue through the year ending September 30, 2016.
In connection with the Global Restructuring Plan, we recorded total initial expenses of $4,522,000, consisting of $2,128,000 of employee severance and related costs and $2,394,000 related to the termination of leases. Of these amounts, $2,563,000 was recorded in North America and $1,959,000 in Rest of World. Such expenses were recorded in selling, general and administrative expenses in the consolidated statements of comprehensive (loss) income.
No material amounts related to the Global Restructuring Plan were paid in the year ended September 30, 2015. The actual costs related to the Global Restructuring Plan may be higher than the amount we accrued as of September 30, 2015, as our implementation of this plan progresses during the year ending September 30, 2016. We are not able to quantify the additional costs at the time of the filing of this Annual Report on Form 10-K.
ITEM 9. CHANGES IN AND DISAGREEMENTS WITH ACCOUNTANTS ON ACCOUNTING AND FINANCIAL DISCLOSURE
None.
ITEM 9A. CONTROLS AND PROCEDURES
Disclosure Controls and Procedures
Our management, with the participation of the chief executive officer and chief financial officer, evaluated the effectiveness of the Company’s disclosure controls and procedures (as defined in Rules 13a-15(e) and 15d-15(e)) as of the end of the period covered by this report. Based on this evaluation, and as described below under “Management’s Report on Internal Control over Financial Reporting,” our chief executive officer and chief financial officer have concluded that our disclosure controls and procedures were not effective as of September 30, 2015, because of the material weaknesses described below.
In light of the material weaknesses, management performed additional analyses and supplementary review procedures and has concluded that the audited consolidated financial statements contained in this Annual Report on Form 10-K fairly present, in all material respects, our financial condition, results of operations and cash flows for the fiscal years presented in conformity with generally accepted accounting principles. Additionally, these material weaknesses did not result in any material misstatements of the Company’s audited consolidated financial statements and disclosures for the year ended September 30, 2015.
Management’s Report on Internal Control Over Financial Reporting
Our management is responsible for establishing and maintaining adequate internal control over financial reporting (as defined in Rules 13a-15(f) and 15d-15(f) of the Exchange Act). Under the supervision and with the participation of our management, including the chief executive officer and chief financial officer, we conducted an evaluation of the effectiveness of the Company’s internal control over financial reporting as of September 30, 2015 based on the framework established in Internal Control - Integrated Framework (2013) issued by the Committee of Sponsoring Organizations of the Treadway Commission (COSO). This assessment identified material weaknesses in our internal control over financial reporting. A material weakness is a deficiency, or a combination of deficiencies, in internal control over financial reporting, such that there is a reasonable possibility that a material misstatement of the Company’s annual or interim financial statements will not be prevented or detected on a timely basis. As a result of these material weaknesses, management has concluded that our internal control over financial reporting was not effective as of September 30, 2015.
The existing material weakness we identified relates to a lack of a sufficient complement of accounting and financial reporting personnel with an appropriate level of accounting knowledge and experience commensurate with our financial reporting requirements. This material weakness contributed to the following two material weaknesses. We did not maintain effective controls over the preparation and review of account reconciliations. Specifically, our controls over the reconciliation of our balance sheet accounts did not operate effectively. We also did not maintain effective controls over the integration of policies, practices and controls over the Haas business unit. These material weaknesses resulted in certain immaterial audit adjustments to the Company’s consolidated financial statements for the year ended September 30, 2015. These material weaknesses could result in misstatements of substantially all accounts and disclosures that would result in a material misstatement to the annual or interim consolidated financial statements that would not be prevented or detected.
The effectiveness of our internal control over financial reporting as of September 30, 2015 has been audited by PricewaterhouseCoopers LLP, an independent registered public accounting firm, as stated in their report, which is included in Item 8 of this Annual Report on Form 10-K.
Remediation Activities
On February 28, 2014, we acquired Haas as part of our growth strategy. Throughout fiscal 2015, our accounting and financial reporting personnel were constrained by the continued integration of Haas and increased attrition attributable to the integration, as well as openings at senior financial and organizational positions for part of the fiscal year. Although we filled most of these positions during fiscal 2015, an
adequate period of time is required in order to institute the appropriate policies, procedures and processes, and to demonstrate effectiveness and oversight. As a result, the material weakness identified in fiscal 2014 still existed as of September 30, 2015. This material weakness led to other material weaknesses in the review of account reconciliations and the integration of policies, practices and controls over the Haas business unit as of September 30, 2015.
In some cases, such as in the case of Haas, the companies we acquire may not have invested in adequate systems or staffing to meet public company financial reporting standards. In addition, we have acquired companies that currently operate on a variety of systems, which makes process standardization more difficult. Because of this, we plan to convert some or all subsidiaries to our systems over time, depending on available resources and the level of materiality a particular entity might have. We believe this will allow for easier comparison and reconciliation across companies and more timely consolidations. The transition for the first subsidiary to the new platform was completed in the three months ended March 31, 2015. In addition, our objective is to centralize some accounting functions at our headquarters location, rather than having such activities performed at each subsidiary. We believe having a majority of accounting and numerous internal controls performed where our senior management is located will allow review and remediation to occur quickly. We plan to hire additional accounting, audit, controls and financial reporting personnel at our headquarters to meet this objective.
The following remedial actions have been taken in fiscal 2015:
· Engaged a consulting firm with technical expertise in accounting and SEC reporting matters to provide assistance and oversight of the fiscal 2014 year-end close and the preparation of the Annual Report on Form 10-K for the year ended September 30, 2014. The consulting firm has continued to assist with the preparation of our periodic reports.
· Filled openings at senior financial and organizational leadership roles in fiscal 2015:
· Global controller started in January 2015
· Chief executive officer started in May 2015
· Chief financial officer started in May 2015
· Executive vice president of strategy and business process development started in July 2015
· Restructured and reorganized our finance department, as well as other departments, to capitalize on the collective skills, abilities, and expertise of our resources based on our assessment and analysis of our combined talent pool from the Haas acquisition. Where gaps were identified, we actively filled key roles and continue to seek additional resources.
· Added qualified and experienced financial reporting staff in the finance department to ensure that it has sufficient depth, skills, and experience to prepare our financial statements and disclosures in accordance with GAAP. Additional experienced staff include:
· New treasury manager promoted in August 2015
· New director of SEC reporting and technical accounting started in September 2015
· New internal audit manager started in September 2015
· Enhanced controls around the identification, documentation and application of technical accounting guidance with particular emphasis on events outside the ordinary course of business. These controls include the implementation of additional supervision and review activities by qualified personnel, the preparation of formal accounting memoranda to support our conclusions on technical accounting matters and the development and use of checklists and research tools to assist in compliance with GAAP for complex accounting issues.
· Formed a disclosure committee comprised of members of our financial management and representatives from our accounting, legal, and investor relations departments to address and coordinate SEC filings and investor communications, the minutes of which are reviewed with the audit committee.
· Engaged a professional accounting services firm to help us assess and improve our internal controls for complying with the Sarbanes-Oxley Act. The process of implementing an effective financial reporting system is a continuous effort that requires us to anticipate and react to changes in our business and the economic and regulatory environments and to expend significant resources to maintain a financial reporting system that is adequate to satisfy our reporting obligations. As we continue to evaluate and take actions to improve our internal control over financial reporting, we may take additional actions to address control deficiencies or modify certain of the remediation measures described above.
· Purchased and began implementation of new software that will help automate and improve certain elements of our financial close and reporting process, including our consolidations process. Leveraging technology will simplify and reduce routine activities and will provide additional time for our finance department to focus on non-routine areas requiring more analysis and professional judgment.
We are also in the process of implementing and testing the following:
· Integrating various key processes, systems and resources, including implementation of a common financial system across substantially all of the business. Centralizing processes will allow for streamlined efforts, reduced redundancies, and the ability to train employees to specialize in their tasks. In turn, maintaining a specialization or an expertise in a certain task or process means constant learning and creation of best practices.
· Enhancing and strengthening our written accounting and reporting policies and training employees on the new policies, which is key to centralizing and standardizing processes.
· Allocating time and resources for training internal accounting personnel, including our senior accounting and internal audit personnel, to upgrade skillsets around GAAP, industry standards and latest accounting and audit updates, as well as certain complex and non-routine transactions.
While significant progress has been made to enhance our internal control over financial reporting relating to the material weaknesses, we are still in the process of implementing and testing these processes and procedures and additional time is required to complete implementation and to assess and ensure the sustainability of these procedures. We believe the above actions will be effective in remediating the material weaknesses described above and we will continue to devote significant time and attention to these remedial efforts. However, the material weaknesses cannot be considered remediated until the applicable remedial controls operate for a sufficient period of time and management has concluded, through testing, that these controls are operating effectively. We intend to complete the implementation and testing of our remediation plan and remediate the material weaknesses during fiscal 2016.
Changes in Internal Control over Financial Reporting
As described in “—Remediation Activities” above, we promoted a new treasury manager in August 2015 and hired a new director of SEC reporting and technical accounting, and a new internal audit manager in September 2015, which are changes in internal control over financial reporting during the quarter ended September 30, 2015 that have materially affected, or are reasonably likely to materially affect, the Company’s internal control over financial reporting. Other than these actions, there have been no changes in our internal control over financial reporting during the quarter ended September 30, 2015 that have materially affected, or are reasonably likely to materially affect, the Company’s internal control over financial reporting.
None.
In accordance with General Instruction G.(3) of Form 10-K certain information required by this Part III will either be incorporated into this Annual Report on Form 10-K by reference to our definitive proxy statement for our 2016 annual meeting of stockholders, or our 2016 Proxy Statement, filed within 120 days after September 30, 2015 or will be included in an amendment to this Annual Report on Form 10-K filed within 120 days after September 30, 2015. To the extent such information is included in our 2016 Proxy Statement within 120 days after September 30, 2015, it is expected to be incorporated by reference to the sections of our 2016 Proxy Statement specified below.
ITEM 10. DIRECTORS, EXECUTIVE OFFICERS AND CORPORATE GOVERNANCE
The information appearing in our 2016 Proxy Statement under the following headings is incorporated herein by reference:
· “Proposal 1—Election of Directors,”
· “Executive Officers,”
· “Section 16(a) Beneficial Ownership Reporting Compliance” and
· “General Information Concerning the Board of Directors, Its Committees and the Company’s Corporate Governance.”
ITEM 11. EXECUTIVE COMPENSATION
The information appearing in our 2016 Proxy Statement under the following headings is incorporated herein by reference:
· “Compensation Discussion and Analysis,”
· “General Information Concerning the Board of Directors, Its Committees and the Company’s Corporate Governance” and
· “Compensation Committee Report.”
ITEM 12. SECURITY OWNERSHIP OF CERTAIN BENEFICIAL OWNERS AND MANAGEMENT AND RELATED STOCKHOLDER MATTERS
The information appearing in our 2016 Proxy Statement under the following heading is incorporated herein by reference:
· “Security Ownership of Certain Beneficial Owners and Management” and
· “Compensation Discussion and Analysis.”
ITEM 13. CERTAIN RELATIONSHIPS AND RELATED TRANSACTIONS, AND DIRECTOR INDEPENDENCE
The information appearing in our 2016 Proxy Statement under the following headings is incorporated herein by reference:
· “Certain Relationships and Related Party Transactions” and
· “General Information Concerning the Board of Directors, Its Committees and the Company’s Corporate Governance.”
ITEM 14. PRINCIPAL ACCOUNTING FEES AND SERVICES
The information appearing in our 2016 Proxy Statement under the following heading is incorporated herein by reference:
· “Proposal 3—Ratification of Appointment of Independent Auditors.”
ITEM 15. EXHIBITS, FINANCIAL STATEMENT SCHEDULES
(a) The following documents are filed as part of this Annual Report on Form 10-K:
(1) Financial Statements. The financial statements listed in the “Index to Consolidated Financial Statements” under Part II, Item 8. “Financial Statements and Supplementary Data,” which index is incorporated herein by reference.
(2) Financial Statement Schedules. Financial statement schedules have been omitted because either they are not applicable, not required or the information is included in the financial statements or the notes thereto.
(3) Exhibits. The attached list of exhibits in the “Exhibit Index” immediately preceding the exhibits to this Annual Report on Form 10-K, which index is incorporated herein by reference.
Pursuant to the requirements of Section 13 or 15(d) of the Securities Exchange Act of 1934, the registrant has duly caused this report to be signed on its behalf by the undersigned, thereunto duly authorized.
|
|
WESCO AIRCRAFT HOLDINGS, INC. | |
|
|
|
|
|
|
|
|
|
Dated: November 30, 2015 |
By: |
/s/ David J. Castagnola |
|
|
|
David J. Castagnola |
Pursuant to the requirements of the Securities Exchange Act of 1934, this report has been signed below by the following persons on behalf of the registrant and in the capacities and on the dates indicated.
|
SIGNATURE |
|
TITLE |
|
DATE |
|
|
|
|
|
|
|
/s/ DAVID J. CASTAGNOLA |
|
President and Chief Executive Officer |
|
|
|
David J. Castagnola |
|
and Director |
|
November 30, 2015 |
|
|
|
|
|
|
|
/s/ RICHARD J. WELLER |
|
Executive Vice President and Chief Financial |
|
|
|
Richard J. Weller |
|
Officer |
|
November 30, 2015 |
|
|
|
|
|
|
|
/s/ K. LYNN MACKISON |
|
|
|
|
|
K. Lynn Mackison |
|
Vice President and Global Controller |
|
November 30, 2015 |
|
|
|
|
|
|
|
/s/ RANDY J. SNYDER |
|
|
|
|
|
Randy J. Snyder |
|
Chairman of the Board of Directors |
|
November 30, 2015 |
|
|
|
|
|
|
|
/s/ DAYNE A. BAIRD |
|
|
|
|
|
Dayne A. Baird |
|
Director |
|
November 30, 2015 |
|
|
|
|
|
|
|
/s/ THOMAS M. BANCROFT |
|
|
|
|
|
Thomas M. Bancroft |
|
Director |
|
November 30, 2015 |
|
|
|
|
|
|
|
/s/ PAUL E. FULCHINO |
|
|
|
|
|
Paul E. Fulchino |
|
Director |
|
November 30, 2015 |
|
|
|
|
|
|
|
/s/ JAY L. HABERLAND |
|
|
|
|
|
Jay L. Haberland |
|
Director |
|
November 30, 2015 |
|
|
|
|
|
|
|
/s/ SCOTT E. KUECHLE |
|
|
|
|
|
Scott E. Kuechle |
|
Director |
|
November 30, 2015 |
|
|
|
|
|
|
|
/s/ ADAM J. PALMER |
|
|
|
|
|
Adam J. Palmer |
|
Director |
|
November 30, 2015 |
|
/s/ ROBERT D. PAULSON |
|
|
|
|
|
Robert D. Paulson |
|
Director |
|
November 30, 2015 |
|
|
|
|
|
|
|
/s/ JENNIFER M. POLLINO |
|
|
|
|
|
Jennifer M. Pollino |
|
Director |
|
November 30, 2015 |
|
|
|
|
|
|
|
/s/ NORTON A. SCHWARTZ |
|
|
|
|
|
Norton A. Schwartz |
|
Director |
|
November 30, 2015 |
|
Exhibit |
|
Description |
|
2.1 |
|
Agreement and Plan of Merger, by and among Wesco Aircraft Holdings, Inc., Flyer Acquisition Corp. and Haas Group Inc., dated as of January 30, 2014 (Incorporated by reference to Exhibit 2.1 to the Registrant’s Current Report on Form 8-K dated January 31, 2014 (File No. 001-35253)) |
|
3.1 |
|
Amended and Restated Certificate of Incorporation of Wesco Aircraft Holdings, Inc. (Incorporated by reference to Exhibit 3.1 to the Registrant’s Quarterly Report on Form 10-Q, dated August 17, 2011 (File No. 001-35253)) |
|
3.2 |
|
Amended and Restated Bylaws of Wesco Aircraft Holdings, Inc. (Incorporated by reference to Exhibit 3.2 to the Registrant’s Quarterly Report on Form 10-Q, dated August 17, 2011 (File No. 001-35253)) |
|
4.1 |
|
Form of Stock Certificate (Incorporated by reference to Exhibit 4.1 to the Registrant’s Registration Statement on Form S-1/A dated June 6, 2011 (Registration No. 333-173381)) |
|
10.1 |
|
Credit Agreement, by and among Wesco Aircraft Holdings, Inc., Wesco Aircraft Hardware Corp., Barclays Bank PLC, Merrill Lynch, Pierce, Fenner & Smith Incorporated, J.P. Morgan Securities LLC, Morgan Stanley Senior Funding, Inc., RBC Capital Markets, KeyBank National Association, Sumitomo Mitsui Banking Corporation, Union Bank, N.A., BBVA Compass Bank, PNC Bank, National Association, Raymond James Bank, N.A. and the lenders party thereto, dated as of December 7, 2012 (Incorporated by reference to Exhibit 10.1 to the Registrant’s Quarterly Report on Form 10-Q dated February 8, 2013 (Registration No. 001-35253)) |
|
10.2 |
|
First Amendment to Credit Agreement, by and among Wesco Aircraft Holdings, Inc., Wesco Aircraft Hardware Corp., Barclays Bank PLC and the lenders party thereto, dated February 28, 2014 (Incorporated by reference to Exhibit 10.2 to the Registrant’s Current Report on Form 8-K dated February 28, 2014 (File No. 001-35253)) |
|
10.3 |
|
Guarantee and Collateral Agreement, by and among Wesco Aircraft Holdings, Inc., Wesco Aircraft Hardware Corp., Barclays Bank PLC and the subsidiary guarantors party thereto, dated as of December 7, 2012 (Incorporated by reference to Exhibit 10.1 to the Registrant’s Quarterly Report on Form 10-Q dated February 8, 2013 (Registration No. 001-35253)) |
|
10.4 |
|
Employment Agreement between Wesco Aircraft Hardware Corp. and Randy Snyder, dated as of July 23, 2006 (Incorporated by reference to Exhibit 10.5 to the Registrant’s Registration Statement on Form S-1 dated April 8, 2011 (Registration No. 333-173381)) |
|
10.5 |
|
Amendment to the Employment Agreement between Wesco Aircraft Hardware Corp. and Randy Snyder, dated as of December 31, 2008 (Incorporated by reference to Exhibit 10.6 to the Registrant’s Registration Statement on Form S-1 dated April 8, 2011 (Registration No. 333-173381)) |
|
10.6 |
|
Employment Agreement between Wesco Aircraft Holdings, Inc. (formerly Wesco Holdings, Inc.) and Gregory Hann, dated as of January 22, 2009 (Incorporated by reference to Exhibit 10.7 to the Registrant’s Registration Statement on Form S-1 dated April 8, 2011 (Registration No. 333-173381)) |
|
10.7 |
|
Separation and Consulting Agreement, by and among Wesco Aircraft Holdings, Inc., Wesco Aircraft Hardware Corp. and Gregory Hann, dated as of November 20, 2014 (Incorporated by reference to Exhibit 10.1 to the Registrant’s Current Report on Form 8-K dated November 20, 2014 (File No. 001-35253)) |
|
10.8 |
|
Employment Agreement between Wesco Aircraft Hardware Corp. and Hal Weinstein, dated as of June 15, 2007 (Incorporated by reference to Exhibit 10.8 to the Registrant’s Registration Statement on Form S-1 dated April 8, 2011 (Registration No. 333-173381)) |
|
10.9 |
|
Amendment to the Employment Agreement between Wesco Aircraft Hardware Corp. and Hal Weinstein, dated as of December 31, 2008 (Incorporated by reference to Exhibit 10.9 to the Registrant’s Registration Statement on Form S-1 dated April 8, 2011 (Registration No. 333-173381)) |
|
Exhibit |
|
Description |
|
10.10 |
|
Employment Letter Agreement with Hal Weinstein, dated as of December 5, 2014 (Incorporated by reference to Exhibit 10.1 to the Registrant’s Current Report on Form 8-K dated December 8, 2014 (File No. 001-35253)) |
|
10.11 |
|
Service Agreement between Wesco Aircraft Europe, Ltd and Alexander Murray, dated as of March 24, 2011 (Incorporated by reference to Exhibit 10.21 to the Registrant’s Registration Statement on Form S-1/A dated May 12, 2011 (Registration No. 333-173381)) |
|
10.12 |
|
Employment Agreement between Wesco Aircraft Hardware Corp. and Todd Renehan, dated as of January 30, 2014 (Filed herewith) |
|
10.13 |
|
Executive Severance Agreement between Randy Snyder and Wesco Aircraft Hardware Corp., dated May 8, 2014 (Incorporated by reference to Exhibit 10.15 to the Registrant’s Annual Report on Form 10-K for the fiscal year ended September 30, 2014 (File No. 001-35253)) |
|
10.14 |
|
Executive Severance Agreement between David J. Castagnola and Wesco Aircraft Hardware Corp., dated April 6, 2015 (Incorporated by reference to Exhibit 10.1 to the Registrant’s Current Report on Form 8-K dated April 6, 2015 (File No. 001-35253)) |
|
10.15 |
|
Executive Severance Agreement between Richard J. Weller and Wesco Aircraft Hardware Corp., dated April 23, 2015 (Incorporated by reference to Exhibit 10.1 to the Registrant’s Current Report on Form 8-K dated April 23, 2015 (File No. 001-35253)) |
|
10.16 |
|
Form of Executive Severance Agreement (Incorporated by reference to Exhibit 10.16 to the Registrant’s Annual Report on Form 10-K for the fiscal year ended September 30, 2014 (File No. 001-35253)) |
|
10.17 |
|
Amended and Restated Equity Incentive Plan of Wesco Aircraft Holdings, Inc. (formerly Wesco Holdings, Inc.) (Incorporated by reference to Exhibit 10.3 to the Registrant’s Registration Statement on Form S-1 dated April 8, 2011 (Registration No. 333-173381)) |
|
10.18 |
|
Form of Incentive Stock Option Agreement under Amended and Restated Equity Incentive Plan of Wesco Aircraft Holdings, Inc. (formerly Wesco Holdings, Inc.) (Incorporated by reference to Exhibit 10.10 to the Registrant’s Registration Statement on Form S-1/A dated May 12, 2011 (Registration No. 333-173381)) |
|
10.19 |
|
Form of Non-qualified Stock Option Agreement for Independent Directors under Amended and Restated Equity Incentive Plan of Wesco Aircraft Holdings, Inc. (formerly Wesco Holdings, Inc.) (Incorporated by reference to Exhibit 10.11 to the Registrant’s Registration Statement on Form S-1/A dated May 12, 2011 (Registration No. 333-173381)) |
|
10.20 |
|
Form of Amended and Restated Restricted Stock Unit Agreement under Amended and Restated Equity Incentive Plan of Wesco Aircraft Holdings, Inc. (formerly Wesco Holdings, Inc.) (Incorporated by reference to Exhibit 10.12 to the Registrant’s Registration Statement on Form S-1/A dated May 12, 2011 (Registration No. 333-173381)) |
|
10.21 |
|
Form of Restricted Stock Agreement for Independent Directors under Amended and Restated Equity Incentive Plan of Wesco Aircraft Holdings, Inc. (formerly Wesco Holdings, Inc.) (Incorporated by reference to Exhibit 10.13 to the Registrant’s Registration Statement on Form S-1/A dated May 12, 2011 (Registration No. 333-173381)) |
|
10.22 |
|
Wesco Aircraft Holdings, Inc. 2011 Equity Incentive Award Plan (Incorporated by reference to Exhibit 10.23 to the Registrant’s Registration Statement on Form S-1/A dated June 27, 2011 (Registration No. 333- 173381)) |
|
10.23 |
|
Wesco Aircraft Holdings, Inc. 2014 Incentive Award Plan (Incorporated by reference to Appendix A to the Registrant’s Definitive Proxy Statement dated December 18, 2014 (File No. 001-35253)) |
|
10.24 |
|
Form of Restricted Stock Agreement (Incorporated by reference to Exhibit 10.24 to the Registrant’s Registration Statement on Form S-1/A dated June 27, 2011 (Registration No. 333- 173381)) |
|
Exhibit |
|
Description |
|
10.25 |
|
Form of Restricted Stock Unit Agreement (Incorporated by reference to Exhibit 10.25 to the Registrant’s Registration Statement on Form S-1/A dated June 27, 2011 (Registration No. 333-173381)) |
|
10.26 |
|
Form of Stock Option Agreement (Incorporated by reference to Exhibit 10.26 to the Registrant’s Registration Statement on Form S-1/A dated June 27, 2011 (Registration No. 333-173381)) |
|
10.27 |
|
Form of Performance Stock Unit Agreement (Filed herewith) |
|
10.28 |
|
Wesco Aircraft Holdings, Inc. Management Incentive Plan (Incorporated by reference to Exhibit 10.1 to the Registrant’s Current Report on Form 8-K dated January 9, 2015 (File No. 001-35253)) |
|
10.29 |
|
Amended and Restated Management Agreement between Wesco Aircraft Holdings, Inc. and Carlyle Investment Management, L.L.C. (Incorporated by reference to Exhibit 10.14 to the Registrant’s Quarterly Report on Form 10-Q, dated August 17, 2011 (File No. 001-35253)) |
|
10.30 |
|
Amended and Restated Stockholders Agreement of Wesco Aircraft Holdings, Inc. (Incorporated by reference to Exhibit 10.20 to the Registrant’s Quarterly Report on Form 10-Q, dated August 17, 2011 (File No. 001-35253)) |
|
10.31 |
|
Form of Wesco Aircraft Holdings, Inc. Indemnification Agreement (Incorporated by reference to Exhibit 10.27 to the Registrant’s Registration Statement on Form S-1/A dated June 6, 2011 (Registration No. 333- 173381)) |
|
10.32 |
|
Lease Agreement between Wesco Aircraft France, SAS and WAFR, LLC, dated as of August 1, 2005 (Incorporated by reference to Exhibit 10.15 to the Registrant’s Registration Statement on Form S-1/A dated May 12, 2011 (Registration No. 333-173381)) |
|
10.33 |
|
Lease Agreement between Wesco Aircraft Hardware Corp. and Avenue Scott, LLC, dated as of October 1, 2004 (Incorporated by reference to Exhibit 10.16 to the Registrant’s Registration Statement on Form S-1/A dated May 12, 2011 (Registration No. 333-173381)) |
|
10.34 |
|
Lease Agreement between Wesco Aircraft Hardware Corp. and WATX Properties, LLC, dated as of January 1, 2004 (Incorporated by reference to Exhibit 10.17 to the Registrant’s Registration Statement on Form S-1/A dated May 12, 2011 (Registration No. 333-173381)) |
|
10.35 |
|
Lease Agreement between Wesco Aircraft Europe Ltd. and Snyder Family Living Trust, dated as of January 1, 2006 (Incorporated by reference to Exhibit 10.18 to the Registrant’s Registration Statement on Form S-1/A dated May 12, 2011 (Registration No. 333-173381)) |
|
21.1 |
|
List of Subsidiaries (Filed herewith) |
|
23.1 |
|
Consent of Independent Registered Public Accounting Firm (Filed herewith) |
|
31.1 |
|
Certification of Chief Executive Officer pursuant to Rule 13a- 14(a)/15d-14a and pursuant to Section 302 of the Sarbanes-Oxley Act of 2002 (Filed herewith) |
|
31.2 |
|
Certification of Chief Financial Officer pursuant to Rule 13a- 14(a)/15d-14a and pursuant to Section 302 of the Sarbanes-Oxley Act of 2002 (Filed herewith) |
|
32.1 |
|
Certification of Periodic Report by Chief Executive Officer and Chief Financial Officer pursuant to U.S.C. Section 1350, as adopted pursuant to Section 906 of the Sarbanes-Oxley Act of 2002 (Filed herewith) |
|
101.INS |
|
XBRL Instance Document |
|
101.SCH |
|
XBRL Taxonomy Extension Schema Document |
|
101.CAL |
|
XBRL Taxonomy Extension Calculation Linkbase Document |
|
101.DEF |
|
XBRL Taxonomy Extension Definition Linkbase Document |
|
101.LAB |
|
XBRL Taxonomy Extension Label Linkbase Document |
|
101.PRE |
|
XBRL Taxonomy Extension Presentation Linkbase Document |