Attached files
| file | filename |
|---|---|
| EXCEL - IDEA: XBRL DOCUMENT - Wesco Aircraft Holdings, Inc | Financial_Report.xls |
| EX-21.1 - EX-21.1 - Wesco Aircraft Holdings, Inc | a2206521zex-21_1.htm |
| EX-32.1 - EX-32.1 - Wesco Aircraft Holdings, Inc | a2206521zex-32_1.htm |
| EX-31.1 - EX-31.1 - Wesco Aircraft Holdings, Inc | a2206521zex-31_1.htm |
| EX-31.2 - EX-31.2 - Wesco Aircraft Holdings, Inc | a2206521zex-31_2.htm |
| EX-23.1 - EX-23.1 - Wesco Aircraft Holdings, Inc | a2206521zex-23_1.htm |
Use these links to rapidly review the document
TABLE OF CONTENTS
INDEX TO CONSOLIDATED FINANCIAL STATEMENTS
UNITED STATES
SECURITIES AND EXCHANGE COMMISSION
Washington, D.C. 20549
FORM 10-K
| (Mark One) | ||
ý |
ANNUAL REPORT PURSUANT TO SECTION 13 OR 15(d) OF THE SECURITIES EXCHANGE ACT OF 1934 |
|
For the fiscal year ended September 30, 2011 |
||
or |
||
o |
TRANSITION REPORT PURSUANT TO SECTION 13 OR 15(d) OF THE SECURITIES EXCHANGE ACT OF 1934 |
|
For the transition period from to |
||
Commission File No. 001-35235
WESCO AIRCRAFT HOLDINGS, INC.
(Exact Name of Registrant as Specified in Its Charter)
| Delaware (State of Incorporation) |
20-5441563 (I.R.S. Employer Identification Number) |
27727 Avenue Scott
Valencia, California 91355
(Address of Principal Executive Offices and Zip Code)
(661) 775-7200
(Registrant's Telephone Number, Including Area Code)
Securities Registered pursuant to Section 12(b) of the Act:
| Title of Each Class | Name of Each Exchange on Which Registered | |
|---|---|---|
| Common Stock, par value $0.001 per share | New York Stock Exchange |
Securities Registered pursuant to Section 12(g) of the Act: None
Indicate by check mark if the registrant is a well-known seasoned issuer, as defined in Rule 405 of the Securities Act. Yes o No ý
Indicate by check mark if the registrant is not required to file reports pursuant to Section 13 of Section 15(d) of the Act. Yes o No ý
Indicate by check mark whether the registrant (1) has filed all reports required to be filed by Section 13 or 15(d) of the Securities Exchange Act of 1934 during the preceding 12 months (or for such shorter period that the registrant was required to file such reports), and (2) has been subject to such filing requirements for the past 90 days. Yes ý No o
Indicate by check mark whether the registrant has submitted electronically and posted on its corporate Website, if any, every Interactive Data File required to be submitted and posted pursuant to Rule 405 of Regulation S-T during the preceding 12 months (or shorter period that the registrant was required to submit and post such files). Yes ý No o
Indicate by check mark if disclosure of delinquent filers pursuant to Item 405 of Regulation S-K is not contained herein, and will not be contained, to the best of the registrant's knowledge, in definitive proxy or information statements incorporated by reference in Part III of this Form 10-K or any amendment to this Form 10-K. ý
Indicate by check mark whether the registrant is a large accelerated filer, an accelerated filer, or a non-accelerated filer, or a smaller reporting company. See definitions of "large accelerated filer," "accelerated filer" and "smaller reporting company" in Rule 12b-2 of the Securities Exchange Act of 1934.
| Large accelerated filer o | Accelerated filer o | Non-accelerated filer ý (Do not check if a smaller reporting company) |
Smaller reporting company o |
Indicate by check mark whether the registrant is a shell company (as defined in Rule 12b-2 of the Act). Yes o No ý
As of March 31, 2011, there was no public trading market for the registrant's common stock.
The number of shares of common stock (par value $0.001 per share) of the registrant outstanding as of December 1, 2011 was 85,752,087.
Documents Incorporated by Reference
Part III of this annual report on Form 10-K incorporates by reference certain information from the registrants' definitive proxy statement for the 2012 annual meeting of stockholders, which the registrant intends to file pursuant to Regulation 14A with the Securities and Exchange Commission not later than 120 days after the registrant's fiscal year end of September 30, 2011. With the exception of the sections of the definitive proxy statement specifically incorporated herein by reference, the definitive proxy statement is not deemed to be filed as part of this annual report on Form 10-K.
Unless otherwise noted in this Annual Report, the term "Wesco Aircraft" means Wesco Aircraft Holdings, Inc., our top-level holding company, and the terms "Wesco," "the Company," "we," "us," "our" and "our company" mean Wesco Aircraft and its subsidiaries, including Wesco Aircraft Hardware Corp., our primary domestic operating company, and Wesco Aircraft Europe, Ltd., our primary foreign operating company. References to "fiscal year" mean the year ending or ended September 30. For example, "fiscal year 2011" or "fiscal 2011" means the period from October 1, 2010 to September 30, 2011.
1
PART I
CAUTIONARY NOTE REGARDING FORWARD-LOOKING STATEMENTS
This Annual Report on Form 10-K contains forward-looking statements. The words "believe," "expect," "anticipate," "intend," "estimate" and other expressions that are predictions of or indicate future events and trends and that do not relate to historical matters identify forward-looking statements. You should not place undue reliance on these forward-looking statements. Although forward-looking statements reflect management's good faith beliefs, reliance should not be placed on forward-looking statements because they involve known and unknown risks, uncertainties and other factors, which may cause the actual results, performance or achievements to differ materially from anticipated future results, performance or achievements expressed or implied by such forward-looking statements. Forward-looking statements speak only as of the date the statements are made. We undertake no obligation to publicly update or revise any forward-looking statement, whether as a result of new information, future events, changed circumstances or otherwise. These forward-looking statements are subject to numerous risks and uncertainties, including, but not limited to:
- •
- general economic and industry conditions;
- •
- changes in military spending;
- •
- risks unique to suppliers of equipment and services to the U.S. government;
- •
- risks associated with our long-term, fixed-price agreements that have no guarantee of future sales volumes;
- •
- risks associated with the loss of significant customers, a material reduction in purchase orders by significant customers
or the delay, scaling back or elimination of significant programs on which we rely;
- •
- our ability to effectively manage our inventory;
- •
- our suppliers' ability to provide us with the products we sell in a timely manner, in adequate quantities and/or at a
reasonable cost;
- •
- our ability to maintain an effective IT system;
- •
- our ability to retain key personnel;
- •
- risks associated with our international operations;
- •
- fluctuations in our financial results from period-to-period;
- •
- affiliates of The Carlyle Group's ("Carlyle") ability to control the majority of the voting power of our outstanding
common stock;
- •
- our ability to effectively compete in our industry;
- •
- risks related to our indebtedness; and
- •
- and other risks and uncertainties.
Important factors that could cause actual results to differ materially from our expectations are disclosed under Part I, Item 1A. "Risk Factors." All written and oral forward-looking statements attributable to us, or persons acting on our behalf, are expressly qualified in their entirety by the cautionary statements as well as other cautionary statements that are made from time to time in our public communications. You should evaluate all forward-looking statements made in this Annual Report on Form 10-K in the context of these risks and uncertainties.
2
Company Overview
We are one of the world's largest distributors and providers of comprehensive supply chain management services to the global aerospace industry on an annual sales basis. Our services range from traditional distribution to the management of supplier relationships, quality assurance, kitting, just-in-time, or JIT, delivery and point-of-use inventory management. We supply approximately 475,000 different stock keeping units, or SKUs, including hardware, bearings, tools and more recently, electronic components and machined parts. In fiscal 2011, sales of hardware represented 82% of our net sales, with highly engineered fasteners constituting 82% of that amount. We serve our customers under three types of arrangements: JIT contracts, which govern comprehensive outsourced supply chain management services; long term agreements, or LTAs, which set prices for specific parts; and ad hoc sales. JIT contracts and LTAs, which together comprised approximately 61% of our fiscal 2011 net sales, are multi-year arrangements that provide us with significant visibility into our future sales.
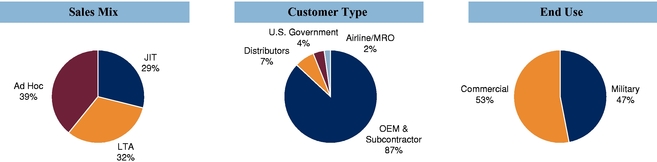
Founded in 1953 by the father of our current Chief Executive Officer, or CEO, Wesco has grown to serve over 7,200 customers in the commercial, military and general aviation sectors, including the leading OEMs and their subcontractors, through which we support nearly all major Western aircraft programs. We have grown our net sales at a 13.5% compound annual growth rate, or CAGR, over the past 20 years to $710.9 million in fiscal 2011. We serve a large and growing global market, and believe that with more than 1,000 employees across 30 locations in 10 countries, we are well positioned to continue our track record of strong long-term growth and profitability. The following charts illustrate the composition of our 2011 net sales based on our sales data or management estimates.
We have invested in building an integrated, highly customized IT system that enables our purchasing and sales organization to make more informed decisions and our inventory management system to operate at maximum efficiency. Specifically, our customized IT system provides us visibility into inventory quantities, stocking locations and purchases across our customer base by individual SKU, enabling us to accurately fill approximately 8,000 orders per day and provide an exceptional level of customer service. The scalable nature of our IT system helps us improve productivity and financial performance as sales volume increases. We believe our customized IT system is a key competitive advantage and critical element in our unique business model that creates significant value for our customers and our suppliers.
We believe that our success has been driven by our focus on customer service and our ability to offer tailored solutions to our customers. We believe customers that utilize our comprehensive JIT supply chain management services are frequently able to realize significant benefits, including:
- •
- reduced inventory levels and inventory excess and obsolescence expense, in part because such customers only purchase what
they need, and make more efficient use of floor space;
- •
- increased accuracy in forecasting and planning, resulting in substantially improved on-time delivery, reduced expediting costs and fewer disruptions of production schedules;
3
- •
- improved quality assurance resulting in a substantial reduction in customer parts rejection rates; and
- •
- reduced administrative and overhead costs relating to procurement, quality assurance, supplier management, expediting and stocking functions.
Our customers also benefit from the strong relationships we maintain with a diverse group of over 1,200 suppliers. We believe these suppliers in turn derive several benefits from our scale, global reach and unique business model, including:
- •
- access to over 7,200 customer accounts;
- •
- larger production runs that facilitate more efficient manufacturing processes;
- •
- a reduction of inventory levels and related obsolescence costs;
- •
- improved performance in meeting on-time-delivery targets to end customers; and
- •
- consolidation of customer accounts, resulting in a reduction in administrative and overhead costs relating to sales and marketing, customer service and other functions.
We believe we are well positioned to continue our track record of strong growth by partnering with our suppliers to provide a compelling combination of value-added services to our customers.
Competitive Strengths
We believe that our key competitive strengths include the following:
Leader in Attractive Global Market. We are one of the world's largest distributors and providers of comprehensive supply chain management services to the global aerospace industry on an annual sales basis. We believe we offer the world's broadest inventory of aerospace parts comprised of approximately 475,000 SKUs. In addition, we fill over 8,000 orders per work day and manage approximately 400,000 stocking bins throughout our customers' facilities. We believe that the scale of our global distribution network, our value-added services and the depth, breadth and dollar investment in our inventory provide us with a significant competitive advantage in an attractive market.
Compelling Value Proposition. We offer a compelling value proposition to our customers by combining access to what we believe to be the world's broadest inventory of aerospace parts with our unique capabilities in comprehensive supply chain management. Our services can significantly improve on-time-delivery performance, enabling our customers to reduce their inventory while at the same time decreasing the frequency of production interruptions caused by part shortages. Due to the high levels of precision and engineering standards in the aerospace industry, our customers must ensure the highest levels of quality assurance. Many of our customers have chosen to outsource these critical quality assurance functions to us, relying on our rigorous inspection processes. Aerospace companies that do not outsource to a supply chain manager like Wesco can incur significant additional overhead and administrative costs relating to internal procurement, quality assurance, inventory stocking and other related personnel.
Diverse Customer and Program Base. We maintain strong relationships with over 7,200 active customers including major OEMs such as Airbus, Boeing, Bombardier, Embraer, Cessna, Gulfstream, BAE Systems, Bell Helicopter, Lockheed Martin, Northrop Grumman and Raytheon. We supply products to nearly every major Western aircraft in production, including the B-787, B-737, B-747, A-320, A330, A340, F-35 Joint Strike Fighter, or JSF, V-22, F18 and all Gulfstream production aircraft inclusive of the new G650 as well as all Bombardier aircraft, inclusive of the new C Series. During fiscal 2011, no single customer or aircraft program represented more than 16% of our net sales. We have actively worked to transition our largest customers from ad hoc purchases to multi-year LTAs or
4
comprehensive JIT supply chain management agreements, the latter two of which together represented approximately 61% of our fiscal 2011 net sales. By developing strong, long-term relationships with a diverse set of customers, we have significant visibility into our future sales.
Superior Purchasing Capabilities and Supplier Relationships. Our management is highly skilled in analyzing supply, demand, cost and pricing factors in order to make optimal inventory investment decisions, and we maintain close relationships with the leading suppliers in the industry. In particular, Alcoa Fastening Systems and Precision Castparts supplied approximately 22% and 20%, respectively, of the products we purchased during fiscal 2011. Our top 10 suppliers have been doing business with us for an average of more than 10 years. We believe that our business model allows our suppliers to smooth out production, improve their cash flow and reduce administrative costs. As a result of our scale and the strength of our relationships, many of our suppliers offer us attractive volume-based price discounts. Our success in making optimal inventory purchasing decisions is driven by our management's deep understanding of our industry and their skill in analyzing fundamental supply, demand, cost and pricing data. These decisions are facilitated by our highly customized IT system. Our superior inventory purchasing capabilities and the strength of our supplier relationships have contributed substantially to what we believe are our industry-leading operating margins.
Experienced Management Team with Significant Equity Ownership. Our management team has extensive industry experience and company tenure. Our Chief Executive Officer and other executive officers have an average of more than 20 years of experience with us and more than 30 years in our industry. In addition, our executive officers owned approximately 12.3% of the common stock of the Company as of September 30, 2011. We believe that this significant equity ownership aligns the interests of our executive officers with our stockholders.
Our Strategy for Continued Growth
We intend to pursue the following strategies in order to continue to grow our business:
Continued Focus on Operational Excellence. We have built strong relationships with our existing customers and suppliers through a relentless focus on operational excellence and improvement. We intend to continue providing our customers with best-in-class on-time delivery performance and quality assurance. We also intend to continue investing in our integrated, highly customized IT system and process automation technology. We believe that by focusing on operational excellence, we will be able to maintain high customer satisfaction and industry-leading operating margins.
Win New Business from Existing Customers. We will continue our strategy of expanding our relationships with existing customers by transitioning them to our comprehensive JIT supply chain management services as well as expanding our programs to include additional customer sites and SKUs. We are a key partner supplying fasteners and other C class parts to support the launch of new aircraft programs, such as the Boeing 787 and Lockheed Martin JSF. We will continue to support our customers in the launch of new aircraft programs by introducing new supply chain solutions that minimize costs, improve productivity, lower inventory investment and ensure a seamless supply of parts for new production and aftermarket support.
Expand Customer Base. We believe that our services and capabilities are attractive to potential new customers and plan to expand our customer base. We have had significant success in winning business when competing distributors have been unable to meet customer service level requirements and in situations where customers have outsourced work that was previously performed internally. Historically, we have focused our activities on the major OEMs and their subcontractors and less on airlines and airline maintenance organizations due to their tendency to order parts in smaller quantities with greater frequency, which makes them more costly to serve.
5
Further Expand into International Markets. We have recently established a presence in international locations such as China, India and Saudi Arabia, and we intend to expand into other high growth regions such as Mexico to support new and existing customers. Our international expansion efforts will enable us to better reach new customers and more effectively serve our existing customer base as the manufacture of aircraft and aircraft structures continues to become more global. We believe that we mitigate many of the risks associated with international expansion by entering into customer contracts before we establish a new stocking facility. Our international expansion will enable us to better reach new customers and more effectively serve our existing customer base as the manufacture of aircraft and aircraft structures becomes increasingly international and interconnected.
Selectively Pursue Strategic Acquisitions. Our industry is highly fragmented and we believe that there are opportunities for continued consolidation. In 2008, we acquired Airtechnics, Inc., or Airtechnics, which enabled us to expand our product offering to include electronic components, as well as gain additional customers. We believe that we are well positioned to expand our product offering and geographical footprint through strategic acquisitions. Consistent with this strategy, we continue to evaluate potential acquisition opportunities.
Our Products and Services
Our Products
We offer more than 475,000 different SKUs, consisting of C class aerospace hardware, bearings, electronic components and machined parts, which are generally priced below $350 per part. Many of the products we sell are highly engineered, precision parts that are specified for use in particular aircraft programs.
Our product categories include the following:
| |
Hardware | Electronic Components |
Bearings | Machined Parts and Other |
||||
|---|---|---|---|---|---|---|---|---|
Wesco Fiscal 2011 Net Product Sales (in millions) |
$585 | $82 | $22 | $22 | ||||
% of Wesco Fiscal 2011 Net Product Sales |
82% | 12% | 3% | 3% | ||||
Types of Products Offered |
• Blind fasteners |
• Connectors |
• Airframe control bearings |
• Brackets |
||||
|
• Panel fasteners |
• Relays |
• Rod ends |
• Milled parts |
||||
|
• Bolts and screws |
• Switches |
• Spherical bearings |
• Shims |
||||
|
• Clamps |
• Circuit breakers |
• Ball bearing rod ends |
• Stampings |
||||
|
• Hi lok pins and collars |
• Lighted products |
• Roller bearings |
• Turned parts |
||||
|
• Hose assemblies |
• Bushings |
• Welded assemblies |
|||||
|
• Hydraulic fittings |
• Installation tooling |
||||||
|
• Inserts |
|||||||
|
• Lockbolts and collars |
|||||||
|
• Nuts |
|||||||
|
• Rivets |
|||||||
|
• Springs |
|||||||
|
• Valves |
|||||||
|
• Washers |
Hardware
Sales of C class aerospace hardware represented approximately 82% of our fiscal 2011 product sales. Fasteners are our largest product category, comprising approximately 82% of our hardware sales in fiscal 2011. Fasteners include a wide range of highly engineered aerospace parts that are designed to hold together two or more components, such as rivets (both blind and solid), bolts (including blind
6
bolts), screws, nuts and washers. Many of these fasteners are designed for use in specific aircraft platforms and others can be used across multiple platforms. Materials used in the manufacture of these fasteners range from standard alloys, such as aluminum, steel or stainless steel, to more advanced materials, such as titanium, Inconel and Waspalloy.
Electronic Components
In 2008, we acquired Wichita, Kansas-based Airtechnics, one of the largest distributors of aerospace electronic components in North America, which helped expand our product offering to our customer base. We offer highly reliable interconnect and electro-mechanical products, including connectors, relays, switches, circuit breakers and lighted products. We also offer value-added assembled products including mil-circular and rack and panel connectors and illuminated push button switches. We maintain large quantities of connector components in inventory, which allows us to respond quickly to customer orders. In addition, our lighted switch assembly operation affords customers same day service, including engraving capabilities in multiple languages.
Bearings
We began to offer aerospace bearings after acquiring the bearing distribution business of Kaman Industrial Technologies in 1999, which enabled us to support new customers and expand our product offering. Our product offering includes a variety of standard anti-friction products designed to both commercial and military aircraft specifications, such as airframe control bearings, rod ends, spherical bearings, ball bearing rod ends, roller bearings and bushings.
Machined Parts and Other
Machined parts are designed for a specific customer and are assigned unique OEM-specific SKUs. The machined parts we distribute include laser cut or stamped brackets, milled parts, shims, stampings, turned parts and welded assemblies made of materials ranging from high-grade steel or titanium to nickel based alloys.
We stock a full range of tools needed for the installation of our products, including air and hydraulic tools as well as drill motors, and we also offer factory authorized maintenance and repair services for these tools. In addition to selling these tools, we also rent or lease these tools to our customers.
Our Services
In addition to our traditional distribution services, we have developed innovative value-added services, such as quality assurance, kitting and JIT supply chain management for our customers.
Quality Assurance
Our quality assurance, or QA, function is a key component of our service offering, with approximately 10% of our employees dedicated to this area. We believe we offer an industry-leading QA function as a result of our rigorous processes, sophisticated testing equipment and dedicated QA staff, and as evidenced by a comparison of our customers' aggregate rejection rate of the products we deliver, which was approximately 0.3% during fiscal 2011, to our rejection rate of the products we receive from our suppliers, which was approximately 2.1% during fiscal 2011.
7
Our QA department inspects the inventory we purchase to ensure the accuracy and completeness of documentation. We also maintain an electronic copy of the relevant certifications for the inventory, which can include a manufacturer certificate of conformance, test reports, process certifications, material distributor certifications and raw material mill certifications. In addition, dimensional inspections are performed on all lots from suppliers that are not certified by our QA department, and all lots for our JIT customers undergo dimensional, and in some cases, structural inspections. For many of our customers, these inspections are conducted at our in-house laboratory, where we operate sophisticated testing equipment. Our industry-leading QA capabilities also allow our JIT customers to reduce the number of personnel dedicated to the QA function and reduce the delays caused by the rejection of improperly inspected parts.
Kitting
Kitting involves the packaging of an entire bill of materials or a complete "ship-set" of parts, which reduces the amount of time workers spend retrieving parts from storage locations. Kits can be customized in varying configurations and sizes and can contain up to several hundred different parts. All of our kits and components contain fully certified and traceable parts and are assembled by our full-service kitting department at our central stocking locations, or CSLs, or at our customer sites.
JIT Supply Chain Management
JIT supply chain management involves the delivery of parts on an as-needed basis to the point-of-use at a customer's manufacturing line. JIT programs are designed to prevent excess inventory build-up and shortages and improve manufacturing efficiency. Each JIT contract requires us to maintain an efficient inventory tracking, analysis and replenishment program and is designed to provide high levels of stock availability and on-time delivery. We began offering JIT supply chain management services in 1993 as some OEMs began outsourcing certain support functions in an effort to cut costs at a time when defense spending was declining and the commercial aerospace industry was entering a cyclical downturn. Since that time, the popularity of our JIT programs has grown and we now support over 150 customer locations, including approximately 400,000 bins serviced worldwide. During fiscal 2011, our on-time delivery rate for JIT customers was approximately 98.5%. We believe customers that utilize our comprehensive JIT supply chain management services are frequently able to realize significant benefits including:
- •
- reduced inventory levels and lower inventory excess and obsolescence expense, in part because such customers only purchase
what they need, and make more efficient use of their floor space;
- •
- increased accuracy in forecasting and planning, resulting in substantially improved on-time delivery, reduced
expediting costs and fewer disruptions of production schedules;
- •
- improved quality assurance resulting in a substantial reduction in customer parts rejection rates; and
- •
- reduced administrative and overhead costs relating to procurement, QA, supplier management and stocking functions.
Before signing a JIT contract, our customers typically experience outages of many SKUs and, in some cases, have up to a year's worth of inventory on hand. As part of our JIT programs, we generally assume the customer's existing inventory at the onset of the contract, immediately reducing their inventory on-hand and the associated management costs. Customer inventory is generally assumed on a consignment basis and is entered in our database in a distinct customer-specific "virtual warehouse." Software protocol in our IT system requires the system to first "look" to a customer's consigned inventory when parts replenishment is required. In many cases, we can sell this consigned inventory to our base of 7,200 active customers around the world, gradually drawing down the customer's inventory.
8
As the consigned inventory for each SKU is exhausted, our stock of Wesco-sourced product is then used for replenishment. Due to the reliable nature of our services, our customers typically carry approximately 45 days worth of inventory in point-of-use bins instead of months or years worth of such products which is typical for many aerospace manufacturers.
Another key strength of our JIT program is our ability to utilize highly scalable and customizable point-of-use systems to develop an efficient supply chain management system and automated replenishment solution for any number of SKUs. In order to minimize inventory on hand, certain indicators are used to trigger the replenishment of product from a supplying location to the location of consumption. Our "Twin-Bin" system is an example of such an indicator. A JIT program designed around a Twin-Bin system utilizes a specially manufactured unit composed of two bins stacked on top of one another. In this system, a clear plastic bag, typically containing a 30-day supply of parts, is loaded in each bin. Production workers use all of the parts within the bottom bin before drawing a pullout slide between the two bins that drops the full plastic bag of parts from the top bin into the bottom bin. An empty top bin indicates the need to initiate replenishment of the parts and provides a clear visual management process on the manufacturing floor. All replenishment activity is done via hand-held scanners that transmit orders to our stocking locations.
Customer Contracts
We sell parts to our customers under three types of arrangements: JIT supply chain management contracts, LTAs and ad hoc sales.
JIT Contracts
JIT contracts are typically three to five years in length and are structured to supply the parts requirement for specific SKUs, production lines or facilities. Given our direct involvement with JIT customers, volume requirements and purchasing frequency under these contracts is highly predictable. Under JIT contracts, customers commit to purchase specified parts from us at a fixed price, on an if-and-when needed basis, and we are responsible for maintaining high levels of stock availability of those parts. JIT contracts typically contain termination for convenience provisions, which generally allow our customers to terminate their contracts on short notice without meaningful penalties, provided that we are reimbursed for the cost of any inventory specifically procured for the customer. JIT customers also often purchase parts from us that are not covered under their contracts on an ad hoc basis. Approximately 29% of our net sales during fiscal 2011 were generated from JIT contracts.
Long-Term Agreements
Like JIT contracts, LTAs also typically run for three to five years. LTAs are essentially negotiated price lists for customers or individual customer sites that cover a range of pre-determined parts, purchased on an as-needed basis. The negotiated prices are typically tiered based on order size. LTAs generally obligate the customer to buy contracted SKUs from us and may obligate us to maintain stock availability for those parts. Once an LTA is in place, the customer is then able to place individual purchase orders with us for any of the contractually specified parts. LTAs typically contain termination for convenience provisions, which generally allow for our customers to terminate their contracts on short notice without meaningful penalties, provided that we are reimbursed for the cost of any inventory specifically procured for the customer. LTA customers also frequently purchase parts from us that are not captured under the pricing arrangement on an ad hoc basis. Approximately 32% of our net sales during fiscal 2011 were derived from our LTAs.
9
Ad Hoc Sales
Ad hoc customers purchase parts from us on an as-needed basis and are generally supplied out of our existing inventory. Typically, ad hoc orders are for smaller quantities of parts than those ordered under either JIT contracts or LTAs, and are often urgent in nature. Given our breadth and volume of inventory, it is not uncommon for even our competitors to purchase parts from us on an ad hoc basis when their own stocks prove to be inadequate. In an environment of increasing aircraft production, parts shortages can become increasingly common for OEMs, subcontractors, MROs and distributors with less sophisticated forecasting abilities and procurement organizations. Approximately 39% of our net sales during fiscal 2011 were generated from ad hoc sales.
Under each of the sales arrangements described above we typically warrant that the products we sell conform to the drawings and specifications that are in effect at the time of delivery in the applicable contract, and that we will replace defective or non-conforming products for a period of time that varies from contract to contract. The product manufacturer, in turn, typically indemnifies us for liabilities resulting from defective or non-conforming products. We do not accrue for warranty expenses as our claims related to defective and non-conforming products have been nominal.
We believe that backlog is not a relevant measure of our business, given the long-term nature of our JIT contracts and LTAs with our customers.
Customers
We sell to over 7,200 active customers worldwide. Boeing was our largest customer during fiscal 2011 and accounted for approximately 16% of our net sales. No other customer accounted for more than 10% of our net sales during fiscal 2011, and only two customers accounted for over 5% of our net sales during the same period, with each consisting of multiple independent programs. Our top 10 customers collectively accounted for 49% of our net sales during fiscal 2011.
Approximately 87% of our fiscal 2011 net sales were derived from major OEMs, such as Airbus, Boeing, Bombardier, Embraer, Cessna, Gulfstream, BAE Systems, Bell Helicopter, Lockheed Martin, Northrop Grumman and Raytheon, and certain of their subcontractors. Government sales comprised roughly 4% of our net sales during fiscal 2011 and were derived from various military parts procurement agencies such as the U.S. Defense Logistics Agency, or from defense contractors buying on their behalf. Aftermarket sales to airline-affiliated or independent MROs made up roughly 2% of our fiscal 2011 net sales. Airlines and airline maintenance organizations traditionally order parts in smaller quantities with greater frequency, making them more costly to serve. We are currently targeting international airlines and aircraft maintenance centers that are assuming an expanded role within the MRO market. The balance of our net sales are to other distributors.
We estimate that during fiscal 2011, approximately 53% of our net sales were derived from customers supporting commercial programs and approximately 47% of our net sales were derived from customers supporting military programs. Our customers are principally located in the United States, comprising approximately 70% of our net sales during fiscal 2011. We also service international customers in markets that include Canada, the United Kingdom, Italy, France, Germany, China, South Korea, India and Australia.
Suppliers
We source our inventory from over 1,200 suppliers, including Alcoa Fastening Systems, Precision Castparts, Amphenol Corporation, Lisi Aerospace and Monogram Aerospace Fasteners. During fiscal 2011, we purchased approximately 42% of our inventory from Alcoa Fastening Systems and Precision Castparts. Suppliers typically prefer to deal with a relatively small number of large and sophisticated distributors in order to improve machine utilization, reduce finished goods inventory and maintain
10
pricing discipline. As a result of the scale of our operations and our long-standing relationships with many of our suppliers, we are often able to take advantage of significant volume-based discounts when purchasing inventory. Given our industry position, financial strength and philosophy of cooperation with suppliers, we believe we are in an excellent position to become a distributor for new product lines as they become available.
Procurement
We consider our procurement expertise to be one of our principal competitive advantages. Our management is highly skilled in analyzing supply, demand, cost and pricing factors to make optimal inventory investment decisions and we maintain close relationships with the leading suppliers in the industry. In particular, Alcoa Fastening Systems and Precision Castparts supplied approximately 22% and 20%, respectively, of the products we purchased during fiscal 2011. Our strong understanding of the global aerospace industry is derived from our long-term relationships with major OEMs, subcontractors and suppliers. In addition, our direct insight into our customers' production rates often allows us to detect industry trends. Furthermore, our ability to forecast demand and place purchase orders with our suppliers well in advance of our customer requirements provides us with a distinct advantage in an industry where inventory availability is critical for customers that need specific parts within a stipulated timeframe to meet their own production and delivery commitments.
We have created a structured procurement process that focuses on return on invested capital, or ROIC, and minimizes excess inventory, which helps us maintain what we believe are our industry-leading operating margins and parts availability. Prior to placing a purchase order, members of our supply chain organization analyze a "buy requisition," which is generated by our IT system. Buy requisitions provide several key pieces of information, including the amount of that SKU currently on-hand, a listing of all active customers that use the specific SKU, the quantities and rates at which the part has been consumed by these customers in the past, tiered pricing for various quantities at which the supplier offers price breaks and recent selling prices of various order sizes. Using the information obtained from the buy requisition, a Wesco employee then conducts an ROIC analysis to determine the expected payback period and margin on the specified inventory investment before making the final procurement decision. This calculated approach to inventory investment, combined with our unique market insight, has enabled us to generate and sustain industry-leading operating margins.
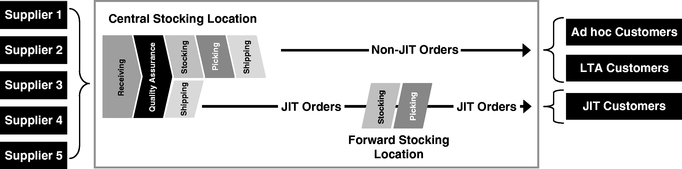
Operations
We have developed a highly structured system in order to manage the receipt, processing and shipment of inventory. This system is based on an efficient warehouse layout, automated machinery, our customized IT system and hand-held scanners. The typical process that each lot of inventory undergoes is outlined below.
11
CSLs and FSLs
Our warehouse operations are divided between Central Stocking Locations, or CSLs, and Forward Stocking Locations, or FSLs. Our primary CSL is located at our global headquarters in Valencia, California. We also operate a CSL in Wichita, Kansas, which primarily serves our global Electronics Products Group or EPG business, and a CSL in Clayton West, U.K., which primarily serves Europe, India and the Middle East. Our CSLs serve as the primary supply warehouses for most of our net sales and also house our procurement, customer service, document control, IT, material support and quality assurance functions. Our CSLs are supported by sales offices throughout the U.S., Canada, United Kingdom, Germany, France, Italy and China.
Complementing our CSLs and sales offices are FSLs. An FSL is a specialized stocking point for one or more JIT contracts located within a geographic region. FSLs are typically located either near or within a customer facility and are established to support large contracts. In certain instances, FSLs initially established to service a single customer are expanded to service other regional customers.
Receiving
All inventory enters our warehouses through a common receiving area. When shipments are received, each package is opened and the documentation is examined. If the documentation is missing or deficient, the shipment is either returned to the supplier or set aside in a designated holding area until accurate documentation is received. If the documentation is acceptable, a Wesco employee inputs the relevant information into our inventory management system, including the SKU, lot number, receipt date, quantity and unit cost.
Quality Assurance
After a shipment has gone through receiving, it is then processed by our QA department. This department inspects the inventory we purchase to ensure the accuracy and completeness of documentation. We also maintain an electronic copy of the relevant certifications for the inventory, which can include a manufacturer certificate of conformance, test reports, process certifications, material distributor certifications and raw material mill certifications. In addition, dimensional inspections are performed on all lots from suppliers that are not certified by our QA department, and all lots for our JIT customers undergo dimensional, and in some cases, structural inspections. For many of our customers, these inspections are conducted at our in-house laboratory, where we operate sophisticated testing equipment.
Stocking
Inventory that passes the quality assurance inspection is placed on a conveyor to a staging area, where warehouse employees assign stocking locations to the parts. Upon arrival at the designated stocking location, an employee scans the bar code affixed to the lot of inventory and the bar code corresponding to the specific shelf location where the lot is to be placed. This stocking information is then transmitted wirelessly to our inventory management system.
Picking
When we receive a purchase order from a customer, notification is sent to the warehouse, where an employee uses a picker truck to retrieve the required part from its stocking location. Each picker truck is equipped with scales used to count the requested number of parts. Each different part type is then placed in a clear plastic bag and sealed. Labels are then generated using hand-held equipment and placed on the bags, and any required documentation is printed and placed along with the bags into color coded crates (crates are color coded based on order urgency so warehouse staff can effectively prioritize shipping requirements). The crates then travel on a conveyer system to the shipping area.
12
Shipping
Upon arriving in the shipping area, parts bags and related documentation are placed into boxes and sealed. The shipping clerk enters the order into a third-party shipping system, generating a label based on the shipping requirements for that customer (e.g., FedEx, UPS, DHL, etc.). Once processed, the system uploads tracking numbers and freight costs, if applicable, and can send an automatic notification to a customer that their order has shipped, or automatically send documentation via e-mail to a freight forwarder to prepare shipments for export. A variety of shipping options are available (same day, overnight, etc.) depending on customer requirements. The picking and shipping processes are organized such that, if necessary, we are able to ship product on the same day a purchase order is received in order to satisfy urgent customer requirements.
Information Technology System
Our scalable IT infrastructure is based on IBM servers and the Oracle JD Edwards EnterpriseOne, or JDE, ERP system. Our IT system provides a powerful, highly distributed computing environment that enables us to quickly scale on demand as business dictates. We also employ virtualization technology to increase system availability, reduce hardware and maintenance costs and respond efficiently to market dynamics. Our entire data services infrastructure runs 24/7 and is protected by network security technologies, an uninterrupted power supply and a backup diesel generator. Remote access to our systems is provided via separate, high speed connections. Our IT infrastructure supports our business critical applications, such as JDE, TRA/X Shipping, AIMS Warehouse Management, or AIMS, and Electronic Data Interchange, or EDI.
At the core of our IT system is our JDE ERP system. JDE covers the full lifecycle of our distribution process, including procurement, planning, supply chain management, sales and accounting. JDE is fully capable of interfacing with external business systems and we have developed additional functionality within JDE for JIT delivery and direct line feed of the products we sell. This functionality includes recognition of signals and actions to fill customer bins from hand-held scanners, min/max data or proprietary signals from a customer's ERP system. JDE also supports our EDI functionality, which allows our system to interface with customers and suppliers, regardless of technology, data format or connectivity.
For our shipping logistics and export compliance support, we employ Precision Software's TRA/X. TRA/X enables us to ship globally while maintaining tracking numbers and rating information for each customer shipment. In addition, at several of our distribution facilities, we use Minerva's AIMS inventory management system in order to provide the best possible warehouse flow and cycle times. AIMS is tailored to fit our global warehouse operational needs and allows us to provide an expandable warehouse management system that can also incorporate transaction processing, work-in-progress and other manufacturing operations. AIMS interfaces with a broad range of material handling equipment, including horizontal and vertical carousels, conveyors, sorting equipment, pick systems and cranes.
Competition
The industry in which we operate is highly competitive and fragmented. We believe the principal competitive factors in our industry include the ability to provide superior customer service and support, on-time delivery, sufficient inventory availability, competitive pricing and an effective quality assurance program. Our competitors include both U.S. and foreign companies, including divisions of larger companies, some of which have significantly greater financial resources than we do, and therefore may be able to adapt more quickly to changes in customer requirements than we can. In addition to facing competition for JIT customers from our primary competitors, JIT customers or potential JIT customers may also determine that it is more cost effective to establish or re-establish an in-house supply chain
13
management system. Under these circumstances, we may be unable to sufficiently reduce our costs in order to provide competitive pricing while also maintaining acceptable operating margins.
Sales and Marketing
As of September 30, 2011, we employed 242 sales personnel with an average of over 8 years of experience at Wesco. Our sales professionals as of that date were located in the following regions: 180 in the U.S., 46 in Europe, 13 in Canada and 3 in Asia. Our marketing efforts are continuing to expand into emerging markets, including a recent office opening in India. We believe that maintaining both inside and outside sales representatives who are extremely facile in the technical details of the products we sell provides a substantial competitive advantage over our smaller competitors. As of September 30, 2011, we had 221 inside sales representatives who provide access to our entire inventory, as well as technical expertise on the products we sell. In addition, as of September 30, 2011, we also had 21 outside sales representatives, or OSRs, worldwide who provide support at certain of our customer sites. The support provided by these OSRs includes making recommendations for the products best suited for specific applications, providing technical assistance with drilling and the installation of fasteners and troubleshooting issues relating to installation tooling. Our OSRs' hands-on expertise and access to the customer site allows them a unique opportunity to market additional products to our customers.
Employees
As of September 30, 2011, we employed 1,014 personnel worldwide, 122 of which were located at customer sites. We have 245 employees located outside of North America. We are not a party to any collective bargaining agreements with our employees.
Regulatory Matters
Governmental agencies throughout the world, including the U.S. Federal Aviation Administration, or the FAA, prescribe standards for aircraft components, including virtually all commercial airline and general aviation products, as well as regulations regarding the repair and overhaul of airframes and engines. Specific regulations vary from country to country, although compliance with FAA requirements generally satisfies regulatory requirements in other countries. In addition, the products we distribute must also be certified by aircraft and engine OEMs. If any of the material authorizations or approvals that allow us to supply products is revoked or suspended, then the sale of the related products would be prohibited by law, which would have an adverse effect on our business, financial condition and results of operations.
From time to time, the FAA or equivalent regulatory agencies in other countries propose new regulations or changes to existing regulations, which are usually more stringent than existing regulations. If these proposed regulations are adopted and enacted, we could incur significant additional costs to achieve compliance, which could have a material adverse effect on our business, financial condition and results of operations.
We are also subject to government rules and regulations that include the FCPA, ITAR and the False Claims Act. See "Risk Factors—We are subject to unique business risks as a result of supplying equipment and services to the U.S. Government" and "—Our international operations require us to comply with anti-corruption laws and regulations of the U.S. government and various international jurisdictions."
Environmental Matters
Although we are subject to various environmental regulations, we are not aware of any environmental issues that would be likely to have a materially adverse impact upon our business or financial condition.
14
Available Information
We file annual, quarterly and current reports and other information with the SEC. You may read and copy any documents that we file at the SEC's public reference room at 100 F Street, N.E., Washington, D.C. 20549. You may call the SEC at 1-800-SEC-0330 to obtain further information about the public reference room. In addition, the SEC maintains an Internet website (www.sec.gov) that contains reports, proxy and information statements and other information regarding registrants that file electronically with the SEC, including us. You may also access, free of charge, our reports filed with the SEC (for example, our Annual Report on Form 10-K, our Quarterly Reports on Form 10-Q and our Current Reports on Form 8-K and any amendments to those forms) through the "Investor Relations" portion of our Internet website (www.wescoair.com). Reports filed with or furnished to the SEC will be available as soon as reasonably practicable after they are filed with or furnished to the SEC. Our website is included in this Annual Report as an inactive textual reference only. The information found on our website is not part of this or any other report filed with or furnished to the SEC.
15
You should consider and read carefully all of the risks and uncertainties described below, as well as other information included in this Annual Report, including our consolidated financial statements and related notes. The risks described below are not the only ones facing us. The occurrence of any of the following risks or additional risks and uncertainties not presently known to us or that we currently believe to be immaterial could materially and adversely affect our business, financial condition, or results of operations. This Annual Report also contains forward-looking statements and estimates that involve risks and uncertainties. Our actual results could differ materially from those anticipated in the forward-looking statements as a result of specific factors, including the risks and uncertainties described below.
Risks Related to Our Business and Industry
We are directly dependent upon the condition of the aerospace industry, which is closely tied to global economic conditions, and if the volatility in the global financial markets were to result in a slowdown in the current economic recovery or a return to a recession, our business, financial condition and results of operations could be negatively impacted.
Demand for the products and services we offer is directly tied to the delivery of new aircraft and aircraft utilization, which, in turn, is impacted by global economic conditions. Although the economy has exhibited signs of recovery, global financial markets have experienced extreme volatility and disruption for nearly three years, which, at times, reached unprecedented levels as a result of the financial crisis affecting the banking system and participants in the global financial markets. Concerns over the tightening of the corporate credit markets, sovereign debt, inflation, energy costs and the dislocation of the real estate and mortgage markets have contributed to the volatility in the global financial markets and, together with the global financial crisis, have created uncertainties for global economic conditions in the future. The aerospace industry is particularly sensitive to changes in economic conditions. In 2009, revenue passenger miles, or RPMs, on commercial aircraft declined due to the global recession. During the same period, the industry experienced declines in large commercial, regional jet and business jet deliveries. While demand for commercial jets has recovered somewhat, both regional and business jet orders and deliveries have recovered more slowly. A slowdown in the current economic recovery or a return to a recession would negatively impact the aerospace industry, and could negatively impact our business, financial condition and results of operations.
Military spending, including spending on the products we sell, is dependent upon national defense budgets, and a reduction in military spending could have a material adverse effect on our business, financial condition and results of operations.
During the year ended September 30, 2011, approximately 47% of our net sales were related to military aircraft. The military market is significantly dependent upon government budget trends, particularly the U.S. Department of Defense, or DoD, budget. Future DoD budgets could be negatively impacted by several factors, including, but not limited to, a change in defense spending policy by the current and future presidential administrations and Congress, the U.S. Government's budget deficits, spending priorities, the cost of sustaining the U.S. military presence in overseas operations and possible political pressure to reduce U.S. Government military spending, each of which could cause the DoD budget to decline. A decline in U.S. military expenditures could result in a reduction in military aircraft production, which could have a material adverse effect on our business, financial condition and results of operations.
In particular, military spending may be negatively impacted by the Budget Control Act of 2011 (the "Budget Act"), which was passed in August 2011. The Budget Act calls for a $917.0 billion reduction in discretionary spending over the next decade, and also created a joint committee of Congress (the "Super Committee") that was responsible for identifying up to an additional $1.5 trillion
16
in deficit reductions by November 23, 2011. The Super Committee failed to reach an agreement by the November 23, 2011 deadline, and accordingly, $1.2 trillion in automatic spending cuts split between defense and non-defense programs are currently scheduled to be triggered beginning in 2013. We are unable to predict the impact such cuts, if enacted, would have on funding for the military programs which we support. However, such cuts could result in reductions, delays or cancellations of these programs, which could have a material adverse effect on our business, financial condition and results of operations.
We are subject to unique business risks as a result of supplying equipment and services to the U.S. Government directly and as a subcontractor, which could lead to a reduction in our net sales from, or the profitability of our supply arrangements with, the U.S. Government.
Companies engaged in supplying defense-related equipment and services to U.S. Government agencies are subject to business risks specific to the defense industry. We contract directly with the U.S. Government and as a subcontractor to customers contracting with the U.S. Government. These risks include the ability of the U.S. Government to unilaterally suspend us from receiving new contracts pending resolution of alleged violations of procurement laws or regulations, reduce the value of existing contracts and audit our contract-related costs and fees. In addition, most of our U.S. Government contracts and subcontracts can be terminated by the U.S. Government or the contracting party, as applicable, at its convenience. Termination for convenience provisions provide only for our recovery of costs incurred or committed, settlement expenses and profit on the work completed prior to termination.
In addition, the U.S. Government may seek to review our costs to determine whether our pricing is "fair and reasonable." Such a review could be costly and time consuming for our management and could distract from our ability to effectively manage the business. As a result of such a review, we could be required to provide a refund to the U.S. Government or we could be asked to enter into an arrangement whereby our prices would be based on cost or the DoD could seek to pursue alternative sources of supply for our parts. Any of those occurrences could lead to a reduction in our net sales from, or the profitability of certain of our supply arrangements with, certain agencies and buying organizations of the U.S. Government.
We are also subject to the federal False Claims Act, which provides for substantial civil penalties and treble damages where a contractor presents a false or fraudulent claim to the government for payment. Actions under the False Claims Act may be brought by the government or by other persons on behalf of the government (who may then share in any recovery).
We do not have guaranteed future sales of the products we sell and when we enter into JIT contracts and LTAs with our customers we generally take the risk of cost overruns, and our business, financial condition, results of operations and operating margins may be negatively affected if we purchase more products than our customers require, product costs increase unexpectedly, we experience high start up costs on new contracts or our contracts are terminated.
Our JIT contracts and LTAs are long-term, fixed-price agreements with no guarantee of future sales volumes, and they may be terminated for convenience on short notice by our customers, often without meaningful penalties, provided that we are reimbursed for the cost of any inventory specifically procured for the customer. In addition, we purchase inventory based on our forecasts of anticipated future customer demand. As a result, we may take the risk of having excess inventory in the event that our customers do not place orders consistent with our forecasts. We also run the risk of not being able to pass along or otherwise recover unexpected increases in our product costs, including as a result of commodity price increases, which may increase above our established prices at the time we entered into the customer contract and established prices for parts we provide. We were recently awarded a major new JIT contract. When we are awarded new contracts, particularly JIT contracts, we may incur high
17
costs, including salary and overtime costs to hire and train on-site personnel, in the start up phase of our performance. In the event that we purchase more products than our customers require, product costs increase unexpectedly, we experience high start up costs on new contracts or our contracts are terminated, our business, financial condition, results of operations and operating margins could be negatively affected.
If we lose significant customers, significant customers materially reduce their purchase orders or significant programs on which we rely are delayed, scaled back or eliminated, our business, financial condition and results of operations may be adversely affected.
Our top ten customers for the year ended September 30, 2011 accounted for approximately 49% of our net sales. Boeing was our largest customer during fiscal 2011, accounting for approximately 16% of our net sales through purchases by its various divisions and subsidiaries. A reduction in purchasing by or loss of one of our larger customers for any reason, such as changes in manufacturing practices, loss of a customer as a result of the acquisition of such customer by a purchaser who does not fully utilize a distribution model or uses a competitor, in-sourcing by customers, a transfer of business to a competitor, an economic downturn, failure to adequately service our clients, decreased production or a strike, could have a material adverse effect on our business, financial condition and results of operations.
As an example of changes in manufacturing practices that could impact us, OEMs such as Boeing and Airbus are currently incorporating an increasing amount of composite materials in the aircraft they manufacture. Aircraft utilizing composite materials generally require the use of significantly fewer C class aerospace parts than new aircraft made of more traditional non-composite materials, although the parts used are generally higher priced than C class aerospace parts used in non-composite aircraft structures. As Boeing, Airbus and other customers increase their reliance on composite materials, they may materially reduce their purchase orders from us.
During fiscal 2011, we were notified by Boeing of its intent to perform certain supply chain management functions in-house that we were providing at two facilities under JIT contracts that were awarded to us prior to these particular facilities being acquired by Boeing. In fiscal 2011, JIT sales at these facilities accounted for approximately 3.1% of net sales.
As an example of the potential loss of business due to customer in-sourcing, it is our understanding that Boeing is undertaking an initiative to cause its first and second tier suppliers to source certain Boeing-specific materials, including fasteners, directly from manufacturers, rather than through distributors such as us. If Boeing's initiative is broadly implemented, a portion of our sales to these Boeing suppliers, and consequently our business, financial condition and results of operations, could be adversely affected.
While we believe that we have a diversified customer and aircraft program base, we expect to derive a significant portion of our net sales from certain aerospace programs in their early production stages. In particular, our future growth will be dependent, in part, upon our sales to various OEMs and subcontractors related to the Boeing 787 and the Lockheed Martin JSF. If production of any of the programs we support is terminated or delayed, or if our sales to customers affiliated with these programs are reduced or eliminated, our business, financial condition and results of operations could be adversely affected.
We operate in a highly competitive market and our failure to compete effectively may negatively impact our results of operations.
We operate in a highly competitive global industry and compete against a number of companies, including divisions of larger companies, some of which may have significantly greater financial resources than we do, and therefore may be able to adapt more quickly to changes in customer requirements
18
than we can. Our competitors consist of both U.S. and foreign companies and range in size from divisions of large public corporations to small privately held entities. We believe that our ability to compete depends on superior customer service and support, on-time delivery, sufficient inventory availability, competitive pricing and effective quality assurance programs. In order to remain competitive, we may have to adjust the prices of some of the products and services we sell and continue investing in our procurement, supply-chain management and sales and marketing functions, the costs of which could negatively impact our results of operations.
In addition, we face competition for our JIT and LTA customers from both competitors in our industry and the in-sourcing of supply-chain management by our customers themselves. If any of our JIT or LTA customers decides to in-source the services we provide or switch to one of our competitors, we would be adversely affected.
We may be unable to effectively manage our inventory as we grow, which could have a material adverse effect on our business, financial condition and results of operations.
We have experienced rapid growth in recent periods and intend to continue to grow our business by increasing our product offerings and expanding our customer base. Due to the lead times required by our suppliers, we order products in advance of expected sales, and the volume of such orders may be significant as a result of our growth strategy. Lead times generally range from several weeks up to two years, depending on industry conditions, which make it difficult to successfully manage our inventory as we plan for expected growth. For example, in 2009, our cash flows were negatively impacted as our suppliers continued filling orders that we had placed in anticipation of future sales, while orders from our customers slowed because the aerospace industry had entered a significant downturn. In the future, if we are unable to effectively manage our inventory as we attempt to grow our business, our cash flows may be negatively affected, which could have a material adverse effect on our business, financial condition and results of operations.
If suppliers are unable to supply us with the products we sell in a timely manner, in adequate quantities and/or at a reasonable cost, we may be unable to meet the demands of our customers, which could have a material adverse effect on our business, financial condition and results of operations.
Our inventory is primarily sourced directly from manufacturing firms, and we depend on the availability of large supplies of the products we sell. Our largest supplier for the year ended September 30, 2011 was Alcoa Fastening Systems. During fiscal 2011, approximately 22% of the products we purchased were from Alcoa Fastening Systems and 20% were purchased from Precision Castparts. In addition, our ten largest suppliers during fiscal 2011 accounted for approximately 56% of our purchases. These manufacturers may experience capacity constraints that result in their being unable to supply us with products in a timely manner, in adequate quantities and/or at a reasonable cost. Contributing factors to manufacturer capacity constraints include, among other things, industry or customer demands in excess of machine capacity, labor shortages and changes in raw material flows. Any significant interruption in the supply of these products or termination of our relationship with any of our suppliers could result in us being unable to meet the demands of our customers, which would have a material adverse effect on our business, financial condition and results of operations.
Our business is highly dependent on complex information technology.
The provision and application of IT is an increasingly critical aspect of our business. Among other things, our IT system must frequently interact with those of our customers, suppliers and logistics providers. Our future success will depend on our continued ability to employ an IT system that meets our customers' demands. The failure of the hardware or software that supports our IT system, including redundancy systems, could significantly disrupt our ability to service our customers and cause economic losses for which we could be held liable and which could damage our reputation.
19
Our competitors may have or may develop IT systems that permit them to be more cost effective and otherwise better situated to meet customer demands than we are able to acquire or develop. Larger competitors may be able to develop or license IT systems more cost effectively than we can by spreading the cost across a larger revenue base, and competitors with greater financial resources may be able to acquire or develop IT systems that we cannot afford. If we fail to meet the demands of our customers or protect against disruptions of our IT system, we may lose customers, which could seriously harm our business and adversely affect our operating results and operating cash flow.
We may be unable to retain personnel who are key to our operations.
Our success, among other things, is dependent on our ability to attract, develop and retain highly qualified senior management and other key personnel. Competition for key personnel is intense, and our ability to attract and retain key personnel is dependent on a number of factors, including prevailing market conditions and compensation packages offered by companies competing for the same talent. The inability to hire, develop and retain these key employees may adversely affect our operations.
There are risks inherent in international operations that could have a material adverse effect on our business, financial condition and results of operations.
While the majority of our operations are based in the United States, we have significant international operations, with facilities in Canada, China, France, Germany, Israel, Italy, Saudi Arabia, South Korea and the United Kingdom, and customers throughout North America, Latin America, Europe, Asia and the Middle East. For the years ended September 30, 2011 and 2010, 30% and 26%, respectively, of our net sales were derived from customers located outside the United States.
Our international operations are subject to, without limitation, the following risks:
- •
- the burden of complying with multiple and possibly conflicting laws and any unexpected changes in regulatory requirements;
- •
- political risks, including risks of loss due to civil disturbances, acts of terrorism, acts of war, guerilla activities
and insurrection;
- •
- unstable economic, financial and market conditions and increased expenses as a result of inflation, or higher interest
rates;
- •
- difficulties in enforcement of third-party contractual obligations and collecting receivables through foreign legal
systems;
- •
- difficulties in staffing and managing international operations and the application of foreign labor regulations;
- •
- differing local product preferences and product requirements; and
- •
- potentially adverse tax consequences from changes in tax laws, requirements relating to withholding taxes on remittances and other payments by subsidiaries and restrictions on our ability to repatriate dividends from our subsidiaries.
In addition, fluctuations in the value of foreign currencies affect the dollar value of our net investment in foreign subsidiaries, with these fluctuations being included in a separate component of stockholders' equity. At September 30, 2011, we reported a cumulative foreign currency translation adjustment of approximately $0.7 million in stockholders' equity as a result of foreign currency adjustments, and we may incur additional adjustments in future periods. In addition, operating results of foreign subsidiaries are translated into U.S. dollars for purposes of our statement of operations at average monthly exchange rates. Moreover, to the extent that our net sales are not denominated in the same currency as our expenses, our net earnings could be materially adversely affected. For example, a
20
portion of labor, material and overhead costs for our facilities in the United Kingdom, Germany, France and Italy are incurred in British Pounds or Euros, but the related net sales are generally denominated in U.S. dollars. Changes in the value of the U.S. dollar or other currencies could result in material fluctuations in foreign currency translation amounts or the U.S. dollar value of transactions and, as a result, our net earnings could be materially adversely affected. Although we at times engage in hedging transactions to manage or reduce our foreign exchange risk, our attempts to manage our foreign currency exchange risk may not be successful and, as a result, our business, financial condition and results of operations could be materially adversely affected. For example, in fiscal 2009, the strengthening of the U.S. dollar relative to the British pound resulted in a negative impact on net sales of approximately $22.1 million while in fiscal 2011 and 2010, the weakening of the U.S. dollar relative to the British pound resulted in a positive impact of approximately $2.7 million and $0.1 million respectively. Although we at times engage in hedging transactions to manage or reduce our foreign exchange risk, our attempts to manage our foreign currency exchange risk may not be successful and, as a result, our business, financial condition and results of operations could be materially adversely affected.
Our international operations also cause our business to be subject to the U.S. Export Control regime and similar regulations in other countries, in particular in the United Kingdom. In the United States, items of a commercial nature are generally subject to regulatory control by the U.S. Department of Commerce's Bureau of Industry and Security and to Export Administration Regulations, and other international trade regulations may apply as well. Additionally, we are not permitted to export some of the products we sell. In the future, regulatory authorities may require us to obtain export licenses or other export authorizations to export the products we sell abroad, depending upon the nature of items being exported, as well as the country to which the export is to be made. We cannot assure you that any of our applications for export licenses or other authorizations will be granted or approved. Furthermore, the export license and export authorization process is often time-consuming. Violation of export control regulations could subject us to fines and other penalties, such as losing the ability to export for a period of years, which would limit our sales and significantly hinder our attempts to expand our business internationally.
Our international operations require us to comply with anti-corruption laws and regulations of the U.S. government and various international jurisdictions, and our failure to comply with these laws and regulations could adversely affect our reputation, business, financial condition and results of operations.
Doing business on a worldwide basis requires us and our subsidiaries to comply with the laws and regulations of the U.S. government and various international jurisdictions, and our failure to successfully comply with these rules and regulations may expose us to liabilities. These laws and regulations apply to companies, individual directors, officers, employees and agents, and may restrict our operations, trade practices, investment decisions and partnering activities. In particular, our international operations are subject to U.S. and foreign anti-corruption laws and regulations, such as the U.S. Foreign Corrupt Practices Act, or FCPA. The FCPA prohibits us from providing anything of value to foreign officials for the purposes of influencing official decisions or obtaining or retaining business or otherwise obtaining favorable treatment, and requires companies to maintain adequate record-keeping and internal accounting practices to accurately reflect the transactions of the company. As part of our business, we deal with state-owned business enterprises, the employees and representatives of which may be considered foreign officials for purposes of the FCPA. In addition, some of the international locations in which we operate lack a developed legal system and have elevated levels of corruption. As a result of the above activities, we are exposed to the risk of violating anti-corruption laws.
We are also subject to International Traffic in Arms Regulation, or ITAR. ITAR requires export licenses from the U.S. Department of State for products shipped outside the U.S. that have military or
21
strategic applications. Violations of these legal requirements are punishable by criminal fines and imprisonment, civil penalties, disgorgement of profits, injunctions, debarment from government contracts as well as other remedial measures. We have established policies and procedures designed to assist us and our personnel to comply with applicable U.S. and international laws and regulations. However, there can be no assurance that our policies and procedures will effectively prevent us from violating these regulations in every transaction in which we may engage, and such a violation could adversely affect our reputation, business, financial condition and results of operations.
If any of our customers were to become insolvent or experience substantial financial difficulties, our business, financial condition and results of operations may be adversely affected.
If any of the customers with whom we do business becomes insolvent or experiences substantial financial difficulties we may be unable to timely collect amounts owed to us by such customers and may not be able to sell the inventory we have purchased for such customers, which could have a material adverse effect on our business, financial condition and results of operations. For example, during the year ended September 30, 2009, we wrote off a receivable of $2.4 million and inventory of approximately $1.8 million after one of our customers filed for bankruptcy protection. The majority of these write-offs were recorded as a reduction to receivable and inventory reserves taken during prior fiscal years.
We, our suppliers or our customers may experience damage to or disruptions at our or their facilities caused by natural disasters and other factors, which may result in our business, financial condition and results of operations being adversely affected.
Several of our facilities or those of our suppliers and customers could be subject to a catastrophic loss caused by earthquakes, tornadoes, floods, hurricanes, fire, power loss, telecommunication and information systems failure or other similar events. Should insurance be insufficient to recover all such losses or should we be unable to reestablish our operations, or if our customers or suppliers were to experience material disruptions in their operations as a result of such events, our business, financial condition and results of operations could be adversely affected.
We are dependent on access to and the performance of third-party package delivery companies.
Our ability to provide efficient distribution of the products we sell to our customers is an integral component of our overall business strategy. We do not maintain our own delivery networks, and instead rely on third-party package delivery companies. We cannot assure you that we will always be able to ensure access to preferred delivery companies or that these companies will continue to meet our needs or provide reasonable pricing terms. In addition, if the package delivery companies on which we rely experience delays resulting from inclement weather or other disruptions, we may be unable to maintain products in inventory and deliver products to our customers on a timely basis, which may adversely affect our business, financial condition and results of operations.
A significant labor dispute involving us or one or more of our customers or suppliers, or a labor dispute that otherwise affects our operations, could reduce our net sales and harm our profitability.
Labor disputes involving us or one or more of our customers or suppliers could affect our operations. If our customers or suppliers are unable to negotiate new labor agreements and our customers' or suppliers' plants experience slowdowns or closures as a result, our net sales and profitability could be negatively impacted.
While our employees are not currently unionized, they may attempt to form unions in the future, and the employees of our customers, suppliers and other service providers may be, or may in the future be, unionized. We cannot assure you that there will not be any strike, lock out or material labor dispute with respect to our business or those of our customers or suppliers in the future that materially affects our business, financial condition and results of operations.
22
We may be materially adversely affected by high fuel prices.
Fluctuations in the global supply of crude oil and the possibility of changes in government policies on the production, transportation and marketing of jet fuel make it impossible to predict the future availability and price of jet fuel. In the event there is an outbreak or escalation of hostilities or other conflicts or significant disruptions in oil production or delivery in oil-producing areas or elsewhere, there could be reductions in the production or importation of crude oil and significant increases in the cost of jet fuel. If there were major reductions in the availability of jet fuel or significant increases in its cost, commercial airlines would face increased operating costs. Due to the competitive nature of the airline industry, airlines are often unable to pass on increases in fuel prices to customers by increasing fares. As a result, an increase in jet fuel could result in a decrease in net income from either lower margins or, if airlines increase ticket fares, less net sales from reduced airline travel. Decreases in airline profitability could decrease the demand for new commercial aircraft, resulting in delays of or reductions in deliveries of commercial aircraft that utilize the products we sell, and, as a result, our business, financial condition and results of operations could be materially adversely affected.
Our financial results may fluctuate from period-to-period, making quarter-to-quarter comparisons of our business, financial condition and results of operations less reliable indicators of our future performance.
There are many factors, such as the cyclical nature of the aerospace industry, fluctuations in our ad hoc sales, delays in major aircraft programs, downward pressure on sales prices and changes in the volume of our customers' orders, that could cause our financial results to fluctuate from period-to-period. For example, during the year ended September 30, 2011, approximately 39% of our net sales were derived from ad hoc sales. The prices we charge for ad hoc sales are typically higher than the prices under our JIT contracts or LTAs. However, ad hoc customers may not continue to purchase the same amount of products from us as they have in the past, so we cannot assure you that in any given year we will be able to generate similar net sales from our ad hoc customers as we did in the past. We are also actively working to transition customers from ad hoc purchases to multi-year LTAs or comprehensive JIT supply chain management agreements, which may also result in a reduction in ad hoc purchases. A significant diminution in our ad hoc sales in any given period could result in fluctuations in our financial results and operating margins. As a result of these factors, we believe that quarter-to-quarter comparisons of our financial results are not necessarily meaningful and that these comparisons cannot be relied upon as indicators of future performance.
We will continue to be controlled by Carlyle and its affiliates, whose interests in our business may be different than yours.
The interests of Carlyle and its affiliates could conflict with yours. As of September 30, 2011, certain funds affiliated with Carlyle own approximately 62.5% of our common stock. As a result of this ownership, Carlyle continues to have substantial influence over the outcome of votes on all matters requiring approval by our stockholders, including the election of directors, the adoption of amendments to our certificate of incorporation and bylaws and approval of significant corporate transactions. Carlyle is also able to take actions that have the effect of delaying or preventing a change in control of the Company or discouraging others from making tender offers for our shares, which could prevent stockholders from receiving a premium for their shares. These actions may be taken even if other stockholders oppose them. Moreover, this concentration of stock ownership may make it difficult for stockholders to replace management and may also adversely affect the trading price for our common stock because investors often perceive disadvantages in owning stock in companies with controlling stockholders. In addition, pursuant to the Amended and Restated Stockholders Agreement, Carlyle will continue to have certain rights to appoint directors to our board of directors and Randy Snyder, Susan Snyder, certain affiliates of Mr. Snyder and certain of our employees, which we collectively refer to as
23
the Wesco Stockholders, are required to vote their shares in favor of such directors. In addition, Carlyle and its affiliates may also in the future own businesses that directly compete with ours.
We are a "controlled company" within the meaning of the rules of the New York Stock Exchange and, as a result, intend to rely on exemptions from certain corporate governance requirements. You will not have the same protections afforded to stockholders of companies that are subject to such requirements.
We expect that Carlyle will continue to control a majority of the voting power of our outstanding common stock. As a result, we expect to be a "controlled company" within the meaning of the corporate governance standards of the New York Stock Exchange. Under these rules, a company of which more than 50% of the voting power is held by an individual, group or another company is a "controlled company" and may elect not to comply with certain corporate governance requirements, including:
- •
- the requirement that a majority of the board of directors consist of independent directors;
- •
- the requirement that we have a nominating and corporate governance committee that is composed entirely of independent
directors with a written charter addressing the committee's purpose and responsibilities;
- •
- the requirement that we have a compensation committee that is composed entirely of independent directors with a written
charter addressing the committee's purpose and responsibilities; and
- •
- the requirement for an annual performance evaluation of the nominating and corporate governance and compensation committees.
We intend to utilize these exemptions if we continue to qualify as a "controlled company." For these purposes, as a result of the provisions of the Amended and Restated Stockholders Agreement, the Wesco Stockholders and the affiliates of Carlyle that own shares will be treated as a "group," and therefore the Wesco Stockholders' shares will be included in determining whether we are a controlled company. If we utilize these exemptions we will not have a majority of independent directors and our nominating and corporate governance and compensation committees will not consist entirely of independent directors and such committees will not be subject to annual performance evaluations. Accordingly, you will not have the same protections afforded to stockholders of companies that are subject to all of the corporate governance requirements of the New York Stock Exchange.
We will incur a significant increased in costs as a result of operating as a publicly traded company, and our management will be required to devote substantial time to new compliance requirements and investor needs.
As a publicly traded company, we will incur significant legal, accounting and other expenses. In addition, the Sarbanes-Oxley Act of 2002, or the Sarbanes-Oxley Act, and the rules of the Securities and Exchange Commission, or the SEC, and the New York Stock Exchange have imposed various requirements on public companies. Our management and other personnel will need to devote a substantial amount of time to these compliance initiatives. Moreover, these rules and regulations will increase our legal and financial compliance costs and will make some activities more time-consuming and costly. For example, we expect these rules and regulations to make it more difficult and more expensive for us to obtain director and officer liability insurance, and we may be required to incur substantial costs to maintain appropriate levels of coverage.
If we fail to maintain proper and effective internal controls, our ability to produce accurate and timely financial statements could be impaired and investors' views of us could be harmed.
The Sarbanes-Oxley Act requires, among other things, that we maintain effective internal control over financial reporting and disclosure controls and procedures. In particular, we must perform system
24
and process evaluation and testing of our internal control over financial reporting to allow management and, to the extent required, our independent registered public accounting firm to report on the effectiveness of our internal control over financial reporting, as required by Section 404 of the Sarbanes-Oxley Act, with auditor attestation of the effectiveness of our internal controls, beginning with our annual report on Form 10-K for the fiscal year ending September 30, 2012. If we are not able to comply with the requirements of Section 404 in a timely manner, or if we or our independent registered public accounting firm identify deficiencies in our internal control over financial reporting that are deemed to be material weaknesses, the market price of shares of our common stock could decline and we could be subject to sanctions or investigations by the New York Stock Exchange, the SEC or other regulatory authorities, which would require additional financial and management resources.
Our ability to successfully implement our business plan and comply with Section 404 requires us to be able to prepare timely and accurate financial statements. Any delay in the implementation of, or disruption in the transition to, new or enhanced systems, procedures or controls, may cause our operations to suffer and we may be unable to conclude that our internal control over financial reporting is effective and to obtain an unqualified report on internal controls from our auditors if required under Section 404 of the Sarbanes-Oxley Act. Moreover, we cannot be certain that these measures would ensure that we implement and maintain adequate controls over our financial processes and reporting in the future. Even if we were to conclude, and our auditors were to concur, that our internal control over financial reporting provided reasonable assurance regarding the reliability of financial reporting and the preparation of financial statements for external purposes in accordance with accounting principles generally accepted in the U.S., or GAAP, because of its inherent limitations, internal control over financial reporting may not prevent or detect fraud or misstatements. This, in turn, could have an adverse impact on the trading price of our shares of common stock, and could adversely affect our ability to access the capital markets.
We are subject to health, safety and environmental laws and regulations, any violation of which could subject us to significant liabilities and penalties.
We are subject to extensive and changing federal, state, local and foreign laws and regulations establishing health, safety and environmental quality standards and may be subject to liability or penalties for violations of those standards. We are also subject to laws and regulations governing remediation of contamination at facilities currently or formerly owned or operated by us or to which we have sent hazardous substances or wastes for treatment, recycling or disposal. We may be subject to future liabilities or obligations as a result of new or more stringent interpretations of existing laws and regulations. In addition, we may have liabilities or obligations in the future if we discover any environmental contamination or liability at any of our facilities, or at facilities we may acquire.
Our reputation and/or our business, financial condition and results of operations could be adversely affected if one of the products we sell causes an aircraft to crash.
We may be exposed to liabilities for personal injury, death or property damage as a result of the failure of a product we have sold. We typically agree to indemnify our customers against certain liabilities resulting from the products we sell. Although we may seek third party indemnification from our suppliers in the event of a product failure, we cannot guarantee that we will be successful in doing so and may ultimately be held liable. While we maintain liability insurance to protect us in these situations, our insurers may attempt to deny coverage or any coverage we have may not be adequate. We also may not be able to maintain insurance coverage in the future at an acceptable cost. Any liability for which third party indemnification is not available that is not covered by insurance could have a material adverse effect on our business, financial condition and results of operations.
25
In addition, a crash caused by one of the products we have sold could damage our reputation for selling quality products. We believe our customers consider safety and reliability as key criteria in selecting a provider of aircraft products and believe our reputation for quality assurance is a significant competitive strength. If a crash were to be caused by one of the products we sold, or if we were to otherwise fail to maintain a satisfactory record of safety and reliability, our ability to retain and attract customers may be materially adversely affected.
We sell products to a highly regulated industry and our business may be adversely affected if our suppliers or customers lose government approvals, if more stringent government regulations are enacted or if industry oversight is increased.
The aerospace industry is highly regulated in the United States and in other countries. The FAA prescribes standards and other requirements for aircraft components in the U.S. and comparable agencies, such as the European Aviation Safety Agency, the Civil Aviation Administration of China and the Japanese Civil Aviation Bureau, regulate these matters in other countries. Our suppliers and customers must generally be certified by the FAA, the DoD and similar agencies in foreign countries. If any of our suppliers' government certifications are revoked, we would be less likely to buy such supplier's products, and, as a result, would need to locate a suitable alternate supply of such products, which we may be unable to accomplish on commercially reasonable terms or at all. If any of our customers' government certifications are revoked, their demand for the products we sell would decline. In each case, our business, financial condition and results of operations may be adversely affected.
In addition, if new and more stringent government regulations are adopted or if industry oversight increases, our suppliers and customers may incur significant expenses to comply with such new regulations or heightened industry oversight. In the case of our suppliers, these expenses may be passed on to us in the form of price increases, which we may be unable to pass along to our customers. In the case of our customers, these expenses may limit their ability to purchase products from us. In each case, our business, financial condition and results of operations may be adversely affected.
We may be unable to successfully consummate or integrate future acquisitions, which could negatively impact our business, financial condition and results of operations.
We may consider future acquisitions, some of which could be material to us. Depending upon the acquisition opportunities available, we may need to raise additional funds through the capital markets or arrange for additional debt financing in order to consummate such acquisitions. We may be unable to raise the capital required for future acquisitions on satisfactory terms or at all, which could adversely affect our business, financial condition and results of operations. In addition, we may not be able to successfully integrate acquired businesses into our operations and may be unable to realize any anticipated benefits from future acquisitions, which failure to do so could negatively impact our business, financial condition and results of operations.
Our total assets include substantial intangible assets, and the write-off of a significant portion of our intangible assets would negatively affect our financial results.
Our total assets reflect substantial intangible assets. At September 30, 2011, goodwill and intangible assets, net represented approximately 45% of our total assets. Goodwill represents the excess of the purchase price of acquired businesses over the fair value of the assets acquired and liabilities assumed resulting from acquisitions, including the Carlyle Acquisition. Intangible assets, net represents tradenames, customer backlogs, non-compete agreements and customer relationships. On at least an annual basis, we assess whether there has been impairment in the value of goodwill and indefinite lived intangible assets. If our testing identifies impairment under generally accepted accounting principles in the United States, the impairment charge we calculate would result in a charge to operating earnings. Any determination requiring the write-off of a significant portion of goodwill and unamortized
26
identified intangible assets would negatively affect our results of operations and total capitalization, which could be material.
Our substantial indebtedness could adversely affect our financial health and could harm our ability to react to changes to our business.
On April 7, 2011, we entered into a new $765.0 million senior secured credit facility with Barclays Bank PLC, as administrative agent and collateral agent, and Merrill Lynch, Pierce, Fenner & Smith, Incorporated, Key Bank, N.A. and Barclays Capital, as joint lead arrangers, which we refer to as the new senior secured credit facilities. We have a significant amount of indebtedness. As of September 30, 2011, our total long-term indebtedness outstanding under our new senior secured credit facilities was approximately $556.0 million, which was approximately 46.9% of our total capitalization.
In addition, we may be able to incur substantial additional indebtedness in the future. Although the new senior secured credit facilities contain restrictions on the incurrence of additional indebtedness, these restrictions are subject to a number of significant qualifications and exceptions, and the indebtedness incurred in compliance with these qualifications and exceptions could be substantial. If we incur additional debt, the risks associated with our substantial leverage would increase.
Our substantial indebtedness could have important consequences to investors. For example, it could:
- •
- increase our vulnerability to general economic downturns and industry conditions;
- •
- require us to dedicate a substantial portion of our cash flow from operations to payments on our indebtedness, thereby
reducing the availability of our cash flow to fund working capital, capital expenditures and other general corporate requirements;
- •
- limit our flexibility in planning for, or reacting to, changes in our business and the industry in which we operate;
- •
- place us at a competitive disadvantage compared to competitors that have less debt; and
- •
- limit, along with the financial and other restrictive covenants contained in the documents governing our indebtedness, among other things, our ability to borrow additional funds, make investments and incur liens.
In addition, all of our debt under the new senior secured credit facilities bears interest at floating rates. Accordingly, in the event that interest rates increase, our debt service expense will also increase.
Our substantial level of indebtedness increases the possibility that we may be unable to generate cash sufficient to pay, when due, the principal of, interest on or other amounts due in respect of our indebtedness. We cannot assure you that our business will generate sufficient cash flow from operations or that future borrowings will be available to us under the new senior secured credit facilities or otherwise in amounts sufficient to enable us to service our indebtedness. If we cannot service our debt, we will have to take actions such as reducing or delaying capital investments, selling assets, restructuring or refinancing our debt or seeking additional equity capital and cannot assure you that we will be successful in implementing any such actions or that any actions we take will allow us to stay in compliance with the terms of our indebtedness.
The terms of the new senior secured credit facilities and other debt instruments may restrict our current and future operations, particularly our ability to respond to changes or to take certain actions.
The new senior secured credit facilities contain a number of restrictive covenants that impose significant operating and financial restrictions on us and may limit our ability to engage in acts that
27
may be in our long-term best interests. The new senior secured credit facilities include covenants restricting, among other things, our ability to:
- •
- incur or guarantee additional indebtedness or issue preferred stock;
- •
- pay distributions on, redeem or repurchase our capital stock or redeem or repurchase our subordinated debt;
- •
- make investments;
- •
- sell assets;
- •
- enter into agreements that restrict distributions or other payments from our restricted subsidiaries to us;
- •
- incur or allow existing liens;
- •
- consolidate, merge or transfer all or substantially all of our assets;
- •
- engage in transactions with affiliates;
- •
- enter into sale leaseback transactions;
- •
- change fiscal periods;
- •
- enter into agreements that restrict the granting of liens or the making of subsidiary distributions;
- •
- create unrestricted subsidiaries; and
- •
- engage in certain business activities.
In addition, the new senior secured credit facilities contain financial maintenance covenants, including a maximum leverage ratio covenant and a minimum interest coverage ratio covenant. A breach of any of these covenants could result in a default under the new senior secured credit facilities. If any such default occurs, the lenders under the new senior secured credit facilities may elect to declare all outstanding borrowings, together with accrued interest and other amounts payable thereunder, to be immediately due and payable. The lenders under the new first lien credit facility also have the right in these circumstances to terminate any commitments they have to provide further borrowings. In addition, following an event of default under the new senior secured credit facilities, the lenders under those facilities will have the right to proceed against the collateral granted to them to secure the debt, which includes our available cash. If the debt under the new senior secured credit facilities was to be accelerated, we cannot assure you that our assets would be sufficient to repay in full our debt.
Risks Related to our Common Stock
The price of our common stock may fluctuate significantly, and you could lose all or part of your investment.
Volatility in the market price of our common stock may prevent you from being able to sell your common stock at or above the price you paid for your common stock. The market price of our common stock could fluctuate significantly for various reasons, including:
- •
- our operating and financial performance and prospects;
- •
- our quarterly or annual earnings or those of other companies in our industry;
- •
- the public's reaction to our press releases, our other public announcements and our filings with the SEC;
- •
- changes in, or failure to meet, earnings estimates or recommendations by research analysts who track our common stock or the stock of other companies in our industry;
28
- •
- the failure of analysts to cover our common stock;
- •
- strategic actions by us or our competitors, such as acquisitions or restructurings;
- •
- new laws or regulations or new interpretations of existing laws or regulations applicable to our business;
- •
- changes in accounting standards, policies, guidance, interpretations or principles;
- •
- the impact on our profitability temporarily caused by the time lag between when we experience cost increases until these
increases flow through cost of sales because of our method of accounting for inventory;
- •
- material litigations or government investigations;
- •
- changes in general conditions in the United States and global economies or financial markets, including those resulting
from war, incidents of terrorism or responses to such events;
- •
- changes in key personnel;
- •
- sales of common stock by us or members of our management team;
- •
- the termination of lock-up agreements with our directors, officers and stockholders;
- •
- the granting or exercise of employee stock options;
- •
- the volume of trading in our common stock (in particular given that only 21.0 million, or approximately 24.5%, of
our outstanding shares of common stock are publicly traded); and
- •
- the realization of any risks described under "Risk Factors."
In addition, in the past three years, the U.S. stock market has experienced significant price and volume fluctuations. This volatility has had a significant impact on the market price of securities issued by many companies, including companies in our industry. The changes frequently appear to occur without regard to the operating performance of the affected companies. Hence, the price of our common stock could fluctuate based upon factors that have little or nothing to do with our company, and these fluctuations could materially reduce our share price and cause you to lose all or part of your investment. Further, in the past, market fluctuations and price declines in a company's stock have led to securities class action litigations. If such a suit were to arise, it could have a substantial cost and divert our resources regardless of the outcome.
If securities analysts do not publish research or reports about our business or if they downgrade our stock, the price of our stock could decline.
The research and reports that industry or financial analysts publish about us or our business may vary widely and may not predict accurate results, but will likely have an effect on the trading price of our common stock. If an industry analyst decides not to cover our company, or if an industry analyst decides to cease covering our company at some point in the future, we could lose visibility in the market, which in turn could cause our stock price to decline. If an industry analyst downgrades our stock, our stock price would likely decline rapidly in response.
29
We have no plans to pay regular dividends on our common stock, so you may not receive funds without selling your common stock.
We have no plans to pay regular dividends on our common stock. We generally intend to invest our future earnings, if any, to fund our growth. Any payment of future dividends will be at the discretion of our board of directors and will depend on, among other things, our earnings, financial condition, capital requirements, level of indebtedness, statutory and contractual restrictions applying to the payment of dividends and other considerations that our board of directors deems relevant. The new senior secured credit facilities also effectively limit our ability to pay dividends. Accordingly, you may have to sell some or all of your common stock in order to generate cash flow from your investment. You may not receive a gain on your investment when you sell your common stock and you may lose the entire amount of the investment.
Provisions of our amended and restated certificate of incorporation and amended and restated bylaws and Delaware law might discourage, delay or prevent a change of control of our company or changes in our management and, as a result, depress the trading price of our common stock.
Our amended and restated certificate of incorporation and amended and restated bylaws contain provisions that could discourage, delay or prevent a change in control of our company or changes in our management that the stockholders of our company may deem advantageous. These provisions:
- •
- establish a classified board of directors, with three classes of directors;
- •
- authorize the issuance of blank check preferred stock that our board of directors could issue to increase the number of
outstanding shares and to discourage a takeover attempt;
- •
- limit the ability of stockholders to remove directors if a "group," as defined under Section 13(d)(3) of the
Securities Exchange Act of 1934, as amended , or the Exchange Act, ceases to own more than 50% of our common stock;
- •
- prohibit our stockholders from calling a special meeting of stockholders;
- •
- prohibit stockholder action by written consent, which requires all stockholder actions to be taken at a meeting of our
stockholders, if a "group" ceases to own more than 50% of our common stock;
- •
- provide that our board of directors is expressly authorized to adopt, or to alter or repeal our bylaws; and
- •
- establish advance notice requirements for nominations for election to our board of directors or for proposing matters that can be acted upon by stockholders at stockholder meetings.
These anti-takeover defenses could discourage, delay or prevent a transaction involving a change in control of our company. These provisions could also discourage proxy contests and make it more difficult for you and other stockholders to elect directors of your choosing and cause us to take corporate actions other than those you desire.
Future sales of our common stock in the public market could lower our share price, and any additional capital raised by us through the sale of equity or convertible debt securities may dilute your ownership in us and may adversely affect the market price of our common stock.
We and our existing stockholders may sell additional shares of common stock in subsequent public offerings. We may also issue additional shares of common stock or convertible debt securities to finance future acquisitions. As of September 30, 2011, we had 950,000,000 shares of common stock authorized and 85,716,863 shares of common stock outstanding. This number includes 21,000,000 shares that were sold by the selling stockholders in our initial public offering, which shares may be resold in the public
30
market. In addition, we have 7,659,315 shares of common stock issuable upon the exercise of options outstanding as of September 30, 2011, 5,604,338 shares of common stock issuable pursuant to restricted stock units on the earlier of September 28, 2012 or the occurrence of a change in control, as defined in the applicable award agreement, and 5,289,615 shares of common stock reserved for issuance under our 2011 Equity Incentive Award Plan. All of our remaining outstanding shares are restricted from immediate resale under lock-up agreements between us, all of our directors, executive officers and stockholders and the underwriters described in our prospectus, but may be sold into the market in the near future. These shares will become available for sale following the expiration of the lock-up agreements, which, without the prior consent of the representatives of the underwriters, is 180 days after July 27, 2011, the date of our prospectus, subject to compliance with the applicable requirements under Rule 144 of the Securities Act of 1933, or the Securities Act.
We cannot predict the size of future issuances of our common stock or the effect, if any, that future issuances and sales of our common stock will have on the market price of our common stock. Sales of substantial amounts of our common stock (including sales pursuant to Carlyle's registration rights and shares issued in connection with an acquisition), or the perception that such sales could occur, may adversely affect prevailing market prices for our common stock.
ITEM 1B. UNRESOLVED STAFF COMMENTS
None.
31
Our global headquarters is located at 27727 Avenue Scott, Valencia, California 91355. As of September 30, 2011, we have a total of 30 administrative, sales and/or stocking facilities located in 10 countries, all of which are either leased or located at a customer site. The following table sets forth certain information regarding these facilities:
Region
|
Location | Purpose | Facility Size (Sq. Feet) |
|||||
|---|---|---|---|---|---|---|---|---|
North America |
Valencia, CA (Wesco headquarters) | Sales, CSL and Administrative | 150,428 | |||||
|
Wichita, KS (EPG headquarters) | Sales, CSL and Administrative | 67,500 | |||||
|
Auburn, WA | Sales and FSL | 9,370 | |||||
|
Charleston, SC | FSL | 22,159 | |||||
|
Charleston, SC | FSL* | 2,799 | |||||
|
Fort Worth, TX | Sales and FSL | 40,000 | |||||
|
Fountain Valley, CA | Sales | 1,978 | |||||
|
Glen Cove, NY | Sales | 3,700 | |||||
|
Holbrook, NY | Sales | 1,050 | |||||
|
Indianapolis, IN | FSL | 10,800 | |||||
|
Mesa, AZ | Sales | 3,648 | |||||
|
Nashville, TN | FSL* | 7,200 | |||||
|
Orlando, FL | Sales | 4,636 | |||||
|
Savannah, GA | FSL | 10,000 | |||||
|
West Chester, PA | FSL | 3,227 | |||||
|
St. Louis, MO | FSL | 10,750 | |||||
|
Mississauga, Ontario | Sales | 2,164 | |||||
|
Lachine, Quebec | Sales and FSL | 31,037 | |||||
Rest of World |
Clayton West, UK | Sales, CSL and Administrative | 36,577 | |||||
|
Filton, UK | FSL* | 2,200 | |||||
|
Bremen, Germany | Sales | 2,508 | |||||
|
Blagnac, France | Sales and FSL | 4,746 | |||||
|
Marcon, Italy | Sales | 1,865 | |||||
|
Grottaglie, Italy | FSL* | 10,549 | |||||
|
Tessera, Italy | FSL* | 1,865 | |||||
|
Holon, Israel | FSL | 5,381 | |||||
|
Busan, South Korea | FSL* | <500 | |||||
|
Shanghai, China | Sales | 1,222 | |||||
|
Xi'An, China | FSL* | 2,000 | |||||
|
Ta'if, Saudi Arabia | FSL* | 1,264 | |||||
- *
- Located at customer site.
We are involved in various legal matters that arise in the normal course of our business. We believe that the ultimate outcome of such matters will not have a material adverse effect on our business, financial condition or results of operations. However, there can be no assurance that such actions will not be material or adversely affect our business, financial condition or results of operations.
32
ITEM 5. MARKET FOR REGISTRANT'S COMMON EQUITY, RELATED STOCKHOLDER MATTERS AND ISSUER PURCHASES OF EQUITY SECURITIES
Market Information About Our Common Stock
Our common stock began trading on the New York Stock Exchange under the symbol "WAIR" on July 28, 2011. Before then, there was no public market for our common stock. The following table sets forth, for the periods indicated, the high and low sales prices of our common stock as reported by the New York Stock Exchange:
| |
High | Low | |||||
|---|---|---|---|---|---|---|---|
Fourth Quarter 2011 (beginning July 28, 2011) |
$ | 15.03 | $ | 10.93 | |||
Stockholders
On September 30, 2011, the closing price reported on the New York Stock Exchange of our common stock was $10.93 per share. As of December 1, 2011, we had approximately 26 holders of record of our common stock.
Dividends
We have not paid dividends in the past and we do not intend to pay any cash dividends for the foreseeable future. We intend to retain earnings, if any, for the future operation and expansion of our business and the repayment of debt. Any determination to pay dividends in the future will be at the discretion of our board of directors and will depend upon our results of operations, cash requirements, financial condition, contractual restrictions, restrictions imposed by applicable laws and other factors that our board of directors may deem relevant. Our existing indebtedness effectively limits our ability to pay dividends and make distributions to our stockholders.
Recent Sales of Unregistered Securities
Since September 30, 2010, we have granted to our directors, officers and employees options to purchase an aggregate of 274,500 shares of our common stock with per share exercise of $7.78 under our amended and restated equity incentive plan, which we refer to as the prior plan.
Since September 30, 2010, we have issued to our directors, officers and employees an aggregate of 570,920 shares of our common stock pursuant to exercises of options granted under our prior plan, of which 553,951 shares were subsequently sold by the selling stockholders in our IPO. We received proceeds of approximately $2.6 million from the exercise of these options.
Since September 30, 2010, we have issued to certain of our directors an aggregate of 57,492 shares of restricted stock under our prior plan to members of our board of directors as compensation for their service to us as directors.
Unless otherwise stated, the sales of the above securities were deemed to be exempt from registration under the Securities Act in reliance upon Section 4(2) of the Securities Act or Regulation D promulgated thereunder, or Rule 701 promulgated under Section 3(b) of the Securities Act as transactions by an issuer not involving any public offering or pursuant to benefit plans and contracts relating to compensation as provided under Rule 701. Individuals who purchased common stock as described above represented their intention to acquire the common stock for investment only and not with a view to or for sale in connection with any distribution thereof, and appropriate legends were affixed to any share certificates issued in such transactions.
33
Equity Compensation Plan Information
The following table presents information concerning the securities authorized for issuance pursuant to our equity compensation plans as of September 30, 2011:
Plan Category
|
Number of Securities to Be Issued Upon Exercise of Outstanding Options, Warrants and Rights (a) |
Weighted- Average Exercise Price of Outstanding Options, Warrants and Rights (b) |
Number of Securities Remaining Available for Future Issuance Under Equity Compensation Plans (Excluding Securities Reflected in Column (a)) (c) |
|||||||
|---|---|---|---|---|---|---|---|---|---|---|
Equity compensation plans approved by securityholders |
7,659,315 | $ | 5.09 | 5,289,615 | ||||||
Equity compensation plans not approved by securityholders |
— | — | — | |||||||
Total |
7,659,315 | $ | 5.09 | 5,289,615 | ||||||
34
Performance
The graph set forth below compares the cumulative total shareholder return on our common stock between July 28, 2011 (our first trading day on the New York Stock Exchange) and September 30, 2011 to (i) the cumulative total return of U.S. companies listed on the New York Stock Exchange and (ii) the cumulative total return of a peer group selected by the Company (BE Aerospace, Inc. (BEAV), Precision Castparts Corp. (PCP), Transdigm Group Incorporated (TDG), HEICO Corporation (HEI), Fastenal Company (FAST), W.W. Grainger, Inc. (GWW), MSC Industrial Direct Co., Inc. (MSM), Watsco, Incorporated (WSO)) over the same period. This graph assumes an initial investment of $100 on July 28, 2011, in our common stock, the market index and the peer group and assumes the reinvestment of dividends, if any. The graph also assumes that the price of our common stock on July 28, 2011 was equal to the closing price of $14.92. The historical information set forth below is not necessarily indicative of future price performance.
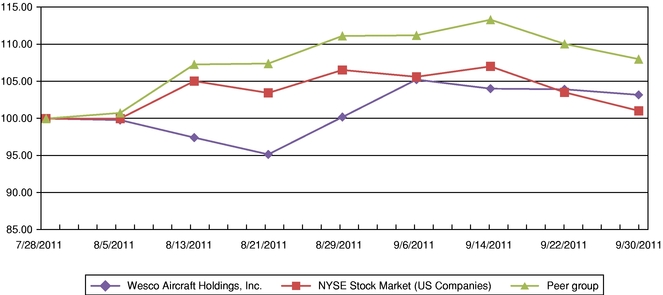
ASSUMES $100 INVESTED ON JULY 28, 2011
ASSUMES DIVIDEND REINVESTED
FISCAL YEAR ENDING SEPTEMBER 30, 2011
Company/Market/Peer Group
|
07/28/2011 | 08/03/2011 | 08/11/2011 | 08/19/2011 | 08/29/2011 | 09/06/2011 | 09/14/2011 | 09/22/2011 | 09/30/2011 | |||||||||||||||||||
|---|---|---|---|---|---|---|---|---|---|---|---|---|---|---|---|---|---|---|---|---|---|---|---|---|---|---|---|---|
Wesco Aircraft Holdings, Inc. |
100.00 | 99.80 | 97.43 | 95.16 | 100.20 | 105.26 | 104.04 | 103.95 | 103.20 | |||||||||||||||||||
New York Stock Exchange (U.S. Companies) |
100.00 |
100.39 |
105.06 |
103.46 |
106.56 |
105.64 |
107.04 |
103.54 |
101.05 |
|||||||||||||||||||
Peer Group |
100.00 |
100.76 |
107.31 |
107.43 |
111.16 |
111.24 |
113.35 |
110.08 |
108.03 |
|||||||||||||||||||
35
ITEM 6. SELECTED FINANCIAL DATA
The selected income statement and other data for each of the years ended September 30, 2011, 2010 and 2009 and the selected balance sheet data as of September 30, 2011 and 2010 have been derived from our audited consolidated financial statements that are included in this Annual Report. The selected income statement and other data for the years ended September 30, 2008 and 2007 and the selected balance sheet data as of September 30, 2009, 2008 and 2007 have been derived from audited consolidated financial statements that are not included in this Form 10-K.
The financial data set forth below are not necessarily indicative of future results of operations. This data should be read in conjunction with, and is qualified in its entirety by reference to, Part II, Item 7. "Management's Discussion and Analysis of Financial Condition and Results of Operations" and our financial statements and notes thereto included elsewhere in this Annual Report.
| |
Year Ended September 30, | |||||||||||||||||
|---|---|---|---|---|---|---|---|---|---|---|---|---|---|---|---|---|---|---|
| (Dollars in thousands) |
2011 | 2010 | 2009 | 2008 | 2007 | |||||||||||||
Consolidated statements of income: |
||||||||||||||||||
Net sales: |
||||||||||||||||||
North America |
$ | 645,034 | $ | 603,809 | $ | 557,874 | $ | 551,135 | $ | 416,899 | ||||||||
Rest of World |
119,384 | 95,342 | 102,796 | 112,623 | 89,888 | |||||||||||||
Intercompany elimination |
(53,532 | ) | (43,115 | ) | (47,983 | ) | (59,415 | ) | (38,207 | ) | ||||||||
Net sales |
710,886 | 656,036 | 612,687 | 604,343 | 468,580 | |||||||||||||
Gross profit: |
||||||||||||||||||
North America |
242,533 | 226,497 | 204,296 | 221,898 | 171,006 | |||||||||||||
Rest of World |
39,096 | 34,167 | 39,733 | 42,143 | 36,698 | |||||||||||||
Intercompany elimination |
(6,233 | ) | (6,434 | ) | (5,742 | ) | (7,433 | ) | (5,078 | ) | ||||||||
Gross profit |
275,396 | 254,230 | 238,287 | 256,608 | 202,626 | |||||||||||||
Selling, general and administrative expenses: |
||||||||||||||||||
North America |
91,533 | 81,674 | 86,007 | 84,807 | 71,998 | |||||||||||||
Rest of World |
22,253 | 18,241 | 17,888 | 20,951 | 18,320 | |||||||||||||
Selling, general and administrative expenses |
113,786 | 99,915 | 103,895 | 105,758 | 90,318 | |||||||||||||
Income from operations |
161,610 | 154,315 | 134,392 | 150,850 | 112,308 | |||||||||||||
Interest expense, net |
(34,491 | ) | (36,270 | ) | (37,707 | ) | (48,743 | ) | (55,817 | ) | ||||||||
Other income (expense), net |
1,005 | (458 | ) | (376 | ) | 746 | (2,857 | ) | ||||||||||
Income before provision for income taxes |
128,124 | 117,587 | 96,309 | 102,853 | 53,634 | |||||||||||||
Provision for income taxes |
(52,526 | ) | (43,913 | ) | (37,862 | ) | (44,251 | ) | (20,596 | ) | ||||||||
Net income |
$ | 75,598 | $ | 73,674 | $ | 58,447 | $ | 58,602 | $ | 33,038 | ||||||||
Earnings per share data: |
||||||||||||||||||
Basic |
$ | 0.83 | $ | 0.81 | $ | 0.69 | $ | 0.69 | $ | 0.39 | ||||||||
Diluted |
$ | 0.81 | $ | 0.81 | $ | 0.65 | $ | 0.67 | $ | 0.39 | ||||||||
Weighted average shares outstanding: |
||||||||||||||||||
Basic |
90,697 | 90,569 | 84,965 | 84,784 | 84,459 | |||||||||||||
Diluted |
93,182 | 91,068 | 89,682 | 87,661 | 85,389 | |||||||||||||
| |
Year Ended September 30, | ||||||||||||||||
|---|---|---|---|---|---|---|---|---|---|---|---|---|---|---|---|---|---|
| (Dollars in thousands) |
2011 | 2010 | 2009 | 2008 | 2007 | ||||||||||||
Consolidated balance sheet data: |
|||||||||||||||||
Cash and cash equivalents |
$ | 45,525 | $ | 39,463 | $ | 11,406 | $ | 15,998 | $ | 12,863 | |||||||
Total assets |
1,301,385 | 1,279,012 | 1,254,812 | 1,173,620 | 987,228 | ||||||||||||
Total long-term debt and capital lease obligations(1) |
556,712 | 622,032 | 684,268 | 688,128 | 589,269 | ||||||||||||
Total stockholders' equity |
628,471 | 545,739 | 473,940 | 409,773 | 335,783 | ||||||||||||
- (1)
- Total long-term debt and capital lease obligations excludes current portion.
36
ITEM 7. MANAGEMENT'S DISCUSSION AND ANALYSIS OF FINANCIAL CONDITION AND RESULTS OF OPERATIONS
The following discussion and analysis is intended to help the reader understand our business, financial condition, results of operations, liquidity and capital resources. You should read this discussion in conjunction with our condensed consolidated interim financial statements and the related notes contained elsewhere in this Annual Report on Form 10-K.
The statements in this discussion regarding industry trends, our expectations regarding our future performance, liquidity and capital resources and other non-historical statements are forward-looking statements. These forward-looking statements are subject to numerous risks and uncertainties, including, but not limited to, the risks and uncertainties described in Part I, Item 1A. "Risk Factors" and "Cautionary Note Regarding Forward-Looking Statements." Our actual results may differ materially from those contained in or implied by any forward-looking statements.
Executive Overview
We are one of the world's largest distributors and providers of comprehensive supply chain management services to the global aerospace industry on an annual sales basis. Our services range from traditional distribution to the management of supplier relationships, quality assurance, kitting, JIT delivery and point-of-use inventory management. We supply approximately 475,000 different SKUs, including hardware, bearings, tools and more recently, electronic components and machined parts. In fiscal 2011, sales of hardware represented 82% of our net sales, with highly engineered fasteners constituting 82% of that amount. We serve our customers under three types of arrangements: JIT contracts, which govern comprehensive outsourced supply chain management services; LTAs, which set prices for specific parts; and ad hoc sales. JIT contracts and LTAs, which together comprised approximately 61% of our fiscal 2011 net sales, are multi-year arrangements that provide us with significant visibility into our future sales.
Founded in 1953 by the father of our current CEO, Wesco has grown to serve over 7,200 customers in the commercial, military and general aviation sectors, including the leading OEMs and their subcontractors, through which we support nearly all major Western aircraft programs. We have grown our net sales at a 13.5% compounded annual growth rate over the past 20 years to $710.9 million in fiscal 2011. The Company has more than 1,000 employees and operates across 30 locations in 10 countries.
On September 29, 2006, 100% of the outstanding stock of Wesco Aircraft Hardware Corp., Wesco Aircraft Israel and the European entities of Flintbrook Ltd., Wesco Aircraft France and Wesco Aircraft Germany were acquired by Wesco Aircraft Holdings, Inc. The acquisition was completed in a leveraged transaction in which affiliates of Carlyle, the prior owner and certain employees of Wesco contributed the equity portion of the purchase price. The prior owner's and certain employees' investment represented a contribution of ownership in the predecessor company to the newly formed holding company. In accordance with Accounting Standards Codification, or ASC, 805, Business Combinations, the acquired assets and liabilities have been recorded at fair value for the interests acquired by new investors and at carryover basis for the continuing investors.
On June 30, 2008, Wesco Aircraft Hardware Corp. acquired 100% of the outstanding stock of Airtechnics, a distributor of electronic components for the aerospace industry, which we refer to as the Airtechnics Acquisition. The acquisition was funded through a provision in the old senior secured credit facilities (as defined below) that provided for additional borrowing under existing credit terms. Operating cash was also used by us to pay a portion of the purchase price and cover transaction fees and expenses. The assets and liabilities have been recorded at fair value for the interests we acquired.
37
Recent Developments
On August 2, 2011, we consummated our initial public offering, or IPO. In the IPO, certain of our stockholders sold an aggregate of 21,000,000 shares of common stock at a public offering price of $15.00 per share. Immediately prior to the offering, certain option holders exercised stock options to purchase 553,951 shares of common stock that were subsequently sold by the selling stockholders in the IPO. The Company received proceeds of $2.5 million from the exercise of these options. We did not receive any proceeds from the sale of shares of common stock in the IPO. In connection with the IPO, we amended and restated our certificate of incorporation, pursuant to which (i) our pre-existing shares of class A and class B common stock were converted into a single class of common stock and (ii) each share of common stock was then split into nine shares of common stock by way of a stock split. Pursuant to our amended and restated certificate of incorporation, our authorized capital stock consists of (1) 950,000,000 shares of common stock, par value $0.001 per share, and (2) 50,000,000 shares of preferred stock, par value $0.001 per share.
Industry Trends Affecting Our Business
Commercial Aerospace Market
We rely on demand for new commercial aircraft for a significant portion of our sales. Commercial aircraft demand is driven by many factors, including airline passenger volumes, airline profitability, introduction of new aircraft models, general economic conditions and the aging life cycle of current fleets.
During 2008 and 2009, our customers were impacted by the global recession and weak demand for air passenger travel, which resulted in significant losses for the global airline industry. During 2011, as the global economy began to recover, airline passenger volumes began to increase. Increased passenger traffic volumes and the return to profitability of the global airline industry have renewed demand for commercial aircraft, particularly for more fuel efficient models, such as the Boeing 787 and Airbus A350. In addition, commercial maintenance, repair and overhaul providers are expected to benefit from similar growth trends to those impacting the commercial OEM market, in particular, increased revenue passenger miles, which will in turn drive growth in the commercial fleet and greater utilization of existing aircraft. Growth in the commercial aerospace market is also expected to be aided by a recovery in business jet and regional jet deliveries.
Military Aerospace Market
A significant portion of our sales are also reliant on demand for new military aircraft, which is primarily driven by government spending, the timing of military aircraft orders and evolving U.S. Department of Defense strategies and policies. We believe the diversity of the military aircraft programs we service can help us mitigate the impact of program delays, changes or cancellations, through increased sales to other active programs that directly benefit from such delays, changes or cancellations. For example, we believe the delay in production of the Lockheed Martin JSF has resulted in an increase in our sales to manufacturers of the F-18. Going forward, we believe that the Company will benefit from increases in the production of the JSF, a program on which we believe our business is well positioned.
We also support customers in the military aerospace MRO market and believe that our presence in this market helps us mitigate the volatility of new military aircraft sales with sales to the aftermarket. We expect demand in the military MRO market to be driven by requirements to maintain aging military fleets, changes in the overall fleet size and the level of U.S. military activity overseas.
38
Other Factors Affecting Our Financial Results
Fluctuations in Revenue
There are many factors, such as fluctuations in ad hoc sales, timing of aircraft deliveries, changes in selling prices and the volume or timing of customer orders that can cause fluctuations in our financial results from quarter-to-quarter. To normalize for short-term fluctuations, we tend to look at our performance over several quarters or years of activity rather than discrete short-term periods. As such, it can be difficult to determine longer-term trends in our business based on quarterly comparisons.
We will continue our strategy of seeking to expand our relationships with existing customers by transitioning them to our comprehensive JIT supply chain management services as well as expanding relationships with our existing JIT customers to include additional customer sites and additional SKUs. We believe this strategy serves to mitigate fluctuations in our net sales. Although, our ad hoc sales as a percentage of net sales increased from 37% in fiscal 2010 to 39% in fiscal 2011, we do not believe that this increase is inconsistent with our strategy of transitioning customers to JIT contracts and LTAs. Instead, we believe that an increase in ad hoc sales is typical during industry growth cycles, as both customer demand and supplier lead times increase, resulting in customers facing parts shortages that they attempt to mitigate by making ad hoc purchases. Accordingly, even though we believe that our ad hoc sales will continue to increase during fiscal 2012 as a result of the current industry growth cycle, we do not believe that this trend will impact our long-term JIT and LTA strategy.
Earlier this year we were notified by Boeing of its intent to perform certain supply chain management functions in-house that we had been providing at two Boeing facilities under JIT contracts that were awarded to us when these particular facilities were under different ownership. In fiscal 2011, JIT sales under these contracts accounted for approximately 3.1% of our net sales. If any of our customers are acquired by a company that elects not to utilize our services, or attempt to implement in-sourcing initiatives, it could have a negative effect on our strategy to mitigate fluctuations in our net sales. Additionally, although we derive a significant portion of our net sales from the building of new commercial and military aircraft, we have not typically experienced extreme fluctuations in our net sales when sales for an individual aircraft program decrease, which we believe is attributable to our diverse base of customers and programs. In addition, we believe our substantial sales under JIT contracts and LTAs help to mitigate fluctuations in our financial results, as JIT and LTA customers tend to have steadier purchasing patterns than ad hoc customers. However, as is noted above, our ad hoc sales as a percentage of net sales increased during fiscal 2011, and we believe this trend will continue during 2012.
Fluctuations in Margins
We entered the electronic components business in 2008 after the Airtechnics Acquisition. As we continue to grow our electronics products group, or EPG, business, we expect that EPG sales as a percentage of our total net sales will increase. Gross profit margins on EPG products are lower than the gross profit margins on many of our other products, which we believe will result in a reduction in our overall gross profit margins as our EPG sales increase.
We believe that our strategy of growing our JIT and LTA sales and converting ad hoc customers into JIT and LTA customers will negatively affect our gross profit margins, as gross profit margins tend to be higher on ad hoc sales than they are in JIT and LTA-related sales. However, we believe any potential adverse impact on our gross profit margins is outweighed by the benefits of a more stable long-term revenue stream attributable to JIT contracts and LTAs. However, as is noted above, our ad hoc sales as a percentage of net sales increased during fiscal 2011, and we believe this trend will continue during 2012.
39
Our JIT contracts and LTAs generally provide for fixed prices, which can expose us to risks if prices we pay to our suppliers rise due to increased raw material or other costs. However, we believe our expansive product offerings and inventories, our ad hoc sales and, where possible, our longer-term agreements with suppliers have enabled us to mitigate this risk.
Fluctuations in Cash Flow
We believe our cash flows may be affected by fluctuations in our inventory that can occur over time. When we are awarded new programs, we generally increase our inventory to account for expected sales related to the new program, which often take time to materialize. As a result, if certain programs for which we have procured inventory are delayed, we may experience a more sustained inventory increase. For example, we increased our inventory in anticipation of deliveries of the Boeing 787, which have been significantly delayed.
Inventory fluctuations may also be attributable to general industry trends. For example, as production in the global aerospace industry increases, we typically see an increase in demand from our customers and a delay in deliveries from our suppliers, which tends to result in a temporary inventory reduction and increased cash flow. However, when production in the aerospace industry decreases, our suppliers are able to catch up on our outstanding orders, while demand from our customers decreases, which tends to result in an increase in inventory levels and decreased cash flow. For example in 2009, as a result of the global economic recession, production in the aerospace industry decreased, freeing up our suppliers to ship previously ordered products to us faster than expected. As a result, we experienced an inventory build of approximately $111.1 million during fiscal 2009. Although we have made, and continue to make, adjustments to our purchasing practices in order to mitigate the effect of inventory fluctuations on our cash flows, inventory fluctuations continue to occur and, as a result, will continue to impact our cash flows.
Segment Presentation
We conduct our business through two reportable segments: North America and Rest of World. We evaluate segment performance based on segment operating earnings or loss. Each segment reports its results of operations and makes requests for capital expenditures and acquisition funding to our chief operating decision-maker, or CODM. Our Chief Executive Officer serves as our CODM. Each operating segment has separate management teams and infrastructures dedicated to providing a full range of products and services to their respective customers.
Key Components of Our Results of Operations
The following is a discussion of the key line items included in our financial statements for the periods presented below under the heading "Results of Operations." These are the measures that management utilizes to assess our results of operations, anticipate future trends and evaluate risks in our business.
Net Sales
Our net sales include sales of C class aerospace parts, including hardware, electronic components, bearings, machined parts and installation tooling, and eliminate all intercompany sales. We also provide certain services to our customers, including quality assurance, kitting and JIT supply chain management. However, these services are generally performed in connection with the sale of our products, and as such, the price of such services is included in the price of the products delivered to customers. We do not account for these services as a separate element, as the services do not generally have stand-alone value and typically cannot be separated from the product element of the arrangement. There are no significant post-delivery obligations associated with these services.
40
We sell products and services to our customers using three types of contractual arrangements: JIT supply chain management contracts, LTAs and individual ad hoc sales. In fiscal 2010 and 2009, we experienced a decrease in ad hoc sales due to a weakening aerospace market that resulted in customers reducing their on-hand inventory and our strategy of transitioning ad hoc sales to JIT contracts or LTAs in an effort to achieve a more predictable revenue stream. However, in fiscal 2011, we experienced an increase in ad hoc sales. JIT contracts and LTAs typically run for three to five years. Under JIT contracts, customers commit to purchase specified parts from us at a fixed price, on an if-and-when needed basis, and we are responsible for maintaining high levels of stock availability of those parts. LTAs are essentially negotiated price lists for customers or individual customer sites that cover a range of pre-determined parts, purchased on an as-needed basis. Ad hoc customers purchase parts from us on an as-needed basis and are generally supplied out of our existing inventory. In addition, JIT and LTA customers often purchase parts that are not captured under their contract on an ad hoc basis.
Cost of Sales
The principal component of our cost of sales is product cost, which is approximately 95.9% of our total cost of sales for the year ended September 30, 2011. The remaining components are freight and expediting fees, import duties, tooling repair charges, inventory excess and obsolescence write-down, packaging supplies and physical inventory adjustment charges, which collectively is approximately 4.1% of our total cost of sales for the year ended September 30, 2011.
Product cost is determined by the current weighted average cost of each inventory item and is a function of many factors, including fluctuations in the price of raw materials, the effect of inflation, the terms of long-term agreements we negotiate with certain of our suppliers, the timing of bulk purchases that allow us to take advantage of price breaks from suppliers and general market trends that can result in increases or decreases in our suppliers' available production capacity. Although we cannot specifically quantify trends relating to the costs of our products in inventory, during fiscal 2011 and 2010, as a result of the economic downturn and its effect on the global aerospace industry, our suppliers' collective available production capacity increased, which generally resulted in a decrease in per part prices and a corresponding decrease in our product costs. We expect that conditions within the aerospace industry will continue to improve, and as a result, that per part prices will increase as our suppliers' capacity becomes more limited. However, we believe the long-term agreements we have with certain of our suppliers and our ability to make opportunistic, large-scale product purchases will allow us to mitigate the impact of future per part price increases. In addition, we believe we will be able to further mitigate the impact of any such price increases on our results of operations by passing along the price increases to customers who are not a party to contracts with pre-negotiated price lists.
Inventory write-down is calculated to estimate the amount of excess and obsolete inventory we currently have on-hand, based on historical and forecasted sell-through rates. We review inventory for excess and obsolescence write-down monthly and adjust the expense and future forecasted sell-through rates as necessary.
Selling, General and Administrative Expenses
The principal components of our selling, general and administrative expenses are salaries, wages, benefits and bonuses paid to our employees; stock-based compensation; commissions paid to outside sales representatives; travel and other business expenses; training and recruitment costs; marketing, advertising and promotional event costs; rent; bad debt expense; professional services fees (including legal, audit and tax); and ordinary day-to-day business expenses. Depreciation and amortization expense is also included in selling, general and administrative expenses, and consists primarily of scheduled depreciation for leasehold improvements, machinery and equipment, vehicles, computers, software and furniture and fixtures. Depreciation and amortization also includes intangible amortization expense.
41
Selling, general and administrative expenses, as a percentage of net sales, have continued to decline as we have leveraged the fixed cost and labor component of our infrastructure while consolidated net sales have grown. However, for the year ended September 30, 2011, we experienced an increase in selling, general and administrative expenses in part as a result of one-time costs associated with our IPO. Going forward, we will continue to incur costs associated with operating as public company, but we continue to expect that selling, general and administrative expenses, as a percent of net sales, will continue to decline.
Other Expenses
Interest Expense, net. Interest expense, net consists of the interest we pay on our short-term and long-term debt, fees on our revolver and our line-of-credit, deferred financing costs and the costs of hedging agreements, net of interest income.
Other Income (Expense), net. Other income (expense), net is primarily comprised of unrealized foreign exchange gain or loss associated with transactions denominated in currencies other than the respective functional currency of the reporting subsidiary.
Critical Accounting Policies and Estimates
The methods, estimates and judgments we use in applying our most critical accounting policies have a significant impact on the results we report in our financial statements. We evaluate our estimates and judgments on an on-going basis. We base our estimates on historical experience and on assumptions that we believe to be reasonable under the circumstances. Our experience and assumptions form the basis for our judgments about the carrying value of assets and liabilities that are not readily apparent from other sources. Actual results may vary from what we anticipate, and different assumptions or estimates about the future could change our reported results. We believe the following accounting policies are the most critical in that they significantly affect our financial statements, and they require our most significant estimates and complex judgments.
Inventories
Our inventory is comprised solely of finished goods. Inventories are stated at the lower of weighted-average cost or market and in-bound freight-related costs are included as part of the cost of inventory held for resale. We record provisions, as appropriate, to write-down excess and obsolete inventory to estimated net realizable value. The process for evaluating excess and obsolete inventory often requires us to make subjective judgments and estimates concerning future sales levels, quantities and prices at which such inventories will be able to be sold in the normal course of business.
Demand for our products can fluctuate significantly. Our estimates of future product demand may prove to be inaccurate, in which case we may have understated or overstated the write-down required for excess and obsolete inventories. In the future, if our inventories are determined to be overvalued, we would be required to recognize such costs in our cost of goods sold at the time of such determination. Likewise, if our inventories are determined to be undervalued, we may have over-reported our costs of goods sold in previous periods and would be required to recognize such additional operating income at the time such products are sold.
Goodwill and Indefinite-Lived Intangible Assets
Goodwill represents the excess of the aggregate purchase price over the fair value of the net assets acquired in a purchase business combination. In accordance with the provisions of ASC 350, Intangibles—Goodwill and Other, goodwill and indefinite-lived intangible assets acquired in a business combination are not amortized, but instead tested for impairment at least annually or more frequently should an event occur or circumstances indicate that the carrying amount may be impaired. Such events
42
or circumstances may be a significant change in business climate, economic and industry trends, legal factors, negative operating performance indicators, significant competition, changes in strategy, or disposition of a reporting unit or a portion thereof. Goodwill impairment testing is performed at the reporting unit level on July 1 of each year.
Goodwill impairment testing is a two-step test. The first step identifies potential impairment by comparing the fair value of a reporting unit with its carrying amount, including goodwill. For all periods presented, our reporting units are consistent with our operating segments. The estimates of fair value of a reporting unit are determined based on a discounted cash flow analysis and market earnings multiples. A discounted cash flow analysis requires us to make various judgmental assumptions, including assumptions about future cash flows, growth rates and discount rates. These assumptions about future cash flows and growth rates are based on the forecast and long-term business plans of each operating segment. Discount rate assumptions are based on an assessment of the risk inherent in the future cash flows of the respective reporting units. If the fair value exceeds its carrying amount, goodwill is not considered impaired and the second step of the test is unnecessary. If the carrying amount of a reporting unit's goodwill exceeds its fair value, the second step measures the impairment loss, if any. The second step compares the implied fair value of goodwill with the carrying amount of that goodwill. The implied fair value of goodwill is determined in the same manner as the amount of goodwill recognized in a business combination. If the carrying amount of goodwill exceeds the implied fair value of that goodwill, an impairment loss is recognized in an amount equal to that excess.
Application of the goodwill impairment test requires judgment, including the identification of reporting units, assignment of assets and liabilities to reporting units, assignment of goodwill to reporting units, and determination of the fair value of each reporting unit. Changes in these estimates and assumptions could materially affect the determination of fair value and/or goodwill impairment for each reporting unit.
We reviewed the carrying value of our indefinite lived intangible assets by comparing such amount to its fair value and determined that the carrying amount did not exceed its respective fair value. During the years ended September 30, 2011, 2010 and 2009, the fair value of our reporting units was substantially in excess of the reporting units' carrying values. Additionally, the fair value of our indefinite lived intangible assets was substantially in excess of its carrying value. Accordingly, management believes there are no impairments as of September 30, 2011 related to either goodwill or the indefinite-lived intangible asset.
Revenue Recognition
We recognize product and service revenue when (i) persuasive evidence of an arrangement exists, (ii) title transfers to the customer, (iii) the sales price charged is fixed or determinable and (iv) collection is reasonably assured. In instances where title does not pass to the customer upon shipment, we recognize revenue upon delivery or customer acceptance, depending on the terms of the sales contract.
In connection with the sale of our products, we often provide certain supply chain services. These services are provided exclusively in connection with the sale of products, and as such, the price of such services is generally included in the price of the products delivered to the customer. We do not account for these services as a separate element, as the services do not have stand-alone value and cannot be separated from the product element of the arrangement. There are no significant post-delivery obligations associated with these services.
We also enter into sales rebates and profit sharing arrangements. Such customer incentives are accounted for as a reduction to gross sales and recorded based upon estimates at the time products are sold. These estimates are based upon historical experience for similar programs and products. We review such rebates and profit sharing arrangements on an ongoing basis and accruals are adjusted, if necessary, as additional information becomes available.
43
Management provides allowances for credits and returns, based on historic experience and adjusts such allowances as considered necessary. To date, such provisions have been within the range of management's expectations and the allowance established. Sales tax collected from customers is excluded from net sales in the accompanying consolidated statements of income.
Income Taxes
We account for income taxes in accordance with ASC 740, Income Taxes. ASC 740, which requires the recognition of deferred tax liabilities and assets for the expected future tax consequences of temporary differences between the carrying amounts and the tax bases of assets and liabilities. Deferred income tax assets and liabilities are measured using enacted tax rates expected to apply to taxable income in the years in which these temporary differences are expected to be recovered or settled. The effect on deferred tax assets and liabilities of a change in tax rates is recognized in income in the period that includes the enactment date. A valuation allowance is established, when necessary, to reduce net deferred tax assets to the amount expected to be realized. Our foreign subsidiaries are taxed in local jurisdictions at local statutory rates.
Stock-Based Compensation
We account for all stock-based compensation awards to employees and members of our board of directors based upon their fair values as of the date of grant using a fair value method and recognize the fair value of each award as an expense over the requisite service period using the graded vesting method.
For purposes of calculating stock-based compensation, we estimate the fair value of stock options using a Black-Scholes-Merton valuation model, which requires the use of certain subjective assumptions including expected term, volatility, expected dividend, risk-free interest rate, forfeiture rate and the fair value of our common stock. These assumptions generally require significant judgment.
We estimate the expected term of employee options using the average of the time-to-vesting and the contractual term. We derive our expected volatility from the historical volatilities of several unrelated public companies within our industry because we have little information on the volatility of the price of our common stock since we have no trading history. When making the selections of our industry peer companies to be used in the volatility calculation, we also consider the size and financial leverage of potential comparable companies. These historical volatilities are weighted based on certain qualitative factors and combined to produce a single volatility factor. Our expected dividend rate is zero, as we have never paid any dividends on our common stock and do not anticipate any dividends in the foreseeable future. We base the risk-free interest rate on the U.S. Treasury yield in effect at the time of grant for zero coupon U.S. Treasury notes with maturities approximately equal to each grant's expected life.
We estimate our forfeiture rate based on an analysis of our actual forfeitures and will continue to evaluate the appropriateness of the forfeiture rate based on actual forfeiture experience, analysis of employee turnover behavior and other factors. Quarterly changes in the estimated forfeiture rate can have a significant effect on reported stock-based compensation expense, as the cumulative effect of adjusting the rate for all expense amortization is recognized in the period the forfeiture estimate is changed. If a revised forfeiture rate is higher than the previously estimated forfeiture rate, an adjustment is made that will result in a decrease to the stock-based compensation expense recognized in the consolidated financial statements. If a revised forfeiture rate is lower than the previously estimated forfeiture rate, an adjustment is made that will result in an increase to the stock-based compensation expense recognized in the consolidated financial statements. The following table
44
summarizes the amount of non-cash stock-based compensation expense recognized in our statements of operations:
| |
Year Ended September 30, | |||||||||
|---|---|---|---|---|---|---|---|---|---|---|
(Dollars in thousands)
|
2011 | 2010 | 2009 | |||||||
Non-cash stock-based compensation |
$ | 3,658 | $ | 2,510 | $ | 10,389 | ||||
For the years ending September 30, 2012 and 2013 we expect to incur stock-based compensation expense related to nonvested stock options of approximately $2.9 million and $1.2 million, respectively.
If factors change and we employ different assumptions, stock-based compensation expense may differ significantly from what we have recorded in the past. If there is a difference between the assumptions used in determining stock-based compensation expense and the actual factors that become known over time, we may change the input factors used in determining stock-based compensation costs for future grants. These changes, if any, may materially impact our results of operations in the period such changes are made. We expect to continue to grant stock options in the future, and to the extent that we do, our actual stock-based compensation expense recognized in future periods will likely increase.
Results of Operations
| |
Year Ended September 30, | |||||||||||
|---|---|---|---|---|---|---|---|---|---|---|---|---|
| (Dollars in thousands) |
2011 | 2010 | 2009 | |||||||||
Consolidated statements of income: |
||||||||||||
Net sales: |
||||||||||||
North America |
$ | 645,034 | $ | 603,809 | $ | 557,874 | ||||||
Rest of World |
119,384 | 95,342 | 102,796 | |||||||||
Intercompany elimination |
(53,532 | ) | (43,115 | ) | (47,983 | ) | ||||||
Net sales |
710,886 | 656,036 | 612,687 | |||||||||
Gross profit: |
||||||||||||
North America |
242,533 | 226,497 | 204,296 | |||||||||
Rest of World |
39,096 | 34,167 | 39,733 | |||||||||
Intercompany elimination |
(6,233 | ) | (6,434 | ) | (5,742 | ) | ||||||
Gross profit |
275,396 | 254,230 | 238,287 | |||||||||
Selling, general and administrative expenses: |
||||||||||||
North America |
91,533 | 81,674 | 86,007 | |||||||||
Rest of World |
22,253 | 18,241 | 17,888 | |||||||||
Selling, general and administrative expenses |
113,786 | 99,915 | 103,895 | |||||||||
Income from operations |
161,610 | 154,315 | 134,392 | |||||||||
Interest expense, net |
(34,491 | ) | (36,270 | ) | (37,707 | ) | ||||||
Other income (expense), net |
1,005 | (458 | ) | (376 | ) | |||||||
Income before provision for income taxes |
128,124 | 117,587 | 96,309 | |||||||||
Provision for income taxes |
(52,526 | ) | (43,913 | ) | (37,862 | ) | ||||||
Net income |
$ | 75,598 | $ | 73,674 | $ | 58,447 | ||||||
45
| |
Year Ended September 30, |
|||||||||||
|---|---|---|---|---|---|---|---|---|---|---|---|---|
| (as a % of total net sales; numbers have been rounded) |
2011 | 2010 | 2009 | |||||||||
Consolidated statements of income: |
||||||||||||
Net sales: |
||||||||||||
North America |
90.7 | % | 92.0 | % | 91.1 | % | ||||||
Rest of World |
16.8 | 14.5 | 16.8 | |||||||||
Intercompany elimination |
(7.5 | ) | (6.6 | ) | (7.8 | ) | ||||||
Net sales |
100.0 | 100.0 | 100.0 | |||||||||
Gross profit: |
||||||||||||
North America |
34.1 | 34.5 | 33.3 | |||||||||
Rest of World |
5.5 | 5.2 | 6.5 | |||||||||
Intercompany elimination |
(0.9 | ) | (1.0 | ) | (0.9 | ) | ||||||
Gross profit |
38.7 | 38.8 | 38.9 | |||||||||
Selling, general and administrative expenses: |
||||||||||||
North America |
12.9 | 12.4 | 14.0 | |||||||||
Rest of World |
3.1 | 2.8 | 2.9 | |||||||||
Selling, general and administrative expenses |
16.0 | 15.2 | 17.0 | |||||||||
Income from operations |
22.7 | 23.5 | 21.9 | |||||||||
Interest expense, net |
(4.9 | ) | (5.5 | ) | (6.2 | ) | ||||||
Other income (expense), net |
0.1 | (0.1 | ) | (0.1 | ) | |||||||
Income before provision for income taxes |
18.0 | 17.9 | 15.7 | |||||||||
Provision for income taxes |
(7.4 | ) | (6.7 | ) | (6.2 | ) | ||||||
Net income |
10.6 | % | 11.2 | % | 9.5 | % | ||||||
Year Ended September 30, 2011 compared with the Year Ended September 30, 2010
Net Sales
Consolidated net sales of $710.9 million for the year ended September 30, 2011 increased approximately $54.9 million, or 8.4%, compared to the year ended September 30, 2010. Ad hoc, JIT and LTA sales as a percentage of net sales represented 39%, 29% and 32%, respectively, for the year ended September 30, 2011, as compared to 37%, 31% and 32%, respectively, for the year ended September 30, 2010.
Net sales of $645.0 million in our North America segment for the year ended September 30, 2011 increased approximately $41.2 million, or 6.8%, compared to the year ended September 30, 2010. Ad hoc and LTA net sales increased by $29.5 million and $14.2 million, respectively, while JIT net sales decreased by $11.0 million, for the year ended September 30, 2011 as compared to the year ended September 30, 2010. The primary driver of the increase in ad hoc sales was $20.1 million of accelerated sales of inventory to one customer in connection with the completion of certain sales contracts with us, and the remaining $9.4 million was attributable to general growth across numerous customers. The increase in LTA net sales was primarily driven by a new contract with a military customer as well as new SKUs added to existing contracts. The decrease in JIT net sales was primarily related to the completion of contracts with two customers, which resulted in a reduction of $11.6 million in JIT net sales in fiscal 2011 compared to fiscal 2010.
Net sales of $119.4 million in our Rest of World segment for the year ended September 30, 2011 increased approximately $24.0 million, or 25.2%, compared to the year ended September 30, 2010. Ad hoc, JIT and LTA net sales increased by $3.3 million, $18.0 million and $3.0 million, respectively,
46
for the year ended September 30, 2011 as compared to the year ended September 30, 2010. Ad hoc net sales improved, despite $3.7 million in sales shifting to a JIT contract, due to a strengthening in demand across our customer base. The JIT increase was driven by new long-term contracts entered into during the latter half of fiscal 2011, which accounted for $4.9 million in net sales, the ongoing maturation of 787 programs, as well as a general improvement in commercial build rates. LTA growth was driven by new contract wins from engine component manufacturers.
Gross Profit
Consolidated gross profit of $275.4 million for the year ended September 30, 2011 increased approximately $21.2 million, or 8.3%, compared to the year ended September 30, 2010. Gross profit as a percentage of net sales was 38.7% for the year ended September 30, 2011, compared to 38.8% for the year ended September 30, 2010.
Gross profit of $242.5 million in our North America segment for the year ended September 30, 2011 increased approximately $16.0 million, or 7.1%, compared to the year ended September 30, 2010. Gross profit as a percentage of net sales in our North America segment was 37.6% for the year ended September 30, 2011 compared to 37.5% for the year ended September 30, 2010. The slight increase in gross profit as a percentage of net sales was primarily a result of changes in our sales mix.
Gross profit of $39.1 million in our Rest of World segment for the year ended September 30, 2011 increased approximately $4.9 million, or 14.4%, compared to the year ended September 30, 2010. Gross profit as a percentage of net sales in our Rest of World segment was 32.7% for the year ended September 30, 2011 compared to 35.8% for the year ended September 30, 2010. The decrease in gross profit as a percentage of net sales was primarily a result of changes in our sales mix as lower margin JIT sales increased significantly.
Selling, General and Administrative Expenses
Total selling, general and administrative expenses of $113.8 million for the year ended September 30, 2011 increased approximately $13.9 million, or 13.9%, compared to the year ended September 30, 2010. Total selling, general and administrative expenses as a percentage of net sales increased by 0.8% during the year ended September 30, 2011 as compared to the year ended September 30, 2010. This increase was mainly driven by $5.3 million of additional payroll related costs and $4.9 million in initial public offering expenses incurred during the year ended September 30, 2011 as compared to the year ended September 30, 2010. Initial public offering expenses represent 0.7% of net sales during the year ended September 30, 2011 as compared to September 30, 2010.
Selling, general and administrative expenses of $91.5 million in our North America segment for the year ended September 30, 2011 increased approximately $9.9 million, or 12.1%, compared to the year ended September 30, 2010. This increase was primarily due to $4.9 million in initial public offering expenses incurred during the year ended September 30, 2011. Payroll costs, stock compensation and group insurance increased $2.9 million, $1.1 million and $0.8 million, respectively during the year ended September 30, 2011 as compared to September 30, 2010. The increase in payroll costs was driven by a $1.2 million increase in bonus expense.
Selling, general and administrative expenses of $22.3 million in our Rest of World segment for the year ended September 30, 2011 increased approximately $4.0 million, or 22.0%, compared to the year ended September 30, 2010. The increase was primarily due to increased payroll costs of $3.0 million and a $1.0 million increase in commissions during the year ended September 30, 2011 as compared to September 30, 2010.
47
Other Expenses
Interest Expense, net
Interest expense, net of $34.5 million for the year ended September 30, 2011 decreased approximately $1.8 million, or 4.9%, compared to the year ended September 30, 2010. The decrease was primarily due to the lower interest expense as a result of a $64.2 million reduction in the outstanding debt balances for the year ended September 30, 2011 as compared to the year ended September 30, 2010, offset by a $7.1 million extinguishment of deferred financing charges related to the refinancing of the old senior secured credit facilities on April 7, 2011.
Other Income (Expense), net
Other income, net of $1.0 million for the year ended September 30, 2011 increased by $1.5 million compared to the year ended September 30, 2010. This increase was primarily due to unrealized foreign exchange gains associated with transactions denominated in currencies other than the respective functional currency of the reporting subsidiary.
Provision for Income Taxes
Provision for income taxes of $52.5 million for the year ended September 30, 2011 increased approximately $8.6 million, or 19.6%, compared to the year ended September 30, 2010. Our effective tax rate was 41.0% and 37.3% during the years ended September 30, 2011 and 2010, respectively. The increase in provision for income taxes was primarily a result of a $10.5 million, or 9.0%, increase in pre-tax income from the year ended September 30, 2011 as compared to the year ended September 30, 2010. Drivers contributing to the increased effective tax rate include the non-deductibility of initial public offering expenses, as well as increased income earned by our foreign subsidiaries from business operations conducted outside their country of domicile related to inventory which was purchased from the U.S. Such income is taxed at our effective tax rate in the U.S. rather than the effective tax rate of the originating foreign subsidiary. U.S. tax is imposed at the time when the earnings are either repatriated or deemed repatriated. For the year ended September 30, 2011 we had greater deemed repatriated earnings which increased the provision for U.S. federal income taxes. Other items impacting our overall tax provision included a decrease in our effective tax rate in the United States for the year ended September 30, 2010 related to the filing of an amended 2008 California return, which resulted in a $1.4 million refund.
Net Income
Due to the factors described above, we reported a net income of $75.6 million for the year ended September 30, 2011, compared to net income of $73.7 million for the year ended September 30, 2010. Net income as a percent of net sales decreased 0.6% for the year ended September 30, 2011 as compared to the year ended September 30, 2010, primarily due to a $7.1 million loss on the extinguishment of deferred financing charges related to the refinancing of the old senior secured credit facilities on April 7, 2011, $5.3 million in payroll related costs, as well as $4.9 million of expenses related to the initial public offering.
Year Ended September 30, 2010 compared with the Year Ended September 30, 2009
Net Sales
Consolidated net sales of $656.0 million for the year ended September 30, 2010 increased $43.3 million, or 7.1%, compared to the year ended September 30, 2009. Excluding EPG products, JIT, LTA and ad hoc sales as a percentage of net sales represented 34%, 34% and 32%, respectively, for the
48
year ended September 30, 2010, as compared to 29%, 31% and 40%, respectively, for the year ended September 30, 2009.
Net sales of $603.8 million in our North America segment for the year ended September 30, 2010 increased $45.9 million, or 8.2%, compared to the year ended September 30, 2009. JIT and LTA net sales increased by $43.9 million and $42.0 million, respectively, while ad hoc and EPG net sales decreased by $9.6 million and $27.3 million, respectively, year over year. Approximately $21.0 million of the JIT increase was driven by increased sales relating to the B-787 program, $8.1 million by the addition of new sites for one of our major customers and $7.0 million by military programs such as the Chinook and V-22, while the remaining $7.8 million was attributable to general growth across numerous customers. $17.0 million of the LTA increase was due to a new contract for the F-18 program, $8.2 million related to the addition of new sites for one of our major customers and $5.1 million to other increases in military programs such as Chinook and V-22. The remaining $11.7 million was attributable to general growth across numerous customers. The decrease in ad hoc net sales was primarily driven by business shifting to JIT and LTA contract sales. The decrease in EPG net sales was due to the decline in the general aviation markets.
Net sales of $95.3 million in our Rest of World segment for the year ended September 30, 2010 decreased $7.5 million, or 7.3%, compared to the year ended September 30, 2009. JIT net sales increased by $4.4 million, while ad hoc and LTA net sales decreased by $9.3 million and $1.7 million, respectively. The reduction in ad hoc sales was attributed to a general market slowdown. JIT sales grew primarily due to $2.4 million of net sales related to the B-737 program, and $2.1 million related to growth in several of our military contracts. Other smaller increases in JIT net sales were driven primarily by the conversion of B-787 LTAs to JIT contracts in Italy.
Gross Profit
Consolidated gross profit of $254.2 million for the year ended September 30, 2010 increased $15.9 million, or 6.7% compared to gross profit for the year ended September 30, 2009. Gross profit as a percentage of net sales was 38.8% for the year ended September 30, 2010 compared to 38.9% for the year ended September 30, 2009.
Gross profit of $226.5 million in our North America segment for the year ended September 30, 2010 increased $22.2 million, or 10.9%, compared to the year ended September 30, 2009. Gross profit as a percentage of net sales in our North America segment was 37.5% for the year ended September 30, 2010 compared to 36.6% for the year ended September 30, 2009. The increase in gross profit as a percentage of net sales was primarily driven by the $27.3 million decrease in EPG sales, which have lower margins than hardware sales.
Gross profit of $34.2 million in our Rest of World segment for the year ended September 30, 2010 decreased $5.6 million, or 14.0%, compared to the year ended September 30, 2009. Gross profit as a percentage of net sales was 35.8% for the year ended September 30, 2010 compared to 38.7% for the year ended September 30, 2009. The lower gross profit resulted from a $4.2 million decrease in higher margin ad hoc sales as well as a reduction in the average ad hoc gross profit percentage reducing the gross profit by $1.4 million. This was due to the general market decline. The increased JIT sales came at a reduced margin of $0.6 million, offsetting the margin lost from lower LTA sales of $0.5 million.
Selling, General and Administrative Expenses
Total selling, general and administrative expenses of $99.9 million for the year ended September 30, 2010 decreased $4.0 million, or 3.8%, compared to the year ended September 30, 2009, as we leveraged our infrastructure to support sales growth.
49
Selling, general and administrative expenses of $81.7 million in our North America segment for the year ended September 30, 2010 decreased $4.3 million, or 5.0%, compared to the year ended September 30, 2009. This decrease was primarily a result of a reduction in non-cash stock-based compensation expense of $7.9 million, which was predominantly associated with restricted stock units that became fully vested on September 30, 2009, and a $1.6 million decrease in amortization expense related to certain intangible assets becoming fully amortized. These deductions were partially offset by increases of $0.6 million and $0.2 million in depreciation and professional service fees, respectively, as well as an increase in payroll expenses of $4.3 million, which was primarily driven by a $3.5 million increase in bonus expense.
Selling, general and administrative expenses of $18.2 million in our Rest of World segment for the year ended September 30, 2010 increased $0.4 million, or 2.0%, compared to the year ended September 30, 2009. This increase was primarily a result of increased payroll costs related to $0.4 million of additional bonus expense.
Other Expenses
Interest Expense, net
Interest expense, net of $36.3 million for the year ended September 30, 2010 decreased $1.4 million, or 3.8%, compared to the year ended September 30, 2009. This decrease was primarily a result of principal debt payments of $67.4 million and a decrease in the average London Inter-Bank Offer Rate, or LIBOR, of 0.7% during the year ended September 30, 2010 as compared the year ended September 30, 2009. This was partially offset by $9.0 million in interest rate swap expense for the year ended September 30, 2010, an increase of $3.3 million as compared to the year ended September 30, 2009. We entered into our interest rate swap agreements midway through the year ended September 30, 2009 to hedge against interest rate fluctuations.
Other (Expense), net
Other expense, net of $0.5 million for the year ended September 30, 2010 increased $0.1 million, compared to the year ended September 30, 2009. This change was primarily due to unrealized foreign exchange losses associated with transactions denominated in currencies other than the respective functional currency of the reporting subsidiary.
Provision for Income Taxes
Provision for income taxes of $43.9 million for the year ended September 30, 2010, increased $6.1 million, or 16.0%, compared to the year ended September 30, 2009. Our effective tax rate was 39.3% and 37.3% during the years ended September 30, 2009 and 2010, respectively. The increase in the provision for income taxes was primarily a result of a $21.3 million, or 22.1%, increase in pre-tax income for the year ended September 30, 2010. Other items impacting the overall tax provision included a decrease in our effective tax rate in the U.S. for the year ended September 30, 2009 related to the filing of an amended 2008 California return, which resulted in a $1.4 million refund.
Net Income
Due to the factors described above, we reported a net income of $73.7 million for the year ended September 30, 2010, compared to net income of $58.4 million for the year ended September 30, 2009. Net income as a percent of net sales increased 1.7% for the year ended September 30, 2010 primarily due to a decrease in operating expenses as a percent of net sales as we continued to leverage our infrastructure to support sales growth.
50
Supplemental Quarterly Financial Information
The following table sets forth our historical unaudited quarterly consolidated statements of operations for each of the last eight quarters ended September 30, 2011. This unaudited quarterly information has been prepared on the same basis as our consolidated audited financial statements appearing elsewhere in this prospectus, and includes all adjustments, consisting only of normal and recurring adjustments, that we consider necessary to present a fair statement of the financial information for the quarters presented. We have not historically experienced any significant seasonality with respect to our results of operations.
The quarterly data should be read in conjunction with our consolidated financial statements and the notes.
| |
Three Months Ended | |||||||||||||||||||||||||
|---|---|---|---|---|---|---|---|---|---|---|---|---|---|---|---|---|---|---|---|---|---|---|---|---|---|---|
| (Dollars in thousands) |
September 30, 2011 |
June 30, 2011 |
March 31, 2011 |
December 31, 2010 |
September 30, 2010 |
June 30, 2010 |
March 31, 2010 |
December 31, 2009 |
||||||||||||||||||
| |
(unaudited) |
|||||||||||||||||||||||||
Consolidated statement of income: |
||||||||||||||||||||||||||
Net sales |
$ | 181,330 | $ | 180,013 | $ | 176,015 | $ | 173,528 | $ | 174,009 | $ | 171,116 | $ | 164,105 | $ | 146,806 | ||||||||||
Gross profit |
72,650 | 68,620 | 67,427 | 66,699 | 68,150 | 68,240 | 63,197 | 54,643 | ||||||||||||||||||
Selling, general and administrative expenses |
34,087 | 29,817 | 24,494 | 25,388 | 25,621 | 24,968 | 24,568 | 24,758 | ||||||||||||||||||
Income from operations |
38,563 | 38,803 | 42,933 | 41,311 | 42,529 | 43,272 | 38,629 | 29,885 | ||||||||||||||||||
Interest expense, net |
(6,939 | ) | (14,966 | ) | (6,309 | ) | (6,277 | ) | (8,857 | ) | (9,199 | ) | (9,635 | ) | (8,579 | ) | ||||||||||
Other income (expense), net |
1,137 | 45 | (693 | ) | 516 | (1,020 | ) | (495 | ) | 1,098 | (41 | ) | ||||||||||||||
Income before provision for taxes |
32,761 | 23,882 | 35,931 | 35,550 | 32,652 | 33,578 | 30,092 | 21,265 | ||||||||||||||||||
Provision for income taxes |
(14,732 | ) | (9,921 | ) | (13,993 | ) | (13,880 | ) | (12,620 | ) | (12,121 | ) | (11,978 | ) | (7,194 | ) | ||||||||||
Net income |
$ | 18,029 | $ | 13,961 | $ | 21,938 | $ | 21,670 | $ | 20,032 | $ | 21,457 | $ | 18,114 | $ | 14,071 | ||||||||||
Liquidity and Capital Resources
Overview
Our primary sources of liquidity are cash flow from operations and available borrowings under our new revolving facility. We have historically funded our operations, debt payments, capital expenditures and discretionary funding needs from our cash from operations. We had total available cash and cash equivalents of approximately $45.5 million and $39.5 million as of September 30, 2011 and 2010, respectively. In addition, as of September 30, 2011, we had no amounts outstanding under the new revolving facility. Our primary uses of cash are for:
- •
- operating expenses;
- •
- working capital requirements to fund the growth of our business;
- •
- capital expenditures that primarily relate to IT equipment and our warehouse operations; and
- •
- debt service requirements for borrowings under the new senior secured credit facilities.
Generally, cash provided by operating activities has been adequate to fund our operations. Due to fluctuations in our cash flows and the growth in our operations, it may be necessary from time to time in the future to borrow under our new revolving facility to meet cash demands. We anticipate that cash
51
provided by operating activities, cash and cash equivalents and borrowing capacity under our new revolving facility will be sufficient to meet our cash requirements for the next twelve months. As of September 30, 2011, we did not have any material capital expenditure commitments.
Senior Secured Credit Facilities
New Senior Secured Credit Facilities
On April 7, 2011, Wesco Aircraft Hardware Corp. entered into a new $765.0 million senior secured credit facility with Barclays Bank PLC, as administrative agent and collateral agent, and Merrill Lynch, Pierce, Fenner & Smith, Incorporated, Key Bank, N.A. and Barclays Capital, as joint lead arrangers, which we refer to as the new senior secured credit facilities.
The purpose of the refinancing was to extend the maturity dates under the term loans of Wesco Aircraft Hardware Corp.'s existing senior secured credit facilities, which we refer to as the old senior secured credit facilities, and increase the borrowing capacity under our revolver. The new senior secured credit facilities consist of a (i) $150.0 million revolving credit facility, which we refer to as the new revolving facility, (ii) $265.0 million term loan A facility, which we refer to as the new term loan A facility, and (iii) $350.0 million term loan B facility, which we refer to as the new term loan B facility. Wesco Aircraft is a guarantor of the new senior secured credit facilities. As of September 30, 2011, our outstanding indebtedness under our new senior secured credit facilities was approximately $556.0 million, of which (a) $238.0 million consisted of indebtedness under the new term loan A facility and (b) $318.0 million consisted of indebtedness under the new term loan B facility. There were no outstanding borrowings under the new revolving facility as of September 30, 2011.
As a result of the refinancing, we have recorded a loss on extinguishment of debt in the amount of $7.1 million, consisting of write-offs of unamortized debt issuance costs and third party fees of $6.5 million and $0.6 million, respectively. The loss on extinguishment is recorded as a component of interest expense, net in the consolidated statement of income during the year ended September 30, 2011. Additionally, $1.9 million of unamortized debt issuance costs will remain capitalized and new creditor fees associated with the April 7, 2011 refinancing in the amount of $12.6 million will be capitalized. These fees will be amortized over the term of the debt using the effective interest rate method.
Borrowings under the new revolving facility and new term loan A facility bear interest at the Eurocurrency rate plus the applicable margin or the ABR plus the applicable margin. Borrowings under the new term loan B facility bear interest at a rate equal to (A) the greater of (x) the Eurocurrency rate and (y) 1.25% or (B) the greater of (x) the ABR and (y) 1.25%, plus, in each case, the applicable margin.
The applicable margin for the new revolving facility and the new term loan A facility was 3.00% for Eurocurrency loans and 2.00% for ABR loans for the six-month period after the closing of the new senior secured credit facilities, and thereafter the applicable margin will be based on our total net leverage ratio as determined in the most recently delivered financial statements, with the respective margins ranging from 2.25% to 3.25% for Eurocurrency loans and 1.25% to 2.25% for ABR loans. The applicable margin for the new term loan B facility is 3.00% for Eurocurrency loans and 2.00% for ABR loans for the period from the closing date of the new senior secured credit facilities until June 30, 2012, and thereafter the applicable margin will be based on our total net leverage ratio as determined in the most recently delivered financial statements, with the respective margins ranging from 2.75% to 3.00% for Eurocurrency loans and 1.75% to 2.00% for ABR loans.
The new revolving facility and new term loan A facility each mature on April 7, 2016 and the new term loan B facility matures on April 7, 2017.
52
The obligations under the new senior secured credit facilities are guaranteed by us and all of our direct and indirect, wholly owned, domestic restricted subsidiaries (subject to certain exceptions) and secured by a first lien on substantially all of our assets and the assets of our guarantor subsidiaries, including capital stock of subsidiaries (in each case, subject to certain exceptions).
The new senior secured credit facilities contain customary negative covenants, including restrictions on our and our restricted subsidiaries' ability to merge and consolidate with other companies, incur indebtedness, grant liens or security interests on assets, make acquisitions, loans, advances or investments, pay dividends, sell or otherwise transfer assets, optionally prepay or modify terms of any junior indebtedness or enter into transactions with affiliates. The new senior secured credit facilities also require the maintenance of a net-debt-to-EBITDA ratio (as such ratio is defined in the new senior secured credit facilities) of less than 4.00 and an EBITDA-to-net cash interest expense ratio (as such ratio is defined in the new senior secured credit facilities) of no lower than 2.25. As of September 30, 2011, our net-debt-to-EBITDA ratio was 2.74 and our EBITDA-to-net cash interest expense ratio was 8.11.
The new senior secured credit facilities contain customary affirmative covenants, including delivery of financial and other information to the administrative agent, notice to the administrative agent upon the occurrence of certain material events, preservation of existence, payment of material taxes and other claims, maintenance of properties and insurance, maintenance of books and records, access to properties and records for inspection by administrative agent and lenders, further assurances and provision of additional collateral and guarantees.
The new senior secured credit facilities provide that, upon the occurrence of certain events of default, the obligations thereunder may be accelerated and the lending commitments terminated. Such events of default include payment defaults to the lenders, material inaccuracies of representations and warranties, covenant defaults, cross-defaults to other material indebtedness, voluntary and involuntary bankruptcy proceedings, material money judgments, material ERISA events, certain change of control events and other customary events of default.
Old Senior Secured Credit Facilities
The old senior secured credit facilities, which were repaid on April 7, 2011 in connection with our entry into the new senior secured credit facilities, consisted of a $625.0 million first lien credit facility, which we refer to as the old first lien credit facility, and a $150.0 million second lien credit facility, which we refer to as the old second lien credit facility. At the time of initial incurrence, the old first lien credit facility was comprised of a $450.0 million first lien term loan facility and a $75.0 million first lien revolving line of credit. On June 30, 2008, we modified the terms of the old first lien credit facility to include an additional $100.0 million of term loan borrowings thereunder, to fund the Airtechnics Acquisition, bringing the old first lien term loan facility up to $550.0 million at such time. As of April 7, 2011, the date on which the old senior secured credit facilities were repaid, we had approximately $477.2 million outstanding under the old first lien credit facility.
The interest rate on term loans under the old first lien credit facility was calculated using either Alternate Base Rate, or ABR (which is defined as Prime Rate plus an applicable margin rate of 1.25%), or Eurocurrency rate (defined as LIBOR plus an applicable margin rate of 2.25%), at our option. The interest rate on the term loans under the old first lien credit facility was 2.50% as of April 7, 2011.
There were no outstanding borrowings under the old revolving facility as of April 7, 2011, or at any point during fiscal 2011 or fiscal 2010, prior to the repayment of the old senior secured credit facilities. The annual commitment fees for the old revolving facility were approximately $0.3 million.
53
As of April 7, 2011 we had approximately $129.0 million outstanding under the old second lien credit facility. The interest rate on the old second lien credit facility was calculated using ABR (defined as Prime Rate plus the applicable margin rate of 4.75%) or Eurocurrency rate (defined as LIBOR plus an applicable margin rate of 5.75%), at our option. The interest rate on the old second lien credit facility was 6.00% as of April 7, 2011.
During fiscal 2011, prior to the repayment of the old senior secured credit facilities on April 7, 2011, we made repayments totaling approximately $14.0 million with respect to the term loans under the old second lien credit facility, inclusive of contractually scheduled payments.
UK Line of Credit
Our subsidiary, Wesco Aircraft Europe Limited, also has a £10.0 million (approximately $15.6 million based on the September 30, 2011 exchange rate) line of credit available that automatically renews annually on October 1, which we refer to as the UK Line of Credit. This line of credit bears interest based on the base rate plus an applicable margin of 1.15%. There were no outstanding borrowings under the UK Line of Credit as of September 30, 2011.
Cash Flows
A summary of our operating, investing and financing activities are shown in the following table:
| |
Year Ended September 30, | |||||||||
|---|---|---|---|---|---|---|---|---|---|---|
(In thousands)
|
2011 | 2010 | 2009 | |||||||
Consolidated statements of cash flows data: |
||||||||||
Net cash provided by operating activities |
$ | 86,317 | $ | 100,773 | $ | 1,266 | ||||
Net cash used in investing activities |
(5,119 | ) | (3,077 | ) | (4,135 | ) | ||||
Net cash used in financing activities |
(75,126 | ) | (69,483 | ) | (1,720 | ) | ||||
Operating Activities
Our operating activities generated $86.3 million of cash in the year ended September 30, 2011, a decrease of $14.5 million compared to the year ended September 30, 2010. This decrease was primarily due to an increase in working capital including a $4.2 million increase to income tax receivable, a $4.1 million reduction related to income taxes payable and a $5.6 million use of cash related to accounts payable for the year ended September 30, 2011.
The $8.3 million increased use of cash related to taxes was driven by increased estimated quarterly payments as well as increased receivables related to certain beneficial tax items. The $5.6 million decrease in accounts payable was driven primarily by timing. We typically pay vendors every Friday, and our fiscal year ended September 30, 2011 contained one additional Friday as compared to the prior fiscal year. This additional Friday resulted in an extra accounts payable payment processing day thereby causing our accounts payable to decrease by $5.6 million compared to the prior year.
Our operating activities generated $100.8 million of cash in the year ended September 30, 2010, an increase of $99.5 million compared to the year ended September 30, 2009. This increase was primarily the result of a $112.7 million net decrease in the change in inventory for the year ended September 30, 2010 as compared to the year ended September 30, 2009. Net income also increased $15.2 million during the year ended September 30, 2010. This was offset by a $12.2 million increase in the net change in accounts receivable for the year ended September 30, 2009 as compared to the year ended September 30, 2010. This increase was primarily driven by a $43.3 million, or 7.1%, increase in net sales for the year ended September 30, 2010. The average days sales outstanding remained constant at 50 days for both the years ended September 30, 2009 and 2010. Our accounts receivable balance as a
54
percentage of net sales was 13.6% and 13.6% for the years ended September 30, 2009 and September 30, 2010, respectively.
Our operating activities generated $1.3 million of cash in the year ended September 30, 2009, a decrease of $23.4 million compared to the year ended September 30, 2008. This decrease was primarily the result of a $52.4 million increase in the net change in inventory for the year ended September 30, 2009 as compared to the year ended September 30, 2008. This significant inventory increase was caused by increased supplier capacity that resulted in shorter lead times and faster shipments of our pre-existing orders. This was offset by a decrease of $15.6 million in accounts receivable driven by a five day decrease in days sales outstanding of 50 days for the year ended September 30, 2009, as compared to 55 days for the year ended September 30, 2008. Our accounts receivable balance as a percentage of net sales was 15.1% and 13.6% for the years ended September 30, 2008 and September 30, 2009, respectively. The 1.5% increase for fiscal 2008 compared with fiscal 2009 was primarily the result of increased net sales during the last two months of fiscal 2008.
Our accounts receivable balance as a percentage of net sales may fluctuate from quarter-to-quarter. These fluctuations are primarily driven by changes, from quarter-to-quarter, in (i) the timing of sales and (ii) the current average days sales outstanding. The completion of customer contracts with accelerated payment terms can also contribute to these quarter-to-quarter fluctuations.
Our allowance for doubtful accounts may also fluctuate from quarter-to-quarter. These fluctuations are primarily driven by changes in our accounts receivable balance, and can also be impacted by the repayment of amounts owed to us that had previously been categorized as bad debt.
Investing Activities
Our investing activities used approximately $5.1 million, $3.1 million and $4.1 million of cash in the years ended September 30, 2011, 2010 and 2009, respectively. These amounts were used for investments in various capital expenditures and to purchase property and equipment. Our purchases of property and equipment may vary from period to period due to the timing of the expansion of our business and the investment requirements to provide us with technology that allows us to better serve our customers.
55
Financing Activities
Our financing activities used approximately $75.1 million of cash in the year ended September 30, 2011. This amount primarily consisted of $64.2 million used to repay principal against the old senior secured credit facilities and new credit facility, $13.1 million used to pay fees associated with the April 2011 debt refinancing and the remaining amount was used to make repayments under our capital lease obligations and proceeds from exercise of stock options.
Our financing activities used $69.5 million of cash in the year ended September 30, 2010. This amount consisted of $67.4 million used to make repayments under the old senior secured credit facilities, $1.3 million used to make repayments under our capital lease obligations and $0.8 million used to make repayments under our UK Line of Credit.
Our financing activities used $1.7 million of cash in the year ended September 30, 2009. This amount consisted of $0.7 million used to redeem vested stock options, $1.0 million used to make repayments under our capital lease obligations and less than $0.1 million used to make repayments under our UK Line of Credit, partially offset by less than $0.1 million in cash proceeds from the exercise of stock options.
Contractual Obligations
The following table is a summary of contractual cash obligations at September 30, 2011 (in thousands):
| |
Payments Due by Period | |||||||||||||||
|---|---|---|---|---|---|---|---|---|---|---|---|---|---|---|---|---|
| |
Less Than 1 Year |
1 - 3 Years |
3 - 5 Years |
More Than 5 Years |
Total | |||||||||||
Long-Term Debt Obligations(1) |
$ | — | $ | 26,000 | $ | 212,000 | $ | 318,000 | $ | 556,000 | ||||||
Capital Lease Obligations(2) |
2,085 | 675 | 21 | — | 2,781 | |||||||||||
Operating Lease Obligations(3) |
3,706 | 5,749 | 4,092 | 5,452 | 18,999 | |||||||||||
Purchase Obligations(4) |
212,321 | 5,561 | — | — | 217,882 | |||||||||||
Total |
$ | 218,112 | $ | 37,985 | $ | 216,113 | $ | 323,452 | $ | 795,662 | ||||||
- (1)
- Includes
our payment obligations under our new senior secured credit facilities. These amounts do not include variable interest payments required to be
made.
- (2)
- Includes
our payment obligations under leases classified as a capital lease.
- (3)
- Includes
any payment obligations under leases classified as an operating lease.
- (4)
- Includes our current open purchase orders with respect to the purchase of products and the estimated timing of the transaction.
Off-Balance Sheet Arrangements
We are not a party to any off-balance sheet arrangements.
Recently Adopted Accounting Pronouncements
See Note 3 of Notes to Consolidated Financial Statements in Part II, Item 8 of this annual report on Form 10-K for a summary of recently issued and adopted accounting pronouncements.
56
ITEM 7A. QUANTITATIVE AND QUALITATIVE DISCLOSURES ABOUT MARKET RISKS
Our exposure to market risk consists of foreign currency exchange rate fluctuations, changes in interest rates and fluctuations in fuel prices.
Foreign Currency Exposure
Currency translation
During the years ended September 30, 2011 and September 30, 2010, approximately 17% and 15%, respectively, of our net sales were made by our foreign subsidiaries, and our total non-U.S. net sales represented approximately 30% and 26%, respectively, of our total net sales. As a result of these international operating activities, we are exposed to risks associated with changes in foreign exchange rates, principally exchange rates between the U.S. dollar, British pound and the Euro.
The results of operations of our foreign subsidiaries are translated into U.S. dollars at the average exchange rate for each relevant period. This translation has no impact on our cash flow. However, as foreign exchange rates change, there are changes to the U.S. dollar equivalent of sales and expenses denominated in foreign currencies. Any adjustments resulting from the translation are recorded in accumulated other comprehensive income on our statements of changes in stockholders' equity. We do not consider the risk associated with exchange rate fluctuations to be material to our financial condition or results of operations.
A hypothetical 5% increase in the value of the British pound and the Euro relative to the U.S. dollar would have resulted in an increase in our net income of approximately $0.4 million and less than $0.1 million, respectively, during fiscal 2011 and approximately $0.3 million and less than $0.1 million, respectively, during fiscal 2010. A corresponding decrease would have resulted in a decrease in our net income of approximately $0.4 million and less than $0.1 million, respectively, during fiscal 2011 and approximately $0.3 million and less than $0.1 million, respectively, during fiscal 2010.
Currency transactions
Currency transaction exposure arises where actual sales and purchases are made by a company in a currency other than its own functional currency. During the year ended September 30, 2011, our subsidiary in the United Kingdom had sales in U.S. dollars and Euros of approximately $85.1 million and €7.6 million, respectively, and had purchases in U.S. dollars and Euros of approximately $61.2 million and €13.4 million, respectively. During the year ended September 30, 2010, our subsidiary in the United Kingdom had sales in U.S. dollars and Euros of approximately $66.0 million and €8.2 million, respectively, and had purchases in U.S dollars and Euros of approximately $47.9 million and €8.7 million, respectively. To the extent possible, we structure arrangements where the purchase transactions are denominated in U.S. dollars in order to minimize near-term exposure to foreign currency fluctuations.
From September 30, 2008 to September 30, 2009, the average value of the U.S. dollar strengthened against the British pound by $0.42 (from $1.97 to $1.55). From September 30, 2009 to September 30, 2010, the British pound stabilized against the dollar. From September 30, 2010 through September 30, 2011, the pound strengthened slightly against the dollar by $0.06 (from $1.56 to $1.61). A strengthening of the U.S. dollar means we realize a lesser amount of U.S. dollar revenue on sales that were denominated in British pounds. In fiscal 2009, the strengthening of the U.S. dollar relative to the British pound resulted in a negative impact of approximately $22.1 million in net sales as compared to the exchange rate during fiscal 2008 and resulted in a decrease of approximately $2.9 million in our net income in fiscal 2009. As a result of the stabilization of the value of the British pound against the U.S. dollar during fiscal 2010 and the slight weakening of the U.S. dollar during the year ended September 30, 2011, currency transactions did not have a material impact on our financial results
57
during those periods. A hypothetical 5% increase in the value of the British pound relative to the U.S. dollar would have resulted in an increase in our net income of approximately $0.4 million and $0.3 million during fiscal 2011 and fiscal 2010, respectively, attributable to our foreign currency transactions. A corresponding decrease would have resulted in a decrease in our net income of approximately $0.4 million and $0.3 million during fiscal 2011 and fiscal 2010, respectively.
We have historically entered into currency forward and option contracts to limit exposure to currency rate changes and will continue to monitor our transaction exposure to currency rate changes. Gains and losses on these contracts are deferred until the transaction being hedged is finalized. As of September 30, 2011, we had no outstanding currency forward and option contracts.
Interest Rate Risk
Our principal interest rate exposure relates to the new senior secured credit facilities, which bear interest at a variable rate. See Part II, Item 7. "Management's Discussion and Analysis of Financial Condition and Results of Operations—Liquidity and Capital Resources—Senior Secured Credit Facilities—New Senior Secured Credit Facilities." If there is a rise in interest rates, our debt service obligations on the borrowings under the new senior secured credit facilities would increase even though the amount borrowed remained the same, which would affect our results of operations, financial condition and liquidity. At our debt level and borrowing rates as of September 30, 2011, annual cash interest expense, including fees under our new revolving facility, would have been approximately $22.0 million. If variable interest rates were to change by 1.0%, our interest expense would fluctuate approximately $2.4 million per year, without taking into account the effect of any hedging instruments.
We periodically enter into interest rate swap agreements to manage interest rate risk on our borrowing activities. Upon the maturity of our previous interest rate swap agreements, we entered into two interest rate swap agreements that expire in February and June 2012, respectively, which we refer to collectively as the Swaps. Each Swap converts the interest rate on approximately $100.0 million (notional amount) of our outstanding indebtedness from variable rates to a fixed interest rate. During the years ended September 30, 2011 and September 30, 2010, we recorded a gain in the amount of approximately $5.0 million and a loss in the amount of $2.6 million, respectively, as a result of changes in fair value of derivative financial instruments. These gains and losses are recorded as a component of interest expense.
We do not hold or issue derivative financial instruments for trading or speculative purposes.
Fuel Price Risk
Our principal direct exposure to increases in fuel prices is as a result of potential increased freight costs caused by fuel surcharges or other fuel cost-driven price increases implemented by the third-party package delivery companies on which we rely. We estimate that our annual freight costs are approximately $2.5 million, and, as a result, we do not believe the impact of these potential fuel surcharges or fuel cost-driven price increases would have a material impact on our business, financial condition and results of operations. In addition, increases in fuel prices may have an indirect material adverse effect on our business, financial condition and results of operations, as such increases may contribute to decreased airline profitability and, as a result, decreased demand for new commercial aircraft that utilize the products we sell. See Part I, Item 1A. "Risk Factors—We may be materially adversely affected by high fuel prices." We do not use derivatives to manage our exposure to fuel prices.
58
ITEM 8. FINANCIAL STATEMENTS AND SUPPLEMENTARY DATA
INDEX TO CONSOLIDATED FINANCIAL STATEMENTS
59
Report of Independent Registered Public Accounting Firm
To the Board of Directors and Stockholders of Wesco Aircraft Holdings, Inc.:
In our opinion, the accompanying consolidated balance sheets and the related consolidated statements of income, stockholders' equity and comprehensive income, and cash flows present fairly, in all material respects, the financial position of Wesco Aircraft Holdings, Inc. and its subsidiaries at September 30, 2011 and September 30, 2010, and the results of their operations and their cash flows for each of the three years in the period ended September 30, 2011 in conformity with accounting principles generally accepted in the United States of America. These financial statements are the responsibility of the Company's management. Our responsibility is to express an opinion on these financial statements based on our audits. We conducted our audits of these statements in accordance with the standards of the Public Company Accounting Oversight Board (United States). Those standards require that we plan and perform the audit to obtain reasonable assurance about whether the financial statements are free of material misstatement. An audit includes examining, on a test basis, evidence supporting the amounts and disclosures in the financial statements, assessing the accounting principles used and significant estimates made by management, and evaluating the overall financial statement presentation. We believe that our audits provide a reasonable basis for our opinion.
/s/
PricewaterhouseCoopers LLP
Los Angeles, California
December 5, 2011
60
Wesco Aircraft Holdings, Inc. and Subsidiaries
Consolidated Balance Sheets
September 30, 2011 and 2010
(In thousands, except
share and per share data)
| |
2011 | 2010 | |||||||
|---|---|---|---|---|---|---|---|---|---|
Assets |
|||||||||
Current assets |
|||||||||
Cash and cash equivalents |
$ | 45,525 | $ | 39,463 | |||||
Accounts receivable, net of allowance for doubtful accounts of $4,257 at September 30, 2011 and $6,236 at September 30, 2010 |
97,289 | 89,427 | |||||||
Inventories |
483,062 | 483,442 | |||||||
Prepaid expenses and other current assets |
11,740 | 6,581 | |||||||
Deferred income taxes |
39,289 | 33,138 | |||||||
Total current assets |
676,905 | 652,051 | |||||||
Property and equipment, net |
20,952 |
20,173 |
|||||||
Deferred financing costs, net |
12,058 | 10,329 | |||||||
Goodwill |
504,764 | 504,841 | |||||||
Intangible assets, net |
86,239 | 89,998 | |||||||
Other assets |
467 | 1,620 | |||||||
Total assets |
$ | 1,301,385 | $ | 1,279,012 | |||||
Liabilities and Stockholders' Equity |
|||||||||
Current liabilities |
|||||||||
Accounts payable |
$ | 53,069 | $ | 59,183 | |||||
Accrued expenses and other current liabilities |
18,664 | 20,888 | |||||||
Income taxes payable |
1,144 | 5,500 | |||||||
Capital lease obligations—current portion |
2,069 | 1,354 | |||||||
Total current liabilities |
74,946 | 86,925 | |||||||
Long-term debt |
556,000 | 620,243 | |||||||
Capital lease obligations |
712 | 1,789 | |||||||
Deferred income taxes |
41,256 | 23,927 | |||||||
Other liabilities |
— | 389 | |||||||
Total liabilities |
672,914 | 733,273 | |||||||
Commitments and contingencies |
|||||||||
Stockholders' equity |
|||||||||
Preferred stock, $0.001 par value per share: 50,000,000 shares authorized; no shares issued and outstanding |
— | — | |||||||
Common stock, class A, $0.001 par value per share: 950,000,000 shares authorized; 85,716,863 and 83,875,053 shares issued and outstanding as of September 30, 2011 and September 30, 2010, respectively |
86 | 84 | |||||||
Class B convertible redeemable common stock, $0.001 par value per share: 2,000,000 shares authorized; zero and 1,089,742 shares issued and outstanding as of September 30, 2011 and 2010, respectively |
— | 1 | |||||||
Additional paid-in capital |
336,998 | 329,181 | |||||||
Accumulated other comprehensive loss |
(7,972 | ) | (7,288 | ) | |||||
Retained earnings |
299,359 | 223,761 | |||||||
Total stockholders' equity |
628,471 | 545,739 | |||||||
Total liabilities and stockholders' equity |
$ | 1,301,385 | $ | 1,279,012 | |||||
See the accompanying notes to the consolidated financial statements.
61
Wesco Aircraft Holdings, Inc. and Subsidiaries
Consolidated Statements of Income
For the Years Ended September 30, 2011, 2010 and 2009
(In thousands, except per share data)
| |
2011 | 2010 | 2009 | ||||||||||
|---|---|---|---|---|---|---|---|---|---|---|---|---|---|
Net sales |
$ | 710,886 | $ | 656,036 | $ | 612,687 | |||||||
Cost of sales |
435,490 | 401,806 | 374,400 | ||||||||||
Gross profit |
275,396 | 254,230 | 238,287 | ||||||||||
Selling, general and administrative expenses |
113,786 | 99,915 | 103,895 | ||||||||||
Income from operations |
161,610 | 154,315 | 134,392 | ||||||||||
Interest expense, net |
(34,491 | ) | (36,270 | ) | (37,707 | ) | |||||||
Other income (expense), net |
1,005 | (458 | ) | (376 | ) | ||||||||
Income before provision for income taxes |
128,124 | 117,587 | 96,309 | ||||||||||
Provision for income taxes |
(52,526 | ) | (43,913 | ) | (37,862 | ) | |||||||
Net income |
$ | 75,598 | $ | 73,674 | $ | 58,447 | |||||||
Net income per share: |
|||||||||||||
Basic |
$ | 0.83 | $ | 0.81 | $ | 0.69 | |||||||
Diluted |
$ | 0.81 | $ | 0.81 | $ | 0.65 | |||||||
Weighted average shares outstanding: |
|||||||||||||
Basic |
90,697 | 90,569 | 84,965 | ||||||||||
Diluted |
93,182 | 91,068 | 89,682 | ||||||||||
See the accompanying notes to the consolidated financial statements.
62
Wesco Aircraft Holdings, Inc. and Subsidiaries
Consolidated Statements of Stockholders' Equity and Comprehensive Income
For the Years Ended September 30, 2011, 2010 and 2009
(In thousands)
| |
|
|
Class B Convertible Redeemable Common Stock |
|
|
|
|
|
|||||||||||||||||||||
|---|---|---|---|---|---|---|---|---|---|---|---|---|---|---|---|---|---|---|---|---|---|---|---|---|---|---|---|---|---|
| |
Class A Common Stock |
|
|
|
|
|
|||||||||||||||||||||||
| |
|
Accumulated Other Comprehensive Income (Loss) |
|
|
|
||||||||||||||||||||||||
| |
Additional Paid-In Capital |
Retained Earnings |
Total Shareholders' Equity |
Comprehensive Income |
|||||||||||||||||||||||||
| |
Shares | Amount | Shares | Amount | |||||||||||||||||||||||||
Balance, September 30, 2008 |
83,875 | $ | 84 | 1,047 | $ | 1 | $ | 316,995 | $ | 1,053 | $ | 91,640 | $ | 409,773 | $ | 59,330 | |||||||||||||
Exercise of stock options |
— | — | 4 | — | 16 | — | — | 16 | |||||||||||||||||||||
Stock-based compensation |
— | — | 39 | — | 10,389 | — | — | 10,389 | |||||||||||||||||||||
Redemption of vested stock options |
— | — | — | — | (729 | ) | — | — | (729 | ) | |||||||||||||||||||
Net income |
— | — | — | — | — | — | 58,447 | 58,447 | 58,447 | ||||||||||||||||||||
Other comprehensive income |
|||||||||||||||||||||||||||||
Foreign currency translation adjustment, net of tax |
— | — | — | — | — | (3,956 | ) | — | (3,956 | ) | (3,956 | ) | |||||||||||||||||
Total comprehensive income |
$ | 54,491 | |||||||||||||||||||||||||||
Balance, September 30, 2009 |
83,875 | $ | 84 | 1,090 | $ | 1 | $ | 326,671 | $ | (2,903 | ) | $ | 150,087 | $ | 473,940 | ||||||||||||||
Stock-based compensation |
— | — | — | — | 2,510 | — | — | 2,510 | |||||||||||||||||||||
Net income |
— | — | — | — | — | — | 73,674 | 73,674 | 73,674 | ||||||||||||||||||||
Other comprehensive income |
|||||||||||||||||||||||||||||
Foreign currency translation adjustment, net of tax |
— | — | — | — | — | (4,385 | ) | — | (4,385 | ) | (4,385 | ) | |||||||||||||||||
Total comprehensive income |
$ | 69,289 | |||||||||||||||||||||||||||
Balance, September 30, 2010 |
83,875 | $ | 84 | 1,090 | $ | 1 | $ | 329,181 | $ | (7,288 | ) | $ | 223,761 | $ | 545,739 | ||||||||||||||
Recapitalization of capital structure |
1,090 | 1 | (1,090 | ) | (1 | ) | — | — | — | — | |||||||||||||||||||
Issuance of common stock from stock options exercised |
571 | 1 | — | — | 2,612 | — | — | 2,613 | |||||||||||||||||||||
Excess tax benefit related to stock options exercised |
— | — | — | — | 1,547 | — | — | 1,547 | |||||||||||||||||||||
Stock-based compensation |
181 | — | — | 3,658 | — | — | 3,658 | ||||||||||||||||||||||
Net income |
— | — | — | — | — | — | 75,598 | 75,598 | 75,598 | ||||||||||||||||||||
Other comprehensive income |
|||||||||||||||||||||||||||||
Foreign currency translation adjustment, net of tax |
— | — | — | — | — | (684 | ) | — | (684 | ) | (684 | ) | |||||||||||||||||
Total comprehensive income |
$ | 74,914 | |||||||||||||||||||||||||||
Balance, September 30, 2011 |
85,717 | $ | 86 | — | $ | — | $ | 336,998 | $ | (7,972 | ) | $ | 299,359 | $ | 628,471 | ||||||||||||||
See the accompanying notes to the consolidated financial statements.
63
Wesco Aircraft Holdings, Inc. and Subsidiaries
Consolidated Statements of Cash Flows
For the Years Ended September 30, 2011, 2010 and 2009
(In thousands)
| |
2011 | 2010 | 2009 | ||||||||||
|---|---|---|---|---|---|---|---|---|---|---|---|---|---|
Cash flows from operating activities |
|||||||||||||
Net income |
$ | 75,598 | $ | 73,674 | $ | 58,447 | |||||||
Adjustments to reconcile net income to net cash provided by operating activities |
|||||||||||||
Amortization of intangible assets |
3,699 | 4,119 | 5,763 | ||||||||||
Depreciation |
5,859 | 4,702 | 4,302 | ||||||||||
Amortization of deferred financing costs |
11,416 | 4,814 | 3,703 | ||||||||||
Bad debt and sales return reserve |
256 | 607 | 254 | ||||||||||
Non-cash foreign currency exchange |
(427 | ) | 242 | 364 | |||||||||
Non-cash stock-based compensation |
3,658 | 2,510 | 10,389 | ||||||||||
Excess tax benefit related to stock options exercised |
(1,547 | ) | — | — | |||||||||
Change in value of derivative |
(4,958 | ) | 2,558 | 4,102 | |||||||||
Deferred income tax provision |
11,176 | 6,741 | 14,024 | ||||||||||
Changes in assets and liabilities |
|||||||||||||
Accounts receivable |
(8,281 | ) | (7,795 | ) | 4,429 | ||||||||
Income taxes receivable |
(4,176 | ) | (45 | ) | 7 | ||||||||
Inventories |
(129 | ) | 1,593 | (111,136 | ) | ||||||||
Prepaid expenses and other assets |
1,388 | 4,448 | (959 | ) | |||||||||
Accounts payable |
(5,558 | ) | (1,099 | ) | 9,073 | ||||||||
Accrued expenses and other liabilities |
2,406 | 3,423 | (3,446 | ) | |||||||||
Income taxes payable |
(4,063 | ) | 281 | 1,950 | |||||||||
Net cash provided by operating activities |
86,317 | 100,773 | 1,266 | ||||||||||
Cash flows from investing activities |
|||||||||||||
Purchases of property and equipment |
(5,119 | ) | (3,077 | ) | (4,135 | ) | |||||||
Net cash used in investing activities |
(5,119 | ) | (3,077 | ) | (4,135 | ) | |||||||
Cash flows from financing activities |
|||||||||||||
Net repayments under line of credit |
— | (796 | ) | (23 | ) | ||||||||
Proceeds from issuance of long-term debt |
615,000 | — | — | ||||||||||
Repayment of long-term debt |
(679,243 | ) | (67,382 | ) | — | ||||||||
Financing fees |
(13,144 | ) | — | — | |||||||||
Redemption of vested stock options |
— | — | (729 | ) | |||||||||
Repayment of capital lease obligations |
(1,898 | ) | (1,305 | ) | (984 | ) | |||||||
Excess tax benefit related to stock options exercised |
1,547 | — | — | ||||||||||
Proceeds from exercise of stock options |
2,612 | — | 16 | ||||||||||
Net cash used in financing activities |
(75,126 | ) | (69,483 | ) | (1,720 | ) | |||||||
Effect of foreign currency exchange rates on cash and cash equivalents |
(10 | ) | (156 | ) | (3 | ) | |||||||
Net increase in cash and cash equivalents |
6,062 | 28,057 | (4,592 | ) | |||||||||
Cash and cash equivalents, beginning of period |
39,463 | 11,406 | 15,998 | ||||||||||
Cash and cash equivalents, end of period |
$ | 45,525 | $ | 39,463 | $ | 11,406 | |||||||
Supplemental disclosure of cash flow information (see Note 16)
See the accompanying notes to the consolidated financial statements.
64
Wesco Aircraft Holdings, Inc. & Subsidiaries
Notes to the Consolidated Financial Statements
(In thousands, except share and per share data)
Note 1. Organization and Business
Wesco Aircraft Holdings, Inc. is a distributor and provider of comprehensive supply chain management services to the global aerospace industry. The Company's services range from traditional distribution to the management of supplier relationships, quality assurance, kitting, just-in-time, or JIT delivery, and point-of-use inventory management.
In addition to the central stocking facilities, the Company uses a network of forward-stocking locations to service its customers in a JIT and/or ad hoc manner. There are over 15 stocking locations around the world with concentrations in North America and Europe. In addition to product fulfillment, the Company also provides comprehensive supply chain management services for selected customers. These services include procurement and just-in-time inventory management and delivery services.
On September 29, 2006, 100% of the outstanding stock of Wesco Aircraft Hardware Corp., Wesco Aircraft Israel and the European entities of Flintbrook Ltd., Wesco Aircraft France and Wesco Aircraft Germany were acquired by the Company. The acquisition was completed in a leveraged transaction in which affiliates of The Carlyle Group invested approximately 85% of the total voting equity in the Company and the prior owner of the Company contributed the remaining 15% of the total voting equity invested. The prior owner's investment represented a contribution of ownership in the predecessor company to the newly formed holding company. In accordance with Accounting Standards Codification ("ASC") 805, Business Combinations, the acquired assets and liabilities have been recorded at fair value for the interests acquired by new investors and at carryover basis for the continuing investors.
Note 2. Summary of Significant Accounting Policies
Principles of Consolidation
The accompanying consolidated financial statements include the accounts of Wesco Aircraft Hardware Corp., Wesco Aircraft Europe Limited, Flintbrook Limited, Wesco Aircraft Germany GmbH, Wesco Aircraft France SAS, Wesco Aircraft Israel Limited, Wesco Aircraft Italy SRL, Wesco Aircraft Hardware India Pvt., Limited, and Wesco Aircraft Trading Shanghai Co., Limited. All intercompany accounts and transactions have been eliminated.
Use of Estimates in Preparation of Financial Statements
The preparation of financial statements, in conformity with accounting principles generally accepted in the United States of America, requires management to make estimates and assumptions that affect the reported amounts of assets and liabilities and the disclosure of contingent assets and liabilities at the date of the financial statements and the reported amounts of revenues and expenses during the reporting period. Estimates are used for, but not limited to, receivable valuations and sales returns, inventory valuations of excess and obsolete inventories, the useful lives of long-lived assets including property, equipment and intangible assets, annual goodwill impairment assessment, income taxes and contingencies. Actual results could differ from such estimates.
Cash and Cash Equivalents
The Company considers all highly liquid investments with original maturities from date of purchase by the Company of three months or less to be cash equivalents.
65
Wesco Aircraft Holdings, Inc. & Subsidiaries
Notes to the Consolidated Financial Statements (Continued)
(In thousands, except share and per share data)
Note 2. Summary of Significant Accounting Policies (Continued)
Accounts Receivable
Accounts receivable consist of amounts owed to the Company by customers. The Company performs periodic credit evaluations of the financial condition of its customers, monitors collections and payments from customers, and generally does not require collateral. Accounts receivable are generally due within 30 to 60 days. The Company provides for the possible inability to collect accounts receivable by recording an allowance for doubtful accounts. The Company reserves for an account when it is considered to be uncollectible. The Company estimates its allowance for doubtful accounts based on historical experience, aging of accounts receivable and information regarding the creditworthiness of its customers. To date, losses have been within the range of management's expectations. If the estimated allowance for doubtful accounts subsequently proves to be insufficient, additional allowances may be required.
The Company's allowance for doubtful accounts activity consists of the following:
| |
Balance at Beginning of Period |
Changes to Cost and Expenses |
Write-offs | Balance at End of Period |
|||||||||
|---|---|---|---|---|---|---|---|---|---|---|---|---|---|
Allowance for doubtful accounts at September 30, 2009 |
$ | 7,833 | $ | 169 | $ | (2,371 | ) | $ | 5,631 | ||||
Allowance for doubtful accounts at September 30, 2010 |
5,631 | 605 | — | 6,236 | |||||||||
Allowance for doubtful accounts at September 30, 2011 |
6,236 | 254 | (2,233 | ) | 4,257 | ||||||||
Inventories
The Company's inventory is comprised solely of finished goods. Inventories are stated at the lower of weighted-average cost or market. In-bound freight-related costs are included as part of the cost of inventory held for resale. The Company records provisions, as appropriate, to write-down excess and obsolete inventory to estimated net realizable value. The process for evaluating excess and obsolete inventory often requires the Company to make subjective judgments and estimates concerning future sales levels, quantities and prices at which such inventories will be able to be sold in the normal course of business.
Incorrect estimates of future sales may cause the actual results to differ from the estimates at the time such inventories are disposed or sold.
Property and Equipment
Property and equipment are stated at cost, less accumulated amortization and depreciation, computed using the straight-line method over the estimated useful life of each asset. Leasehold improvements are amortized over the lesser of the remaining lease term or the estimated useful life of the assets. Expenditures for repair and maintenance costs are expensed as incurred, and expenditures for major renewals and improvements are capitalized. When assets are retired or otherwise disposed of, the cost and accumulated depreciation and amortization are removed from the accounts and any gain
66
Wesco Aircraft Holdings, Inc. & Subsidiaries
Notes to the Consolidated Financial Statements (Continued)
(In thousands, except share and per share data)
Note 2. Summary of Significant Accounting Policies (Continued)
or loss is reflected in the Company's consolidated statements of operations. The useful lives and lease terms for depreciable assets are as follows:
Leasehold improvements |
3 - 15 years | |
Machinery and equipment |
5 - 9 years | |
Furniture and fixtures |
7 years | |
Vehicles |
5 years | |
Computer & Software |
3 - 5 years |
Impairment of Long Lived Assets
The Company assesses potential impairments of its long-lived assets in accordance with the provisions of ASC 360, Property, Plant, and Equipment. An impairment review is performed whenever events or changes in circumstances indicate that the carrying value of the assets may not be recoverable. Factors considered by the Company include, but are not limited to: significant underperformance relative to expected historical or projected future operating results; significant changes in the manner of use of the acquired assets or the strategy for the overall business; and significant negative industry or economic trends. The Company has determined that its asset group for impairment testing is comprised of the assets and liabilities of each of its reporting units as this is the lowest level of identifiable cash flows. The Company has identified customer relationships as the primary asset because it is the principle asset from which the reporting units derive their cash flow generating capacity and has the longest remaining useful life. The recoverability is assessed by comparing the carrying value of the assets group to the undiscounted cash flows expected to be generated by these assets. Impairment losses are measured as the amount by which the carrying values of the primary assets exceed their fair values. To date, the Company has not recognized an impairment charge related to the write-down of long-lived assets.
Deferred Financing Costs
Deferred financing costs are amortized using the effective interest method over the term of the related credit arrangement and are included in interest expense in the consolidated statement of operations. Amortization of deferred financing costs was $11,416, $4,814 and $3,703, respectively, for the years ended September 30, 2011, 2010 and 2009. At September 30, 2011 and September 30, 2010, accumulated amortization of deferred financing cost amounted to $2,363 and $15,509, respectively. The $6,602 increase in amortization of deferred financing costs and the $13,146 decrease in accumulated amortization of deferred financing cost as of September 30, 2011 are the result of the Company refinancing its debt in April 20l1. The Company recorded a loss on extinguishment of debt in the amount of $7,129, consisting of write-offs of unamortized debt issuance costs and third party fees of $6,541 and $587, respectively. The loss on extinguishment is recorded as a component of interest expense, net in the consolidated statement of income during the year ended September 30, 2011.
Goodwill and Indefinite-Lived Intangible Assets
Goodwill represents the excess of the purchase price of the acquired businesses over the fair value of the assets acquired and liabilities assumed resulting from the acquisition. In accordance with the
67
Wesco Aircraft Holdings, Inc. & Subsidiaries
Notes to the Consolidated Financial Statements (Continued)
(In thousands, except share and per share data)
Note 2. Summary of Significant Accounting Policies (Continued)
provisions of ASC 350, Intangibles—Goodwill and Other, goodwill and indefinitely lived intangible assets acquired in a purchase business combination are not amortized, but instead tested for impairment at least annually or more frequently should an event occur or circumstances indicate that the carrying amount may be impaired. Such events or circumstances may be a significant change in business climate, economic and industry trends, legal factors, negative operating performance indicators, significant competition, changes in strategy or disposition of a reporting unit or a portion there of. Goodwill impairment testing is performed at the reporting unit level on July 1 of each year.
Goodwill impairment testing is a two-step test. The first step identifies potential impairment by comparing the fair value of a reporting unit with its carrying amount, including goodwill. If the fair value exceeds its carrying amount, goodwill is not considered impaired and the second step of the test is unnecessary. If the carrying amount of a reporting unit's goodwill exceeds its fair value, the second step measures the impairment loss, if any. The second step compares the implied fair value of goodwill with the carrying amount of that goodwill. The implied fair value of goodwill is determined in the same manner as the amount of goodwill recognized in a business combination. If the carrying amount of goodwill exceeds the implied fair value of that goodwill, an impairment loss is recognized in an amount equal to that excess.
Application of the goodwill impairment test requires judgment, including the identification of reporting units, assignment of assets and liabilities to reporting units, assignment of goodwill to reporting units, and determination of the fair value of each reporting unit. The fair value of each reporting unit is estimated using a combination of market earnings multiples and discounted cash flow methodologies. This requires significant judgments including estimation of future cash flows, which is dependent on internal forecasts, estimation of the long-term rate of growth of the Company's business, the useful life over which cash flows will occur and determination of the Company's weighted average cost of capital. Changes in these estimates and assumptions could materially affect the determination of fair value and/or goodwill impairment for each reporting unit.
Intangible assets with indefinite useful lives are not amortized but tested annually on July 1 for impairment or more often if events or circumstances change that would create a triggering event. The Company has one indefinite-lived intangible asset, its trademark. The valuation of the trademark was derived from an income approach by which the relief from royalty method was applied valuing the savings as cash flow. The relief from royalty method requires assumptions to be made concerning forecasted net sales, a discount rate, and a royalty rate. The underlying concept of the relief from a royalty method is that the value of the trademark can be estimated by determining the cost savings the Company achieves by not having to license the trademark. Changes in projections or estimates, a deterioration of operating results and the related cash flow effect or a significant increase in the discount rate or decrease is the royalty rate could decrease the estimated fair value and result in impairments.
During the year ended September 30, 2011 and September 30, 2010, the decrease in goodwill was due to foreign currency translation effect of $77 and $1,225, respectively.
68
Wesco Aircraft Holdings, Inc. & Subsidiaries
Notes to the Consolidated Financial Statements (Continued)
(In thousands, except share and per share data)
Note 2. Summary of Significant Accounting Policies (Continued)
Lease Receivable
During fiscal 2011, the Company changed their tool lease accounting treatment from a capital lease to an operating lease based on an amendment to the terms of the current leases. Prior to fiscal 2011, lease receivable comprises direct-financing lease and maintenance arrangements for tools leased to various customers. These agreements typically have terms of five years and are generally collateralized by a security interest in the underlying assets. The current portion of lease receivables is approximately zero and $1,631 at September 30, 2011 and 2010, respectively, and recorded in prepaid expenses and other current assets. The non-current portion is approximately zero and $1,187 at September 30, 2011 and 2010, respectively, and is recorded in other assets in the consolidated balance sheets.
Fair Value of Financial Instruments
The Company's financial instruments consist of cash and cash equivalents, accounts receivable and payable, accrued and other current liabilities and line of credit. The carrying amounts of these instruments approximate fair value because of their short-term maturities. The fair value of the long-term debt instruments are determined using current applicable rates for similar instruments as of the balance sheet date. The carrying amounts and fair value of the debt instruments as of September 30, 2011 were as follows:
| |
Carrying Value | Fair Value | |||||
|---|---|---|---|---|---|---|---|
$265,000 term loan |
$ | 238,000 | $ | 236,810 | |||
$350,000 term loan |
$ | 318,000 | $ | 306,615 | |||
Comprehensive Income
ASC 220, Comprehensive Income, establishes guidelines for the reporting and display of comprehensive income and its components in financial statements. Comprehensive income generally represents all changes in stockholders' equity, except those resulting from investments by or distributions to stockholders. The Company's comprehensive income includes foreign currency translation adjustments and is included in the consolidated statements of stockholders' equity and comprehensive income.
Revenue Recognition
The Company recognizes hardware and service revenue when (i) persuasive evidence of an arrangement exists, (ii) title transfers to the customer, (iii) the sales price charged is fixed or determinable and (iv) collection is reasonably assured.
In connection with the sales of its products, the Company often provides certain supply chain management programs. These services are provided exclusively in connection with the sales of products, and as such, the price of such services is generally included in the price of the products delivered to the customer. The Company does not account for these services as a separate element, as the services do not have stand-alone value and cannot be separated from the product element of the arrangement. Additionally, the Company does not present service revenues apart from product revenues, as the
69
Wesco Aircraft Holdings, Inc. & Subsidiaries
Notes to the Consolidated Financial Statements (Continued)
(In thousands, except share and per share data)
Note 2. Summary of Significant Accounting Policies (Continued)
service fees represent less than 5% of the Company's consolidated net sales. There are no significant post-delivery obligations associated with these services.
The Company also enters into sales rebates and profit sharing arrangements. Such customer incentives are accounted for as a reduction to gross sales and recorded based upon estimates at the time products are sold. These estimates are based upon historical experience for similar programs and products. The Company reviews such rebates and profit sharing arrangements on an ongoing basis and accruals are adjusted, if necessary, as additional information becomes available.
Management provides allowances for credit losses and returns based on historic experience. The allowances are adjusted as considered necessary. To date, such allowances have been within the range of management's expectations.
In connection with the Company's JIT supply chain management programs, the Company at times assumes customer inventory on a consignment basis. This consigned inventory remains the property of the customer but is managed and distributed by the Company. The Company earns a fixed fee per unit on each shipment of the consigned inventory; such amounts represent less than 1% of consolidated revenues.
The Company leases certain equipment under its tool leasing program. Prior to the lease modifications in fiscal year 2011, such arrangements represent direct-financing leases under which the Company recognized revenue over the lease term using consistent rates of return. Since the revenue earned under these leasing arrangements represented less than 1% of the Company's consolidated revenues, the sales earned from such arrangements are included in net sales within the consolidated statements of income and are not presented separately as financing income. Subsequent to the lease modifications, such leases are accounted for as operating leases under which the Company recognizes revenue over the lease term on a straight-line basis.
Shipping and Handling Costs
The Company records revenue for shipping and handling billed to its customers. Shipping and handling revenues were approximately $1,006, $1,031 and $1,418 for the years ended September 30, 2011, 2010 and 2009, respectively.
Shipping and handling costs are included in cost of sales. Total shipping and handling costs were approximately $4,636, $4,009 and $4,033 for the years ended September 30, 2011, 2010 and 2009, respectively.
Income Taxes
The Company accounts for income taxes in accordance with ASC 740, Income Taxes. ASC 740 requires the recognition of deferred tax liabilities and assets for the expected future tax consequences of temporary differences between the carrying amounts and the tax bases of assets and liabilities. Deferred income tax assets and liabilities are measured using enacted tax rates expected to apply to taxable income in the years in which these temporary differences are expected to be recovered or settled. The effect on deferred tax assets and liabilities of a change in tax rates is recognized in income in the period that includes the enactment date. A valuation allowance is established, when necessary, to
70
Wesco Aircraft Holdings, Inc. & Subsidiaries
Notes to the Consolidated Financial Statements (Continued)
(In thousands, except share and per share data)
Note 2. Summary of Significant Accounting Policies (Continued)
reduce net deferred tax assets to the amount expected to be realized. The Company's foreign subsidiaries are taxed in local jurisdictions at local statutory rates. The Company intends to reinvest all earnings of foreign subsidiaries.
Concentration of Credit Risk and Significant Vendors
The Company maintains its cash and cash equivalents in bank deposit accounts which, at times, may exceed federally insured limits. The Company has not experienced any losses in such accounts and does not believe it is exposed to any significant credit risk from cash and cash equivalents.
The Company purchases its products on credit terms from vendors located throughout North America and Europe. For the years ended September 30, 2011, 2010 and 2009, the Company made approximately 22%, 20% and 19% respectively, of its purchases from Alcoa Fastening Systems and the amounts payable to this vendor were approximately 17% and 18% of amounts payable at September 30, 2011 and 2010, respectively. Additionally, for the years ended September 30, 2011, 2010 and 2009, the Company made approximately 20%, 22% and 13%, respectively, of its purchases from Precision Castparts Corporation and the amounts payable to this vendor were approximately 10% and 17% of accounts payable at September 30, 2011 and 2010, respectively. The majority of the products the Company sells are available through multiple channels and, therefore, reduces the risk related to any vendor relationship.
For the years ending September 30, 2011, 2010 and 2009, the Company derived approximately 16%, 15% and 11%, respectively, of its recorded sales from The Boeing Company and the accounts receivable balance associated with this customer was approximately 9% and 11% at September 30, 2011 and 2010, respectively.
Foreign Currency Translation
The financial statements of the foreign subsidiaries are translated into U.S. Dollars in accordance with ASC 830, Foreign Currency Matters. The financial statements of foreign subsidiaries and affiliates where the local currency is the functional currency are translated into U.S. Dollars using exchange rates in effect at the year-end for assets and liabilities and average exchange rates during the year for results of operations. The adjustment resulting from translating the financial statements of such foreign subsidiaries is reflected as a separate component of stockholders' equity. Foreign currency transaction gains and losses are reported as other income (expense), net in the consolidated statements of income. For the years ended September 30, 2011, 2010 and 2009, foreign currency transaction gains and (losses) were approximately $390, $(651) and $(486), respectively.
Stock-Based Compensation
The Company accounts for stock-based compensation in accordance with ASC 718, Compensation—Stock Compensation. ASC 718 requires all stock-based awards to employees and directors to be recognized as stock-based compensation expense based upon their fair values on the date of grant. In March 2005, the Securities Exchange Commission ("SEC") issued Staff Accounting Bulletin ("SAB") No. 107, Share-Based Payment, which provides guidance regarding the interaction of
71
Wesco Aircraft Holdings, Inc. & Subsidiaries
Notes to the Consolidated Financial Statements (Continued)
(In thousands, except share and per share data)
Note 2. Summary of Significant Accounting Policies (Continued)
ASC 718 and certain SEC rules and regulations. The Company has applied the provision of SAB No. 107 in its adoption of ASC 718.
ASC 718 requires companies to estimate the fair value of stock-based payment awards on the date of grant using an option-pricing model. The value of the portion of the award that is ultimately expected to vest is recognized as an expense during the requisite service periods. The Company has estimated the fair value for each award as of the date of grant using the Black-Scholes option pricing model. The Black-Scholes model considers, among other factors, the expected life of the award and the expected volatility of the Company's stock price. The Company recognizes the stock-based compensation expense using the graded vesting method over the requisite service periods, which is generally a vesting term of 5 years. Stock options typically have a contractual term of 10 years. The stock options granted had an exercise price equal to the estimated fair value of the Company's common stock on the grant date.
Net Income Per Share
Basic net income per share is computed by dividing net income available to common stockholders by the weighted average number of common shares outstanding during the period. At September 30, 2011, 2010 and 2009, 3,736,203, 1,971,963 and 5,355,459 shares, respectively, of restricted stock and stock options issued to employees were unvested and, therefore, excluded from the calculation of basic earnings per share for each of the fiscal years ended on those dates. Diluted net income per share includes the dilutive effect of both outstanding stock options and restricted shares, calculated using the treasury stock method. Assumed proceeds from the in-the-money options include the windfall tax benefits, net of shortfalls, calculated under the "as-if" method as prescribed by ASC 718.
| |
September 30 | |||||||||
|---|---|---|---|---|---|---|---|---|---|---|
| |
2011 | 2010 | 2009 | |||||||
| |
(In thousands, except per share data) |
|||||||||
Net income |
$ | 75,598 | $ | 73,674 | $ | 58,447 | ||||
Basic weighted average shares outstanding |
90,697 | 90,569 | 84,965 | |||||||
Dilutive effect of stock options and restricted stock awards/units |
2,485 | 499 | 4,717 | |||||||
Dilutive weighted average shares outstanding |
93,182 | 91,068 | 89,682 | |||||||
Basic net income per share |
$ | 0.83 | $ | 0.81 | $ | 0.69 | ||||
Diluted net income per share |
$ | 0.81 | $ | 0.81 | $ | 0.65 | ||||
Shares of common stock equivalents of 37,883, 551,925 and 685,692 for fiscal 2011, 2010 and 2009, respectively, were excluded from the diluted calculation due to their anti-dilutive effect.
72
Wesco Aircraft Holdings, Inc. & Subsidiaries
Notes to the Consolidated Financial Statements (Continued)
(In thousands, except share and per share data)
Note 3. Recent Accounting Pronouncements
In October 2009, the FASB issued guidance on revenue arrangements with multiple deliverables effective for the Company's 2012 fiscal year, although early adoption is permitted. The guidance revises the criteria for separating, measuring and allocating arrangement consideration to each deliverable in a multiple element arrangement. The guidance requires companies to allocate revenue using the relative selling price of each deliverable, which must be estimated if the Company does not have a history of selling the deliverable on a stand-alone basis or third-party evidence of selling price. The Company does not believe that the adoption of this guidance will significantly change the timing in which revenue is recorded as the pricing of its service components are included in the per unit price of the products delivered to the customer that is solely contingent on the number of units sold. As a result, the revenue earned on the service element does not become fixed or determinable until delivery of the product has taken place.
In June 2009, the FASB issued guidance to revise the approach to determine when a variable interest entity ("VIE") should be consolidated. The new consolidation model for VIEs considers whether the Company has the power to direct the activities that most significantly impact the VIE's economic performance and shares in the significant risks and rewards of the entity. The guidance on VIEs requires companies to continually reassess VIEs to determine if consolidation is appropriate and provide additional disclosures. The Company adopted the provisions of this guidance during fiscal year 2011, and the adoption did not have a material impact on the Company's financial statements.
In January 2010, the FASB issued guidance that revised two disclosure requirements concerning fair value measurements and clarifies two others. It requires separate presentation of significant transfers into and out of Levels 1 and 2 of the fair value hierarchy and disclosure of the reasons for such transfers. It will also require the presentation of purchases, sales, issuances and settlements within Level 3 on a gross basis rather than a net basis. The guidance also clarifies that disclosures should be disaggregated by class of asset or liability and that disclosures about inputs and valuation techniques should be provided for both recurring and non-recurring fair value measurements. These new disclosure requirements became effective for the Company's financial statements for the period ended September 30, 2011, except for the requirement concerning gross presentation of Level 3 activity, which will become effective for fiscal years beginning after December 15, 2010. Since this guidance is only related to financial statement disclosures, there has been and will be no impact to the Company's financial results as a result of the adoption of this guidance.
In May 2011, the Financial Accounting Standards Board ("FASB") issued Accounting Standards Update ("ASU") 2011-04, Amendments to Achieve Common Fair Value Measurement and Disclosure Requirements in U.S. GAAP and IFRSs (ASU 2011-04), which amends FASB Accounting Standards Codification ("ASC") 820, Fair Value Measurement. These amendments, effective for the interim and annual periods beginning on or after December 15, 2011 (early adoption is prohibited), result in common definition of fair value and common requirements for measurement of and disclosure requirements between U.S. GAAP and IFRS. Consequently, the amendments change some fair value measurement principles and disclosure requirements. The adoption of ASU 2011-04 is not expected to have a material impact on the Company's consolidated financial statements.
In August 2011, the FASB issued ASU 2011-08, Intangibles—Goodwill and Other (Topic 350): Testing Goodwill for Impairment, which amends existing guidance by giving an entity the option to first assess qualitative factors to determine whether it is more likely than not (that is, a likelihood of more
73
Wesco Aircraft Holdings, Inc. & Subsidiaries
Notes to the Consolidated Financial Statements (Continued)
(In thousands, except share and per share data)
Note 3. Recent Accounting Pronouncements (Continued)
than 50 percent) that the fair value of a reporting unit is less than its carrying amount. If this is the case, companies will need to perform a more detailed two-step goodwill impairment test, which is used to identify potential goodwill impairments and to measure the amount of goodwill impairment losses to be recognized, if any. ASU 2011-08 will be effective for annual and interim goodwill impairment tests performed for fiscal years beginning after December 15, 2011 (early adoption is permitted). The adoption of ASU 2011-08 is not expected to have a material impact on the Company's consolidated financial statements.
In June 2011, the FASB issued ASU 2011-05, Presentation of Comprehensive Income, which amends FASB ASC 220, Comprehensive Income. This guidance, effective retrospectively for the interim and annual periods beginning on or after December 15, 2011 (early adoption is permitted), requires presentation of total comprehensive income, the components of net income, and the components of other comprehensive income either in a single continuous statement of comprehensive income or in two separate but consecutive statements. The option to present components of other comprehensive income as part of the statement of stockholders' equity was eliminated. The items that must be reported in other comprehensive income or when an item of other comprehensive income must be reclassified to net income were not changed. Additionally, no changes were made to the calculation and presentation of earnings per share. The adoption of ASU 2011-05 is not expected to have a material impact on the Company's consolidated financial statements.
Note 4. Related Party Transactions
The Company entered into a management agreement with The Carlyle Group to provide certain financial, strategic advisory and consultancy services. Under this management agreement, the Company is obligated to pay The Carlyle Group, or a designee thereof, an annual management fee of $1,000 plus fees and expenses associated with company-related meetings. The Company incurred expense of approximately $1,096, $1,070 and $1,008 and for the years ended September 30, 2011, 2010 and 2009, respectively, related to this management agreement. These amounts were paid to The Carlyle Group during the years ended September 30, 2011, 2010 and 2009.
The Company leases several office and warehouse facilities under operating lease agreements from entities controlled by the Company's CEO. Rent expense on these facilities was approximately $1,719, $1,709 and $1,689 for the years ended September 30, 2011, 2010 and 2009, respectively (see Note 14).
On June 30, 2008, the Company's CEO purchased $50,000 of the total debt outstanding. During January 2011, the Company's CEO sold his holding in the Company's debt. Subsequent to the sale, the Company's CEO has no ownership interest in the Company's debt. For the years ended September 30, 2011, 2010 and 2009, total interest paid to the minority stockholder related to the debt was approximately $281, and $1,222 and $1,635, respectively.
74
Wesco Aircraft Holdings, Inc. & Subsidiaries
Notes to the Consolidated Financial Statements (Continued)
(In thousands, except share and per share data)
Note 5. Property and Equipment, net
Property and equipment, net, consist of the following:
| |
2011 | 2010 | ||||||
|---|---|---|---|---|---|---|---|---|
Leasehold improvements |
$ | 10,177 | $ | 9,775 | ||||
Machinery and equipment |
12,696 | 11,403 | ||||||
Vehicles |
631 | 713 | ||||||
Computer and software |
13,728 | 9,485 | ||||||
Furniture and fixtures |
2,568 | 2,453 | ||||||
Construction in progress |
43 | — | ||||||
|
39,843 | 33,829 | ||||||
Less: accumulated depreciation and amortization |
(18,891 | ) | (13,656 | ) | ||||
Property and equipment, net |
$ | 20,952 | $ | 20,173 | ||||
At September 30, 2011 and 2010, property and equipment included assets of approximately $6,457 and $5,196, respectively, acquired under capital lease arrangements. Accumulated amortization of assets acquired under capital leases was approximately $3,718 and $2,237 as of September 30, 2011 and 2010, respectively.
Depreciation and amortization expense for property and equipment was approximately $5,859, $4,702 and $4,302 during the years ended September 30, 2011, 2010 and 2009, respectively (including amortization expense of approximately $1,756, $1,157 and $2,158 on assets acquired under capital leases for 2011, 2010 and 2009, respectively).
Note 6. Intangible Assets, net
As of September 30, 2011 and 2010, the gross amounts and accumulated amortization of intangible assets is as follows:
| |
2011 | 2010 | ||||||||||||
|---|---|---|---|---|---|---|---|---|---|---|---|---|---|---|
| |
Gross Amount |
Accumulated Amortization |
Gross Amount |
Accumulated Amortization |
||||||||||
Customer relationships (12 to 20 year life) |
$ | 64,471 | $ | (16,252 | ) | $ | 64,560 | $ | (12,832 | ) | ||||
Trademarks (5 years to indefinite life) |
39,332 | (1,500 | ) | 39,332 | (1,500 | ) | ||||||||
Backlog (2 year life) |
1,150 | (1,150 | ) | 1,150 | (1,150 | ) | ||||||||
Non-compete agreements (4 year life) |
1,000 | (812 | ) | 1,000 | (562 | ) | ||||||||
Total intangible assets |
$ | 105,953 | $ | (19,714 | ) | $ | 106,042 | $ | (16,044 | ) | ||||
75
Wesco Aircraft Holdings, Inc. & Subsidiaries
Notes to the Consolidated Financial Statements (Continued)
(In thousands, except share and per share data)
Note 6. Intangible Assets, net (Continued)
Estimated future amortization expense at September 30, 2011 is as follows:
2012 |
$ | 3,637 | ||
2013 |
3,449 | |||
2014 |
3,449 | |||
2015 |
3,449 | |||
2016 |
3,449 | |||
Thereafter |
30,974 | |||
|
$ | 48,407 | ||
In addition to its amortizing intangibles, the Company assigned an indefinite life to the Wesco Aircraft trademark. As of September 30, 2011, the trademark had a carrying value of $37,832. Amortization expense included in the accompanying statements of operations for the years ended September 30, 2011, 2010 and 2009 was $3,699, $4,119 and $5,763, respectively.
Note 7. Accrued Expenses and Other Current Liabilities
Accrued expenses and other current liabilities consist of the following:
| |
2011 | 2010 | ||||||
|---|---|---|---|---|---|---|---|---|
Accrued compensation and related expenses |
$ | 11,305 | $ | 8,392 | ||||
Accrual for commissions |
306 | 184 | ||||||
Accrued professional fees |
681 | 778 | ||||||
Fair value of interest rate swaps |
1,703 | 6,660 | ||||||
Unearned revenue |
— | 633 | ||||||
Accrued customer rebates |
1,532 | 2,146 | ||||||
Accrued taxes (property, sales and use) |
741 | 954 | ||||||
Accrued interest |
72 | 76 | ||||||
IPO costs |
842 | — | ||||||
Accrued profit sharing |
799 | 772 | ||||||
Other accruals |
683 | 293 | ||||||
Accrued expenses and other current liabilities |
$ | 18,664 | $ | 20,888 | ||||
Note 8. Derivative Financial Instruments
The Company entered into an interest rate swap arrangement in order to manage its net exposure to interest rate changes on the Company's long-term debt. Interest rate swap contracts involve the exchange of floating rate interest payment obligations for fixed interest rate payments without the exchange of the underlying principal amounts. The Company accounts for this arrangement pursuant to the provisions of ASC 815, Derivatives and Hedging. ASC 815 establishes accounting and reporting standards requiring that every derivative instrument be recorded in the balance sheet as either an asset or liability measured at fair value and that any changes in fair value be recognized currently in earnings unless specific hedge accounting criteria are met. The Company's interest rate swap arrangement is not
76
Wesco Aircraft Holdings, Inc. & Subsidiaries
Notes to the Consolidated Financial Statements (Continued)
(In thousands, except share and per share data)
Note 8. Derivative Financial Instruments (Continued)
designated as a hedge pursuant to ASC 815 and, accordingly, the Company reflects the change in fair value of the interest rate swap in the consolidated statements of operations as part of interest expense.
These arrangements also contain an element of risk in that the counterparties may be unable to meet the terms of such arrangements. In the event the parties required to deliver commitments are unable to fulfill their obligations, the Company could potentially incur significant additional costs by replacing the positions at then current market rates. The Company manages its risk of exposure by limiting counterparties to those banks and institutions deemed appropriate by management. The Company considers its own risk of non-performance to be limited. Upon the maturity of its previous interest rate swaps, the Company entered into two interest rate swaps arrangements, which expire in February and June 2012. Each interest rate swap converts the interest rate on approximately $100,000 (notional amount) of its outstanding debt from variable rates to a fixed interest rate. The swap agreements have fixed the LIBOR component of the term debt to interest rates of 1.77% and 1.96%.
The following table includes the notional amounts and fair value of derivative financial instruments as of September 30, 2011 and September 30, 2010:
| |
|
September 30, 2011 | September 30, 2010 | ||||||||||||
|---|---|---|---|---|---|---|---|---|---|---|---|---|---|---|---|
| |
Balance Sheet Location |
Notional Amount |
Fair Value |
Notional Amount |
Fair Value |
||||||||||
Swap Contracts |
Accrued Expenses | $ | 200,000 | $ | (1,703 | ) | $ | 400,000 | $ | (6,660 | ) | ||||
Note 9. Fair Value of Financial Instruments
Fair value is the price that would be received to sell an asset or paid to transfer a liability in an orderly transaction between market participants at the measurement date. To determine fair value, the Company primarily utilizes reported market transactions and discounted cash flow analyses. On October 1, 2008, the Company adopted the FASB's new fair value model that establishes a fair value hierarchy that maximizes the use of observable inputs and minimizes the use of unobservable inputs. Observable inputs are inputs that reflect the assumptions market participants would use in pricing the asset or liability developed based on market data obtained from sources independent of the reporting entity. Unobservable inputs are inputs that reflect the reporting entity's own assumptions about the assumptions market participants would use in pricing the asset or liability developed based on the best information available in the circumstances. The fair value hierarchy prioritizes the inputs to valuation techniques into three broad levels whereby the highest priority is given to Level 1 inputs and the lowest to Level 3 inputs. The three broad categories are:
| Level 1: | Quoted prices in active markets for identical assets or liabilities. | |
Level 2: |
Inputs other than quoted prices that are observable for the asset or liability, either directly or indirectly. |
|
Level 3: |
Unobservable inputs for the asset or liability. |
The Company makes use of observable market-based inputs to calculate fair value, in which case the measurements are classified within Level 2. If quoted or observable market prices are not available, fair value is based upon internally developed models that use, where possible, current market-based
77
Wesco Aircraft Holdings, Inc. & Subsidiaries
Notes to the Consolidated Financial Statements (Continued)
(In thousands, except share and per share data)
Note 9. Fair Value of Financial Instruments (Continued)
parameters such as interest rates, yield curves and currency rates. These measurements are classified within Level 3.
Fair value measurements are classified according to the lowest level input or value-driver that is significant to the valuation. A measurement may therefore be classified within Level 3 even though there may be significant inputs that are readily observable.
The guidance on fair value measurements expanded the definition of fair value to include the consideration of nonperformance risk. Nonperformance risk refers to the risk that an obligation (either by a counterparty or us) will not be fulfilled. For financial assets traded in an active market (Level 1), the nonperformance risk is included in the market price. For certain other financial assets and liabilities (Level 2 and 3), the Company's fair value calculations have been adjusted accordingly.
Where available, the Company utilizes quoted market prices or observable inputs rather than unobservable inputs to determine fair value.
The valuation techniques used and key assumptions made to estimate the fair value of financial instruments measured at fair value are:
Derivative Financial Instruments
Exchange-traded derivative financial instruments are valued based on quoted market prices and classified within Level 1 of the valuation hierarchy. Derivative financial instruments that are traded on an index are valued based on direct or indirect prices and classified within Level 2 of the valuation hierarchy. If quoted market prices or other observable inputs are not available, fair value is based on unobservable inputs and classified within Level 3 of the fair value hierarchy.
The following tables set forth assets and liabilities measured at fair value as of September 30, 2011 and 2010, categorized by input level within the fair value hierarchy:
| |
Fair Value Measurements Using | ||||||||||
|---|---|---|---|---|---|---|---|---|---|---|---|
| |
Quoted Prices in Active Markets |
Significant Other Observable Inputs |
Significant Unobservable Inputs |
||||||||
| |
Level 1 | Level 2 | Level 3 | ||||||||
September 30, 2011 |
|||||||||||
Financial instruments measured at fair value on a recurring basis |
|||||||||||
Derivative financial instruments |
— | $ | (1,703 | ) | — | ||||||
| |
Level 1 | Level 2 | Level 3 | ||||||||
|---|---|---|---|---|---|---|---|---|---|---|---|
September 30, 2010 |
|||||||||||
Financial instruments measured at fair value on a recurring basis |
|||||||||||
Derivative financial instruments |
— | $ | (6,660 | ) | — | ||||||
78
Wesco Aircraft Holdings, Inc. & Subsidiaries
Notes to the Consolidated Financial Statements (Continued)
(In thousands, except share and per share data)
Note 9. Fair Value of Financial Instruments (Continued)
The fair value of our derivative financial instruments was estimated using the net present value of a series of cash flows on both the cap and floor components of the interest rate collars. These cash flows were based on yield curves that take into account the contractual terms of the derivatives, including the period to maturity and market-based parameters such as interest rates and volatility. The Company incorporates nonperformance risk by adjusting the present value of each liability position utilizing an estimation of its credit risk.
Note 10. Long-Term Debt
Long-term debt consists of the following at:
| |
September 30, | ||||||||
|---|---|---|---|---|---|---|---|---|---|
| |
2011 | 2010 | |||||||
$550,000 term loan, bearing interest based on Alternate Base Rate ("ABR") (defined as Prime Rate plus the applicable margin rate of 1.25%) or Eurodollar (defined as London Inter-Bank Offer Rate ("LIBOR") rates plus the applicable margin rate of 2.25%), at the option of the Company. The term loan is payable quarterly equal to 0.25% of the principal amount of $550,000 with the final payment due on September 29, 2013 |
$ | — | $ | 477,243 | |||||
$150,000 term loan, bearing interest based on ABR (defined as Prime Rate plus the applicable margin rate of 4.75%) or Eurodollar (defined as London Inter-Bank Offer Rate ("LIBOR") rates plus the applicable margin rate of 5.75%), at the option of the Company |
— |
143,000 |
|||||||
$265,000 term loan, bearing interest based on Alternate Base Rate ("ABR") (defined as Prime Rate plus an applicable margin rate ranging from 1.25%-2.25%) or Eurodollar (defined as London Inter-Bank Offer Rate ("LIBOR") rates plus an applicable margin rate ranging from 2.25%-3.25%), whichever is greater. The applicable margin rates are indexed to the Company's consolidated leverage ratio and adjusted each reporting period based on operating results. The term loan is payable quarterly equal to 1.25% the first year, escalating to 3.75% by the fifth year of the principal amount of $265,000 with the final payment due on April 7, 2016. Interest rate was 3.24% at September 30, 2011 |
238,000 |
— |
|||||||
$350,000 term loan, bearing interest based on the ABR (defined as Prime Rate plus an applicable margin rate ranging from 1.75%-2.00%) or Eurodollar (defined as London Inter-Bank Offer Rate ("LIBOR") rates plus an applicable margin rate ranging from 2.75%-3.25%), whichever is greater, provided however that at no time shall the base rate be less than 1.25%. The applicable margin rates are indexed to the Company's consolidated leverage ratio and adjusted each reporting period based on operating results. The term loan is payable quarterly equal to 0.25% of the principal amount of $350,000. The entire balance is due April 7, 2017. Interest rate was 4.25% at September 30, 2011 |
318,000 |
— |
|||||||
|
556,000 | 620,243 | |||||||
Less: current portion |
— | — | |||||||
Long-term debt |
$ | 556,000 | $ | 620,243 | |||||
79
Wesco Aircraft Holdings, Inc. & Subsidiaries
Notes to the Consolidated Financial Statements (Continued)
(In thousands, except share and per share data)
Note 10. Long-Term Debt (Continued)
Aggregate maturities of long-term debt of September 30, 2011 are as follows:
Years Ended September 30, |
||||
2012 |
$ | — | ||
2013 |
4,469 | |||
2014 |
21,531 | |||
2015 |
29,813 | |||
Thereafter |
500,187 | |||
|
$ | 556,000 | ||
During year ended September 30, 2011, the Company made prepayments totaling approximately $59,000, exclusive of contractually scheduled payments, on its $265,000 and $350,000 term loans. In accordance with the loan agreement, $59,000 was applied to the Company's regular quarterly payments through 2016 with the excess applied to the Company's balloon payment. As of September 30, 2011, the Company had prepaid all required quarterly payments through April 7, 2017 on the $350,000 term loan and prepaid all required quarterly payments through June 30, 2013 on the $265,000 term loan.
As part of the loan agreement, the Company had a $150,000 revolving line of credit that expires on April 7, 2016. The applicable margin for the revolving facility is 2.00% for ABR and 3.00% for Eurocurrency loans during the six-month period after closing. Thereafter, the applicable margin is based on the ratio of the Company's EBITDA, as defined in the loan agreement, for the most recently ended four fiscal quarters and ranges between 1.25% and 2.25% for the ABR Loans and range between 2.25% and 3.25% for the Eurodollar Loans. There was no outstanding borrowing under this line of credit as of September 30, 2011 or at any point during fiscal year 2011. Annual commitment fees for this line of credit approximate $750.
The Company's subsidiary, Wesco Aircraft Europe Limited, has available a £10,000 ($15,625 based on the September 30, 2011 exchange rate) line of credit that automatically renews annually on October 1. The line of credit bears interest based on the base rate plus an applicable margin of 1.15%. The net outstanding borrowing under this line of credit was £0 as of September 30, 2011 and 2010, respectively.
Under the terms and definitions of the First Lien Credit Agreement, the Company is required to maintain a net debt-to-EBITDA ratio not to exceed 4.00, an EBITDA-to-net interest expense ratio greater than 2.25. The credit agreement also restricts the Company from incurring certain additional indebtedness, payment of dividends and sale of substantial assets, and limits certain investments. The Company was in compliance with these covenants at September 30, 2011.
Borrowings under these credit facilities are collateralized by substantially all of the assets of the Company.
80
Wesco Aircraft Holdings, Inc. & Subsidiaries
Notes to the Consolidated Financial Statements (Continued)
(In thousands, except share and per share data)
Note 11. Income Taxes
Income before provision for income taxes for the years ended September 30, 2011, 2010 and 2009 included the following:
| |
2011 | 2010 | 2009 | ||||||||
|---|---|---|---|---|---|---|---|---|---|---|---|
U.S. Income |
$ | 118,475 | $ | 108,846 | $ | 81,446 | |||||
Foreign Income |
9,649 | 8,741 | 14,863 | ||||||||
Total |
$ | 128,124 | $ | 117,587 | $ | 96,309 | |||||
The components of the Company's income tax provision for the years ended September 30, 2011, 2010 and 2009 are as follows:
| |
2011 | 2010 | 2009 | |||||||||
|---|---|---|---|---|---|---|---|---|---|---|---|---|
Current provision |
||||||||||||
Federal |
$ | 31,840 | $ | 28,692 | $ | 12,228 | ||||||
State and local |
5,897 |
4,724 |
4,808 |
|||||||||
Foreign |
3,613 | 3,755 | 6,789 | |||||||||
Subtotal |
41,350 | 37,171 | 23,825 | |||||||||
Deferred provision (benefit) |
||||||||||||
Federal |
9,157 | 5,415 | 12,313 | |||||||||
State and local |
1,991 | 1,336 | 1,776 | |||||||||
Foreign |
28 | (9 | ) | (52 | ) | |||||||
Subtotal |
11,176 | 6,742 | 14,037 | |||||||||
Provision for income taxes |
$ | 52,526 | $ | 43,913 | $ | 37,862 | ||||||
The tax benefits associated with the exercise of employee stock options were recognized in the current year tax return which were in excess of previously recorded value at the time of grant ("windfall"). During fiscal year 2011, $1,547 of tax benefit ("windfall") has been credited to additional paid in capital.
Deferred income taxes reflect the tax effects of temporary differences between the carrying amounts of assets and liabilities for financial reporting purposes and the amounts used for income tax purposes.
81
Wesco Aircraft Holdings, Inc. & Subsidiaries
Notes to the Consolidated Financial Statements (Continued)
(In thousands, except share and per share data)
Note 11. Income Taxes (Continued)
The Company's deferred income tax assets consist of the following at September 30, 2011 and 2010:
| |
2011 | 2010 | ||||||
|---|---|---|---|---|---|---|---|---|
Current deferred tax assets/(liabilities) |
||||||||
Inventories |
$ | 24,331 | $ | 17,701 | ||||
Reserves and other accruals |
3,205 | 4,654 | ||||||
Compensation accruals |
11,753 | 10,783 | ||||||
Total current deferred tax assets/(liabilities) |
39,289 | 33,138 | ||||||
Non-current deferred tax assets/(liabilities) |
||||||||
Property and equipment |
(3,875 | ) | (3,442 | ) | ||||
Goodwill and intangible assets |
(42,910 | ) | (26,230 | ) | ||||
Stock options |
5,523 | 5,219 | ||||||
Deferred financing costs and other |
6 | 526 | ||||||
Total non-current deferred tax assets/(liabilities) |
(41,256 | ) | (23,927 | ) | ||||
Net deferred tax assets/(liabilities) |
$ | (1,967 | ) | $ | 9,211 | |||
The Company believes its deferred tax assets are more likely than not to be realized based on historical and projected taxable income levels.
The Company files income tax returns in the U.S. federal jurisdiction, various state jurisdictions, and various non-U.S. jurisdictions. The earliest tax year still subject to examination by a significant taxing jurisdiction is September 30, 2006.
The undistributed earnings of the Company's foreign subsidiaries, which amount to $36,225, are considered to be indefinitely reinvested. Accordingly, no provision for federal or state and local taxes or foreign withholding taxes has been provided on such undistributed earnings.
The Company adopted the provision of Accounting for Uncertainty in Income Taxes during the year ended September 30, 2008. We recognize interest and penalties accrued related to unrecognized tax benefits in income tax expense. As a result of adoption, the Company did not identify any material positions that would not meet the more likely than not recognition threshold. As of September 30, 2011 and September 30, 2010, there are no uncertain tax positions.
82
Wesco Aircraft Holdings, Inc. & Subsidiaries
Notes to the Consolidated Financial Statements (Continued)
(In thousands, except share and per share data)
Note 11. Income Taxes (Continued)
A reconciliation of the Company's provision for income taxes from applying the domestic federal statutory tax rate of 35% to actual income tax expense is as follows for the years ended September 30, 2011, 2010 and 2009:
| |
2011 | 2010 | 2009 | ||||||||||||||||
|---|---|---|---|---|---|---|---|---|---|---|---|---|---|---|---|---|---|---|---|
Provision for income taxes using the domestic federal statutory rate |
$ | 44,843 | 35.00 | % | $ | 41,155 | 35.00 | % | $ | 33,543 | 35.00 | % | |||||||
State taxes, net of tax benefit |
5,141 | 4.01 | 3,989 | 3.39 | 4,279 | 4.47 | |||||||||||||
Nondeductible items |
2,948 | 2.30 | 1,309 | 1.11 | 1,365 | 1.42 | |||||||||||||
Other |
1,302 | 1.02 | (704 | ) | (0.60 | ) | 26 | 0.03 | |||||||||||
Foreign income not taxed at the Federal rate |
2 | — | 572 | 0.45 | 1,405 | 1.47 | |||||||||||||
Foreign tax credit |
(1,710 | ) | (1.33 | ) | (2,408 | ) | (2.05 | ) | (2,756 | ) | (2.88 | ) | |||||||
Actual provision for income taxes |
$ | 52,526 | 41.00 | % | $ | 43,913 | 37.30 | % | $ | 37,862 | 39.51 | % | |||||||
Note 12. Stockholders' Equity
On August 2, 2011, the Company consummated its initial public offering. In connection with the IPO, the Company amended and restated its certificate of incorporation, pursuant to which (1) the pre-existing shares of class B common stock were converted to Class A common stock on a one-for-one basis and (2) each share of common stock was then split into nine shares of common stock by way of a stock split. Pursuant to the amended and restated certificate of incorporation, the Company's authorized capital stock consists of (1) 950,000,000 shares of common stock, par value $0.001 per share, and (2) 50,000,000 shares of preferred stock, par value $0.001 per share. The accompanying financial statements and notes to the financial statements give retroactive effect to the stock split for all periods presented.
Prior to the amended and restated certificate of incorporation the Company's capital structure consisted of two classes of common stock, Class A and Class B. These classes of stock differ primarily with respect to the voting and conversion rights. Only common stock—Class A shares have voting rights. Class B convertible redeemable common stock automatically converted to Class A common stock on a one-for-one basis immediately prior to a merger or consolidation of the Company in which the holders of the Class A common stock cease to hold more than 50% of the voting securities of the Company outstanding immediately prior to such transaction or upon the sale of substantially all the assets of the Company.
Note 13. Stock-Based and Other Compensation Arrangements
The Company's Amended and Restated Equity Incentive Plan (the "Prior Plan"), which was originally adopted in 2006 and the Company's 2011 Equity Incentive Award Plan (the "2011 Plan"), which was adopted in connection with our initial public offering, provide or provided for the issuance of stock options, restricted stock awards, stock option rights and restricted stock units to certain employees and directors of the Company. These awards are subject to call rights by the Company upon the occurrence of certain events, including employee separation. Awards that are called by the Company are valued at fair market value, as determined by the Company's Board of Directors.
83
Wesco Aircraft Holdings, Inc. & Subsidiaries
Notes to the Consolidated Financial Statements (Continued)
(In thousands, except share and per share data)
Note 13. Stock-Based and Other Compensation Arrangements (Continued)
Following the adoption of the Company's 2011 Plan, no new awards will be granted under the Prior Plan. There are 5,850,000 shares authorized for issuance under this Plan. As of September 30, 2011, there were 5,289,615 shares remaining available for issuance under the 2011 Plan.
Stock Options
The Company's stock options typically vest over a period of 3 to 5 years on the basis of continuous employment and financial performance of the Company, as further defined below. Of the total options granted, typically 25% to 50% are time-based options and 50% to 75% of the options represent performance-based options. Vested shares are exercisable at any time until the earlier of a change in control or approximately 10 years from the date of the option grant. Certain vesting restrictions may apply in the year of change of control. The stock options granted had an exercise price equal to the estimated fair value of the Company's common stock on the grant date.
Continuous Employment Conditions
At September 30, 2011, the Company has outstanding 270,644 unvested time-based stock options under the Plans, which will vest on the basis of continuous employment with the Company. Most of the time-based options vest ratably during the period of service. In case of a liquidity event, all the time-vesting options shall become fully vested and exercisable prior to the effective date of the first liquidity event. A liquidity event includes a sale, transfer or disposition of the equity securities of the Company held by all of the principal stockholders such that following such a transaction the total number of equity shares held by all of the principal stockholders is less than 30% of the total number of shares held at the effective date of acquisition of the Company, or a sale, transfer or other disposition of substantially all of the assets of the Company.
Performance Conditions
At September 30, 2011, the Company had outstanding 367,389 unvested performance-based stock options (the "performance options") under the Plans to employees and directors. Most performance options vest in ratably over the vesting period and become exercisable on the last day of each fiscal year, or within 120 days after, if the following conditions are met: (i) if Bonus EBITDA for the applicable year equals or exceeds the financial results target for the applicable year, then 10% of the performance options shall become vested and exercisable; and (ii) if Bonus Cash Flow for the applicable year equals or exceeds the Bonus Cash Flow target for the applicable year, then the remaining 10% of the performance options shall become vested and exercisable.
If the Bonus EBITDA for the applicable year is less than the target set for the year but at least 90% of the Bonus EBITDA target through the end of such applicable year, then that portion of the performance options shall become exercisable on the last day of the fiscal year following the missed target year (the "Bonus EBITDA cumulative catch up year") or within 120 days thereafter if: (i) Bonus EBITDA equals or exceeds the Bonus EBITDA target for the cumulative catch up year and (ii) the cumulative Bonus EBITDA equals or exceeds the cumulative Bonus EBITDA target for the cumulative catch up year.
84
Wesco Aircraft Holdings, Inc. & Subsidiaries
Notes to the Consolidated Financial Statements (Continued)
(In thousands, except share and per share data)
Note 13. Stock-Based and Other Compensation Arrangements (Continued)
If the Bonus Cash Flow for the applicable year is less than the Bonus Cash Flow target for the year but at least 90% of the Bonus Cash Flow target through the end of such applicable year, then that portion of the performance options shall become exercisable on the last day of the fiscal year following the Bonus Cash Flow missed year (the "Bonus Cash Flow cumulative catch up year") or within 120 days thereafter if: (i) Bonus Cash Flow equals or exceeds the Bonus Cash Flow target for the Bonus Cash Flow cumulative catch up year and (ii) the cumulative Bonus Cash Flow equals or exceeds the cumulative Cash Flow target for the Bonus Cash Flow cumulative catch up year.
In case of a liquidity event, the following shall automatically become vested and exercisable in full prior to the effective date of such liquidity event: performance options that have not yet, as of such liquidity event, become eligible for yearly performance-based vesting, if and only if the cumulative Bonus EBITDA and the cumulative Bonus Cash Flow for the fiscal year in which liquidity event occurs equals or exceeds the cumulative Bonus EBITDA target and cumulative Bonus Cash Flow target for the fiscal year in which such liquidity event occurs.
The Board of Directors of the Company has the sole discretion to accelerate the vesting of any portion of the time or performance-based options, which otherwise does not vest pursuant to the Plan provisions.
During the year ended September 30, 2009, the Company did not meet one of the performance condition targets necessary to entitle a portion of the performance options to vest for fiscal year 2009. These unvested stock options were subject to cumulative catch up provisions that would enable such stock options to vest if the Company's cash flows during fiscal years 2010 and 2011 met defined thresholds (the "catch-up cash flows targets"). The Company determined that it is probable that these catch-up cash flows targets would be achieved and did not reduce the compensation expense recorded in the current year even though the vesting requirement was not met. During fiscal year 2010 the Company was deemed to have met the 2010 catch-up cash flows target, which allowed one half of such awards to vest. During fiscal year 2011, the Company did not meet the 2011 catch-up cash flows target that would have entitled the remaining one-half of such awards to vest. However, the compensation committee determined that due to the near achievement of such 2011 catch-up cash flows target, it was appropriate to cause such awards to vest in order to recognize and reward the extraordinary efforts of the Company's employees during fiscal year 2011. The Company determined that this change constituted a stock option modification and recorded an addition compensation expense of $1,343.
During the year ended September 30, 2010, the Company did not meet the 2010 EBITDA target that was established for performance option vesting; however, the compensation committee determined that the failure to achieve the EBITDA target did not result from a lack of performance but rather from a change in overall market conditions that were beyond the control of the Company. Accordingly, the compensation committee allowed the EBITDA portion of the 2010 performance options to vest, effective as of September 30, 2010. The Company determined that this change constituted a stock option modification; however, since the awards were probable of vesting prior to the modification and did not affect any other terms of the awards other than accelerating vesting, no additional compensation expense was incurred.
85
Wesco Aircraft Holdings, Inc. & Subsidiaries
Notes to the Consolidated Financial Statements (Continued)
(In thousands, except share and per share data)
Note 13. Stock-Based and Other Compensation Arrangements (Continued)
The following table sets forth the summary of options activity under the plan for:
| |
Outstanding Options | ||||||||||||
|---|---|---|---|---|---|---|---|---|---|---|---|---|---|
| |
Number of Shares |
Weighted Average Exercise Price |
Weighted Average Remaining Contractual Life (in years) |
Aggregate Intrinsic Value(1) |
|||||||||
September 30, 2009 |
7,679,466 | $ | 4.42 | 7.3 | $ | 3,665,100 | |||||||
Granted |
68,013 | $ | 6.29 | ||||||||||
Forfeited options |
(184,176 | ) | $ | 4.88 | |||||||||
September 30, 2010 |
7,563,303 | $ | 4.38 | 6.3 | $ | 13,229,671 | |||||||
Granted |
711,225 | $ | 12.21 | ||||||||||
Exercised |
(570,920 | ) | $ | 4.55 | |||||||||
Forfeited options |
(44,293 | ) | $ | 5.24 | |||||||||
September 30, 2011 |
7,659,315 | $ | 5.09 | 5.7 | $ | 46,528,736 | |||||||
Exercisable at the end of year |
7,021,282 | $ | 4.46 | 5.3 | $ | 45,411,377 | |||||||
- (1)
- Aggregate intrinsic value is calculated on the difference between our closing stock price at year end and the exercise price, multiplied by the number of in-the-money options and represents the pre-tax amount that would have been received by the option holders, had they all exercised all their options on the fiscal year end date.
The total intrinsic value of options exercised during fiscal year 2011 was $5,780. For the years ended September 30, 2011, 2010 and 2009, the Company recorded $3,411 and $2,310, $2,404, respectively, of stock-based compensation expense related to these options that is included within selling, general and administrative expenses. At September 30, 2011, the unrecognized stock-based compensation related to these options was approximately $2,453 and is expected to be recognized through September 30, 2014.
Restricted Stock Units and Restricted Stock
Concurrent with Carlyle's acquisition of Wesco, 5,604,338 Restricted Stock Units ("RSUs") with a total fair value of $23,115 were granted to certain employees. RSUs represent the right to receive one share of the Company's common stock and all of the RSUs became fully vested as of September 30, 2009. During the years ended September 30, 2011, 2010 and 2009, the Company recorded $0, $0 and $7,705, respectively, of stock-based compensation expense related to the vested portion of these RSUs. As of September 30, 2011, the shares of common stock underlying the RSUs have not been issued to the employees; such shares will be issued on the earlier of September 28, 2012 or the occurrence of a change in control. Accordingly, the underlying 5,604,338 shares of common stock have not been included in the Consolidated Statements of Stockholders' Equity and Comprehensive Income or Consolidated Balance Sheets as issued and outstanding. Such shares have been included in the basic weighted average shares outstanding as of September 30, 2009 based on their vesting.
86
Wesco Aircraft Holdings, Inc. & Subsidiaries
Notes to the Consolidated Financial Statements (Continued)
(In thousands, except share and per share data)
Note 13. Stock-Based and Other Compensation Arrangements (Continued)
In connection with the Company's initial public offering, the Company granted 123,660 shares of restricted common stock to employees. These shares are eligible to vest in three equal annual installments, subject to continued employment on each vesting date. In addition, the vesting of one half of these stock options is subject to the Company achieving a performance target for fiscal year 2012 that was established by the compensation committee in early fiscal year 2012. During the years ended September 30, 2011, 2010 and 2009, the Company granted 25,704, 31,788 and 38,808, respectively, of restricted common shares to its directors. The September 30, 2010 grants of 31,788 shares were authorized by the Compensation Committee for granting during 2010 but were not issued until 2011. Accordingly the compensation expense attributable to such awards was recorded in 2010 but the underlying shares of common stock have not been included in the Consolidated Statements of Stockholders' Equity and Comprehensive Income or Consolidated Balance Sheets as issued and outstanding until fiscal year 2011. For the years ended September 30, 2011, 2010 and 2009, the Company recorded $408, $200, and $280, respectively, of stock-based compensation expense related to restricted stock that is included within selling, general and administrative expenses. The RSUs do not contain any redemption provisions that are not within the Company's control. Accordingly, these equity awards have been classified within stockholders' equity. At September 30, 2011, the unrecognized stock-based compensation related to restricted stock awards was approximately $2,079 and is expected to be recognized through September 30, 2014.
Restricted share activity during fiscal 2011 was as follows:
| |
Shares(1) | Weighted Average Fair Value |
|||||
|---|---|---|---|---|---|---|---|
Outstanding at start of year |
6,226,777 | $ | 4.15 | ||||
Granted(2) |
181,152 | $ | 12.71 | ||||
Vested |
(57,492 | ) | $ | 7.78 | |||
Forfeited |
— | $ | — | ||||
Outstanding at end of year |
6,350,437 | $ | 4.36 | ||||
- (1)
- Includes
5,604,338 shares of vested RSUs for which the underlying common stock have not been issued to the employees; such shares will be issued on the
earlier of September 28, 2012 or the occurrence of a change in control.
- (2)
- Under the terms of their respective RSA award agreements, RSA shareholders have the same voting rights as common stock shareholders, such rights exist even if the RSA have not vested. Accordingly, 181,152 shares of common stock underlying the RSA's granted during the year ended September 30, 2011 have been included in the Consolidated Statements of Stockholders' Equity and Comprehensive Income and Consolidated Balance Sheets as issued and outstanding.
Fair value of our restricted shares is based on our closing stock price on the date of grant. The fair value of shares that were granted during fiscal years 2011, 2010 and 2009 was $2,055, $247 and $280, respectively. The weighted average fair value at the grant date for restricted shares issued during fiscal 2011, 2010 and 2009 was $13.76, $7.78 and $7.22, respectively.
87
Wesco Aircraft Holdings, Inc. & Subsidiaries
Notes to the Consolidated Financial Statements (Continued)
(In thousands, except share and per share data)
Note 13. Stock-Based and Other Compensation Arrangements (Continued)
Stock-Based Compensation
The Company accounts for stock-based compensation in accordance with ASC 718. The Company currently uses the Black-Scholes option pricing model to determine the fair value of the stock options. The determination of the fair value of stock-based payment awards on the date of grant using an option-pricing model is affected by the Company's stock price as well as assumptions regarding complex and subjective variables. These variables include the expected stock price volatility over the term of the awards, actual and projected employee stock option exercise behaviors, risk-free interest rate and expected dividends.
The Company estimated expected volatility based on historical data of comparable public companies. The expected term, which represents the period of time that options granted are expected to be outstanding, is estimated based on guidelines provided in SAB No. 110 and represents the average of the vesting tranches and contractual terms. The risk-free rate assumed in valuing the options is based on the U.S. Treasury rate in effect at the time of grant for the expected term of the option. The Company does not anticipate paying any cash dividends in the foreseeable future and, therefore, used an expected dividend yield of zero in the option pricing model. Compensation expense is recognized only for those options expected to vest with forfeitures estimated based on the Company's historical experience and future expectations. Stock-based compensation awards are amortized on a graded vesting method over the requisite service periods of the awards, which are generally the vesting periods.
The weighted average assumptions used to value the option grants are as follows:
| |
2011 | 2010 | 2009 | |||||||
|---|---|---|---|---|---|---|---|---|---|---|
Expected life (in years) |
6.70 | 6.46 | 5.83 | |||||||
Volatility |
45.57 | % | 50.17 | % | 52.65 | % | ||||
Risk free interest rate |
2.26 | % | 3.17 | % | 2.04 | % | ||||
Dividend yield |
— | — | — | |||||||
The weighted average fair value per option at the grant date for options issued during fiscal 2011, 2010 and 2009 was $4.43, $1.49 and $1.77, respectively.
Note 14. Commitments and Contingencies
Operating Leases
The Company leases office and warehouse facilities (certain of which are from related parties), and warehouse equipment under various non-cancelable operating leases that expire at various dates through December 31, 2020. Certain leases contain escalation clauses based on the Consumer Price Index. The Company is also committed under the terms of certain of these operating lease agreements to pay property taxes, insurance, utilities and maintenance costs.
88
Wesco Aircraft Holdings, Inc. & Subsidiaries
Notes to the Consolidated Financial Statements (Continued)
(In thousands, except share and per share data)
Note 14. Commitments and Contingencies (Continued)
Future minimum rental payments as of September 30, 2011 are as follows:
| |
Third Party |
Related Party |
Total | |||||||
|---|---|---|---|---|---|---|---|---|---|---|
Years Ended September 30, |
||||||||||
2012 |
$ | 1,994 | $ | 1,711 | $ | 3,705 | ||||
2013 |
1,457 | 1,711 | 3,168 | |||||||
2014 |
870 | 1,711 | 2,581 | |||||||
2015 |
529 | 1,711 | 2,240 | |||||||
2016 |
140 | 1,711 | 1,851 | |||||||
Thereafter |
— | 5,453 | 5,453 | |||||||
|
$ | 4,990 | $ | 14,008 | $ | 18,998 | ||||
Total rent expense for the years ended September 30, 2011, 2010 and 2009 was $3,963, $3,863 and $3,891, respectively.
Capital Lease Commitments
The Company leases certain equipment under capital lease agreements that require minimum monthly payments that expire at various dates through August 2015.
Future minimum lease payments as of September 30, 2011 are as follows:
2012 |
$ | 2,086 | |||
2013 |
548 | ||||
2014 |
126 | ||||
2015 |
21 | ||||
2016 |
— | ||||
|
2,781 | ||||
Less: interest |
(116 | ) | |||
Total |
$ | 2,665 | |||
Purchase Orders
As of September 30, 2011, the Company has open inventory purchase orders in the amount of $217,882.
Litigation
The Company is involved in various legal matters that arise in the normal course of its business. Management, after consulting with outside legal counsel, believes that the ultimate outcome of such matters will not have a material adverse effect on the Company's financial position, results of operations or cash flows. There can be no assurance, however, that such actions will not be material or adversely affect the Company's business, financial position, and results of operations or cash flows.
89
Wesco Aircraft Holdings, Inc. & Subsidiaries
Notes to the Consolidated Financial Statements (Continued)
(In thousands, except share and per share data)
Note 15. Employee Benefit Plan
The Company maintains a 401(k) defined contribution plan and a retirement saving plan for the benefit of its eligible employees. All full-time employees who have completed at least six months of service and are at least 21 years of age are eligible to participate in the plans. Eligible employees may elect to contribute up to 60% of their eligible compensation. Contributions by the Company were $763, $725 and $687 during the years ending September 30, 2011, 2010 and 2009, respectively.
Note 16. Supplemental Cash Flow Information
| |
2011 | 2010 | 2009 | |||||||
|---|---|---|---|---|---|---|---|---|---|---|
Cash payments for: |
||||||||||
Interest paid |
$ | 20,278 | $ | 23,350 | $ | 28,371 | ||||
Income taxes paid |
$ | 49,567 | $ | 38,335 | $ | 22,028 | ||||
Schedule of non-cash investing and financing activities: |
||||||||||
Property and equipment acquired pursuant to capital leases |
$ | 1,536 | $ | 1,270 | $ | 3,624 | ||||
Property and equipment disposed of pursuant to termination of capital leases |
$ | (275 | ) | $ | — | $ | (1,266 | ) | ||
Note 17. Quarterly Financial Data (unaudited)
Summarized unaudited quarterly financial data for quarters ended December 31, 2009 through September 30, 2011 is as follows:
Quarter Ended:
|
September 30, 2011 | June 30, 2011 | March 31, 2011 | December 31, 2010 | |||||||||
|---|---|---|---|---|---|---|---|---|---|---|---|---|---|
Net sales |
$ | 181,330 | $ | 180,013 | $ | 176,015 | $ | 173,528 | |||||
Gross profit |
72,650 | 68,620 | 67,427 | 66,699 | |||||||||
Income from operations |
38,563 | 38,803 | 42,934 | 41,311 | |||||||||
Net income |
18,029 | 13,961 | 21,938 | 21,670 | |||||||||
Basic net income per share(1) |
$ | 0.20 | $ | 0.15 | $ | 0.24 | $ | 0.24 | |||||
Diluted net income per share(1) |
$ | 0.19 | $ | 0.15 | $ | 0.24 | $ | 0.23 | |||||
Quarter Ended:
|
September 30, 2010 | June 30, 2010 | March 31, 2010 | December 31, 2009 | |||||||||
|---|---|---|---|---|---|---|---|---|---|---|---|---|---|
Net sales |
$ | 174,009 | $ | 171,116 | $ | 164,105 | $ | 146,806 | |||||
Gross profit |
68,150 | 68,240 | 63,197 | 54,643 | |||||||||
Income from operations |
42,529 | 43,272 | 38,629 | 29,885 | |||||||||
Net income |
20,032 | 21,457 | 18,114 | 14,071 | |||||||||
Basic net income per share(1) |
$ | 0.22 | $ | 0.24 | $ | 0.20 | $ | 0.16 | |||||
Diluted net income per share(1) |
$ | 0.22 | $ | 0.24 | $ | 0.20 | $ | 0.16 | |||||
- (1)
- Net income per share calculations for each quarter are based on the weighted average diluted shares outstanding for that quarter and may not total to the full year amount.
90
Wesco Aircraft Holdings, Inc. & Subsidiaries
Notes to the Consolidated Financial Statements (Continued)
(In thousands, except share and per share data)
Note 18. Segment Reporting
The Company is organized based on geographical location. The Company's reportable segments are comprised of North America and the Rest of World.
The Company evaluates segment performance based on segment operating earnings or loss. Each segment reports its results of operations and makes requests for capital expenditures and acquisition funding to the Company's chief operating decision-maker ("CODM"). The Company's Chief Executive Officer ("CEO") serves as CODM. Each operating segment has separate management teams and infrastructures dedicated to providing a full range of products and services to their customers.
The following table presents net sales and other financial information by business segment:
| |
Fiscal Year Ended September 30, 2011 | ||||||||||||
|---|---|---|---|---|---|---|---|---|---|---|---|---|---|
| |
North America |
Rest of World |
Intercompany Elimination |
Consolidated | |||||||||
Net sales |
$ | 645,034 | $ | 119,384 | $ | (53,532 | ) | $ | 710,886 | ||||
Gross profit |
242,533 | 39,096 | (6,233 | ) | 275,396 | ||||||||
Income from operations |
151,000 | 9,920 | 690 | 161,610 | |||||||||
Interest expense, net |
(33,748 | ) | (743 | ) | — | (34,491 | ) | ||||||
Provision for income taxes |
49,712 | 2,814 | — | 52,526 | |||||||||
Total assets |
1,237,964 | 113,631 | (50,210 | ) | 1,301,385 | ||||||||
Goodwill |
498,200 | 6,564 | — | 504,764 | |||||||||
Capital expenditures |
4,745 | 374 | — | 5,119 | |||||||||
Depreciation and amortization |
8,575 | 983 | — | 9,558 | |||||||||
| |
Fiscal Year Ended September 30, 2010 | ||||||||||||
|---|---|---|---|---|---|---|---|---|---|---|---|---|---|
| |
North America |
Rest of World |
Intercompany Elimination |
Consolidated | |||||||||
Net sales |
$ | 603,809 | $ | 95,342 | $ | (43,115 | ) | $ | 656,036 | ||||
Gross profit |
226,497 | 34,167 | (6,434 | ) | 254,230 | ||||||||
Income from operations |
144,823 | 10,002 | (510 | ) | 154,315 | ||||||||
Interest expense, net |
(35,505 | ) | (765 | ) | — | (36,270 | ) | ||||||
Provision for income taxes |
41,314 | 2,599 | — | 43,913 | |||||||||
Total assets |
1,225,195 | 97,624 | (43,807 | ) | 1,279,012 | ||||||||
Goodwill |
498,199 | 6,642 | — | 504,841 | |||||||||
Capital expenditures |
2,867 | 210 | — | 3,077 | |||||||||
Depreciation and amortization |
7,861 | 960 | — | 8,821 | |||||||||
91
Wesco Aircraft Holdings, Inc. & Subsidiaries
Notes to the Consolidated Financial Statements (Continued)
(In thousands, except share and per share data)
Note 18. Segment Reporting (Continued)
| |
Fiscal Year Ended September 30, 2009 | ||||||||||||
|---|---|---|---|---|---|---|---|---|---|---|---|---|---|
| |
North America |
Rest of World |
Intercompany Elimination |
Consolidated | |||||||||
Net sales |
$ | 557,874 | $ | 102,796 | $ | (47,983 | ) | $ | 612,687 | ||||
Gross profit |
204,296 | 39,733 | (5,742 | ) | 238,287 | ||||||||
Income from operations |
118,289 | 15,762 | 341 | 134,392 | |||||||||
Interest expense, net |
(37,328 | ) | (379 | ) | — | (37,707 | ) | ||||||
Provision for income taxes |
33,179 | 4,683 | — | 37,862 | |||||||||
Total assets |
1,178,558 | 92,645 | (16,391 | ) | 1,254,812 | ||||||||
Goodwill |
498,199 | 7,867 | — | 506,066 | |||||||||
Capital expenditures |
3,701 | 434 | — | 4,135 | |||||||||
Depreciation and amortization |
8,948 | 1,117 | — | 10,065 | |||||||||
Geographic Information
The Company operated principally in three geographic areas, North America, Europe and emerging markets, such as Asia, Pacific Rim and the Middle East.
Net sales by geographic area, for the fiscal years ended September 30, 2011, 2010 and 2009 were as follows:
| |
Fiscal Year Ended September 30, | ||||||||||||||||||
|---|---|---|---|---|---|---|---|---|---|---|---|---|---|---|---|---|---|---|---|
| |
2011 | 2010 | 2009 | ||||||||||||||||
| |
Sales | % of Sales |
Sales | % of Sales |
Sales | % of Sales |
|||||||||||||
North America |
$ | 600,752 | 84.5 | % | $ | 569,099 | 86.7 | % | $ | 519,840 | 84.8 | % | |||||||
Europe |
109,363 | 15.4 | 86,376 | 13.2 | 92,211 | 15.1 | |||||||||||||
Asia, Pacific Rim, Middle East and other |
771 | 0.1 | 561 | 0.1 | 636 | 0.1 | |||||||||||||
|
$ | 710,886 | 100.0 | % | $ | 656,036 | 100.0 | % | $ | 612,687 | 100.0 | % | |||||||
The Company determines the geographic area based on where the sale was originated from. Export sales from North America to customers in foreign countries amounted to $101, $84 and $103 and for the years ended September 30, 2011, 2010 and 2009, respectively.
Long-lived assets by geographic area, for the fiscal years ended September 30, 2011, 2010 and 2009 were as follows:
| |
Fiscal Year Ended September 30, | |||||||||
|---|---|---|---|---|---|---|---|---|---|---|
| |
2011 | 2010 | 2009 | |||||||
North America |
$ | 19,354 | $ | 18,338 | $ | 18,315 | ||||
Europe |
1,598 | 1,835 | 2,246 | |||||||
Asia, Pacific Rim, Middle East and other |
— | — | — | |||||||
|
$ | 20,952 | $ | 20,173 | $ | 20,561 | ||||
92
ITEM 9. CHANGES IN AND DISAGREEMENTS WITH ACCOUNTANTS ON ACCOUNTING AND FINANCIAL DISCLOSURE
None.
ITEM 9A. CONTROLS AND PROCEDURES
Evaluation of Disclosure Controls and Procedures
Our management, with the participation of our chief executive officer and chief financial officer, evaluated the effectiveness of our disclosure controls and procedures (as defined in Rules 13a-15(e) or 15d-15(e) under the Exchange Act as of the end of the period covered by this report. Based on that evaluation, our chief executive officer and chief financial officer concluded that our disclosure controls and procedures as of the end of the period covered by this report were effective to provide reasonable assurance that information we are required to disclose in reports that we file or submit under the Exchange Act is recorded, processed, summarized and reported within the time periods specified in the Securities and Exchange Commission rules and forms, and that such information is accumulated and communicated to our management, including our chief executive officer and chief financial officer, as appropriate, to allow timely decisions regarding required disclosure.
Management's Annual Report on Internal Control over Financial Reporting and Attestation Report of the Registered Public Accounting Firm
This Annual report does not include a report of management's assessment regarding internal control over financial reporting or an attestation report of our registered public accounting firm due to a transition period established by the rules of the SEC for newly public companies.
Changes in Internal Control over Financial Reporting
There were no changes in our internal control over financial reporting (as defined in Rules 13a-15(f) or 15d-15(f) under the Exchange Act) during the fourth quarter of the fiscal year ended September 30, 2011, that have materially affected, or are reasonably likely to materially affect, our internal control over financial reporting.
None.
93
In accordance with General Instruction G.(3) of Form 10-K certain information required by this Part III will either be incorporated into this Annual Report on Form 10-K by reference to our definitive proxy statement for our 2012 annual meeting of stockholders (our "2012 Proxy Statement") filed within 120 days after September 30, 2011 or will be included in an amendment to this Annual Report on Form 10-K filed within 120 days after September 30, 2011. To the extent such information is included in our 2012 Proxy Statement within 120 days after September 30, 2011, it is expected to be incorporated by reference to the sections of our 2012 Proxy Statement specified below.
ITEM 10. DIRECTORS, EXECUTIVE OFFICERS AND CORPORATE GOVERNANCE
The information appearing in our 2012 Proxy Statement under the following headings is incorporated herein by reference:
- •
- "Proposal 1—Election of Directors,"
- •
- "Executive Officers,"
- •
- "Section 16(a) Beneficial Ownership Reporting Compliance" and
- •
- "General Information Concerning the Board of Directors, Its Committees and the Company's Corporate Governance."
ITEM 11. EXECUTIVE COMPENSATION
The information appearing in our 2012 Proxy Statement under the following headings is incorporated herein by reference:
- •
- "Compensation Discussion and Analysis,"
- •
- "General Information Concerning the Board of Directors, Its Committees and the Company's Corporate Governance" and
- •
- "Compensation Committee Report."
ITEM 12. SECURITY OWNERSHIP OF CERTAIN BENEFICIAL OWNERS AND MANAGEMENT AND RELATED STOCKHOLDER MATTERS
The information appearing in our 2012 Proxy Statement under the following heading is incorporated herein by reference:
- •
- "Security Ownership of Certain Beneficial Owners and Management."
The information under Part II, Item 5. "Market for Registrant's Common Equity, Related Stockholder Matters and Issuer Purchases of Equity Securities—Equity Compensation Plan Information" in this Annual Report on Form 10-K is also incorporated herein by reference.
ITEM 13. CERTAIN RELATIONSHIPS AND RELATED TRANSACTIONS, AND DIRECTOR INDEPENDENCE
The information appearing in our 2012 Proxy Statement under the following headings is incorporated herein by reference:
- •
- "Certain Relationships and Related Party Transactions" and
- •
- "General Information Concerning the Board of Directors, Its Committees and the Company's Corporate Governance."
ITEM 14. PRINCIPAL ACCOUNTING FEES AND SERVICES
The information appearing in our 2012 Proxy Statement under the following heading is incorporated herein by reference:
- •
- "Proposal 4—Ratification of Appointment of Independent Auditors."
94
ITEM 15. EXHIBITS, FINANCIAL STATEMENT SCHEDULES
- (a)
- The
following documents are filed as part of this Annual Report on Form 10-K:
- (1)
- Financial Statements. The financial statements listed in the "Index to Consolidated Financial
Statements" under Part II, Item 8. "Financial Statements and Supplementary Data," which index is incorporated herein by reference.
- (2)
- Financial Statement Schedules. Financial statement schedules have been omitted because either
they are not applicable, not required or the information is included in the financial statements or the notes thereto.
- (3)
- Exhibits. The attached list of exhibits in the "Exhibit Index" immediately preceding the exhibits to this Annual Report on Form 10-K, which index is incorporated herein by reference.
95
Pursuant to the requirements of Section 13 or 15(d) of the Securities Exchange Act of 1934, the registrant has duly caused this report to be signed on its behalf by the undersigned, thereunto duly authorized.
| WESCO AIRCRAFT HOLDINGS, INC. | ||||
Dated: December 5, 2011 |
By: |
/s/ RANDY J. SNYDER Randy J. Snyder Chairman of the Board of Directors, President and Chief Executive Officer |
||
Pursuant to the requirements of the Securities Exchange Act of 1934, this report has been signed below by the following persons on behalf of the registrant and in the capacities and on the dates indicated.
SIGNATURE
|
TITLE
|
DATE
|
||
|---|---|---|---|---|
| /s/ RANDY J. SNYDER Randy J. Snyder |
Chairman of the Board of Directors, President and Chief Executive Officer |
December 5, 2011 | ||
/s/ GREGORY A. HANN Gregory A. Hann |
Executive Vice President and Chief Financial Officer |
December 5, 2011 |
||
/s/ J. SHAWN TROGDON J. Shawn Trogdon |
Global Controller |
December 5, 2011 |
||
/s/ DAYNE A. BAIRD Dayne A. Baird |
Director |
December 5, 2011 |
||
/s/ PETER J. CLARE Peter J. Clare |
Director |
December 5, 2011 |
||
/s/ PAUL E. FULCHINO Paul E. Fulchino |
Director |
December 5, 2011 |
||
/s/ JAY L. HABERLAND Jay L. Haberland |
Director |
December 5, 2011 |
96
SIGNATURE
|
TITLE
|
DATE
|
||
|---|---|---|---|---|
| /s/ JOHN JUMPER John Jumper |
Director | December 5, 2011 | ||
/s/ ADAM J. PALMER Adam J. Palmer |
Director |
December 5, 2011 |
||
/s/ ROBERT D. PAULSON Robert D. Paulson |
Director |
December 5, 2011 |
||
/s/ DAVID L. SQUIER David L. Squier |
Director |
December 5, 2011 |
97
| EXHIBIT NO. |
DESCRIPTION OF EXHIBIT | ||
|---|---|---|---|
| 3.1 | Amended and Restated Certificate of Incorporation of Wesco Aircraft Holdings, Inc. (Incorporated by reference to Exhibit 3.1 to the Quarterly Report on Form 10-Q, dated August 17, 2011 (File No. 001-35253)). | ||
3.2 |
Amended and Restated Bylaws of Wesco Aircraft Holdings, Inc. (Incorporated by reference to Exhibit 3.2 to the Quarterly Report on Form 10-Q, dated August 17, 2011, (File No. 001-35253)). |
||
10.1 |
Credit Agreement, by and among Wesco Aircraft Holdings, Inc. (formerly Wesco Holdings, Inc.), Wesco Aircraft Hardware Corp., Barclays Bank PLC, Merrill Lynch, Pierce, Fenner & Smith Incorporated, Barclays Capital, J.P. Morgan Securities LLC, Morgan Stanley Senior Funding, Inc., Sumitomo Mitsui Banking Corporation, Royal Bank of Canada, Bank of America, N.A. and the lenders party thereto, dated as of April 7, 2011 (Incorporated by reference to Exhibit 10.1 to the Registration Statement on Form S-1, dated June 6, 2011 (File No. 333-173381)). |
||
10.2 |
Guarantee and Collateral Agreement, by and among Wesco Aircraft Holdings, Inc. (formerly Wesco Holdings, Inc.), Wesco Aircraft Hardware Corp., Barclays Bank PLC and the subsidiary guarantors party thereto, dated as of April 7, 2011 (Incorporated by reference to Exhibit 10.2 to the Registration Statement on Form S-1, dated May 13, 2011 (File No. 333-173381)). |
||
10.3 |
Amended and Restated Equity Incentive Plan of Wesco Aircraft Holdings, Inc. (formerly Wesco Holdings, Inc.) (Incorporated by reference to Exhibit 10.3 to the Registration Statement on Form S-1, dated April 8, 2011 (File No. 333-173381)). |
||
10.4 |
Management Annual Incentive Plan of Wesco Aircraft Holdings, Inc. (formerly Wesco Holdings, Inc.) (Incorporated by reference to Exhibit 10.4 to the Registration Statement on Form S-1, dated April 8, 2011 (File No. 333-173381)). |
||
10.5 |
Employment Agreement between Wesco Aircraft Hardware Corp. and Randy Snyder, dated as of July 23, 2006 (Incorporated by reference to Exhibit 10.5 to the Registration Statement on Form S-1, dated April 8, 2011 (File No. 333-173381)). |
||
10.6 |
Amendment to the Employment Agreement between Wesco Aircraft Hardware Corp. and Randy Snyder, dated as of December 31, 2008 (Incorporated by reference to Exhibit 10.6 to the Registration Statement on Form S-1, dated April 8, 2011 (File No. 333-173381)). |
||
10.7 |
Employment Agreement between Wesco Aircraft Holdings, Inc. (formerly Wesco Holdings, Inc.) and Gregory Hann, dated as of January 22, 2009 (Incorporated by reference to Exhibit 10.7 to the Registration Statement on Form S-1, dated April 8, 2011 (File No. 333-173381)). |
||
10.8 |
Employment Agreement between Wesco Aircraft Hardware Corp. and Hal Weinstein, dated as of June 15, 2007 (Incorporated by reference to Exhibit 10.8 to the Registration Statement on Form S-1, dated April 8, 2011 (File No. 333-173381)). |
||
10.9 |
Amendment to the Employment Agreement between Wesco Aircraft Hardware Corp. and Hal Weinstein, dated as of December 31, 2008 (Incorporated by reference to Exhibit 10.9 to the Registration Statement on Form S-1, dated April 8, 2011 (File No. 333-173381)). |
||
98
| EXHIBIT NO. |
DESCRIPTION OF EXHIBIT | ||
|---|---|---|---|
| 10.10 | Form of Incentive Stock Option Agreement under Amended and Restated Equity Incentive Plan of Wesco Aircraft Holdings, Inc. (formerly Wesco Holdings, Inc.) (Incorporated by reference to Exhibit 10.10 to the Registration Statement on Form S-1, dated May 13, 2011 (File No. 333-173381)). | ||
10.11 |
Form of Non-qualified Stock Option Agreement for Independent Directors under Amended and Restated Equity Incentive Plan of Wesco Aircraft Holdings, Inc. (formerly Wesco Holdings, Inc.) (Incorporated by reference to Exhibit 10.11 to the Registration Statement on Form S-1, dated May 13, 2011 (File No. 333-173381)). |
||
10.12 |
Form of Amended and Restated Restricted Stock Unit Agreement under Amended and Restated Equity Incentive Plan of Wesco Aircraft Holdings, Inc. (formerly Wesco Holdings, Inc.) (Incorporated by reference to Exhibit 10.12 to the Registration Statement on Form S-1, dated May 13, 2011 (File No. 333-173381)). |
||
10.13 |
Form of Restricted Stock Agreement for Independent Directors under Amended and Restated Equity Incentive Plan of Wesco Aircraft Holdings, Inc. (formerly Wesco Holdings, Inc.) (Incorporated by reference to Exhibit 10.13 to the Registration Statement on Form S-1, dated May 13, 2011 (File No. 333-173381)). |
||
10.14 |
Amended and Restated Management Agreement between Wesco Aircraft Holdings, Inc. and Carlyle Investment Management, L.L.C. (Incorporated by reference to Exhibit 10.14 to the Quarterly Report on Form 10-Q, dated August 17, 2011 (File No. 001-35253)). |
||
10.15 |
Lease Agreement between Wesco Aircraft France, SAS and WAFR, LLC, dated as of August 1, 2005 (Incorporated by reference to Exhibit 10.15 to the Registration Statement on Form S-1, dated May 13, 2011 (File No. 333-173381)). |
||
10.16 |
Lease Agreement between Wesco Aircraft Hardware Corp. and Avenue Scott, LLC, dated as of October 1, 2004 (Incorporated by reference to Exhibit 10.16 to the Registration Statement on Form S-1, dated May 13, 2011 (File No. 333-173381)). |
||
10.17 |
Lease Agreement between Wesco Aircraft Hardware Corp. and WATX Properties, LLC, dated as of January 1, 2004 (Incorporated by reference to Exhibit 10.17 to the Registration Statement on Form S-1, dated May 13, 2011 (File No. 333-173381)). |
||
10.18 |
Lease Agreement between Wesco Aircraft Europe Ltd. and Snyder Family Living Trust, dated as of January 1, 2006 (Incorporated by reference to Exhibit 10.18 to the Registration Statement on Form S-1, dated May 13, 2011 (File No. 333-173381)). |
||
10.19 |
Engagement Agreement by and between Wesco Aircraft Holdings, Inc. (formerly Wesco Holdings, Inc.) and Solebury Capital LLC, dated as of January 20, 2011 (Incorporated by reference to Exhibit 10.19 to the Registration Statement on Form S-1, dated May 13, 2011 (File No. 333-173381)). |
||
10.20 |
Amended and Restated Stockholders Agreement (Incorporated by reference to Exhibit 10.20 to the Quarterly Report on Form 10-Q, dated August 17, 2011 (File No. 001-35253)). |
||
10.21 |
Service Agreement between Wesco Aircraft Europe, Ltd and Alexander Murray, dated as of March 24, 2011 (Incorporated by reference to Exhibit 10.21 to the Registration Statement on Form S-1, dated May 13, 2011 (File No. 333-173381)). |
||
10.22 |
Wesco Aircraft Holdings, Inc. Incentive Plan (Incorporated by reference to Exhibit 10.22 to the Registration Statement on Form S-1, dated June 27, 2011 (File No. 333-173381)). |
||
99
| EXHIBIT NO. |
DESCRIPTION OF EXHIBIT | ||
|---|---|---|---|
| 10.23 | Wesco Aircraft Holdings, Inc. 2011 Equity Incentive Award Plan (Incorporated by reference to Exhibit 10.23 to the Registration Statement on Form S-1, dated June 27, 2011 (File No. 333-173381)). | ||
10.24 |
Form of 2011 Equity Incentive Award Plan Restricted Stock Agreement (Incorporated by reference to Exhibit 10.24 to the Registration Statement on Form S-1, dated June 27, 2011 (File No. 333-173381)). |
||
10.25 |
Form of 2011 Equity Incentive Award Plan Restricted Stock Unit Agreement (Incorporated by reference to Exhibit 10.25 to the Registration Statement on Form S-1, dated June 27, 2011 (File No. 333-173381)). |
||
10.26 |
Form of 2011 Equity Incentive Award Plan Stock Option Agreement (Incorporated by reference to Exhibit 10.26 to the Registration Statement on Form S-1, dated June 27, 2011 (File No. 333-173381)). |
||
10.27 |
Form of Wesco Aircraft Holdings, Inc. Indemnification Agreement (Incorporated by reference to Exhibit 10.27 to the Registration Statement on Form S-1, dated June 6, 2011 (File No. 333-173381)). |
||
21.1 |
List of Subsidiaries (filed herewith). |
||
23.1 |
Consent of Independent Registered Public Accounting Firm (filed herewith). |
||
31.1 |
Rule 13a-14(a)/15d-14(a) Certification of the Chief Executive Officer (filed herewith). |
||
31.2 |
Rule 13a-14(a)/15d-14(a) Certification of the Chief Financial Officer (filed herewith). |
||
32.1 |
Certification of Periodic Report by Chief Executive Officer and Chief Financial Officer pursuant to U.S.C. Section 1350, as adopted pursuant to Section 906 of the Sarbanes-Oxley Act of 2002 (filed herewith). |
||
101.INS |
XBRL Instance Document* |
||
101.SCH |
XBRL Taxonomy Extension Schema Document* |
||
101.CAL |
XBRL Taxonomy Extension Calculation Linkbase Document* |
||
101.DEF |
XBRL Taxonomy Extension Definition Linkbase Document* |
||
101.LAB |
XBRL Taxonomy Extension Label Linkbase Document* |
||
101.PRE |
XBRL Taxonomy Extension Presentation Linkbase Document* |
||
- *
- Pursuant to Rule 406T of Regulation S-T, this interactive data file is deemed not filed or part of a registration statement or prospectus for purposes of Sections 11 or 12 of the Securities Act of 1933, is deemed not filed for purposes of section 18 of the Securities Exchange Act of 1934, and otherwise is not subject to liability under these sections.
100