Attached files
| file | filename |
|---|---|
| EX-23.1 - EX-23.1 - MACOM Technology Solutions Holdings, Inc. | d92356dex231.htm |
| EX-31.2 - EX-31.2 - MACOM Technology Solutions Holdings, Inc. | d92356dex312.htm |
| EX-31.1 - EX-31.1 - MACOM Technology Solutions Holdings, Inc. | d92356dex311.htm |
| EX-21.1 - EX-21.1 - MACOM Technology Solutions Holdings, Inc. | d92356dex211.htm |
| EX-10.11 - EX-10.11 - MACOM Technology Solutions Holdings, Inc. | d92356dex1011.htm |
| XML - IDEA: XBRL DOCUMENT - MACOM Technology Solutions Holdings, Inc. | R9999.htm |
| EX-32.1 - EX-32.1 - MACOM Technology Solutions Holdings, Inc. | d92356dex321.htm |
Table of Contents
UNITED STATES
SECURITIES AND EXCHANGE COMMISSION
Washington, D.C. 20549
FORM 10-K
| x | ANNUAL REPORT PURSUANT TO SECTION 13 OR 15(d) OF THE SECURITIES EXCHANGE ACT OF 1934 |
For the fiscal year ended October 2, 2015
OR
| ¨ | TRANSITION REPORT PURSUANT TO SECTION 13 OR 15(d) OF THE SECURITIES EXCHANGE ACT OF 1934 |
For the transition period from to
Commission file number: 001-35451
M/A-COM Technology Solutions Holdings, Inc.
(Exact name of registrant as specified in its charter)
| Delaware | 27-0306875 | |
| (State or other jurisdiction of incorporation or organization) |
(I.R.S. Employer Identification No.) |
| 100 Chelmsford Street, Lowell, Massachusetts | 01851 | |
| (Address of principal executive offices) | (Zip Code) |
Registrant’s telephone number, including area code: (978) 656-2500
Securities registered pursuant to Section 12(b) of the Act:
| Title of Each Class |
Name of Each Exchange on Which Registered | |
| Common Stock, par value $0.001 per share | NASDAQ Global Select Market |
Securities registered pursuant to Section 12(g) of the Act:
None
Indicate by check mark if the registrant is a well-known seasoned issuer, as defined in Rule 405 of the Securities
Act. x Yes ¨ No
Indicate by check mark if the registrant is not required to file reports pursuant to Section 13 or 15(d) of the
Act. x Yes ¨ No
Indicate by check mark whether the registrant (1) has filed all reports required to be filed by Section 13 or 15(d) of the Securities Exchange Act of 1934 during the preceding 12 months (or for such shorter period that the registrant was required to file such reports), and (2) has been subject to such filing requirements for the past 90 days. x Yes ¨ No
Indicate by check mark whether the registrant has submitted electronically and posted on its corporate website, if any, every Interactive Data File required to be submitted and posted pursuant to Rule 405 of Regulation S-T (§ 232.405 of this chapter) during the preceding 12 months (or for such shorter period that the registrant was required to submit and post such files). x Yes ¨ No
Indicate by check mark if disclosure of delinquent filers pursuant to Item 405 of Regulation S-K (§ 229.405 of this chapter) is not contained herein, and will not be contained, to the best of registrant’s knowledge, in definitive proxy or information statements incorporated by reference in Part III of this Form 10-K or any amendment to this Form 10-K. ¨
Indicate by check mark whether the registrant is a large accelerated filer, an accelerated filer, a non-accelerated filer, or a smaller reporting company. See the definitions of “large accelerated filer”, “accelerated filer” and “smaller reporting company” in Rule 12b-2 of the Exchange Act.
| Large accelerated filer x | Accelerated filer ¨ | Non-accelerated filer ¨ | Smaller reporting company ¨ | |||
| (Do not check if a smaller reporting company) |
||||||
Indicate by check mark whether the registrant is a shell company (as defined in Rule 12b-2 of the Exchange
Act). ¨ Yes x No
The aggregate market value of the registrant’s common stock held by non-affiliates of the registrant as of April 3, 2015, the last business day of the registrant’s second fiscal quarter, was approximately $869.7 million based on the closing price of the registrant’s common stock as of such date as reported on the NASDAQ Global Select Market. For purposes of the foregoing calculations only, shares of common stock held by each executive officer and director of the registrant and their respective affiliates have been excluded, as such persons may be deemed to be affiliates. This determination of affiliate status is not necessarily a conclusive determination for other purposes.
The number of outstanding shares of the registrant’s common stock, par value $0.001 per share, as of November 20, 2015 was 53,073,246.
DOCUMENTS INCORPORATED BY REFERENCE
Part III incorporates certain information by reference from the registrant’s definitive proxy statement for the 2016 Annual Meeting of Stockholders, which will be filed no later than 120 days after the close of the registrant’s fiscal year ended October 2, 2015.
Table of Contents
M/A-COM TECHNOLOGY SOLUTIONS HOLDINGS, INC.
ANNUAL REPORT ON FORM 10-K
FOR THE FISCAL YEAR ENDED OCTOBER 2, 2015
2
Table of Contents
CAUTIONARY STATEMENT
This Annual Report on Form 10-K (Annual Report) contains forward-looking statements, including statements regarding our business outlook, strategy, plans, expectations, estimates and objectives for future operations, and our future results of operations and financial position. Forward-looking statements include all statements that are not historical facts and generally may be identified by terms such as “anticipates,” “believes,” “could,” “continue,” “estimates,” “expects,” “intends,” “may,” “plans,” “potential,” “predicts,” “projects,” “seeks,” “should,” “targets,” “will,” “would,” or similar expressions or variations or the negatives of those terms, but are not the exclusive means of identifying forward-looking statements in this Annual Report.
Although forward-looking statements in this Annual Report reflect the good faith judgment of our management based on what we know at the time they are made, such statements involve inherent risks and uncertainties and actual results and outcomes may differ materially and adversely from the results and outcomes expressed or implied by our forward-looking statements. A number of important factors could cause actual results to differ materially and adversely from those in the forward-looking statements. We urge you to consider the risks and uncertainties in “Item 1A - Risk Factors” and elsewhere in this Annual Report and the other documents filed by us with the Securities and Exchange Commission (SEC). Except as required by law, we have no plans, and undertake no obligation, to revise or update our forward-looking statements to reflect any event or circumstance that may arise after the date of this Annual Report. We caution readers not to place undue reliance upon any such forward-looking statements, which speak only as of the date made.
In this document, the words “Company,” “we,” “our,” “us,” and similar terms refer only to M/A-COM Technology Solutions Holdings, Inc. and its consolidated subsidiaries, and not any other person or entity.
“M/A-COM” and “MACOM” are trademarks of M/A-COM Technology Solutions Holdings, Inc. All other brands and names listed are trademarks of their respective owners.
3
Table of Contents
Overview
We are a leading provider of high-performance analog semiconductor solutions that enable next-generation internet applications, the cloud connected apps economy, and the modern, networked battlefield across the radio frequency (RF), microwave, millimeterwave and photonic spectrum. We design and manufacture differentiated, high-value products for customers who demand high performance, quality, and reliability. We offer a broad portfolio of over 3,500 standard and custom devices, which include integrated circuits (IC), multi-chip modules, power pallets and transistors, diodes, amplifiers, switches and switch limiters, passive and active components and complete subsystems, across approximately 40 product lines serving over 6,000 end customers in three primary markets. Our semiconductor products are electronic components that our customers incorporate into their larger electronic systems, such as, point-to-point wireless backhaul radios, high density networks, active antenna arrays, radar, magnetic resonance imaging systems (MRI) and unmanned aerial vehicles (UAVs). Our primary markets are: Networks, which includes carrier and enterprise infrastructure, wired broadband and cellular backhaul, cellular infrastructure, photonic solutions and fiber optic applications; Aerospace and Defense (A&D), which includes military and commercial radar, RF jammers, electronic countermeasures, and communication data links; and Multi-market, which includes industrial, medical, test and measurement and scientific applications.
We have built upon a 60-year heritage of delivering innovative solutions dating back to the founding of Microwave Associates, Inc. We utilize our system-level knowledge and our extensive capabilities in high-frequency modeling, IC design, integration, packaging and manufacturing of semiconductors to address our customers’ needs. Our specialized engineers and technologists located across twelve global design centers collaborate with our customers during the early stage of their system development process to incorporate our standard products and identify custom products we can develop to enhance their overall system performance. We intend to continue to expand our revenue opportunities through our market-facing strategy of aligning our solutions with our customers’ needs and collaborating with them during the product definition stage of their systems toward design-in of our products. We believe this approach will allow us to sell more complete semiconductor solutions that integrate more functions and incorporate more highly-valued content into our products. We believe the combination of our market-facing strategy, targeted development projects, our engineering expertise and our fabrication capabilities enables us to identify profitable growth opportunities and rapidly develop and deliver new products and solutions.
Many of our products have long life cycles ranging from five to ten years, and some of our products have been shipping for over 20 years. We continue to develop or acquire new products to extend our market share, strengthen customer relationships and capture design wins, where a customer allows us to be a supplier of a particular component used in its system.
We believe our “fab-lite” manufacturing model provides us with a competitive advantage and an attractive financial model through a largely variable cost structure. We operate semiconductor fabrication facilities at our Lowell, Massachusetts headquarters and in Ithaca, New York. We manufacture compound semiconductors including Gallium Arsenide (GaAs) and Indium Phosphide (InP), and we are currently in the process of adding Gallium Nitride (GaN) fabrication capacity as well. In the A&D market, a domestic fabrication facility may be a requirement to be a strategic supplier, and we believe our status as a “Trusted Foundry” offers us further competitive differentiation.
We also utilize external semiconductor foundries to supply us with additional capacity and lower costs, and to provide us access to additional process technologies. The ability to utilize a broad array of internal proprietary process technologies and commercially available foundry technologies allows us to select the most appropriate technology to solve our customers’ needs. We believe our fab-lite strategy provides us with dependable domestic supply, control over quality, reduced capital investment requirements, faster time to market, and additional
4
Table of Contents
outsourced capacity when needed. In addition, the experience base cultivated through the continued operation of our internal fabrication lines provides us with the expertise to better manage our external foundry suppliers.
We serve our broad and diverse customer base through a multi-channel sales strategy utilizing our direct sales force, a global network of independent sales representatives, distributors, and an e-commerce channel. Our direct sales force and application engineers are focused on securing design wins by supporting industry-leading original equipment manufacturer (OEM) customers. Our external sales representatives, distributors, and our e-commerce channel are focused on increasing our design wins with smaller or emerging customers early in their new product development efforts.
Our Markets & Products
The growth of advanced electronic systems using analog RF, microwave, millimeterwave and photonic semiconductor technologies has created demand for high-performance analog semiconductor components, modules and solutions. The terms RF, microwave and millimeterwave are used to refer to electromagnetic waves in a particular frequency range produced by applying an alternating current to an antenna or conductor. A wide variety of advanced electronic systems rely on electromagnetic waves for high-speed data transmission or reception. We offer high-performance analog semiconductor products for both wireless and wireline applications across the frequency spectrum from RF to millimeterwave and beyond through photonics. We develop high-value products to serve our customers in three primary markets: Networks, A&D, and Multi-market which represented 65.1%, 19.8%, and 15.1%, respectively, of our revenue in fiscal year 2015.
The market demand for high-performance analog RF, microwave, millimeterwave, and photonic semiconductors is driven by the growth of mobile Internet devices, cloud computing and streaming video that strain existing network capacity, as well as the growth in advanced information-centric military applications. In addition, the increasing need for real-time information, sensing and imaging functions in industrial, medical, scientific, and test and measurement applications is driving demand for our products.
Networks. Growth in the Networks market is driven by the proliferation of wireless and wired devices from smartphones and tablets to data centers, as well as the data rich applications and services they enable such as mobile Internet, cloud computing, video-on-demand, social media, global positioning functionality, and location based services. Growth in global next-generation Internet and Internet of Things (IoT) drives demand for communications infrastructure equipment requiring amplifiers, filters, receivers, switches, synthesizers, transformers, upconverters, and other components to expand and upgrade cellular backhaul, cellular infrastructure, wired broadband, and fiber optic networks. Semiconductor products and solutions must continually deliver greater bandwidth and functionality as the demands of our customers and end users increase.
In December 2014 we completed the acquisition of BinOptics Corporation (BinOptics), a leading merchant provider of InP lasers for data centers, mobile backhaul, silicon photonics and access networks. With this acquisition, we have broadened our position in the growing optical component market, which we believe will continue to be an important growth driver in future periods and support our growth opportunities in data center networks, including silicon photonics applications. This transaction expands our optical portfolio with differentiated edge-emitting and surface-emitting Fabry Perot and Distributed Feedback lasers, incorporating proprietary and patented Etched Facet Technology (EFT) for lasers that enables wafer-scale economics in both device manufacturing and testing.
Our expertise in system-level architectures and advanced IC design capability allow us to offer Networks OEMs highly-integrated solutions optimized for performance and cost. We are a leader in high-frequency semiconductors used in point-to-point radios for cellular backhaul, where we provide a highly-integrated chipset solution featuring innovative IC and low cost package design capabilities. Similarly, our portfolio of opto-electronics products for clock and data recovery, optical post amplifiers, laser and modulator drivers, transimpedance amplifiers, transmitter and receiver applications in 2.5/6/10/40/100/400 gigabits per second (Gbps) long haul, metro, data center links and fiber-to-the-X (FTTx) fiber optic networks enable
5
Table of Contents
telecommunications carriers and data centers to cost-efficiently increase their network capacity by a factor of four to ten times over earlier generation solutions. For optical communications applications, we utilize a proprietary combination of GaAs, InP, and Silicon Germanium (SiGe) technologies to obtain advantages in performance and size. For wired broadband applications, we offer OEMs the opportunity to streamline their supply chain through our broad catalog of active components such as active splitters, amplifiers, multi-function ICs and switches, as well as passive components such as transformers, diplexers, filters, power dividers, and combiners.
Aerospace & Defense. In the A&D market, military applications require more advanced electronic systems, such as radar warning receivers, communications data links and tactical radios, UAVs, RF jammers, electronic countermeasures, and smart munitions. Military applications are becoming more sophisticated, favoring higher performance semiconductor ICs based on GaAs and GaN technologies due to their high power density, improved power efficiency, and broadband capability. Radar systems for mapping and targeting missions are undergoing a major transition from existing mechanically-scanned radar products to a next-generation of active electronically-scanned array (AESA) based products. Consisting of hundreds or thousands of transmit/receive modules commonly based on GaAs and GaN technologies, AESAs deliver greater speed, range, resolution, and reliability over mechanically-scanned radar products that utilize a single transmitter and receiver with mechanical steering. Military communications employing wireless infrastructure and tactical radios in the field remain critical for allowing geographically dispersed operators to exchange information quickly and efficiently. UAVs and their underlying semiconductor content require innovative designs to meet rigorous specifications for high performance, small size, and low power consumption.
We believe our in-depth knowledge of critical radar system requirements, integration expertise, and track record of reliability make us a valued resource for our A&D customers faced with demanding application parameters. Further, we have been accredited by the United States Department of Defense with “Trusted Foundry” status, a designation conferred on microelectronics vendors exhibiting the highest levels of process integrity and protection, which we believe differentiates us as a trusted manufacturer of ICs for U.S. military and aerospace applications. For radar applications, we offer standard and custom power transistor pallets, discrete components, switch limiters, phase shifters, and integrated modules for transmit and receive functions in air traffic control, marine, weather, and military radar applications. For military communications data link and tactical radio applications, we offer a family of active, passive and discrete products, such as integrated IC modules, control components, voltage-controlled oscillators (VCOs), transformers, power transistors and pallets, and diodes. In some cases, we design parts specifically for these applications, while in others, our reputation for quality and our broad catalog allows these demanding customers to reduce the cost of their high-performance systems by designing in standard dual-use or commercial off-the-shelf parts that we have developed for other applications. We believe manufacturing many of these products in our Lowell, Massachusetts “Trusted Foundry” fabrication offers us a competitive advantage in the A&D market because of certain A&D customers’ requirements for a domestic supply chain.
Multi-market. Multi-market encompasses industrial, medical, test and measurement, and scientific applications, where analog RF, microwave, and millimeterwave semiconductor solutions are gaining prevalence. In addition, evolving medical technology has increased the need for high-performance semiconductor solutions in medical imaging and patient monitoring to provide enhanced analysis and functionality.
In the medical industry, our custom designed non-magnetic diode product line is a critical component for certain MRI applications. For sensing and test and measurement applications, we believe our patented Heterolithic Microwave Integrated Circuit (HMIC) process is ideal for high-performance, integrated bias networks and switches. Our catalog of general purpose GaAs ICs includes low noise amplifiers, switches, and power amplifiers that address a wide range of applications such as industrial automation systems to test and measurement equipment.
To address our target markets, we offer a broad range of standard and custom ICs, modules and complete subsystems across approximately 40 product lines. Our product catalog currently consists of more than 3,500
6
Table of Contents
products including the following key product platforms: power pallets and transistors, ICs, diodes, switches and switch limiters, passive and active components, multi-chip modules, and complete subsystems. Many of our product platforms are leveraged across multiple markets and applications. For example, our application expertise with regard to power transistor technology is leveraged across both scientific laboratory equipment applications and commercial and defense radar system applications. Our diode technology is used in switch filter banks of military tactical radios as well as medical imaging MRI systems. The table below presents the major product families and major applications in our primary target markets.
| TARGET MARKET
|
MAJOR PRODUCT FAMILIES
|
MAJOR APPLICATIONS
| ||
| Networks | Active Splitters | 2G/3G/4G Wireless Base Stations | ||
| Amplifiers | 40/100G Fiber Optics | |||
| Attenuators | Broadcast Video | |||
| Clock and Data Recovery | CATV Infrastructure | |||
| Crosspoint Switches | Enterprise Routing and Switching | |||
| Carrier Convergence Processors | GPON/FTTX | |||
| Enterprise Voice & Data Processors | Hybrid PBX | |||
| Filters/Diplexers | IP PBX | |||
| Laser Drivers | Optical Transport Networks | |||
| Modulator Driver Amplifiers | Point-to-Point Wireless Backhaul | |||
| Post Amplifiers | Session Border Controller | |||
| SDI Cable Drivers | Set Top Boxes | |||
| SDI Equalizers | Unified Communication | |||
| SDI Reclockers | Wireless Trunk Gateway | |||
| Signal Conditioners | Wireline Access Gateway | |||
| Switches | Wireline Trunk Gateway | |||
| Transformers/Baluns | ||||
| Transimpedance Amplifiers | ||||
| Upconverters/Downconverters | ||||
| VoIP Processors | ||||
| Voltage Controlled Oscillators | ||||
| Aerospace and Defense | Amplifiers | Air Traffic Control Radar | ||
| Attenuators | Weather Radar | |||
| Components | Public Safety Radios | |||
| Diodes | Tactical & Manpack Radios | |||
| Power Transistors & Modules | Satellite Communications | |||
| Mixers | Military Communications | |||
| Phase Shifters | ||||
| Switch Limiters | ||||
| Voltage Control Oscillators | ||||
| Multi-Market | Amplifiers | Industrial | ||
| Attenuators | Medical | |||
| Couplers | Scientific | |||
| Diodes | Test & Measurement | |||
| Logic Drivers | ||||
| Mixers | ||||
| Power Detectors | ||||
| Power Transistors | ||||
| Switches | ||||
| Transceivers
|
||||
In August 2015, we divested our Automotive business to Autoliv based on our belief that the business was no longer accretive to our operating model and was no longer consistent with our long-term strategic vision from
7
Table of Contents
a growth and profitability perspective. We believe divesting our Automotive business will help us to realize our potential as a high-performance analog semiconductor company and focus our efforts on growing our retained core businesses.
We believe the combination of our market-facing strategy and our engineering expertise enables us to identify profitable growth opportunities and rapidly develop and deliver new products and solutions complemented by strategic acquisitions. Many of our products have long lifecycles ranging from five to ten years, and some of our products have been shipping for over 20 years. Our goal is to strengthen customer relationships and capture design wins with customers that allow us to be a supplier of components used in their systems.
Research and Development
Our research and development efforts are directed toward the rapid development of new and innovative products and solutions, process technologies and packaging techniques. The interaction of semiconductor process technology, circuit design technology and packaging technology defines the performance parameters and the customers’ acceptance of our products. We believe our core competency is the ability to model, design, integrate, package, and manufacture differentiated solutions. We leverage this core competency to solve difficult and complex challenges that our customers face during their system design phases. We believe our integrated and customized solutions offer customers high performance, quality, reliability, and faster time to market.
Circuit design and device modeling expertise. Our engineers are experts in the design of circuits capable of reliable, high-performance analog RF, microwave, millimeterwave and photonic signal conditioning. Our staff has decades of experience in solving complex design challenges in applications involving high frequency, high power, and environmentally-rugged operating conditions. We also develop proprietary device and electro-magnetic modeling techniques that our engineers use to generate predictive models prior to fabrication. Our predictive modeling expertise allows us to achieve faster design cycle times resulting in shorter time to market for our products.
Semiconductor process technology. We leverage our domestic semiconductor wafer fabrication capabilities and our foundry suppliers to offer customers the right process technology to meet their particular requirements. Depending on the requirements for the application, our semiconductor products may be designed using an internally developed or externally sourced process technology.
Packaging expertise. Our extensive packaging expertise enables us to model the interaction between the semiconductor and its package. Our engineers make adjustments in the design of both the semiconductor and the package, to take account of that interaction. We offer products in a variety of different package types for specific applications, including plastic over-molded, ceramic, and laminate-based packaging.
We continue to invest in proprietary processes to enable us to develop and manufacture high-value solutions. For example, we have developed innovative, patented technologies such as HMIC, which provides high integration, high power and low loss switching capabilities for our primary markets. This technology replaces mechanical switches for very high power applications such as wireless base stations. We are also in the process of transferring innovative, high-performance GaN process technology manufacturing capability from an external foundry supplier to our Lowell, Massachusetts fabrication facility. Upon completion of the transfer and qualification process, we believe that being able to offer our customers this dual-sourced, internal and external GaN supply capability will provide us with a competitive advantage.
Our engineers’ system-level design expertise allows us to offer differentiated solutions that leverage multiple process technologies and are integrated into a single, higher-level assembly, thereby delivering our customers enhanced functionality.
8
Table of Contents
Research and development expenses were $82.2 million, $71.4 million, and $42.5 million for fiscal years 2015, 2014, and 2013, respectively. We anticipate that we will continue to make significant research and development expenditures in order to drive future new product and process introductions and maintain our competitive position.
Sales and Marketing
We employ a global multi-channel sales strategy and support model intended to facilitate our customers’ evaluations and selections of our products. We sell through our direct sales force, our application engineering staff, our global network of independent sales representatives, resellers, and distributors, as well as an e-commerce channel. We have strategically positioned our direct sales and applications engineering staff in 32 locations worldwide, augmented by independent sales representatives and distributors with additional domestic and foreign locations to offer responsive local support resources to our customers and to build long-term relationships. From our global design centers, our application engineers visit customers at their engineering and manufacturing facilities, aid them in understanding our capabilities, and collaborate with them to deliver products that can optimize their system performance. Our global independent sales representatives and distributor network allows us to extend our sales capabilities to new customers in new geographies more cost effectively than using our direct sales force alone.
Our products are principally sold in the U.S., Asia, and Europe, which is where we concentrate our direct sales force, engineering staff, independent sales representatives, and distributors. Sales to our distributors accounted for 20.7%, 22.0%, and 24.5% of our revenue in fiscal years 2015, 2014, and 2013, respectively. Our agreements with sales representatives, resellers and distributors may provide for an initial term of one or more years with the opportunity for subsequent renewals or for an indefinite term, and also typically provide that either party may terminate the agreement for convenience with a minimum period of prior notice to the other party, usually between 30 and 90 days.
Our sales efforts are focused on the needs of our customers in our three primary markets rather than on particular product lines, facilitating product cross-selling across end markets, and within key accounts. Through our website, customers can order online, request samples, and access our product selection guides, detailed product brochures and data sheets, application notes, suggested design block diagrams and test fixture information, technical articles, and information regarding quality and reliability.
Customers
Our diversified base of over 6,000 end customers includes OEMs, contract manufacturers, and distributors. For fiscal years 2015 and 2014, one direct customer individually accounted for more than 10% of our revenue, Alltek at 12.1% and 9.7%, respectively. There were no sales to this customer in 2013. In addition, our principal distributor, Richardson Electronics, an Arrow Electronics Company (Richardson), accounted for 17.7%, 18.5%, and 20.8% of our revenue in fiscal years 2015, 2014, and 2013, respectively. Our top 25 direct customers accounted for an aggregate of 54.6%, 51.2%, and 45.8% of our revenue in fiscal years 2015, 2014, and 2013, respectively.
Competition
The markets for our products are highly competitive and are characterized by continuously evolving customer requirements. We believe that the principal competitive factors in our markets include:
| • | the ability to timely design and deliver products and solutions that meet customers’ performance, reliability and price requirements; |
| • | the breadth and diversity of product offerings; |
| • | the ability to provide a reliable supply of products in sufficient quantities and in a timely manner; |
9
Table of Contents
| • | the ability of engineering talent to drive innovation and new product development; |
| • | the quality of customer service and technical support; and |
| • | the financial reliability, operational stability, and reputation of the supplier. |
We believe that we compete favorably with respect to these factors. We compete primarily with both internal design resources and other suppliers of high-performance analog semiconductor solutions for use in wireless and wireline RF, microwave, millimeterwave and photonic applications, some of whom have greater financial resources and scale than us. We expect competition in our markets to intensify, as new competitors enter these markets, existing competitors merge or form alliances, and new technologies emerge. We believe that in the future there will be increased competition from companies utilizing alternative technologies, such as high-volume manufacturers using low-cost silicon process technology. Some of our competitors are also our customers, and in certain product categories we compete with semiconductor manufacturers from which we also obtain foundry services, including Sumitomo Electric Device Innovations, Inc. and Qorvo, Inc. (Qorvo).
We compete with Analog Devices, Inc. (ADI) across our primary markets, Networks, A&D and Multi-market. In the Networks market, we also compete with Avago, Inc.(Avago), and Semtech Corporation, Inc. In the A&D market, we also compete with Cobham Defense Electronic Systems Corporation (Cobham), Microsemi Corporation (Microsemi), and Qorvo. In the Multi-market arena, we also compete with Cobham, Avago, Microsemi and Skyworks Solutions, Inc (Skyworks).
Segment and Geographic Information
We manage our operations in one reportable segment, semiconductors and modules. Financial information about our operations, including our revenue and long-lived assets by geographic region, is included in our consolidated financial statements and accompanying notes in Item 8. “Financial Statements and Supplementary Data” appearing elsewhere below.
Risks attendant to our foreign operations are discussed in this Annual Report under “Item 1A—Risk Factors.”
Backlog and Inventory
Our sales are made primarily on a purchase order basis, rather than pursuant to long-term contracts where the customer commits to buy any minimum amount of product over an extended period. On occasion, we ship finished goods inventory to certain customer or third-party “hub” locations, but do not recognize revenue associated with such shipments until these customers consume the inventory from the hub. We also frequently ship products from inventory shortly after receipt of an order, which we refer to as “turns business”. Due to these arrangements and industry practice, which allows customers to cancel orders with limited advance notice prior to shipment, and with little or no penalty, we believe that backlog as of any particular date may not be a reliable indicator of our future revenue levels.
Intellectual Property
Our success depends in part upon our ability to protect our intellectual property. To accomplish this, we rely on a combination of intellectual property rights, including patents, copyrights, trademarks, and trade secrets, as well as customary contractual protections with our customers, suppliers, employees, and consultants.
As of October 2, 2015, we had 409 U.S. and 161 foreign patents and 61 U.S. and 41 foreign pending patent applications covering elements of circuit design, manufacturing and wafer fabrication. We do not know whether any of our pending patent applications will result in the issuance of patents or whether the examination process will require us to narrow our claims. The expiration dates of our patents range from 2016 to 2035. We do not
10
Table of Contents
regard any of the patents scheduled to expire in the next 12 months as material to our overall intellectual property portfolio. Notwithstanding our active pursuit of patent protection when available, we believe that our future success will be determined by the innovation, technical expertise and management abilities of our engineers and management more than by patent ownership.
The semiconductor industry is characterized by the existence of a large number of patents, copyrights, trademarks and trade secrets, and by the vigorous pursuit, protection and enforcement of intellectual property rights. Many of our customer agreements require us to indemnify our customers for third-party intellectual property infringement claims, which may in the future require that we defend those claims and might require that we pay damages in the case of adverse rulings. Claims of this sort could harm our relationships with our customers and might deter future customers from doing business with us. With respect to any intellectual property rights claims against us or our customers or distributors, we may be required to cease manufacture of the infringing product, pay damages or settlement amounts, expend resources to develop non-infringing technology, seek a license, which may not be available on commercially reasonable terms or at all, or relinquish patents or other intellectual property rights.
Manufacturing, Sources of Supply and Raw Materials
In any particular situation, we may choose to leverage our internal proprietary process technologies or other technologies with external fabrication facilities. We believe this ability to leverage our existing internal capabilities and external outsourcing helps us to provide optimized solutions for our customers.
Our internal wafer fabrication, and a majority of our internal assembly and test operations, are conducted at our Lowell, Massachusetts headquarters and internal wafer fabrication and test operations in Ithaca, New York. We believe having a U.S.-based wafer fabrication lines is a competitive advantage for us over competitors that do not have this capability, because it provides us with greater control over quality, a secure source of supply, and a domestic source for U.S. A&D customers. We also believe that our domestic fabrication lines allow us to better manage quality control and develop products faster with shorter production lead times than if we utilized external foundries. We also perform internal assembly and test functions at our Long Beach, California, Ithaca, New York, Nashua, New Hampshire, and Hsinchu, Taiwan locations.
We complement our internal manufacturing with outsourced foundry partners and other supply chain suppliers. Our operations staff has extensive expertise in the management of outsourced manufacturing service providers and other supply chain participants. We believe our fab-lite model of outsourcing certain of our manufacturing activities rather than investing heavily in capital-intensive production facilities, provides us with the flexibility to respond to new market opportunities, simplifies our operations, provides access to other process technologies and additional manufacturing capacity, and reduces our capital requirements. We also use third-party contract manufacturers for assembly, packaging and test functions, and in some cases for fully-outsourced turnkey manufacturing of our products.
The principal materials used in the production of our IC products are high purity source materials such as gallium, aluminum, arsenic, nitrite, carbon, and silicon. We purchase from hundreds of suppliers worldwide, a wide variety of semiconductors, wafers, packages, metals, printed circuit boards, electromechanical components, and other materials for use in our operations. These supply relationships are generally conducted on a purchase order basis. The use of external suppliers involves a number of risks, including the possibility of material disruptions in the supply of key raw materials and components, the lack of control over delivery schedules, capacity, quality, and costs.
While we attempt to maintain alternative sources for our principal raw materials to reduce the risk of supply interruptions or price increases, some of the raw materials and components are not readily available from alternate suppliers due to their unique nature, design or the length of time necessary for re-design or qualification. We routinely utilize single sources of supply for various materials based on availability,
11
Table of Contents
performance, efficiency, or cost considerations. For example, wafers procured from merchant foundries for a particular process technology are generally sourced through a single foundry on which we rely for all of our wafers in that process. Our reliance on external suppliers puts us at risk of supply chain disruption if a supplier does not have sufficient raw material inventory to meet our manufacturing needs, goes out of business, changes or discontinues the process in which components or wafers are manufactured, or declines to continue supplying us for competitive or other reasons, as discussed in more detail in Item 1A. “Risk Factors” herein. Where practical, we attempt to mitigate these risks by qualifying multiple sources of supply, redesigning products for alternative components, and purchasing incremental inventory of raw materials and components in order to protect us against supply disruptions.
Quality Assurance
The goal of our quality assurance program is for our products to meet our customers’ requirements, be delivered on time, and function reliably throughout their useful lives. The International Organization for Standards (ISO) provides models for quality assurance for various operational disciplines, such as design, manufacturing, and testing, which comprise part of our overall quality management system. Our following locations have each received ISO 9001:2008 certifications in one or more of their principal functional areas: Lowell, Massachusetts; Ithaca, New York; Long Beach, Santa Clara and Newport Beach, California; Morrisville, North Carolina; Nashua, New Hampshire; Belfast, Northern Ireland; Cork, Ireland; Sydney, Australia, and Hsinchu, Taiwan. In addition, our Lowell, Massachusetts facility has received an ISO 14001:2004 environmental management systems certification.
Environmental Regulation
Our operations involve the use of hazardous substances and are regulated under federal, state, and local laws governing health and safety and the environment in the U.S. and other countries. These regulations include limitations on discharge of pollutants into the air, water, and soil; remediation requirements; product chemical content limitations; manufacturing chemical use and handling restrictions; pollution control requirements; waste minimization considerations; and requirements regarding the treatment, transport, storage, and disposal of hazardous wastes. We are also subject to regulation by the U.S. Occupational Safety and Health Administration and similar health and safety laws in other jurisdictions. While we are committed to compliance with applicable regulations, the risk of environmental liabilities can never be completely eliminated, and there can be no assurance that the application of environmental and health and safety laws to our business will not require us to incur material future expenditures.
We are also regulated under a number of federal, state, and local laws regarding responsible sourcing, recycling, product packaging and product content requirements in the U.S. and other countries, including legislation enacted in the European Union and other foreign jurisdictions that have placed greater restrictions on the use of lead, among other chemicals, in electronic products, which affects materials composition and semiconductor packaging. These laws are becoming more stringent and may in the future cause us to incur material expenditures or otherwise cause financial harm.
Export Regulations
We market and sell our products both inside and outside the U.S. Certain products are subject to the Export Administration Regulations, administered by the Department of Commerce, Bureau of Industry Security, which require that we obtain an export license before we can export certain controlled products or technology to specified countries. Additionally, some of our products are subject to the International Traffic in Arms Regulations, which restrict the export of information and material that may be used for military or intelligence applications by a foreign person. Similar controls exist in other jurisdictions. Failure to comply with these laws could result in sanctions by the government, including substantial monetary penalties, denial of export privileges, and debarment from government contracts. We maintain an export compliance program staffed by dedicated
12
Table of Contents
personnel under which we screen export transactions against current lists of restricted exports, destinations, and end users with the objective of managing export-related decisions, transactions, and shipping logistics to ensure compliance with these requirements.
Employees
As of October 2, 2015, we employ approximately 1,100 individuals worldwide. None of our domestic employees are represented by a collective bargaining agreement; however, certain of our employees working in our European operations are covered by collective bargaining agreements. We consider our relations with employees to be good, and we have not experienced a work stoppage due to labor issues.
History and Recent Developments
We were incorporated under the laws of the State of Delaware in March 2009. Our operations are conducted through our various subsidiaries, which are organized and operated according to the laws of their respective jurisdictions of incorporation.
M/A-COM Technology Solutions Inc., our primary operating subsidiary, which provides high-performance analog semiconductor solutions for use in wireless and wireline applications across the RF, microwave, and millimeterwave spectrum, was incorporated under the laws of the state of Delaware on July 16, 2008. M/ACOM Technology Solutions (Cork) Limited, our primary foreign operating subsidiary, was incorporated under the laws of Ireland on November 18, 2008. In September 2008, Cobham acquired certain assets from a third party, including the RF and microwave component and subsystem design and business operations that would ultimately become the operations of M/A-COM Technology Solutions Inc. and M/ACOM Technology Solutions (Cork) Limited. The heritage of some of these business operations dates back over 60 years to the founding of Microwave Associates, Inc. and the M/A-COM brand date back over 30 years.
On March 30, 2009, we acquired 100% of the outstanding stock of M/A-COM Technology Solutions Inc., M/ACOM Technology Solutions (Cork) Limited and the related M/A-COM brand from Cobham for $22.1 million in cash net of purchase price adjustments, the issuance of $35.0 million in short- and long-term debt payable to the seller, and contingent consideration of approximately $30.0 million based on our achievement of revenue targets in each of the 12-month periods ended September 30, 2010, 2011 and 2012.
On December 18, 2013, we acquired Mindspeed Technologies, Inc. (Mindspeed), a supplier of semiconductor solutions for communications infrastructure applications (Mindspeed Acquisition). We acquired Mindspeed to further its expansion into high- performance analog products. We funded the Mindspeed Acquisition through the use of available cash and borrowings under our revolving credit facility.
In February 2014, subsequent to closing the Mindspeed Acquisition, we divested the wireless business of Mindspeed. The operations of the wireless business are included in discontinued operations.
In May 2014, we divested the communications processor equipment (CPE) product line we acquired as part of the Mindspeed acquisition. The operations of the CPE product line are included in the results of continuing operations through the date of the sale.
On February 13, 2014, we completed the acquisition of Nitronex, LLC (Nitronex) (the Nitronex Acquisition). Nitronex designs, develops, manufactures, and markets GaN semiconductors and holds an exclusive license to fundamental GaN patents in the RF field of use. We funded the Nitronex Acquisition through the use of available cash and borrowings under our revolving credit facility.
We acquired Nitronex from a party under common control. As a result, we have accounted for the Nitronex Acquisition as a pooling of interest from the date of acquisition by the common control party in June 2012. The
13
Table of Contents
original acquisition of Nitronex by the common control party was accounted for as a purchase. Our financial statements have been retroactively combined to include the results of operations of Nitronex from June 2012.
In December 2014, we completed the acquisition of BinOptics, a leading merchant provider of InP lasers for data centers, mobile backhaul, silicon photonics and access networks. This acquisition has broadened our position in the optical components market, which we believe will continue to be an important growth driver in future periods. We funded the BinOptics acquisition through the use of available cash and borrowings under our revolving credit facility.
In August 2015, we divested our Automotive business to Autoliv based on our belief that the business was no longer accretive to our operating model and was no longer consistent with our long-term strategic vision from a growth and profitability perspective. We believe divesting our Automotive business will help us to realize our potential as a high-performance analog semiconductor company and focus our efforts on growing our retained core businesses.
We expect that our optical and laser businesses will continue to perform and contribute to our consolidated earnings and cashflows with our pre-divestment expectations.
Additionally, our operating margins related to the Automotive business were no longer accretive to our operating model which was a driver in our decision to divest the Automotive business.
We intend to continue to pursue acquisitions of technologies, design teams, products, and companies that complement our strengths and help us execute our strategies. Our acquisition strategy is designed to accelerate our revenue growth, expand our technology portfolio, grow our addressable market, and create shareholder value. We believe our management team has a proven track record in identifying, acquiring, and successfully integrating companies and technologies in the high-performance analog semiconductor industry.
Available Information
We maintain a website at www.macom.com, including an investors section at which we routinely post important information, such as webcasts of quarterly earnings calls and other investor events in which we participate or host, and any related materials. You may access our annual reports on Form 10-K, quarterly reports on Form 10-Q, current reports on Form 8-K and amendments to those reports, as well as other reports relating to us that are filed with or furnished to the SEC, free of charge in the investors section of our website as soon as reasonably practicable after such material is electronically filed with or furnished to the SEC. The public may also read and copy materials we file with the SEC at the SEC’s Public Reference Room, which is located at 100 F Street, NE, Room 1580, Washington, DC 20549. You can obtain information on the operation of the Public Reference Room by calling the SEC at 1-800-SEC-0330. The SEC also maintains a website that contains reports, proxy and information statements and other information regarding issuers that file electronically with the SEC at www.sec.gov. The contents of the websites mentioned above are not incorporated into and should not be considered a part of this report.
14
Table of Contents
| ITEM | 1A. RISK FACTORS |
Our business involves a high degree of risk. You should carefully consider the following risks and other information in this Annual Report in evaluating the Company and its common stock. If any of the following risks actually occurs, our business, financial condition or results of operations could suffer. The risks described below are not the only ones facing us. Additional risks not presently known to us or that we currently consider immaterial also may adversely affect our Company.
Risks Relating to Our Business
Our revenue growth is substantially dependent on our successful development and release of new products.
Maintaining or growing our revenue will depend on our ability to timely develop new products for existing and new markets that meet customers’ performance, reliability and price expectations. The development of new products is a highly complex process, and we have in the past and may in the future experience delays and failures in completing the development and introduction of new products. Our successful product development depends on a number of factors, including the following:
| • | the accurate prediction of market requirements, changes in technology and evolving standards; |
| • | the availability of qualified product designers and process technologies needed to solve difficult design challenges in a cost-effective, reliable manner; |
| • | our ability to design products that meet customers’ cost, size and performance requirements; |
| • | our ability to manufacture new products according to customer needs with acceptable manufacturing yields; |
| • | our ability to offer new products at competitive prices; |
| • | the acceptance by customers of our new product designs; |
| • | the identification of and entry into new markets for our products; |
| • | the acceptance of our customers’ products by the market and the lifecycle of such products; |
| • | our ability to deliver products in a timely manner within our customers’ product planning and deployment cycle; and |
| • | our ability to maintain and increase our level of product content in our customers’ systems. |
A new product design effort may last 12 to 18 months or longer, and requires significant investment in engineering hours and materials, as well as sales and marketing expenses, which may not be recouped if the product launch is unsuccessful. We may not be able to design and introduce new products in a timely or cost-efficient manner, and our new products may fail to meet the requirements of the market or our customers, or may be adopted by customers more slowly than we expect. In that case, we may not reach our expected level of production orders and may lose market share, which could adversely affect our ability to sustain our revenue growth or maintain our current revenue levels.
Various factors may reduce our gross margin, which could negatively affect our business, financial condition and results of operations.
If we are unable to utilize our design, fabrication, assembly and test facilities at a high level, the significant fixed costs associated with these facilities may not be fully absorbed, resulting in higher average unit costs and lower gross margin. Our various products have different gross margins. Increased sales of lower-margin products, such as certain of our products targeted at consumer markets, in a given period relative to sales of higher-margin products such as our optical products, may cause us to report lower overall gross margin. We have
15
Table of Contents
experienced periods where our gross margin declined due to, among other things, reduced factory utilization resulting from reduced customer demand, reduced selling prices and a change in product mix towards lower-margin products. Future market conditions may adversely affect our revenue and utilization rates and consequently our future gross margin, and this, in turn, could have an adverse impact on our business, financial condition and results of operations. In addition, increased raw material costs, changes in manufacturing yields, more complex engineering requirements and certain other factors may lead to lower margins for us in the future. As a result of these or other factors, we may be unable to maintain or increase our gross margin in future periods and our gross margin may fluctuate from period to period.
Our operating results may fluctuate significantly from period to period. We may not meet investors’ quarterly or annual financial expectations and, as a result, our stock price may decline.
Our quarterly and annual operating results and related expectations may vary significantly in the future based upon a number of factors, many of which are beyond our control. Factors that could cause operating results and related expectations to fluctuate include:
| • | the general economic growth or decline in the U.S. or foreign markets; |
| • | the reduction or cancellation of orders by customers, whether as a result of a loss of market share by us or our customers, changes in the design of customers’ products or slowing demand for our products or customers’ products; |
| • | the amount of new customer orders we book and ship in any particular fiscal quarter, which accounts for a significant amount of our net revenue in any particular quarter, and which can often be weighted toward the latter part of each fiscal quarter, making the timing of recognition of the associated revenue difficult to forecast and susceptible to slippage between quarters; |
| • | the relative linearity of our shipments within any particular fiscal quarter, in that a less linear shipment pattern within a given fiscal quarter tends to result in lower gross margin in that quarter, and a shipment pattern weighted toward the latter part of a fiscal quarter tends to reduce our cash flows from operations in that quarter, as collections of related receivables do not occur until later fiscal periods; |
| • | the gain or loss of a key customer or significant changes in the financial condition of one or more key customers; |
| • | the fluctuations in manufacturing output, yields, capacity levels, quality control or other potential problems or delays we or our subcontractors may experience in the fabrication, assembly, testing or delivery of our products; |
| • | the fluctuations in demand relating to the A&D market due to changes in government programs, budgets or procurement; |
| • | the market acceptance of our products and particularly the timing and success of new product and technology introductions by us, customers or competitors; |
| • | the amount, timing, and relative success of our investments in research and development, which impacts our ability to develop, introduce and market new products and solutions on a timely basis; |
| • | the period-to-period changes in the mix of products we sell, which can result in lower gross margin; |
| • | the availability, quality and cost of semiconductor wafers and other raw materials, equipment, components and internal or outsourced manufacturing, packaging and test capacity, particularly where we have only one qualified source of supply; |
| • | the effects of seasonal and other changes in customer purchasing cycles and component inventory levels; |
| • | the effects of competitive pricing pressures, including decreases in average selling prices of our products; |
16
Table of Contents
| • | the effects of impairment charges associated with intangible assets, including goodwill and acquisition-related intangible assets; |
| • | the loss of key personnel or the shortage of available skilled workers; |
| • | the effects of factors that could cause our reported domestic and foreign income taxes and income tax rate to increase in future periods, such as limits on our ability to utilize net operating losses or tax credits and the geographic distribution of our income, which may change from period to period; and |
| • | the effects of war, natural disasters, acts of terrorism, macroeconomic uncertainty or decline or geopolitical unrest. |
The foregoing factors are difficult to forecast, and these, as well as other factors, could materially and adversely affect our quarterly and annual operating results and related expectations for future periods. If our operating results in any period do not meet our publicly stated guidance or the expectations of investors or securities analysts, our stock price may decline. Similarly, any publicly stated guidance we provide in the future may fail to meet the expectations of investors or securities analysts and our stock price may decline as a result.
If our primary markets decline or fail to grow, our revenue and profitability may suffer.
Our future growth depends to a significant extent on the continued growth in usage of advanced electronic systems in our primary markets: Networks, A&D and Multi-market. The rate and extent to which these markets grow, if at all, is uncertain. These markets may fail to grow or decline for many reasons, including insufficient consumer demand, lack of access to capital, sequestration or other changes in the U.S. defense budget and procurement processes, changes in export controls or other regulatory environments, macro-economic factors and changes in network specifications. If demand for electronic systems that incorporates our products declines, fails to grow, or grows more slowly than we anticipate, purchases of our products may be reduced, which may adversely affect our business, financial condition and results of operations. In particular, we believe that the rollout of fiber-to-the-home network technology and other new network technology developments in China, Japan and certain other geographies will be an important factor in our future growth. If any such expected rollout fails to occur, occurs more slowly than we expect or does not result in the amount or type of new business we anticipate, purchases of our products intended to address the affected markets may be reduced or not occur, which may materially and adversely affect our business, financial condition, results of operations and prospects.
We typically depend on orders from a limited number of customers for a significant percentage of our revenue.
In the fiscal year ended October 2, 2015, sales to two of our customers accounted for 10% or more of our revenue and sales to our top 10 direct and distribution customers accounted for an aggregate of 57% of our revenue. While the composition of our top 10 customers varies from year to year, we expect that sales to a limited number of customers will continue to account for a significant percentage of our revenue for the foreseeable future. The purchasing arrangements with our customers are typically conducted on a purchase order basis that does not require our customers to purchase any minimum amount of our products over a period of time. As a result, it is possible that any of our major customers could terminate their purchasing arrangements with us or significantly reduce or delay the amount of our products that they order, purchase products from our competitors or develop their own products internally. The loss of, or a reduction in, orders from any major customer may cause a decline in revenue and adversely affect our results of operations.
Our investment in research and development may not be successful, which may impact our profitability.
The semiconductor industry requires substantial investment in research and development in order to develop and bring to market new and enhanced technologies and products. Research and development expenses were $82.2 million for the fiscal year ended October 2, 2015. In each of the last three fiscal years, we invested in research and development as part of our strategy toward the development of innovative products and solutions to
17
Table of Contents
fuel our growth and profitability. We cannot assure you if, or when, the products and solutions where we have focused our research and development expenditures will become commercially successful. In addition, we may not have sufficient resources to maintain the level of investment in research and development required to remain competitive or succeed in our strategy. Our efforts to develop new and improved process technologies for use in our products require substantial expenditures that may not generate any return on investment, may take longer than we anticipate to generate a return or may generate a return on investment that is inadequate. In July 2013, we announced that we had licensed 0.5, 0.25 and 0.15 micron GaN process technology from Global Communications Semiconductors, LLC (GCS) and would be installing such process technology to our Lowell, Massachusetts manufacturing facility. This installation effort is expected to be a multi-year process and to involve tens of millions of dollars of investment in capital equipment, license fees and other related costs and expenses. We have in the past and may in the future experience unexpected difficulties, expenses, or delays in installing and qualifying our GaN technology, and ultimately, may not be successful in our efforts, may not realize the competitive advantage we anticipate from the license and porting effort, and may not realize customer demand for the GaN technology that meets our expectations following the installation effort, any of which could lead to reduced revenues and gross margin or otherwise harm our business. Similarly, following the Nitronex Acquisition, we announced a number of strategic plans and positive expectations concerning the future cost structure, manufacturability, opportunity for strategic partnerships and licensing programs, market applicability and potential positive impact on our market share of another type of GaN technology called GaN-on-Silicon, which is a focus of the Nitronex business. We also have undertaken significant research and development efforts aimed at targeting emerging market segments where we see potential for growth including the wireless base station, data center and radar tile markets. We have in the past and may in the future experience unexpected difficulties, expenses or delays in driving the performance, qualification, licensing arrangements, scale manufacturing, decreased manufacturing cost structure, productization or customer adoption of any of the new products or process technology types that we are targeting. We may not be successful in our efforts or may not realize the competitive advantage or revenues or profits we anticipate from this technology, any of which may lead to higher research and development expense, lower than expected revenues, gross margin and reduce profitability or may otherwise harm our business or reduce the price of our common stock.
We may incur significant risk and expense in attempting to win new business, and such efforts may never generate revenue.
To obtain new business, we often need to win a competitive selection process to develop semiconductors for use in our customers’ systems, known in the industry as a “design win.” These competitive selection processes can be lengthy and can require us to incur significant and unreimbursed design and development expenditures and dedicate scarce engineering resources in pursuit of a single customer opportunity. We may not win the competitive selection process or may never generate any revenue despite incurring significant design and development expenditures and selling, general and administrative expenses. Failure to obtain a design win may prevent us from supplying components for an entire generation of a customer’s system. This can result in lost or foregone revenue and could weaken our position in future competitive selection processes.
Even when we achieve a design win, success is not assured. Customer qualification and design cycles can be lengthy, and it may take a year or more following a successful design win and product qualification for one of our products to be purchased in volume by the customer. We may experience difficulties manufacturing the part in volume, such as low yields, supply chain delays or shortages, or quality issues. Further, while the customer has successfully qualified our part for use in its system, it may not have qualified all of the other components being sourced for its system, or qualified its system as a whole with its end customers. Any difficulties our customer may experience in completing those qualifications may delay or prevent us from translating the design win into revenue. These risks can be particularly acute in our A&D market, where we may spend material amounts and commit substantial design engineer resources to product development work in support of an OEM customer’s attempt to win business tied to a government contract award, but realize no related revenue or less than expected revenue from our investment due to failure of the OEM to win the business, government program cancellation, federal budget limitations, or otherwise. Any of these events, or any cancellation of a customer’s program or
18
Table of Contents
failure of our customer to successfully market its own product after our design win could materially and adversely affect our business, financial condition and results of operations, as we may have incurred significant expense and generated no revenue.
We are subject to order and shipment uncertainties. Our profitability will decline if we fail to accurately forecast customer demand when managing inventory.
We generally sell our products on the basis of purchase orders rather than long-term purchase commitments from our customers. Our customers can typically cancel purchase orders or defer product shipments for some period without incurring liability to us. We typically plan production and inventory levels based on internal forecasts of customer demand, which can be highly unpredictable and can fluctuate substantially, leading to excess inventory write-downs, and resulting negative impacts on gross margin and net income. We have limited visibility into our customers’ inventories, future customer demand, and the product mix that our customers will require, which could adversely affect our production forecasts and operating margins. The difficulty in predicting demand may be compounded when we sell to OEMs indirectly through distributors or contract manufacturers, or both, as our forecasts of demand are then based on estimates provided by multiple parties. In a number of markets we serve, large dollar value customer orders scheduled for delivery in the current fiscal quarter may be canceled or rescheduled by the customer for delivery in a future fiscal quarter on short notice, which may cause our reported revenue to vary materially from our prior expectations. In addition, the rapid pace of innovation in our industry could render significant portions of our inventory obsolete. If we overestimate our customers’ requirements, we may have excess inventory, which could lead to obsolete inventory and unexpected costs. Further, if we build inventory specific to non-recurring engineering (NRE) arrangements that we may enter into with our customers from time to time, and then fail to achieve one or more required milestones in connection with such NRE arrangements, we may have excess, non-qualified or non-conforming customer specific inventory, which could lead to unsellable inventory and unexpected costs. Conversely, if we underestimate our customers’ requirements, we may have inadequate inventory, which could lead to foregone revenue opportunities, loss of potential market share and damage to customer relationships caused by product deliveries not made on a timely basis and disrupting our customers’ production schedules. Some of our larger customers also require us to build and maintain minimum inventories and keep them available for purchase at specified locations based on non-binding demand estimates that are subject to change, which exposes us to increased inventory risk and makes it more difficult to manage our working capital. If demand from such customers decreases, we may be left with excess or obsolete inventory that we are unable to sell. In response to anticipated long lead times to obtain inventory and materials from outside suppliers and foundries, we periodically order materials and build a stock of finished goods inventory in advance of customer demand. This advance ordering of raw material and building of finished goods inventory has in the past and may in the future result in excess inventory levels or unanticipated inventory write-downs if expected orders fail to materialize, or other factors make our products less saleable. In addition, any significant future cancellation or deferral of product orders could adversely affect our revenue and margins, increase inventory write-downs due to obsolete inventory, or adversely affect our operating results and stock price.
The average selling prices of our products may decrease over time, which could have a material adverse effect on our revenue and gross margin.
It is common in our industry for the average selling price of a given product to decrease over time as production volumes increase, competing products are developed, technology, industry standards and customer platforms evolve, or new technologies featuring higher performance or lower cost emerge. To combat the negative effects that erosion of average selling prices have had in the past, and may have in the future, on our revenue and gross margin, we attempt to actively manage the prices of our existing products and introduce new process technologies and products in the market that exhibit higher performance, new features that are in demand, or lower manufacturing costs. Despite this strategy, we may experience price erosion in select product platforms or generally in future periods. Failure to maintain our current prices or to successfully execute on our new product development strategy will cause our revenue and gross margin to decline, which could decrease the value of your investment in our common stock.
19
Table of Contents
We face intense competition in our industry, and our inability to compete successfully could negatively affect our operating results.
The semiconductor industry is highly competitive. While we compete with a wide variety of companies, we compete with ADI across most of our primary markets. Our other significant competitors include, among others, Avago Technologies Limited, Cobham, Microsemi, Qorvo and Skyworks.
We believe future competition could also come from companies developing new alternative technologies, component suppliers based in countries with lower production costs and IC manufacturers achieving higher levels of integration that exceed the functionality offered by our products. Our customers and suppliers could also develop products that compete with or replace our products. A decision by any of our large customers to design and manufacture ICs internally could have an adverse effect on our operating results. Increased competition could mean lower prices for our products, reduced demand for our products, and a corresponding reduction in our ability to recover development, engineering and manufacturing costs.
Many of our existing and potential competitors have entrenched market positions, historical affiliations with original equipment manufacturers, considerable internal manufacturing capacity, established intellectual property rights, and substantial technological capabilities. Many of them may also have greater financial, technical, manufacturing or marketing resources than we do. Prospective customers may decide not to buy from us due to concerns about our relative size, financial stability or other factors. Our failure to successfully compete could result in lower revenue, decreased profitability and a lower stock price.
We operate in the semiconductor industry, which is cyclical and subject to significant downturns.
The semiconductor industry is highly cyclical and is characterized by constant and rapid technological change, price erosion, product obsolescence, evolving standards, short product lifecycles and significant fluctuations in supply and demand. The industry has historically experienced significant fluctuations in demand and product obsolescence, resulting in product overcapacity, high inventory levels and accelerated erosion of average selling prices. Downturns in many sectors of the electronic systems industry have in the past contributed to extended periods of weak demand for semiconductor products. We have experienced adverse effects on our profitability and cash flows during such downturns in the past, and our business may be similarly harmed by future downturns, particularly if we are unable to effectively respond to reduced demand in a particular market.
We expect to make future acquisitions, dispositions and investments, which involve numerous risks.
We have an active corporate development program and routinely evaluate potential acquisitions, investments and strategic alliances involving complementary technologies, design teams, products, and companies. We also periodically evaluate the merits of a potential divestment of one or more of our existing business lines. We expect to pursue such transactions if appropriate opportunities arise. However, we may not be able to identify suitable transactions in the future, or if we do identify such transactions, we may not be able to complete them on commercially acceptable terms, or at all. We also face intense competition for acquisitions from other acquirers in our industry. These competing acquirers may have significantly greater financial and other resources than us, which may prevent us from successfully pursuing a transaction. In the event we pursue acquisitions, we will face numerous risks including:
| • | difficulties in integrating the personnel, culture, operations, technology or products and service offerings of the acquired company; |
| • | diversion of management’s attention from normal daily operations of our business; |
| • | difficulties in entering markets where competitors have stronger market positions; |
| • | difficulties in improving and integrating the financial reporting capabilities and operating systems of any acquired operations, particularly foreign and formerly private operations, as needed to maintain effective internal control over financial reporting and disclosure controls, and procedures; |
20
Table of Contents
| • | loss of any key personnel of the acquired company as well as their know-how, relationships and expertise, which is common following an acquisition; |
| • | maintaining customer, supplier or other favorable business relationships of acquired operations; |
| • | generating insufficient revenue from completed acquisitions to offset increased expenses associated with any abandoned or completed acquisitions; |
| • | acquiring material or unknown leasehold, environmental, regulatory, infringement, contractual or other liabilities associated with any acquired operations; |
| • | litigation frequently associated with merger and acquisition transactions; and |
| • | increasing expense associated with amortization or depreciation of intangible and tangible assets we acquire. |
Our past acquisitions required or continue to require significant management time and attention relating to the transaction and integration activities. If we fail to properly integrate these acquired companies with ours, we may not receive the expected benefits of the acquisitions. Even if a proposed acquisition is successfully realized and integrated, we may not receive the expected benefits of the transaction.
Past transactions, whether completed or abandoned by us, have resulted, and in the future may result, in significant costs, expenses, liabilities and charges to earnings. The accounting treatment for any acquisition may result in significant amortizable intangible assets which, when amortized, will negatively affect our consolidated results of operations. The accounting treatment for any acquisition may result in significant goodwill, which, if impaired, will negatively affect our consolidated results of operations. Furthermore, we may incur debt or issue equity securities to pay for acquisitions. The incurrence of debt could limit our operating flexibility and be detrimental to our profitability, and the issuance of equity securities would be dilutive to our existing stockholders. Any or all of the above factors may differ from the investment community’s expectations in a given quarter, which could negatively affect our stock price. In addition, as a result of the foregoing, we may not be able to successfully execute acquisitions in the future to the same extent as we have the in the past, if at all.
In the event we make future investments, the investments may decline in value or fail to deliver any strategic benefits we anticipate from them, and we may lose all or part of our investment. For example, in May 2015 we received notice that a private company in which we held a minority equity investment was sold to a third party, and that the proceeds we would receive at closing would be less than the carrying value previously reported in our consolidated financial statements. We wrote down the investment to the estimated net proceeds we would receive from the sale, and recorded a charge of $3.5 million to other income (expense) resulting in an increase of our previously reported net loss per diluted share for the three and six months ended April 3, 2015, respectively. In the event we undertake divestments, such as the recent divestment of our Automotive business in August 2015, we may suffer from associated management distraction, damaged customer relationships, failure to realize the perceived strategic, or financial merits of the divestment, or we may incur material indemnity liabilities to the purchaser. Further, the investments may incur unanticipated or larger than anticipated liabilities for patent and trademark infringement claims, violations of laws, commercial disputes, taxes and other known and unknown types of liabilities. There may be liabilities that we underestimate or do not discover in the course of performing our due diligence investigation of the investment. We may not have recourse under the transaction documents to recover any damages relating to potential liabilities.
We may incur liabilities for claims of intellectual property infringement relating to our products.
The semiconductor industry is generally subject to frequent litigation regarding patents and other intellectual property rights. Other companies in the industry have numerous patents that protect their intellectual property rights in these areas and technology is frequently licensed. In the past, we have been, and may in the
21
Table of Contents
future be, subject to claims that we have breached infringed or misappropriated patent, license or other intellectual property rights. Our customers may assert claims against us for indemnification if they receive claims alleging that their or our products infringe others’ intellectual property rights, and have in the past and may in the future choose not to purchase our products based on their concerns over such a pending claim. In the event of an adverse result of any intellectual property rights litigation, we could be required to incur significant costs to defend or settle such litigation, pay substantial damages for infringement, expend significant resources to develop non-infringing technology, incur material liability for royalty payments or fees to obtain licenses to the technology covered by the litigation or be subjected to an injunction, which could prevent us from selling our products, and materially and adversely affect our revenue and results of operations. Negotiated settlements resolving such claims may require us to pay substantial sums, as was the case in September 2013 when we paid $7.25 million in settlement of a suit alleging intellectual property misappropriation. We cannot be sure that we will be successful in any such non-infringing development or that any such license would be available on commercially reasonable terms, if at all. Any claims relating to the infringement of third-party proprietary rights, even if not meritorious, could result in costly litigation, lost sales or damaged customer relationships and diversion of management’s attention and resources.
Many of our products currently incorporate technology licensed or acquired from third parties and we expect our products in the future to also require technology from third parties. If the licenses to such technology that we currently hold become unavailable or the terms on which they are available become commercially unreasonable, or if we are unable to acquire or license necessary technology for our products in the future, our business could be adversely affected.
We sell products in markets that are characterized by rapid technological changes, evolving industry standards, frequent new product introductions and increasing levels of integration. Our ability to keep pace with this market at times depends on our ability to obtain technology from third parties on commercially reasonable terms to allow our products to remain competitive. If licenses to such technology are not available on commercially reasonable terms and conditions or at all, and we cannot otherwise acquire or integrate such technology, our products or our customers’ products could become unmarketable or obsolete, and we could lose market share. In addition, disputes with third party licensors over required payments, scope of licensed rights and compliance with contractual terms are common in our industry, and we have in the past and may in the future be subjected to disputes over the terms of such licenses. Such disputes may require us to incur significant costs defending our license rights, divert management’s attention or result in our inability to sell or develop certain products. In such instances, we could also incur substantial unanticipated costs or scheduling delays to develop substitute technology to deliver competitive products, damaged customer and vendor relationships, indemnification liabilities, and declining revenues and profitability. Such events could have a material adverse effect on our financial condition and results of operations and the value of an investment in our common stock.
We depend on third parties for products and services required for our business, which may limit our ability to meet customer demand, assure product quality and control costs.
We purchase numerous raw materials, such as ceramic packages, precious metals, semiconductor wafers and ICs, from a limited number of external suppliers. We also currently use several external manufacturing suppliers for assembly and testing of our products, and in some cases for fully-outsourced turnkey manufacturing of our products. We currently expect to increase our use of outsourced manufacturing in the future as a strategy. The ability and willingness of our external suppliers to perform is largely outside of our control. The use of external suppliers involves a number of risks, including the possibility of material disruptions in the supply of key components, the lack of control over delivery schedules, capacity constraints, manufacturing yields, quality and fabrication costs and misappropriation of our intellectual property. If these vendors’ processes vary in reliability or quality, they could negatively affect our products and, therefore, our customer relations and results of operations. We generally purchase raw materials on a purchase order basis and we do not have significant long-term supply commitments from our vendors. Where we do have long-term supply commitments, they may result in our being obligated to purchase more material than we need, materially and negatively impacting our
22
Table of Contents
operating results. In terms of relative bargaining power, many of our suppliers are larger than we are, with greater resources, and many of their other customers are larger and have greater resources than we do. If these vendors experience shortages or fail to accurately predict customer demand, they may have insufficient capacity to meet our demand, creating a capacity constraint on our business. They may also choose to supply others in preference to us in times of capacity constraint or otherwise, particularly where the other customers purchase in higher volume. Third-party supplier capacity constraints have in the past and may in the future prevent us from supplying customer demand that we otherwise could have fulfilled at attractive prices. If we have a firm commitment to supply our customer but are unable to do so based on inability or unwillingness of one of our suppliers to provide related materials or services, we may be liable for resulting damages and expense incurred by our customer.
Based on superior performance features, cost parameters or other factors, we utilize sole source suppliers for certain semiconductor packages and other materials, and it is common for one of our outside semiconductor foundries to be our sole supplier for the particular semiconductor fabrication process technologies manufactured at that supplier’s facility. Such supplier concentrations involve the risk of a potential future business interruption if the supplier becomes unable or unwilling to supply us at any point. While in some cases alternate suppliers may exist, because there are limited numbers of third-party wafer suppliers that use the process technologies we select for our products and that have sufficient capacity to meet our needs, it may not be possible or may be expensive to find an alternative source of supply. Even if we are able to find an alternative source, moving production to an alternative supplier requires an extensive qualification or re-qualification process that could prevent or delay product shipments, or disrupt customer’s production schedules, which could harm our business. In addition, some of our external foundry suppliers compete against us in the market in addition to being our supplier. The loss of a supplier can also significantly harm our business and operating results. A supplier may discontinue supplying us if its business is not sufficiently profitable, for competitive reasons or otherwise. We have in the past and may in the future have our supply relationship discontinued by an external foundry, causing us to experience supply chain disruption, customer dissatisfaction, loss of business and increased cost.
If we lose key personnel or fail to attract and retain key personnel, we may be unable to pursue business opportunities or develop our products.
We believe our continued ability to recruit, hire, retain and motivate highly-skilled engineering, operations, sales, administrative and managerial personnel is key to our future success. Competition for these employees is intense, particularly with respect to qualified engineers. Our failure to retain our present employees and hire additional qualified personnel in a timely manner and on reasonable terms could harm our competitiveness and results of operations. In addition, from time to time, we may recruit and hire employees from our competitors, customers, suppliers and distributors, which could result in liability to us, and has in the past and could in the future, damage our business relationship with these parties. For example, in June 2015 NXP B.V. filed a lawsuit against us alleging, among other things, that by hiring away certain of its employees we breached a non-disclosure agreement we had signed as part of our participation in a private equity-backed consortium in the early stages of bidding on a proposed divestiture of NXP’s RF power amplifier business. The lawsuit seeks, among other things, an injunction barring us from hiring additional NXP employees and limiting the scope of our employment of persons we have already hired. None of our senior management team is contractually bound to remain with us for a specified period, and we generally do not maintain key person life insurance covering our senior management. The loss of any member of our senior management team could strengthen a competitor or harm our ability to implement our business strategy.
Sources for certain components and materials are limited, which could result in interruptions, delays or reductions in product shipments.
Our industry may be affected from time to time by limited supplies of certain key components and materials. We have in the past and may in the future, experience delays or reductions in supply shipments, which could reduce our revenue and profitability. If key components or materials are unavailable, our costs could increase and our revenue could decline.
23
Table of Contents
In particular, our manufacturing headquarters, design facilities, assembly and test facilities, and supply chain, and those of our contract manufacturers, are subject to risk of catastrophic loss due to fire, flood, or other natural or man-made disasters. The majority of our semiconductor products are fabricated in our Lowell, Massachusetts headquarters and our facility in Ithaca, New York. The majority of the internal and outsourced assembly and test facilities we utilize are located in the Pacific Rim, and some of our internal design, assembly and test facilities are located in California regions with above average seismic and severe weather activity. In addition, our research and development personnel are concentrated in a few locations, with the expertise of the personnel at each such location generally focused on one or two specific areas. Any catastrophic loss or significant damage to any of these facilities would likely disrupt our operations, delay production, shipments and revenue, and result in significant expenses to repair or replace the facility, and in some instances, could significantly curtail our research and development efforts in a particular product area or primary market, which could have a material adverse effect on our operations. In particular, any catastrophic loss at our headquarters or our Ithaca, New York facilities could materially and adversely affect our business and financial results, revenue and profitability.
Our failure to continue to keep pace with new or improved semiconductor process technologies could impair our competitive position.
Semiconductor manufacturers constantly seek to develop new and improved semiconductor process technologies. Our future success depends in part upon our ability to continue to gain access to these semiconductor process technologies, internally or externally, in order to adapt to emerging customer requirements and competitive market conditions. We may be unable to internally develop such technologies successfully, and may be unable to gain access to them from merchant foundries or other sources on commercially reasonable terms, or at all. If we fail to remain abreast of new and improved semiconductor process technologies as they emerge, we may lose market share and our revenue and gross margin may decline, which could adversely affect our operating results.
Minor deviations in the manufacturing process can cause substantial manufacturing yield loss or even cause halts in production, which could have a material adverse effect on our revenue and gross margin.
Our products involve complexities in both their design and the semiconductor process technology employed in their fabrication. In many cases, the products are also assembled in customized packages or feature high levels of integration. Our products must meet exacting customer specifications for quality, performance and reliability.
Our manufacturing yield, or the percentage of units of a given product in a given period that is usable relative to all such units produced, is a combination of yields including wafer fabrication, assembly, and test yields. Due to the complexity of our products, we periodically experience difficulties in achieving acceptable yields as even minor deviations in the manufacturing process can cause substantial manufacturing yield loss halt production. Our customers may also test our components once they have been assembled into their products. The number of usable products that result from our production process can fluctuate as a result of many factors, including the following:
| • | design errors; |
| • | defects in photomasks, used to print circuits on wafers; |
| • | minute impurities in materials used; |
| • | contamination of the manufacturing environment; |
| • | equipment failure or variations in the manufacturing processes; |
| • | losses from broken wafers or other human error; |
| • | defects in packaging; and |
| • | issues and errors in testing. |
24
Table of Contents
Typically, for a given level of sales, when our yields improve, our gross margin improves. When our yields decrease, our unit costs are typically higher, our gross margin is lower and our profitability is adversely affected, any or all of which can harm our results of operations and lower our stock price.
We depend on third-party sales representatives and distributors for a material portion of our revenues.
We sell many of our products to customers through independent sales representatives and distributors, as well as through our direct sales force. We are unable to predict the extent to which our independent sales representatives and distributors will be successful in marketing and selling our products. Moreover, many of our independent sales representatives and distributors also market and sell competing products. Our relationships with our representatives and distributors typically may be terminated by either party at any time, and do not require them to buy any of our products. Sales to distributors accounted for approximately 20.7% of our revenue for the fiscal year ended October 2, 2015, and sales to our largest distributor, Richardson, represented 17.7% of our revenue in the same period. If our distributors cease doing business with us or fail to successfully market and sell our products, our ability to sustain and grow our revenue could be materially adversely affected.
Our internal and external manufacturing, assembly and test model subjects us to various manufacturing and supply risks.
We own and operate a semiconductor wafer processing and manufacturing facility at our headquarters in Lowell, Massachusetts, and operate a semiconductor wafer processing and manufacturing facility at our Ithaca, New York site. These facilities are also important internal design, assembly and test facilities. We maintain other internal assembly and test operation facilities as well, including leased sites in Long Beach, California, Nashua, New Hampshire and Hsinchu, Taiwan. We also use multiple external foundries for outsourced semiconductor wafer supply, as well as multiple domestic and Asian assembly and test suppliers to assemble and test our products. A number of factors will affect the future success of these internal manufacturing facilities and outsourced supply and service arrangements, including the following:
| • | the level of demand for our products; |
| • | our ability to expand and contract our facilities and purchase commitments in a timely and cost-effective manner in response to changes in demand for our products; |
| • | our ability to generate revenue in amounts that cover the significant fixed costs of operating our facilities; |
| • | our ability to qualify our facilities for new products in a timely manner; |
| • | the availability of raw materials, including GaAs, SiGe and InP substrates and high purity source materials such as gallium, aluminum, arsenic, carbon, nitrite, indium and silicon; |
| • | our manufacturing cycle times and yields; |
| • | the political and economic risks associated with our reliance on outsourced Asian assembly and test suppliers; |
| • | the location of our facilities and those of our outsourced suppliers; |
| • | natural disasters impacting our facilities and those of our outsourced suppliers; |
| • | our ability to hire, train, manage and retain qualified production personnel; |
| • | our compliance with applicable environmental and other laws and regulations; and |
| • | our ability to avoid prolonged periods of downtime or high levels of scrap in our and our suppliers’ facilities for any reason. |
If we experience issues in any of the above areas, the effectiveness of our supply chain could be adversely affected, and could harm our results of operations.
25
Table of Contents
We may experience difficulties in managing any future growth.
To successfully conduct business in a rapidly evolving market, we must effectively plan and manage any current and future growth. Our ability to do so will be dependent on a number of factors, including the following:
| • | maintaining access to sufficient manufacturing capacity to meet customer demands; |
| • | arranging for sufficient supply of key raw materials and services to avoid shortages or supply bottlenecks; |
| • | building out our administrative infrastructure at the proper pace to support any current and future sales growth while maintaining operating efficiencies; |
| • | adhering to our high quality and process execution standards, particularly as we hire and train new employees and during periods of high volume; |
| • | managing the various components of our working capital effectively; |
| • | upgrading our operational and financial systems, procedures and controls, including improvement of our accounting and internal management systems; and |
| • | maintaining high levels of customer satisfaction. |
If we do not effectively manage any future growth, we may not be able to take advantage of attractive opportunities in the markets, our operations may be impacted, and we may experience delays in delivering products to our customers or damaged customer relationships, and achieve lower than anticipated revenue and decreased profitability.
We may incur higher than expected expense from, or not realize the expected benefits, of consolidation, outsourcing and restructuring initiatives designed to reduce costs and increase revenue across our operations.
We have pursued in the past and may pursue in the future various restructuring initiatives designed to reduce costs and increase revenue across operations, including reductions in our number of manufacturing facilities, workforce reductions, establishing certain operations closer in location to our global customers and evaluating functions that may be more efficiently performed through outsourcing arrangements. These initiatives can be substantial in scope and disruptive to our operations, and they can involve large expenditures. In fiscal years 2015, 2014 and 2013, we incurred restructuring charges of $1.3 million, $14.8 million and $1.1 million, respectively, consisting primarily of employee severance and related costs resulting from reductions in our workforce. Exiting a leased site may involve contractual or negotiated exit payments with the landlord, temporary holding over at an increased lease rate, costs to perform restoration work required by the lease, or associated environmental liability, any of which may be material in amount. Consolidation of operations and outsourcing may involve substantial capital expenses and the transfer of manufacturing processes and personnel from one site to another, with resultant startup issues at the receiving site and the need for re-qualification of the transitioned operations with major customers and for ISO or other certifications. We may experience shortages of affected products, delays and higher than expected expenses. Affected employees may be distracted by the transition or may seek other employment, which could cause our overall operational efficiency to suffer. Any of these issues or our failure to realize the expected benefits of these initiatives could harm our results of operations and reduce the price of our common stock.
Our business may be harmed if systems manufacturers choose not to use components made of the compound semiconductor materials we utilize.
Silicon semiconductor technologies are the dominant process technologies for the manufacture of ICs in high-volume, commercial markets, and the performance of silicon ICs continues to improve. While we use silicon for some applications, we also often use compound semiconductor technologies such as GaAs, InP, SiGe or GaN to deliver reliable operation at higher power, higher frequency, or smaller form factor than a silicon
26
Table of Contents
solution has historically allowed. While these compound semiconductor materials offer high-performance features, it is generally more difficult to design and manufacture products with reliability and in volume using them. GaN and InP, in particular, are newer process technologies that do not have as extensive a track record of reliable performance in the field as many of the competing process technologies. Compound semiconductor technology tends to be more expensive than silicon technology due to its above-described challenges, and the generally lower volumes at which parts in those processes tend to be manufactured relative to silicon parts for high-volume consumer applications.
System designers in some markets may be reluctant to adopt our non-silicon products or may be likely to adopt silicon products in lieu of our products if silicon products meeting their demanding performance requirements are available, because of:
| • | their unfamiliarity with designing systems using our products; |
| • | their concerns related to manufacturing costs and yields; |
| • | their unfamiliarity with our design and manufacturing processes; or |
| • | uncertainties about the relative cost effectiveness of our products compared to high-performance silicon components. |
We cannot be certain that additional systems manufacturers will design our compound semiconductor products into their systems or that the companies that have utilized our products will continue to do so in the future. Improvements in the performance of available silicon process technologies and solutions could result in a loss of market share on our part. If our products fail to achieve or maintain market acceptance for any of the above reasons, our results of operations will suffer.
We are subject to risks from our international sales and operations.
We have operations in Europe, Asia and Australia, and customers around the world. In addition, in November 2015, we entered into a definitive agreement to acquire FiBest, a Japan-based merchant market component supplier of optical sub assemblies. If completed, the FiBest acquisition is expected to significantly increase our overall scope of operations and employee base in Japan. As a result, we are subject to regulatory, geopolitical and other risks associated with doing business outside the U.S. Global operations involve inherent risks, including currency controls, currency exchange rate fluctuations, tariffs, required import and export licenses, associated delays and other related international trade restrictions and regulations. Further, there is a risk that language barriers, cultural differences and other factors associated with our international operations may make them more difficult to manage effectively.
The legal system in many of the regions where we conduct business can lack transparency in certain respects relative to that of the U.S. and can accord local government authorities a higher degree of control and discretion over business than is customary in the U.S. This makes the process of obtaining necessary regulatory approvals and maintaining compliance inherently more difficult and unpredictable. In addition, the protection accorded to proprietary technology and know-how under these legal systems may not be as strong as in the U.S., and, as a result, we may lose valuable trade secrets and competitive advantages. The cost of doing business in European jurisdictions can also be higher than in the U.S. due to exchange rates, local collective bargaining regimes, and local legal requirements and norms regarding employee benefits and employer-employee relations, in particular. We are also subject to U.S. legal requirements related to our foreign operations, including the Foreign Corrupt Practices Act.
Sales to customers located outside the U.S. accounted for 63.6% of our revenue for the fiscal year ended October 2, 2015. We expect that revenue from international sales will continue to be a significant part of our total revenue. Because the majority of our foreign sales are denominated in U.S. dollars, our products become less price-competitive in countries with currencies that are low or are declining in value against the U.S. dollar. Also, we cannot be sure that our international customers will continue to accept orders denominated in U.S. dollars. If they do not, our reported revenue and earnings will become more directly subject to foreign exchange
27
Table of Contents
fluctuations. Some of our customer purchase orders and agreements are governed by foreign laws, which may differ significantly from U.S. laws. We may be limited in our ability to enforce our rights under such agreements and to collect amounts owed to us.
The majority of our assembly, packaging and test vendors are located in Asia. We generally do business with our foreign assemblers in U.S. dollars. Our manufacturing costs could increase in countries with currencies that are increasing in value against the U.S. dollar. Also, our international manufacturing suppliers may not continue to accept orders denominated in U.S. dollars. If they do not, our costs will become more directly subject to foreign exchange fluctuations. From time to time we may attempt to hedge our exposure to foreign currency risk by buying currency contracts or otherwise, and any such efforts involve expense and associated risk that the currencies involved may not behave as we expect, and we may lose money on such hedging strategies or not properly hedge our risk.
In addition, if terrorist activity, armed conflict, civil, economic or military unrest, embargoes or other economic sanctions or political instability occurs in the U.S. or other locations, such events may disrupt our manufacturing, assembly, logistics, security and communications, and could also result in reduced demand for our products. We have in the past and, may again in the future, experience difficulties relating to employees traveling in and out of countries facing civil unrest or political instability, and with obtaining travel visas for our employees. Major health pandemics could also adversely affect our business and our customer order patterns. We could also be affected if labor issues disrupt our transportation arrangements or those of our customers or suppliers. There can be no assurance that we can mitigate all identified risks with reasonable effort. The occurrence of any of these events could have a material adverse effect on our operating results.
If we fail to comply with export control regulations we could be subject to substantial fines or other sanctions, including loss of export privileges.
Certain of our products are subject to the Export Administration Regulations, administered by the Department of Commerce, Bureau of Industry Security, which require that we obtain an export license before we can export products or technology to specified countries. Other products are subject to the International Traffic in Arms Regulations, which restrict the export of information and material that may be used for military or intelligence applications by a foreign person. U.S. regulators have announced “export control reform” that has changed and is expected to change many of the rules applicable to us in this area in the future in ways we do not yet fully understand, and we have experienced and will continue to experience challenges in complying with the new rules as they become effective, resulting in difficulties or an inability to ship products to certain countries and customers.
We are also subject to U.S. import regulations and the import and export regimes of other countries in which we operate. Failure to comply with these laws could result in sanctions by the government, including substantial monetary penalties, denial of export privileges and debarment from government contracts. Export and import regulations may create delays in the introduction of our products in international markets, or prevent the export or import of our products to certain countries or customers altogether. Any change in export or import regulations or related legislation, shift in approach by regulators to the enforcement or scope of existing regulations, changes in the interpretation of existing regulations by regulators or change in the countries, persons or technologies targeted by such regulations, could harm our business by resulting in decreased use of our products by, or our decreased ability to export or sell our products to, existing or potential customers with international operations. In addition, our sale of our products to or through third-party distributors, resellers and sales representatives creates the risk that any violation of these laws they may engage in may cause disruption in our markets or otherwise bring liability on us.
Our business may be adversely affected if we experience product returns, product liability and defects claims.
Our products are complex and frequently operate in high-performance, challenging environments. We may not be able to anticipate all of the possible performance or reliability problems that could arise with our products after they are released to the market. If such problems occur or become significant, we may experience reduced revenue and increased costs related to product recalls, inventory write-offs, warranty or damage claims, delays in, cancellations of, or returns of product orders and other expenses. The many materials and vendors used in the
28
Table of Contents
manufacture of our products increase the risk that some defects may escape detection in our manufacturing process and subsequently affect our customers, even in the case of long-standing product designs. Our use of newly-developed or less mature semiconductor process technologies, such as GaN and InP, which have a less extensive track record of reliability in the field than other more mature process technologies, also increases the risk of performance and reliability problems. These matters have arisen in our operations from time to time in the past, have resulted in significant expense to us per occurrence, and will likely occur again in the future. The occurrence of defects could result in product returns and liability claims, reduced product shipments, the loss of customers, the loss of or delay in market acceptance of our products, harm to our reputation, diversion of management’s time and resources, lower revenue, higher expenses and reduced profitability. Any warranty or other rights we may have against our suppliers for quality issues caused by them may be more limited than those our customers have against us, based on our relative size, bargaining power, or otherwise. In addition, even if we ultimately prevail, such claims could result in costly litigation, divert management’s time and resources and damage our customer relationships.
We also face exposure to potential liability resulting from the fact that some of our customers integrate our products into consumer products such as automobiles or mobile communication devices, which are then sold to consumers in the marketplace. We may be named in product liability claims even if there is no evidence that our products caused a loss. Product liability claims could result in significant expenses in connection with the defense of such claims and possible damages. In addition, we may be required to participate in a recall if our products prove to be defective. Any product recall or product liability claim brought against us, particularly in high-volume consumer markets, could have a material negative impact on our reputation, business, financial condition or results of operations.
The outcome of litigation in which we are involved in is unpredictable and an adverse decision in any such matter could subject us to damage awards and lower the market price of our stock.
From time to time we are a party to litigation matters such as those described in “Item 3—Legal Proceedings” below. These and any other future disputes, litigations, investigations, administrative proceedings or enforcement actions we may be involved in may divert financial and management resources that would otherwise be used to benefit our operations, result in negative publicity and harm our customer or supplier relationships. Although we intend to contest such matters vigorously, we cannot assure you that their outcome will be favorable to us. An adverse resolution of any such matter in the future, including the results of any amicable settlement, could subject us to material damage awards or settlement payments or otherwise materially harm our business.
Our financial results may be adversely affected by increased tax rates and exposure to additional tax liabilities.
Our effective tax rate is highly dependent upon the geographic composition of our worldwide earnings and tax regulations governing each region, each of which can change from period to period. We are subject to income taxes in both the U.S. and various foreign jurisdictions, and significant judgment is required to determine our worldwide tax liabilities. Our effective tax rate as well as the actual tax ultimately payable could be adversely affected by changes in the amount of our earnings attributable to countries with differing statutory tax rates, changes in the valuation of our deferred tax assets, changes in tax laws or tax rates (particularly in the U.S. or Ireland), increases in non-deductible expenses, the availability of tax credits, material audit assessments, or repatriation of non-U.S. earnings, each of which could materially affect our profitability. Any significant increase in our effective tax rates could materially reduce our net income in future periods and decrease the value of your investment in our common stock.
Changes in tax laws are introduced from time to time to reform U.S. taxation of international business activities. Depending on the final form of legislation enacted, if any, these consequences may be significant for us due to the large scale of our international business activities. If any of these proposals are enacted into legislation, they could have material adverse consequences on the amount of tax we pay and, thereby, on our financial position and results of operations.
29
Table of Contents
We face risks associated with government contracting.
Some of our revenue is derived from contracts with agencies of the U.S. government or subcontracts with its prime contractors. Under some of our government subcontracts, we are required to maintain secure facilities and to obtain security clearances for personnel involved in performance of the contract, in compliance with applicable federal standards. If we were unable to comply with these requirements, or if personnel critical to our performance of these contracts were to lose their security clearances, we might be unable to perform these contracts or compete for other projects of this nature, which could adversely affect our revenue.
Our limited ability to protect our proprietary information and technology may adversely affect our ability to compete.
Our future success and ability to compete is dependent in part upon our protection of our proprietary information and technology through patent filings and otherwise. We cannot be certain that any patents we apply for will be issued or that any claims allowed from pending applications will be of sufficient scope or strength to provide meaningful protection or commercial advantage. Our competitors may also be able to design around our patents. The laws of some countries in which our products are or may be developed, manufactured, or sold, may not protect our products or intellectual property rights to the same extent as U.S. laws, increasing the possibility of piracy of our technology and products. Although we intend to vigorously defend our intellectual property rights, we may not be able to prevent misappropriation of our technology or may need to expend significant financial and other resources in defending our rights.
In addition, we rely on trade secrets, technical know-how and other unpatented proprietary information relating to our product development and manufacturing activities. We try to protect this information by entering into confidentiality agreements with employees and other parties. We cannot be sure that these agreements will be adequate and will not be breached, that we would have adequate remedies for any breach or that our trade secrets and proprietary know-how will not otherwise become known or independently discovered by others.
Additionally, our competitors may independently develop technologies that are substantially equivalent or superior to our technology. Despite our efforts to protect our proprietary rights, unauthorized parties may attempt to copy, or otherwise obtain or use our products or technology. Patent litigation is expensive, and our ability to enforce our patents and other intellectual property, is limited by our financial resources and is subject to general litigation risks. If we seek to enforce our rights, we may be subject to claims that the intellectual property rights are invalid, are otherwise not enforceable, or are licensed to the party against whom we assert a claim. In addition, our assertion of intellectual property rights could result in the other party seeking to assert alleged intellectual property rights of its own against us, which is a frequent occurrence in such litigations.
We may need to modify our activities or incur substantial costs to comply with environmental laws, and if we fail to comply with environmental laws we could be subject to substantial fines or be required to change our operations.
We are subject to a variety of international, federal, state and local governmental regulations directed at preventing or mitigating climate change and other environmental harms, as well as to the storage, discharge, handling, generation, disposal and labeling of toxic or other hazardous substances used to manufacture our products. If we fail to comply with these regulations, substantial fines could be imposed on us, and we could be required to suspend production, alter manufacturing processes, cease operations or remediate polluted land, air or groundwater, any of which could have a negative effect on our revenue, results of operations and business. Failure to comply with environmental regulations could subject us to civil or criminal sanctions and property damage or personal injury claims. Compliance with current or future environmental laws and regulations could restrict our ability to expand our facilities or build new facilities, or require us to acquire additional expensive equipment, modify our manufacturing processes, or incur other substantial expenses which could harm our business, financial condition and results of operations. In addition, under some of these laws and regulations, we
30
Table of Contents
could be held financially responsible for remedial measures if our properties or, those nearby are contaminated, even if we did not cause the contamination. We have incurred in the past and may in the future incur environmental liability based on the actions of prior owners, lessees or neighbors of sites we have leased or may lease in the future, or sites we become associated with due to acquisitions. We cannot predict:
| • | changes in environmental or health and safety laws or regulations; |
| • | the manner in which environmental or health and safety laws or regulations will be enforced, administered or interpreted; |
| • | our ability to enforce and collect under any indemnity agreements and insurance policies relating to environmental liabilities; or |
| • | the cost of compliance with future environmental or health and safety laws or regulations or the costs associated with any future environmental claims, including the cost of clean-up of currently unknown environmental conditions. |
In addition to the costs of complying with environmental, health and safety requirements, we may in the future incur costs defending against environmental litigation brought by government agencies, lessors at sites we currently lease or have been associated with in the past and other private parties. We may be defendants in lawsuits brought by parties in the future alleging environmental damage, personal injury or property damage. A significant judgment or fine levied against us, or agreed settlement payment, could materially harm our business, financial condition and results of operations.
Environmental regulations such as the WEEE and RoHS directives limit our flexibility and may require us to incur material expense.
Various countries require companies selling a broad range of electrical equipment to conform to regulations such as the Waste Electrical and Electronic Equipment (WEEE) and the European Directive 2002/95/Ec on Restriction of Hazardous Substances (RoHS). New environmental standards such as these could require us to redesign our products in order to comply with the standards, require the development of compliance administration systems or otherwise limit our flexibility in running our business or require us to incur substantial compliance costs. For example, RoHS requires that certain substances be removed from most electronic components. The WEEE directive makes producers of electrical and electronic equipment financially responsible for specified collection, recycling, treatment and disposal of past and future covered products. We have already invested significant resources into complying with these regimes, and further investments may be required. Alternative designs implemented in response to regulation may be more costly to produce, resulting in an adverse effect on our gross profit margin. If we cannot develop compliant products in a timely fashion or properly administer our compliance programs, our revenue may also decline due to lower sales, which would adversely affect our operating results. Further, if we were found to be non-compliant with any rule or regulation, we could be subject to fines, penalties and/or restrictions imposed by government agencies that could adversely affect our operating results.
Our term loan and revolving credit facility could result in outstanding debt with a claim to our assets that is senior to that of our stockholders, and may have other adverse effects on our results of operations.
As of October 2, 2015, we have a term loan outstanding of $345.6 million and a revolving credit facility with $130.0 million of available borrowing capacity. The facility is secured by a first priority lien on our assets and those of our domestic subsidiaries. The amount of our indebtedness could have important consequences, including the following:
| • | our ability to obtain additional financing in the future for working capital, capital expenditures, acquisitions, general corporate or other purposes may be limited; |
| • | our ability to make distributions to our stockholders in a sale or liquidation until any balance on the line is repaid in full; |
31
Table of Contents
| • | we may be more vulnerable to economic downturns, less able to withstand competitive pressures and less flexible in responding to changing business and economic conditions; |
| • | our cash flow from operations will be allocated to the payment of the principal of, and interest on, any outstanding indebtedness; and |
| • | we cannot assure you that our business will generate sufficient cash flow from operations or other sources to enable us to meet our payment obligations under the facility and to fund other liquidity needs. |
Our credit facility also contains certain restrictive covenants that may limit or eliminate our ability to, among other things, incur additional debt, sell, lease or transfer our assets, pay dividends, make investments and loans, make acquisitions, guarantee debt or obligations, create liens, enter into transactions with our affiliates, enter into new lines of business and enter into certain merger, consolidation or other reorganizations transactions. These restrictions could limit our ability to withstand downturns in our business or the economy in general or to take advantage of business opportunities that may arise, any of which could place us at a competitive disadvantage relative to our competitors that are not subject to such restrictions. If we breach a loan covenant, the lenders could either refuse to lend funds to us or accelerate the repayment of any outstanding borrowings under the credit facility. We might not have sufficient assets to repay such indebtedness upon a default. If we are unable to repay the indebtedness, the lenders could initiate a bankruptcy proceeding against us or collection proceedings with respect to our subsidiaries securing the facility, which could materially decrease the value of our common stock.
Customer demands and regulations related to “conflict” minerals may force us to incur additional expenses and liabilities.
In August 2012, the SEC adopted its final rule to implement Section 1502 of the Dodd-Frank Wall Street Reform and Consumer Protection Act regarding disclosure and reporting requirements for companies who use “conflict” minerals mined from the Democratic Republic of Congo and adjoining countries in their products. In the semiconductor industry, these minerals are most commonly found in metals used in the manufacture of semiconductor devices and related assemblies. These requirements may adversely affect our ability to source related minerals and metals and increase our related cost. We face difficulties and increased expense associated with complying with the related disclosure requirements, such as costs related to determining the source of any conflict minerals used in our products. Continued timely reporting is dependent upon the improvement and implementation of new systems and processes and information supplied by our suppliers of products that contain, or potentially contain, conflict minerals. Our supply chain is complex, and some suppliers may be unwilling to share related confidential information regarding the source of their products, or may provide us information that is inaccurate or inadequate. If those risks arise, or if our processes in obtaining that information do not fulfill the SEC’s requirements, we may face both reputational challenges and SEC enforcement risks based on our inability to sufficiently verify the origins of the subject minerals and metals or otherwise. More recently, executive orders issued by the President of the U.S. have increased sanctions in this area as well, which may impact us in the scenarios described above. Moreover, we may encounter challenges to satisfy any related requirements of our customers, which may be different from or more onerous than the requirements of the related SEC rules and executive orders. If we cannot satisfy these customers, they may choose a competitor’s products or may choose to disqualify us as a supplier, and we may experience lower than expected revenues or have to write off inventory in the event that it becomes unsalable as a result of these regulations.
We are a holding company and rely on dividends, distributions and other payments, advances and transfers of funds from our subsidiaries to meet our obligations.
As a holding company, we derive substantially all of our cash flow from our subsidiaries. Because we conduct our operations through our subsidiaries, we depend on those entities for dividends and other payments or distributions to meet our operating needs. Legal and contractual restrictions in any existing and future
32
Table of Contents
outstanding indebtedness we or our subsidiaries incur may limit our ability to obtain cash from our subsidiaries. The deterioration of the earnings from, or other available assets of, our subsidiaries for any reason could limit or impair their ability to pay dividends or other distributions to us.
Variability in self-insurance liability estimates could adversely impact our results of operations.
We self-insure for employee health insurance and workers’ compensation insurance coverage up to a predetermined level, beyond which we maintain stop-loss insurance from a third-party insurer. Our aggregate exposure varies from year to year based upon the number of participants in our insurance plans. We estimate our self-insurance liabilities using an analysis provided by our claims administrator and our historical claims experience. Our accruals for insurance reserves reflect these estimates and other management judgments, which are subject to a high degree of variability. If the number or severity of claims for which we self-insure increases, it could cause a material and adverse change to our reserves for self-insurance liabilities, as well as to our earnings.
We may be subject to liabilities based on alleged links between the semiconductor manufacturing process and certain illnesses and birth defects.
In recent years, there has been increased media scrutiny and associated reports regarding a potential link between working in semiconductor manufacturing clean room environments and birth defects and certain illnesses, primarily cancer. Regulatory agencies and industry associations have begun to study the issue to determine if any actual correlation exists. Because we utilize clean rooms, we may become subject to liability claims alleging personal injury. In addition, these reports may also affect our ability to recruit and retain employees. A significant judgment against us or material defense costs could harm our reputation, business, financial condition and results of operations.
We rely on third parties to provide corporate infrastructure services necessary for the operation of our business. Any failure of one or more of our vendors to provide these services could have a material adverse effect on our business.
We rely on third-party vendors to provide critical corporate infrastructure services, including, among other things, certain services related to information technology and network development and monitoring. We depend on these vendors to ensure that our corporate infrastructure will consistently meet our business requirements. The ability of these third-party vendors to successfully provide reliable, high quality services is subject to technical and operational uncertainties that are beyond our control. While we may be entitled to damages if our vendors fail to perform under their agreements with us, our agreements with these vendors limit the amount of damages we may receive. In addition, we do not know whether we will be able to collect on any award of damages or that any such damages would be sufficient to cover the actual costs we would incur as a result of any vendor’s failure to perform under its agreement with us. Any failure of our corporate infrastructure could have a material adverse effect on our business, financial condition and results of operations. Upon expiration or termination of any of our agreements with third-party vendors, we may not be able to replace the services provided to us in a timely manner or on terms and conditions, including service levels and cost, that are favorable to us, and a transition from one vendor to another vendor could subject us to operational delays and inefficiencies until the transition is complete.
Our business and operations could suffer in the event of a security breach or other cybersecurity incident.
Cyber attacks and attempts by others to gain unauthorized access to our information technology systems are becoming more sophisticated and may be successful. These attempts, which might be related to industrial or other espionage, include covertly introducing malware to our computers and networks and impersonating authorized users, among others. We seek to detect and investigate all security incidents and to prevent their recurrence, but in some cases, we might be unaware of an incident or its magnitude and effects. The theft,
33
Table of Contents
unauthorized use or publication of our intellectual property and/or confidential business information could harm our competitive position, reduce the value of our investment in research and development and other strategic initiatives or otherwise adversely affect our business and reputation. To the extent that any security breach impacts the operation of our products in the field, or results in inappropriate disclosure of our customers’ confidential information, we may incur liability, reputational damage or impaired business relationships as a result, which could harm our business. While we expect to continually invest in additional resources and services to bolster the security of our information technology systems, no amount of investment will eliminate these risks entirely.
Our ability to utilize our net operating loss carryforwards and certain other tax attributes may be limited.
Although we currently do not have reason to believe that any of our net operating loss carryforwards will expire unutilized, under Section 382 of the Internal Revenue Code, if a corporation undergoes an “ownership change,” the corporation’s ability to use its pre-change net operating loss carryforwards and other pre-change tax attributes to offset its post-change income may be significantly limited. An ownership change is generally defined as a greater than 50% change in equity ownership by value over a three year period. We may experience such an ownership change in the future as a result of shifts in our stock ownership, including upon the issuance of our common stock, the exercise of stock options or warrants or as a result of any conversion of our convertible notes into shares of our common stock, among other things. If we were to trigger an ownership change in the future, our ability to use any net operating loss carryforwards existing at that time could be limited, resulting in higher than anticipated taxes payable and lower than expected net income and earnings per share.
Risks Relating to Ownership of our Common Stock
We may engage in future capital-raising transactions that dilute the ownership of our existing stockholders or cause us to incur debt.
We may issue additional equity, debt or convertible securities to raise capital in the future. If we do, existing stockholders may experience significant further dilution. In addition, new investors may demand rights, preferences or privileges that differ from, or are senior to, those of our existing stockholders. Our incurrence of indebtedness could limit our operating flexibility and be detrimental to our results of operations.
The market price of our common stock may be volatile, which could result in substantial losses for investors.
We cannot predict the prices at which our common stock will trade. The market price of our common stock may fluctuate significantly, depending upon many factors, some of which may be beyond our control. In addition to the risks described in this Annual Report, other factors that may cause the market price of our common stock to fluctuate include:
| • | changes in general economic, industry and market conditions; |
| • | domestic and international economic factors unrelated to our performance; |
| • | actual or anticipated fluctuations in our quarterly operating results; |
| • | changes in or failure to meet publicly disclosed expectations as to our future financial performance, as was the case in August 2012 when the trading price of our common stock declined approximately 21% on the day following our public announcement of lower than expected revenue, gross margin and business outlook figures; |
| • | changes in securities analysts’ estimates of our financial performance or lack of research and reports by industry analysts; |
| • | changes in market valuations or earnings of similar companies; |
| • | addition or loss of significant customers; |
34
Table of Contents
| • | announcements by us or our competitors, customers or suppliers of significant products, contracts, acquisitions, strategic partnerships or other events; |
| • | developments or disputes concerning patents or proprietary rights, including any injunction issued or material sums paid for damage awards, settlement payments, license fees, attorney’s fees or other litigation expenses associated with intellectual property lawsuits we may initiate, or in which we may be named as defendants; |
| • | failure to complete significant sales or to win a competitive selection process; |
| • | developments concerning current or future strategic alliances or acquisitions; |
| • | any future sales of our common stock or other securities; and |
| • | additions or departures of directors, executives or key personnel. |
Furthermore, the stock markets recently have experienced price and volume fluctuations that have affected and continue to affect the market prices of equity securities of many companies. These fluctuations often have been unrelated or disproportionate to the operating performance of those companies. These broad market and industry fluctuations, as well as general economic, political, and market conditions such as recessions, interest rate changes or international currency fluctuations, may negatively impact the market price of our common stock. In the past, companies that have experienced volatility in the market price of their stock have been subject to securities class action litigation. We may be the target of this type of litigation in the future. Securities litigation against us could result in substantial costs and divert our management’s attention from other business concerns, which could seriously harm our business.
If securities or industry analysts do not publish research or reports about our business, or publish negative reports about our business, our stock price and trading volume could decline.
The trading market for our common stock may depend on the research and reports that securities or industry analysts publish about us or our business. We do not have any control over these analysts. If one or more of the analysts who cover us downgrade our common stock or change their opinion of our common stock, our stock price would likely decline. If one or more of these analysts cease their coverage of us or fail to regularly publish reports on us, we could lose visibility in the financial markets, which could cause our stock price or trading volume to decline.
Our common stock price may decline if a substantial number of shares are sold in the market by our stockholders.
Future sales of substantial amounts of shares of our common stock by our existing stockholders in the public market, or the perception that these sales could occur, may cause the market price of our common stock to decline. Increased sales of our common stock in the market for any reason could exert significant downward pressure on our stock price. These sales also might make it more difficult for us to sell equity or equity-related securities in the future at a time and price we deem appropriate.
We are no longer a “controlled company” within the meaning of the rules of the NASDAQ Global Select Market (NASDAQ), and we are now subject to additional governance requirements under the NASDAQ rules.
Following our public common stock offering on February 5, 2015 (the Offering), John and Susan Ocampo and their affiliates no longer control more than 50% of our common stock and, consequently, we are no longer a “controlled company” within the meaning of the NASDAQ listing requirements. As a result, we are now subject to additional governance requirements under NASDAQ rules, including the requirements to have:
| • | a majority of the board of directors consist of independent directors; and |
| • | certain compensation committee and nominating and governance committee requirements. |
35
Table of Contents
The NASDAQ rules provide for phase-in periods for these requirements, but we must be fully compliant with the new requirements within one year following the consummation of the Offering. Currently, we do not have a majority of independent directors. During the current transition period following our ceasing to be a “controlled company,” our stockholders may not have the same protections afforded to stockholders of companies that are subject to all of the NASDAQ corporate governance requirements, such as a majority of independent directors. If within the one-year phase-in period we are not able to recruit additional directors that qualify as independent, or otherwise comply with NASDAQ listing requirements, we may be subject to enforcement actions by NASDAQ. In addition, these changes in the board of directors and committee membership may result in a change in corporate strategy and operating philosophies, and may result in deviations from our current growth strategy.
Our management has identified a material weakness in our internal control over financial reporting. If we fail to maintain effective internal control over financial reporting, we may not be able to accurately report our financial results, which could have a material adverse effect on our operations, investor confidence in our business and the trading prices of our securities.
As disclosed in “Item 9A—Controls and Procedures” below, our management identified a material weakness in our internal control over financial reporting related to our information technology general controls in the areas of user access and program change management for certain information technology systems that comprise part of our system of internal control over financial reporting and are relevant to the preparation of our consolidated financial statements. A material weakness is defined as a deficiency, or a combination of deficiencies, in internal control over financial reporting, such that there is a reasonable possibility that a material misstatement of our annual or interim financial statements will not be prevented or detected on a timely basis. As a result of this material weakness, our Chief Executive Officer and Chief Financial Officer concluded that our internal control over financial reporting was not effective as of the last day of the period covered by this Annual Report.
We are actively engaged in developing a remediation plan designed to address this material weakness. If our remediation efforts are insufficient to address the identified material weakness or if additional material weaknesses in our internal controls are discovered in the future, they may adversely affect our ability to record, process, summarize and report financial information timely and accurately and, as a result, our financial statements may contain material misstatements or omissions, which could result in regulatory scrutiny, cause investors to lose confidence in our reported financial condition and otherwise have a material adverse effect on our business, financial condition, cash flow results of operations or the trading price of our stock.
Some of our stockholders can exert control over us, and they may not make decisions that reflect our interests or those of other stockholders.
Our largest stockholders control a significant amount of our outstanding common stock. As of October 2, 2015, John and Susan Ocampo beneficially owned 43.1% of our common stock and certain investment funds affiliated with Summit Partners, L.P. owned 14.3% of our common stock on an as-converted basis. As a result, these stockholders will be able to exert a significant degree of influence over our management and affairs and control over matters requiring stockholder approval, including the election of our directors and approval of significant corporate transactions. In addition, this concentration of ownership may delay or prevent a change in control of us and might affect the market price of our securities. In addition, the interests of these stockholders may not always coincide with your interests or the interests of other stockholders.
Anti-takeover provisions in our charter documents and Delaware law could prevent or delay a change in control of our company that stockholders may consider beneficial and may adversely affect the price of our stock.
Provisions of our fourth amended and restated certificate of incorporation and second amended and restated bylaws may discourage, delay or prevent a merger, acquisition or change of control that a stockholder may consider favorable. These provisions could also discourage proxy contests and make it more difficult for stockholders to elect directors and take other corporate actions. The existence of these provisions could limit the price that investors might be willing to pay in the future for shares of our common stock. These provisions include authorizing the issuance of “blank check” preferred stock, staggered elections of directors, and
36
Table of Contents
establishing advance notice requirements for nominations for election to the board of directors and for proposing matters to be submitted to a stockholder vote. Provisions of Delaware law may also discourage, delay or prevent someone from acquiring or merging with our company or obtaining control of our company. Specifically, Section 203 of the Delaware General Corporate Law may prohibit business combinations with stockholders owning 15% or more of our outstanding voting stock. Our Board of Directors could rely on Delaware law to prevent or delay an acquisition of us and this reliance could reduce our value.
We do not intend to pay dividends for the foreseeable future.
We do not intend to pay any cash dividends on our common stock in the foreseeable future. The payment of cash dividends is restricted under the terms of the agreements governing our indebtedness. In addition, because we are a holding company, our ability to pay cash dividends may be limited by restrictions on our ability to obtain sufficient funds through dividends from subsidiaries. We anticipate that we will retain all of our future earnings for use in the development of our business and for general corporate purposes. Any determination to pay dividends in the future will be at the discretion of our board of directors. Accordingly, investors must rely on sales of their common stock after price appreciation, which may never occur, as the only way to realize any future gains on their investments.
ITEM 1B. UNRESOLVED STAFF COMMENTS.
None.
For additional information regarding property, plant and equipment by geographic region for each of the last two fiscal years, see Notes to Consolidated Financial Statements in Item 8 below.
Our principal executive offices are located in Lowell, Massachusetts. In June 2015, we purchased our corporate headquarters and fabrication facilities including the associated land, improvements, leases and leasehold property, for approximately $8.3 million. Prior to the purchase, we leased the 157,600 square foot facility from Cobham Properties, Inc., and concurrently with the closing of the purchase, the lease was terminated. Also, we maintain leased facilities for our design centers located in Massachusetts, California, North Carolina, New York, Rhode Island, Ireland, the United Kingdom, France, and Australia as well as for our administrative, assembly and test operations located in New Hampshire and Taiwan, and our local sales offices in Oregon, Canada, Germany, Malaysia, China, Japan, India, and South Korea. We believe that our leased facilities are adequate for our present operations. The following is a list of our main leased facilities and their primary functions.
| Site |
Major Activity |
Square Footage | Lease Expiration | |||
| Lowell, Massachusetts |
Administration, Research and Development, Application Engineering |
60,700 | December 2022 | |||
| Newport Beach, California |
Administration, Research and Development, Sales and Marketing | 88,160 | December 2019 | |||
| Long Beach, California |
Administration, Assembly and Test, Research and Development, Sales and Marketing | 25,317 | January 2018 | |||
| Ithaca, New York |
Administration, Production and Fabrication, Test and Assembly | 20,600 | December 2025 | |||
| Cork, Ireland |
Administration, Research and Development, Sales and Marketing, Application Engineering, Reliability Testing | 21,634 | April 2017 | |||
37
Table of Contents
From time to time we may be subject to commercial and employment disputes, claims by other companies in the industry that we have infringed their intellectual property rights and other similar claims and litigations. Any such claims may lead to future litigation and material damages and defense costs. Other than as set forth below, we were not involved in any pending legal proceedings as of the filing date of this Annual Report that we believe could have a material adverse effect on our business, operating results, financial condition or cash flows.
Patent Suit Against Laird. On February 11, 2014, we brought a patent infringement suit against Laird Technologies, Inc. (Laird) in the Federal District Court for the District of Delaware, seeking monetary damages and a permanent injunction. The suit alleged that Laird infringed on our United States Patent No. 6,272,349 (‘349 Patent), titled “Integrated Global Positioning System Receiver,” by making, using, selling, offering to sell or selling products incorporating an integrated global positioning receiver that include structure(s) recited in the ‘349 Patent, including global positioning system modules for Automotive industry customers. The court entered a preliminary injunction against Laird on June 13, 2014. On April 15, 2015, the parties reached a confidential settlement agreement, filed a stipulated permanent injunction with the court that is similar in scope to the preliminary injunction, and filed a stipulated dismissal of all claims. The permanent injunction and dismissal were entered on April 21, 2015 by the court.
Class Action Suit Against Mindspeed Technologies, Inc. On March 10, 2015, Philip Alvarez, a former employee of Mindspeed filed a putative class action lawsuit against Mindspeed in the Superior Court of California for the County of Orange. On April 24, 2015, Alvarez filed a First Amended Complaint adding our subsidiary M/A-COM Technology Solutions Inc. as a defendant. The lawsuit alleged, among other things, that Alvarez and certain other employees who designed and manufactured hardware systems for Mindspeed or M/A-COM Technology Solutions Inc. between March 10, 2011 and the present were misclassified as exempt employees under California law. The lawsuit seeks recovery of alleged unpaid overtime wages, meal and rest period premiums, penalties and attorneys’ fees. We dispute the allegations of the lawsuit. On June 15, 2015, Mindspeed removed the action to the United States District Court for the Central District of California. On July 15, 2015, Plaintiff filed a Motion to Remand, which Motion was denied in an Order dated September 9, 2015. The parties have reached an agreement for the dismissal of all class action allegations and claims in the action, as well as certain other claims against Mindspeed and M/A-COM Technology Solutions Inc. The parties have stipulated to the filing of a Second Amended Complaint that effectuates this agreement, and are awaiting order by the Court on that stipulation. After the Second Amended Complaint is filed, the matter will proceed as an individual action by Alvarez seeking only his personal claims, as well as claims under the Private Attorneys’ General Act.
With respect to the above and other legal proceedings, we have not been able to reasonably estimate the amount or range of any possible loss, and accordingly has not accrued or disclosed any related amounts of possible loss in the accompanying consolidated financial statements.
ITEM 4. MINE SAFETY DISCLOSURES.
Not applicable.
38
Table of Contents
ITEM 5. MARKET FOR REGISTRANT’S COMMON EQUITY, RELATED STOCKHOLDER MATTERS AND ISSUER PURCHASES OF EQUITY SECURITIES.
Our common stock has been listed on the NASDAQ Global Select Market under the symbol “MTSI” since March 15, 2012. The following table sets forth for the periods indicated the high and low sale prices of our common stock on the NASDAQ Global Select Market. The number of stockholders of record of our common stock as of November 16, 2015 was approximately 14.
The high and low sales prices of our common stock by quarter in fiscal year 2015 and fiscal year 2014 follows:
| High | Low | |||||||
| Fiscal Year 2015: |
||||||||
| First quarter |
$ | 32.80 | $ | 18.23 | ||||
| Second quarter |
39.52 | 27.64 | ||||||
| Third quarter |
42.81 | 29.85 | ||||||
| Fourth quarter |
36.51 | 25.82 | ||||||
| High | Low | |||||||
| Fiscal Year 2014: |
||||||||
| First quarter |
$ | 18.25 | $ | 13.20 | ||||
| Second quarter |
21.70 | 15.43 | ||||||
| Third quarter |
23.44 | 15.76 | ||||||
| Fourth quarter |
25.70 | 19.04 | ||||||
We have not paid cash dividends on our common stock and we do not anticipate paying cash dividends in the foreseeable future. Our credit facility also contains restrictions on our ability to pay cash dividends, subject to certain exceptions.
39
Table of Contents
Stock Price Performance Graph
The following graph shows a comparison from March 15, 2012 (the date our common stock commenced trading on NASDAQ) through October 2, 2015 of the total cumulative return of our common stock with the total cumulative return of the NASDAQ Composite Index and the PHLX Semiconductor Index. The amounts represented below assume an investment of $100 in our common stock at the closing price of $20.55 on March 15, 2012 and in the NASDAQ Composite Index and the PHLX Semiconductor Index on the closest month end date of February 29, 2012, and assume reinvestment of dividends. The comparisons in the graph are historical and are not intended to forecast or be indicative of possible future performance of our common stock.
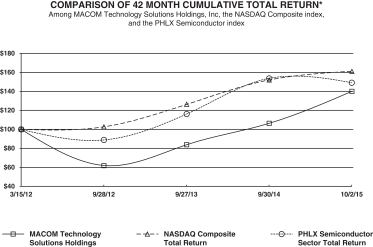
| March 15, 2012 |
September 28, 2012 |
September 27, 2013 |
October 3, 2014 |
October 2, 2015 |
||||||||||||||||
| M/A-COM Technology Solutions Holdings, Inc. |
$ | 100.00 | $ | 61.80 | $ | 83.75 | $ | 106.28 | $ | 140.00 | ||||||||||
| NASDAQ Composite Index |
$ | 100.00 | $ | 102.61 | $ | 126.30 | $ | 151.94 | $ | 161.04 | ||||||||||
| PHLX Semiconductor Index |
$ | 100.00 | $ | 88.74 | $ | 116.04 | $ | 153.64 | $ | 149.08 | ||||||||||
Issuer Purchases of Equity Securities
| Period |
Total Number of Shares (or Units) Purchased (1) |
Average Price Paid per Share (or Unit) |
Total Number of Shares (or Units) Purchased as Part of Publicly Announced Plans or Programs |
Maximum Number (or Approximate Dollar Value) of Shares (or Units) that May Yet Be Purchased Under the Plans or Programs |
||||||||||||
| July 4, 2015 — July 31, 2015 |
512 | $ | 32.39 | — | — | |||||||||||
| August 1, 2015 — August 28, 2015 |
1,577 | 32.60 | — | — | ||||||||||||
| August 29, 2015 — October 2, 2015 |
219 | 30.06 | — | — | ||||||||||||
|
|
|
|
|
|
|
|
|
|||||||||
| Total |
2,308 | $ | 32.31 | — | — | |||||||||||
|
|
|
|
|
|
|
|
|
|||||||||
| (1) | In 2011, our Board of Directors approved “withhold to cover” as a tax payment method for vesting of restricted stock awards for our employees. Pursuant to an election for “withhold to cover” made by our employees in connection with the vesting of such awards, all of which were outside of a publicly-announced repurchase plan, we withheld from such employees the shares noted in the table above to cover tax withholding related to the vesting of their awards. The average prices listed in the above table are averages of the fair market prices at which we valued shares withheld for purposes of calculating the number of shares to be withheld. |
40
Table of Contents
ITEM 6. SELECTED FINANCIAL DATA.
You should read the following selected financial data in conjunction with our consolidated financial statements and related notes, as well as “Item 1—Risk Factors” and “Item 7—Management’s Discussion and Analysis of Financial Condition and Results of Operations” appearing elsewhere in this Annual Report.
In August 2015, we divested our Automotive business to Autoliv based on our belief that the business was not consistent with our long-term strategic vision from either a growth or profitability perspective. We believe divesting our Automotive business will enable us to realize our potential as a high-performance analog company and will allow us to focus on growing our retained core businesses. Certain amounts contained within our Consolidated Financial Statements have been reclassified to reflect adjustments related to the discontinued operations of our Automotive business. Refer to Note 19, to the Consolidated Financial Statements for additional information.
On December 15, 2014, we completed the acquisition of BinOptics, a supplier of high-performance photonic semiconductor products. The operations of BinOptics are included in our consolidated financial statements from the date of acquisition.
On December 18, 2013, we completed the acquisition of Mindspeed, a supplier of high performance analog products previously headquartered in Southern California. The operations of Mindspeed have been included in our consolidated financial statements since the date of acquisition.
Subsequent to closing the Mindspeed Acquisition, in February 2014, we divested the wireless business of Mindspeed. The operations of the wireless business are included in discontinued operations.
On May 9, 2014, we completed the sale of the CPE communication processor product line of Mindspeed for $12.0 million and an additional $2.0 million based upon the achievement of certain revenue-related milestones through December 31, 2014. During the quarter ended April 3, 2015, these milestones were achieved and we recorded income related to this contingent consideration of $2.0 million.
We acquired Nitronex on February 13, 2014. Because we and Nitronex were under common control since June 25, 2012, we present combined financial statements in a manner similar to a pooling-of-interests for all periods since June 25, 2012, the earliest date of common control. Accordingly, our historical financial statements have been retroactively combined as if Nitronex was acquired on June 25, 2012. All periods from June 25, 2012, have been combined using historical amounts of each entity.
We derived (i) the statements of operations data for the fiscal years 2015, 2014, and 2013, and (ii) the balance sheet data as of October 2, 2015 and October 3, 2014, from our audited consolidated financial statements, which appear elsewhere in this Annual Report. We derived the statements of operations data for the fiscal years 2012 and 2011 and balance sheet data as of September 28, 2012, and September 30, 2011 from our audited consolidated financial statements, adjusted for discontinued operations, which do not appear elsewhere in this Annual Report. We adopted a 52-or 53-week fiscal year ending on the Friday closest to September 30.
41
Table of Contents
The historical results presented below are not necessarily indicative of financial results to be achieved in future periods.
| Fiscal Years | ||||||||||||||||||||
| 2015 | 2014 | 2013 | 2012 | 2011 | ||||||||||||||||
| (in thousands, except per share data) | ||||||||||||||||||||
| Statements of Operations Data (1): |
||||||||||||||||||||
| Revenue |
$ | 420,609 | $ | 339,189 | $ | 242,703 | $ | 255,544 | $ | 274,208 | ||||||||||
| Cost of revenue |
217,019 | 198,249 | 133,505 | 134,826 | 151,609 | |||||||||||||||
|
|
|
|
|
|
|
|
|
|
|
|||||||||||
| Gross profit |
203,590 | 140,940 | 109,198 | 120,718 | 122,599 | |||||||||||||||
|
|
|
|
|
|
|
|
|
|
|
|||||||||||
| Operating expenses: |
||||||||||||||||||||
| Research and development |
82,188 | 71,351 | 42,505 | 34,903 | 34,974 | |||||||||||||||
| Selling, general and administrative |
110,030 | 82,593 | 57,930 | 41,235 | 47,556 | |||||||||||||||
| Restructuring charges |
1,280 | 14,823 | 1,060 | 1,862 | 1,499 | |||||||||||||||
|
|
|
|
|
|
|
|
|
|
|
|||||||||||
| Total operating expenses |
193,498 | 168,767 | 101,495 | 78,000 | 84,029 | |||||||||||||||
|
|
|
|
|
|
|
|
|
|
|
|||||||||||
| Income (loss) from operations |
10,092 | (27,827 | ) | 7,703 | 42,718 | 38,570 | ||||||||||||||
|
|
|
|
|
|
|
|
|
|
|
|||||||||||
| Other income (expense): |
||||||||||||||||||||
| Warrant liability (expense) gain (2) |
(6,020 | ) | (3,928 | ) | (4,312 | ) | 3,175 | (5,080 | ) | |||||||||||
| Class B conversion liability expense (2) |
— | — | — | (44,119 | ) | (39,737 | ) | |||||||||||||
| Interest (expense) income |
(18,376 | ) | (12,362 | ) | (817 | ) | (695 | ) | (1,561 | ) | ||||||||||
| Other (expense) income, net |
(1,096 | ) | 3,217 | 372 | 185 | — | ||||||||||||||
|
|
|
|
|
|
|
|
|
|
|
|||||||||||
| Other (expense) income, net |
(25,492 | ) | (13,073 | ) | (4,757 | ) | (41,454 | ) | (46,378 | ) | ||||||||||
|
|
|
|
|
|
|
|
|
|
|
|||||||||||
| (Loss) income before income taxes |
(15,400 | ) | (40,900 | ) | 2,946 | 1,264 | (7,808 | ) | ||||||||||||
| Income tax (benefit) provision |
(9,858 | ) | (16,086 | ) | 283 | 11,830 | (1,433 | ) | ||||||||||||
|
|
|
|
|
|
|
|
|
|
|
|||||||||||
| (Loss) income from continuing operations |
(5,542 | ) | (24,814 | ) | 2,663 | (10,566 | ) | (6,375 | ) | |||||||||||
|
|
|
|
|
|
|
|
|
|
|
|||||||||||
| Income from discontinued operations |
54,131 | 9,491 | 15,533 | 6,902 | 5,359 | |||||||||||||||
|
|
|
|
|
|
|
|
|
|
|
|||||||||||
| Net income (loss) |
48,589 | (15,323 | ) | 18,196 | (3,664 | ) | (1,016 | ) | ||||||||||||
| Less: net income attributable to noncontrolling interest in a subsidiary |
— | — | — | — | 195 | |||||||||||||||
|
|
|
|
|
|
|
|
|
|
|
|||||||||||
| Net income (loss) attributable to controlling interest |
48,589 | (15,323 | ) | 18,196 | (3,664 | ) | (1,211 | ) | ||||||||||||
| Accretion value of redeemable preferred stock (3) |
— | — | — | (2,616 | ) | (80,452 | ) | |||||||||||||
|
|
|
|
|
|
|
|
|
|
|
|||||||||||
| Net income (loss) attributable to common stockholders |
$ | 48,589 | $ | (15,323 | ) | $ | 18,196 | $ | (6,280 | ) | $ | (81,663 | ) | |||||||
|
|
|
|
|
|
|
|
|
|
|
|||||||||||
| Basic income (loss) per common share: |
||||||||||||||||||||
| (Loss) income from continuing operations |
$ | (0.11 | ) | $ | (0.53 | ) | $ | 0.06 | $ | (0.53 | ) | $ | (57.69 | ) | ||||||
| Income from discontinued operations |
1.06 | 0.20 | 0.34 | 0.28 | 3.56 | |||||||||||||||
|
|
|
|
|
|
|
|
|
|
|
|||||||||||
| Net income (loss) — basic |
$ | 0.95 | $ | (0.33 | ) | $ | 0.40 | $ | (0.25 | ) | $ | (54.13 | ) | |||||||
|
|
|
|
|
|
|
|
|
|
|
|||||||||||
| Diluted income (loss) per common share: |
||||||||||||||||||||
| (Loss) income from continuing operations |
$ | (0.11 | ) | $ | (0.53 | ) | $ | 0.06 | $ | (0.53 | ) | $ | (57.69 | ) | ||||||
| Income from discontinued operations |
1.06 | 0.20 | 0.33 | $ | 0.28 | $ | 3.56 | |||||||||||||
|
|
|
|
|
|
|
|
|
|
|
|||||||||||
| Net income (loss) — diluted |
$ | 0.95 | $ | (0.33 | ) | $ | 0.39 | $ | (0.25 | ) | $ | (54.13 | ) | |||||||
|
|
|
|
|
|
|
|
|
|
|
|||||||||||
| Shares used to compute net income (loss) per common share: |
||||||||||||||||||||
| Basic |
51,146 | 47,009 | 45,916 | 24,758 | 1,505 | |||||||||||||||
|
|
|
|
|
|
|
|
|
|
|
|||||||||||
| Diluted |
51,146 | 47,009 | 47,137 | 24,758 | 1,505 | |||||||||||||||
|
|
|
|
|
|
|
|
|
|
|
|||||||||||
42
Table of Contents
| As of | ||||||||||||||||||||
| October 2, 2015 |
October 3, 2014 |
September 27, 2013 |
September 28, 2012 |
September 30, 2011 |
||||||||||||||||
| Consolidated Balance Sheet Data (in thousands): |
||||||||||||||||||||
| Cash and cash equivalents |
$ | 122,312 | $ | 173,895 | $ | 110,488 | $ | 84,600 | $ | 45,668 | ||||||||||
| Working capital |
312,743 | 287,703 | 194,289 | 157,451 | 89,426 | |||||||||||||||
| Total assets |
866,251 | 682,234 | 316,635 | 268,217 | 211,268 | |||||||||||||||
| Long-term debt, less current portion |
340,504 | 343,178 | — | — | — | |||||||||||||||
| Class B conversion liability |
— | — | — | — | 81,378 | |||||||||||||||
| Convertible and redeemable preferred stock |
— | — | — | — | 182,018 | |||||||||||||||
| Stockholders’ equity (deficit) |
$ | 424,533 | $ | 228,567 | $ | 247,141 | $ | 199,458 | $ | (144,837 | ) | |||||||||
Dividends of $0.63 per share, $0.81 per share and $2.44 per share were paid to the record holders as of January 4, 2011 of our Series A-1 convertible preferred stock, Series A-2 convertible preferred stock and common stock, respectively, aggregating $80 million.
| (1) | See Results of Operations in Item 7 and Consolidated Statements of Operations and our Notes to Consolidated Financial Statements for additional information for fiscal years 2015, 2014 and 2013. |
| (2) | Represents changes in the fair value of certain features of our warrant and Class B convertible preferred stock that were recorded as liabilities and adjusted each reporting period to fair value. The convertible preferred stock liability was settled in connection with our initial public offering (IPO) in March 2012. |
| (3) | In fiscal year 2011, includes $76.2 million of dividends declared and paid in January 2011 to holders of our Series A-1 and A-2 convertible preferred stock. |
43
Table of Contents
ITEM 7. MANAGEMENT’S DISCUSSION AND ANALYSIS OF FINANCIAL CONDITION AND RESULTS OF OPERATION.
The following discussion and analysis of our financial condition and results of operations should be read in conjunction with our consolidated financial statements and related notes that appear elsewhere in this Annual Report. In addition to historical information, the following discussion contains forward-looking statements that are subject to risks and uncertainties. Actual results may differ substantially and adversely from those referred to herein due to a number of factors, including but not limited to those described below and in Item 1A “Risk Factors” and elsewhere in this Annual Report.
OVERVIEW
See Item 1, Business for additional information.
We are a leading provider of high-performance analog semiconductor solutions that enable next-generation internet applications, the cloud connected apps economy, and the modern, networked battlefield across the radio frequency (RF), microwave, millimeterwave and photonic spectrum. We design and manufacture differentiated, high-value products for customers who demand high performance, quality, and reliability. We offer a broad portfolio of over 3,500 standard and custom devices, which include integrated circuits (IC), multi-chip modules, power pallets and transistors, diodes, amplifiers, switches and switch limiters, passive and active components and complete subsystems, across approximately 40 product lines serving over 6,000 end customers in three primary markets. Our semiconductor products are electronic components that our customers incorporate into their larger electronic systems, such as, point-to-point wireless backhaul radios, high density networks, active antenna arrays, radar, magnetic resonance imaging systems (MRI) and unmanned aerial vehicles (UAVs). Our primary markets are: Networks, which includes carrier and enterprise infrastructure, wired broadband and cellular backhaul, cellular infrastructure, photonic solutions and fiber optic applications; Aerospace and Defense (A&D), which includes military and commercial radar, RF jammers, electronic countermeasures, and communication data links; Multi-market, which includes industrial, medical, test and measurement and scientific applications.
Basis of Presentation
We have one reportable operating segment, semiconductors and modules. All intercompany balances have been eliminated in consolidation. Certain prior period financial statement amounts, including the Automotive business discontinued operations have been adjusted to conform to currently reported presentations.
We have a 52 or 53-week fiscal year ending on the Friday closest to the last day of September. The fiscal year 2015 includes 52 weeks, fiscal year 2014 included 53 weeks and fiscal year 2013 included 52 weeks. To offset the effect of holidays, for fiscal years in which there are 53 weeks, we include the extra week arising in our fiscal years in the first quarter.
Description of Our Revenue
Revenue. Substantially all of our revenue is derived from sales of high-performance analog semiconductor solutions for use in wireless and wireline applications across the RF, microwave, millimeterwave and photonic spectrum and in high speed communications. We design, integrate, manufacture, and package differentiated product solutions that we sell to customers through our direct sales organization, our network of independent sales representatives, and our distributors.
We believe the primary drivers of our future revenue growth will include:
| • | engaging early with our lead customers to develop products and solutions that can be driven across multiple growth markets; |
| • | leveraging our core strength and leadership position in standard, catalog products that service all of our end applications; |
44
Table of Contents
| • | increasing content of our semiconductor solutions in our customers’ systems through cross-selling of our more than 40 product lines; |
| • | introducing new products through internal development and acquisitions with market reception that command higher prices based on the application of advanced technologies such as GaN, added features, higher levels of integration and improved performance; and |
| • | growth in the market for high-performance analog semiconductors generally, and in our three primary markets in particular. |
Our core strategy is to develop innovative, high-performance products that address our customers’ most difficult technical challenges in our primary markets: Networks, A&D and Multi-market. While sales in any or all of our primary markets may slow or decline from period to period, over the long-term we generally expect to benefit from strength in these markets.
We expect our revenue in the Networks market to be primarily driven by continued upgrades and expansion of communications equipment to support expansion in the Internet of Things (IoT), the proliferation of mobile computing devices such as smartphones and tablets, increasing adoption of bandwidth rich services such as video on demand and cloud computing, the rapid adoption of cloud-based services, and the migration to an application centric architecture, which we expect will drive faster adoption of higher speed, low latency optical and wireless links.
We expect our revenue in the A&D market to be driven by the upgrading of radar systems and modern battlefield communications equipment and networks designed to improve situational awareness. Growth in this market is subject to changes in governmental programs and budget funding, which is difficult to predict.
We expect revenue in multi-market to be driven by diverse demand for our multi-purpose catalog products.
CRITICAL ACCOUNTING POLICIES AND ESTIMATES
Our discussion and analysis of our financial condition and results of operations are based on our consolidated financial statements. The preparation of financial statements, in conformity with generally accepted accounting principles in the U.S. (GAAP), requires management to make estimates and judgments that affect the reported amounts of assets and liabilities and disclosure of contingent assets and liabilities at the date of the financial statements and the reported amounts of revenue and expenses during the reporting period. By their nature, these estimates and judgments are subject to an inherent degree of uncertainty and could be material if our actual or expected experience were to change unexpectedly. On an ongoing basis, we re-evaluate our estimates and judgments.
We base our estimates and judgments on our historical experience and on other assumptions that we believe are reasonable under the circumstances, the results of which form the basis for making the judgments about the carrying values of assets and liabilities that are not readily apparent from other sources. Actual results could differ from those estimates, and material effects on our operating results and financial position may result. The accounting policies which our management believes involve the most significant application of judgment, or involve complex estimation, are inventories and associated reserves; goodwill and intangibles asset valuations and associated impairment assessments; revenue reserves; contingent consideration valuations; share-based compensation valuations and income taxes and deferred income tax accounting. For additional information related to these and other accounting policies refer to Note 2—Summary of Significant Accounting Policies to our Consolidated Financial Statements included in this Annual Report which is incorporated by reference herein.
During the first quarter of 2015 we re-evaluated certain revenue recognition estimates and judgments associated with certain sales to distributors. We generally do not provide customers other than distributors the right to return product, with the exception of warranty related matters. Accordingly, we do not typically maintain
45
Table of Contents
a reserve for customers. Shipping and handling fees billed to customers are recorded as revenue while the related costs are classified as a component cost of revenue. We provide warranties for certain products and accrue the costs of warranty claims in the period the related revenue is recorded.
Prior to fiscal 2015, we had concluded that we had insufficient information as well as limited experience in estimating the effect of the right of distributors to return product and price protection and, accordingly, used the sell through approach of revenue recognition. Under this approach, we would recognize revenue from sales after the distributor resold the product to its end customer (the sell through basis). After concluding an extensive three year study of distributor related transactions, we completed an evaluation of our revenue recognition policy and concluded that it was more appropriate to recognize revenue to distributors at the time of shipment to the distributor (sell-in basis). We believe we now have sufficient data to predict future price adjustments from distributors and has a basis of being able to reasonably estimate these future price adjustments.
On a consolidated basis, revenue from distribution customers impacted by the change in estimate accounts for approximately 20-25% of total consolidated revenue. Certain agreements with distribution customers provide for rights of return and compensation credits until such time as our products are sold by the distributors to their end customers. We have agreements with some distribution customers for various programs, including compensation, volume-based pricing, obsolete inventory, new products and stock rotation. Sales to these distribution customers, as well as the existence of compensation programs, are in accordance with terms set forth in written agreements with these distribution customers. In general, credits allowed under these programs are capped based upon individual distributor agreements. We record charges associated with these programs as a reduction of revenue at the time of sale with a corresponding adjustment to accounts receivable based upon historical activity. Our policy is to use a 12 month rolling historical experience rate and an estimated general reserve percentage in order to estimate the necessary allowance to be recorded.
During the first fiscal quarter of 2015, we recorded corresponding adjustments related to this change in estimate to recognize previously deferred revenues. The net effect was an increase of $15.1 million, of which $12.4 million was from previously deferred revenue and $2.7 million was related to the change in distributor inventories. Additionally, we recognized the related deferred inventory costs of $4.7 million which resulted in a reduction to net loss of $8.5 million, or a reduction of $0.18 net loss per share when the change in estimate was recorded. The full year impact of this change in estimate resulted in additional revenue of $17.4 million and a net income of $7.7 million, or $0.15 earnings per share.
We also established a new reserve of $5.6 million during the first quarter of fiscal year 2015 which was increased to $6.0 million for the fiscal year ended October 2, 2015 related to future rebates and returns under various programs associated with our distributor agreements. The amount of this reserve is largely driven by the individual distribution agreements and our business strategy whereby we will invoice the distributor at “list price”. We expect to issue compensation credits consistent with the distributor agreements. The difference between the list price and distributor selling price will vary by product grouping consistent with historical trends and marketing strategies. Historically, 90 percent of the credits issued to distributors are based on “list price” credits and 10 percent of the credits were for product returns and stock rotation rights, based upon the 12 month rolling historical experience rate.
46
Table of Contents
The table below shows the changes in gross and net distributor revenue and reserve balances associated with the change in estimate for the fiscal year ended October 2, 2015 (in thousands):
| Three Months Ended | Fiscal
Year 2015 |
|||||||||||||||||||
| January 2, 2015 |
April 3, 2015 |
July 3, 2015 |
October 2, 2015 |
|||||||||||||||||
| Gross revenue effect of one-time change in estimate (1) |
$ | 17,028 | $ | — | $ | — | $ | — | $ | 17,028 | ||||||||||
| Gross revenue effect associated with change in estimate (2) |
3,636 | 4,687 | (1,687 | ) | (351 | ) | 6,285 | |||||||||||||
| Total gross revenue resulting from change in estimate |
20,664 | 4,687 | (1,687 | ) | (351 | ) | 23,313 | |||||||||||||
|
|
|
|
|
|
|
|
|
|
|
|||||||||||
| Net revenue effect of one-time change in estimate (3) |
12,457 | — | — | 12,457 | ||||||||||||||||
| Net revenue effect associated with change in estimate (4) |
2,643 | 3,686 | (1,296 | ) | (134 | ) | 4,899 | |||||||||||||
| Total net revenue resulting from change in estimate |
15,100 | 3,686 | (1,296 | ) | (134 | ) | 17,356 | |||||||||||||
|
|
|
|
|
|
|
|
|
|
|
|||||||||||
| Reserve for future returns and credits (5) |
$ | 5,564 | $ | 1,001 | $ | (391 | ) | $ | (217 | ) | $ | 5,957 | ||||||||
|
|
|
|
|
|
|
|
|
|
|
|||||||||||
| (1) | This amount was recorded as deferred revenue as of October 3, 2014. |
| (2) | This amount represents the impact of the change in estimate associated with increases in distributor inventories as compared to the prior reporting period. |
| (3) | This amount represents the net revenue impact of the one-time change in estimate after applying the associated reserve for future credits and returns. |
| (4) | This amount represents the impact of the change in estimate associated with increases in distributor inventories as compared to the prior reporting period after applying the associated reserve for future credits and returns. |
| (5) | This amount reflects the change in the revenue reserve for future returns and credits. |
RESULTS OF OPERATIONS
As discussed in Note 19—Discontinued Operations, to our Consolidated Financial Statements included in this Annual Report, we have adjusted certain amounts associated with these businesses in our results of operations, cash flows, and assets and liabilities as discontinued operations for all periods presented.
47
Table of Contents
The following table sets forth, for the periods indicated, our statement of operations data (in thousands):
| Fiscal Years | ||||||||||||
| 2015 | 2014 | 2013 | ||||||||||
| Revenue |
$ | 420,609 | 339,189 | 242,703 | ||||||||
| Cost of revenue (1) (4) (5) |
217,019 | 198,249 | 133,505 | |||||||||
|
|
|
|
|
|
|
|||||||
| Gross profit |
203,590 | 140,940 | 109,198 | |||||||||
|
|
|
|
|
|
|
|||||||
| Operating expenses: |
||||||||||||
| Research and development (1) (5) |
82,188 | 71,351 | 42,505 | |||||||||
| Selling, general and administrative (1) (3) (5) |
110,030 | 82,593 | 57,930 | |||||||||
| Restructuring charges |
1,280 | 14,823 | 1,060 | |||||||||
|
|
|
|
|
|
|
|||||||
| Total operating expenses |
193,498 | 168,767 | 101,495 | |||||||||
|
|
|
|
|
|
|
|||||||
| Income (loss) from operations |
10,092 | (27,827 | ) | 7,703 | ||||||||
|
|
|
|
|
|
|
|||||||
| Other (expense) income: |
||||||||||||
| Warrant liability expense (2) |
(6,020 | ) | (3,928 | ) | (4,312 | ) | ||||||
| Interest expense (1) |
(18,376 | ) | (12,362 | ) | (817 | ) | ||||||
| Other (expense) income, net |
(1,096 | ) | 3,217 | 372 | ||||||||
|
|
|
|
|
|
|
|||||||
| Other (expense) income, net |
(25,492 | ) | (13,073 | ) | (4,757 | ) | ||||||
|
|
|
|
|
|
|
|||||||
| (Loss) income before income taxes |
(15,400 | ) | (40,900 | ) | 2,946 | |||||||
| Income tax (benefit) provision |
(9,858 | ) | (16,086 | ) | 283 | |||||||
|
|
|
|
|
|
|
|||||||
| (Loss) income from continuing operations |
(5,542 | ) | (24,814 | ) | 2,663 | |||||||
|
|
|
|
|
|
|
|||||||
| Income from discontinued operations (6) |
54,131 | 9,491 | 15,533 | |||||||||
|
|
|
|
|
|
|
|||||||
| Net income (loss) |
$ | 48,589 | $ | (15,323 | ) | $ | 18,196 | |||||
|
|
|
|
|
|
|
|||||||
| (1) | Includes (a) Amortization expense related to intangible assets arising from acquisitions, (b) Non-Cash compensation expense, and (c) deferred financing cost amortization included in our consolidated statements of operations is set forth below (in thousands): |
| Fiscal Years | ||||||||||||
| 2015 | 2014 | 2013 | ||||||||||
| (a) Intangible amortization expense: |
||||||||||||
| Cost of revenue |
$ | 27,285 | $ | 18,274 | $ | 2,986 | ||||||
| Selling, general and administrative |
11,695 | 1,779 | 1,335 | |||||||||
| (b) Non-cash compensation expense: (i) |
||||||||||||
| Cost of revenue |
1,949 | 1,771 | 1,039 | |||||||||
| Research and development |
5,447 | 2,818 | 1,688 | |||||||||
| Selling, general and administrative |
12,039 | 6,688 | 3,369 | |||||||||
| (c) Deferred financing cost amortization — interest expense |
1,652 | 3,021 | 321 | |||||||||
| (i) | Includes share-based compensation expense and incentive and retention compensation amounts payable to certain of our employees in connection with the sale of acquired business to us. |
| (2) | Represents changes in the fair value of common stock warrants recorded as liabilities and adjusted each reporting period to fair value. |
| (3) | Includes litigation costs of $0.9 million, $1.6 million and $2.6 million incurred in fiscal years 2015, 2014 and 2013, respectively. |
| (4) | In fiscal year 2015 and 2014, includes approximately $5.5 and $18.1 million of costs for step-up in valuation of acquired business inventories to fair value. |
| (5) | In fiscal year 2014, cost of revenue, research and development, and selling, general, and administrative includes approximately $1.4 million, $4.5 million, and $13.9 million, respectively, of costs related to the acquisition and integration of Mindspeed. |
| (6) | See Note 19—Discontinued Operations to the Consolidated Financial Statements for additional information. |
48
Table of Contents
The following table sets forth, for the periods indicated, our statement of operations data expressed as a percentage of our revenue:
| Fiscal Years | ||||||||||||
| 2015 | 2014 | 2013 | ||||||||||
| Revenue |
100.0 | % | 100.0 | % | 100.0 | % | ||||||
| Cost of revenue |
51.6 | 58.4 | 55.0 | |||||||||
|
|
|
|
|
|
|
|||||||
| Gross profit |
48.4 | 41.6 | 45.0 | |||||||||
|
|
|
|
|
|
|
|||||||
| Operating expenses: |
||||||||||||
| Research and development |
19.5 | 21.0 | 17.5 | |||||||||
| Selling, general and administrative |
26.2 | 24.4 | 23.9 | |||||||||
| Restructuring charges |
0.3 | 4.4 | 0.4 | |||||||||
|
|
|
|
|
|
|
|||||||
| Total operating expenses |
46.0 | 49.8 | 41.8 | |||||||||
|
|
|
|
|
|
|
|||||||
| Income (loss) from operations |
2.4 | (8.2 | ) | 3.2 | ||||||||
|
|
|
|
|
|
|
|||||||
| Other (expense) income: |
||||||||||||
| Warrant liability expense |
(1.4 | ) | (1.2 | ) | (1.8 | ) | ||||||
| Interest expense |
(4.4 | ) | (3.6 | ) | (0.3 | ) | ||||||
| Other (expense) income, net |
(0.3 | ) | 0.9 | 0.2 | ||||||||
|
|
|
|
|
|
|
|||||||
| Other (expense) income, net |
(6.1 | ) | (3.9 | ) | (2.0 | ) | ||||||
|
|
|
|
|
|
|
|||||||
| (Loss) income (loss) before income taxes |
(3.7 | ) | (12.1 | ) | 1.2 | |||||||
| Income tax (benefit) provision |
(2.3 | ) | (4.7 | ) | 0.1 | |||||||
|
|
|
|
|
|
|
|||||||
| (Loss) income from continuing operations |
(1.3 | ) | (7.3 | ) | 1.1 | |||||||
| Income from discontinued operations |
12.9 | 2.8 | 6.4 | |||||||||
|
|
|
|
|
|
|
|||||||
| Net income (loss) |
11.6 | % | (4.5 | )% | 7.5 | % | ||||||
|
|
|
|
|
|
|
|||||||
Comparison of Fiscal Year Ended October 2, 2015 to Fiscal Year Ended October 3, 2014
Revenue. In fiscal year 2015, our revenue increased $81.4 million, or 24.0%, to $420.6 million from $339.2 million for fiscal year 2014.
Revenue from our primary markets, the percentage of change between the years, and revenue by primary markets expressed as a percentage of total revenue were (in thousands, except percentages):
| Fiscal Years | ||||||||||||
| 2015 | 2014 | % Change | ||||||||||
| Networks |
$ | 273,931 | $ | 183,347 | 49.4 | % | ||||||
| A&D |
83,296 | 87,563 | (4.9 | )% | ||||||||
| Multi-market |
63,382 | 68,279 | (7.2 | )% | ||||||||
|
|
|
|
|
|
|
|||||||
| Total |
$ | 420,609 | $ | 339,189 | 24.0 | % | ||||||
|
|
|
|
|
|
|
|||||||
| Networks |
65.1 | % | 54.1 | % | ||||||||
| A&D |
19.8 | % | 25.8 | % | ||||||||
| Multi-market |
15.1 | % | 20.1 | % | ||||||||
|
|
|
|
|
|||||||||
| Total |
100.0 | % | 100.0 | % | ||||||||
|
|
|
|
|
|||||||||
49
Table of Contents
In fiscal year 2015, our Networks market revenue increased by $90.6 million, or 49.4%, compared to fiscal year 2014. The increase in revenue was primarily from sales of products from the BinOptics Acquisition in December 2014 and the full year impact of the Mindspeed Acquisition in December 2013. Each of these acquisitions expanded our product offerings significantly.
In fiscal year 2015, our A&D market revenue decreased by $4.3 million, or 4.9%, compared to fiscal year 2014. We attribute this decrease to lower demand and shipments of certain legacy radar programs as well as cyclical demand for radar applications.
In fiscal year 2015, our Multi-market revenues decreased $4.9 million, or 7.2%, compared to fiscal year 2014. The decrease in revenue in the 2015 period was primarily due to lower general market demand for catalog products, partially offset by distributor revenue adjustments associated with a change in estimate during the first quarter of fiscal year 2015.
Gross profit. In fiscal year 2015, our gross profit increased by $62.7 million or 44.5%, compared to fiscal 2014. Gross margin of 48.4%, increased 6.8%, compared to fiscal year 2014. The higher gross profit was largely the result of a favorable product mix with higher revenue from recent acquisitions and legacy products, partially offset by acquisition related increases in amortization expense.
Research and development. In fiscal year 2015, R&D expense increased $10.8 million, or 15.2%, to $82.2 million, or 19.5% of our revenue, compared with $71.4 million, or 21.0% of our revenue in fiscal year 2014. Research and development expenses increased primarily related to additional research and development activities as well as increased headcount and employee compensation related to recently acquired businesses.
Selling, general and administrative. In fiscal year 2015, SG&A expense increased $27.4 million, or 33.2%, to $110.0 million, or 26.2% of our revenue, compared with $82.6 million, or 24.4% of our revenue for fiscal year 2014. The increase was primarily due to increased headcount and employee compensation expense related to acquired businesses, acquisition integration costs and higher litigation costs.
Restructuring charges. In fiscal year 2015, restructuring charges were $1.3 million, or 0.3% of our revenue compared with $14.8 million, or 4.4% of our revenue for fiscal year 2014. Restructuring charges were higher in 2014 primarily due to a reduction in headcount and changes related to payments associated with Mindspeed employment agreements, as well as, reductions associated with the integration of the Mindspeed business which included severance and related benefits.
Income (loss) from operations. In fiscal year 2015, we reported income from operations of $10.1 million, or 2.4%, compared to a loss from operations of $27.8 million, or 8.2%. This change of $37.9 million, or 136.3%, was primarily the result of higher revenue and gross profit associated with recently acquired businesses, partly offset by higher operating expenses in fiscal year 2015 compared the prior fiscal year 2014.
Warrant liability. In fiscal year 2015, we recorded an expense of $6.0 million compared to an expense of $3.9 million for fiscal year 2014. The expense relates to the change in the estimated fair value of common stock warrants we issued in December 2010, which we carry as a liability at fair value. Our common stock price is a key input in determining the fair value of the warrant liability and has increased over the past year which has resulted in a higher expense.
Interest expense. In fiscal year 2015, interest expense was $18.4 million, or 4.4% of our revenue, compared with $12.4 million, or 3.6% of our revenue for fiscal year 2014, due to increased borrowings outstanding under our Credit Agreement at higher interest rates. The borrowings were primarily utilized to fund our acquisitions.
Other income. In fiscal year 2015, other income, net, was $1.1 million expense and primarily related to contingent consideration income of $2.0 million associated with a 2014 product line divestiture and income for
50
Table of Contents
services and fees earned under a transition services agreement related to a business sold during the fiscal year, offset by $3.5 million related to a minority equity investment impairment.
Discontinued Operations. See Note 19 to the Consolidated Financial Statements for additional information.
Provision for income taxes. In fiscal year 2015, the provision for income taxes was a benefit of $9.9 million compared to a benefit of $16.1 million for fiscal year 2014. The benefit decreased primarily due to a decrease in the current period taxable loss in the U.S. partially offset by income taxed in foreign jurisdictions.
The difference between the U.S. federal statutory income tax rate of 35% and the Company’s effective income tax rates for fiscal year 2015 and 2014, was primarily impacted by changes in fair values of the stock warrant liability which are not deductible nor taxable for tax purposes, as well as income taxed in foreign jurisdictions at generally lower tax rates, research and development credits, non-deductible compensation and for fiscal year 2015 provision to return adjustments.
The aggregate net deferred income tax liabilities acquired in the BinOptics Acquisition were $33.3 million. At the date of the acquisition, BinOptics had federal net operating loss (NOL) carryforwards of approximately $44.9 million, which will expire at various dates through 2034, and federal research and development tax credit carryforwards of $1.5 million. Both the NOL and the tax credits are subject to change-in-control limitations within the Internal Revenue Code and, accordingly, the NOL carryforwards were reduced to $43.3 million and the research and development credits were reduced to $1.1 million, to reflect the estimated realizable amount after consideration of the limitations. The NOL carryforwards and tax credits are included in the computation of net deferred income tax assets arising from the acquisition.
During fiscal year 2015, the Company’s unrecognized tax benefits did not change and remained at $1.7 million. The unrecognized tax benefits primarily relate to positions taken by the Company in its 2014 U.S. tax filings. During fiscal year 2014, the Company settled the federal audit for fiscal years 2011 and 2012 with no material impact upon the financial statements.
Comparison of Fiscal Year Ended October 3, 2014 to Fiscal Year Ended September 27, 2013
Revenue. In fiscal year 2014, our revenue increased $96.5 million, or 39.8%, to $339.2 million from $242.7 million for fiscal year 2013. The increase in revenue was primarily due to the acquisition of Mindspeed, which expanded our product offerings significantly.
Revenue from our primary markets, the percentage of change between the years, and revenue by primary markets expressed as a percentage of total revenue were (in thousands, except percentages):
| Fiscal Years | ||||||||||||
| 2014 | 2013 | % Change | ||||||||||
| Networks |
183,347 | 83,785 | 118.8 | % | ||||||||
| A&D |
87,563 | 91,390 | (4.2 | )% | ||||||||
| Multi-Market |
68,279 | 67,528 | 1.1 | % | ||||||||
|
|
|
|
|
|
|
|||||||
| Total |
339,189 | 242,703 | 39.8 | % | ||||||||
|
|
|
|
|
|
|
|||||||
| Networks |
54.1 | % | 34.5 | % | ||||||||
| A&D |
25.8 | % | 37.7 | % | ||||||||
| Multi-Market |
20.1 | % | 27.8 | % | ||||||||
|
|
|
|
|
|||||||||
| Total |
100.0 | % | 100.0 | % | ||||||||
|
|
|
|
|
|||||||||
In fiscal year 2014, our Networks market revenue increased by $99.6 million, or 118.8%, compared to fiscal year 2013. The increase is revenue was primarily from sales of our newly acquired products from our Mindspeed
51
Table of Contents
Acquisition addressing carrier infrastructure, fiber-to-the-home access networks, physical media devices and broadcast video, as well as increased sales of our products targeting wireless backhaul and optical applications, partly offset by continued weakness in our products targeting set top box products.
In fiscal year 2014, our A&D market revenue decreased by $3.8 million, or 4.1%, compared to fiscal year 2013. We attribute this decrease to ramp down of certain legacy radar programs as well as cyclical demand for radar applications.
In fiscal year 2014, our Multi-market revenues decreased by $0.8 million, or 1.1%, compared to fiscal year 2013. The modest increase in revenue in the 2014 period was primarily from sales of our newly acquired CPE product line, as partly offset by softness in demand for catalog products. We divested the CPE product line in May 2014.
Gross profit. In fiscal year 2014, our gross profit increased $31.7 million, or 29.1%, compared to fiscal year 2013. Gross margin of 41.6%, decreased 3.4% compared to fiscal year 2013. The higher gross profit was largely the result of leveraging greater revenue against fixed costs compared to fiscal year 2013. The decline in gross margin percentage included the effect of the step-up in valuation of Mindspeed’s inventory to fair value and other acquisition and integration costs increasing costs by $19.5 million, which offset the positive impact of selling higher margin products.
Research and development. In fiscal year 2014, R&D expense increased $28.8 million, or 67.9%, to $71.4 million, or 21.0% of our revenue, compared with $42.5 million, or 17.5% of our revenue, in fiscal year 2013. R&D expenses increased primarily as a result of increased headcount and employee compensation related to acquired businesses, of which approximately $4.5 million related to Mindspeed acquisition and integration costs.
Selling, general and administrative. In fiscal year 2014, SG&A expense increased $24.7 million, or 42.6%, to $82.6 million, or 24.4% of our revenue, compared with $57.9 million, or 23.9% of our revenue, for fiscal year 2013. The increase was primarily due to increased headcount and employee compensation expense related to acquired businesses, acquisition integration expense, and increased litigation costs, of which approximately $13.9 million related to Mindspeed Acquisition.
Restructuring charges. In fiscal year 2014, restructuring charges were $14.8 million, or 4.4% of our revenue, compared with $1.1 million, or 0.4% of our revenue for fiscal year 2013. Restructuring charges were due to a reduction in headcount as part of the integration of the Mindspeed business and included severance, related benefits, and an immaterial amount of non-employee related charges.
Income (loss) from operations. In fiscal year 2014, loss from operations decreased $35.5 million, or 461.2%, to a loss of $27.8 million, or 8.2%, of our revenue, compared with income from operations of $7.7 million, or 3.2%, of our revenue for fiscal year 2013. The fiscal year 2014 loss was primarily driven by the incremental costs incurred related to our acquisition and integration of Mindspeed.
Warrant liability. In fiscal year 2014, we recorded an expense of $3.9 million compared to an expense of $4.3 million for fiscal year 2013. The expense relates to the change in the estimated fair value of common stock warrants we issued in December 2010, which we carry as a liability at fair value.
Interest expense. In fiscal year 2014, interest expense was $12.4 million, or 3.6% of our revenue, compared with $0.8 million, or 0.3% of our revenue for fiscal year 2013, primarily due to increased borrowings outstanding under our Credit Agreement at higher interest rates. The borrowings were primarily utilized to fund our Mindspeed and Nitronex Acquisitions.
Other income. In fiscal year 2014, other income was $3.2 million for services and fees earned under a transition services agreement related to a business sold during the fiscal year.
52
Table of Contents
Discontinued Operations. See Note 19 to the Consolidated Financial Statements for additional information.
Provision for income taxes. In fiscal year 2014, the provision for income taxes was a benefit of $16.1 million compared to an expense of $0.3 million for fiscal year 2013. The provision for income taxes decreased primarily due to a current period taxable loss in the U.S. for which we have recorded a benefit, partially offset by income taxed in foreign jurisdictions.
The difference between the U.S. federal statutory income tax rate of 35% and the Company’s effective income tax rates for fiscal year 2014 and 2013, was primarily impacted by changes in fair values of the stock warrant liability which are not deductible nor taxable for tax purposes, as well as income taxed in foreign jurisdictions at generally lower tax rates, partly offset by U.S. state income taxes, and, for fiscal year 2014, by nondeductible expenses for tax purposes resulting from the Mindspeed Acquisition and pre-acquisition Nitronex losses.
The aggregate net deferred income tax assets acquired in the Mindspeed Acquisition were $92.9 million, net of a $9.2 million valuation allowance. A valuation allowance is required to the extent we believe that it is more likely than not our deferred tax assets will not be recovered.
At the date of acquisition, Mindspeed had federal NOL carryforwards of approximately $668.8 million, which will expire at various dates through 2033, and federal research and development tax credit carryforwards of $19.9 million. Both the NOL and the tax credits are subject to change-in-control limitations within the Internal Revenue Code and, accordingly, these carryforwards were reduced to $307.0 million, the estimated realizable amount after consideration of the limitations. The NOL carryforwards and tax credits are included in the computation of net deferred income tax assets arising from the acquisition.
During fiscal year 2014, the Company increased its unrecognized tax benefits by $1.7 million primarily relating to positions to be taken by the Company in its US tax filings. During fiscal year 2014, the Company settled the federal audit for fiscal years 2011 and 2012 with no material impact upon the financial statements.
LIQUIDITY AND CAPITAL RESOURCES
The following table summarizes our cash flow activities for the fiscal years ended October 2, 2015 and October 3, 2014, respectively (in thousands):
| Twelve Months Ended | ||||||||
| October 2, 2015 | October 3, 2014 | |||||||
| Cash and cash equivalents, beginning of period |
$ | 173,895 | $ | 110,488 | ||||
| Net cash provided by operating activities |
33,678 | 25,472 | ||||||
| Net cash used in investing activities |
(207,425 | ) | (264,243 | ) | ||||
| Net cash provided by financing activities |
122,407 | 302,360 | ||||||
| Effect of exchange rates on cash balances |
(243 | ) | (182 | ) | ||||
|
|
|
|
|
|||||
| Cash and cash equivalents, end of period |
$ | 122,312 | $ | 173,895 | ||||
|
|
|
|
|
|||||
Cash Flow from Operating Activities:
As of October 2, 2015, we held $122.3 million of cash and cash equivalents, all deposited with financial institutions. Our cash flow from operating activities consists of net income for the period, adjusted for certain non-cash items and changes in operating assets and liabilities. Cash provided by operations was $33.7 million in fiscal 2015 of which the principal components were net income of $48.6 million, plus noncash items of $45.8 million including depreciation and amortization expense of $54.7 million, stock-based and other noncash
53
Table of Contents
incentive compensation expense of $19.4 million partially offset by gains on the disposal of discontinued businesses of $63.3 million. In addition cash used by operating assets and liabilities were $60.7 million for fiscal 2015.
Cash used by operating assets and liabilities for fiscal 2015 was driven by a use of cash of $17.0 million related to the reduction of deferred revenue primarily related to a change in estimate associated with revenue recognition during the first quarter of fiscal 2015. Increases in accounts receivable balances were a use of cash of $13.1 million, primarily related to increases in revenue from acquisitions, and income taxes were a use of $12.5 million during the year primarily related to tax payments associated with the sale of the automotive business. In addition we had a use of cash related to prepaid compensation associated with the BinOptics Acquisition that used cash of $14.6 million. With the exception of the cash used for prepaid compensation related to the BinOptics Acquisition, these changes in working capital generally reflect normal fluctuations relative to the timing and nature of the transactions.
Cash provided by operating activities for fiscal 2014 was $25.5 million which was largely driven by a net loss of $15.3 million, plus noncash expenses of $57.8 million, and cash decreases from operating assets and liabilities of $17.0 million. The change in operating assets and liabilities included cash used in inventory of $9.6 million, accounts payable of $7.1 million, accrued expenses of $6.7 million and income taxes of $2.7 million, primarily driven by the Mindspeed Acquisition and other normal fluctuations in working capital requirements. These amounts were partially offset by an increase deferred revenue of $7.6 million.
Cash Flow from Investing Activities:
Our cash flow used by investing activities consists primarily of cash paid for acquisitions, capital expenditures and the acquisition of intellectual property, as well as other strategic investments. Cash used in investing activities was $207.4 million for fiscal 2015, which consisted of net business acquisition expenditures of $208.4 million for the BinOptics Acquisition. We also used $38.3 million for the purchase of property and equipment, including $8.3 million related to purchase of our headquarters and fabrication facility in Lowell, Massachusetts, the renovation of leased facilities as well as purchases of production and manufacturing equipment, tooling, engineering equipment and software tools. We used $3.3 million for the purchase of intellectual property. These expenditures were partially offset by proceeds from the sale of businesses of $81.2 million including the divestiture of the Automotive business, the wireless business of Mindspeed and the sale of our CPE communications product line.
Cash Flow from Financing Activities:
Cash from financing activities was $122.4 million in fiscal year 2015, driven primarily by net proceeds from our February 2015 common stock offering totaling $127.8 million. Proceeds from stock option exercises and employee stock plans totaled $5.5 million. We also received proceeds of $100.0 million from our Revolving Facility during the first fiscal quarter, which was subsequently repaid during the following fiscal quarter. We made $3.5 million in payments of debt as well as $1.5 million in capital lease payments. Repurchases of common stock related to minimum tax withholding payments for employee share-based awards totaled $8.6 million during the period.
On February 5, 2015, we completed a public offering of 7,800,000 shares of common stock at a price of $30.00 per share, of which 4,500,000 shares were newly-issued shares sold and 3,300,000 shares were previously outstanding shares held by affiliates of John Ocampo, our Chairman of the Board and majority stockholder prior to the offering, and held by certain funds affiliated with Summit Partners, L.P. After deducting underwriting discounts and commissions and offering expenses, the net proceeds from shares sold in this offering were approximately $127.7 million. We used $100.0 million of the net proceeds we received in this offering to repay outstanding borrowings under our revolving credit facility, and we expect to use the remainder of the net
54
Table of Contents
proceeds for general corporate purposes. We did not receive any proceeds from the sale of shares of common stock by the selling stockholders.
On May 8, 2014, we refinanced our outstanding indebtedness under our prior revolving credit facility (Prior Facility) and discharged our obligations thereunder by entering into a credit agreement (Credit Agreement) with a syndicate of lenders. Concurrent with the execution of the Credit Agreement, we terminated the Prior Facility and repaid the outstanding $245.0 million principal and interest due through draws on the Credit Agreement. The Credit Agreement provides for term loans in an aggregate principal amount of $350.0 million, which mature in May 2021 (Term Loans) and a revolving credit facility of initially $100.0 million, which matures in May 2019 (Revolving Facility). In February 2015, we executed an amendment to the Credit Agreement that increased our available borrowing capacity under the Revolving Facility to $130.0 million. The Term Loans were issued with an original issue discount (OID) of 0.75%, which is being amortized over the term of the Term Loans using the straight line method, which approximates the effective interest rate method. Borrowings under both the Term Loans and the Revolving Facility bear interest at variable rates payable quarterly. The Term Loans are payable in quarterly principal installments of 0.25% of the Term Loans on the last business day of each calendar quarter, with the remainder due on the maturity date.
The Term Loans and Revolving Facility are secured by a first priority lien on substantially all of our assets and provide that we must comply with certain financial and non-financial covenants. As of October 2, 2015, we were in compliance with all financial and non-financial covenants under the Credit Agreement and we had $345.6 million of outstanding Term Loan borrowings under the Credit Agreement and $130.0 million of borrowing capacity under our Revolving Facility.
In July 2013, we announced that we had licensed GaN process technology from Global Communications Semiconductors, LLC and would be installing such process technology at our Lowell, Massachusetts manufacturing facility. This installation effort continues to be a multi-year process and to involve tens of millions of dollars of investment in capital equipment, license fees, and other related costs and expenses. We have a long-term technology licensing and transfer commitment that calls for remaining potential payments by us, as of October 2, 2015, of up to $5.0 million through July 2016.
The undistributed earnings of our foreign subsidiaries are indefinitely reinvested and we do not intend to repatriate such earnings. We believe the decision to reinvest these earnings will not have a significant impact on our liquidity. As of October 2, 2015, cash held by our foreign subsidiaries was $32.2 million, which, along with cash generated from foreign operations, is expected to be used in the support of international growth and working capital requirements.
We plan to use our available cash and cash equivalents, short term investments, and potential remaining borrowing capacity under our Revolving Facility for general corporate purposes, including working capital, or for the acquisition of or investment in complementary technologies, design teams, products and businesses. We may also use a portion of our cash and cash equivalents and any amounts remaining under our Revolving Facility, which we may draw on from time to time, for the acquisition of, or investment in, complementary technologies, design teams, products and companies. We believe that our cash and cash equivalents, short term investments, cash generated from operations, and borrowing availability under the Revolving Facility will be sufficient to meet our working capital requirements for at least the next 12 months. We may need to raise additional capital from time to time through the issuance and sale of equity or debt securities, and there is no assurance that we will be able do so on favorable terms or at all.
OFF-BALANCE SHEET ARRANGEMENTS
We do not have significant contractual obligations not fully recorded on our consolidated balance sheet or fully disclosed in the notes to our consolidated financial statements. As of October 2, 2015, we do not have material off-balance sheet arrangements as defined in SEC Regulation S-K Item 303(a)(4)(ii).
55
Table of Contents
CONTRACTUAL OBLIGATIONS
The following is a summary of our contractual payment obligations for consolidated debt, purchase agreements, operating leases, other commitments and long-term liabilities as of October 2, 2015, (in thousands):
| Payments Due By Period | ||||||||||||||||||||
| Total | Less Than
1 Year |
1-3 Years | 3-5 Years | More Than 5 Years |
||||||||||||||||
| Contractual Cash Obligations | ||||||||||||||||||||
| Long-term Debt Principal Payments |
$ | 345,625 | $ | 3,500 | $ | 7,000 | $ | 7,000 | $ | 328,125 | ||||||||||
| Estimated Interest Payments on Long-term Debt |
89,843 | 16,159 | 31,928 | 30,588 | 11,168 | |||||||||||||||
| Capital Lease Payments |
982 | 558 | 425 | — | — | |||||||||||||||
| Estimated Interest Payments on Capital Leases |
29 | 24 | 5 | — | — | |||||||||||||||
| Operating Lease Obligations (1) |
30,228 | 7,343 | 11,731 | 6,875 | 4,279 | |||||||||||||||
| Purchase Commitments (2) |
1,183 | 1,183 | — | — | — | |||||||||||||||
|
|
|
|
|
|
|
|
|
|
|
|||||||||||
| Total Contractual Cash Obligations |
$ | 467,890 | $ | 28,766 | $ | 51,089 | $ | 44,464 | $ | 343,571 | ||||||||||
|
|
|
|
|
|
|
|
|
|
|
|||||||||||
| Other Commercial Commitments | ||||||||||||||||||||
| Letters of Credit |
$ | 400 | $ | 400 | $ | — | $ | — | $ | — | ||||||||||
| Commercial Contract Commitments (3) |
54,825 | 54,674 | 151 | — | — | |||||||||||||||
|
|
|
|
|
|
|
|
|
|
|
|||||||||||
| Total Commercial Commitments |
$ | 55,225 | $ | 55,074 | $ | 151 | $ | — | $ | — | ||||||||||
|
|
|
|
|
|
|
|
|
|
|
|||||||||||
| (1) | We have non-cancelable operating lease agreements for office, research, development, and manufacturing space in the U.S. and certain foreign locations. We also have operating leases for certain equipment, automobiles and services. These lease agreements expire at various dates through 2022 and certain agreements contain provisions for extension at substantially the same terms as currently in effect. |
| (2) | In the normal course of business, we enter into supply arrangements with certain of our suppliers to purchase minimum quantities of inventories. |
| (3) | The most significant of our commercial contract commitments relate to approximately $54.8 million of commitments related to open purchase orders. |
As of October 2, 2015, we had an estimated $1.3 million in asset retirement obligations for the restoration of leased facilities upon the termination of the related leases. Although it is reasonably possible that our estimates could materially change in the next 12 months, we are presently unable to reliably estimate when any cash settlement of these obligations may occur.
We have a long term technology licensing and transfer commitment that calls for potential payments of up to $9.0 million to one specific party in connection with the technology through July 2016. We have made payments of approximately $4.0 million as of October 2, 2015 and $9.4 million in aggregate on this long term technology licensing and transfer commitment and related costs will be amortized upon completion of the transfer, which is expected to be completed during fiscal year 2017.
OTHER MATTERS
Inflation did not have a material impact upon our results of operations during the three-year period ended October 2, 2015.
ITEM 7A. QUANTITATIVE AND QUALITATIVE DISCLOSURES ABOUT MARKET RISK.
We are exposed to market risk in the ordinary course of business, which consists primarily of interest rate risk associated with our cash and cash equivalents short-term investments, and our variable rate debt, as well as foreign exchange rate risk. In addition, the value of our warrant liability is based on the underlying price of our common stock and changes in its value could significantly impact our warrant liability expense.
56
Table of Contents
Interest rate risk. The primary objectives of our investment activity are to preserve principal, provide liquidity, and earn a money market rate of return. To minimize market risk, we maintain our portfolio in cash and diversified short-term investments, which may consist of bank deposit and money market funds. The interest rates are variable and fluctuate with current market conditions. The risk associated with fluctuating interest rates is limited to this investment portfolio. We believe that a 10% change in interest rates would not have a material impact on our financial position or results of operations.
Our exposure to interest rate risk also relates to the increase or decrease in the amount of interest expense we must pay on the outstanding debt under the Credit Agreement. The interest rates on our term loans and revolving credit facility are variable interest rates based on our lender’s prime rate or a LIBOR rate, in each case plus an applicable margin, which exposes us to market interest rate risk when we have outstanding borrowings under the Credit Agreement. As of October 2, 2015, we had $345.6 million of outstanding borrowings under the Credit Agreement. Assuming our outstanding debt remains constant under the Credit Agreement for an entire year and the applicable annual interest rate increases or decreases by 1%, our annual interest expense would increase or decrease by $3.5 million.
Foreign currency risk. To date, our international customer agreements have been denominated primarily in U.S. dollars. Accordingly, we have limited exposure to foreign currency exchange rates. The functional currency of a majority of our foreign operations is U.S. dollars with the remaining operations being local currency. Increases in the value of the United States dollar relative to other currencies could make our products more expensive, which could negatively impact demand in certain regions. Conversely, decreases in the value of the United States dollar relative to other currencies could result in our products being more expensive to certain customers and could reduce or delay orders, or otherwise negatively affect how they do business with us. The effects of exchange rate fluctuations on the net assets of the majority of our operations are accounted for as transaction gains or losses. We believe that a change of 10% in such foreign currency exchange rates would not have a material impact on our financial position or results of operations. In the future, we may enter into foreign currency exchange hedging contracts to reduce our exposure to changes in exchange rates.
57
Table of Contents
ITEM 8. FINANCIAL STATEMENTS AND SUPPLEMENTARY DATA.
INDEX TO FINANCIAL STATEMENTS
| Page | ||||
| M/A-COM TECHNOLOGY SOLUTIONS HOLDINGS, INC. |
||||
| 59 | ||||
| Consolidated Financial Statements: |
||||
| 60 | ||||
| 61 | ||||
| 62 | ||||
| 63 | ||||
| 65 | ||||
| 66 | ||||
58
Table of Contents
REPORT OF INDEPENDENT REGISTERED PUBLIC ACCOUNTING FIRM
To the Board of Directors and Stockholders of
M/A-COM Technology Solutions Holdings, Inc.
Lowell, Massachusetts
We have audited the accompanying consolidated balance sheets of M/A-COM Technology Solutions Holdings, Inc. and subsidiaries (the “Company”) as of October 2, 2015 and October 3, 2014 and the related consolidated statements of operations, comprehensive income (loss), stockholders’ equity, and cash flows for each of the three fiscal years in the period ended October 2, 2015. These consolidated financial statements are the responsibility of the Company’s management. Our responsibility is to express an opinion on these consolidated financial statements based on our audits.
We conducted our audits in accordance with the standards of the Public Company Accounting Oversight Board (United States). Those standards require that we plan and perform the audit to obtain reasonable assurance about whether the financial statements are free of material misstatement. An audit includes examining, on a test basis, evidence supporting the amounts and disclosures in the financial statements. An audit also includes assessing the accounting principles used and significant estimates made by management, as well as evaluating the overall financial statement presentation. We believe that our audits provide a reasonable basis for our opinion.
In our opinion, such consolidated financial statements present fairly, in all material respects, the financial position of the Company as of October 2, 2015 and October 3, 2014, and the results of its operations and its cash flows for each of the three fiscal years in the period ended October 2, 2015 in conformity with accounting principles generally accepted in the United States of America.
We have also audited, in accordance with the standards of the Public Company Accounting Oversight Board (United States), the Company’s internal control over financial reporting as of October 2, 2015 based on the criteria established in Internal Control—Integrated Framework (2013) issued by the Committee of Sponsoring Organizations of the Treadway Commission and our report dated November 24, 2015 expressed an adverse opinion on the Company’s internal control over financial reporting because of a material weakness.
/s/ Deloitte & Touche LLP
Boston, Massachusetts
November 24, 2015
59
Table of Contents
M/A-COM TECHNOLOGY SOLUTIONS HOLDINGS, INC.
(In thousands, except per share data)
| October 2, 2015 |
October 3, 2014 |
|||||||
| ASSETS |
||||||||
| Current assets: |
||||||||
| Cash and cash equivalents |
$ | 122,312 | $ | 173,895 | ||||
| Short term investments |
39,557 | — | ||||||
| Accounts receivable, net |
83,950 | 62,258 | ||||||
| Inventories |
79,943 | 71,481 | ||||||
| Deferred income taxes |
31,431 | 35,957 | ||||||
| Prepaids and other current assets |
27,026 | 14,769 | ||||||
| Current assets, discontinued operations |
— | 14,989 | ||||||
|
|
|
|
|
|||||
| Total current assets |
384,219 | 373,349 | ||||||
| Property and equipment, net |
83,759 | 50,052 | ||||||
| Goodwill |
93,346 | 10,784 | ||||||
| Intangible assets, net |
243,666 | 142,633 | ||||||
| Deferred income taxes |
48,239 | 84,629 | ||||||
| Other long-term assets |
13,022 | 20,232 | ||||||
| Other assets, discontinued operations |
— | 555 | ||||||
|
|
|
|
|
|||||
| Total assets |
$ | 866,251 | $ | 682,234 | ||||
|
|
|
|
|
|||||
| LIABILITIES AND STOCKHOLDERS’ EQUITY |
||||||||
| Current liabilities: |
||||||||
| Current portion long-term debt |
4,058 | 3,478 | ||||||
| Accounts payable |
29,311 | 22,528 | ||||||
| Accrued liabilities |
37,599 | 33,596 | ||||||
| Income taxes payable |
508 | 865 | ||||||
| Deferred revenue |
— | 17,258 | ||||||
| Other current liabilities, discontinued operations |
— | 7,921 | ||||||
|
|
|
|
|
|||||
| Total current liabilities |
71,476 | 85,646 | ||||||
| Long-term debt, less current portion |
340,504 | 343,178 | ||||||
| Warrant liability |
21,822 | 15,801 | ||||||
| Other long-term liabilities |
7,916 | 9,042 | ||||||
|
|
|
|
|
|||||
| Total liabilities |
441,718 | 453,667 | ||||||
|
|
|
|
|
|||||
| Commitments and contingencies (Notes 11) |
||||||||
| Stockholders’ equity: |
||||||||
| Preferred stock, $0.001 par value, 10,000 shares authorized, no shares issued |
— | — | ||||||
| Common stock, $0.001 par value, 300,000 shares authorized; 52,958 and 47,548 shares issued and 52,933 and 47,525 shares outstanding as of October 2, 2015 and October 3, 2014, respectively, of which 11 and 59 shares, respectively, are subject to forfeiture |
53 | 48 | ||||||
| Accumulated other comprehensive loss |
(2,279 | ) | (1,354 | ) | ||||
| Additional paid-in capital |
526,011 | 377,714 | ||||||
| Treasury stock, at cost, 23 shares as of October 2, 2015 and October 3, 2014 |
(330 | ) | (330 | ) | ||||
| Accumulated deficit |
(98,922 | ) | (147,511 | ) | ||||
|
|
|
|
|
|||||
| Total stockholders’ equity |
424,533 | 228,567 | ||||||
|
|
|
|
|
|||||
| Total liabilities and stockholders’ equity |
$ | 866,251 | $ | 682,234 | ||||
|
|
|
|
|
|||||
See notes to consolidated financial statements.
60
Table of Contents
M/A-COM TECHNOLOGY SOLUTIONS HOLDINGS, INC.
CONSOLIDATED STATEMENTS OF OPERATIONS
(In thousands, except per share data)
| Fiscal Years | ||||||||||||
| 2015 | 2014 | 2013 | ||||||||||
| Revenue |
$ | 420,609 | $ | 339,189 | $ | 242,703 | ||||||
| Cost of revenue |
217,019 | 198,249 | 133,505 | |||||||||
|
|
|
|
|
|
|
|||||||
| Gross profit |
203,590 | 140,940 | 109,198 | |||||||||
|
|
|
|
|
|
|
|||||||
| Operating expenses: |
||||||||||||
| Research and development |
82,188 | 71,351 | 42,505 | |||||||||
| Selling, general and administrative |
110,030 | 82,593 | 57,930 | |||||||||
| Restructuring charges |
1,280 | 14,823 | 1,060 | |||||||||
|
|
|
|
|
|
|
|||||||
| Total operating expenses |
193,498 | 168,767 | 101,495 | |||||||||
|
|
|
|
|
|
|
|||||||
| Income (loss) from operations |
10,092 | (27,827 | ) | 7,703 | ||||||||
|
|
|
|
|
|
|
|||||||
| Other (expense) income: |
||||||||||||
| Warrant liability expense |
(6,020 | ) | (3,928 | ) | (4,312 | ) | ||||||
| Interest expense |
(18,376 | ) | (12,362 | ) | (817 | ) | ||||||
| Other (expense) income, net |
(1,096 | ) | 3,217 | 372 | ||||||||
|
|
|
|
|
|
|
|||||||
| Other (expense) income, net |
(25,492 | ) | (13,073 | ) | (4,757 | ) | ||||||
|
|
|
|
|
|
|
|||||||
| (Loss) income before income taxes |
(15,400 | ) | (40,900 | ) | 2,946 | |||||||
| Income tax (benefit) provision |
(9,858 | ) | (16,086 | ) | 283 | |||||||
|
|
|
|
|
|
|
|||||||
| (Loss) income from continuing operations |
(5,542 | ) | (24,814 | ) | 2,663 | |||||||
| Income from discontinued operations, net of tax |
54,131 | 9,491 | 15,533 | |||||||||
|
|
|
|
|
|
|
|||||||
| Net income (loss) |
$ | 48,589 | $ | (15,323 | ) | $ | 18,196 | |||||
|
|
|
|
|
|
|
|||||||
| Net income (loss) per share: |
||||||||||||
| Basic income (loss) per common share: |
||||||||||||
| Income (loss) from continuing operations |
$ | (0.11 | ) | $ | (0.53 | ) | $ | 0.06 | ||||
| Income (loss) from discontinued operations |
1.06 | 0.20 | 0.34 | |||||||||
|
|
|
|
|
|
|
|||||||
| Net income (loss) — basic |
$ | 0.95 | $ | (0.33 | ) | $ | 0.40 | |||||
|
|
|
|
|
|
|
|||||||
| Diluted income (loss) per common share: |
||||||||||||
| Income (loss) from continuing operations |
$ | (0.11 | ) | $ | (0.53 | ) | $ | 0.06 | ||||
| Income (loss) from discontinued operations |
1.06 | 0.20 | 0.33 | |||||||||
|
|
|
|
|
|
|
|||||||
| Net income (loss) — diluted |
$ | 0.95 | $ | (0.33 | ) | $ | 0.39 | |||||
|
|
|
|
|
|
|
|||||||
| Shares used to compute net income (loss) per common share: |
||||||||||||
| Basic |
51,146 | 47,009 | 45,916 | |||||||||
|
|
|
|
|
|
|
|||||||
| Diluted |
51,146 | 47,009 | 47,137 | |||||||||
|
|
|
|
|
|
|
|||||||
See notes to consolidated financial statements.
61
Table of Contents
M/A-COM TECHNOLOGY SOLUTIONS HOLDINGS, INC.
CONSOLIDATED STATEMENTS OF COMPREHENSIVE INCOME (LOSS)
(In thousands)
| Fiscal Years | ||||||||||||
| 2015 | 2014 | 2013 | ||||||||||
| Net income (loss) |
48,589 | $ | (15,323 | ) | $ | 18,196 | ||||||
| Unrealized gain (loss) on short term investments, net of tax |
(97 | ) | — | |||||||||
| Foreign currency translation gain (loss), net of tax |
(918 | ) | (1,097 | ) | (30 | ) | ||||||
| Other adjustments, net of tax |
90 | (90 | ) | — | ||||||||
|
|
|
|
|
|
|
|||||||
| Other comprehensive income |
(925 | ) | (1,187 | ) | (30 | ) | ||||||
|
|
|
|
|
|
|
|||||||
| Total comprehensive income (loss) |
$ | 47,664 | $ | (16,510 | ) | $ | 18,166 | |||||
|
|
|
|
|
|
|
|||||||
See notes to consolidated financial statements.
62
Table of Contents
M/A-COM TECHNOLOGY SOLUTIONS HOLDINGS, INC.
CONSOLIDATED STATEMENTS OF STOCKHOLDERS’ EQUITY
(In thousands, except per share data)
| Accumulated Other Comprehensive Loss |
Additional Paid-In Capital |
Accumulated Deficit |
Total Stockholders’ Equity |
|||||||||||||||||||||||||||||
| Common Stock | Treasury Stock | |||||||||||||||||||||||||||||||
| Shares | Amount | Shares | Amount | |||||||||||||||||||||||||||||
| Balance — September 28, 2012 |
45,452 | $ | 45 | 43 | $ | (685 | ) | $ | (137 | ) | $ | 361,616 | $ | (150,384 | ) | $ | 210,455 | |||||||||||||||
| Capital contributions |
— | — | — | — | — | 8,435 | — | 8,435 | ||||||||||||||||||||||||
| Stock option exercises |
614 | 1 | — | — | — | 604 | — | 605 | ||||||||||||||||||||||||
| Vesting of restricted common stock and units |
248 | — | — | — | — | — | — | — | ||||||||||||||||||||||||
| Issuance of common stock pursuant to employee stock purchase plan |
131 | — | — | — | — | 1,281 | — | 1,281 | ||||||||||||||||||||||||
| Shares repurchased for tax withholdings on stock awards |
— | — | 6 | (77 | ) | — | — | — | (77 | ) | ||||||||||||||||||||||
| Retirement of treasury stock |
(26 | ) | — | (26 | ) | 432 | — | (432 | ) | — | ||||||||||||||||||||||
| Share-based and other incentive compensation |
— | — | — | — | — | 6,096 | — | 6,096 | ||||||||||||||||||||||||
| Excess tax benefits |
— | — | — | — | — | 2,180 | — | 2,180 | ||||||||||||||||||||||||
| Other comprehensive income |
— | — | — | — | (30 | ) | — | — | (30 | ) | ||||||||||||||||||||||
| Net income |
— | — | — | — | — | — | 18,196 | 18,196 | ||||||||||||||||||||||||
|
|
|
|
|
|
|
|
|
|
|
|
|
|
|
|
|
|||||||||||||||||
| Balance — September 27, 2013 |
46,419 | $ | 46 | 23 | $ | (330 | ) | $ | (167 | ) | $ | 379,780 | $ | (132,188 | ) | $ | 247,141 | |||||||||||||||
| Capital contributions |
— | — | — | — | — | 3,200 | — | 3,200 | ||||||||||||||||||||||||
| Common control business combination |
— | — | — | — | — | (26,080 | ) | — | (26,080 | ) | ||||||||||||||||||||||
| Common control tax benefits |
— | — | — | — | — | 6,069 | — | 6,069 | ||||||||||||||||||||||||
| Stock option exercises |
515 | 1 | — | — | — | 2,218 | — | 2,219 | ||||||||||||||||||||||||
| Issuance of common stock pursuant to employee stock purchase plan |
150 | — | — | — | — | 1,810 | — | 1,810 | ||||||||||||||||||||||||
| Vesting of restricted common stock and units |
536 | 1 | — | — | — | — | — | 1 | ||||||||||||||||||||||||
| Shares repurchased for tax withholdings on stock awards |
(72 | ) | — | — | — | — | (1,282 | ) | — | (1,282 | ) | |||||||||||||||||||||
| Share-based and other incentive compensation |
— | — | — | — | — | 11,277 | — | 11,277 | ||||||||||||||||||||||||
| Fair value of vested awards assumed in acquisition |
— | — | — | — | — | 785 | — | 785 | ||||||||||||||||||||||||
| Excess tax benefits |
— | — | — | — | — | (63 | ) | — | (63 | ) | ||||||||||||||||||||||
| Other comprehensive income |
— | — | — | — | (1,187 | ) | — | — | (1,187 | ) | ||||||||||||||||||||||
| Net loss |
— | — | — | — | — | — | (15,323 | ) | (15,323 | ) | ||||||||||||||||||||||
|
|
|
|
|
|
|
|
|
|
|
|
|
|
|
|
|
|||||||||||||||||
| Balance — October 3, 2014 |
47,548 | $ | 48 | 23 | $ | (330 | ) | $ | (1,354 | ) | $ | 377,714 | $ | (147,511 | ) | $ | 228,567 | |||||||||||||||
(Continued)
63
Table of Contents
M/A-COM TECHNOLOGY SOLUTIONS HOLDINGS, INC.
CONSOLIDATED STATEMENTS OF STOCKHOLDERS’ EQUITY
(In thousands, except per share data)
| Accumulated Other Comprehensive Loss |
Additional Paid-In Capital |
Accumulated Deficit |
Total Stockholders’ Equity |
|||||||||||||||||||||||||||||
| Common Stock | Treasury Stock | |||||||||||||||||||||||||||||||
| Shares | Amount | Shares | Amount | |||||||||||||||||||||||||||||
| Balance — October 3, 2014 |
47,548 | $ | 48 | 23 | $ | (330 | ) | $ | (1,354 | ) | $ | 377,714 | $ | (147,511 | ) | $ | 228,567 | |||||||||||||||
|
|
|
|
|
|
|
|
|
|
|
|
|
|
|
|
|
|||||||||||||||||
| Common stock issued, net of issuance costs |
4,500 | 5 | — | — | — | 127,756 | — | 127,761 | ||||||||||||||||||||||||
| Vesting of restricted common stock and units |
704 | 1 | — | — | — | — | — | 1 | ||||||||||||||||||||||||
| Stock option exercises |
288 | — | — | — | — | 2,613 | — | 2,613 | ||||||||||||||||||||||||
| Issuance of common stock pursuant to employee stock purchase plan |
176 | — | — | — | — | 2,838 | — | 2,838 | ||||||||||||||||||||||||
| Shares repurchased for tax withholdings on stock awards |
(258 | ) | (1 | ) | — | — | (8,555 | ) | — | (8,556 | ) | |||||||||||||||||||||
| Share-based and other incentive compensation |
— | — | — | — | — | 20,655 | — | 20,655 | ||||||||||||||||||||||||
| Excess tax benefits |
— | — | — | — | — | 2,990 | — | 2,990 | ||||||||||||||||||||||||
| Other comprehensive income |
— | — | — | — | (925 | ) | — | — | (925 | ) | ||||||||||||||||||||||
| Net income |
— | — | — | — | — | — | 48,589 | 48,589 | ||||||||||||||||||||||||
|
|
|
|
|
|
|
|
|
|
|
|
|
|
|
|
|
|||||||||||||||||
| Balance — October 2, 2015 |
52,958 | $ | 53 | 23 | $ | (330 | ) | $ | (2,279 | ) | $ | 526,011 | $ | (98,922 | ) | $ | 424,533 | |||||||||||||||
|
|
|
|
|
|
|
|
|
|
|
|
|
|
|
|
|
|||||||||||||||||
See notes to consolidated financial statements.
64
Table of Contents
M/A-COM TECHNOLOGY SOLUTIONS HOLDINGS, INC.
CONSOLIDATED STATEMENTS OF CASH FLOWS
(In thousands)
| Fiscal Years | ||||||||||||
| 2015 | 2014 | 2013 | ||||||||||
| CASH FLOWS FROM OPERATING ACTIVITIES: |
||||||||||||
| Net income (loss) |
$ | 48,589 | $ | (15,323 | ) | $ | 18,196 | |||||
| Adjustments to reconcile net income (loss) to net cash from operating activities (net of acquisition): |
||||||||||||
| Depreciation and intangible amortization |
54,708 | 34,618 | 14,822 | |||||||||
| Stock-based and other noncash incentive compensation |
19,435 | 11,277 | 6,096 | |||||||||
| Warrant liability expense |
6,020 | 3,928 | 4,312 | |||||||||
| Acquired inventory step-up amortization |
5,533 | 18,053 | — | |||||||||
| Deferred financing costs amortization and write-offs |
1,651 | 3,021 | 321 | |||||||||
| Gain on disposition of business |
(63,256 | ) | — | — | ||||||||
| Impairment of minority equity investment |
3,500 | — | — | |||||||||
| Acquisition prepaid compensation amortization |
9,623 | — | — | |||||||||
| Deferred income taxes |
7,835 | (13,328 | ) | (4,650 | ) | |||||||
| Other adjustments |
740 | 186 | (530 | ) | ||||||||
| Change in operating assets and liabilities (net of acquisition): |
||||||||||||
| Accounts receivable |
(13,089 | ) | 2,223 | (8,495 | ) | |||||||
| Inventories |
92 | (9,586 | ) | 3,368 | ||||||||
| Prepaid expenses and other assets |
3,932 | (646 | ) | (4,753 | ) | |||||||
| Prepaid compensation |
(14,586 | ) | — | — | ||||||||
| Accounts payable |
(1,858 | ) | (7,140 | ) | (3,642 | ) | ||||||
| Accrued and other liabilities |
(5,640 | ) | (6,726 | ) | 4,337 | |||||||
| Income taxes |
(12,512 | ) | (2,656 | ) | 3,714 | |||||||
| Deferred revenue |
(17,039 | ) | 7,571 | 1,135 | ||||||||
| Payment of contingent consideration |
— | — | (5,328 | ) | ||||||||
|
|
|
|
|
|
|
|||||||
| Net cash from operating activities |
33,678 | 25,472 | 28,903 | |||||||||
|
|
|
|
|
|
|
|||||||
| CASH FLOWS FROM INVESTING ACTIVITIES: |
||||||||||||
| Purchases of property and equipment |
(38,252 | ) | (16,973 | ) | (12,336 | ) | ||||||
| Strategic investments |
1,500 | (5,250 | ) | — | ||||||||
| Purchase of short-term investments |
(40,183 | ) | — | — | ||||||||
| Acquisition of intellectual property |
(3,346 | ) | (5,490 | ) | (897 | ) | ||||||
| Acquisition of businesses, net |
(208,352 | ) | (260,875 | ) | — | |||||||
| Sale of product line |
— | 12,000 | — | |||||||||
| Sale of businesses |
81,208 | 12,345 | — | |||||||||
|
|
|
|
|
|
|
|||||||
| Net cash used in investing activities |
(207,425 | ) | (264,243 | ) | (13,233 | ) | ||||||
|
|
|
|
|
|
|
|||||||
| CASH FLOWS FROM FINANCING ACTIVITIES: |
||||||||||||
| Proceeds from stock offering, net of issuance costs of $827 |
127,761 | — | — | |||||||||
| Borrowings from revolving credit facility |
100,000 | 245,000 | — | |||||||||
| Payments on revolving credit facility |
(100,000 | ) | (245,000 | ) | — | |||||||
| Borrowings from notes payable |
— | 350,000 | — | |||||||||
| Payments on notes payable |
(3,500 | ) | (3,500 | ) | — | |||||||
| Payments of assumed debt |
(1,504 | ) | (40,917 | ) | — | |||||||
| Repurchase of common stock |
(8,626 | ) | (1,282 | ) | (77 | ) | ||||||
| Proceeds from stock option exercises and employee stock purchases |
5,450 | 4,028 | 1,886 | |||||||||
| Capital contributions |
— | 3,200 | 8,435 | |||||||||
| Other adjustments |
2,826 | (9,169 | ) | (26 | ) | |||||||
|
|
|
|
|
|
|
|||||||
| Net cash from financing activities |
122,407 | 302,360 | 10,218 | |||||||||
|
|
|
|
|
|
|
|||||||
| Effect of exchange rate changes on cash and cash equivalents |
(243 | ) | (182 | ) | — | |||||||
| NET INCREASE (DECREASE) IN CASH AND CASH EQUIVALENTS |
(51,583 | ) | 63,407 | 25,888 | ||||||||
| CASH AND CASH EQUIVALENTS — Beginning of year |
$ | 173,895 | $ | 110,488 | 84,600 | |||||||
|
|
|
|
|
|
|
|||||||
| CASH AND CASH EQUIVALENTS — End of year |
$ | 122,312 | $ | 173,895 | $ | 110,488 | ||||||
|
|
|
|
|
|
|
|||||||
See notes to consolidated financial statements.
65
Table of Contents
M/A-COM TECHNOLOGY SOLUTIONS HOLDINGS, INC.
NOTES TO CONSOLIDATED FINANCIAL STATEMENTS
1. DESCRIPTION OF BUSINESS
M/A-COM Technology Solutions Holdings, Inc. (the Company) was incorporated in Delaware on March 25, 2009. We are a leading provider of high-performance analog semiconductor solutions that enable the next-generation internet applications, the cloud connected apps economy, and the modern, networked battlefield across the radio frequency (RF), microwave, and millimeterwave spectrum. We design and manufacture differentiated, high-value products for customers who demand high performance, quality, and reliability.
2. SUMMARY OF SIGNIFICANT ACCOUNTING POLICIES
Principles of Consolidation, Basis of Presentation and Reclassification—We have one reportable segment, semiconductors and modules. The accompanying consolidated financial statements include our accounts and the accounts of our majority-owned subsidiaries. All intercompany balances and transactions have been eliminated in consolidation. Certain prior period financial statement amounts, including Automotive business discontinued operations have been adjusted to conform to current reported presentations.
We have a 52 or 53-week fiscal year ending on the Friday closest to the last day of September. The fiscal year 2015 includes 52 weeks, fiscal year 2014 included 53 weeks and fiscal year 2013 included 52 weeks. To offset the effect of holidays, for fiscal years in which there are 53 weeks, we include the extra week arising in our fiscal years in the first quarter.
Use of Estimates—The preparation of consolidated financial statements in conformity with accounting principles generally accepted in the U.S. requires management to make estimates and assumptions that affect the reported amounts of assets and liabilities during the reporting periods, the reported amounts of revenue and expenses during the reporting periods, and the disclosure of contingent assets and liabilities at the date of the financial statements. On an ongoing basis, we base estimates and assumptions on historical experience, currently available information, and various other factors that management believes to be reasonable under the circumstances. Actual results may differ materially from these estimates and assumptions.
Discontinued Operations—In the fourth quarter of fiscal year 2015, we divested our Automotive business. In the second quarter of fiscal year 2014, we sold assets of the non-core wireless business of Mindspeed. The operating results of these businesses are reflected in discontinued operations.
Foreign Currency Translation and Remeasurement—Our consolidated financial statements are presented in U.S. dollars. While the majority of our foreign operations use the U.S. dollar as the functional currency, the financial statements of our foreign operations for which the functional currency is not the U.S. dollar are translated into U.S. dollars at the exchange rates in effect at the balance sheet dates (for assets and liabilities) and at average exchange rates (for revenue and expenses). The unrealized translation gains and losses on the net investment in these foreign operations are accumulated as a component of other comprehensive income (loss).
The financial statements of our foreign operations where the functional currency is the U.S. dollar, but where the underlying transactions are transacted in a different currency, are remeasured at the exchange rate in effect at the balance sheet date with respect to monetary assets and liabilities. Nonmonetary assets and liabilities, such as inventories and property and equipment, and related statements of operations accounts, such as cost of revenue and depreciation, are remeasured at historical exchange rates. Revenue and expenses, other than cost of revenue, amortization and depreciation, are translated at the average exchange rate for the period in which the transaction occurred. The net gains and losses on foreign currency remeasurement are reflected in selling, general
66
Table of Contents
and administrative expense in the accompanying consolidated statements of operations. Net foreign exchange gains and losses for all periods presented were immaterial.
Cash and Cash Equivalents—Cash equivalents are primarily composed of short-term, highly-liquid instruments with an original maturity of three months or less.
Investments—We classify our investments as available-for-sale. Our investments classified as available-for-sale are recorded at fair value based upon quoted market prices at period end. Unrealized gains and losses that are deemed temporary in nature are recorded in accumulated other comprehensive income and loss as a separate component of stockholders’ equity.
A decline in the fair value of any security below cost that is deemed other than temporary results in a charge to earnings and the corresponding establishment of a new cost basis for the security. Premiums and discounts are amortized (accreted) over the life of the related security as an adjustment to its yield. Dividend and interest income are recognized when earned. Realized gains and losses are included in earnings and are derived using the specific identification method for determining the cost of investments sold.
Inventories—Inventories are stated at the lower of cost or market. We use a combination of standard cost and moving weighted-average cost methodologies to determine the cost basis for our inventories, approximating a first-in, first-out basis. The standard cost of finished goods and work-in-process inventory is composed of material, labor and manufacturing overhead, which approximates actual cost. In addition to stating inventory at the lower of cost or market, we also evaluate inventory each reporting period for excess quantities and obsolescence, establishing reserves when necessary based upon historical experience, assessment of economic conditions and expected demand. Once recorded, these reserves are considered permanent adjustments to the carrying value of inventory.
Property and Equipment—Property and equipment are stated at cost, less accumulated depreciation and amortization. Expenditures for maintenance and repairs are charged to expense as incurred, whereas major improvements that significantly extend the useful life of the assets are capitalized as additions to property and equipment.
Property and equipment are depreciated or amortized using the straight-line method over the following estimated useful lives:
| Asset Classification |
Estimated Useful Life In Years | |
| Buildings and improvements |
40 | |
| Machinery and equipment |
2 – 7 | |
| Computer equipment and software |
2 – 5 | |
| Furniture and fixtures |
7 – 10 | |
| Leasehold improvements |
Shorter of useful life or term of lease |
Goodwill and Indefinite-lived Intangible Assets—We have goodwill and certain intangible assets with indefinite-lives which are not subject to amortization; these are reviewed for impairment annually during our fiscal fourth quarter and more frequently if events or changes in circumstances indicate that the assets may be impaired. For our assessment of goodwill impairment we compare the carrying value of the reporting unit to the fair value of the Company. If impairment exists, a loss would be recorded to write down the value of the indefinite-lived assets to their implied fair values. There have been no impairments of goodwill or indefinite-lived intangible assets in any period presented through October 2, 2015.
Other Intangible Assets—Our other intangible assets, including acquired technology and customer relationships, are definite-lived assets and are subject to amortization. We amortize definite-lived assets over
67
Table of Contents
their estimated useful lives, which range from five to ten years, generally based on the pattern over which we expect to receive the economic benefit from these assets.
Impairment of Long-Lived Assets—Long-lived assets include property and equipment and definite-lived intangible assets subject to amortization. We evaluate long-lived assets for recoverability when events or changes in circumstances indicate that their carrying amounts may not be recoverable. Circumstances which could trigger a review include, but are not limited to, significant decreases in the market price of the asset or asset group, significant adverse changes in the business climate or legal factors, the accumulation of costs significantly in excess of the amount originally expected for the acquisition or construction of the asset, current period cash flow or operating losses combined with a history of losses or a forecast of continuing losses associated with the use of the asset and a current expectation that the asset will more likely than not, be sold or disposed of significantly before the end of its previously estimated useful life.
In evaluating a long-lived asset for recoverability, we estimate the undiscounted cash flows expected to result from our use and eventual disposition of the asset. If the sum of the expected undiscounted cash flows is less than the carrying amount of the asset, an impairment loss, equal to the excess of the carrying amount over the fair value of the asset, is recognized. There were no impairments of long-lived assets in any period presented. Intangible assets related to in-process research and development acquired are not amortized until the underlying asset begins revenue generating activity, at which time it is amortized over its estimated useful life. Intangibles related to abandoned in-process research and development projects are expensed in the period the project is abandoned.
Revenue Recognition—We recognize revenue when: (i) persuasive evidence of an arrangement exists; (ii) delivery or services have been rendered; (iii) the price is fixed or determinable; and (iv) collectability is reasonably assured. We recognize revenue with the transfer of title and risk of loss and provide for reserves for returns and other allowances.
We generally do not provide customers other than distributors the right to return product, with the exception of warranty related matters. Accordingly, we do not typically maintain a reserve for customers. Shipping and handling fees billed to customers are recorded as revenue while the related costs are classified as a component cost of revenue. We provide warranties for certain products and accrue the costs of warranty claims in the period the related revenue is recorded.
Prior to fiscal 2015, we had concluded that we had insufficient information as well as limited experience in estimating the effect of the right of distributors to return product and price protection and, accordingly, used the sell through approach of revenue recognition. Under this approach, we would recognize revenue from sales after the distributor resold the product to its end customer (the sell through basis). After concluding an extensive three year study of distributor related transactions, we completed an evaluation of our revenue recognition policy and concluded that it was more appropriate to recognize revenue to distributors at the time of shipment to the distributor (sell-in basis). We believe we now have sufficient data to predict future price adjustments from distributors and has a basis of being able to reasonably estimate these future price adjustments.
On a consolidated basis, revenue from distribution customers impacted by the change in estimate accounts for approximately 20-25% of total consolidated revenue. Certain agreements with distribution customers provide for rights of return and compensation credits until such time as our products are sold by the distributors to their end customers. We have agreements with some distribution customers for various programs, including compensation, volume-based pricing, obsolete inventory, new products and stock rotation. Sales to these distribution customers, as well as the existence of compensation programs, are in accordance with terms set forth in written agreements with these distribution customers. In general, credits allowed under these programs are capped based upon individual distributor agreements. We record charges associated with these programs as a reduction of revenue at the time of sale with a corresponding adjustment to accounts receivable based upon
68
Table of Contents
historical activity. Our policy is to use a 12 month rolling historical experience rate and an estimated general reserve percentage in order to estimate the necessary allowance to be recorded.
During the first fiscal quarter of 2015, we recorded corresponding adjustments related to this change in estimate to recognize previously deferred revenues. The net effect was an increase of $15.1 million, of which $12.4 million was from previously deferred revenue and $2.7 million was related to the change in distributor inventories. Additionally, we recognized the related deferred inventory costs of $4.7 million which resulted in a reduction to net loss of $8.5 million, or a reduction of $0.18 net loss per share when the change in estimate was recorded. The full year impact of this change in estimate resulted in additional revenue of $17.4 million and a net income of $7.7 million, or $0.15 earnings per share.
We also established a new reserve of $5.6 million during the first quarter of fiscal year 2015 which was increased to $6.0 million for the fiscal year ended October 2, 2015 related to future rebates and returns under various programs associated with our distributor agreements. The amount of this reserve is largely driven by the individual distribution agreements and our business strategy whereby we will invoice the distributor at “list price”. We expect to issue compensation credits consistent with the distributor agreements. The difference between the list price and distributor selling price will vary by product grouping consistent with historical trends and marketing strategies. Historically, 90 percent of the credits issued to distributors are based on “list price” credits and 10 percent of the credits were for product returns and stock rotation rights, based upon the 12 month rolling historical experience rate.
The table below shows the changes in gross and net distributor revenue and reserve balances associated with the change in estimate for the fiscal year ended October 2, 2015 (in thousands):
| Three Months Ended | Fiscal Year | |||||||||||||||||||
| January 2, 2015 |
April 3, 2015 |
July 3, 2015 |
October 2, 2015 |
2015 | ||||||||||||||||
| Gross revenue effect of one-time change in estimate (1) |
$ | 17,028 | $ | — | $ | — | $ | — | $ | 17,028 | ||||||||||
| Gross revenue effect associated with change in estimate (2) |
3,636 | 4,687 | (1,687 | ) | (351 | ) | 6,285 | |||||||||||||
|
|
|
|
|
|
|
|
|
|
|
|||||||||||
| Total gross revenue resulting from change in estimate |
20,664 | 4,687 | (1,687 | ) | (351 | ) | 23,313 | |||||||||||||
|
|
|
|
|
|
|
|
|
|
|
|||||||||||
| Net revenue effect of one-time change in estimate (3) |
12,457 | — | — | 12,457 | ||||||||||||||||
| Net revenue effect associated with change in estimate (4) |
2,643 | 3,686 | (1,296 | ) | (134 | ) | 4,899 | |||||||||||||
|
|
|
|
|
|
|
|
|
|
|
|||||||||||
| Total net revenue resulting from change in estimate |
15,100 | 3,686 | (1,296 | ) | (134 | ) | 17,356 | |||||||||||||
|
|
|
|
|
|
|
|
|
|
|
|||||||||||
| Reserve for future returns and credits (5) |
$ | 5,564 | $ | 1,001 | $ | (391 | ) | $ | (217 | ) | $ | 5,957 | ||||||||
|
|
|
|
|
|
|
|
|
|
|
|||||||||||
| (1) | This amount was recorded as deferred revenue as of October 3, 2014. |
| (2) | This amount represents the impact of the change in estimate associated with increases in distributor inventories as compared to the prior reporting period. |
| (3) | This amount represents the net revenue impact of the one-time change in estimate after applying the associated reserve for future credits and returns. |
| (4) | This amount represents the impact of the change in estimate associated with increases in distributor inventories as compared to the prior reporting period after applying the associated reserve for future credits and returns. |
| (5) | This amount reflects the change in the revenue reserve for future returns and credits. |
69
Table of Contents
Accounts Receivable Allowances—The activity in our accounts receivable allowances which includes compensation credits, customer returns, doubtful accounts and other items are as follows (in thousands):
| Fiscal year | ||||||||||||
| 2015 | 2014 | 2013 | ||||||||||
| Beginning balance |
$ | 725 | $ | 514 | $ | 834 | ||||||
| Provisions (recoveries), net |
5,056 | 250 | (259 | ) | ||||||||
| Charge-offs |
(36 | ) | (39 | ) | (61 | ) | ||||||
|
|
|
|
|
|
|
|||||||
| Ending balance |
$ | 5,745 | $ | 725 | $ | 514 | ||||||
|
|
|
|
|
|
|
|||||||
Includes compensation credits and customer returns allowance of $5.5 million, $0.4 million and $0.3 million for fiscal years 2015, 2014 and 2013, respectively. Includes allowance for doubtful accounts of $0.2 million for fiscal 2015, 2014 and 2013.
Research and Development Costs—Costs incurred in the research and development of products are expensed as incurred.
Income Taxes—Deferred tax assets and liabilities are recognized based on temporary differences between the financial reporting and income tax bases of assets and liabilities, using rates anticipated to be in effect when such temporary differences reverse. A valuation allowance against net deferred tax assets is required if, based upon the available evidence, it is more likely than not that some or all of the deferred tax assets will not be realized.
We provide reserves for potential payments of tax to various tax authorities related to uncertain tax positions and other issues. Reserves are based on a determination of whether and how much of a tax benefit is taken by us in our tax filings or positions and that are more likely than not to be realized following an examination by taxing authorities. We recognize the financial statement benefit of an uncertain tax position only after considering the probability that a tax authority would sustain the position in an examination. For tax positions meeting a “more-likely-than-not” threshold, the amount recognized in the financial statements is the benefit expected to be realized upon settlement with the tax authority. For tax positions not meeting the threshold, no financial statement benefit is recognized. Potential interest and penalties associated with such uncertain tax positions are recorded as a component of income tax expense.
Nitronex elected, for U.S. income tax purposes, to be taxed as a limited-liability company. As such, for the periods prior to its acquisition by us, Nitronex’s federal and state income taxes are the responsibility of GaAs Labs and no provision for income taxes is recorded in the financial statements for such periods.
Earnings Per Share—Basic net income (loss) per share is computed by dividing net income (loss) attributable to common stockholders by the weighted-average number of common shares outstanding during the period, excluding the dilutive effect of common stock equivalents. Diluted net income (loss) per share reflects the dilutive effect of common stock equivalents, such as stock options, warrants, and restricted stock units, using the treasury stock method.
Fair Value Measurements—Financial assets and liabilities are measured at fair value. Fair value is an exit price, representing the amount that would be received from the sale of an asset or paid to transfer a liability in an orderly transaction between market participants. As such, fair value is a market-based measurement that should be determined based on assumptions that market participants would use in pricing an asset or liability. As a basis for considering such assumptions, we group financial assets and liabilities in a three-tier fair value hierarchy, according to the inputs used in measuring fair value as follows: Level 1—observable inputs such as quoted prices in active markets for identical assets and liabilities; Level 2—inputs other than quoted prices in active markets that are observable either directly or indirectly, such as quoted prices in active markets for similar assets and liabilities, quoted prices for identical assets and liabilities in markets that are not active, and model-based valuation techniques for which significant assumptions are observable in active markets; and Level 3—unobservable inputs for which there is little or no market data, requiring us to develop our own assumptions for model-based valuation techniques. This hierarchy requires us to use observable market data, when available, and to minimize the use of unobservable inputs when determining fair value.
70
Table of Contents
The carrying amounts of cash and cash equivalents, accounts receivable, accounts payable, and accrued liabilities approximate fair value due to the short-term nature of these assets and liabilities.
Contingent Consideration—We estimate and record at the acquisition date, the fair value of contingent consideration making up part of the purchase price consideration for acquisitions. Additionally, at each reporting period, we estimate the change in the fair value of contingent consideration, and any change in fair value is recognized in the consolidated statements of operations. We estimate the fair value of contingent consideration by discounting the associated expected cash flows, using a probability-weighted, discounted cash flow model. The estimate of the fair value of contingent consideration requires subjective assumptions to be made regarding future operating results, discount rates, and probabilities assigned to various potential operating result scenarios.
Share-Based Compensation—We account for all share-based compensation arrangements using the fair value method. We recognize compensation expense over the requisite service period of the award, which is generally the vesting period, using the straight-line method and providing that the minimum amount of compensation recorded is equal to the vested portion of the award. We record the expense in the consolidated statements of operations in the same manner in which the award recipients’ costs are classified. We use the Black-Scholes option-pricing model to estimate the fair value of stock options, inclusive of assumptions for risk-free interest rates, dividends, expected terms, and estimated volatility. We derive the risk-free interest rate assumption from the U.S. Treasury’s rates for U.S. Treasury zero-coupon bonds with maturities similar to the expected term of the award being valued. We base the assumed dividend yield on its expectation of not paying dividends in the foreseeable future. We calculate the weighted-average expected term of the options using the simplified method, which is a method of applying a formula that uses the vesting term and the contractual term to compute the expected term of a stock option. The decision to use the simplified method is based on a lack of relevant historical data, due to our limited operating experience. In addition, due to our limited historical data, we incorporate the historical volatility of comparable companies with publicly available share prices to determine estimated volatility. The accounting for stock options requires forfeitures to be estimated at the time of grant and revised, if necessary, in subsequent periods if actual forfeitures differ from those estimates.
Guarantees and Indemnification Obligations—We enter into agreements in the ordinary course of business with, among others, customers, distributors, and original equipment manufacturers (OEM). Most of these agreements require us to indemnify the other party against third-party claims alleging that a Company product infringes a patent and/or copyright. Certain agreements in which we grant limited licenses to specific Company trademarks require us to indemnify the other party against third-party claims alleging that the use of the licensed trademark infringes a third-party trademark. Certain of these agreements require us to indemnify the other party against certain claims relating to property damage, personal injury, or the acts or omissions, its employees, agents, or representatives. In addition, from time to time, we have made certain guarantees in the form of warranties regarding the performance of Company products to customers.
We have agreements with certain vendors, creditors, lessors, and service providers pursuant to which we have agreed to indemnify the other party for specified matters, such as acts and omissions, its employees, agents, or representatives.
We have procurement or license agreements with respect to technology that are used in our products and agreements in which we obtain rights to a product from an OEM. Under some of these agreements, we have agreed to indemnify the supplier for certain claims that may be brought against such party with respect to our acts or omissions relating to the supplied products or technologies.
Our certificate of incorporation and agreements with certain of our directors and officers and certain of our subsidiaries’ directors and officers provide them indemnification rights, to the extent legally permissible, against liabilities incurred by them in connection with legal actions in which they may become involved by reason of their service as a director or officer. As a matter of practice, we have maintained director and officer liability insurance coverage, including coverage for directors and officers of acquired companies.
71
Table of Contents
We have not experienced any losses related to these indemnification obligations in any period presented, and no claims with respect thereto were outstanding as of October 2, 2015. We do not expect significant claims related to these indemnification obligations and, consequently, have concluded that the fair value of these obligations is negligible. No liabilities related to indemnification liabilities have been established.
Recent Accounting Pronouncements—In May 2014, the FASB issued ASU 2014-09, Revenue from Contracts with Customers. ASU 2014-09 requires revenue recognition to depict the transfer of goods or services to customers in an amount that reflects the consideration to which the entity expects to be entitled in exchange for those goods or services. ASU 2014-09 sets forth a new revenue recognition model that requires identifying the contract, identifying the performance obligations, determining the transaction price, allocating the transaction price to performance obligations and recognizing the revenue upon satisfaction of performance obligations. The amendments in ASU 2014-09 can be applied either retrospectively to each prior reporting period presented or retrospectively with the cumulative effect of initially applying the update recognized at the date of the initial application along with additional disclosures. On July 9, 2015, the FASB voted to defer the effective date by one year to interim and annual reporting periods beginning after December 15, 2017, and permitted early adoption of the standard, but not for periods beginning on or before the original effective date of December 15, 2016. We have not yet selected a transition method and are currently evaluating the impact of ASU 2014-09.
In June 2014, the FASB issued ASU 2014-12-Compensation-Stock Compensation (Topic 718): Accounting for Share-Based Payments When the Terms of an Award Provide That a Performance Target Could Be Achieved after the Requisite Service Period (a consensus of the FASB Emerging Issues Task Force) which addresses how to account for share-based performance awards including determining rendering service on the date the performance target is achieved. We are currently evaluating the impact of ASU 2014-12, which is effective for annual periods and interim periods within those annual periods, beginning after December 15, 2015.
In February 2015, the FASB issued ASU 2015-02, Consolidation: Amendments to the Consolidation Analysis. ASU 2015-02 address concerns regarding the current accounting for consolidation of certain legal entities. A reporting entity may apply the amendments in this Update using a modified retrospective approach by recording a cumulative-effect adjustment to equity as of the beginning of the fiscal year of adoption. A reporting entity also may apply the amendments retrospectively. We are currently evaluating the impact of ASU 2015-02, which is effective for us in our fiscal years, and for interim periods within those fiscal years, beginning after December 15, 2015.
In April 2015, the FASB issued ASU 2015-03, Interest-Imputation of Interest: Simplifying the Presentation of Debt Issuance Costs. ASU 2015-03 requires that debt issuance costs related to a recognized debt liability be presented in the balance sheet as a direct deduction from the carrying amount of that debt liability, consistent with debt discounts. We are currently evaluating the impact which is effective for us in our fiscal years beginning after December 15, 2015, and interim periods within those fiscal years.
In August 2015, the FASB issued Accounting Standards Update 2015-15 (“ASU 2015-15”), “Presentation and Subsequent Measurement of Debt Issuance Costs Associated with Line-of-Credit Arrangements.” ASU 2015-15 supplements the requirements of ASU 2015-03 by allowing an entity to defer and present debt issuance costs related to a line of credit arrangement as an asset and subsequently amortize the deferred costs ratably over the term of the line of credit arrangement. We are currently evaluating the impact and do not expect the adoption to have a material impact on our consolidated financial statements.
In September 2015, the FASB issued ASU 2015-16, “Business Combinations (Topic 805): Simplifying the Accounting for Measurement-Period Adjustments,” which eliminates the requirement for an acquirer in a business combination to account for measurement-period adjustments retrospectively. Acquirers would now recognize measurement-period adjustments during the period in which they determine the amount of the adjustment. This ASU is effective for annual and interim reporting periods beginning after December 15, 2015, including interim periods within those fiscal years, and should be applied prospectively to adjustments for provisional amounts that occur after the effective date with early adoption permitted for financial statements that have not been issued. We do not expect the adoption to have a material impact on our consolidated financial statements.
72
Table of Contents
Evaluation of Subsequent Events—Management has evaluated subsequent events for potential recognition or disclosure in the accompanying audited consolidated financial statements through the date of the issuance of the consolidated financial statements. Subsequent events are events or transactions that occurred after the balance sheet date but before the accompanying consolidated financial statements are issued. See Note 25 to the Consolidated Financial Statements.
3. ACQUISITIONS
Acquisition of BinOptics Corporation—On December 15, 2014, we completed the acquisition of BinOptics, a supplier of high-performance photonic semiconductor products. In accordance with the related Agreement and Plan of Merger, all of the outstanding equity interests (including outstanding warrants) of BinOptics were exchanged for aggregate consideration of approximately $208.4 million in cash. In addition we paid $14.6 million as part of a related retention escrow agreement designed to retain certain BinOptics employees. This $14.6 million was included in the terms of the purchase agreement and has been accounted for as a post-closing prepaid expense. We funded the BinOptics Acquisition with a combination of cash on hand and the incurrence of $100.0 million of additional borrowings under our existing Revolving Facility. For the twelve months ended October 2, 2015, we recorded transaction costs of approximately $4.2 million related to the BinOptics Acquisition in selling, general and administrative expense in the accompanying consolidated statements of operations.
The BinOptics Acquisition was accounted for as a purchase and the operations of BinOptics have been included in our consolidated financial statements since the date of acquisition.
We recognize the BinOptics assets acquired and liabilities assumed based upon the fair value of such assets and liabilities measured as of the date of acquisition. The aggregate purchase price for BinOptics is being allocated to the tangible and identifiable intangible assets acquired and liabilities assumed based on their estimated fair values at the date of acquisition. The excess of the purchase price over the fair value of the acquired net assets represents cost and revenue synergies specific to the Company, as well as non-capitalizable intangible assets, such as the employee workforce acquired, and has been allocated to goodwill, none of which is tax deductible.
The Company expects to finalize its allocation of purchase price within 12 months of December 15, 2014. The preliminary allocation of purchase price as of October 2, 2015, is as follows (in thousands):
| Original Allocation |
Allocation Adjustments |
October 2, 2015 Adjusted Allocation |
||||||||||
| Current assets |
$ | 41,836 | $ | (18,162 | ) | $ | 23,674 | |||||
| Intangible assets |
135,254 | 1,646 | 136,900 | |||||||||
| Other assets |
14,090 | (4,896 | ) | 9,194 | ||||||||
|
|
|
|
|
|
|
|||||||
| Total assets acquired |
191,180 | (21,412 | ) | 169,768 | ||||||||
|
|
|
|
|
|
|
|||||||
| Liabilities assumed: |
||||||||||||
| Debt |
1,491 | 1,044 | 2,535 | |||||||||
| Deferred income taxes |
37,745 | (4,400 | ) | 33,345 | ||||||||
| Other liabilities |
12,810 | 296 | 13,106 | |||||||||
|
|
|
|
|
|
|
|||||||
| Total liabilities assumed |
52,046 | (3,060 | ) | 48,986 | ||||||||
|
|
|
|
|
|
|
|||||||
| Net assets acquired |
139,134 | (18,352 | ) | 120,782 | ||||||||
|
|
|
|
|
|
|
|||||||
| Consideration: |
||||||||||||
| Cash paid upon closing, net of cash acquired |
224,114 | (15,762 | ) | 208,352 | ||||||||
|
|
|
|
|
|
|
|||||||
| Goodwill |
$ | 84,980 | $ | 2,590 | $ | 87,570 | ||||||
|
|
|
|
|
|
|
|||||||
73
Table of Contents
The $15,762 of allocation adjustments shown above in the “Cash paid upon closing, net of cash acquired” caption consists of the following (in thousands):
| Cash paid upon closing, net of cash acquired |
||||
| Original Allocation |
$ | 224,114 | ||
| Reclassification of prepaid compensation |
(14,586 | ) | ||
| Reclassification of assumed capital lease debt |
(1,044 | ) | ||
| Reclassification of escrow fees |
(17 | ) | ||
| Cash received from acquiree related to working capital true-up |
(115 | ) | ||
|
|
|
|||
| Allocation Adjustments |
(15,762 | ) | ||
|
|
|
|||
| Adjusted Allocations at October 2, 2015 |
$ | 208,352 | ||
|
|
|
|||
The prepaid compensation item above is to reclassify the employee retention escrow payment previously reported as a cash outflow from investing activities, to cash outflows from operating activities. The assumed capital lease debt item above is to show the gross capital lease debt assumed in the acquisition, not previously shown as part of purchase consideration.
The components of the acquired intangible assets on a preliminary basis are as follows (in thousands):
| Amount | Useful Lives (Years) |
|||||||
| Developed technology |
$ | 17,500 | 7 | |||||
| Customer relationships |
119,400 | 10 | ||||||
|
|
|
|||||||
| $ | 136,900 | |||||||
|
|
|
|||||||
The overall weighted-average life of the identified intangible assets acquired in the BinOptics Acquisition is estimated to be 9.6 years and the assets are being amortized over their estimated useful lives based upon the pattern over which we expect to receive the economic benefit from these assets.
The purchase accounting is preliminary and subject to completion including the areas of taxation where we are finalizing a study of the potential utilization of acquired net operating losses is not yet complete, and certain fair value measurements, particularly the finalization of the valuation assessment of the acquired tangible and intangible assets. The adjustments arising from the completion of the outstanding matters may materially affect the preliminary purchase accounting.
The following is a summary of BinOptics revenue and earnings included in the accompanying consolidated statements of operations for the twelve months ended October 2, 2015 (in thousands):
| Twelve Months Ended October 2, 2015 |
||||
| Revenue |
$ | 61,549 | ||
| Income before income taxes |
354 | |||
Unaudited Supplemental Pro Forma Data—The pro forma statements of operations data for the twelve months ended October 2, 2015 and October 3, 2014, below, give effect to the BinOptics Acquisition, described above, as if it had occurred at September 28, 2013. These amounts have been calculated after applying our accounting policies and adjusting the results of BinOptics to reflect the acquisition costs of $9.3 million, change of control and retention payments, the impact of the step-up to the value of the acquired inventory, as well as additional amortization that would have been charged assuming the fair value adjustments to intangible assets and additional interest expense on acquisition-related borrowings had been applied and incurred since
74
Table of Contents
September 28, 2013. This pro forma data is presented for informational purposes only and does not purport to be indicative of our future results of operations.
| Twelve Months Ended | ||||||||
| October 2, 2015 |
October 3, 2014 |
|||||||
| Revenue |
$ | 428,440 | $ | 384,452 | ||||
| Loss from continuing operations before income taxes |
(3,489 | ) | (98,119 | ) | ||||
The table above represents proforma net income (loss) which differs from the actual results due to adjustments related to inventory step-up and intangible amortization expense which were reflected in fiscal 2014, as well as compensation costs paid to BinOptics employees and transaction costs paid to third parties in connection with the BinOptics acquisition.
Acquisition of Mindspeed Technologies, Inc.—On December 18, 2013, we completed the acquisition of Mindspeed Technologies, Inc. (Mindspeed), a supplier of semiconductor solutions for communications infrastructure applications (Mindspeed Acquisition). We acquired Mindspeed to further our expansion into high-performance analog products.
We completed the Mindspeed Acquisition through a cash tender offer (Offer) by Micro Merger Sub, Inc. (Merger Sub), a wholly-owned subsidiary, for all of the outstanding shares of common stock, par value $0.01 per share, of Mindspeed (Shares) at a purchase price of $5.05 per share, net to the seller in cash, without interest, less any applicable withholding taxes (Offer Price). Immediately following the Offer, Merger Sub merged with and into Mindspeed, with Mindspeed surviving as a wholly-owned subsidiary. At the effective time of the merger, each Share not acquired in the Offer (other than shares held by us, Merger Sub and Mindspeed, and shares of restricted stock assumed by us in the merger) was converted into the right to receive the Offer Price. We funded the Mindspeed Acquisition through the use of available cash and borrowings under its revolving credit facility (see Note 8 below). The aggregate purchase price for the Shares, net of cash acquired, was $232.0 million and we assumed $81.3 million of liabilities and incurred costs of $4.5 million expensed during fiscal year 2014.
The Mindspeed Acquisition was accounted for as a purchase and the operations of Mindspeed have been included in our consolidated financial statements since the date of acquisition.
We are recognizing all assets acquired and liabilities assumed based upon the fair value of such assets and liabilities measured as of the date of acquisition. The aggregate purchase price for Mindspeed is being allocated to the tangible and identifiable intangible assets acquired and liabilities assumed based on their estimated fair values at the date of acquisition. None of the goodwill resulting from this acquisition is deductible for tax purposes.
75
Table of Contents
We completed the allocation of purchase price during the fourth quarter of fiscal 2014, as follows (in thousands):
| Final Allocation | ||||
| Assets acquired: |
||||
| Current assets |
$ | 50,612 | ||
| Intangible assets |
138,663 | |||
| Deferred income taxes |
92,881 | |||
| Other assets |
31,788 | |||
|
|
|
|||
| Total assets acquired |
313,944 | |||
|
|
|
|||
| Liabilities assumed: |
||||
| Current liabilities |
35,270 | |||
| Debt |
40,177 | |||
| Other long-term liabilities |
5,865 | |||
|
|
|
|||
| Total liabilities assumed |
81,312 | |||
|
|
|
|||
| Net assets acquired |
232,632 | |||
|
|
|
|||
| Consideration: |
||||
| Cash paid upon closing, net of cash acquired |
$ | 232,028 | ||
| Fair value of vested awards assumed in acquisition |
785 | |||
|
|
|
|||
| Total consideration |
232,813 | |||
|
|
|
|||
| Goodwill |
181 | |||
|
|
|
|||
In connection with the Mindspeed Acquisition, we assumed all of the outstanding options and all unvested restricted stock awards under Mindspeed’s equity plans and converted such options and stock awards into equivalent awards under the same general terms and conditions as were in existence with adjustments made to shares and exercise prices, if any, pursuant to a formula stipulated in the terms of the acquisition. The fair value of the assumed options and stock awards was $4.1 million, of which $0.8 million relates to vested stock options which has been included in the purchase consideration and the remainder relates to unvested stock options and stock awards, which will be expensed as the remaining services are provided.
The elements of the acquired intangible assets were as follows (in thousands):
| Amount | Useful
Lives (Years) | |||||
| Developed technology |
$ | 109,263 | 7 | |||
| Customer relationships |
11,430 | 10 | ||||
| In-process research and development |
17,970 | N/A | ||||
|
|
|
|||||
| $ | 138,663 | |||||
|
|
|
|||||
The overall weighted-average life of the identified intangible assets acquired in the acquisition is estimated to be seven years.
The following is a summary of Mindspeed revenue and earnings included in our accompanying consolidated statements of operations for fiscal year 2014 (in thousands):
| Revenue |
$ | 94,613 | ||
| Loss from continuing operations before income taxes |
(9,266 | ) |
76
Table of Contents
Unaudited Supplemental Pro Forma Data—The pro forma statements of operations data for fiscal year 2014 below give effect to the Mindspeed Acquisition, described above, as if it had occurred at September 29, 2012. These amounts have been calculated after applying our accounting policies and adjusting the results of Mindspeed to reflect the acquisition costs of $4.5 million paid by us, $14.1 million of restructuring charges and change-in-control payments, the impact of the step-up to fair value of the acquired inventory, as well as the additional depreciation and amortization that would have been charged assuming the fair value adjustments to property, plant and equipment and intangible assets and additional interest expense on acquisition-related borrowings had been applied and incurred since September 29, 2012. This supplement pro forma earnings for fiscal year 2014 and 2013 were adjusted to exclude discontinued operations. This pro forma data is presented for informational purposes only and does not purport to be indicative of our future results of operations.
| Twelve Months Ended | ||||||||
| October 3, 2014 |
September 27, 2013 |
|||||||
| (in thousands) | ||||||||
| Revenue |
$ | 358,645 | $ | 380,362 | ||||
| Loss from continuing operations before income taxes |
(21,164 | ) | (43,007 | ) | ||||
Acquisition under Common Control—On February 13, 2014, we acquired Nitronex, an entity under common control, through a cash payment of $26.1 million for all of the outstanding ownership interests of Nitronex. We funded the Nitronex Acquisition through the use of available cash and borrowings under its revolving credit facility. The purchase price includes $3.9 million held on account by a third-party escrow agent pending any claims by us in connection with general representation matters made by GaAs Labs in the transaction. The indemnification period expired in August 2015, at which point all but $500,000 of the escrow fund was released to GaAs Labs and the remainder was retained by the escrow agent pending final resolution of an outstanding indemnity claim.
Other Acquisitions—In the fiscal fourth quarter of 2014 we acquired two businesses, IKE Micro and Photonic Controls. The first acquisition, IKE Micro, is a specialized build-to-print house based in Nashua, New Hampshire. The primary purpose of IKE Micro acquisition is to drive COGS reductions and further improve gross margin in our Optoelectronics business. The second acquisition, Photonic Controls, is a small design company based in Corning, New York which specializes in photonic semiconductor development and system design. Their primary focus is to design silicon photonic chips for 100G/400G optical networks and future aerospace and defense applications.
The assets acquired and liabilities assumed were recorded at their fair values and operating results were included in the consolidated financial statements from the date of acquisition. All accounting has been completed for the acquisitions, which resulted in goodwill of $3.9 million and intangible assets, including manufacturing know-how and customer relationships, of $1.6 million recorded on the date of acquisition, which will be amortized over 7-10 years. Additionally, we recorded a contingent consideration liability of $1.2 million related to the acquisition of Photonic Controls which is included in other long-term liabilities in the accompanying consolidated balance sheet as of October 2, 2015. The maximum possible payment of contingent purchase price is $1.3 million. Approximately $1.7 million of the goodwill resulting from these acquisitions is deductible for tax purposes. The acquisitions were not material to our consolidated financial statements.
77
Table of Contents
4. INVESTMENTS
During the fourth quarter of 2015, we purchased investment securities for approximately $40.2 million. We did not hold any available-for-sale securities as of October 3, 2014. All investments are classified as available-for-sale. The amortized cost, gross unrealized holding gains or losses, and fair value of our available-for-sale investments by major investments type are summarized in the tables below (in thousands):
| October 2, 2015 | ||||||||||||||||
| Amortized Cost |
Gross Unrealized Holding Gains |
Gross Unrealized Holding Losses |
Aggregate
Fair Value |
|||||||||||||
| Corporate bonds |
$ | 24,546 | $ | 5 | $ | (89 | ) | $ | 24,462 | |||||||
| US treasuries and agency bonds |
15,108 | 3 | (16 | ) | 15,095 | |||||||||||
|
|
|
|
|
|
|
|
|
|||||||||
| Total investments |
$ | 39,654 | $ | 8 | $ | (105 | ) | $ | 39,557 | |||||||
|
|
|
|
|
|
|
|
|
|||||||||
The contractual maturities of available-for-sale investments were as follows (in thousands):
| October 2, 2015 |
||||
| Less than 1 year |
$ | 16,259 | ||
| Over 1 year |
23,298 | |||
|
|
|
|||
| Total investments |
$ | 39,557 | ||
|
|
|
|||
Available-for-sale investments are reported at fair value and as such, their associated unrealized gains and losses are reported as a separate component of stockholders’ equity (deficit) within accumulated other comprehensive income (loss).
Other Investments—We determined the appropriate classification of our investments at the time of acquisition and re-evaluate such determination at each balance sheet date. We record at cost non-marketable equity investments where we do not have the ability to exercise significant influence or control and periodically reviews such investments for impairment.
During fiscal year 2015 and 2014, we made a minority investment of $0.5 million and $0.3 million, respectively in the convertible debt of a privately-held U.S. based company. This investment was included in the assets sold in connection with the Automotive business.
During fiscal year 2014, we made a minority investment of $5.0 million in the equity of a privately-held U.S. based company. This minority equity investment was accounted for under the cost method and is included on the consolidated balance sheets in other long-term assets. During the second fiscal quarter of 2015, the privately-held U.S. based company was sold to a third party which provided us with information that the underlying value of the investment had been impaired at April 3, 2015. Accordingly, we recorded an impairment charge of $3.5 million which is included in Other Expense in the Consolidated Statement of Operations during fiscal year 2015. We received $1.5 million in exchange for the equity investment during fiscal year 2015.
78
Table of Contents
5. FAIR VALUE
Assets and liabilities measured at fair value on a recurring basis consist of the following (in thousands):
| October 2, 2015 | ||||||||||||||||
| Fair Value | Active Markets for Identical Assets (Level 1) |
Observable Inputs (Level 2) |
Unobservable Inputs (Level 3) |
|||||||||||||
| Assets |
||||||||||||||||
| Money market funds |
$ | 15,000 | $ | 15,000 | $ | — | $ | — | ||||||||
| US treasuries and agency bonds |
15,095 | — | 15,095 | — | ||||||||||||
| Corporate bonds |
24,462 | — | 24,462 | — | ||||||||||||
|
|
|
|
|
|
|
|
|
|||||||||
| Total assets measured at fair value |
$ | 54,557 | $ | 15,000 | $ | 39,557 | $ | — | ||||||||
|
|
|
|
|
|
|
|
|
|||||||||
| Liabilities |
||||||||||||||||
| Contingent consideration |
$ | 1,150 | $ | — | $ | — | $ | 1,150 | ||||||||
| Common stock warrant liability |
21,822 | — | — | 21,822 | ||||||||||||
|
|
|
|
|
|
|
|
|
|||||||||
| Total liabilities measured at fair value |
$ | 22,972 | $ | — | $ | — | $ | 22,972 | ||||||||
|
|
|
|
|
|
|
|
|
|||||||||
| October 3, 2014 | ||||||||||||||||
| Fair Value | Active Markets
for Identical Assets (Level 1) |
Observable Inputs (Level 2) |
Unobservable Inputs (Level 3) |
|||||||||||||
| Assets |
||||||||||||||||
| Trading securities |
$ | 250 | $ | — | $ | — | $ | 250 | ||||||||
|
|
|
|
|
|
|
|
|
|||||||||
| Total assets measured at fair value |
$ | 250 | $ | — | $ | — | $ | 250 | ||||||||
|
|
|
|
|
|
|
|
|
|||||||||
| Liabilities |
||||||||||||||||
| Contingent consideration |
$ | 820 | $ | — | $ | — | $ | 820 | ||||||||
| Warrant liability |
15,801 | — | — | 15,801 | ||||||||||||
|
|
|
|
|
|
|
|
|
|||||||||
| Total liabilities measured at fair value |
$ | 16,621 | $ | — | $ | — | $ | 16,621 | ||||||||
|
|
|
|
|
|
|
|
|
|||||||||
The changes in assets and liabilities with inputs classified within Level 3 of the fair value hierarchy consist of the following (in thousands):
| Fiscal Year 2015 | ||||||||||||||||||||||||
| October
3, 2014 |
Net Realized/Unrealized Losses (Gains) Included in Earnings |
Purchases and Issuances |
Sales
and Settlements |
Transfers in and/or (out) of Level 3 |
October
2, 2015 |
|||||||||||||||||||
| Trading securities |
$ | 250 | $ | — | $ | 500 | $ | (750 | ) | $ | — | $ | — | |||||||||||
|
|
|
|
|
|
|
|
|
|
|
|
|
|||||||||||||
| Contingent consideration |
$ | 820 | $ | 330 | $ | — | $ | — | $ | — | $ | 1,150 | ||||||||||||
|
|
|
|
|
|
|
|
|
|
|
|
|
|||||||||||||
| Warrant liability |
$ | 15,801 | $ | 6,021 | $ | — | $ | — | $ | — | $ | 21,822 | ||||||||||||
|
|
|
|
|
|
|
|
|
|
|
|
|
|||||||||||||
79
Table of Contents
| Fiscal Year 2014 | ||||||||||||||||||||||||
| September 27, 2013 |
Net Realized/Unrealized Losses (Gains) Included in Earnings |
Purchases and Issuances |
Sales
and Settlements |
Transfers in and/or (out) of Level 3 |
October 3, 2014 |
|||||||||||||||||||
| Trading securities |
$ | — | $ | — | $ | 250 | $ | — | $ | — | $ | 250 | ||||||||||||
|
|
|
|
|
|
|
|
|
|
|
|
|
|||||||||||||
| Contingent consideration |
$ | — | $ | — | $ | 820 | $ | — | $ | — | $ | 820 | ||||||||||||
|
|
|
|
|
|
|
|
|
|
|
|
|
|||||||||||||
| Warrant liability |
$ | 11,873 | $ | 3,928 | $ | — | $ | — | $ | — | $ | 15,801 | ||||||||||||
|
|
|
|
|
|
|
|
|
|
|
|
|
|||||||||||||
| Fiscal Year 2013 | ||||||||||||||||||||||||
| September
28, 2012 |
Net Realized/Unrealized Losses (Gains) Included in Earnings |
Purchases and Issuances |
Sales
and Settlements |
Transfers in and/or (out) of Level 3 |
September
27, 2013 |
|||||||||||||||||||
| Contingent consideration |
$ | 6,580 | $ | (577 | ) | $ | — | $ | (6,003 | ) | $ | — | $ | — | ||||||||||
|
|
|
|
|
|
|
|
|
|
|
|
|
|||||||||||||
| Warrant liability |
$ | 7,561 | $ | 4,312 | $ | — | $ | — | $ | — | $ | 11,873 | ||||||||||||
|
|
|
|
|
|
|
|
|
|
|
|
|
|||||||||||||
Money market funds which are included in cash and cash equivalents, are actively traded and consist of highly liquid investments with original maturities of 90 days or less. They are measured at their net asset value (“NAV”) and classified as Level 1. Corporate, treasury and agency bonds are categorized as Level 2 assets except where sufficient quoted prices exist in active markets, in which case such securities are categorized as Level 1 assets. These securities are valued using third-party pricing services. These services may use, for example, model-based pricing methods that utilize observable market data as inputs. Broker dealer bids or quotes of securities with similar characteristics may also be used. Our policy is to recognize significant transfers between levels at the actual date of the event. We had no transfers of financial assets or liabilities between Level 1, Level 2 or Level 3 during the periods presented.
The fair values of the contingent consideration liabilities were estimated based upon a risk-adjusted present value of the probability-weighted expected payments by us. Specifically, we considered base, upside and downside scenarios for the operating metrics upon which the contingent payments are to be based. Probabilities were assigned to each scenario and the probability-weighted payments were discounted to present value using risk-adjusted discount rates.
As of October 2, 2015 and October 3, 2014, the fair value of the common stock warrants has been estimated using a Black-Scholes option pricing model giving consideration to the quoted market price of the common stock on that date, an expected lives of 5.2 years and 6.2 years, expected volatility of 36.0% and 42.3% and risk free rates of 1.30% and 2.16%, respectively. The change in approach to estimation results from our IPO in March 2012 and the availability of a quoted market price for the common stock underlying the warrants.
These estimates include significant judgments and actual results could materially differ and have a material impact upon the values of the recorded liabilities. Any changes in the estimated fair values of the liabilities in the future will be reflected in our earnings and such changes could be material.
6. INVENTORIES
Inventories consist of the following (in thousands):
| October 2, 2015 |
October 3, 2014 |
|||||||
| Raw materials | $44,329 | $34,919 | ||||||
| Work-in-process |
3,086 | 5,500 | ||||||
| Finished goods |
32,528 | 31,062 | ||||||
|
|
|
|
|
|||||
| Total |
$ | 79,943 | $ | 71,481 | ||||
|
|
|
|
|
|||||
80
Table of Contents
7. PROPERTY, PLANT AND EQUIPMENT
Property, plant and equipment consist of the following (in thousands):
| October 2, 2015 |
October 3, 2014 |
|||||||
| Land, buildings and improvements |
$ | 10,981 | $ | — | ||||
| Machinery and equipment |
89,852 | 67,427 | ||||||
| Leasehold improvements |
9,161 | 7,958 | ||||||
| Furniture and fixtures |
983 | 1,017 | ||||||
| Construction in process |
25,898 | 12,918 | ||||||
| Computer equipment and software |
9,307 | 7,648 | ||||||
|
|
|
|
|
|||||
| Total property and equipment |
146,182 | 96,968 | ||||||
| Less accumulated depreciation and amortization |
(62,423 | ) | (46,916 | ) | ||||
|
|
|
|
|
|||||
| Property and equipment — net |
$ | 83,759 | $ | 50,052 | ||||
|
|
|
|
|
|||||
Depreciation and amortization expense related to property and equipment for fiscal years 2015, 2014, and 2013 was $15.7 million, $14.0 million and $10.5 million, respectively.
8. DEBT
On September 26, 2013, and as amended November 5, 2013, we entered into an amended and restated loan agreement with a syndicate of lenders, which provided for a revolving credit facility of up to $300.0 million that was due to mature in September 2018 (Prior Facility). Borrowings under the revolving credit facility bore a variable interest rate based on either the lender’s prime rate or a LIBOR rate, plus an applicable margin. The revolving credit facility was secured by a first priority lien on substantially all of our assets and required compliance with certain financial and non-financial covenants. In connection with the Mindspeed and Nitronex acquisitions, we borrowed an aggregate of $245.0 million of indebtedness on our Prior Facility.
On May 8, 2014, we refinanced our outstanding indebtedness under the prior facility and discharged our obligations thereunder by entering into a credit agreement (Credit Agreement) with a syndicate of lenders. Concurrent with the execution of the Credit Agreement, we terminated the prior facility and repaid the outstanding $245.0 million principal and interest due. Upon terminating the prior facility, previously deferred financing costs pertaining to that facility of $2.1 million were expensed as additional interest.
The Credit Agreement provides for term loans in an aggregate principal amount of $350.0 million, which mature in May 2021 (Term Loans) and a revolving credit facility of $100.0 million initially, which matures in May 2019 (Revolving Facility). In February 2015, we executed an amendment to the credit agreement that increased our aggregate borrowing capacity under the Revolving Facility to $130.0 million. The Term Loans were issued with an original issue discount of 0.75%, which is being amortized over the term of the Term Loans using the straight-line method, which approximates the effective interest rate method. Borrowings under the Term Loans bear interest (payable quarterly) at: (i) for LIBOR loans, a rate per annum equal to the LIBOR rate (subject to a floor of 0.75%), plus an applicable margin of 3.75%, and (ii) for base rate loans, a rate per annum equal to the prime rate (subject to a floor of 1.75%), plus an applicable margin of 2.75%. Borrowings under the Revolving Facility bear interest (payable quarterly) at: (i) for LIBOR loans, a rate per annum equal to the LIBOR rate, plus an applicable margin in the range of 2.00% to 2.50% (based on our total net leverage ratio being within certain defined ranges); and (ii) for base rate loans, a rate per annum equal to the prime rate, plus an applicable margin in the range of 1.00% to 1.50% (based on our total net leverage ratio being within certain defined ranges). The effective interest rate on our Term Loans was 4.5% as of October 2, 2015. We also pay a quarterly unused line fee for the Revolving Facility in the range of 0.25% to 0.375% (based on our total net leverage ratio being within certain defined ranges) as well as overall agency fees. We borrowed $100.0 million of indebtedness on our Revolving Facility in connection with the BinOptics Acquisition, which was paid down in full using net proceeds
81
Table of Contents
from a public offering of common stock we completed in February 2015. As of October 2, 2015, we had $130.0 million of borrowing capacity under the Revolving Facility.
The Term Loans are payable in quarterly principal installments equal to 0.25% of the aggregate dollar amount of all Term Loans outstanding at the signing of the Credit Agreement, with the remainder due on the maturity date. In the event that we divest a business, the net cash proceeds of the divestment are generally to be applied to repayment of outstanding Term Loans except to the extent we reinvest such proceeds in assets useful for its business within 18 months of receiving the proceeds. To the extent we enter into a binding agreement to reinvest such proceeds within 18 months of receiving them, we have until the later of 18 months following our receipt of the proceeds and six months following the date of such agreement to complete the reinvestment. We expect to reinvest the proceeds from the sale of the Automotive business.
At the signing of the Credit Agreement, the entire $350.0 million principal amount of the Term Loans was funded. The Term Loans and Revolving Facility are secured by a first priority lien on substantially all of our assets and provide that we must comply with certain financial and non-financial covenants. We incurred $8.7 million in fees for the issuance of the Credit Agreement which were recorded as deferred financing costs and are being amortized over the life of Credit Agreement as interest expense. As of October 2, 2015, approximately $6.9 million of deferred financing costs remain unamortized.
The Credit Agreement contains covenants that require, among other items, maintenance of certain financial ratios and also limit our ability to: issue dividends; acquire and dispose of businesses; and transfer assets among domestic and international entities.
As of October 2, 2015, the following remained outstanding on the Term Loans:
| Principal balance |
$ | 345,625 | ||
| Unamortized discount |
(2,094 | ) | ||
|
|
|
|||
| 343,531 | ||||
| Current portion |
3,500 | |||
|
|
|
|||
| Long-term, less current portion |
$ | 340,031 | ||
|
|
|
As of October 2, 2015, the minimum principal payments under the Term Loans in future fiscal years was as follows (in thousands):
| 2016 |
$ | 3,500 | ||
| 2017 |
3,500 | |||
| 2018 |
3,500 | |||
| 2019 |
3,500 | |||
| 2020 |
3,500 | |||
| Thereafter |
328,125 | |||
|
|
|
|||
| Total |
$ | 345,625 | ||
|
|
|
The fair value of the Term Loans was estimated to be approximately $346.5 million as of October 2, 2015 and was determined using Level 3 inputs, including a quoted rate from a bank.
In connection with the BinOptics Acquisition during fiscal year 2015 we assumed capital lease obligations of approximately $2.5 million of which approximately $1.0 million was outstanding as of October 2, 2015.
Additionally, the Company assumed $40.9 million of debt in the Mindspeed Acquisition. The Company paid off these assumed debt amounts of $40.9 million during fiscal year 2014.
82
Table of Contents
9. EMPLOYEE BENEFIT PLANS
We established a defined contribution savings plan under Section 401(k) of the Code (Section 401(k)) on October 1, 2009 (401(k) Plan). The 401(k) Plan follows a calendar year, covers substantially all U.S. employees who meet minimum age and service requirements, and allows participants to defer a portion of their annual compensation on a pretax basis, subject to legal limitations. Our contributions to the plan may be made at the discretion of the board of directors. During the fiscal year ended October 2, 2015, we contributed $1.4 million to our 401(k) Plan for calendar year 2014. There were no contributions made by us to the 401(k) Plan for calendar year 2015 through October 2, 2015.
Our employees located in foreign jurisdictions meeting minimum age and service requirements participate in defined contribution plans whereby participants may defer a portion of their annual compensation on a pretax basis, subject to legal limitations. Company contributions to these plans are discretionary and vary per region. We expensed contributions of $1.0 million, $1.0 million, and $0.9 million for fiscal years 2015, 2014, and 2013, respectively.
10. ACCRUED LIABILITIES
Accrued liabilities consist of the following (in thousands):
| October 2, 2015 |
October 3, 2014 |
|||||||
| Compensation and benefits |
$ | 20,711 | $ | 19,135 | ||||
| Product warranty |
656 | 446 | ||||||
| Professional fees |
2,167 | 1,528 | ||||||
| Software licenses |
1,223 | 1,862 | ||||||
| Distribution costs |
3,091 | 1,757 | ||||||
| Restructuring costs |
943 | 801 | ||||||
| Interest payable |
3,502 | 2,447 | ||||||
| Rent and utilities |
1,458 | 1,658 | ||||||
| Other |
3,848 | 3,962 | ||||||
|
|
|
|
|
|||||
| Total |
$ | 37,599 | $ | 33,596 | ||||
|
|
|
|
|
|||||
11. COMMITMENTS AND CONTINGENCIES
Operating Leases—We have non-cancelable operating lease agreements for office, research and development and manufacturing space in the United States and foreign locations. We also have operating leases for certain equipment, automobiles and services in the United States and foreign jurisdictions. These lease agreements expire at various dates through 2022 and certain agreements contain provisions for extension at substantially the same terms as currently in effect. Lease escalation clauses, rent abatements and/or concessions, such as rent holidays and landlord or tenant incentives or allowances, are typically included in the determination of straight-line rent expense over the lease term.
Future minimum lease payments for the next five fiscal years as of October 2, 2015, are as follows (in thousands):
| 2016 |
$ | 7,343 | ||
| 2017 |
6,555 | |||
| 2018 |
5,177 | |||
| 2019 |
4,836 | |||
| 2020 |
2,038 | |||
| Thereafter |
4,279 | |||
|
|
|
|||
| Total minimum lease payments |
$ | 30,228 | ||
|
|
|
83
Table of Contents
Rent expense incurred under non-cancelable operating leases was $6.5 million, $6.6 million, and $4.5 million in fiscal years 2015, 2014, and 2013, respectively.
Asset Retirement Obligations—We are obligated under certain facility leases to restore those facilities to the condition in which we or our predecessors first occupied the facilities. We are required to remove leasehold improvements and equipment installed in these facilities prior to termination of the leases. As of October 2, 2015, October 3, 2014 and September 27, 2013, the estimated costs for the removal of these assets are recorded as asset retirement obligations was $1.3 million, $1.8 million and $1.0 million, respectively.
Unused Letter of Credit—As of October 2, 2015, we had outstanding unused letters of credit from a bank aggregating $0.4 million.
Purchase Commitments—As of October 2, 2015, we had outstanding non-cancelable purchase commitments aggregating $1.2 million pursuant to inventory supply arrangements.
Litigation—We are periodically subject to legal proceedings, claims and contingencies arising in the ordinary course of business.
Patent Suit Against Laird. We brought a patent infringement suit against Laird Technologies, Inc. (Laird) in the Federal District Court for the District of Delaware on February 11, 2014, seeking monetary damages and a permanent injunction. The suit alleged that Laird infringed on our United States Patent No. 6,272,349 (‘349 Patent), titled “Integrated Global Positioning System Receiver,” by making, using, selling, offering to sell or selling products incorporating an integrated global positioning receiver that include structure(s) recited in the ‘349 Patent, including global positioning system modules for Automotive industry customers. The court entered a preliminary injunction against Laird on June 13, 2014. On April 15, 2015, the parties reached a confidential settlement agreement, filed a stipulated permanent injunction with the court that is similar in scope to the preliminary injunction, and filed a stipulated dismissal of all claims. The permanent injunction and dismissal were entered on April 21, 2015 by the court.
Class Action Suit Against Mindspeed Technologies, Inc. On March 10, 2015, Philip Alvarez, a former employee of Mindspeed filed a putative class action lawsuit against Mindspeed in the Superior Court of California for the County of Orange. On April 24, 2015, Alvarez filed a First Amended Complaint adding our subsidiary M/A-COM Technology Solutions Inc. as a defendant. The lawsuit alleged, among other things, that Alvarez and certain other employees who designed and manufactured hardware systems for Mindspeed or M/A-COM Technology Solutions Inc. between March 10, 2011 and the present were misclassified as exempt employees under California law. The lawsuit seeks recovery of alleged unpaid overtime wages, meal and rest period premiums, penalties and attorneys’ fees. We dispute the allegations of the lawsuit. On June 15, 2015, Mindspeed removed the action to the United States District Court for the Central District of California. On July 15, 2015, Plaintiff filed a Motion to Remand, which Motion was denied in an Order dated September 9, 2015. The parties have reached an agreement for the dismissal of all class action allegations and claims in the action, as well as certain other claims against Mindspeed and M/A-COM Technology Solutions Inc. The parties have stipulated to the filing of a Second Amended Complaint that effectuates this agreement, and are awaiting order by the Court on that stipulation. After the Second Amended Complaint is filed, the matter will proceed as an individual action by Alvarez seeking only his personal claims, as well as claims under the Private Attorneys’ General Act.
With respect to the above and other legal proceedings, we have not been able to reasonably estimate the amount or range of any possible loss, and accordingly have not accrued or disclosed any related amounts of possible loss in the accompanying consolidated financial statements.
84
Table of Contents
12. RESTRUCTURINGS
We have periodically implemented restructuring actions in connection with broader plans to reduce staffing, reduce the its internal manufacturing footprint, and, generally, reduce operating costs. The restructuring expenses are comprised of direct and incremental costs related to facility closure, change-in-control obligations, severance, and outplacement fees for the terminated employees. The following is a summary of the costs incurred and remaining balances included in accrued expenses related to restructuring actions taken (in thousands):
| Total | ||||
| Balance — September 28, 2012 |
$ | 328 | ||
| Current period charges |
1,060 | |||
| Payments |
(1,243 | ) | ||
|
|
|
|||
| Balance — September 27, 2013 |
145 | |||
| Current period charges |
14,823 | |||
| Payments |
(14,167 | ) | ||
|
|
|
|||
| Balance — October 3, 2014 |
801 | |||
| Current period charges |
1,280 | |||
| Payments |
(1,138 | ) | ||
|
|
|
|||
| Balance — October 2, 2015 |
$ | 943 | ||
|
|
|
|||
In fiscal year 2014, we implemented restructuring plans to reduce manufacturing and operating costs of the Mindspeed and Nitronex operations through a reduction of staffing. In fiscal year 2015, we implemented additional restructuring actions primarily associated with employee-related separation costs. We do not anticipate any additional restructuring costs associated with the 2015 actions and expect the remaining balance outstanding as of October 2, 2015 to be paid during the upcoming fiscal quarters.
13. PRODUCT WARRANTIES
We establish a product warranty liability at the time of revenue recognition. Product warranties generally have terms of between 12 months and 60 months and cover nonconformance with specifications and defects in material or workmanship. For sales to distributors, our warranty generally begins when the product is resold by the distributor. The liability is based on estimated costs to fulfill customer product warranty obligations and utilizes historical product failure rates. Should actual warranty obligations differ from estimates, revisions to the warranty liability may be required.
Product warranty liability activity is as follows (in thousands):
| Fiscal Years | ||||||||||||
| 2015 | 2014 | 2013 | ||||||||||
| Balance — beginning of year |
$ | 446 | $ | 318 | $ | 549 | ||||||
| Impact of acquisition |
50 | 202 | — | |||||||||
| Provisions |
160 | (74 | ) | (49 | ) | |||||||
| Direct charges |
— | — | (182 | ) | ||||||||
|
|
|
|
|
|
|
|||||||
| Balance — end of year |
$ | 656 | $ | 446 | $ | 318 | ||||||
|
|
|
|
|
|
|
|||||||
85
Table of Contents
14. INTANGIBLE ASSETS
Amortization expense related to amortized intangible assets is as follows (in thousands):
| Fiscal Years | ||||||||||||
| 2015 | 2014 | 2013 | ||||||||||
| Cost of revenue |
$ | 27,285 | $ | 18,787 | $ | 2,986 | ||||||
| Selling, general and administrative |
11,695 | 1,806 | 1,335 | |||||||||
|
|
|
|
|
|
|
|||||||
| Total |
$ | 38,980 | $ | 20,593 | $ | 4,321 | ||||||
|
|
|
|
|
|
|
|||||||
Intangible assets consist of the following (in thousands):
| October 2, 2015 |
October 3, 2014 |
|||||||
| Acquired technology |
$ | 162,536 | $ | 131,953 | ||||
| Customer relationships |
144,070 | 24,670 | ||||||
| In-process research and development |
8,000 | 17,970 | ||||||
| Trade name |
3,400 | 3,400 | ||||||
|
|
|
|
|
|||||
| Total |
318,006 | 177,993 | ||||||
| Less accumulated amortization |
(74,340 | ) | (35,360 | ) | ||||
|
|
|
|
|
|||||
| Intangible assets — net |
$ | 243,666 | $ | 142,633 | ||||
|
|
|
|
|
|||||
A summary of the activity in intangible assets and goodwill follows (in thousands):
| Total | Acquired Technology |
Customer Relationships |
In-Process Research and Development |
Trade Name |
Goodwill | |||||||||||||||||||
| Balance at September 27, 2013 |
$ | 46,937 | $ | 23,637 | $ | 13,150 | $ | — | $ | 3,400 | $ | 6,750 | ||||||||||||
| Net intangibles acquired |
137,405 | 103,881 | 11,520 | 17,970 | — | 4,034 | ||||||||||||||||||
| Other intangibles purchased |
4,435 | 4,435 | — | — | — | — | ||||||||||||||||||
|
|
|
|
|
|
|
|
|
|
|
|
|
|||||||||||||
| Balance at October 3, 2014 |
188,777 | 131,953 | 24,670 | 17,970 | 3,400 | 10,784 | ||||||||||||||||||
| Net intangibles acquired |
224,470 | 17,500 | 119,400 | — | — | 87,570 | ||||||||||||||||||
| Placed in service |
— | 9,780 | (9,780 | ) | — | — | ||||||||||||||||||
| Adjustment to fair value |
(190 | ) | — | — | (190 | ) | — | — | ||||||||||||||||
| Goodwill allocation to discontinued operations |
(5,008 | ) | — | — | — | — | (5,008 | ) | ||||||||||||||||
| Other intangibles purchased |
3,303 | 3,303 | — | — | — | — | ||||||||||||||||||
|
|
|
|
|
|
|
|
|
|
|
|
|
|||||||||||||
| Balance at October 2, 2015 |
$ | 411,352 | $ | 162,536 | $ | 144,070 | $ | 8,000 | $ | 3,400 | $ | 93,346 | ||||||||||||
|
|
|
|
|
|
|
|
|
|
|
|
|
|||||||||||||
As of October 2, 2015, estimated amortization of the intangible assets in future fiscal years, was as follows (in thousands):
| 2016 |
$ | 43,266 | ||
| 2017 |
41,741 | |||
| 2018 |
36,354 | |||
| 2019 |
31,276 | |||
| 2020 |
25,779 | |||
| Thereafter |
53,996 | |||
|
|
|
|||
| Total |
$ | 232,412 | ||
|
|
|
86
Table of Contents
Neither the goodwill nor the “M/A-COM” trade name are subject to amortization; these are reviewed for impairment annually in August and more frequently if events or changes in circumstances indicate that the assets may be impaired. Accumulated amortization, for the acquired technology and customer relationships, was $52.0 million and $22.3 million, respectively, as of October 2, 2015, and $27.8 million and $7.6 million, respectively, as of October 3, 2014.
In July 2013, we entered into a long term technology licensing and transfer agreement that calls for potential payments by us of up to $9.0 million through July 2016 based upon the achievement of specified milestones. As of October 2, 2015, costs incurred in connection with the licensing and the transfer of the technology was $5.0 million and $2.7 million during fiscal years 2015 and 2014, respectively, and were capitalized as incurred as acquired technology. Costs will be amortized to costs of sales upon completion of the transfer, which is currently expected to be completed through fiscal year 2017.
15. INCOME TAXES
Deferred income taxes reflect the net effect of temporary differences between the carrying amounts of assets and liabilities for financial reporting purposes and amounts used for income tax purposes. The components of our deferred tax assets and liabilities are as follows (in thousands):
| October 2, 2015 |
October 3, 2014 |
|||||||
| Current deferred tax assets: |
||||||||
| Accrued liabilities |
$ | 11,332 | $ | 9,830 | ||||
| Inventory |
5,043 | 8,088 | ||||||
| Deferred revenue |
(3 | ) | 4,451 | |||||
| Accounts receivable |
51 | 142 | ||||||
| Federal net operating loss |
11,186 | 15,452 | ||||||
| Other current deferred tax assets |
— | 46 | ||||||
| Discontinued operations |
2,703 | — | ||||||
| Deferred compensation |
3,468 | — | ||||||
| Valuation allowance |
(2,349 | ) | (2,052 | ) | ||||
|
|
|
|
|
|||||
| Current net deferred tax assets |
$ | 31,431 | $ | 35,957 | ||||
|
|
|
|
|
|||||
| Non-current deferred tax assets (liabilities): |
||||||||
| Federal and foreign net operating losses and credits |
$ | 70,448 | $ | 128,035 | ||||
| Intangible assets |
(44,196 | ) | (33,158 | ) | ||||
| Property and equipment |
(2,977 | ) | (3,072 | ) | ||||
| Other non-current deferred tax assets |
292 | 272 | ||||||
| Discontinued operations |
9,191 | — | ||||||
| Deferred compensation |
1,066 | — | ||||||
| Deferred gain |
23,531 | — | ||||||
| Valuation allowance |
(9,116 | ) | (7,448 | ) | ||||
|
|
|
|
|
|||||
| Non-current net deferred tax assets (liabilities) |
48,239 | 84,629 | ||||||
|
|
|
|
|
|||||
| Total deferred tax asset |
$ | 79,670 | $ | 120,586 | ||||
|
|
|
|
|
|||||
As of October 2, 2015, we have $193.5 million of gross federal net operating loss carryforward consisting of $26.2 million relating to the BinOptics Acquisition, $158.9 million attributable to the Mindspeed Acquisition, and $8.4 million relating to a prior acquisition. The federal net operating loss carryforwards will expire at various dates through 2034. The reported net operating loss carryforward includes any limitation under Sections 382 and 383 of the Internal Revenue Code of 1986, as amended, which applies to an ownership change as defined under Section 382.
87
Table of Contents
The domestic and foreign income (loss) from continuing operations before taxes were as follows (in thousands):
| Fiscal Years | ||||||||||||
| 2015 | 2014 | 2013 | ||||||||||
| United States |
$ | (34,251 | ) | $ | (60,836 | ) | $ | (11,333 | ) | |||
| Foreign |
18,851 | 19,936 | 14,279 | |||||||||
|
|
|
|
|
|
|
|||||||
| (Loss) income from operations before income taxes |
$ | (15,400 | ) | $ | (40,900 | ) | $ | 2,946 | ||||
|
|
|
|
|
|
|
|||||||
The components of the provision (benefit) for income taxes are as follows (in thousands):
| Fiscal Years | ||||||||||||
| 2015 | 2014 | 2013 | ||||||||||
| Current: |
||||||||||||
| Federal |
$ | (19,015 | ) | $ | 712 | $ | 2,923 | |||||
| State |
688 | (419 | ) | 1,024 | ||||||||
| Foreign |
1,092 | 2,181 | 986 | |||||||||
|
|
|
|
|
|
|
|||||||
| Current provision (benefit) |
(17,235 | ) | 2,474 | 4,933 | ||||||||
|
|
|
|
|
|
|
|||||||
| Deferred: |
||||||||||||
| Federal |
10,845 | (16,557 | ) | (3,326 | ) | |||||||
| State |
(4,131 | ) | (756 | ) | (1,146 | ) | ||||||
| Foreign |
(1,302 | ) | (725 | ) | (273 | ) | ||||||
| Change in valuation allowance |
1,965 | (522 | ) | 95 | ||||||||
|
|
|
|
|
|
|
|||||||
| Deferred provision (benefit) |
7,377 | (18,560 | ) | (4,650 | ) | |||||||
|
|
|
|
|
|
|
|||||||
| Total provision (benefit) |
$ | (9,858 | ) | $ | (16,086 | ) | $ | 283 | ||||
|
|
|
|
|
|
|
|||||||
Our net deferred tax asset relates predominantly to our operations in the United States. A valuation allowance is recorded when, based on assessment of both positive and negative evidence, management determines that it is not more likely than not that the assets are recoverable. Such assessment is required on a jurisdictional basis.
The $11.5 million of valuation allowance as of October 2, 2015 relates primarily to state net operating loss (“NOL”) carryforwards assumed in the Mindspeed Acquisition and UK tax credit and NOL carryforwards whose recovery is not considered more likely than not. The $9.5 million of valuation allowance as of October 3, 2014 related primarily to state NOL carryforwards assumed in the Mindspeed Acquisition. The change during the year ending October 2, 2015 of $2.0 million primarily relates to reporting a $1.4 million gross R&D tax credit in the UK offset by a full valuation allowance, a $1.2 million state R&D tax credit offset by a full valuation allowance less a reduction of $0.6 million related to foreign entities.
88
Table of Contents
Our effective tax rates differ from the federal and statutory rate as follows:
| Fiscal Years | ||||||||||||
| 2015 | 2014 | 2013 | ||||||||||
| Federal statutory rate |
35.0 | % | 35.0 | % | 35.0 | % | ||||||
| Foreign rate differential |
30.5 | 11.2 | (117.9 | ) | ||||||||
| State taxes net of federal benefit |
3.5 | 1.8 | 26.0 | |||||||||
| Warrant liabilities |
(13.7 | ) | (3.4 | ) | 51.2 | |||||||
| Change in valuation allowance |
(6.0 | ) | (0.3 | ) | 3.2 | |||||||
| Research and development credits |
16.1 | 1.9 | (98.6 | ) | ||||||||
| Provision to return adjustments |
9.9 | — | 7.3 | |||||||||
| Nondeductible compensation expense |
(8.9 | ) | (1.5 | ) | 7.0 | |||||||
| Nondeductible legal fees |
(4.1 | ) | (1.9 | ) | — | |||||||
| Nitronex losses |
— | (2.6 | ) | 102.7 | ||||||||
| Other permanent differences |
1.6 | (0.8 | ) | (1.1 | ) | |||||||
|
|
|
|
|
|
|
|||||||
| Effective income tax rate |
63.9 | % | 39.4 | % | 14.8 | % | ||||||
|
|
|
|
|
|
|
|||||||
For fiscal year 2015 and 2014, the effective tax rate to calculate the tax benefit on $15.4 million and $40.9 million, respectively, of pre-tax loss from continuing operations was 63.9% and 39.4%, respectively. For fiscal year 2013, the effective tax rate to calculate the tax expense on pre-tax income of $2.9 million was 14.8%. The effective income tax rate for fiscal years 2015, 2014 and 2013 were primarily impacted by a lower income tax rate in many foreign jurisdictions in which our foreign subsidiaries operate, research and development tax credits, and the fair market value adjustment of warrant liabilities. For fiscal year 2015, the rate was impacted by a retroactive enactment of the R&D tax credit from fiscal year 2014 and a larger shift of the revenue associated with foreign entities taxed at lower rates as part of our auto divestiture. In addition, the effective income tax rate for fiscal years 2014 and 2013 were impacted by pre-acquisition Nitronex losses.
All earnings of foreign subsidiaries are considered indefinitely reinvested for the periods presented. Undistributed earnings of all foreign subsidiaries as of October 2, 2015 aggregated $71.3 million, with Ireland and Grand Cayman accounting for $34.8 million and $24.3 million, respectively. It is not practicable to determine the U.S. federal and state deferred tax liabilities associated with such foreign earnings.
Activity related to unrecognized tax benefits is as follows (in thousands):
| Amount | ||||
| Balance — September 27, 2013 |
— | |||
| Additions based on tax positions |
(1,670 | ) | ||
| Reductions based on tax positions |
— | |||
|
|
|
|||
| Balance — October 3, 2014 |
$ | (1,670 | ) | |
| Additions based on tax positions |
— | |||
| Reductions based on tax positions |
— | |||
|
|
|
|||
| Balance — October 2, 2015 |
$ | (1,670 | ) | |
|
|
|
|||
The balance of the unrecognized tax benefit as of October 2, 2015 is included in other long-term liabilities in the accompanying consolidated balance sheets. The entire balance of unrecognized tax benefits, if recognized, will reduce income tax expense. It is our policy to recognize any interest and penalties accrued related to unrecognized tax benefits in income tax expense. During fiscal year 2015, we did not make any payment of interest and penalties. There was nothing accrued in the consolidated balance sheets for the payment of interest and penalties at October 2, 2015 as the remaining unrecognized tax benefits would only serve to reduce our current federal and state NOL carryforwards, if ultimately recognized.
89
Table of Contents
During fiscal year 2014, we settled the federal audit for fiscal years 2011 and 2012 with no material impact upon the financial statements. A summary of the fiscal tax years that remain subject to examination, as of October 2, 2015, for the Company’s significant tax jurisdictions are:
| Jurisdiction |
Tax Years Subject to Examination |
|||
| United States — federal |
2013 — forward | |||
| United States — various states |
2012 — forward | |||
| Ireland |
2012 — forward | |||
Generally, we are no longer subject to federal income tax examinations for years before 2013, except to the extent of loss and tax credit carryforwards from those years.
16. SHARE-BASED COMPENSATION PLANS
The following table presents the effects of stock-based compensation expense related to stock-based awards to employees and non-employees in our consolidated statements of operations during the periods presented (in thousands):
| Fiscal Years | ||||||||||||
| 2015 | 2014 | 2013 | ||||||||||
| Cost of revenue |
$ | 1,949 | $ | 1,771 | $ | 1,068 | ||||||
| Research and development |
5,447 | 2,818 | 1,739 | |||||||||
| Selling, general and administrative |
12,039 | 6,688 | 3,649 | |||||||||
|
|
|
|
|
|
|
|||||||
| Total |
$ | 19,435 | $ | 11,277 | $ | 6,456 | ||||||
|
|
|
|
|
|
|
|||||||
Amounts presented above included share-based compensation expense in 2015, 2014 and 2013 related to employees terminated in conjunction with the Automotive divestiture in August 2015 of $0.4 million, $0.3 million and $0.1 million, respectively.
We have three equity incentive plans: the Amended and Restated 2009 Stock Incentive Plan (2009 Plan), the 2012 Omnibus Incentive Plan (2012 Plan) and the 2012 Employee Stock Purchase Plan (ESPP).
Upon the closing of the IPO, all shares that were reserved under the 2009 Plan but not awarded were assumed by the 2012 Plan. No additional awards will be made under the 2009 Plan. Under the 2012 Plan, we have the ability to issue incentive stock options (ISOs), non-statutory stock options (NSOs), performance-based non-statutory stock options, stock appreciation rights, restricted stock (RSAs), restricted stock units (RSUs), performance-based stock units (PRSUs), performance shares, and other equity-based awards to employees, directors and outside consultants. The ISOs and NSOs must be granted at a price per share not less than the fair value of our common stock on the date of grant. Options granted to date primarily vest over a four-year period with 25% vesting at the end of one year and the remaining vesting monthly thereafter. Certain of the share-based awards granted and outstanding as of October 2, 2015, are subject to accelerated vesting upon a sale of the Company or similar changes in control. Options granted generally have a term of 7 to 10 years. As of October 2, 2015, we had 9.0 million shares available for future grants under the 2012 Plan.
90
Table of Contents
Stock Options
A summary of stock option activity for fiscal year 2015 is as follows (in thousands, except per share amounts):
| Number of Shares | Weighted-Average Exercise Price per Share |
Weighted- Average Remaining Contractual Term (in Years) |
Aggregate Intrinsic Value |
|||||||||||||
| Options outstanding — October 3, 2014 |
948 | $ | 11.72 | 6.6 | $ | 10,015 | ||||||||||
|
|
|
|
|
|
|
|||||||||||
| Granted |
255 | 33.60 | ||||||||||||||
| Exercised |
(288 | ) | 9.08 | |||||||||||||
| Forfeited, canceled or expired |
(26 | ) | 27.11 | |||||||||||||
|
|
|
|
|
|||||||||||||
| Options outstanding — October 2, 2015 |
889 | $ | 18.4 | 6.19 | $ | 10,574 | ||||||||||
|
|
|
|
|
|
|
|
|
|||||||||
| Options vested and expected to vest — October 2, 2015 |
889 | $ | 18.4 | 6.19 | $ | 10,574 | ||||||||||
|
|
|
|
|
|
|
|
|
|||||||||
| Options exercisable — October 2, 2015 |
644 | $ | 12.63 | 6.03 | $ | 10,574 | ||||||||||
|
|
|
|
|
|
|
|
|
|||||||||
Aggregate intrinsic value represents the difference between our closing stock price on October 2, 2015, and the exercise price of outstanding, in-the-money options. The total intrinsic value of options exercised was $7.1 million, $7.6 million and $8.4 million for fiscal year 2015, 2014 and 2013, respectively.
In April 2015 and May 2015, the Company granted 225,000 performance-based stock options for shares of common stock with an aggregate grant date fair value of $2.0 million that are subject to vesting based on a service and individual performance targets. The Company used the Black-Scholes valuation model for estimating the fair value on the date of grant of $10.35 and $10.12 per option share, respectively. The fair value of stock option awards is affected by valuation assumptions, including volatility, the Company’s stock price, expected term of the option, risk-free interest rate and expected dividends.
The weighted-average assumptions used for calculating the fair value of stock options granted is as follows:
| Risk-free interest rate |
1.2 | % | ||
| Expected term (years) |
4.0 | |||
| Expected volatility |
36.2 | % | ||
| Expected dividends |
— | % |
The performance-based stock options described above will vest and become exercisable in full if certain pre-established revenue and non-GAAP gross margin targets are met or exceeded in any period of four consecutive fiscal quarters completed during the term of the options. The stock options have a term of seven years, assuming continued employment with or services to the Company, and have an average exercise price of $34.06 and equal to the closing price of the Company’s common stock on the date of grant.
In September 2015, we granted 30,000 stock option awards, with an exercise price of $29.80, under the 2012 stock compensation plan with a grant date fair value of $0.4 million that are subject to vesting only upon the closing market price of the Company’s underlying public stock being equal to or in excess of $63.60 per share for a period of not less than three consecutive trading days. These stock options fair value of $12.38 was estimated using a Monte Carlo simulation model based on the market conditions vesting condition. Compensation cost is recognized on a straight-line basis over the estimated service period of approximately three years, expiring in September 2022.
91
Table of Contents
In April 2014, we granted 405,000 options to purchase common stock with a grant date fair value of $3.5 million that are subject to vesting only upon the market price of the Company’s underlying public stock closing at or above $32.55 per share within ten years of the grant date. Due to the market condition upon which vesting is based, the fair value of the awards was estimated using a Monte Carlo simulation model. Compensation cost is recognized regardless of the number of awards that are earned based on the market condition. Compensation cost is recognized on a straight-line basis over the estimated service period of three years. In the event that the Company’s common stock achieves the target price of $32.55 per share prior to the end of the estimated service period, any remaining unamortized compensation cost will be recognized.
During the second fiscal quarter of 2015, the Company’s common stock closed at a price of $34.79 per share, exceeding the target price of $32.55 per share, which resulted in the recognition of approximately $2.5 million of compensation expense during the fiscal year.
The weighted-average assumptions used for calculating the fair value of stock options granted during fiscal year 2014, is as follows:
| Risk-free interest rate |
2.71 | % | ||
| Expected term (years) |
10 | % | ||
| Expected volatility |
42.6 | % | ||
| Expected dividends |
— | % |
Restricted Stock Awards and Units
A summary of restricted stock awards and units activity for fiscal year 2015 is as follows (in thousands):
| Number of Shares |
Weighted-Average Remaining Contractual Term in Years |
Aggregate Intrinsic Value |
||||||||||
| Issued and unvested — October 3, 2014 |
1,720 | 2.3 | $ | 37,200 | ||||||||
| Granted |
821 | |||||||||||
| Vested |
(704 | ) | ||||||||||
| Forfeited, canceled or expired |
(145 | ) | ||||||||||
|
|
|
|||||||||||
| Issued and unvested shares — October 2, 2015 |
1,692 | 1.4 | $ | 48,375 | ||||||||
|
|
|
|
|
|
|
|||||||
| Shares expected to vest |
1,586 | 1.3 | $ | 45,328 | ||||||||
|
|
|
|
|
|
|
|||||||
As of October 2, 2015, the aggregate intrinsic value of vesting restricted stock units including time-based and performance units was $45.3 million for fiscal year 2015. The total fair value of restricted stock awards and units vesting was $23.3 million, $9.2 million and $3.9 million for the fiscal years 2015, 2014 and 2013, respectively.
On April 22, 2015 and May 5, 2015, we issued performance-based RSUs which were divided into three equal tranches with one tranche based on our adjusted earnings per share (EPS) growth during fiscal year 2015, one tranche based on adjusted EPS growth during fiscal years 2015-2016 and one tranche based on adjusted EPS growth during fiscal years 2015-2017. A participant may earn between 0% to 300% of the targeted shares for each tranche based on actual performance, and a straight-line interpolation will be applied for achievement between the specified performance ranges. Once earned, the performance-based RSUs will be settled in shares of the Company’s common stock, assuming continued employment with or services to us through the vest date of May 15th following each tranches performance criteria being met at period end.
92
Table of Contents
A summary of PRSU activity during the fiscal year ended October 2, 2015 is as follows:
| Non-vested Performance-based Restricted Stock Units |
Weighted-Average Grant-Date Fair Value per PRSU |
|||||||
| Unvested shares at October 3, 2014 |
— | |||||||
| Granted |
83,954 | $ | 34.39 | |||||
| Change due to performance condition achievement |
251,862 | $ | 34.39 | |||||
| Vested |
— | |||||||
| Forfeited |
— | |||||||
|
|
|
|
|
|||||
| Unvested shares at October 2, 2015 |
335,816 | $ | 34.39 | |||||
|
|
|
|
|
|||||
The total fair value of restricted stock award units with time-based and performance vesting was $7.8 million for the fiscal year ended October 2, 2015.
In April 2015, the Company approved an amended and restated Change in Control Plan to exclude certain performance-based options and to increase the percentage by which outstanding performance-based equity awards, other than those specifically excluded) will be deemed earned in the event of a change in control, from 100% of target to 200% of targeted shares. Other share-based awards granted and outstanding as of October 2, 2015, are subject to accelerated vesting upon a sale of the Company or similar changes in control.
In conjunction with the Automotive divestiture, the Compensation Committee approved the acceleration of all unvested and outstanding RSU awards for employees who were terminated and accepted employment with the acquiring company effective upon the closing date of the transaction. Accordingly, during the fourth quarter of fiscal year ended October 2, 2015, we recorded additional stock compensation expense related to approximately 20 employees of $1.2 million related to this equity modification to accelerate vesting of unvested shares.
As of October 2, 2015, total unrecognized compensation cost, adjusted for estimated forfeitures, related to stock options, restricted stock awards and units including awards with time-based and performance vesting was $37.8 million, which is expected to be recognized over the next 3.4 years.
Employee Stock Purchase Plan (ESPP)
Concurrently with the IPO in March 2012, the ESPP became effective. The ESPP allows eligible employees to purchase shares of our common stock at a discount through payroll deductions of up to 15% of their eligible compensation, subject to any plan limitations. In administering the ESPP, the board of directors has limited discretion to set the length of the offering periods thereunder. As of October 2, 2015, total unrecognized compensation cost related to the ESPP was not material. In fiscal years 2015 and 2014, approximately 176,000 and 150,000, respectively, of shares of common stock were issued under the ESPP.
The 2012 Plan contains an “evergreen” provision, pursuant to which the number of shares of common stock available for issuance under the 2012 Plan can be increased on the first day of each fiscal year equal to the lesser of (a) 4.0% of outstanding common stock on a fully diluted basis as of the end of the immediately preceding fiscal year, (b) 1.9 million shares of common stock, and (c) a lesser amount determined by the board of directors; provided, however, that any shares from any increases in previous years that are not actually issued will continue to be available for issuance under the 2012 Plan. The ESPP also contains an “evergreen” provision, pursuant to which the number of shares of common stock available for issuance under the ESPP can be increased on the first day of each fiscal year equal to the lesser of (a) 1.25% of outstanding common stock on a fully diluted basis as of the end of the immediately preceding fiscal year, (b) 550,000 shares of common stock, and (c) a lesser amount
93
Table of Contents
determined by the board of directors; provided, however, that any shares from any increases in previous years that are not actually issued will continue to be available for issuance under the ESPP. In fiscal year 2015, pursuant to the evergreen provisions, the number of shares of common stock available for issuance under the 2012 Plan and the ESPP were increased by 1.9 million shares and 550,000 shares, respectively.
17. STOCKHOLDERS’ EQUITY
Outstanding shares of common stock presented in the accompanying consolidated statements of stockholders’ equity as of October 2, 2015 and October 3, 2014, exclude 11,000 and 59,000 shares, respectively, issued as compensation to employees that were subject to forfeiture, pending continued employment with us through stated vesting dates.
Common Stock Warrants—In March 2012, we issued warrants to purchase 1,281,358 shares of common stock for $14.05 per share. The warrants expire December 21, 2020, or earlier as per the terms of the agreement, including immediately following consummation of a sale of all or substantially all assets or capital stock or other equity securities, including by merger, consolidation, recapitalization, or similar transactions. Prior to completion of the IPO in March 2012, the number of shares issuable upon exercise of the warrants were subject to potential increases pursuant to certain antidilution rights included in the agreements the holders of the warrants have the right in certain circumstances to require us to register the underlying shares of common stock for resale under the Securities Act. We do not currently have sufficient registered and available shares to immediately satisfy the request for registration, if such is made. As of October 2, 2015, no exercise of the warrants had occurred and no request had been made to register the warrants or any underlying securities for resale by the holders.
We are recording the estimated fair values of the warrants as a long-term liability in the accompanying consolidated financial statements with changes in the estimated fair value being recorded in the accompanying statements of operations. The following is a summary of the activity of the warrant liability (in thousands):
| Balance — September 27, 2013 |
$ | 11,873 | ||
| Change in estimated fair value |
3,928 | |||
|
|
|
|||
| Balance — October 3, 2014 |
15,801 | |||
| Change in estimated fair value |
6,021 | |||
|
|
|
|||
| Balance — October 2, 2015 |
$ | 21,822 | ||
|
|
|
18. RELATED-PARTY TRANSACTIONS
GaAs Labs, a former stockholder and an affiliate of directors and then majority stockholders John and Susan Ocampo, engaged the Company to provide administrative and business development services to GaAs Labs on a time and materials basis. There are no minimum service requirements or payment obligations and the agreement may be terminated by either party with 30 days notice. We did not record any related revenue in fiscal year 2015 and recorded related revenue of $0.1 million and $0.4 million in fiscal years 2014, and 2013, respectively. Services provided pursuant to this agreement, were recorded as other income in the accompanying consolidated statements of operations.
In fiscal years 2015, 2014 and 2013, we recorded revenue of $1.1 million, $0.2 million and $0.2 million, respectively, from sales of product to a privately-held company with a common director.
19. DISCONTINUED OPERATIONS
In the fourth quarter of fiscal year 2015, we sold our Automotive business to Autoliv ASP Inc as the Automotive business was not consistent with our long-term strategic vision from both a growth and profitability perspective. The agreed consideration included $82.1 million in cash paid at closing, subject to customary working capital and other adjustments, $18.0 million payable in eighteen months pending resolution of any
94
Table of Contents
contingencies as part of an indemnification agreement, plus the opportunity to receive up to an additional $30.0 million in cash based on achievement of revenue-based earnout targets through 2019. Additionally, we entered into a Consulting Agreement pursuant to which we may provide Autoliv with certain non-design advisory services for a period of two years following the closing of the transaction for up to $15.0 million in cash.
In the fourth quarter of fiscal year 2015, we recorded a pre-tax gain on the sale of the Automotive business of $61.8 million based on the $82.1 million received at closing on August 17, 2015 as described above. We expect that the remainder of the consideration to be received from Autoliv, including any amounts related to the consulting agreement, will being accounted for in discontinued operations when the contingencies are finalized and the proceeds are realizable over the next several years.
In fiscal year 2014, subsequent to closing the Mindspeed Acquisition, we decided to divest the wireless business of Mindspeed. The operations of the wireless business are included in discontinued operations through the date of sale. There was no initial gain or loss on the sale which closed in February 2014. We received $12.3 million of proceeds from the sale of the wireless business during fiscal 2014 and an additional $3.1 million during fiscal 2015 upon settlement of indemnification holdbacks, resulting in a pre-tax gain of $1.6 million.
Additionally during fiscal year 2014, we sold non-core assets representing one product line, receiving cash proceeds aggregating $12.0 million. We have no continuing interests in these assets. There was no gain or loss on the sale, which closed in May 2014 and results of this product line are included in continuing operations.
The accompanying consolidated statement of operations includes the following operating results related to these divested businesses (in thousands):
| Automotive Business | Mindspeed Wireless Business |
|||||||||||||||||||
| Fiscal Years | Fiscal Years | |||||||||||||||||||
| 2015 | 2014 | 2013 | 2015 | 2014 | ||||||||||||||||
| Revenue |
$ | 71,712 | $ | 79,473 | $ | 80,368 | $ | — | $ | 2,439 | ||||||||||
| Cost of revenue |
46,931 | 51,425 | 53,153 | — | 1,249 | |||||||||||||||
|
|
|
|
|
|
|
|
|
|
|
|||||||||||
| Gross profit |
24,781 | 28,048 | 27,215 | — | 1,190 | |||||||||||||||
| Operating expenses: |
||||||||||||||||||||
| Research and development |
2,319 | 2,334 | 2,083 | — | 4,531 | |||||||||||||||
| Selling, general and administrative |
2,441 | 3,586 | 747 | — | 1,078 | |||||||||||||||
| Restructuring charges |
— | — | — | — | 2,962 | |||||||||||||||
|
|
|
|
|
|
|
|
|
|
|
|||||||||||
| Total operating expenses |
4,760 | 5,920 | 2,830 | — | 8,571 | |||||||||||||||
|
|
|
|
|
|
|
|
|
|
|
|||||||||||
| Income (loss) from discontinued operations |
20,021 | 22,128 | 24,385 | — | (7,381 | ) | ||||||||||||||
| Other income (expense) |
4,000 | — | — | — | — | |||||||||||||||
| Gain on sale |
61,771 | — | — | 1,550 | — | |||||||||||||||
|
|
|
|
|
|
|
|
|
|
|
|||||||||||
| Income (loss) before income taxes |
85,792 | 22,128 | 24,385 | 1,550 | (7,381 | ) | ||||||||||||||
| Income tax provision (benefit) |
32,652 | 8,032 | 8,852 | 559 | (2,776 | ) | ||||||||||||||
|
|
|
|
|
|
|
|
|
|
|
|||||||||||
| Income (loss) from discontinued operations |
$ | 53,140 | $ | 14,096 | $ | 15,533 | $ | 991 | $ | (4,605 | ) | |||||||||
|
|
|
|
|
|
|
|
|
|
|
|||||||||||
| Above includes depreciation & amortization of |
$ | 189 | $ | 302 | $ | 311 | $ | — | $ | — | ||||||||||
| Cashflow from Operating Activities |
$ | (9,513 | ) | $ | 16,945 | $ | 11,798 | $ | 991 | $ | (4,605 | ) | ||||||||
| Cashflow from Investing Activities |
$ | (505 | ) | $ | (275 | ) | $ | (48 | ) | $ | — | $ | — | |||||||
Cash flow from investing activities presented above excludes proceeds from the sale of business.
95
Table of Contents
20. EARNINGS PER SHARE
The following table set forth the computation for basic and diluted net income (loss) per share of common stock (in thousands, except per share data):
| Fiscal Years | ||||||||||||
| 2015 | 2014 | 2013 | ||||||||||
| Numerator: |
||||||||||||
| Income (loss) from continuing operations |
$ | (4,597 | ) | $ | (24,814 | ) | $ | 2,663 | ||||
| Loss from discontinued operations |
54,131 | 9,491 | 15,533 | |||||||||
|
|
|
|
|
|
|
|||||||
| Net income (loss) |
48,589 | (15,323 | ) | 18,196 | ||||||||
|
|
|
|
|
|
|
|||||||
| Warrant liability gain |
— | — | — | |||||||||
|
|
|
|
|
|
|
|||||||
| Net income (loss) attributable to common stockholders |
$ | 48,589 | $ | (15,323 | ) | $ | 18,196 | |||||
|
|
|
|
|
|
|
|||||||
| Denominator: |
||||||||||||
| Weighted average common shares outstanding-basic |
51,146 | 47,009 | 45,916 | |||||||||
| Dilutive effect of options and warrants |
— | — | 1,221 | |||||||||
|
|
|
|
|
|
|
|||||||
| Weighted average common shares outstanding-diluted |
51,146 | 47,009 | 47,137 | |||||||||
|
|
|
|
|
|
|
|||||||
| Common stock earnings per share-basic: |
||||||||||||
| Continuing operations |
$ | (0.11 | ) | $ | (0.53 | ) | $ | 0.06 | ||||
| Discontinued operations |
1.06 | 0.20 | 0.34 | |||||||||
|
|
|
|
|
|
|
|||||||
| Net common stock earnings per share-basic |
$ | 0.95 | $ | (0.33 | ) | $ | 0.40 | |||||
|
|
|
|
|
|
|
|||||||
| Common stock earnings per share-diluted: |
||||||||||||
| Continuing operations |
$ | (0.11 | ) | $ | (0.53 | ) | $ | 0.06 | ||||
| Discontinued operations |
1.06 | 0.20 | 0.33 | |||||||||
|
|
|
|
|
|
|
|||||||
| Net common stock earnings per share-diluted |
$ | 0.95 | $ | (0.33 | ) | $ | 0.39 | |||||
|
|
|
|
|
|
|
|||||||
The following common equivalent shares were excluded from the calculation from net income per share as their inclusion would have been antidilutive (in thousands):
| Fiscal Years | ||||||||||||
| 2015 | 2014 | 2013 | ||||||||||
| Stock options and restricted stock |
1,342 | 1,079 | — | |||||||||
| Warrants |
714 | 329 | — | |||||||||
|
|
|
|
|
|
|
|||||||
| Total common stock equivalent shares excluded |
2,056 | 1,408 | — | |||||||||
|
|
|
|
|
|
|
|||||||
21. SUPPLEMENTAL CASH FLOW INFORMATION
The following is supplemental cash flow information regarding noncash investing and financing activities:
| Fiscal Years | ||||||||||||
| 2015 | 2014 | 2013 | ||||||||||
| Cash paid for interest |
$ | 15,607 | $ | 6,994 | $ | 501 | ||||||
| Cash paid for income taxes |
$ | 22,676 | $ | 4,668 | $ | 7,318 | ||||||
| • | As of October 2, 2015 and October 3, 2014, we had $3.2 million and $2.4 million, respectively, in unpaid amounts related to purchases of property and equipment and intangibles included in accounts |
96
Table of Contents
| payable and accrued liabilities. These amounts have been excluded from the payments for purchases of property and equipment until paid. |
| • | Upon closing the Mindspeed Acquisition, we assumed $40.2 million of the seller’s indebtedness, all of which was paid in fiscal year 2014. |
22. ACCUMULATED OTHER COMPREHENSIVE INCOME
The components of accumulated other comprehensive income, net of income taxes, are as follows:
| Foreign currency items |
Other items | Total | ||||||||||
| Balance — September 27, 2013 |
$ | (167 | ) | $ | — | $ | (167 | ) | ||||
| Foreign currency translation adjustment |
(1,097 | ) | — | (1,097 | ) | |||||||
| Pension adjustment, net of tax |
— | (90 | ) | (90 | ) | |||||||
|
|
|
|
|
|
|
|||||||
| Balance — October 3, 2014 |
(1,264 | ) | (90 | ) | (1,354 | ) | ||||||
| Foreign currency translation, net of tax |
(918 | ) | — | (918 | ) | |||||||
| Other adjustments |
— | 90 | 90 | |||||||||
| Unrealized gain/loss on short term investments |
— | (97 | ) | (97 | ) | |||||||
|
|
|
|
|
|
|
|||||||
| Balance — October 2, 2015 |
$ | (2,182 | ) | $ | (97 | ) | $ | (2,279 | ) | |||
|
|
|
|
|
|
|
|||||||
23. GEOGRAPHIC AND SIGNIFICANT CUSTOMER INFORMATION
We have one reportable operating segment which designs, develops, manufactures, and markets semiconductors and modules. The determination of the number of reportable operating segments is based on the chief operating decision maker’s use of financial information for the purposes of assessing performance and making operating decisions. In evaluating financial performance and making operating decisions, the chief operating decision maker primarily uses consolidated net revenue, gross profit, and operating income (loss).
Information about our operations in different geographic regions, based upon customer locations, is presented below (in thousands):
| Fiscal Years | ||||||||||||
| Revenue by Geographic Region |
2015 | 2014 | 2013 | |||||||||
| United States |
$ | 152,974 | $ | 134,436 | $ | 110,686 | ||||||
| China |
92,493 | 33,308 | 21,057 | |||||||||
| Taiwan |
56,421 | 34,344 | 10,612 | |||||||||
| Other countries (1) |
118,721 | 137,101 | 100,348 | |||||||||
|
|
|
|
|
|
|
|||||||
| Total |
$ | 420,609 | $ | 339,189 | $ | 242,703 | ||||||
|
|
|
|
|
|
|
|||||||
| (1) | No other international countries represented greater than 10% of total revenue during the periods presented. |
| As of | ||||||||
| Long-Lived Assets by Geographic Region |
October 2, 2015 |
October 3, 2014 |
||||||
| United States |
$ | 72,617 | $ | 41,726 | ||||
| International (1) |
11,142 | 8,326 | ||||||
|
|
|
|
|
|||||
| Total |
$ | 83,759 | $ | 50,052 | ||||
|
|
|
|
|
|||||
| • | No other international country or region represented greater than 10% of the total net long-lived assets as of the dates presented. |
97
Table of Contents
The following is a summary of customer concentrations as a percentage of total sales and accounts receivable as of and for the periods presented:
| Fiscal Years | ||||||||||||
| Revenue |
2015 | 2014 | 2013 | |||||||||
| Customer A |
18 | % | 19 | % | 21 | % | ||||||
| Customer B |
12 | % | 10 | % | — | % | ||||||
| October 2, 2015 |
October 3, 2014 |
|||||||
| Accounts Receivable |
||||||||
| Customer A |
22 | % | 20 | % | ||||
| Customer B |
14 | % | 2 | % | ||||
| Customer C |
10 | % | 8 | % | ||||
No other customer represented more than 10% of revenue or accounts receivable in the periods presented in the accompanying consolidated financial statements. In fiscal years 2015, 2014, and 2013, ten customers represented an aggregate of 57%, 52% and 47% of total revenue, respectively.
24. QUARTERLY FINANCIAL DATA (UNAUDITED)
(In thousands, except per share data)
| First Quarter |
Second Quarter |
Third Quarter |
Fourth Quarter |
Fiscal Year |
||||||||||||||||
| Fiscal Year 2015 |
||||||||||||||||||||
| Revenue |
$ | 96,556 | $ | 102,431 | $ | 109,058 | $ | 112,564 | $ | 420,609 | ||||||||||
| Gross profit |
47,419 | 46,714 | 52,496 | 56,961 | 203,590 | |||||||||||||||
| Income (loss) from continuing operations (1) |
(9,963 | ) | (11,176 | ) | 1,756 | 13,841 | (5,542 | ) | ||||||||||||
| Income (loss) from discontinued operations (1) |
3,657 | 3,639 | 6,271 | 40,564 | 54,131 | |||||||||||||||
| Per share data (2) |
||||||||||||||||||||
| Income (loss) from continuing operations, basic |
$ | (0.21 | ) | $ | (0.22 | ) | $ | 0.03 | $ | 0.26 | $ | (0.11 | ) | |||||||
|
|
|
|
|
|
|
|
|
|
|
|||||||||||
| Income (loss) from discontinued operations, basic |
$ | 0.08 | $ | 0.07 | $ | 0.12 | $ | 0.76 | $ | 1.06 | ||||||||||
|
|
|
|
|
|
|
|
|
|
|
|||||||||||
| Per share data (2) |
||||||||||||||||||||
| Income (loss) from continuing operations, diluted (3) |
$ | (0.21 | ) | $ | (0.22 | ) | $ | 0.03 | $ | 0.08 | $ | (0.11 | ) | |||||||
|
|
|
|
|
|
|
|
|
|
|
|||||||||||
| Income (loss) from discontinued operations, diluted |
$ | 0.08 | $ | 0.07 | $ | 0.11 | $ | 0.74 | $ | 1.06 | ||||||||||
|
|
|
|
|
|
|
|
|
|
|
|||||||||||
| Fiscal Year 2014 |
||||||||||||||||||||
| Revenue |
$ | 64,278 | $ | 87,734 | $ | 93,318 | $ | 93,859 | $ | 339,189 | ||||||||||
| Gross profit |
28,408 | 20,142 | 43,606 | 48,784 | 140,940 | |||||||||||||||
| Income (loss) from continuing operations |
(10,853 | ) | (23,189 | ) | (1,350 | ) | 10,578 | (24,814 | ) | |||||||||||
| Income (loss) from discontinued operations (1) |
1,932 | 1,067 | 2,533 | 3,959 | 9,491 | |||||||||||||||
| Per share data (2) |
||||||||||||||||||||
| Income (loss) from continuing operations, basic |
$ | (0.23 | ) | $ | (0.50 | ) | $ | (0.03 | ) | $ | 0.22 | $ | (0.53 | ) | ||||||
|
|
|
|
|
|
|
|
|
|
|
|||||||||||
| Income (loss) from discontinued operations, basic |
$ | 0.04 | $ | 0.02 | $ | 0.05 | $ | 0.08 | $ | 0.20 | ||||||||||
|
|
|
|
|
|
|
|
|
|
|
|||||||||||
| Per share data (2) |
||||||||||||||||||||
| Income (loss) from continuing operations, diluted |
$ | (0.23 | ) | $ | (0.50 | ) | $ | (0.03 | ) | $ | 0.22 | $ | (0.53 | ) | ||||||
|
|
|
|
|
|
|
|
|
|
|
|||||||||||
| Income (loss) from discontinued operations, diluted |
$ | 0.04 | $ | 0.02 | $ | 0.05 | $ | 0.08 | $ | 0.20 | ||||||||||
|
|
|
|
|
|
|
|
|
|
|
|||||||||||
98
Table of Contents
| (1) | During the fourth quarter of fiscal year 2015 we divested our Automotive business and during the second quarter of fiscal year 2014, we divested the Mindspeed wireless business. |
| (2) | Earnings per share calculations for each of the quarters are based on the weighted average number of shares outstanding and included common stock equivalents in each period. Therefore, the sums of the quarters may not necessarily equal the full year earnings per share. |
| (3) | Diluted income (loss) per shares for the fiscal fourth quarter 2015 excludes $9.7 million related to warrant liability gain. |
25. SUBSEQUENT EVENTS
On November 17, 2015, we entered into a definitive agreement to acquire FiBest Limited (FiBest), a Japan-based merchant market component supplier of optical sub assemblies, in an all-cash transaction valued at approximately ¥7.3 billion, or $60 million. We expect to fund the purchase price of the acquisition with available cash. Closing is subject to customary closing conditions and is expected to occur during the company’s fiscal first quarter of 2016.
99
Table of Contents
ITEM 9. CHANGES IN AND DISAGREEMENTS WITH ACCOUNTANTS ON ACCOUNTING AND FINANCIAL DISCLOSURE.
None.
ITEM 9A. CONTROLS AND PROCEDURES.
Evaluation of Disclosure Controls and Procedures
We maintain disclosure controls and procedures (as defined in Rule 13a-15(e) under the Securities Exchange Act of 1934, as amended (the “Exchange Act”), that are intended to ensure that information that would be required to be disclosed in Exchange Act reports is recorded, processed, summarized and reported within the time periods specified in the SEC’s rules and forms, and that such information is accumulated and communicated to our management, including the Principal Executive Officer and the Principal Financial Officer, as appropriate, to allow timely decisions regarding required disclosure.
We carried out an evaluation, under the supervision, and with the participation of our management, including our Principal Executive Officer and Principal Financial Officer, of the effectiveness of the design and operation of our disclosure controls and procedures as of October 2, 2015. We acquired BinOptics on December 15, 2014. During our fiscal year 2015 we commenced integrating BinOptics into our internal controls over financial reporting procedures. As such the scope of our evaluation of the effectiveness of our disclosure controls and procedures for fiscal year 2015 did not include the internal control over financial reporting of BinOptics for periods prior to integration. BinOptics pre-integration total assets and revenue were not material to our consolidated 2015 total assets and revenue. Based on this evaluation, our Principal Executive Officer and Principal Financial Officer concluded that our disclosure controls and procedures were not effective as of October 2, 2015 due to the material weakness in internal control over financial reporting described below.
Management has identified a material weakness in its internal control over financial reporting related to information technology general controls in the areas of user access security and program change management. For additional information regarding the nature of this material weakness, see “Management’s Report on Internal Control Over Financial Reporting” below. We have developed a remediation plan for this material weakness, which is described below under “Remediation Activities.”
Notwithstanding the identified material weakness and management’s assessment that internal control over financial reporting was ineffective as of October 2, 2015, management believes that the audited consolidated financial statements contained in this Annual Report fairly present, in all material respects, our financial condition, results of operations and cash flows for the fiscal years presented in conformity with accounting principles generally accepted in the United States of America. Additionally, this material weakness did not result in any restatements of our audited consolidated financial statements and disclosures for any prior period previously reported by us.
Management’s Annual Report on Internal Control over Financial Reporting
Our management is responsible for establishing and maintaining adequate internal control over financial reporting. Internal control over financial reporting is defined in Rule 13a-15(f) promulgated under the Exchange Act as a process, designed by, or under the supervision of our principal executive and principal financial officers and effected by our board of directors, management and other personnel, to provide reasonable assurance regarding the reliability of financial reporting and the preparation of financial statements for external purposes in accordance with accounting principles generally accepted in the United States of America. Internal control over financial reporting includes maintaining records that in reasonable detail accurately and fairly reflect our transactions and disposition of assets; providing reasonable assurance that transactions are recorded as necessary for preparation of our financial statements; providing reasonable assurance that receipts and expenditures are made only in accordance with management and board authorizations; and providing reasonable assurance regarding prevention or timely detection of unauthorized acquisition, use or disposition of our assets that could have a material effect on our financial statements.
100
Table of Contents
Because of its inherent limitations, internal control over financial reporting is not intended to provide absolute assurance that a misstatement of our financial statements would be prevented or detected. Also, projections of any evaluation of effectiveness to future periods are subject to the risk that controls may become inadequate because of changes in conditions or that the degree of compliance with policies or procedures may deteriorate.
Management, with the participation of our Principal Executive and Principal Financial Officers, conducted an evaluation of the effectiveness of our internal control over financial reporting as of October 2, 2015 based on the framework and criteria established in Internal Control—Integrated Framework (2013) issued by the Committee of Sponsoring Organizations of the Treadway Commission. This evaluation included review of the documentation of controls, evaluation of the design effectiveness of controls, testing of the operating effectiveness of controls and a conclusion on this evaluation. Based on the foregoing, management concluded that our internal control over financial reporting was not effective as of October 2, 2015 for the reasons described below.
In the course of completing our assessment of internal control over financial reporting as of October 2, 2015, management identified a number of deficiencies related to the design and operating effectiveness of information technology (“IT”) general controls for certain information systems including our primary ERP system that comprise part of our system of internal control over financial reporting and are relevant to the preparation of its consolidated financial statements (such information technology systems are referred to as the “affected IT systems”). Specifically, our process lacks sufficient internal controls intended to ensure (i) that access to affected IT systems, and the ability to make program changes, were adequately restricted to appropriate personnel and (ii) that the activities of individuals with access to modify data and make program changes were appropriately monitored.
As a result of the deficiencies within the aforementioned information technology environment, there is a possibility that the effectiveness of business process controls, which are dependent on the affected IT systems, or electronic data and financial reports, generated from the affected IT systems, could be adversely impacted. Therefore, management has concluded that, as of October 2, 2015, there was a material weakness in internal control over financial reporting related to information technology general controls in the areas of user access security and program change management for the affected IT systems. A material weakness is a deficiency, or a combination of deficiencies, in internal control over financial reporting, such that there is a reasonable possibility that a material misstatement of our annual or interim financial statements will not be prevented or detected on a timely basis.
Changes in Internal Control over Financial Reporting
During our fourth fiscal quarter 2015 we implemented additional procedures associated with our acquisition related internal controls over financial reporting and also performed extensive analysis related to our acquisition related financial reporting and disclosures. As a result of the implementation of these additional fourth quarter 2015 procedures and analysis we concluded that we have remediated the material weakness associated with purchase accounting and reporting of the BinOptics acquisition identified during the nine months ended July 3, 2015. In addition, during our fourth fiscal quarter we identified a material weakness in our IT systems as described above. Other than these two items, there have been no changes in the Company’s internal control over financial reporting that occurred during the three months ended October 2, 2015 that have materially affected, or are reasonably likely to materially affect, the Company’s internal control over financial reporting.
101
Table of Contents
Remediation Activities
We are actively engaged in the implementation of a remediation plan to ensure that controls contributing to this material weakness are designed appropriately and will operate effectively. The remediation actions we are taking and expect to take include the following:
| • | Implementation of improved user access security and program management controls, inclusive of monitoring controls, to enable optimal security configuration with appropriate segregation of duties for the affected IT systems. |
| • | Enhance existing program change management control activities for affected IT systems. |
| • | Expansion of resources in the functional areas that support and monitor our IT systems and the information generated therefrom. |
Management believes that these efforts will effectively remediate the material weakness. However, the material weakness in our internal control over financial reporting will not be considered remediated until the new controls are fully implemented, in operation for a sufficient period of time and tested and concluded by management to be designed and operating effectively, and we cannot provide any assurance that these remediation efforts will be successful or that our internal control over financial reporting will be effective as a result of these efforts. In addition, as we continue to evaluate and work to improve its internal control over financial reporting, management may determine to take additional measures to address control deficiencies or determine to modify the remediation plan described above. Management will test and evaluate the implementation of these new processes and internal controls during fiscal 2016 to ascertain whether they are designed and operating effectively to provide reasonable assurance that they will prevent or detect a material error in our financial statements. Subject to the foregoing, management believes these remediation efforts will be completed during fiscal year 2016.
102
Table of Contents
Report of Independent Registered Public Accounting Firm
To the Board of Directors and Stockholders of
M/A-COM Technology Solutions Holdings, Inc.
Lowell, Massachusetts
We have audited the internal control over financial reporting of M/A-COM Technology Solutions Holdings, Inc. and subsidiaries (the “Company”) as of October 2, 2015, based on criteria established in Internal Control—Integrated Framework (2013) issued by the Committee of Sponsoring Organizations of the Treadway Commission. The Company’s management is responsible for maintaining effective internal control over financial reporting and for its assessment of the effectiveness of internal control over financial reporting, included in the accompanying “Management’s Annual Report on Internal Control Over Financial Reporting” appearing at Item 9A. Our responsibility is to express an opinion on the Company’s internal control over financial reporting based on our audit.
We conducted our audit in accordance with the standards of the Public Company Accounting Oversight Board (United States). Those standards require that we plan and perform the audit to obtain reasonable assurance about whether effective internal control over financial reporting was maintained in all material respects. Our audit included obtaining an understanding of internal control over financial reporting, assessing the risk that a material weakness exists, testing and evaluating the design and operating effectiveness of internal control based on the assessed risk, and performing such other procedures as we considered necessary in the circumstances. We believe that our audit provides a reasonable basis for our opinion.
A company’s internal control over financial reporting is a process designed by, or under the supervision of, the company’s principal executive and principal financial officers, or persons performing similar functions, and effected by the company’s board of directors, management, and other personnel to provide reasonable assurance regarding the reliability of financial reporting and the preparation of financial statements for external purposes in accordance with generally accepted accounting principles. A company’s internal control over financial reporting includes those policies and procedures that (1) pertain to the maintenance of records that, in reasonable detail, accurately and fairly reflect the transactions and dispositions of the assets of the company; (2) provide reasonable assurance that transactions are recorded as necessary to permit preparation of financial statements in accordance with generally accepted accounting principles, and that receipts and expenditures of the company are being made only in accordance with authorizations of management and directors of the company; and (3) provide reasonable assurance regarding prevention or timely detection of unauthorized acquisition, use, or disposition of the company’s assets that could have a material effect on the financial statements.
Because of the inherent limitations of internal control over financial reporting, including the possibility of collusion or improper management override of controls, material misstatements due to error or fraud may not be prevented or detected on a timely basis. Also, projections of any evaluation of the effectiveness of the internal control over financial reporting to future periods are subject to the risk that the controls may become inadequate because of changes in conditions, or that the degree of compliance with the policies or procedures may deteriorate.
A material weakness is a deficiency, or combination of deficiencies, in internal control over financial reporting, such that there is a reasonable possibility that a material misstatement of the company’s annual or interim financial statements will not be prevented or detected on a timely basis. The following material weakness has been identified and included in management’s assessment. Management identified a material weakness in internal control over financial reporting relating to the design and operating effectiveness of user access and program change management controls related to certain information systems that are relevant to the preparation of the Company’s consolidated financial statements and system of internal control over financial reporting. This material weakness was considered in determining the nature, timing and extent of audit tests applied in our audit of the consolidated financial statements as of and for the year ended October 2, 2015, of the Company and this report does not affect our report on such financial statements.
103
Table of Contents
In our opinion, because of the effects of the material weakness identified above on the achievement of the objectives of the control criteria, the Company has not maintained effective internal control over financial reporting as of October 2, 2015, based on the criteria established in Internal Control—Integrated Framework (2013) issued by the Committee of Sponsoring Organizations of the Treadway Commission.
We have also audited, in accordance with the standards of the Public Company Accounting Oversight Board (“PCAOB”) (United States), the consolidated balance sheets of M/A-COM Technology Solutions Holdings, Inc., and subsidiaries as of October 2, 2015 and October 3, 2014, and the related consolidated statements of operations, changes in stockholders’ equity, and cash flows for each of the three fiscal years in the period ended October 2, 2015 of M/A-COM Technology Solutions Holdings, Inc., and subsidiaries and our report dated November 24, 2015 expressed an unqualified opinion thereon.
/s/ Deloitte & Touche LLP
Boston, Massachusetts
November 24, 2015
None.
104
Table of Contents
ITEM 10. DIRECTORS, EXECUTIVE OFFICERS AND CORPORATE GOVERNANCE.
The information required by this item is incorporated herein by reference to our definitive proxy statement for the 2015Annual Meeting of Stockholders to be filed with the SEC within 120 days after October 2, 2015.
We have adopted a written code of business conduct and ethics that applies to our directors, officers and employees, including our principal executive officer, principal financial officer, principal accounting officer or controller, and persons performing similar functions. We make available our code of business conduct and ethics free of charge through our website, which is located at www.macom.com. We intend to disclose any amendments to, or waivers from, our code of business conduct and ethics that are required to be publicly disclosed pursuant to rules of the SEC and the NASDAQ Global Select Market by posting any such amendment or waivers on our website and disclosing any such waivers in a Form 8-K filed with the SEC.
ITEM 11. EXECUTIVE COMPENSATION.
The information required by this item is incorporated herein by reference to our definitive proxy statement for the 2015 Annual Meeting of Stockholders to be filed with the SEC within 120 days after October 2, 2015.
ITEM 12. SECURITY OWNERSHIP OF CERTAIN BENEFICIAL OWNERS AND MANAGEMENT AND RELATED STOCKHOLDER MATTERS.
The information required by this item is incorporated herein by reference to our definitive proxy statement for the 2015 Annual Meeting of Stockholders to be filed with the SEC within 120 days after October 2, 2015.
Equity Compensation Plan Information
We have two equity compensation plans under which shares are currently authorized for issuance, our 2012 Omnibus Incentive Plan (2012 Plan) and our 2012 Employee Stock Purchase Plan (2012 ESPP). We also maintain our Amended and Restated 2009 Omnibus Incentive Plan (2009 Plan), however, no additional awards may be issued under the 2009 Plan. Each of our aforementioned plans were approved by our stockholders prior to our initial public offering in March 2012. The following table provides information regarding securities authorized for issuance as of October 2, 2015 under our equity compensation plans.
| Plan Category |
(a) Number of securities to be issued upon exercise of outstanding options, warrants and rights(1) |
(b) Weighted-average exercise price of outstanding options, warrants and rights(1) |
(c) Number of securities remaining available for future issuance under equity compensation plans (excluding securities reflected in column (a))(2)(3)(4) |
|||||||||
| Equity Compensation Plans Approved by Security Holders |
1,860,791 | $ | 1.23 | 9,238,981 | ||||||||
| Equity Compensation Plans Not Approved by Security Holders |
— | — | — | |||||||||
|
|
|
|
|
|
|
|||||||
| Total |
1,860,791 | $ | 1.23 | 9,238,981 | ||||||||
|
|
|
|
|
|
|
|||||||
| 1. | Does not include 581,990 unvested shares outstanding as of October 2, 2015 in the form of restricted stock awards or restricted stock units under our 2012 Plan, which do not require the payment of any consideration by the recipients. |
| 2. | Reflects 450,617 restricted stock units granted and outstanding as of October 2, 2015. |
105
Table of Contents
| 3. | The 2012 Plan contains an “evergreen” provision, pursuant to which the number of shares of our common stock available for issuance under the 2012 Plan can be increased on the first day of each fiscal year equal to the lesser of (a) 4.0% of our outstanding common stock on a fully diluted basis as of the end of our immediately preceding fiscal year, (b) 1.9 million shares of our common stock, and (c) a lesser amount determined by our board of directors; provided, however, that any shares from any increases in previous years that are not actually issued will continue to be available for issuance under the 2012 Plan. |
| 4. | The 2012 ESPP contains an “evergreen” provision, pursuant to which the number of shares of our common stock available for issuance under the 2012 ESPP can be increased on the first day of each fiscal year equal to the lesser of (a) 1.25% of our outstanding common stock on a fully diluted basis as of the end of our immediately preceding fiscal year, (b) 550,000 shares of our common stock, and (c) a lesser amount determined by our board of directors; provided, however, that any shares from any increases in previous years that are not actually issued will continue to be available for issuance under the 2012 ESPP. |
ITEM 13. CERTAIN RELATIONSHIPS AND RELATED TRANSACTIONS, AND DIRECTOR INDEPENDENCE.
The information required by this item is incorporated herein by reference to our definitive proxy statement for the 2015 Annual Meeting of Stockholders to be filed with the SEC within 120 days after October 2, 2015.
ITEM 14. PRINCIPAL ACCOUNTING FEES AND SERVICES.
The information required by this item is incorporated herein by reference to our definitive proxy statement for the 2015 Annual Meeting of Stockholders to be filed with the SEC within 120 days after October 2, 2015.
106
Table of Contents
ITEM 15. EXHIBITS, FINANCIAL STATEMENT SCHEDULES.
(a) Financial Statements (included in Item 8 of this Annual Report on Form 10-K):
Report of Independent Registered Public Accounting Firm
Consolidated Balance Sheets as of October 2, 2015 and October 3, 2014
Consolidated Statements of Operations for the Fiscal Years Ended October 2, 2015, October 3, 2014 and September 27, 2013
Consolidated Statements of Cash Flows for the Fiscal Years October 2, 2015, October 3, 2014 and September 27, 2013
Consolidated Statements of Stockholders’ Equity and Comprehensive Income (Loss) for the Fiscal Years Ended October 2, 2015, October 3, 2014 and September 27, 2013
Notes to Consolidated Financial Statements
(b) Exhibits
The exhibits required by Item 601 of Regulation S-K are filed herewith and incorporated by reference herein.
| Exhibit |
Description | |
| 2.1 | Membership Interest Purchase Agreement by and among M/A-COM Technology Solutions Inc., Nitronex, LLC and GaAs Labs, LLC, dated February 13, 2014 (incorporated by reference to Exhibit 2.1 to our Current Report on Form 8-K filed on February 13, 2014). | |
| 2.2 | Agreement and Plan of Merger by and among M/A-COM Technology Solutions Inc., BinOptics Corporation, Borealis Merger Sub, Inc. and Ithaca Stockholders’ Agent, LLC, as stockholders’ agent, dated November 17, 2014 (incorporated by reference to Exhibit 2.1 to our Current Report on Form 8-K filed on November 19, 2014). | |
| 2.3 | Stock Purchase Agreement, dated July 16, 2015, among Autoliv ASP Inc., M/A-COM Technology Solutions Inc., M/A-COM Auto Solutions Inc. and M/A-COM Technology Solutions Holdings, Inc. (incorporated by reference to Exhibit 2.1 to our Current Report on Form 8-K filed on July 17, 2015). | |
| 3.1 | Fourth Amended and Restated Certificate of Incorporation (incorporated by reference to Exhibit 3.3 to Amendment No. 6 to our Registration Statement on Form S-1 (File No. 333-175934) filed on February 28, 2012). | |
| 3.2 | Second Amended and Restated Bylaws (incorporated by reference to Exhibit 3.4 to Amendment No. 6 to our Registration Statement on Form S-1 (File No. 333-175934) filed on February 28, 2012). | |
| 4.1 | Specimen of Common Stock Certificate (incorporated by reference to Exhibit 4.1 to Amendment No. 4 to our Registration Statement on Form S-1 (File No. 333-175934) filed on November 23, 2011). | |
| 4.2 | Form of Common Stock Purchase Warrant issued on December 21, 2010 (incorporated by reference to Exhibit 4.3 our Registration Statement on Form S-1 (File No. 333-175934) filed on August 1, 2011). | |
107
Table of Contents
| 4.3 | Second Amended and Restated Investor Rights Agreement, dated February 28, 2012 (incorporated by reference to Exhibit 4.2 to Amendment No. 6 to our Registration Statement on Form S-1 (File No. 333-175934) filed on February 28, 2012). | |
| 4.4 | First Amendment to the Second Amended and Restated Investor Rights Agreement, dated May 20, 2013 (incorporated by reference to Exhibit 4.5 to our Registration Statement on Form S-3 (File No. 333-188728) filed on May 21, 2013). | |
| 4.5 | Second Amendment to the Second Amended and Restated Investor Rights Agreement, dated February 2, 2015 (incorporated by reference to Exhibit 4.5 to our Registration Statement on Form S-3 ASR (File No. 333-201827) filed on February 2, 2015). | |
| 10.1* | Form of Indemnification Agreement between M/A-COM Technology Solutions Holdings, Inc. and each of its directors and executive officers (incorporated by reference to Exhibit 10.1 to Amendment No. 3 to our Registration Statement on Form S-1 (File No. 333-175934) filed on October 21, 2011). | |
| 10.2 | M/A-COM Technology Solutions Holdings, Inc. Amended and Restated 2009 Omnibus Stock Plan, as amended (incorporated by reference to Exhibit 10.2 to our Annual Report on Form 10-K filed on November 28, 2012). | |
| 10.3 | Form of Incentive Stock Option Agreement under the M/A-COM Technology Solutions Holdings, Inc. 2009 Omnibus Stock Plan (incorporated by reference to Exhibit 10.3 to our Registration Statement on Form S-1 (File No. 333-175934) filed on August 1, 2011). | |
| 10.4* | Form of Restricted Stock Agreement under the M/A-COM Technology Solutions Holdings, Inc. 2009 Omnibus Stock Plan (incorporated by reference to Exhibit 10.4 to our Registration Statement on Form S-1 (File No. 333-175934) filed on August 1, 2011). | |
| 10.5* | M/A-COM Technology Solutions Holdings, Inc. 2012 Omnibus Incentive Plan, as amended (incorporated by reference to Exhibit 10.5 to our Annual Report on Form 10-K filed on November 28, 2012). | |
| 10.6* | Form of Restricted Stock Unit Award Agreement under 2012 Omnibus Incentive Plan (Time-Based and Performance-Based) (incorporated by reference to Exhibit 10.1 to our Current Report on Form 8-K filed on April 27, 2015). | |
| 10.7* | Form of Nonqualified Stock Option Agreement under 2012 Omnibus Incentive Plan (Performance-Based) (incorporated by reference to Exhibit 10.2 to our Current Report on Form 8-K filed on April 27, 2015). | |
| 10.8* | M/A-COM Technology Solutions Holdings, Inc. 2012 Employee Stock Purchase Plan, as amended. (incorporated by reference to Exhibit 10.4 to our Quarterly Report on Form 10-Q filed on February 2, 2015). | |
| 10.9* | Mindspeed Technologies, Inc. 2013 Equity Incentive Plan (incorporated by reference to Exhibit 10.1 to the Current Report on Form 8-K filed by Mindspeed Technologies, Inc. on February 12, 2013 (File No. 001-31650)). | |
| 10.10* | Mindspeed Technologies, Inc. 2003 Long-Term Incentives Plan (incorporated by reference to Exhibit 10.1 to the Current Report on Form 8-K filed by Mindspeed Technologies, Inc. on April 8, 2011 (File No. 001-31650)). | |
| 10.11* | M/A-COM Technology Solutions Holdings, Inc. Change in Control Plan, as amended and restated through November 13, 2015. | |
| 10.12* | Offer of Employment Letter to Michael Murphy, dated September 28, 2009, as amended (incorporated by reference to Exhibit 10.13 to our Registration Statement on Form S-1 (File No. 333-175934) filed on August 1, 2011). | |
108
Table of Contents
| 10.13* | Offer of Employment to John Croteau, dated September 6, 2012 (incorporated by reference to Exhibit 10.1 to our Current Report on Form 8-K filed on September 7, 2012). | |
| 10.14* | Offer of Employment to Robert McMullan, dated December 11, 2013 (incorporated by reference to Exhibit 10.2 to our Current Report on Form 8-K filed on December 16, 2013). | |
| 10.15* | Offer of Promotion and Revised Terms of Employment Letter, dated September 24, 2013, between M/A-COM Technology Solutions Inc. and Robert Dennehy (incorporated by reference to Exhibit 10.1 to our Quarterly Report on Form 10-Q filed on February 2, 2015). | |
| 10.16* | Offer of Employment Letter, dated as of December 11, 2013, between M/A-COM Technology Solutions Inc. and Preetinder Virk (incorporated by reference to Exhibit (d)(8) to Amendment No. 4 to our Tender Offer Statement on Schedule TO filed with the SEC on December 11, 2013). | |
| 10.17 | Credit Agreement by and among M/A-COM Technology Solutions Holdings, Inc., Goldman Sachs Bank USA, as Administrative Agent, Collateral Agent, Swing Line Lender and an L/C Issuer, and the other agents and lenders party thereto, dated May 8, 2014 (incorporated by reference to Exhibit 10.1 to our Current Report on Form 8-K filed on May 12, 2014). | |
| 10.18 | Incremental Amendment, dated February 13, 2015, among Morgan Stanley Senior Funding, Inc., M/A-Com Technology Solutions Holdings, Inc., and Goldman Sachs Bank USA incorporated by reference to Exhibit 10.1 to our Quarterly Report on Form 10-Q filed on May 13, 2015. | |
| 10.19* | Form of Restricted Stock Award Agreement under 2012 Omnibus Incentive Plan (incorporated by reference to Exhibit 10.1 to our Quarterly Report on Form 10-Q filed on August 12, 2015). | |
| 10.20 | Consulting Agreement, dated July 16, 2015, among M/A-COM Technology Solutions Inc., M/A-COM Auto Solutions Inc. and Autoliv ASP Inc. (incorporated by reference to Exhibit 10.1 to our Current Report on Form 8-K filed on July 17, 2015). | |
| 10.21 | Agreement of Purchase and Sale, dated June 17, 2015, between Cobham Properties, Inc. and M/A-COM Technology Solutions Inc. (incorporated by reference to Exhibit 10.1 to our Current Report on Form 8-K filed on June 23, 2015). | |
| 21.1 | Subsidiaries of Registrant. | |
| 23.1 | Consent of Deloitte & Touche LLP. | |
| 31.1 | Certification of Principal Executive Officer Required Under Rule 13a-14(a) and 15d-14(a) of the Securities Exchange Act of 1934, as amended. | |
| 31.2 | Certification of Principal Financial Officer Required Under Rule 13a-14(a) and 15d-14(a) of the Securities Exchange Act of 1934, as amended. | |
| 32.1 | Certification of Principal Executive Officer and Principal Financial Officer Required Under Rule 13a-14(b) of the Securities Exchange Act of 1934, as amended, and 18 U.S.C. §1350. | |
| 101.INS | XBRL Instance Document | |
| 101.SCH | XBRL Taxonomy Extension Schema Document | |
| 101.CAL | XBRL Taxonomy Calculation Linkbase Document | |
| 101.DEF | XBRL Taxonomy Definition Linkbase Document | |
| 101.LAB | XBRL Taxonomy Label Linkbase Document | |
| 101.PRE | XBRL Taxonomy Presentation Linkbase Document | |
| * | Management contract or compensatory plan. |
109
Table of Contents
Pursuant to the requirements of Section 13 or 15(d) of the Securities Exchange Act of 1934, the registrant has duly caused this Annual Report to be signed on its behalf by the undersigned, thereunto duly authorized.
Date: November 24, 2015
| M/A-COM TECHNOLOGY SOLUTIONS HOLDINGS, INC. Registrant |
||||||
| By: | /s/ John Croteau |
|||||
| John Croteau | ||||||
| President and Chief Executive Officer | ||||||
Pursuant to the requirements of the Securities Exchange Act of 1934, this report has been signed below by the following persons on behalf of the registrant and in the capacities indicated on November 24, 2015.
| Signature and Title |
Signature and Title | |||
| /s/ John Croteau |
/s/ John Ocampo | |||
| John Croteau | John Ocampo | |||
| President and Chief Executive Officer | Chairman of the Board | |||
| Director (principal executive officer)
/s/ Robert J. McMullan Robert J. McMullan Senior Vice President and Chief Financial Officer (principal accounting and financial officer) |
/s/ Susan Ocampo Susan Ocampo Director
/s/ Peter Chung Peter Chung Director | |||
| /s/ Gil Van Lunsen Gil Van Lunsen Director | ||||
| /s/ Charles Bland Charles Bland Director | ||||
| /s/ Stephen Daly Stephen Daly Director | ||||
110
Table of Contents
EXHIBIT INDEX
| Exhibit |
Description | |
| 2.1 | Membership Interest Purchase Agreement by and among M/A-COM Technology Solutions Inc., Nitronex, LLC and GaAs Labs, LLC, dated February 13, 2014 (incorporated by reference to Exhibit 2.1 to our Current Report on Form 8-K filed on February 13, 2014). | |
| 2.2 | Agreement and Plan of Merger by and among M/A-COM Technology Solutions Inc., BinOptics Corporation, Borealis Merger Sub, Inc. and Ithaca Stockholders’ Agent, LLC, as stockholders’ agent, dated November 17, 2014 (incorporated by reference to Exhibit 2.1 to our Current Report on Form 8-K filed on November 19, 2014). | |
| 2.3 | Stock Purchase Agreement, dated July 16, 2015, among Autoliv ASP Inc., M/A-COM Technology Solutions Inc., M/A-COM Auto Solutions Inc. and M/A-COM Technology Solutions Holdings, Inc. (incorporated by reference to Exhibit 2.1 to our Current Report on Form 8-K filed on July 17, 2015). | |
| 3.1 | Fourth Amended and Restated Certificate of Incorporation (incorporated by reference to Exhibit 3.3 to Amendment No. 6 to our Registration Statement on Form S-1 (File No. 333-175934) filed on February 28, 2012). | |
| 3.2 | Second Amended and Restated Bylaws (incorporated by reference to Exhibit 3.4 to Amendment No. 6 to our Registration Statement on Form S-1 (File No. 333-175934) filed on February 28, 2012). | |
| 4.1 | Specimen of Common Stock Certificate (incorporated by reference to Exhibit 4.1 to Amendment No. 4 to our Registration Statement on Form S-1 (File No. 333-175934) filed on November 23, 2011). | |
| 4.2 | Form of Common Stock Purchase Warrant issued on December 21, 2010 (incorporated by reference to Exhibit 4.3 our Registration Statement on Form S-1 (File No. 333-175934) filed on August 1, 2011). | |
| 4.3 | Second Amended and Restated Investor Rights Agreement, dated February 28, 2012 (incorporated by reference to Exhibit 4.2 to Amendment No. 6 to our Registration Statement on Form S-1 (File No. 333-175934) filed on February 28, 2012). | |
| 4.4 | First Amendment to the Second Amended and Restated Investor Rights Agreement, dated May 20, 2013 (incorporated by reference to Exhibit 4.5 to our Registration Statement on Form S-3 (File No. 333-188728) filed on May 21, 2013). | |
| 4.5 | Second Amendment to the Second Amended and Restated Investor Rights Agreement, dated February 2, 2015 (incorporated by reference to Exhibit 4.5 to our Registration Statement on Form S-3 ASR (File No. 333-201827) filed on February 2, 2015). | |
| 10.1* | Form of Indemnification Agreement between M/A-COM Technology Solutions Holdings, Inc. and each of its directors and executive officers (incorporated by reference to Exhibit 10.1 to Amendment No. 3 to our Registration Statement on Form S-1 (File No. 333-175934) filed on October 21, 2011). | |
| 10.2 | M/A-COM Technology Solutions Holdings, Inc. Amended and Restated 2009 Omnibus Stock Plan, as amended (incorporated by reference to Exhibit 10.2 to our Annual Report on Form 10-K filed on November 28, 2012). | |
| 10.3 | Form of Incentive Stock Option Agreement under the M/A-COM Technology Solutions Holdings, Inc. 2009 Omnibus Stock Plan (incorporated by reference to Exhibit 10.3 to our Registration Statement on Form S-1 (File No. 333-175934) filed on August 1, 2011). | |
| 10.4* | Form of Restricted Stock Agreement under the M/A-COM Technology Solutions Holdings, Inc. 2009 Omnibus Stock Plan (incorporated by reference to Exhibit 10.4 to our Registration Statement on Form S-1 (File No. 333-175934) filed on August 1, 2011). | |
111
Table of Contents
| 10.5* | M/A-COM Technology Solutions Holdings, Inc. 2012 Omnibus Incentive Plan, as amended (incorporated by reference to Exhibit 10.5 to our Annual Report on Form 10-K filed on November 28, 2012). | |
| 10.6* | Form of Restricted Stock Unit Award Agreement under 2012 Omnibus Incentive Plan (Time-Based and Performance-Based) (incorporated by reference to Exhibit 10.1 to our Current Report on Form 8-K filed on April 27, 2015). | |
| 10.7* | Form of Nonqualified Stock Option Agreement under 2012 Omnibus Incentive Plan (Performance-Based) (incorporated by reference to Exhibit 10.2 to our Current Report on Form 8-K filed on April 27, 2015). | |
| 10.8* | M/A-COM Technology Solutions Holdings, Inc. 2012 Employee Stock Purchase Plan, as amended. (incorporated by reference to Exhibit 10.4 to our Quarterly Report on Form 10-Q filed on February 2, 2015). | |
| 10.9* | Mindspeed Technologies, Inc. 2013 Equity Incentive Plan (incorporated by reference to Exhibit 10.1 to the Current Report on Form 8-K filed by Mindspeed Technologies, Inc. on February 12, 2013 (File No. 001-31650)). | |
| 10.10* | Mindspeed Technologies, Inc. 2003 Long-Term Incentives Plan (incorporated by reference to Exhibit 10.1 to the Current Report on Form 8-K filed by Mindspeed Technologies, Inc. on April 8, 2011 (File No. 001-31650)). | |
| 10.11* | M/A-COM Technology Solutions Holdings, Inc. Change in Control Plan, as amended and restated through November 13, 2015. | |
| 10.12* | Offer of Employment Letter to Michael Murphy, dated September 28, 2009, as amended (incorporated by reference to Exhibit 10.13 to our Registration Statement on Form S-1 (File No. 333-175934) filed on August 1, 2011). | |
| 10.13* | Offer of Employment to John Croteau, dated September 6, 2012 (incorporated by reference to Exhibit 10.1 to our Current Report on Form 8-K filed on September 7, 2012). | |
| 10.14* | Offer of Employment to Robert McMullan, dated December 11, 2013 (incorporated by reference to Exhibit 10.2 to our Current Report on Form 8-K filed on December 16, 2013). | |
| 10.15* | Offer of Promotion and Revised Terms of Employment Letter, dated September 24, 2013, between M/A-COM Technology Solutions Inc. and Robert Dennehy (incorporated by reference to Exhibit 10.1 to our Quarterly Report on Form 10-Q filed on February 2, 2015). | |
| 10.16* | Offer of Employment Letter, dated as of December 11, 2013, between M/A-COM Technology Solutions Inc. and Preetinder Virk (incorporated by reference to Exhibit (d)(8) to Amendment No. 4 to our Tender Offer Statement on Schedule TO filed with the SEC on December 11, 2013). | |
| 10.17 | Credit Agreement by and among M/A-COM Technology Solutions Holdings, Inc., Goldman Sachs Bank USA, as Administrative Agent, Collateral Agent, Swing Line Lender and an L/C Issuer, and the other agents and lenders party thereto, dated May 8, 2014 (incorporated by reference to Exhibit 10.1 to our Current Report on Form 8-K filed on May 12, 2014). | |
| 10.18 | Incremental Amendment, dated February 13, 2015, among Morgan Stanley Senior Funding, Inc., M/A-Com Technology Solutions Holdings, Inc., and Goldman Sachs Bank USA incorporated by reference to Exhibit 10.1 to our Quarterly Report on Form 10-Q filed on May 13, 2015. | |
| 10.19* | Form of Restricted Stock Award Agreement under 2012 Omnibus Incentive Plan (incorporated by reference to Exhibit 10.1 to our Quarterly Report on Form 10-Q filed on August 12, 2015). | |
| 10.20 | Consulting Agreement, dated July 16, 2015, among M/A-COM Technology Solutions Inc., M/A-COM Auto Solutions Inc. and Autoliv ASP Inc. (incorporated by reference to Exhibit 10.1 to our Current Report on Form 8-K filed on July 17, 2015). | |
112
Table of Contents
| 10.21 | Agreement of Purchase and Sale, dated June 17, 2015, between Cobham Properties, Inc. and M/A-COM Technology Solutions Inc. (incorporated by reference to Exhibit 10.1 to our Current Report on Form 8-K filed on June 23, 2015). | |
| 21.1 | Subsidiaries of Registrant. | |
| 23.1 | Consent of Deloitte & Touche LLP. | |
| 31.1 | Certification of Principal Executive Officer Required Under Rule 13a-14(a) and 15d-14(a) of the Securities Exchange Act of 1934, as amended. | |
| 31.2 | Certification of Principal Financial Officer Required Under Rule 13a-14(a) and 15d-14(a) of the Securities Exchange Act of 1934, as amended. | |
| 32.1 | Certification of Principal Executive Officer and Principal Financial Officer Required Under Rule 13a-14(b) of the Securities Exchange Act of 1934, as amended, and 18 U.S.C. §1350. | |
| 101.INS | XBRL Instance Document | |
| 101.SCH | XBRL Taxonomy Extension Schema Document | |
| 101.CAL | XBRL Taxonomy Calculation Linkbase Document | |
| 101.DEF | XBRL Taxonomy Definition Linkbase Document | |
| 101.LAB | XBRL Taxonomy Label Linkbase Document | |
| 101.PRE | XBRL Taxonomy Presentation Linkbase Document | |
| * | Management contract or compensatory plan. |
113