Attached files
| file | filename |
|---|---|
| 8-K - FORM 8-K - Tower International, Inc. | v424172_8k.htm |
| EX-99.1 - EXHIBIT 99.1 - Tower International, Inc. | v424172_ex99-1.htm |
Exhibit 99.2

Potential Sale of Tower Europe November 10, 2015

2 Forward - Looking Statements and Risk Factors This presentation contains statements which constitute forward - looking statements, within the meaning of the Private Securities Litigation Reform Act of 1995, including but not limited to statements regarding the possibility of a sale of Tow er Europe, potential benefits from a sale of Tower Europe, the possibility of accretive growth and /or stock buybacks, our anticipated transaction timeline and projected revenue, adjusted EBITDA , adjusted EBITDA margin, and free cash flow. The forward - looking statements can be identified by words such as “anticipate,” “believe,” “plan,” “estimate,” “expect,” “intend,” “project,” “target,” and other similar expressions. Forward - looking statements are made as of the date of this presentation and are based upon management’s current expectations and beliefs concerning future developments and their potential effects on us. Such forward - looking statements are not guarantees of future performance. The following important factors, as well as risk factors described in our reports filed with the SEC, could cause our actual results to differ materially from estimates or expectations reflected in such forward - looking statements: • global automobile production volumes; • the financial condition of our customers and suppliers; • our ability to make scheduled payments of principal or interest on our indebtedness and comply with the covenants and restrictions contained in the instruments governing our indebtedness; • our ability to refinance our indebtedness; • risks associated with our non - U.S. operations, including foreign exchange risks and economic uncertainty in some regions; • any increase in the expense and funding requirements of our pension and other postretirement benefits; • our customers’ ability to obtain equity and debt financing for their businesses; • our dependence on our largest customers; • pricing pressure from our customers; • work stoppages or other labor issues affecting us or our customers or suppliers; • our ability to integrate acquired businesses; • risks associated with business divestitures including volatility in the capital markets, the capacity of potential bidders to finance transactions and the difficulty of predicting the outcome of negotiations; and • costs or liabilities relating to environmental and safety regulations We do not assume any obligation to update or revise the forward - looking statements contained in this presentation.

3 Potential Sale of Tower Europe: How This Can Benefit Shareholders • Demonstrate through sum - of - the - parts valuation what we believe is a major disconnect between TOWR’s present stock price and the Company’s intrinsic value. • Focus shareholders on a Tower North America business with strong growth, profit margin, and cash flow comparable to or better than other auto parts companies that have significantly higher valuation multiples. • Result in a very strong Tower balance sheet. • Provide Tower the financial flexibility to invest in additional accretive growth and/or to buy back stock.

Expected Benefits for Customers in Europe • Industrial synergies should further improve supplier competitiveness and capabilities. • A buyer will likely plan to invest even more on growth and technology than Tower can presently afford to allocate to its European Operations. Expected Benefit for Customers in North America • Further strengthen Tower’s balance sheet and provide capital flexibility to pursue additional customer - requested opportunities and sector consolidation. Expected Benefit for Tower Colleagues and Suppliers • If a sale of Tower Europe occurs, we expect the result to be stronger and more capable remaining suppliers in both Europe and North America - - which we believe should provide an even better future outlook for the vast majority of Tower’s existing colleagues and suppliers. 4 Potential Sale of Tower Europe: How This Can Benefit Customers (and Colleagues and Suppliers)

5 Overview of Tower Europe Locations Key Vehicle Platforms Modern Technology Directional Financial Data • Volvo V40 • Fiat Jeep Renegade • Mercedes Sprinter • Skoda Octavia • Porsche Cayenne • Porsche Macan • VW Up • VW Caddy Van • Fiat 500/500X • BMW 3 - Series Hot Forming? Yes Aluminum Forming & Joining ? Yes Servo Transfer Press? Yes (in $ millions with € =$1.10) Proj. 2015 • Revenue ~ $650 • Adj. EBITDA* ~ $70 - Margin ~ 10.5-11% • Free Cash Flow** - Pct. of Revenue ~ 5% - - - - - * Excluding allocated U.S. corporate cost ** Unlevered and excluding customer tooling Duisburg, Germany Gent, Belgium Cologne, Germany Zwickau, Germany Buchholz, Germany Artern, Germany Opole, Poland Malacky, Slovakia Caserta, Italy Melfi, Italy Factories Tech Center, Regional HQ Mlada Boleslav, Czech Republic See Appendix for comments regarding non - GAAP financial measures.

6 How will Tower decide whether or not to complete a sale of Tower Europe? • Tower Europe will be sold only if we receive a satisfactory offer. – While we believe the timing is right to evaluate whether a sale of Tower Europe could provide the significant benefits reviewed on the prior slides, there is no business requirement to sell. • Tower is fully prepared to continue to own and operate its European operations if that is judged to be the best outcome at the conclusion of this evaluation. – To limit possible distractions or uncertainty, the evaluation process will be completed expeditiously.
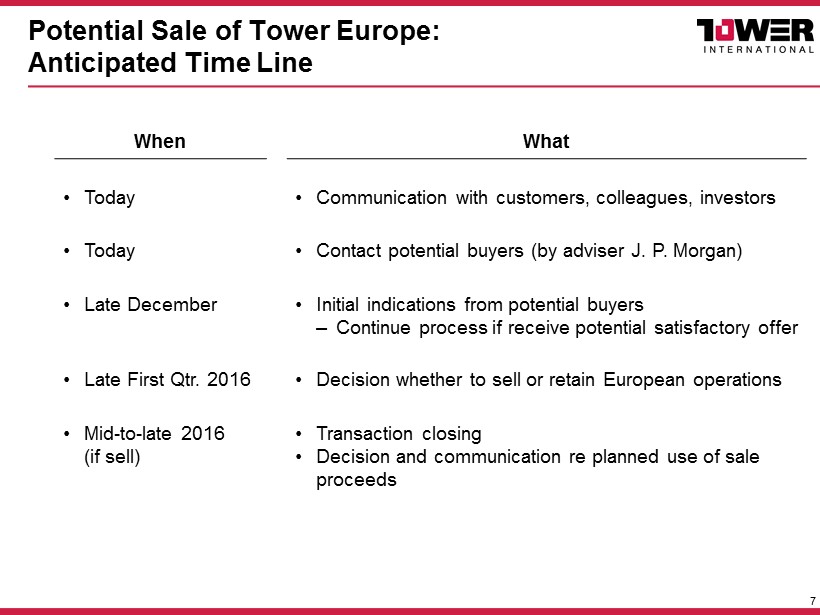
7 Potential Sale of Tower Europe: Anticipated Time Line When What • Today • Communication with customers, colleagues, investors • Today • Contact potential buyers (by adviser J. P. Morgan) • Late December • Initial indications from potential buyers – Continue process if receive potential satisfactory offer • Late First Qtr. 2016 • Decision whether to sell or retain European operations • Mid - to - late 2016 (if sell) • Transaction closing • Decision and communication re planned use of sale proceeds
8 Why Tower Will Be Successful If It Is No Longer Fully Global • Our sector has not experienced meaningful global program sourcing because cost economies strongly favor regional sourcing. – Our parts are expensive to ship because of weight and size. – Capital intensity makes utilization of existing installed capacity from the best - located supplier the most cost - effective solution. – There are no meaningful supplier cost or technology synergies in our business from being global (other than spreading corporate overhead over larger revenue). • If needed by customers or beneficial to Tower, we will be able to invest in the future in China, India, or other growth markets. – This is where the OEMs are most likely to add future capacity and need suppliers’ support.
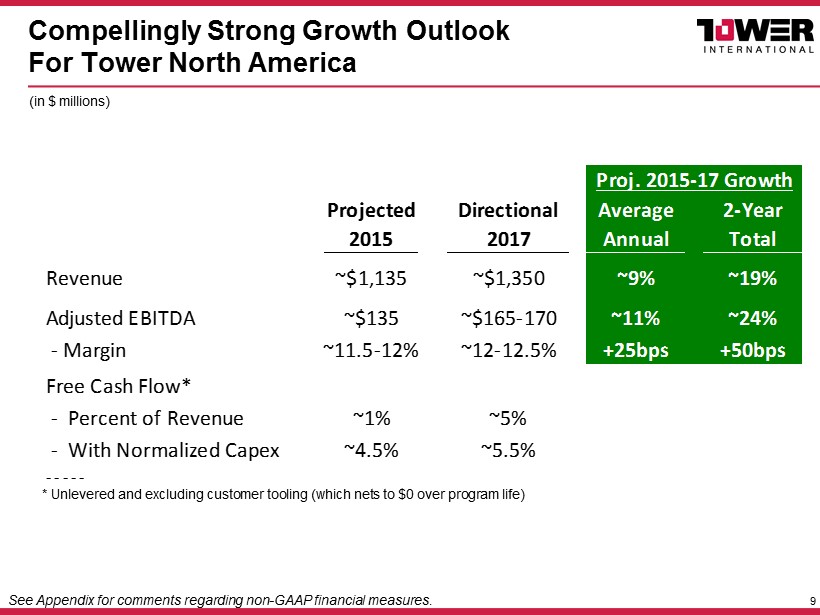
9 Compellingly Strong Growth Outlook For Tower North America Projected Directional Average 2-Year 2015 2017 Annual Total Revenue ~$1,135 ~$1,350 ~9% ~19% Adjusted EBITDA ~$135 ~$165-170 ~11% ~24% - Margin ~11.5-12% ~12-12.5% +25bps +50bps Free Cash Flow* - Percent of Revenue ~1% ~5% - With Normalized Capex ~4.5% ~5.5% Proj. 2015-17 Growth - - - - - * Unlevered and excluding customer tooling (which nets to $0 over program life) (in $ millions) See Appendix for comments regarding non - GAAP financial measures.
APPENDIX 10

This presentation includes the following non - GAAP financial measures: “adjusted EBITDA”, “adjusted EBITDA margin”, “free cash flow”. We define adjusted EBITDA as net income / (loss) before interest, taxes, depreciation, amortization, restructuring items and other adjustments described in the reconciliations provided in this presentation. Adjusted EBITDA margin represents adjusted EBITDA divided by revenues. Free cash flow is defined as cash provided by operating activities less cash disbursed for purchases of property, plant and equipment. We use adjusted EBITDA, adjusted EBITDA margin, free cash flow, as supplements to information provided in accordance with generally accepted accounting principles (“GAAP”) in evaluating our business and they are included in this presentation because they are principal factors upon which our management assesses performance. The non - GAAP measures presented above are not measures of performance under GAAP. These measures should not be considered as alternatives for the most directly comparable financial measures calculated in accordance with GAAP. Other companies in our industry may define these non - GAAP measures differently than we do and, as a result, these non - GAAP measures may not be comparable to similarly titled measures used by other companies in our industry; and certain of our non - GAAP financial measures exclude financial information that some may consider important in evaluating our performance. Given the inherent uncertainty regarding special items and other expense in any future period, a reconciliation of forward - looking financial measures to the most directly comparable financial measures calculated and presented in accordance with GAAP is not feasible. The magnitude of these items, however, may be significant. 11 Non - GAAP Financial Measures