Attached files
Table of Contents
UNITED STATES
SECURITIES AND EXCHANGE COMMISSION
Washington, D.C. 20549
Form 10-K
ANNUAL REPORT PURSUANT TO SECTION 13 OR 15(d)
OF THE SECURITIES EXCHANGE ACT OF 1934
| For the fiscal year ended: | Commission file number: | |
| December 31, 2010 | 001-34903 |
TOWER INTERNATIONAL, INC.
(Exact name of Registrant as specified in its charter)
| Delaware | 27-3679414 | |
| (State of Incorporation) | (IRS Employer Identification Number) | |
| 17672 Laurel Park Drive North, Suite 400 E Livonia, Michigan |
48152 | |
| (Address of Principal Executive Offices) | (Zip Code) | |
Registrant’s telephone number, including area code: (248) 675-6000
Securities registered pursuant to Section 12(b) of the Act:
| Title of each class |
Name of each exchange on which registered | |
| Common Stock, par value $.01 per share | New York Stock Exchange |
Securities registered pursuant to Section 12(g) of the Act:
None
Indicate by check mark if the Registrant is a well-known seasoned issuer, as defined in Rule 405 of the Securities Act. Yes ¨ No x
Indicate by check mark if the registrant is not required to file reports pursuant to Section 13 or Section 15d of the Act. Yes ¨ No x
Indicate by check mark whether the Registrant (1) has filed all reports required to be filed by Section 13 or 15(d) of the Securities Exchange Act of 1934 during the preceding 12 months (or for such shorter period that the registrant was required to file such reports), and (2) has been subject to such filing requirements for the past 90 days. Yes x No ¨
Indicate by check mark whether the registrant has submitted electronically and posted on its corporate website, if any, every Interactive Data File required to be submitted and posted pursuant to Rule 405 of Regulation S-T (§232.405 of this chapter) during the preceding 12 months (or for such shorter period that the registrant was required to submit and post such files). Yes ¨ No ¨ Not applicable
Indicate by check mark if disclosure of delinquent filers pursuant to Item 405 of Regulation S-K is not contained herein, and will not be contained, to the best of registrant’s knowledge, in definitive proxy or information statements incorporated by reference in Part III of this Form 10-K or any amendment to this Form 10-K. x
Indicate by check mark whether the Registrant is a large accelerated filer, an accelerated filer, a non-accelerated filer, or a smaller reporting company. See the definitions of “large accelerated filer,” “accelerated filer,” and “smaller reporting company” in Rule 12b-2 of the Exchange Act. (Check one):
Large accelerated filer ¨ Accelerated filer ¨ Non-accelerated filer x Smaller reporting company ¨
Indicate by check mark whether the registrant is a shell company (as defined in Rule 12b-2 of the Exchange Act). Yes ¨ No x
The registrant completed the initial public offering of its common stock in October 2010. Accordingly, there was no public market for the registrant’s common stock as of June 30, 2010, the last day of the registrant’s most recently completed second fiscal quarter.
There were 19,101,588 shares of the registrant’s common stock outstanding at March 14, 2011.
DOCUMENTS INCORPORATED BY REFERENCE
Certain portions, as expressly described in this report, of the Registrant’s Proxy Statement for the 2011 Annual Meeting of the Stockholders, to be filed within 120 days of December 31, 2010, are incorporated by reference into Part III.
Table of Contents
TOWER INTERNATIONAL, INC. – FORM 10-K
FOR THE FISCAL YEAR ENDED DECEMBER 31, 2010
TABLE OF CONTENTS
| 10-K Pages | ||||||
| PART I |
||||||
| Item 1. | 1 | |||||
| Item 1A. | 13 | |||||
| Item 1B. | 34 | |||||
| Item 2. | 35 | |||||
| Item 3. | 36 | |||||
| Item 4. | 36 | |||||
| PART II |
||||||
| Item 5. | 37 | |||||
| Item 6. | 38 | |||||
| Item 7. | Management’s Discussion and Analysis of Financial Condition and Results of Operations |
41 | ||||
| Item 7A. | 72 | |||||
| Item 8. | 74 | |||||
| Item 9. | Changes in and Disagreements with Accountants on Accounting and Financial Disclosure |
122 | ||||
| Item 9A. | 122 | |||||
| Item 9B. | 122 | |||||
| PART III |
||||||
| Item 10. | 123 | |||||
| Item 11. | 123 | |||||
| Item 12. | Security Ownership of Certain Beneficial Owners and Management and Related Stockholder Matters |
123 | ||||
| Item 13. | Certain Relationships and Related Transactions, and Director Independence |
123 | ||||
| Item 14. | 123 | |||||
| PART IV |
||||||
| Item 15. | 124 | |||||
| Signatures Exhibit Index Exhibits EX-21 EX-23 EX-24 EX-31.1 EX-31.2 EX-32.1 EX-32.2 |
||||||
Table of Contents
PART I
| Item 1. | Business |
Our History and Corporate Structure
Our Corporate History
Tower Automotive, Inc., our predecessor (the “Predecessor Company”), was formed in 1993 to acquire R. J. Tower Corporation. On February 2, 2005, Tower Automotive, Inc. along with 25 of its United States subsidiaries each filed a voluntary petition for relief under Chapter 11 of the Bankruptcy Code in the United States Bankruptcy Court, Southern District of New York. On July 11, 2007, the Bankruptcy Court confirmed the Chapter 11 Reorganization Plan of the debtors and approved the sale of substantially all of the debtors’ assets to Tower Automotive, LLC, an affiliate of Cerberus Capital Management, L.P. (“CCM”) and funds and accounts affiliated with CCM (collectively, “Cerberus”). The plan became effective on July 31, 2007, and in connection therewith, the debtors completed the sale of substantially all of their assets to Tower Automotive, LLC. As part of the sale, Tower Automotive, LLC also acquired the capital stock of substantially all of the foreign subsidiaries of Tower Automotive, Inc.
Our Corporate Conversion and IPO
On October 14, 2010, (i) all of our equity owners transferred their equity interests in Tower Automotive, LLC to a newly created limited liability company, Tower International Holdings, LLC, a newly formed entity controlled by Cerberus, (ii) Tower Automotive, LLC converted into a Delaware corporation, which was named Tower International, Inc., and (iii) all of the equity interests in Tower Automotive, LLC were converted into common stock of Tower International, Inc. We refer to this transaction as our “Corporate Conversion.”
On October 15, 2010, our common stock began trading on the New York Stock Exchange following our IPO. On October 20, 2010, we received $75.6 million of proceeds, after underwriting discounts and commissions, in connection with the sale of 6,250,000 shares of common stock in our IPO. On November 8, 2010, we sold an additional 383,722 shares of common stock resulting in additional proceeds of $4.6 million, after underwriting discounts and commissions, pursuant to a partial exercise of the underwriters’ over-allotment option.
All references to our company in this Annual Report for periods prior to the effective time of our Corporate Conversion are to Tower Automotive, LLC and its subsidiaries. All references to our company in this Annual Report for periods subsequent to the effective time of our Corporate Conversion are to Tower International, Inc. and its subsidiaries.
Our Company
We are a leading integrated global manufacturer of engineered structural metal components and assemblies primarily serving automotive original equipment manufacturers (“OEMs”). We offer our automotive customers a broad product portfolio, supplying body-structure stampings, frame and other chassis structures, as well as complex welded assemblies, for small and large cars, crossovers, pickups and SUVs.
Our products are manufactured at 31 production facilities strategically located near our customers in North America, South America, Europe and Asia. We support our manufacturing operations through nine engineering and sales locations throughout the world. We are a disciplined, process-driven company with an experienced management team that has a history of implementing sustainable operational improvements. From January 1, 2008 through December 31, 2010, we achieved more than $250 million in manufacturing and purchasing cost reductions. We achieved these cost reductions in large part through successful implementation of Lean Six Sigma principles and rigorous application of global best practices. These cost reductions helped us achieve a 10.5% gross profit margin in 2010. For the year ended December 31, 2010, we generated revenues of $2 billion and a
1
Table of Contents
net loss attributable to Tower International, Inc. of $(36.9) million. In addition, we had Adjusted EBITDA of $190.2 million and an Adjusted EBITDA margin of 9.5% for the year ended December 31, 2010. (See Item 7 of this Annual Report and Note 16 to our consolidated financial statements)
We believe that our product capabilities, our geographic, customer and product diversification, and the cost reductions that we achieved in 2008 through 2010 position us to benefit from a recovery in global automotive industry production. We also intend to leverage our program management and engineering expertise to pursue growth opportunities outside of our existing automotive markets.
Our Industry
We believe OEMs produce a majority of their structural metal components and assemblies internally. While OEM policies differ and may be especially impacted by their own capacity utilization, the capital expenditures associated with internal production can be substantial. We believe that longer term, OEMs may outsource a greater proportion of their stamping requirements because of this capital and fixed-cost intensity and we may benefit from this shift in our customer preferences. In addition, we believe OEMs will increasingly favor global vehicle platforms supported by larger, more capable and financially strong suppliers. Given our global manufacturing footprint, cost structure and integrated design, engineering and program management capabilities, we are well-positioned to take advantage of these potential opportunities.
Our Competitive Strengths
Geographic Diversification
We are well-diversified geographically, which positions us to participate in growth opportunities as they occur over time around the world and mitigates the impact of regional production fluctuations on our business. These potential opportunities range from near-term cyclical volume recovery in North America and Europe to continued growth in emerging markets such as Brazil and China. Proximity to end customers is especially important in our business because size and weight make our products difficult and expensive to transport. Our geographic mix of revenues for 2010, 2009 and 2008 is shown below:
Geographic Mix (% of Revenues)
| Year Ended December 31, | ||||||||||||
| Region |
2010 | 2009 | 2008 | |||||||||
| Europe |
36% | 40% | 41% | |||||||||
| North America |
32% | 29% | 32% | |||||||||
| South Korea |
14% | 12% | 12% | |||||||||
| South America |
10% | 10% | 10% | |||||||||
| China |
8% | 9% | 5% | |||||||||
| Total |
100% | 100% | 100% | |||||||||
Customer Diversification
We have a well-diversified customer mix. In 2010, no single customer accounted for more than 16% of our revenues, and nine different OEMs individually accounted for 5% or more of our revenues. European OEMs, including Volvo and Opel, were our biggest customer group in 2010, followed by Asian OEMs, with Ford, General Motors and Chrysler (which we refer to as the “Detroit 3”) OEMs representing the smallest group, at 21% of 2010 revenues. Ford accounted for approximately 62% of our 2010 Detroit 3 revenues. With this customer diversification, we believe we are well-positioned to participate in the anticipated automotive recovery, while also mitigating our exposure to any individual customer. The below charts summarize our customer mix as a percent of revenues in 2010, 2009 and 2008.
2
Table of Contents
Customer Mix (% of Revenues)
| Year Ended December 31, | ||||||||||||
| Customer |
2010 | 2009 | 2008 | |||||||||
| VW |
16% | 17% | 14% | |||||||||
| Hyundai/Kia |
13% | 10% | 11% | |||||||||
| Ford |
13% | 13% | 14% | |||||||||
| Fiat |
11% | 13% | 11% | |||||||||
| Volvo |
8% | 10% | 10% | |||||||||
| Chrysler |
7% | 5% | 7% | |||||||||
| Nissan |
7% | 6% | 6% | |||||||||
| Daimler |
5% | 5% | 7% | |||||||||
| Toyota |
5% | 5% | 6% | |||||||||
| BMW |
4% | 5% | 4% | |||||||||
| Chery |
2% | 3% | 1% | |||||||||
| Honda |
2% | 2% | 3% | |||||||||
| Other |
7% | 6% | 6% | |||||||||
| Total |
100% | 100% | 100% | |||||||||
Customer Mix by Region (% of Revenues)
| Year Ended December 31, | ||||||||||||
| OEM |
2010 | 2009 | 2008 | |||||||||
| European OEMs |
49% | 54% | 51% | |||||||||
| Asian OEMs |
30% | 28% | 28% | |||||||||
| Detroit 3 OEMs |
21% | 18% | 21% | |||||||||
| Total |
100% | 100% | 100% | |||||||||
Platform Diversification
Our products are offered on a diverse mix of vehicle platforms, reflecting the balanced portfolio approach of our business model and the breadth of our product capabilities. We believe that our platform diversification provides us an opportunity to participate in an industry recovery without being overly exposed to a single vehicle model. We supply products to approximately 170 vehicle models globally. Our 10 largest vehicle models represented approximately 36% of our 2010 revenues.
Vehicle Platform Mix (% of Revenues)
| Year Ended December 31, | ||||||||||||
| Vehicle Platform |
2010 | 2009 | 2008 | |||||||||
| Small Cars |
43% | 49% | 43% | |||||||||
| Large Cars |
24% | 21% | 22% | |||||||||
| North American Framed Vehicles |
20% | 18% | 16% | |||||||||
| Other—Light Trucks |
13% | 12% | 19% | |||||||||
| Total |
100% | 100% | 100% | |||||||||
3
Table of Contents
The term “small cars” refers to passenger cars that are classified by IHS Automotive® (“IHS”) in the smallest three of IHS’s four categories of passenger cars, the term “large cars” refers to the largest category of passenger cars, multi-purpose vehicles and cross-over vehicles that are based on a unibody structure and the term “North American framed vehicles” refers to vehicles that are built on a full-frame structure, such as pick-up trucks and most sports utility vehicles.
Competitive Cost Structure
Based on the cost improvement actions taken and the results we have achieved, we believe we have a competitive cost structure. Between 2005 and 2007, while operating under bankruptcy protection, we achieved significant restructuring savings. For example, in North America the manufacturing footprint was reduced from 23 to 12 plants, a 48% reduction. In addition, the average North American labor rate for hourly production workers, including wages and fringe benefits, was reduced by approximately 15%, to what we believe is a competitive level for our sector. Also, we froze our pension plan and our post-retirement healthcare liability was capped to an amount which, at December 31, 2010, was $0.6 million. With our current leadership team, we shifted aggressively to improve productivity and manufacturing throughput to world-class standards to further improve our cost structure. We launched three additional operating efficiency initiatives during 2010 (for a total of ten initiatives) and we intend to implement other efficiency programs in the future to assist us in driving costs out of our manufacturing and procurement processes.
We measure our operating efficiencies in manufacturing and purchasing cost reductions as a percentage of our material and manufacturing costs. We believe the typical percentage for our industry is approximately 2% to 3%. From January 1, 2008 through December 31, 2009, we achieved $195 million in manufacturing and purchasing cost reductions, or 6% of material and manufacturing costs. During 2010, we achieved $55.8 million in manufacturing and purchasing cost reductions, or 3% of material and manufacturing costs. While we experienced above-average cost reductions during our turn-around after bankruptcy, we expect to trend toward a rate of 2% to 3% in the near-term. Our focus in 2011 and beyond is to retain the benefit of these achieved cost savings as anticipated volume recovery occurs.
Our Strategy
Our strategy is to strengthen our leadership position as a supplier to the global automotive industry and to expand opportunistically into non-automotive markets, seeking to capitalize on opportunities beyond the expected industry recovery. We believe that our core strengths described above position us to continue to provide a high-quality, compelling value proposition to our customers, enabling profitable growth. Specific strategic objectives include:
Revenue Growth
Our strategy for revenue growth has three main pillars: organic automotive growth, expansion into solar and other non-automotive markets, and opportunistic acquisitions and joint ventures.
Organic Automotive Growth: Although for planning purposes we have been and remain cautious about the pace of automotive industry recovery in 2011, we believe that vehicle growth will be above-average over the next three-to-five years. Having significantly improved our cost structure over the last three years, we believe that we are poised to benefit from an anticipated cyclical recovery in the European and North American markets and to grow in developing markets like Brazil and China, which we believe have above-average secular growth prospects. In terms of organic automotive growth, our planning assumption is that our growth will roughly track the growth in annual vehicle production. We will also strive to increase our share of business principally through contract wins for new models developed by our existing customers and by expanding our customer base, while maintaining good geographic, customer and platform diversification.
Expansion into Other Non-Automotive Markets: We intend to leverage our integrated engineering, manufacturing and program-management expertise to pursue growth opportunities in non-automotive markets. For example, the solar industry shows promise for us, as many applications require highly engineered large
4
Table of Contents
stampings and complex welded structural assemblies that must be produced in high volume at repeatable tight tolerances, similar to our product requirements in the automotive industry. We believe the solar industry in the United States and globally has the potential to grow at an average rate substantially greater than the trend rate for the automotive industry. As previously announced, our initial solar customer, Stirling Energy Systems (“SES”), experienced delays in obtaining financing, curtailed expenditures and ultimately experienced the termination of both of the power-purchase agreements for its principal solar projects, resulting in our writing down our investment by $7.3 million. We continue to monitor developments in the solar industry and pursue relationships with potential solar customers other than SES. Beyond solar, we believe there may be similar opportunities in the future to apply and extend our core skills in other industries, such as defense.
Opportunistic Acquisitions and Joint Ventures: We intend to analyze and pursue acquisition opportunities where we believe we can add value and realize synergies by improving operating results through application of our processes, as demonstrated in our own business. We anticipate that the automotive structural metals and assemblies sector will experience increased consolidation and believe that we are well-positioned to participate successfully in that evolution. We also intend to seek suitable partners to set up additional joint ventures in developing automotive markets such as China, which we believe have above-average secular growth prospects. Further, to support our expansion into non-automotive markets, we may pursue acquisitions that align with our non-automotive initiatives.
Continuous Process-Driven Operating Improvements
Our business philosophy and approach is grounded in the fundamental importance of building capabilities through ongoing process awareness and improvements. That focus and mindset applies to daily plant and cash reports, to detailed monthly business reviews, to our adoption and implementation of Lean Six Sigma principles, to our global inventory reduction process, to our internal controls, to our employee engagement process that measures the involvement of our employees, and to many other critical governance and business processes employed and under development in our company. Near-term results must be delivered, but we strive to do so in a way that is repeatable and sustainable, strengthening our longer-term competitiveness to the ultimate benefit of our customers, employees, suppliers and stockholders.
Intense Focus on Cash Flow
We have a common focus and an alignment of management incentives throughout our company on the importance of operating cash flow. For example, we track cash on a daily basis and our global bonus program is tied to cash flow metrics. This common focus and aligned incentive with respect to cash flow among all our employees helps us in seeking to create value for our stockholders. For example, inventories were reduced from 23 average days on hand in December 2007 to approximately 14 average days on hand in December 2010.
Maintain a Sound Balance Sheet
We consider it critical to maintain a sound balance sheet in the cyclical automotive industry. That mindset and approach helped us weather the severe 2009 downturn without violating our loan covenants, and we intend to maintain this approach going forward. During 2010, we refinanced a substantial portion of our long-term debt extending maturities through 2017. We further reduced our leverage in 2010 by applying the net proceeds from our initial public offering to repay $58.5 million of our revolving credit facility and to redeem $26 million of our senior secured notes. In addition, we have announced plans to redeem an additional $17 million of such notes during the first quarter of 2011.
Our Products
We produce a broad range of structural components and assemblies, many of which are critical to the structural integrity of a vehicle.
5
Table of Contents
Product Offerings
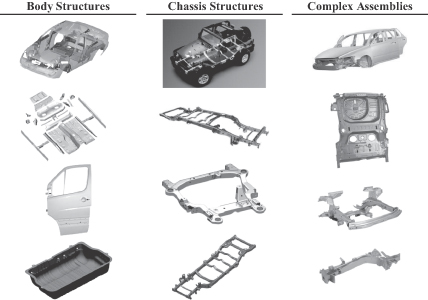
Body structures and assemblies
Body structures and assemblies form the basic upper body structure of the vehicle and include structural metal components such as body pillars, roof rails and side sills. This category also includes Class A surfaces and assemblies. Class A surfaces are the “exterior skin” of the vehicle—body sides, hoods, doors, fenders and pickup truck boxes. These components form the appearance of the vehicle, calling for flawless surface finishes.
Chassis, lower vehicle structures and suspension components
Lower vehicle frames and structures include chassis structures that make up the “skeleton” of a vehicle and which are critical to overall performance, particularly in the areas of noise, vibration and harshness, handling and crash management. These products include pickup truck and SUV full frames, automotive engine and rear suspension cradles, floor pan components, and cross members that form the basic lower body structure of the vehicle. These heavy gauge metal stampings carry the load of the vehicle, provide crash integrity, and are critical to the strength and safety of vehicles. We manufacture a wide variety of stamped, formed and welded suspension components including control arms, suspension links, track bars, spring and shock towers, shackles, twist axles, radius arms, stabilizer bars, trailing axles and brackets.
Complex body-in-white assemblies
Complex body-in-white assemblies are comprised of multiple components and sub-assemblies welded to form major portions of the vehicle’s body structure. We refer to body-in-whites as the manufacturing stage in which the vehicle body sheet metal has been assembled or designed but before the components and trim have been added. Examples of complex assemblies include front and rear floor pan assemblies and door/pillar assemblies.
Other
We also manufacture a variety of other automotive products, including heat shields and other precision stampings.
6
Table of Contents
Product Mix
We have a well-diversified product group mix. Our product group mix of revenues for 2010, 2009 and 2008 is shown below:
Product Group Mix (% of Revenues)
| Year Ended December 31, | ||||||||||||
| Product Group |
2010 | 2009 | 2008 | |||||||||
| Body structures and assemblies |
53% | 56% | 58% | |||||||||
| Chassis, lower vehicle structures and suspension components |
26% | 25% | 23% | |||||||||
| Complex body-in-white assemblies |
20% | 17% | 17% | |||||||||
| Other |
1% | 2% | 2% | |||||||||
| Total |
100% | 100% | 100% | |||||||||
7
Table of Contents
Overview of Major Vehicle Models
The following table presents an overview of the major vehicle models for which we supply products:
| OEM |
Models |
Product Type | ||
| Europe |
||||
| Volvo | S40 / V50 / C30 | Complex Assembly | ||
| VW | Cayenne / Touareg / Q7 | Body Structures & Complex Assembly | ||
| Octavia | Body Structures | |||
| Caddy Van | Body Structures | |||
| BMW | 1 / 3 Series | Body Structures | ||
| Daimler | Sprinter / Crafter | Body Structures & Complex Assembly | ||
| Fiat | 500 | Body Structures | ||
| Bravo | Body Structures | |||
| Ducato | Body Structures | |||
| MiTo | Body Structures | |||
| Punto | Body Structures | |||
| Opel | Astra | Body Structures | ||
| North America |
||||
| Ford | Econoline | Frame Assembly | ||
| Explorer | Complex Assembly | |||
| Expedition / Navigator | Body Structures | |||
| F-Series | Body Structures | |||
| Focus | Body Structures | |||
| Taurus / Sable | Complex Assembly | |||
| Ranger | Frame Assembly | |||
| Chrysler | Dakota | Frame Assembly | ||
| Grand Caravan /Town & Country | Body Structures | |||
| Wrangler | Frame Assembly | |||
| Nissan | Frontier / Xterra / Pathfinder | Body Structures & Frame Assembly | ||
| Titan / Armada / Qx56 | Frame Assembly | |||
| Toyota | Camry | Body Structures | ||
| Asia |
||||
| Hyundai | Bongo Truck | Body Structures & Frame Assembly | ||
| Carens | Body Structures | |||
| Carnival | Frame Assembly | |||
| Forte | Body Structures | |||
| Mohave | Frame Assembly | |||
| Morning | Body Structures | |||
| Sorento | Body Structures & Frame Assembly | |||
| Sportage | Body Structures | |||
| VW—FAW | Bora / Golf A4 | Chassis | ||
| Jetta | Chassis | |||
| Chery | A3 | Chassis | ||
| M11 | Chassis | |||
| SAIC | Rover 550 | Chassis | ||
| South America |
||||
| VW | Gol | Body Structures | ||
| Saveiro | Body Structures | |||
| Fiat | Palio / Doblo | Body Structures | ||
| Punto | Body Structures | |||
| Strada | Body Structures | |||
| Honda | Civic | Body Structures | ||
| Fit | Body Structures | |||
8
Table of Contents
Manufacturing and Operations
We focus on achieving superior product quality at the lowest operating costs possible and concentrate on improving our manufacturing processes to drive out inefficiencies. We seek to continually improve our processes in efforts to improve our cost competitiveness and to achieve higher quality. We continue to adapt our capacity to customer demand, both by expanding capabilities in growth areas and by reallocating capacity away from demand segments in decline.
We are committed to implementing Lean Six Sigma principles throughout our manufacturing processes. We utilize Lean Six Sigma principles to increase the efficiency of our operations and to reduce operating costs, thereby improving our cost competitiveness. We have accomplished efficiency improvements while at the same time improving our quality performance, with customer-reported defects per million parts below 40 for 2010 and 2009.
Our manufacturing operations consist primarily of stamping and welding operations, system and modular assembly operations, coating, and other ancillary operations. Stamping involves passing metal through dies in a stamping press to form the metal into three-dimensional parts. We produce stamped parts using precision single-stage, progressive and transfer presses, ranging in size from 150 to 4,500 tons, which perform multiple functions to convert raw material into finished products. We invest in our press technology to increase flexibility, improve safety and minimize die changeover time.
We feed stampings into assembly operations that produce complex assemblies through the combination of multiple parts that are welded or fastened together. Our assembly operations are performed on either dedicated, high-volume welding/fastening machines or on flexible cell-oriented robotic lines. The assembly machines attach additional parts, fixtures or stampings to the original metal stampings. In addition to standard production capabilities, our assembly machines also are able to perform various statistical control functions and identify improper welds and attachments. From time to time we work with manufacturers of fixed/robotic welding systems to develop faster, more flexible machinery.
Our products use various grades and thicknesses of steel and aluminum, including high–strength, hot- and cold-rolled, galvanized, organically coated, stainless, and aluminized steel.
Supply Base—Manufactured Components and Raw Materials
We purchase various manufactured components and raw materials for use in our manufacturing processes. All of these components and raw materials are available from numerous sources. We employ just-in-time manufacturing and sourcing systems enabling us to meet customer requirements for faster deliveries while minimizing our need to carry significant inventory levels. The primary raw material used to produce the majority of our products is steel. We purchase hot- and cold-rolled, galvanized, organically coated, stainless and aluminized steel from a variety of suppliers. We purchase a portion of our steel from certain of our customers through various OEM resale programs. The purchases through customer resale programs have buffered the impact of price swings associated with the procurement of steel. The remainder of our steel purchasing requirements are met through contracts with steel producers and market purchases. In addition, we produce small- and medium-sized stampings, fasteners, tubing, and rubber products.
Although we have not, in recent years, experienced any significant shortages of manufactured components or raw materials, and we normally do not carry inventories of these items in excess of those reasonably required to meet our goal of just-in-time production and transportation schedule, the possibility of shortages exist.
9
Table of Contents
Sales, Marketing and Distribution
Our sales and marketing efforts are designed to create awareness of our engineering, program management, manufacturing and assembly expertise, and to translate our leadership position into contract wins. We have developed a sales team that consists of an integrated group of professionals, including skilled engineers and program managers, which we believe provides the appropriate mix of operational and technical expertise needed to interface successfully with OEMs. We sell directly to OEMs through our sales and engineering teams at our technical and customer service centers strategically located around the world. Bidding on automotive OEM platforms typically encompasses many months of engineering and business development activity. We integrate our sales force directly into our operating team and work closely with our customers throughout the process of development and manufacturing a product. Our proximity to our customer base enables us to enjoy close relationships with our customers and positions us well to seek future business awards.
Customers
We have developed long-standing business relationships with our customers around the world. We work together with our customers in various stages of production, including development, component sourcing, quality assurance, manufacturing and delivery. With a diverse mix of products and facilities in major markets worldwide, we believe we are well-positioned to meet customer needs. We believe we have a strong, established reputation with customers for providing high-quality products at competitive prices, as well as for timely delivery and customer service. Given that the automotive OEM business involves long-term production contracts awarded on a platform-by-platform basis, one of our business strategies is to leverage our strong customer relationships to obtain new platform awards.
Customer Support
We have nine engineering and sales locations throughout the world, including a 24-hour engineering support center in India. We believe that we provide effective customer solutions, products and service to our customers throughout the world. Our customer service group is organized into customer-dedicated teams within regions to provide more focused service to our clients.
Seasonality
Our business is seasonal. Our customers in Europe typically shut down vehicle production during portions of July or August and during one week in our fourth quarter. Our North American customers typically shut down vehicle production for approximately two weeks during July and for one week during December. Our results of operations, cash flows and liquidity in our third and fourth quarters may be impacted by these seasonal practices.
Competition
We principally compete for new business both at the beginning of the development of new models and upon the redesign of existing models. New-model development generally begins two to five years before the marketing of such models to the public. Once a supplier has been designated to supply parts for a new program, an OEM usually will continue to purchase those parts from the designated producer for the life of the program, although not necessarily for a redesign. OEMs typically rigorously evaluate suppliers based on many criteria such as quality, price/cost competitiveness, system and product performance, reliability and timeliness of delivery, new product and technology development capability, excellence and flexibility in operations, degree of global and local presence, effectiveness of customer service and overall management capability.
We believe that we compete effectively with other leading suppliers in our market. The strength and breadth of our program management and engineering capabilities, as well as our geographic, customer and platform diversification, provide the necessary scale to attempt to optimize our cost structure. We follow manufacturing practices designed to improve efficiency and quality, including, but not limited to, manpower standardization and global inventory reduction initiatives, all of which enable us to manage inventory so that we can deliver quality
10
Table of Contents
components and systems to our customers in the quantities and at the times ordered. Our resulting quality and delivery performance, as measured by our customers, is designed to meet or exceed their expectations.
Our major competitors include: Magna International, Inc. (Cosma division), Gestamp Automocion, Martinrea International, Gruppo Magnetto, Benteler Automotive, Thyssen Krupp (stamping group), Sungwoo and MS Auto Tech. We compete with other competitors with respect to certain of our products and in particular geographic markets. The number of our competitors has decreased in recent years and we believe will continue to decline due to continued supplier consolidation and the recent economic downturn. OEMs have been, and we expect will continue to be, increasingly focused on the financial strength and viability of their supply base. We believe that such scrutiny of suppliers will result in additional contraction in the supply base and may force combinations of some suppliers.
In addition, a number of our major OEM customers manufacture products which compete with our products. Our OEM customers tend to outsource less when they have idle capacity. Although these OEM customers have indicated that they will continue to rely on outside suppliers, they could elect to increase the extent to which they manufacture products to meet their own requirements or to compete with us.
Joint Ventures
Joint ventures represent an important strategic part of our business. We have used our joint ventures to enter into new geographic markets, such as China, to gain new customers and/or strengthen our position with existing customers, and to develop new technologies.
When we enter new geographic markets where we have not previously established substantial local experience and infrastructure, teaming with a local partner can reduce capital investment by leveraging pre-existing infrastructure. In addition, local partners in these markets can provide knowledge and insight into local customs and practices and access to local suppliers of raw materials and components. All of these advantages can reduce the risk, thereby enhancing the prospect for success of entry into a new geographic market.
Joint ventures can also be an effective means to acquire new customers and strengthen relationships with existing customers. Through joint venture arrangements, partners can access technology that they would otherwise be required to develop independently, thereby reducing the time and cost of development. Moreover, they can provide the opportunity to create synergies and applications of the technology that would not otherwise be possible.
We currently have two joint ventures in China: TWA WuHu, which we refer to as WuHu, and Changchun Tower Golden Ring Automotive Products Co., Ltd., which we refer to as TGR.
Our WuHu joint venture consists of an 80% equity interest in WuHu, a joint venture limited liability company located in WuHu City, Anhui Province, China. This joint venture primarily serves to supply Chery with front and rear lower vehicle structure modules and their respective replacement platforms.
Our TGR joint venture consists of a 60% equity interest in TGR, a joint venture limited liability company located in the City of Changchun, Jilin Province, China. Our TGR joint venture primarily supplies FAW-VW Automotive Company Limited with structure based components, including sub-frames, cross members with motor carriers, rear axles, frame front-ends, and control arms and the structural components for other vehicles.
Employees
As of December 31, 2010, we had approximately 7,800 employees worldwide, of whom approximately 5,500 were covered under collective bargaining agreements that expire at various times.
11
Table of Contents
We are not aware of any work stoppages since the inception of the Predecessor Company in 1993. A strike or slow-down by one of our unions could have a material adverse effect on our business. We believe that our relations with our employees are satisfactory.
Intellectual Property
By the nature of our business, the loss of any single intellectual property right owned by us or licensed to us is not likely to cause a material disruption in the manufacturing, marketing and distribution of our products.
Our customers typically own the tooling we use in the manufacture of their vehicles.
Environmental Matters
We are subject to various domestic and foreign federal, state and local laws and regulations governing the protection of the environment and health and safety, including those regulating soil, surface water and groundwater contamination; the generation, storage, handling, use, disposal and transportation of hazardous materials; the emission and discharge of materials, including green house gases (“GHG”), into the environment; and the health and safety of our employees. We are also required to obtain environmental permits from governmental authorities for certain operations. We have taken steps to comply with these numerous and sometimes complex laws, regulations and permits. We have also achieved ISO-14001 registration for substantially all of our facilities. While compliance with environmental requirements has not had a material impact on our capital expenditures, earnings or competitive position, we have made and will continue to make capital and other expenditures pursuant to such requirements and, if we violate or fail to comply with these requirements, could be subject to fines, penalties or litigation.
Environmental laws, regulations and permits, and the enforcement thereof, change frequently and have tended to become more stringent over time. In particular, more rigorous GHG emission requirements are in various stages of development. For example, the United States Congress has considered legislation that would establish a nationwide limit on GHGs, and the EPA has issued regulations limiting GHG emissions from mobile and stationary sources pursuant to the federal Clean Air Act. Any regulation of GHG emissions, including through a cap-and-trade system, technology mandate, emissions tax, reporting requirement or other program, could subject us to significant costs, including those relating to emission credits, pollution control equipment, monitoring and reporting, as well as increased energy and raw material prices. In addition, our OEM customers may seek price reductions from us to account for their increased costs resulting from GHG regulations. Further, growing pressure to reduce GHG emissions from mobile sources could reduce automobile sales, thereby reducing demand for our products and ultimately our revenues. Although there is still significant uncertainty surrounding the scope, timing and effect of future GHG regulation, any such regulation could have a material adverse impact on our business, financial condition, results of operations, reputation, product demand and liquidity.
We also could be responsible for costs relating to any contamination at our, or a predecessor entity’s, current or former owned or operated properties or third party waste disposal sites, even if we were not at fault. Some of these locations have been impacted by environmental releases, and soil or groundwater contamination is being addressed at certain of these sites. In addition to potentially significant investigation and remediation costs, contamination can give rise to third party claims for fines or penalties, natural resource damages, personal injury or property damage. Our costs and liabilities associated with environmental contamination could be substantial and may be material to our business, financial condition, results of operations or cash flows.
Segment Overview
See note 16 to our consolidated financial statements for information on our segments.
12
Table of Contents
International Operations
We have significant manufacturing operations outside the United States, and in 2010, approximately 68% of our revenues originated outside the United States. For information regarding potential risks associated with our international operations, see “Risk Factors—We are subject to risks related to our international operations.” See “Management’s Discussion and Analysis of Financial Condition and Results of Operations” and note 16 to our consolidated financial statements for further information regarding our international operations.
Public Information
We maintain a website at http://www.towerinternational.com. We will make available on our website, free of charge, the proxy statements and reports on Forms 8-K, 10-K and 10-Q that we file with the SEC as soon as reasonably practicable after such material is electronically filed with or furnished to the SEC. Additionally, we have adopted and posted on our website a Code of Business Conduct that applies to, among other people, our principal executive officer, principal financial officer and principal accounting officer. We intend to disclose any waivers of the Code of Business Conduct on our website. We will provide, free of charge, a copy of our Code of Business Conduct to any person who requests such a copy. All such requests should be directed to our Executive Director, Investor & External Relations, c/o Tower International, Inc., 17672 Laurel Park Drive North, Suite 400 E, Livonia, Michigan 48152.
| Item 1A. | Risk Factors |
Our business is subject to a number of risks. In addition to the various risks described elsewhere in this Annual Report, the following risk factors should be considered. Additional risks and uncertainties not presently known or that we currently believe to be less significant may also adversely affect us.
Risk Factors Relating to Our Industry and Our Business
The weakness in the global economy, the global credit markets and the financial services industry over the past several years has severely and negatively affected demand for automobiles and automobile parts and our business, financial condition, results of operations and cash flows.
Demand for and pricing of our products are subject to economic conditions and other factors present in the various domestic and international markets where our products are sold. The level of demand for our products depends primarily upon the level of consumer demand for new vehicles that are manufactured with our products. The level of new vehicle purchases is cyclical, affected by such factors as general economic conditions, interest rates, consumer confidence, consumer preferences, patterns of consumer spending, fuel costs and the automobile replacement cycle.
The global economic crisis that prevailed throughout 2008 and 2009 resulted in delayed and reduced purchases of durable consumer goods, such as automobiles. Although the global economic climate improved during 2010, the global economy has not recovered to levels previously experienced. As a result, our OEM customers have significantly reduced their production from pre-crisis levels. According to IHS Automotive®, vehicle production during 2009 decreased by 32% in North America and by 20% in Europe, as compared to 2008. According to IHS Automotive®, vehicle production during 2010 increased by 40% in North America and by 15% in Europe, as compared to 2009; however, vehicle production during 2010 remained below average levels as represented by a 6% decrease in North America and by a 8% decrease in Europe, as compared to 2008. While production began to increase during 2010, we can provide no assurances that this trend will continue. The unprecedented conditions experienced over the past several years had a severe and negative impact on our business, financial condition, results of operations and cash flows during 2008 and 2009.
In addition, there has been significant economic instability in several countries in the European Union where we conduct business. Such instability could adversely affect our business, financial condition, results of operations and cash flows.
13
Table of Contents
Deterioration in the United States and world economies could exacerbate the difficulties experienced by our customers and suppliers in obtaining financing, which, in turn, could materially and adversely impact our business, financial condition, results of operations and cash flows.
Lending institutions have suffered and may continue to suffer losses due to their lending and other financial relationships, especially because of the general weakening of the global economy and the increased financial instability of many borrowers. Longer-term disruptions in the credit markets could further adversely affect our customers by making it increasingly difficult for them to obtain financing for their businesses and for their customers to obtain financing for automobile purchases. Our OEM customers typically require significant financing for their respective businesses. In addition, our OEM customers typically have related finance companies that provide financing to their dealers and customers. These finance companies have historically been active participants in the securitization markets, which have experienced severe disruptions during the global economic crisis. Our suppliers, as well as the other suppliers to our customers, may face similar difficulties in obtaining financing for their businesses. If capital is not available to our customers and suppliers, or if its cost is prohibitively high, their businesses would be negatively impacted, which could result in their restructuring or even reorganization/liquidation under applicable bankruptcy laws. Any such negative impact, in turn, could materially and negatively affect our company either through the loss of revenues to any of our customers so affected, or due to our inability to meet our commitments without excess expense resulting from disruptions in supply caused by the suppliers so affected.
A number of automobile manufacturers have recently been facing severe financial difficulties. Many automobile manufacturers have undertaken significant restructuring actions in an effort to improve profitability and remain solvent. Weaknesses in the capital markets combined with a slowdown in global automotive demand have increased the pressure on our customers and their cash reserves. Automobile manufacturers are burdened with substantial structural and embedded costs, such as facility overhead, pension expenses and healthcare costs, that have caused some manufacturers, including General Motors (GM) and Chrysler, to seek government financing and, ultimately, file for bankruptcy protection. Due to the declining economic situation, the United States government granted GM and Chrysler government loans to assist them in obtaining the necessary capital to continue to operate. In spite of the government programs, Chrysler filed for bankruptcy on April 30, 2009 and GM filed for bankruptcy on June 1, 2009. Chrysler and GM emerged from bankruptcy on June 10, 2009 and July 10, 2009, respectively, and GM subsequently completed an initial public offering on November 17, 2010. Other automakers periodically have experienced difficulties from a weakened economy, tightening credit and reduced demand for their products. For example, certain automakers sought and were granted government assistance in countries such as Germany, Sweden, Brazil, France, Britain, Portugal, Spain, and Canada during 2009 in an attempt to sustain viability. We may be adversely affected by either a bankruptcy filing or merger or sale of an OEM. We cannot assure you that governmental responses to these disruptions or the recent recovery in the financial markets will lead to sustained growth.
Financial difficulties experienced by any major customer could have a material adverse impact on us if such customer were unable to pay for the products we provide or we experienced a loss of, or material reduction in, business from such customer. As a result of such difficulties, we could experience lost revenues, significant write-offs of accounts receivable, significant impairment charges or additional restructurings beyond the steps we have taken to date.
The automobile industry is highly cyclical and cyclical downturns in our domestic or international business segments negatively impact our business, financial condition, results of operations and cash flows.
The volume of automotive production in North America, Europe and the rest of the world has fluctuated, sometimes significantly from year-to-year, and such fluctuations give rise to fluctuations in demand for our products. Because we have significant fixed production costs, relatively modest declines in our customers’ production levels can have a significant adverse impact on our results of operations. Our results of operations have been negatively impacted over the last several years in part due to declines in North American production
14
Table of Contents
levels from prior periods. According to IHS Automotive®, vehicle production during 2009 decreased by 32% in North America and by 20% in Europe as compared to 2008. While IHS Automotive® reports that vehicle production during 2010 increased by 40% in North America and by 15% in Europe, as compared to 2009; we cannot provide assurance that this trend will continue.
The highly cyclical nature of the automotive industry presents a risk that is outside our control and that cannot be accurately predicted. For example, while the improvements experienced in the financial markets during 2010 may continue in 2011, we cannot assure you that the recent recovery will be prolonged or will improve our results of operations. Moreover, a number of factors that we cannot predict can and have impacted cyclicality in the past. Decreases in demand for automobiles generally, or in the demand for our products in particular, could materially and adversely impact our business, financial condition, results of operations and cash flows.
Product recalls by OEMs could negatively impact their production levels and therefore have a material adverse impact on our business, financial condition, results of operations and cash flows.
There have been significant product recalls by some of the world’s largest automobile manufacturers. Toyota, for example, engaged in a recall of some of its most popular models in 2010. Recalls may result in decreased production levels due to (i) an OEM focusing its efforts on addressing the problems underlying the recall, as opposed to generating new sales volume, and (ii) consumers’ electing not to purchase automobiles manufactured by the OEM initiating the recall, or by OEMs in general, while such recalls persist. Any reductions in OEM production volumes, especially those OEMs that are our existing customers, could have a material adverse impact on our business, financial condition, results of operations and cash flows.
Product liability claims could cause us to incur losses and damage our reputation.
Many of our products are critical to the structural integrity of a vehicle. As such, we face an inherent business risk of exposure to product liability claims in the event of the failure of our products to perform to specifications, or if our products are alleged to result in property damage, bodily injury or death. In addition, if any of our products are, or are alleged to be, defective, we may be required to participate in a recall involving those products. We are generally required under our customer contracts to indemnify our customers for product liability claims in respect of our products. In addition, we do not have insurance covering product recalls. Accordingly, we may be materially and adversely impacted by product liability claims.
The decreasing number of automotive parts customers could make it more difficult for us to compete favorably.
Our business, financial condition, results of operations and cash flows could be materially and adversely affected because the OEM customer base is consolidating. As a result, we are competing for business from fewer customers. Due to the cost focus of these major customers, we have been, and expect to continue to be, requested to reduce prices as part of our initial business quotations and over the life of contracts we have been awarded. We cannot be certain that we will be able to generate cost savings and operational improvements in the future that are sufficient to offset price reductions requested by customers and to make us profitable and position us to win additional business.
The decreasing number of automotive parts suppliers could make it more difficult for us to compete favorably.
Consolidation and bankruptcies among automotive parts suppliers are resulting in fewer and larger competitors who benefit from purchasing and distribution economies of scale. If we cannot compete favorably in the future with these larger suppliers, our business, financial condition, results of operations and cash flows could be adversely affected due to a reduction of, or inability to increase, revenues.
15
Table of Contents
We may have difficulty competing favorably in the highly competitive automotive parts industry.
The automotive parts industry is highly competitive. Although the overall number of competitors has decreased due to ongoing industry consolidation, we face significant competition within each of our major product areas, including from new competitors entering the markets that we serve, and from OEMs seeking to integrate vertically. The principal competitive factors include price, quality, global presence, service, product performance, design and engineering capabilities, new product innovation and timely delivery. We cannot assure you that we will be able to continue to compete favorably in these competitive markets or that increased competition will not have a material adverse effect on our business by reducing our ability to increase or maintain sales and profit margins. A number of our major OEM customers manufacture products which compete with our products. Our OEM customers tend to outsource less when they have idle capacity.
We principally compete for new business at the beginning of the development of new models and upon the redesign of existing models by major OEM customers. New model development generally begins three to five years prior to the marketing of such models to the public. Redesign of existing models begins during the life cycle of a platform, usually at least two to three years before the end of the platform’s life cycle. The failure to obtain new business on new models or to retain or increase business on redesigned existing models, could adversely affect our business, financial condition, results of operations, and cash flows. In addition, as a result of the relatively long lead times required for many of our structural components, it may be difficult in the short term for us to obtain new revenues to replace any unexpected decline in the sale of existing products.
The inability for us, our customers and/or our suppliers to obtain and maintain sufficient capital financing, including working capital lines, and credit insurance may adversely affect our, our customers’ and our suppliers’ liquidity and financial condition.
Our working capital requirements can vary significantly, depending in part on the level, variability and timing of our customers’ worldwide vehicle production and the payment terms with our customers and suppliers. Our liquidity could also be adversely impacted if our suppliers were to suspend normal trade credit terms and require payment in advance or payment on delivery. If our available cash flows from operations are not sufficient to fund our ongoing cash needs, we would be required to look to our cash balances and availability for borrowings under our credit facilities to satisfy those needs, as well as potential sources of additional capital, which may not be available on satisfactory terms and in adequate amounts, if at all.
Capital markets conditions have made it difficult for companies, including ours, to raise and maintain the liquidity necessary to operate. While we believe that we have sufficient liquidity to operate, there can be no assurance that we, our customers and our suppliers will continue to have such ability. This may increase the risk that we cannot produce our products or will have to pay higher prices for our inputs. These higher prices may not be recovered in our selling prices.
Our suppliers often seek to obtain credit insurance based on the strength of the financial condition of our subsidiary with the payment obligation, which may be less robust than our consolidated financial condition. If we were to experience liquidity issues, our suppliers may not be able to obtain credit insurance and in turn would likely not be able to offer us payment terms that we have historically received. Our failure to receive such terms from our suppliers could have a material adverse effect on our liquidity.
We may incur material costs related to product warranties and other legal proceedings, which could have a material adverse impact on our business, financial condition, results of operations and cash flows.
If our warranty expense estimates differ materially from our actual claims, or if we are unable to estimate future warranty expense for new products, our business and financial results could be harmed. Currently, we have limited exposure to warranty claims with our present products and historically we have incurred limited expense in relation to warranty claims; however, as we transition to new products in the future, including within any
16
Table of Contents
non-automotive business that we may develop, we may incur substantial warranty expense related to these products.
From time to time, we are involved in legal proceedings, claims or investigations that are incidental to the conduct of our business. Some of these proceedings allege damages against us relating to environmental liabilities, personal injury claims, taxes, employment matters or commercial or contractual disputes.
We cannot assure you that the costs, charges and liabilities associated with these matters will not be material, or that those costs, charges and liabilities will not exceed any amounts reserved for them in our consolidated financial statements. In future periods, we could be subject to cash costs or non-cash charges to earnings if any of these matters is resolved unfavorably to us.
We are dependent on large customers for current and future revenues. The loss of any of these customers or the loss of market share by these customers could have a material adverse impact on us.
We depend on major vehicle manufacturers for our revenues. For example, during 2010, Volkswagen, Hyundai/Kia, Ford, and Fiat accounted for 16%, 13%, 13%, and 11% of our revenues, respectively. The loss of all or a substantial portion of our sales to any of our large-volume customers could have a material adverse effect on our business, financial condition, results of operations and cash flows by reducing cash flows and by limiting our ability to spread our fixed costs over a larger revenue base. We may make fewer sales to these customers for a variety of reasons, including, but not limited to:
| • | loss of awarded business; |
| • | reduced or delayed customer requirements; |
| • | OEMs’ insourcing business they have traditionally outsourced to us; |
| • | strikes or other work stoppages affecting production by our customers; or |
| • | reduced demand for our customers’ products. |
See “—Deterioration in the United States and world economies could exacerbate the difficulties experienced by our customers and suppliers in obtaining financing, which, in turn, could materially and adversely impact our business, financial condition, results of operations and cash flows.”
In addition, during 2010 Ford sold Volvo Car Corporation to Geely, a privately-owned Chinese OEM. The change in ownership may adversely impact our ability to win new business from Volvo. We cannot predict how Volvo will be operated in the future.
The loss of key customer platforms could materially and adversely affect our business.
Our typical sales contract with a customer provides for supplying that customer’s requirements for a particular platform, rather than manufacturing a specific quantity of components. Our revenues contracts generally run for the life of the platform, usually three to ten years, and do not require the purchase by our customers of any minimum number of components. The loss or significant reduction in demand for vehicles for which we produce components could have a material adverse effect on our existing and future revenues and net income. The loss of one or more significant platforms, or a significant decrease in purchases from us in respect of such platforms, could have a material adverse effect on our business, financial condition, results of operations and cash flows.
We may be unable to realize revenues represented by our awarded business, which could materially and adversely impact our business, financial condition, results of operations and cash flows.
The realization of future revenues from awarded business is inherently subject to a number of important risks and uncertainties, including the number of vehicles that our customers will actually produce, the timing of that
17
Table of Contents
production and the mix of options that our customers may choose. Prior to 2008, substantially all of our North American customers had slowed or maintained at relatively flat levels new vehicle production for several years. During 2009, new vehicle production decreased dramatically as a result of the global economic crisis. While our customers increased new vehicle production during 2010 as the general business climate improved, we cannot predict the extent to which such increased production will be sustained. In addition, we have agreed with our customers, that during the course of our awarded business, and as sales volume increases, we will lower the per unit cost of our products, and such savings will, in part, be passed on to our customers. Accordingly, we cannot assure you that we will realize any or all of the future revenues represented by our awarded business. Any failure to realize these revenues could have a material adverse effect on our business, financial condition, results of operations and cash flows.
In addition to not having a commitment from our customers regarding the minimum number of products they must purchase from us if we obtain awarded business, typically the terms and conditions of the agreements with our customers provide that they have the contractual right to unilaterally terminate our contracts with them with no notice or limited notice. If such contracts are terminated by our customers, our ability to obtain compensation from our customers for such termination is generally limited to the direct out-of-pocket costs that we incurred for raw materials and work-in-progress and in certain instances undepreciated capital expenditures.
We base a substantial part of our planning on the anticipated lifetime revenues of particular products. We calculate the lifetime revenues of a product by multiplying our expected price for a product by forecasted production volume during the length of time we expect the related vehicle to be in production. We use a third-party forecasting service, IHS Automotive®, to provide long-term forecasts which allows us to determine how long a vehicle is expected to be in production. Lifetime revenues associated with a particular platform are not guaranteed and are not equivalent to backlog. If we over-estimate the production units or if a customer reduces its level of anticipated purchases of a particular platform as a result of reduced demand, our actual revenues for that platform may be substantially less than the lifetime revenues we had anticipated for that platform.
Typically, it takes two to five years from the time a manufacturer awards a program until the program is launched and production begins. In many cases, we must commit substantial resources in preparation for production under awarded customer business well in advance of the customer’s production start date. Although we have been successful in recovering these costs under appropriate circumstances in the past, we cannot assure you that our results of operations will not be materially adversely impacted in the future if we are unable to recover these types of pre-production costs related to our customers’ cancellation of awarded business.
Shifts in demand away from light trucks and sport utility vehicles could materially and adversely impact our business, financial condition, results of operations and cash flows.
In our North American operations, we are heavily dependent on SUVs and pickup trucks, which accounted for approximately 64% of North American revenues in 2010. As fuel prices increased significantly during the first half of 2008, consumers began to shift their purchases from these types of vehicles to cross-over utility vehicles, or CUVs, and passenger cars. CUVs are vehicles built on car platforms but that have many features similar to a traditional SUV. While gas prices have fluctuated, there has not been a substantial shift back to SUVs and pickup trucks. These trends could adversely affect our North American operations as the product life cycles are long and it will take time to diversify the North American portfolio.
Our joint venture partners may have interests that are not consistent with those of the joint venture, thereby resulting in our joint venture failing to achieve the results we desire.
We have two joint ventures in China. In both instances, our joint venture partner is also affiliated with the largest customer of the joint venture. As such, these partners may negotiate on behalf of customers of the joint venture for sales terms that are not in the best interest of the joint venture. More specifically, when acting on behalf of a
18
Table of Contents
customer, our joint venture partners effectively receive 100% of the benefits of revenues terms, but when acting as a joint venture partner we must share with them any benefits received by the joint venture. This may create a misalignment of incentives between us and our joint venture partners that could have a material adverse impact on our business.
Our ability to recognize revenues from non-automotive business is subject to several risks, any one of which could materially and adversely impact our business, financial condition, results of operations and cash flows.
There are several risks associated with attaining our objective to develop non-automotive sources of income to supplement our automotive business. Although we entered into an agreement to supply large stamped mirror-facet panels and welded support structures for the solar energy market, our first solar customer, SES, experienced delays in obtaining financing and curtailed its expenditures. Ultimately, the power-purchase agreements for both of SES’s principal solar projects were terminated and we learned that the related development contract was sold to a company that intends mainly to pursue a different solar technology than had been sourced to us. Thus, we do not believe that we will be able to generate meaningful non-automotive revenues in the solar energy market within the next year. While we continue to pursue relationships with other potential solar customers which may provide potential revenue in 2012 and beyond and enable the associated utilization of our leased facility in Arizona, we cannot predict whether we will be able reach agreement with any such customers, whether any such customers will impose conditions that we will be able to satisfy, whether such customers will have the financing capability to order products from us, or even if these obstacles are overcome, when and to what extent we will be able to achieve meaningful revenues from any such customers. During 2010, we took an impairment charge of $7.3 million associated with the equipment specifically purchased for use in our SES agreement. Based on current market conditions, we believe that our facility in Arizona can be sub-leased for terms similar to our lease agreement if we are unable to attract the necessary business for such facility; however, we cannot assure you that we will be successful in finding a sub-lessee in the future.
As we seek to expand into markets beyond vehicle structural components and assemblies, we expect to diversify our product revenues by leveraging our development, engineering and manufacturing capabilities in order to source necessary parts and components for other industries. Such diversification requires investments and resources that may not be available as needed. Even if we sign contracts in new non-automotive markets, we cannot guarantee that we will be successful in leveraging our capabilities into these new markets and thus in meeting the needs of these new customers and competing favorably in these new markets. If these customers experience reduced demand for their products or financial difficulties, our future prospects will be negatively affected as well.
The termination of, or damage to, one or more of our relationships with key third-party suppliers could have a material adverse effect on our business, financial condition, results of operations and cash flows.
We obtain raw materials and components, including some of our steel, from third-party suppliers. Any delay in receiving supplies could impair our ability to deliver products to our customers and, accordingly, could have a material adverse effect on our business, financial condition, results of operations and cash flows. Some of our suppliers are the sole source for a particular supply item. Loss of or damage to our relationships with these suppliers could have a material adverse effect on our business, financial condition, results of operations and cash flows.
Various factors could result in the termination of our relationship with any supplier or the inability of suppliers to continue to meet our requirements on favorable terms. For example, the volatility in the financial markets and uncertainty in the automotive sector could result in exposure related to the financial viability of certain of our key third-party suppliers. Severe financial difficulties at any of our major suppliers could have a material adverse effect on us if we were unable to obtain, on a timely basis, on similar economic terms, the quantity and quality of components and raw materials we require to produce our products. In response to financial pressures, suppliers may also exit certain business lines, or change the terms on which they are willing to provide raw material and components to us.
19
Table of Contents
Disruptions in the automotive supply chain could have a material adverse effect on our business, financial condition, results of operations and cash flows.
The automotive supply chain has been faced with severe cash flow problems as a result of the significantly lower production of vehicles during 2008 and 2009, increases in certain raw material, commodity and energy costs and restricted access to additional liquidity. Several automotive suppliers have filed for bankruptcy protection or ceased operations. Severe financial difficulties, including bankruptcy, of any automotive supplier could have a significant disruptive effect on the entire automotive industry, leading to, among other things, supply chain disruptions and labor unrest. For example, if a parts supplier were to cease operations, it could force the automotive manufacturers to whom the supplier provides parts to shut down their operations. This, in turn, could force other suppliers, including us, to shut down production at plants that are producing products for these automotive manufacturers.
The volatility of steel prices may adversely affect our results of operations.
We utilize steel and various purchased steel products in virtually all of our products. We refer to the “net steel impact” as the combination of the change in steel prices that are reflected in customer pricing, the change in the cost to procure steel from the mills, and the change in our recovery of scrap steel, which we refer to as offal. While we strive to achieve a neutral net steel impact over time, we are not always successful in achieving that goal. Changes in steel prices may affect our liquidity because of the time difference between our payment for our steel and our collection of cash from our customers. We tend to pay for replacement materials, which are more expensive when steel prices are rising, over a much shorter period. As a result, rising steel prices may cause us to draw greater than anticipated amounts from our credit lines to cover the cash flow cycle from our steel purchases to cash collection for related accounts receivable. This cash requirement for working capital is higher in periods when we are increasing our inventory quantities.
A by-product of our production process is the generation of offal. We typically sell offal in secondary markets, which are similar to the steel markets. We generally share our recoveries from sales of offal with our customers either through scrap sharing agreements, in cases where we are on resale programs, or in the product pricing that is negotiated regarding increases and decreases in the steel price in cases where we purchase steel directly from the mills. In either situation, we may be impacted by the fluctuation in scrap steel prices, either positive or negative, in relation to our various customer agreements. Since scrap steel prices generally increase and decrease as steel prices increase and decrease, our sale of offal may mitigate the severity of steel price increases and limit the benefits we achieve through steel price declines. Any dislocation in offal and steel prices could negatively affect our business, financial condition, results of operations and cash flows.
The seasonality we experience in our business may negatively impact our quarterly results of operations, cash flows and liquidity.
Our business is seasonal. Our customers in Europe typically shut down vehicle production during portions of July or August and during one week in our fourth quarter. Our North American customers typically shut down vehicle production for approximately two weeks during July and for one week during December. Such seasonality may adversely affect our results of operations, cash flows and liquidity during the third and fourth quarters of our fiscal year.
We have significant operating lease obligations and our failure to meet those obligations could adversely affect our business, financial condition, results of operations and cash flows.
We lease many of our manufacturing facilities and certain capital equipment. Our lease expense under these operating leases was $21.3 million, $24.1 million, and $32.1 million for the years ended December 31, 2010, 2009, and 2008, respectively. A failure to pay our lease obligations would constitute a default allowing the applicable landlord or lessor to pursue remedies available to it under our leases and applicable law, which could include taking possession of property that we utilize in our business and, in the case of facilities leases, evicting
20
Table of Contents
us. In addition, we are party to two master leases with entities affiliated with a single commercial real estate company that cover a number of our leased properties. These master leases require us to continue to perform under the leases with respect to certain properties that we are no longer using. Such obligations negatively impact our results of operations.
We may incur material costs related to plant closings, which could have a material adverse impact on our business, financial condition, results of operations and cash flows.
If we must close additional manufacturing locations because of loss of business or consolidation of manufacturing facilities, the employee severance, asset retirement and other costs, including reimbursement costs relating to public subsidies, to close these facilities may be significant. In certain locations that are subject to leases, we may continue to incur material costs consistent with the initial lease terms. We continually attempt to align production capacity with demand; therefore, we cannot assure you that additional plants will not have to be closed. Historically, we have incurred significant costs related to the closure of our facilities and can provide no assurance that such costs will not be material in the future.
Our ability to operate effectively could be impaired if we are unable to recruit and retain key personnel.
Our success depends, in part, on the efforts of our executive officers and other key senior managers and employees. Our senior management team has reoriented our business towards anticipated future demand and potential alternative markets and has implemented significant productivity initiatives. The loss of members of our senior management team could jeopardize our ability to execute these business strategies and could adversely impact our efforts to improve our cost competitiveness. In addition, our future success will depend on, among other factors, our ability to continue to attract and retain qualified personnel. For example, we will also need to attract engineers with experience in non-automotive areas in order to explore opportunities in solar and other non-automotive industries. The loss of the services of our executive officers, senior managers or other key employees, or the failure to attract or retain qualified employees, could have a material adverse effect on our business, financial condition, results of operations and cash flows.
The hourly workforce in the automotive industry is highly unionized and our business could be adversely affected by labor disruptions.
As of December 31, 2010, we had approximately 7,800 employees, of whom approximately 5,500 were covered under collective bargaining agreements that expire at various times. If major work disruptions involving our employees were to occur, our business could be adversely affected by a variety of factors, including a loss of revenues, increased costs and reduced profitability. We cannot assure you that we will not experience a material labor disruption at one or more of our facilities in the future in the course of renegotiation of our labor arrangements or otherwise. In addition, substantially all of the hourly employees of North American vehicle manufacturers and many of their suppliers are represented by the United Automobile, Aerospace and Agricultural Implement Workers of America under collective bargaining agreements. Vehicle manufacturers and suppliers and their employees in other countries are also subject to labor agreements. A work stoppage or strike at our production facilities, at those of a significant customer, or at a significant supplier of ours, such as the 2008 strike at American Axle that resulted in 30 General Motors facilities in North America being idled for several months, could have a material adverse impact on us by disrupting demand for our products or our ability to manufacture our products. Also, we cannot assure you that the labor rate following a renegotiation of any of our current collective bargaining agreements will be beneficial to us.
We sponsor a defined benefit pension plan that is underfunded and will require substantial cash payments. Additionally, if the performance of the assets in our pension plan does not meet our expectations, or if other actuarial assumptions are modified, our required contributions may be higher than we expect.
We sponsor a defined benefit pension plan that is underfunded. Although the Predecessor Company ceased benefit accruals under the plan, we anticipate that the plan may require substantial cash payments in order to
21
Table of Contents
meet our funding obligations. These cash contributions may be significant in future periods and could adversely impact our cash flow.
Additionally, our earnings may be positively or negatively impacted by the amount of income or expense recorded for our pension plan. Generally accepted accounting principles (GAAP) requires that income or expense for pension plans be calculated at the annual measurement date using actuarial assumptions and calculations. These calculations reflect certain assumptions, the most significant of which relate to the capital markets, interest rates and other economic conditions. Changes in key economic indicators can change these assumptions. These assumptions, along with the actual value of assets at the measurement date, will impact the calculation of pension expense for the year. Although GAAP expense and pension contributions are not directly related, the key economic indicators that affect GAAP expense also affect the amount of cash that we would contribute to our pension plan. As a result of current economic instability, the investment portfolio of the pension plan has experienced volatility. Because the values of these pension plan assets have fluctuated and will fluctuate in response to changing market conditions, the amount of gains or losses that will be recognized in subsequent periods, the impact on the funded status of the pension plan and the future minimum required contributions, if any, could have a material adverse effect on our business, financial condition, results of operations and cash flows, but such impact cannot be determined at this time.
We are subject to environmental requirements and risks as a result of which we may incur significant costs, liabilities and obligations.
We are subject to a variety of environmental and pollution control laws, regulations and permits that govern, among other things, soil, surface water and groundwater contamination; the generation, storage, handling, use, disposal and transportation of hazardous materials; the emission and discharge of materials, including greenhouse gases, or GHGs, into the environment; and health and safety. If we fail to comply with these laws, regulations or permits, we could be fined or otherwise sanctioned by regulators or become subject to litigation. Environmental and pollution control laws, regulations and permits, and the enforcement thereof, change frequently, have tended to become more stringent over time and may necessitate substantial capital expenditures or operating costs.
Under certain environmental requirements, we could be responsible for costs relating to any contamination at our, or a predecessor entity’s, current or former owned or operated properties or third-party waste-disposal sites, even if we were not at fault. Soil and groundwater contamination is being addressed at certain of these locations. In addition to potentially significant investigation and cleanup costs, contamination can give rise to third-party claims for fines or penalties, natural resource damages, personal injury or property damage.
We cannot assure you that our costs, liabilities and obligations relating to environmental matters will not have a material adverse effect on our business, financial condition, results of operations and cash flows.
We may incur material costs related to the return or retirement of leased and owned assets, which could have a material adverse impact on our business, financial condition, results of operations and cash flows.
Facility leases generally require that the premises be returned to the owner or lessor in the original condition. Asset leases also may require the disassembly and removal of heavy equipment at the termination of the lease. Costs are incurred in connection with the removal of equipment and general cleanup resulting from past operations and/or equipment removal. In addition, environmental assessments, notifications to regulatory authorities and cancellation of permits may be required. Finally, costs associated with the removal and/or mitigation of asbestos-containing materials also may be incurred in connection with lease terminations, improvements to facilities or otherwise. We have established reserves for these asset retirement obligations based, in part, on past experiences at other facilities that we have operated. Although we believe our estimates of costs associated with asset retirement obligations are reasonable, future experience may require us to revise these estimates. We could be subject to material cash or non-cash charges to earnings if we are required to incur material additional costs based on our ongoing analyses of the asset retirement obligations at our properties.
22
Table of Contents
We are subject to risks related to our international operations.
Our international operations include manufacturing facilities in Europe, China, South Korea, and Brazil, and we sell our products in each of these areas. For the year ended December 31, 2010, approximately 68% of our revenues were derived from operations outside the United States. International operations are subject to various risks that could have a material adverse effect on those operations and our business as a whole, including:
| • | exposure to local economic conditions; |
| • | exposure to local political conditions, including the risk of seizure of assets by a foreign government; |
| • | exposure to local social unrest, including any resultant acts of war, terrorism or similar events; |
| • | exposure to local public health issues and the resultant impact on economic and political conditions; |
| • | exposure to local tax requirements and obligations; |
| • | foreign currency exchange rate fluctuations; |
| • | hyperinflation in certain foreign countries; |
| • | the risk of government-sponsored competition; |
| • | controls on the repatriation of cash, including the imposition or increase of withholding and other taxes on remittances and other payments by foreign subsidiaries; and |
| • | export and import restrictions. |
Foreign exchange rate fluctuations could cause a decline in our financial condition, results of operations and cash flows.
As a result of our international operations, we are subject to risk because we generate a significant portion of our revenues and incur a significant portion of our expenses in currencies other than the U.S. dollar. To the extent that we have significantly more costs than revenues generated in a foreign currency, we are subject to risk if the foreign currency in which our costs are paid appreciates against the currency in which we generate revenues because the appreciation effectively increases our cost in that country. The financial condition, results of operations and cash flows of some of our operating entities are reported in foreign currencies and then translated into U.S. dollars at the applicable foreign exchange rate for inclusion in our consolidated financial statements. As a result, appreciation of the U.S. dollar against these foreign currencies generally will have a negative impact on our reported sales and profits while depreciation of the U.S. dollar against these foreign currencies will generally have a positive effect on reported revenues and profits. A significant amount of our revenues are denominated in Euros. Economic instability in the European Union and the related decline in the value of the Euro could have a material adverse effect on our business, financial condition, results of operations and cash flows.
To the extent we are unable to match revenues received in foreign currencies with costs paid in the same currency, foreign exchange rate fluctuations in that currency could have a material adverse effect on our business, financial condition, results of operations and cash flows.
We may use a combination of natural hedging techniques and financial derivatives to protect against certain foreign currency exchange rate risks. Such hedging activities may be ineffective or may not offset more than a portion of the adverse financial impact resulting from foreign currency variations. Gains or losses associated with hedging activities also may negatively impact operating results.
We will have increased exposure to fluctuations in the Euro due to the exchange of U.S. dollar for Euro denominated debt as a result of our retirement of our outstanding first lien term loan and the issuance of our senior secured notes in August 2010. As of December 31, 2010, we estimated that a hypothetical change of 100 basis points in the Euro to the U.S. dollar exchange rate would have impacted our equity / (deficit) by approximately $2.9 million. We intend to evaluate our hedging activities in light of such exposure, but there is no guarantee we will be able to effectively mitigate such risk.
23
Table of Contents
Entering new markets poses new competitive threats and commercial risks.
As we seek to expand into markets beyond vehicle structural components and assemblies, we expect to diversify our product revenues by leveraging our development, engineering and manufacturing capabilities in order to source necessary parts and components for other industries. Such diversification requires investments and resources that may not be available as needed. While we signed a contract with a customer in the solar energy industry, difficulties experienced by our customer caused us to write-down $7.3 million of our investment during 2010. Furthermore, even if non-automotive customers are prepared to order products from us, we cannot guarantee that we will be successful in leveraging our capabilities into these new markets and thus in meeting the needs of these new customers and competing favorably in these new markets. If these customers experience reduced demand for their products or financial difficulties, our future prospects will be negatively affected as well.
Any acquisitions we make could disrupt our business and materially harm our financial condition, results of operations and cash flows.
We may, from time to time, consider acquisitions of complementary companies, products or technologies. Acquisitions involve numerous risks, including difficulties in the assimilation of the acquired businesses, the diversion of our management’s attention from other business concerns, the assumption of unknown liabilities, undisclosed risks impacting the target and potential adverse effects on existing business relationships with current customers and suppliers. In addition, any acquisitions could involve the incurrence of substantial additional indebtedness or dilution to our stockholders. We cannot assure you that we will be able to successfully integrate any acquisitions that we undertake or that such acquisitions will perform as planned or prove to be beneficial to our operations and cash flow. Any such failure could seriously harm our financial condition, results of operations and cash flows.
The mix of profits and losses in various jurisdictions may have an impact on our overall tax rate, which in turn, may adversely affect our profitability.
Our overall effective tax rate is equal to our total tax expense as a percentage of our total operating profit or loss before tax. However, tax expenses and benefits are determined separately for each of our taxpaying entities or groups of entities that is consolidated for tax purposes in each jurisdiction. Losses in such jurisdictions may provide no current financial statement tax benefit. As a result, changes in the mix of projected profits and losses between jurisdictions, among other factors, could have a significant impact on our overall effective tax rate.
Negative or unexpected results from tax audits could adversely affect us.
We are currently subject to tax audits by governmental authorities in the United States and numerous non-United States jurisdictions. Because the results of tax audits are inherently uncertain, negative or unexpected results from one or more such tax audits could adversely affect us.
Proposed future United States federal income tax legislation could adversely impact our effective tax rate.
In May 2009, President Obama’s administration announced proposed future tax legislation that would, if enacted into law, substantially modify the rules governing the United States taxation of owners of certain non-United States subsidiaries. In February 2011, President Obama’s administration delivered proposed budgets reflecting many of these potential tax law changes. These potential changes include, but are not limited to: limitations on the deferral of United States taxation of foreign earnings; limitations on the ability to claim and utilize foreign tax credits; and deferral of various tax deductions until non-United States earnings are repatriated to the United States. Many details of the proposals remain unknown. If any of these proposals are enacted into law, they could adversely impact our effective tax rate.
24
Table of Contents
The value of our deferred tax assets could become impaired, which could materially and adversely affect our operating results.
As of December 31, 2010, we had approximately $16.8 million in net deferred income tax assets. These deferred tax assets include net operating loss carryforwards that can be used to offset taxable income in future periods and reduce income taxes payable in those future periods. We periodically determine the probability of the realization of deferred tax assets, using significant judgments and estimates with respect to, among other things, historical operating results, expectations of future earnings and tax planning strategies. If we determine in the future that there is not sufficient positive evidence to support the valuation of these assets, due to the factors described above or other factors, we may be required to further adjust the valuation allowance to reduce our deferred tax assets. Such a reduction could result in material non-cash expenses in the period in which the valuation allowance is adjusted and could have a material adverse effect on our results of operations.
Our ability to utilize our net operating loss carryforwards may be limited and delayed. As of December 31, 2010, we had U.S. net operating loss carryforwards of approximately $192 million. Certain provisions of the United States tax code could limit our annual utilization of the net operating loss carryforwards. There can be no assurance that we will be able to utilize all of our net operating loss carryforwards and any subsequent net operating loss carryforwards in the future. There is a full valuation allowance recorded against the deferred tax asset benefit of this carryforward.
In addition, adverse changes in the underlying profitability and financial outlook of our operations in several foreign jurisdictions could lead to changes in our valuation allowances against deferred tax assets and other tax accruals that could adversely affect our financial results.
Further, as a result of our IPO, we may have an “ownership change” for purposes of Section 382 of the Internal Revenue Code if, under certain circumstances, our existing stockholders were to sell within a specified period a sufficient amount of our common stock that they then possess to cause an ownership change. If we do experience an ownership change, we may be further limited, pursuant to Section 382 of the Internal Revenue Code, in using our then-current net operating losses to offset taxable income for taxable periods (or portions thereof) beginning after such ownership change. Consequently, in the future we may be required to pay increased cash income taxes because of the Section 382 limitations on our ability to use our net operating loss carryforwards.
We have a material amount of goodwill, which, if it becomes impaired, would result in a reduction in our net income and equity.
Goodwill represents the excess of the cost of an acquisition over the fair value of the net assets acquired. GAAP requires that goodwill be periodically evaluated for impairment based on the fair value of the reporting unit. A significant percentage of our total assets represent goodwill primarily associated with the purchase of our assets from the Predecessor Company in 2007. Declines in our profitability or the value of comparable companies may impact the fair value of our reporting units, which could result in a write-down of goodwill and a reduction in net income.
As of December 31, 2010, we had approximately $66.3 million of goodwill on our consolidated balance sheet that could be subject to impairment. In addition, if we acquire new businesses in the future, we may recognize additional goodwill, which could be significant. We could also be required to recognize additional impairments in the future and such an impairment charge could have a material adverse effect on our financial position and results of operations in the period of recognition.
We may face risks relating to climate change that could have an adverse impact on our business.
Greenhouse gas (“GHG”) emissions have increasingly become the subject of substantial international, national, regional, state and local attention. GHG emission regulations have been promulgated in certain of the
25
Table of Contents
jurisdictions in which we operate, and additional GHG requirements are in various stages of development. For example, the United States Congress has considered legislation that would establish a nationwide limit on GHGs. In addition, the United States Environmental Protection Agency (EPA) has issued regulations limiting GHG emissions from mobile and stationary sources pursuant to the federal Clean Air Act. When effective, such measures could require us to modify existing or obtain new permits, implement additional pollution control technology, curtail operations or increase our operating costs. In addition, our OEM customers may seek price reductions from us to account for their increased costs resulting from GHG regulations. Further, growing pressure to reduce GHG emissions from mobile sources could reduce automobile sales, thereby reducing demand for our products and ultimately our revenues. Thus, any additional regulation of GHG emissions, including through a cap-and-trade system, technology mandate, emissions tax, reporting requirement or other program, could adversely affect our business, results of operations, financial condition, reputation, product demand and liquidity.
Risk Factors Relating to Our Indebtedness
We have a substantial amount of indebtedness, which could have a material adverse effect on our financial health and our ability to fund our operations, to obtain financing in the future and to react to changes in our business, and which could adversely affect the price of our common stock.
As of December 31, 2010, our total debt, including capital leases, was $558.2 million. That indebtedness could limit our ability to satisfy our obligations, limit our ability to operate our businesses and impair our competitive position. For example, it could:
| • | adversely affect our stock price; |
| • | make it more difficult for us to satisfy our obligations under our financing documents; |
| • | increase our vulnerability to adverse economic and general industry conditions, including interest rate fluctuations, because a portion of our borrowings are, and will continue to be, at variable rates of interest; |
| • | require us to dedicate a substantial portion of our cash flow from operations to payments on our debt, which would reduce the availability of our cash flow from operations to fund working capital, capital expenditures or other general corporate purposes; |
| • | limit our flexibility in planning for, or reacting to, changes in our business and industry; |
| • | place us at a disadvantage compared to competitors that may have proportionately less debt; |
| • | limit our ability to obtain additional debt or equity financing due to applicable financial and restrictive covenants in our debt agreements; and |
| • | increase our cost of borrowing. |
We may not be able to refinance any of our debt or we may not be able to refinance our debt on commercially reasonable terms.
We cannot assure you that we will be able to refinance, extend the maturity or otherwise amend the terms of our existing indebtedness, or whether any refinancing, extension or amendment will be on commercially reasonable terms. The indebtedness issued in any refinancing of our existing indebtedness could have a significantly higher rate of interest and greater costs than our existing indebtedness. There can be no assurance that the financial terms or covenants of any new credit facility and/or other indebtedness issued to refinance our existing indebtedness will be the same or as favorable as those under our existing indebtedness.
Our ability to complete a refinancing of our existing indebtedness prior to their respective maturities is subject to a number of conditions beyond our control. For example, if a disruption in the financial markets were to occur at the time that we intended to refinance this indebtedness, we might be restricted in our ability to access the
26
Table of Contents
financial markets. If we were unable to make payments or refinance our debt or obtain new financing under these circumstances, we would have to consider other options, such as:
| • | sales of assets; |
| • | sales of equity; or |
| • | negotiations with lenders and their respective agents to restructure the applicable debt. |
Our debt instruments may restrict, or market or business conditions may limit, our ability to employ some of our options.
In addition, under our credit agreements, a change in control may lead the lenders to exercise remedies such as acceleration of the loan, termination of their obligations to fund additional advances and collection against the collateral securing such loan; and, in the case of our senior secured notes, a change in control may lead to one or more noteholders exercising their change of control put right.
Despite our current indebtedness levels, we may still be able to incur substantially more debt. This could exacerbate the risks associated with our substantial leverage.
Although we used the net proceeds from our IPO to retire outstanding indebtedness, we may incur additional indebtedness in the future or refinance existing debt prior to the respective maturities of such debt. We could also incur indebtedness under other existing as well as additional financing arrangements. As of December 31, 2010, we had $105.8 million of availability for additional borrowing of senior secured indebtedness under our revolving credit facility. If new debt or other liabilities are added to our current debt levels, the related risks that we now face could intensify.
We may be unable to generate sufficient cash to service all of our indebtedness and may be forced to take other actions to satisfy our obligations under such indebtedness, which may not be successful.
Our ability to make scheduled payments on or to refinance our debt obligations, certain of which have short term maturities, depends on our financial condition and operating performance, which is subject to prevailing economic and competitive conditions and to financial, business and other factors beyond our control. We cannot assure you that we will maintain a level of cash flows from operating activities sufficient to permit us to pay or refinance our indebtedness, including our senior secured notes (the “notes”) and our revolving credit facility.
If we are unable to service our debt or pay our other obligations, we will be forced to take actions such as revising or delaying our strategic plans, reducing or delaying capital expenditures, selling assets, restructuring or refinancing such debt, or seeking additional equity capital. We may be unable to effect any of these remedies on satisfactory terms, or at all. Our revolving credit facility, our letter of credit facility and the indenture governing the notes restrict our ability to dispose of assets and use the proceeds from such disposition. We may not be able to consummate those dispositions or to use those proceeds to meet any debt service obligations then due.
If we cannot make scheduled payments on our debt, we will be in default and, as a result:
| • | the indenture trustee or the noteholders who collectively hold at least 25% in principal amount of the outstanding notes could declare all outstanding principal and interest under the notes to be due and payable; |
| • | the lenders under our revolving credit facility, our letter of credit facility and the agreements governing certain of our other indebtedness could terminate their commitments to lend to us and to issue letters of credit, and such lenders could foreclose against the assets securing our borrowings; and |
| • | we could be forced into bankruptcy or liquidation. |
27
Table of Contents
Certain of our debt is owned by Cerberus, which controls our controlling stockholder, and in certain instances such as in the event of a default under the financing documents governing such debt, the interests of Cerberus in its capacity as a lender may be adverse to the interests of our stockholders.
As of December 31, 2010, Cerberus, which controls our controlling stockholder, owned all $27.5 million of the commitments under our synthetic letter of credit facility. The synthetic letter of credit facility is an off-balance sheet obligation. Cerberus may have interests as a lender which differ from the interests of our stockholders. In the event that Cerberus seeks to exercise certain rights that it has pursuant to the financing documents governing our indebtedness, such actions could be adverse to the interests of our stockholders. In addition, Cerberus and our controlling stockholder may have an incentive to cause us to refinance such debt, even if the terms available in the market are not as attractive as the terms contained in our existing indebtedness.
Our debt instruments restrict our current and future operations.
The financing documents governing our indebtedness impose significant operating and financial restrictions on us. These restrictions limit our ability and the ability of our subsidiaries to, among other things:
| • | incur or guarantee additional debt, incur liens, or issue certain equity; |
| • | declare or make distributions to our stockholders, repurchase equity or prepay certain debt; |
| • | make loans and certain investments; |
| • | make certain acquisitions of equity or assets; |
| • | enter into certain transactions with affiliates; |
| • | enter into mergers, acquisitions and other business combinations; |
| • | consolidate, transfer, sell or otherwise dispose of certain assets; |
| • | use the proceeds from sales of assets and stock; |
| • | enter into sale and leaseback transactions; |
| • | enter into restrictive agreements; |
| • | make capital expenditures; |
| • | change our fiscal year; |
| • | amend or modify organizational documents; and |
| • | engage in businesses other than the businesses we currently conduct. |
In addition to the restrictions and covenants listed above, certain of our financing documents require us, under certain circumstances, to comply with specified financial maintenance covenants. Any of these restrictions or covenants could limit our ability to plan for or react to market conditions or meet certain capital needs and could otherwise restrict our corporate activities.
Any one or more of the risks mentioned herein, as well as events not yet contemplated, could result in our failing to meet such covenants and restrictions. Our ability to comply with these covenants and restrictions may be affected by events beyond our control, and an adverse development affecting our business could require us to seek waivers or amendments of such covenants or restrictions or alternative or additional sources of financing. We cannot assure you that these waivers, amendments or alternative or additional financings could be obtained, or if obtained, would be on terms acceptable to us.
A breach of any of the covenants or restrictions contained in any of our existing or future financing agreements, including our inability to comply with the financial maintenance covenants in such financing documents, could result in an event of default under those financing documents. Any such event of default could permit the agent
28
Table of Contents
or lenders under our financing documents, if such documents so provide, to discontinue lending, to accelerate the related debt as well as any other debt to which a cross acceleration or cross default provision applies, and to declare all borrowings outstanding under our financing arrangements to be immediately due and payable and institute enforcement proceedings against those assets that secure the extensions of credit under our outstanding indebtedness. In addition, the agent or lenders could terminate any commitments they had made to supply us with further funds. If the agent or lenders require immediate repayments, we may not be able to repay them in full. This could adversely affect our financial results, liquidity and cash flow and our ability to service our indebtedness and could lead to our bankruptcy.
Substantially all of our subsidiaries’ assets are pledged as collateral under secured financing arrangements.
As of December 31, 2010, we had $524.5 million (net of $11.4 original issue discount in respect of the issuance of the notes) of secured debt. Substantially all of our subsidiaries’ assets are pledged as collateral for our borrowings under our secured financing arrangements. Most of our domestic subsidiaries are either primary obligors or guarantors under a secured financing arrangement. Substantially all of our domestic subsidiaries’ assets are pledged as collateral for these guarantees. If we are unable to repay all secured borrowings when due, whether at maturity or if declared due and payable following a default, the agent or the lenders, as applicable, would have the right to proceed against the collateral pledged to secure the indebtedness and may sell the assets pledged as collateral in order to repay those borrowings, which could have a material adverse effect on our businesses, financial condition, results of operations and cash flows.
We operate as a holding company and depend on our subsidiaries for cash to satisfy the obligations of the holding company.
Tower International, Inc. is a holding company. Our subsidiaries conduct all of our operations and own substantially all of our assets. Our cash flow and our ability to meet our obligations depends on the cash flow of our subsidiaries. In addition, the payment of funds in the form of dividends, intercompany payments, tax sharing payments and other forms are, in certain instances, subject to restrictions under the terms of our subsidiaries’ financing arrangements.
Our variable rate indebtedness exposes us to interest rate risk, which could cause our debt costs to increase significantly.
As of December 31, 2010, 19% of our borrowings were at variable rates of interest. Such indebtedness exposes us to interest rate risks. An increase in borrowings under our revolving credit facility or any similar replacement facilities which provide for variable interest rates would increase our exposure to increases in market interest rates.
Our ability to borrow under our revolving credit facility is subject to an annual appraisal of certain of our assets. Such appraisal could result in the reduction of available borrowings under this facility, thereby negatively impacting our liquidity.
The borrowings available under our revolving credit facility are subject to the calculation of a borrowing base, which is based upon the value of certain of our assets, including accounts receivable, inventory and property, plant and equipment, which we refer to as PP&E. The administrative agent for this facility causes a third party to perform an appraisal of the assets included in the calculation of the borrowing base either on an annual basis or, if our availability under the facility is less than $30 million during any twelve month period, as frequently as on a semi-annual basis. In addition, if certain material defaults under the facility have occurred and are continuing, the administrative agent has the right to perform any such appraisal as often as it deems necessary in its sole discretion. During 2010, the appraised value of our PP&E was higher than the value of such assets used in the calculation of the borrowing base at the time of the previous appraisal, thereby increasing available borrowings under our revolving credit facility. During 2009, the appraised value of our PP&E was less than the value of such assets used in the calculation of the borrowing base at the time of the previous appraisal, thereby reducing available borrowings
29
Table of Contents
under our revolving credit facility. If any such appraisal results in a significant reduction of the borrowing base, a portion of the outstanding indebtedness under the facility could become immediately due and payable.
Risk Factors Relating to Our Common Stock
The price of our common stock may be volatile.
The price at which our common stock trades may be volatile due to a number of factors, including:
| • | actual or anticipated fluctuations in our financial condition or annual or quarterly results of operations; |
| • | changes in investors’ and financial analysts’ perception of the business risks and conditions of our business; |
| • | changes in, or our failure to meet, earning estimates and other performance expectations of investors or financial analysts; |
| • | unfavorable commentary or downgrades of our stock by equity research analysts; |
| • | our success or failure in implementing our growth plans; |
| • | changes in the market valuations of companies viewed as similar to us; |
| • | changes or proposed changes in governmental regulations affecting our business; |
| • | changes in key personnel; |
| • | depth of the trading market in our common stock; |
| • | failure of securities analysts to cover our common stock; |
| • | termination of the lock-up agreement signed by our insiders and controlling stockholder in connection with our IPO, the vesting of the restricted stock units that we granted in connection with our IPO or the termination of other restrictions on the ability of our existing stockholders to sell shares; |
| • | future sales of our common stock; |
| • | the granting or exercise of employee stock options or other equity awards; |
| • | increased competition; |
| • | realization of any of the risks described elsewhere under “Risk Factors”; and |
| • | general market and economic conditions. |
In addition, equity markets have experienced significant price and volume fluctuations that have affected the market prices for the securities of newly public companies for a number of reasons, including reasons that may be unrelated to our business or operating performance. These broad market fluctuations may result in a material decline in the market price of our common stock and you may not be able to sell your shares at prices you deem acceptable. In the past, following periods of volatility in the equity markets, securities class action lawsuits have been instituted against public companies. Such litigation, if instituted against us, could result in substantial cost and the diversion of management attention.
We are a “controlled company” within the meaning of the New York Stock Exchange corporate governance standards and, as a result, rely on exemptions from certain corporate governance requirements. Our stockholders will not have the same protections afforded to stockholders of companies that are subject to these requirements.
Cerberus, through our controlling stockholder, controls a majority of our outstanding common stock. As a result, we are a “controlled company” within the meaning of the New York Stock Exchange corporate governance
30
Table of Contents
standards. Under these standards, a company of which more than 50% of the voting power is held by an individual, group or another company is a “controlled company” and may elect not to comply with certain corporate governance requirements, including:
| • | the requirement that a majority of the board of directors consist of independent directors; |
| • | the requirement that we have a nominating/corporate governance committee that is composed entirely of independent directors with a written charter addressing the committee’s purpose and responsibilities; |
| • | the requirement that we have a compensation committee that is composed entirely of independent directors with a written charter addressing the committee’s purpose and responsibilities; and |
| • | the requirement for an annual performance evaluation of the nominating/corporate governance and compensation committees. |
We are utilizing these exemptions. As a result, we do not have a majority of independent directors and our nominating and corporate governance and compensation committees do not consist entirely of independent directors. Accordingly, you do not have the same protections afforded to stockholders of companies that are subject to all of the corporate governance requirements. Cerberus also currently owns 100 percent of our letter of credit facility.
The interests of our controlling stockholder in its capacity as a stockholder may be adverse to the interests of our other stockholders.
Our controlling stockholder controls the election of our directors, determines our corporate and management policies and determines, without the consent of our other stockholders, the outcome of any corporate transaction or other matter submitted to our stockholders for approval, including potential mergers or acquisitions, asset sales and other significant corporate transactions. Our controlling stockholder also has sufficient voting power to amend our organizational documents.
We cannot assure you that the interests of our controlling stockholder will coincide with the interests of other holders of our common stock. Additionally, Cerberus, which controls our controlling stockholder, is in the business of making investments in companies and may, from time to time, acquire and hold interests in businesses that compete directly or indirectly with us. Our certificate of incorporation provides that neither Cerberus or its affiliates, nor members of our board of directors who are not our employees (including any directors who also serve as officers) or their affiliates, have any duty to refrain from engaging, directly or indirectly, in the same or similar business activities or lines of business in which we operate. Cerberus and our controlling stockholder may also pursue, for their own accounts, acquisition opportunities that may be complementary to our business, and, as a result, those acquisition opportunities may not be available to us. So long as our controlling stockholder continues to own a significant amount of our common stock, it will continue to be able to strongly influence or effectively control our decisions, including director and officer appointments, potential mergers or acquisitions, asset sales and other significant corporate transactions. These potential conflicts of interest could have a material adverse effect on our business, financial condition, results of operations or prospects if attractive corporate opportunities are directed by Cerberus, its affiliates or our directors to themselves or their other affiliates instead of to us.
Shares eligible for future sale may cause the market price of our common stock to decline, even if our business is doing well.
Sales of substantial amounts of our common stock in the public market, or the perception that these sales may occur, could adversely affect the price of our common stock and could impair our ability to raise capital through the sale of additional equity securities. Our certificate of incorporation authorizes us to issue 350,000,000 shares of common stock and as of March 14, 2011 we had 19,101,588 shares of common stock outstanding. Of these
31
Table of Contents
outstanding shares, 6,633,722 shares of common stock are freely tradable, without restriction, in the public market unless purchased by our affiliates. The remaining 12,467,866 shares of common stock are “restricted securities,” as that term is defined in Rule 144 under the Securities Act of 1933, as amended (the “Securities Act”), which are freely tradable subject to applicable holding period, volume and other limitations under Rule 144 or Rule 701 of the Securities Act.
The restricted securities are subject to a lock-up agreement with the underwriters, restricting the sale of such shares for 180 days after the date of our IPO. This lock-up agreement is subject to a number of exceptions, however, and holders may be released from these agreements without prior notice at the discretion of each of the representatives of the underwriters. Moreover, after expiration of the lock-up our controlling stockholder, as the holder of an aggregate of 12,467,866 shares of our common stock, will have rights, subject to some conditions, to require us to file registration statements covering its shares or to include its shares in registration statements that we may file for ourselves or other stockholders. Once we register these shares, they can be freely sold in the public market upon issuance.
Our average trading volume is not substantial, which adds to the volatility of our stock price.
During the period from October 16, 2010 (the day after which our shares began trading in the public markets) through December 31, 2010, the average daily trading volume of our common stock on the New York Stock Exchange was approximately 94,000 shares, or roughly 1% of our outstanding common stock. When a relatively small number of shares are traded in a given day, the stock price can be influenced by the purchase or sale of a very small number of shares, leading to volatility in our stock price.
Reports published by securities or industry analysts, including projections in those reports that exceed our actual results, could adversely affect our common stock price and trading volume.
We currently have securities research analysts that establish and publish their own periodic projections for our business. These projections may vary widely from one another and may not accurately predict the results we actually achieve. Our stock price may decline if our actual results do not match securities research analysts’ projections. Similarly, if one or more of the analysts who writes reports on us downgrades our stock or publishes inaccurate or unfavorable research about our business, our stock price could decline. If one or more of these analysts ceases coverage of our company or fails to publish reports on us regularly, our stock price or trading volume could decline. While we expect securities research analyst coverage to continue, if no securities or industry analysts continue coverage of our company, the trading price for our stock and the trading volume could be adversely affected.
We only recently began operating as a public company and the obligations incident to being a public company will require additional expenditures of both time and resources.
Although the Predecessor Company was a public company, we have only operated as a public company since October 2010, and we expect that the obligations of being a public company, including substantial public reporting, auditing and investor relations obligations, will require significant additional expenditures, and place additional demands on our management. These obligations will increase our operating expenses and could divert our management’s attention from our operations. The Sarbanes-Oxley Act of 2002, the Dodd-Frank Wall Street Reform and Consumer Protection Act of 2010 and the SEC rules and regulations implementing those Acts, as well as various New York Stock Exchange rules, will increase our legal and financial compliance costs, and make some activities more difficult, time-consuming and/or costly. These rules and regulations could also make it more difficult for us to attract and retain qualified independent members of our board of directors and qualified members of our management team.
32
Table of Contents
Provisions in our charter documents and certain agreements governing our indebtedness and under Delaware law, could make an acquisition of us more difficult and may prevent attempts by our stockholders to replace or remove our current management, even if beneficial to our stockholders.
Provisions in our certificate of incorporation and our bylaws may discourage, delay or prevent a merger, acquisition or other change in control of our company that stockholders may consider favorable, including transactions in which you might otherwise receive a premium for your shares. These provisions could also limit the price that investors might be willing to pay in the future for shares of our common stock, thereby depressing the market price of our common stock. In addition, these provisions may frustrate or prevent any attempts by our stockholders to replace or remove our current management by making it more difficult for stockholders to replace members of our board of directors. Among others, these provisions:
| • | establish a staggered board of directors such that not all members of the board are elected at one time; |
| • | on or after such date that our controlling stockholder, its affiliates, or any person who is an express assignee or designee of our controlling stockholder’s rights under our certificate of incorporation and such assignee’s or designee’s affiliates, ceases to beneficially own (as defined in Rule 13d-3 under the Securities Exchange Act of 1934), in the aggregate, at least 50% of the outstanding shares of our common stock, which we refer to as the 50% Trigger Date, allow the authorized number of our directors to be changed only by resolution of our board of directors (and prior to such date, only by stockholders having the right to vote at least fifty percent in voting power of our outstanding voting stock, voting together as a single class, which holders, prior to such date, may also fill vacancies and newly created directorships resulting from any increases in authorized directors); |
| • | on or after the 50% Trigger Date, limit the manner in which stockholders can remove directors from our board (and prior to such date, stockholders having the right to vote at least fifty percent in voting power of our outstanding voting stock, voting together as a single class, may remove a director with or without cause); |
| • | on or after such date that our controlling stockholder, its affiliates, or any person who is an express assignee or designee of our controlling stockholder’s rights under our certificate of incorporation and such assignee’s or designee’s affiliates, ceases to beneficially own (as defined in Rule 13d-3 under the Securities Exchange Act of 1934), in the aggregate, at least 33-1/3% of the outstanding shares of our common stock, which we refer to as the 33-1/3% Trigger Date, prohibit stockholders from proposing business to be conducted at special meetings of stockholders; |
| • | establish advance notice requirements for nominations by stockholders of directors to our board of directors; |
| • | on or after the 33-1/3% Trigger Date, require that stockholder actions must be effected at a duly called stockholder meeting and prohibit actions by our stockholders by written consent; |
| • | on or after the 33-1/3% Trigger Date, limit who may call stockholder meetings to the chairman of our board of directors or our board of directors pursuant to a resolution approved by a majority of the whole board (prior to that time, special meetings of stockholders may be called by the chairman of our board of directors, by our board of directors pursuant to a resolution approved by a majority of the whole board or by any of our controlling stockholder, its affiliates, or any express assignee or designee of our controlling stockholder under our certificate of incorporation, and such assignee’s or designee’s affiliates or any director employed by any of them); |
| • | require any stockholder, or group of stockholders acting in concert, who seeks to transact business at a meeting or nominate directors for election to submit a list of derivative and other interests in our company’s securities, including any short interests and synthetic equity interests held by such proposing stockholder; |
| • | require any stockholder, or group of stockholders acting in concert, who seeks to nominate directors for election to submit a description of all material relationships and related party transactions between such |
33
Table of Contents
| stockholders or group of stockholders, and their respective affiliates and associates, with the proposed nominee(s) and their respective affiliates or associates; |
| • | establish that our bylaws may be amended or repealed by a majority vote of our board of directors or, on or after the 50% Trigger Date, by stockholders having the right to vote at least two-thirds in voting power of our outstanding voting stock, voting together as a single class (and prior to such date, by stockholders having the right to vote at least 50% in voting power of our outstanding shares of voting stock, voting together as a single class); |
| • | limit our ability to engage in business combinations with certain interested stockholders; and |
| • | authorize our board of directors to cause the issuance of preferred stock without stockholder approval, which could work to dilute the stock ownership of a potential hostile acquirer, effectively preventing acquisitions that have not been approved by our board of directors. |
Our certificate of incorporation authorizes the board of directors to issue up to 50,000,000 shares of preferred stock. The preferred stock may be issued in one or more series, the terms of which may be fixed by resolution of our board of directors without further action by the stockholders. These terms may include voting rights, preferences as to dividends and liquidation, conversion rights, redemption rights, and sinking fund provisions. The issuance of preferred stock could diminish the rights of holders of our common stock, and therefore could reduce the value of our common stock. In addition, specific rights granted to holders of preferred stock could be used to restrict our ability to merge with, or sell assets to, a third party. The ability of our board of directors to issue preferred stock could delay, discourage, prevent or make it more difficult or costly to acquire or effect a change in control, thereby preserving the current stockholders’ control.
We have no present intention to pay dividends and, even if we change that policy, we may be restricted from paying dividends on our common stock.
We do not intend to pay dividends for the foreseeable future. If we change that policy and commence paying dividends, we will not be obligated to continue those dividends and our stockholders will not be guaranteed, or have contractual or other rights, to receive dividends. If we commence paying dividends in the future, our board of directors may decide, in its discretion, at any time, to decrease the amount of dividends, otherwise modify or repeal the dividend policy or discontinue entirely the payment of dividends.
Our ability to pay dividends will be restricted by certain of the agreements governing our indebtedness, and may be restricted by agreements governing any of our future indebtedness. Furthermore, we are permitted under the terms of certain of the agreements governing our indebtedness to incur additional indebtedness (under certain circumstances) which in turn may severely restrict or prohibit the payment of dividends.
Under the Delaware General Corporation Law (DGCL), our board of directors may not authorize the payment of a dividend unless it is either paid out of our surplus, as calculated in accordance with the DGCL, or if we do not have a surplus, it is paid out of our net profits for the fiscal year in which the dividend is declared and/or the preceding fiscal year.
| Item 1B. | Unresolved Staff Comments |
None.
34
Table of Contents
| Item 2. | Properties |
We are headquartered in Livonia, Michigan in a 76,300 square foot facility that we lease. This facility is utilized for management offices as well as certain customer service, engineering, human resources, information technology, finance and treasury functions. We believe that this facility is suitable for the activities conducted there.
Our manufacturing is conducted in 31 manufacturing facilities strategically located throughout North and South America, Europe and Asia. Our manufacturing facilities are supported by nine engineering and sales locations throughout the world.
The following table sets forth selected information regarding each of our facilities.
| Facility |
Country | Description of Use | Square Feet |
Ownership | ||||||||||||
| Americas Locations |
||||||||||||||||
| Aruja |
Brazil | |
Manufacturing / Office / Technical Center |
|
217,900 | Owned | ||||||||||
| Betim |
Brazil | Manufacturing | 120,600 | Owned | ||||||||||||
| Contagem |
Brazil | Manufacturing | 144,200 | Leased(2) | ||||||||||||
| Auburn, Indiana |
United States | Manufacturing | 162,800 | Leased | ||||||||||||
| Bardstown, Kentucky |
United States | Manufacturing | 601,700 | |
Owned / Leased(1) |
| ||||||||||
| Bellevue, Ohio (2 locations) |
United States | Manufacturing | 363,700 | Owned | ||||||||||||
| Bluffton, Ohio |
United States | Manufacturing | 196,175 | Leased | ||||||||||||
| Chicago, Illinois |
United States | Manufacturing | 423,700 | Leased | ||||||||||||
| Clinton Township, Michigan |
United States | Manufacturing | 385,300 | Leased | ||||||||||||
| Elkton, Michigan |
United States | Manufacturing | 1,100,000 | Owned | ||||||||||||
| Grand Rapids, Michigan |
United States | Office | 5,900 | Leased | ||||||||||||
| Goodyear, Arizona |
United States | Manufacturing | 458,800 | Leased(2) | ||||||||||||
| Kendallville, Indiana |
United States | Manufacturing | 142,400 | Leased(3) | ||||||||||||
| Livonia, Michigan |
United States | |
Corporate Office / Technical Center |
|
76,300 | Leased | ||||||||||
| Madison, Mississippi |
United States | Manufacturing | 270,500 | Leased | ||||||||||||
| Meridian, Mississippi |
United States | Manufacturing | 412,000 | Leased | ||||||||||||
| Milan, Tennessee |
United States | Manufacturing | 531,400 | Leased(3) | ||||||||||||
| Plymouth, Michigan |
United States | Manufacturing | 285,100 | Leased | ||||||||||||
| Smyrna, Tennessee |
United States | Manufacturing | 271,000 | Leased | ||||||||||||
| Upper Sandusky, Ohio |
United States | Manufacturing | 80,000 | Leased(3) | ||||||||||||
| International Locations |
||||||||||||||||
| Gent |
Belgium | Manufacturing | 346,700 | Leased | ||||||||||||
| Artern |
Germany | Manufacturing | 164,600 | Owned | ||||||||||||
| Bergisch-Gladbach |
Germany | |
Corporate Office / Technical Center |
|
99,400 | Owned(4) | ||||||||||
| Zwickau |
Germany | Manufacturing | 499,000 | |
Owned / Leased(5) |
| ||||||||||
| Duisburg |
Germany | Manufacturing | 110,000 | (6) | ||||||||||||
| Buchholz |
Germany | Manufacturing | 79,900 | Owned | ||||||||||||
| Kaarst |
Germany | Purchasing Office | 3,300 | Leased | ||||||||||||
| Caserta |
Italy | Manufacturing | 262,500 | Owned | ||||||||||||
35
Table of Contents
| Facility |
Country | Description of Use | Square Feet |
Ownership | ||||||
| Turin |
Italy | Manufacturing / Office / Technical Center |
180,300 | Owned | ||||||
| Melfi |
Italy | Manufacturing | 73,600 | Owned | ||||||
| Opole |
Poland | Manufacturing | 146,000 | (5) | ||||||
| Malacky |
Slovakia | Manufacturing | 539,400 | Owned | ||||||
| WuHu |
China | Manufacturing / Office / Technical Center |
308,500 | (7) | ||||||
| Changchun |
China | Manufacturing / Office / Technical Center |
249,100 | (8) | ||||||
| Shanghai |
China | Office | 2,400 | Leased | ||||||
| Hyderabad |
India | Engineering / Design / Technical Center |
8,700 | Leased | ||||||
| Yokohama |
Japan | Sales / Engineering / Technical Center |
2,500 | Leased | ||||||
| Kwangju Metropolitan City, Pyeongdong |
Korea | Manufacturing | 237,000 | Owned(9) | ||||||
| Hwaseong-si, Gyeonggi-do |
Korea | Manufacturing | 221,900 | Owned | ||||||
| Shiheung-si, Gyeonggi-do |
Korea | Manufacturing | 183,000 | Owned | ||||||
| Ansan-si, Gyeonggi-do |
Korea | Manufacturing | 60,700 | Owned | ||||||
| Yeongcheon-si |
Korea | Manufacturing | 49,400 | Owned | ||||||
| Ulsan Metropolitan City |
Korea | Manufacturing | 53,900 | Owned | ||||||
| Gunpo-si, Gyeonggi-do |
Korea | Office / Technical Center | 28,800 | Owned | ||||||
| (1) | Facility consists of three buildings—two buildings are leased and one building is owned. |
| (2) | Manufacturing has not yet commenced at this facility. |
| (3) | Facility is closed, but we remain subject to obligations under the operating lease. |
| (4) | The manufacturing facility has been closed, but the technical center and corporate office remain open. |
| (5) | Facility consists of two buildings—one building is leased and one building is owned. |
| (6) | We own a building right to this facility which is leased by one of our subsidiaries to another of our subsidiaries. |
| (7) | Facility is utilized by our joint venture. The building is owned by the joint venture. |
| (8) | Facility is utilized by our joint venture. The building is owned by the joint venture. |
| (9) | Facility is owned, but the land is leased. |
| Item 3. | Legal Proceedings |
We are from time to time involved in legal proceedings, claims or investigations that are incidental to the conduct of our business. We vigorously defend ourselves against these claims. In future periods, we could be subjected to cash costs or non-cash charges to earnings if any of these matters is resolved on unfavorable terms. However, although the ultimate outcome of any legal matter cannot be predicted with certainty, based on current information, including our assessment of the merits of the particular claims, we do not expect that our pending legal proceedings or claims will have a material adverse impact on our future consolidated financial condition, results of operations or cash flows.
| Item 4. | Reserved |
36
Table of Contents
PART II
| Item 5. | Market for Registrant’s Common Equity, Related Stockholder Matters and Issuer Purchases of Equity Securities |
Market Information—Our common stock trades on the New York Stock Exchange under the symbol “TOWR.” The stock began trading on such exchange on October 15, 2010, in conjunction with our initial public offering. As of March 8, 2011, we had 19,101,588 shares of common stock outstanding, $0.01 par value, of which 6,633,722 shares were not owned by Tower International Holdings, LLC (an entity owned by Cerberus) and were freely tradable, and 37 holders of record of our common stock. The transfer agent and registrar for our common stock is American Stock Transfer & Trust Company, LLC.
The following table shows the high and low reported closing price per share of our common stock during 2010:
| High and Low Closing Prices per Share |
High Price | Low Price | ||||||
| Fourth Quarter 2010 (beginning October 15, 2010) |
$ | 17.90 | $ | 12.72 | ||||
Stockholder Return—The following graph shows the quarterly cumulative total stockholder return for our common stock during the period from October 15, 2010 to December 31, 2010. Five year historical data is not presented since our common stock commenced trading in connection with our initial public offering on October 15, 2010 and we did not have common stock outstanding prior to that date. The graph also shows the cumulative returns of the S&P 500 Index and the Dow Jones U.S. Auto Parts Index. The comparison assumes $100 was invested on October 15, 2010 (the date our new common stock began trading on the NYSE). Each of the indices shown assumes that all dividends paid were reinvested.
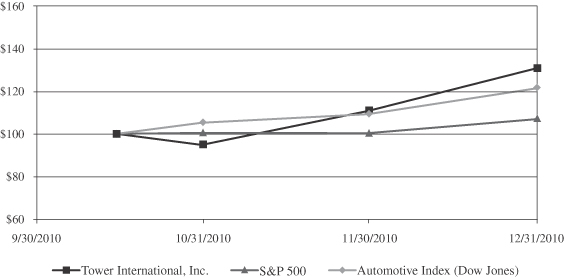
| 10/15/2010 | 10/31/2010 | 11/30/2010 | 12/31/2010 | |||||||||||||
| Tower International, Inc. |
$ | 100.00 | $ | 94.83 | $ | 110.70 | $ | 130.55 | ||||||||
| S&P 500 |
100.00 | 100.49 | 100.26 | 106.81 | ||||||||||||
| Automotive Index (Dow Jones) |
100.00 | 105.26 | 109.26 | 121.26 | ||||||||||||
Dividends—We did not declare or pay any common stock dividends during 2010 and do not anticipate paying any such dividends in the foreseeable future.
37
Table of Contents
Issuer’s Purchases of Equity Securities—We did not repurchase any of our common stock during the year ended December 31, 2010.
Use of Proceeds—In connection with our IPO, the SEC declared our Registration Statement on Form S-1 (No. 333-165200), filed under the Securities Act of 1933, effective on October 14, 2010. On October 20, 2010, we closed the sale of 6,250,000 shares of our common stock registered under the Registration Statement. On November 8, 2010, we sold an additional 383,722 shares of our common stock pursuant to a partial exercise of the underwriters’ over-allotment option. Goldman, Sachs & Co., Citigroup Global Markets Inc. and J.P. Morgan Securities LLC acted as joint book-running managers of the offering and as representatives of the underwriters.
The IPO price was $13.00 per share. The aggregate sale price for all of the shares sold by us was approximately $86.2 million (including proceeds from the partial exercise of the underwriters’ over-allotment option), resulting in net proceeds to us of approximately $74 million after payment of underwriting discounts and commissions of approximately $6 million and other offering costs of approximately $6.2 million. Contemporaneous with the IPO, we paid $1.2 million to certain executive officers pursuant to a Special Incentive Program. No additional payments were made by us to directors, officers, or persons owning ten percent or more of our common stock or to their associates, or to our affiliates, other than payments in the ordinary course of business to officers for salaries and to non-employee directors as compensation for board or board committee service.
We used $58.5 million of the proceeds from the IPO to reduce the outstanding balance on the revolving credit facility and used the balance of such proceeds plus $3 million of our cash to reduce outstanding indebtedness and to pay expenses of the IPO not previously paid.
| Item 6. | Selected Financial Data |
The following tables set forth (i) selected consolidated financial data of Tower International, Inc. for periods after the Corporate Conversion, (ii) selected consolidated financial data of Tower Automotive, LLC, for periods prior to the Corporate Conversion but subsequent to July 31, 2007, the date on which we acquired substantially all of the assets and assumed certain specific liabilities of Tower Automotive, Inc. and its United States subsidiaries in connection with the bankruptcy proceedings of Tower Automotive, Inc. and such subsidiaries and acquired the capital stock of substantially all of the foreign subsidiaries of Tower Automotive, Inc. and (iii) selected consolidated financial data of Tower Automotive, Inc. for periods on or before July 31, 2007. With respect to our financial data and throughout this Annual Report, we refer to Tower Automotive, Inc. through July 31, 2007 as the Predecessor Company and we refer to Tower Automotive, LLC after July 31, 2007 as the Successor. The selected consolidated balance sheet data of the Successor as of December 31, 2010 and 2009 and the selected consolidated statement of operations data of the Successor for the years ended December 31, 2010, 2009 and 2008 have been derived from our audited consolidated financial statements and related notes that we have included elsewhere in this Annual Report. The selected consolidated balance sheet data of the Successor as of December 31, 2008 and 2007 and of the Predecessor as of December 31, 2006, the selected consolidated statement of operations data of the Successor for the five months ended December 31, 2007 and the selected consolidated statement of operations data of the Predecessor for the seven months ended July 31, 2007 and the year ended December 31, 2006 have been derived from audited consolidated financial statements that are not presented in this Annual Report.
The selected historical consolidated financial data as of any date and for any period are not necessarily indicative of the results that may be achieved as of any future date or for any future period. As a result of the implementation of applicable accounting pronouncements relating to our acquisition of the Predecessor Company’s assets, the financial statements and financial data presented in this Annual Report for dates and for periods ending on or before July 31, 2007 are not comparable with the financial statements and financial data for periods after July 31, 2007.
38
Table of Contents
You should read the following selected historical consolidated financial data in conjunction with the more detailed information contained in “Management’s Discussion and Analysis of Financial Condition and Results of Operations” and our consolidated financial statements and the related notes that we have presented elsewhere in this Annual Report.
| Successor | Predecessor Company | |||||||||||||||||||||||
| Year Ended December 31, | Five Months Ended December 31, 2007 |
Seven Months Ended July 31, 2007 |
Year
Ended December 31, 2006 |
|||||||||||||||||||||
| 2010 | 2009 | 2008 | ||||||||||||||||||||||
| (in millions except share and per share data) | ||||||||||||||||||||||||
| Statement of Operations Data: |
||||||||||||||||||||||||
| Revenues |
$ | 1,997.1 | $ | 1,634.4 | $ | 2,171.7 | $ | 1,086.1 | $ | 1,455.5 | $ | 2,539.4 | ||||||||||||
| Cost of Sales |
1,786.5 | 1,536.8 | 1,991.3 | 970.5 | 1,325.9 | 2,389.2 | ||||||||||||||||||
| Gross profit |
210.6 | 97.6 | 180.4 | 115.6 | 129.6 | 150.2 | ||||||||||||||||||
| Gross profit margin |
10.5% | 6.0% | 8.3% | 10.6% | 8.9% | 5.9% | ||||||||||||||||||
| Selling, general, and administrative expenses (1) |
$ | 144.0 | $ | 118.3 | $ | 138.6 | $ | 57.0 | $ | 77.2 | $ | 131.5 | ||||||||||||
| Amortization expense |
3.3 | 2.8 | 3.0 | 1.2 | — | — | ||||||||||||||||||
| Restructuring and asset impairment charges, net |
14.3 | 13.4 | 4.8 | 1.8 | 22.4 | 70.5 | ||||||||||||||||||
| Operating income / (loss) |
49.0 | (36.9 | ) | 34.0 | 55.5 | 30.0 | (51.1 | ) | ||||||||||||||||
| Operating income / (loss) margin |
2.5% | (2.3)% | 1.6% | 5.1% | 2.1% | (2.0 | ) | |||||||||||||||||
| Interest expense, net |
$ | 65.9 | $ | 56.9 | $ | 60.2 | $ | 34.0 | $ | 65.5 | $ | 95.3 | ||||||||||||
| Chapter 11 and related reorganization items |
— | — | — | — | 62.2 | 66.2 | ||||||||||||||||||
| Income / (loss) from continuing operations |
(28.5 | ) | (59.0 | ) | (45.7 | ) | 18.2 | (100.3 | ) | (199.4 | ) | |||||||||||||
| Net income / (loss) (2) |
(28.5 | ) | (59.0 | ) | (45.7 | ) | 18.2 | (100.6 | ) | (195.4 | ) | |||||||||||||
| Net income attributable to the non-controlling interests |
8.4 | 8.9 | 6.6 | 3.0 | 5.4 | 6.7 | ||||||||||||||||||
| Net income / (loss) attributable to Tower International, Inc. |
(36.9 | ) | (67.9 | ) | (52.3 | ) | 15.2 | (106.0 | ) | (202.1 | ) | |||||||||||||
| Preferred unit dividends (3) |
10.7 | 16.1 | 14.9 | 8.8 | — | — | ||||||||||||||||||
| Income / (loss) available to common stockholders |
(47.6 | ) | (84.0 | ) | (67.3 | ) | 6.4 | (106.0 | ) | (202.1 | ) | |||||||||||||
| Basic and diluted income / (loss) per share: |
||||||||||||||||||||||||
| Income / (loss) from continuing operations |
(3.43 | ) | (6.74 | ) | (5.40 | ) | 0.51 | (1.79 | ) | (3.51 | ) | |||||||||||||
| Income / (loss) from discontinued operations |
— | — | — | — | (0.01 | ) | 0.07 | |||||||||||||||||
| Income / (loss) per share |
(3.43 | ) | (6.74 | ) | (5.40 | ) | 0.51 | (1.80 | ) | (3.44 | ) | |||||||||||||
| Weighted average basic and diluted shares outstanding (in thousands) |
13,866 | 12,468 | 12,468 | 12,468 | 58,807 | 58,659 | ||||||||||||||||||
| Cash dividends declared per share |
— | — | — | — | — | — | ||||||||||||||||||
| Successor | Predecessor Company |
|||||||||||||||||||||||
| December 31, | December
31, 2006 |
|||||||||||||||||||||||
| 2010 | 2009 | 2008 | 2007 | |||||||||||||||||||||
| (in millions) | ||||||||||||||||||||||||
| Balance Sheet Data: |
||||||||||||||||||||||||
| Cash and cash equivalents |
$ | 150.3 | $ | 149.8 | $ | 126.8 | $ | 96.8 | $ | 64.3 | ||||||||||||||
| Total assets |
1,340.2 | 1,334.4 | 1,269.8 | 1,582.9 | 2,107.0 | |||||||||||||||||||
| Total debt (4) |
558.2 | 669.5 | 628.1 | 691.7 | 1,681.0 | |||||||||||||||||||
| Redeemable preferred units (3) |
— | 170.9 | 155.2 | 145.9 | — | |||||||||||||||||||
| Total stockholders’ equity / (deficit) |
111.6 | (147.2 | ) | (88.5 | ) | 32.6 | (662.7 | ) | ||||||||||||||||
| (1) | In connection with the closing of the notes offering and the IPO, we incurred charges of $11.1 million related to one-time compensation plans for our executive officers. |
39
Table of Contents
| (2) | During the year ended December 31, 2009, we recorded a gain of $33.7 million related to the reduction of our letter of credit facility and subsequent repurchase of our first lien term loan. |
| (3) | Represents preferred equity interests in Tower Automotive, LLC. See note 12 to our consolidated financial statements. On August 12, 2010, the preferred units, common units and management incentive plan units of Tower Automotive, LLC, which constituted all of the equity interests in Tower Automotive, LLC, were converted into capital units of Tower Automotive, LLC. The preferred units received dividend payments in 2010, 2009, 2008, and 2007. |
| (4) | Consists of short-term and long-term debt, current portion of long-term debt and capital lease obligations. |
40
Table of Contents
| Item 7. | Management’s Discussion and Analysis of Financial Condition and Results of Operations |
Disclosure Regarding Forward-Looking Statements
This Annual Report contains statements which constitute forward-looking statements within the meaning of the Private Securities Litigation Reform Act of 1995 that involve substantial risks and uncertainties. The forward-looking statements can be identified by the words such as “anticipate,” “believe,” “plan,” “estimate,” “expect,” “intend,” “project,” and other similar expressions. Forward-looking statements are made as of the date of this report and are based upon management’s current expectations and beliefs concerning future developments and their potential effects on us. Such forward-looking statements are not guarantees of future performance. The following important factors, and those important factors described elsewhere in this Annual Report, including the matters set forth under the captions entitled “Risk Factors” and “Quantitative and Qualitative Disclosures About Market Risk” could affect (and in some cases have affected) our actual results and could cause such results to differ materially from estimates or expectations reflected in such forward-looking statements:
| • | automobile production volumes by original equipment manufacturers (“OEMs”); |
| • | the financial condition of the OEMs; |
| • | our ability to make scheduled payments of principal or interest on our indebtedness; |
| • | our ability to refinance our indebtedness; |
| • | our ability to generate non-automotive revenues; |
| • | our ability to comply with the covenants and restrictions contained in the instruments governing our indebtedness; |
| • | our customers’ ability to obtain equity and debt financing for their businesses; |
| • | our dependence on our largest customers; |
| • | significant recalls experienced by OEMs; |
| • | pricing pressure from our customers; |
| • | strengthening of the U.S. dollar and other foreign currency exchange rate fluctuations impacting our results; |
| • | work stoppages or other labor issues at our facilities or at the facilities of our customers or suppliers; |
| • | risks associated with non-U.S. operations, including foreign exchange risks and economic uncertainty in some regions; |
| • | costs or liabilities relating to environmental and safety regulations; and |
| • | any increase in the expense and funding requirements of our pension and other postretirement benefits. |
We do not assume any obligation to update or revise the forward-looking statements contained in this Annual Report.
This Annual Report also contains estimates and other statistical data made by independent parties and by us relating to market size and growth and other data about our industry. This data involves a number of assumptions and limitations, and you are cautioned not to give undue weight to such estimates. We have not independently verified the statistical and other industry data generated by independent parties that is contained in this Annual Report and, accordingly, we cannot assure you of its accuracy or completeness. In addition, projections, assumptions and estimates of our future performance and the future performance of the industries in which we operate are necessarily subject to a high degree of uncertainty and risk.
41
Table of Contents
Any forward-looking statement speaks only as of the date on which it is made, and we undertake no obligation to update any forward-looking statement to reflect events or circumstances after the date on which the statement is made or to reflect the occurrence of unanticipated events. Except as required by law, we undertake no obligation to publicly revise our forward-looking statements to reflect events or circumstances that arise after the date of this Annual Report.
Overview of the Business
Tower International, Inc. was formed in October 2010 as a Delaware corporation. On October 14, 2010, in connection with its initial public offering (“IPO”), Tower Automotive, LLC was converted into Tower International, Inc. (the “Corporate Conversion”). Upon the Corporate Conversion, all of the equity interests in Tower Automotive, LLC were converted into common stock of Tower International, Inc. Tower Automotive, LLC was formed in April 2007 as a Delaware limited liability company. It acquired the assets of Tower Automotive, Inc. and its subsidiaries (the “Predecessor Company”) in July 2007 (the “Original Acquisition”).
We are a leading integrated global manufacturer of engineered structural metal components and assemblies primarily serving automotive OEMs. We offer our automotive customers a broad product portfolio, supplying body-structure stampings, frame and other chassis structures, as well as complex welded assemblies, for small and large cars, crossovers, pickups and SUVs.
Our products are manufactured at 31 production facilities strategically located near our customers in North America, South America, Europe and Asia. We support our manufacturing operations through nine engineering and sales locations throughout the world. Our products are offered on a diverse mix of vehicle platforms, reflecting the balanced portfolio approach of our business model and the breadth of our product capabilities. We supply products to approximately 170 vehicle models globally. Our 10 largest vehicle models represented approximately 36% of our 2010 revenues.
We are a disciplined, process-driven company with an experienced management team which has a history of implementing sustainable operational improvements. We measure our operating efficiencies in manufacturing and purchasing cost reductions as a percentage of our material and manufacturing costs. We believe the typical percentage for our industry is approximately 2% to 3%. From January 1, 2008 through December 31, 2009, we achieved $195 million in manufacturing and purchasing cost reductions, or 6% of material and manufacturing costs. During 2010, we achieved $55.8 million in manufacturing and purchasing cost reductions, or 3% of material and manufacturing costs. These cost reductions helped us achieve a 10.5% gross profit margin and a 9.5% Adjusted EBITDA margin in 2010. We achieved these cost reductions in large part through successful implementation of Lean Six Sigma principles and rigorous application of global best practices. While we experienced above-average cost reductions during our turn-around after bankruptcy, we expect to trend toward a rate of 2% to 3% in the near-term. Our focus in 2011 and beyond is to retain the benefit of these achieved cost savings as anticipated volume recovery occurs.
Business Strategy
Our strategy is to strengthen our leadership position as a supplier to the global automotive industry and to expand opportunistically into non-automotive markets, seeking to capitalize on opportunities beyond the expected industry recovery. We believe that we are positioned to continue to provide a high-quality, compelling value proposition to our customers, enabling profitable growth.
We believe that our product capabilities, our geographic, customer and product diversification and the cost reductions that we achieved in 2008 through 2010 position us to benefit from an expected recovery in global automotive industry production. We intend to further strengthen our position through additional reductions in leverage and by capitalizing on the above-average growth expected in China and Brazil. We also intend to leverage our program management and engineering experience to pursue growth opportunities outside our
42
Table of Contents
existing automotive markets. For example, the solar industry shows promise for us, as many applications require highly engineered large stampings and complex welded structural assemblies that must be produced in high volume at repeatable tight tolerances similar to our product requirements in the automotive industry. We believe the solar industry in the United States and globally has the potential to grow at an average rate substantially greater than the longer term trend rate for the automotive industry. Beyond solar, we believe there may be similar opportunities in the future to apply and extend our core skills in other industries, such as defense.
Factors Affecting Our Industry
Our business and our revenues are primarily driven by the strength of the global automotive industry, which tends to be cyclical and highly correlated to general global macroeconomic conditions. The strength of the automotive market dictates the volume of purchases of our products by our OEM customers to ultimately satisfy consumer demand. We manufacture products pursuant to written agreements with each of our OEM customers. However, those agreements do not dictate the volume requirements of our customers; instead, OEMs monitor their inventory and the inventory levels of their dealers and adjust the volume of their purchases from us based on consumer demand for their products.
During the latter half of 2008 and throughout 2009, the automotive industry experienced an unprecedented downturn, led by the recession in the United States and followed by declines in many major markets around the world. The economic crisis in general, and the decline in consumer spending and the financial market turmoil in particular, had a severe and detrimental impact upon the global automotive market. In response to both the lack of strong consumer demand and the tightening of access to financial markets, OEMs reduced production volumes throughout the automotive industry, significantly impacting the revenues of both OEMs and their suppliers. During 2010, the financial markets improved and vehicle production increased; however, the global economy has not recovered to levels previously experienced. Vehicle production is expected to increase in 2011 compared to 2010, but at this time we cannot determine whether the recent recovery experienced will be prolonged.
The reports prepared by IHS Automotive® referred to in this Annual Report are subscription-based. All references in this report to historical industry production volumes, projections, estimates or other data attributable to IHS Automotive® are based on data available from the IHS Automotive® February 2011 forecast.
As measured by IHS Automotive®, global industry production of cars and light trucks was 72 million vehicles in 2010 compared to 57 million vehicles in 2009. The increased production is a trend that we expect to continue as the global economy recovers from the unprecedented economic crisis experienced over the last several years. Over the long term, IHS Automotive® projects production will reach 95 million vehicles by 2015, reflecting a recovery in both the North American and European markets as well as continued growth in emerging markets such as China and Brazil. We believe that we are well positioned to benefit from this long-term trend, but we are not insulated from short-term fluctuations in the global automotive industry.
Factors Affecting Our Revenues
While overall production volumes are largely driven by economic factors outside of our direct control, we believe that the following elements of our business also impact our revenues:
| • | Diversification of our customer base. Our revenues are impacted by the popularity of the OEMs for which we supply structural metal components and their respective market shares. By diversifying our customer base, we limit the risks associated with a downturn in any one OEM’s product portfolio. |
| • | Diversification of our vehicle mix. Similar to shifts in popularity of OEMs, shifts in consumer preferences directly influence the types and quantities of vehicles that OEMs manufacture, which in turn directly influences the structural components that we produce. By diversifying the vehicle types |
43
Table of Contents
| that we supply components for, we limit the risks associated with a downturn in any one of our vehicle segments. In 2010, our revenue mix was: 43%—small cars; 24%—large cars, including multi-purpose vehicles; 20%—North American framed vehicles; and 13%—other—light trucks. The term “small cars” refers to passenger cars that are classified by IHS Automotive® in the smallest three of IHS’s four categories of passenger cars, the term “large cars” refers to the largest category of passenger cars, multi-purpose vehicles and cross-over vehicles that are based on a unibody structure and the term “North American framed vehicles” refers to vehicles that are built on a full-frame structure, such as pick-up trucks and most sports utility vehicles. |
| • | Diversification of our product offerings. Our OEM customers rely upon us to efficiently produce structural metal components for the platforms that they design and to respond quickly to platform and vehicle enhancements that they develop. OEMs value the extent to which we are able to integrate multiple stampings and assemblies into offerings, thereby reducing the extent to which they must devote their focus and capital to integrating components they purchase from their suppliers. |
| • | Geographic diversification. Given the high costs and difficulties associated with transporting large structural metal components that we manufacture, it is critical that our facilities are in close proximity to our customers. We believe that countries such as Brazil and China, as well as other regions including Eastern Europe, will experience significant growth in vehicle demand and associated production volumes during the next five years as projected by IHS Automotive®. We currently have seven manufacturing facilities in Poland, Slovakia, Brazil and China and a technical center in India. As such, our geographic footprint is positioned to benefit as these markets expand and ultimately influence our revenue growth. |
| • | Opportunities to pursue non-automotive revenues. Our ability to produce large engineered structural components and assemblies is not confined to automotive markets. We intend to consider and pursue applications of our core competencies to develop other sources of non-automotive revenues, for example, in solar or defense. |
| • | Life cycle of our agreements. Our agreements with OEMs typically follow one of two patterns. Agreements for new models of vehicles normally cover the lifetime of the platform, often awarded two to five years before these models are marketed to the public. Agreements covering design improvements to existing automobiles have shorter expected life cycles, typically with shorter pre-production and development periods. Typically, once a supplier has been designated to supply components for a new platform, an OEM will continue to purchase those parts from the designated manufacturer for the life of the program. For any given agreement, our revenues depend in part upon the life cycle status of the applicable product platform. Overall, our revenues are enhanced to the extent that the products we are assembling and producing are in the peak production periods of their life cycles. |
| • | Product pricing. Generally, our customers negotiate annual price reductions with us during the term of their contracts. When negotiated price reductions are expected to be retroactive, we accrue for such amounts as a reduction of revenues as products are shipped. The extent of our price reductions negatively impacts our revenues. In unusual circumstances, we have been able to negotiate year-over-year price increases as well. |
| • | Steel pricing. We require significant quantities of steel in the manufacture of our products. Although changing steel prices affect our results, we seek to be neutral with respect to steel pricing over time, with the intention of neither making nor losing money as steel prices fluctuate. The pricing of our products includes a component for steel which increases as steel prices increase and decreases as steel prices decrease. For our North American customers and several of our other customers, we purchase steel through our customers’ resale programs, where our customers actually negotiate the cost of steel for us. In other cases, we procure steel directly from the mills, negotiating our own price and seeking to pass through steel price increases and decreases to our customers. |
44
Table of Contents
| • | Seasonality. Our business is seasonal. Our customers in Europe typically shut down vehicle production during portions of July or August and during one week in our fourth quarter. Our North American customers typically shut down vehicle production for approximately two weeks during July and for one week during December. Our results of operations, cash flows and liquidity in our third and fourth quarters may be impacted by these seasonal practices. |
| • | Foreign exchange. Our foreign exchange transaction risk is generally limited, primarily because we purchase and produce products in the same country where we sell to our final customer. However, the translation of foreign currencies back to the U.S. dollar may have a significant impact on our revenues, results of operations, cash flows, or equity / (deficit). Foreign exchange has an unfavorable impact on revenues when the U.S. dollar is relatively strong as compared with foreign currencies and a favorable impact on revenues when the U.S. dollar is relatively weak as compared with foreign currencies. The functional currency of our foreign operations is the local currency. Assets and liabilities of our foreign operations are translated into U.S. dollars using the applicable period-end rates of exchange. Results of operations are translated at applicable average rates prevailing throughout the period. Translation gains or losses are reported as a separate component of accumulated other comprehensive income in our consolidated statements of equity / (deficit). Gains and losses resulting from foreign currency transactions, the amounts of which were not material in any of the periods presented in this Annual Report, are included in net income / (loss). |
Factors Affecting Our Expenses
Our expenses are principally driven by the following factors:
| • | Cost of steel. We utilize steel and various purchased steel products in virtually all of our products. We refer to the “net steel impact” as the combination of the change in steel prices that are reflected in the price of our products, the change in the cost to procure steel from the mill, and the change in our recovery of scrap steel (which we refer to as offal). Our strategy is to be economically indifferent to steel pricing by having these factors offset each other. While we strive to achieve a neutral net steel impact, we are not always successful in achieving that goal, in large part due to timing. Depending upon when a steel price change occurs, that change may have a disproportionate effect, within any particular fiscal period, on our product pricing, our steel costs and the results of our sales of scrap steel. Imbalances in any one particular fiscal period may be reversed in a subsequent fiscal period, although we cannot provide assurances as to if or when these reversals will occur. |
| • | Purchase of steel. As noted above, we purchase a portion of our steel from our customers through our customers’ resale programs and a portion of our steel directly from the mills. Whether our customer negotiates the cost of steel for us in a customer resale program or we negotiate the cost of steel with the mills, the price we pay is charged directly to our cost of sales, just as the component of product pricing relating to steel is included within our revenues. |
| • | Sale of scrap steel. We typically sell offal in secondary markets which are influenced by similar market forces. We generally share our recoveries from sales of offal with our customers either through scrap sharing agreements, in cases where we are on resale programs, or in the product pricing that is negotiated regarding increases and decreases in the steel price in cases where we purchase steel directly from the mills. In either situation, we may be impacted by the fluctuation in scrap steel prices, either positive or negative, in relation to our various customer agreements. Since scrap steel prices generally increase and decrease as steel prices increase and decrease, our sale of offal may mitigate the severity of steel price increases and limit the benefits we achieve through steel price declines. Recoveries related to sales of offal reduce cost of sales. |
45
Table of Contents
| • | Other manufacturing expenses. Our cost of sales includes raw material costs, labor expenses and other expenses that we incur to operate our plants. In addition to steel, our cost of sales is directly impacted by: |
| • | the number of employees engaged in manufacturing and the wages and benefits that we pay to those employees; |
| • | depreciation; |
| • | energy expenses; |
| • | the costs we incur to purchase raw materials other than steel; |
| • | non-production materials; |
| • | shipping and handling expenses; and |
| • | lease expenses associated with our production facilities. |
| • | Selling, general and administrative expenses. Our selling, general and administrative, or SG&A, expenses include costs associated with our sales efforts; engineering; centralized finance, human resources, purchasing, and information technology services; and other administrative functions. In addition, we implemented compensation programs in connection with our IPO and notes offering that have resulted in compensation charges against earnings in 2010 and will continue to impact earnings in subsequent periods. See notes 14 and 18 to our consolidated financial statements. |
| • | Amortization expense. Our amortization expense consists of the charges we incur to amortize certain intangible assets. The intangible assets relate to key customer relationships in Europe and Brazil and land rights in China. Our intangible assets are amortized over their estimated useful lives as determined when the intangible asset is initially recorded. See note 3 to our consolidated financial statements. |
| • | Restructuring and related asset impairment charges. Our restructuring expenses are incurred when we establish reserves for particular restructuring actions and when we incur costs that are expensed as incurred related to particular restructuring actions. We have implemented several restructuring plans in recent years in order to realign our manufacturing capacity to meet global automotive production demands and to improve the utilization of our facilities. See note 4 to our consolidated financial statements. |
| • | Interest expense. Our interest expense relates to costs associated with our debt instruments and reflects both the amount of our indebtedness and the rates we are required to pay. Our primary debt instruments consist of our notes and our asset-based revolving credit facility. We also have debt at our foreign subsidiaries, consisting of borrowings in South Korea and Brazil and a factoring facility in Italy. Our interest expense is also affected by the amortization of our original issue discount and debt issuance costs. During the third quarter of 2010, we completed the issuance of $430 million aggregate principal amount of our 10.625% senior secured notes due 2017. During the fourth quarter, we completed the redemption of $26 million of the senior secured notes which resulted in accelerated interest expense of $1.2 million related to the amortization of the associated original issue discount and debt issue costs. We have announced plans to redeem an additional $17 million of the senior secured notes by the end of March 2011. See “Liquidity and Capital Resources – Debt.” |
| • | Provision for income taxes. We make estimates of the amounts to recognize for income taxes in each tax jurisdiction in which we operate. In addition, provisions are established for withholding taxes related to the transfer of cash between jurisdictions, uncertain tax positions taken, and any locations in which we are not permanently reinvested. In connection with the notes offering, Cerberus agreed to convert $25 million aggregate principal amount of indebtedness under the first lien term loan and, in exchange, received equity in Tower International, Inc. As a result, we experienced cancellation of indebtedness income of $12.9 million for tax purposes which was completely offset by net operating losses and therefore had no impact on our provision for income taxes. |
46
Table of Contents
| • | Efficiencies. Our ability to control our costs is directly linked to our ability to offset price reductions and other cost increases with reductions in operating costs through the implementation of various manufacturing, purchasing, administrative and other efficiencies. We seek to drive costs out of our operations through several ongoing initiatives, including the following: |
| • | Manufacturing efficiencies. We have achieved cost savings in our core manufacturing operations through several ongoing initiatives, including: |
| • | Implementation of Lean Six Sigma principles. Lean and Six Sigma are industry-recognized methodologies which our management utilizes to reduce waste, improve quality and improve our ability to respond to customer demand rates by focusing on reductions in manufacturing lead times. |
| • | Labor best practices standardization. We studied how other companies utilize their production related labor. As a result of that study, we developed benchmark labor standards for our production processes. We then applied those standards and processes consistently across our manufacturing facilities. |
| • | Real-time production reporting and throughput analysis. Many of our manufacturing facilities are equipped with production count systems that interface directly with our general ledger system. These reports enable us to reduce the costs we incur to manufacture our products. Real-time production reporting allows us to: |
| • | perform bottleneck management analysis, which allows us to analyze production bottlenecks and improve efficiency and cycle times; |
| • | complete shift-to-shift assessments, which help us to reduce the number of employees needed to meet production during any given shift; and |
| • | perform press changeover time analysis, which helps us to reduce the time in which equipment is not in production. |
| • | Purchasing efficiencies. We actively negotiate with our supply base to achieve year-over-year price reductions in the components and supplies that we purchase. |
| • | SG&A reductions. We have reduced the amount of our SG&A expense necessary to operate our business, excluding the one-time compensation programs described above related to the initial public offering and notes offering. We have centralized and continue to centralize several administrative functions which we previously performed on a decentralized basis, including purchasing, customer quoting and product costing, product engineering and accounting. In addition, we have instituted policies and procedures on discretionary spending to reduce our costs. |
Adjusted EBITDA
We use the term Adjusted EBITDA throughout this Annual Report. We define Adjusted EBITDA as net income / (loss) before interest, taxes, depreciation, amortization, restructuring items and other adjustments described in the reconciliations provided in this report. Adjusted EBITDA is not a measure of performance defined in accordance with U.S. GAAP (“GAAP”). We use Adjusted EBITDA as a supplement to our GAAP results in evaluating our business.
Adjusted EBITDA is included in this report because it is one of the principal factors upon which our management assesses performance. Our Chief Executive Officer measures the performance of our segments on the basis of Adjusted EBITDA. As an analytical tool, Adjusted EBITDA assists us in comparing our performance over various reporting periods on a consistent basis because it excludes items that we do not believe reflect our core operating performance.
47
Table of Contents
We believe that Adjusted EBITDA is useful in evaluating our performance because Adjusted EBITDA is a commonly used financial metric for measuring and comparing the operating performance of companies in our industry. We believe that the disclosure of Adjusted EBITDA offers an additional financial metric that, when coupled with the GAAP results and the reconciliation to GAAP results, provides a more complete understanding of our results of operations and the factors and trends affecting our business.
Adjusted EBITDA should not be considered as an alternative to net income / (loss) as an indicator of our performance, as an alternative to net cash provided by operating activities as a measure of liquidity, or as an alternative to any other measure prescribed by GAAP. There are limitations to using non-GAAP measures such as Adjusted EBITDA. Although we believe that Adjusted EBITDA may make an evaluation of our operating performance more consistent because it removes items that do not reflect our core operations, (i) other companies in our industry may define Adjusted EBITDA differently than we do and, as a result, it may not be comparable to similarly titled measures used by other companies in our industry; and (ii) Adjusted EBITDA excludes certain financial information that some may consider important in evaluating our performance.
We compensate for these limitations by providing disclosure of the differences between Adjusted EBITDA and GAAP results, including providing a reconciliation of Adjusted EBITDA to GAAP results, to enable investors to perform their own analysis of our operating results. For a reconciliation of consolidated Adjusted EBITDA to its most directly comparable GAAP measure, net income / (loss), see “Results of Operations” below.
Because of these limitations, Adjusted EBITDA should not be considered as a measure of the income generated by our business or discretionary cash available to us to invest in the growth of our business. Our management compensates for these limitations by analyzing both our GAAP results and Adjusted EBITDA.
Our Segments
Our management reviews our operating results and makes decisions based upon two reportable segments: the Americas and International, each of which has its own president and leadership team. For accounting purposes, we have identified four operating segments, which we have aggregated into two reportable segments. See note 16 to our consolidated financial statements. Through December 31, 2010, our businesses have had similar economic characteristics, including the nature of our products, our production processes and our customers.
Results of Operations—Year Ended December 31, 2010 Compared with the Year Ended December 31, 2009
Automobile production volumes increased during the year ended December 31, 2010 in all major markets compared to the year ended December 31, 2009. The following table presents production volumes in specified regions according to IHS Automotive® for the year ended December 31, 2010 compared to the year ended December 31, 2009 (in millions of units produced):
| Europe | Korea | China | North America |
Brazil | ||||||||||||||||
| 2010 production |
18.8 | 4.2 | 14.7 | 11.9 | 3.2 | |||||||||||||||
| 2009 production |
16.3 | 3.4 | 10.8 | 8.6 | 2.9 | |||||||||||||||
| Increase |
2.5 | 0.8 | 3.9 | 3.3 | 0.3 | |||||||||||||||
| Percentage change |
15 | % | 22 | % | 36 | % | 40 | % | 8 | % | ||||||||||
48
Table of Contents
The following table presents selected financial information for the years ended December 31, 2010 and 2009 (in millions). In the discussion that follows, all references to “2010” are to the year ended December 31, 2010 and all references to “2009” are to the year ended December 31, 2009.
| International | Americas | Consolidated | ||||||||||||||||||||||
| Year Ended December 31, |
Year Ended December 31, |
Year Ended December 31, |
||||||||||||||||||||||
| 2010 | 2009 | 2010 | 2009 | 2010 | 2009 | |||||||||||||||||||
| Revenues |
$ | 1,147.6 | $ | 990.5 | $ | 849.5 | $ | 643.9 | $ | 1,997.1 | $ | 1,634.4 | ||||||||||||
| Cost of sales |
1,012.6 | 889.9 | 773.9 | 646.9 | 1,786.5 | 1,536.8 | ||||||||||||||||||
| Gross profit / (loss) |
135.0 | 100.6 | 75.6 | (3.0 | ) | 210.6 | 97.6 | |||||||||||||||||
| Selling, general, and administrative expenses |
63.1 | 57.7 | 80.9 | 60.6 | 144.0 | 118.3 | ||||||||||||||||||
| Amortization |
2.4 | 2.0 | 0.9 | 0.8 | 3.3 | 2.8 | ||||||||||||||||||
| Restructuring and asset impairments |
3.3 | 12.6 | 11.0 | 0.8 | 14.3 | 13.4 | ||||||||||||||||||
| Operating income / (loss) |
$ | 66.2 | $ | 28.3 | $ | (17.2 | ) | $ | (65.2 | ) | 49.0 | (36.9 | ) | |||||||||||
| Interest expense, net |
65.9 | 56.9 | ||||||||||||||||||||||
| Other (income) / expense |
1.3 | (33.7 | ) | |||||||||||||||||||||
| Provision / (benefit) for income taxes |
10.3 | (1.1 | ) | |||||||||||||||||||||
| Noncontrolling interest, net of tax |
8.4 | 8.9 | ||||||||||||||||||||||
| Net loss attributable to Tower International, Inc. |
$ | (36.9 | ) | $ | (67.9 | ) | ||||||||||||||||||
Comparison of Periods—GAAP Analysis of Consolidated Results
Revenues
Total revenues increased during the year ended December 31, 2010 by $362.7 million or 22% from the year ended December 31, 2009, reflecting primarily higher volume in both our International segment ($211.1 million) and our Americas segment ($194.5 million). Revenues were also positively impacted by the strengthening of foreign currencies against the U.S. dollar in our Americas segment, primarily the Brazilian Real ($21.2 million) and in our International segment, primarily the Korean Won ($21.2 million); however, that positive impact was more than offset by the strengthening of the U.S. dollar against the Euro in our International segment ($42.8 million). Revenues were negatively impacted by unfavorable pricing and economics ($36.9 million), primarily related to product pricing and lower steel recoveries.
Gross Profit
When we analyze our total gross profit, we separately categorize external factors—volume, product mix and foreign exchange—and all other factors which impact gross profit, which we refer to as “other factors”. When we refer to “mix,” we are referring to the relative composition of revenues and profitability of the products we sell in any given period. When we refer to “pricing and economics,” we are referring to (i) the impact of adjustments in the pricing of particular products, which we refer to as product pricing; (ii) the impact of steel price changes, taking into account the component of our product pricing attributable to steel, the cost of steel included in our cost of sales and the amounts recovered on the sale of offal, which in total we refer to as the net steel impact; and (iii) the impact of inflation and changes in operating costs such as labor, utilities and fuel, which we refer to as economics.
Total gross profit increased by $113 million or 116% from the year ended December 31, 2009 to the year ended December 31, 2010, and our gross profit margin increased from 6% during 2009 to 10.5% in 2010, as partially explained by higher volume ($95.4 million) offset partially by unfavorable product mix ($3.8 million) and
49
Table of Contents
unfavorable foreign exchange ($2.9 million, excluding the impact on depreciation). All other factors were net favorable by $24.3 million. Cost of sales was reduced by manufacturing, purchasing, and other efficiencies ($47.7 million), a one-time provision in 2009 associated with a value added tax audit in Brazil ($4.7 million), and savings from restructuring actions undertaken in 2008 and 2009 ($3.6 million). These factors were offset partially by unfavorable pricing and economics ($42.2 million), which included the non-recurrence of a one-time adjustment to our workers’ compensation accrual in 2009 associated with our closed facilities in our Americas segment ($3 million). Gross profit was also adversely impacted by the non-recurrence of customer cost recoveries ($12.2 million), higher launch costs ($9 million), and the non-recurrence of recoveries of expenditures for customer-funded tooling ($3.1 million).
Total gross profit was positively impacted by a reduction in the depreciation included in cost of sales from $141.1 million during the year ended December 31, 2009 to $107.2 million during the year ended December 31, 2010. The reduction reflected primarily accelerated depreciation in 2009 related to certain restructuring actions taken in the Americas segment, the strengthening of the U.S. dollar against foreign currencies, and a portion of our fixed assets becoming fully depreciated in July 2009.
Selling, General, and Administrative Expenses (“SG&A”)
Total SG&A increased $25.7 million or 22% from the year ended December 31, 2009, reflecting higher bonus and higher salary costs relating in part to the hiring of additional engineering colleagues in support of new programs ($13.3 million) and acquisition costs related to the acquisition of a manufacturing plant in Artern, Germany during the first quarter of 2010 ($0.7 million). In addition, SG&A for the year ended December 31, 2010 includes a charge for compensation costs related to our Special Incentive Program ($6.7 million), restricted stock units granted under our 2010 Equity Incentive Plan ($2.9 million), and our Supplemental Value Creation Program ($1.5 million). These compensation expenses were incurred as a result of the consummation of the IPO and the notes offering (see notes 14 and 18 to the consolidated financial statements).
Amortization Expense
Total amortization expense increased $0.5 million or 18% from the year ended December 31, 2009, reflecting primarily the amortization of the intangible asset recorded for the Artern facility at the end of the first quarter. Our amortization expense consists of the charges we incur to amortize certain intangible assets.
Restructuring and Asset Impairment Expense
Total restructuring and asset impairment expense increased $0.9 million or 7% from the year ended December 31, 2009. During 2010, we incurred charges of $14.3 million reflecting primarily an impairment charge taken on our non-automotive business of $7.3 million, an impairment charge taken of $2.7 million on our press shop in Bergisch Gladbach, Germany as we put it up for sale, and $2.3 million related to the sale of a closed facility. The charge taken on our non-automotive business relates to the equipment specifically purchased for use with our SES agreement, less any salvage value. See Item 1 of this Annual Report, “Business – Our Strategies.” During 2009, we incurred a $13.4 million charge reflecting primarily the closure of our press shop in Bergisch Gladbach, Germany ($10.2 million) and $4 million related to the 2008 closure of our facility in Traverse City, Michigan. The 2009 charges were offset partially by $6.9 million of restructuring income related to the cancellation of an old customer program relating to our closed facility in Milwaukee, Wisconsin. The remaining charges in 2010 and 2009 related to the ongoing maintenance of closed facilities and other small restructuring actions taken.
Interest Expense, net
Interest expense, net, increased $9 million or 16% from the year ended December 31, 2009 reflecting primarily the acceleration of the amortization of our debt issue costs associated with the first lien term loan ($5.3 million)
50
Table of Contents
and the higher interest expense associated with our senior secured notes ($3.4 million). During the third quarter of 2010, we issued $430 million of senior secured notes with an original issue discount of $12.8 million and subsequently retired our first lien term loan. The weighted average annual interest rate of the first lien term loan was approximately 8% during 2009 and 2010 when taking into account our interest rate swaps compared with the senior secured notes that bear an annual interest rate of 10.625%. On December 17, 2010, we redeemed $26 million of the senior secured notes from a portion of the net proceeds of our initial public offering. We have announced plans to redeem an additional $17 million of such notes during the first quarter of 2011 (see note 21 to our consolidated financial statements).
Provision / (Benefit) for Income Taxes
Income tax expense increased $11.4 million from the year ended December 31, 2009. Income tax expense increased $12.3 million reflecting primarily increased foreign income taxes, relating to increased earnings in our international segment, offset partially by reduced withholding and state income taxes. During 2010, we also reversed $7.8 million (net of uncertain tax benefits) of our valuation allowance in South Korea which resulted in a tax benefit. This valuation allowance was reversed because the profitability of our South Korean operations has improved during the past two years and the expected production volumes in South Korea are remaining at or above levels experienced during 2008. In addition, income tax expense of $2 million was recognized in operations, relating to the reversal of interest rate swaps reported in accumulated other comprehensive income (AOCI), compared to a benefit of $4.9 million for 2009.
The change in income tax expense varies during each period depending on the level and mix of income and losses generated in the various jurisdictions in which we do business. Our effective tax rate differs from our statutory rate primarily due to valuation allowances recorded against tax benefits on losses incurred in certain countries, including the U.S. where we have recorded the valuation allowances due to the uncertainty of the future realization of the tax benefits associated with the losses.
Noncontrolling Interest, Net of Tax
The adjustment to our earnings required to give effect to the elimination of noncontrolling interests decreased $0.5 million or 6% from the year ended December 31, 2009, reflecting decreased earnings in our Chinese joint ventures during 2010.
51
Table of Contents
Comparison of Periods—Non-GAAP Analysis of Adjusted EBITDA
A reconciliation of Adjusted EBITDA to net loss attributable to Tower International, Inc. for the periods presented is set forth below (in millions):
| International | Americas | Consolidated | ||||||||||||||||||||||
| Year Ended December 31, |
Year Ended December 31, |
Year Ended December 31, |
||||||||||||||||||||||
| 2010 | 2009 | 2010 | 2009 | 2010 | 2009 | |||||||||||||||||||
| Adjusted EBITDA |
$ | 125.5 | $ | 108.7 | $ | 64.7 | $ | 16.3 | $ | 190.2 | $ | 125.0 | ||||||||||||
| Intercompany charges |
7.0 | 8.0 | (7.0 | ) | (8.0 | ) | — | — | ||||||||||||||||
| Restructuring and asset impairments (a) |
(3.3 | ) | (12.6 | ) | (11.0 | ) | (0.8 | ) | (14.3 | ) | (13.4 | ) | ||||||||||||
| Depreciation and amortization |
(61.3 | ) | (75.1 | ) | (53.4 | ) | (72.6 | ) | (114.7 | ) | (147.7 | ) | ||||||||||||
| Receivable factoring charges and other (b) |
(0.3 | ) | (0.7 | ) | (0.1 | ) | (0.1 | ) | (0.4 | ) | (0.8 | ) | ||||||||||||
| Acquisition costs (c) |
(0.7 | ) | — | — | — | (0.7 | ) | — | ||||||||||||||||
| Incentive compensation related to funding events (d) |
(0.7 | ) | — | (10.4 | ) | — | (11.1 | ) | — | |||||||||||||||
| Operating income / (loss) |
$ | 66.2 | $ | 28.3 | $ | (17.2 | ) | $ | (65.2 | ) | 49.0 | (36.9 | ) | |||||||||||
| Interest expense, net |
(65.9 | ) | (56.9 | ) | ||||||||||||||||||||
| Other income / (expense) (e) |
(1.3 | ) | 33.7 | |||||||||||||||||||||
| (Provision) / benefit for income taxes |
(10.3 | ) | 1.1 | |||||||||||||||||||||
| Noncontrolling interest, net of tax (f) |
(8.4 | ) | (8.9 | ) | ||||||||||||||||||||
| Net loss attributable to Tower International, Inc. |
$ | (36.9 | ) | $ | (67.9 | ) | ||||||||||||||||||
| (a) | Represents asset impairments and costs associated with facilities closures or permanent layoffs, including (i) closure and other exit costs and (ii) termination and severance payments. |
| (b) | Represents the discounts taken by our customers when making payments on our accounts receivable before the normal payment terms would require payment. We have excluded these amounts from Adjusted EBITDA because they represent a form of finance charge and finance charges have otherwise been excluded in calculating Adjusted EBITDA. |
| (c) | Represents one-time costs related to the acquisition of a facility in Artern, Germany during 2010. |
| (d) | Represents the one-time compensation programs triggered by the closing of the notes offering and the closing of the initial public offering in 2010. |
| (e) | In 2010, represents the premium paid in connection with the redemption of $26 million of our senior secured notes during the fourth quarter of 2010. In 2009, represents the gains associated with a reduction in our synthetic letter of credit facility and then a repurchase and retirement of a portion of our first lien term loan in 2009. |
| (f) | Represents the net income attributable to non-controlling partners in entities that we consolidate in our financial results, given the controlling nature of our interests in these entities. |
52
Table of Contents
The following table presents revenues (a GAAP measure) and Adjusted EBITDA (a non-GAAP measure) for the years ended December 31, 2010 and 2009 (in millions) as well as an explanation of variances:
| International | Americas | Consolidated | ||||||||||||||||||||||
| Revenues | Adjusted EBITDA(g) |
Revenues | Adjusted EBITDA(g) |
Revenues | Adjusted EBITDA(g) |
|||||||||||||||||||
| 2010 results |
$ | 1,147.6 | $ | 125.5 | $ | 849.5 | $ | 64.7 | $ | 1,997.1 | $ | 190.2 | ||||||||||||
| 2009 results |
990.5 | 108.7 | 643.9 | 16.3 | 1,634.4 | 125.0 | ||||||||||||||||||
| Variance |
$ | 157.1 | $ | 16.8 | $ | 205.6 | $ | 48.4 | $ | 362.7 | $ | 65.2 | ||||||||||||
| Variance attributable to: |
||||||||||||||||||||||||
| Volume and mix |
$ | 211.1 | $ | 35.9 | $ | 194.5 | $ | 55.7 | $ | 405.6 | $ | 91.6 | ||||||||||||
| Foreign exchange |
(21.6 | ) | (4.1 | ) | 21.2 | 1.0 | (0.4 | ) | (3.1 | ) | ||||||||||||||
| Pricing and economics |
(31.9 | ) | (34.0 | ) | (5.0 | ) | (20.8 | ) | (36.9 | ) | (54.8 | ) | ||||||||||||
| Manufacturing and purchasing efficiencies |
— | 24.6 | — | 31.2 | — | 55.8 | ||||||||||||||||||
| Selling, general and administrative expenses and other items (h) |
(0.5 | ) | (5.6 | ) | (5.1 | ) | (18.7 | ) | (5.6 | ) | (24.3 | ) | ||||||||||||
| Total |
$ | 157.1 | $ | 16.8 | $ | 205.6 | $ | 48.4 | $ | 362.7 | $ | 65.2 | ||||||||||||
| (g) | We have presented a reconciliation of Adjusted EBITDA to net loss attributable to Tower International, Inc. above. |
| (h) | When we refer to “selling, general and administrative expenses (“SG&A”) and other items”, the “other items” refer to (i) savings which we generate after implementing restructuring actions, (ii) the costs associated with launching new products, (iii) one-time items which may include reimbursement of costs, and (iv) other efficiencies. |
Adjusted EBITDA
Consolidated Company: Consolidated Adjusted EBITDA improved by $65.2 million or 52% from the year ended December 31, 2009, as explained by higher volume ($95.4 million) offset partially by unfavorable product mix ($3.8 million) and unfavorable foreign exchange ($3.1 million). All other factors were net unfavorable by $23.3 million; manufacturing and purchasing efficiencies ($55.8 million) were more than offset by unfavorable pricing and economics ($54.8 million) and unfavorable SG&A expenses and other items ($24.3 million).
International Segment: In our International segment, Adjusted EBITDA improved by $16.8 million or 15% from the year ended December 31, 2009, reflecting higher volumes ($47.3 million) offset partially by unfavorable product mix ($11.4 million) and unfavorable foreign exchange ($4.1 million). All other factors were net unfavorable by $15 million. Unfavorable pricing and economics ($34 million), principally product pricing and labor costs, were offset partially by manufacturing and purchasing efficiencies ($24.6 million). In addition, SG&A and other items contributed unfavorably during the year ended December 31, 2010 ($5.6 million) resulting from the non-recurrence of customer cost recoveries ($3.9 million), higher launch costs ($2.9 million), and increased personnel costs, primarily engineering ($2.5 million), offset partially by savings from restructuring actions undertaken in 2009 ($1.9 million).
Americas Segment: In our Americas segment, Adjusted EBITDA improved by $48.4 million or 297% from the year ended December 31, 2009, reflecting primarily higher volumes ($48.1 million), favorable product mix ($7.6 million), and favorable foreign exchange ($1 million). All other factors were net unfavorable by $8.3 million. Manufacturing and purchasing efficiencies ($31.2 million) were offset partially by unfavorable pricing and economics ($20.8 million), principally product pricing and labor costs including higher bonus and salary
53
Table of Contents
costs and the non-recurrence of a one-time adjustment to our workers’ compensation accrual in 2009 associated with our closed facilities ($3 million), and higher SG&A expenses and other items ($18.7 million). The adverse impact from SG&A spending and other items resulted from the non-recurrence of customer cost recoveries ($8.3 million), higher launch costs ($6.1 million), increased personnel costs, primarily engineering ($3.4 million), the non-recurrence of recoveries of expenditures for customer-funded tooling ($3.1 million), and increased costs related to becoming a public company ($2 million), all of which were offset partially by the non-recurrence of a one-time provision in 2009 associated with a value added tax audit in Brazil ($4.7 million) and savings from restructuring actions undertaken in 2008 and 2009 ($1.7 million).
Results of Operations—Year Ended December 31, 2009 Compared with the Year Ended December 31, 2008
Due to the downturn in the global economy, automobile production volumes decreased significantly during 2009 in all major markets except China and Brazil. The following table presents production volumes in specified regions according to IHS Automotive® for 2009 compared to 2008 (in millions of units produced).
| Europe | Korea | China | North America |
Brazil | ||||||||||||||||
| 2009 production |
16.3 | 3.4 | 10.8 | 8.6 | 2.9 | |||||||||||||||
| 2008 production |
20.5 | 3.7 | 7.3 | 12.6 | 2.9 | |||||||||||||||
| Increase / (decrease) |
(4.2 | ) | (0.3 | ) | 3.5 | (4.0 | ) | — | ||||||||||||
| Percentage change |
(20 | )% | (8 | )% | 48 | % | (32 | )% | 2 | % | ||||||||||
The following table presents selected financial information for the years ended December 31, 2009 and 2008 (in millions). In the discussion that follows, all references to “2009” are to the year ended December 31, 2009 and all references to “2008” are to the year ended December 31, 2008.
| International | Americas | Consolidated | ||||||||||||||||||||||
| Year Ended December 31, |
Year Ended December 31, |
Year Ended December 31, |
||||||||||||||||||||||
| 2009 | 2008 | 2009 | 2008 | 2009 | 2008 | |||||||||||||||||||
| Revenues |
$ | 990.5 | $ | 1,251.4 | $ | 643.9 | $ | 920.3 | $ | 1,634.4 | $ | 2,171.7 | ||||||||||||
| Cost of sales |
889.9 | 1,104.5 | 646.9 | 886.8 | 1,536.8 | 1,991.3 | ||||||||||||||||||
| Gross profit / (loss) |
100.6 | 146.9 | (3.0 | ) | 33.5 | 97.6 | 180.4 | |||||||||||||||||
| Selling, general and administrative expenses |
57.7 | 63.3 | 60.6 | 75.3 | 118.3 | 138.6 | ||||||||||||||||||
| Amortization |
2.0 | 2.2 | 0.8 | 0.8 | 2.8 | 3.0 | ||||||||||||||||||
| Restructuring and asset impairments |
12.6 | 1.4 | 0.8 | 3.4 | 13.4 | 4.8 | ||||||||||||||||||
| Operating income / (loss) |
$ | 28.3 | $ | 80.0 | $ | (65.2 | ) | $ | (46.0 | ) | (36.9 | ) | 34.0 | |||||||||||
| Interest expense, net |
56.9 | 60.2 | ||||||||||||||||||||||
| Other (income) / loss, net |
(33.7 | ) | — | |||||||||||||||||||||
| Provision / (benefit) for income taxes |
(1.1 | ) | 19.5 | |||||||||||||||||||||
| Noncontrolling interest, net of tax |
8.9 | 6.6 | ||||||||||||||||||||||
| Net loss attributable to Tower Automotive, LLC |
$ | (67.9 | ) | $ | (52.3 | ) | ||||||||||||||||||
54
Table of Contents
Comparison of Periods—GAAP Analysis of Consolidated Results
Revenues
Total revenues declined in 2009 by $537.3 million or 25% from 2008, reflecting primarily lower volume in both our Americas segment ($262 million) and our International segment ($167.1 million) and the effect of the strengthened U.S. dollar against foreign currencies in our International segment, primarily the Euro and Korean Won ($96.6 million), and against foreign currencies in our Americas segment, primarily the Brazilian Real ($19.8 million).
Gross Profit
Total gross profit declined in 2009 by $82.8 million or 46% from 2008 and gross profit margin decreased from 8.3% in 2008 to 6% in 2009, as explained by lower volume ($103.2 million), unfavorable product mix ($43.8 million), and unfavorable foreign exchange primarily in the International segment ($17.3 million, excluding the impact on depreciation). All other factors were net favorable by $81.5 million—cost of sales was reduced primarily by manufacturing, purchasing and other efficiencies ($90 million) that more than offset unfavorable pricing and economics ($35.5 million). The unfavorable pricing and economics was attributable principally to product pricing and net steel impact ($46.7 million), offset partially by reductions in our workers’ compensation and healthcare costs ($11.2 million) associated with reductions in our workforce and improvements in our plant safety record in the Americas segment. Gross profit was positively impacted by the achievement of savings in 2009 from restructuring actions undertaken in 2008 and 2009 ($10.2 million) and was negatively impacted by a one-time provision associated with a value-added tax audit in Brazil ($4.7 million).
Total gross profit was also positively impacted by a reduction in the depreciation included in cost of goods sold from $164.1 million in 2008 to $141.1 million in 2009. The reduction reflected primarily a portion of our fixed assets becoming fully depreciated in July 2009 as a result of having been assigned estimated lives of two years at the time of our acquisition in 2007, as well as the strengthening of the U.S. dollar against foreign currencies, primarily in the International segment, offset partially by accelerated depreciation in 2009 related to certain restructuring actions taken in the Americas segment.
Selling, General and Administrative Expenses
Total SG&A decreased $20.3 million or 15% from 2008, reflecting a reduction in personnel and related expenses associated with the decline in production and a reduction in other spending undertaken to control costs ($17.1 million) primarily in the Americas segment and the strengthening of the U.S. dollar against foreign currencies resulting in less SG&A costs ($4.8 million, excluding the impact of depreciation) primarily in the International segment.
Amortization Expense
Total amortization expense decreased by $0.2 million due to the strengthening of the U.S. dollar against foreign currencies.
Restructuring and Asset Impairment Expense
Total restructuring increased by $8.6 million or 179% from 2008 due to higher restructuring charges incurred in 2009, related primarily to the closure of our press shop in Bergisch Gladbach, Germany.
Interest Expense, net
Interest expense, net, decreased in 2009 by $3.3 million or 5% as compared to 2008, related primarily to declining debt balances in the Americas segment due to a debt repurchase in the second quarter and declining rates on the portion of our first lien term loan not covered by an interest rate swap.
55
Table of Contents
Other Income
During 2009, we amended certain terms of our revolving credit facility, first lien term loan agreement and letter of credit facility. As part of the amendments, we reduced our $200 million revolving credit facility to $150 million, reduced our letter of credit facility from $60 million to $27.5 million and repurchased $32.9 million of the U.S. tranche of our first lien term loan. In connection with these transactions, we recognized gains of $33.7 million which we recognized as other income.
Provision (Benefit) for Income Taxes
Income tax expense declined $20.6 million or 106% in 2009 from 2008 reflecting primarily the substantial decrease in overall income, a tax benefit from gain recognition in other comprehensive income and a shift in the mix of income among jurisdictions.
Noncontrolling Interest, Net of Tax
The adjustment to our earnings required to give effect to the elimination of minority interests increased by $2.3 million in 2009 from 2008 reflecting increased earnings in our Chinese joint ventures.
Comparison of Periods—Non-GAAP Analysis of Adjusted EBITDA
A reconciliation of Adjusted EBITDA to net loss attributable to Tower Automotive, LLC for the periods presented is set forth below (in millions):
| International | Americas | Consolidated | ||||||||||||||||||||||
| Year Ended December 31, |
Year Ended December 31, |
Year Ended December 31, |
||||||||||||||||||||||
| 2009 | 2008 | 2009 | 2008 | 2009 | 2008 | |||||||||||||||||||
| Adjusted EBITDA |
$ | 108.7 | $ | 163.9 | $ | 16.3 | $ | 49.0 | $ | 125.0 | $ | 212.9 | ||||||||||||
| Intercompany charges |
8.0 | 3.0 | (8.0 | ) | (3.0 | ) | — | — | ||||||||||||||||
| Restructuring |
(12.6 | ) | (1.4 | ) | (0.8 | ) | (3.4 | ) | (13.4 | ) | (4.8 | ) | ||||||||||||
| Depreciation and amortization |
(75.1 | ) | (82.4 | ) | (72.6 | ) | (87.9 | ) | (147.7 | ) | (170.3 | ) | ||||||||||||
| Receivable factoring charges |
(0.7 | ) | — | (0.1 | ) | (0.7 | ) | (0.8 | ) | (0.7 | ) | |||||||||||||
| Other adjustments |
— | (3.1 | ) | — | — | — | (3.1 | ) | ||||||||||||||||
| Operating income / (loss) |
$ | 28.3 | $ | 80.0 | $ | (65.2 | ) | $ | (46.0 | ) | (36.9 | ) | 34.0 | |||||||||||
| Interest expense, net |
(56.9 | ) | (60.2 | ) | ||||||||||||||||||||
| Other income |
33.7 | — | ||||||||||||||||||||||
| (Provision) / benefit for income taxes |
1.1 | (19.5 | ) | |||||||||||||||||||||
| Noncontrolling interest, net of tax |
(8.9 | ) | (6.6 | ) | ||||||||||||||||||||
| Net loss attributable to Tower Automotive, LLC |
$ | (67.9 | ) | $ | (52.3 | ) | ||||||||||||||||||
See table reconciling Adjusted EBITDA to net loss attributable to Tower International, Inc. for 2010 compared with 2009.
56
Table of Contents
The following table presents revenues (a GAAP measure) and Adjusted EBITDA (a non-GAAP measure) for the years ended December 31, 2009 and 2008 (in millions) as well as an explanation of variances:
| International | Americas | Consolidated | ||||||||||||||||||||||
| Revenues | Adjusted EBITDA(a) |
Revenues | Adjusted EBITDA(a) |
Revenues | Adjusted EBITDA(a) |
|||||||||||||||||||
| 2009 results |
$ | 990.5 | $ | 108.7 | $ | 643.9 | $ | 16.3 | $ | 1,634.4 | $ | 125.0 | ||||||||||||
| 2008 results |
1,251.4 | 163.9 | 920.3 | 49.0 | 2,171.7 | 212.9 | ||||||||||||||||||
| Variance |
$ | (260.9 | ) | $ | (55.2 | ) | $ | (276.4 | ) | $ | (32.7 | ) | $ | (537.3 | ) | $ | (87.9 | ) | ||||||
| Variance attributable to: |
|
|||||||||||||||||||||||
| Volume and mix |
$ | (167.1 | ) | $ | (60.4 | ) | $ | (262.0 | ) | $ | (86.6 | ) | $ | (429.1 | ) | $ | (147.0 | ) | ||||||
| Foreign exchange |
(96.6 | ) | (12.3 | ) | (19.8 | ) | (0.2 | ) | (116.4 | ) | (12.5 | ) | ||||||||||||
| Pricing and economics |
3.3 | (23.8 | ) | 4.3 | (10.6 | ) | 7.6 | (34.4 | ) | |||||||||||||||
| Manufacturing and purchasing efficiencies |
— | 39.7 | — | 48.6 | — | 88.3 | ||||||||||||||||||
| Selling, general and administrative expenses and other items |
(0.5 | ) | 1.6 | 1.1 | 16.1 | 0.6 | 17.7 | |||||||||||||||||
| Total |
$ | (260.9 | ) | $ | (55.2 | ) | $ | (276.4 | ) | $ | (32.7 | ) | $ | (537.3 | ) | $ | (87.9 | ) | ||||||
| (a) | We have presented a reconciliation of Adjusted EBITDA to net loss attributable to Tower International, Inc. above. |
Adjusted EBITDA
Total Company: Total Adjusted EBITDA declined in 2009 by $87.9 million or 41% from 2008, as explained by lower volume ($103.2 million), unfavorable product mix ($43.8 million) and unfavorable foreign exchange ($12.5 million). All other factors were net favorable by $71.6 million; manufacturing and purchasing efficiencies ($88.3 million) and a decrease in SG&A and other items ($17.7 million) more than offset unfavorable pricing and economics ($34.4 million).
The favorable impact of manufacturing and purchasing efficiencies more than offset general cost increases. We were able to achieve this gain in 2009 because of the continued implementation of our competitive cost structure initiatives.
International Segment: In our International segment, Adjusted EBITDA declined by $55.2 million or 34% from 2008, reflecting lower volumes ($37.4 million), unfavorable product mix ($23 million) and unfavorable foreign exchange ($12.3 million). All other factors were net favorable by $17.5 million; unfavorable pricing and economics ($23.8 million), principally product pricing and labor costs, were more than offset by operational efficiencies ($39.7 million). In addition, SG&A and other items contributed favorably in 2009, primarily because restructuring savings were achieved in 2009 from restructuring actions undertaken in 2008 and 2009 ($5.2 million), offset partially by higher launch costs in Europe.
Americas Segment: In our Americas segment, Adjusted EBITDA declined by $32.7 million or 67% from 2008, reflecting primarily lower volumes ($65.8 million) and unfavorable product mix ($20.8 million). Foreign exchange had a negligible impact. All other factors were net favorable by $54.1 million, due principally to operational efficiencies ($48.6 million) and reduced SG&A expenses and other items ($16.1 million). The positive impact from SG&A spending and other items resulted from a reduction in personnel and related
57
Table of Contents
expenses and a reduction in other spending undertaken to control costs ($17.1 million) and savings from restructuring actions undertaken in 2008 and 2009 ($5 million). These other factors were offset partially by unfavorable pricing and economics ($10.6 million) and a one-time provision associated with a value added tax audit in Brazil ($4.7 million). The unfavorable pricing and economics reflects principally unfavorable product pricing and net steel impact ($21.8 million), offset partially by reductions in our workers’ compensation and healthcare costs ($11.2 million) associated with reductions in our workforce and improvements in our plant safety record. Our net steel impact was adversely impacted by lower offal recoveries in 2009.
Restructuring and Asset Impairments
The following table sets forth our net restructuring and asset impairment expense by type for the periods presented (in millions):
| Year Ended December 31, | ||||||||||||
| 2010 | 2009 | 2008 | ||||||||||
| Employee termination costs |
$ | 0.6 | $ | 12.9 | $ | 9.7 | ||||||
| Other exit costs |
3.7 | 5.6 | 4.2 | |||||||||
| Asset impairments |
10.0 | 1.8 | — | |||||||||
| Restructuring income |
— | (6.9 | ) | (9.1 | ) | |||||||
| Total |
$ | 14.3 | $ | 13.4 | $ | 4.8 | ||||||
We restructure our global operations in an effort to align our capacity with demand and to reduce our costs. Restructuring costs include employee termination benefits and other incremental costs resulting from restructuring activities. These incremental costs principally include equipment and personnel relocation costs. Restructuring costs are recognized in our consolidated financial statements in accordance with FASB ASC No. 420, “Exit or Disposal Obligations,” and appear in our statement of operations under a line item entitled “restructuring and related asset impairment charges, net.” We believe the restructuring actions discussed below will help our efficiency and results of operations on a going forward basis.
In December 2010, we recorded an impairment charge of $7.3 million on our non-automotive business and recorded a charge of $2.3 million related to the sale of a closed facility. The charge taken on our non-automotive business related to the equipment specifically purchased for use with our SES agreement, less any salvage value. See Item 1 of this Annual Report, “Business – Our Strategy.” In March 2010, we recorded an impairment charge of $2.7 million on our Bergisch Gladbach, Germany facility which was closed in 2009. This charge was recorded to align the book value to fair value less costs to sell when the facility was classified as held for sale.
In July 2009, we announced that we had ceased production at our press shop in Bergisch Gladbach, Germany. This closure impacted 57 employees. Total costs of the closure of this facility were $10.2 million, which was comprised of $9.1 million of employee costs and $1.1 million of other exit costs. We recorded the entire charge of $10.2 million in 2009. In connection with our prior restructuring actions and current activities other than our Bergisch press shop and Traverse City closure, we recorded restructuring charges of approximately $6.1 million during 2009.
In September 2008, we announced the closure of our Traverse City, Michigan facility (the facility has ceased production, although some operations remain). Charges of $4 million and $4.5 million were recognized during the years ended December 31, 2009 and 2008, respectively. The charges incurred during 2009 were comprised of $0.1 million of severance costs, $1.8 million for an additional impairment charge on the Traverse City facility and $2.1 million of other exit costs. The charges incurred during 2008 were comprised of $4.4 million of severance costs and $0.1 million of other exit costs.
58
Table of Contents
The additional charges incurred in 2010, 2009, and 2008 related to other severance costs and ongoing maintenance of facilities closed as a result of prior actions. We expect to continue to incur additional restructuring expense in 2011 primarily related to previously announced restructuring actions. We do not anticipate that any additional expense will be significant with respect to previously announced actions. We had no restructuring income during the year ended December 31, 2010 and we had restructuring income of $6.9 million and $9.1 million, respectively, during the years ended December 31, 2009 and 2008. The restructuring income was related to the cancellation of an old customer program relating to our closed facility in Milwaukee, Wisconsin. This income was recorded in the Americas segment. As of December 31, 2009, all recoveries had been received.
Liquidity and Capital Resources
General
We generally expect to fund expenditures for operations, administrative expenses, capital expenditures and debt service obligations with internally generated funds from operations, and satisfy working capital needs from time-to-time with borrowings under our revolving credit facility or use of cash on hand. We believe that we will be able to meet our debt service obligations and fund our short-term and long-term operating requirements for at least the next twelve months with cash flow from operations, cash on hand, and borrowings under our revolving credit facility, although no assurance can be given in this regard.
Cash Flows and Working Capital
The following table shows the components of our cash flows for the periods presented (in millions):
| Year Ended December 31, | ||||||||||||
| 2010 | 2009 | 2008 | ||||||||||
| Net cash provided by / (used in): |
||||||||||||
| Operating activities |
$ | 120.4 | $ | 48.9 | $ | 200.6 | ||||||
| Investing activities |
(117.2 | ) | (86.0 | ) | (126.8 | ) | ||||||
| Financing activities |
(0.2 | ) | 50.8 | (32.3 | ) | |||||||
Net Cash Provided by Operating Activities
During the year ended December 31, 2010, we generated $120.4 million of cash flow from operations compared with $48.9 million during the year ended December 31, 2009. The primary reason for this increase resulted from higher volumes during 2010 which increased our revenues and profitability. During 2010, we generated $40.6 million of cash through working capital items, reflecting primarily favorable timing of customer funded tooling payments and receipts of $21.1 million.
During 2009, we generated $48.9 million of cash flow from operations compared with $200.6 million in 2008. The primary reason for this reduction resulted from lower volumes related to the global economic downturn that substantially reduced our revenues and profitability. Although our operating cash flows were substantially decreased, we were nevertheless able to generate $7.2 million of cash from working capital items, reflecting our efforts to reduce the amount of working capital needed in our business. During 2008, we were able to generate a $87.3 million benefit from working capital items, reflecting primarily our efforts to match the payment terms on which we paid our suppliers with the payment terms on which our customers paid us. This reversed a trend that the Predecessor Company experienced during its bankruptcy proceedings, when suppliers were demanding shorter payment terms.
59
Table of Contents
Net Cash Used in Investing Activities
Net cash utilized in investing activities was $117.2 million during 2010 compared to net cash utilized of $86 million during 2009. The $31.2 million increase in cash used reflects primarily our acquisition of a manufacturing plant in Artern, Germany and spending of $13 million related to our non-automotive business.
Net cash utilized in investing activities was $86 million during 2009 compared to net cash utilized of $126.8 million during 2008. The $40.8 million decrease in cash used in investing activities for 2009 reflects our using $30.6 million of cash in 2008 to buy-out equipment leases, which resulted in operating improvements. In addition, we used cash to pay the consideration in connection with the 2007 acquisition.
Net Cash Provided by Financing Activities
Net cash utilized by financing activities was $0.2 million during 2010 compared to net cash provided of $50.8 million during 2009. The $51 million change was primarily attributable to increased borrowings in 2009 due to the downturn in the global economy to help fund our operations, as compared with the repayment of borrowings in 2010 funded primarily from the increased generation of cash from operations, the issuance of the senior secured notes in August 2010, and the net proceeds received from our IPO. These factors were offset partially by the retirement of the first lien term loan in August 2010 and the financing costs incurred to complete the transactions.
Net cash provided by financing activities was $50.8 million during 2009 compared to net cash utilized of $32.3 million during 2008. The $83.1 million change was attributable primarily to increased borrowings in 2009 to offset some of the negative cash impact resulting from the significant downturn in the global economy. In contrast, during 2008 we used $27.9 million to repay in full our second lien term loan.
Working Capital
We manage our working capital by monitoring key metrics principally associated with inventory, accounts receivable and accounts payable. We have implemented various inventory control processes which have allowed us to maintain our inventory days on hand; however, our inventory levels increased from $62.6 million at December 31, 2009 to $73.2 million at December 31, 2010, reflecting primarily the substantial increase in volume experienced during 2010. We have continued efforts to match terms on which we pay our suppliers with the payment terms we receive from our customers in an effort to remain cash flow neutral with respect to our trade payables and receivables.
On December 31, 2010 and 2009, we had working capital balances of $(10.3) million and $(29.8) million. We negotiate our payment terms to our vendors to either match or exceed the payment terms that we receive from our customers on our accounts receivable and our pre-paid tooling. In addition, we actively manage our inventory balances to minimize the inventory on hand which is facilitated by our customers’ just-in-time manufacturing process. We also have a substantial portion of our foreign subsidiary debt subject to annual renewal. Historically, we have been successful in renewing this debt as it becomes due. During 2010, we were successful in renewing $22.3 million of our foreign subsidiary debt, changing the terms from annual renewal to an extended term, which increased working capital. As of December 31, 2010, we had available liquidity of $285.4 million, which we believe is adequate to fund our working capital requirements for at least the next 12 months.
Our working capital usage is seasonal in nature. During the first half of the year, production and sales typically increase substantially, which causes our working capital to increase because our accounts receivable and inventory increase. In the second half of the year, production and sales typically decline as a result of scheduled customer shutdowns, which results in lower sales. The lower production and sales generally results in a reduction of accounts receivables and inventory which decreases our working capital.
60
Table of Contents
Our accounts receivable balance increased from $290.1 million as of December 31, 2009 to $297.1 million as of December 31, 2010. The increase in our accounts receivable balance reflects increased revenues during the last quarter of 2010 as compared with the last quarter of 2009. Our revenues for the fourth quarter of 2010 were $541.6 million, which represented an increase of $40.6 million over our revenues during the fourth quarter of 2009. A substantial portion of this increase occurred during the last two months of the quarter. Our November and December 2010 revenues were $356.5 million as compared with $327 million during November and December 2009.
Sources and Uses of Liquidity
Our available liquidity at December 31, 2010 was $285.4 million, and consisted of $150.3 million of cash on hand and unutilized borrowing availability of $105.8 million and $29.3 million, respectively, under our U.S. and foreign credit facilities. As of December 31, 2009 and 2008, we had available liquidity in the amount of $238.1 million and $236 million, respectively.
As of December 31, 2010, we had current maturities of long term debt of $106.9 million, of which $63.5 million related to debt in South Korea, $23.9 million related to receivable factoring in Europe, and $19.5 million related to debt in Brazil. The majority of our South Korean debt and all of our Brazilian debt is subject to annual renewal. Historically, we have been successful in renewing this debt on an annual basis, but we cannot assure you that this debt will continue to be renewed or, if renewed, that this debt will continue to be renewed under the same terms. The receivable factoring in Europe consists of uncommitted, demand facilities which are subject to termination at the discretion of the banks, although we have not experienced any terminations by the banks at any time since the 2007 acquisition. We believe that we will be able to continue to renew the majority of our South Korean and Brazilian debt and to continue the receivable factoring in Europe.
During the fourth quarter of 2010, the Company renewed $16.2 million (KRW 18.2 billion) of maturing indebtedness for an additional year. The renewals consisted of unsecured indebtedness of $8.9 million (KRW 10 billion) and secured bonds of $7.3 million (KRW 8.2 billion). There were no material changes to the terms of the loans except for the extension of the maturities to 2011. In addition, we renewed a credit facility for an additional year of $1.8 million (KRW 2 billion) for which no balance was outstanding as of December 31, 2010. In Brazil, two of the local banks provided the Company with aggregate indebtedness of $7.8 million (R$13 million). The terms of the new loans are substantially the same as the other portfolio loans.
During the third quarter of 2010, we renewed $30.1 million (KRW 33.8 billion) of maturing secured indebtedness in South Korea for an additional year. There were no material changes to the terms of the loans except for the extension of the maturities to 2011. In Brazil, one of the local banks provided us with a $3 million (R$5 million) new one-year term loan that refinances a previous loan. In addition, three of the local banks provided us with aggregate indebtedness of $10.8 million (R$18 million). The terms of the new loans are substantially the same as the other portfolio loans.
During the second quarter of 2010, we renewed $22.3 million (KRW 25 billion) of maturing secured bonds in South Korea for an additional two years. We also renewed three additional facilities with aggregate indebtedness of $8.5 million (KRW 9.5 billion) for an additional year. There were no material changes to the terms of the loans except for the extension of the maturities. In addition, we obtained a new $4.5 million (KRW 5 billion) unsecured bond from the South Korean Government. The bond has a three year maturity with an interest rate of 8.32%. In Brazil, one of the local banks provided us with a new $3.2 million (R$5.3 million) one-year term loan. The terms of the new loan are substantially the same as the other portfolio loans.
During the first quarter of 2010, we renewed $14.7 million (KRW 16.5 billion) of maturing secured indebtedness in South Korea for an additional year. There were no material changes to the terms of the loans except the average annual interest rate reduced from 7.1% to 6.3%. In Brazil, two local banks provided us with a combined $8.7 million (R$14.5 million) of new one-year term loans that refinanced previous principal payments made on
61
Table of Contents
our existing term loan portfolio. The terms of the new loans are substantially the same as the other portfolio loans except for a reduction in interest rates from the portfolio average of 13.8% to 13.2% for the new loans.
During 2009, despite the tightening of credit in our industry, we were able to increase borrowings in certain of our foreign jurisdictions, including additional borrowings in Korea, new borrowings in Brazil and increasing certain account receivable factoring lines in Europe. All of these actions helped to offset the declining cash flow from operating activities arising from the significant downturn in our revenues.
Debt
As of December 31, 2010, we had outstanding indebtedness, excluding capital leases, of approximately $539.6 million, which consisted of the following:
| • | no indebtedness outstanding under our asset-based lending revolving credit facility; |
| • | $392.6 million (net of a $11.4 million discount) of indebtedness outstanding on our senior secured notes; and |
| • | $147 million of foreign subsidiary indebtedness. |
Our asset-based revolving credit facility, which we refer to as our ABL revolver, provides for a revolving credit facility in the aggregate amount of $150 million, subject to a borrowing base limitation. Our ABL revolver provides for the issuance of letters of credit in an aggregate amount not to exceed $75 million, provided that the total amount of credit (inclusive of revolving loans and letters of credit) extended under our ABL revolver is subject to an overall cap, on any date, equal to the lesser of $150 million or the amount of the borrowing base on such date. The borrowing base is based upon the value of certain of our assets, including certain of our accounts receivable, inventory and PP&E, and thus changes from time to time depending on the volume of the assets included within the borrowing base. The administrative agent for this facility causes to be performed an appraisal of the assets included in the calculation of the borrowing base either on an annual basis or, if our availability under the facility is less than $30 million during any twelve month period, as frequently as on a semi-annual basis. In addition, if certain material defaults under the facility have occurred and are continuing, the administrative agent has the right to perform any such appraisal as often as it deems necessary in its sole discretion. Our administrative agent may make adjustments to our borrowing base pursuant to these appraisals. These adjustments may negatively impact our ability to obtain revolving loans or support our letters of credit needs under our ABL revolver. Based on our asset mix at December 31, 2010, we were entitled to borrow $105.8 million under our revolver at December 31, 2010. On that date, we had no borrowings under the revolver and no letters of credit outstanding. Thus, we could have borrowed an additional $105.8 million under the revolver as of December 31, 2010, calculated as follows (in millions):
| Revolver borrowing base |
$ | 105.8 | ||
| Borrowings on revolver |
— | |||
| Letters of credit outstanding on revolver |
— | |||
| Availability |
$ | 105.8 | ||
Our ABL revolver bears interest at a base rate plus a margin or at LIBOR plus a margin. The applicable margin is determined by reference to the average availability under the ABL revolver over the preceding three months. The applicable margins as of December 31, 2010 were 0.75% and 1.75% for base rate and LIBOR based borrowings, respectively. Borrowings outstanding under our ABL revolver may vary significantly from time to time depending on our cash needs at any given time. Our ABL revolver expires in July 2012.
Our first lien term loan was borrowed in two tranches, a $250 million U.S. dollar denominated tranche and a €190.8 million Euro denominated tranche ($260 million at the time of the initial borrowing). Our first lien term
62
Table of Contents
loan carried an initial rate of interest equal to 4.00% per annum plus the applicable U.S. dollar LIBOR or EURIBOR rate. Subsequently, the applicable margin was increased to 4.25% per annum. Our first lien term loan, scheduled to mature in July 2013, was repaid on August 24, 2010, funded principally by our offering of $430 million aggregate principal amount of senior secured notes. Under our first lien term loan agreement, we also have a $27.5 million letter of credit facility, of which $26.5 million was outstanding at December 31, 2010. The letter of credit facility remains outstanding notwithstanding the retirement of the first lien term loan. As of December 31, 2010, Cerberus owned all of the letter of credit facility.
Our foreign subsidiary indebtedness consists primarily of borrowings in South Korea and Brazil and factoring in Italy. Factoring involves the sale of our receivables at a discount, which discount is included in interest expense. A majority of the South Korean debt and all of the Brazilian debt is subject to annual renewal. The factoring in Italy consists of uncommitted demand facilities which are subject to termination at the discretion of the applicable banks. Interest on the South Korean borrowings ranges from 4.57% to 9.96% per annum. Interest on the Brazilian debt ranges from 12.68% to 14.44% per annum.
Our ABL revolver contains a financial maintenance covenant ratio, which we refer to as the fixed charge coverage ratio. Compliance with the fixed charge coverage ratio is determined by comparing consolidated lender-adjusted EBITDA to consolidated fixed charges, each as defined in the credit agreement governing our ABL revolver. If we have less than ten percent of the total commitment available (provided that such number cannot be less than $10 million or greater than $20 million) under our ABL revolver for more than five consecutive days, we are required to maintain a fixed charge coverage ratio of not less than 1.00 to 1.00 on a rolling four quarter basis. We were not required to maintain a minimum fixed charge coverage ratio under our ABL revolver during 2010. If we are required at any time to maintain the fixed charge coverage ratio, such requirement will end after we have more than ten percent of the total commitment available (provided that such number cannot be less than $10 million or greater than $20 million) for twenty consecutive days.
Our first lien term loan agreement, which continues to apply to us with respect to our letter of credit facility, contains a leverage covenant ratio, which we refer to as the first priority leverage ratio. Compliance with this ratio is determined by comparing our first priority debt to consolidated lender-adjusted EBITDA, each as defined in the credit agreement governing our first lien term loan. We are required to maintain a first priority leverage ratio of not greater than 4.25 to 1.00 on a rolling four quarter basis. In addition, our first lien term loan contains a financial maintenance covenant ratio referred to as the interest coverage ratio, which is determined by comparing consolidated lender-Adjusted EBITDA (calculated in accordance with the first lien term loan agreement) to consolidated interest expense, excluding amounts not paid or payable in cash, each as defined in the credit agreement governing our first lien term loan. We are required to maintain an interest coverage ratio of not less than 2.00 to 1.00 on a rolling four quarter basis. As of December 31, 2010, we were in compliance with the required leverage ratio and interest coverage ratio covenants and anticipate being in compliance with both ratios during 2011. Our financial condition and liquidity would be adversely impacted by the violation of any of our covenants.
On August 24, 2010, we consummated the sale of $430 million aggregate principal amount of our 10.625% Senior Secured Notes due 2017. The indenture governing the notes contains a provision that gives each holder of notes the right, upon a change of control, to require the Issuers to purchase all or any part of such holder’s notes at a purchase price in cash equal to 101% of the principal amount thereof plus accrued and unpaid interest. We may also redeem some or all of the notes on the terms and subject to the conditions set forth in the indenture. On December 16, 2010, we redeemed $26 million of the senior secured notes from a portion of the net proceeds of our initial public offering which resulted in a premium paid of $1.3 million. We have announced plans to redeem an additional $17 million of the senior secured notes by the end of March 2011.
The indenture governing the notes contains customary covenants applicable to our subsidiaries and places some restrictions on Tower Automotive, LLC which became restrictions on Tower International, Inc. after the Corporate Conversion. The indenture governing the notes contains certain restrictions on, among other things,
63
Table of Contents
our subsidiaries’ ability to: incur debt; incur liens; declare or make distributions to us or our equity holders; repay debt; enter into mergers, acquisitions and other business combinations; engage in asset and equity sales; enter into sale and lease-back transactions; enter into restrictive agreements; and enter into transactions with affiliates. The indenture governing the notes includes customary events of default, including, but not limited to, in respect of payment defaults; breaches of covenants; bankruptcy; material judgments; failure to have perfected liens on substantially all or all the collateral securing the notes; and cross-acceleration to material indebtedness.
Capital and Operating Leases
We maintain capital leases mainly for a manufacturing facility and certain manufacturing equipment. We have several operating leases, including leases for office and manufacturing facilities and certain equipment, with lease terms expiring between the years 2011 and 2021. As of December 31, 2010, our total future operating lease payments amounted to $136.9 million and the present value of minimum lease payments under our capital leases amounted to $18.3 million. During the first quarter of 2010, we added $9.6 million of capital lease obligations in connection with our acquisition of a manufacturing plant in Artern, Germany, of which we made lease payments of approximately $5.6 million during 2010. As of December 31, 2010, we were committed to making lease payments of not less than $24.1 million on our operating leases and not less than $4.1 million on our capital leases during 2011.
Capital Expenditures
In general, we are awarded new automotive business two to five years prior to the launch of a particular program. During the pre-launch period, we typically invest significant resources in the form of capital expenditures for the purchase and installation of the machinery and equipment necessary to manufacture the awarded products. Capital expenditures for the years ended December 31, 2010 and 2009 were $100.5 million and $86 million, respectively, the increase reflecting primarily our non-automotive spending in 2010. Our capital spending for 2011 is expected to be approximately $100 million.
Off-Balance Sheet Obligations
Our only off-balance sheet obligations consist of obligations under our $27.5 million letter of credit facility. As of December 31, 2010, letters of credit outstanding were $26.5 million under this facility.
Our letter of credit facility was fully cash collateralized by third parties for purposes of replacing or backstopping letters of credit outstanding. The cash collateral was deposited by the third parties in a trust account, and we have no right, title or interest in the trust account. Applicable fees are 4.5% of the aggregate letters of credit outstanding for commissions and fronting fees and a deposit fee of 0.15% based on the amount of the cash collateral deposit. As of December 31, 2010, Cerberus owned all of the letter of credit facility.
64
Table of Contents
Contractual Obligations and Commercial Commitments
Our contractual obligations and commercial commitments as of December 31, 2010 are summarized below (in millions):
| Payments Due by Period | ||||||||||||||||||||
| Contractual Obligations |
Total | Less than 1 Year |
1-3 Years |
4-5 Years |
After 5 Years |
|||||||||||||||
| Long-term debt (including current portion): |
||||||||||||||||||||
| Asset based revolving credit facility |
$ | — | $ | — | $ | — | $ | — | $ | — | ||||||||||
| Senior secured notes |
404.0 | — | — | — | 404.0 | |||||||||||||||
| Other foreign subsidiary indebtedness |
147.0 | 106.9 | 40.1 | — | — | |||||||||||||||
| Cash interest payments |
334.0 | 49.8 | 115.0 | 84.6 | 84.6 | |||||||||||||||
| Pension contributions (a) |
97.0 | 16.3 | 39.4 | 29.7 | 11.6 | |||||||||||||||
| VEBA payments (b) |
0.6 | 0.6 | — | — | — | |||||||||||||||
| Expected tax payments (c) |
13.6 | 5.6 | 6.0 | 1.6 | 0.4 | |||||||||||||||
| Capital and tooling purchase obligations (d) |
120.0 | 120.0 | — | — | — | |||||||||||||||
| Capital lease obligations |
22.8 | 4.1 | 6.2 | 3.4 | 9.1 | |||||||||||||||
| Operating leases |
136.9 | 24.1 | 30.2 | 26.9 | 55.7 | |||||||||||||||
| Total contractual obligations at December 31, 2010 |
$ | 1,275.9 | $ | 327.4 | $ | 236.9 | $ | 146.2 | $ | 565.4 | ||||||||||
| (a) | Represents expected future contributions required to fund our pension plan based on current actuarially determined assumptions. |
| (b) | Represents obligations assumed pursuant to the 2007 acquisition to make contributions to a Voluntary Employee Benefit Association, or VEBA, trust to administer medical insurance benefits. |
| (c) | Represents payments expected to be made to various governmental agencies relating to certain tax positions taken by our company pursuant to FASB ASC No. 450 “Accounting for Uncertain Tax Positions.” |
| (d) | Represents obligations under executory purchase orders related to capital and tooling expenditures. |
Our purchase orders for inventory are based on demand and do not require us to purchase minimum quantities.
Critical Accounting Policies and Estimates
The preparation of our consolidated financial statements in conformity with GAAP requires us to make estimates and assumptions that affect the reported amounts of assets and liabilities and disclosure of contingent assets and liabilities at the date of the consolidated financial statements and the reported amounts of revenues and expenses during the reporting period. Considerable judgment is often involved in making these determinations. Critical estimates are those that require the most difficult, subjective or complex judgments in the preparation of the financial statements and the accompanying notes. We evaluate these estimates and judgments on a regular basis. We believe our assumptions and estimates are reasonable and appropriate. However, the use of different assumptions could result in significantly different results and actual results could differ from those estimates. The following discussion of accounting estimates is intended to supplement the Summary of Significant Accounting Policies presented as note 3 to our consolidated financial statements in Item 8. Policies that are excluded from the discussion below are deemed to be either immaterial or not critical for the periods presented in this Annual Report.
Revenue Recognition
We recognize revenue once the criteria in FASB ASC No. 605, Revenue Recognition, have been met. These criteria are that persuasive evidence of an arrangement exists, delivery has occurred or services have been rendered, our price to the buyer is fixed or determinable, and collectability is reasonably assured.
65
Table of Contents
We recognize revenue as our products are shipped to our customers, at which time title and risk of loss passes to the customer. We participate in certain customers’ steel resale programs. Under these programs, we purchase steel directly from a customer’s designated steel supplier for use in manufacturing products for that customer. We take delivery and title to such steel and we bear the risk of loss and obsolescence. We invoice our customers based upon annually negotiated selling prices, which inherently includes a component for steel under these resale programs. Under guidance provided in FASB ASC No. 605-45, Principal Agent Considerations, we have substantial risks and rewards of ownership and are acting as a principal. Therefore, for sales where we participate in a customer’s steel resale program, revenue is recognized on a gross basis for the entire amount of the sales, including the component for purchases under that customer’s steel resale program.
We are generally asked to provide annual price reductions by our customers. When negotiations are underway and negotiated prices are expected to be retroactive, we accrue for such amounts as a reduction of revenue as products are shipped. We record adjustments to those accruals in the period in which the pricing is finalized with the customer or if it becomes probable and estimable that pricing negotiated with customers will vary from previous assumptions.
We enter into agreements to produce products for our customers at the beginning of a given vehicle program life. Once we enter into these agreements, fulfillment of the customers’ purchasing requirements is our obligation for the entire production period of the vehicle programs, which range from three to ten years, and generally we have no provisions to terminate these contracts. Additionally, we monitor the aging of uncollected billings and adjust the accounts receivable allowance on a quarterly basis as necessary, based on our evaluation of the probability of collection. The adjustments we have made due to the write-off of uncollectible amounts have been negligible.
Restructuring Reserves
We have recognized accruals in relation to restructuring reserves, which require the use of estimates and judgment regarding risk, loss exposure and ultimate liability. Reserves for restructuring activities are estimated primarily for activities associated with the discontinuation and consolidation of certain operations of our company. Changes to these assumptions and estimates could materially affect the recorded liabilities and related loss.
Fair Value Measurements
We adopted FASB ASC No. 820, Fair Value Measurements, on January 1, 2008 for financial assets and liabilities and on January 1, 2009 for non-financial assets and liabilities. FASB ASC No. 820 (i) creates a single definition of fair value, (ii) establishes a framework for measuring fair value and (iii) expands disclosure requirements about items measured at fair value. FASB ASC No. 820 applies both to items recognized and reported at fair value in our consolidated financial statements and items disclosed at fair value in the notes to our consolidated financial statements. FASB ASC No. 820 does not change existing accounting rules governing what can or what must be recognized and reported at fair value in our consolidated financial statements, or disclosed at fair value in the notes to our consolidated financial statements. Additionally, FASB ASC No. 820 does not eliminate practicability exceptions that exist in accounting pronouncements amended by FASB ASC No. 820 when measuring fair value. As a result, we were not required to recognize any new assets or liabilities at fair value.
Prior to the adoption of FASB ASC No. 820, certain measurements of fair value were based on the price that would be paid to acquire an asset, or received to assume a liability (an entry price). FASB ASC No. 820 clarifies the definition of fair value as the price that would be received to sell an asset, or paid to transfer a liability, in an orderly transaction between market participants at the measurement date (an exit price). The exit price is based on the amount that the holder of the asset or liability would receive or need to pay in an actual transaction, or in a hypothetical transaction if an actual transaction does not exist, at the measurement date. In some circumstances, the entry and exit price may be the same; however, they are conceptually different.
66
Table of Contents
Fair value is generally determined based on quoted market prices in active markets for identical assets or liabilities. If quoted market prices are not available, we use valuation techniques that place greater reliance on observable inputs and less reliance on unobservable inputs. In measuring fair value, we may make adjustments for risks and uncertainties, if a market participant would include such an adjustment in its pricing.
FASB ASC No. 820 establishes a fair value hierarchy that distinguishes between assumptions based on market data, referred to as observable inputs, and our assumptions, referred to as unobservable inputs. Determining where an asset or liability falls within that hierarchy depends on the lowest level input that is significant to the fair value measurement as a whole. An adjustment to the pricing method used within either level 1 or level 2 inputs could generate a fair value measurement that effectively falls in a lower level in the hierarchy. The hierarchy consists of three broad levels as follows:
| Level 1: | Quoted market prices in active markets for identical assets and liabilities; |
| Level 2: | Inputs other than level 1 inputs that are either directly or indirectly observable; and |
| Level 3: | Unobservable inputs developed using our estimates and assumptions, which reflect those that market participants would use. |
| Fair value measurements at December 31, 2010 (in millions) using: | ||||||||||||||||
| Quoted prices in active markets for identical assets |
Significant other observable inputs |
Significant unobservable inputs |
Total | |||||||||||||
| Level 1 | Level 2 | Level 3 | ||||||||||||||
| Liabilities: |
||||||||||||||||
| Long-lived assets held for sale |
Not applicable | Not applicable | $ | 8.2 | $ | 8.2 | ||||||||||
| Total long-term debt |
Not applicable | $ | 431.5 | $ | 147.0 | $ | 578.5 | |||||||||
The fair value of our long-lived assets held for sale was determined using third-party appraisals. The third-party appraisals use current market conditions to determine the fair market value.
At December 31, 2010, the carrying value and estimated fair value of our long-term debt was $539.6 million and $578.5 million, respectively. At December 31, 2009, the carrying value and estimated fair value of our long-term debt was $651.9 million. The majority of our long-term debt at December 31, 2010 is traded in the market and is classified as a level 2 measurement as the debt is thinly traded. The fair value was determined based on the quoted market values. The remainder of our long-term debt of foreign subsidiaries is asset-backed and is classified as level 3. As this debt carries variable rates and minimal credit risk, the book value approximates the fair value for this debt. The majority of our long-term debt at December 31, 2009 was owned by our affiliate and was classified as a level 3 measurement. The fair value was determined using significant unobservable inputs based on the estimated fair value of comparable instruments with quoted active market values.
We value our foreign exchange hedges using significant other observable inputs. The fair value is determined using third-party valuation models. The third-party valuation models use quoted interest rate curves to calculate the forward value and then discount the forward values to the present period.
67
Table of Contents
The following table provides each major category of assets and liabilities measured at fair value on a nonrecurring basis during the period (in millions):
| Quoted prices in active markets for identical assets |
Significant other observable inputs |
Significant unobservable inputs |
Total Gains / (losses) |
|||||||||||||
| Level 1 | Level 2 | Level 3 | ||||||||||||||
| Description |
||||||||||||||||
| Long-lived assets held for sale |
Not applicable | Not applicable | $ | 4.0 | $ | (2.7 | ) | |||||||||
| Asset impairments |
Not applicable | Not applicable | $ | 0.7 | $ | (7.3 | ) | |||||||||
In accordance with FASB ASC No. 360, Property, Plant, & Equipment, long-lived assets held for sale with a carrying amount of $6.7 million were written down to their fair value of $4.3 million, less cost to sell of $0.3 million (or $4 million), resulting in a loss of $2.7 million, which was included in earnings for the period.
In accordance with FASB ASC No. 360, equipment specifically purchased for use with our solar agreement with Stirling Energy Systems (SES) with a carrying amount of $8 million was written down to the fair value of $0.7 million, resulting in a loss of $7.3 million, which was included in earnings for the period.
The determination of where an asset or liability falls in the hierarchy requires significant judgment. We evaluate our hierarchy disclosures each quarter based on various factors, and it is possible that an asset or liability may be classified differently from quarter to quarter. However, we expect that changes in classifications between different levels will be rare.
Most derivative contracts are not listed on an exchange and require the use of valuation models. Consistent with FASB ASC No. 820, we attempt to maximize the use of observable market inputs in our models. When observable inputs are not available, we default to unobservable inputs.
Goodwill
Goodwill represents the excess of the cost of an acquisition over the fair value of net assets acquired. Goodwill is not amortized but is tested for impairment on at least an annual basis. In accordance with FASB ASC No. 350, Intangibles—Goodwill and Other, goodwill is reviewed for impairment utilizing a two-step process. The first step of the impairment test requires the identification of the reporting units, and comparison of the fair value of each of these reporting units to the respective carrying value. We define our reporting units as Europe, Asia, North America, and South America. The recoverability of goodwill is evaluated at the following reporting units for which goodwill exists: Europe and South America. These reporting units exist at a lower level than our reportable segments. If the carrying value is less than the fair value, no impairment exists and the second step is not performed. In the second step, the impairment is computed by comparing the implied fair value of reporting unit goodwill with the carrying amount of that goodwill. FASB ASC No. 350 requires goodwill to be tested for impairment annually at the same time every year, and when an event occurs or circumstances change such that it is reasonably possible that impairment may exist. The annual impairment test is performed at year end.
We utilize an income approach to estimate the fair value of each of our reporting units. The income approach is based on projected debt free cash flow which is discounted to the present value using discount factors that consider the timing and risk of cash flows. We believe that this approach is appropriate because it provides a fair value estimate based upon the reporting units’ expected long-term operating cash flow performance. This approach also mitigates the impact of cyclical trends that occur in the industry. Fair value is estimated using recent automotive industry and specific platform production volume projections, which are based on internally-developed forecasts, as well as commercial, wage and benefit, inflation and discount rate assumptions. Other significant assumptions include terminal value growth rates, terminal value margin rates, future capital
68
Table of Contents
expenditures, known restructuring actions, and changes in future working capital requirements. While there are inherent uncertainties related to the assumptions used and to management’s application of these assumptions to this analysis, we believe that the income approach provides a reasonable estimate of the fair value of our reporting units. However, our assumptions and estimates may differ significantly from actual results. We also use a second approach, which is the market multiple approach, to test the reasonableness of the income approach.
Our 2010 and 2009 annual goodwill impairment analysis, completed as of each year end, indicated that the carrying value of the Europe and South America reporting units was less than the respective fair values; thus, no impairment existed at either date. We also performed an interim goodwill impairment analysis during 2010 as we deemed our IPO to be a triggering event. The fair value of each reporting unit was substantially in excess of the carrying value for each analysis performed.
Income Taxes
We account for income taxes under the asset and liability method, which requires the recognition of deferred tax assets and liabilities for the expected future tax consequences of events that have been included in the financial statements. Under this method, deferred tax assets and liabilities are determined based on the differences between the consolidated financial statements and tax basis of assets and liabilities using enacted tax rates in effect for the year in which the differences are expected to reverse. We record net deferred tax assets to the extent we believe that these assets will more likely than not be realized. In making such determination, we consider all available positive and negative evidence, including future reversals of existing taxable temporary differences, projected future taxable income, tax planning strategies and recent financial operations. Valuation allowances have been recorded where it has been determined that it is more likely than not that we will not be able to realize the net deferred tax assets. Previously established valuation allowances are reversed into income when there is compelling evidence, typically three or more consecutive years of profit or other positive evidence, that the future tax profitability will be sufficient to utilize the deferred tax asset. Due to the significant judgment involved in determining whether deferred tax assets will be realized, the ultimate resolution of these items may be materially different from the previously estimated outcome.
During 2010, the valuation allowance on deferred taxes in South Korea was reversed. We determined that the valuation allowance was no longer necessary because the profitability of our South Korean operations had improved over the prior two years and the expected production volumes in South Korea are remaining at or above the levels experienced in 2008. The impact on income tax expense was a benefit of $7.8 million, representing a $9.1 million valuation allowance reversal offset by $1.3 million of income tax expense for the establishment of a reserve for uncertain tax positions required under FASB ASC No. 740, Income Taxes.
Pursuant to FASB ASC No. 740, we allocated a tax benefit of $4.9 million to continuing operations in 2009 due to the gain in other comprehensive income offsetting a portion of the losses from continuing operations. There was a corresponding tax provision of $4.9 million charged to other comprehensive income. During 2010, the $2 million tax benefit associated with the gain on the interest rate swaps was reversed upon termination of the hedge.
Changes in tax laws and rates could also affect recorded deferred tax assets and liabilities in the future. Management is not aware of any such changes that would have a material effect on our results of operations, cash flows or financial position.
The calculation of our tax liabilities involves dealing with uncertainties in the application of complex tax laws and regulations in a multitude of jurisdictions across our global operations.
FASB ASC No. 740, Income Taxes, provides that a tax benefit from an uncertain tax position may be recognized when it is more likely than not that the position will be sustained upon examination, including resolutions of any related appeals or litigation processes, based on the technical merits. FASB ASC No. 740 also provides guidance
69
Table of Contents
on measurement, derecognition, classification, interest and penalties, accounting in interim periods, disclosure and transition.
We recognize tax liabilities in accordance with FASB ASC No. 740 and adjust these liabilities when its judgment changes as a result of the evaluation of new information not previously available. Due to the complexity of some of these uncertainties, the ultimate resolution may result in a payment that is materially different from our current estimate of the tax liabilities. These differences will be reflected as increases or decreases to income tax expense in the period in which they are determined.
Pre-production Tooling
Tooling costs represent costs incurred by us in the development of new tooling used in the manufacture of our products. All pre-production tooling costs, incurred for tools that the Company will not own and that will be used in producing products supplied under long-term supply agreements, are expensed as incurred unless the supply agreement provides the Company with the non-cancelable right to use the tools or the reimbursement of such costs is contractually guaranteed by the customer. Generally, when the customer awards a contract to us, the customer agrees to reimburse us for certain of our tooling costs. If estimated costs are expected to be in excess of reimbursement, a loss is recorded in the period when the loss is estimated. If estimated costs are expected to be less than reimbursement, a gain is recognized over the life of the associated program.
Impairment and Depreciation of Long-Lived Assets
Our long-lived assets are reviewed for impairment whenever adverse events or changes in circumstances indicate a possible impairment. An impairment loss is recognized when the carrying value of a long-lived asset group exceeds its undiscounted future cash flows generated by the asset group. The impairment is calculated as the excess of carrying value over the fair value of the asset group. Significant judgments and estimates used by management when evaluating long-lived assets for impairment cover, among other things, the following:
| • | program product volumes and remaining production life for parts produced on the assets being reviewed; |
| • | product pricing over the remaining life of the parts, including an estimate of future customer price reductions which may be negotiated; |
| • | product cost information, including an assessment of the success of our cost reduction activities; and |
| • | assessments of future alternative applications of specific long-lived assets based on awarded programs. |
In December 2010, we recorded an impairment charge of $7.3 million related to our non-automotive business. The charge taken related to the equipment specifically purchased for use with our solar agreement with SES, less any salvage value.
In addition, we follow our established accounting policy for estimating useful lives of long-lived assets. This policy is based upon significant judgments and estimates as well as historical experience. Actual future experience with those assets may indicate different useful lives resulting in a significant impact on depreciation expense.
Asset Retirement Obligations
FASB ASC No. 410, Asset Retirement and Environmental Obligations, requires the recognition of a liability for the fair value of a conditional asset retirement obligation if the fair value can be reasonably estimated. An asset retirement obligation is a legal obligation to perform certain activities in connection with retirement, disposal or abandonment of assets. The fair value of a conditional asset retirement obligation should be recognized when incurred, generally upon acquisition, construction or development and through the normal operation of the asset.
70
Table of Contents
Uncertainty about the timing or method of settlement of a conditional asset retirement should be factored into the measurement of the liability. The liability is measured at discounted fair value and is adjusted to its present value in subsequent periods. Our asset retirement obligations are primarily associated with renovating, upgrading, and returning leased property to the lessor in accordance with the requirements of the lease.
Pension and Other Postretirement Benefits
The determination of the obligation and expense for pension and other postretirement benefits is dependent on the selection of certain assumptions used by actuaries in calculating such amounts. Those assumptions are described in note 10 to our consolidated financial statements and include, among others, the discount rate, expected long-term rate of return on plan assets, mortality rates, and expected increases in compensation and healthcare costs. In accordance with generally accepted accounting principles, actual results that differ from these assumptions are accumulated and amortized over future periods and, therefore, generally affect the recognized expense and recorded obligation in such future periods. While we believe that our current assumptions are appropriate based on available information, significant differences in actual experience or significant changes in assumptions may materially affect the pension and other postretirement obligations and the future expense.
Pension and other postretirement costs are calculated based on a number of actuarial assumptions, most notably the discount rates used in the calculation of our pension benefit obligation for the years ended December 31, 2010, 2009 and 2008, respectively, of 5.25%, 5.75% and 6.25% and the discount rates used in the calculation of our postretirement benefit obligations of 5.25%, 5.75%, and 6.25%, as of each of our December 31, 2010, 2009 and 2008 measurement dates, respectively. The discount rates that we use are developed based on a yield curve analysis from a third-party, which calculates the yield to maturity that mirrors the timing and amounts of future anticipated benefit payments.
The expected rate of return on pension plan assets under FASB ASC No. 715, Compensation—Retirement Benefits, of 7.4% and 7.25% as of December 31, 2010 and 2009, respectively, represents our expected long-term rate of return on plan assets. The rate of return assumptions selected by us reflect our estimate of the average rate of earnings expected on the funds invested or to be invested in order to provide for future participant benefits to be paid out over time. As part of this estimate, we review the existing allocation of invested assets against expectations about future performance of similar asset allocations. Future expectations were obtained from readily available public sources. Expected future returns were adjusted for expectations regarding future investment and other expenses.
Based on our assumptions as of December 31, 2010 (the measurement date), a change in the discount rate or the expected rate of long term return on pension plan assets assumptions, holding all other assumptions constant, would have the following effect on our pension costs and obligations on an annual basis:
| Impact on Net Periodic Benefit Cost |
||||||||
| Increase | Decrease | |||||||
| .25% change in discount rate |
$ | (24,349 | ) | $ | 20,887 | |||
| .25% change in expected long-term rate of return |
(397,805 | ) | 397,805 | |||||
| Impact on Obligation | ||||||||
| Increase | Decrease | |||||||
| .25% change in discount rate |
$ | (6,345,876 | ) | $ | 6,639,417 | |||
FASB ASC No. 715 and the policies we have used, most notably the use of a calculated value of plan assets for pensions as described above, generally reduce the volatility of pension expense that would otherwise result from
71
Table of Contents
changes in the value of the pension plan assets and pension liability discount rates. Our pension benefits relate to our plan in the United States.
Our 2011 pension expense is estimated to be approximately $3 million and we expect to contribute approximately $16.3 million to our pension plans in 2011.
Our 2011 other post-employment benefit expense is estimated to be approximately $0.7 million and benefit payments are expected to be $0.8 million in 2011. As of July 31, 2007, future benefit payments on our other postretirement benefit plans were capped at specified amounts to be paid through 2011. See note 10 to our consolidated financial statements.
Recent Accounting Pronouncements
For information regarding recent accounting pronouncements, see note 2 to our consolidated financial statements.
| Item 7A. | Quantitative and Qualitative Disclosures about Market Risk |
Market risk is the potential loss arising from adverse changes in market rates and prices. We are exposed to market risk in the normal course of our business operations due to our purchases of steel, our sales of scrap steel, our ongoing investing and financing activities and our exposure to foreign currency exchange rates. We have established policies and procedures to govern our management of market risks.
Commodity Pricing Risk
Steel is the primary raw material that we use. We purchase a portion of our steel from certain of our customers through various OEM resale programs. The purchases through customer resale programs have buffered the impact of price swings associated with the procurement of steel. The remainder of our steel purchasing requirements are met through contracts with steel mills. At times, we may be unable to either avoid increases in steel prices or pass through any price increases to our customers. We refer to the “net steel impact” as the combination of the change in steel prices that are reflected in product pricing, the change in the cost to procure steel from the mill, and the change in our recovery of scrap steel, which we refer to as offal. Our strategy is to be economically indifferent to steel pricing by having these factors offset each other. While we strive to achieve a neutral net steel impact, we are not always successful in achieving that goal, in large part due to timing differences. Depending upon when a steel price change or offal price change occurs, that change may have a disproportionate effect, within any particular fiscal period, on our product pricing, our steel costs and the results of our sales of scrap steel. Net imbalances in any one particular fiscal period may be reversed in a subsequent fiscal period, although we cannot assure you that, or when, these reversals will occur.
Interest Rate Risk
At December 31, 2010, we had total debt of $539.6 million (net of a $11.4 million discount), consisting of fixed rate debt of $434.4 million (81%) and floating rate debt of $105.2 million (19%). Our floating rate debt is primarily held by our international subsidiaries. Assuming no changes in the monthly average variable-rate debt levels of $118.3 million and $133.2 million, excluding the retired first lien term loan, for the years ended December 31, 2010 and 2009, respectively, we estimate that a hypothetical change of 100 basis points in the LIBOR and alternate base rate interest rates would have impacted interest expense for each of the years ended December 31, 2010 and 2009 by $1.2 million and $1.3 million, respectively. A 100 basis point increase in interest rates would not materially impact the fair value of our fixed rate debt.
72
Table of Contents
Foreign Exchange Risk
A significant portion of our revenues is derived from manufacturing operations in Europe, Asia and South America. The results of operations and financial condition of our non-United States businesses are principally measured in their respective local currency and translated into U.S. dollars. The effects on us of foreign currency fluctuations in Europe, Asia and South America are mitigated by the fact that expenses are generally incurred in the same currency in which revenues are generated, since we strive to manufacture our products in close proximity to our customers. Nevertheless, the reported income of our foreign subsidiaries will be higher or lower depending on a weakening or strengthening of the U.S. dollar against the respective foreign currencies.
Assets located in our foreign facilities are translated into U.S. dollars at foreign currency exchange rates in effect as of the end of each reporting period. The effect of such translations is reflected as a separate component of consolidated equity / (deficit). As a result, our consolidated equity / (deficit) will fluctuate depending upon the weakening or strengthening of the U.S. dollar against the respective foreign currencies.
Our strategy for managing currency risk relies primarily upon conducting business in a foreign country in that country’s currency. We may, from time to time, also participate in hedging programs intended to reduce our exposure to currency fluctuations. We believe that the effect of a 100 basis point movement in foreign currency rates against the U.S. dollar would not have materially affected our results of operations or cash flows for the years ended December 31, 2010 and 2009. However, we believe that the effect of a 100 basis point movement in the Euro to the U.S. dollar has the potential to materially affect our equity / (deficit) whereas we do not believe a 100 basis point movement in other foreign currencies would have a material impact. As of December 31, 2010, we estimated that a hypothetical change of 100 basis points in the Euro to the U.S. dollar exchange rate would have impacted equity / (deficit) by approximately $2.9 million.
Inflation
Despite recent declines, we have experienced a continued rise in inflationary pressures impacting certain commodities, such as petroleum-based products, resins, yarns, ferrous metals, base metals and certain chemicals. Additionally, because we purchase various types of equipment, raw materials and component parts from our suppliers, we may be adversely affected by their inability to adequately mitigate inflationary, industry, or economic pressures. These pressures have proven to be insurmountable to some of our suppliers and we have seen the number of bankruptcies and insolvencies in our industry increase. The overall condition of our supply base may possibly lead to delivery delays, production issues or delivery of non-conforming products by our suppliers in the future. As such, we continue to monitor our vendor base for the best sources of supply and work with those vendors and customers to attempt to mitigate the impact of the pressures mentioned above.
73
Table of Contents
| Item 8. | Financial Statements and Supplementary Data |
Index to Consolidated Financial Statements and Supplementary Data
| Form 10-K Page |
||||
| Audited Financial Statements for the Three Years Ended December 31, 2010: |
||||
| 75 | ||||
| Consolidated Balance Sheets as of December 31, 2010 and 2009 |
77 | |||
| Consolidated Statements of Operations for the Years Ended December 31, 2010, 2009 and 2008 |
78 | |||
| Consolidated Statements of Cash Flows for the Years Ended December 31, 2010, 2009 and 2008 |
79 | |||
| 80 | ||||
| 81 | ||||
| Supplementary Data |
||||
| Quarterly Financial Information (Unaudited)—See note 20 of the Notes to Consolidated Financial Statements |
| |||
74
Table of Contents
REPORT OF INDEPENDENT REGISTERED PUBLIC ACCOUNTING FIRM
To the Board of Directors and Stockholders of
Tower International, Inc.
Livonia, MI
We have audited the accompanying consolidated balance sheets of Tower International, Inc. (previously Tower Automotive, LLC) and subsidiaries (the “Company”) as of December 31, 2010 and 2009, and the related consolidated statements of operations, equity (deficit) and redeemable preferred units, and cash flows for each of the three years in the period ended December 31, 2010. Our audits also included the financial statement schedules listed in the Index at Item 15. These financial statements and financial statement schedules are the responsibility of the Company’s management. Our responsibility is to express an opinion on the financial statements and financial statement schedules based on our audits.
We conducted our audits in accordance with the standards of the Public Company Accounting Oversight Board (United States). Those standards require that we plan and perform the audit to obtain reasonable assurance about whether the financial statements are free of material misstatement. An audit includes examining, on a test basis, evidence supporting the amounts and disclosures in the financial statements, assessing the accounting principles used and significant estimates made by management, as well as evaluating the overall financial statement presentation. We believe that our audits provide a reasonable basis for our opinion.
In our opinion, such consolidated financial statements present fairly, in all material respects, the financial position of Tower International, Inc. and subsidiaries as of December 31, 2010 and 2009, and the results of their operations and their cash flows for each of the three years in the period ended December 31, 2010, in conformity with accounting principles generally accepted in the United States of America. Also, in our opinion, such financial statement schedules, when considered in relation to the basic consolidated financial statements taken as a whole, present fairly, in all material respects, the information set forth therein.
We have also audited, in accordance with the standards of the Public Company Accounting Oversight Board (United States), the Company’s internal control over financial reporting as of December 31, 2010, based on the criteria established in Internal Control – Integrated Framework issued by the Committee of Sponsoring Organizations of the Treadway Commission and our report dated March 14, 2011, expressed an unqualified opinion on the Company’s internal control over financial reporting.
/s/ DELOITTE & TOUCHE LLP
Detroit, MI
March 14, 2011
75
Table of Contents
REPORT OF INDEPENDENT REGISTERED PUBLIC ACCOUNTING FIRM
To the Board of Directors and Stockholders of
Tower International, Inc.
Livonia, MI
We have audited the internal control over financial reporting of Tower International, Inc. and subsidiaries (the “Company”) as of December 31, 2010, based on criteria established in Internal Control – Integrated Framework issued by the Committee of Sponsoring Organizations of the Treadway Commission. The Company’s management is responsible for maintaining effective internal control over financial reporting and for its assessment of the effectiveness of internal control over financial reporting, included in the accompanying Management’s Annual Report on Internal Control over Financial Reporting. Our responsibility is to express an opinion on the Company’s internal control over financial reporting based on our audit.
We conducted our audit in accordance with the standards of the Public Company Accounting Oversight Board (United States). Those standards require that we plan and perform the audit to obtain reasonable assurance about whether effective internal control over financial reporting was maintained in all material respects. Our audit included obtaining an understanding of internal control over financial reporting, assessing the risk that a material weakness exists, testing and evaluating the design and operating effectiveness of internal control based on the assessed risk, and performing such other procedures as we considered necessary in the circumstances. We believe that our audit provides a reasonable basis for our opinion.
A company’s internal control over financial reporting is a process designed by, or under the supervision of, the company’s principal executive and principal financial officers, or persons performing similar functions, and effected by the company’s board of directors, management, and other personnel to provide reasonable assurance regarding the reliability of financial reporting and the preparation of financial statements for external purposes in accordance with generally accepted accounting principles. A company’s internal control over financial reporting includes those policies and procedures that (1) pertain to the maintenance of records that, in reasonable detail, accurately and fairly reflect the transactions and dispositions of the assets of the company; (2) provide reasonable assurance that transactions are recorded as necessary to permit preparation of financial statements in accordance with generally accepted accounting principles, and that receipts and expenditures of the company are being made only in accordance with authorizations of management and directors of the company; and (3) provide reasonable assurance regarding prevention or timely detection of unauthorized acquisition, use, or disposition of the company’s assets that could have a material effect on the financial statements.
Because of the inherent limitations of internal control over financial reporting, including the possibility of collusion or improper management override of controls, material misstatements due to error or fraud may not be prevented or detected on a timely basis. Also, projections of any evaluation of the effectiveness of the internal control over financial reporting to future periods are subject to the risk that the controls may become inadequate because of changes in conditions, or that the degree of compliance with the policies or procedures may deteriorate.
In our opinion, the Company maintained, in all material respects, effective internal control over financial reporting as of December 31, 2010, based on the criteria established in Internal Control – Integrated Framework issued by the Committee of Sponsoring Organizations of the Treadway Commission.
We have also audited, in accordance with the standards of the Public Company Accounting Oversight Board (United States), the consolidated financial statements and financial statement schedules as of and for the year ended December 31, 2010 of the Company and our report dated March 14, 2011, expressed an unqualified opinion on those consolidated financial statements and financial statement schedules.
/s/ DELOITTE & TOUCHE LLP
Detroit, MI
March 14, 2011
76
Table of Contents
TOWER INTERNATIONAL, INC. AND SUBSIDIARIES
CONSOLIDATED BALANCE SHEETS
(Amounts in thousands)
| December 31, 2010 |
December 31, 2009 |
|||||||
| ASSETS | ||||||||
| Cash and cash equivalents |
$ | 150,345 | $ | 149,802 | ||||
| Accounts receivable, net of allowance of $1,674 and $2,439 |
297,086 | 290,098 | ||||||
| Inventories (Note 3) |
73,189 | 62,611 | ||||||
| Deferred tax asset—current |
12,406 | 4,762 | ||||||
| Assets held for sale (Note 5) |
8,178 | 6,008 | ||||||
| Prepaid tooling and other |
57,754 | 60,139 | ||||||
| Total current assets |
598,958 | 573,420 | ||||||
| Property, plant and equipment, net (Note 3) |
627,497 | 640,148 | ||||||
| Goodwill (Note 3) |
66,309 | 70,565 | ||||||
| Deferred tax asset—non-current |
17,377 | 15,009 | ||||||
| Other assets, net |
30,035 | 35,279 | ||||||
| Total assets |
$ | 1,340,176 | $ | 1,334,421 | ||||
| LIABILITIES AND EQUITY / (DEFICIT) | ||||||||
| Current maturities of long-term debt and capital lease obligations (Note 6) |
$ | 109,848 | $ | 137,499 | ||||
| Current maturities of long-term debt with affiliate (Note 6) |
— | 4,132 | ||||||
| Accounts payable |
366,761 | 333,773 | ||||||
| Accrued liabilities |
132,614 | 127,823 | ||||||
| Total current liabilities |
609,223 | 603,227 | ||||||
| Long-term debt, net of current maturities (Note 6) |
432,726 | 112,602 | ||||||
| Long-term debt with affiliate, net of current maturities (Note 6) |
— | 399,776 | ||||||
| Obligations under capital leases, net of current maturities (Note 6) |
15,604 | 15,544 | ||||||
| Deferred tax liability—non-current |
12,710 | 13,917 | ||||||
| Pension liability (Note 10) |
76,403 | 78,730 | ||||||
| Other non-current liabilities |
81,884 | 86,869 | ||||||
| Total non-current liabilities |
619,327 | 707,438 | ||||||
| Total liabilities |
1,228,550 | 1,310,665 | ||||||
| Commitments and contingencies (Note 18) |
||||||||
| Redeemable preferred units (Note 12) |
— | 170,915 | ||||||
| Equity / (deficit): |
||||||||
| Tower International, Inc.’s equity / (deficit) |
||||||||
| Common units (Note 11) |
— | 12,595 | ||||||
| Common stock, $0.01 par value, 350,000,000 authorized, 19,101,588 issued and outstanding (Note 11) |
191 | — | ||||||
| Additional paid in capital |
296,262 | — | ||||||
| Accumulated deficit |
(192,556 | ) | (144,955 | ) | ||||
| Accumulated other comprehensive loss (Note 3) |
(36,530 | ) | (54,363 | ) | ||||
| Total Tower International, Inc.’s equity / (deficit) |
67,367 | (186,723 | ) | |||||
| Noncontrolling interests in subsidiaries |
44,259 | 39,564 | ||||||
| Total equity / (deficit) |
111,626 | (147,159 | ) | |||||
| Total liabilities and equity / (deficit) |
$ | 1,340,176 | $ | 1,334,421 | ||||
The accompanying notes are an integral part of these Consolidated Financial Statements.
77
Table of Contents
TOWER INTERNATIONAL, INC. AND SUBSIDIARIES
CONSOLIDATED STATEMENTS OF OPERATIONS
(Amounts in thousands, except per share amounts)
| Year
Ended December 31, 2010 |
Year
Ended December 31, 2009 |
Year
Ended December 31, 2008 |
||||||||||
| Revenues |
$ | 1,997,058 | $ | 1,634,405 | $ | 2,171,705 | ||||||
| Cost of sales |
1,786,476 | 1,536,752 | 1,991,325 | |||||||||
| Gross profit |
210,582 | 97,653 | 180,380 | |||||||||
| Selling, general and administrative expenses (Note 8) |
143,975 | 118,331 | 138,618 | |||||||||
| Amortization expense |
3,265 | 2,784 | 2,969 | |||||||||
| Restructuring and related asset impairment charges, net (Note 4) |
14,288 | 13,436 | 4,837 | |||||||||
| Operating income / (loss) |
49,054 | (36,898 | ) | 33,956 | ||||||||
| Interest expense |
66,872 | 57,881 | 63,778 | |||||||||
| Interest income |
962 | 982 | 3,588 | |||||||||
| Other expense / (income), net (Note 6) |
1,300 | (33,661 | ) | — | ||||||||
| Loss before provision for income taxes |
(18,156 | ) | (60,136 | ) | (26,234 | ) | ||||||
| Provision for income taxes (Note 9) |
10,297 | (1,104 | ) | 19,507 | ||||||||
| Net loss |
(28,453 | ) | (59,032 | ) | (45,741 | ) | ||||||
| Less: Net income attributable to the noncontrolling interests |
8,441 | 8,904 | 6,614 | |||||||||
| Net loss attributable to Tower International, Inc. |
$ | (36,894 | ) | $ | (67,936 | ) | $ | (52,355 | ) | |||
| Less: Preferred unit dividends |
$ | (10,707 | ) | $ | (16,087 | ) | $ | (14,940 | ) | |||
| Loss available to common shareholders |
$ | (47,601 | ) | $ | (84,023 | ) | $ | (67,295 | ) | |||
| Weighted average basic and diluted shares outstanding |
13,865,509 | 12,467,866 | 12,467,866 | |||||||||
| Basic and diluted loss per share attributable to Tower International, Inc.: |
||||||||||||
| Loss per share (Note 13) |
$ | (3.43 | ) | $ | (6.74 | ) | $ | (5.40 | ) | |||
The accompanying notes are an integral part of these Consolidated Financial Statements.
78
Table of Contents
TOWER INTERNATIONAL, INC. AND SUBSIDIARIES
CONSOLIDATED STATEMENTS OF CASH FLOWS
(Amounts in thousands)
| Year Ended December 31, 2010 |
Year Ended December 31, 2009 |
Year Ended December 31, 2008 |
||||||||||
| OPERATING ACTIVITIES: |
||||||||||||
| Net loss |
$ | (28,453 | ) | $ | (59,032 | ) | $ | (45,741 | ) | |||
| Adjustments required to reconcile net loss to net cash provided by operating activities: |
||||||||||||
| Non-cash restructuring and asset impairment charges |
9,999 | 1,787 | — | |||||||||
| Deferred income tax provision |
(13,851 | ) | (13,053 | ) | (269 | ) | ||||||
| Depreciation and amortization |
114,668 | 147,705 | 170,267 | |||||||||
| Gain from debt repurchase / letter of credit reduction |
— | (33,661 | ) | — | ||||||||
| Non-cash share-based compensation |
3,047 | — | — | |||||||||
| Pension expense, net of contributions |
(5,619 | ) | (2,102 | ) | (10,974 | ) | ||||||
| Change in working capital and other operating items |
40,568 | 7,231 | 87,267 | |||||||||
| Net cash provided by operating activities |
$ | 120,359 | $ | 48,875 | $ | 200,550 | ||||||
| INVESTING ACTIVITIES: |
||||||||||||
| Cash disbursed for purchases of property, plant and equipment, net |
$ | (100,495 | ) | $ | (85,995 | ) | $ | (116,620 | ) | |||
| Net assets acquired, net of cash acquired |
(16,687 | ) | — | (10,200 | ) | |||||||
| Net cash used in investing activities |
$ | (117,182 | ) | $ | (85,995 | ) | $ | (126,820 | ) | |||
| FINANCING ACTIVITIES: |
||||||||||||
| Proceeds from letter of credit reduction |
$ | — | $ | 13,250 | $ | — | ||||||
| Repayments of term debt |
(3,484 | ) | (16,381 | ) | (27,900 | ) | ||||||
| Repayment of first lien term loan |
(414,172 | ) | — | — | ||||||||
| Issuance of senior secured notes |
417,203 | — | — | |||||||||
| Partial redemption of senior secured notes |
(26,000 | ) | — | — | ||||||||
| Noncontrolling interest dividends |
(5,257 | ) | (4,866 | ) | (8,038 | ) | ||||||
| Preferred units dividends |
(95 | ) | (388 | ) | (5,600 | ) | ||||||
| Proceeds from borrowings |
418,237 | 436,172 | 316,094 | |||||||||
| Repayments of borrowings |
(452,286 | ) | (375,501 | ) | (306,843 | ) | ||||||
| Financing costs |
(8,356 | ) | (1,488 | ) | — | |||||||
| Net proceeds from initial public offering |
74,021 | — | — | |||||||||
| Net cash provided by (used in) financing activities |
$ | (189 | ) | $ | 50,798 | $ | (32,287 | ) | ||||
| Effect of exchange rate changes on cash and cash equivalents |
$ | (2,445 | ) | $ | 9,304 | $ | (11,411 | ) | ||||
| NET CHANGE IN CASH AND CASH EQUIVALENTS |
$ | 543 | $ | 22,982 | $ | 30,032 | ||||||
| CASH AND CASH EQUIVALENTS: |
||||||||||||
| Beginning of period |
$ | 149,802 | $ | 126,820 | $ | 96,788 | ||||||
| End of period |
$ | 150,345 | $ | 149,802 | $ | 126,820 | ||||||
| Supplemental Cash Flow Information: |
||||||||||||
| Interest paid, net of amounts capitalized |
$ | 43,437 | $ | 52,429 | $ | 61,187 | ||||||
| Income taxes paid |
14,384 | 14,950 | 18,739 | |||||||||
| Non-cash Investing Activities: |
||||||||||||
| Capital expenditures in liabilities for purchases of property, plant and equipment |
$ | 26,709 | $ | 24,396 | $ | 30,410 | ||||||
| Cumulative preferred stock units accrued |
10,612 | 15,699 | 9,339 | |||||||||
| Contribution of indebtedness |
25,000 | — | — | |||||||||
| Conversion of preferred units to common shares |
181,527 | — | — | |||||||||
The accompanying notes are an integral part of these Consolidated Financial Statements.
79
Table of Contents
TOWER INTERNATIONAL, INC. AND SUBSIDIARIES
CONSOLIDATED STATEMENTS OF EQUITY / (DEFICIT)* AND REDEEMABLE PREFERRED UNITS
(Amounts in thousands, except per share data)
| Common Stock Units/ Shares |
Amount | Additional Paid-in Capital |
Retained Earnings (Accumulated Deficit) |
Accumulated Other Comprehensive Income (Loss) |
Total Stockholders’ Equity / (Deficit)* Attributable to Tower International, Inc. |
Non controlling Interest Amount |
Total Equity (Deficit)* |
Redeemable Units |
||||||||||||||||||||||||||||||||||||
| Units | Amount | |||||||||||||||||||||||||||||||||||||||||||
| Balance at January 1, 2008 |
8,500 | $ | 11,250 | $ | — | $ | 6,362 | $ | 14,965 | $ | 32,577 | $ | 34,343 | $ | 66,920 | 10,000 | $ | 145,877 | ||||||||||||||||||||||||||
| Net loss |
— | — | — | (52,355 | ) | — | (52,355 | ) | 6,614 | (45,741 | ) | — | — | |||||||||||||||||||||||||||||||
| Other comprehensive income / (loss): |
||||||||||||||||||||||||||||||||||||||||||||
| Foreign currency translation adjustment (net of tax of $0) |
— | — | — | — | (15,455 | ) | (15,455 | ) | 2,626 | (12,829 | ) | — | — | |||||||||||||||||||||||||||||||
| Defined benefit plans, net (net of tax of $0) |
— | — | — | — | (65,156 | ) | (65,156 | ) | — | (65,156 | ) | — | — | |||||||||||||||||||||||||||||||
| Unrealized loss on qualifying cash flow hedge (net of tax of $0) |
— | — | — | — | (9,781 | ) | (9,781 | ) | — | (9,781 | ) | — | — | |||||||||||||||||||||||||||||||
| Total comprehensive income / (loss) |
— | — | — | — | — | (142,747 | ) | 9,240 | (133,507 | ) | — | — | ||||||||||||||||||||||||||||||||
| Preferred unit dividends paid |
— | — | — | (5,600 | ) | — | (5,600 | ) | — | (5,600 | ) | — | — | |||||||||||||||||||||||||||||||
| Cumulative preferred stock units accrued |
— | — | — | (9,339 | ) | — | (9,339 | ) | — | (9,339 | ) | — | 9,339 | |||||||||||||||||||||||||||||||
| Noncontrolling interest dividends |
— | — | — | — | — | — | (8,038 | ) | (8,038 | ) | — | — | ||||||||||||||||||||||||||||||||
| Unit-based compensation expense |
— | 1,039 | — | — | — | 1,039 | — | 1,039 | — | — | ||||||||||||||||||||||||||||||||||
| Balance at December 31, 2008 |
8,500 | $ | 12,289 | $ | — | $ | (60,932 | ) | $ | (75,427 | ) | $ | (124,070 | ) | $ | 35,545 | $ | (88,525 | ) | 10,000 | $ | 155,216 | ||||||||||||||||||||||
| Net loss |
— | — | — | (67,936 | ) | — | (67,936 | ) | 8,904 | (59,032 | ) | — | — | |||||||||||||||||||||||||||||||
| Other comprehensive income / (loss): |
||||||||||||||||||||||||||||||||||||||||||||
| Foreign currency translation adjustment (net of tax of $0) |
— | — | — | — | 12,470 | 12,470 | (19 | ) | 12,451 | — | — | |||||||||||||||||||||||||||||||||
| Defined benefit plans, net (net of tax of $2.9 million) |
— | — | — | — | 4,565 | 4,565 | — | 4,565 | — | — | ||||||||||||||||||||||||||||||||||
| Unrealized gain on qualifying cash flow hedge (net of tax of $2 million) |
— | — | — | — | 4,029 | 4,029 | — | 4,029 | — | — | ||||||||||||||||||||||||||||||||||
| Total comprehensive income / (loss) |
— | — | — | — | — | (46,872 | ) | 8,885 | (37,987 | ) | — | — | ||||||||||||||||||||||||||||||||
| Preferred unit dividends paid |
— | — | — | (388 | ) | — | (388 | ) | — | (388 | ) | — | — | |||||||||||||||||||||||||||||||
| Cumulative preferred stock units accrued |
— | — | — | (15,699 | ) | — | (15,699 | ) | — | (15,699 | ) | — | 15,699 | |||||||||||||||||||||||||||||||
| Noncontrolling interest dividends |
— | — | — | — | — | — | (4,866 | ) | (4,866 | ) | — | — | ||||||||||||||||||||||||||||||||
| Unit-based compensation expense |
— | 306 | — | — | — | 306 | — | 306 | — | — | ||||||||||||||||||||||||||||||||||
| Balance at December 31, 2009 |
8,500 | $ | 12,595 | $ | — | $ | (144,955 | ) | $ | (54,363 | ) | $ | (186,723 | ) | $ | 39,564 | $ | (147,159 | ) | 10,000 | $ | 170,915 | ||||||||||||||||||||||
| Net loss |
— | — | — | (36,894 | ) | — | (36,894 | ) | 8,441 | (28,453 | ) | — | — | |||||||||||||||||||||||||||||||
| Other comprehensive income / (loss): |
||||||||||||||||||||||||||||||||||||||||||||
| Foreign currency translation adjustment (net of tax of $0) |
— | — | — | — | 8,597 | 8,597 | 1,511 | 10,108 | — | — | ||||||||||||||||||||||||||||||||||
| Defined benefit plans, net (net of tax of $0 million) |
— | — | — | — | (3,060 | ) | (3,060 | ) | — | (3,060 | ) | — | — | |||||||||||||||||||||||||||||||
| Settlement of interest rate swap (net of tax of $2 million) |
12,551 | 12,551 | — | 12,551 | ||||||||||||||||||||||||||||||||||||||||
| Unrealized loss on qualifying cash flow hedge (net of tax of $0.1 million) |
— | — | — | — | (255 | ) | (255 | ) | — | (255 | ) | — | — | |||||||||||||||||||||||||||||||
| Total comprehensive income / (loss) |
— | — | — | — | — | (19,061 | ) | 9,952 | (9,109 | ) | — | — | ||||||||||||||||||||||||||||||||
| Preferred unit dividends paid |
— | — | — | (95 | ) | — | (95 | ) | — | (95 | ) | — | — | |||||||||||||||||||||||||||||||
| Cumulative preferred stock units accrued |
— | — | — | (10,612 | ) | — | (10,612 | ) | — | (10,612 | ) | — | 10,612 | |||||||||||||||||||||||||||||||
| Unit conversion—transfer of common and preferred units to capital units |
(8,500 | ) | (12,858 | ) | 12,858 | — | — | — | — | — | — | — | ||||||||||||||||||||||||||||||||
| Unit conversion—transfer of common and preferred units to capital units |
10,000 | — | 181,527 | — | — | 181,527 | — | 181,527 | (10,000 | ) | (181,527 | ) | ||||||||||||||||||||||||||||||||
| Contribution of indebtedness |
— | — | 25,000 | — | — | 25,000 | — | 25,000 | — | — | ||||||||||||||||||||||||||||||||||
| Corporate conversion—capital units to common shares |
(10,000 | ) | — | — | — | — | — | — | — | — | — | |||||||||||||||||||||||||||||||||
| Corporate conversion—capital units to common shares |
12,467,866 | 125 | (125 | ) | — | — | — | — | — | — | — | |||||||||||||||||||||||||||||||||
| Initial public offering |
6,633,722 | 66 | 73,955 | — | — | 74,021 | — | 74,021 | — | — | ||||||||||||||||||||||||||||||||||
| Share-based compensation expense |
— | — | 3,047 | — | — | 3,047 | — | 3,047 | — | — | ||||||||||||||||||||||||||||||||||
| Noncontrolling interest dividends |
— | — | — | — | — | — | (5,257 | ) | (5,257 | ) | — | — | ||||||||||||||||||||||||||||||||
| Unit-based compensation expense |
— | 263 | — | — | — | 263 | — | 263 | — | — | ||||||||||||||||||||||||||||||||||
| Balance at December 31, 2010 |
19,101,588 | $ | 191 | $ | 296,262 | $ | (192,556 | ) | $ | (36,530 | ) | $ | 67,367 | $ | 44,259 | $ | 111,626 | — | $ | — | ||||||||||||||||||||||||
| * | Prior to October 14, 2010 refers to members’ equity as the Company was not a public company |
The accompanying notes are an integral part of these Consolidated Financial Statements.
80
Table of Contents
TOWER INTERNATIONAL, INC. AND SUBSIDIARIES
NOTES TO CONSOLIDATED FINANCIAL STATEMENTS
Note 1. Nature of Business
Tower International, Inc. and its subsidiaries (collectively referred to as the “Company” or “Tower International”) is a leading integrated global producer of engineered structural metal components and assemblies primarily serving automotive original equipment manufacturers, or OEMs, including Volkswagen Group, Hyundai/Kia, Ford, Fiat, Volvo, Chrysler, Nissan, Daimler, Toyota, BMW, Chery, and Honda. Products include body structures stampings, chassis structures (including frames), and complex welded assemblies for small and large cars, crossovers, pickups and SUVs. Including both 100% owned subsidiaries and majority owned subsidiaries, the Company has strategically located production facilities in the United States, Belgium, Germany, Italy, Slovakia, Poland, Brazil, South Korea, and China, supported by engineering and sales locations in the United States, Germany, Italy, Brazil, South Korea, Japan, China, and India.
Note 2. Basis of Presentation and Organizational History
On October 14, 2010, in connection with its initial public offering (the “IPO”), Tower Automotive, LLC was converted to a Delaware corporation named Tower International, Inc. (the “Corporate Conversion”). Upon the Corporate Conversion, all of the equity interests in Tower Automotive, LLC were converted into common stock of Tower International, Inc. (see note 11 for further discussion).
On October 15, 2010, the Company’s common stock began trading on the New York Stock Exchange pursuant to the Company’s initial public offering (the “IPO”). On October 20, 2010, the Company received $75.6 million of proceeds, after underwriting discounts and commissions, in connection with the sale of 6,250,000 shares of common stock in the IPO. On November 8, 2010, the Company sold an additional 383,722 shares of common stock resulting in additional proceeds of $4.6 million, after underwriting discounts and commissions, pursuant to a partial exercise of the underwriters’ over-allotment option.
All references to the company in this Annual Report for periods prior to the effective time of our Corporate Conversion are to Tower Automotive, LLC and its subsidiaries. All references to our company in this Annual Report for periods subsequent to the effective time of our Corporate Conversion are to Tower International, Inc. and its subsidiaries.
Recent Accounting Pronouncements
Variable Interest Entities
In January 2010, the Company adopted amendments to Accounting Standards Codification (“ASC”) No. 810-10, Consolidation (ASC No. 810-10). These amendments require an enterprise to qualitatively assess the determination of the primary beneficiary of a variable interest entity (“VIE”) based on whether the enterprise: (i) has the power to direct the activities of a VIE that most significantly affect the entity’s economic performance; and (ii) has the obligation to absorb losses of the entity or the right to receive benefits from the entity that could potentially be significant to the VIE. These amendments also require, among other considerations, an ongoing reconsideration of the primary beneficiary. The adoption of this standard did not have a material impact on the Company’s financial statements.
Financial Accounting Standards Board (“FASB”) Accounting Standards Update (“ASU”) 2010-06, “Fair Value Measurements and Disclosures (Topic 820): Improving Disclosures about Fair Value Measurements”
In January 2010, the FASB issued ASU 2010-06 which amended ASC No. 820-10, Fair Value Measurement and Disclosures—Overall. ASU 2010-06 requires new disclosures regarding transfers in and out of assets and liabilities measured at fair value classified within the valuation hierarchy as either Level 1 or Level 2 and information about sales, issuances and settlements on a gross basis for assets and liabilities classified as Level 3.
81
Table of Contents
ASU 2010-06 clarifies existing disclosures on the level of disaggregation required and inputs and valuation techniques. The provisions of ASU 2010-06 became effective for the Company on January 1, 2010, except for disclosure of information about sales, issuances and settlements on a gross basis for assets and liabilities classified as Level 3, which is effective for the Company on January 1, 2011. The provisions of ASU 2010-06 impact disclosures only and the Company has disclosed information in accordance with the revised provisions of ASU 2010-06 within this report.
Note 3. Significant Accounting Policies
Financial Statement Presentation
a. Principles of Consolidation
The consolidated financial statements include the accounts of the Company and all subsidiaries that are more than 50% owned and over which the Company exercises control. The Company’s share of earnings or losses of nonconsolidated affiliates are included in the consolidated operating results using the equity method of accounting when the Company is able to exercise significant influence over the operating and financial decisions of the affiliates. The Company did not have any nonconsolidated affiliates during the periods presented in this report. All intercompany transactions and balances have been eliminated upon consolidation.
b. Cash and Cash Equivalents
All highly liquid investments with an original maturity of three months or less are considered to be cash equivalents. Cash equivalents are stated at cost, which approximates fair value. Substantially all of the Company’s cash is concentrated in a few financial institutions.
c. Allowance for Doubtful Accounts
The Company maintains an allowance for doubtful receivables for estimated losses resulting from the inability of its trade customers to make required payments. The Company provides an allowance for specific customer accounts where collection is doubtful and also provides an allowance for customer deductions based on historical collection and write-off experience. Additional allowances could be required if the financial condition of the Company’s customers deteriorated. Bad debt expense is not material for any periods presented.
d. Inventories
Inventories are stated at the lower of cost or market. Cost is determined by the first-in, first-out (“FIFO”) method. In addition, the Company uses a valuation account for inventory obsolescence, which has not been material for any periods presented. Maintenance, repair and non-productive inventory, which are considered consumables, are expensed when acquired in cost of sales. Inventories consist of the following (in thousands):
| December 31, 2010 |
December 31, 2009 |
|||||||
| Raw materials |
$ | 29,762 | $ | 21,911 | ||||
| Work in process |
19,335 | 20,841 | ||||||
| Finished goods |
24,092 | 19,859 | ||||||
| Total inventory |
$ | 73,189 | $ | 62,611 | ||||
e. Tooling
Tooling represents costs incurred by the Company in the development of new tooling used in the manufacture of the Company’s products. All pre-production tooling costs, incurred for tools that the Company will not own and
82
Table of Contents
that will be used in producing products supplied under long-term supply agreements, are expensed as incurred unless the supply agreement provides the Company with the non-cancelable right to use the tools or the reimbursement of such costs is contractually guaranteed by the customer. Generally, the customer agrees to reimburse the Company for certain of its tooling costs at the time the customer awards a contract to the Company.
When the part for which tooling has been developed reaches a production-ready status, the Company is reimbursed by its customer for the cost of the tooling at which time the tooling becomes the property of the customer. The Company has certain other tooling costs, which are capitalized and amortized over the life of the related product program, related to tools which the Company has the contractual right to use during the life of the supply arrangement. Customer-owned tooling is included in prepaid tooling and other and company-owned tooling is included in other assets in the Consolidated Balance Sheet. The components of capitalized tooling costs are as follows (in thousands):
| December 31, 2010 |
December 31, 2009 |
|||||||
| Customer-owned tooling |
$ | 38,683 | $ | 33,713 | ||||
| Company-owned tooling |
3,828 | 5,492 | ||||||
| Total tooling |
$ | 42,511 | $ | 39,205 | ||||
Any gain recognized, which is defined as the excess of reimbursement over cost, is amortized over the life of the program. If estimated costs are expected to be in excess of reimbursement, a loss is recorded in the period when the loss is estimated.
f. Property, Plant and Equipment
Property, plant and equipment are recorded at cost, less accumulated depreciation. Depreciation expense was $111.4 million, $144.9 million, and $167.3 million for the years ended December 31, 2010, 2009, and 2008. Depreciation is computed using the straight-line method over the following estimated useful lives of assets as follows:
| Buildings and improvements |
32 to 40 years | |||
| Machinery and equipment |
3 to 20 years |
Leasehold improvements are amortized over the shorter of 10 years or the remaining lease term at the date of acquisition of the leasehold improvement.
Interest is capitalized during the preparation of facilities for product programs and is amortized over the estimated lives of the programs. Interest of $1.9 million, $0.9 million and $0.6 million was capitalized in 2010, 2009, and 2008, respectively.
Costs of maintenance and repairs are charged to expense as incurred in cost of sales. Spare parts are considered capital in nature when purchased during the initial investment of a fixed asset. Amounts relating to significant improvements, which extend the useful life or utility of the related asset, are capitalized and depreciated over the remaining life of the asset. Upon disposal or retirement of property, plant and equipment, the cost and related accumulated depreciation are eliminated from the respective accounts and the resulting gain or loss is recognized in the Consolidated Statements of Operations.
83
Table of Contents
Property, plant and equipment consist of the following (in thousands):
| December 31, 2010 |
December 31, 2009 |
|||||||
| Cost: |
||||||||
| Land |
$ | 61,885 | $ | 87,774 | ||||
| Buildings and improvements |
209,696 | 164,529 | ||||||
| Machinery and equipment |
765,670 | 722,136 | ||||||
| Construction in progress |
91,705 | 55,604 | ||||||
| Property, plant, and equipment, gross |
1,128,956 | 1,030,043 | ||||||
| Less: accumulated depreciation |
(501,459 | ) | (389,895 | ) | ||||
| Property, plant, and equipment, net |
$ | 627,497 | $ | 640,148 | ||||
g. Asset Retirement Obligations
FASB ASC No. 410, Asset Retirement and Environmental Obligations, requires the recognition of a liability for the fair value of a conditional asset retirement obligation if the fair value can be reasonably estimated. An asset retirement obligation is a legal obligation to perform certain activities in connection with retirement, disposal or abandonment of assets. The fair value of a conditional asset retirement obligation should be recognized when incurred, generally upon acquisition, construction or development and through the normal operation of the asset. Uncertainty about the timing or method of settlement of a conditional asset retirement should be factored into the measurement of the liability. The liability is measured at discounted fair value and is adjusted to its present value in subsequent periods. The Company’s asset retirement obligations are primarily associated with renovating, upgrading, and returning leased property to the lessor in accordance with the requirements of the lease.
Asset retirement obligations are included in other non-current liabilities in the Consolidated Balance Sheet. The following table reconciles our asset retirement obligations as of December 31, 2010 and 2009 (in thousands):
| December 31, 2010 |
December 31, 2009 |
|||||||
| Asset retirement obligation as of January 1 |
$ | 12,906 | $ | 13,106 | ||||
| Accretion expense |
1,104 | 1,127 | ||||||
| Liabilities settled |
(2,145 | ) | (1,327 | ) | ||||
| Asset retirement obligation as of December 31 |
$ | 11,865 | $ | 12,906 | ||||
h. Impairment of Long-Lived Assets
The Company monitors its long-lived assets for impairment indicators on an ongoing basis in accordance with FASB ASC No. 360, Property, Plant, and Equipment. If impairment indicators exist, the Company performs the required analysis and records impairment charges. In conducting its analysis, the Company compares the undiscounted cash flows expected to be generated from the long-lived assets to the related net book values. If the undiscounted cash flows exceed the net book value, the long-lived assets are considered not to be impaired. If the net book value exceeds the undiscounted cash flows, an impairment loss is measured and recognized. An impairment loss is measured as the difference between the net book value and the fair value of the long-lived assets. Fair value is estimated based upon discounted cash flow analyses. Cash flows are estimated using internal budgets based on recent sales data and independent automotive production volume estimates and customer commitments. Changes in economic or operating conditions impacting these estimates and assumptions could result in the impairment of long-lived assets. Refer to note 4 for discussion of impairment charges for the periods presented.
84
Table of Contents
Long-lived assets held for sale are recorded at the lower of their carrying amount or estimated fair value less cost to sell.
i. Goodwill and Other Intangible Assets
Goodwill represents the excess of the cost of an acquisition over the fair value of net assets acquired. Goodwill is not amortized but is tested for impairment on at least an annual basis. In accordance with FASB ASC No. 350, Intangibles—Goodwill and Other, goodwill is reviewed for impairment utilizing a two-step process. The first step of the impairment test requires the identification of the reporting units, and comparison of the fair value of each of these reporting units to the respective carrying value. The Company defines its reporting units as Europe, Asia, North America, and South America. The recoverability of goodwill is evaluated at the following reporting units for which goodwill exists: Europe and South America. These reporting units exist at a lower level than our reportable segments. If the carrying value is less than the fair value, no impairment exists and the second step is not performed. In the second step, the impairment is computed by comparing the implied fair value of reporting unit goodwill with the carrying amount of that goodwill. FASB ASC No. 350 requires goodwill to be tested for impairment annually at the same time every year, and when an event occurs or circumstances change such that it is reasonably possible that impairment may exist. The annual impairment test is performed at year end.
The Company utilizes an income approach to estimate the fair value of each of its reporting units. The income approach is based on projected debt free cash flow which is discounted to the present value using discount factors that consider the timing and risk of cash flows. The Company believes that this approach is appropriate because it provides a fair value estimate based upon the reporting units’ expected long-term operating cash flow performance. This approach also mitigates the impact of cyclical trends that occur in the industry. Fair value is estimated using recent automotive industry and specific platform production volume projections, which are based on internally-developed forecasts, as well as commercial, wage and benefit, inflation and discount rate assumptions. Other significant assumptions include terminal value growth rates, terminal value margin rates, future capital expenditures, known restructuring actions, and changes in future working capital requirements. While there are inherent uncertainties related to the assumptions used and to management’s application of these assumptions to this analysis, the Company believes that the income approach provides a reasonable estimate of the fair value of its reporting units. However, the Company’s assumptions and estimates may differ significantly from actual results. The Company also uses a second approach, which is the market multiple approach, to test the reasonableness of the income approach.
The Company’s 2010 and 2009 annual goodwill impairment analysis, completed as of each year end, indicated that the carrying value of the Europe and South America reporting units was less than the respective fair values; thus, no impairment existed at either date. The Company also performed an interim goodwill impairment analysis during 2010 as the Company deemed its IPO to be a triggering event. The fair value of each reporting unit was substantially in excess of the carrying value for each analysis performed.
The change in the carrying amount of goodwill is set forth below on a segment and consolidated basis (in thousands):
| International | Americas | Consolidated | ||||||||||
| Balance at December 31, 2008 |
$ | 65,453 | $ | 2,626 | $ | 68,079 | ||||||
| Currency translation adjustment |
1,626 | 860 | 2,486 | |||||||||
| Balance at December 31, 2009 |
67,079 | 3,486 | 70,565 | |||||||||
| Currency translation adjustment |
(4,433 | ) | 177 | (4,256 | ) | |||||||
| Balance at December 31, 2010 |
$ | 62,646 | $ | 3,663 | $ | 66,309 | ||||||
The Company has certain intangible assets that are related to customer relationships. These intangible assets have definite lives and are amortized on a straight-line basis, which approximates the recognition of related revenue, over the estimated lives of the related assets. The intangible assets are recorded in other assets. The Company
85
Table of Contents
anticipates amortization expense of $3.6 million, $3.6 million, $2.9 million, and $1.6 million for the years ended December 31, 2011, 2012, 2013, and 2014, respectively, at which time no further amortization expense will be incurred. The Company has incurred amortization expense of $3.3 million, $2.8 million, and $3 million, respectively, for the years ended December 31, 2010, 2009 and 2008. The following table presents information about the intangible assets of the Company at December 31, 2010 and 2009, respectively (in thousands):
| Weighted Average Life |
As of December 31, 2010 | As of December 31, 2009 | ||||||||||||||||||
| Gross Carrying Amount |
Accumulated Amortization |
Gross Carrying Amount |
Accumulated Amortization |
|||||||||||||||||
| Amortized intangibles: |
||||||||||||||||||||
| Europe |
6 years | $ | 16,011 | $ | 7,504 | $ | 14,664 | $ | 5,074 | |||||||||||
| Brazil |
7 years | 5,935 | 2,749 | 5,790 | 1,911 | |||||||||||||||
| Total intangibles |
$ | 21,946 | $ | 10,253 | $ | 20,454 | $ | 6,985 | ||||||||||||
j. Fair Value of Financial Instruments
Fair value is generally determined based on quoted market prices in active markets for identical assets or liabilities. If quoted market prices are not available, the Company uses valuation techniques that place greater reliance on observable inputs and less reliance on unobservable inputs. In measuring fair value, the Company may make adjustments for risks and uncertainties, if a market participant would include such an adjustment in its pricing.
FASB ASC No. 820, Fair Value Measurements, establishes a fair value hierarchy that distinguishes between assumptions based on market data, referred to as observable inputs, and the Company’s assumptions, referred to as unobservable inputs. Determining where an asset or liability falls within that hierarchy depends on the lowest level input that is significant to the fair value measurement as a whole. An adjustment to the pricing method used within either level 1 or level 2 inputs could generate a fair value measurement that effectively falls in a lower level in the hierarchy. The hierarchy consists of three broad levels as follows:
| Level 1: |
Quoted market prices in active markets for identical assets and liabilities; | |
| Level 2: |
Inputs other than level 1 inputs that are either directly or indirectly observable; and | |
| Level 3: |
Unobservable inputs developed using our estimates and assumptions, which reflect those that market participants would use. | |
At December 31, 2010, the carrying value and estimated fair value of the Company’s long-term debt was $539.6 million and $578.5 million, respectively. At December 31, 2009, the carrying value and estimated fair value of the Company’s long-term debt was $651.9 million. The majority of the Company’s long-term debt at December 31, 2010 is traded in the market and is classified as a level 2 measurement as the debt is thinly traded. The fair value was determined based on the quoted market values. The remainder of the Company’s long-term debt of foreign subsidiaries is asset-backed and is classified as level 3. As this debt carries variable rates and minimal credit risk, the book value approximates the fair value for this debt. The majority of the Company’s long-term debt at December 31, 2009 was owned by an affiliate of the Company and was classified as a level 3 measurement. The fair value was determined using significant unobservable inputs based on the estimated fair value of comparable instruments with quoted active market values.
The Company is party to certain derivative financial instruments, which are all classified as level 2 measurements determined using significant other observable inputs. The Company also has certain assets that have been classified as held for sale. The fair value of the long-lived assets held for sale was determined using
86
Table of Contents
third-party appraisals. The third-party appraisals use current market conditions to determine the fair market value; therefore, are classified as level 3.
The carrying amounts of cash and cash equivalents, accounts receivables, accounts payables, and accruals approximate fair value because of the short maturity of these instruments.
The following table provides each major category of assets and liabilities measured at fair value on a nonrecurring basis during the period (in millions):
| Quoted prices in active markets for identical assets |
Significant other observable inputs |
Significant unobservable inputs |
Total Gains
/ (losses) | |||||||||||
| Level 1 | Level 2 | Level 3 | ||||||||||||
| Description |
||||||||||||||
| Long-lived assets held for sale |
Not applicable | Not applicable | $ | 4.0 | $(2.7) | |||||||||
| Asset impairments |
Not applicable | Not applicable | $ | 0.7 | $(7.3) | |||||||||
In accordance with FASB ASC No. 360, Property, Plant, & Equipment, long-lived assets held for sale with a carrying amount of $6.7 million were written down to their fair value of $4.3 million, less cost to sell of $0.3 million (or $4 million), resulting in a loss of $2.7 million, which was included in earnings for the period.
In accordance with FASB ASC No. 360, equipment specifically purchased for use with the Company’s solar agreement with Stirling Energy Systems (SES) with a carrying amount of $8 million was written down to the fair value of $0.7 million, resulting in a loss of $7.3 million, which was included in earnings for the period.
k. Derivative Financial Instruments
Periodically, the Company uses derivative financial instruments to manage the risk that changes in interest rates will have on the amount of future interest payments. Interest rate swap contracts are used to adjust the proportion of total debt that is subject to variable and fixed interest rates. The Company is not a party to leveraged derivatives and does not enter into derivative financial instruments for trading or speculative purposes. Under FASB ASC No. 815, Derivatives and Hedging, all derivatives are recorded at fair value and the changes in fair value are immediately included in earnings if the derivatives do not qualify as effective cash flow hedges. If a derivative is a fair value hedge, then changes in the fair value of the derivative are offset against the changes in the fair value of the underlying hedged item. If a derivative is a cash flow hedge, then changes in the fair value of the derivative are recognized as a component of accumulated other comprehensive income until the underlying hedged item is recognized in earnings.
The Company formally documents hedge relationships, including the identification of the hedging instruments and the hedged items, as well as the risk management objectives and strategies for undertaking the hedge transaction. Effective hedges are recorded at fair value in other long-term liabilities with a corresponding offset to accumulated other comprehensive income in the Consolidated Balance Sheet. This process includes linking derivatives that are designated as hedges of specific assets, liabilities, firm commitments or forecasted transactions. The Company also formally assesses, both at inception and at least quarterly thereafter, whether a derivative used in a hedging transaction is highly effective in offsetting changes in either the fair value or cash flows of the hedged item. The Company will discontinue hedge accounting when it is determined that a derivative ceases to be an effective hedge. As of December 31, 2009, an accumulated loss of $12.6 million was recorded in accumulated other comprehensive income relating to the Company’s two cash flow hedges which were considered effective. The hedges were terminated in August 2010 in connection with the retirement of the
87
Table of Contents
first lien term loan. By termination, the amounts that had been recorded in accumulated other comprehensive were expensed through interest expense. Refer to note 7 for further discussion.
l. Revenue Recognition
The Company recognizes revenue once the criteria in FASB ASC No. 605, Revenue Recognition, have been met. These criteria are that persuasive evidence of an arrangement exists, delivery has occurred or services have been rendered, the Company’s price to the buyer is fixed or determinable, and collectability is reasonably assured.
The Company recognizes revenue as its products are shipped to its customers at which time title and risk of loss pass to the customer. The Company participates in certain customers’ steel repurchase programs. Under these programs, the Company purchases steel directly from a customer’s designated steel supplier for use in manufacturing products. The Company takes delivery and title to such steel and bears the risk of loss and obsolescence. The Company invoices its customers based upon annually negotiated selling prices, which inherently include a component for steel under such repurchase programs. Under guidance provided in FASB ASC No. 605-45, Principal Agent Considerations, the Company has substantial risks and rewards of ownership and is acting as a principal. Therefore, for sales where the Company participates in a customer’s steel resale program, revenue is recognized on a gross basis for the entire amount of the sales, including the component for purchases under that customer’s steel resale program.
The Company enters into agreements to produce products for its customers at the beginning of a given vehicle program life. Once such agreements are entered into by the Company, fulfillment of the customers’ purchasing requirements is the obligation of the Company for the entire production period of the vehicle programs, which range from three to ten years, and generally the Company has no provisions to terminate such contracts. Additionally, the Company tracks the aging of uncollected billings and adjusts its accounts receivable allowance on a quarterly basis as necessary based on its evaluation of the probability of collection. The adjustments the Company has made due to the write-off of uncollectible amounts have been negligible.
m. Income Taxes
The Company accounts for income taxes under the asset and liability method, which requires the recognition of deferred tax assets and liabilities for the expected future tax consequences of events that have been included in the financial statements. Under this method, deferred tax assets and liabilities are determined based on the differences between the consolidated financial statements and tax basis of assets and liabilities using enacted tax rates in effect for the year in which the differences are expected to reverse. The Company records net deferred tax assets to the extent it believes that these assets will more likely than not be realized. In making such determination, the Company considers all available positive and negative evidence, including future reversals of existing taxable temporary differences, projected future taxable income, tax planning strategies and recent financial operations. Valuation allowances have been recorded where it has been determined that it is more likely than not the Company will not be able to realize the net deferred tax assets. Previously established valuation allowances are reversed into income when there is compelling evidence, typically three or more consecutive years of cumulative profit or other positive evidence, that the future tax profitability will be sufficient to utilize the deferred tax asset. Due to the significant judgment involved in determining whether deferred tax assets will be realized, the ultimate resolution of these items may be materially different from the previously estimated outcome.
During 2010, the valuation allowance on deferred taxes in South Korea was reversed. The Company determined that the valuation allowance was no longer necessary because the profitability of its South Korean operations had improved over the prior two years and the expected production volumes in South Korea are remaining at or above the levels experienced in 2008. The impact on income tax expense was a benefit of $7.8 million, representing $9.1 million valuation allowance reversal offset by $1.3 million of income tax expense for the establishment of a reserve for uncertain tax positions required under FASB ASC No. 740, Income Taxes.
88
Table of Contents
Pursuant to FASB ASC No. 740, the Company allocated a tax benefit of $4.9 million to continuing operations in 2009 due to the gain in other comprehensive income which offset a portion of the losses from continuing operations. There was a corresponding tax provision of $4.9 million charged to other comprehensive income. During 2010, the $2 million tax benefit associated with the gain on the interest rate swaps was reversed upon termination of the hedge.
Changes in tax laws and rates could also affect recorded deferred tax assets and liabilities in the future. Management is not aware of any such changes that would have a material effect on the Company’s results of operations, cash flows or financial position.
The calculation of the Company’s tax liabilities involves dealing with uncertainties in the application of complex tax laws and regulations in a multitude of jurisdictions across the Company’s global operations.
FASB ASC No. 740, provides that a tax benefit from an uncertain tax position may be recognized when it is more likely than not that the position will be sustained upon examination, including resolutions of any related appeals or litigation processes, based on the technical merits. FASB ASC No. 740 also provides guidance on measurement, derecognition, classification, interest and penalties, accounting in interim periods, disclosure and transition.
The Company recognizes tax liabilities in accordance with FASB ASC No. 740 and adjusts these liabilities when its judgment changes as a result of the evaluation of new information not previously available. Due to the complexity of some of these uncertainties, the ultimate resolution may result in a payment that is materially different from the Company’s current estimate of the tax liabilities. These differences will be reflected as increases or decreases to income tax expense in the period in which they are determined.
n. Segment Reporting
The Company determines its reportable segments based on the guidance in FASB ASC No. 280, Segment Reporting. The Company defines its operating segments as components of its business where separate financial information is available and is routinely evaluated by management. Management reviews financial information based on four operating segments: Europe, Asia, North America, and South America. The Company aggregates the four operating segments into two reportable segments consistent with the aggregation criteria in FASB ASC No. 280 as the Company’s operations have similar economic characteristics, and share fundamental characteristics including the nature of the products, production processes, customers, and distribution channels. The Company’s two reportable segments are the Americas, consisting of North and South America, and International, consisting of Europe and Asia. See note 16 for further discussion.
o. Foreign Currency Translation
The functional currency of the Company’s foreign operations is the local currency in which they operate. Assets and liabilities of the Company’s foreign operations are translated into U.S. dollars using the applicable period end rates of exchange. Results of operations are translated at applicable average rates prevailing throughout the period. Translation gains or losses are reported as a separate component of accumulated other comprehensive income in the accompanying Consolidated Statements of Equity / (Deficit) and Redeemable Preferred Units. Gains and losses resulting from foreign currency transactions, the amounts of which are not material in all periods presented, are included in net income / (loss).
p. Exit or Disposal Activities
Costs to idle, consolidate, or close facilities and provide postemployment benefits to employees on an other than temporary basis are accrued based on management’s best estimate of the wage and benefit costs that will be
89
Table of Contents
incurred. Costs related to idlings of employees that are expected to be temporary are expensed as incurred. Costs to terminate a contract without economic benefit to the Company are expensed at the time the contract is terminated. One-time termination benefits that are not subject to contractual arrangements provided to employees who are involuntarily terminated are recorded when management commits to a detailed plan of termination, that plan is communicated to employees, and actions required to complete the plan indicate that significant changes are not likely. If employees are required to render service until they are terminated in order to earn termination benefits, the benefits are recognized ratably over the future service period.
q. Share-based compensation
The Company measures compensation cost arising from the grant of share-based awards to employees at fair value. The Company recognizes such costs in income over the period during which the requisite service is provided, usually the vesting period.
r. Accumulated Other Comprehensive Income / (Loss) (AOCI)
The components of accumulated other comprehensive loss, net of tax, in equity / (deficit) is as follows (in thousands):
| December 31, 2010 |
December 31, 2009 |
|||||||
| Foreign currency translation |
$ | 29,808 | $ | 21,211 | ||||
| Defined benefit plans, net |
(66,083 | ) | (63,023 | ) | ||||
| Unrealized loss on qualifying cash flow hedge, net |
(255 | ) | (12,551 | ) | ||||
| Accumulated other comprehensive loss |
$ | (36,530 | ) | $ | (54,363 | ) | ||
During the year ended December 31, 2010, $1.5 million was transferred out of accumulated other comprehensive (AOCI) through net periodic benefit cost related to the amortization of the loss on the Company’s defined benefit plan and $10.6 million and $2 million that had been recorded in AOCI related to the Company’s cash flow hedges were transferred out of AOCI through interest expense and income tax expense, respectively.
s. Estimates
The preparation of financial statements in conformity with accounting principles generally accepted in the United States requires management to make estimates and assumptions that affect the reported amounts of assets and liabilities and disclosure of contingent assets and liabilities at the date of the financial statements and the reported amounts of revenues and expenses during the reporting period. Generally, matters subject to estimation and judgment include amounts related to accounts receivable realization, inventory obsolescence, fair value measurements, pension and other postretirement benefit plan assumptions, restructuring reserves, self-insurance accruals, asset valuation reserves and accruals related to environmental remediation costs, asset retirement obligations and income taxes. Actual results may differ from those estimates and assumptions, and changes in such estimates and assumptions may affect amounts reported in future periods.
t. Accounting Standards Not Yet Adopted
The FASB has not published any accounting standards affecting the Company that the Company has not yet adopted as of December 31, 2010.
90
Table of Contents
Note 4. Restructuring and Asset Impairment Charges
The Company has executed various restructuring plans and may execute additional plans in the future to realign manufacturing capacity to prevailing global automotive production and to improve the utilization of remaining facilities. Estimates of restructuring charges are based on information available at the time such charges are recorded. Due to the inherent uncertainty involved in estimating restructuring expenses, actual amounts paid for such activities may differ from amounts initially recorded. Accordingly, the Company may record revisions of previous estimates by adjusting previously established reserves.
Restructuring Charges
Restructuring charges and asset impairments for each of our segments include the following (in thousands):
| Year Ended December 31, | ||||||||||||
| 2010 | 2009 | 2008 | ||||||||||
| International |
$ | 3,302 | $ | 12,619 | $ | 1,427 | ||||||
| Americas |
10,986 | 817 | 3,410 | |||||||||
| Consolidated |
$ | 14,288 | $ | 13,436 | $ | 4,837 | ||||||
The following table sets forth net restructuring expense by type for the periods presented (in thousands):
| Year Ended December 31, | ||||||||||||
| 2010 | 2009 | 2008 | ||||||||||
| Employee termination costs |
$ | 573 | $ | 12,860 | $ | 9,697 | ||||||
| Other exit costs |
3,716 | 5,699 | 4,283 | |||||||||
| Asset impairments |
9,999 | 1,787 | — | |||||||||
| Restructuring income |
— | (6,910 | ) | (9,143 | ) | |||||||
| Total restructuring expense |
$ | 14,288 | $ | 13,436 | $ | 4,837 | ||||||
The Company incurred restructuring expense of $14.3 million during the year ended December 31, 2010. The Company incurred restructuring expense of $20.3 million and $13.9 million, respectively, during the years ended December 31, 2009 and 2008, which were offset by $6.9 million and $9.1 million, respectively, of restructuring income.
The restructuring income was related to the cancellation of an old customer program relating to the Company’s closed facility in Milwaukee, Wisconsin. This income was recorded in the Americas segment. As of December 31, 2009, all recoveries had been received.
The charges incurred during 2010, 2009, and 2008 primarily related to the following actions:
2010 Actions
During the fourth quarter of 2010, the Company recorded an impairment charge of $7.3 million related to its non-automotive business. The charge taken relates to the equipment specifically purchased for use with the Company’s solar agreement with Stirling Energy Systems (SES), less any anticipated salvage value. The Company also recorded an expense of $2.3 million related to the sale of a closed facility in Granite City, Illinois. During the first quarter of 2010, the Company classified its Bergisch Gladbach facility as held for sale (see note 5), which resulted in an impairment charge of $2.7 million to align the book value with the estimated fair value, less costs to sell. The additional charges incurred in 2010 in both the International and Americas segments related to other severance costs and ongoing maintenance of facilities closed as a result of prior actions.
91
Table of Contents
2009 Actions
In July 2009 in the International segment, the Company announced the closure of its press shop in Bergisch Gladbach, Germany. This closure impacted 57 employees, who ceased employment with the Company in October 2009. Total estimated costs of the closure of this facility are $10.2 million which is comprised of $9.1 million of severance costs and $1.1 million of other exit costs. The Company recorded the entire charge of $10.2 million during 2009 related to the closure of the Bergisch press shop. The additional charges incurred in 2009 in both the International and Americas segments relate to other severance costs, ongoing maintenance of facilities closed as a result of prior actions, and an additional impairment charge on an asset held for sale.
2008 Actions
In September 2008 in the Americas segment, the Company announced certain restructuring activities in its North American operations. The Company announced the closure of its Traverse City, Michigan facility. This closure impacted approximately 360 employees. The costs of the Traverse City, Michigan facility closure were recognized over the required service period of the employees through April 2009. Charges of $4 million and $4.5 million, respectively, were recognized during the years ended December 31, 2009 and 2008 for a cumulative charge of $8.5 million. The charges incurred during 2009 were comprised of $0.1 million of severance costs, $1.8 million for an impairment charge on the facility, and $2.1 million of other exit costs. The charges incurred during 2008 were comprised of $4.4 million of severance costs and $0.1 million of other exit costs.
Restructuring Reserve
The table below summarizes the activity in the accrual by segment, reflected in accrued liabilities, for the above-mentioned actions through December 31, 2010 (in thousands):
| International | Americas | Consolidated | ||||||||||
| Balance at December 31, 2008 |
$ | 2,355 | $ | 4,876 | $ | 7,231 | ||||||
| Payments |
(3,458 | ) | (3,755 | ) | (7,213 | ) | ||||||
| Increase in liability |
9,290 | 323 | 9,613 | |||||||||
| Adjustment to liability |
— | 117 | 117 | |||||||||
| Balance at December 31, 2009 |
8,187 | 1,561 | 9,748 | |||||||||
| Payments |
(7,713 | ) | (3,419 | ) | (11,132 | ) | ||||||
| Increase in liability |
580 | 3,731 | 4,311 | |||||||||
| Adjustment to liability |
(233 | ) | (986 | ) | (1,219 | ) | ||||||
| Balance at December 31, 2010 |
$ | 821 | $ | 887 | $ | 1,708 | ||||||
Except as disclosed in the table above, the Company does not anticipate incurring additional material cash charges associated with the actions described above. The increase in the liability above does not agree with the restructuring charges in the table above as certain items are expensed as incurred related to the actions described. The liability primarily relates to severance, with the exception of costs accrued resulting from the sale of a closed facility in 2010.
The liability decreased during 2010 primarily due to severance payments made relating to the closure of the Company’s facility in Bergisch Gladbach, Germany. Of the $1.7 million restructuring reserve accrued as of December 31, 2010, the majority is expected to be paid in 2011. In the Americas segment, the liability increased during the year primarily related to the sale of a closed facility; however, the majority of the payments relating to the sale were made as of December 31, 2010.
The liability increased during 2009 primarily due to restructuring actions taken in the Company’s International segment. In July 2009, the Company announced the closure of its press shop in Bergisch Gladbach, Germany and colleagues ceased employment with the Company in October 2009.
92
Table of Contents
During the year ended December 31, 2010, the Company incurred severance payments related to prior accruals in Europe of $7.7 million and in North America of $3.4 million. During the year ended December 31, 2009, the Company incurred severance payments related to prior accruals in Europe of $2.4 million, Asia of $1 million, North America of $3.1 million, and Brazil of $0.7 million.
Note 5. Assets Held for Sale
The Company has three locations that are considered held for sale in accordance with FASB ASC No. 360, Property, Plant, and Equipment. The three locations are Gunpo, South Korea; Bergisch Gladbach, Germany; and Milwaukee, Wisconsin. The Gunpo facility was classified as held for sale in 2009 and the Bergisch and Milwaukee facilities were classified as held for sale in the first quarter of 2010. The Company’s facility in Traverse City, Michigan classified as held for sale in 2009 was sold during the third quarter of 2010, at an amount close to the revised carrying value. The Company’s management has demonstrated intent to sell these locations by listing the properties with local real estate agencies at prices deemed reasonable in comparison to their respective fair values; thus, the Company expects to sell these locations within one year. Accordingly, the Company has recorded these locations at fair value, ceased depreciation on them, and classified them as held for sale. The following table summarizes assets held for sale by category (in thousands):
| December 31, 2010 |
December 31, 2009 |
|||||||
| Land |
$ | 6,426 | $ | 2,868 | ||||
| Building |
1,752 | 3,140 | ||||||
| Total |
$ | 8,178 | $ | 6,008 | ||||
Note 6. Debt
Long-Term Debt
Long-term debt consists of the following (in thousands):
| December 31, 2010 |
December 31, 2009 |
|||||||
| Senior secured notes, due September 1, 2017 (net of discount of $11,410) |
$ | 392,590 | $ | — | ||||
| First lien term borrowings, due July 31, 2013 |
— | 471,033 | ||||||
| Revolving credit facility |
— | 24,500 | ||||||
| Other foreign subsidiary indebtedness |
147,034 | 156,403 | ||||||
| Total long-term debt |
539,624 | 651,936 | ||||||
| Less current maturities |
(106,898 | ) | (139,558 | ) | ||||
| Long-term debt, net of current portion |
$ | 432,726 | $ | 512,378 | ||||
The current maturities do not include capital lease obligations of $3 million and $2.1 million as of December 31, 2010 and 2009.
93
Table of Contents
Future maturities of long-term debt as of December 31, 2010 are as follows (in thousands):
| 2011 |
$ | 106,898 | ||
| 2012 |
35,676 | |||
| 2013 |
4,460 | |||
| 2014 |
— | |||
| 2015 |
— | |||
| Thereafter |
392,590 | |||
| Total |
$ | 539,624 | ||
Senior Secured Notes
On August 24, 2010, the Company’s subsidiaries Tower Automotive Holdings USA, LLC and TA Holdings Finance, Inc. (collectively with Tower Automotive Holdings USA, LLC, the “Issuers”) issued $430 million in senior secured notes (the “notes offering”). The senior secured notes (the “notes”) were issued at an original issue discount of $12.8 million and bear an annual interest rate of 10.625%. The original issue discount will be amortized on a straight-line basis, which approximates the effective interest method, through interest expense over the term of the notes which increases the effective annual interest rate to 11.25%. The notes mature on September 1, 2017. The notes are jointly and severally and unconditionally guaranteed by the Company on a senior unsecured basis and by the existing domestic subsidiaries of the Company, other than the Issuers, that are guarantors under Tower Automotive Holdings USA, LLC’s existing revolving credit facility (the “ABL Facility”) and existing letter of credit facility (the “Letter of Credit Facility”) (such domestic subsidiaries, the “Subsidiary Guarantors”) on a senior secured basis. The notes are senior secured obligations of the Issuers that, subject to certain permitted liens and exceptions, and subject to certain limitations with respect to enforcement, rank equally in right of payment to any existing and future senior indebtedness of the Issuers and are effectively junior to the extent of the collateral securing the Issuers’ and the Subsidiary Guarantors’ obligations on a first priority basis under the ABL Facility. The notes and the subsidiary guarantees are effectively junior to any existing and future indebtedness of the Company’s subsidiaries that are not guaranteeing the notes. The notes also restrict the Company from paying cash dividends on its common stock.
The notes are secured, on a pari passu basis with the obligations under the Letter of Credit Facility, by (i) a first priority security interest in the assets of the Issuers and the Subsidiary Guarantors which have been pledged on a first priority basis to the agent for the benefit of the lenders under the Letter of Credit Facility and (ii) on a second priority basis to all other assets of the Issuers and the Subsidiary Guarantors which have been pledged on a first priority basis to the agent for the benefit of the lenders under the ABL Facility.
Upon the occurrence of certain specified changes of control, the holders of the notes will have the right to require the Issuers to purchase all or a part of their notes at a repurchase price equal to 101% of the principal amount of the notes, plus accrued and unpaid interest.
At any time prior to September 1, 2014, the Issuers may redeem some or all of the notes at a redemption price equal to 100% of the principal amount of the notes to be redeemed, plus a “make-whole” premium and accrued and unpaid interest. Additionally, prior to September 1, 2014, during any 12-month period, the Issuers may redeem up to 10% of the principal amount of the notes at a redemption price equal to 105% of the principal amount of the notes to be redeemed, plus accrued and unpaid interest. Further, the Issuers may redeem some or all of the notes at any time on or after September 1, 2014 at a redemption price equal to 105.313% of the principal amount of the notes to be redeemed through September 1, 2015 and at 100% of the principal amount thereafter, plus accrued and unpaid interest. In addition, prior to September 1, 2013, the Issuers may redeem up to 35% of the original principal amount of the notes from the proceeds of certain equity offerings at a price of 110.625% of the principal amount of the notes to be redeemed, plus accrued and unpaid interest. The Company
94
Table of Contents
has concluded that bifurcation is not required for the embedded derivative related to the redemption provisions of the notes as it is clearly and closely related to the debt instrument or is not material.
On December 16, 2010, the Issuers redeemed $26 million of the notes at 105% which resulted in a premium paid of $1.3 million that was recognized as other expense. In connection with the redemption, the Issuers accelerated the amortization of the original issue discount and associated debt issue costs by $1.2 million in the fourth quarter of 2010. As of December 31, 2010, the outstanding principal balance on the notes was $392.6 million (net of a remaining $11.4 million original issue discount).
First Lien Term Loan
The first lien term loan was borrowed in two tranches, with $250 million advanced to the U.S. Borrower and the Euro currency equivalent of $260 million (or €190.8 million) advanced to the European Borrower. The first lien term loan required principal payments of 1%, paid quarterly at the end of each January, April, July and October. Immediately prior to the repayment described below, funds and accounts managed by Cerberus Capital Management, L.P. (collectively with Cerberus Capital Management, L.P., “Cerberus” or “Members”) owned approximately 90% of the first lien term loan. The first lien term loan was set to mature on July 31, 2013.
On August 13, 2010, in connection with the offering of the senior secured notes described above, Cerberus agreed to convert $25 million aggregate principal amount of indebtedness under the first lien term loan and, in exchange, received equity in the Company; however, no new units were issued.
On August 24, 2010, the outstanding principal balance on the U.S. Dollar and Euro tranches was repaid in full in connection with the issuance of the senior secured notes described above.
Second Lien Term Loan
On January 31, 2008 and May 5, 2008, the Company elected to make $10 million and $17.9 million early payments of the second lien term loan, respectively. The payments were made in accordance with Amendment No. 1 to the second lien term loan, and therefore, the Company did not incur an early payment penalty. With the May 5, 2008 payment, the second lien term loan was repaid in full.
Revolving Credit Facility
Advances under the revolving credit facility bear interest at a base rate plus a margin or LIBOR plus a margin. The applicable margins are determined by the average availability under the revolving credit facility over the preceding three months. The applicable margins as of December 31, 2010 were 0.75% and 1.75% for base rate and LIBOR based borrowings, respectively. As of December 31, 2010 there was $105.8 million of borrowing availability under the revolving credit facility; however, no borrowings or letters of credit were outstanding.
The revolving credit facility is secured by (1) a first-priority lien on all accounts receivable, inventory, cash, investments and property, plant and equipment of the U.S. Borrower and guarantors, (2) a second-priority pledge of 65% of any voting and 100% of any non-voting equity interests held in any foreign subsidiary by the U.S. Borrower and guarantors, and (3) a second-priority lien on all other tangible and intangible assets of the U.S. Borrower and guarantors.
Letter of Credit Facility
The $27.5 million Letter of Credit Facility is fully cash collateralized by third parties for purposes of replacing or backstopping letters of credit outstanding. The Letter of Credit Facility is part of the first lien term loan agreement, but remains outstanding as it was not retired when the first lien term loan was retired. The cash collateral was deposited by such third parties in a deposit account, and the Company has no right, title or interest
95
Table of Contents
in the deposit account. As of December 31, 2010, the outstanding letters of credit under the Letter of Credit Facility were $26.5 million. The facility matures in July 2013. Applicable fees are 0.25% of the aggregate letters of credit outstanding for commissions. The Letter of Credit Facility has a 4.25% facility commitment fee and a facility deposit fee of 0.15%. As of December 31, 2010, Cerberus owned all of the $27.5 million Letter of Credit Facility.
Debt Issue Costs
The Company incurred interest expense related to the amortization of debt issue costs of $7.8 million, $3.5 million, and $2.9 million, respectively, during the years ended December 31, 2010, 2009, and 2008. The costs incurred during 2010 included the $5.3 million acceleration of debt issue costs related to the retirement of the first lien term loan.
2009 Amendment
During the first quarter of 2009, the Company reached an agreement to amend certain terms of its revolving credit facility, first lien term loan agreement, and Letter of Credit Facility. As part of the amendment, the Company agreed to reduce the $200 million revolving credit facility to $150 million.
The amendment also allowed the Company to redeem a portion of its Letter of Credit Facility for cash. On April 8, 2009, the Company received cash proceeds of $12 million, in exchange for a reduction of the Letter of Credit Facility from $60 million to $30 million. A gain of $11.5 million, net of fees, was recognized as other income as a result of this transaction. In addition, the Company had the ability to redeem up to an additional $10 million of the letter of credit facility by the end of the third quarter of 2009. On September 30, 2009, the Company received cash proceeds of $1.2 million, in exchange for a $2.5 million reduction of the Letter of Credit Facility to decrease the facility from $30 million to $27.5 million. A gain of $1.2 million, net of fees, was recognized as other income as a result of this transaction.
Also pursuant to the amendment, the Company was required to use the proceeds from the first letter of credit reduction to repurchase a portion of the U.S. tranche of the first lien term loan. On May 1, 2009, the Company agreed to a tender offer to repurchase $32.9 million of the first lien term loan using the net proceeds from the letter of credit facility reduction. On May 6, 2009, the Company executed the agreement by transferring $11.5 million to complete the transaction, which resulted in a net gain of $20.9 million after fees, recognized as other income.
Other Foreign Subsidiary Indebtedness
As of December 31, 2010, other foreign subsidiary indebtedness of $147 million consists primarily of borrowings in South Korea of $103.6 million, receivable factoring in Europe of $23.9 million, and borrowings in Brazil of $19.5 million.
South Korea
As of December 31, 2010, the Company’s South Korean subsidiary had borrowings of $103.6 million, consisting of secured indebtedness of $35.8 million, secured bonds of $34.1 million, unsecured corporate bonds of $17.8 million issued in connection with a government sponsored collateralized bond program, and unsecured indebtedness of $15.9 million, which have annual interest rates ranging from 4.57% to 9.96% and maturity dates ranging from February 2011 to April 2013. The majority of these borrowings are subject to annual renewal. Substantially all of the assets of the Company’s South Korean subsidiary serve as collateral for the secured indebtedness and secured bonds.
96
Table of Contents
During the first quarter of 2010, the Company renewed $14.7 million (KRW 16.5 billion) of maturing secured indebtedness for an additional year. There were no material changes to the terms of the loans except the average annual interest rate was reduced from 7.1% to 6.3%.
During the second quarter of 2010, the Company renewed $22.3 million (KRW 25 billion) of maturing secured bonds for an additional two years. The Company also renewed three additional facilities of a combined $8.5 million (KRW 9.5 billion) for an additional year. There were no material changes to the terms of the loans except for the extension of the maturities to 2011. In addition, the Company obtained a new $4.5 million (KRW 5 billion) unsecured corporate bond from the South Korean government. The bond has a three year maturity with an annual interest rate of 8.32%.
During the third quarter of 2010, the Company renewed $30.1 million (KRW 33.8 billion) of maturing indebtedness for an additional year. The renewals consisted of unsecured indebtedness of $13.2 million (KRW 14.8 billion), secured indebtedness of $12.4 million (KRW 14 billion), and a secured bond of $4.5 million (KRW 5 billion). There were no material changes to the terms of the loans except for the extension of the maturities to 2011.
During the fourth quarter of 2010, the Company renewed $16.2 million (KRW 18.2 billion) of maturing indebtedness for an additional year. The renewals consisted of unsecured indebtedness of $8.9 million (KRW 10 billion) and secured bonds of $7.3 million (KRW 8.2 billion). There were no material changes to the terms of the loans except for the extension of the maturities to 2011.
Brazil
As of December 31, 2010, the Company’s Brazilian subsidiary had borrowings of $19.5 million (R$32.4 million) which have annual interest rates ranging from 12.68% to 14.44% and maturity dates ranging from January 2011 to December 2011. This credit is provided through bilateral agreements with three local banks. Periodic interest and principal payments are required. All loans have a duration of one year or less and are secured by certain fixed and current assets.
During the first quarter of 2010, two local banks provided the Company with a combined $8.7 million (R$14.5 million) of new one-year term loans that refinance previous principal payments made on the existing term loan portfolio. The terms of the new loans are substantially the same as the other portfolio loans except for a reduction in annual interest rates from the portfolio average of 13.8% to 13.2% for the new loans.
During the second quarter of 2010, one of the local banks provided the Company with a $3.2 million (R$5.3 million) new one-year term loan. The terms of the new loan are substantially the same as the other portfolio loans.
During the third quarter of 2010, one of the local banks provided the Company with a $3 million (R$5 million) new one-year term loan that refinances a previous loan. In addition, three of the local banks provided the Company with aggregate indebtedness of $10.8 million (R$18 million). The terms of the new loans are substantially the same as the other portfolio loans.
During the fourth quarter of 2010, two of the local banks provided the Company with aggregate indebtedness of $7.8 million (R$13 million). The terms of the new loans are substantially the same as the other portfolio loans.
Italy
As of December 31, 2010, the receivable factoring facilities available to the Company were $30.7 million (€22.9 million), of which $23.9 million (€17.9 million) was drawn. These are uncommitted, demand facilities which are subject to termination at the discretion of the banks, and bear interest rates based on the average three month
97
Table of Contents
EURIBOR plus a spread ranging from 1.45% to 2.00%. The effective annual interest rates as of December 31, 2010 ranged from 2.47% to 3.02%. Any receivable factoring under these facilities is with recourse, and is secured by the accounts receivable factored. These receivable factoring transactions are recorded in the Company’s Consolidated Balance Sheet in current maturities of long-term debt.
Covenants
As of December 31, 2010, the Company was in compliance with the financial covenants that govern its credit agreements.
Capital Leases
The Company had capital lease obligations of $18.6 million and $17.6 million as of December 31, 2010 and December 31, 2009, respectively, which expire between April 2011 and March 2018. Property under capital leases was $33.5 million and $25.2 million with $7.8 million and $4.1 million of accumulated depreciation as of December 31, 2010 and December 31, 2009, respectively.
Note 7. Derivative Financial Instruments
The Company was required by its credit agreements to enter into two interest rate swap agreements during the third quarter of 2007. These derivative agreements effectively fixed interest rates on a portion of the Company’s European and U.S. first lien term loan tranches at 5.06% and 4.62%, respectively, and qualified for cash flow hedge accounting treatment under FASB ASC No. 815, Derivatives and Hedging. The swaps were designated as hedging instruments to offset the changes in cash flows resulting from changes in interest rates on this variable rate debt through August 31, 2010. In August 2010, the first lien term loan was repaid in full and the interest rate swaps expired. Under FASB ASC No. 815, each swap was recorded as a cash flow hedge in which the fair value was recorded as an asset or liability and the changes in the fair value were recorded as a component of other comprehensive income. Periodic measurement of hedge effectiveness was performed quarterly. Any changes in the effective portion of these derivatives were recorded as a component of accumulated other comprehensive income / (loss), a component of equity / (deficit), while any ineffective portion was recorded in earnings and reflected in the consolidated statement of income as part of interest expense. The following table presents the notional amount of interest rate swaps by class (in thousands):
| Financial Instruments |
Hedge Type |
Notional Amount |
Start Date |
Maturity Date |
||||||||||||
| Floating to fixed |
Cash Flow | $ | 182,500 | 8/31/2007 | 8/31/2010 | |||||||||||
| Floating to fixed |
Cash Flow | € | 100,000 | 8/31/2007 | 8/31/2010 | |||||||||||
During 2009, a pre-tax gain of $6 million was recorded in other comprehensive income relating to the two cash flow hedges. As of December 31, 2009, no ineffective portion existed and the fair values of these derivatives were recorded as a liability of $10.6 million in the Company’s Consolidated Balance Sheet in accrued liabilities. The fair value of our interest rate swaps was determined based on third-party valuation models. During the year ended December 31, 2010, $10.6 million and $2 million was expensed through interest expense and income tax expense, respectively, that had been recorded in accumulated other comprehensive income. During the year ended December 31, 2009, $6 million was expensed through interest expense that had been recorded in accumulated other comprehensive income.
Note 8. Selling, General, and Administrative Expenses
The Company’s selling, general and administrative (“SG&A”) expenses include costs associated with the Company’s sales efforts; engineering; centralized finance, human resources, purchasing, and information
98
Table of Contents
technology services; and other administrative functions. The Company has implemented one-time compensation programs that will result in compensation charges against earnings in 2010 and subsequent periods. See notes 14 and 18 for further description of each program. SG&A expenses include the following (in thousands):
| Year Ended December 31, | ||||||||||||
| 2010 | 2009 | 2008 | ||||||||||
| SG&A (excluding items below) |
$ | 132,221 | $ | 118,331 | $ | 135,518 | ||||||
| Special incentive program |
6,700 | — | — | |||||||||
| Supplemental value creation program |
1,509 | — | — | |||||||||
| 2010 equity incentive plan—restricted stock units |
2,866 | — | — | |||||||||
| Acquisition costs |
679 | — | 3,100 | |||||||||
| Total SG&A |
$ | 143,975 | $ | 118,331 | $ | 138,618 | ||||||
Note 9. Income Taxes
Tax Summary
The summary of loss before provision for income taxes and noncontrolling interests consisted of the following (in thousands):
| Year Ended December 31, 2010 |
Year Ended December 31, 2009 |
Year Ended December 31, 2008 |
||||||||||
| Domestic |
$ | (45,566 | ) | $ | (38,811 | ) | $ | (75,763 | ) | |||
| Foreign |
27,410 | (21,325 | ) | 49,529 | ||||||||
| Total |
$ | (18,156 | ) | $ | (60,136 | ) | $ | (26,234 | ) | |||
The provision for income taxes consisted of the following (in thousands):
| Year Ended December 31, 2010 |
Year Ended December 31, 2009 |
Year Ended December 31, 2008 |
||||||||||
| Current: |
||||||||||||
| Domestic—Federal |
$ | — | $ | — | $ | — | ||||||
| Domestic—State |
(114 | ) | 192 | (157 | ) | |||||||
| Foreign |
22,284 | 16,658 | 19,933 | |||||||||
| Total |
22,170 | 16,850 | 19,776 | |||||||||
| Tax (benefit) expense with offset in OCI: |
||||||||||||
| Domestic—Federal |
1,786 | (4,398 | ) | — | ||||||||
| Domestic—State |
192 | (503 | ) | — | ||||||||
| Total |
1,978 | (4,901 | ) | — | ||||||||
| Deferred: |
||||||||||||
| Domestic—Federal |
— | — | — | |||||||||
| Domestic—State |
— | 238 | 438 | |||||||||
| Foreign |
(13,851 | ) | (13,291 | ) | (707 | ) | ||||||
| Total |
(13,851 | ) | (13,053 | ) | (269 | ) | ||||||
| Total provision for income taxes |
$ | 10,297 | $ | (1,104 | ) | $ | 19,507 | |||||
99
Table of Contents
Effective Rate Reconciliation
A reconciliation of income taxes computed at the statutory rates to the reported income tax provision is as follows (in thousands):
| Year Ended December 31, 2010 |
Year Ended December 31, 2009 |
Year Ended December 31, 2008 |
||||||||||
| Taxes at U.S. federal statutory rates |
$ | (6,355 | ) | $ | (21,057 | ) | $ | (9,182 | ) | |||
| Foreign withholding tax and exchange |
2,476 | (679 | ) | (3,541 | ) | |||||||
| Foreign tax rate differential |
(2,017 | ) | (1,706 | ) | (3,657 | ) | ||||||
| Increase in uncertain tax positions |
1,869 | 2,824 | 2,676 | |||||||||
| State tax expense (benefit) |
372 | 1,626 | (5,751 | ) | ||||||||
| Tax (benefit) expense in OCI |
1,978 | (4,901 | ) | — | ||||||||
| Valuation allowance |
3,607 | 19,496 | 28,073 | |||||||||
| Inflation adjustment—Mexico |
(913 | ) | (1,277 | ) | (991 | ) | ||||||
| Disallowed interest expense |
1,171 | 1,506 | 3,431 | |||||||||
| Cancellation of Debt Income |
4,529 | — | — | |||||||||
| Sale of investment in subsidiaries |
— | — | 4,847 | |||||||||
| Other permanent differences |
3,580 | 3,064 | 3,602 | |||||||||
| Total |
$ | 10,297 | $ | (1,104 | ) | $ | 19,507 | |||||
Deferred Income Tax Assets / (Liabilities)
A summary of deferred income tax assets / (liabilities) is as follows (in thousands):
| December 31, 2010 |
December 31, 2009 |
|||||||
| Accrued compensation costs |
$ | 29,722 | $ | 29,926 | ||||
| Postretirement benefit obligations |
3,784 | 1,328 | ||||||
| MRO Inventory |
8,259 | 8,251 | ||||||
| Facility closure and consolidation costs |
— | 1,427 | ||||||
| Net operating loss carryforwards and tax credits |
140,991 | 112,896 | ||||||
| Other reserves and adjustments |
15,256 | 24,888 | ||||||
| Goodwill and intangibles |
(3,516 | ) | (3,932 | ) | ||||
| Fixed asset, and leases |
2,705 | 3,164 | ||||||
| Subtotal (deferred taxes before valuation allowance) |
197,201 | 177,948 | ||||||
| Less: valuation allowance |
(180,395 | ) | (172,358 | ) | ||||
| Net deferred income tax assets / (liabilities) |
$ | 16,806 | $ | 5,590 | ||||
During 2010, the valuation allowance on deferred taxes in South Korea was reversed. The Company determined that the valuation allowance was no longer necessary because the profitability of its South Korean operations has improved over the prior two years and the expected production volumes in South Korea are remaining at or above levels experienced in 2008. The impact on income tax expense for the year was a benefit of $7.8 million, representing $9.1 million valuation allowance reversal offset by $1.3 million of income tax expense for the establishment of a reserve for uncertain tax positions required under FASB ASC No. 740, Income Taxes. Interest rate swaps expired during the year and the impact of these swaps is a component of accumulated other comprehensive income (“AOCI”), resulting in $2 million tax expense in continuing operations. Valuation
100
Table of Contents
allowances were provided for tax benefits generated during 2010 on losses incurred in the U.S. and various foreign locations. In connection with the notes offering, Cerberus agreed to convert $25 million aggregate principal amount of indebtedness under the first lien term loan and, in exchange, received equity in the Company. As a result, the Company experience cancellation of indebtedness income of $12.9 million for tax purposes which was offset by net operating losses.
The Company has U.S. net operating loss (“NOLs”) carryforwards of $192 million that expire during the years 2027 through 2030 and state NOL carryforwards of $94.6 million and state credit carryforwards of $22.1 million that expire during the years 2012 through 2030. The Company has recorded deferred tax assets of $67.2 million, and $27.8 million related to federal NOL carryforwards and state NOL and credit carryforwards, respectively. The Company assesses the available positive and negative evidence to estimate if sufficient future taxable income will be generated to utilize the existing deferred tax assets. Based on this assessment, the Company continues to record a full valuation allowance against its U.S. federal and state net deferred tax assets.
The Company’s foreign subsidiaries have net income tax NOL carryforwards of $168.4 million, other income tax NOL carryforwards of $28.1 million and credit carryforwards of $2.9 million at December 31, 2010 of which some expire in 2014 and others are carried forward indefinitely. The Company has recorded deferred tax assets of $46 million related to the foreign NOL and credit carryforwards and has recorded a full valuation allowance in most foreign jurisdictions against its foreign net deferred tax assets.
The Company permanently reinvests the earnings of its foreign subsidiaries, which totaled approximately $30 million as of December 31, 2010. As such, the Company does not provide for deferred taxes on the excess of the financial reporting over the tax basis in its investments in foreign subsidiaries. It is not practicable to estimate the amount of deferred tax liability related to investments in those foreign subsidiaries. The Company has recorded a tax liability of $1.3 million for expected future taxes relating to repatriations within Europe and Asia.
Unrecognized Tax Benefits
A reconciliation of the beginning and ending amounts of unrecognized tax benefits are as follows (in thousands):
| Year Ended December 31, 2010 |
Year Ended December 31, 2009 |
Year Ended December 31, 2008 |
||||||||||
| Unrecognized tax benefit—January 1 |
$ | 8,227 | $ | 5,647 | $ | 4,007 | ||||||
| Increase in prior year tax positions |
972 | 882 | 228 | |||||||||
| Decrease in prior year tax positions |
(262 | ) | — | — | ||||||||
| Increase in current year tax positions |
1,827 | 1,718 | 1,840 | |||||||||
| Audit settlements |
(152 | ) | (303 | ) | (118 | ) | ||||||
| Lapse in statute of limitations |
(100 | ) | (75 | ) | (91 | ) | ||||||
| Foreign currency translation |
(416 | ) | 358 | (219 | ) | |||||||
| Total |
$ | 10,096 | $ | 8,227 | $ | 5,647 | ||||||
Included in the balance of unrecognized tax benefits at December 31, 2010, 2009 and 2008 respectively, are $9.1 million, $7.4 million and $5.2 million of tax benefits that, if recognized, would affect the effective tax rate, subject to valuation allowance adjustments. Also included in the balance of unrecognized tax benefits at December 31, 2010, 2009 and 2008 respectively, are $1.0 million, $0.8 million and $0.4 million of tax benefits that, if recognized, would result in adjustments to other tax accounts, primarily deferred taxes.
The Company recognizes interest and penalties related to unrecognized tax benefits as income tax expense. During the year ended December 31, 2010, the Company recognized $0.7 million of interest and $0.4 million in penalties as income tax expense and in total, as of December 31, 2010, has recognized a liability for interest and
101
Table of Contents
penalties of $3.5 million. During 2009, the Company accrued interest of less than $0.1 million and penalties of $0.4 million and in total, as of December 31, 2009, had recognized a liability for penalties and interest of $2.5 million. During 2008, the Company accrued interest of $1.1 million and penalties of $0.1 million.
The Company files income tax returns in the U.S. federal jurisdiction, as well as various states and foreign jurisdictions. As of December 31, 2010 the Company’s tax years for 2002 through 2010 are subject to examination by the tax authorities.
At this time, the Company is also under audit in several foreign jurisdictions. Based on the status of the audits and the protocol of finalizing audits by the relevant tax authorities, the Company does not believe there will be material changes within the next twelve months to previously recorded uncertain tax positions. However, as of December 31, 2010, the foreign tax authorities proposed certain adjustments that would impact the Company’s liability for unrecognized tax benefits. Although it is not possible to predict the timing of the conclusion of all ongoing audits with accuracy, it is reasonably possible that a reduction in the unrecognized tax benefits may occur; however, quantification of an estimated range cannot be made at this time.
One of the Company’s joint ventures has applied for a lower tax rate in China. Pending final approval of the lower rate, the income tax expense is currently computed using the higher statutory rate. If the lower tax rate is ultimately accepted, the Company could recognize an income tax benefit in the future.
Note 10. Employee Benefit Plans
The Company sponsors various pension and other postretirement benefit plans for its employees.
In accordance with FASB ASC No. 805, Business Combinations, on August 1, 2007, the Company recorded a liability for the total projected benefit obligation in excess of plan assets for the pension plans and a liability for the total accumulated postretirement benefit obligation in excess of the fair value of plan assets for other postretirement benefit plans and for postretirement benefit settlement agreements, which were approved by the Bankruptcy Court and assumed by the Company.
Defined Benefit Retirement Plans
The Tower Automotive Consolidated Pension Plan (the “Pension Plan”) provides benefits for certain current and former U.S. employees. Benefits under the Pension Plan are based on years of service, compensation, and other factors. Effective October 1, 2006, the plan was frozen and ceased accruing any additional benefits. Contributions by the Company are intended to fund benefits that accrued through October 1, 2006.
The Company’s funding policy is to annually contribute amounts to the Pension Plan’s related trust sufficient to meet the minimum funding requirements of the Employee Retirement Income Security Act of 1974, as amended (“ERISA”) and the Internal Revenue Code of 1986, as amended (the “Code”). The Company expects minimum contribution requirements to the Pension Plan of $16.3 million during 2011. Benefit payments under the Pension Plan are estimated to be $20 million, $19.7 million, $18.6 million, $18.7 million, and $18 million for the years ending December 31, 2011, 2012, 2013, 2014, and 2015, respectively, for a total of $95 million during that five-year period. Aggregate benefit payments under the Pension Plan for the years 2016 through 2020 are estimated to be $85.6 million.
102
Table of Contents
The following table provides a reconciliation of the changes in the benefit obligations and fair value of assets for the Pension Plan (in thousands):
| Year Ended December 31, 2010 |
Year Ended December 31, 2009 |
|||||||
| Reconciliation of fair value of plan assets: |
||||||||
| Fair value of plan assets at the beginning of the period |
$ | 165,858 | $ | 154,697 | ||||
| Actual return on plan assets |
20,210 | 24,882 | ||||||
| Employer contributions |
9,741 | 8,208 | ||||||
| Plan expenses paid |
(1,180 | ) | (927 | ) | ||||
| Benefits paid |
(22,443 | ) | (21,002 | ) | ||||
| Fair value of plan assets at the end of the period |
$ | 172,186 | $ | 165,858 | ||||
| Change in Benefit Obligations: |
||||||||
| Benefit obligations at the beginning of the period |
$ | 244,588 | $ | 243,549 | ||||
| Service cost |
29 | 28 | ||||||
| Interest cost |
13,211 | 14,305 | ||||||
| Actuarial loss (gain) |
13,204 | 7,708 | ||||||
| Benefits paid |
(22,443 | ) | (21,002 | ) | ||||
| Benefit obligations at the end of the period |
$ | 248,589 | $ | 244,588 | ||||
| Funded status of the pension plan |
$ | (76,403 | ) | $ | (78,730 | ) | ||
At December 31, 2010 and 2009, the funded status is recorded as pension liability in the Consolidated Balance Sheet.
At the December 31, 2010 measurement date, the accumulated benefit obligation of the Pension Plan was approximately $248.4 million. At December 31, 2009, the accumulated benefit obligation of the Pension Plan was approximately $244.4 million.
The following table provides the components of net periodic pension benefit cost for the Pension Plan (in thousands):
| Year Ended December 31, | ||||||||||||
| 2010 | 2009 | 2008 | ||||||||||
| Service cost |
$ | 29 | $ | 28 | $ | 30 | ||||||
| Interest cost |
13,211 | 14,305 | 14,889 | |||||||||
| Expected return on plan assets |
(10,611 | ) | (10,063 | ) | (14,511 | ) | ||||||
| Amortization of net losses |
1,495 | 1,835 | — | |||||||||
| Net periodic benefit cost |
$ | 4,124 | $ | 6,105 | $ | 408 | ||||||
103
Table of Contents
Amounts recognized in other comprehensive income / (loss), pre-tax, at December 31, 2010 and 2009 consist of the following:
| Year Ended December 31, | ||||||||
| 2010 | 2009 | |||||||
| Net actuarial loss / (gain) |
$ | 4,786 | $ | (6,185 | ) | |||
| Amortization of net losses |
(1,495 | ) | (1,835 | ) | ||||
| Amount recognized |
$ | 3,291 | $ | (8,020 | ) | |||
The net periodic benefit cost for the year ending December 31, 2011 will contain an estimated $1.7 million to be amortized from accumulated other comprehensive income.
The assumptions used in the measurement of the Company’s benefit obligation, based upon a December 31, 2010 and December 31, 2009 measurement date, are as follows:
| Year Ended December 31, | ||||||||
| 2010 | 2009 | |||||||
| Discount rate |
5.25% | 5.75% | ||||||
| Rate of compensation increase |
4.50% | 4.50% | ||||||
The assumptions used in determining net periodic benefit cost are shown below:
| Year Ended December 31, | ||||||||||||
| 2010 | 2009 | 2008 | ||||||||||
| Discount rate |
5.75% | 6.25% | 6.25% | |||||||||
| Expected return on plan assets |
7.25% | 7.25% | 7.25% | |||||||||
| Rate of compensation increase |
4.50% | 4.50% | 4.50% | |||||||||
The present value of the Company’s pension benefit obligation is calculated through the use of a discount rate. The discount rate used is established annually at the measurement date and reflects the construction of a yield curve analysis from a third party, which calculates the yield to maturity that mirrors the timing and amounts of future benefit payments.
The Company invests the assets of the Pension Plan in a diversified portfolio consisting of an array of asset classes that attempts to maximize returns while minimizing volatility. The Company’s allocations of Pension Plan assets on the December 31, 2010 and 2009 measurement dates, as well as the 2010 target allocation, are as follows:
| Year Ended December 31, | ||||||||||||
| 2010 | 2009 | 2010 Target | ||||||||||
| Fixed income investments |
40% | 43% | 45% | |||||||||
| Equity securities |
35% | 38% | 30% | |||||||||
| Non-equity investments |
25% | 12% | 25% | |||||||||
| Real estate |
— | 6% | — | |||||||||
| Cash equivalents |
— | 1% | — | |||||||||
| Total |
100% | 100% | 100% | |||||||||
104
Table of Contents
The expected long-term rates of return on the plans’ assets assumptions are based on modeling studies completed with the assistance of the Company’s actuaries and investment consultants. The models take into account inflation, asset class returns, and bond yields for both domestic and foreign markets. These studies, along with the history of returns for the plans, indicate that expected future returns, weighted by asset allocation, support an expected long-term asset return assumption of 7.4% for 2010 and 7.25% for 2009.
The Company’s investment goals are to achieve returns in excess of the plans’ actuarial assumptions, commensurate with the plans’ risk tolerance; to invest in a prudent manner in accordance with fiduciary requirements of ERISA; and to ensure that plan assets will meet the obligations of the plans as they come due.
Investment management of the plans is delegated to a professional investment management firm that must adhere to policy guidelines and objectives. An independent investment consultant is used to measure and report on investment performance; perform asset/liability modeling studies and recommend changes to objectives, guidelines, managers, or asset class structure; and keep the Company informed of current investment trends and issues.
The investment policy, as established by the Company’s Benefit Plans Committee (the “Committee”), allows for effective supervision, monitoring, and evaluating of the investment of the Company’s retirement plan assets. This includes setting forth an investment structure for managing assets and providing guidelines for each portfolio to control the level of overall risk and liquidity. The cash inflows and outflows will be deployed in a manner consistent with the above target allocations. If the Committee determines cash flows to be insufficient within the strategic allocation target ranges, the Committee shall decide whether to effect transactions to bring the strategic allocation within the threshold ranges. Plan assets do not include equity securities of the Company.
Based on consideration of the plans’ projected benefit obligation, the plans’ ability to tolerate risk is in the moderate range. Asset allocation is consistent with this level of risk, with assets being a mix of equities and fixed income. Equity investments are diversified across U.S. and non-U.S. stocks. Minimum and maximum ranges are established for each asset class to control risk and maximize the effectiveness of the plans’ asset allocation strategy. Asset allocation is reviewed quarterly and rebalanced if necessary. Specific investment guidelines, restrictions, and investment return objectives exist for each asset class and corresponding investment manager.
Pension Plan assets are recorded at fair value. Fixed income and equity securities may each be combined into commingled fund investments. Commingled funds are valued to reflect the Company’s interest in the fund based on the reported year-end net asset value. The estimated fair values of debt securities held are based on quoted market prices and/or market data for the same or comparable instruments. Due to the nature of pricing fixed income securities and the use of commingled fixed income funds, some of these instruments are classified as level 2 or level 3 investments within the fair value hierarchy described in this note. Fair value estimates for publicly-traded equity securities are based on quoted market prices and/or other market data for the same or comparable instruments. Collective trusts that hold securities directly are stated at fair value of the underlying securities, as determined by the administrator, based on readily determinable market values and as such are classified as level 2 or level 3 investments within the fair value hierarchy described in this note. Non-equity investments, which represent approximately 25% of Pension Plan assets, include investments in hedge funds, and are valued based on year-end reported net asset value. The balance sheet includes the funded status of the benefit plans, which represents the difference between the benefit obligations and fair value of Pension Plan assets.
105
Table of Contents
The following table summarizes the Company’s Pension Plan assets measured at fair value as of December 31, 2010 and 2009 (in millions). See note 3 for definitions of levels 1, 2, and 3 fair value hierarchy and the methods and assumptions to estimate fair value of marketable securities.
| Fair Value Measurements at December 31, 2010 | ||||||||||||||||
| Asset Classes |
Total | Quoted Prices in Active Markets for Identical Assets (Level 1) |
Significant Observable Inputs (Level 2) |
Significant Unobservable Inputs (Level 3) |
||||||||||||
| Cash |
$ | 2 | $ | 2 | $ | — | $ | — | ||||||||
| Equity securities |
21 | 21 | — | — | ||||||||||||
| Mutual funds (a) |
51 | 39 | 12 | — | ||||||||||||
| U.S. Treasuries |
14 | — | 14 | — | ||||||||||||
| Corporate bonds |
36 | — | 36 | — | ||||||||||||
| Equity long/short hedge funds (b) |
48 | — | — | 48 | ||||||||||||
| Total |
$ | 172 | $ | 62 | $ | 62 | $ | 48 | ||||||||
| Fair Value Measurements at December 31, 2009 | ||||||||||||||||
| Asset Classes |
Total | Quoted Prices in Active Markets for Identical Assets (Level 1) |
Significant Observable Inputs (Level 2) |
Significant Unobservable Inputs (Level 3) |
||||||||||||
| Cash |
$ | 2 | $ | 2 | $ | — | $ | — | ||||||||
| Equity securities: |
||||||||||||||||
| U.S. companies |
27 | 27 | — | — | ||||||||||||
| International companies |
10 | 10 | — | — | ||||||||||||
| Mutual funds (a) |
34 | 18 | 16 | — | ||||||||||||
| Real estate investment trusts |
9 | 9 | — | — | ||||||||||||
| U.S. Treasuries |
31 | 31 | — | — | ||||||||||||
| Corporate bonds |
32 | 32 | — | — | ||||||||||||
| Equity long/short hedge funds (b) |
20 | — | — | 20 | ||||||||||||
| Total |
$ | 165 | $ | 129 | $ | 16 | $ | 20 | ||||||||
| (a) | This category consists of mutual fund investments that are focused on international equity securities. |
| (b) | This category includes hedge funds that invest both long and short in a variety of U.S. equities, and international equities and currencies. Management of the hedge funds has the ability to shift investments from value to growth strategies, from small to large capitalization stocks, and from a net long position to a net short position. |
106
Table of Contents
For Pension Plan assets with a fair value measurement using significant unobservable inputs (level 3), the reconciliation of the beginning and ending balances are as follows (in millions):
| Fair Value Measurements Using Significant Unobservable Inputs (Level 3) |
||||
| Equity Long / Short Hedge Funds |
||||
| Beginning balance at December 31, 2008 |
$ | — | ||
| Actual return on plan assets: |
||||
| Relating to assets still held at the reporting date |
2 | |||
| Purchases |
18 | |||
| Balance at December 31, 2009 |
20 | |||
| Actual return on plan assets: |
||||
| Relating to assets still held at the reporting date |
2 | |||
| Purchases |
26 | |||
| Ending balance at December 31, 2010 |
$ | 48 | ||
Defined Contribution Retirement Plans
The Company sponsors various qualified defined contribution retirement plans. Each plan serves a defined group of employees and has varying levels of Company contributions. The Company’s contributions may be required by collective bargaining agreements for certain plans. During 2010, 2009, and 2008, the Company contributed $3.3 million, $3 million and $3.8 million, respectively.
Retirement Plans of Non-U.S. Operations
The Company has no defined benefit pension plans associated with its non-U.S. operations. The Company primarily provides severance benefits to employees that have terminated their employment due to retirement or otherwise. The amount associated with such benefits depends upon the length of service of the employee and also upon whether the termination was voluntary or at the request of the Company. During 2010, 2009, and 2008, the Company recorded expenses associated with these non-U.S. plans of $3.2 million, $3.1 million, and $3.9 million, respectively.
Other Postretirement Plans
Defined-Dollar Capped Medical Plans
For the retirees of the Company’s Milwaukee, Wisconsin facility, a Voluntary Employee Beneficiary Association (“VEBA”) Trust was established and began administering medical insurance benefits for retirees and their dependents beginning July 1, 2006. A separate VEBA Trust was established and began administering benefits for retirees from the Company’s Greenville facilities and their dependents beginning September 1, 2006.
As of July 31, 2007, the Company assumed the liabilities associated with the VEBA Trusts described above and future benefit payments were capped at specified amounts to be paid through 2011. As a result, the Company determined that these arrangements represent defined benefit postretirement plans and defined-dollar capped plans in accordance with FASB ASC No. 715, Compensation—Retirement Benefits. The Company has accreted the interest cost through cost of sales until settlement in accordance with FASB ASC No. 715. Benefit payments during the years ended December 31, 2010, 2009, and 2008 were $1.2 million, $2 million, and $6.3 million,
107
Table of Contents
respectively. Interest accretion during the years ended December 31, 2010, 2009, and 2008 was $0.1 million, $0.2 million, and $0.5 million, respectively. The accumulated postretirement benefit obligation at December 31, 2010 was $0.6 million. Expected benefit payments and future Company contributions amount to $0.6 million for 2011, after which no further payments remain.
Life Insurance Plans
As of July 31, 2007, the Company assumed life insurance benefits for certain U.S. retirees and the benefit plans pursuant to which such life insurance benefits are provided. Expected future life insurance benefit payments amount to $0.9 million for each year 2011 through 2015 for a total of $4.5 million during the five-year period. Aggregate expected benefit payments for the years 2016 through 2020 are $4.6 million.
The following table provides a reconciliation of the changes in the benefit obligations and funded status of the Company’s other post employment benefit plans (in thousands):
| Year Ended December 31, 2010 (1) |
Year Ended December 31, 2009 (1) |
|||||||
| Reconciliation of fair value of plan assets: |
||||||||
| Fair value of plan assets at the beginning of the period |
$ | — | $ | — | ||||
| Employer contributions |
431 | 500 | ||||||
| Benefits paid |
(431 | ) | (500 | ) | ||||
| Fair value of plan assets at the end of the period |
$ | — | $ | — | ||||
| Change in Benefit Obligations: |
||||||||
| Benefit obligations at the beginning of the period |
$ | 13,831 | $ | 12,999 | ||||
| Service cost |
— | — | ||||||
| Interest cost |
753 | 778 | ||||||
| Actuarial loss (gain) |
(231 | ) | 554 | |||||
| Benefits paid |
(431 | ) | (500 | ) | ||||
| Benefit obligations at the end of the period |
$ | 13,922 | $ | 13,831 | ||||
| Funded status of life insurance plan |
$ | (13,922 | ) | $ | (13,831 | ) | ||
| (1) | Excludes defined-dollar capped plans as described above. |
At December 31, 2010 and 2009, the funded status is recorded as accrued liabilities and other non-current liabilities in the Consolidated Balance Sheet.
The following table provides the components of net periodic benefit cost for the plans (in thousands):
| Year Ended December 31, 2010 (1) |
Year Ended December 31, 2009 (1) |
Year Ended December 31, 2008 (1) |
||||||||||
| Service cost |
$ | — | $ | — | $ | — | ||||||
| Interest cost |
753 | 778 | 781 | |||||||||
| Expected return on plan assets |
— | — | — | |||||||||
| Amortization of net losses |
— | — | — | |||||||||
| Net periodic benefit cost |
$ | 753 | $ | 778 | $ | 781 | ||||||
| (1) | Excludes defined-dollar capped plans as described above. |
108
Table of Contents
Amounts recognized in other comprehensive income at December 31, 2010 and 2009, pre-tax, consist of the following (in thousands):
| 2010 | 2009 | |||||||
| Net actuarial (gain) or loss |
$ | (231 | ) | $ | 554 | |||
| Net prior service cost |
— | — | ||||||
| Amount recognized |
$ | (231 | ) | $ | 554 | |||
The discount rate used to measure the Company’s post employment benefit obligation was 5.25% and 5.75% for 2010 and 2009. The discount rate used to determine net periodic benefit costs was 5.75% in 2010, 6.25% in 2009, and 6.25% in 2008. The rate used reflects the construction of a yield curve analysis from a third party, which calculates the yield to maturity that mirrors the timing of future benefits. The measurement dates for the Company’s post retirement benefit plans were December 31, 2010 and December 31, 2009.
Note 11. Equity / (Deficit) and Share Based Compensation
Equity
Effective October 14, 2010, prior to the IPO, (i) all of the Company’s equity owners transferred their equity interests in Tower Automotive, LLC to a newly created limited liability company, Tower International Holdings, LLC, (ii) Tower Automotive, LLC converted into a Delaware corporation named Tower International, Inc., and (iii) all of the equity interests in Tower Automotive, LLC were converted into common stock of Tower International, Inc (“Corporate Conversion”). Thus, immediately prior to the IPO and the commencement of trading of the Company’s common stock, all of the Company’s outstanding common stock was owned by Tower International Holdings, LLC. Upon the Corporate Conversion, all of the equity interests in Tower Automotive, LLC were converted into common stock of Tower International, Inc. On October 20, 2010, the Company received $75.6 million of proceeds, after underwriting discounts and commissions, in connection with the sale of 6,250,000 shares of its common stock at the closing of the IPO. On November 3, 2010, the Company sold an additional 383,722 shares of its common stock resulting in additional proceeds of $4.6 million, after underwriting discounts and commissions, pursuant to a partial exercise of the underwriters’ over-allotment option. As of December 31, 2010, the Company had 19,101,588 shares of common stock outstanding.
Members’ Equity
Prior to August 12, 2010, the membership interests in Tower Automotive, LLC (“Membership Interests”) were represented by issued and outstanding “Units” divided into three series consisting of “Redeemable Preferred Units,” “Common Units” and “MIP Units.” Effective August 12, 2010, the three series of units of the Company were converted into one series of “Capital Units.”
Capital Units
On August 12, 2010, the Company’s operating agreement was amended and restated (the “Unit Conversion”) to provide for the conversion of the Company’s Redeemable Preferred Units, Common Units, and MIP Units into a single class of membership interests, referred to as Capital Units. Prior to the Corporate Conversion, a total of 8,500 Capital Units of Tower Automotive, LLC were owned by Cerberus (Cerberus is sometimes referred to herein as the “Vested Members”) and a total of 1,500 Capital Units of Tower Automotive, LLC were owned by Tower Management, LLC (“Management LLC Capital Units”).
The Management LLC Capital Units held by the former owner of MIP Units will not be entitled to distributions until the holders of the other Capital Units have received distributions, in addition to tax distributions, equal to $180.9 million (the “Reference Amount”) plus a return on the unpaid portion of such amount accruing from July 31, 2010 (“Reference Date”) on a quarterly cumulative basis at a rate of 10% per annum. As a result of the
109
Table of Contents
contribution of indebtedness (see note 6), the Reference Amount was increased by $25 million, together with a return on the unpaid portion of such amount accruing from August 24, 2010.
The Management LLC Capital Units shall not vest until the first time subsequent to the Reference Date when the aggregate distributions made by the Company with respect to all Vested Members since the Reference Date equals the Reference Amount plus accruals (“Vesting Time”).
Common Units
Prior to the Unit Conversion, the Company had authorized, issued, and outstanding 8,500 units of Membership Interest (designated as “Common Units”). Cerberus made initial capital contributions for all of the Common Units, for total cash proceeds of $11.3 million. The Common Units were entitled to all of the rights of ownership, including voting rights. Due to the Unit Conversion, no Common Units were outstanding as of December 31, 2010.
MIP Units / Share Based Compensation
Prior to the Unit Conversion, the Company authorized 1,500 units of Membership Interest (designated as “MIP Units”) to be eligible for grants in connection with the Company’s Management Incentive Plan (“MIP”). The MIP was designed to promote the long-term success of the Company through share-based compensation by aligning the interests of participants with those of its members. The Company’s management determined vesting at the date of grant and assigned the original MIP Units with both service and performance conditions. Effective February 19, 2010, the Board of Managers (“Board”) removed the performance conditions from the MIP Units, which resulted in only a service condition remaining to each unit. The modification resulted in no incremental compensation cost as the fair value of the awards did not change based on the modified terms.
Under the fair value recognition provisions, share-based compensation cost was measured at the grant date based on the fair value of the award and was recognized as expense over the applicable vesting period of the award. The fair value of each MIP Unit was based on the fair value of the Common Units on the date of grant. The compensation cost for the MIP Plan was insignificant for the periods ended December 31, 2010 and 2009, respectively, with no income tax benefit due to the valuation allowance in the United States recognized during 2010 and 2009.
MIP Units were entitled to all of the rights of ownership but were not entitled to vote, unless required by the Limited Liability Act of the State of Delaware. In addition, MIP Units were entitled to share in the residual value of the Company based on the liquidation preferences described below.
There was no established trading market for the Company’s former Common Units, Redeemable Preferred Units, or MIP Units.
Membership Interest Distributions
Prior to the Corporate Conversion, each fiscal year, the Company was able to make certain distributions to its Members, absent a Liquidation Event (as defined below), and after all amounts were paid by the Company for such fiscal year for ordinary and necessary business expenses, employee salaries and benefits, and payments of principal and interest on any Company indebtedness, in accordance with the following order of priority. First, to the Members, a tax distribution amount which is intended to enable the Members to use such distributions to satisfy their estimated and final income tax liabilities for that fiscal year. Second, until the Vesting Time, to the holders of all Capital Units other than holders of Management LLC Capital Units, an amount that is pro rata in proportion to their respective number of Capital Units. Thereafter, following the Vesting Time, to the holders of all Capital Units (including holders of Management LLC Capital Units), an amount that is pro rata in proportion
110
Table of Contents
to their respective number of Capital Units. If distributions are not made with respect to any fiscal year, the distributions to the holders of all Capital Units other than holders of Management LLC Capital Units were cumulative.
Prior to the Corporate Conversion, in the event of (i) a liquidation, dissolution, or winding up of the Company; (ii) a sale of all or substantially all of the assets of the Company to an unrelated third party; (iii) a merger, acquisition, or sale of Membership Interests, in which Members immediately prior to such event received consideration for no less than half of the value of their Membership Interests; or (iv) a recapitalization, reorganization, reclassification, or other similar transaction in which the Company receives proceeds from a financing for the purpose of distributing such proceeds to the Members and the consummation of which the Board determines is a liquidation event (each, a “Liquidation Event”), the Board was required to make distributions in the following order of priority. First, payment of all debts and liabilities owing to creditors including, if applicable, Members in their capacity as creditors and the expenses of dissolution or liquidation; second, establishment of such reserves as are deemed necessary by the Board for any contingent or unforeseen liabilities of the Company; third, until the Vesting Time, to the holders of all Capital Units other than holders of Management LLC Capital Units, an amount equal to the Reference Amount plus accruals to be distributed to such holders pro rata in proportion to their respective number of Capital Units; and (d) thereafter, following the Vesting Time, to the holders of all Capital Units (including holders of Management LLC Capital Units), pro rata in proportion to their respective number of Capital Units.
In connection with the Corporate Conversion and initial public offering of common stock, all Capital Units were converted into shares of common stock.
Note 12. Redeemable Preferred Units
Prior to the Unit Conversion (see note 11), the Company had outstanding 10,000 units of Membership Interest (designated as “Redeemable Preferred Units”). This was the total number of units authorized, issued, and outstanding. The Members made initial capital contributions for all of the Redeemable Preferred Units in the amount of $213.8 million in July 2007. Redeemable Preferred Units were entitled to all of the rights of ownership, including a profits interest and a distribution preference, but had no conversion rights. Redeemable Preferred Units were non-voting, unless required by the Limited Liability Act of the State of Delaware. In accordance with FASB ASC No. 480, Distinguishing Liabilities from Equity, the Redeemable Preferred Units were recorded as mezzanine equity at their issuance price, as they were redeemable at the option of the holder, based on the Members control of the Board of the Company. The initial carrying amount of redeemable preferred stock was its fair value, which was equal to the redemption value at date of issue.
The redemption value of the Redeemable Preferred Units was an amount that was equal to the holder’s initial capital contribution less all distributions previously made to such Redeemable Preferred Unit holders (the “Unpaid Preference Amount”) plus an amount accruing at the rate of 10% per quarter on the holder’s Unpaid Preference Amount (the “Preferred Return Amount”). Therefore, if distributions were not made with respect to any fiscal year, the Redeemable Preferred Unit holders’ distributions were cumulative. These units were recorded at redemption value at each balance sheet date and the Preferred Return Amount was recorded as an adjustment to retained earnings. During the years ended December 31, 2010 and 2009, the Company paid distributions to the Redeemable Preferred Unit holders of $0.1 million and $0.4 million, respectively.
On August 12, 2010, the Redeemable Preferred Units were converted to Capital Units in connection with the Unit Conversion at carrying value, which approximated fair value. Due to the Unit Conversion, no Redeemable Preferred Units were outstanding as of December 31, 2010.
Note 13. Loss per Share
Immediately prior to the Corporate Conversion, the Company had outstanding Capital Units (see note 11). In connection with the Corporate Conversion and IPO (see note 11), existing holders of Capital Units contributed
111
Table of Contents
their Capital Units to Tower International Holdings, LLC and that entity received 12,467,866 shares of the Company’s common stock through conversion of the Capital Units into common stock. Additionally, in the third quarter of 2010, prior to the Corporate Conversion, the Company completed the Unit Conversion whereby the Company converted its Common Units, MIP Units, and Redeemable Preferred Units into Capital Units (see note 11). The units outstanding before and after the Unit Conversion were held by the same parties. In addition, the units outstanding before and the shares outstanding after the Corporate Conversion were held by those same parties.
The impact of the Corporate Conversion has been applied on a retrospective basis to determine earnings per share for the periods presented. The weighted average number of common shares reflected in the calculation prior to the IPO is the total number of shares issued to Tower International Holdings based upon their units held on the IPO date.
Basic earnings / (loss) per share is calculated by dividing the net income / (loss) attributable to Tower International, Inc., less preferred unit dividends, by the weighted-average number of common shares outstanding.
The share count for diluted earnings / (loss) per share is computed on the basis of the weighted-average number of common shares outstanding plus the effects of dilutive common stock equivalents (CSEs) outstanding during the period. CSEs, which are securities that may entitle the holder to obtain common stock, include outstanding stock options and restricted stock units. When the average price of the common stock during the period exceeds the exercise price of a stock option, the options are considered potentially dilutive CSEs. To the extent these CSEs are anti-dilutive they are excluded from the calculation of diluted earnings per share. Also, when there is a loss from continuing operations, potentially dilutive shares are excluded from the computation of earnings per share as their effect would be anti-dilutive.
The Company excluded 2.2 million of potentially anti-dilutive shares for the year ended December 31, 2010. There are no potentially anti-dilutive shares for the years ended December 31, 2009 and 2008.
A summary of information used to compute basic net loss per share attributable to Tower International, Inc. is shown below (in thousands–except share and per share amounts):
| Year Ended December 31, | ||||||||||||
| 2010 | 2009 | 2008 | ||||||||||
| Net loss attributable to Tower International, Inc. |
$ | (36,894 | ) | $ | (67,936 | ) | $ | (52,355 | ) | |||
| Less: Preferred unit dividends |
(10,707 | ) | (16,087 | ) | (14,940 | ) | ||||||
| Loss available to common shareholders |
$ | (47,601 | ) | $ | (84,023 | ) | $ | (67,295 | ) | |||
| Weighted average basic and diluted units outstanding |
13,865,509 | 12,467,866 | 12,467,866 | |||||||||
| Basic and diluted loss per share attributable to Tower International, Inc. |
$ | (3.43 | ) | $ | (6.74 | ) | $ | (5.40 | ) | |||
Note 14. Share-based Compensation
2010 Equity Incentive Plan
The Company adopted a new equity incentive plan in connection with the IPO that allows for the grants of stock options, restricted stock awards, and other equity-based awards to be made pursuant to the plan. The eligibility requirements and terms governing the allocation of any common stock and the receipt of other consideration under the 2010 Equity Incentive Plan are determined by the Board of Directors and/or its Compensation Committee. The number of shares of common stock that may be issued or delivered may not exceed in the aggregate 4.6 million shares. Cash settled awards do not count against the maximum aggregate number.
112
Table of Contents
At December 31, 2010, there were 2,379,277 shares available for future grants of options and other types of awards under the 2010 Equity Incentive Plan. Forfeited shares may be re-issued under the plan up to the maximum amount to be issued as defined by the plan.
The following table summarizes the Company’s award activity during 2010:
| Options | Restricted Stock Units | |||||||||||||||
| Outstanding at: |
Shares | Weighted Average Exercise Price |
Shares | Weighted Average Grant Date Fair Value |
||||||||||||
| October 14, 2010 |
— | $ | — | — | $ | — | ||||||||||
| Granted upon IPO |
455,507 | 13.00 | 1,763,625 | 13.00 | ||||||||||||
| Granted during fourth quarter of 2010 |
1,591 | 14.31 | — | — | ||||||||||||
| Vested |
— | — | — | — | ||||||||||||
| December 31, 2010 |
457,098 | $ | 13.00 | 1,763,625 | $ | 13.00 | ||||||||||
Stock options—For options covering 455,507 shares granted concurrent with the IPO, the exercise price of each such option was equal to the price paid by the public in the IPO, which was $13.00 per share. These options vest over approximately three and a half years and their maximum term is ten years. During the fourth quarter of 2010, subsequent to the IPO, additional options were granted with an exercise price of $14.13, which was the market price on the grant date. Compensation expense is measured based on the fair value at the date of grant and is recognized on a straight-line basis over the vesting period. Shares issued upon the exercise of options are recorded as common stock and additional paid-in capital at the option price.
The Company calculated a weighted-average fair value of $7.15 for each option at the date of the grant using a Black-Scholes valuation model. The weighted-average key assumptions used in the model for options granted during 2010 are an expected term of 6.5 years and expected volatility of 62%. The dividend yield is assumed to be zero since there are no current plans to pay common stock dividends. The Company used the simplified method to calculate the expected term because the Company has insufficient historical exercise data due to the limited period of time the Company’s common stock has been publicly traded. During the fourth quarter of 2010, the Company recognized an expense of $0.1 million relating to the options. As of December 31, 2010, the Company has $2.8 million of unrecognized compensation expense associated with these stock options that will be amortized on a straight-line basis through March 2014.
As of December 31, 2010, the remaining average contractual life for the options is approximately 9.75 years and the aggregate intrinsic value is $1.9 million.
Restricted stock units (“RSUs”)—On October 14, 2010, in connection with the IPO, the Company granted RSUs covering an aggregate of 1,763,625 shares of common stock to the Company’s executive officers, a Board member and a consultant. The grant date value of the RSUs of $13.00 per share, less an estimated forfeiture amount, is being charged as a compensation expense against earnings over the 18 month vesting period of the RSUs. During the fourth quarter of 2010, the Company recognized an expense of $2.9 million relating to this program. As of December 31, 2010, the Company has $17.8 million of unrecognized compensation expense associated with these RSUs that will be amortized on a straight-line basis through February 2012.
Note 15. Related Party Transactions
During the years ended December 31, 2009 and 2008, Cerberus purchased from third parties approximately 86% of the Company’s first lien term loan. During the years ended December 31, 2010 and 2009, the Company paid
113
Table of Contents
$14.8 million and $14.6 million of interest to Cerberus relating to the first lien term loan and the related letter of credit facility. On August 24, 2010, the outstanding principal balance on the U.S. Dollar and Euro tranches of the Company’s first lien term loan were repaid in full in connection with the issuance of the Company’s senior secured notes. During the years ended December 31, 2010 and 2009, the Company paid $374 million and $2.6 million of principal payments to Cerberus relating to the first lien term loan and related letter of credit facility. On August 13, 2010, in connection with the offering of the Company’s senior secured notes, Cerberus agreed to convert $25 million aggregate principal amount of indebtedness under the first lien term loan and, in exchange, received equity in the Company; however, no new units were issued.
The Company has made certain payments to Cerberus for certain operational consulting services post acquisition. The Company made minor payments to its parent totaling less than $0.1 million during the years ended December 31, 2010 and 2009 and made payments of $0.8 million during the year ended December 31, 2008. The Company also has certain service agreements with Board members and consultants whereby the Company has paid them approximately $1.3 million, $2 million, and $3.2 million for 2010, 2009, and 2008, respectively. As of December 31, 2010, no consulting or service agreements existed with Board members.
On August 3, 2007, an affiliate of Cerberus acquired 80% of the Chrysler division from DaimlerChrysler Corporation. On April 30, 2009, Chrysler filed for bankruptcy and Cerberus divested its ownership in Chrysler. The Company sells certain products from its North American operations to Chrysler. The sale of these products was $144.9 million during 2008 and $17.7 million during the four months ended April 30, 2009.
The Company sells certain products from its Asian operations to our joint venture partners, FAW-VW and Chery. The sale of these products to FAW-VW was $106.8 million, $90.6 million, and $74.6 million for the years ended December 31, 2010, 2009, and 2008, respectively. The sale of these products to Chery was $34.9 million, $42.8 million, and $28.5 million for the years ended December 31, 2010, 2009 and 2008, respectively. The Company’s accounts receivable with FAW-VW at December 31, 2010 and 2009 was $11.7 million and $12.4 million, respectively. The Company’s accounts receivable with Chery at December 31, 2010 and 2009 was $21 million and $8.7 million, respectively.
Note 16. Segment Information
The Company defines its operating segments as components of its business where separate financial information is available and is routinely evaluated by management. The company’s chief operating decision maker (CODM) is the Chief Executive Officer. The Company produces engineered structural metal components and assemblies primarily serving the global automotive industry. The Company’s operations have similar economic characteristics, and share fundamental characteristics including the nature of the products, production processes, customers, and distribution channels. The Company’s products include body structures stampings, chassis structures (including frames), and complex welded assemblies for small and large cars, crossovers, pickups and SUVs. The Company is comprised of four operating segments: Europe, Asia, North America, and South America. These operating segments are aggregated into two reportable segments. The International segment consists of Europe and Asia while the Americas segment consists of North and South America.
The Company measures segment operating performance based on Adjusted EBITDA. The Company uses segment Adjusted EBITDA as the basis for the CODM to evaluate the performance of each of the Company’s reportable segments.
114
Table of Contents
The following is a summary of selected data for each of our segments, excluding discontinued operations (in thousands):
| International | Americas | Total | ||||||||||
| 2010: |
||||||||||||
| Revenues |
$ | 1,147,614 | $ | 849,444 | $ | 1,997,058 | ||||||
| Adjusted EBITDA |
125,545 | 64,690 | 190,235 | |||||||||
| Capital expenditures |
46,255 | 56,553 | 102,808 | |||||||||
| Total assets |
$ | 867,300 | $ | 472,876 | $ | 1,340,176 | ||||||
| 2009: |
||||||||||||
| Revenues |
$ | 990,523 | $ | 643,882 | $ | 1,634,405 | ||||||
| Adjusted EBITDA |
108,650 | 16,350 | 125,000 | |||||||||
| Capital expenditures |
49,753 | 29,185 | 78,938 | |||||||||
| Total assets |
$ | 886,936 | $ | 447,485 | $ | 1,334,421 | ||||||
| 2008: |
||||||||||||
| Revenues |
$ | 1,251,361 | $ | 920,344 | $ | 2,171,705 | ||||||
| Adjusted EBITDA |
163,875 | 48,979 | 212,854 | |||||||||
| Capital expenditures |
75,956 | 53,153 | 129,109 | |||||||||
| Total assets |
$ | 831,990 | $ | 437,790 | $ | 1,269,780 | ||||||
Inter-segment sales are not significant for any period presented. Capital expenditures do not equal cash disbursed for purchases of property, plant, and equipment as presented in the accompanying consolidated statements of cash flows, as capital expenditures above include amounts paid and accrued during the periods presented.
The following is a reconciliation of Adjusted EBITDA to net loss before provision for income taxes (in thousands):
| Years Ended December 31, | ||||||||||||
| 2010 | 2009 | 2008 | ||||||||||
| Adjusted EBITDA |
$ | 190,235 | $ | 125,000 | $ | 212,854 | ||||||
| Restructuring |
(14,288 | ) | (13,436 | ) | (4,837 | ) | ||||||
| Depreciation and amortization |
(114,668 | ) | (147,705 | ) | (170,267 | ) | ||||||
| Receivable factoring charges |
(471 | ) | (757 | ) | (694 | ) | ||||||
| Acquisition costs |
(679 | ) | — | — | ||||||||
| Incentive compensation related to funding events |
(11,075 | ) | — | — | ||||||||
| Other adjustments |
— | — | (3,100 | ) | ||||||||
| Interest expense, net |
(65,910 | ) | (56,899 | ) | (60,190 | ) | ||||||
| Other income / (expense), net |
(1,300 | ) | 33,661 | — | ||||||||
| Net loss before provision for income taxes |
$ | (18,156 | ) | $ | (60,136 | ) | $ | (26,234 | ) | |||
115
Table of Contents
The following is a summary of revenues and long-lived assets by geographic location (in thousands):
| Years Ended and End of Year December 31, | ||||||||||||||||||||||||
| 2010 | 2009 | 2008 | ||||||||||||||||||||||
| Revenues | Long-Lived Assets |
Revenues | Long-Lived Assets |
Revenues | Long-Lived Assets |
|||||||||||||||||||
| Belgium |
$ | 157,709 | $ | 29,648 | $ | 161,821 | $ | 45,887 | $ | 214,589 | $ | 63,693 | ||||||||||||
| Italy |
140,255 | 45,628 | 158,483 | 56,722 | 182,030 | 61,825 | ||||||||||||||||||
| Germany |
341,220 | 86,719 | 250,142 | 96,121 | 378,996 | 102,650 | ||||||||||||||||||
| Slovakia |
99,990 | 63,498 | 75,980 | 59,698 | 119,727 | 47,341 | ||||||||||||||||||
| Other Europe |
56,236 | 10,313 | 54,117 | 11,536 | 58,951 | 14,149 | ||||||||||||||||||
| Asia |
442,622 | 140,354 | 337,765 | 120,759 | 370,892 | 113,931 | ||||||||||||||||||
| U.S. |
640,076 | 210,825 | 472,622 | 216,337 | 702,743 | 259,975 | ||||||||||||||||||
| Brazil |
209,515 | 44,340 | 171,273 | 38,580 | 217,804 | 32,332 | ||||||||||||||||||
| Intercompany eliminations |
(90,565 | ) | — | (47,798 | ) | — | (74,027 | ) | — | |||||||||||||||
| Total |
$ | 1,997,058 | $ | 631,325 | $ | 1,634,405 | $ | 645,640 | $ | 2,171,705 | $ | 695,896 | ||||||||||||
Revenues are attributed to geographic locations based on the location of specific production. Long-lived assets consist of net property, plant and equipment and company-owned tooling.
The following is a summary of the approximate composition by product category of the Company’s revenues (in thousands):
| Years Ended December 31, | ||||||||||||
| 2010 | 2009 | 2008 | ||||||||||
| Body structures and assemblies |
$ | 1,052,675 | $ | 920,990 | $ | 1,272,920 | ||||||
| Chassis, lower vehicle systems and suspension components |
509,881 | 402,882 | 492,482 | |||||||||
| Complex body-in-white assemblies |
405,849 | 282,582 | 372,230 | |||||||||
| Other |
28,653 | 27,951 | 34,073 | |||||||||
| Total |
$ | 1,997,058 | $ | 1,634,405 | $ | 2,171,705 | ||||||
The Company sells its products directly to automotive manufacturers. Following is a summary of customers that accounted for 10 percent or more of consolidated revenues in any of the three years ended December 31, 2010:
| 2010 | 2009 | 2008 | ||||||||||
| VW |
16% | 17% | 14% | |||||||||
| Hyundai/Kia |
13% | 10% | 11% | |||||||||
| Ford |
13% | 13% | 14% | |||||||||
| Fiat |
11% | 13% | 11% | |||||||||
| Volvo |
8% | 10% | 10% | |||||||||
All customers that accounted for 10 percent or more of consolidated revenues from the table above are customers in the automotive industry; therefore, the Company is potentially subject to a concentration of credit risk.
116
Table of Contents
Note 17. Acquisition of Facility in Artern, Germany
On March 14, 2010, a foreign subsidiary of the Company acquired the assets of the manufacturing plant of TWB Fahrzeugtechnik GmbH & Co, KG i.L. located in Artern, Germany from an insolvency administrator. The acquisition was accounted for as a purchase under the acquisition method in accordance with FASB ASC No. 805, Business Combinations. The total purchase price was approximately $17.7 million, which does not include direct acquisition costs of approximately $0.7 million. The acquisition was recorded by allocating the purchase price to the assets acquired, including identifiable intangible assets and liabilities assumed, based on their estimated fair values at the date of acquisition. There was no goodwill recorded in connection with the acquisition. Supplemental pro forma disclosures are not included as the amounts are deemed immaterial. Revenues and earnings of the acquiree since the acquisition date included in the Company’s Consolidated Statement of Operations are immaterial for all periods presented.
The Company will be liable to pay back certain investment grants in the amount of $2.2 million, if agreed upon levels of employment at the Artern facility are not maintained through April 30, 2011. At present, the Company expects to maintain adequate employment through the period ending April 30, 2011.
In accordance with FASB ASC No. 805, the preliminary purchase price allocation is subject to additional adjustment within one year after the acquisition as additional information on asset and liability valuations becomes available. Through December 31, 2010, no adjustments to the initial purchase price allocation have been recorded.
The preliminary allocation of the purchase price for the acquisition was made to the following major opening balance sheet categories (in thousands):
| Assets Acquired |
||||
| Current assets |
$ | 1,925 | ||
| Property, plant and equipment, net |
14,495 | |||
| Intangibles |
2,055 | |||
| Total assets acquired |
18,475 | |||
| Other non-current liabilities assumed |
822 | |||
| Net assets acquired |
17,653 | |||
| Less: Amount remaining to pay |
966 | |||
| Cash paid during 2010 |
$ | 16,687 | ||
Note 18. Commitments and Contingencies
Leases
The Company leases office and manufacturing space and certain equipment under non-cancelable lease agreements, which require the Company to pay maintenance, insurance, taxes and other expenses in addition to rental payments. The Company has entered into leasing commitments with lease terms expiring between the years 2011 and 2021. The Company has options to extend the terms of certain leases in future periods. The properties covered under these leases include manufacturing equipment and facilities and administrative offices and equipment. Rent expense for all operating leases totaled $21.3 million, $24.1 million, and $32.1 million in 2010, 2009, and 2008, respectively.
117
Table of Contents
Future minimum capital and operating lease payments at December 31, 2010 are as follows (in thousands):
| Year |
Operating Leases | Capital Leases | ||||||
| 2011 |
$ | 24,143 | $ | 4,062 | ||||
| 2012 |
17,290 | 3,864 | ||||||
| 2013 |
12,912 | 2,325 | ||||||
| 2014 |
13,250 | 1,766 | ||||||
| 2015 |
13,644 | 1,697 | ||||||
| Thereafter |
55,653 | 9,119 | ||||||
| Total future lease payments |
$ | 136,892 | 22,833 | |||||
| Less: amount representing interest |
(4,526 | ) | ||||||
| Present value of minimum lease payments |
$ | 18,307 | ||||||
Purchase Commitments
As of December 31, 2010, the Company was obligated under executory purchase orders for approximately $68.1 million of tooling, $51.9 million of capital expenditures, and $5.6 million of other expenditures.
Compensation Programs
The primary objectives of the Company’s compensation programs are to (i) attract, motivate and retain the best executive officers with the skills necessary to successfully manage the business, and (ii) align the interests of the executive officers with equityholders by rewarding them for strong Company performance.
Special Incentive Program
The Board established the Special Incentive Program on February 19, 2010. The Special Incentive Program provided for a $5.5 million cash bonus to be paid to eight executives if a Qualifying Event occurred. For this program, a “Qualifying Event” was defined as the consummation of an initial public offering or the repayment of the Company’s first lien term loan in full. The Company initially believed it would repay the first lien term loan on or before its July 31, 2013 expiration date; thus, the Company began recording an expense related to the Special Incentive Program on a straight line basis through July 31, 2013. On July 22, 2010, the Board modified the Special Incentive Program to provide that, in addition to the $5.5 million cash bonus payable upon consummation of an initial public offering or retirement of the Company’s first lien term loan, an additional cash bonus of $1.2 million would be payable to specified executive officers of the Company on the earlier of the one year anniversary of the consummation of a notes offering or the consummation of an initial public offering. As the Company retired its first lien term loan on August 24, 2010, the Company recognized the remaining expense related to the $5.5 million in August and began recording the additional $1.2 million over the one year vesting period. On October 20, 2010, the additional $1.2 million Special Incentive Program vested immediately upon the closing of the IPO. The full amount of the compensation paid pursuant to the Special Incentive Program that had not been previously expensed was charged as a compensation expense against earnings in the fourth quarter of 2010 when the compensation was paid. The Company recorded an expense of $6.7 million during the year ended December 31, 2010. As of December 31, 2010, the Company has a liability remaining of $1 million relating to the Special Incentive Program.
Amended Value Creation Plan (“VC Plan”)
The Board amended the VC Plan on February 19, 2010. The VC Plan provided for special cash bonuses to be paid to approximately 70 executives if a Funding Event were to occur and certain other conditions were satisfied. A Funding Event was defined as either the consummation of an initial public offering or the occurrence
118
Table of Contents
of a liquidation event (as defined in the Company’s operating agreement). However, based upon the size of the IPO, the necessary conditions to the payment of any benefits under the VC Plan were not satisfied.
Supplemental Value Creation Program
The Supplemental Value Creation Program was created in addition to the VC Plan discussed above on February 19, 2010. The Supplemental Value Creation Program provided for a $7.5 million cash bonus to be paid to approximately 70 executives, subject to vesting requirements of 9 and 18 months, if a Qualifying Liquidation Event were to occur. A Qualifying Liquidation Event was initially defined to have occurred if the Preferred Unit holders received a cash distribution in an amount equal to the full value of their preferred investment in the Company. On July 22, 2010, the Supplemental Value Creation Program was modified to include the retirement of the existing first lien term loan in full or consummation of an initial public offering as Qualifying Liquidation Events. As the Company retired its first lien term loan on August 24, 2010, the Company began recording a liability in August 2010 related to this Program. The Company recorded an expense of $1.5 million for the year ended December 31, 2010 and has recorded a liability of $1.5 million relating to this Program.
Long Term Incentive Program
The Board established the Long Term Incentive Program on February 19, 2010. Participants were entitled to receive special cash bonuses if a Qualifying Transaction occurred. For this program, a “Qualifying Transaction” was defined as a distribution to the Company’s Preferred Unit holders in excess of $50 million. In the event of an IPO, the special bonuses were expected to be paid in the form of restricted stock units (“RSUs”), the number of which was to be determined on the basis of the amount of value attributable to the Preferred Unit holders. A Qualifying Transaction was not a prerequisite to such award of RSUs. In connection with the Company’s IPO, the special bonuses were paid in the form of RSUs under the 2010 Equity Incentive Plan (see note 14); therefore, no cash bonuses will be paid under this Program.
Environmental Matters
The Company owns properties which have been impacted by environmental releases. The Company is actively involved in investigation and/or remediation at several of these locations. Total costs and liabilities associated with environmental contamination could be substantial and may have an adverse impact on the Company’s financial condition, results of operations or cash flows.
Accruals for environmental matters are recorded when it is probable that a liability has been incurred and the amount of the liability can be reasonably estimated. The established liability for environmental matters is based upon management’s best estimates of expected investigation/remediation costs related to environmental contamination. It is possible that actual costs associated with these matters will exceed the environmental reserves established by the Company. Inherent uncertainties exist in the estimates, primarily due to unknown environmental conditions, changing governmental regulations and legal standards regarding liability and evolving technologies for handling site remediation and restoration. At December 31, 2010 and 2009, the Company had accrued approximately $1.8 million for environmental matters.
Contingent Matters
The Company will establish reserves for matters in which losses are probable and can be reasonably estimated. These types of matters may involve additional claims that, if granted, could require the Company to pay penalties or make other expenditures in amounts that will not be estimable at the time of discovery of the matter. In these cases, a liability will be recorded at the low end of the range if no amount within the range is a better estimate in accordance with FASB ASC No. 450, Accounting for Contingencies.
119
Table of Contents
In connection with the bankruptcy of Tower Automotive, Inc., all of the assets not acquired by Tower Automotive, LLC were transferred to a Post-Consummation Trust (the “Post-Consummation Trust”). The Company agreed to pay up to $70 million to the Post-Consummation Trust to relinquish certain defined liabilities to date. The Company has made payments of $57.5 million and remains contingently liable to pay an additional $12.5 million. As of December 31, 2010, the Company has not recorded a liability for the $12.5 million since it does not believe it is probable that any additional payments to the trust will be required; therefore, these amounts were eliminated as part of the final purchase accounting adjustments. To the extent that future payments are required, the payments will be expensed.
The Company has been subject to various governmental audits in Brazil. As a result of these audits, the Company may be required to pay up to $14 million for which the Company has recorded a liability of $10.8 million as of December 31, 2010. To the extent that future payments are required above the amount recorded as a liability, the payments will be expensed.
Litigation
The Company is subject to various legal actions and claims incidental to its business, including potential lawsuits with customers or suppliers. Litigation is subject to many uncertainties and the outcome of individual litigated matters is not probable and estimable. After discussions with counsel litigating these matters, it is the opinion of management that the outcome of such matters will not have a material adverse impact on the Company’s financial position, results of operations or cash flows.
Note 19. Change in Working Capital and Other Operating Items
The following table summarizes the sources / (uses) of cash provided by changes in working capital and other operating items (in thousands):
| Year Ended December 31, | ||||||||||||
| 2010 | 2009 | 2008 | ||||||||||
| Accounts receivable |
$ | (6,988 | ) | $ | (114,754 | ) | $ | 165,791 | ||||
| Inventories |
(10,578 | ) | 13,563 | 34,356 | ||||||||
| Prepaid tooling and other current assets |
215 | 6,875 | (4,844 | ) | ||||||||
| Accounts payable and accrued liabilities |
44,495 | 92,999 | (137,288 | ) | ||||||||
| Other assets and liabilities |
13,424 | 8,548 | 29,252 | |||||||||
| Change in working capital |
$ | 40,568 | $ | 7,231 | $ | 87,267 | ||||||
120
Table of Contents
Note 20. Quarterly Financial Data (Unaudited)
The following table summarizes selected quarterly financial data (in thousands):
| Quarter |
Net Sales | Gross Profit | Net Income
/ (Loss) |
Net Income
/ (Loss) Attributable to Tower International, Inc. |
Earnings per Share |
|||||||||||||||
| 2010 |
||||||||||||||||||||
| 1st |
$ | 479,129 | $ | 53,225 | $ | (2,348 | ) | $ | (4,482 | ) | $ | (0.70 | ) | |||||||
| 2nd |
501,682 | 55,538 | 4,305 | 1,911 | (0.20 | ) | ||||||||||||||
| 3rd |
474,640 | 44,878 | (10,986 | )(a) | (13,001 | )(a) | (1.21 | ) | ||||||||||||
| 4th |
541,607 | 56,941 | (19,424 | )(b) | (21,322 | )(b) | (1.18 | ) | ||||||||||||
| Full Year |
$ | 1,997,058 | $ | 210,582 | $ | (28,453 | ) | $ | (36,894 | ) | $ | (3.43 | ) | |||||||
| 2009 |
||||||||||||||||||||
| 1st |
$ | 320,035 | (c) | $ | (2,769 | )(c) | $ | (41,678 | )(c) | $ | (43,044 | )(c) | $ | (3.76 | ) | |||||
| 2nd |
377,814 | (c) | 18,736 | (c) | 6,626 | (d) | 4,010 | (d) | — | |||||||||||
| 3rd |
435,562 | 40,011 | (7,388 | ) | (9,925 | ) | (1.12 | ) | ||||||||||||
| 4th |
500,994 | 41,675 | (16,592 | )(e) | (18,977 | )(e) | (1.86 | ) | ||||||||||||
| Full Year |
$ | 1,634,405 | $ | 97,653 | $ | (59,032 | ) | $ | (67,936 | ) | $ | (6.74 | ) | |||||||
| (a) | During the third quarter of 2010, the Company recorded one-time compensation charges of $6.1 million related to the Special Incentive Program and Supplemental Value Creation Program in connection with the notes offering. |
| (b) | During the fourth quarter of 2010, the Company recorded an impairment charge of $7.3 million related to solar spending, one-time compensation charges of $5 million related to the compensation programs in connection with the initial public offering, an expense of $2.5 million related to the partial redemption of the notes, and a restructuring charge of $2.3 million in connection with the sale of a closed facility. |
| (c) | During the first half of 2009, the Company experienced an unprecedented downturn due to the global economic downturn which significantly impacted revenues and profitability. |
| (d) | During the second quarter of 2009, the Company recorded a one-time gain of $32.5 million related to the repurchase of a portion of its first lien term loan. |
| (e) | During the fourth quarter of 2009, the Company closed its press shop in Bergisch Gladbach, Germany, which resulted in charges of $10.2 million. |
Note 21. Subsequent Events
On February 17, 2011, the Issuers delivered notice of their intention to repurchase $17 million of the senior secured notes pursuant to the terms of the indenture. The aggregate amount to be paid with respect to the notes to be redeemed will be $18 million, representing an aggregate redemption price of $17.9 million and aggregate accrued and unpaid interest of $0.1 million. The record date for the proposed redemption is February 28, 2011 and the scheduled date for the proposed redemption is March 30, 2011.
121
Table of Contents
| Item 9. | Changes in and Disagreements with Accountants on Accounting and Financial Disclosure |
None.
| Item 9A. | Controls and Procedures |
Evaluation of Disclosure Controls and Procedures
Mark Malcolm, our Chief Executive Officer (“CEO”), and James C. Gouin, our Chief Financial Officer (“CFO”), have performed an evaluation of our disclosure controls and procedures, as defined in Rule 13a-15(e) of the Securities Exchange Act of 1934, as amended (the “Exchange Act”), as of December 31, 2010 and each has concluded that such disclosure controls and procedures were effective to ensure that information required to be disclosed in our periodic reports filed under the Exchange Act is recorded, processed, summarized and reported within the time periods specified by the Securities and Exchange Commission’s rules and forms and such information is accumulated and communicated to our management, including our principal executive and principal financial officers, as appropriate to allow for timely decisions regarding required disclosure.
Management’s Annual Report on Internal Control over Financial Reporting
Our management is responsible for establishing and maintaining adequate internal control over financial reporting, as such term is defined in Rule 13a-15(f) under the Securities Exchange Act of 1934, as amended. Our internal control over financial reporting is a process designed to provide reasonable assurance regarding the reliability of financial reporting and the preparation of financial statements for external purposes in accordance with generally accepted accounting principles in the U.S.
Because of its inherent limitations, internal control over financial reporting may not prevent or detect misstatements. Also, projections of any evaluation of effectiveness to future periods are subject to the risk that controls may become inadequate because of changes in conditions or because the degree of compliance with policies or procedures may deteriorate.
Under the supervision and with the participation of our management, including our CEO and CFO, we conducted an assessment of the effectiveness of our internal control over financial reporting as of December 31, 2010. The assessment was based on criteria established in the framework “Internal Control – Integrated Framework” issued by the Committee of Sponsoring Organizations of the Treadway Commission. Based on this assessment, management concluded that our internal control over financial reporting was effective as of December 31, 2010.
The effectiveness of our internal control over financial reporting as of December 31, 2010 has been audited by Deloitte & Touche LLP, an independent registered public accounting firm, as stated in their report included herein.
Changes in Internal Control over Financial Reporting
There has not been any change in our internal control over financial reporting during the quarter ended December 31, 2010, that has materially affected, or is reasonably likely to materially affect, our internal control over financial reporting.
| Item 9B. | Other Information |
None.
122
Table of Contents
PART III
| Item 10. | Directors, Executive Officers and Corporate Governance |
The Company responds to this Item by incorporating by reference the material responsive to this Item in the Company’s definitive proxy statement for its 2011 Annual Meeting of Shareholders.
Tower has adopted a Code of Business Conduct that applies to, among other persons, our principal executive officer, principal financial officer, principal accounting officer and other persons performing similar functions. A copy of our Code of Business Conduct, as it may be amended from time to time, is available on our website, www.towerinternational.com, under “Investor Relations” under the subheading “Corporate Governance.”
| Item 11. | Executive Compensation |
The Company responds to this Item by incorporating by reference the material responsive to this Item in the Company’s definitive proxy statement for its 2011 Annual Meeting of Shareholders.
| Item 12. | Security Ownership of Certain Beneficial Owners and Management and Related Stockholder Matters |
The Company responds to this Item by incorporating by reference the material responsive to this Item in the Company’s definitive proxy statement for its 2011 Annual Meeting of Shareholders.
Equity Compensation Plan Information—The following table provides information about our equity compensation plans as of December 31, 2010.
| Plan Category |
Number of Securities to be Issued Upon Exercise of Outstanding Options, Warrants and Rights |
Weighted-Average Exercise Price of Outstanding Options, Warrants and Rights |
Number of Securities Remaining Available for Future Issuance Under Equity Compensation Plans |
|||||||||
| Equity compensation plans approved by security holders |
2,220,723 | $ | 13.00 | 2,379,277 | ||||||||
| Equity compensation plans not approved by security holders |
N/A | N/A | N/A | |||||||||
| Total |
2,220,723 | $ | 13.00 | 2,379,277 | ||||||||
| Item 13. | Certain Relationships and Related Transactions, and Director Independence |
The Company responds to this Item by incorporating by reference the material responsive to this Item in the Company’s definitive proxy statement for its 2011 Annual Meeting of Shareholders.
| Item 14. | Principal Accountant Fees and Services |
The Company responds to this Item by incorporating by reference the material responsive to this Item in the Company’s definitive proxy statement for its 2011 Annual Meeting of Shareholders.
123
Table of Contents
PART IV
| Item 15. | Exhibits and Financial Statement Schedules |
(a) List of documents filed as part of this Annual Report or incorporated herein by reference:
(1) Financial Statements: The following financial statements of the Registrant as set forth under Part II, Item 8 of this report on Form 10-K on the pages indicated:
| Page | ||||
| Audited Financial Statements for the Three Years Ended December 31, 2010: |
||||
| 75 | ||||
| Consolidated Balance Sheets as of December 31, 2010 and 2009 |
77 | |||
| Consolidated Statements of Operations for the Years Ended December 31, 2010, 2009 and 2008 |
78 | |||
| Consolidated Statements of Cash Flows for the Years Ended December 31, 2010, 2009 and 2008 |
79 | |||
| 80 | ||||
| 81 | ||||
(2) Financial Statement Schedule:
SCHEDULE II
Valuation and Qualifying Accounts for the years ended December 31, 2010, 2009, and 2008 (in thousands)
| Column A |
Column B | Column C | Column D | Column E | ||||||||||||||||
| Additions | ||||||||||||||||||||
| Description |
Balance at Beginning of Year |
Charged to Costs and Expenses |
Charged to Other Accounts |
Deductions | Balance at End of Year |
|||||||||||||||
| Year Ended December 31, 2010 |
||||||||||||||||||||
| Allowance for doubtful accounts |
$ | 2,439 | $ | (199 | ) | $ | — | $ | (566 | )(a) | $ | 1,674 | ||||||||
| Deferred tax asset valuation allowance |
172,358 | 3,607 | 4,430 | — | 180,395 | |||||||||||||||
| Year Ended December 31, 2009 |
||||||||||||||||||||
| Allowance for doubtful accounts |
$ | 3,974 | $ | 930 | $ | — | $ | (2,465 | )(a) | $ | 2,439 | |||||||||
| Deferred tax asset valuation allowance |
170,093 | 19,496 | (17,231 | ) | — | 172,358 | ||||||||||||||
| Year Ended December 31, 2008 |
||||||||||||||||||||
| Allowance for doubtful accounts |
$ | 4,890 | $ | 3,124 | $ | — | $ | (4,040 | )(a) | $ | 3,974 | |||||||||
| Deferred tax asset valuation allowance |
125,530 | 28,073 | 16,490 | (b) | — | 170,093 | ||||||||||||||
| (a) | Write off of uncollectible accounts |
| (b) | Currency translation adjustment and other comprehensive income |
All other schedules are omitted because they are inapplicable or not required or the information is included in the Company’s consolidated financial statements or the notes thereto.
124
Table of Contents
(3) Exhibits
| 2.1 | Asset Purchase Agreement, dated as of May 1, 2007, by and among Tower Automotive, Inc., a debtor-in-possession and certain of its subsidiaries, and Tower Automotive, LLC f/k/a TA Acquisition Company, LLC (filed as Exhibit 2.1 to the Registrant’s Registration Statement on Form S-1 as originally filed on March 4, 2010 (No. 333-165200) and incorporated herein by reference). | |
| 2.2 | Form of Contribution Agreement providing for the contribution of equity interests in Tower Automotive, LLC to Tower International Holdings, LLC (filed as Exhibit 2.2 to Amendment No. 3 to the Registrant’s Registration Statement on Form S-1 (No. 333-165200) and incorporated herein by reference). | |
| 3.1 | Form of Certificate of Incorporation of the Registrant (filed as Exhibit 3.1 to Amendment No. 4 to the Registrant’s Registration Statement on Form S-1 (No. 333-165200) and incorporated herein by reference). | |
| 3.2 | Form of By-Laws of the Registrant (filed as Exhibit 3.2 to Amendment No. 8 to the Registrant’s Registration Statement on Form S-1 (No. 333-165200) and incorporated herein by reference). | |
| 4.1 | See Exhibits 3.1 and 3.2 for provisions of the Certificate of Incorporation and Bylaws of the Registrant defining the rights of holders of common stock of the Registrant. | |
| 4.2 | Specimen stock certificate (filed as Exhibit 4.2 to Amendment No. 3 to the Registrant’s Registration Statement on Form S-1 (No. 333-165200) and incorporated herein by reference). | |
| 4.3 | Form of Registration Rights Agreement between the Registrant and Tower International Holdings, LLC (filed as Exhibit 4.3 to Amendment No. 3 to the Registrant’s Registration Statement on Form S-1 (No. 333-165200) and incorporated herein by reference). | |
| 4.4 | Indenture, dated as of August 24, 2010, among Tower Automotive Holdings USA, LLC and TA Holdings Finance, Inc., as issuers, the guarantors party thereto and Wilmington Trust FSB, as trustee and collateral agent (filed as Exhibit 4.4 to Amendment No. 6 to the Registrant’s Registration Statement on Form S-1 (No. 333-165200) and incorporated herein by reference). | |
| 10.1 | Revolving Credit and Guaranty Agreement, dated as of July 31, 2007, by and among Tower Automotive Holdings USA, LLC, the Guarantors named therein, the Lenders named therein and JPMorgan Chase Bank, N.A., as Administrative Agent (filed as Exhibit 10.1 to the Registrant’s Registration Statement on Form S-1 as originally filed on March 4, 2010 (No. 333-165200) and incorporated herein by reference). | |
| 10.2 | Amendment No. 1 to Revolving Credit and Guaranty Agreement, dated May 5, 2008, by and among Tower Automotive Holdings USA, LLC, the Guarantors from time to time party thereto, the Lenders from time to time party thereto and JPMorgan Chase Bank, N.A., as Administrative Agent (filed as Exhibit 10.2 to the Registrant’s Registration Statement on Form S-1 as originally filed on March 4, 2010 (No. 333-165200) and incorporated herein by reference). | |
| 10.3 | Amendment No. 2 to the Revolving Credit and Guaranty Agreement, dated as of August 4, 2010, among Tower Automotive Holdings USA, LLC, the guarantors from time to time party thereto, the lenders from time to time party thereto and JPMorgan Chase Bank, N.A., as administrative agent (filed as Exhibit 10.3 to Amendment No. 6 to the Registrant’s Registration Statement on Form S-1 (No. 333-165200) and incorporated herein by reference). | |
| 10.4 | First Lien Term Loan and Guaranty Agreement, dated as of July 31, 2007, by and among Tower Automotive Holdings USA, LLC, Tower Automotive Holding Europe B.V., the Guarantors named
therein, the Lenders, named therein and JPMorgan Chase Bank, N.A., as Agent (filed as Exhibit 10.4 to the Registrant’s Registration Statement on Form S-1 as originally filed on March 4, 2010 (No. 333-165200) and incorporated herein by reference). | |
125
Table of Contents
| 10.5 | Amendment No 1 to First Lien Term Loan and Guaranty Agreement, dated as of December 24, 2007, by and among Tower Automotive Holdings USA, LLC, Tower Automotive Holding Europe B.V., the Guarantors named therein, the Lenders named therein and JPMorgan Chase Bank, N.A., as Agent (filed as Exhibit 10.5 to the Registrant’s Registration Statement on Form S-1 as originally filed on March 4, 2010 (No. 333-165200) and incorporated herein by reference). | |
| 10.6 | Amendment No 2 to First Lien Term Loan and Guaranty Agreement, dated as of May 5, 2008, by and among Tower Automotive Holdings USA, LLC, Tower Automotive Holding Europe B.V., the Guarantors named therein, the Lenders named therein and JPMorgan Chase Bank, N.A., as Agent (filed as Exhibit 10.6 to the Registrant’s Registration Statement on Form S-1 as originally filed on March 4, 2010 (No. 333-165200) and incorporated herein by reference). | |
| 10.7 | Waiver and Amendment No 3 to First Lien Term Loan and Guaranty Agreement, April 1, 2009, by and among Tower Automotive Holdings USA, LLC, Tower Automotive Holding Europe B.V., the Guarantors named therein, the Lenders named therein and JPMorgan Chase Bank, N.A., as Agent (filed as Exhibit 10.7 to the Registrant’s Registration Statement on Form S-1 as originally filed on March 4, 2010 (No. 333-165200) and incorporated herein by reference). | |
| 10.8 | Amendment No. 4 to the First Lien Term Loan and Guaranty Agreement, dated as of August 24, 2010, among Tower Automotive Holdings USA, LLC, Tower Automotive Holdings Europe B.V., the guarantors from time to time party thereto, the lenders from time to time party thereto and JPMorgan Chase Bank, N.A. (filed as Exhibit 10.8 to Amendment No. 6 to the Registrant’s Registration Statement on Form S-1 (No. 333-165200) and incorporated herein by reference). | |
| 10.9 | Amended and Restated Intercreditor Agreement, dated as of August 24, 2010, among JPMorgan Chase Bank, N.A., as representative with respect to certain agreements identified therein, Wilmington Trust FSB, as representative with respect to the notes agreement identified therein, each additional representative from time to time party thereto, Tower Automotive Holdings USA, LLC, the other loan parties party thereto and Tower Automotive, LLC (filed as Exhibit 10.9 to Amendment No. 6 to the Registrant’s Registration Statement on Form S-1 (No. 333-165200) and incorporated herein by reference). | |
| 10.10 | Term Intercreditor Agreement, dated as of August 24, 2010, among JPMorgan Chase Bank, N.A., as synthetic letter of credit facility agent, Wilmington Trust FSB, as notes collateral agent, each additional term agent from time to time party thereto, each grantor from time to time party thereto and Tower Automotive, LLC (filed as Exhibit 10.10 to Amendment No. 6 to the Registrant’s Registration Statement on Form S-1 (No. 333-165200) and incorporated herein by reference). | |
| 10.11 | Amended and Restated ABL Security Agreement, dated as of August 24, 2010, among Tower Automotive Holdings USA, LLC, the guarantors party thereto and JPMorgan Chase Bank, N.A., as agent (filed as Exhibit 10.11 to Amendment No. 6 to the Registrant’s Registration Statement on Form S-1 (No. 333-165200) and incorporated herein by reference). | |
| 10.12 | Amended and Restated First Lien Term Loan Security Agreement, dated as of August 24, 2010, among Tower Automotive Holdings USA, LLC, the guarantors party thereto and JPMorgan Chase Bank, N.A., as agent (filed as Exhibit 10.12 to Amendment No. 6 to the Registrant’s Registration Statement on Form S-1 (No. 333-165200) and incorporated herein by reference). | |
| 10.13 | Notes Security Agreement, dated as of August 24, 2010, among Tower Automotive Holdings USA, LLC, TA Holdings Finance, Inc., the subsidiary guarantors party thereto and Wilmington Trust FSB, as collateral agent (filed as Exhibit 10.13 to Amendment No. 6 to the Registrant’s Registration Statement on Form S-1 (No. 333-165200) and incorporated herein by reference). | |
| 10.14† | Registrant’s Employment Agreement with James Gouin (filed as Exhibit 10.25 to the Registrant’s Registration Statement on Form S-1 as originally filed on March 4, 2010 (No. 333-165200) and incorporated herein by reference). | |
126
Table of Contents
| 10.15† | Letter Agreement Amendment to Employment Agreement, dated as of June 1, 2010, between the Registrant and James Gouin (filed as Exhibit 10.52 to Amendment No. 5 to the Registrant’s Registration Statement on Form S-1 (No. 333-165200) and incorporated herein by reference). | |
| 10.16† | Registrant’s Employment Agreement with Mark Malcolm (filed as Exhibit 10.26 to the Registrant’s Registration Statement on Form S-1 as originally filed on March 4, 2010 (No. 333-165200) and incorporated herein by reference). | |
| 10.17† | Letter Agreement Amendment to Employment Agreement, dated as of June 1, 2010, between the Registrant and Mark Malcolm (filed as Exhibit 10.50 to Amendment No. 5 to the Registrant’s Registration Statement on Form S-1 (No. 333-165200) and incorporated herein by reference). | |
| 10.18† | Registrant’s Employment Agreement with Michael Rajkovic (filed as Exhibit 10.27 to the Registrant’s Registration Statement on Form S-1 as originally filed on March 4, 2010 (No. 333-165200) and incorporated herein by reference). | |
| 10.19† | Letter Agreement Amendment to Employment Agreement, dated as of June 1, 2010, between the Registrant and Michael Rajkovic (filed as Exhibit 10.51 to Amendment No. 5 to the Registrant’s Registration Statement on Form S-1 (No. 333-165200) and incorporated herein by reference). | |
| 10.20† | Registrant’s Employment Agreement with William Cook (filed as Exhibit 10.28 to the Registrant’s Registration Statement on Form S-1 as originally filed on March 4, 2010 (No. 333-165200) and incorporated herein by reference). | |
| 10.21† | Registrant’s Employment Agreement with Gyula Meleghy (filed as Exhibit 10.29 to the Registrant’s Registration Statement on Form S-1 as originally filed on March 4, 2010 (No. 333-165200) and incorporated herein by reference). | |
| 10.22† | Registrant’s Compensation Agreement with William Pumphrey (filed as Exhibit 10.30 to the Registrant’s Registration Statement on Form S-1 as originally filed on March 4, 2010 (No. 333-165200) and incorporated herein by reference). | |
| 10.23† | Registrant’s Compensation Agreement with Paul Radkoski (filed as Exhibit 10.31 to the Registrant’s Registration Statement on Form S-1 as originally filed on March 4, 2010 (No. 333-165200) and incorporated herein by reference). | |
| 10.24 | Form of Indemnification Agreement (filed as Exhibit 10.24 to Amendment No. 8 to the Registrant’s Registration Statement on Form S-1 (No. 333-165200) and incorporated herein by reference). | |
| 10.25 | Service Agreement with Rande Somma & Associates LLC (filed as Exhibit 10.33 to the Registrant’s Registration Statement on Form S-1 as originally filed on March 4, 2010 (No. 333-165200) and incorporated herein by reference). | |
| 10.26 | Amendment to Service Agreement with Rande Somma & Associates LLC, dated September 29, 2010 (filed as Exhibit 10.55 to Amendment No. 9 to the Registrant’s Registration Statement on Form S-1 (No. 333-165200) and incorporated herein by reference). | |
| 10.27 | Service Agreement with Larry Schwentor and MGT4VALUE LLC (filed as Exhibit 10.34 to the Registrant’s Registration Statement on Form S-1 as originally filed on March 4, 2010 (No. 333-165200) and incorporated herein by reference). | |
| 10.28† | Second Amended and Restated Value Creation Plan of Tower Automotive, LLC (filed as Exhibit 10.27 to Amendment No. 8 to the Registrant’s Registration Statement on Form S-1 (No. 333-165200) and incorporated herein by reference). | |
| 10.29† | Form of 2010 Equity Incentive Plan (filed as Exhibit 10.28 to Amendment No. 9 to the Registrant’s Registration Statement on Form S-1 (No. 333-165200) and incorporated herein by reference). | |
127
Table of Contents
| 10.30† | Form of Restricted Stock Award Agreement (filed as Exhibit 10.29 to Amendment No. 8 to the Registrant’s Registration Statement on Form S-1 (No. 333-165200) and incorporated herein by reference). | |
| 10.31† | Form of Restricted Stock Unit Award Agreement (filed as Exhibit 10.30 to Amendment No. 8 to the Registrant’s Registration Statement on Form S-1 (No. 333-165200) and incorporated herein by reference). | |
| 10.32† | Form of Restricted Stock Unit Award Agreement (filed as Exhibit 10.30.1 to Amendment No. 8 to the Registrant’s Registration Statement on Form S-1 (No. 333-165200) and incorporated herein by reference). | |
| 10.33† | Form of Nonqualified Stock Option Grant Agreement (filed as Exhibit 10.31 to Amendment No. 8 to the Registrant’s Registration Statement on Form S-1 (No. 333-165200) and incorporated herein by reference). | |
| 10.34† | Form of Nonqualified Stock Option Grant Agreement (filed as Exhibit 10.31.1 to Amendment No. 8 to the Registrant’s Registration Statement on Form S-1 (No. 333-165200) and incorporated herein by reference). | |
| 10.35† | Form of Incentive Stock Option Grant Agreement (filed as Exhibit 10.32 to Amendment No. 8 to the Registrant’s Registration Statement on Form S-1 (No. 333-165200) and incorporated herein by reference). | |
| 10.36† | Tower Management, LLC 2007 Management Incentive Plan (filed as Exhibit 10.33 to Amendment No. 3 to the Registrant’s Registration Statement on Form S-1 (No. 333-165200) and incorporated herein by reference). | |
| 10.37† | Form of Award Letter, Tower Automotive, LLC Supplemental Value Creation Program Plan (filed as Exhibit 10.34 to Amendment No. 3 to the Registrant’s Registration Statement on Form S-1 (No. 333-165200) and incorporated herein by reference). | |
| 10.38† | Form of Award Letter, Tower Automotive, LLC 2010 Long-Term Incentive Program (filed as Exhibit 10.35 to Amendment No. 3 to the Registrant’s Registration Statement on Form S-1 (No. 333-165200) and incorporated herein by reference). | |
| 10.39† | Form of Award Letter, Tower Automotive, LLC Special Incentive Program (filed as Exhibit 10.36 to Amendment No. 3 to the Registrant’s Registration Statement on Form S-1 (No. 333-165200) and incorporated herein by reference). | |
| 10.40†† | Lease Agreement, dated as of April 10, 2002, by and among Module (DE) Limited Partnership, Tower Automotive Products Company, Inc. and Tower Automotive Tool LLC (filed as Exhibit 10.37 to Amendment No. 2 to the Registrant’s Registration Statement on Form S-1 (No. 333-165200) and incorporated herein by reference). | |
| 10.41 | Amendment No. 1 to Lease Agreement, dated as of November 15, 2002, by and among Module (DE) Limited Partnership, Tower Automotive Products Company, Inc. and Tower Automotive Tool LLC (filed as Exhibit 10.38 to Amendment No. 1 to the Registrant’s Registration Statement on Form S-1 (No. 333-165200) and incorporated herein by reference). | |
| 10.42†† | Amendment No. 2 to Lease Agreement, dated as of July 31, 2007, by and among Module (DE) Limited Partnership, Tower Automotive Products Company, Inc. and Tower Automotive Tool LLC (filed as Exhibit 10.39 to Amendment No. 1 to the Registrant’s Registration Statement on Form S-1 (No. 333-165200) and incorporated herein by reference). | |
| 10.43†† | Lease Agreement, dated as of April 10, 2002, by and among Chassis (DE) Limited Partnership, Tower Automotive Products Company, Inc. and Tower Automotive Tool LLC (filed as Exhibit 10.40 to Amendment No. 2 to the Registrant’s Registration Statement on Form S-1 (No. 333-165200) and incorporated herein by reference). | |
128
Table of Contents
| 10.44 | Amendment No. 1 to Lease Agreement, dated as of October 9, 2002, by and among Chassis (DE) Limited Partnership, Tower Automotive Products Company, Inc. and Tower Automotive Tool LLC (filed as Exhibit 10.41 to Amendment No. 1 to the Registrant’s Registration Statement on Form S-1 (No. 333-165200) and incorporated herein by reference). | |
| 10.45†† | Amendment No. 2 to Lease Agreement, dated as of July 31, 2007, by and among Chassis (DE) Limited Partnership, Tower Automotive Products Company, Inc. and Tower Automotive Tool LLC (filed as Exhibit 10.42 to Amendment No. 1 to the Registrant’s Registration Statement on Form S-1 (No. 333-165200) and incorporated herein by reference). | |
| 10.46 | Unit Sale and Purchase Agreement of Mark Malcolm (filed as Exhibit 10.43 to Amendment No. 4 to the Registrant’s Registration Statement on Form S-1 (No. 333-165200) and incorporated herein by reference). | |
| 10.47 | Unit Sale and Purchase Agreement of Jim Gouin (filed as Exhibit 10.44 to Amendment No. 4 to the Registrant’s Registration Statement on Form S-1 (No. 333-165200) and incorporated herein by reference). | |
| 10.48 | Unit Sale and Purchase Agreement of Michael Rajkovic (filed as Exhibit 10.45 to Amendment No. 4 to the Registrant’s Registration Statement on Form S-1 (No. 333-165200) and incorporated herein by reference). | |
| 10.49 | Unit Sale and Purchase Agreement of William Pumphrey (filed as Exhibit 10.46 to Amendment No. 4 to the Registrant’s Registration Statement on Form S-1 (No. 333-165200) and incorporated herein by reference). | |
| 10.50 | Unit Sale and Purchase Agreement of Gyula Meleghy (filed as Exhibit 10.47 to Amendment No. 4 to the Registrant’s Registration Statement on Form S-1 (No. 333-165200) and incorporated herein by reference). | |
| 10.51 | Unit Sale and Purchase Agreement of Rande Somma and Associates LLC (filed as Exhibit 10.48 to Amendment No. 4 to the Registrant’s Registration Statement on Form S-1 (No. 333-165200) and incorporated herein by reference). | |
| 10.52 | Unit Sale and Purchase Agreement of MGT4VALUE LLC (filed as Exhibit 10.49 to Amendment No. 4 to the Registrant’s Registration Statement on Form S-1 (No. 333-165200) and incorporated herein by reference). | |
| 10.53† | Form of Amendment to Form of Award Letter, Tower Automotive, LLC 2010 Long-Term Incentive Program (filed as Exhibit 10.53 to Amendment No. 9 to the Registrant’s Registration Statement on Form S-1 (No. 333-165200) and incorporated herein by reference). | |
| 10.54† | Form of Award Letter, Tower Automotive, LLC 2010 Special Incentive Program (filed as Exhibit 10.54 to Amendment No. 8 to the Registrant’s Registration Statement on Form S-1 (No. 333-165200) and incorporated herein by reference). | |
| 11.1 | A statement regarding the computation of earnings per share is omitted because such computation can be clearly determined from the material contained in this Report. | |
| 21.1* | Subsidiaries of Tower International, Inc. | |
| 23.1* | Consent of Deloitte and Touche LLP, Independent Registered Public Accounting Firm | |
| 24.1* | Power of Attorney | |
| 31.1* | Certification of Chief Executive Officer pursuant to Rule 13a-14 Securities Exchange Act Rules 13a-14(a) and 15d-14(a), pursuant to section 302 of the Sarbanes-Oxley Act of 2002 | |
| 31.2* | Certification of Chief Financial Officer pursuant to Rule 13a-14 Securities Exchange Act Rules 13a-14(a) and 15d-14(a), pursuant to section 302 of the Sarbanes-Oxley Act of 2002 | |
129
Table of Contents
| 32.1** | Certification of Chief Executive Officer pursuant to 18 U.S.C. Section 1350, as adopted by Section 906 of the Sarbanes-Oxley Act of 2002. | |
| 32.2** | Certification of Chief Financial Officer pursuant to 18 U.S.C. Section 1350, as adopted by Section 906 of the Sarbanes-Oxley Act of 2002. | |
| * | Filed herewith. |
| ** | Furnished herewith. |
| † | Management contract or compensatory plan or arrangement. |
| †† | Confidential treatment has been granted for certain provisions of this Exhibit pursuant to Rule 406 promulgated under the Securities Act of 1933, as amended. |
130
Table of Contents
SIGNATURES
Pursuant to the requirements of Section 13 or 15(d) of the Securities Exchange Act of 1934, the Registrant has duly caused this report to be signed on its behalf by the undersigned, thereunto duly authorized.
| Date: March 14, 2011 | /s/ James C. Gouin | |||
| James C. Gouin Chief Financial Officer | ||||
Pursuant to the requirements of the Securities Exchange Act of 1934, this report has been signed by the following persons on behalf of the Registrant and in the capacities indicated on the 14th day of March, 2011.
| Signature |
Title | |
| /s/ Mark Malcolm* Mark Malcolm |
Chief Executive Officer and Director (Principal Executive Officer) | |
| /s/ James C. Gouin James C. Gouin |
Executive Vice President and Chief Financial Officer (Principal Financial Officer) | |
| /s/ Jeffrey L. Kersten* Jeffrey L. Kersten |
Senior Vice President and Corporate Controller (Principal Accounting Officer) | |
| /s/ Dennis Donovan* Dennis Donovan |
Director | |
| /s/ Chan Galbato* Chan Galbato |
Director | |
| /s/ Dev Kapadia* Dev Kapadia |
Director | |
| /s/ Larry Schwentor* Larry Schwentor |
Director | |
| /s/ Scott Wille* Scott Wille |
Director | |
*By: /s/ James C. Gouin
James C. Gouin, Attorney-in-Fact
131
Table of Contents
EXHIBIT LIST
| 2.1 | Asset Purchase Agreement, dated as of May 1, 2007, by and among Tower Automotive, Inc., a debtor-in-possession and certain of its subsidiaries, and Tower Automotive, LLC f/k/a TA Acquisition Company, LLC (filed as Exhibit 2.1 to the Registrant’s Registration Statement on Form S-1 as originally filed on March 4, 2010 (No. 333-165200) and incorporated herein by reference). | |
| 2.2 | Form of Contribution Agreement providing for the contribution of equity interests in Tower Automotive, LLC to Tower International Holdings, LLC (filed as Exhibit 2.2 to Amendment No. 3 to the Registrant’s Registration Statement on Form S-1 (No. 333-165200) and incorporated herein by reference). | |
| 3.1 | Form of Certificate of Incorporation of the Registrant (filed as Exhibit 3.1 to Amendment No. 4 to the Registrant’s Registration Statement on Form S-1 (No. 333-165200) and incorporated herein by reference). | |
| 3.2 | Form of By-Laws of the Registrant (filed as Exhibit 3.2 to Amendment No. 8 to the Registrant’s Registration Statement on Form S-1 (No. 333-165200) and incorporated herein by reference). | |
| 4.1 | See Exhibits 3.1 and 3.2 for provisions of the Certificate of Incorporation and Bylaws of the Registrant defining the rights of holders of common stock of the Registrant. | |
| 4.2 | Specimen stock certificate (filed as Exhibit 4.2 to Amendment No. 3 to the Registrant’s Registration Statement on Form S-1 (No. 333-165200) and incorporated herein by reference). | |
| 4.3 | Form of Registration Rights Agreement between the Registrant and Tower International Holdings, LLC (filed as Exhibit 4.3 to Amendment No. 3 to the Registrant’s
Registration Statement on Form S-1 (No. 333-165200) and incorporated herein by reference). | |
| 4.4 | Indenture, dated as of August 24, 2010, among Tower Automotive Holdings USA, LLC and TA Holdings Finance, Inc., as issuers, the guarantors party thereto and Wilmington Trust FSB, as trustee and collateral agent (filed as Exhibit 4.4 to Amendment No. 6 to the Registrant’s Registration Statement on Form S-1 (No. 333-165200) and incorporated herein by reference). | |
| 10.1 | Revolving Credit and Guaranty Agreement, dated as of July 31, 2007, by and among Tower Automotive Holdings USA, LLC, the Guarantors named therein, the Lenders named therein and JPMorgan Chase Bank, N.A., as Administrative Agent (filed as Exhibit 10.1 to the Registrant’s Registration Statement on Form S-1 as originally filed on March 4, 2010 (No. 333-165200) and incorporated herein by reference). | |
| 10.2 | Amendment No. 1 to Revolving Credit and Guaranty Agreement, dated May 5, 2008, by and among Tower Automotive Holdings USA, LLC, the Guarantors from time to time party thereto, the Lenders from time to time party thereto and JPMorgan Chase Bank, N.A., as Administrative Agent (filed as Exhibit 10.2 to the Registrant’s Registration Statement on Form S-1 as originally filed on March 4, 2010 (No. 333-165200) and incorporated herein by reference). | |
| 10.3 | Amendment No. 2 to the Revolving Credit and Guaranty Agreement, dated as of August 4, 2010, among Tower Automotive Holdings USA, LLC, the guarantors from time to time party thereto,
the lenders from time to time party thereto and JPMorgan Chase Bank, N.A., as administrative agent (filed as Exhibit 10.3 to Amendment No. 6 to the Registrant’s Registration Statement on Form S-1 (No. 333-165200) and incorporated herein by reference). | |
| 10.4 | First Lien Term Loan and Guaranty Agreement, dated as of July 31, 2007, by and among Tower Automotive Holdings USA, LLC, Tower Automotive Holding Europe B.V., the Guarantors named
therein, the Lenders, named therein and JPMorgan Chase Bank, N.A., as Agent (filed as Exhibit 10.4 to the Registrant’s Registration Statement on Form S-1 as originally filed on March 4, 2010 (No. 333-165200) and incorporated herein by reference). | |
132
Table of Contents
| 10.5 | Amendment No 1 to First Lien Term Loan and Guaranty Agreement, dated as of December 24, 2007, by and among Tower Automotive Holdings USA, LLC, Tower Automotive Holding Europe B.V., the Guarantors named therein, the Lenders named therein and JPMorgan Chase Bank, N.A., as Agent (filed as Exhibit 10.5 to the Registrant’s Registration Statement on Form S-1 as originally filed on March 4, 2010 (No. 333-165200) and incorporated herein by reference). | |
| 10.6 | Amendment No 2 to First Lien Term Loan and Guaranty Agreement, dated as of May 5, 2008, by and among Tower Automotive Holdings USA, LLC, Tower Automotive Holding Europe B.V., the Guarantors named therein, the Lenders named therein and JPMorgan Chase Bank, N.A., as Agent (filed as Exhibit 10.6 to the Registrant’s Registration Statement on Form S-1 as originally filed on March 4, 2010 (No. 333-165200) and incorporated herein by reference). | |
| 10.7 | Waiver and Amendment No 3 to First Lien Term Loan and Guaranty Agreement, April 1, 2009, by and among Tower Automotive Holdings USA, LLC, Tower Automotive Holding Europe B.V., the Guarantors named therein, the Lenders named therein and JPMorgan Chase Bank, N.A., as Agent (filed as Exhibit 10.7 to the Registrant’s Registration Statement on Form S-1 as originally filed on March 4, 2010 (No. 333-165200) and incorporated herein by reference). | |
| 10.8 | Amendment No. 4 to the First Lien Term Loan and Guaranty Agreement, dated as of August 24, 2010, among Tower Automotive Holdings USA, LLC, Tower Automotive Holdings Europe B.V., the guarantors from time to time party thereto, the lenders from time to time party thereto and JPMorgan Chase Bank, N.A. (filed as Exhibit 10.8 to Amendment No. 6 to the Registrant’s Registration Statement on Form S-1 (No. 333-165200) and incorporated herein by reference). | |
| 10.9 | Amended and Restated Intercreditor Agreement, dated as of August 24, 2010, among JPMorgan Chase Bank, N.A., as representative with respect to certain agreements identified therein, Wilmington Trust FSB, as representative with respect to the notes agreement identified therein, each additional representative from time to time party thereto, Tower Automotive Holdings USA, LLC, the other loan parties party thereto and Tower Automotive, LLC (filed as Exhibit 10.9 to Amendment No. 6 to the Registrant’s Registration Statement on Form S-1 (No. 333-165200) and incorporated herein by reference). | |
| 10.10 | Term Intercreditor Agreement, dated as of August 24, 2010, among JPMorgan Chase Bank, N.A., as synthetic letter of credit facility agent, Wilmington Trust FSB, as notes collateral agent, each additional term agent from time to time party thereto, each grantor from time to time party thereto and Tower Automotive, LLC (filed as Exhibit 10.10 to Amendment No. 6 to the Registrant’s Registration Statement on Form S-1 (No. 333-165200) and incorporated herein by reference). | |
| 10.11 | Amended and Restated ABL Security Agreement, dated as of August 24, 2010, among Tower Automotive Holdings USA, LLC, the guarantors party thereto and JPMorgan Chase Bank, N.A., as agent (filed as Exhibit 10.11 to Amendment No. 6 to the Registrant’s Registration Statement on Form S-1 (No. 333-165200) and incorporated herein by reference). | |
| 10.12 | Amended and Restated First Lien Term Loan Security Agreement, dated as of August 24, 2010, among Tower Automotive Holdings USA, LLC, the guarantors party thereto and JPMorgan Chase Bank, N.A., as agent (filed as Exhibit 10.12 to Amendment No. 6 to the Registrant’s Registration Statement on Form S-1 (No. 333-165200) and incorporated herein by reference). | |
| 10.13 | Notes Security Agreement, dated as of August 24, 2010, among Tower Automotive Holdings USA, LLC, TA Holdings Finance, Inc., the subsidiary guarantors party thereto and Wilmington Trust FSB, as collateral agent (filed as Exhibit 10.13 to Amendment No. 6 to the Registrant’s Registration Statement on Form S-1 (No. 333-165200) and incorporated herein by reference). | |
| 10.14† | Registrant’s Employment Agreement with James Gouin (filed as Exhibit 10.25 to the Registrant’s Registration Statement on Form S-1 as originally filed on March 4, 2010 (No. 333-165200) and incorporated herein by reference). | |
133
Table of Contents
| 10.15† | Letter Agreement Amendment to Employment Agreement, dated as of June 1, 2010, between the Registrant and James Gouin (filed as Exhibit 10.52 to Amendment No. 5 to the Registrant’s Registration Statement on Form S-1 (No. 333-165200) and incorporated herein by reference). | |
| 10.16† | Registrant’s Employment Agreement with Mark Malcolm (filed as Exhibit 10.26 to the Registrant’s Registration Statement on Form S-1 as originally filed on March 4, 2010 (No. 333-165200) and incorporated herein by reference). | |
| 10.17† | Letter Agreement Amendment to Employment Agreement, dated as of June 1, 2010, between the Registrant and Mark Malcolm (filed as Exhibit 10.50 to Amendment No. 5 to the Registrant’s Registration Statement on Form S-1 (No. 333-165200) and incorporated herein by reference). | |
| 10.18† | Registrant’s Employment Agreement with Michael Rajkovic (filed as Exhibit 10.27 to the Registrant’s Registration Statement on Form S-1 as originally filed on March 4, 2010 (No. 333-165200) and incorporated herein by reference). | |
| 10.19† | Letter Agreement Amendment to Employment Agreement, dated as of June 1, 2010, between the Registrant and Michael Rajkovic (filed as Exhibit 10.51 to Amendment No. 5 to the Registrant’s Registration Statement on Form S-1 (No. 333-165200) and incorporated herein by reference). | |
| 10.20† | Registrant’s Employment Agreement with William Cook (filed as Exhibit 10.28 to the Registrant’s Registration Statement on Form S-1 as originally filed on March 4, 2010 (No. 333-165200) and incorporated herein by reference). | |
| 10.21† | Registrant’s Employment Agreement with Gyula Meleghy (filed as Exhibit 10.29 to the Registrant’s Registration Statement on Form S-1 as originally filed on March 4, 2010 (No. 333-165200) and incorporated herein by reference). | |
| 10.22† | Registrant’s Compensation Agreement with William Pumphrey (filed as Exhibit 10.30 to the Registrant’s Registration Statement on Form S-1 as originally filed on March 4, 2010 (No. 333-165200) and incorporated herein by reference). | |
| 10.23† | Registrant’s Compensation Agreement with Paul Radkoski (filed as Exhibit 10.31 to the Registrant’s Registration Statement on Form S-1 as originally filed on March 4, 2010 (No. 333-165200) and incorporated herein by reference). | |
| 10.24 | Form of Indemnification Agreement (filed as Exhibit 10.24 to Amendment No. 8 to the Registrant’s Registration Statement on Form S-1 (No. 333-165200) and incorporated herein by reference). | |
| 10.25 | Service Agreement with Rande Somma & Associates LLC (filed as Exhibit 10.33 to the Registrant’s Registration Statement on Form S-1 as originally filed on March 4, 2010 (No. 333-165200) and incorporated herein by reference). | |
| 10.26 | Amendment to Service Agreement with Rande Somma & Associates LLC, dated September 29, 2010 (filed as Exhibit 10.55 to Amendment No. 9 to the Registrant’s Registration Statement on Form S-1 (No. 333-165200) and incorporated herein by reference). | |
| 10.27 | Service Agreement with Larry Schwentor and MGT4VALUE LLC (filed as Exhibit 10.34 to the Registrant’s Registration Statement on Form S-1 as originally filed on March 4, 2010 (No. 333-165200) and incorporated herein by reference). | |
| 10.28† | Second Amended and Restated Value Creation Plan of Tower Automotive, LLC (filed as Exhibit 10.27 to Amendment No. 8 to the Registrant’s Registration Statement on Form S-1 (No. 333-165200) and incorporated herein by reference). | |
| 10.29† | Form of 2010 Equity Incentive Plan (filed as Exhibit 10.28 to Amendment No. 9 to the Registrant’s Registration Statement on Form S-1 (No. 333-165200) and incorporated herein by reference). | |
134
Table of Contents
| 10.30† | Form of Restricted Stock Award Agreement (filed as Exhibit 10.29 to Amendment No. 8 to the Registrant’s Registration Statement on Form S-1 (No. 333-165200) and incorporated herein by reference). | |
| 10.31† | Form of Restricted Stock Unit Award Agreement (filed as Exhibit 10.30 to Amendment No. 8 to the Registrant’s Registration Statement on Form S-1 (No. 333-165200) and incorporated herein by reference). | |
| 10.32† | Form of Restricted Stock Unit Award Agreement (filed as Exhibit 10.30.1 to Amendment No. 8 to the Registrant’s Registration Statement on Form S-1 (No. 333-165200) and incorporated herein by reference). | |
| 10.33† | Form of Nonqualified Stock Option Grant Agreement (filed as Exhibit 10.31 to Amendment No. 8 to the Registrant’s Registration Statement on Form S-1 (No. 333-165200) and incorporated herein by reference). | |
| 10.34† | Form of Nonqualified Stock Option Grant Agreement (filed as Exhibit 10.31.1 to Amendment No. 8 to the Registrant’s Registration Statement on Form S-1 (No. 333-165200) and incorporated herein by reference). | |
| 10.35† | Form of Incentive Stock Option Grant Agreement (filed as Exhibit 10.32 to Amendment No. 8 to the Registrant’s Registration Statement on Form S-1 (No. 333-165200) and incorporated herein by reference). | |
| 10.36† | Tower Management, LLC 2007 Management Incentive Plan (filed as Exhibit 10.33 to Amendment No. 3 to the Registrant’s Registration Statement on Form S-1 (No. 333-165200) and incorporated herein by reference). | |
| 10.37† | Form of Award Letter, Tower Automotive, LLC Supplemental Value Creation Program Plan (filed as Exhibit 10.34 to Amendment No. 3 to the Registrant’s Registration Statement on Form S-1 (No. 333-165200) and incorporated herein by reference). | |
| 10.38† | Form of Award Letter, Tower Automotive, LLC 2010 Long-Term Incentive Program (filed as Exhibit 10.35 to Amendment No. 3 to the Registrant’s Registration Statement on Form S-1 (No. 333-165200) and incorporated herein by reference). | |
| 10.39† | Form of Award Letter, Tower Automotive, LLC Special Incentive Program (filed as Exhibit 10.36 to Amendment No. 3 to the Registrant’s Registration Statement on Form S-1 (No. 333-165200) and incorporated herein by reference). | |
| 10.40†† | Lease Agreement, dated as of April 10, 2002, by and among Module (DE) Limited Partnership, Tower Automotive Products Company, Inc. and Tower Automotive Tool LLC (filed as Exhibit 10.37 to Amendment No. 2 to the Registrant’s Registration Statement on Form S-1 (No. 333-165200) and incorporated herein by reference). | |
| 10.41 | Amendment No. 1 to Lease Agreement, dated as of November 15, 2002, by and among Module (DE) Limited Partnership, Tower Automotive Products Company, Inc. and Tower Automotive Tool LLC (filed as Exhibit 10.38 to Amendment No. 1 to the Registrant’s Registration Statement on Form S-1 (No. 333-165200) and incorporated herein by reference). | |
| 10.42†† | Amendment No. 2 to Lease Agreement, dated as of July 31, 2007, by and among Module (DE) Limited Partnership, Tower Automotive Products Company, Inc. and Tower Automotive Tool LLC (filed as Exhibit 10.39 to Amendment No. 1 to the Registrant’s Registration Statement on Form S-1 (No. 333-165200) and incorporated herein by reference). | |
| 10.43†† | Lease Agreement, dated as of April 10, 2002, by and among Chassis (DE) Limited Partnership, Tower Automotive Products Company, Inc. and Tower Automotive Tool LLC (filed as Exhibit 10.40 to Amendment No. 2 to the Registrant’s Registration Statement on Form S-1 (No. 333-165200) and incorporated herein by reference). | |
135
Table of Contents
| 10.44 | Amendment No. 1 to Lease Agreement, dated as of October 9, 2002, by and among Chassis (DE) Limited Partnership, Tower Automotive Products Company, Inc. and Tower Automotive Tool LLC (filed as Exhibit 10.41 to Amendment No. 1 to the Registrant’s Registration Statement on Form S-1 (No. 333-165200) and incorporated herein by reference). | |
| 10.45†† | Amendment No. 2 to Lease Agreement, dated as of July 31, 2007, by and among Chassis (DE) Limited Partnership, Tower Automotive Products Company, Inc. and Tower Automotive Tool LLC (filed as Exhibit 10.42 to Amendment No. 1 to the Registrant’s Registration Statement on Form S-1 (No. 333-165200) and incorporated herein by reference). | |
| 10.46 | Unit Sale and Purchase Agreement of Mark Malcolm (filed as Exhibit 10.43 to Amendment No. 4 to the Registrant’s Registration Statement on Form S-1 (No. 333-165200) and incorporated herein by reference). | |
| 10.47 | Unit Sale and Purchase Agreement of Jim Gouin (filed as Exhibit 10.44 to Amendment No. 4 to the Registrant’s Registration Statement on Form S-1 (No. 333-165200) and incorporated herein by reference). | |
| 10.48 | Unit Sale and Purchase Agreement of Michael Rajkovic (filed as Exhibit 10.45 to Amendment No. 4 to the Registrant’s Registration Statement on Form S-1 (No. 333-165200) and incorporated herein by reference). | |
| 10.49 | Unit Sale and Purchase Agreement of William Pumphrey (filed as Exhibit 10.46 to Amendment No. 4 to the Registrant’s Registration Statement on Form S-1 (No. 333-165200) and incorporated herein by reference). | |
| 10.50 | Unit Sale and Purchase Agreement of Gyula Meleghy (filed as Exhibit 10.47 to Amendment No. 4 to the Registrant’s Registration Statement on Form S-1 (No. 333-165200) and incorporated herein by reference). | |
| 10.51 | Unit Sale and Purchase Agreement of Rande Somma and Associates LLC (filed as Exhibit 10.48 to Amendment No. 4 to the Registrant’s Registration Statement on Form S-1 (No. 333-165200) and incorporated herein by reference). | |
| 10.52 | Unit Sale and Purchase Agreement of MGT4VALUE LLC (filed as Exhibit 10.49 to Amendment No. 4 to the Registrant’s Registration Statement on Form S-1 (No. 333-165200) and incorporated herein by reference). | |
| 10.53† | Form of Amendment to Form of Award Letter, Tower Automotive, LLC 2010 Long-Term Incentive Program (filed as Exhibit 10.53 to Amendment No. 9 to the Registrant’s Registration Statement on Form S-1 (No. 333-165200) and incorporated herein by reference). | |
| 10.54† | Form of Award Letter, Tower Automotive, LLC 2010 Special Incentive Program (filed as Exhibit 10.54 to Amendment No. 8 to the Registrant’s Registration Statement on Form S-1 (No. 333-165200) and incorporated herein by reference). | |
| 11.1 | A statement regarding the computation of earnings per share is omitted because such computation can be clearly determined from the material contained in this Report. | |
| 21.1* | Subsidiaries of Tower International, Inc. | |
| 23.1* | Consent of Deloitte and Touche LLP, Independent Registered Public Accounting Firm | |
| 24.1* | Power of Attorney | |
| 31.1* | Certification of Chief Executive Officer pursuant to Rule 13a-14 Securities Exchange Act Rules 13a-14(a) and 15d-14(a), pursuant to section 302 of the Sarbanes-Oxley Act of 2002 | |
| 31.2* | Certification of Chief Financial Officer pursuant to Rule 13a-14 Securities Exchange Act Rules 13a-14(a) and 15d-14(a), pursuant to section 302 of the Sarbanes-Oxley Act of 2002 | |
136
Table of Contents
| 32.1** | Certification of Chief Executive Officer pursuant to 18 U.S.C. Section 1350, as adopted by Section 906 of the Sarbanes-Oxley Act of 2002. | |
| 32.2** | Certification of Chief Financial Officer pursuant to 18 U.S.C. Section 1350, as adopted by Section 906 of the Sarbanes-Oxley Act of 2002. | |
| * | Filed herewith. |
| ** | Furnished herewith. |
| † | Management contract or compensatory plan or arrangement. |
| †† | Confidential treatment has been granted for certain provisions of this Exhibit pursuant to Rule 406 promulgated under the Securities Act of 1933, as amended. |
137