Attached files
| file | filename |
|---|---|
| EX-31.1 - EXHIBIT 31.1 - Tower International, Inc. | towr-20171231xex31_1.htm |
| EX-32.2 - EXHIBIT 32.2 - Tower International, Inc. | towr-20171231xex32_2.htm |
| EX-32.1 - EXHIBIT 32.1 - Tower International, Inc. | towr-20171231xex32_1.htm |
| EX-31.2 - EXHIBIT 31.2 - Tower International, Inc. | towr-20171231xex31_2.htm |
| EX-23.1 - EXHIBIT 23.1 - Tower International, Inc. | towr-20171231xex23_1.htm |
| EX-21.1 - EXHIBIT 21.1 - Tower International, Inc. | towr-20171231xex21_1.htm |
| EX-10.62 - EXHIBIT 10.62 - Tower International, Inc. | towr-20171231xex10_62.htm |
| EX-10.61 - EXHIBIT 10.61 - Tower International, Inc. | towr-20171231xex10_61.htm |
| EX-10.60 - EXHIBIT 10.60 - Tower International, Inc. | towr-20171231xex10_60.htm |
UNITED STATES SECURITIES AND EXCHANGE COMMISSION
Washington, D.C. 20549
Form 10-K
ANNUAL REPORT PURSUANT TO SECTION 13 OR 15(d)
OF THE SECURITIES EXCHANGE ACT OF 1934
|
For the fiscal year ended: |
Commission file number: |
|
December 31, 2017 |
001-34903 |
TOWER INTERNATIONAL, INC.
(Exact name of Registrant as specified in its charter)
|
Delaware |
27-3679414 |
|
(State of Incorporation) |
(IRS Employer Identification Number) |
|
17672 Laurel Park Drive North, Suite 400 E |
48152 |
|
Livonia, Michigan |
(Zip Code) |
|
(Address of Principal Executive Offices) |
|
|
|
Registrant's telephone number, including area code: (248) 675-6000
Securities registered pursuant to Section 12(b) of the Act:
|
Title of each class |
Name of each exchange on which registered |
|
Common Stock, par value $.01 per share |
New York Stock Exchange |
Securities registered pursuant to Section 12(g) of the Act:
None
Indicate by check mark if the Registrant is a well-known seasoned issuer, as defined in Rule 405 of the Securities Act. Yes ☐ No ☒
Indicate by check mark if the registrant is not required to file reports pursuant to Section 13 or Section 15d of the Act. Yes ☐ No ☒
Indicate by check mark whether the Registrant (1) has filed all reports required to be filed by Section 13 or 15(d) of the Securities Exchange Act of 1934 during the preceding 12 months (or for such shorter period that the registrant was required to file such reports), and (2) has been subject to such filing requirements for the past 90 days. Yes ☒ No ☐
Indicate by check mark whether the registrant has submitted electronically and posted on its corporate website, if any, every Interactive Data File required to be submitted and posted pursuant to Rule 405 of Regulation S-T (§232.405 of this chapter) during the preceding 12 months (or for such shorter period that the registrant was required to submit and post such files). Yes ☒ No ☐
Indicate by check mark if disclosure of delinquent filers pursuant to Item 405 of Regulation S-K is not contained herein, and will not be contained, to the best of registrant's knowledge, in definitive proxy or information statements incorporated by reference in Part III of this Form 10-K or any amendment to this Form 10-K. ☒
Indicate by check mark whether the Registrant is a large accelerated filer, an accelerated filer, a non-accelerated filer, or a smaller reporting company. See the definitions of “large accelerated filer,” “accelerated filer,” “smaller reporting company” and “emerging growth company” in Rule 12b-2 of the Exchange Act. (Check one):
Large accelerated filer ☐ Accelerated filer ☒ Non-accelerated filer ☐ Smaller reporting company ☐ Emerging growth company ☐
If an emerging growth company, indicate by check mark if the registrant has elected not to use the extended transition period for complying with any new or revised financial accounting standards provided pursuant to Section 13(a) of the Exchange Act. ☐
Indicate by check mark whether the registrant is a shell company (as defined in Rule 12b-2 of the Exchange Act). Yes ☐ No ☒
The aggregate market value of the common stock held by non-affiliates of the registrant, computed by reference to the closing price of the common stock as of the closing of trading on June 30, 2017, was approximately $439,942,031.
There were 20,542,397 shares of the registrant’s common stock outstanding at February 21, 2018.
DOCUMENTS INCORPORATED BY REFERENCE
Certain portions, as expressly described in this report, of the Registrant’s Proxy Statement for the 2018 Annual Meeting of Stockholders are incorporated by reference into Part III.
TOWER INTERNATIONAL, INC. – FORM 10-K
FOR THE FISCAL YEAR ENDED DECEMBER 31, 2017
TABLE OF CONTENTS
|
|
|
10-K Pages |
|
PART I |
|
|
|
Item 1. |
3 | |
|
Item 1A. |
13 | |
|
Item 1B. |
20 | |
|
Item 2. |
20 | |
|
Item 3. |
21 | |
|
Item 4. |
21 | |
|
|
|
|
|
PART II |
|
|
|
Item 5. |
22 | |
|
Item 6. |
24 | |
|
Item 7. |
Management's Discussion and Analysis of Financial Condition and Results of Operations |
26 |
|
Item 7A. |
44 | |
|
Item 8. |
46 | |
|
Item 9. |
Changes in and Disagreements with Accountants on Accounting and Financial Disclosure |
89 |
|
Item 9A. |
89 | |
|
Item 9B. |
91 | |
|
|
|
|
|
PART III |
|
|
|
Item 10. |
92 | |
|
Item 11. |
92 | |
|
Item 12. |
Security Ownership of Certain Beneficial Owners and Management and Related Stockholder Matters |
92 |
|
Item 13. |
Certain Relationships and Related Transactions, and Director Independence |
92 |
|
Item 14. |
93 | |
|
|
|
|
|
PART IV |
|
|
|
Item 15. |
94 | |
|
|
|
|
|
Exhibits EX-10.60 EX-10.61 EX-10.62 EX-21.1 EX-23.1 EX-31.1 EX-31.2 EX-32.1 EX-32.2 EX-101.DEF EX-101.INS EX-101.SCH EX-101.CAL EX-101.LAB EX-101.PRE |
|
|
2
PART I
Our Company
We are a leading global manufacturer of engineered automotive structural metal components and assemblies primarily serving original equipment manufacturers (“OEMs”). We offer our automotive customers a broad product portfolio, supplying body-structure stampings, frame and other chassis structures, and complex welded assemblies for small and large cars, crossovers, pickups, and sport utility vehicles.
Our products are manufactured at 23 facilities, strategically located near our customers in North America and Europe. We support our manufacturing operations through six engineering and sales locations around the world. We are a disciplined, process-driven company with an experienced management team that has a history of implementing sustainable operational improvements. For the year ended December 31, 2017, in accordance with U.S. Generally Accepted Accounting Principles (“GAAP”), we generated revenues of $2 billion and net income attributable to Tower International, Inc. (the “Company”) of $47.6 million. In addition, we had Adjusted EBITDA of $209.7 million and an Adjusted EBITDA margin of 10.5% for the year ended December 31, 2017. (Item 7 of this Annual Report includes a discussion of Adjusted EBITDA as a non-GAAP measure).
We believe that our engineering, manufacturing, and program management capabilities, our competitive cost and quality, our financial discipline, and our colleague engagement position us for long-term success.
Our History and Corporate Structure
Our Corporate History
On October 15, 2010, our common stock began trading on the New York Stock Exchange following our initial public offering (“IPO”). On July 31, 2013, Tower International Holdings, LLC, an affiliate of Cerberus, completed the sale of 7,888,122 shares of our common stock in a secondary public offering. Upon completion of the sale, Cerberus no longer controlled a majority of our outstanding common stock and therefore, we ceased being a “controlled company” within the meaning of the New York Stock Exchange corporate governance standards. On November 6, 2013, Tower International Holdings, LLC, completed the sale of 3,000,000 shares of our common stock in another secondary public offering. In addition, Tower International Holdings, LLC completed multiple transactions during the fourth quarter of 2013 whereby it sold additional shares of our common stock in the open market. As a result of these sales, Tower International Holdings, LLC and Cerberus held no shares of our common stock at December 31, 2013.
Sale of China Joint Ventures
On December 6, 2015, the Company completed the sale of its equity interest in its Xiangtan DIT Automotive Products Co. Ltd. (“Xiangtan”) joint venture. The sale agreement provided for the repayment of $9.9 million of the Company’s shareholder loans to the joint venture, and the purchase of the Company’s equity in the joint venture for $3.5 million, net of tax.
On December 31, 2015, the Company completed the sale of its equity interest in its Changchun Tower Golden Ring Automotive Products Co., Ltd. (“TGR”) joint venture. The sale agreement provided for the purchase of the Company’s equity in the joint venture for $29.4 million, and the payment of a dividend of $14.8 million, net of tax.
In October of 2016, the Company entered into an agreement to sell its joint venture in Wuhu, China: Tower Automotive Company, Ltd. (“Wuhu”). The sale agreement provided for the purchase of the Company’s equity in the joint venture for approximately $21 million, net of tax. The Company received proceeds of $4.5 million in the fourth quarter of 2016. On May 9, 2017, the Company completed the sale of its equity interest in Wuhu. During the second quarter of 2017, the Company received total net proceeds of $15.9 million related to the sale, which resulted in a total sales price that was less than the carrying value of the net assets of Wuhu. In addition, the Company incurred certain transaction related costs; therefore, a net loss of $2.6 million was recorded in the second quarter of 2017.
Xiangtan, TGR, and Wuhu have been presented as discontinued operations in the Company’s Consolidated Financial Statements, in accordance with Financial Accounting Standards Board (“FASB”) Accounting Standards Codification (“ASC”) No. 205, Discontinued Operations.
Also, in October of 2016, the Company entered into an agreement to sell its joint venture in Ningbo, China: Tower DIT Automotive Products Co., Ltd. (“Ningbo”). The agreement is subject to Chinese government approval. The sale agreement provides for purchase of the Company’s equity in the joint venture for approximately $4 million, net of tax. The Company anticipates that this transaction will close in the first quarter of 2018.
As of December 31, 2017, our China joint venture in Ningbo has been presented as discontinued operations, and is considered held for sale in accordance with FASB ASC No. 360, Property, Plant, and Equipment, and FASB ASC No. 205, Discontinued Operations.
3
Brazil Discontinued Operation
On December 21, 2015, the Company sold one of its two operations in Brazil. Net cash proceeds from this sale were $9.5 million. During the second quarter of 2016, the Company’s Board of Directors approved a plan to sell the Company’s remaining business operations in Brazil. At December 31, 2017, the remaining Brazilian business operations are considered held for sale in accordance with FASB ASC No. 360, Property, Plant, and Equipment, and presented as discontinued operations in the Consolidated Financial Statements, in accordance with FASB ASC No. 205, Discontinued Operations.
Our Industry
We believe OEMs produce a majority of their structural metal components and assemblies internally. While OEM policies differ and may be especially impacted by their own capacity utilization, the capital expenditures associated with internal production of the types of parts and assemblies Tower manufactures can be substantial. As fuel efficiency and emissions regulations tighten globally, the continued lightweighting and electrification of vehicles is expected. Due to the capital investment and fixed cost requirements for the OEMs related to these trends as well as the evolution toward autonomous vehicles, we believe that longer term, OEMs will outsource a greater proportion of their stamping requirements and we may benefit from this shift. We also believe that our products are relatively agnostic to vehicle autonomy because the stampings and assemblies we produce are critical to the structural integrity of a vehicle and not dependent upon the powertrain or how vehicles are driven. In addition, we believe OEMs will increasingly favor larger, more capable, financially strong regional suppliers. Given our manufacturing, engineering, and operational program management capabilities, we believe we are particularly well-positioned in North America and Europe to take advantage of these potential opportunities.
Our Strategy
We seek to:
|
· |
Execute a business model that generates sustainable ongoing free cash flow, providing flexibility for capital allocation and resilience during cyclical downturns; |
|
· |
Achieve organic growth above industry levels through strong competitive capabilities in engineering, manufacturing, and program management that contribute to leading positions in cost and quality; |
|
· |
Opportunistically pursue accretive acquisitions; |
|
· |
Achieve and maintain appropriate net debt leverage of about 1 times Adjusted EBITDA, which we consider to be integral to a financially strong and capable automotive parts supplier; |
|
· |
Return capital to shareholders through regular growing dividends, stock repurchases and, when appropriate, other actions; and |
|
· |
Manage risk through financial discipline. |
Execute Business Model Focused on Free Cash Flow
Free cash flow (defined as net cash provided by operating activities less cash disbursed for purchases of property, plant and equipment) is one of our most important financial metrics. Our focus on sustainable ongoing free cash flow keeps us disciplined regarding product pricing and margins, as well as determining and prioritizing affordable capital expenditures. To further our alignment with our business model, free cash flow is a major component of our annual bonus program for salaried and hourly colleagues. (Item 7 of this Annual Report includes a discussion of free cash flow as a non-GAAP measure).
Achieve Organic Growth Above Industry and Opportunistically Pursue Accretive Acquisitions
We have demonstrated the ability to win significant net new business from our customers from a combination of share gains from competitors via conquest wins and OEM outsourcing. In addition, the increased use of aluminum, higher strength steels and hot forming (i.e., “light weighting”) with complex joining technologies is providing us with higher value-add opportunities. We believe our ability to win new business at a return in excess of our cost of capital is a direct reflection of our core engineering strength, competitive cost and quality, and proven ability to manage complex new-model launches for OEM customers. We use processes such as Lean Six Sigma, labor best practices standardization, and advanced product quality planning (“APQP”) to drive productivity and quality while managing new programs on time and on budget.
We believe Tower is positioned for organic growth well above industry from 2018 through at least 2020 as a result of major new business awards primarily in North America that are anticipated to provide approximately $350 million of annual ongoing net revenue. We also believe there can be future upside growth opportunities from accretive acquisitions. Our projections regarding future performance constitute forward-looking statements. For information regarding the risks associated with forward looking statements, see “Disclosure Regarding Forward-Looking Statements.”
4
Achieve and Maintain Appropriate Leverage
Achieving and maintaining net debt leverage (defined as total debt less cash and cash equivalents divided by annual Adjusted EBITDA) at our target of 1 times Adjusted EBITDA is an important business priority for optimizing cost of capital and maintaining appropriate financial strength. As of December 31, 2017, our net debt was $263.1 million, representing net debt leverage of 1.3 times. (Item 7 of this Annual Report includes a discussion of net debt as a non-GAAP measure).
During the last two years, we have entered into operating leases to fund a portion of the capital expenditures necessary to achieve growth above industry average. We believe that these operating leases provide a diversified capital source for financing capital expenditures at competitive rates. These leasing arrangements bear a weighted average fixed interest rate of 5.4%. As of December 31, 2017, the effective interest rate on our Term Loan Credit Facility (the “Term Loan”) was 4.2%.
Beginning in 2019, FASB ASC No. 842, Leases, will change the financial reporting for leases. Certain of our manufacturing equipment leases currently classified as operating leases will be considered financing leases under the new standard. As a result, we will be required to record a right of use asset as additional property, plant, and equipment and the associated liability as lease debt.
As of December 31, 2017, the associated liability from these leases would have been approximately $72 million. Including our net debt of $263.1 million, our pro-forma leverage including these leases represents net debt leverage of 1.6 times.
In addition, we have numerous real estate and equipment leases currently classified as operating that we believe will continue to be classified as operating under the new standard. We expect that the right of use assets and liabilities associated with these leases will be material, but have not yet quantified the total balance sheet impact for these leases.
Return Capital to Shareholders
With our long-term leverage target in sight, we have begun returning capital to shareholders. In the fourth quarter of 2017, Tower raised its regular quarterly dividend per common share by 9%. In addition, on June 17, 2016, the Company announced its Board of Directors’ authorization to repurchase up to $100 million of the Company’s issued and outstanding common stock from time to time in the open market, or in privately negotiated transactions (the “Repurchase Program”). As of December 31, 2017, 829,648 shares have been purchased for $18.9 million under the Repurchase Program.
Manage Risk
We consider risk management to be an important part of our ability to operate predictably and successfully in the cyclical automotive parts industry. Foremost in managing risk is financial discipline, beginning during the evaluation and approval of new programs to ensure sound assumptions and projected returns in excess of our cost of capital. During each year, we carefully monitor and manage all elements of cost, with an objective of achieving productivity and other savings that offset customer price reductions and labor and overhead inflation. Through our commercial agreements, we are largely shielded from changes in steel prices.
Customer and Vehicle Portfolio
We believe we have a well-diversified customer mix, as six different OEMs individually accounted for 5% or more of our revenues in 2017. The following table summarizes our customer mix as a percent of revenues for the year ended December 31, 2017.
|
Customer |
|||
|
Ford |
35 |
% |
|
|
Fiat - Chrysler |
20 |
% |
|
|
Volkswagen Group |
11 |
% |
|
|
Nissan |
10 |
% |
|
|
Volvo |
7 |
% |
|
|
Toyota |
5 |
% |
|
|
Daimler |
4 |
% |
|
|
BMW |
3 |
% |
|
|
Honda |
1 |
% |
|
|
Other |
4 |
% |
|
|
Total |
100 |
% |
|
5
Geographic Regions
The following table summarizes our geographic mix as a percent of revenues for the year ended December 31, 2017.
|
Region |
|||
|
North America |
67 |
% |
|
|
Europe |
33 |
% |
|
|
Total |
100 |
% |
|
Platform Diversification
We supply products for approximately 130 vehicle models globally to 11 of the 12 largest global OEMs, reflecting the balanced portfolio approach of our business model and the breadth of our product capabilities. The following table summarizes our vehicle platform mix as a percent of revenues for the year ended December 31, 2017.
|
Vehicle Platform |
|||
|
SUV |
38 |
% |
|
|
Pickup |
22 |
% |
|
|
Small Car |
16 |
% |
|
|
Van |
9 |
% |
|
|
Large Car |
8 |
% |
|
|
MPV |
2 |
% |
|
|
All Other |
5 |
% |
|
|
Total |
100 |
% |
|
In North America, SUV and Pickup accounted for 45% and 34% of revenues, respectively, for the year ended December 31, 2017.
IHS Automotive® (“IHS”) Global Sales Sub-Segment and Global Production Segment include the following references:
|
· |
“SUV” refers to Global Sales Sub-Segment "SUV" (sport-utility vehicles); |
|
· |
“Pickup” refers to Global Sales Sub-Segment "PUP” (pickup trucks); |
|
· |
“Small car” refers to Global Sales Sub-Segment and Global Production Segment (A-C Segment); |
|
· |
“Van” refers to Global Sales Sub-Segment "Van"; |
|
· |
“Large car” refers to Global Sales Sub-Segment and Global Production Segment (D-E Segment); |
|
· |
“MPV” refers to Global Sales Sub-Segment "MPV" (multi-purpose vehicles); |
|
· |
“All Other” refers to Heavy truck, Non-Auto (Racks), Offload, Service, and Other (primarily Tier 2) |
The reports prepared by IHS referred to in this Annual Report are subscription-based. All references in this report to historical industry production volumes, projections, estimates, or other data attributable to IHS, are based on data available from the IHS January 2018 forecast.
6
Our Products
We produce a broad range of structural components and assemblies, many of which are critical to the structural integrity of a vehicle. Images of some of the products we offer are presented below.
|
|
|||
|
Product Offerings
|
|||
|
|
|||
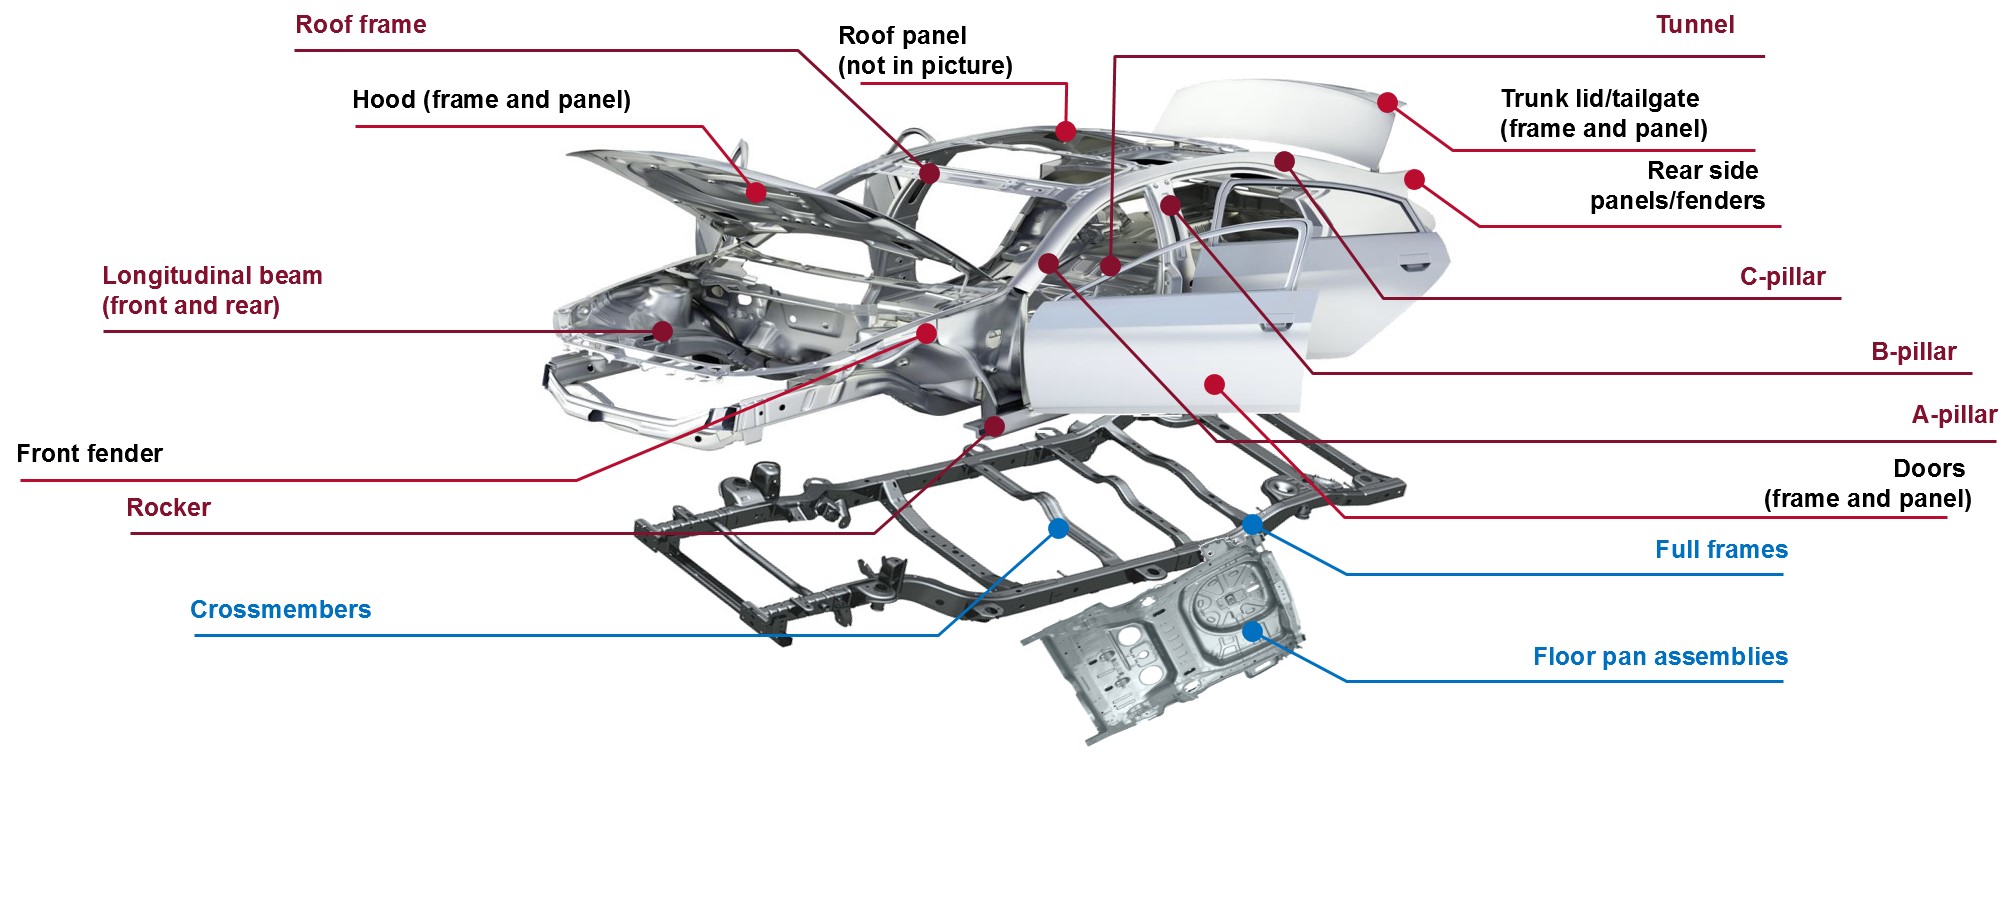
Body structures and assemblies
Body structures and assemblies form the basic upper body structure of the vehicle and include structural metal components such as body pillars, roof rails, and side sills. This category also includes Class A surfaces and assemblies, which are components of the “exterior skin” of the vehicle—body sides, hoods, doors, fenders, and pickup truck boxes. These components form the appearance of the vehicle, requiring flawless surface finishes.
Chassis and lower vehicle structures
Lower vehicle frames and structures include chassis structures that make up the “skeleton” of a vehicle and which are critical to overall performance, particularly in the areas of noise, vibration and harshness, handling, and crash management. These products include pickup truck and SUV full frames, automotive engine and rear suspension cradles, floor pan components, and cross members that form the basic lower body structure of the vehicle. These heavy gauge metal stampings carry the load of the vehicle, provide crash integrity, and are critical to the strength and safety of vehicles.
Complex body-in-white assemblies
Complex body-in-white assemblies are comprised of multiple components and sub-assemblies welded to form major portions of the vehicle’s body structure. We refer to body-in-white as the manufacturing stage in which the vehicle body sheet metal has been assembled but before the components and trim have been added. Examples of complex assemblies include front and rear floor pan assemblies and door/ pillar assemblies.
Product mix
We believe we have a diversified product group mix, as each of our product groups individually accounted for 20% or more of our revenues in 2017. The following table summarizes our product group mix as a percent of revenues for the year ended December 31, 2017:
|
Product Group |
|||
|
Body structures and assemblies |
51 |
% |
|
|
Complex body-in-white assemblies |
26 |
% |
|
|
Chassis and lower vehicle structures |
23 |
% |
|
|
Total |
100 |
% |
|
7
The following table presents the major vehicle models for which we supply products:
|
|
||||
|
OEM |
Models |
Product Type |
||
|
North America |
||||
|
Ford |
Econoline |
Frame Assembly |
||
|
Explorer |
Complex Assembly |
|||
|
Expedition/Navigator |
Body Structures |
|||
|
F-Series |
Frame Assembly & Body Structures |
|||
|
Focus |
Body Structures |
|||
|
Taurus/MKS |
Complex Assembly |
|||
|
Escape |
Body Structures & Complex Assembly |
|||
|
|
||||
|
Chrysler |
Caravan |
Body Structures |
||
|
Grand Cherokee/Durango |
Body Structures |
|||
|
|
Wrangler |
Frame Assembly |
||
|
Cherokee |
Body Structures |
|||
|
|
Ram Pickup |
Body Structures |
||
|
|
||||
|
Nissan |
Frontier |
Body Structures & Frame Assembly |
||
|
NV Series |
Frame Assembly |
|||
|
Titan |
Frame Assembly |
|||
|
Altima |
Body Structures |
|||
|
|
||||
|
Toyota |
Camry |
Body Structures |
||
|
Corolla |
Body Structures |
|||
|
Tacoma |
Body Structures |
|||
|
|
Tundra |
Body Structures |
||
|
|
||||
|
Europe |
||||
|
Volvo |
V40 |
Complex Assembly |
||
|
|
XC60 |
Body Structures |
||
|
|
||||
|
VW |
Touareg |
Body Structures & Complex Assembly |
||
|
Caddy Van |
Body Structures |
|||
|
Citigo/Mii/Up! |
Body Structures |
|||
|
Octavia |
Body Structures |
|||
|
Superb |
Body Structures |
|||
|
Fabia |
Body Structures |
|||
|
|
Ateca |
Body Structures |
||
|
|
Kodiaq |
Body Structures |
||
|
|
Touran |
Body Structures |
||
|
|
||||
|
Porsche |
Macan |
Body Structures |
||
|
Cayenne |
Body Structures & Complex Assembly |
|||
|
|
||||
|
BMW |
1/3 Series |
Body Structures |
||
|
|
||||
|
Daimler |
Sprinter |
Body Structures & Complex Assembly |
||
|
|
||||
|
Fiat |
500 |
Body Structures |
||
|
500X |
Body Structures |
8
|
Ducato |
Body Structures |
|||
|
Giulietta |
Body Structures |
|||
|
|
Giulia |
Body Structures |
||
|
Punto |
Body Structures |
|||
|
Renegade |
Body Structures |
|||
|
|
Stelvio |
Body Structures |
||
|
|
||||
|
Opel |
Astra |
Body Structures |
||
|
|
International Operations
We have significant manufacturing operations outside the United States, including Europe and Mexico. In 2017, 36% of our revenues originated outside the United States. For information regarding potential risks associated with our international operations, see Risk Factors Relating to Our Industry and Our Business — “Our substantial international operations make us vulnerable to risks associated with doing business in foreign countries”. See Management’s Discussion and Analysis of Financial Condition and Results of Operations and Note 14 to our Consolidated Financial Statements for further information regarding our international operations.
Manufacturing and Operations
Our manufacturing operations consist primarily of stamping and welding operations, system and modular assembly operations, cold and hot forming, coating, and other ancillary operations. Stamping involves passing metal through dies in a stamping press to form the metal into three-dimensional parts. We produce stamped parts using precision single-stage, progressive, and transfer presses, ranging in size from 100 to 4,500 tons, which perform multiple functions to convert raw material into finished products. We invest in our press technology to increase flexibility, improve safety, and minimize die changeover time.
We feed stampings into assembly operations that produce complex assemblies through the combination of multiple parts that are welded or fastened together. Our assembly operations are performed on either dedicated, high-volume welding/fastening machines or on flexible, cell-oriented robotic lines. The assembly machines attach additional parts, fixtures, or stampings to the original metal stampings. In addition to standard production capabilities, our assembly machines are also able to perform various statistical control functions and identify improper welds and attachments.
Our products use various grades and thicknesses of steel and aluminum, including high–strength, hot- and cold-rolled, galvanized, organically coated, stainless, and aluminized steel. Although changing steel prices affect our results, we seek to be neutral with respect to steel pricing over time, with the intention of neither making nor losing money as steel prices fluctuate. The pricing of our products includes a component for steel which can increase as steel prices increase and decrease as steel prices decrease. For our North American customers and several of our other customers, we purchase steel through our customers’ resale programs, where our customers actually negotiate the cost of steel for us. In other cases, we procure steel directly from the mills, negotiating our own price and seeking to pass through steel price increases and decreases to our customers.
Our hot forming technology provides customers with ultra-high strength steels (“UHSS”) for automotive body structures. Demand for UHSS is increasing to allow conformance to additional regulatory requirements for fuel economy – through mass reduction – while maintaining vehicle safety.
We focus on achieving superior product quality at the lowest operating costs possible and concentrate on improving our manufacturing processes to drive out inefficiencies. We seek to continually improve our processes through efforts to improve our cost competitiveness and achieve higher quality.
We are committed to sustaining Lean Six Sigma principles throughout our manufacturing processes and as of December 31, 2017, we employed 92 certified black belts. We utilize Lean Six Sigma principles to increase the efficiency of our operations and to reduce operating costs, thereby improving our cost competitiveness. We have accomplished efficiency improvements, while at the same time improving our quality.
Supply Base—Manufactured Components and Raw Materials
We purchase various manufactured components and raw materials for use in our manufacturing processes. All of these components and raw materials are available from numerous sources. We employ just-in-time manufacturing and sourcing systems, enabling us to meet customer requirements for faster deliveries, while minimizing our need to carry significant inventory levels. The primary raw material used to produce the majority of our products is steel. A portion of our steel is purchased from certain of our customers through various
9
OEM resale programs. The remainder of our steel purchasing requirements are met through contracts with steel producers and market purchases. In addition, we procure small- and medium-sized stampings, fasteners, tubing, and rubber products.
Sales, Marketing, and Distribution
Our sales and marketing efforts are designed to create awareness of our engineering, program management, manufacturing and assembly expertise, and to translate our leadership position into contract wins. We have developed a sales team that consists of an integrated group of professionals, including skilled engineers and program managers, whom we believe provide the appropriate mix of operational and technical expertise needed to interface successfully with OEMs. We sell directly to OEMs through our sales and engineering teams at our technical centers, which are strategically located around the world. Bidding on automotive OEM platforms typically encompasses many months of engineering and business development activity. We integrate our sales force directly into our operating team and work closely with our customers throughout the process of developing and manufacturing a product. Our proximity to our customer base enables us to enjoy close relationships with our customers and positions us well to seek future business awards.
Customers
We have developed long-standing business relationships with our automotive customers around the world. We work together with our customers in various stages of production, including development, component sourcing, quality assurance, manufacturing, and delivery. With a diverse mix of products and facilities in major markets worldwide, we believe we are well-positioned to meet customer needs. We believe we have a strong, established reputation with customers for providing high-quality products at competitive prices, as well as for timely delivery and customer service. Given that the automotive OEM business involves long-term production contracts awarded on a platform-by-platform basis, we believe that we can leverage our strong customer relationships to obtain new platform awards. Contracts are typically sole-sourced to one supplier for individual platforms.
Customer Support
We have six engineering and sales locations throughout the world, including a 24-hour engineering support center in India. We believe that we provide effective customer solutions, products, and service to our customers. Our customer service group is organized into customer-dedicated teams within regions to provide more focused service to our clients.
Seasonality
Our customers in North America and Europe typically shut down vehicle production during portions of July - August and for one week in late December. Our quarterly results of operations, cash flows, and liquidity may be impacted by these seasonal practices. For example, working capital is typically a use of cash during the first quarter of the year and a source of cash generation in the fourth quarter. See Management’s Discussion and Analysis of Financial Condition and Results of Operations for further discussion on working capital.
Competition
We principally compete for new business at the beginning of the development of new models and on the redesign of existing models. New-model development generally begins two to three years before the marketing of such models to the public. Once a supplier has been designated to supply parts for a new program, an OEM will usually continue to purchase those parts from the designated producer for the life of the program, although not necessarily for a major redesign. OEMs typically evaluate suppliers based on many criteria such as quality, price/cost competitiveness, system and product performance, reliability and timeliness of delivery, new product and technology development capability, excellence and flexibility in operations, location relative to the customer’s assembly plant, effectiveness of customer service, and overall management capability.
We believe that we compete effectively with other leading suppliers in our sector. Our main tier one competitors include: Magna International, Inc. (Cosma division), Gestamp Automocion, Martinrea International, Metalsa, S.A. de C.V., Gruppo Magnetto, and Benteler Automotive. We compete with other competitors with respect to certain of our products and in particular geographic markets. The number of our competitors has decreased in recent years and we believe that number will continue to decline due to supplier consolidation. In addition, most of our OEM customers manufacture similar products that compete with our products. We believe the recent trend has been for OEMs, on average, to increase outsourcing, and we expect that trend to continue, which may provide above-industry growth opportunities for key suppliers like Tower.
Joint Ventures
In the fourth quarter of 2016, we entered into agreements in principle to sell our two remaining joint ventures in China: Wuhu and Ningbo. As of December 31, 2017, we had completed the sale of Wuhu and expect to complete the sale of Ningbo during the first quarter of 2018.
10
Employees
As of December 31, 2017, we had approximately 7,600 employees worldwide, of whom approximately 4,400 were covered under collective bargaining agreements that expire at various times. We are not aware of any significant work stoppages since the formation of Tower Automotive Inc., our predecessor (the “Predecessor Company”), in 1993. A prolonged strike or slow-down by one of our unions could have a material adverse effect on our business. We believe that our relations with our employees are satisfactory.
Environmental Matters
We are subject to various domestic and foreign Federal, state and local laws and regulations governing the protection of the environment and health and safety, including those regulating the following: soil, surface water, and groundwater contamination; the generation, storage, handling, use, disposal, and transportation of hazardous materials; the emission and discharge of materials, including greenhouse gases (“GHGs”) into the environment; and the health and safety of our employees. We are also required to obtain environmental permits from governmental authorities for certain operations. We have taken steps to comply with the numerous and sometimes complex laws, regulations, and permits. We have also achieved ISO 14001 registration for substantially all of our facilities, which means we have implemented environmental management systems to improve our environmental performance. Compliance with environmental requirements has not had a material impact on our capital expenditures, earnings, or competitive position and we have made, and will continue to make, capital and other expenditures pursuant to such requirements. If we violate or fail to comply with these requirements, we could be subject to fines, penalties, enforcement actions, or lawsuits.
Environmental laws, regulations, and permits, and the enforcement thereof, change frequently and have become more stringent over time. In particular, more rigorous GHG emission requirements are in various stages of development. For example, the United States Environmental Protection Agency (“U.S. EPA”) has promulgated the GHG Reporting Rule, which requires reporting of GHG data and other relevant information from large sources and suppliers in the United States and the GHG Tailoring Rule, which requires certain facilities with significant GHG emissions to obtain emissions permits under the authority of the Clean Air Act (typically limited to only the largest stationary sources of GHGs.) The United States Congress has also considered imposing additional restrictions on GHG emissions. Any additional regulation of GHG emissions by either the United States Congress and/ or the U.S. EPA could include a cap-and-trade system, technology mandate, emissions tax, reporting requirement, or other program, and could subject us to significant costs, including those relating to emission credits, pollution control equipment, monitoring, and reporting, as well as increased energy and raw material prices. In addition, our OEM customers may seek price reductions from us to account for their increased costs resulting from GHG regulations. Further, growing pressure to reduce GHG emissions from mobile sources could reduce automobile sales, thereby reducing demand for our products, and ultimately our revenues. At this time, none of our facilities are required to report GHG emissions or participate in any cap-and-trade system programs under the existing regulatory scheme. However, there is still significant uncertainty surrounding the scope, timing, and effect of future GHG regulation, and any changes to the current laws or regulations could have a material adverse impact on our business, financial condition, results of operations, reputation, product demand, and liquidity.
We are also responsible for certain costs relating to contamination at our, or the Predecessor Company’s, current or formerly owned or operated properties or third party waste disposal sites, even if we are not at fault. Certain locations have been impacted by environmental releases and soil or groundwater contamination is being addressed at certain of these sites. In addition to potentially significant investigation and remediation costs, contamination can give rise to third party claims, including fines or penalties, natural resource damages, personal injury, or property damage. Our costs and liabilities associated with environmental contamination could be substantial and may be material to our business, financial condition, results of operations, or cash flows. Refer to Note 15 to our Consolidated Financial Statements for information regarding our environmental liabilities.
Segment Overview
Refer to Note 14 to our Consolidated Financial Statements for information regarding our operating and reportable segments.
Public Information
We maintain a website at http://www.towerinternational.com. We will make available on our website, free of charge, the proxy statements and reports on Forms 8-K, 10-K, and 10-Q that we file with the United States Securities and Exchange Commission (“SEC”) as soon as reasonably practicable, after such material is electronically filed with, or furnished to, the SEC. Additionally, we have adopted and posted on our website a Code of Business Conduct and Ethics that applies to, among other people, our principal executive officer, principal financial officer, and principal accounting officer. We intend to disclose any waivers of the Code of Business Conduct and Ethics on our website. We will provide, free of charge, a copy of our Code of Business Conduct and Ethics to any person who requests a copy. All such requests should be directed to our Executive Director, Investor & External Relations, c/o Tower International, Inc., 17672 Laurel Park Drive North, Suite 400 E, Livonia, Michigan 48152. Except as otherwise stated, the information contained on our website or available by hyperlink from our website is not incorporated into this Annual Report on Form 10-K or other documents we file with, or furnish to, the SEC.
11
Disclosure Regarding Forward-Looking Statements
This Annual Report contains statements which constitute forward-looking statements within the meaning of the Private Securities Litigation Reform Act of 1995, including, but not limited to, statements relating to trends in the operations, financial results, business and products of our Company, and anticipated production trends. The forward-looking statements can be identified by words such as “anticipate”, “believe”, “plan”, “estimate”, “expect”, “intend”, “project”, as well as other similar expressions and statements regarding our intent, belief, current plans, or expectations. Our forward looking statements also include, without limitation, statements regarding our anticipated future financial condition, operating results, free cash flows, adjusted free cash flows, net debt leverage, Adjusted EBITDA, and business and financing plans and models. Forward-looking statements are made as of the date of this report and are based upon management’s current expectations and beliefs concerning future developments and their potential effects on us. Such forward-looking statements are not guarantees of future performance. The following important factors, as well as those important factors described elsewhere in this Annual Report, including the matters set forth under the captions entitled “Risk Factors” and “Quantitative and Qualitative Disclosures About Market Risk”, could cause our actual results to differ materially from estimates or expectations reflected in such forward-looking statements:
|
· |
global automobile production volumes; |
|
· |
the financial condition of our customers and suppliers; |
|
· |
our ability to make scheduled payments of principal or interest on our indebtedness and comply with the covenants and restrictions contained in the instruments governing our indebtedness; |
|
· |
our ability to refinance our indebtedness; |
|
· |
risks associated with non-U.S. operations, including foreign exchange risks and economic uncertainty in some regions; |
|
· |
any increase in the expense and funding requirements of our pension and postretirement benefits; |
|
· |
our customers’ ability to obtain equity and debt financing for their businesses; |
|
· |
our dependence on our largest customers; |
|
· |
pricing pressure from our customers; |
|
· |
our ability to integrate acquired businesses; |
|
· |
our ability to take advantage of emerging secular trends relating to lightweighting, outsourcing, replacement, electrification, and autonomous vehicles; |
|
· |
risks associated with business divestitures including volatility in the capital markets, the capacity of potential bidders to finance transactions and the difficulty of predicting the outcome of negotiations; and |
|
· |
costs or liabilities related to environmental and safety regulations. |
|
|
Any forward-looking statement speaks only as of the date on which it is made, and we undertake no obligation to update or revise any forward-looking statement to reflect events or circumstances after the date on which the statement is made or to reflect the occurrence of unanticipated events.
This Annual Report also contains estimates and other statistical data made by independent parties and by us relating to market size and growth and other data about our industry. This data involves a number of assumptions and limitations, and you are cautioned not to give undue weight to such estimates. We have not independently verified the statistical and other industry data generated by independent parties that are contained in this Annual Report and, accordingly, we cannot assure you of the accuracy or completeness of such data. In addition, projections, assumptions, and estimates of our future performance and the future performance of the industries in which we operate are necessarily subject to a high degree of uncertainty and risk.
12
Our business is subject to a number of risks. In addition to the various risks described elsewhere in this Annual Report, the following risk factors should be considered.
Risk Factors Relating to Our Industry and Our Business
A downturn in the global economy could adversely affect demand for automobiles that are manufactured with our products and therefore, could adversely affect our business, financial condition, results of operations, and cash flows.
The level of demand for our products depends primarily upon the level of consumer demand for new vehicles that are manufactured with our products. As experienced in 2008 and 2009, a global economic recession can have a significant adverse effect on our business, customers, and suppliers, and can contribute to delayed and reduced purchases of automobiles, including those manufactured with our products. If the global economy were to undergo a significant downturn, depending upon its length, duration, and severity, our financial condition, results of operations, and cash flow could be materially adversely affected.
Demand for and pricing of our products is also subject to economic conditions and other factors (e.g., energy costs, fuel costs, climate change concerns, vehicle age, consumer spending and preferences, materials used in production, changing technology, etc.) present in the various domestic and international markets in which our products are sold.
We may be unable to realize revenues represented by our awarded business, which could materially and adversely affect our business, financial condition, results of operations and cash flows.
The realization of future revenues from awarded business is inherently subject to a number of important risks and uncertainties, including the number of vehicles that our customers will actually produce, the timing of that production, and the mix of options that our customers may choose.
In addition to not having a commitment from our customers regarding the minimum number of products they must purchase from us if we obtain awarded business, the terms and conditions of the agreements with our customers typically provide that they have the contractual right to unilaterally terminate our contracts with them without notice or with only limited notice. If such contracts are terminated by our customers, our ability to obtain compensation from our customers for such termination is generally limited to the direct out-of-pocket costs that we incurred for raw materials and work-in-progress, and in certain instances, un-depreciated capital expenditures.
We base a substantial part of our planning on the anticipated lifetime revenues of particular products. We calculate the lifetime revenues of a product by multiplying our expected price for a product by the forecasted production volume for that product during the length of time we expect the related vehicle to be in production. In addition to applying our experienced judgment to customer projections, we use IHS, a third-party forecasting service, to provide long-term forecasts, which allow us to determine how long a vehicle is expected to be in production. If we over-estimate the production units or if a customer reduces its level of anticipated purchases of a particular platform as a result of reduced demand, our actual revenues for that platform may be substantially less than the lifetime revenues we had anticipated for that platform.
Typically, it takes two to three years from the time a manufacturer awards a program until the program is launched and production begins. In many cases, we must commit substantial resources in preparation for production under awarded customer business well in advance of the customer’s production start date. We cannot provide assurance that our results of operations will not be materially adversely affected in the future if we are unable to recover these types of pre-production costs related to our customers’ cancellation of awarded business or if projected volumes are not attained.
The automobile industry is highly cyclical and a downturn would adversely affect our business, financial condition, results of operations, and cash flows.
Our business is directly related to the volume of automotive production. Automotive production and sales are highly cyclical and depend on general economic conditions and other factors, including interest rates, consumer confidence, consumer preferences, patterns of consumer spending, fuel costs, and the automobile replacement cycle. Automotive production and sales may fluctuate significantly from year-to-year and such fluctuations may give rise to changes in demand for our products. Because we have significant fixed production costs, declines in our customers’ production levels can have a significant adverse effect on our results of operations.
The highly cyclical nature of the automotive industry presents a risk that is outside our control and that cannot be accurately predicted. Moreover, a number of factors that we cannot reasonably predict could affect cyclicality in the automotive industry, and have affected cyclicality in the past. Decreases in demand for automobiles generally, or decreases in demand for our products in particular, could materially and adversely affect our business, financial condition, results of operations, and cash flows.
13
Our substantial international operations make us vulnerable to risks associated with doing business in foreign countries.
Our international operations include manufacturing facilities in Europe and Mexico. For the year ended December 31, 2017, approximately 36% of our revenues were derived from operations outside the United States. Our international operations are subject to various risks that could have a material adverse effect on those operations and our business as a whole, including, but not limited to, exposure to the following in certain locations:
|
· |
local economic and political conditions; |
|
· |
local civil and social unrest, including any resultant acts of war, terrorism or similar events; |
|
· |
local public health issues; |
|
· |
local tax requirements and obligations; |
|
· |
foreign currency exchange rate fluctuations; |
|
· |
high inflationary conditions; |
|
· |
the risk of government-sponsored competition; |
|
· |
legal and regulatory concerns, including difficulty enforcing agreements and collecting receivables; |
|
· |
controls on the repatriation of cash, including the imposition or increase of withholding and other taxes on remittances and other payments by foreign subsidiaries; |
|
· |
export and import restrictions; |
|
· |
the ability to attract and retain qualified personnel; |
|
· |
labor disruptions and operational shutdowns; |
|
· |
natural and man-made disasters; and |
|
· |
local environmental regulations. |
Additionally, the economic instability in Mexico and other countries in which we operate could adversely affect our business, financial condition, results of operations and cash flows, as well as adversely affect our access to, and cost of, capital.
We are dependent upon large customers for current and future revenues. The loss of any of these customers, or the loss of market share by these customers, could have a material adverse effect on us.
Our customers are major vehicle manufacturers. During 2017, our largest volume customers, Ford, Fiat-Chrysler, Volkswagen Group, Nissan, Volvo, and Toyota accounted for 35%, 20%, 11%, 10%, 7%, and 5% of our revenues, respectively. The loss of all or a substantial portion of our sales to any of our large-volume customers could have a material adverse effect on our business, financial condition, results of operations, and cash flows by reducing cash flows and limiting our ability to spread our fixed costs over a larger revenue base. A variety of reasons could lead to a reduction of sales to our customers, including, but not limited to:
|
· |
loss of awarded business; |
|
· |
reduced or delayed customer requirements; |
|
· |
OEMs’ choosing to insource business that has been traditionally outsourced to us; |
|
· |
strikes or other work stoppages affecting customer production; or |
|
· |
reduced demand for our customers’ products. |
14
Foreign exchange rate fluctuations could cause a decline in our financial condition, results of operations, and cash flows.
We generate a significant portion of our revenues and incur a significant portion of our expenses in currencies other than the U.S. dollar, primarily the Euro. Appreciation of the U.S. dollar against these foreign currencies will generally have an adverse effect on our reported sales and profits, while depreciation of the U.S. dollar against these foreign currencies will generally have a positive effect on reported revenues and profits.
We may use a combination of natural hedging techniques and financial derivatives to protect against certain foreign currency exchange rate risks (see Note 8 of our Consolidated Financial Statements for further information relating to our swaps). Such hedging activities may be ineffective or may not offset more than a portion of the adverse financial effect resulting from foreign currency variations. The gains or losses associated with hedging activities may adversely affect our results of operations.
The Trump Administration could make substantial changes to regulatory, fiscal, trade, and other policies that could adversely affect our business.
The Trump Administration has called for substantial changes to regulatory, fiscal and other policies, which may include significant changes to trade agreements currently in effect. We cannot predict the impact, if any, of these changes to our business. However, it is possible that these changes could adversely affect our business. It is likely that some policies adopted by the administration will benefit us and others will negatively affect us. Until we know what new changes are enacted, we will not know whether in total we benefit from, or are negatively affected by such changes.
Deterioration in the United States and world economies could adversely affect our customers’ and suppliers’ ability to access the capital markets, which may affect our business, financial condition, results of operations, and cash flows.
The capital and credit markets provide companies with liquidity to help operate and grow their businesses, beyond that which is provided by operating cash flows. Disruptions in the capital and credit markets could adversely affect our customers by making it increasingly difficult for them to obtain financing for their businesses and for their customers to obtain financing for automobile purchases. Our OEM customers typically require significant financing for their respective businesses. In addition, our OEM customers typically have related finance companies that provide financing to their dealers and customers. These finance companies have historically been active participants in the securitization markets, which experienced severe disruptions during the global economic crisis. Our suppliers, as well as the other suppliers to our customers, may face similar difficulties in obtaining financing for their businesses. If capital is not available to our customers or suppliers, or if the cost of capital is prohibitively high, their businesses would be adversely affected, which could result in their restructuring or even reorganization or liquidation under applicable bankruptcy laws. Any such adverse effect on our customers or suppliers could materially and adversely affect our Company, either through loss of revenues from any of our customers so affected, or due to our inability to meet our commitments without excess expense, as a result of disruptions in supply caused by the suppliers so affected.
Financial difficulties experienced by any of our major customers could have a material adverse effect on us if such customer were unable to pay for the products we provide or if we experienced a loss of, or material reduction in, business from such customer. As a result of such difficulties, we could experience lost revenues, significant write-offs of accounts receivable, significant impairment charges, or additional restructurings beyond the steps we have taken to date.
Any acquisitions or divestitures we make could disrupt our business and materially harm our financial condition, results of operations and cash flows.
We may, from time to time, consider certain acquisitions or divestitures. Acquisitions and divestitures involve numerous risks, including identifying attractive target acquisitions, undisclosed risks affecting the target, difficulties integrating acquired businesses, the assumption of unknown liabilities, potential adverse effects on existing business relationships with current customers and suppliers, the diversion of our management’s attention from other business concerns, and decreased geographic or customer diversification.
We cannot provide assurance that any acquisitions or divestitures will perform as planned or prove to be beneficial to our operations and cash flow, or that we will be able to successfully integrate any acquisitions that we undertake. Any such failure could seriously harm our financial condition, results of operations and cash flows.
We sponsor a defined benefit pension plan that is underfunded and requires annual cash payments. If the performance of the assets in our pension plan does not meet our expectations, or if other actuarial assumptions are modified, our required contributions may be higher than we expect.
We sponsor a defined benefit pension plan that is underfunded. While this plan is frozen as benefit accruals under the plan have ceased, the plan will require annual cash payments in order to meet our funding obligations, which adversely affects our cash flow.
Additionally, our earnings may be affected by the amount of income or expense recorded for our pension plan. GAAP requires that income or expense of a pension plan be calculated at the annual measurement date using actuarial assumptions, the most significant of
15
which relate to the capital markets, interest rates, and other economic conditions. Changes in key economic indicators can change these assumptions. These assumptions, along with the actual value of assets at the measurement date, will impact the calculation of pension expense for the year. Although GAAP expense and pension contributions are not directly related, the key economic indicators that affect GAAP expense also affect the amount of cash that we would contribute to our pension plan. The investment portfolio of the pension plan has experienced volatility. Because the values of these pension plan assets have fluctuated, and will fluctuate in response to changing market conditions, the amount of gains or losses that will be recognized in subsequent periods, the impact on the funded status of the pension plan, and the future minimum required contributions, if any, could have a material adverse effect on our business, financial condition, results of operations, and cash flows.
The decreasing number of automotive parts suppliers and pricing pressures from our automotive customers could make it more difficult for us to compete in the highly competitive automotive industry.
The automotive parts industry is highly competitive and bankruptcies and consolidation among automotive parts suppliers are reducing the number of competitors and resulting in larger competitors who benefit from purchasing and distribution economies of scale. Our inability to compete with these larger suppliers in the future could result in a reduction of, or inability to increase, revenues, which would materially adversely affect our business, financial condition, results of operations, and cash flows.
Although the overall number of competitors is decreasing due to ongoing industry consolidation, we face significant competition within each of our major product areas. The principal competitive factors include quality, global presence, service, cost, product performance, design and engineering capabilities, new product innovation, and timely delivery. We also face significant competitive pricing pressures from our automotive customers. Because of their purchasing size, our automotive customers can influence market participants to compete on price terms. If we are not able to offset pricing reductions resulting from these pressures by improving operating efficiencies and reducing expenditures, those pricing reductions may have a material adverse effect on our business.
We cannot provide assurance that we will be able to continue to compete in the highly competitive automotive industry or that increased competition will not have a material adverse effect on our business.
The volatility of steel prices may adversely affect our results of operations.
We utilize steel and various purchased steel products in virtually all of our products. We refer to the “net steel impact” as the combination of the change in steel prices that are reflected in the price of our products, the change in the cost to procure steel from mills, and the change in our recovery of scrap steel (which we refer to as “offal”). Our strategy is to be economically neutral to steel pricing by having these factors offset each other. While we strive to achieve a neutral net steel impact, we are not always successful in achieving that goal, in large part due to timing differences. The timing of a change in the price for steel may occur in separate periods and if a change occurs, that change may have a disproportionate effect on our liquidity because of the time difference between our payment for steel and our collection of cash from customers. We tend to pay for replacement materials, which are more expensive when steel prices are rising, over a much shorter period. As a result, rising steel prices may cause us to draw greater than anticipated amounts from our credit lines to cover the cash flow cycle from our steel purchases to cash collection for related accounts receivable. This cash requirement for working capital is higher in periods when we are increasing our inventory quantities.
A by-product of our production process is the generation of offal. We typically sell offal in secondary markets, which are similar to the steel markets. We generally share our recoveries from sales of offal with our customers either through scrap sharing agreements, in cases in which we are participating in resale programs, or through product pricing, in cases in which we purchase steel directly from steel mills. In either situation, we may be affected by the fluctuation in scrap steel prices, either positively or negatively, in relation to our various customer agreements. As offal prices generally increase and decrease as steel prices increase and decrease, our sale of offal may mitigate the impact of the volatility of steel price increases, as well as limit the benefits reaped from steel price declines. Any volatility in offal and steel prices could materially adversely affect our business, financial condition, results of operations, and cash flows.
We have a material amount of goodwill, which, if it becomes impaired, would result in a reduction in our net income and equity.
Goodwill represents the excess of the cost of an acquisition over the fair value of the net assets acquired. GAAP requires that goodwill be periodically evaluated for impairment based upon the fair value of the reporting unit. As of December 31, 2017, we had $63.7 million of goodwill that could be subject to impairment. Declines in our profitability or the value of comparable companies may impact the fair value of our reporting units, which could result in a write-down of goodwill and a reduction of net income.
Disruptions in the automotive supply chain could have a material adverse effect on our business, financial condition, results of operations, and cash flows.
Automotive industry conditions could adversely affect the original equipment supply base. The automotive supply chain is subject to disruptions because we, along with our customers and suppliers, attempt to maintain low inventory levels.
16
Disruptions could result from a multitude of potential problems, such as the closure of one of our or our suppliers’ plants or critical manufacturing lines due to strikes, mechanical breakdowns, electrical outages, fires, explosions, or political upheaval. Disruptions could also result from logistical complications due to weather, earthquakes, or other natural or nuclear disasters, mechanical failures, technology disruptions, or delayed customs processing.
If we are the cause for a customer being forced to halt production, the customer may seek to recoup all of its losses and expenses from us. Any disruptions affecting us or caused by us could have a material adverse effect on our business, financial condition, results of operations, and cash flows.
The inability for us, our customers, or our suppliers to obtain and maintain sufficient credit insurance or capital financing, including working capital lines, may adversely affect the liquidity and financial condition of us, our customers, and our suppliers.
Our working capital requirements can vary significantly, depending, in part, on the level, variability and timing of our customers’ vehicle production and the payment terms we have with our customers and suppliers. Our liquidity could also be adversely affected if our suppliers were to suspend normal trade credit terms and require payment in advance or payment on delivery. If our available cash flows from operations are not sufficient to fund our ongoing cash needs, we would be required to look to our cash balances and borrowing availability under our credit facilities to satisfy those needs, as well as look to potential sources of additional capital, which may not be available on satisfactory terms or in adequate amounts, if at all.
There can be no assurance that we, our customers, or our suppliers will continue to have the ability to maintain sufficient capital financing. This may increase the risk of not being able to produce our products or having to pay higher prices for our inputs that may not be recovered in our selling prices. Our suppliers often seek to obtain credit insurance based on our consolidated financial condition and strength, which may be less robust. If we were to experience liquidity issues, our suppliers may not be able to obtain credit insurance and, in turn, would likely not be able to offer us payment terms that we have historically received, which could have a material adverse effect on our liquidity.
We may incur costs of a material nature related to plant closings, which could have a material adverse effect on our business, financial condition, results of operations, and cash flows.
If we must close manufacturing locations because of lost business or consolidation of manufacturing facilities, the employee termination costs, asset retirements, and other exit costs associated with the closure of these facilities may be significant. In certain circumstances, we may close a manufacturing facility that is operated under a lease agreement and we may continue to incur material costs in accordance with the lease agreement. We attempt to align production capacity with demand; however, we cannot provide assurance that plants will not have to be closed.
We are subject to environmental risks and requirements and we may incur significant costs, liabilities, and obligations associated with those risks and requirements.
We are subject to a variety of environmental and pollution control laws, regulations, and permits that govern, among other things, soil, surface water, and groundwater contamination; the generation, storage, handling, use, disposal, and transportation of hazardous materials; the emission and discharge of materials, including GHGs, into the environment; and health and safety. If we fail to comply with these laws, regulations, or permits, we could be fined or otherwise sanctioned by regulators or become subject to litigation. Environmental and pollution control laws, regulations, and permits, and the enforcement thereof, change frequently, have tended to become more stringent over time, and may necessitate substantial capital expenditures or operating costs.
Under certain environmental requirements, we could be responsible for costs relating to any contamination at our, or the Predecessor Company’s, currently or formerly owned or operated properties or third-party waste-disposal sites, even if we were not at fault. Soil and groundwater contamination is being addressed at certain of these locations. In addition to potentially significant investigation and cleanup costs, contamination can give rise to third-party claims for fines or penalties, natural resource damages, personal injury, or property damage.
We cannot provide assurance that our costs, liabilities, and obligations relating to environmental matters will not have a material adverse effect on our business, financial condition, results of operations, and cash flows.
A disruption in our information technology systems, including a disruption related to cybersecurity, could adversely affect our financial performance.
We rely on the accuracy, capacity and security of our information technology systems. Despite the security measures that we have implemented, including those measures related to cybersecurity, our systems could be breached or damaged by computer viruses, natural or man-made incidents or disasters or unauthorized physical or electronic access. A breach could result in business disruption, theft of our intellectual property, trade secrets or customer information and unauthorized access to personnel information. To the extent that our
17
business is interrupted or data is lost, destroyed or inappropriately used or disclosed, such disruptions could materially and adversely affect our competitive position, relationships with our customers, financial condition, operating results and cash flows. In addition, we may be required to incur significant costs to protect against the damage caused by these disruptions or security breaches in the future.
Risk Factors Relating to Our Indebtedness
We have a substantial amount of indebtedness, which could have a material adverse effect on our financial health and our ability to fund our operations, obtain financing in the future, and react to changes in our business.
As of December 31, 2017, our total debt, including capital lease obligations and net of debt issue costs, was $386.8 million. That indebtedness could:
|
· |
adversely affect our stock price; |
|
· |
make it more difficult for us to satisfy our obligations under our financing arrangements; |
|
· |
increase our vulnerability to adverse economic and general industry conditions, including interest rate fluctuations, because a portion of our borrowings have, and will continue to have, variable interest rates; |
|
· |
require us to dedicate a substantial portion of our cash flow from operations to payments on our debt, which would reduce the availability of our cash flow from operations to fund working capital, capital expenditures or other general corporate purposes; |
|
· |
limit our flexibility in planning for, or reacting to, changes in our business and industry; |
|
· |
place us at a disadvantage compared to competitors that may have proportionately less debt; |
|
· |
limit our ability to obtain additional debt or equity financing due to financial and restrictive covenants included in our debt agreements; and |
|
· |
increase our cost of borrowing. |
Our primary debt instrument is the Term Loan Credit Facility which bears interest at (i) the Alternate Base Rate plus a margin of 1.75% or (ii) the Adjusted LIBO Rate (calculated by multiplying the applicable LIBOR by a statutory reserve rate, with a floor of 1.00%) plus a margin of 2.75%. As of December 31, 2017, the balance on the term loan was $356.5 million (net of a $2.3 million discount). If the LIBOR rates increase in excess of 1%, we will incur higher debt service requirements, which could adversely affect our cash flow and operating results. While we periodically enter into agreements designed to limit our exposure to higher interest rates, any such agreements do not offer complete protection from this risk.
We may not be able to refinance our debt on commercially reasonable terms, if at all.
We cannot provide assurance that we will be able to refinance, extend the maturity of, or otherwise amend the terms of our existing indebtedness, or that any refinancing, extension, or amendment will be on commercially reasonable terms. The indebtedness issued in any refinancing of our existing indebtedness could have a significantly higher rate of interest and greater costs than our existing indebtedness. There can be no assurance that the financial terms or covenants of any new credit facility or other indebtedness issued to refinance our existing indebtedness will be the same or as favorable as those under our existing indebtedness.
Our ability to complete a refinancing of our existing indebtedness prior to their respective maturities is subject to a number of conditions beyond our control. For example, if a disruption in the financial markets were to occur at the time that we intended to refinance this indebtedness, we might be restricted in our ability to access the financial markets. Also, if we were unable to make payments or refinance our debt or obtain new financing under these circumstances, we would have to consider other options, such as:
|
· |
sales of assets; |
|
· |
sales of equity; or |
|
· |
negotiations with lenders and their respective agents to restructure the applicable debt. |
Our debt instruments may restrict, and market or business conditions may limit, our ability to employ some of our options.
18
In addition, under our credit agreements, a change in control may lead the lenders to exercise remedies such as acceleration of the loan, termination of their obligations to fund additional advances and collection against the collateral securing such loan.
We may be unable to generate sufficient cash to service all of our indebtedness and we may be forced to take other actions to satisfy our obligations under such indebtedness, which may not be successful.
Our ability to make scheduled payments on or to refinance our debt obligations, certain of which have short-term maturities, depends on our financial condition and operating performance, which is subject to prevailing economic and competitive conditions, as well as financial, business, and other factors beyond our control. We cannot provide assurance that we will maintain a level of cash flows from operating activities sufficient to permit us to pay or refinance our indebtedness.
Our debt instruments restrict our current and future operations.
The financing agreements governing our indebtedness impose significant operating and financial restrictions on us. These restrictions limit our ability and the ability of our subsidiaries to, among other things:
|
|
• |
|
incur or guarantee additional debt, incur liens, or issue certain equity; |
|
|
• |
|
declare or make distributions to our stockholders, repurchase equity, or prepay certain debt; |
|
|
• |
|
make loans or certain investments; |
|
|
• |
|
make certain acquisitions of equity or assets; |
|
|
• |
|
enter into certain transactions with affiliates; |
|
|
• |
|
enter into mergers, acquisitions, or other business combinations; |
|
|
• |
|
consolidate, transfer, sell, or otherwise dispose of certain assets; |
|
|
• |
|
use the proceeds from sales of assets and stock; |
|
|
• |
|
enter into sale and leaseback transactions; |
|
|
• |
|
enter into restrictive agreements; |
|
|
• |
|
make capital expenditures; |
|
|
• |
|
change our fiscal year; |
|
|
• |
|
amend or modify organizational documents; and |
|
|
• |
|
engage in businesses other than the businesses we currently conduct. |
In addition to the restrictions and covenants listed above, certain of our financing documents require us, under certain circumstances, to comply with specified financial maintenance covenants. Any of these restrictions or covenants could limit our ability to plan for or react to market conditions or meet certain capital needs and could otherwise restrict our corporate activities.
Substantially all of our subsidiaries’ assets are pledged as collateral under our secured financing arrangements.
As of December 31, 2017, we had $386.8 million (net of $8.2 million debt issue costs) of secured debt. Substantially all of our subsidiaries’ assets are pledged as collateral for our borrowings under our secured financing arrangements. Most of our domestic subsidiaries are either primary obligors or guarantors under a secured financing arrangement. Substantially all of our domestic subsidiaries’ assets are pledged as collateral for these obligations. If we are unable to repay all secured borrowings when due, whether at maturity or if declared due and payable following a default, the agent or the lenders, as applicable, would have the right to proceed against the collateral pledged to secure the indebtedness and may sell the assets pledged as collateral in order to repay those borrowings, which could have a material adverse effect on our businesses, financial condition, results of operations, and cash flows.
19
Risk Factors Relating to Our Common Stock
The price of our common stock may be volatile.
The price at which our common stock trades may be volatile due to a number of factors, including:
|
|
• |
|
actual or anticipated fluctuations in our financial condition or annual or quarterly results of operations; |
|
|
• |
|
changes in investors’ or financial analysts’ perception of our business risks or condition of our business; |
|
|
• |
|
changes in, or our failure to meet, earnings estimates or other performance expectations of investors or financial analysts; |
|
|
• |
|
unfavorable commentary or downgrades of our stock by equity research analysts; |
|
|
• |
|
our success or failure in implementing our growth plans; |
|
|
• |
|
changes in the market valuations of companies viewed as similar to us; |
|
|
• |
|
changes or proposed changes in governmental regulations affecting our business; |
|
|
• |
|
changes in key personnel; |
|
|
• |
|
volume of our common stock trading in the market; |
|
|
• |
|
failure of securities analysts to cover our common stock; |
|
|
• |
|
future sales of our common stock; and |
|
|
• |
|
the granting or exercise of employee stock options or other equity awards. |
Broad market fluctuations may result in a material decline in the market price of our common stock and you may not be able to sell your shares at prices you deem acceptable. In the past, following periods of volatility in the equity markets, securities class action lawsuits have been instituted against public companies. Such litigation, if instituted against us, could result in substantial cost and the diversion of management attention.
Shares eligible for future sale may cause the market price of our common stock to decline, even if our business is doing well.
Sales of substantial amounts of our common stock in the public market, or the perception that these sales may occur, could adversely affect the price of our common stock and could impair our ability to raise capital through the sale of additional equity securities. Our certificate of incorporation authorizes us to issue up to 350,000,000 shares of common stock and as of February 21, 2018 we had 20,542,397 shares of common stock outstanding.
Item 1B. Unresolved Staff Comments
None.
We are headquartered in Livonia, Michigan in a 76,000 square foot facility, which we lease. This facility is utilized for management offices, as well as certain accounting, customer service, engineering, human resources, information technology, finance, purchasing, and treasury functions. We believe that this facility is suitable for the activities conducted there.
Our manufacturing is conducted in 23 manufacturing facilities strategically located throughout North America and Europe. Our manufacturing facilities are supported by six engineering and sales locations throughout the world.
20
The following table sets forth selected information regarding each of our facilities:
|
Facility |
Country |
Description of Use |
Square Feet |
Ownership |
||||
|
U.S. Locations |
||||||||
|
Auburn, Indiana |
United States |
Manufacturing |
162,800 |
Leased |
||||
|
Bardstown, Kentucky (2 locations) |
United States |
Manufacturing |
519,000 |
Owned/Leased(1) |
||||
|
Bellevue, Ohio (2 locations) |
United States |
Manufacturing |
377,450 |
Owned |
||||
|
Bluffton, Ohio |
United States |
Manufacturing |
196,200 |
Leased |
||||
|
Chicago, Illinois |
United States |
Manufacturing |
412,800 |
Leased |
||||
|
Clinton Township, Michigan |
United States |
Manufacturing |
392,300 |
Leased |
||||
|
Elkton, Michigan |
United States |
Manufacturing |
1,100,000 |
Owned |
||||
|
Grand Rapids, Michigan |
United States |
Office |
5,900 |
Leased |
||||
|
Fountain Inn, South Carolina |
United States |
Manufacturing |
264,385 |
Leased |
||||
|
Livonia, Michigan |
United States |
Corporate Office/ |
76,300 |
Leased |
||||
|
Madison, Mississippi |
United States |
Manufacturing |
270,000 |
Leased |
||||
|
Meridian, Mississippi |
United States |
Manufacturing |
420,000 |
Leased |
||||
|
Plymouth, Michigan |
United States |
Manufacturing |
315,133 |
Leased |
||||
|
Shepherdsville, Kentucky |
United States |
Manufacturing |
311,878 |
Leased |
||||
|
Non-U.S. Locations |
||||||||
|
Mexico City (4 locations) |
Mexico |
Manufacturing |
192,663 |
Leased |
||||
|
Gent |
Belgium |
Manufacturing |
346,700 |
Leased |
||||
|
Neprevazka |
Czech Republic |
Manufacturing |
69,200 |
Leased |
||||
|
Artern |
Germany |
Manufacturing |
164,600 |
Owned |
||||
|
Buchholz |
Germany |
Manufacturing |
79,900 |
Owned |
||||
|
Duisburg |
Germany |
Manufacturing |
116,700 |
Owned |
||||
|
Kaarst |
Germany |
Office |
3,300 |
Leased |
||||
|
Cologne |
Germany |
Corporate Office/ |
32,530 |
Leased |
||||
|
Zwickau |
Germany |
Manufacturing |
535,095 |
Owned/Leased(1) |
||||
|
Caserta |
Italy |
Manufacturing |
262,500 |
Owned |
||||
|
Melfi |
Italy |
Manufacturing |
73,600 |
Owned |
||||
|
Turin |
Italy |
Technical Center |
23,100 |
Leased |
||||
|
Opole |
Poland |
Manufacturing |
146,000 |
Owned/Leased(1) |
||||
|
Malacky |
Slovakia |
Manufacturing |
542,500 |
Owned |
||||
|
Shanghai |
China |
Corporate Office/ |
475 |
Leased |
||||
|
Hyderabad |
India |
Technical Center |
8,700 |
Leased |
||||
|
Yokohama |
Japan |
Technical Center |
2,500 |
Leased |
||||
|
Aruja(2) |
Brazil |
Manufacturing/ |
334,880 |
Owned |
|
(1) |
Facility consists of two buildings—one building is leased and one building is owned. |
|
(2) |
Facility is part of our held for sale operations. |
From time to time, we are involved in legal proceedings, claims, or investigations that are incidental to the conduct of our business. We vigorously defend ourselves against such claims. In future periods, we could be subject to cash costs or non-cash charges to earnings if a matter is resolved on unfavorable terms. However, although the ultimate outcome of any legal matter cannot be predicted with certainty, based on current information, including our assessment of the merits of the particular claims, we do not expect that our pending legal proceedings or claims will have a material impact on our future consolidated financial condition, results of operations, or cash flows.
Item 4. Mine Safety Disclosures
21
Not applicable.
PART II
Item 5. Market for Registrant’s Common Equity, Related Stockholder Matters, and Issuer Purchases of Equity Securities
Market Information — Our common stock trades on the New York Stock Exchange under the symbol “TOWR”. As of February 21, 2018, we had 20,542,397 shares of common stock ($0.01 par value) outstanding, 5,028 beneficial shareholders, and two holders of record of our common stock. The transfer agent and registrar for our common stock is Broadridge Financial Solutions, Inc.
The following table presents the reported high and low closing prices per share of our common stock during 2017 and 2016:
|
|
2017 |
2016 |
||||||||||
|
High and Low Closing Prices per Share |
High Price |
Low Price |
High Price |
Low Price |
||||||||
|
Fourth Quarter |
$ |
33.05 |
$ |
27.45 |
$ |
28.95 |
$ |
20.95 | ||||
|
Third Quarter |
27.45 | 21.55 | 24.79 | 19.69 | ||||||||
|
Second Quarter |
27.90 | 21.10 | 28.20 | 18.89 | ||||||||
|
First Quarter |
28.75 | 24.75 | 27.67 | 20.26 | ||||||||
Performance Graph — The following chart shows the cumulative total stockholder return for our common stock from December 31, 2012 to December 31, 2017. The graph also shows the cumulative returns of the S&P 500 Index and the S&P Supercomposite Auto Parts and Equipment Index. The comparison assumes $100 was invested on December 31, 2012. Each of the indices shown assumes that all dividends paid were reinvested.
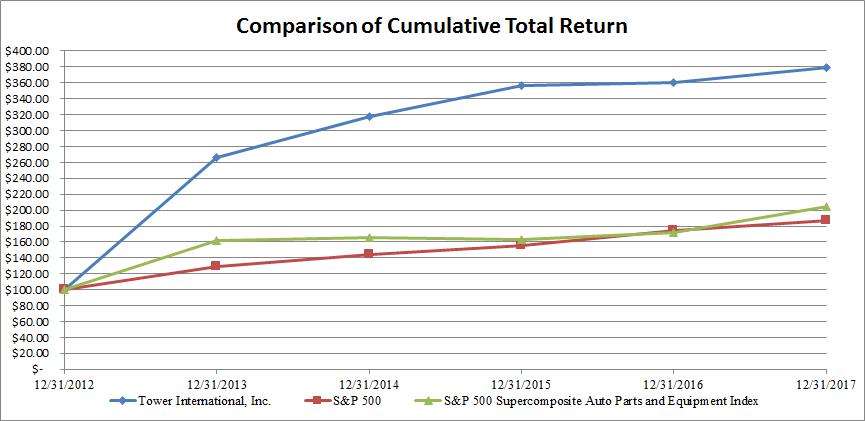
|
|
12/31/2012 |
12/31/2013 |
12/31/2014 |
12/31/2015 |
12/31/2016 |
12/31/2017 |
|||||||||||||
|
Tower International, Inc. |
$ |
100.00 |
$ |
265.84 | 317.39 | 356.19 | 359.98 |
$ |
379.50 | ||||||||||
|
S&P 500 |
100.00 | 129.60 | 144.36 | 156.03 | 174.68 | 187.47 | |||||||||||||
|
S&P 500 Supercomposite Auto Parts and Equipment Index |
100.00 | 162.39 | 165.65 | 162.54 | 171.47 | 204.99 |
22
Dividends
The following table presents information regarding our quarterly dividends per common share.
|
Declaration Date |
Cash Amount |
Record Date |
Payment Date |
||||
|
2017 |
|||||||
|
October 20, 2017 |
$ |
0.12 |
November 10, 2017 |
December 8, 2017 |
|||
|
July 21, 2017 |
0.11 |
August 10, 2017 |
September 8, 2017 |
||||
|
April 21, 2017 |
0.11 |
May 10, 2017 |
June 9, 2017 |
||||
|
January 27, 2017 |
0.11 |
February 10, 2017 |
February 28, 2017 |
||||
|
2016 |
|||||||
|
October 21, 2016 |
0.11 |
November 10, 2016 |
December 9, 2016 |
||||
|
July 22, 2016 |
0.10 |
August 10, 2016 |
September 9, 2016 |
||||
|
April 22, 2016 |
0.10 |
May 10, 2016 |
June 10, 2016 |
||||
|
January 29, 2016 |
0.10 |
February 10, 2016 |
February 29, 2016 |
||||
|
2015 |
|||||||
|
October 16, 2015 |
0.10 |
November 10, 2015 |
December 10, 2015 |
The payment of future quarterly dividends is subject to the discretion of our Board of Directors and depends on various factors, including our net earnings, financial condition, cash requirements, future prospects, and other factors that our Board of Directors deems relevant to its analysis and decision making.
Unregistered Sales of Equity Securities and Use of Proceeds
Purchases of Equity Securities
The following table presents information regarding shares of our common stock repurchased during the fourth quarter of 2017.
|
|
Total Number of |
|||||||||
|
|
Shares (or Units) |
Dollar Value of |
||||||||
|
|
Weighted |
Purchased as Part |
Shares that May |
|||||||
|
|
Total Number of |
Average Price |
of Publicly |
Yet Be Purchased |
||||||
|
|
Shares (or Units) |
Paid per Share |
Announced Plan |
Under Plan or |
||||||
|
Period |
Purchased |
(or Unit) |
or Program |
Program (1) |
||||||
|
October 1 to October 31, 2017 |
- |
$ |
- |
- |
$ |
81,056,732 | ||||
|
November 1 to November 30, 2017 |
- |
$ |
- |
- |
$ |
81,056,732 | ||||
|
December 1 to December 31, 2017 |
- |
$ |
- |
- |
$ |
81,056,732 | ||||
|
Total |
- |
$ |
- |
- |
||||||
(1) This column includes the approximate dollar value of shares that remain authorized for repurchase under the Company’s Repurchase Program announced on June 17, 2016. Subject to applicable legal restrictions, shares may be repurchased in open market transactions, privately negotiated transactions, or in such other manner as shall be determined by the Chief Executive Officer, the Chief Financial Officer (the “Proper Officers”), or their designee. The timing, manner, price, and amount of repurchases will be determined at the Proper Officer’s discretion and the Repurchase Program shall terminate on the earlier of (i) the first date on which a total of $100 million of the Company’s shares of common stock shall have been purchased and (ii) such other date as shall be determined by the Company’s Board of Directors.
23
Item 6. Selected Financial Data
The following tables set forth selected consolidated balance sheet data as of December 31, 2017 and 2016 and selected consolidated statement of operations data for the years ended December 31, 2017, 2016, and 2015, which have been derived from our audited Consolidated Financial Statements and related notes that are included in this Annual Report. The selected consolidated balance sheet data as of December 31, 2015, 2014, and 2013 and the selected consolidated statement of operations data for the years ended December 2014 and 2013 set forth below, have been derived from previously filed audited consolidated financial statements that are not presented in this Annual Report. As with our Consolidated Financial Statements for the years ended December 31, 2017, 2016, and 2015, we adjusted the information in the consolidated financial statements for the years ended December 31, 2014 and 2013, where appropriate, to account for discontinued operations.
You should read the following selected historical consolidated financial data in conjunction with the more detailed information contained in Management’s Discussion and Analysis of Financial Condition and Results of Operations and our Consolidated Financial Statements and the related notes that we have presented elsewhere in this Annual Report.
|
|
||||||||||||||||||||
|
|
2017 |
2016 |
2015 |
2014 |
2013 |
|||||||||||||||
|
|
(in millions except share and per share data) |
|||||||||||||||||||
|
Statements of Operations Data: |
||||||||||||||||||||
|
Revenues |
$ |
1,988.0 |
$ |
1,913.6 |
$ |
1,796.1 |
$ |
1,838.1 |
$ |
1,722.1 | ||||||||||
|
Cost of sales (a) |
1,743.5 | 1,675.2 | 1,578.2 | 1,622.3 | 1,510.5 | |||||||||||||||
|
Gross profit |
244.5 | 238.4 | 217.9 | 215.8 | 211.5 | |||||||||||||||
|
Gross profit margin |
12.3 |
% |
12.5 |
% |
12.1 |
% |
11.7 |
% |
12.3 |
% |
||||||||||
|
Selling, general, and administrative expenses (b) |
$ |
118.1 |
$ |
131.6 |
$ |
124.5 |
$ |
123.6 |
$ |
122.8 | ||||||||||
|
Amortization expense |
0.4 | 0.4 | 0.2 | 1.2 | 2.1 | |||||||||||||||
|
Restructuring and asset impairment charges, net |
10.7 | 5.4 | 7.8 | 11.4 | 20.4 | |||||||||||||||
|
Operating income |
115.3 | 101.0 | 85.4 | 79.6 | 66.2 | |||||||||||||||
|
Operating income margin |
5.8 |
% |
5.3 |
% |
4.8 |
% |
4.3 |
% |
3.8 |
% |
||||||||||
|
Interest expense, net |
$ |
13.4 |
$ |
21.0 |
$ |
23.7 |
$ |
31.0 |
$ |
48.8 | ||||||||||
|
Other expense (b) |
0.6 | 6.5 |
- |
0.1 | 48.4 | |||||||||||||||
|
Income before provision for income taxes (c) (d) |
101.3 | 73.5 | 61.7 | 48.5 | (31.0) | |||||||||||||||
|
Provision / (benefit) for income taxes |
55.4 | 17.2 | (123.8) | 7.3 | (2.9) | |||||||||||||||
|
Income / (loss) from continuing operations |
45.9 | 56.3 | 185.5 | 41.2 | (28.1) | |||||||||||||||
|
Income / (loss) from discontinued operations, |
||||||||||||||||||||
|
net of tax (e) |
1.9 | (17.0) | 10.3 | (14.1) | 12.1 | |||||||||||||||
|
Net income / (loss) |
47.7 | 39.3 | 195.8 | 27.1 | (16.1) | |||||||||||||||
|
Net income attributable to the noncontrolling interests |
0.1 | 0.7 | 1.7 | 5.6 | 4.2 | |||||||||||||||
|
Net income / (loss) attributable to Tower International, Inc. |
$ |
47.6 |
$ |
38.6 |
$ |
194.1 |
$ |
21.5 |
$ |
(20.3) | ||||||||||
|
|
||||||||||||||||||||
|
Basic income / (loss) per share: |
||||||||||||||||||||
|
Income / (loss) per share from continuing operations |
$ |
2.23 |
$ |
2.66 |
$ |
8.71 |
$ |
1.72 |
$ |
(1.59) | ||||||||||
|
Income / (loss) per share from discontinued operations |
0.09 | (0.82) | 0.49 | (0.68) | 0.59 | |||||||||||||||
|
Net income / (loss) attributable to Tower International, Inc. per share |
2.32 | 1.85 | 9.20 | 1.04 | (0.99) | |||||||||||||||
|
Weighted average basic shares outstanding (in thousands) |
20,499 | 20,864 | 21,093 | 20,662 | 20,387 | |||||||||||||||
|
|
||||||||||||||||||||
|
Diluted income / (loss) per share: |
||||||||||||||||||||
|
Income / (loss) per share from continuing operations |
$ |
2.20 |
$ |
2.62 |
$ |
8.58 |
$ |
1.67 |
$ |
(1.59) | ||||||||||
|
Income / (loss) per share from discontinued operations |
0.09 | (0.80) | 0.48 | (0.66) | 0.59 | |||||||||||||||
|
Net income / (loss) attributable to Tower International, Inc. per share |
2.29 | 1.82 | 9.06 | 1.01 | (0.99) | |||||||||||||||
|
Weighted average diluted shares outstanding (in thousands) |
20,829 | 21,222 | 21,408 | 21,391 | 20,387 | |||||||||||||||
|
|
||||||||||||||||||||
|
Dividends declared per share |
$ |
0.45 |
$ |
0.41 |
$ |
0.10 |
$ |
- |
$ |
- |
||||||||||
|
|
||||||||||||||||||||
|
Balance Sheets Data: |
||||||||||||||||||||
|
Cash and cash equivalents |
$ |
123.7 |
$ |
62.8 |
$ |
121.6 |
$ |
132.7 |
$ |
123.3 | ||||||||||
|
Total assets (f) |
1,260.1 | 1,162.5 | 1,215.5 | 1,165.2 | 1,163.8 | |||||||||||||||
24
|
Total debt (f) (g) |
386.8 | 390.3 | 444.6 | 475.4 | 465.5 | |||||||||||||||
|
Total stockholders' equity |
269.9 | 213.9 | 206.7 | 99.8 | 136.9 |
|
(a) |
During the years ended December 31, 2016, 2015 and 2014, non-cash actuarial pension losses of $8.3 million, $9.1 million and $4.2 million, respectively, were recorded. |
|
(b) |
During the year ended December 31, 2013, we recorded $42.5 million related to premiums paid and fees incurred in connection with notes repurchases, $5.1 million related to term loan re-pricings, and $0.8 million related to certain secondary offerings. |
|
(c) |
During the year ended December 31, 2015, net income included a $131 million deferred tax benefit primarily due to the release of the valuation allowance in the United States and Italy. Refer to Note 9 of our Consolidated Financial Statements for further information regarding our valuation allowances. |
|
(d) |
During the year ended December 31, 2017, net income included $27.2 million of deferred tax expense related to the revaluation of our U.S. deferred tax assets due to a reduction in the federal income tax rate as a result of U.S. Tax Reform and $2.4 million deferred tax expense to establish a valuation allowance on certain European deferred tax assets. Refer to Note 9 of our Consolidated Financial Statements for further discussion. |
|
(e) |
During the years ended December 31, 2016 and 2014, the Company recorded a loss in discontinued operations (net of tax) of $18.1 million and $22.9 million, respectively. |
|
(f) |
For all years presented, total assets and total debt have been adjusted to reflect the adoption of FASB ASU No. 2015-03, Simplifying the Presentation of Debt Issuance Costs, which changed the presentation of debt issuance costs from an asset to a direct deduction from long-term debt, and FASB ASU No. 2015-17, Balance Sheet Classification of Deferred Taxes, which changed the classification of all deferred tax assets and liabilities, along with any related valuation allowance, to noncurrent, rather than current. |
|
(g) |
Consists of short-term and long-term debt (net of debt issue costs), current portion of long-term debt, and capital lease obligations. |
25
Item 7. Management's Discussion and Analysis of Financial Condition and Results of Operations
Company Overview
We are a leading integrated global manufacturer of engineered structural metal components and assemblies primarily serving original equipment manufacturers (“OEMs”). We offer our automotive customers a broad product portfolio, supplying body-structure stampings, frame and other chassis structures, as well as complex welded assemblies, for small and large cars, crossovers, pickups, and sport utility vehicles. Our products are manufactured at 23 facilities strategically located near our customers in North America and Europe. We support our manufacturing operations through six engineering and sales locations around the world. Our products are offered on a diverse mix of vehicle platforms, reflecting the balanced portfolio approach of our business model and the breadth of our product capabilities. We supply products to approximately 130 vehicle models globally to 11 of the 12 largest OEMs based on 2017 production volumes.
We believe that our engineering, manufacturing, and program management capabilities, our competitive cost, our financial discipline, and our colleague engagement position us for long-term success.
Factors Affecting Our Industry
Our business and our revenues are primarily driven by the strength of the global automotive industry, which tends to be cyclical and highly correlated to general global macroeconomic conditions. The strength of the automotive market dictates the volume of purchases of our products by our OEM customers to ultimately satisfy consumer demand. We manufacture products pursuant to written agreements with each of our OEM customers. However, those agreements do not dictate the volume requirements of our customers; instead, OEMs monitor their inventory and the inventory levels of their dealers and adjust the volume of their purchases from us based on consumer demand for their products.
During 2017, industry production volumes increased from 2016 in the European market, but decreased in the North American market. According to IHS, industry production is projected to increase in 2018 in both of our markets. Any such changes may be offset by changes in production levels for our customers’ products.
Factors Affecting Our Revenues
While overall production volumes are largely driven by economic factors outside of our direct control, we believe that the following elements of our business also impact our revenues:
Life cycle of our agreements: Agreements for new models of vehicles normally cover the lifetime of the platform, often awarded two to three years before these models are marketed to the public, while agreements covering design improvements to existing automobiles have shorter expected life cycles, typically with shorter pre-production and development periods. Typically, once a supplier has been designated to supply components for a new platform, an OEM will continue to purchase those parts from the designated manufacturer for the life of the program. For any given agreement, our revenues depend, in part, upon the life cycle status of the applicable product platform.
Product pricing: Generally, our customers negotiate annual price reductions with us during the term of their contracts. When negotiated price reductions are expected to be retroactive, we accrue for such amounts as a reduction of revenues as products are shipped. The extent of our price reductions negatively affects our revenues. We have also been able to negotiate year-over-year price increases in select circumstances.
Steel pricing: We require significant quantities of steel and aluminum in the manufacture of our products. The pricing of our products includes a component for these metals which increases as prices for these metals increase and decreases as prices for these metals decrease. Depending upon when a price change occurs, that change may have a disproportionate effect on our revenues within any particular fiscal period. We purchase a portion of our steel and aluminum from certain of our customers through various OEM resale programs, where our customers actually negotiate the cost for us. The purchases through customer resale programs have buffered the impact of price swings associated with the procurement of these metals. The remainder of our steel and aluminum purchasing requirements are met through contracts with mills, in which we negotiate our own price and seek to pass through price increases and decreases to our customers.
Foreign exchange: Our foreign exchange transaction risk is limited because we generally purchase materials and produce products in the same currency in which we sell those products to our final customers. However, the translation of foreign currencies, primarily the Euro, back to U.S. dollars may have a significant impact on our revenues, results of operations, cash flows, or stockholders’ equity. Foreign exchange has an unfavorable impact on revenues when the U.S. dollar is relatively strong when compared to foreign currencies and a favorable impact on revenues when the U.S. dollar is relatively weak when compared
26
to foreign currencies. The results of operations and financial condition of our businesses outside of the U.S. are principally measured in their respective local currency and translated into U.S. dollars. Assets and liabilities of our foreign operations are translated into U.S. dollars at foreign currency exchange rates in effect as of the end of each reporting period. Results of operations are translated at applicable average rates prevailing throughout the period. Translation gains or losses are reported as a separate component of accumulated other comprehensive income / (loss) in our Consolidated Statements of Equity / (Deficit). Gains and losses resulting from foreign currency transactions, the amounts of which were not material in any of the periods presented in this Annual Report, are included in net income.
Factors Affecting Our Expenses
Our largest expense is steel material, which is driven by the following factors:
Cost of steel: We utilize steel and various purchased steel products in virtually all of our products. We refer to the “net steel impact” as the combination of the change in steel prices that are reflected in the price of our products, the change in the cost to procure steel from mills, and the change in our recovery of offal. Our strategy is to be economically neutral to steel pricing by having these factors offset each other. While we strive to achieve a neutral net steel impact, we are not always successful in achieving that goal, in large part due to timing differences. The timing of a change in the price for steel may occur in separate periods and if a change occurs, that change may have a disproportionate effect, within any particular fiscal period, on our product pricing, our steel costs, and the results of our sales of offal. Net imbalances in any one particular fiscal period may be reversed in a subsequent fiscal period, although we cannot provide assurances that, or when, these reversals will occur. Over the past several years, we have not experienced a material net impact from these factors.
Purchase of steel: As noted above, we purchase a portion of our steel from certain of our customers through various OEM resale programs and the remaining portion of our steel directly from steel mills. Whether our customer negotiates the cost of steel for us in a customer resale program or we negotiate the cost of steel with the mills, the price we pay is charged directly to our cost of sales, just as the component of product pricing relating to steel is included within our revenues.
Sale of offal: A by-product of our production process is the generation of offal. We typically sell offal in secondary markets, which are influenced by similar market forces. We generally share our recoveries from sales of offal with our customers either through scrap sharing agreements, in cases in which we are participating in resale programs, or through product pricing, in cases in which we purchase steel directly from steel mills. In either situation, we may be affected by the fluctuation in scrap steel prices, either positively or negatively, in relation to our various customer agreements. As offal prices generally increase or decrease as steel prices increase or decrease, our sale of offal may mitigate the impact of the volatility of steel price increases, as well as limit the benefits reaped from steel price declines. Recoveries related to the sales of offal reduce cost of sales.
Adjusted EBITDA
We use the term Adjusted EBITDA throughout this Annual Report. We define Adjusted EBITDA as net income / (loss) before interest, taxes, depreciation, amortization, restructuring items, and other adjustments described in the reconciliations provided in this report. Adjusted EBITDA is not a measure of performance defined in accordance with U.S. GAAP. We use Adjusted EBITDA as a supplement to our GAAP results in evaluating our business.
Adjusted EBITDA is included in this Annual Report because it is one of the principal factors upon which our management assesses performance. Our Chief Executive Officer measures the performance of our segments on the basis of Adjusted EBITDA. As an analytical tool, Adjusted EBITDA assists us in comparing our performance over various reporting periods on a consistent basis because it excludes items that we do not believe reflect our core operating performance.
We believe that Adjusted EBITDA is useful in evaluating our performance as it is a commonly used financial metric for measuring and comparing the operating performance of companies in our industry. We believe that the disclosure of Adjusted EBITDA offers an additional financial metric that, when coupled with the GAAP results and the reconciliation to GAAP results, provides a more complete understanding of our results of operations and the factors and trends affecting our business.
Adjusted EBITDA should not be considered as an alternative to net income / (loss) as an indicator of our performance, as an alternative to net cash provided by operating activities as a measure of liquidity, or as an alternative to any other measure prescribed by GAAP. There are limitations to using non-GAAP measures such as Adjusted EBITDA. Although we believe that Adjusted EBITDA may make an evaluation of our operating performance more consistent because it removes items that do not reflect our core operations, other companies in our industry may define Adjusted EBITDA differently than we do and, as a result, it may not be comparable to similarly titled measures used by other companies in our industry, and Adjusted EBITDA excludes certain financial information that some may consider important in evaluating our performance.
27
We compensate for these limitations by providing disclosure of the differences between Adjusted EBITDA and GAAP results, including a reconciliation of Adjusted EBITDA to GAAP results, to enable investors to perform their own analysis of our operating results. For a reconciliation of consolidated Adjusted EBITDA to its most directly comparable GAAP measure, net income / (loss), see “Results of Operations” below.
Because of these limitations, Adjusted EBITDA should not be considered as a measure of the income generated by our business or discretionary cash available to us to invest in the growth of our business. Our management compensates for these limitations by analyzing both our GAAP results and Adjusted EBITDA.
Our Segments
Our management reviews our operating results and makes decisions based upon two reportable segments: North America and Europe. Refer to Note 14 to our Consolidated Financial Statements for further information regarding our operating and reportable segments.
Results of Operations—Year Ended December 31, 2017 Compared with the Year Ended December 31, 2016
Automobile production volumes increased in Europe and decreased in North America during the year ended December 31, 2017 compared to the year ended December 31, 2016. The following table presents production volumes in specified regions according to IHS for the year ended December 31, 2017 compared to the year ended December 31, 2016 (in millions of units produced):
|
|
Europe |
North America |
||||||
|
2017 production volumes |
22.2 | 17.1 | ||||||
|
2016 production volumes |
21.5 | 17.8 | ||||||
|
Increase/(decrease) |
0.7 | (0.7) | ||||||
|
Percentage change |
3 |
% |
(4) |
% |
||||
The following table presents selected financial information for the years ended December 31, 2017 and 2016 (in millions).
|
|
Europe |
North America |
Consolidated |
|||||||||||||||
|
|
Year Ended |
Year Ended |
Year Ended |
|||||||||||||||
|
|
December 31, |
December 31, |
December 31, |
|||||||||||||||
|
|
2017 |
2016 |
2017 |
2016 |
2017 |
2016 |
||||||||||||
|
|
||||||||||||||||||
|
Revenues |
$ |
664.8 |
$ |
639.3 |
$ |
1,323.2 |
$ |
1,274.3 |
$ |
1,988.0 |
$ |
1,913.6 | ||||||
|
Cost of sales |
602.9 | 565.9 | 1,140.6 | 1,109.3 | 1,743.5 | 1,675.2 | ||||||||||||
|
Gross profit |
61.9 | 73.4 | 182.6 | 165.0 | 244.5 | 238.4 | ||||||||||||
|
Selling, general, and administrative expenses |
39.8 | 39.6 | 78.3 | 92.0 | 118.1 | 131.6 | ||||||||||||
|
Amortization expense |
- |
- |
0.4 | 0.4 | 0.4 | 0.4 | ||||||||||||
|
Restructuring and asset impairment charges |
1.9 | 0.1 | 8.8 | 5.3 | 10.7 | 5.4 | ||||||||||||
|
Operating income |
$ |
20.2 |
$ |
33.7 |
$ |
95.1 |
$ |
67.3 | 115.3 | 101.0 | ||||||||
|
Interest expense, net |
13.4 | 21.0 | ||||||||||||||||
|
Other expense |
0.6 | 6.5 | ||||||||||||||||
|
Provision for income taxes |
55.4 | 17.2 | ||||||||||||||||
|
Income / (loss) from discontinued operations, net of tax |
1.9 | (17.0) | ||||||||||||||||
|
Noncontrolling interest, net of taxes |
0.1 | 0.7 | ||||||||||||||||
|
Net income attributable to Tower International, Inc. |
$ |
47.6 |
$ |
38.6 | ||||||||||||||
28
Comparison of Periods – GAAP Analysis of Consolidated Results
Revenues
Total revenues increased during the year ended December 31, 2017 by $74.4 million, or 3.9%, from the year ended December 31, 2016, reflecting primarily higher volume in our North America segment ($53.9 million), favorable foreign exchange ($13.4 million), and favorable pricing ($14.7 million), principally the recovery of higher steel prices in Europe. Revenues were adversely impacted by lower volume in our Europe segment ($7.6 million).
Gross Profit
When we analyze our total gross profit, we separately categorize external factors—volume, product mix, and foreign exchange—from all other factors that impact gross profit, which we refer to as “other factors”. When we refer to “mix” we are referring to the relative composition of revenues and profitability of the products we sell in any given period. When we refer to “pricing and economics” we are referring to (i) the impact of adjustments in the pricing of particular products, which we refer to as product pricing; (ii) the impact of steel price changes, taking into account the component of our product pricing attributable to steel, the cost of steel included in our cost of sales, and the amounts recovered on the sale of offal, which in total we refer to as the net steel impact; and (iii) the impact of inflation and changes in operating costs, such as labor, utilities, and fuel, which we refer to as economics.
Total gross profit increased by $6.1 million from the year ended December 31, 2016 and our gross profit margin decreased from 12.5% during 2016 to 12.3% during 2017. The increase in gross profit reflected higher volume ($16.9 million), favorable foreign exchange ($3.4 million, excluding the impact on depreciation), and favorable product mix ($1.8 million), offset partially by higher fixed costs to support new business ($4.9 million). All other factors were net unfavorable by $11.1 million. Cost of sales was impacted by unfavorable pricing and economics ($26.3 million) and higher launch costs to support new business offset partially by favorable efficiencies ($26.9 million).
Total gross profit was negatively impacted by an increase in the depreciation included in cost of sales from $68.1 million during the year ended December 31, 2016 to $73.5 million during the year ended December 31, 2017, reflecting primarily higher capital spending in 2016 and 2017.
Selling, General, and Administrative Expenses (“SG&A”)
Total SG&A decreased $13.5 million from the year ended December 31, 2016, reflecting primarily lower long-term incentive compensation costs primarily related to non-recurring CEO retirement expenses that were accrued in 2016, lower compensation costs primarily due to restructuring actions described below, and lower depreciation, offset partially by unfavorable foreign exchange.
Restructuring and Asset Impairment Expense
Total restructuring and asset impairment expense increased $5.3 million from the year ended December 31, 2016 which reflects the charges incurred in the North America and Europe segments related to severance charges to reduce corporate overhead and fixed costs. During 2017, we took numerous actions to better align the management teams to the remaining footprint of the continuing operations. These actions included a shift in composition of the executive leadership team as well as certain changes within the Corporate and Regional management teams.
Interest Expense, net
Interest expense, net decreased $7.6 million, or 36.2%, from the year ended December 31, 2016, reflecting primarily favorable non-cash mark-to-market changes of $7.3 million on our derivative financial instruments.
Other Expense
Other expense decreased $5.9 million from the year ended December 31, 2016, reflecting the non-recurrence of costs incurred during 2016 to support a potential divestiture that did not occur. The costs incurred in 2017 related to certain costs incurred to support the amendment of our Term Loan.
Provision for Income Taxes
On December 22, 2017, the U.S. government enacted the Tax Cut and Jobs Act Bill (the “TCJA”). Effective January 1, 2018, the new tax law results in a reduction to the statutory federal income tax rate for U.S. corporate taxable income from 35% to 21%. Upon enactment, we recorded a one-time deferred tax expense of $27.2 million related to the revaluation of our U.S. deferred tax assets. In 2018 and subsequent periods, we expect our worldwide effective tax rate to be significantly lower due to the new U.S. federal tax rate. In addition, the provisions to repeal the corporate alternative minimum tax and allow full expensing of new capital equipment, coupled with the retention of the research tax credit, will enable us to eliminate a material U.S. cash tax liability until at least 2022. We had previously estimated that we would incur a material U.S. cash tax liability in 2020.
29
The new tax law also required a one-time "deemed repatriation" of accumulated foreign earnings for the year ended December 31, 2017. To determine the amount of the deemed repatriation and any associated repatriation tax, we must determine, in addition to other factors, the amount of post-1986 profits or losses of each foreign subsidiary, as well as the amount of foreign income taxes paid on such profits or losses. We have made a reasonable estimate that no transition tax is due; however, this represents a provisional estimate. We are gathering additional information to more precisely compute the amount of our deemed repatriation tax, if any. In future periods, we believe the move to a territorial system exempting the repatriation of post-2017 foreign profits to the U.S. will be neutral to us. In addition, we do not anticipate that the new provisions imposing U.S. taxes on foreign “excess returns” or other minimum tax anti-abuse provisions will materially impact our foreign profits since we have significant tangible assets at our foreign locations.
Income tax expense from continuing operations increased $38.2 million from the year ended December 31, 2016, for an overall effective tax rate of 54.7%. Our adjusted effective rate was 27.8% after excluding the one-time charge of $27.2 million due to the revaluation of our deferred tax assets as described above. Our effective tax rate in 2016 was 23.5%. The effective tax rate increased in 2017 primarily related to a valuation allowance that we recorded in the third quarter of 2017 in one of our European subsidiaries. We continue to record significant research tax credit benefits from new launch activities in the United States.
In 2017, the Internal Revenue Service performed an examination for the 2015 tax year, which was completed in January 2018, resulting in no adjustments. In Germany, we are subject to a tax audit for the years ended December 31, 2013 through December 31, 2015. In conjunction with this audit, we have tentatively agreed to make certain transfer pricing adjustments, for which we already have sufficient reserves recorded.
Noncontrolling Interest, Net of Tax
The adjustment to our earnings required to give effect to the elimination of noncontrolling interests decreased by $0.6 million from the year ended December 31, 2016, reflecting decreased earnings in our consolidated Chinese joint venture during 2017 as a result of the sale in the second quarter of 2017.
Comparison of Periods—Non-GAAP Analysis of Adjusted EBITDA
A reconciliation of net income attributable to Tower International, Inc. to Adjusted EBITDA, for the periods presented is set forth below (in millions):
|
|
Consolidated |
Europe |
North America |
|||||||||||||||
|
|
Year Ended |
Year Ended |
Year Ended |
|||||||||||||||
|
|
December 31, |
December 31, |
December 31, |
|||||||||||||||
|
|
2017 |
2016 |
2017 |
2016 |
2017 |
2016 |
||||||||||||
|
|
||||||||||||||||||
|
Net income attributable to Tower International, Inc. |
$ |
47.6 |
$ |
38.6 | ||||||||||||||
|
Interest expense, net |
13.4 | 21.0 | ||||||||||||||||
|
Other expenses (a) |
0.6 | 6.5 | ||||||||||||||||
|
Provision for income taxes |
55.4 | 17.2 | ||||||||||||||||
|
(Income) / loss from discontinued operations, |
||||||||||||||||||
|
net of tax (b) |
(1.9) | 17.0 | ||||||||||||||||
|
Noncontrolling interest, net of taxes |
0.1 | 0.7 | ||||||||||||||||
|
Operating income |
115.3 | 101.0 |
$ |
20.2 |
$ |
33.7 |
$ |
95.1 |
$ |
67.3 | ||||||||
|
Intercompany charges |
- |
- |
(7.4) | (7.7) | 7.4 | 7.7 | ||||||||||||
|
Restructuring and asset impairment charges, net |
10.7 | 5.4 | 1.9 | 0.1 | 8.8 | 5.3 | ||||||||||||
|
Depreciation and amortization |
77.3 | 72.5 | 30.5 | 28.0 | 46.8 | 44.5 | ||||||||||||
|
Acquisition costs and other |
0.4 | 0.4 | (0.2) |
- |
0.6 | 0.4 | ||||||||||||
|
Long-term compensation (c) |
6.0 | 14.1 | 0.5 | 1.2 | 5.5 | 12.9 | ||||||||||||
|
Pension actuarial loss |
- |
8.3 |
- |
- |
- |
8.3 | ||||||||||||
|
Adjusted EBITDA |
$ |
209.7 |
$ |
201.7 |
$ |
45.5 |
$ |
55.3 |
$ |
164.2 |
$ |
146.4 | ||||||
____________
|
(a) |
The expense recorded in 2016 represents costs incurred to support an investigation into a potential divestiture that did not occur. |
|
(b) |
Represents the (income) / loss on discontinued operations for the years ended 2017 and 2016. Included in 2016 is the $18.1 million fair value adjustment related to the planned sale of the Company’s remaining Brazil and China operations. |
|
(c) |
Represents the compensation expense related to stock options, restricted stock units, one-time CEO compensation awards, and certain compensation programs intended to benefit our long-term success and growth. The compensation charges are incurred during the applicable vesting periods of each program. |
30
The following table presents revenues (a GAAP measure) and Adjusted EBITDA (a non-GAAP measure) for the years ended December 31, 2017 and 2016 (in millions) as well as explanations of variances:
|
|
Europe |
North America |
Consolidated |
|||||||||||||||
|
Revenues |
Adjusted EBITDA(d) |
Revenues |
Adjusted EBITDA(d) |
Revenues |
Adjusted EBITDA(d) |
|||||||||||||
|
2017 results |
$ |
664.8 |
$ |
45.5 |
$ |
1,323.2 |
$ |
164.2 |
$ |
1,988.0 |
$ |
209.7 | ||||||
|
2016 results |
639.3 | 55.3 | 1,274.3 | 146.4 | 1,913.6 | 201.7 | ||||||||||||
|
Variance |
$ |
25.5 |
$ |
(9.8) |
$ |
48.9 |
$ |
17.8 |
$ |
74.4 |
$ |
8.0 | ||||||
|
Variance attributable to: |
||||||||||||||||||
|
Volume and mix |
$ |
(7.6) |
$ |
0.2 |
$ |
53.9 |
$ |
13.6 |
$ |
46.3 |
$ |
13.8 | ||||||
|
Foreign exchange |
13.4 | 2.3 |
- |
- |
13.4 | 2.3 | ||||||||||||
|
Pricing and economics |
19.7 | (16.8) | (5.0) | (7.8) | 14.7 | (24.6) | ||||||||||||
|
Efficiencies |
- |
9.1 |
- |
17.8 |
- |
26.9 | ||||||||||||
|
Selling, general, and administrative expenses and other items(e) |
- |
(4.6) |
- |
(5.8) |
- |
(10.4) | ||||||||||||
|
Total |
$ |
25.5 |
$ |
(9.8) |
$ |
48.9 |
$ |
17.8 |
$ |
74.4 |
$ |
8.0 | ||||||
(d) We have presented a reconciliation of net income attributable to Tower International, Inc. to Adjusted EBITDA above.
(e) When we refer to “selling, general, and administrative expenses and other items”, the “other items” refer to (i) savings which we generate after implementing restructuring actions, (ii) the costs associated with launching new products, and (iii) one-time items which may include reimbursement of costs.
Adjusted EBITDA
When we analyze Adjusted EBITDA, we separately categorize external factors—volume, product mix, and foreign exchange—and all other factors which impact Adjusted EBITDA, which we refer to as “other factors.”
Consolidated Company: Consolidated Adjusted EBITDA increased by $8 million, or 4.0%, from the year ended December 31, 2016, reflecting primarily higher volume and mix ($13.8 million) and favorable foreign exchange ($2.3 million). Volume and mix consisted of higher volume ($16.9 million) and favorable mix ($1.8 million) offset partially by higher fixed costs to support new business ($4.9 million). All other factors were net unfavorable by $8.1 million. Unfavorable pricing and economics ($24.6 million) and unfavorable SG&A expenses and other items ($10.4 million), reflecting primarily higher launch costs to support new business, were offset partially by favorable efficiencies ($26.9 million).
Europe Segment: In our Europe segment, Adjusted EBITDA decreased by $9.8 million, or 17.7%, from the year ended December 31, 2016, despite favorable foreign exchange ($2.3 million) and favorable volume and mix ($0.2 million). Volume and mix consisted of favorable product mix ($2.4 million) which was offset partially by lower volume ($2.2 million). All other factors were net unfavorable by $12.3 million. Unfavorable pricing and economics ($16.8 million), principally product pricing and labor costs, and unfavorable SG&A and other items ($4.6 million), were offset partially by favorable efficiencies ($9.1 million). The unfavorable SG&A and other items reflected primarily higher launch costs to support new business.
North America Segment: In our North America segment, Adjusted EBITDA increased by $17.8 million, or 12.2%, from the year ended December 31, 2016, reflecting primarily higher volume and mix ($13.6 million), which consisted of higher volumes ($19.1 million) offset partially by higher fixed costs to support new business ($4.9 million) and unfavorable product mix ($0.6 million). All other factors were net favorable by $4.2 million. Favorable efficiencies ($17.8 million) were offset partially by unfavorable pricing and economics ($7.8 million), principally product pricing and labor costs, and unfavorable SG&A expenses and other items ($5.8 million), principally higher launch costs to support new business.
31
Results of Operations—Year Ended December 31, 2016 Compared with the Year Ended December 31, 2015
Automobile production volumes increased during the year ended December 31, 2016 in both of our major markets compared to the year ended December 31, 2015. The following table presents production volumes in specified regions according to IHS for the year ended December 31, 2016 compared to the year ended December 31, 2015 (in millions of units produced):
|
|
Europe |
North |
||||||
|
2016 production volumes |
21.5 | 17.8 | ||||||
|
2015 production volumes |
20.9 | 17.5 | ||||||
|
Increase/(decrease) |
0.6 | 0.3 | ||||||
|
Percentage change |
3 |
% |
2 |
% |
||||
The following table presents select financial information for the years ended December 31, 2016 and 2015 (in millions).
|
|
Europe |
North America |
Consolidated |
|||||||||||||||
|
|
Year Ended |
Year Ended |
Year Ended |
|||||||||||||||
|
|
December 31, |
December 31, |
December 31, |
|||||||||||||||
|
|
2016 |
2015 |
2016 |
2015 |
2016 |
2015 |
||||||||||||
|
|
||||||||||||||||||
|
Revenues |
$ |
639.3 |
$ |
652.6 |
$ |
1,274.3 |
$ |
1,143.5 |
$ |
1,913.6 |
$ |
1,796.1 | ||||||
|
Cost of sales |
565.9 | 579.6 | 1,109.3 | 998.6 | 1,675.2 | 1,578.2 | ||||||||||||
|
Gross profit |
73.4 | 73.0 | 165.0 | 144.9 | 238.4 | 217.9 | ||||||||||||
|
Selling, general, and administrative expenses |
39.6 | 36.4 | 92.0 | 88.1 | 131.6 | 124.5 | ||||||||||||
|
Amortization |
- |
- |
0.4 | 0.2 | 0.4 | 0.2 | ||||||||||||
|
Restructuring and asset impairments |
0.1 | 0.2 | 5.3 | 7.6 | 5.4 | 7.8 | ||||||||||||
|
Operating income |
$ |
33.7 |
$ |
36.4 |
$ |
67.3 |
$ |
49.0 | 101.0 | 85.3 | ||||||||
|
Interest expense, net |
21.0 | 23.7 | ||||||||||||||||
|
Other expense |
6.5 |
- |
||||||||||||||||
|
Provision / (benefit) for income taxes |
17.2 | (123.8) | ||||||||||||||||
|
Income / (loss) from discontinued operations, net of tax |
(17.0) | 10.3 | ||||||||||||||||
|
Noncontrolling interest, net of taxes |
0.7 | 1.7 | ||||||||||||||||
|
Net income attributable to Tower International, Inc. |
$ |
38.6 |
$ |
194.1 | ||||||||||||||
Comparison of Periods – GAAP Analysis of Consolidated Results
Revenues
Total revenues increased during the year ended December 31, 2016 by $117.5 million, or 6.5%, from the year ended December 31, 2015, reflecting primarily higher volume in our North America segment ($145.6 million) and in our Europe segment ($2.5 million). Revenues were adversely impacted by unfavorable pricing ($30.1 million), and unfavorable foreign exchange ($0.5 million).
Gross Profit
Total gross profit increased by $20.5 million from the year ended December 31, 2015 and our gross profit margin increased from 12.1% during 2015 to 12.5% during 2016. The increase in gross profit reflected higher volume ($26.3 million), offset partially by unfavorable product mix ($6.5 million) and unfavorable foreign exchange ($1.3 million). All other factors were net favorable by $2 million. Cost of sales was positively impacted by favorable efficiencies ($28.7 million). These factors were offset partially by unfavorable pricing and economics ($20 million), and higher launch costs ($3.5 million).
Total gross profit was negatively impacted by an increase in the depreciation included in cost of sales from $67.5 million during the year ended December 31, 2015 to $68.1 million during the year ended December 31, 2016.
Selling, General, and Administrative Expenses (“SG&A”)
Total SG&A increased $7.1 million from the year ended December 31, 2015, reflecting primarily higher engineering costs to support new business.
32
Restructuring and Asset Impairment Expense
Total restructuring and asset impairment expense decreased $2.4 million from the year ended December 31, 2015. During 2016, we incurred charges in the North America segment related to the buyout of a lease on a previously closed facility, ongoing maintenance and lease exit costs of facilities closed as a result of prior actions, and severance charges to reduce fixed costs. During 2015, we incurred charges in the North America segment related to a liability established to reflect a change in estimated future rents on a previously closed facility, ongoing maintenance and expense of facilities closed as a result of prior actions, and severance charges to reduce fixed costs.
Interest Expense, net
Interest expense, net decreased $2.7 million, or 11.4%, from the year ended December 31, 2015, reflecting primarily lower expense on our Term Loan of $2.5 million.
Other Expense
Other expense increased $6.5 million from the year ended December 31, 2015, reflecting the costs incurred to support a potential divestiture that did not occur.
Provision for Income Taxes
Income tax expense / (benefit) from continuing operations increased $141 million from the year ended December 31, 2015. In 2015, the Company recorded a one-time deferred tax benefit of $131 million by releasing valuation allowances on U.S. and Italy deferred tax assets. After excluding the 2015 deferred tax benefit, income tax expense increased $7.2 million in 2016 primarily due to increased profitability. Our worldwide effective tax rate was 23.5%. In the United States our effective rate was approximately 23.9%, which is lower than the U.S. statutory rate of 35% primarily because of the benefit of Federal research tax credits generated in 2016. In foreign jurisdictions our effective tax rate was approximately 23% primarily attributable to lower statutory rates.
The availability of U.S. net operating loss carryforwards generated in 2007-2013 has enabled the Company to effectively eliminate our U.S. cash tax liability, except for some immaterial amounts for U.S. alternative minimum tax and state income taxes. We are also generating significant Federal research credits from new U.S. launch activities.
In 2016, the Internal Revenue Service completed the examination of the Company for tax years 2011-2013. Also in 2016 the German Federal Fiscal Court ruled against the Company's appeal of disallowed interest deductions taken in tax years 2004 and 2005. The court ruled the interest payments made by our Germany subsidiary to its parent were non-deductible dividends. The Company was fully reserved for its tax position.
Noncontrolling Interest, Net of Tax
The adjustment to our earnings required to give effect to the elimination of noncontrolling interests decreased by $1 million from the year ended December 31, 2015, reflecting decreased earnings in our consolidated Chinese joint venture during 2016.
33
Comparison of Periods—Non-GAAP Analysis of Adjusted EBITDA
A reconciliation of Adjusted EBITDA to net income / (loss) attributable to Tower International, Inc. for the periods presented is set forth below (in millions):
|
|
Consolidated |
Europe |
North America |
|||||||||||||||
|
|
Year Ended |
Year Ended |
Year Ended |
|||||||||||||||
|
|
December 31, |
December 31, |
December 31, |
|||||||||||||||
|
|
2016 |
2015 |
2016 |
2015 |
2016 |
2015 |
||||||||||||
|
|
||||||||||||||||||
|
Net income attributable to Tower International, Inc. |
$ |
38.6 | 194.1 | |||||||||||||||
|
Interest expense, net |
21.0 | 23.7 | ||||||||||||||||
|
Other expenses (a) |
6.5 |
- |
||||||||||||||||
|
Provision for income taxes |
17.2 | (123.8) | ||||||||||||||||
|
Income / (loss) from discontinued operations, |
||||||||||||||||||
|
net of tax (b) |
17.0 | (10.3) | ||||||||||||||||
|
Noncontrolling interest, net of taxes |
0.7 | 1.7 | ||||||||||||||||
|
Operating income |
101.0 | 85.3 |
$ |
33.7 |
$ |
36.4 |
$ |
67.3 |
$ |
49.0 | ||||||||
|
Intercompany charges |
- |
- |
(7.7) | (6.3) | 7.7 | 6.3 | ||||||||||||
|
Restructuring and asset impairments |
5.4 | 7.8 | 0.1 | 0.2 | 5.3 | 7.6 | ||||||||||||
|
Depreciation and amortization |
72.5 | 72.5 | 28.0 | 26.4 | 44.5 | 46.1 | ||||||||||||
|
Acquisition costs and other |
0.4 | 0.8 |
- |
0.4 | 0.4 | 0.4 | ||||||||||||
|
Long-term compensation (c) |
14.1 | 12.7 | 1.2 |
- |
12.9 | 12.7 | ||||||||||||
|
Pension actuarial loss |
8.3 | 9.1 |
- |
- |
8.3 | 9.1 | ||||||||||||
|
Adjusted EBITDA |
$ |
201.7 |
$ |
188.3 |
$ |
55.3 |
$ |
57.1 |
$ |
146.4 |
$ |
131.2 | ||||||
____________
|
(a) |
Represents costs incurred to support a potential divestiture that did not occur. |
|
(b) |
Represents the income / (loss) on discontinued operations for the years ended 2016 and 2015. Included in 2016 is the $18.1 million fair value adjustment related to the planned sale of the Company’s remaining Brazil and China operations. Included in 2015 is the gain on the sale of China joint ventures ($19 million, net). |
|
(c) |
Represents the compensation expense related to stock options, restricted stock units, one-time CEO compensation awards, and certain compensation programs intended to benefit our long-term success and growth. The compensation charges are incurred during the applicable vesting periods of each program. |
34
The following table presents revenues (a GAAP measure) and Adjusted EBITDA (a non-GAAP measure) for the years ended December 31, 2016 and 2015 (in millions) as well as an explanation of variances:
|
|
Europe |
North America |
Consolidated |
|||||||||||||||
|
Revenues |
Adjusted EBITDA(f) |
Revenues |
Adjusted EBITDA(f) |
Revenues |
Adjusted EBITDA(f) |
|||||||||||||
|
2016 results |
$ |
639.3 |
$ |
55.3 |
$ |
1,274.3 |
$ |
146.4 |
$ |
1,913.6 |
$ |
201.7 | ||||||
|
2015 results |
652.6 |
$ |
57.1 |
$ |
1,143.5 |
$ |
131.2 | 1,796.1 | 188.3 | |||||||||
|
Variance |
$ |
(13.3) |
$ |
(1.8) |
$ |
130.8 |
$ |
15.2 |
$ |
117.5 |
$ |
13.4 | ||||||
|
Variance attributable to: |
||||||||||||||||||
|
Volume and mix |
$ |
2.5 |
$ |
(4.5) |
$ |
145.6 |
$ |
24.3 |
$ |
148.1 |
$ |
19.8 | ||||||
|
Foreign exchange |
(0.5) | 0.4 |
- |
- |
(0.5) | 0.4 | ||||||||||||
|
Pricing and economics |
(15.3) | (8.8) | (14.8) | (14.8) | (30.1) | (23.6) | ||||||||||||
|
Efficiencies |
- |
13.8 |
- |
14.9 |
- |
28.7 | ||||||||||||
|
Selling, general, and administrative expenses and other items(g) |
- |
(2.7) |
- |
(9.2) |
- |
(11.9) | ||||||||||||
|
Total |
$ |
(13.3) |
$ |
(1.8) |
$ |
130.8 |
$ |
15.2 |
$ |
117.5 |
$ |
13.4 | ||||||
(f) We have presented a reconciliation of net income attributable to Tower International, Inc. to Adjusted EBITDA above.
(g) When we refer to “selling, general, and administrative expenses and other items”, the “other items” refer to (i) savings which we generate after implementing restructuring actions, (ii) the costs associated with launching new products, and (iii) one-time items which may include reimbursement of costs.
Adjusted EBITDA
When we analyze Adjusted EBITDA, we separately categorize external factors—volume, product mix, and foreign exchange—and all other factors which impact Adjusted EBITDA, which we refer to as “other factors.”
Consolidated Company: Consolidated Adjusted EBITDA increased by $13.4 million, or 7.1%, from the year ended December 31, 2015, reflecting primarily higher volume ($26.3 million) and favorable foreign exchange ($0.4 million), offset partially by unfavorable product mix ($6.5 million). All other factors were net unfavorable by $6.8 million. Unfavorable pricing and economics ($23.6 million) and unfavorable SG&A expenses and other items ($11.9 million), reflecting primarily higher engineering costs and launch costs to support new business, were offset partially by favorable efficiencies ($28.7 million).
Europe Segment: In our Europe segment, Adjusted EBITDA decreased by $1.8 million, or 3.2%, from the year ended December 31, 2015, reflecting the unfavorable product mix ($3.5 million) and unfavorable volume ($1 million), offset partially by favorable foreign exchange ($0.4 million). All other factors were net favorable by $2.3 million. Favorable efficiencies ($13.8 million) were offset partially by unfavorable pricing and economics ($8.8 million), principally product pricing and labor costs, and unfavorable SG&A and other items ($2.7 million).
North America Segment: In our North America segment, Adjusted EBITDA increased by $15.2 million, or 11.6%, from the year ended December 31, 2015, reflecting primarily higher volumes ($27.3 million), offset partially by unfavorable product mix ($3 million). All other factors were net unfavorable by $9.1 million. Unfavorable pricing and economics ($14.8 million), principally product pricing and labor costs, and unfavorable SG&A expenses and other items ($9.2 million), principally higher engineering costs and higher launch costs to support new business, were offset partially by favorable efficiencies ($14.9 million).
Restructuring and Asset Impairments
The following table sets forth our net restructuring and asset impairment charges by type for the periods presented (in millions):
|
|
Year Ended December 31, |
|||||||||
|
|
2017 |
2016 |
2015 |
|||||||
|
Employee termination costs |
$ |
9.5 |
$ |
0.8 |
$ |
0.3 | ||||
|
Other exit costs |
1.2 | 4.6 | 7.5 | |||||||
|
Total restructuring and asset impairment charges, net |
$ |
10.7 |
$ |
5.4 |
$ |
7.8 | ||||
35
We restructure our global operations in an effort to align our capacity with demand and to reduce our costs. Restructuring costs include employee termination benefits and other incremental costs resulting from restructuring activities. These incremental costs principally include equipment and personnel relocation costs. Restructuring costs are recognized in our Consolidated Financial Statements in accordance with FASB ASC No. 420, Exit or Disposal Obligations, and are presented in our Consolidated Statements of Operations as restructuring and asset impairment charges, net. We believe the restructuring actions discussed below will help our efficiency and results of operations on a going forward basis.
The charges incurred in the North America and Europe segments related to severance charges to reduce corporate overhead and fixed costs. During 2017, we took numerous actions to better align the management teams to the remaining footprint of the continuing operations. These actions included a shift in composition of the executive leadership team as well as certain changes within the Corporate and Regional management teams.
The charges incurred in the North America segment during 2016 related to the buyout of a lease on a previously closed facility, ongoing maintenance expense of facilities closed as a result of prior actions and severance charges to reduce fixed costs. The charges incurred in the Europe segment related to severance charges to reduce fixed costs and a revision of a previous estimate.
The charges incurred in our North America segment during 2015 related to a liability established to reflect a change in estimated future rents on a previously closed facility, ongoing maintenance expense of facilities closed as a result of prior actions and severance charges to reduce fixed costs. The charges incurred in the Europe segment related to severance charges to reduce fixed costs and a revision of a previous estimate.
Liquidity and Capital Resources
General
We generally expect to fund expenditures for operations, administrative expenses, capital expenditures, and debt service obligations with internally generated funds from operations and we generally expect to satisfy working capital needs from time-to-time with borrowings under our revolving credit facility or cash on hand. As of December 31, 2017, we had available liquidity of approximately $370 million, which we believe is adequate to fund our working capital requirements for at least the next twelve months. We believe that we will be able to meet our debt service obligations and fund operating requirements for at least the next twelve months with cash flow from operations, cash on hand, potential operating lease arrangements, and borrowings under our revolving credit facility.
On June 17, 2016, we announced our Board of Directors’ authorization to repurchase up to $100 million of the Company’s issued and outstanding common stock from time to time in the open market, or in privately negotiated transactions. We expect to fund such repurchases from cash flow from operations, cash on hand, asset dispositions, and borrowings under our revolving credit facility. To date, the Company repurchased a total of 829,648 shares of common stock at an aggregate cost of $18.9 million; all such purchases occurred during the year ended December 31, 2016.
Cash Flows and Working Capital
The following table shows the components of our cash flows from continuing operations for the periods presented (in millions):
|
|
Year Ended December 31, |
||||||||
|
|
2017 |
2016 |
2015 |
||||||
|
Net cash provided by / (used in): |
|||||||||
|
Operating activities |
$ |
164.7 |
$ |
137.7 |
$ |
101.4 | |||
|
Investing activities |
(88.2) | (111.7) | (141.5) | ||||||
|
Financing activities |
(20.1) | (83.2) | (11.5) | ||||||
Net Cash Provided by Operating Activities
During the year ended December 31, 2017, we generated $164.7 million of cash flow from operations, compared with $137.7 million during the year ended December 31, 2016. The primary reasons for this increase were increased pre-tax earnings and a favorable net tooling position.
During the year ended December 31, 2016, we generated $137.7 million of cash flow from operations, compared with $101.4 million during the year ended December 31, 2015. The primary reasons for this increase were increased pre-tax earnings and a favorable fluctuation in working capital which resulted from favorable term changes from some of our customers.
36
Net Cash Used in Investing Activities
Net cash utilized in investing activities was $88.2 million during 2017, compared to $111.7 million during 2016. The $23.5 million change in cash used reflects decreased capital expenditures, related primarily to the timing of program launches, and the proceeds received from the sale of a China joint venture.
Net cash utilized in investing activities was $111.7 million during 2016, compared to $141.5 million during 2015. The $29.8 million change in cash used reflects decreased capital expenditures, related primarily to the timing of program launches, cash used in 2015 to fund the acquisition of a facility in Mexico, and proceeds received from the sale of a China joint venture.
Net Cash Used In Financing Activities
Net cash used in financing activities was $20.1 million during 2017 compared to $83.2 million during 2016. The $63.1 million change was attributable primarily to the non-recurrence of a $50 million repayment on the Term Loan Credit facility during the first quarter of 2016 and lower treasury stock purchases during 2017.
Net cash used in financing activities was $83.2 million during 2016, compared to $11.5 million during 2015. The $71.7 million change was attributable primarily to net repayment of borrowings, purchase of treasury stock, dividend payments, and the non-recurrence of swap proceeds received in 2015.
Working Capital
We manage our working capital by monitoring key metrics principally associated with inventory, accounts receivable, and accounts payable. Our quarterly average inventory days on hand remained at 17 days during the fourth quarter of 2016 and the fourth quarter of 2017; however our inventory increased from $71.7 million at December 31, 2016 to $78.7 million at December 31, 2017, reflecting primarily the ramp up of production on recently awarded business and favorable foreign exchange.
Our accounts receivable balance increased from $178.3 million as of December 31, 2016 to $239.3 million as of December 31, 2017. The increased accounts receivable reflects primarily higher revenues and the change of receivables related to customer-owned tooling.
Our accounts payable balance increased from $258.1 million as of December 31, 2016 to $323.3 million as of December 31, 2017. The change reflects primarily higher revenues and the change of payables related to customer-owned tooling.
Our working capital usage is seasonal in nature. During the first half of the year, production and sales typically increase substantially, which causes our working capital to increase because our accounts receivable and inventory increase. In addition, we make our annual incentive bonus plan payments during the second quarter. In the second half of the year, production and sales typically decline as a result of scheduled customer shutdowns. The lower production and sales generally results in a reduction of accounts receivables and inventory, which decreases our working capital.
Our working capital is also impacted by our net position in regard to tooling owned by our customers. Tooling costs represent costs incurred by us in the development of new tooling used in the manufacture of our products. Generally, when a customer awards a contract to us, the customer agrees to reimburse us for certain of our tooling costs. As the tooling is developed, we experience cash outflows because we bear the costs and we typically do not receive reimbursement from our customers until the manufacture of the particular program commences. This timing delay causes our working capital to fluctuate between periods due to the timing of the cash inflows and outflows. We define our net tooling position as tooling in progress (see Note 3 of our Consolidated Financial Statements) plus accounts receivable related to tooling less accounts payable related to tooling. During 2017 our net tooling position decreased by $41 million from $77 million at December 31, 2016 to $36 million at December 31, 2017. This decrease reflects reimbursements from customers that exceeded spending on customer-owned tooling.
On December 31, 2017 and 2016, we had working capital balances of $41 million and $9.4 million, respectively. This increase reflects primarily positive cash generated in 2017 primarily due to higher earnings and a favorable net tooling position.
Sources and Uses of Liquidity
Our available liquidity at December 31, 2017 was $369.7 million, which consisted of $123.7 million of cash on hand, and unutilized borrowing availability under our U.S. and foreign credit facilities of $192 million and $54 million, respectively. A portion of our cash balance ($53.4 million) is located at foreign subsidiaries and is presently being used to fund operations at and investment in those locations. As of December 31, 2016 and 2015, we had available liquidity of approximately $292.2 million and $350.6 million, respectively, excluding the cash and unutilized borrowing availability at our discontinued operations.
As of December 31, 2017, we had short-term debt, excluding capital leases, of $36.5 million, of which $32.9 million related to receivables factoring in Europe and $3.6 million related to current maturities of our Term Loan Credit Facility. The receivables factoring
37
in Europe consists of uncommitted demand facilities, which are subject to termination at the discretion of the banks, although we have not experienced any terminations by the banks. We believe that we will be able to continue the receivables factoring in Europe.
We are currently experiencing organic growth well above industry as a result of major new business awards primarily in North America. To fund this growth, we continue to incur significant capital investment requirements for the purchase and installation of the machinery and equipment necessary to manufacture the awarded products. We have entered into operating leases to assist with a portion of the funding requirements for the related capital investments. We believe that these operating leases provide a diversified capital source for financing the capital investment requirements at competitive rates in relation to our existing debt arrangements and help to maintain our strong liquidity profile. These leasing arrangements bear a weighted average fixed interest rate of 5.4%.
Pursuant to the Board of Directors’ declaration on October 16, 2015, the Company commenced payment of a quarterly dividend of $0.10 per common share. This dividend was raised to $0.11 per common share on October 20, 2016 and to $0.12 per common share on October 20, 2017. During the years ended December 31, 2017, 2016, and 2015, the Company paid dividends of $9.2 million, $8.6 million, and $2.1 million, respectively.
As noted above, on June 17, 2016, the Company announced its Board of Directors’ authorization to repurchase up to $100 million of the Company’s issued and outstanding common stock from time to time in the open market, or in privately negotiated transactions. As of December 31, 2017, 829,648 shares have been purchased under the Repurchase Program at an aggregate cost of $18.9 million with no additional shares being purchased under that program during the year ended December 31, 2017.
Free Cash Flow
Free cash flow is a non-GAAP measure. Free cash flow is defined as cash provided by continuing operating activities less cash disbursed for purchases of property, plant, and equipment. We believe this metric provides useful information to our investors because management regularly reviews this metric as an important indicator of how much cash is generated by our normal business operations, net of capital expenditures, and makes decisions based upon this metric. Management also views this metric as a measure of cash available to reduce debt and grow the business. Free cash flow is calculated as follows (in millions):
|
|
Year Ended December 31, |
||||||||
|
|
2017 |
2016 |
2015 |
||||||
|
Net cash provided by continuing operating activities |
$ |
164.7 |
$ |
137.7 |
$ |
101.4 | |||
|
Cash disbursed for purchases of property, plant, and equipment, net |
(104.1) | (116.3) | (119.7) | ||||||
|
Free cash flow |
$ |
60.6 |
$ |
21.4 |
$ |
(18.3) | |||
Free cash flow was $60.6 million during 2017, compared to $21.4 million during 2016. The $39.2 million difference in free cash flow reflects primarily a favorable fluctuation in our net tooling position, higher adjusted EBITDA, and lower capital spending.
Free cash flow was $21.4 million during 2016, compared to $18.3 million utilized during 2015. The $39.7 million difference in free cash flow reflects primarily a favorable fluctuation in working capital, higher adjusted EBITDA, lower capital spending, and favorable net tooling position.
Debt
As of December 31, 2017, we had outstanding indebtedness, excluding capital lease obligations, of approximately $381.2 million, which consisted of the following:
$356.5 million (net of a $2.3 million discount) indebtedness outstanding under our Term Loan Credit Facility
$32.9 million of foreign subsidiary indebtedness
$8.2 million of debt issue costs netted against our indebtedness
Term Loan Credit Facility
On April 23, 2013, we and our subsidiaries, Tower Automotive Holdings USA, LLC, Tower Automotive Holdings I, LLC, Tower Automotive Holdings II (a) LLC, Tower Automotive Holdings II (b) LLC and the domestic subsidiary and domestic affiliate guarantors named therein, entered into a Term Loan and Guaranty Agreement (the “Term Loan Credit Agreement”) whereby we obtained a term loan of $420 million. The maturity date for the initial term loan disbursed under the Term Loan Credit Agreement was April 23, 2020.
On January 31, 2014, we amended the Term Loan Credit Agreement by entering into the Second Refinancing Term Loan Amendment and Additional Term Loan Amendment (the “Second Term Loan Amendment”), pursuant to which, among other things, the outstanding term loans under the Term Loan Credit Agreement were refinanced in full, and additional term loans in an aggregate principal amount of approximately $33 million (the “Additional Term Loans”) were disbursed. After giving effect to the disbursement of the Additional
38
Term Loans, there were term loans (the “Term Loans”) in the aggregate principal amount of $450 million outstanding under the Term Loan Credit Agreement. The term loans bear interest at (i) the Alternate Base Rate plus a margin of 2.00% or (ii) the Adjusted LIBO Rate (calculated by multiplying the applicable LIBOR rate by a statutory reserve rate, with a floor of 1.00%) plus a margin of 3.00%.
On March 7, 2017, we amended the Term Loan Credit Agreement by entering into the Third Refinancing Term Loan Amendment and Restatement Agreement (“Third Term Loan Amendment”), pursuant to which, among other things, the outstanding term loans under the Term Loan Credit Agreement were refinanced in full. There were no additional borrowings associated with this refinancing. The aggregate principal amount of $358.9 million was outstanding under the Term Loan Credit Agreement upon amendment. The maturity date of the Term Loan Credit Facility is March 7, 2024 and the Term Loans bear interest at (i) the Alternate Base Rate plus a margin of 1.75% or (ii) the Adjusted LIBO Rate (calculated by multiplying the applicable LIBOR rate by a statutory reserve rate) plus a margin of 2.75%.
Our Term Loan Credit Facility contains customary covenants applicable to certain of our subsidiaries, including a financial covenant (the “Total Net Leverage Ratio”) based on the ratio of Total Net Debt to Consolidated EBITDA (each as defined in the Term Loan Credit Agreement). As of the last day of each fiscal quarter, we are required to maintain a Total Net Leverage Ratio of not more than 3.75 to 1.00 on a rolling four quarter basis. Our financial condition and liquidity would be adversely impacted by the violation of any of our covenants.
Amended Revolving Credit Facility
On March 7, 2017, we entered into a Fourth Amended and Restated Revolving Credit and Guaranty Agreement (“Fourth Amended Revolving Credit Facility Agreement”), by and among Tower Automotive Holdings USA, LLC, the Company, Tower Automotive Holdings I, LLC, Tower Automotive Holdings II(a), LLC, the subsidiary guarantors named therein, the financial institutions from time to time party thereto as Lenders, and JPMorgan Chase Bank, N.A. as Issuing Lender, as Swing Line Lender, and as Administrative Agent for the Lenders.
The Fourth Amended Revolving Credit Facility Agreement amended and restated, in its entirety, the Third Amended Revolving Credit Facility Agreement, dated as of September 17, 2014, by and among the Borrower, its domestic affiliate and domestic subsidiary guarantors named therein, and the lenders party thereto, and the Agent. The Fourth Amended Revolving Credit Facility Agreement provides for a cash flow revolving credit facility (the “Amended Revolving Credit Facility”) in the aggregate amount of up to $200 million. The Fourth Amended Revolving Credit Facility Agreement also provides for the issuance of letters of credit in an aggregate amount not to exceed $30 million, provided that the total amount of credit (inclusive of revolving loans and letters of credit) extended under the Fourth Amended Revolving Credit Facility Agreement is subject to an overall cap, on any date, of $200 million. We may request the issuance of Letters of Credit denominated in Dollars or Euros. As of December 31, 2017, we had no borrowings outstanding under our Amended Revolving Credit Facility and $8 million of letters of credit outstanding under the Fourth Amended Revolving Credit Facility Agreement. Thus, we could have borrowed an additional $192 million under the Fourth Amended Revolving Credit Facility Agreement as of December 31, 2017, calculated as follows (in millions):
|
Total Revolving Credit Commitment |
$ |
200.0 | |
|
Letter of credit outstanding |
(8.0) | ||
|
Availability on Fourth Amended Revolving Credit Facility Agreement |
$ |
192.0 |
Advances under the Amended Revolving Credit Facility bear interest at an alternate base rate plus a base rate margin or LIBOR plus a Eurodollar margin. The applicable margins are determined by the Company’s Total Net Leverage Ratio (as defined in the Fourth Amended Revolving Credit Facility Agreement). As of December 31, 2017, the applicable margins were 1.50% per annum and 2.50% per annum for base rate and LIBOR based borrowings, respectively. Borrowings outstanding under our Amended Revolving Credit Facility may vary significantly from time to time, depending on our cash needs at any given time. Our Amended Revolving Credit Facility matures on March 7, 2022.
Our Amended Revolving Credit Facility Agreement contains customary covenants applicable to certain of our subsidiaries, including financial maintenance covenant ratios requiring the Borrower and the Guarantors to maintain a ratio, as of the last day of any fiscal quarter, of (i) consolidated adjusted EBITDA to consolidated interest charges of not less than 2.75 to 1.00 on a rolling four quarter basis; and (ii) total net debt to consolidated adjusted EBITDA not to exceed 3.50 to 1.00 on a rolling four quarter basis.
Foreign Subsidiary Indebtedness
Our foreign subsidiary indebtedness consists primarily of borrowings in Europe and receivables factoring in Europe, which is described above.
39
Capital and Operating Leases
We maintain capital leases primarily for a manufacturing facility and certain manufacturing equipment. We have several operating leases, including leases for office and manufacturing facilities, as well as certain equipment, with lease terms expiring between the years 2018 and 2026. As of December 31, 2017, our total future operating lease payments amounted to $170.1 million. The present value of minimum lease payments under our capital leases amounted to $5.5 million. As of December 31, 2017, we were committed to making lease payments during 2018 of not less than $35.1 million on our operating leases and not less than $5.6 million on our capital leases.
Beginning in 2019, FASB ASC No. 842, Leases, will change the financial reporting for leases. Certain of our manufacturing equipment leases currently classified as operating leases will be considered financing leases under the new standard which will require us to record the right of use asset as additional property, plant, and equipment and the associated liability as lease debt. As of December 31, 2017 the associated liability from these leases would have been approximately $72 million.
In addition, we have numerous real estate and equipment leases currently classified as operating that we believe will continue to be classified as operating under the new standard. We expect that the right of use assets and liabilities associated with these leases will be material, but have not yet quantified the total balance sheet impact for these leases.
Capital Expenditures
In general, we are awarded new automotive business two to three years prior to the launch of a particular program. During the pre-launch period, we typically invest significant resources in the form of capital expenditures for the purchase and installation of the machinery and equipment necessary to manufacture the awarded products. Some of our recent major awards in 2016 and 2015 have been on a more accelerated timing and have launched approximately six months after being awarded. Capital expenditures for the years ended December 31, 2017 and 2016 were $104.1 million and $116.3 million, respectively. The decrease reflects primarily the timing of customer program launches. Our capital spending for 2018 is expected to be approximately $150 million. In addition to this capital spending, we expect to fund approximately $75 - $85 million of incremental machinery and equipment purchases through leases over the next two years.
Off-Balance Sheet Obligations
In addition to the operating leases described above, our off-balance sheet obligations consist of obligations under our Third Amended Revolving Credit Facility. As of December 31, 2017, letters of credit outstanding were $8 million under our Fourth Amended Revolving Credit Facility.
Covenants
As of December 31, 2017, the Company was in compliance with all financial covenants that govern its credit agreements.
Net Debt
Net debt is a non-GAAP financial measure that represents total debt less cash and cash equivalents. We believe that the presentation of net debt provides useful information because we understand that our investors perceive net debt as part of the management of our overall liquidity, financial flexibility, capital structure and leverage. Furthermore, certain debt rating agencies, creditors and credit analysts monitor our net debt as part of their assessments of our business. Net debt is used by management to help assess our exposure to our funding sources and to evaluate future needs for additional liquidity. Our use of the term “net debt” should not be understood to mean that we will use any cash on hand to repay debt. Net debt is calculated as follows (in millions):
|
|
|||||||||
|
|
As of December 31, |
||||||||
|
|
2017 |
2016 |
2015 |
||||||
|
Total debt, including capital leases and net of debt issue costs |
$ |
386.8 |
$ |
390.3 |
$ |
444.6 | |||
|
Less: Cash and cash equivalents |
(123.7) | (62.8) | (121.6) | ||||||
|
Add: Cash attributable to discontinued operations |
- |
- |
8.7 | ||||||
|
Net debt |
$ |
263.1 |
$ |
327.5 |
$ |
331.7 | |||
As of December 31, 2017, our net debt was $263.1 million, compared to $327.5 million as of December 31, 2016. The $64.4 million change reflects primarily favorable free cash flow and cash received from our discontinued operations offset partially by the remittance of dividends to our shareholders and debt issuance costs.
40
As of December 31, 2015, our net debt was $331.7 million. The $4.2 million change from 2015 to 2016 reflects primarily favorable free cash flow and cash received from our discontinued operations offset by our shares purchased as part of our stock buyback program and remittance of dividends to our shareholders.
Contractual Obligations and Commercial Commitments
Our contractual obligations and commercial commitments as of December 31, 2017 are summarized below (in millions):
|
|
|||||||||||||||
|
|
Less than |
After |
|||||||||||||
|
Contractual Obligations |
Total |
1 Year |
2 – 3 Years |
4 – 5 Years |
5 Years |
||||||||||
|
Long-term debt (including current portion): |
|||||||||||||||
|
Term Loan Credit Facility |
$ |
356.5 |
$ |
3.6 |
$ |
7.2 |
$ |
7.2 |
$ |
338.5 | |||||
|
Other subsidiary indebtedness |
32.9 | 32.9 |
- |
- |
- |
||||||||||
|
Cash interest payments |
92.9 | 16.0 | 29.8 | 29.2 | 17.9 | ||||||||||
|
Pension contributions(a) |
48.4 | 6.1 | 14.8 | 14.9 | 12.6 | ||||||||||
|
Expected tax payments(b) |
7.4 | 1.1 | 0.4 | 1.2 | 4.7 | ||||||||||
|
Capital and tooling purchase obligations(c) |
218.8 | 218.8 |
- |
- |
- |
||||||||||
|
Capital lease obligations(d) |
5.6 | 5.6 |
- |
- |
- |
||||||||||
|
Operating leases |
170.1 | 35.1 | 61.9 | 42.4 | 30.7 | ||||||||||
|
Total contractual obligations at December 31, 2017 |
$ |
932.6 |
$ |
319.2 |
$ |
114.1 |
$ |
94.9 |
$ |
404.4 | |||||
___________
(a) Represents expected future contributions required to fund our pension plan, based on current actuarial assumptions.
(b) Represents payments expected to be made to various governmental agencies relating to certain tax positions taken pursuant to
FASB ASC No. 740, Income Taxes.
(c) Represents obligations under executory purchase orders related to capital and tooling expenditures.
(d) Represents principal and interest payments on our capital lease obligations.
Our purchase orders for inventories are based on demand and do not require us to purchase minimum quantities.
Critical Accounting Policies and Estimates
The preparation of our Consolidated Financial Statements in conformity with U.S. GAAP requires us to make estimates and assumptions that affect the reported amounts of our assets and liabilities and disclosure of our contingent assets and liabilities at the date of the Consolidated Financial Statements, as well as the reported amounts of our revenues and expenses during the reporting period. Considerable judgment is often involved in making these estimates and assumptions. Critical estimates are those that require the most difficult, subjective, or complex judgments in the preparation of our financial statements and the accompanying notes. We evaluate these assumptions and estimates on a regular basis and we believe that they are reasonable and appropriate. However, actual results could differ from our estimates and the use of different assumptions could result in significantly different results. The following discussion of accounting estimates is intended to supplement the Summary of Significant Accounting Policies section of Note 3 to our Consolidated Financial Statements. Policies that are excluded from the discussion below are deemed to be either immaterial or not critical for the periods presented in this Annual Report.
Fair Value Measurements
FASB ASC No. 820, Fair Value Measurements, defines fair value as the price that would be received to sell an asset, or paid to transfer a liability, in an orderly transaction between market participants, at the measurement date (an exit price). The exit price is based upon the amount that the holder of the asset or liability would receive or need to pay in an actual transaction or in a hypothetical transaction if an actual transaction does not exist, at the measurement date. In some circumstances, the entry and exit price may be the same; however, they are conceptually different.
Fair value is generally determined based upon quoted market prices in active markets for identical assets or liabilities. If quoted market prices are not available, we use valuation techniques that place greater reliance on observable inputs and less reliance on unobservable inputs. In measuring fair value, we may make adjustments for risks and uncertainties, if a market participant would include such an adjustment in its pricing.
Periodically, the Company uses derivative financial instruments to manage interest rate risk and net investment risk in foreign operations, and to limit exposure of foreign currency fluctuations related to certain intercompany payments. Under FASB ASC No. 815, Derivatives and Hedging, all derivatives are recorded at fair value.
41
At December 31, 2017 and 2016, our derivative financial instruments include interest rate and cross currency swaps. These instruments are recorded in other assets, net or other non-current liabilities in our Consolidated Balance Sheets and the fair value is measured using Level 2 observable inputs such as foreign currency exchange rates, swap rates, cross currency basis swap spreads and interest rate spreads. At December 31, 2017, the foreign currency exchange hedge (net investment hedge of our European subsidiaries) and the interest rate swap had liability fair values of $27 million and $8.9 million respectively. At December 31, 2016, the foreign currency exchange hedge (net investment hedge of our European subsidiaries) had a liability fair value of $5 million. The interest rate swap (not designated for hedge accounting in 2016) had a liability fair value of $2.5 million. Refer to Note 8 to our Consolidated Financial Statements for further information regarding derivatives.
Goodwill
Goodwill represents the excess of the cost of an acquisition over the fair value of net assets acquired. Goodwill is not amortized, but it is tested for impairment on, at a minimum, an annual basis. In accordance with FASB ASC No. 350, Intangibles – Goodwill and Other, a two-step process is utilized in reviewing for impairment. The first step in the process requires the identification of reporting units and comparison of the fair value of each reporting unit to its respective carrying value. We have identified our reporting units as North America and Europe. If the carrying value of a unit is less than its fair value, no impairment is deemed to exist and step two is not necessary. If the carrying value of a unit is greater than its fair value, step two is required. The second step in the impairment review process requires the computation of impairment by comparing the implied fair value of a reporting unit’s goodwill with the carrying amount of its goodwill. In accordance with FASB ASC No. 350, which requires goodwill be tested for impairment annually and at the same time each year, we perform an annual impairment each year at year-end. We will also test goodwill for impairment when an event occurs or circumstances change such that it is reasonably possible that impairment may exist.
The evaluation of goodwill for possible impairment includes estimating the fair market value of each of the reporting units which have goodwill associated with their operations using discounted cash flow and multiples of cash earnings valuation techniques, plus valuation comparisons to recent public sale transactions of similar businesses, if any. These valuation methods require the Company to make estimates and assumptions regarding future operating results, cash flows, changes in working capital and capital expenditures, selling prices, profitability, and the cost of capital. Although the Company believes that the estimates and assumptions used were reasonable, actual results could differ from those estimates and assumptions.
The results of our 2017 and 2016 annual goodwill impairment analysis indicated that the fair values of the Europe and North American reporting units were substantially in excess of their carrying value; thus, no impairment existed at December 31, 2017 or December 31, 2016.
Income Taxes
We account for income taxes under the asset and liability method, which requires the recognition of deferred tax assets and liabilities for the expected future tax consequences of events that have been included in the financial statements. Under this method, deferred tax assets and liabilities are determined based on the differences between the Consolidated Financial Statements and tax basis of assets and liabilities using enacted tax rates in effect for the year in which the differences are expected to reverse. We record net deferred tax assets to the extent we believe that these assets will more likely than not be realized. In making such determination, we consider all available positive and negative evidence, including future reversals of existing taxable temporary differences, projected future taxable income, tax planning strategies and recent financial operations. Valuation allowances have been recorded where it has been determined that it is more likely than not that we will not be able to realize the net deferred tax assets. Previously established valuation allowances are reversed into income when there is compelling evidence, typically three or more consecutive years of cumulative profit or other positive evidence, that the future tax profitability will be sufficient to utilize the deferred tax asset. Due to the significant judgment involved in determining whether deferred tax assets will be realized, the ultimate resolution of these items may be materially different from the previously estimated outcome.
On December 22, 2017, the U.S. government enacted the Tax Cut and Jobs Act Bill. Effective January 1, 2018, the new tax law results in a reduction to the statutory federal income tax rate for U.S. corporate taxable income from 35% to 21%. Upon enactment, we recorded a one-time deferred tax expense of $27.2 million related to the revaluation of our U.S. deferred tax assets. In 2018 and subsequent periods, we expect our worldwide effective tax rate to be significantly lower due to the new U.S. federal tax rate.
Additional changes in tax laws and rates could also affect recorded deferred tax assets and liabilities in the future. Management is not aware of any such changes, other than as described above, that would have a material effect on our results of operations, cash flows, or financial position.
The calculation of our tax liabilities involves dealing with uncertainties in the application of complex tax laws and regulations in a multitude of jurisdictions across our global operations.
42
FASB ASC No. 740, Income Taxes, provides that a tax benefit from an uncertain tax position may be recognized when it is more likely than not that the position will be sustained upon examination, including resolutions of any related appeals or litigation processes, based on the technical merits. FASB ASC No. 740 also provides guidance on measurement, derecognition, classification, interest and penalties, accounting in interim periods, disclosure, and transition.
We recognize tax liabilities in accordance with FASB ASC No. 740 and adjust these liabilities when our judgment changes as a result of the evaluation of new information not previously available. Due to the complexity of some of these uncertainties, the ultimate resolution may result in a payment that is materially different from our current estimate of the tax liabilities. These differences will be reflected as increases or decreases to income tax expense in the period in which they are determined.
Pension and Other Postretirement Benefits
We recognize net actuarial gains or losses in excess of 10% of the greater of the market-related value of the Tower International
Consolidated Pension Plan (the “Pension Plan”) assets or the Pension Plan’s projected benefit obligation (“the corridor”) annually, in the fourth quarter of each fiscal year, or at the date of a measurement event.
The calculations of the projected pension benefit obligation and other postretirement benefits obligation and the associated expenses are based upon certain assumptions made by third party actuaries. These assumptions include, among others, the discount rate, expected long-term rate of return on plan assets, mortality rates, and expected increases in compensation and healthcare costs. Refer to Note 10 to our Consolidated Financial Statements for a description of assumptions made. In accordance with GAAP, actual results that differ from these assumptions are accumulated and amortized over future periods and therefore, generally affect the expense recognized and obligation recorded in future periods. While we believe the current assumptions are appropriate based on available information, significant differences in actual experience or significant changes in assumptions may materially affect the projected pension obligation and other postretirement obligations, as well as the related future expenses.
Our Pension Plan and other postretirement costs are calculated based upon a number of actuarial assumptions, most notably the discount rates used to calculate our projected pension benefit obligations in 2017 and 2016, which were 3.42% and 3.84%, respectively, and the discount rates used in the calculation of our postretirement benefit obligations in 2017 and 2016, which were 3.47% and 3.94%, respectively. The discount rates used in the calculations are established based upon the results of a yield curve analysis performed annually by a third party, which calculates a yield to maturity that mirrors the timing and amounts of future benefit payments. The measurement dates of our post retirement plans are December 31 of each year.
The expected long-term rate of return assumptions are based upon modeling studies completed with the assistance of our actuaries and investment consultants. These models take into account inflation, asset class returns, and bond yields for both domestic and foreign markets. These studies, along with the history of returns for the Pension Plan, indicate that expected future returns, weighted by asset allocation, supported an expected long-term asset return assumption of 7.4% for 2017 and 2016.
Based on our assumptions as of December 31, 2017, a change in the discount rate or the expected long-term rate of return assumptions, holding all other assumptions constant, would have the following impact on our projected pension benefit obligation and net periodic benefit cost on an annual basis (in millions):
|
|
||||||
|
|
Impact on Net |
|||||
|
|
Periodic Benefit Cost |
|||||
|
Increase |
Decrease |
|||||
|
.25% change in discount rate |
$ |
0.3 |
$ |
(0.4) | ||
|
.25% change in expected long-term rate of return |
(0.4) | 0.4 | ||||
|
|
||||||
|
|
Impact on Projected Pension |
|||||
|
|
Benefit Obligation |
|||||
|
Increase |
Decrease |
|||||
|
.25% change in discount rate |
$ |
(6.3) |
$ |
6.6 | ||
Our Pension Plan provides benefits for certain current and former U.S. employees. Benefits under the Pension Plan were frozen in October 2006. We recognized income of $2.9 million during the year ended December 31, 2017. We incurred expenses of $5.6 million during the year ended December 31, 2016, which includes the actuarial pension loss recorded in the fourth quarter of 2016 of $8.3 million. We incurred expenses of $4.6 million during the year ended December 31, 2015, which includes the actuarial pension loss recorded in the fourth quarter of 2015 of $9.1 million. We anticipate that we will have approximately $2.9 million of pension income in
43
2018, excluding any actuarial gain or loss, and we expect to contribute $6.1 million to our Pension Plan in 2018. It is difficult to reliably forecast whether a mark-to-market adjustment for net actuarial gains or losses will be required in 2018 and the amount of such an adjustment, if one is required. Mark-to-market adjustments are primarily driven by events and circumstances beyond our control, including changes in interest rates and the performance of financial markets. To the extent discount rates decrease or the value of our Pension Plan’s investments decrease, mark-to market charges to operations may be recorded during the fourth quarter of 2018, if the actuarial gain or loss is in excess of the corridor.
We anticipate our other post-employment benefit expense to be approximately $0.7 million and we expect to make benefit payments of $0.7 million in 2018. Refer to Note 10 to our Consolidated Financial Statements for further information regarding pension and other postretirement benefits.
Recent Accounting Pronouncements
For information regarding recent accounting pronouncements, refer to Note 2 to our Consolidated Financial Statements.
Item 7A. Quantitative and Qualitative Disclosures about Market Risk
Market risk is the potential loss arising from adverse changes in market rates and prices. We are exposed to market risk throughout the normal course of our business operations due to our purchases of steel, our sales of scrap steel, our ongoing investing and financing activities, and our exposure to foreign currency exchange rates. We have established policies and procedures to govern our management of market risks.
Commodity Pricing Risk
Steel is the primary raw material that we use. We purchase a portion of our steel from certain of our customers through various OEM resale programs. The purchases through customer resale programs have buffered the impact of price swings associated with the procurement of steel. The remainder of our steel purchasing requirements is met through contracts with steel mills. At times, we may be unable to either avoid increases in steel prices or pass through any price increases to our customers. We refer to the “net steel impact” as the combination of the change in steel prices that are reflected in the price of our products, the change in the cost to procure steel from the mill, and the change in our recovery of offal. Our strategy is to be economically neutral to steel pricing by having these factors offset each other. While we strive to achieve a neutral net steel impact, we are not always successful in achieving that goal, in large part due to timing differences. The timing of a change in the price of steel may occur in separate periods and if a change occurs, that change may have a disproportionate effect, within any fiscal period, on our product pricing. Depending upon when a steel price change or offal price change occurs, that change may have a disproportionate effect, within any particular fiscal period, on our product pricing, our steel costs and the results of our sales of offal. Net imbalances in any one particular fiscal period may be reversed in a subsequent fiscal period, although we cannot provide assurances that, or when, these reversals will occur. Over the past several years, we have not experienced a material net impact from these factors.
Interest Rate Risk
At December 31, 2017, we had total debt, excluding capital leases, of $381.2 million (net of a $2.3 million discount and $8.2 million of debt issue costs), consisting of floating rate debt of $195.1 million (51%) and fixed rate debt of $186.1 million (49%) taking into account our $186.1 million variable rate to fixed rate swap (See Note 8 of our Consolidated Financial Statements for further information relating to our swaps). Assuming no changes in the monthly average variable rate debt levels of $232.5 million for the year ended December 31, 2017, we estimate that a hypothetical change of 100 basis points in the LIBOR and alternative base rate would not have a significant impact on interest expense due to the LIBOR floor in our Term Loan.
Foreign Exchange Risk
A significant portion of our revenues is derived from manufacturing operations in Europe. The results of operations and financial condition of our non-United States businesses are principally measured in their respective local currency and translated into U.S. dollars. The effects of foreign currency fluctuations in Europe are mitigated by the fact that expenses are generally incurred in the same currency in which revenues are generated, since we strive to manufacture our products in close proximity to our customers. Nevertheless, the reported income of our foreign subsidiaries will be higher or lower depending on a weakening or strengthening of the U.S. dollar against the respective foreign currencies.
Assets located in our foreign facilities are translated into U.S. dollars at foreign currency exchange rates in effect as of the end of each reporting period. The effect of such translations is reflected as a separate component of consolidated stockholders’ equity. As a result, our consolidated stockholders’ equity will fluctuate, depending upon the weakening or strengthening of the U.S. dollar against the respective foreign currencies.
44
Our strategy for managing currency risk relies primarily upon conducting business in a foreign country in that country’s currency. We may, from time to time, also participate in hedging programs intended to reduce our exposure to currency fluctuations (See Note 8 of our Consolidated Financial Statements for further information relating to our swaps). We believe that the effect of a 100 basis point movement in foreign currency rates against the U.S. dollar would not have materially impacted the results of our operations, our cash flows, or our stockholders’ equity for the year ended December 31, 2017.
Inflation
Despite recent declines, we have experienced a continued rise over time in inflationary pressures impacting certain commodities, such as petroleum-based products, ferrous metals, base metals, and certain chemicals. Additionally, because we purchase various types of equipment, raw materials, and component parts from our suppliers, we may be adversely impacted by their inability to adequately mitigate inflationary, industry, or economic pressures. The overall condition of our supply base may possibly lead to delivery delays, production issues, or delivery of non-conforming products by our suppliers in the future. As such, we continue to monitor our vendor base for the best sources of supply and we continue to work with those vendors and customers to mitigate the impact of inflationary pressures.
45
Item 8. Financial Statements and Supplementary Data
Index to Consolidated Financial Statements and Supplementary Data
|
|
|
Form 10-K Page |
Audited Financial Statements for the Three Years Ended December 31, 2017:
46
REPORT OF INDEPENDENT REGISTERED PUBLIC ACCOUNTING FIRM
To the Stockholders and the Board of Directors of
Tower International, Inc.
Livonia, MI
Opinion on the Financial Statements
We have audited the accompanying consolidated balance sheets of Tower International, Inc. and subsidiaries (the "Company") as of December 31, 2017 and 2016, the related consolidated statements of operations, comprehensive income / (loss), equity / (deficit), and cash flows for each of the three years in the period ended December 31, 2017, and the related notes and the schedule listed in the Index at Item 15 (collectively referred to as the "financial statements"). In our opinion, the financial statements present fairly, in all material respects, the financial position of the Company as of December 31, 2017 and 2016, and the results of its operations and its cash flows for each of the three years in the period ended December 31, 2017, in conformity with accounting principles generally accepted in the United States of America.
We have also audited, in accordance with the standards of the Public Company Accounting Oversight Board (United States) (PCAOB), the Company's internal control over financial reporting as of December 31, 2017, based on the criteria established in Internal Control — Integrated Framework (2013) issued by the Committee of Sponsoring Organizations of the Treadway Commission and our report dated February 28, 2018 expressed an unqualified opinion on the Company's internal control over financial reporting.
Basis for Opinion
These financial statements are the responsibility of the Company's management. Our responsibility is to express an opinion on the Company's financial statements based on our audits. We are a public accounting firm registered with the PCAOB and are required to be independent with respect to the Company in accordance with the U.S. federal securities laws and the applicable rules and regulations of the Securities and Exchange Commission and the PCAOB.
We conducted our audits in accordance with the standards of the PCAOB. Those standards require that we plan and perform the audit to obtain reasonable assurance about whether the financial statements are free of material misstatement, whether due to error or fraud. Our audits included performing procedures to assess the risks of material misstatement of the financial statements, whether due to error or fraud, and performing procedures that respond to those risks. Such procedures included examining, on a test basis, evidence regarding the amounts and disclosures in the financial statements. Our audits also included evaluating the accounting principles used and significant estimates made by management, as well as evaluating the overall presentation of the financial statements. We believe that our audits provide a reasonable basis for our opinion.
/s/ DELOITTE & TOUCHE LLP
Detroit, MI
February 28, 2018
We have served as the Company’s auditor since 2002.
47
TOWER INTERNATIONAL, INC. AND SUBSIDIARIES
CONSOLIDATED BALANCE SHEETS
(Amounts in thousands, except share data)
|
|
December 31, |
December 31, |
|||
|
|
2017 |
2016 |
|||
|
|
|||||
|
ASSETS |
|||||
|
Cash and cash equivalents |
$ |
123,688 |
$ |
62,788 | |
|
Accounts receivable, net of allowance of $1,385 and $961 |
239,319 | 178,251 | |||
|
Inventories (Note 3) |
78,745 | 71,710 | |||
|
Assets held for sale (Note 6) |
44,250 | 102,252 | |||
|
Prepaid tooling, notes receivable, and other |
78,481 | 103,023 | |||
|
Total current assets |
564,483 | 518,024 | |||
|
|
|||||
|
Property, plant, and equipment, net |
535,272 | 465,569 | |||
|
Goodwill (Note 3) |
63,665 | 56,383 | |||
|
Deferred tax asset |
83,035 | 112,645 | |||
|
Other assets, net |
13,642 | 9,902 | |||
|
Total assets |
$ |
1,260,097 |
$ |
1,162,523 | |
|
|
|||||
|
LIABILITIES AND EQUITY |
|||||
|
Short-term debt and current maturities of capital lease obligations (Note 7) |
$ |
42,048 |
$ |
34,211 | |
|
Accounts payable |
323,271 | 258,129 | |||
|
Accrued liabilities |
113,949 | 114,079 | |||
|
Liabilities held for sale (Note 6) |
17,336 | 53,310 | |||
|
Total current liabilities |
496,604 | 459,729 | |||
|
|
|||||
|
Long-term debt, net of current maturities (Note 7) |
344,738 | 351,232 | |||
|
Obligations under capital leases, net of current maturities (Note 7) |
- |
4,863 | |||
|
Deferred tax liability |
4,807 | 5,594 | |||
|
Pension liability (Note 10) |
47,813 | 61,627 | |||
|
Other non-current liabilities |
96,263 | 65,539 | |||
|
Total non-current liabilities |
493,621 | 488,855 | |||
|
Total liabilities |
990,225 | 948,584 | |||
|
Commitments and contingencies (Note 15) |
|||||
|
|
|||||
|
Stockholders' equity: |
|||||
|
Tower International, Inc.'s stockholders' equity |
|||||
|
Preferred stock, $0.01 par value, 50,000,000 authorized and 0 issued and outstanding |
- |
- |
|||
|
Common stock, $0.01 par value, 350,000,000 authorized, 22,317,671 issued |
|||||
|
and 20,542,397 outstanding at December 31, 2017, and 22,107,402 issued |
|||||
|
and 20,359,131 outstanding at December 31, 2016 |
223 | 221 | |||
|
Additional paid in capital |
344,153 | 340,623 | |||
|
Treasury stock, at cost, 1,775,274 and 1,748,271 shares |
|||||
|
as of December 31, 2017 and December 31, 2016 |
(36,408) | (35,645) | |||
|
Accumulated earnings / (deficit) |
29,712 | (14,021) | |||
|
Accumulated other comprehensive loss (Note 3) |
(67,808) | (83,383) | |||
|
Total Tower International, Inc.'s stockholders' equity |
269,872 | 207,795 | |||
|
Noncontrolling interests in subsidiaries |
- |
6,144 | |||
|
Total stockholders' equity |
269,872 | 213,939 | |||
|
Total liabilities and stockholders' equity |
$ |
1,260,097 |
$ |
1,162,523 | |
|
|
|||||
The accompanying notes are an integral part of these Consolidated Financial Statements.
48
TOWER INTERNATIONAL, INC. AND SUBSIDIARIES
CONSOLIDATED STATEMENTS OF OPERATIONS
(Amounts in thousands, except share and per share amounts)
|
|
|||||||||
|
|
Year Ended December 31, |
Year Ended December 31, |
Year Ended December 31, |
||||||
|
|
2017 |
2016 |
2015 |
||||||
|
|
|||||||||
|
Revenues |
$ |
1,988,046 |
$ |
1,913,641 |
$ |
1,796,103 | |||
|
Cost of sales |
1,743,511 | 1,675,232 | 1,578,231 | ||||||
|
Gross profit |
244,535 | 238,409 | 217,872 | ||||||
|
Selling, general, and administrative expenses |
118,061 | 131,552 | 124,459 | ||||||
|
Amortization expense (Note 3) |
443 | 449 | 249 | ||||||
|
Restructuring and asset impairment charges, net (Note 5) |
10,735 | 5,389 | 7,819 | ||||||
|
Operating income |
115,296 | 101,019 | 85,345 | ||||||
|
Interest expense |
13,735 | 21,618 | 23,847 | ||||||
|
Interest income |
330 | 614 | 125 | ||||||
|
Other expense |
575 | 6,481 |
- |
||||||
|
Income before provision for income taxes, and income / (loss) from discontinued operations |
101,316 | 73,534 | 61,623 | ||||||
|
Provision / (benefit) for income taxes (Note 9) |
55,434 | 17,246 | (123,844) | ||||||
|
Income from continuing operations |
45,882 | 56,288 | 185,467 | ||||||
|
Income / (loss) from discontinued operations, net of tax (Note 6) |
1,853 | (17,008) | 10,324 | ||||||
|
Net income |
47,735 | 39,280 | 195,791 | ||||||
|
Less: Net income attributable to the noncontrolling interests |
110 | 701 | 1,739 | ||||||
|
Net income attributable to Tower International, Inc. |
$ |
47,625 |
$ |
38,579 |
$ |
194,052 | |||
|
|
|||||||||
|
Weighted average basic shares outstanding |
20,498,668 | 20,864,321 | 21,093,387 | ||||||
|
Weighted average diluted shares outstanding |
20,828,888 | 21,222,183 | 21,408,301 | ||||||
|
|
|||||||||
|
Basic income per share attributable to Tower International, Inc. (Note 11): |
|||||||||
|
Income per share from continuing operations |
$ |
2.23 |
$ |
2.66 |
$ |
8.71 | |||
|
Income / (loss) per share from discontinued operations |
0.09 | (0.82) | 0.49 | ||||||
|
Net income attributable to Tower International, Inc. per share |
2.32 | 1.85 | 9.20 | ||||||
|
|
|||||||||
|
Diluted income per share attributable to Tower International, Inc. (Note 11): |
|||||||||
|
Income per share from continuing operations |
$ |
2.20 |
$ |
2.62 |
$ |
8.58 | |||
|
Income / (loss) per share from discontinued operations |
0.09 | (0.80) | 0.48 | ||||||
|
Net income attributable to Tower International, Inc. per share |
2.29 | 1.82 | 9.06 | ||||||
|
|
|||||||||
|
Dividends declared per share |
$ |
0.45 |
$ |
0.41 |
$ |
0.10 | |||
|
|
|||||||||
The accompanying notes are an integral part of these Consolidated Financial Statements.
49
TOWER INTERNATIONAL, INC. AND SUBSIDIARIES
CONSOLIDATED STATEMENTS OF COMPREHENSIVE INCOME / (LOSS)
(Amounts in thousands)
|
|
|||||||||
|
|
|||||||||
|
|
|||||||||
|
|
Year Ended December 31, |
||||||||
|
|
2017 |
2016 |
2015 |
||||||
|
|
|||||||||
|
Net income |
$ |
47,735 |
$ |
39,280 |
$ |
195,791 | |||
|
Other comprehensive income / (loss), net of tax: |
|||||||||
|
Foreign currency translation adjustments, net of tax expense / (benefit) of ($10 million), $2.5 million, and $7.8 million |
19,602 | (4,401) | (35,095) | ||||||
|
Change in defined benefit plans, net of tax expense / (benefit) of $0.8 million, $0.7 million, and ($0.2 million) |
723 | 1,030 | (312) | ||||||
|
Unrealized loss on qualifying cash flow hedge, net of tax expense / (benefit) of ($2.8 million), $0 million, and $0 million |
(4,698) |
- |
- |
||||||
|
Other comprehensive income / (loss), net of tax |
15,627 | (3,371) | (35,407) | ||||||
|
Comprehensive income |
63,362 | 35,909 | 160,384 | ||||||
|
Less: Comprehensive income / (loss) attributable to noncontrolling interests |
162 | 221 | (90) | ||||||
|
Comprehensive income attributable to Tower International, Inc. |
$ |
63,200 |
$ |
35,688 |
$ |
160,474 | |||
|
|
|||||||||
The accompanying notes are an integral part of these Consolidated Financial Statements.
50
TOWER INTERNATIONAL, INC. AND SUBSIDIARIES
CONSOLIDATED STATEMENTS OF CASH FLOWS
(Amounts in thousands)
|
|
Year Ended December 31, |
||||||||
|
|
2017 |
2016 |
2015 |
||||||
|
|
|||||||||
|
OPERATING ACTIVITIES: |
|||||||||
|
Net income |
$ |
47,735 |
$ |
39,280 |
$ |
195,791 | |||
|
Less: Income / (loss) from discontinued operations, net of tax |
1,853 | (17,008) | 10,324 | ||||||
|
Income from continuing operations |
45,882 | 56,288 | 185,467 | ||||||
|
|
|||||||||
|
Adjustments required to reconcile income from continuing operations to net |
|||||||||
|
cash provided by continuing operating activities: |
|||||||||
|
Deferred income tax provision |
46,126 | 9,546 | (130,964) | ||||||
|
Depreciation and amortization |
77,284 | 72,469 | 72,542 | ||||||
|
Non-cash share-based compensation |
2,219 | 2,455 | 2,322 | ||||||
|
Pension income, net of contributions |
(11,512) | (1,999) | (14,116) | ||||||
|
Change in working capital and other operating items |
4,740 | (1,051) | (13,838) | ||||||
|
Net cash provided by continuing operating activities |
$ |
164,739 |
$ |
137,708 |
$ |
101,413 | |||
|
INVESTING ACTIVITIES: |
|||||||||
|
Cash disbursed for purchases of property, plant, and equipment, net |
$ |
(104,153) |
$ |
(116,283) |
$ |
(119,749) | |||
|
Proceeds from disposition of China JVs, net |
15,944 | 4,546 |
- |
||||||
|
Acquisition, net of cash |
- |
- |
(21,740) | ||||||
|
Net cash used in continuing investing activities |
$ |
(88,209) |
$ |
(111,737) |
$ |
(141,489) | |||
|
|
|||||||||
|
FINANCING ACTIVITIES: |
|||||||||
|
Proceeds from borrowings |
$ |
599,888 |
$ |
581,833 |
$ |
125,290 | |||
|
Repayments of borrowings |
(604,716) | (587,146) | (133,116) | ||||||
|
Repayments on Term Loan Credit Facility |
- |
(50,000) | (25,000) | ||||||
|
Debt financing costs |
(4,747) |
- |
- |
||||||
|
Original issuance discount |
(1,808) |
- |
- |
||||||
|
Proceeds from termination of cross currency swaps |
- |
- |
32,377 | ||||||
|
Dividend payment to Tower shareholders |
(9,221) | (8,570) | (2,111) | ||||||
|
Proceeds from stock options exercised |
1,313 | 305 | 204 | ||||||
|
Purchase of treasury stock |
(763) | (19,578) | (6,551) | ||||||
|
Noncontrolling interest dividends and other activity |
- |
- |
(2,633) | ||||||
|
Net cash used in continuing financing activities |
$ |
(20,054) |
$ |
(83,156) |
$ |
(11,540) | |||
|
Discontinued operations: |
|||||||||
|
Net cash from discontinued operating activities |
$ |
2,468 |
$ |
6,032 |
$ |
15,586 | |||
|
Net cash from / (used in) discontinued investing activities |
(2,591) | (3,589) | 41,809 | ||||||
|
Net cash from / (used in) discontinued financing activities |
291 | (3,441) | (11,361) | ||||||
|
Net cash from / (used in) discontinued operations |
$ |
168 |
$ |
(998) |
$ |
46,034 | |||
|
|
|||||||||
|
Effect of exchange rate changes on continuing cash and cash equivalents |
$ |
4,256 |
$ |
(623) |
$ |
(5,508) | |||
|
|
|||||||||
|
NET CHANGE IN CASH AND CASH EQUIVALENTS |
$ |
60,900 |
$ |
(58,806) |
$ |
(11,090) | |||
|
|
|||||||||
|
CASH AND CASH EQUIVALENTS: |
|||||||||
|
Beginning of period |
$ |
62,788 |
$ |
121,594 |
$ |
132,684 | |||
|
|
|||||||||
|
End of period |
$ |
123,688 |
$ |
62,788 |
$ |
121,594 | |||
|
|
|||||||||
|
Supplemental Cash Flow Information: |
|||||||||
|
Interest paid, net of amounts capitalized |
$ |
22,168 |
$ |
18,837 |
$ |
20,253 | |||
|
Income taxes paid |
9,233 | 7,561 | 6,545 | ||||||
|
Non-cash Investing Activities: |
|||||||||
|
Capital expenditures in liabilities for purchases of property, plant, and equipment |
$ |
22,347 |
$ |
14,172 |
$ |
17,896 | |||
The accompanying notes are an integral part of these Consolidated Financial Statements.
51
TOWER INTERNATIONAL, INC. AND SUBSIDIARIES
CONSOLIDATED STATEMENTS OF EQUITY/(DEFICIT)
(Amounts in thousands, except per share data)
|
|
||||||||||||||||||||||||||
|
|
||||||||||||||||||||||||||
|
|
Total |
|||||||||||||||||||||||||
|
|
Stockholders' |
|||||||||||||||||||||||||
|
|
Accumulated |
Equity/(Deficit) |
||||||||||||||||||||||||
|
|
Other |
Attributable to |
||||||||||||||||||||||||
|
|
Additional |
Accumulated |
Comprehensive |
Tower |
Noncontrolling |
|||||||||||||||||||||
|
|
Common Stock |
Paid-in |
Treasury |
Earnings |
Income |
International, |
Interest |
Total Equity |
||||||||||||||||||
|
|
Units/Shares |
Amount |
Capital |
Stock |
/ (Deficit) |
(Loss) |
Inc. |
Amount |
(Deficit) |
|||||||||||||||||
|
Balance at December 31, 2014 |
20,752,226 |
$ |
214 |
$ |
335,338 |
$ |
(9,516) |
$ |
(235,971) |
$ |
(46,914) |
$ |
43,151 |
$ |
56,627 |
$ |
99,778 | |||||||||
|
Net income |
- |
- |
- |
- |
194,052 |
- |
194,052 | 1,739 | 195,791 | |||||||||||||||||
|
Other comprehensive income / (loss) |
- |
- |
- |
- |
- |
(33,578) | (33,578) | (1,829) | (35,407) | |||||||||||||||||
|
Total comprehensive income |
- |
- |
- |
- |
- |
- |
160,474 | (90) | 160,384 | |||||||||||||||||
|
Vesting of RSUs |
592,907 | 6 | (6) |
- |
- |
- |
- |
- |
- |
|||||||||||||||||
|
Stock options exercised |
17,321 |
- |
204 |
- |
- |
- |
204 |
- |
204 | |||||||||||||||||
|
Treasury stock |
(250,844) |
- |
- |
(6,551) |
- |
- |
(6,551) |
- |
(6,551) | |||||||||||||||||
|
Share-based compensation expense |
- |
- |
2,328 |
- |
- |
- |
2,328 |
- |
2,328 | |||||||||||||||||
|
Dividend paid |
- |
- |
- |
- |
(2,111) |
- |
(2,111) |
- |
(2,111) | |||||||||||||||||
|
Noncontrolling interest sold |
- |
- |
- |
- |
- |
- |
- |
(46,984) | (46,984) | |||||||||||||||||
|
Noncontrolling interest dividends - Wuhu |
- |
- |
- |
- |
- |
- |
- |
(329) | (329) | |||||||||||||||||
|
Balance at December 31, 2015 |
21,111,610 |
$ |
220 |
$ |
337,864 |
$ |
(16,067) |
$ |
(44,030) |
$ |
(80,492) |
$ |
197,495 |
$ |
9,224 |
$ |
206,719 | |||||||||
|
Net income |
- |
- |
- |
- |
38,579 |
- |
38,579 | 701 | 39,280 | |||||||||||||||||
|
Other comprehensive income / (loss) |
- |
- |
- |
- |
- |
(2,891) | (2,891) | (480) | (3,371) | |||||||||||||||||
|
Total comprehensive income |
- |
- |
- |
- |
- |
- |
35,688 | 221 | 35,909 | |||||||||||||||||
|
Vesting of RSUs |
77,912 | 1 | (1) |
- |
- |
- |
- |
- |
- |
|||||||||||||||||
|
Stock options exercised |
25,670 |
- |
305 |
- |
- |
- |
305 |
- |
305 | |||||||||||||||||
|
Treasury stock |
(856,061) |
- |
- |
(19,578) |
- |
- |
(19,578) |
- |
(19,578) | |||||||||||||||||
|
Share-based compensation expense |
- |
- |
2,455 |
- |
- |
- |
2,455 |
- |
2,455 | |||||||||||||||||
|
Dividend paid |
- |
- |
- |
- |
(8,570) |
- |
(8,570) |
- |
(8,570) | |||||||||||||||||
|
Noncontrolling interest sold |
- |
- |
- |
- |
- |
- |
- |
- |
- |
|||||||||||||||||
|
Noncontrolling interest dividends - Wuhu |
- |
- |
- |
- |
- |
- |
- |
(3,301) | (3,301) | |||||||||||||||||
|
Balance at December 31, 2016 |
20,359,131 |
$ |
221 |
$ |
340,623 |
$ |
(35,645) |
$ |
(14,021) |
$ |
(83,383) |
$ |
207,795 |
$ |
6,144 |
$ |
213,939 | |||||||||
|
Net income |
- |
- |
- |
- |
47,625 |
- |
47,625 | 110 | 47,735 | |||||||||||||||||
|
Other comprehensive income / (loss) |
- |
- |
- |
- |
- |
15,575 | 15,575 | 52 | 15,627 | |||||||||||||||||
|
Total comprehensive income |
- |
- |
- |
- |
- |
- |
63,200 | 162 | 63,362 | |||||||||||||||||
|
Vesting of RSUs |
101,478 | 1 | (1) |
- |
- |
- |
- |
- |
- |
|||||||||||||||||
|
Stock options exercised |
108,791 | 1 | 1,312 |
- |
- |
- |
1,313 |
- |
1,313 | |||||||||||||||||
|
Treasury stock |
(27,003) |
- |
- |
(763) |
- |
- |
(763) |
- |
(763) | |||||||||||||||||
|
Share-based compensation expense |
- |
- |
2,219 |
- |
- |
- |
2,219 |
- |
2,219 | |||||||||||||||||
|
Dividend paid |
- |
- |
- |
- |
(9,221) |
- |
(9,221) |
- |
(9,221) | |||||||||||||||||
|
Cumulative effect of the adoption of ASU No. 2016-09 |
- |
- |
- |
- |
5,329 |
- |
5,329 |
- |
5,329 | |||||||||||||||||
|
Noncontrolling interest sold |
- |
- |
- |
- |
- |
- |
- |
(6,306) | (6,306) | |||||||||||||||||
|
Balance at December 31, 2017 |
20,542,397 |
$ |
223 |
$ |
344,153 |
$ |
(36,408) |
$ |
29,712 |
$ |
(67,808) |
$ |
269,872 |
$ |
(0) |
$ |
269,872 | |||||||||
52
TOWER INTERNATIONAL, INC. AND SUBSIDIARIES
NOTES TO CONSOLIDATED FINANCIAL STATEMENTS
Note 1. Nature of Business
Tower International, Inc. and its subsidiaries (collectively referred to as the “Company” or “Tower International”), is a leading integrated global manufacturer of engineered automotive structural metal components and assemblies, primarily serving original equipment manufacturers (“OEMs”), including Ford, Volkswagen Group, Fiat-Chrysler, Volvo, Nissan, Daimler, Toyota, BMW, and Honda. Products include body structures, assemblies and other chassis, structures, and lower vehicle systems and suspension components for small and large cars, crossovers, pickups, and sport utility vehicles. Including both wholly owned subsidiaries and majority owned subsidiaries, the Company has strategically located production facilities in the United States, Germany, Belgium, Slovakia, Italy, Poland, Mexico, and the Czech Republic, supported by engineering and sales locations in the United States, Germany, Italy, Japan, China, and India.
Note 2. Basis of Presentation and Organizational History
On October 14, 2010, the Company completed its initial public offering (the “IPO”), whereby Tower Automotive, LLC was converted into a Delaware corporation named Tower International, Inc. (the “Corporate Conversion”).
Pursuant to the Company’s IPO, the Company’s common stock began trading on the New York Stock Exchange on October 15, 2010. On October 20, 2010, in connection with the IPO the Company sold 6,250,000 shares of common stock and received $75.6 million of proceeds, after underwriting discounts and commissions. Pursuant to a partial exercise of the underwriters’ over-allotment option, the Company sold an additional 383,722 shares of common stock on November 8, 2010 and received proceeds of $4.6 million, after underwriting discounts and commissions.
All references to the Company in these notes for periods prior to the effective date of the Corporate Conversion are to Tower Automotive, LLC and its subsidiaries. All references to the Company in these notes for periods subsequent to the effective date of the Company’s Corporate Conversion are to Tower International, Inc. and its subsidiaries.
The results of the Company’s Changchun Tower Golden Ring Automotive Products Co., Ltd. (“TGR”), Xiangtan DIT Automotive Products Co. Ltd. (“Xiangtan”), Tower Automotive Company, Ltd. (“Wuhu”) and Tower DIT Automotive Products Co., Ltd. (“Ningbo”) joint ventures in China along with all of the Company’s Brazilian operations are presented as discontinued operations in the Company’s Consolidated Financial Statements, in accordance with Financial Accounting Standards Board (“FASB”) Accounting Standards Codification (“ASC”) No. 205, Discontinued Operations. Refer to Note 6 for additional information regarding the Company’s discontinued operations.
Accounting Pronouncements
Recently Adopted
Stock Compensation
In March 2016, the FASB issued Accounting Standard Update (“ASU”) No. 2016-09, Improvements to Employee Share-Based Payment Accounting, which simplifies several aspects of the accounting for employee share-based payment transactions. This ASU was effective for annual reporting periods beginning after December 15, 2016, and interim periods therein. Upon adoption in the first quarter of 2017, the Company recorded a cumulative adjustment for previously unrecognized tax benefits to accumulated earnings / (deficit) of approximately $5.3 million.
Inventory
In July 2015, the FASB issued ASU No. 2015-11, Inventory: Simplifying the Measurement of Inventory, which requires entities that measure inventory using first-in, first-out (“FIFO”) or average cost, to measure inventory at the lower of cost and net realizable value. This ASU was effective prospectively for annual periods beginning after December 15, 2016, and interim periods therein. The Company adopted this ASU in the first quarter of 2017, with no material financial statement impact.
53
Pending Adoption
Hedge Accounting
On August 28, 2017, the FASB issued ASU No. 2017-12, Derivatives and Hedging (Topic 815): Targeted Improvements to Accounting for Hedging Activities. This ASU is designed to better align hedge accounting with an organization’s risk management activities in the financial statements. In addition, this ASU simplifies the application of hedge accounting guidance in areas where practice issues exist. This ASU is effective for interim and annual periods after December 15, 2018. Early adoption is permitted, and requires that the effect of adoption should be reflected as of the beginning of the fiscal year of adoption. The Company is currently evaluating the effects that this ASU may have on its Consolidated Financial Statements and is considering early adoption in 2018. As of December 31, 2017, the Company estimates that the cumulative effect adjustment from Accumulated Other Comprehensive Income (“AOCI”) to accumulated earnings that would be recognized upon adoption would be $5.1 million. This adjustment will ensure that the resulting AOCI balance represents the cumulative change in the hedging instruments’ fair value since hedge inception, less any amounts that should have been recognized in earnings under this ASU.
Retirement Benefits
On March 10, 2017, the FASB issued ASU No. 2017-07, Improving the Presentation of Net Periodic Pension Cost and Net Periodic Postretirement Benefit Cost. This ASU is designed to increase the transparency and usefulness of information about defined benefit costs for pension plans and other post-retirement benefit plans presented in employer financial statements. This ASU is effective for interim and annual periods after December 15, 2017. Early adoption is allowed, and requires that the guidance be applied retrospectively to all prior periods. Effective October 1, 2006, the Company’s pension plan was frozen and the Company ceased accruing any additional benefits; as such, the Company does not expect a material financial statement impact related to the adoption of this ASU during the first quarter of 2018.
Goodwill Impairment
On January 26, 2017, the FASB issued ASU No. 2017-04, Simplifying the Test for Goodwill Impairment. This ASU simplifies the accounting for goodwill impairments by eliminating step 2 from the goodwill impairment test, and is effective for annual and any interim impairment tests for periods beginning after December 15, 2019. Early adoption of the ASU is allowed for all entities beginning with any goodwill impairment test occurring and performed after January 1, 2017. The Company does not expect a material financial statement impact related to the adoption of this ASU.
Revenue Recognition
On May 28, 2014, the FASB issued ASU No. 2014-09, Revenue from Contracts with Customers (ASC 606). This ASU outlines a single comprehensive model for entities to utilize to recognize revenue when it transfers goods or services to customers in an amount that reflects the consideration that will be received in exchange for the goods and services. Additional disclosures will also be required to enable users to understand the nature, amount, timing and uncertainty of revenue and cash flows arising from contracts with customers. In August 2015, the FASB deferred the effective date of this standards update to fiscal years beginning after December 15, 2017, with early adoption permitted on the original effective date of fiscal years beginning after December 15, 2016. In 2016, the FASB issued ASU No. 2016-08, ASU No. 2016-10, ASU No. 2016-12, ASU No. 2016-20, all of which amend the implementation guidance and illustrations in the new revenue standard.
The Company will adopt the new revenue standards in its first quarter of 2018 utilizing the modified retrospective transition method. To assess the impact of the new standard, the Company analyzed the standard's impact on customer contracts, comparing its historical accounting policies and practices to the requirements of the new standard, and identifying potential differences from application of the new standard's requirements. The Company reviewed all material contracts and related agreements with customers and confirmed that the performance obligations do not change under ASC No. 606. The Company currently accounts for pre-production costs under ASC 340, Other Assets and Deferred Costs, as a cost reimbursement and will continue to follow this model. In addition, the Company considered all relevant commercial variables to identify transaction consideration and has concluded there is not a material change in the determination of transaction pricing. Therefore, the Company has concluded that the adoption of the new revenue standards will not have a material impact on its Consolidated Financial Statements as the method for recognizing revenue subsequent to the implementation of ASC No. 606 will not vary significantly from the revenue recognition practices under current GAAP.
There are certain considerations related to internal control over financial reporting that are associated with implementing the new guidance under ASC No. 606 and the Company is currently implementing the necessary changes to its control framework for revenue recognition. Disclosure requirements under the new guidance in ASC No. 606 have been significantly expanded in comparison to the
54
disclosure requirements under the current guidance. The Company is currently concluding its assessment of the new disclosure requirements and is in the process of drafting disclosures for both interim and annual periods in 2018 under ASC No. 606.
Leases
In February 2016, the FASB issued ASU 2016-02, Leases. This ASU introduces a lessee model that brings most leases on the balance sheet. The new standard establishes a right-of-use model (“ROU”) that requires a lessee to recognize a ROU asset and lease liability on the balance sheet for all leases with a term longer than 12 months. Leases will be classified as financing or operating, with balance sheet classification affecting the pattern and classification of expense recognition in the income statement.
This ASU is effective for annual periods beginning after December 15, 2018, and interim periods within those fiscal years. The Company expects to adopt the new standard on its effective date. A modified retrospective transition approach is required for leases existing at, or entered into after, the beginning of the earliest comparative period presented in the Consolidated Financial Statements, with certain practical expedients available.
The Company expects that this standard will have a material effect on its Consolidated Financial Statements. The Company is currently evaluating significant contracts and assessing the potential impacts. Based on the assessments performed thus far, the Company believes that it has certain manufacturing equipment leases currently classified as operating leases that will be classified as finance leases under the new standard. As of December 31, 2017, the Company estimates that the ROU asset and liability associated with these leases would be approximately $72 million. This estimate is based upon the present value of the remaining minimum lease payments for equipment that is subject to lease agreements as of December 31, 2017.
In addition, the Company has numerous real estate and equipment leases currently classified as operating that the Company believes will continue to be classified as operating under the new standard. The Company expects that the ROU assets and liabilities associated with these leases will be material, but has not yet quantified the total balance sheet impact for these leases.
Note 3. Significant Accounting Policies
Financial Statement Presentation
a. Principles of Consolidation
The Consolidated Financial Statements include the accounts of the Company and all subsidiaries over which the Company exercises control. The Company’s share of earnings or losses of nonconsolidated affiliates are included in the consolidated operating results using the equity method of accounting when the Company is able to exercise significant influence over the operating and financial decisions of the affiliates. All intercompany transactions and balances have been eliminated upon consolidation.
b. Cash and Cash Equivalents
All highly liquid investments with an original maturity of three months or less are considered to be cash equivalents. Cash equivalents are stated at cost, which approximates fair value because of the short maturity of these instruments.
c. Allowance for Doubtful Accounts
The Company maintains an allowance for doubtful accounts receivable, which represents its estimate of losses inherent in trade receivables. The Company provides an allowance for specific customer accounts where collection is doubtful based on historical collection and write-off experience. The Company will also take into consideration unique factors and provide an allowance, if necessary. Bad debt expense is not material for any period presented.
55
d. Inventories
Inventories are stated at the lower of cost or net realizable value. Cost is determined by the first-in, first-out method. Maintenance, repair, and non-productive inventory, which are considered consumables, are expensed when acquired and included in the Consolidated Statements of Operations as cost of sales. Inventories consist of the following (in thousands):
|
|
December 31, 2017 |
December 31, 2016 |
|||||
|
Raw materials |
$ |
33,929 |
$ |
31,993 | |||
|
Work in process |
16,112 | 14,721 | |||||
|
Finished goods |
28,704 | 24,996 | |||||
|
Total inventory |
$ |
78,745 |
$ |
71,710 | |||
e. Tooling
Tooling represents costs incurred by the Company in the development of new tooling used in the manufacture of the Company’s products. All pre-production tooling costs incurred for tools that the Company will not own and that will be used in producing products supplied under long-term supply agreements are expensed as incurred, unless the supply agreement provides the Company with the noncancellable right to use the tools or the reimbursement of such costs is contractually guaranteed by the customer. Generally, the customer agrees to reimburse the Company for certain of its tooling costs at the time the customer awards a contract to the Company.
When the part for which tooling has been developed reaches a production-ready status, the Company is reimbursed by its customer for the cost of the tooling, at which time the tooling becomes the property of the customer. The Company has certain other tooling costs related to tools the Company has the contractual right to use during the life of the supply arrangement, which are capitalized and amortized over the life of the related product program. Customer-owned tooling is included in the Consolidated Balance Sheets in prepaid tooling, notes receivable, and other, while company-owned and other tooling is included in other assets, net.
The components of capitalized tooling costs are as follows (in thousands):
|
|
December 31, 2017 |
December 31, 2016 |
||||
|
Customer-owned tooling, net |
$ |
63,456 |
$ |
87,934 | ||
|
Company-owned tooling |
277 |
- |
||||
|
Total tooling, net |
$ |
63,733 |
$ |
87,934 | ||
Any gain recognized, which is defined as the excess of reimbursement over cost, is amortized over the life of the program. If estimated costs are expected to be in excess of reimbursement, a loss is recorded in the period in which the loss is estimated.
f. Property, Plant, and Equipment
Property, plant, and equipment are recorded at cost, less accumulated depreciation. Depreciation expense was $76.9 million, $72.1 million, and $72.3 million for the years ended December 31, 2017, 2016, and 2015, respectively. Depreciation is computed using the straight-line method over the following estimated useful lives of assets:
|
|
||
|
Buildings and improvements |
32 to 40 years |
|
|
Machinery and equipment |
3 to 20 years |
Leasehold improvements are amortized over the shorter of ten years or the remaining lease term at the date of acquisition of the leasehold improvement.
Costs of maintenance and repairs are charged to expense as incurred and included in cost of sales. Spare parts are considered capital in nature when purchased during the initial investment of a fixed asset. Amounts relating to significant improvements, which extend the useful life or utility of the related asset, are capitalized and depreciated over the remaining life of the asset. Upon disposal or retirement of property, plant, and equipment, the cost and related accumulated depreciation are eliminated from the respective accounts and the resulting gain or loss is recognized in cost of sales in the Consolidated Statements of Operations.
56
Property, plant, and equipment consist of the following (in thousands):
|
|
||||||
|
|
December 31, |
December 31, |
||||
|
|
2017 |
2016 |
||||
|
Cost: |
||||||
|
Land |
$ |
18,085 |
$ |
16,607 | ||
|
Buildings and improvements |
215,271 | 177,156 | ||||
|
Machinery and equipment |
981,212 | 837,632 | ||||
|
Construction in progress |
79,144 | 93,018 | ||||
|
Property, plant, and equipment, gross |
1,293,712 | 1,124,413 | ||||
|
Less: accumulated depreciation |
(758,440) | (658,844) | ||||
|
Property, plant, and equipment, net |
$ |
535,272 |
$ |
465,569 | ||
The Company recorded capitalized interest on its construction in progress of $4.3 million, $3 million, and $2 million during the years ended December 31, 2017, 2016, and 2015, respectively.
g. Asset Retirement Obligations
FASB ASC No. 410, Asset Retirement and Environmental Obligations, requires the recognition of a liability for the fair value of a conditional asset retirement obligation if the fair value can be reasonably estimated. An asset retirement obligation is a legal obligation to perform certain activities in connection with the retirement, disposal, or abandonment of tangible long-lived assets. The fair value of a conditional asset retirement obligation should be recognized when incurred, generally upon acquisition, construction, or development and through the normal operation of the asset. Uncertainty about the timing or method of settlement of a conditional asset retirement should be factored into the measurement of the liability. The liability is measured at fair value and is adjusted to its present value in subsequent periods. The Company’s asset retirement obligations are primarily associated with renovating, upgrading, and returning leased property to the lessor, in accordance with the requirements of the lease.
Asset retirement obligations are included in other non-current liabilities in the Consolidated Balance Sheets. The following table reconciles the Company’s asset retirement obligations as of December 31, 2017 and 2016 (in thousands):
|
|
||||||
|
|
December 31, |
December 31, |
||||
|
|
2017 |
2016 |
||||
|
Beginning balance |
$ |
17,384 |
$ |
16,800 | ||
|
Liabilities incurred |
3,802 | 890 | ||||
|
Accretion expense |
1,393 | 1,384 | ||||
|
Liabilities settled |
- |
(114) | ||||
|
Change in estimate |
(5,025) | (1,576) | ||||
|
Ending balance |
$ |
17,554 |
$ |
17,384 | ||
The changes in estimate for the years ended December 31, 2017 and 2016 relate primarily to revisions of the expected settlement dates for certain leased facilities.
h. Impairment of Long-Lived Assets
The Company monitors its long-lived assets for impairment on an ongoing basis in accordance with FASB ASC No. 360, Property, Plant, and Equipment. If an impairment indicator exists, the Company will perform the required analysis and record an impairment charge, if necessary. In conducting its impairment analysis, the Company compares the undiscounted cash flows expected to be generated from a long-lived asset to its net book value. If the net book value of an asset exceeds its undiscounted cash flows, an impairment loss is measured and recognized. An impairment loss is measured as the difference between net book value and fair value. Fair value is estimated based upon discounted cash flow analyses using cash flow projections based on recent sales data, and independent automotive production volume estimates, and customer commitments. Changes in economic or operating conditions impacting these estimates and assumptions could result in impairment of long-lived assets. Refer to Note 5 for a discussion regarding impairment charges for the periods presented.
57
Long-lived assets held for sale are recorded at the lower of their carrying amount or estimated fair value less cost to sell and depreciation is ceased.
i. Goodwill and Other Intangible Assets
Goodwill represents the excess of the cost of an acquisition over the fair value of net assets acquired. Goodwill is not amortized, but it is tested for impairment on, at a minimum, an annual basis. In accordance with FASB ASC No. 350, Intangibles—Goodwill and Other, a two-step process is utilized in reviewing for impairment. The first step in the process requires the identification of reporting units and comparison of the fair value of each reporting unit to its respective carrying value. If the carrying value of a unit is less than its fair value, no impairment is deemed to exist and step 2 is not necessary. If the carrying value of a unit is greater than its fair value, step 2 is required. The second step in the impairment review process requires the computation of impairment by comparing the implied fair value of a reporting unit’s goodwill with the carrying amount of its goodwill. In accordance with FASB ASC No. 350, which requires goodwill be tested for impairment annually and at the same time each year, the Company performs an annual impairment review each year at year-end. The Company will also test goodwill for impairment when an event occurs or circumstances change such that it is reasonably possible that impairment may exist.
The evaluation of goodwill for possible impairment includes estimating the fair market value of each of the reporting units which have goodwill associated with their operations using discounted cash flow and multiples of cash earnings valuation techniques, plus valuation comparisons to recent public sale transactions of similar businesses, if any. These valuation methods require the Company to make estimates and assumptions regarding future operating results, cash flows, changes in working capital and capital expenditures, selling prices, profitability, and the cost of capital. Although the Company believes that the estimates and assumptions used were reasonable, actual results could differ from those estimates and assumptions.
The results of the Company’s 2017 annual goodwill impairment analysis indicated that the fair value of the Europe and North America reporting units were in excess of carrying value: thus, no impairment existed at December 31, 2017.
The results of the Company’s 2016 annual goodwill impairment analysis indicated that the fair value of the Europe and North America reporting units were in excess of carrying value; thus, no impairment existed at December 31, 2016.
The change in the carrying amount of goodwill is set forth below by reportable segment and on a consolidated basis (in thousands):
|
|
Europe |
North America |
Consolidated |
||||||
|
Balance at December 31, 2015 |
$ |
50,890 |
$ |
8,450 |
$ |
59,340 | |||
|
Currency translation adjustment |
(1,597) | (1,360) | (2,957) | ||||||
|
Balance at December 31, 2016 |
49,293 | 7,090 | 56,383 | ||||||
|
Currency translation adjustment |
6,948 | 334 | 7,282 | ||||||
|
Balance at December 31, 2017 |
$ |
56,241 |
$ |
7,424 |
$ |
63,665 | |||
The Company recorded a $3.6 million intangible asset during the third quarter of 2015 related to the acquisition of a facility in Mexico. This intangible asset has a definite life and is being amortized on a straight-line basis over seven years, the estimated life of the related asset, which approximates the recognition of related revenues.
The Company incurred amortization expense related to intangible assets of $0.4 million, $0.4 million, and $0.2 million for the years ended December 31, 2017, 2016, and 2015, respectively.
j. Derivative Financial Instruments
Periodically, the Company uses derivative financial instruments to manage interest rate risk and net investment risk in foreign operations, and to limit exposure of foreign currency fluctuations related to certain intercompany payments. The Company is not a party to leveraged derivatives and does not enter into derivative financial instruments for trading or speculative purposes. Under FASB ASC No. 815, Derivatives and Hedging, all derivatives are recorded at fair value.
The Company formally documents hedge relationships, including the identification of the hedging instruments and the hedged items, as well as the risk management objectives and strategies for undertaking the hedge transaction. To the extent that derivative instruments qualify, and are designated as, cash flow or net investment hedges, the effective portion is recorded as a component of AOCI and the
58
ineffective portion is recorded as interest expense. All hedges are presented in the Consolidated Balance Sheets at fair value as other assets, net or other non-current liabilities with a corresponding offset to AOCI. The Company also formally assesses whether a derivative used in a hedging transaction is highly effective in offsetting changes in either the fair value or cash flows of the hedged item at inception and on a quarterly basis, thereafter. If the Company determines that a derivative ceases to be an effective hedge, it will discontinue hedge accounting.
k. Fair Value of Financial Instruments
FASB ASC No. 820, Fair Value Measurements, defines fair value as the price that would be received to sell an asset, or paid to transfer a liability, in an orderly transaction between market participants, at the measurement date (i.e., the exit price). The exit price is based upon the amount that the holder of the asset or liability would receive or need to pay in an actual transaction or in a hypothetical transaction if an actual transaction does not exist at the measurement date. In some circumstances, the entry and exit price may be the same; however, they are conceptually different.
The Company generally determines fair value based upon quoted market prices in active markets for identical assets or liabilities. If quoted market prices are not available, the Company uses valuation techniques that place greater reliance on observable inputs and less reliance on unobservable inputs. In measuring fair value, the Company may make adjustments for risks and uncertainties, if a market participant would include such an adjustment in its pricing.
FASB ASC No. 820 establishes a fair value hierarchy that distinguishes between assumptions based upon market data, referred to as observable inputs, and the Company’s assumptions, referred to as unobservable inputs. Determining where an asset or liability falls within that hierarchy depends on the lowest level input that is significant to the fair value measurement as a whole. An adjustment to the pricing method used within either Level 1 or Level 2 inputs could generate a fair value measurement that effectively falls in a lower level in the hierarchy. The hierarchy consists of three broad levels as follows:
Level 1:Quoted market prices in active markets for identical assets and liabilities;
Level 2:Inputs, other than Level 1 inputs, that are either directly or indirectly observable; and
Level 3:Unobservable inputs developed using estimates and assumptions that reflect those that market participants would use.
At December 31, 2017, the carrying value and estimated fair value of the Company’s total debt was $389.4 million and $392.1 million, respectively. At December 31, 2016, the carrying value and estimated fair value of the Company’s total debt was $390.6 million and $394.2 million, respectively. The majority of the Company’s debt at December 31, 2017 and 2016 was comprised of the Term Loan Credit Facility, which can be traded between financial institutions. Accordingly, this debt has been classified as Level 2. The fair value was determined based upon quoted values. The remainder of the Company’s debt, primarily consisting of foreign subsidiary indebtedness, is asset-backed and is classified as Level 3. As this debt carries variable rates and minimal credit risk, the book values approximate the fair values.
The Company has foreign currency exchange hedges and an interest rate swap that were measured at fair value on a recurring basis at December 31, 2017 and 2016. These instruments are recorded in other assets, net or other non-current liabilities in the Company’s Consolidated Balance Sheets and the fair value is measured using Level 2 observable inputs such as foreign currency exchange rates, swap rates, cross currency basis swap spreads and interest rate spreads. At December 31, 2017, the foreign currency exchange hedge (net investment hedge of our European subsidiaries) and the interest rate swap had liability fair values of $27 million and $8.9 million respectively. At December 31, 2016, the foreign currency exchange hedge (net investment hedge of our European subsidiaries) had a liability fair value of $5 million. The interest rate swap (not designated for hedge accounting in 2016) had a liability fair value of $2.5 million.
59
The following table provides each major category of assets and liabilities measured at fair value on a nonrecurring basis during the year ended December 31, 2017 (in millions):
|
|
Quoted prices in active |
Significant other |
Significant |
||||||
|
|
markets for identical |
observable |
unobservable |
||||||
|
|
assets |
inputs |
inputs |
||||||
|
|
Level 1 |
Level 2 |
Level 3 |
Total gains / |
|||||
|
Long-lived assets held for sale |
Not applicable |
Not applicable |
$ |
4.3 |
$ |
(0.3) | |||
In accordance with FASB ASC No. 360, Property, Plant, & Equipment, the long-lived assets held for sale related to the Ningbo joint venture in China, with a carrying amount of $4.6 million were written down to their fair value of $4.3 million, resulting in a loss of $0.3 million, which was included in the Company’s Consolidated Statements of Operations for the twelve months ended December 31, 2017 as income / (loss) from discontinued operations, net of tax. The fair value of the assets was determined based upon consideration of the negotiated sales price in the sales agreement.
The following table provides each major category of assets and liabilities measured at fair value on a nonrecurring basis during the year ended December 31, 2016 (in millions):
|
|
|||||||||
|
|
Quoted prices in active |
Significant other |
Significant |
||||||
|
|
markets for identical |
observable |
unobservable |
||||||
|
|
assets |
inputs |
inputs |
||||||
|
|
Level 1 |
Level 2 |
Level 3 |
Total gains / |
|||||
|
Long-lived assets held for sale |
Not applicable |
Not applicable |
$ |
4.6 |
$ |
(3.1) | |||
|
Long-lived assets held for sale |
Not applicable |
Not applicable |
18.6 | (15.0) | |||||
In accordance with FASB ASC No. 360, Property, Plant, & Equipment, the long-lived assets held for sale related to the Ningbo joint venture in China, with a carrying amount of $7.7 million were written down to their fair value of $4.6 million, resulting in a loss of $3.1 million, which was included in the Company’s Consolidated Statements of Operations for the twelve months ended December 31, 2016 as income / (loss) from discontinued operations, net of tax. The fair value of the assets was determined based upon consideration of the negotiated sales price in the sales agreement.
In accordance with FASB ASC No. 360, Property, Plant, & Equipment, the long-lived assets held for sale related to the Company’s remaining Brazilian operations, with a carrying amount of $33.6 million were written down to their fair value of $18.6 million, resulting in a loss of $15 million, which was included in the Company’s Consolidated Statements of Operations for the twelve months ended December 31, 2016 as income / (loss) from discontinued operations, net of tax. This fair value adjustment of $15 million reflects that upon the sale of the Brazilian operations, the cumulative translation adjustment will need to be reclassified to earnings.
The carrying amounts of cash and cash equivalents, accounts receivable, accounts payable, and accrued liabilities approximate fair value because of the short maturity of these instruments.
The following table provides each major category of assets and liabilities measured at fair value on a nonrecurring basis during the year ended December 31, 2015 (in millions):
|
|
|||||||||
|
|
Quoted prices in active |
Significant other |
Significant |
||||||
|
|
markets for identical |
observable |
unobservable |
||||||
|
|
assets |
inputs |
inputs |
||||||
|
|
Level 1 |
Level 2 |
Level 3 |
Total gains / |
|||||
|
Long-lived assets held for sale |
Not applicable |
Not applicable |
$ |
13.4 |
$ |
4.1 | |||
60
For the year ended December 31, 2015, in accordance with FASB ASC No. 360, Property, Plant, & Equipment, long-lived assets of the Xiangtan joint venture, with a carrying amount of $9.3 million, were adjusted to their fair value of $13.4 million, resulting in a gain of $4.1 million, which is included in income / (loss) from discontinued operations, net of tax for the year ended December 31, 2015. This gain represents the reversal of a portion of the impairment loss recorded in 2014. The fair value of the assets was determined based upon consideration of the negotiated sales price in the sales agreement.
l. Revenue Recognition
In accordance with FASB ASC No. 605, Revenue Recognition, the Company recognizes revenue once the following criteria have been met: persuasive evidence of an arrangement exists; delivery has occurred or services have been rendered; the Company’s price to the buyer is fixed or determinable; and collectability is reasonably assured.
The Company recognizes revenue when its products are shipped to its customers, at which time title and risk of loss pass to the customer. The Company participates in certain of its customers’ steel repurchase programs, under which it purchases steel directly from a customer’s designated steel supplier, for use in manufacturing products for that customer. The Company takes delivery and title to such steel and bears the risk of loss and obsolescence. The Company invoices its customers based upon annually negotiated selling prices, which inherently include a component for steel under such repurchase programs. Under guidance provided in FASB ASC No. 605-45, Principal Agent Considerations, the Company has risks and rewards of a principal and therefore, for sales transactions in which the Company participates in a customer’s steel resale program, revenue is recognized on a gross basis for the entire amount of the sales, including the component for purchases under that customer’s steel resale program.
The Company enters into agreements to produce products for its customers at the beginning of a given vehicle program’s life. Once such agreements are entered into by the Company, it is obligated to fulfill the customers’ purchasing requirements for the entire production period of the vehicle programs, which range from three to ten years, and generally, the Company has no provisions to terminate such contracts.
m. Income Taxes
The Company accounts for income taxes under the asset and liability method, which requires the recognition of deferred tax assets and liabilities for the expected future tax consequences of events that have been included in the financial statements. Under this method, deferred tax assets and liabilities are determined based on the differences between the Consolidated Financial Statements and tax basis of assets and liabilities using enacted tax rates in effect for the year in which the differences are expected to reverse. The Company records net deferred tax assets to the extent it believes that these assets will more likely than not be realized. In making such determination, the Company considers all available positive and negative evidence, including future reversals of existing taxable temporary differences, projected future taxable income, tax planning strategies and recent financial operations. Valuation allowances have been recorded where it has been determined that it is more likely than not that the Company will not be able to realize the net deferred tax assets. Previously established valuation allowances are reversed into income when there is compelling evidence, typically three or more consecutive years of cumulative profit or other positive evidence, that the future tax profitability will be sufficient to utilize the deferred tax asset. Due to the significant judgment involved in determining whether deferred tax assets will be realized, the ultimate resolution of these items may be materially different from the previously estimated outcome.
Changes in tax laws and rates could also affect recorded deferred tax assets and liabilities in the future. The Company recorded a one-time deferred tax expense of $27.2 million in the fourth quarter of 2017 in order to revalue the Company’s U.S. deferred tax assets to the new lower U.S. Federal statutory rate of 21% due to U.S. Tax Reform.
The calculation of the Company’s tax liabilities involves dealing with uncertainties in the application of complex tax laws and regulations in a multitude of jurisdictions across the Company’s global operations.
FASB ASC No. 740, Income Taxes, provides that a tax benefit from an uncertain tax position be recognized when it is more likely than not that the position will be sustained upon examination, including resolutions of any related appeals or litigation processes, based on the technical merits. FASB ASC No. 740 also provides guidance on measurement, derecognition, classification, interest and penalties, accounting in interim periods, disclosure, and transition. The Company has elected to recognize interest and penalties related to unrecognized tax benefits as income tax expense.
The Company recognizes tax liabilities in accordance with FASB ASC No. 740 and adjusts these liabilities when its judgment changes as a result of the evaluation of new information not previously available. Due to the complexity of some of these uncertainties, the
61
ultimate resolution may result in a payment that is materially different than the Company’s current estimate of the tax liabilities. These differences will be reflected as increases or decreases to income tax expense in the period in which they are determined.
n. Segment Reporting
The Company determines its reportable segments based upon the guidance in FASB ASC No. 280, Segment Reporting. The Company defines its operating segments as components of its business where separate financial information is available. Based on these criteria, the Company has determined that it has two reportable segments, Europe and North America.
o. Foreign Currency Translation
The functional currency of the Company’s foreign operations is the local currency in which they operate. Assets and liabilities of the Company’s foreign operations are translated into U.S. dollars using the applicable period-end exchange rates. Results of operations are translated at applicable average rates prevailing throughout the period. Gains or losses resulting from foreign currency translation are reported as foreign currency translation adjustments, a separate component of AOCI, in the Consolidated Statements of Comprehensive Income / (Loss). Gains and losses resulting from foreign currency transactions are recognized in net income / (loss) in the Consolidated Statements of Operations and were immaterial for all periods presented.
p. Exit or Disposal Activities
Costs to idle, consolidate, or close facilities and provide postemployment benefits to employees are accrued based on management’s best estimate of the wage and benefit costs that will be incurred. Costs related to idling of employees that is expected to be temporary are expensed as incurred. Costs to terminate a contract without economic benefit to the Company are expensed at the time the contract is terminated. One-time termination benefits that are not subject to contractual arrangements, provided to employees who are involuntarily terminated, are recorded after management commits to a detailed plan of termination, communicates the plan to employees, and when actions required to complete the plan indicate that significant changes are not likely. If employees are required to render services until they are terminated in order to earn termination benefits, the benefits are recognized ratably over the future service period.
q. Share-based Compensation
The Company measures compensation cost arising from the grant of share-based awards to employees at fair value. The Company recognizes such costs in income over the period during which the requisite service is provided. Refer to Note 12 for further discussion regarding share-based compensation.
r. Accumulated Other Comprehensive Income / (Loss)
The following table presents the components of accumulated other comprehensive loss (in thousands):
|
|
|||||||
|
|
As of December 31, 2017 |
As of December 31, 2016 |
|||||
|
Foreign currency translation adjustments, net of tax of $0.1 million and $10.1 million |
$ |
(24,861) |
$ |
(44,411) | |||
|
Defined benefit plans, net of tax of $15 million and $14.2 million |
(38,249) | (38,972) | |||||
|
Unrealized loss on qualifying cash flow hedge, |
|||||||
|
net of tax (benefit) of ($2.8 million) and $0 million |
(4,698) |
- |
|||||
|
Accumulated other comprehensive loss |
$ |
(67,808) |
$ |
(83,383) | |||
The following table presents the changes in accumulated other comprehensive loss, net of tax, by component for the year ended December 31, 2017 (in thousands):
|
|
Unrealized Losses |
Foreign Currency |
|||||||||
|
|
on Qualifying |
Defined Benefit |
Translation |
||||||||
|
|
Cash Flow Hedge |
Plans |
Adjustments |
Total |
|||||||
|
Balance at December 31, 2016 |
$ |
- |
$ |
(38,972) |
$ |
(44,411) |
$ |
(83,383) | |||
|
Other comprehensive income / (loss) before reclassification |
(4,698) | 723 | 19,550 | 15,575 | |||||||
|
Net current-period other comprehensive income / (loss) |
(4,698) | 723 | 19,550 | 15,575 | |||||||
|
Balance at December 31, 2017 |
$ |
(4,698) |
$ |
(38,249) |
$ |
(24,861) |
$ |
(67,808) | |||
62
The following table presents the changes in accumulated other comprehensive loss, net of tax, by component for the year ended December 31, 2016 (in thousands):
|
|
Foreign Currency |
||||||||||
|
|
Defined Benefit |
Translation |
|||||||||
|
|
Plans |
Adjustments |
Total |
||||||||
|
Balance at December 31, 2015 |
$ |
(40,002) | (40,490) |
$ |
(80,492) | ||||||
|
Other comprehensive income / (loss) before reclassification |
1,030 | (3,921) | (2,891) | ||||||||
|
Net current-period other comprehensive income / (loss) |
1,030 | (3,921) | (2,891) | ||||||||
|
Balance at December 31, 2016 |
$ |
(38,972) |
$ |
(44,411) |
$ |
(83,383) | |||||
s. Estimates
The preparation of the Company’s financial statements in conformity with U.S. GAAP requires management to make estimates and assumptions that affect the reported amounts of assets and liabilities and the disclosures related to contingent assets and liabilities at the reporting date and the reported amounts of revenues and expenses during the reporting period. Generally, matters subject to estimation and judgment include amounts related to accounts receivable realization, fair value measurements, pension and other postretirement benefit plan assumptions, restructuring reserves, asset valuation reserves and accruals related to environmental remediation costs, asset retirement obligations, and income taxes. Actual results may differ from those estimates and assumptions and changes in such estimates and assumptions may affect amounts reported in future periods.
Note 4. Acquisition of Operations in Mexico City, Mexico
On July 24, 2015, a subsidiary of the Company acquired 100% of the issued and outstanding shares of Herrajes y Acabados Metálicos, S.A. de C.V. (“Hamsa”). The acquisition was accounted for as a purchase under the acquisition method in accordance with FASB ASC No. 805, Business Combinations. The total purchase price was approximately $26.1 million, which does not include direct acquisition costs of approximately $0.4 million. The acquisition was recorded by allocating the purchase price to the assets acquired, including identifiable intangible assets, and liabilities assumed, based on their estimated fair values at the date of acquisition. There was goodwill of $9 million which is not tax deductible and an intangible asset of $3.6 million recorded in connection with the acquisition. Supplemental pro forma disclosures are not included as the amounts are deemed immaterial.
Note 5. Restructuring and Asset Impairment Charges
As of December 31, 2017, the Company has executed various restructuring plans and may execute additional plans in the future to realign manufacturing capacity to prevailing global automotive production and to improve the utilization of remaining facilities. Estimates of restructuring charges are based on information available at the time such charges are recorded. Due to the inherent uncertainty involved in estimating restructuring expenses, actual amounts paid for such activities may differ from amounts initially recorded. Accordingly, the Company may record revisions of previous estimates by adjusting previously established reserves.
Restructuring Charges
Net restructuring and asset impairment charges for each of the Company’s segments include the following (in thousands):
|
|
Year Ended December 31, |
||||||||
|
|
2017 |
2016 |
2015 |
||||||
|
Europe |
$ |
1,948 |
$ |
117 |
$ |
231 | |||
|
North America |
8,787 | 5,272 | 7,588 | ||||||
|
Consolidated |
$ |
10,735 |
$ |
5,389 |
$ |
7,819 | |||
The following table sets forth the Company’s net restructuring and asset impairment charges by type for the periods presented (in thousands):
|
|
Year Ended December 31, |
||||||||
|
|
2017 |
2016 |
2015 |
||||||
|
Employee termination costs |
$ |
9,499 |
$ |
811 |
$ |
260 | |||
|
Other exit costs |
1,236 | 4,578 | 7,559 | ||||||
|
Total restructuring expense |
$ |
10,735 |
$ |
5,389 |
$ |
7,819 | |||
63
The charges incurred during 2017, 2016, and 2015 primarily related to the following actions:
2017 Actions
During the year ended December 31, 2017, the charges incurred in the North America and Europe segments related to severance charges to reduce corporate overhead and ongoing maintenance expense of facilities closed as a result of prior actions. During 2017, the Company took numerous actions to better align the management teams to the remaining footprint of the continuing operations. These actions included a shift in composition of the executive leadership team as well as certain changes within the Corporate and Regional management teams. All estimated costs related to these actions have been recorded during 2017.
2016 Actions
During the year ended December 31, 2016, the charges incurred in the North America segment related to the buyout of a lease on a previously closed facility, ongoing maintenance expense of facilities closed as a result of prior actions and severance charges to reduce fixed costs. The charges incurred in the Europe segment related to severance charges to reduce fixed costs and a revision of a previous estimate.
2015 Actions
During the year ended December 31, 2015, the charges incurred in the North America segment related to a liability established to reflect a change in estimated future rents on a previously closed facility, ongoing maintenance expense of facilities closed as a result of prior actions and severance charges to reduce fixed costs. The charges incurred in the Europe segment related to severance charges to reduce fixed costs and a revision of a previous estimate.
Restructuring Reserve
The following table summarizes the activity in the restructuring reserve, which is included in the Consolidated Balance Sheets in accrued liabilities, by segment, for the above-mentioned actions through December 31, 2017 (in thousands):
|
|
Europe |
North America |
Consolidated |
||||||
|
Balance at December 31, 2015 |
$ |
99 |
$ |
213 |
$ |
312 | |||
|
Payments |
(124) | (710) | (834) | ||||||
|
Increase in liability |
117 | 694 | 811 | ||||||
|
Balance at December 31, 2016 |
$ |
92 |
$ |
197 |
$ |
289 | |||
|
Payments |
(1,063) | (3,678) | (4,741) | ||||||
|
Increase in liability |
1,948 | 7,551 | 9,499 | ||||||
|
Balance at December 31, 2017 |
$ |
977 |
$ |
4,070 |
$ |
5,047 | |||
Except as disclosed in the table above, the Company does not anticipate incurring additional material cash charges associated with the actions described above. The increase in the restructuring reserve set forth in the table above does not agree with the restructuring charges for the period, as certain items are expensed as incurred related to the actions described.
The restructuring reserve increased during the year ended December 31, 2017, reflecting primarily accruals for severance, offset partially by payments related to 2017 restructuring actions and prior accruals. The restructuring reserve decreased during the year ended December 31, 2016, reflecting primarily payments of other exit costs related to prior accruals, offset partially by accruals for severance.
During the year ended December 31, 2017, the Company incurred payments related to prior accruals in Europe of $1.1 million and in North America of $3.7 million. During the year ended December 31, 2016, the Company incurred payments related to prior accruals in Europe of $0.1 million and in North America of $0.7 million.
64
Note 6. Discontinued Operations and Assets Held for Sale
The following table discloses select financial information of the discontinued operations of the Company’s Chinese joint ventures and Brazilian operations (in thousands):
|
|
Year Ended December 31, |
||||||||
|
|
2017 |
2016 |
2015 |
||||||
|
Revenues |
$ |
77,915 |
$ |
119,786 |
$ |
245,680 | |||
|
Gain / (loss) from sale of discontinued operations |
(2,596) |
- |
18,806 | ||||||
|
Income / (loss) from discontinued operations: |
|||||||||
|
Income / (loss) before provision for income taxes and |
|||||||||
|
equity in income / (loss) of joint venture |
2,245 | (14,494) | 11,764 | ||||||
|
Provision for income taxes |
392 | 2,514 | 1,394 | ||||||
|
Equity in loss of joint venture, net of tax |
- |
- |
46 | ||||||
|
Income / (loss) from discontinued operations, net of tax |
$ |
1,853 |
$ |
(17,008) |
$ |
10,324 | |||
China Joint Ventures
On December 6, 2015, the Company completed the sale of its equity interest in its Xiangtan joint venture. The sale agreement provided for the repayment of $9.9 million of the Company’s shareholder loans to the joint venture, and the purchase of the Company’s equity in the joint venture for $3.5 million, net of tax.
On December 31, 2015, the Company completed the sale of its equity interest in its TGR joint venture. The sale agreement provided for the purchase of the Company’s equity in the joint venture for $29.4 million, and the payment of a dividend of $14.8 million, net of tax.
In October of 2016, the Company entered into an agreement to sell its Wuhu joint venture. The sale agreement provided for the purchase of the Company’s equity in the joint venture for approximately $21 million, net of tax. The Company received proceeds of $4.5 million in the fourth quarter of 2016. On May 9, 2017, the Company completed the sale of its equity interest in Wuhu. During the second quarter of 2017, the Company received total net proceeds of $15.9 million related to the sale, which resulted in a total sales price that was less than the carrying value of the net assets of Wuhu. In addition, the Company incurred certain transaction related costs; therefore, a net loss of $2.6 million was recorded in the second quarter of 2017.
Xiangtan, TGR, and Wuhu have been presented as discontinued operations in the Company’s Consolidated Financial Statements, in accordance with FASB ASC No. 205, Discontinued Operations.
Also, in October of 2016, the Company entered into an agreement to sell its Ningbo joint venture. The agreement is subject to Chinese government approval. The sale agreement provided for purchase of the Company’s equity in the joint venture for approximately $4 million, net of tax. The Company anticipates that this transaction will close in the first quarter of 2018.
As of December 31, 2017, the Company’s China joint venture in Ningbo has been presented as discontinued operations, and is considered held for sale in accordance with FASB ASC No. 360, Property, Plant, and Equipment, and FASB ASC No. 205, Discontinued Operations.
Brazil Operations
On December 21, 2015, the Company sold one of its two operations in Brazil. Net cash proceeds from this sale were $9.5 million. During the second quarter of 2016, the Company’s Board of Directors approved a plan to sell the Company’s remaining business operations in Brazil. At December 31, 2017, the remaining Brazilian business operations are considered held for sale in accordance with FASB ASC No. 360, Property, Plant, and Equipment, and presented as discontinued operations in the Consolidated Financial Statements, in accordance with FASB ASC No. 205, Discontinued Operations.
65
The following table summarizes assets and liabilities held for sale by category (in thousands):
|
|
December 31, 2017 |
December 31, 2016 |
||||
|
|
||||||
|
ASSETS |
||||||
|
Current assets |
$ |
24,024 |
$ |
59,137 | ||
|
Property, plant, and equipment, net |
29,239 | 47,640 | ||||
|
Other assets, net |
9,387 | 13,575 | ||||
|
Fair value adjustment |
(18,400) | (18,100) | ||||
|
Total assets held for sale |
$ |
44,250 |
$ |
102,252 | ||
|
|
||||||
|
LIABILITIES |
||||||
|
Short-term debt and current maturities of capital lease obligations |
$ |
1,129 |
$ |
2,792 | ||
|
Accounts payable and accrued liabilities |
11,877 | 43,661 | ||||
|
Total current liabilities |
13,006 | 46,453 | ||||
|
|
||||||
|
Long-term debt, net of current maturities |
1,223 | 2,393 | ||||
|
Other non-current liabilities |
3,107 | 4,464 | ||||
|
Total non-current liabilities |
4,330 | 6,857 | ||||
|
Total liabilities held for sale |
$ |
17,336 |
$ |
53,310 | ||
Note 7. Debt
Short-Term Debt
Short-term debt consists of the following (in thousands):
|
|
December 31, 2017 |
December 31, 2016 |
||||
|
Current maturities of debts (excluding capital leases) |
$ |
36,500 |
$ |
33,277 | ||
|
Current maturities of capital leases |
5,548 | 934 | ||||
|
Total short-term debt |
$ |
42,048 |
$ |
34,211 | ||
Long-Term Debt
Long-term debt consists of the following (in thousands):
|
|
December 31, 2017 |
December 31, 2016 |
||||
|
Term Loan Credit Facility (net of discount of $2,288 and $827) |
$ |
356,501 |
$ |
361,798 | ||
|
Other foreign subsidiary indebtedness |
32,885 | 28,777 | ||||
|
Debt issue costs |
(8,148) | (6,066) | ||||
|
Total debt |
381,238 | 384,509 | ||||
|
Less: Current maturities of debts (excluding capital leases) |
(36,500) | (33,277) | ||||
|
Total long-term debt |
$ |
344,738 |
$ |
351,232 | ||
66
Future maturities of long-term debt as of December 31, 2017 are as follows (in thousands):
|
|
|||
|
2018 |
$ |
36,500 | |
|
2019 |
3,615 | ||
|
2020 |
3,615 | ||
|
2021 |
3,615 | ||
|
2022 |
3,615 | ||
|
2023 |
3,615 | ||
|
2024 |
334,811 | ||
|
Thereafter |
- |
||
|
Total |
$ |
389,386 | |
|
Less: Debt issue costs |
(8,148) | ||
|
Total, net of debt issue costs |
$ |
381,238 |
Term Loan Credit Facility
On April 23, 2013, the Company entered into a Term Loan and Guaranty Agreement (the “Term Loan Credit Agreement”) by and among Tower Automotive Holdings USA, LLC (the “Term Loan Borrower”), the Company, Tower Automotive Holdings I, LLC (“Term Loan Holdco”), Tower Automotive Holdings II(a), LLC, Tower Automotive Holdings II(b), LLC, the subsidiary guarantors named therein, the Lenders from time to time party thereto and Citibank, N.A., as administrative agent for the Lenders (the credit facility evidenced by the Term Loan Credit Agreement and related documentation, the “Term Loan Credit Facility”).
On January 31, 2014, the Company amended the Term Loan Credit Agreement by entering into the Second Refinancing Term Loan Amendment and Additional Term Loan Amendment (“Second Term Loan Amendment”), pursuant to which, among other things, the outstanding term loans under the Term Loan Credit Agreement were refinanced in full and additional term loans in an aggregate principal amount of approximately $33 million (the “Additional Term Loans”) were disbursed, resulting in an increase in cash and cash equivalents. After giving effect to the disbursement of the Additional Term Loans, there were term loans (the “Term Loans”) in the aggregate principal amount of $450 million outstanding under the Term Loan Credit Agreement. The maturity date of the Term Loan Credit Facility remains April 23, 2020 and the Term Loans bear interest at (i) the Alternate Base Rate plus a margin of 2.00% or (ii) the Adjusted LIBO Rate (calculated by multiplying the applicable LIBOR rate by a statutory reserve rate, with a floor of 1.00%) plus a margin of 3.00%.
On March 7, 2017, the Company amended the Term Loan Credit Agreement by entering into the Third Refinancing Term Loan Amendment and Restatement Agreement (“Third Term Loan Amendment”), pursuant to which, among other things, the outstanding term loans under the Term Loan Credit Agreement were refinanced in full. There were no additional borrowings associated with this refinancing. The aggregate principal amount of $358.9 million was outstanding under the Term Loan Credit Agreement upon amendment. The maturity date of the Term Loan Credit Facility is March 7, 2024 and the Term Loans bear interest at (i) the Alternate Base Rate plus a margin of 1.75% or (ii) the Adjusted LIBO Rate (calculated by multiplying the applicable LIBOR rate by a statutory reserve rate) plus a margin of 2.75%.
The Term Loan Borrower’s obligations under the Term Loan Credit Facility are guaranteed by the Company on an unsecured basis and guaranteed by Term Loan Holdco and certain of the Company's other direct and indirect domestic subsidiaries on a secured basis (the “Subsidiary Guarantors”). The Term Loan Credit Facility is secured by (i) a first priority security interest in certain assets of the Term Loan Borrower and the Subsidiary Guarantors, other than, inter alia, accounts, chattel paper, inventory, cash deposit accounts, securities accounts, machinery, equipment and real property and all contract rights, and records and proceeds relating to the foregoing and (ii) on a second priority basis to all other assets of the Term Loan Borrower and the Subsidiary Guarantor which have been pledged on a first priority basis to the agent for the benefit of the lenders under the Amended Revolving Credit Facility described below.
The Term Loan Credit Agreement includes customary covenants applicable to certain of the Company’s subsidiaries and includes customary events of default and amounts due there under may be accelerated upon the occurrence of an event of default.
On February 2, 2015 the Company made a $25 million voluntary repayment on its Term Loan Credit Facility. In connection with this prepayment, the Company accelerated the amortization of the original issue discount and the associated debt issue costs by $0.4 million in the first quarter of 2015.
67
On January 15, 2016, the Company made a $50 million voluntary repayment on its Term Loan Credit Facility. In connection with this prepayment, the Company accelerated the amortization of the original issue discount and the associated debt issue costs by $0.7 million in the first quarter of 2016.
As of December 31, 2017, the outstanding principal balance of the Term Loan Credit Facility was $356.5 million (net of a remaining $2.3 million original issue discount) and the effective interest rate was 4.19% per annum.
Amended Revolving Credit Facility
On September 17, 2014, the Company entered into a Third Amended and Restated Revolving Credit and Guaranty Agreement (“Third Amended Revolving Credit Facility Agreement”), by and among Tower Automotive Holdings USA, LLC, the Company, Tower Automotive Holdings I, LLC, Tower Automotive Holdings II(a), LLC, Tower Automotive Holdings II(b), LLC, the subsidiary guarantors named therein, the financial institutions from time to time party thereto as Lenders, and JPMorgan Chase Bank, N.A. as Issuing Lender, as Swing Line Lender, and as Administrative Agent for the Lenders. The Third Amended Revolving Credit Facility Agreement amended and restated, in its entirety, the Second Amended Revolving Credit Facility Agreement, dated as of June 19, 2013, by and among Tower Automotive Holdings USA, LLC (“the Borrower”), its domestic affiliate and domestic subsidiary guarantors named therein, and the lenders party thereto, and the Agent.
The Third Amended Revolving Credit Facility Agreement provides for a cash flow revolving credit facility (the “Amended Revolving Credit Facility”) in the aggregate amount of up to $200 million. The Third Amended Revolving Credit Facility Agreement also provides for the issuance of letters of credit in an aggregate amount not to exceed $50 million, provided that the total amount of credit (inclusive of revolving loans and letters of credit) extended under the Third Amended Revolving Credit Facility Agreement is subject to an overall cap, on any date, of $200 million. The Company may request the issuance of Letters of Credit denominated in Dollars or Euros. The expiration date for the Amended Revolving Credit Facility is September 16, 2019.
On March 7, 2017, the Company entered into a Fourth Amended and Restated Revolving Credit and Guaranty Agreement (“Fourth Amended Revolving Credit Facility Agreement”), by and among Tower Automotive Holdings USA, LLC, the Company, Tower Automotive Holdings I, LLC, Tower Automotive Holdings II(a), LLC, the subsidiary guarantors named therein, the financial institutions from time to time party thereto as Lenders, and JPMorgan Chase Bank, N.A. as Issuing Lender, as Swing Line Lender, and as Administrative Agent for the Lenders.
The Fourth Amended Revolving Credit Facility Agreement amended and restated, in its entirety, the Third Amended Revolving Credit Facility Agreement, dated as of September 17, 2014, by and among the Borrower, its domestic affiliate and domestic subsidiary guarantors named therein, and the lenders party thereto, and the Agent. The Fourth Amended Revolving Credit Facility Agreement provides for a cash flow revolving credit facility (the “Amended Revolving Credit Facility”) in the aggregate amount of up to $200 million. The Fourth Amended Revolving Credit Facility Agreement also provides for the issuance of letters of credit in an aggregate amount not to exceed $30 million, provided that the total amount of credit (inclusive of revolving loans and letters of credit) extended under the Fourth Amended Revolving Credit Facility Agreement is subject to an overall cap, on any date, of $200 million. The Company may request the issuance of Letters of Credit denominated in Dollars or Euros.
Advances under the Amended Revolving Credit Facility bear interest at an alternate base rate plus a base rate margin or LIBOR plus a Eurodollar margin. The applicable margins are determined by the Company’s Total Net Leverage Ratio (as defined in the Fourth Amended Revolving Credit Facility Agreement). As of December 31, 2017, the applicable margins were 1.50% per annum and 2.50% per annum for base rate and LIBOR based borrowings, respectively. Borrowings outstanding under our Amended Revolving Credit Facility may vary significantly from time to time, depending on our cash needs at any given time. Our Amended Revolving Credit Facility matures on March 7, 2022.
The Amended Revolving Credit Facility is guaranteed by the Company on an unsecured basis and is guaranteed by certain of the Company’s other direct and indirect domestic subsidiaries on a secured basis. The Amended Revolving Credit Facility is secured (i) by a first priority security interest in certain assets of the Borrower and the Subsidiary Guarantors, including accounts, inventory, chattel paper, cash, deposit accounts, securities accounts, machinery, equipment and real property and all contract rights, and records and proceeds relating to the foregoing and (ii) on a second priority basis to all other assets of the Borrower and the Subsidiary Guarantors. The Borrower’s and each Subsidiary Guarantor’s pledge of such assets as security for the obligations under the Amended Revolving Credit Facility is evidenced by a Revolving Credit Security Agreement dated as of March 17, 2017, among the Borrower, the guarantors party thereto, and the Agent.
68
Our Amended Revolving Credit Facility Agreement contains customary covenants applicable to certain of our subsidiaries, including financial maintenance covenant ratios requiring the Borrower and the Guarantors to maintain a ratio, as of the last day of any fiscal quarter, of (i) consolidated adjusted EBITDA to consolidated interest charges of not less than 2.75 to 1.00 on a rolling four quarter basis; and (ii) total net debt to consolidated adjusted EBITDA not to exceed 3.50 to 1.00 on a rolling four quarter basis.
As of December 31, 2017, there was $192 million of borrowing availability under the Amended Revolving Credit Facility, of which no borrowings were outstanding and $8 million letters of credit were outstanding.
Other Foreign Subsidiary Indebtedness
As of December 31, 2017, other foreign subsidiary indebtedness of $32.9 million consisted of receivables factoring in Europe.
The change in foreign subsidiary indebtedness from December 31, 2016 to December 31, 2017 is explained by the following (in thousands):
|
|
Europe |
||
|
Balance at December 31, 2016 |
$ |
28,777 | |
|
Maturities of indebtedness |
(7,377) | ||
|
Change in borrowings on credit facilities, net |
7,429 | ||
|
Foreign exchange impact |
4,057 | ||
|
Balance at December 31, 2017 |
$ |
32,885 | |
Generally, borrowings of foreign subsidiaries are made under credit agreements with commercial lenders and are used to fund working capital and other operating requirements.
Europe
As of December 31, 2017, the receivables factoring facilities balance available to the Company was $32.9 million (€27.4 million), of which the entire amount was drawn. These are uncommitted, demand facilities which are subject to termination at the discretion of the banks and bear interest rates based upon the average three month EURIBOR plus a spread ranging from 2.50% to 3.00%. The effective annual interest rates as of December 31, 2017 ranged from 2.17% to 2.67%, with a weighted average interest rate of 2.49% per annum. Any receivables factoring under these facilities is with recourse and is secured by the accounts receivable factored. These receivables factoring transactions are recorded in the Company’s Consolidated Balance Sheets in short-term debt and current maturities of capital lease obligations.
As of December 31, 2017, the secured line of credit balance available to the Company was $12 million (€10 million), of which no borrowings were outstanding. During the fourth quarter of 2017, the Company extended the maturity date one year from October 2017 to October 2018. The facility bears an interest rate based on the EURIBOR plus a spread of 1.15%. The facility is secured by certain accounts receivable related to customer funded tooling, real estate, and other assets and are subject to negotiated prepayments upon the receipt of funds from completed customer projects.
During the fourth quarter of 2017, the Company's European subsidiaries replaced its asset-based revolving credit facility with a new bank. As of December 31, 2017, the balance available to the Company was $42 million (€35 million), of which no borrowings were outstanding. Advances under this facility bear interest at the three month EURIBOR plus a margin or at EONIA plus a margin. The applicable margin is determined by the Company's total net leverage ratio as defined in the debt agreement. The applicable margin as of December 31, 2017 was 1.95%. The Company is required to pay a commitment fee at a rate equal to 0.6825% per annum on the average daily unused total revolving credit commitment. This facility has a maturity date of November 2022. Availability on the credit facility is determined based upon the appraised value of certain machinery, equipment, and real estate, subject to a borrowing base availability limitation and customary covenants.
The facility that it replaced had an interest rate based upon the one month LIBOR plus a spread of 3.00% to 4.00% and had a maturity date of October 2017. The Company paid a commitment fee at a rate equal to 0.50% per annum on the average daily unused total revolving credit commitment. Availability on the credit facility was determined based upon the appraised value of certain machinery, equipment, and real estate, subject to a borrowing base availability limitation and customary covenants.
Covenants
As of December 31, 2017, the Company was in compliance with all financial covenants that govern its credit agreements.
69
Capital Leases
The Company had the following capital lease obligations as of the dates presented (in thousands). These capital lease obligations expire in March 2018:
|
|
December 31, 2017 |
December 31, 2016 |
||||
|
Current maturities of capital leases |
$ |
5,548 |
$ |
934 | ||
|
Non-current maturities of capital leases |
- |
4,863 | ||||
|
Total capital leases |
$ |
5,548 |
$ |
5,797 | ||
Debt Issue Costs
The Company had debt issuance costs, net of amortization, of $8.2 million and $6.1 million as of December 31, 2017 and December 31, 2016, respectively. These amounts are reflected in the Consolidated Balance Sheets as a direct deduction from long-term debt, net of current maturities, rather than as an asset, in accordance with ASU No. 2015-03, Simplifying the Presentation of Debt Issuance Costs.
The Company incurred interest expense related to the amortization of debt issue costs of $2.1 million, $2.9 million, and $2.4 million for the years ended December 31, 2017, 2016, and 2015, respectively.
Note 8. Derivative Financial Instruments
The Company’s derivative financial instruments include interest rate and cross currency swaps. The Company does not enter into derivative financial instruments for trading or speculative purposes. On an on-going basis, the Company monitors counterparty credit ratings. The Company considers credit non-performance risk to be low because the Company enters into agreements with commercial institutions that have at least an S&P, or equivalent, investment grade credit rating. On October 17, 2014, the Company entered into a $200 million variable rate to fixed rate interest rate swap for a portion of the Company’s Term Loan and a €157.1 million cross currency swap based on the U.S. dollar / Euro exchange spot rate of $1.2733 which was the prevailing rate at the time of the transaction. The maturity date for both swap instruments was April 16, 2020.
On January 23, 2015, the Company terminated the cross currency swap entered into on October 17, 2014 and received $21.9 million in cash proceeds. The Company then entered into a new cross currency swap to hedge its net investment in Europe (U.S. dollar / Euro exchange spot rate was $1.1265). The Euro notional amount was increased from €157.1 million to €178 million and the interest rate was lowered from 3.97% to 3.70% per annum. Using the proceeds received from the swap termination transaction, the Company made a $25 million voluntary repayment on its Term Loan Credit Facility on February 2, 2015.
On March 13, 2015, the Company terminated the cross currency swap entered into on January 23, 2015 and received $10.5 million in cash proceeds. The Company then entered into a new cross currency swap to hedge its net investment in Europe (U.S. dollar / Euro exchange spot rate was $1.0480). The Euro notional amount remained the same but the interest rate was lowered from 3.70% to 3.40% per annum.
On April 16, 2015, the Company reduced the U.S. dollar notional amount on the interest rate swap from $200 million to $186.1 million, but the 5.09% interest rate per annum and the maturity date of April 16, 2020 remained the same. The interest rate is fixed at 5.09% per annum, but the fair value of the swap will fluctuate with changes in interest rates.
On March 7, 2017, the Company amended the variable rate to fixed rate interest rate swap, for a portion of the Company’s Term Loan, entered into on October 17, 2014. The U.S. dollar notional amount remained the same at $186.1 million, the fixed interest rate was changed from 5.09% to 5.628% per annum, and the maturity date was extended from April 16, 2020 to March 7, 2024.
Also on March 7, 2017, the Company amended the cross currency swap, entered into on January 23, 2015, into a new cross currency swap, to hedge its net investment in Europe, based on the U.S. dollar / Euro exchange spot rate of $1.04795. The Euro notional amount remained the same at €178 million, the interest rate was lowered from 3.40% to 2.85%, and the maturity date was extended from April 16, 2020 to March 7, 2024.
Both swaps were amended and restated in conjunction with the March 7, 2017 amendment to the Company’s Term Loan Credit Agreement.
70
On August 31, 2017, the Company amended certain of its variable rate to fixed rate interest rate swaps, for a portion of the Company’s Term Loan, entered into on March 7, 2017. The U.S. dollar notional amount remained the same at $186.1 million, the fixed interest rate was changed from 5.628% to 5.878% per annum for certain swaps, and the maturity date remained at March 7, 2024. The fair value of the swap will fluctuate with changes in interest rates. This amendment was considered a termination event per FASB ASC No. 815, Derivatives and Hedging; therefore, the balance within AOCI will be frozen and recognized in results of operations over the remaining term of the hedged transaction. As of December 31, 2017, $7 million was recorded in AOCI and $0.4 million was recognized in interest expense during the year ended December 31, 2017.
At December 31, 2017 (when the U.S. dollar / Euro exchange spot rate was $1.2009) and December 31, 2016 (when the U.S. dollar / Euro exchange spot rate was $1.0516), the following amounts were recorded in the Consolidated Balance Sheets as being receivable from or payable to counterparties under FASB ASC No. 815, Derivatives and Hedging (in thousands):
|
|
Location |
December 31, 2017 |
December 31, 2016 |
|||||
|
Net investment hedge |
Other non-current liabilities |
$ |
27,001 |
$ |
4,993 | |||
|
Interest rate swap |
Other non-current liabilities |
8,918 | 2,451 | |||||
All derivative instruments are recorded at fair value. Effectiveness for net investment and cash flow hedges is initially assessed at the inception of the hedging relationship and on a quarterly basis thereafter. To the extent that derivative instruments are deemed to be effective, changes in the fair value of derivatives are recognized in the Consolidated Balance Sheets as AOCI, and to the extent they are ineffective or were not designated as part of a hedge transaction, they are recorded in the Consolidated Statements of Operations as interest expense, net. The cross currency swap qualifies as a net investment hedge of the Company’s European subsidiaries. The interest rate swap qualifies as a cash flow hedge of the interest payments related to the Company’s Term Loan. Prior to March 7, 2017, the Company had not accounted for the interest rate swap as a cash flow hedge, and all changes in fair value were recognized in the Consolidated Statements of Operations as interest expense, net.
The following table presents deferred gains / (losses) reported in AOCI at December 31, 2017 and December 31, 2016, respectively (in thousands):
|
|
Deferred gain / (loss) in AOCI |
|||||
|
|
Year Ended December 31, |
|||||
|
|
2017 |
2016 |
||||
|
Net investment hedge |
$ |
9,849 |
$ |
35,699 | ||
|
Interest rate hedge |
(7,537) |
- |
||||
|
Total |
$ |
2,312 |
$ |
35,699 | ||
Derivative instruments held during the period resulted in the following expense recorded in income during the year ended December 31, 2017 and December 31, 2016, respectively (in thousands):
|
|
(Income) / expense recognized |
|||||
|
|
(ineffective portion) |
|||||
|
|
Year Ended December 31, |
|||||
|
|
2017 |
2016 |
||||
|
Net investment hedge |
$ |
(3,841) |
$ |
2,548 | ||
|
Interest rate swap |
(1,070) | (141) | ||||
|
Total |
$ |
(4,911) |
$ |
2,407 | ||
71
Note 9. Income Taxes
Tax Summary
The Company’s income tax expense, deferred tax assets and liabilities, and reserves for unrecognized tax benefits reflect management's best assessments of estimated current and future taxes to be paid. The Company is subject to income taxes in numerous foreign jurisdictions. Significant judgments and estimates are required in determining the consolidated income tax expense.
The summary of income / (loss) before provision for income taxes and noncontrolling interests consisted of the following (in thousands):
|
|
|||||||||
|
|
Year Ended December 31, |
||||||||
|
2017 |
2016 |
2015 |
|||||||
|
Domestic |
$ |
78,361 |
$ |
36,812 |
$ |
32,998 | |||
|
Foreign |
22,955 | 36,722 | 28,625 | ||||||
|
Total |
$ |
101,316 |
$ |
73,534 |
$ |
61,623 | |||
The provision / (benefit) for income taxes consisted of the following (in thousands):
|
|
|||||||||
|
|
Year Ended December 31, |
||||||||
|
2017 |
2016 |
2015 |
|||||||
|
Current: |
|||||||||
|
Domestic – Federal |
$ |
439 |
$ |
152 |
$ |
487 | |||
|
Domestic – State |
(249) | 1,179 | 346 | ||||||
|
Foreign |
9,118 | 6,369 | 6,287 | ||||||
|
Total |
9,308 | 7,700 | 7,120 | ||||||
|
Deferred and other: |
|||||||||
|
Domestic – Federal |
42,675 | 6,564 | (117,582) | ||||||
|
Domestic – State |
537 | 882 | (11,540) | ||||||
|
Foreign |
2,914 | 2,100 | (1,842) | ||||||
|
Total |
46,126 | 9,546 | (130,964) | ||||||
|
Total provision / (benefit) for income taxes |
$ |
55,434 |
$ |
17,246 |
$ |
(123,844) | |||
A reconciliation of income tax expense from continuing operations and the U.S. federal statutory income tax expense were as follows (in thousands):
|
|
|||||||||
|
|
Year Ended December 31, |
||||||||
|
2017 |
2016 |
2015 |
|||||||
|
Taxes at U.S. Federal statutory rate |
$ |
35,461 |
$ |
25,737 |
$ |
21,568 | |||
|
State tax expense |
187 | 1,511 | 1,036 | ||||||
|
Foreign tax rate differential |
(473) | (1,950) | (2,575) | ||||||
|
Valuation allowance |
4,767 | 1,517 | (121,082) | ||||||
|
Permanent differences |
(1,873) | (2,132) | 659 | ||||||
|
U.S. Tax Reform - Deferred Tax Asset Revaluation |
27,163 |
- |
- |
||||||
|
Foreign withholding taxes |
- |
(231) | 765 | ||||||
|
Increase / (decrease) in uncertain tax positions |
1,021 | 772 | 275 | ||||||
|
U.S. taxes on foreign earnings |
- |
- |
(3,500) | ||||||
|
Tax credits |
(10,365) | (7,855) | (23,136) | ||||||
|
Other |
(454) | (123) | 2,146 | ||||||
|
Total income tax expense / (benefit) |
$ |
55,434 |
$ |
17,246 |
$ |
(123,844) | |||
72
On December 22, 2017, the Tax Cuts and Jobs Act (the “TCJA”) was enacted into federal law. The Company has recorded tax expense of $27.2 million in the fourth quarter of fiscal 2017, primarily due to the remeasurement of its net deferred tax assets.
Deferred income taxes are primarily provided for temporary differences between the financial reporting basis and the tax basis of the Company’s assets and liabilities. The tax effects of each type of temporary difference and carryforward that give rise to a significant portion of deferred tax assets / (liabilities) are summarized as follows (in thousands):
|
|
||||||
|
|
December 31, |
December 31, |
||||
|
|
2017 |
2016 |
||||
|
Deferred income tax assets are attributable to: |
||||||
|
Net operating loss carryforwards and tax credits |
$ |
106,069 |
$ |
111,423 | ||
|
Non-deductible reserves and other accruals |
25,733 | 35,728 | ||||
|
Accrued pension and postretirement benefit obligations |
13,148 | 24,341 | ||||
|
Hedging |
9,020 | 1,897 | ||||
|
Capitalized leases |
4,276 | 7,696 | ||||
|
Other |
1,848 | 1,962 | ||||
|
Total gross deferred income tax assets |
160,094 | 183,047 | ||||
|
Less: valuation allowance |
(54,660) | (44,535) | ||||
|
Net deferred income tax assets |
$ |
105,434 |
$ |
138,512 | ||
|
Deferred income tax liabilities are attributable to: |
||||||
|
Deferred cancellation of indebtedness income |
(2,236) | (6,912) | ||||
|
Prepaid tooling development costs |
(7,784) |
- |
||||
|
Long lived assets |
(17,186) | (24,549) | ||||
|
Total gross deferred income tax liabilities |
(27,206) | (31,461) | ||||
|
Net deferred income tax asset / (liability) |
$ |
78,228 |
$ |
107,051 | ||
As of December 31, 2017 and 2016, the amount of valuation allowance that existed was $54.7 and $44.5 million respectively. The valuation allowance increased $10.2 million due to U.S. tax reform affecting the potential realizability of the Company's foreign tax credits. The Company also established a valuation allowance on one of its European subsidiary's deferred tax assets in the third quarter due to cumulative losses at this entity. The Company continually monitors all available evidence to determine if sufficient future taxable income will be generated to utilize the existing deferred tax assets. The Company also continues to maintain valuation allowances in certain international jurisdictions, and certain state tax credits, which the Company anticipates will expire before the Company can utilize them.
As of December 31, 2017, the Company has U.S. net operating loss (“NOL”) carryforwards of $81.1 million that expire during the years 2030 through 2033, state NOL carryforwards of $13.6 million and state credit carryforwards of $23.3 million that expire during the years 2018 to 2035. The Company also has tax credit carryforwards of $45.1 million related to federal research, alternative minimum tax and foreign tax credits.
The Company’s international subsidiaries have NOL carryforwards of $99.9 million and other local income tax NOL carryforwards of $5.9 million at December 31, 2017, many of which are unlimited, while others expire as soon as 2018.
The TCJA includes significant changes to the U.S. corporate income tax system. Among other items, the TCJA lowers the corporate income tax rate to 21% from the current 35% and creates a new modified territorial tax system exempting foreign profits from U.S. taxation with some exceptions. The TCJA also requires a one-time deemed repatriation of accumulated foreign earnings for the year ended December 31, 2017. To determine the amount of the deemed repatriation and any associated repatriation tax, the Company must determine, in addition to other factors, the amount of post-1986 profits or losses of each foreign subsidiary, as well as the amount of foreign income taxes paid on such profits or losses. The Company has made a reasonable estimate that no transition tax is due; however, this represents a provisional estimate. The Company is gathering additional information to more precisely compute the amount of its deemed repatriation, if any. The Company does not believe U.S. tax law imposing minimum income taxes on foreign excess returns or base erosion earnings stripping payments to foreign affiliates will have any impact on the Company.
73
The Company has not made a provision for foreign income or withholding taxes related to investments in foreign subsidiaries that are indefinitely reinvested. Any excess of the amount for financial reporting over the tax basis in these investments is not significant as of December 31, 2017.
Unrecognized Tax Benefits
A reconciliation of the beginning and ending amounts of unrecognized tax benefits are as follows (in thousands):
|
|
|||||||||
|
|
Year Ended December 31, |
||||||||
|
2017 |
2016 |
2015 |
|||||||
|
Unrecognized tax benefit – January 1 |
$ |
6,040 |
$ |
11,379 |
$ |
12,218 | |||
|
Increase in prior year tax positions |
247 |
- |
- |
||||||
|
Decrease in prior year tax positions |
- |
(3,714) |
- |
||||||
|
Increase in current year tax positions |
1,679 | 1,483 | 2,866 | ||||||
|
Audit settlements |
(793) | (1,531) | (2,504) | ||||||
|
Lapse in statute of limitations |
(277) | (340) | (296) | ||||||
|
Foreign currency translation |
351 | (303) | (905) | ||||||
|
Liabilities held for sale |
- |
(934) |
- |
||||||
|
Total |
$ |
7,247 |
$ |
6,040 |
$ |
11,379 | |||
Included in the balance of unrecognized tax benefits at December 31, 2017, 2016, and 2015 are $7.2 million, $6 million, and $10.3 million, respectively, of tax benefits that, if recognized, would affect the effective tax rate. These amounts are primarily associated with uncertainty over qualifying research expenses that generate U.S. Federal research credits and U.S. transfer pricing charges to foreign affiliates. Also included in the balance of unrecognized tax benefits at December 31, 2017, 2016 and 2015 are $5.6 million, $4.4 million, and $3.7 million, respectively, of tax benefits that, if recognized, would result in adjustments to other tax accounts, primarily deferred taxes.
The Company recognizes interest and penalties related to tax benefits as income tax expense. As of December 31, 2017, 2016 and 2015, the Company accrued for the payment of income tax related interest and penalties $0.2 million, $0.2 million and $1.4 million, respectively. The amount of interest and penalty tax expense /or (benefit) was ($0.1) million, ($0.7) million and $0.4 million for the years ended December 31, 2017, 2016, and 2015, respectively.
The Company completed an IRS audit of tax year 2015 in the year 2017 which resulted in no tax adjustments. There are no further IRS audits scheduled. The U.S. statute of limitation extends to the 2008 tax year because the net operating loss carryforward deductions from this year have not been fully utilized. The Company is under audit in Germany for tax years 2013-2015. In October 2016, the German Federal Fiscal Court ruled against the Company's appeal of disallowed interest deductions taken in tax years 2004 and 2005. The court ruled the interest payments made by the Company’s German subsidiary to its parent were non-deductible dividends. The Company was fully reserved for its position. The Company believes appropriate provisions for all outstanding tax issues have been made for all jurisdictions and all open years.
Note 10. Employee Benefit Plans
The Company sponsors a pension and various other postretirement benefit plans for its employees.
Defined Benefit Retirement Plans
The Pension Plan provides benefits for certain current and former U.S. employees. Benefits under the Pension Plan are based on years of service and compensation, as well as other factors. Effective October 1, 2006, the Pension Plan was frozen and the Company ceased accruing any additional benefits. Contributions by the Company are intended to fund benefits that accrued through October 1, 2006.
The Company’s funding policy is to annually contribute amounts to the Pension Plan’s related trust, sufficient to meet the minimum funding requirements of the Employee Retirement Income Security Act of 1974 (“ERISA”) and the Internal Revenue Code of 1986 (the “Code”). The Company expects minimum contribution requirements to the Pension Plan of $6.1 million during 2018. Benefit payments under the Pension Plan are estimated to be $17.3 million, $17.4 million, $16.8 million, $16.7 million, and $16.9 million for the years ending December 31, 2018, 2019, 2020, 2021, and 2022, respectively, for a total of $85.1 million during that five-year period. Aggregate benefit payments under the Pension Plan for the years 2023 through 2027 are estimated to be $78.4 million.
74
The following table provides a reconciliation of the changes in the fair value of Pension Plan assets and the change in the projected benefit obligation (in thousands):
|
|
||||||
|
|
Year Ended |
Year Ended |
||||
|
|
December 31, |
December 31, |
||||
|
|
2017 |
2016 |
||||
|
Reconciliation of fair value of Pension Plan assets: |
||||||
|
Fair value of assets, beginning of period |
$ |
186,473 |
$ |
185,458 | ||
|
Actual return |
28,660 | 13,453 | ||||
|
Employer contributions |
8,600 | 7,646 | ||||
|
Expenses paid from Pension Plan assets |
(3,491) | (2,823) | ||||
|
Benefits paid |
(18,720) | (17,261) | ||||
|
Fair value of assets, end of period |
$ |
201,522 |
$ |
186,473 | ||
|
Change in projected benefit obligation: |
||||||
|
Projected benefit obligation, beginning of period |
$ |
248,100 |
$ |
251,079 | ||
|
Service cost |
19 | 21 | ||||
|
Interest cost |
7,493 | 7,708 | ||||
|
Actuarial (gain)/loss |
12,443 | 6,553 | ||||
|
Benefits paid |
(18,720) | (17,261) | ||||
|
Projected benefit obligation, end of period |
$ |
249,335 |
$ |
248,100 | ||
|
Funded status of the Pension Plan |
$ |
(47,813) |
$ |
(61,627) | ||
At December 31, 2017 and 2016, the funded status of the Pension Plan is recorded as pension liability in the Consolidated Balance Sheets.
At the December 31, 2017 and 2016 measurement dates, the accumulated benefit obligation of the Pension Plan was approximately $249 million and $248 million, respectively.
The following table presents the components of the net periodic pension benefit cost / (income) of the Pension Plan (in thousands):
|
|
|||||||||
|
|
2017 |
2016 |
2015 |
||||||
|
Service cost |
$ |
19 |
$ |
21 |
$ |
27 | |||
|
Interest cost |
7,493 | 7,708 | 7,624 | ||||||
|
Expected return on plan assets |
(10,329) | (10,316) | (12,056) | ||||||
|
Amortization of prior service credit |
(95) | (95) | (95) | ||||||
|
Actuarial loss |
- |
8,330 | 9,066 | ||||||
|
Net periodic benefit cost/(income) |
$ |
(2,912) |
$ |
5,648 |
$ |
4,566 | |||
Pre-tax amounts recognized in other comprehensive income / (loss) for the years ended December 31, 2017, 2016, and 2015 consist of the following (in thousands):
|
|
|||||||||
|
|
Year Ended December 31, |
||||||||
|
2017 |
2016 |
2015 |
|||||||
|
Unrecognized gain/(loss) |
$ |
2,398 |
$ |
2,091 |
$ |
(1,938) | |||
|
Amortization of prior service credit |
(95) | (95) | (95) | ||||||
|
Amount recognized |
$ |
2,303 |
$ |
1,996 |
$ |
(2,033) | |||
75
The following table summarizes the amounts included in accumulated other comprehensive loss, net of tax, related to the Pension Plan (in thousands):
|
|
||||||
|
|
As of December 31, |
|||||
|
2017 |
2016 |
|||||
|
Unrecognized loss |
$ |
(22,777) |
$ |
(25,175) | ||
|
Net prior service credit |
1,665 | 1,760 | ||||
|
Deferred tax impact |
(13,919) | (13,036) | ||||
|
Accumulated other comprehensive loss |
$ |
(35,031) |
$ |
(36,451) | ||
The significant assumptions used in measuring the Company’s projected benefit obligation at the December 31, 2017 and 2016 measurement dates are as follows:
|
|
||||||||
|
|
Year Ended December 31, |
|||||||
|
2017 |
2016 |
|||||||
|
Discount rate |
3.42 |
% |
3.84 |
% |
||||
|
Annual rate of increase in compensation |
4.5 |
% |
4.5 |
% |
||||
The assumptions used in determining net periodic benefit cost are shown below:
|
|
||||||||||||
|
|
Year Ended December 31, |
|||||||||||
|
2017 |
2016 |
2015 |
||||||||||
|
Discount rate |
3.84 |
% |
4.01 |
% |
3.65 |
% |
||||||
|
Expected long-term rate of return on plan assets |
7.4 |
% |
7.4 |
% |
7.4 |
% |
||||||
|
Annual rate of increase in compensation |
4.5 |
% |
4.5 |
% |
4.5 |
% |
||||||
The present value of the Company’s projected benefit obligation is calculated annually with the assistance of third party actuaries. The discount rates used in the calculations are established based upon the results of a yield curve analysis, which calculates a yield to maturity that mirrors the timing and amounts of future benefit payments. The Company utilizes a full yield curve approach in the estimation of these components by applying the specific spot rates along the yield curve used in the determination of the benefit obligation to the relevant projected cash flows.
The Company invests the assets of the Pension Plan in a diversified portfolio, which consists of an array of asset classes and attempts to maximize returns while minimizing volatility. The allocation of Pension Plan assets at December 31, 2017 and 2016, as well as the Company’s 2017 target allocations, are as follows:
|
|
||||||||||||
|
|
Year Ended December 31, |
|||||||||||
|
Asset Classes: |
2017 |
2016 |
2017 Target |
|||||||||
|
Equity securities |
45 |
% |
55 |
% |
50 |
% |
||||||
|
Non-equity investments |
12 |
% |
12 |
% |
5 |
% |
||||||
|
Fixed income investments |
34 |
% |
23 |
% |
40 |
% |
||||||
|
Cash and cash equivalents |
2 |
% |
2 |
% |
- |
% |
||||||
|
Real estate |
7 |
% |
8 |
% |
5 |
% |
||||||
|
Total |
100 |
% |
100 |
% |
100 |
% |
||||||
The expected long-term rate of return on the Pension Plan’s assets assumptions are based upon modeling studies completed with the assistance of the Company’s actuaries and investment consultants. The models take into account inflation, asset class returns, and bond yields for both domestic and foreign markets. These studies, along with the history of returns for the Pension Plan, indicate that expected future returns, weighted by asset allocation, supported an expected long-term asset return assumption of 7.4% for 2017 and 2016.
76
The Company’s investment goals are to achieve returns in excess of the Pension Plan’s actuarial assumptions, commensurate with the Pension Plan’s risk tolerance; to invest in a prudent manner in accordance with fiduciary requirements of ERISA and to ensure that Pension Plan assets will meet the obligations of the Pension Plan as they come due.
Investment management of the Pension Plan is delegated to a professional investment management firm that must adhere to policy guidelines and objectives. An independent investment consultant is used to measure and report on investment performance, perform asset/liability modeling studies, recommend changes to objectives, guidelines, managers, or asset class structure, and keep the Company informed of current investment trends and issues.
The investment policy, as established by the Company’s Benefit Plans Committee (the “Committee”), allows for effective supervision, monitoring, and evaluating of the investment of the Company’s retirement plan assets. This includes setting forth an investment structure for managing assets and providing guidelines for each portfolio to control the level of overall risk and liquidity. The cash inflows and outflows of the Pension Plan will be deployed in a manner consistent with the above target allocations. If the Committee determines cash flows to be insufficient within the strategic allocation target ranges, the Committee shall decide whether to effect transactions to bring the strategic allocation within the threshold ranges. Pension Plan assets do not include equity securities of the Company.
Based on consideration of the Pension Plan’s projected benefit obligation, the Pension Plan’s ability to tolerate risk is in the moderate range. Asset allocation is consistent with this level of risk, with assets being a mix of equities and fixed income. Equity investments are diversified across U.S. and non-U.S. stocks. Minimum and maximum ranges are established for each asset class to control risk and maximize the effectiveness of the Pension Plan’s asset allocation strategy. Asset allocation is reviewed quarterly and rebalanced if necessary. Specific investment guidelines, restrictions, and investment return objectives exist for each asset class and corresponding investment manager.
Pension Plan assets are recorded at fair value. Fixed income and equity securities may each be combined into commingled fund investments, which are valued to reflect the Company’s interest in the fund, based upon the reported year-end net asset value. The estimated fair values of debt securities held are based upon quoted market prices and/or market data for the same or comparable instruments. Because of the nature of these fixed income securities and commingled fixed income funds, some of these instruments are classified as Level 2 or Level 3 investments within the fair value hierarchy, as defined in Note 3. Fair value estimates for publicly-traded equity securities are based upon quoted market prices and/or other market data for the same or comparable instruments. Collective trusts that hold securities directly are stated at fair value of the underlying securities, as determined by the administrator, based on readily determinable market values and as such, are classified as Level 2 or Level 3 investments. Non-equity investments include investments in hedge funds and are valued based upon their year-end reported net asset values. The funded status of the Pension Plan represents the difference between the Company’s projected benefit obligation and fair value of Pension Plan assets and is presented as pension liability in the Consolidated Balance Sheets.
The following table summarizes the Pension Plan assets measured at fair value as of December 31, 2017 and 2016 (in millions). Refer to Note 3 for definitions of Level 1, 2, and 3 financial instruments within the fair value hierarchy and the methods and assumptions used to estimate the fair value of marketable securities.
|
|
||||||||||||
|
|
Fair Value Measurements at December 31, 2017 |
|||||||||||
|
|
Quoted Prices in |
Significant |
Significant |
|||||||||
|
|
Active Markets for |
Observable |
Unobservable |
|||||||||
|
|
Identical Assets |
Inputs |
Inputs |
|||||||||
|
Asset Classes |
Total |
(Level 1) |
(Level 2) |
(Level 3) |
||||||||
|
Cash and cash equivalents |
$ |
3 |
$ |
2 |
$ |
1 |
$ |
- |
||||
|
Equity securities |
91 |
- |
91 |
- |
||||||||
|
Mutual funds(a) |
26 | 16 | 10 |
- |
||||||||
|
Corporate bonds |
51 |
- |
51 |
- |
||||||||
|
Government bonds |
17 |
- |
17 |
- |
||||||||
|
Equity long/short hedge funds(b) |
- |
- |
- |
- |
||||||||
|
Real estate investment funds |
14 |
- |
- |
14 | ||||||||
|
Total |
$ |
202 |
$ |
18 |
$ |
170 |
$ |
14 | ||||
|
|
77
|
|
Fair Value Measurements at December 31, 2016 |
|||||||||||
|
|
Quoted Prices in |
Significant |
Significant |
|||||||||
|
|
Active Markets for |
Observable |
Unobservable |
|||||||||
|
|
Identical Assets |
Inputs |
Inputs |
|||||||||
|
Asset Classes |
Total |
(Level 1) |
(Level 2) |
(Level 3) |
||||||||
|
Cash and cash equivalents |
$ |
4 |
$ |
4 |
$ |
- |
$ |
- |
||||
|
Equity securities |
101 |
- |
101 |
- |
||||||||
|
Mutual funds(a) |
23 | 15 | 8 |
- |
||||||||
|
Corporate bonds |
27 |
- |
27 |
- |
||||||||
|
Government bonds |
16 |
- |
16 |
- |
||||||||
|
Equity long/short hedge funds(b) |
1 |
- |
- |
1 | ||||||||
|
Real estate investment funds |
14 |
- |
- |
14 | ||||||||
|
Total |
$ |
186 |
$ |
19 |
$ |
152 |
$ |
15 | ||||
__________
(a)This category consists of mutual fund investments that are focused on fixed income and international equity securities.
(b)This category includes hedge funds that invest both long and short in a variety of U.S. and international equities and currencies. Management of the hedge funds has the ability to shift investments from value to growth strategies, from small to large capitalization stocks, and from a net long position to a net short position.
For Pension Plan assets with fair value measurements using significant unobservable inputs (Level 3), reconciliations of beginning and ending balances are as follows (in millions):
|
|
|||
|
|
Equity Long/Short |
||
|
|
Hedge Funds |
||
|
Balance at December 31, 2015 |
$ |
32 | |
|
Redemptions |
(31) | ||
|
Balance at December 31, 2016 |
$ |
1 | |
|
Return on plan assets held at the reporting date |
- |
||
|
Redemptions |
(1) | ||
|
Balance at December 31, 2017 |
$ |
- |
|
|
|
|||
|
|
Real Estate |
||
|
|
Investment Funds |
||
|
Balance at December 31, 2015 |
$ |
14 | |
|
Return on plan assets held at the reporting date |
2 | ||
|
Purchases |
1 | ||
|
Redemptions |
(3) | ||
|
Balance at December 31, 2016 |
$ |
14 | |
|
Return on plan assets held at the reporting date |
- |
||
|
Purchases |
- |
||
|
Redemptions |
- |
||
|
Balance at December 31, 2017 |
$ |
14 | |
78
Defined Contribution Retirement Plans
The Company sponsors various qualified defined contribution retirement plans. Each plan serves a defined group of employees and has varying levels of Company contributions. The Company’s contributions to certain plans may be required by the terms of the Company’s collective bargaining agreements. During 2017, 2016, and 2015, the Company contributed $6.2 million, $5.6 million, and $5.4 million, respectively, to its defined contribution retirement plans.
Retirement Plans of Non-U.S. Operations
In certain circumstances, the Company may provide severance benefits to employees whose employment is terminated under a written agreement. The amount of benefits depends upon the length of service of the employee and whether the termination was voluntary or at the request of the Company. During 2017, 2016, and 2015, the Company recorded expenses associated with these non-U.S. plans of $1.2 million, $1.1 million, and $1 million, respectively.
Other Postretirement Plans
Life Insurance Plans
As of July 31, 2007, the Company assumed life insurance benefits for certain U.S. retirees and the benefit plans pursuant to which such life insurance benefits are provided. Expected future life insurance benefit payments amount to $0.7 million, $1 million, $1 million, $1 million, and $1 million for the years ending December 31, 2018, 2019, 2020, 2021, and 2022, respectively, for a total of $4.7 million during the five-year period. Aggregate expected benefit payments for the years 2023 through 2027 are $5.1 million.
The following table provides a reconciliation of the changes in the benefit obligation and funded status of the Company’s life insurance plans (in thousands):
|
|
|||||||
|
|
Year Ended |
Year Ended |
|||||
|
|
December 31, |
December 31, |
|||||
|
|
2017 |
2016 |
|||||
|
Reconciliation of fair value of life insurance plan assets: |
|||||||
|
Fair value of assets, beginning of period |
$ |
— |
$ |
— |
|||
|
Employer contributions |
744 | 749 | |||||
|
Benefits paid |
(744) | (749) | |||||
|
Fair value of assets, end of period |
$ |
— |
$ |
— |
|||
|
Change in benefit obligation: |
|||||||
|
Benefit obligation, beginning of period |
$ |
16,200 |
$ |
16,012 | |||
|
Service cost |
5 | 5 | |||||
|
Interest cost |
530 | 539 | |||||
|
Actuarial loss/(gain) |
901 | 393 | |||||
|
Benefits paid |
(744) | (749) | |||||
|
Benefit obligation, end of period |
$ |
16,892 |
$ |
16,200 | |||
|
Funded status of life insurance plans |
$ |
(16,892) |
$ |
(16,200) | |||
At December 31, 2017 and 2016, the funded status of the Company’s life insurance plans is recorded as accrued liabilities and other non-current liabilities in the Consolidated Balance Sheets.
79
The following table provides the components of the net periodic benefit cost of the Company’s life insurance plans for the years ended December 31, 2017, 2016, and 2015 (in thousands):
|
|
|||||||||
|
|
Year Ended |
Year Ended |
Year Ended |
||||||
|
|
December 31, |
December 31, |
December 31, |
||||||
|
|
2017 |
2016 |
2015 |
||||||
|
Service cost |
$ |
5 |
$ |
5 |
$ |
7 | |||
|
Interest cost |
530 | 539 | 529 | ||||||
|
Amortization of prior service credit |
132 | 132 | 132 | ||||||
|
Net periodic benefit cost |
$ |
667 |
$ |
676 |
$ |
668 | |||
Pre-tax amounts recognized in other comprehensive income / (loss) at December 31, 2017, 2016, and 2015 consist of the following (in thousands):
|
|
|||||||||
|
|
2017 |
2016 |
2015 |
||||||
|
Net actuarial gain/(loss) |
$ |
(901) |
$ |
(393) |
$ |
1,349 | |||
|
Amortization of prior service cost |
132 | 132 | 132 | ||||||
|
Amount recognized |
$ |
(769) |
$ |
(261) |
$ |
1,481 | |||
The following table summarizes the amounts included in accumulated other comprehensive loss, net of tax, related to the Company’s life insurance plans (in thousands):
|
|
||||||
|
|
As of December 31, |
|||||
|
2017 |
2016 |
|||||
|
Unrecognized gain/(loss) |
$ |
(674) |
$ |
227 | ||
|
Net prior service credit |
(1,447) | (1,579) | ||||
|
Deferred tax impact |
(1,097) | (1,169) | ||||
|
Accumulated other comprehensive loss |
$ |
(3,218) |
$ |
(2,521) | ||
The present value of the Company’s postretirement benefit obligation is calculated annually with the assistance of third party actuaries. The discount rates used in the calculations are established based upon the results of a yield curve analysis, which calculates a yield to maturity that mirrors the timing and amounts of future benefit payments. The discount rate used to measure the Company’s postretirement benefit obligation in 2017 and 2016 was 3.47% and 3.94%, respectively. The discount rates used to determine the net periodic benefit cost was 3.91%, 4.1%, and 3.76% in 2017, 2016, and 2015, respectively. The measurement dates of the Company’s post retirement plans are December 31 of each year.
Note 11. Earnings per Share (“EPS”)
Basic earnings / (loss) per share is calculated by dividing the net income / (loss) attributable to Tower International, Inc. by the weighted average number of common shares outstanding.
The share count for diluted earnings / (loss) per share is computed on the basis of the weighted average number of common shares outstanding plus the effects of dilutive common stock equivalents (“CSEs”) outstanding during the period. CSEs, which are securities that may entitle the holder to obtain common stock, include outstanding stock options and restricted stock units. When the average price of the common stock during the period exceeds the exercise price of a stock option, the options are considered potentially dilutive CSEs. When there is a loss from continuing operations, potentially dilutive shares are excluded from the computation of earnings per share, as their effect would be anti-dilutive.
The Company did not exclude any potentially anti-dilutive shares for the years ended December 31, 2017, 2016, and 2015, respectively.
80
A summary of the information used to compute basic and diluted net income / (loss) per share attributable to Tower International, Inc. is shown below (in thousands – except share and per share amounts):
|
|
Year Ended December 31, |
|||||||||
|
|
2017 |
2016 |
2015 |
|||||||
|
Income from continuing operations |
$ |
45,882 |
$ |
56,288 |
$ |
185,467 | ||||
|
Income / (loss) from discontinued operations, net of tax |
1,853 | (17,008) | 10,324 | |||||||
|
Net income |
47,735 | 39,280 | 195,791 | |||||||
|
Less: Net income attributable to the noncontrolling interests |
110 | 701 | 1,739 | |||||||
|
Net income attributable to Tower International, Inc. |
$ |
47,625 |
$ |
38,579 |
$ |
194,052 | ||||
|
|
||||||||||
|
Basic income / (loss) per share: |
||||||||||
|
Continuing operations |
$ |
2.23 |
$ |
2.66 |
$ |
8.71 | ||||
|
Discontinued operations |
0.09 | (0.82) | 0.49 | |||||||
|
Net income attributable to Tower International, Inc. |
2.32 | 1.85 | 9.20 | |||||||
|
Basic weighted average shares outstanding |
20,498,668 | 20,864,321 | 21,093,387 | |||||||
|
|
||||||||||
|
Diluted income / (loss) per share: |
||||||||||
|
Continuing operations |
$ |
2.20 |
$ |
2.62 |
$ |
8.58 | ||||
|
Discontinued operations |
0.09 | (0.80) | 0.48 | |||||||
|
Net income attributable to Tower International, Inc. |
2.29 | 1.82 | 9.06 | |||||||
|
Diluted weighted average shares outstanding |
20,828,888 | 21,222,183 | 21,408,301 | |||||||
The following table presents information regarding our quarterly dividends per common share.
|
Declaration Date |
Cash Amount |
Record Date |
Payment Date |
||||
|
2017 |
|||||||
|
October 20, 2017 |
$ |
0.12 |
November 10, 2017 |
December 8, 2017 |
|||
|
July 21, 2017 |
0.11 |
August 10, 2017 |
September 8, 2017 |
||||
|
April 21, 2017 |
0.11 |
May 10, 2017 |
June 9, 2017 |
||||
|
January 27, 2017 |
0.11 |
February 10, 2017 |
February 28, 2017 |
||||
|
2016 |
|||||||
|
October 21, 2016 |
0.11 |
November 10, 2016 |
December 9, 2016 |
||||
|
July 22, 2016 |
0.10 |
August 10, 2016 |
September 9, 2016 |
||||
|
April 22, 2016 |
0.10 |
May 10, 2016 |
June 10, 2016 |
||||
|
January 29, 2016 |
0.10 |
February 10, 2016 |
February 29, 2016 |
||||
|
2015 |
|||||||
|
October 16, 2015 |
0.10 |
November 10, 2015 |
December 10, 2015 |
Note 12. Share-Based and Long-Term Compensation
Share-Based Compensation
2010 Equity Incentive Plan (“the Plan”)
The Company adopted an equity incentive plan in connection with its 2010 initial public offering that allows for the grant of stock options, restricted stock awards, other equity-based awards, and certain cash-based awards to be made pursuant to the Plan. The eligibility requirements and terms governing the allocation of any common stock and the receipt of other consideration under the Plan are determined by the Board of Directors and/or its Compensation Committee.
On April 25, 2014, the Plan was amended and restated and further amended on December 1, 2016. The number of shares of common stock available for issuance pursuant to new awards under the 2010 Equity Incentive Plan was reduced to 850,000 shares. At December 31, 2017, 800,319 shares were available for future grants of options and other types of awards under the 2010 Equity Incentive Plan.
81
Forfeited shares, in addition to certain other shares, as defined by the Plan, may be re-issued under the Plan up to the maximum amount to be issued.
The following table summarizes the Company’s award activity during the years ended December 31, 2017, 2016, and 2015:
|
|
Options |
Restricted Stock Units |
||||||||
|
|
Weighted |
Weighted |
||||||||
|
|
Average |
Average Grant |
||||||||
|
Outstanding at: |
Shares |
Exercise Price |
Shares |
Date Fair Value |
||||||
|
December 31, 2014 |
517,459 |
$ |
12.15 | 200,340 |
$ |
18.51 | ||||
|
Granted |
- |
- |
89,178 | 26.16 | ||||||
|
Options exercised or RSUs vested |
(17,321) | 11.75 | (99,811) | 15.67 | ||||||
|
Forfeited |
- |
- |
(2,209) | 24.42 | ||||||
|
December 31, 2015 |
500,138 |
$ |
12.17 | 187,498 |
$ |
23.59 | ||||
|
Granted |
- |
- |
105,468 | 23.26 | ||||||
|
Options exercised or RSUs vested |
(25,670) | 11.90 | (77,912) | 19.92 | ||||||
|
Forfeited |
- |
- |
(1,532) | 25.26 | ||||||
|
December 31, 2016 |
474,468 |
$ |
12.18 | 213,522 |
$ |
24.77 | ||||
|
Granted |
- |
- |
106,312 | 28.09 | ||||||
|
Options exercised or RSUs vested |
(108,791) | 12.07 | (101,478) | 24.99 | ||||||
|
Forfeited |
- |
- |
(5,335) | 25.47 | ||||||
|
December 31, 2017 |
365,677 |
$ |
12.22 | 213,022 |
$ |
26.30 | ||||
Stock options
The exercise price of each stock option equals the market price of the Company’s common stock on its grant date. Compensation expense is recorded at the grant date fair value, less an estimated forfeiture amount, and is recognized on a straight-line basis over the applicable vesting periods. The Company’s stock options generally vest over three years, with a maximum term of ten years.
The Company calculates the weighted average grant date fair value of each option granted using a Black-Scholes valuation model. There was zero option expense in the years ended December 31, 2017 and 2016 and $0.2 million in the year ended December 31, 2015. As of December 31, 2015, the Company had recognized all of the compensation expense associated with these stock options.
As of December 31, 2017, the Company had an aggregate of 365,677 stock options that had been granted, but had not yet been exercised. As of December 31, 2017, the remaining average contractual life for these options is approximately four years. During the year ended December 31, 2017, 108,791 options were exercised, which had an aggregate intrinsic value of $1.7 million. As of December 31, 2017, 365,677 stock options were exercisable, which had an aggregate intrinsic value of $6.7 million. During the year ended December 31, 2017, no stock options were granted and no stock options were forfeited or expired.
Restricted stock units (“RSUs”)
The grant date fair value of each RSU equals the market price of the Company’s common stock on its date of grant. Compensation expense is recorded at the grant date fair value, less an estimated forfeiture amount, and is recognized on a straight-line basis over the applicable vesting periods.
During the years ended December 31, 2017, 2016, and 2015, the Company recognized an expense of $2.2 million, $2.5 million, and $2.1 million, respectively, relating to all of the RSUs granted. As of December 31, 2017, the Company had $2.1 million of unrecognized compensation expense associated with these RSUs, which will be amortized on a straight-line basis over the next 12 months, on a weighted average basis. The Company’s RSUs generally vest over a three year period.
As of December 31, 2017, the Company had an aggregate of 213,022 RSUs that have been granted, but have not yet vested. During the year ended December 31, 2017, 106,312 RSUs were granted and 5,335 RSUs were forfeited or expired.
During 2015, a total of 99,811 RSUs vested, resulting in the issuance of 99,811 shares at a fair value of $2.6 million. Additionally, 493,096 shares that vested on December 31, 2014 were issued in January 2015. This total was reduced by shares repurchased to provide payment for certain individuals’ minimum statutory withholding tax. The Company paid $6.5 million to acquire 250,844 vested shares
82
to cover the minimum statutory withholding taxes. After offsets for withholding taxes, a net total of 342,063 shares of common stock were issued.
During 2016, a total of 77,912 RSUs vested, resulting in the issuance of 77,912 shares at a fair value of $1.8 million. This total was reduced by shares repurchased to provide payment for certain individuals’ minimum statutory withholding tax. The Company paid $0.6 million to acquire 26,413 vested shares to cover the minimum statutory withholding taxes. After offsets for withholding taxes, a net total of 51,499 shares of common stock were issued.
During 2017, a total of 101,478 RSUs vested, resulting in the issuance of 101,478 shares at a fair value of $2.8 million. This total was reduced by shares repurchased to provide payment for certain individuals’ minimum statutory withholding tax. The Company paid $0.8 million to acquire 27,003 vested shares to cover the minimum statutory withholding taxes. After offsets for withholding taxes, a net total of 74,475 shares of common stock were issued.
The RSUs held on and after November 10, 2015 earn dividend equivalents at the same rate as dividends paid on common stock. Dividend equivalents are subject to the same vesting conditions as the underlying RSUs and, therefore, are not considered participating securities.
Long-Term Compensation
Amended and Restated CEO Employment Agreement
On July 28, 2014, Mark M. Malcolm, the Company’s former President and Chief Executive Officer, entered into an amended and restated employment agreement (the “Agreement”), by which Mr. Malcolm’s employment was extended through December 31, 2016 (the “Retirement Date”). Mr. Malcolm retired from the Company on the Retirement Date. The Agreement provided for a $3 million transition bonus, for the successful delivery to Tower’s Board of Directors of a comprehensive chief executive officer succession and transition plan, and a $3 million retention bonus. These bonus awards were paid in cash, in the amount of $6.3 million, on July 14, 2017, and fall under the guidance of FASB ASC No. 450, Contingencies. As of December 31, 2017, the Company had no liability remaining relating to these awards.
During the years ended December 31, 2017, 2016, and 2015, the Company recorded expense of $0.3 million, $1.3 million, and $3.1 million related to these awards, respectively.
Performance Award Agreements
Under the provisions of the 2010 Equity Incentive Plan, the Company grants certain awards annually in March pursuant to Performance Award Agreements to approximately 80 executives. These awards are designed to provide the executives with an incentive to participate in the long-term success and growth of the Company. The Performance Award Agreements provide for cash-based awards that vest upon payment. Pursuant to meeting the performance conditions set forth in the Performance Award Agreements, each award will be paid three years after it is granted. These awards are also subject to payment upon a change in control or termination of employment, if certain criteria are met. These awards represent unfunded, unsecured obligations of the Company.
2014 and 2015 Awards
One half of the awards granted in 2014 and 2015 were based upon the Company's Adjusted EPS Growth Rate, which is defined as the Company’s cumulative Adjusted EPS for the performance period of the awards, stated in terms of a percentage growth rate. The Company's EPS was and will be adjusted to exclude the effect of unusual, and/or nonrecurring items and then was and will be divided by the number of fiscal years in the specified period, stated in terms of a percentage growth rate. The other half of the awards are based upon the Company's percentile ranking of total shareholder return, compared to a peer group of companies, for the performance period.
Pursuant to meeting the performance conditions set forth in the Performance Award Agreements, the awards granted in 2014 were paid in the first quarter of 2017. The performance period of the awards granted in 2015, is January 1, 2015 through December 31, 2017.
2016 and 2017 Awards
One half of the awards granted in 2016 and 2017 will be based upon the Company’s Adjusted EBIT Growth Rate, which is defined as the Company’s cumulative Adjusted EBIT (earnings before interest and taxes) for the performance period of the awards, stated in terms of a percentage growth rate. The Company's EBIT will be adjusted to exclude the effect of extraordinary, unusual, and/or nonrecurring items and then will be divided by the number of fiscal years in the specified period, stated in terms of a percentage growth rate. The other half of the awards will be based upon the Company's percentile ranking of total shareholder return, compared to a peer group of companies, for the performance period.
83
The performance period of the awards granted in 2016 is January 1, 2016 through December 31, 2018. The performance period of the awards granted in 2017 is January 1, 2017 through December 31, 2019.
During the years ended December 31, 2017, 2016, and 2015, the Company recorded expense related to these awards of $2.7 million, $8.6 million, and $5.9 million, respectively. At December 31, 2017, the Company had a liability of $6.5 million related to these awards. $3.7 million of this liability is payable in March of 2018 and is presented as other current liabilities in the Consolidated Balance Sheets, while the remaining $2.8 million of this liability is presented as other non-current liabilities in the Consolidated Balance Sheets.
Note 13. Related Party Transactions
During the year ended December 31, 2017, the Company sold its joint venture in Wuhu, China. Prior to the sale, the Company sold certain products from its Wuhu operations to its joint venture partner, Chery. The sales of these products to Chery were $14.8 million, $70.6 million, and $72.1 million for the years ended December 31, 2017, 2016 and 2015, respectively. The Company’s accounts receivable with Chery at December 31, 2017 and 2016 was zero and $24 million, respectively.
Note 14. Segment Information
The Company defines its operating segments as components of its business where separate financial information is available. The Company’s operating segments are routinely evaluated by management. The Company’s chief operating decision maker (“CODM”) is its Chief Executive Officer.
The Company produces engineered structural metal components and assemblies primarily serving the global automotive industry. The Company’s operations have similar economic characteristics and share fundamental characteristics, including the nature of the products, production processes, margins, customers, and distribution channels. The Company’s products include body structures stampings, chassis structures (including frames), and complex welded assemblies for small and large cars, crossovers, pickups, and SUVs. The Company is comprised of two operating and reportable segments: Europe and North America.
The Company measures segment operating performance based on Adjusted EBITDA. The Company uses segment Adjusted EBITDA as the basis for the CODM to evaluate the performance of each of the Company’s reportable segments.
The following is a summary of select data for each of the Company’s reportable segments (in thousands):
|
|
Europe |
North America |
Total |
||||||
|
Year Ended December 31, 2017: |
|||||||||
|
Revenues |
$ |
664,849 |
$ |
1,323,197 |
$ |
1,988,046 | |||
|
Adjusted EBITDA |
45,518 | 164,218 | 209,736 | ||||||
|
Capital Expenditures (a) |
38,927 | 65,226 | 104,153 | ||||||
|
Total assets (b) |
518,679 | 741,418 | 1,260,097 | ||||||
|
|
|||||||||
|
Year Ended December 31, 2016: |
|||||||||
|
Revenues |
$ |
639,307 |
$ |
1,274,334 |
$ |
1,913,641 | |||
|
Adjusted EBITDA |
55,314 | 146,408 | 201,722 | ||||||
|
Capital Expenditures (a) |
46,380 | 69,903 | 116,283 | ||||||
|
Total assets (b) |
476,049 | 686,474 | 1,162,523 | ||||||
|
|
|||||||||
|
Year Ended December 31, 2015: |
|||||||||
|
Revenues |
$ |
652,600 |
$ |
1,143,503 |
$ |
1,796,103 | |||
|
Adjusted EBITDA |
57,057 | 131,252 | 188,309 | ||||||
|
Capital Expenditures (a) |
21,036 | 98,713 | 119,749 | ||||||
|
|
|||||||||
|
(a) |
Capital expenditures represent cash disbursed for purchases of property, plant, and equipment, as presented in the accompanying Consolidated Statements of Cash Flows. |
|
(b) |
Total assets as of December 31, 2017 and 2016 include assets held for sale. |
84
Inter-segment sales are not significant for any period presented.
The following is a reconciliation of income / (loss) before provision for income taxes and equity in loss of joint venture to Adjusted EBITDA (in thousands):
|
|
Year Ended December 31, |
||||||||
|
|
2017 |
2016 |
2015 |
||||||
|
Net income before provision for income taxes |
|||||||||
|
and income / (loss) from discontinued operations |
$ |
101,316 |
$ |
73,534 |
$ |
61,623 | |||
|
Restructuring and asset impairment charges, net |
10,735 | 5,389 | 7,819 | ||||||
|
Depreciation and amortization |
77,284 | 72,469 | 72,542 | ||||||
|
Acquisition costs and other |
425 | 422 | 805 | ||||||
|
Long-term compensation expense |
5,996 | 14,093 | 12,680 | ||||||
|
Interest expense, net |
13,405 | 21,004 | 23,722 | ||||||
|
Other expense |
575 | 6,481 |
- |
||||||
|
Pension actuarial loss |
- |
8,330 | 9,118 | ||||||
|
Adjusted EBITDA |
$ |
209,736 |
$ |
201,722 |
$ |
188,309 | |||
The following is a summary of revenues and long-lived assets by geographic location (in thousands):
|
|
||||||||||||||||||
|
|
Year Ended and End of Year December 31, |
|||||||||||||||||
|
2017 |
2016 |
2015 |
||||||||||||||||
|
|
Long-Lived |
Long-Lived |
Long-Lived |
|||||||||||||||
|
Revenues |
Assets |
Revenues |
Assets |
Revenues |
Assets |
|||||||||||||
|
Germany |
$ |
301,743 |
$ |
82,013 |
$ |
281,700 |
$ |
77,418 |
$ |
288,081 |
$ |
67,154 | ||||||
|
Belgium |
131,015 | 36,327 | 136,693 | 16,892 | 141,835 | 20,382 | ||||||||||||
|
Slovakia |
109,945 | 52,965 | 111,767 | 40,690 | 127,750 | 45,036 | ||||||||||||
|
Italy |
120,190 | 41,419 | 104,144 | 37,786 | 106,382 | 34,368 | ||||||||||||
|
Other Europe |
100,172 | 13,588 | 88,849 | 11,668 | 73,918 | 12,638 | ||||||||||||
|
U.S. |
1,273,441 | 305,127 | 1,222,120 | 276,892 | 1,115,763 | 243,324 | ||||||||||||
|
Mexico |
49,755 | 4,110 | 52,203 | 4,223 | 27,686 | 4,985 | ||||||||||||
|
Intercompany eliminations |
(98,215) |
- |
(83,835) |
- |
(85,312) |
- |
||||||||||||
|
Total |
$ |
1,988,046 |
$ |
535,549 |
$ |
1,913,641 |
$ |
465,569 |
$ |
1,796,103 |
$ |
427,887 | ||||||
Revenues are attributed to geographic locations based on the location of specific production. Long-lived assets consist of net property, plant, and equipment and company-owned tooling.
The following is a summary of the approximate composition of the Company’s revenues, by product category (in thousands):
|
|
||||||||||||
|
|
Year Ended December 31, |
|||||||||||
|
2017 |
2016 |
2015 |
||||||||||
|
Body structures and assemblies |
51 |
% |
51 |
% |
60 |
% |
||||||
|
Complex body-in-white assemblies |
26 |
% |
29 |
% |
24 |
% |
||||||
|
Chassis, lower vehicle structures, and suspension components |
23 |
% |
20 |
% |
16 |
% |
||||||
|
Total |
100 |
% |
100 |
% |
100 |
% |
||||||
85
The Company sells its products directly to automotive manufacturers. The following table presents a summary of customers that accounted for 10% or more of consolidated revenues in any of the three years ended December 31:
|
|
||||||||||||
|
|
2017 |
2016 |
2015 |
|||||||||
|
Ford |
35 |
% |
32 |
% |
25 |
% |
||||||
|
Fiat - Chrysler |
20 |
% |
21 |
% |
24 |
% |
||||||
|
Volkswagen Group |
11 |
% |
11 |
% |
12 |
% |
||||||
|
Nissan |
10 |
% |
8 |
% |
7 |
% |
||||||
All customers that accounted for 10% or more of consolidated revenues from the table above are customers in the automotive industry; therefore, the Company is subject to a concentration of credit risk.
Note 15. Commitments and Contingencies
Leases
The Company leases office space, manufacturing space, and certain equipment under noncancellable lease agreements, which require the Company to pay maintenance, insurance, taxes, and other expenses, in addition to rental payments. The Company has entered into leasing commitments with lease terms expiring between the years 2017 and 2026. The Company has options to extend the terms of certain leases in future periods. The properties covered under these leases include manufacturing and office equipment and facilities. Rent expense for all operating leases totaled $25.4 million, $23 million, and $24.3 million during the years ended December 31, 2017, 2016, and 2015, respectively.
Future minimum capital and operating lease payments at December 31, 2017 are as follows (in thousands):
|
|
Operating |
Capital |
||||
|
Year |
Leases |
Leases |
||||
|
2018 |
$ |
35,103 |
$ |
5,613 | ||
|
2019 |
34,350 |
- |
||||
|
2020 |
27,514 |
- |
||||
|
2021 |
22,132 |
- |
||||
|
2022 |
20,318 |
- |
||||
|
Thereafter |
30,719 |
- |
||||
|
Total future lease payments |
$ |
170,136 |
$ |
5,613 | ||
|
Less: amount representing interest |
(65) | |||||
|
Present value of minimum lease payments |
$ |
5,548 | ||||
Purchase Commitments
As of December 31, 2017, the Company was obligated under executory purchase orders for approximately $122.8 million of tooling, $86.8 million of capital expenditures, and $9.2 million of other expenditures.
As of December 31, 2017, the Company has issued bank guarantees in the aggregate amount of $41 million related to progress payments received for the procurement of certain customer-owned tooling, of which the Company has funded $32.9 million during the year ended December 31, 2017 and expects to procure the remaining balance during the first half of 2018.
Environmental Matters
The Company owns properties which have been affected by environmental releases. The Company is actively involved in investigation and/or remediation at several of these locations.
86
Accruals for environmental matters are recorded when it is probable that a liability has been incurred and the amount of the liability can be reasonably estimated. The established liability for environmental matters is based upon management’s best estimates, on an undiscounted basis, of expected investigation/ remediation costs related to environmental contamination. It is possible that actual costs associated with these matters will exceed the environmental reserves established by the Company. Inherent uncertainties exist in the estimates, primarily due to unknown environmental conditions, changing governmental regulations, and legal standards regarding liability and evolving technologies for handling site remediation and restoration. At December 31, 2017 and 2016, the Company had approximately $1.3 million and $1.4 million, respectively, accrued for environmental matters.
Contingent Matters
The Company will establish an accrual for matters in which losses are probable and can be reasonably estimated. These types of matters may involve additional claims that, if granted, could require the Company to pay penalties or make other expenditures in amounts that will not be estimable at the time of discovery of the matter. In these cases, a liability will be recorded at the low end of the range if no amount within the range is a better estimate in accordance with FASB ASC No. 450, Accounting for Contingencies.
Litigation
The Company is subject to various legal actions and claims incidental to its business, including potential lawsuits with customers or suppliers. Litigation is subject to many uncertainties and the outcome of individual litigated matters is not probable or estimable. After discussions with counsel litigating these matters, it is the opinion of management that the outcome of such matters will not have a material impact on the Company’s financial position, results of operations, or cash flows.
Note 16. Change in Working Capital and Other Operating Items
The following table summarizes the sources / (uses) of cash provided by changes in working capital and other operating items for continuing operations (in thousands):
|
|
|||||||||
|
|
Year Ended December 31, |
||||||||
|
2017 |
2016 |
2015 |
|||||||
|
Accounts receivable |
$ |
(61,068) |
$ |
45,485 |
$ |
(18,551) | |||
|
Inventories |
(7,036) | (5,063) | (6,317) | ||||||
|
Prepaid tooling and other current assets |
24,542 | (34,782) | (20,815) | ||||||
|
Accounts payable and accrued liabilities |
56,818 | 7,417 | 27,116 | ||||||
|
Other assets and liabilities |
(8,516) | (14,108) | 4,729 | ||||||
|
Change in working capital and other operating items |
$ |
4,740 |
$ |
(1,051) |
$ |
(13,838) | |||
87
Note 17. Quarterly Financial Data (Unaudited)
The following table summarizes select quarterly financial data (in thousands):
|
|
|||||||||||||||
|
|
Net Income/(Loss) |
Diluted |
|||||||||||||
|
|
Attributable |
Earnings/ |
|||||||||||||
|
|
Net Income/ |
to Tower |
(Loss) per |
||||||||||||
|
Quarter |
Net Sales |
Gross Profit |
(Loss) |
International, Inc. |
Share |
||||||||||
|
2017 |
|||||||||||||||
|
1st |
$ |
497,590 |
$ |
56,779 |
$ |
17,413 |
$ |
17,345 |
$ |
0.83 | |||||
|
2nd |
489,925 | 61,597 | 19,258 | 19,216 | 0.92 | ||||||||||
|
3rd(a) |
462,372 | 58,753 | 14,931 | 14,931 | 0.72 | ||||||||||
|
4th(b) |
538,159 | 67,406 | (3,867) | (3,867) | (0.19) | ||||||||||
|
Full Year |
$ |
1,988,046 |
$ |
244,535 |
$ |
47,735 |
$ |
47,625 | 2.29 | ||||||
|
|
|||||||||||||||
|
2016 |
|||||||||||||||
|
1st |
$ |
489,194 |
$ |
57,089 |
$ |
8,384 |
$ |
8,378 |
$ |
0.39 | |||||
|
2nd(c) |
505,131 | 62,142 | (4,752) | (4,841) | (0.23) | ||||||||||
|
3rd |
457,042 | 60,236 | 18,275 | 18,157 | 0.86 | ||||||||||
|
4th(d) |
462,274 | 58,942 | 17,373 | 16,885 | 0.81 | ||||||||||
|
Full Year |
$ |
1,913,641 |
$ |
238,409 |
$ |
39,280 |
$ |
38,579 | 1.82 | ||||||
___________
|
(a) |
During the third quarter of 2017, net income included $2.4 million deferred tax expense to establish a valuation allowance on certain European deferred tax assets. |
|
(b) |
During the fourth quarter of 2017, net income included deferred tax expense of $27.2 million related to the revaluation of U.S. deferred tax assets due to a reduction in the federal income tax rate as a result of U.S. Tax Reform. |
|
(c) |
During the second quarter of 2016, net income included an impairment loss in discontinued operations of $18.1 million. |
|
(d) |
During the fourth quarter of 2016, net income included an actuarial pension loss of $8.3 million. |
Note 18. Subsequent Events
On February 20, 2018, the Company entered into an equipment leasing and interim funding agreement that provides for a facility not to exceed $92.6 million. The Company currently expects to fund approximately $75 - $85 million of machinery and equipment purchases through this facility. The facility bears an interest rate equal to one month LIBOR plus 3% with interest based upon the amount of machinery and equipment funded by the lessor. At the end of the funding period, the Company will enter into a six year lease at the then prevailing market terms.
88
Item 9. Changes in and Disagreements with Accountants on Accounting and Financial Disclosure
None.
Item 9A. Controls and Procedures
Evaluation of Disclosure Controls and Procedures
James C. Gouin, our Chief Executive Officer ("CEO"), and Jeffrey L. Kersten, our Chief Financial Officer ("CFO"), have performed an evaluation of our disclosure controls and procedures, as defined in Rule 13a-15(e) of the Securities Exchange Act of 1934, as amended (the "Exchange Act"), as of December 31, 2017 and each has concluded that such disclosure controls and procedures were effective at a reasonable assurance level to ensure that information required to be disclosed in our periodic reports filed under the Exchange Act is recorded, processed, summarized and reported within the time periods specified by the Securities and Exchange Commission's rules and forms and such information is accumulated and communicated to our management, including our principal executive and principal financial officers, as appropriate to allow for timely decisions regarding required disclosure.
Management’s Annual Report on Internal Control over Financial Reporting
Our management is responsible for establishing and maintaining adequate internal control over financial reporting, as such term is defined in Rule 13a-15(f) under the Securities Exchange Act of 1934, as amended. Our internal control over financial reporting is a process designed to provide reasonable assurance regarding the reliability of financial reporting and the preparation of financial statements for external purposes in accordance with generally accepted accounting principles in the U.S.
Because of its inherent limitations, internal control over financial reporting may not prevent or detect misstatements. Also, projections of any evaluation of effectiveness to future periods are subject to the risk that controls may become inadequate because of changes in conditions or because the degree of compliance with policies or procedures may deteriorate.
Under the supervision and with the participation of our management, including our CEO and CFO, we conducted an assessment of the effectiveness of our internal control over financial reporting as of December 31, 2017. The assessment was based on criteria established in the framework “Internal Control – Integrated Framework (2013)” issued by the Committee of Sponsoring Organizations of the Treadway Commission. Based on this assessment, management concluded that our internal control over financial reporting was effective as of December 31, 2017.
The effectiveness of our internal control over financial reporting as of December 31, 2017 has been audited by Deloitte & Touche LLP, an independent registered public accounting firm, as stated in their report which follows.
89
REPORT OF INDEPENDENT REGISTERED PUBLIC ACCOUNTING FIRM
To the Stockholders and the Board of Directors of
Tower International, Inc.
Livonia, MI
Opinion on Internal Control over Financial Reporting
We have audited the internal control over financial reporting of Tower International, Inc. and subsidiaries (the “Company”) as of December 31, 2017, based on criteria established in Internal Control — Integrated Framework (2013) issued by the Committee of Sponsoring Organizations of the Treadway Commission (COSO). In our opinion, the Company maintained, in all material respects, effective internal control over financial reporting as of December 31, 2017, based on criteria established in Internal Control — Integrated Framework (2013) issued by COSO.
We have also audited, in accordance with the standards of the Public Company Accounting Oversight Board (United States) (PCAOB), the consolidated financial statements and financial statement schedule as of and for the year ended December 31, 2017, of the Company and our report dated February 28, 2018, expressed an unqualified opinion on those financial statements.
Basis for Opinion
The Company’s management is responsible for maintaining effective internal control over financial reporting and for its assessment of the effectiveness of internal control over financial reporting, included in the accompanying Management’s Annual Report on Internal Control Over Financial Reporting. Our responsibility is to express an opinion on the Company’s internal control over financial reporting based on our audit. We are a public accounting firm registered with the PCAOB and are required to be independent with respect to the Company in accordance with the U.S. federal securities laws and the applicable rules and regulations of the Securities and Exchange Commission and the PCAOB.
We conducted our audit in accordance with the standards of the PCAOB. Those standards require that we plan and perform the audit to obtain reasonable assurance about whether effective internal control over financial reporting was maintained in all material respects. Our audit included obtaining an understanding of internal control over financial reporting, assessing the risk that a material weakness exists, testing and evaluating the design and operating effectiveness of internal control based on the assessed risk, and performing such other procedures as we considered necessary in the circumstances. We believe that our audit provides a reasonable basis for our opinion.
Definition and Limitations of Internal Control over Financial Reporting
A company’s internal control over financial reporting is a process designed to provide reasonable assurance regarding the reliability of financial reporting and the preparation of financial statements for external purposes in accordance with generally accepted accounting principles. A company’s internal control over financial reporting includes those policies and procedures that (1) pertain to the maintenance of records that, in reasonable detail, accurately and fairly reflect the transactions and dispositions of the assets of the company; (2) provide reasonable assurance that transactions are recorded as necessary to permit preparation of financial statements in accordance with generally accepted accounting principles, and that receipts and expenditures of the company are being made only in accordance with authorizations of management and directors of the company; and (3) provide reasonable assurance regarding prevention or timely detection of unauthorized acquisition, use, or disposition of the company’s assets that could have a material effect on the financial statements.
Because of its inherent limitations, internal control over financial reporting may not prevent or detect misstatements. Also, projections of any evaluation of effectiveness to future periods are subject to the risk that controls may become inadequate because of changes in conditions, or that the degree of compliance with the policies or procedures may deteriorate.
/s/ DELOITTE & TOUCHE LLP
Detroit, MI
February 28, 2018
90
Changes in Internal Control over Financial Reporting
There has not been any change in our internal control over financial reporting during the quarter ended December 31, 2017, that has materially affected, or is reasonably likely to materially affect, our internal control over financial reporting.
On February 27, 2018, the Compensation Committee (the “Compensation Committee”) of the Board of Directors of the Company approved amendments to the employment agreements between Tower Automotive Operations USA I, LLC (“Tower USA”) and each of Pär Malmhagen, our President, and Jeffrey Kersten, our Chief Financial Officer. The amendments, which are intended to align the employment agreements of Messrs. Malmhagen and Kersten with the employment agreements between Tower USA and each of James C. Gouin, our Chief Executive Officer, and Michael Rajkovic, our Chief Operating Officer, provide that all outstanding equity-based awards granted to them under the Company’s equity incentive plan, including performance-based incentives payable in cash and/or shares of our common stock, will become fully vested upon a change in control of the Company.
On February 27, 2018, the Compensation Committee also approved a modified form of performance award agreement for employees of the Company.
Copies of the amendatory agreements to the employment agreements between Tower USA and Messrs. Malmhagen and Kersten, and amended form of performance award agreement, are attached as Exhibits 10.60, 10.61 and 10.62, respectively, to this report.
91
PART III
Item 10. Directors, Executive Officers, and Corporate Governance
The information required by Item 10 regarding executive officers and directors is incorporated by reference from the information under the captions “Directors and Executive Officers” and “The Board of Directors” in the Company’s definitive Proxy Statement for the 2018 Annual Meeting of the Stockholders (the “Proxy Statement”), or will be filed by amendment. The information required by Item 10 regarding the audit committee and audit committee financial expert disclosure is incorporated by reference from the information under the caption “The Board of Directors - Committees of the Board of Directors” and “Audit Committee Matters” in the Proxy Statement, or will be filed by amendment.
Disclosure of delinquent Section 16 filers required by Item 10, if any, pursuant to Item 405 of Regulation S-K is incorporated by reference from the information under the caption “Additional Information – Section 16(a) Beneficial Ownership Reporting Compliance” in the Proxy Statement, or will be filed by amendment.
The Company has adopted a Code of Business Conduct and Ethics that applies to, among other persons, our principal executive officer, principal financial officer, principal accounting officer, and other persons performing similar functions. A copy of our Code of Business Conduct and Ethics is available on our website, www.towerinternational.com, by following links to “Investor Relations,“ “Corporate Governance,” “Governance Documents” and “Code of Business Conduct” or upon written request to the Company. In the event that we make any amendments to, or grant any waiver including an implicit waiver from, a provision of the Code of Conduct and Ethics that applies to our principal executive officer, principal financial officer or principal accounting officer that requires disclosure under applicable SEC rules, we intend to disclose the amendment or waiver and the reasons therefore on our website within four business days of the date of the amendment or waiver.
Item 11. Executive Compensation
The information required by Item 11 is incorporated by reference from the information under the captions “Compensation Discussion and Analysis,” and “Compensation Tables” in the Proxy Statement, or will be filed by amendment.
Item 12. Security Ownership of Certain Beneficial Owners and Management and Related Stockholder Matters
The information required by Item 12 relating to security ownership is incorporated by reference from the information under the caption “Security Ownership” in the Proxy Statement, or will be filed by amendment.
Equity Compensation Plan Information – The following table provides information about our equity compensation plans as of December 31, 2017.
|
|
|||||||||
|
|
Number of Securities |
Number of Securities |
|||||||
|
|
to be Issued Upon |
Weighted-Average |
Remaining Available |
||||||
|
|
Exercise of |
Exercise Price of |
for Future Issuance |
||||||
|
|
Outstanding Options, |
Outstanding Options, |
Under Equity |
||||||
|
Plan Category |
Warrants, and Rights |
Warrants, and Rights |
Compensation Plans |
||||||
|
Equity compensation plans approved by security |
578,699 |
$ |
17.40 | 800,319 | |||||
|
holders |
|||||||||
|
Equity compensation plans not approved by |
N/A |
N/A |
N/A |
||||||
|
security holders |
|||||||||
|
Total |
578,699 |
$ |
17.40 | 800,319 | |||||
Item 13. Certain Relationships and Related Transactions, and Director Independence
The information required by Item 13 regarding transactions with related persons is incorporated by reference from the information under the caption “Certain Relationships and Related Party Transactions” in the Proxy Statement, or will be filed by amendment.
92
The information required by Item 13 regarding director independence is incorporated by reference from the information under the caption “The Board of Directors” in the Proxy Statement, or will be filed by amendment.
Item 14. Principal Accountant Fees and Services
The information required by Item 14 is incorporated by reference from the information under the caption “The Board of Directors – Audit Committee Matters” in the Proxy Statement, or will be filed by amendment.
93
PART IV
Item 15. Exhibits and Financial Statement Schedules
(a) List of documents filed as part of this Annual Report or incorporated herein by reference:
|
(1) |
Financial Statements: The following financial statements of the Registrant as set forth under Part II, Item 8 of this report on Form 10-K on the pages indicated: |
Audited Financial Statements for the Three Years Ended December 31, 2017:
(2) Financial Statement Schedules:
(a) Schedule II:
SCHEDULE II
Valuation and Qualifying Accounts for the years ended December 31, 2017, 2016, and 2015 (in thousands)
|
|
||||||||||||||||
|
Column A |
Column B |
Column C |
Column D |
Column E |
||||||||||||
|
Additions |
||||||||||||||||
|
|
Balance at |
Charged to |
Charged to |
Balance at |
||||||||||||
|
|
Beginning of |
Costs and |
Other |
End of |
||||||||||||
|
Description |
Year |
Expenses |
Accounts |
Deductions |
Year |
|||||||||||
|
Year Ended December 31, 2017 |
||||||||||||||||
|
Allowance for doubtful accounts |
$ |
961 |
$ |
533 |
$ |
- |
$ |
(109) |
(a) |
$ |
1,385 | |||||
|
Deferred tax asset valuation allowance |
44,535 | 7,767 | 2,358 |
- |
54,660 | |||||||||||
|
Year Ended December 31, 2016 |
||||||||||||||||
|
Allowance for doubtful accounts |
$ |
1,277 |
$ |
304 |
$ |
- |
$ |
(620) |
(a) |
$ |
961 | |||||
|
Deferred tax asset valuation allowance |
37,094 | 1,517 | 5,924 |
- |
44,535 | |||||||||||
|
Year Ended December 31, 2015 |
||||||||||||||||
|
Allowance for doubtful accounts |
$ |
1,181 |
$ |
644 |
$ |
- |
$ |
(547) |
(a) |
$ |
1,277 | |||||
|
Deferred tax asset valuation allowance |
167,761 | (121,082) | (9,586) |
- |
37,094 | |||||||||||
_______________
|
(a) |
Write off of uncollectible accounts and collections of past due accounts. |
All other schedules are omitted because they are inapplicable or not required or the information is included in the Company's Consolidated Financial Statements or the notes thereto.
94
(3) Exhibits
|
3.1 |
|
|
|
|
|
3.2 |
|
|
|
|
|
4.1 |
See Exhibits 3.1 and 3.2 for provisions of the Certificate of Incorporation and Bylaws of the Registrant defining the rights of holders of common stock of the Registrant. |
|
|
|
|
4.2 |
|
|
|
|
|
10.1 |
|
10.2 |
|
|
|
|
|
10.3† |
|
|
|
|
|
10.4 |
|
|
|
|
|
10.5† |
|
|
|
|
|
10.6† |
|
|
|
|
|
10.7† |
|
|
|
|
|
10.8† |
|
|
|
|
|
10.9† |
|
|
10.10† |
95
|
|
|
|
10.11† |
|
|
|
|
|
10.12† |
|
|
|
|
|
10.13† |
|
|
|
|
|
10.14†† |
|
|
|
|
|
10.15 |
|
|
|
|
|
10.16†† |
|
|
|
|
|
10.17†† |
|
|
|
|
|
10.18 |
|
|
|
|
|
10.19†† |
|
|
|
|
|
10.20† |
|
|
|
|
|
10.21††† |
|
|
|
|
|
10.22††† |
|
|
|
|
|
10.23 |
96
|
10.24 |
|
|
|
|
|
10.25† |
|
|
|
|
|
10.26† |
|
|
|
|
|
10.27† |
|
|
|
|
|
10.28† |
|
|
|
|
|
10.29† |
|
|
|
|
|
10.30 |
|
|
|
|
|
10.31 |
|
10.32 |
|
|
|
|
|
10.33 |
|
|
|
97
|
10.34 |
|
|
|
|
|
10.35 |
|
|
|
|
|
10.36† |
|
|
|
|
|
10.37† |
|
|
|
|
|
10.38 |
|
|
|
|
|
10.39 |
|
|
|
|
|
10.40† |
|
10.41† |
|
|
|
|
|
10.42† |
|
|
|
|
|
10.43† |
|
|
|
|
|
10.44† |
98
|
|
|
|
10.45† |
|
|
10.46† |
|
|
|
|
|
10.47† |
|
|
|
|
|
10.48† |
|
|
|
|
|
10.49† |
|
|
|
|
|
10.50 |
|
|
|
|
|
10.51 |
|
|
|
|
|
10.52 |
|
|
|
|
|
10.53 |
|
|
|
|
|
10.54 |
|
|
|
|
|
10.55† |
|
|
|
99
|
10.56† |
|
|
|
|
|
10.57† |
|
|
|
|
|
10.58 |
|
|
|
|
|
10.59 |
|
|
|
|
|
10.60†* |
|
|
|
|
|
10.61†* |
|
|
|
|
|
10.62†* |
|
|
|
|
|
11.1 |
A statement regarding the computation of earnings per share is omitted because such computation can be clearly determined from the material contained in this Report. |
|
|
|
|
21.1* |
|
|
|
|
|
23.1* |
Consent of Deloitte & Touche LLP, Independent Registered Public Accounting Firm |
|
|
|
|
31.1* |
|
|
|
|
|
31.2* |
|
|
|
|
|
32.1** |
|
|
|
|
|
32.2** |
|
101.DEF |
XBRL Taxonomy Extension Definition Linkbase Document |
|
|
|
||
|
101.INS |
XBRL Instance Document |
|
|
|
||
|
101.SCH |
XBRL Taxonomy Extension Scheme Document |
|
|
|
100
|
101.CAL |
XBRL Taxonomy Extension Calculation Linkbase Document |
|
|
|
||
|
101.LAB |
XBRL Taxonomy Extension Label Linkbase Document |
|
|
|
||
|
101.PRE |
XBRL Taxonomy Extension Presentation Linkbase Document |
|
* |
Filed herewith. |
|
** |
Furnished herewith. |
|
† |
Management contract or compensatory plan or arrangement. |
|
†† |
Confidential treatment has been granted for certain provisions of this Exhibit pursuant to Rule 406 promulgated under the Securities Act of 1933, as amended. |
|
††† |
Portions of this exhibit have been omitted pursuant to the Company’s request to the Secretary of the Securities and Exchange Commission for confidential treatment pursuant to Rule 24b-2 under the Securities Exchange Act of 1934, as amended |
Item 16. Form 10-K Summary
None
101
Pursuant to the requirements of Section 13 or 15(d) of the Securities Exchange Act of 1934, the Registrant has duly caused this report to be signed on its behalf by the undersigned, thereunto duly authorized.
Date: February 28, 2018/s/ Jeffrey L. Kersten
Jeffrey L. Kersten
Chief Financial Officer
Pursuant to the requirements of the Securities Exchange Act of 1934, this report has been signed by the following persons on behalf of the Registrant and in the capacities indicated on the 28th day of February, 2018.
Signature Title
|
/s/ James C. Gouin James C. Gouin |
|
Chief Executive Officer and Director (Principal Executive Officer) |
|
|
|
|
|
/s/ Jeffrey L. Kersten Jeffrey L. Kersten |
|
Executive Vice President and Chief Financial Officer (Principal Financial Officer and Principal Accounting Officer) |
|
|
|
|
|
/s/ Thomas K. Brown |
|
Director |
|
Thomas K. Brown
|
|
|
|
/s/ James Chapman |
|
Director |
|
James Chapman |
|
|
|
/s/ Frank E. English |
|
Director |
|
Frank E. English |
|
|
|
|
|
|
|
/s/ Alison Davis-Blake |
|
Director |
|
Alison Davis-Blake |
|
|
|
|
|
|
|
/s/ Dev Kapadia |
|
Director |
|
Dev Kapadia |
|
|
|
|
|
|
|
/s/ Mark M. Malcolm |
|
Director |
|
Mark M. Malcolm |
|
|
102