Attached files
| file | filename |
|---|---|
| 8-K - SANDLER O'NEILL PRESENTATION - INDEPENDENT BANK CORP | sandleroneillpresetationfo.htm |

Sandler O' Neill East Coast Financial Services November 11, 2015 Robert Cozzone – Chief Financial Officer and Treasurer Exhibit 99.1

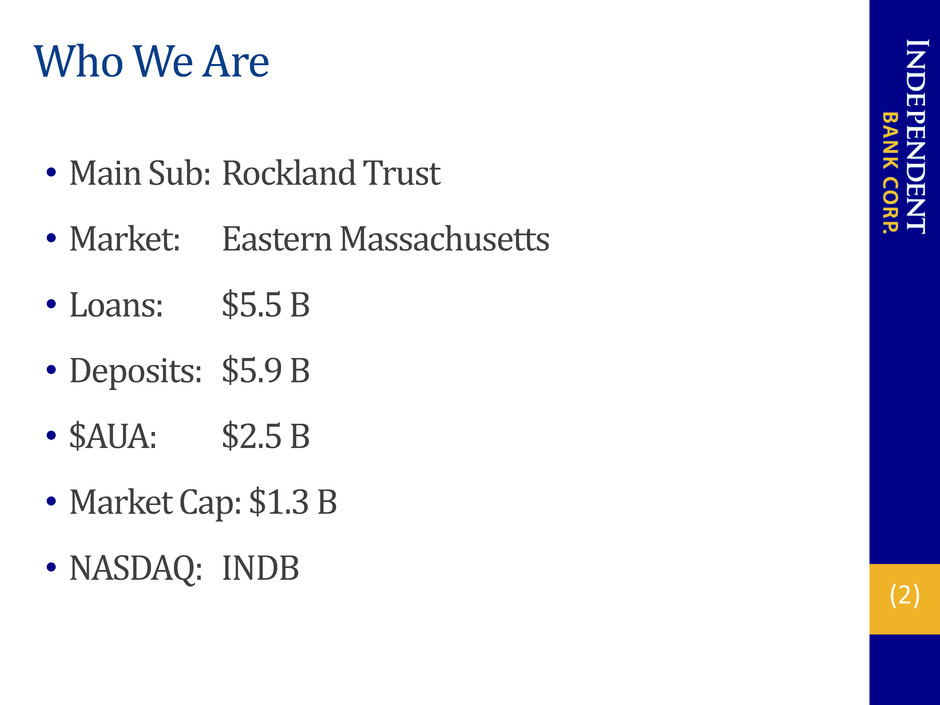
(2) Who We Are • Main Sub: Rockland Trust • Market: Eastern Massachusetts • Loans: $5.5 B • Deposits: $5.9 B • $AUA: $2.5 B • Market Cap: $1.3 B • NASDAQ: INDB

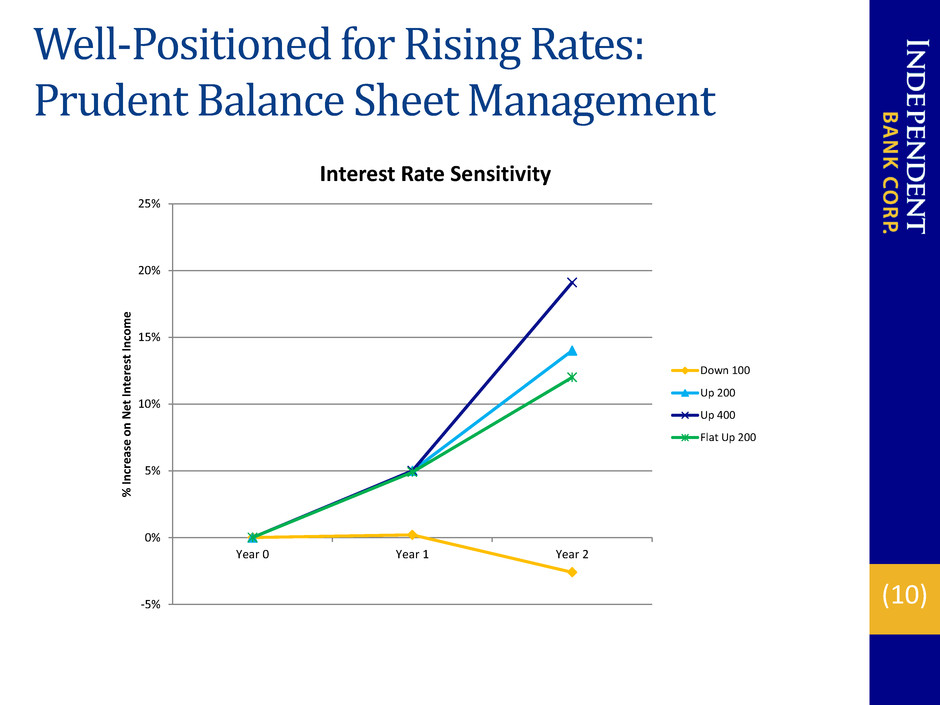
(3) Key Messages • Track record of consistent, solid performance • Robust core deposit and deal flow activity • Growing fee revenue sources, esp. Investment Mgmt. • Expanding footprint in growth markets • Tangible book value steadily rising • Well-positioned for rising rate environment • Disciplined risk management culture

(4) Expanding Company Footprint Rank 2015 1 24.6% 42% Rank 2015 6 5.0% 20% Rank 2015 4 9.8% 12% Rank 2015 7 7.6% 11% Rank 2015 20 1.1% 10% Rank 2015 17 0.3% 4% Rank 2015 32 0.3% 1% Worcester County Suffolk County Middlesex County Norfolk County % of INDB Dep.Share Barnstable County (Cape Cod) Market Plymouth County Bristol County Source: SNL Financial; Deposit/Market Share data as of June 30, 2015.

(5) Recent Accomplishments • Record operating EPS performance in 2014 • Expect to exceed in 2015 • Fully integrated Peoples Federal Bancshares – first retail presence in Boston • Capitalizing on expansion moves in Greater Boston • Strong household growth rate • Keeping pace with digital trend, esp. mobile banking

(6) Strong Fundamentals Driving Performance 47.1 55.2 59.9 43.3 52.3 2012 2013 2014 YTD 14 YTD 15 Operating Earnings ($ Mil.) +21% +13% CAGR Diluted EPS $2.16 $2.39 $2.50 $1.81 $2.02 • Strong customer volumes • Core deposits up to 88% • Fee revenues rising • Low funding costs • Solid asset quality vs. peers • TBV steadily growing • Solid returns

(7) Robust Commercial Lending Franchise TOTAL LOANS $5.5 B AVG. YIELD: 3.99% 3Q 2015 Comm'l 71% Resi Mtg 12% Home Eq 17% • Long-term CRE/ C&I lender • Strong name recognition in local markets • Growing in sophistication and capacity • Expanded market presence • Increased small business focus • Disciplined underwriting

(8) Low Cost Deposit Base Demand Deposits 30% Money Market 19% Savings/Now 39% CDs 12% TOTAL DEPOSITS $5.9 B AVG. COST: 0.20% 3Q 2015 • Valuable source of liquidity • Sizable demand deposit component • Relationship-based approach • Excellent household growth • Growing commercial base CORE DEPOSITS: 88%

(9) 6.1 19.6 15.6 2006 2014 YTD 15 Revenues ($ Mil.) 816 2,540 2006 3Q15 AUAs ($ Mil.) Investment Management : Transformed Into High Growth Business +211% +221% • Successful business model • Growing source of fee revenues • Strong feeder business from Bank • Expanding investment center locations • Cross-sell opportunity in acquired bank markets

(10) Well-Positioned for Rising Rates: Prudent Balance Sheet Management -5% 0% 5% 10% 15% 20% 25% Year 0 Year 1 Year 2 % In cr e ase o n N e t In te re st In co m e Interest Rate Sensitivity Down 100 Up 200 Up 400 Flat Up 200

(11) Asset Quality: Well Managed 28.8 34.7 27.5 29.6 2012 2013 2014 3Q15 NPLs ($ Mil.) 9.7 8.8 8.5 0.9 4.8 2012 2013 2014 YTD 15 Net Chargeoffs ($ Mil.) customer fraud 14.5 customer fraud NPL/Loan % 0.64% 0.73% 0.55% 0.54% Peers 0.88%* Loss Rate 36bp 19bp 18bp 2bp Peers 8bp* * Source: FFIEC Peer Group 2; $3-10 Billion in Assets, June 30, 2015 Incl. 90 days + overdue

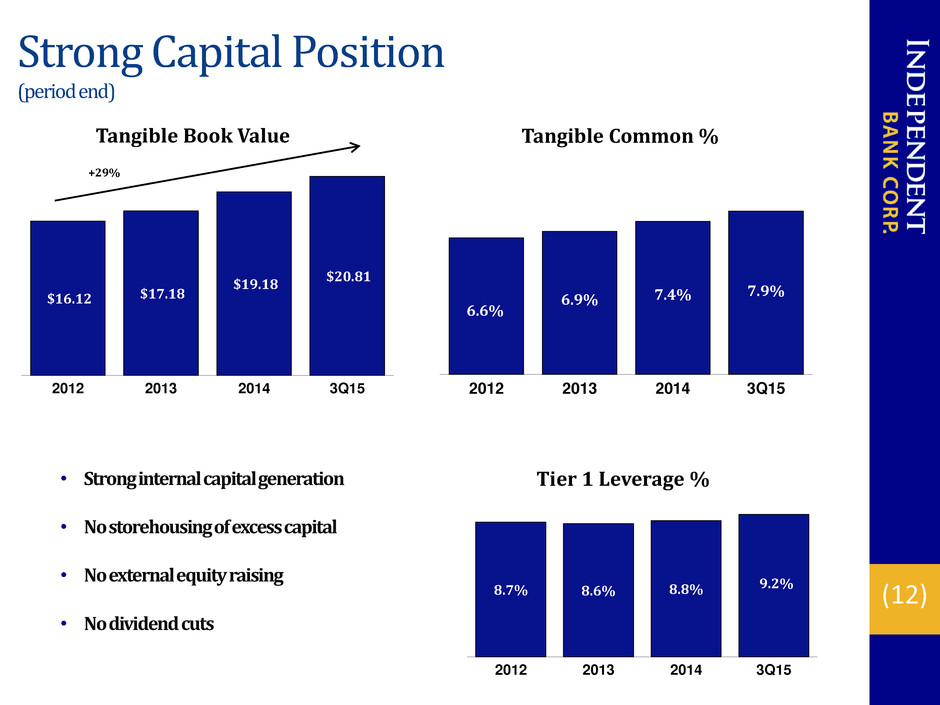
(12) Strong Capital Position (period end) 8.7% 8.6% 8.8% 9.2% 2012 2013 2014 3Q15 6.6% 6.9% 7.4% 7.9% 2012 2013 2014 3Q15 Tier 1 Leverage % Tangible Common % $16.12 $17.18 $19.18 $20.81 2012 2013 2014 3Q15 Tangible Book Value +29% • Strong internal capital generation • No storehousing of excess capital • No external equity raising • No dividend cuts

(13) 2015 Outlook: Key Expectations Loans + 1-2% organic Led by commercial segment Deposits + 3-4% organic Emphasis on core deposits Net Int. Mar. % Low 3.40s% Continued pressure on loan yields Non Int. Inc. + 3-4% organic Ongoing core customer growth Non Int. Exp. + 3-4% organic Selective franchise investments with further improvement in operating efficiency Net Chgoffs $ 1-2 MM Continued strong asset quality Provision $ 2-3 MM Tax Rate ~29% vs. 28.5% in '14 Operating EPS Tang. Common % 7.75-8% Continuing to build $ 2.63-2.73 Upper end of range expected

(14) Sustaining Business Momentum Business Line • Expand Market Presence/Recruit Seasoned Lenders • Grow C&I Client Base • Expand Specialty Products, e.g. ABL Commercial • Continue to Drive Household Growth • Expand Electronic Banking Platform • Optimize Branch Network Retail Delivery • Capitalize on Strong Market Demographics • Continue Strong Branch/Commercial Referrals • Expand Investment Centers Investment Management • Continue Aggressive H.E. Marketing • Scalable Resi Mortgage Origination Platform Consumer Lending Focal Points

(15) Expanded Presence in Vibrant Greater Boston Long-Term Commercial Lender in Greater Boston Central Bancorp $357MM Deposits 10 Branches – Nov. 2012 Investment Management and Commercial Lending Center October 2013 Peoples Federal Bancshares $432MM Deposits 8 Branches – Feb. 2015

(16) Building Franchise Value Disciplined Acquisitions Deal Value: $16.9MM 11% Core Dep. Premium* Falmouth Bancorp Jul ‘04 $140mm Assets $137mm Deposits 4 Branches Deal Value: $102.2 MM 17% Core Dep. Premium* Slade’s Ferry Bancorp Mar ‘08 $630mm Assets $411mm Deposits 9 Branches Deal Value: $84.5MM 2% Core Dep. Premium* Benjamin Franklin Bancorp Apr ‘09 $994mm Assets $701mm Deposits 11 Branches Deal Value: $52.0MM 8% Core Dep. Premium* Central Bancorp Nov ‘12 $537mm Assets $357mm Deposits 10 Branches Deal Value: $40.3MM 8% Core Dep. Premium* Mayflower Bancorp Nov’13 $243mm Assets $219mm Deposits 8 Branches $640 mm Assets $432mm Deposits 8 Branches Deal Value: $141.8MM 10% Core Dep. Premium** All Acquisitions Immediately Accretive *Incl. CDs <$100k Deal metrics based on closing price and actual acquired assets Peoples Federal Bancshares Feb ‘15

(17) Major Opportunities in Acquired Bank Markets: Capitalizing on Rockland Trust Brand Investment Management Commercial Banking Retail/ Consumer • $2.5 billion AUA • Wealth/Institutional • Strong referral network • Sophisticated products • Expanded presence • In depth market knowledge • Award winning customer service • Electronic/mobile banking • Competitive home equity products Acquired Bank Customer Bases

(18) Augmenting Organic Growth • Expanding asset-based lending capability • Streamlining of mobile banking app • Launching of a new and improved RocklandTrust.com website • Tax credit community lending programs • Attracting senior talent from within the region • Process Improvement/ Business Intelligence Low-Risk Growth Opportunities

(19) Attentive to Shareholder Returns $0.84 $0.88 $0.96 $0.78 2012 2013 2014 YTD 15 Cash Dividends Declared Per Share

(20) INDB Investment Merits • High quality franchise in attractive markets • Strong organic business volumes • Operating platform that can be leveraged further • Capitalizing on in-market consolidation opportunities • Diligent stewards of shareholder capital • Grounded management team • Positioned to grow, build, and acquire to drive long-term value creation

(21) NASDAQ Ticker: INDB www.rocklandtrust.com Robert Cozzone – CFO & Treasurer Shareholder Relations: (781) 982-6737 Statements contained in this presentation that are not historical facts are “forward-looking statements” that are subject to risks and uncertainties which could cause actual results to differ materially from those currently anticipated due to a number of factors, which include, but are not limited to, factors discussed in documents filed by the Company with the Securities and Exchange Commission from time to time.
