Attached files
| file | filename |
|---|---|
| 8-K - 8-K - CITIZENS & NORTHERN CORP | v424063_8k.htm |
Exhibit 99.1
Sandler O’Neill + Partners, L.P. East Coast Financial Services Conference November 10 - 11, 2015

Safe Harbor This presentation contains statements which, to the extent that they are not recitations of historical fact may constitute fo rwa rd - looking statements for purposes of the Securities Act of 1933, as amended, and the Securities Exchange Act of 1934, as amended. Such forward - looking statements may include financial and other projections as well as statements regarding Citizens & Northern Corporation (the “Corporation”) that may include future plans, objectives, performance, revenues, growth, pr ofits, operating expenses or the Corporation’s underlying assumptions. The words “may”, “would”, “should”, “could”, “will”, “likely”, “possibly”, “expect,” “anticipate,” “i nte nd”, “estimate”, “target”, “potentially”, “probably”, “outlook”, “predict”, “contemplate”, “continue”, “strategic”, “objective”, “plan”, “forecast”, “project” and “believe” or oth er similar words, phrases or concepts may identify forward - looking statements. Persons reading or present at this presentation are cautioned that such statements are only predictions, and that the Corporation’s actual future results or performance may be materially different. Such forward - looking statements involve known and unknown risks and uncertainties. A number of factors, many of which are beyond the Corporation’s control, could cause our actual results, events or developments, or industry results, to be materially different from any future results, events or de vel opments expressed, implied or anticipated by such forward - looking statements, and so our business and financial condition and results of operations could be materially and adversely a ffe cted. Such factors include, among others, that the execution of any mergers with the Corporation may take longer than anticipated o r b e more costly to complete and that the anticipated benefits, including any anticipated cost savings or strategic gains, may be significantly harder to achieve or take longer th an anticipated or may not be achieved, our need for capital, our ability to control operating costs and expenses, and to manage loan and lease delinquency rates; the credit risks of lend ing activities and overall quality of the composition of our loan and securities portfolio; the impact of economic conditions, consumer and business spending habits, and real estate mark et conditions on our business and in our market area; changes in the levels of general interest rates, deposit interest rates, or net interest margin and funding sources; changes in banking regulations and policies and the possibility that any banking agency approvals we might require for certain activities will not be obtained in a timely manner or at all or will be co nditioned in a manner that would impair our ability to implement our business plans; changes in accounting policies and practices; the inability of key third - party providers to perfor m their obligations to us; our ability to attract and retain key personnel; competition in our marketplace; war or terrorist activities; material differences in the actual financial resu lts , cost savings and revenue enhancements associated with our acquisitions; and other factors as described in our securities filings. All forward - looking statements and information made here in are based on management’s current beliefs and assumptions as of November 11, 2015 and speak only as of that date. The Corporation does not undertake to update forward - looking statements. For a complete discussion of the assumptions, risks and uncertainties related to our business, you are encouraged to review o ur filings with the Securities and Exchange Commission, including our most recent annual report on Form 10 - K, as well as any changes in risk factors that we may identify in our quarter ly or other reports subsequently filed with the SEC. 2
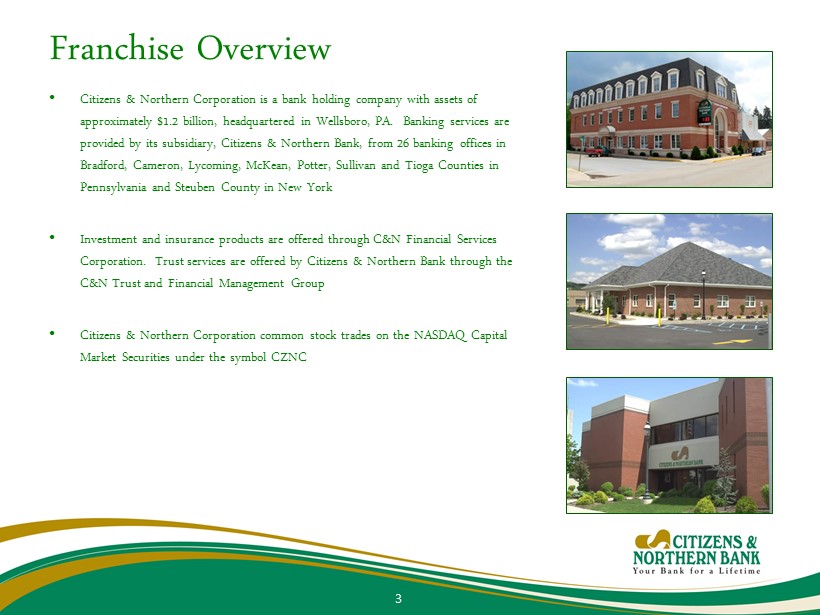
Franchise Overview • Citizens & Northern Corporation is a bank holding company with assets of approximately $1.2 billion, headquartered in Wellsboro, PA. Banking services are provided by its subsidiary, Citizens & Northern Bank, from 26 banking offices in Bradford, Cameron, Lycoming, McKean, Potter, Sullivan and Tioga Counties in Pennsylvania and Steuben County in New York • Investment and insurance products are offered through C&N Financial Services Corporation. Trust services are offered by Citizens & Northern Bank through the C&N Trust and Financial Management Group • Citizens & Northern Corporation common stock trades on the NASDAQ Capital Market Securities under the symbol CZNC 3
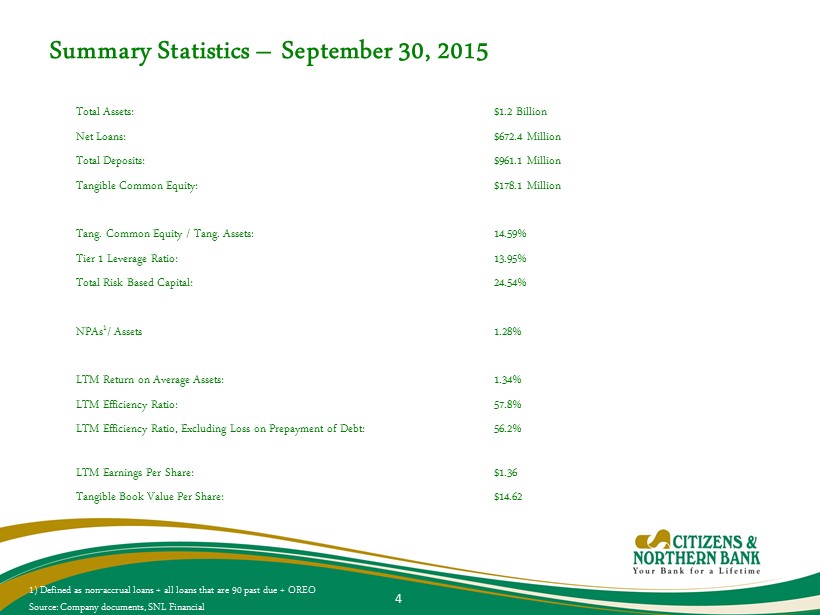
Summary Statistics – September 30, 2015 Total Assets: $1.2 Billion Net Loans: $672.4 Million Total Deposits: $961.1 Million Tangible Common Equity: $178.1 Million Tang. Common Equity / Tang. Assets: 14.59% Tier 1 Leverage Ratio: 13.95% Total Risk Based Capital: 24.54% NPAs 1 / Assets 1.28% LTM Return on Average Assets: 1.34% LTM Efficiency Ratio: 57.8% LTM Efficiency Ratio, Excluding Loss on Prepayment of Debt: 56.2% LTM Earnings Per Share: $1.36 Tangible Book Value Per Share: $14.62 1) Defined as non - accrual loans + all loans that are 90 past due + OREO Source: Company documents, SNL Financial 4
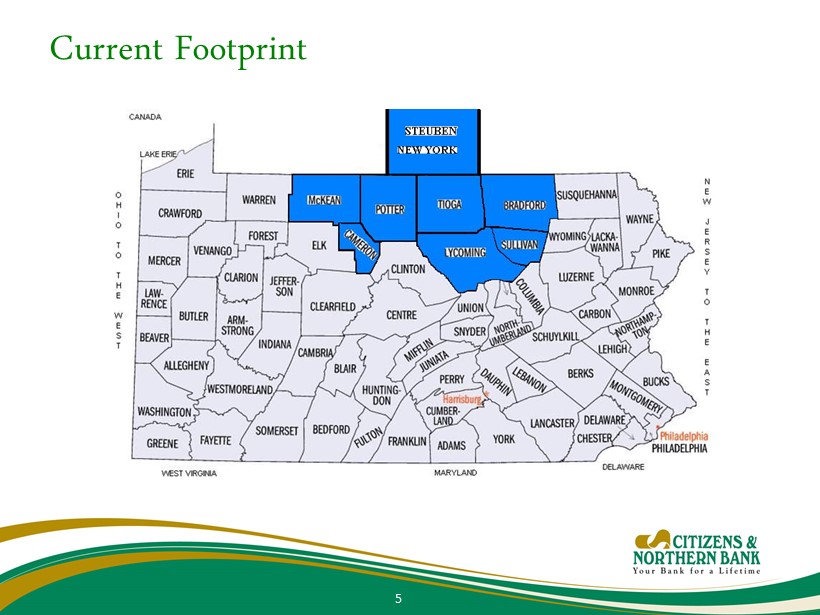
Current Footprint 5
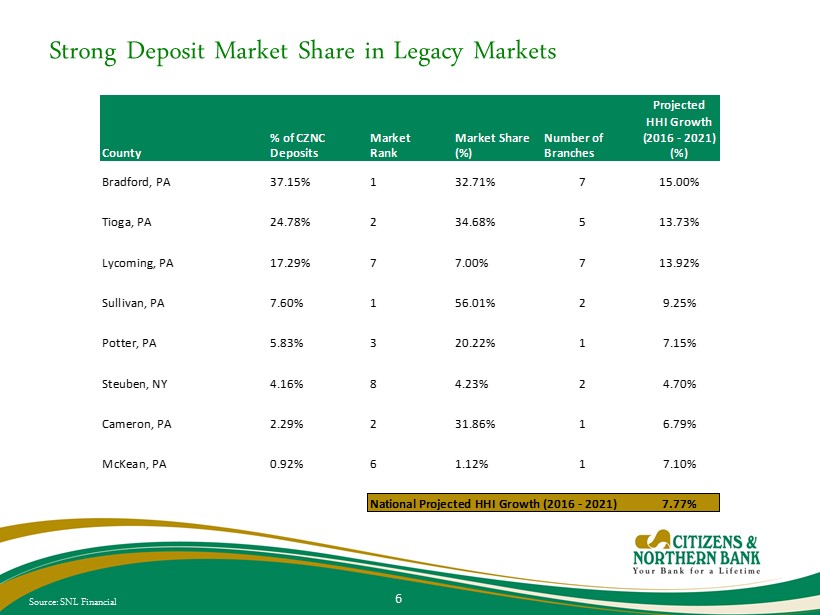
Strong Deposit Market Share in Legacy Markets Source: SNL Financial 6 Projected HHI Growth % of CZNC Market Market Share Number of (2016 - 2021) County Deposits Rank (%) Branches (%) Bradford, PA 37.15% 1 32.71% 7 15.00% Tioga, PA 24.78% 2 34.68% 5 13.73% Lycoming, PA 17.29% 7 7.00% 7 13.92% Sullivan, PA 7.60% 1 56.01% 2 9.25% Potter, PA 5.83% 3 20.22% 1 7.15% Steuben, NY 4.16% 8 4.23% 2 4.70% Cameron, PA 2.29% 2 31.86% 1 6.79% McKean, PA 0.92% 6 1.12% 1 7.10% National Projected HHI Growth (2016 - 2021) 7.77%
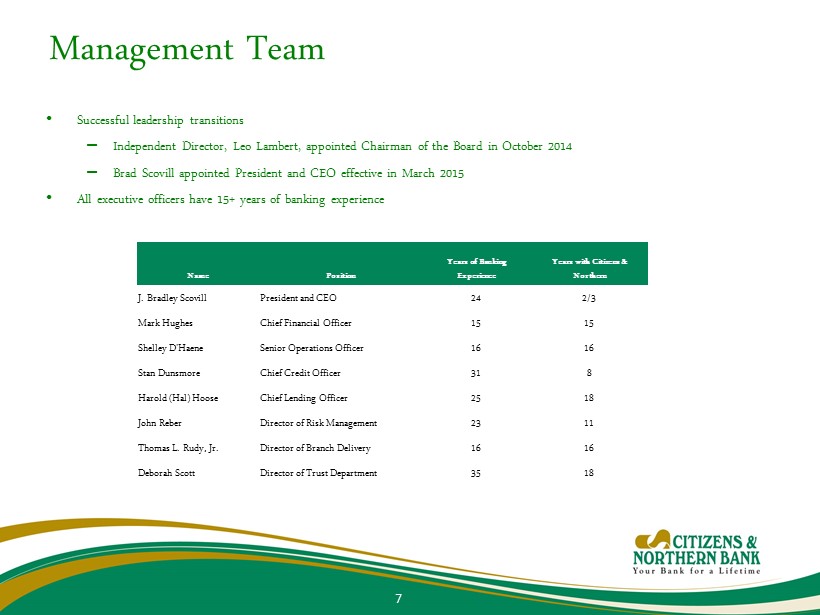
Management Team • Successful leadership transitions – Independent Director, Leo Lambert, appointed Chairman of the Board in October 2014 – Brad Scovill appointed President and CEO effective in March 2015 • All executive officers have 15+ years of banking experience Years of Banking Years with Citizens & Name Position Experience Northern J. Bradley Scovill President and CEO 24 2/3 Mark Hughes Chief Financial Officer 15 15 Shelley D'Haene Senior Operations Officer 16 16 Stan Dunsmore Chief Credit Officer 31 8 Harold (Hal) Hoose Chief Lending Officer 25 18 John Reber Director of Risk Management 23 11 Thomas L. Rudy, Jr. Director of Branch Delivery 16 16 Deborah Scott Director of Trust Department 35 18 7
• Strategic Investments – Recent hires and development of people – Striving to be “best in class” with technology - based products • Evaluating New Market Opportunities – Targeting markets and individuals/teams for expansion • Proactive M&A Strategy – Focus on preparedness • Capital Deployment – Current dividend yield above 5% and stock buyback program in progress • Risk Management – Continue to strengthen enterprise risk management programs consistent with size and complexity of the company Current Strategic Focus 8

Consistently High Earnings Performance Source: Company documents, SNL Financial 9 Earnings Per Share Efficiency Ratio ROAA ROAE $1.45 $1.92 $1.85 $1.50 $1.38 $1.36 $0.75 $0.90 $1.05 $1.20 $1.35 $1.50 $1.65 $1.80 $1.95 2010 2011 2012 2013 2014 LTM Q3 2015 52.86% 49.51% 48.81% 54.70% 57.76% 57.80% 30.00% 36.00% 42.00% 48.00% 54.00% 60.00% 66.00% 72.00% 78.00% 2010 2011 2012 2013 2014 LTM Q3 2015 1.44% 1.78% 1.74% 1.50% 1.38% 1.34% 0.75% 0.90% 1.05% 1.20% 1.35% 1.50% 1.65% 1.80% 1.95% 2010 2011 2012 2013 2014 LTM Q3 2015 12.69% 15.30% 12.91% 10.25% 9.21% 8.91% 0.00% 2.00% 4.00% 6.00% 8.00% 10.00% 12.00% 14.00% 16.00% 2010 2011 2012 2013 2014 LTM Q3 2015
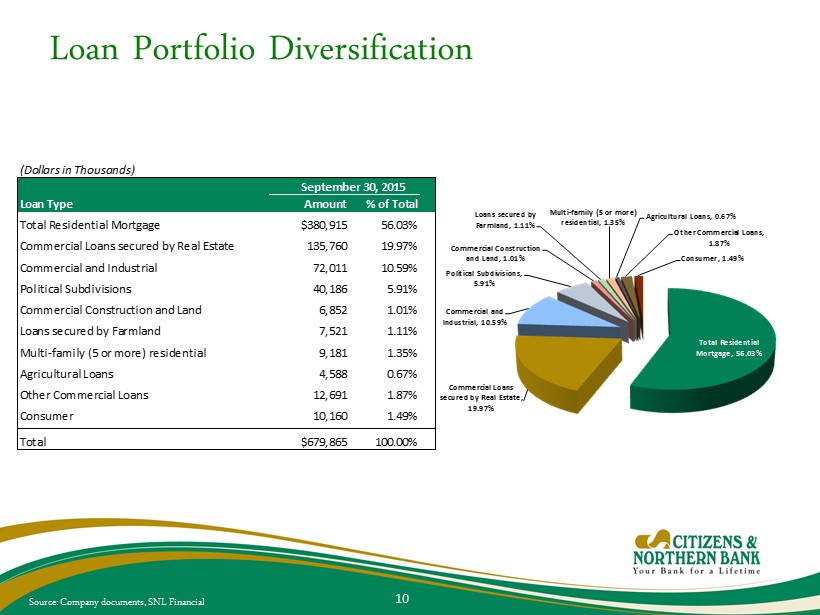
Loan Portfolio Diversification Source: Company documents, SNL Financial 10 (Dollars in Thousands) September 30, 2015 Loan Type Amount % of Total Total Residential Mortgage $380,915 56.03% Commercial Loans secured by Real Estate 135,760 19.97% Commercial and Industrial 72,011 10.59% Political Subdivisions 40,186 5.91% Commercial Construction and Land 6,852 1.01% Loans secured by Farmland 7,521 1.11% Multi-family (5 or more) residential 9,181 1.35% Agricultural Loans 4,588 0.67% Other Commercial Loans 12,691 1.87% Consumer 10,160 1.49% Total $679,865 100.00% Total Residential Mortgage, 56.03% Commercial Loans secured by Real Estate, 19.97% Commercial and Industrial, 10.59% Political Subdivisions, 5.91% Commercial Construction and Land, 1.01% Loans secured by Farmland, 1.11% Multi - family (5 or more) residential, 1.35% Agricultural Loans, 0.67% Other Commercial Loans, 1.87% Consumer, 1.49%

(Dollars in Thousands) September 30, 2015 Security Type Amount % of Total Obligations of U.S. Government Agencies $15,621 3.38% Obligations of states and political subdivisions: Tax-exempt 112,396 24.34% Taxable 35,124 7.61% Mortgage-backed securities 72,697 15.75% US Gov't collateralized mortgage obligations 218,052 47.23% Other collateral debt obligations 34 0.01% Total debt securities $453,924 98.31% Marketable equity securities 7,789 1.69% Total $461,713 100.00% Investment Portfolio – Available - for - Sale Source: Company documents, SNL Financial 11 US Gov't Agencies 3.38% State & Political - Tax - exempt 24.34% State & Political - Taxable 7.61% MBS 15.75% US Gov't CMO 47.23% Other collateral debt obligations 0.01% Marketable equity securities 1.69%
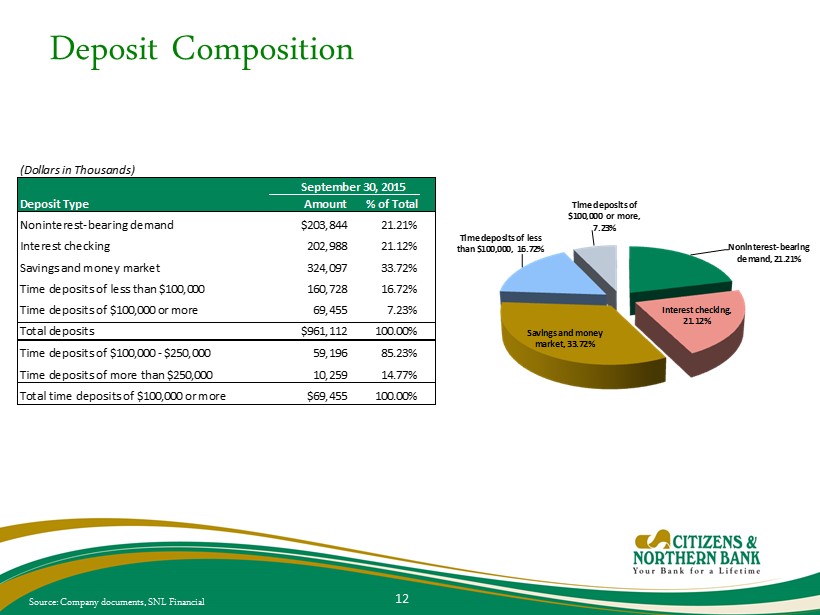
Deposit Composition Source: Company documents, SNL Financial 12 (Dollars in Thousands) September 30, 2015 Deposit Type Amount % of Total Noninterest-bearing demand $203,844 21.21% Interest checking 202,988 21.12% Savings and money market 324,097 33.72% Time deposits of less than $100,000 160,728 16.72% Time deposits of $100,000 or more 69,455 7.23% Total deposits $961,112 100.00% Time deposits of $100,000 - $250,000 59,196 85.23% Time deposits of more than $250,000 10,259 14.77% Total time deposits of $100,000 or more $69,455 100.00% Noninterest - bearing demand, 21.21% Interest checking, 21.12% Savings and money market, 33.72% Time deposits of less than $100,000, 16.72% Time deposits of $100,000 or more, 7.23%
• Largest Locally - based Wealth Management Department with Integrated Broker/Dealer and Insurance Sales • Team is comprised of over 30 professionals • $790 million in Trust assets under management at 9/30/15 • Trust and brokerage revenues totaled $4.1 million in nine - month period ended 9/30/15, or 9.4% of total revenues excluding securities gains • Trust and brokerage revenues totaled $5.4 million in 2014, or 9.1% of total revenues excluding securities gains Wealth Management Division 13
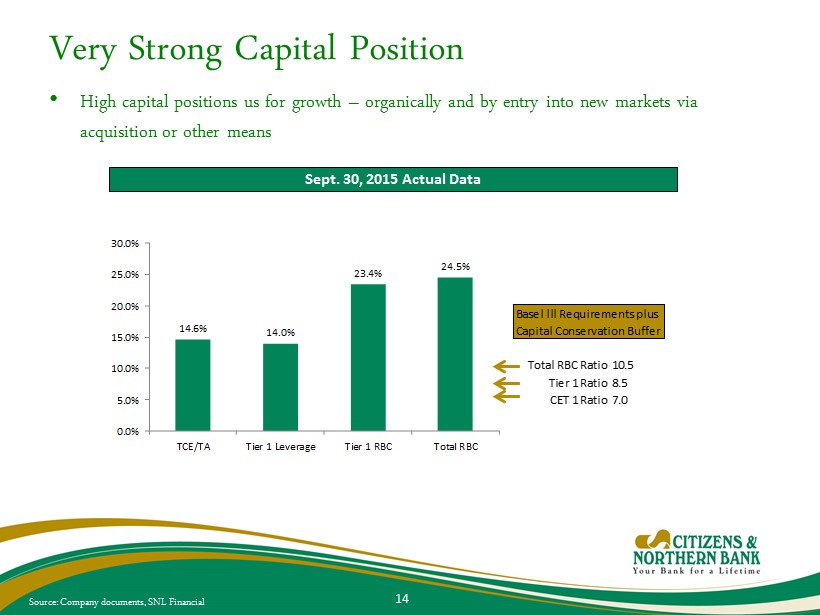
Very Strong Capital Position • High capital positions us for growth – organically and by entry into new markets via acquisition or other means Source: Company documents, SNL Financial 14 Sept. 30, 2015 Actual Data Basel lll Requirements plus Capital Conservation Buffer Total RBC Ratio10.5 Tier 1 Ratio8.5 CET 1 Ratio7.0 14.6% 14.0% 23.4% 24.5% 0.0% 5.0% 10.0% 15.0% 20.0% 25.0% 30.0% TCE/TA Tier 1 Leverage Tier 1 RBC Total RBC
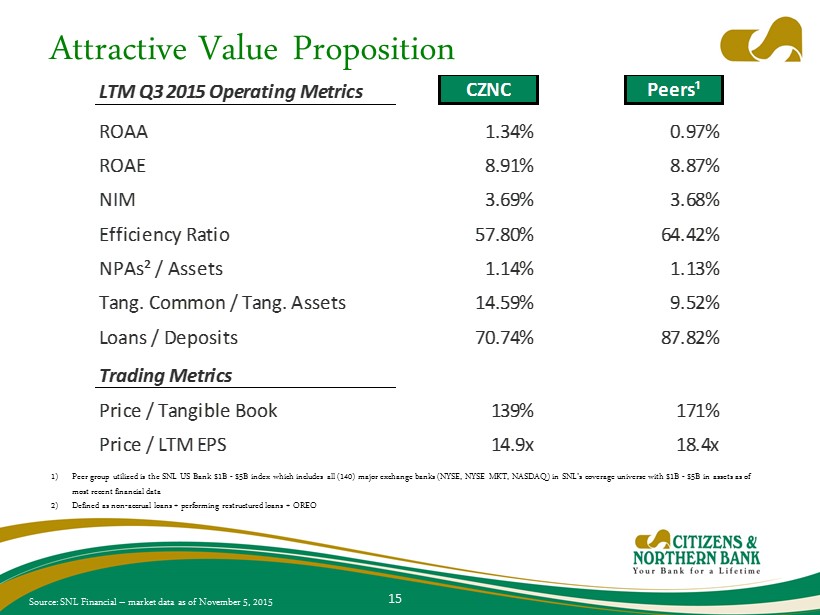
Attractive Value Proposition 1) Peer group utilized is the SNL US Bank $1B - $5B index which includes all (140) major exchange banks (NYSE, NYSE MKT, NASDAQ) in SNL’s coverage universe with $1B - $5B in assets as of most recent financial data 2) Defined as non - accrual loans + p erforming restructured loans + OREO 15 LTM Q3 2015 Operating Metrics CZNC Peers¹ ROAA 1.34% 0.97% ROAE 8.91% 8.87% NIM 3.69% 3.68% Efficiency Ratio 57.80% 64.42% NPAs² / Assets 1.14% 1.13% Tang. Common / Tang. Assets 14.59% 9.52% Loans / Deposits 70.74% 87.82% Trading Metrics Price / Tangible Book 139% 171% Price / LTM EPS 14.9x 18.4x Source: SNL Financial – market data as of November 5, 2015
• Leading market share among community banks in North Central Pennsylvania • Experienced Board and senior leadership team • Consistently high earnings performance, with diverse revenue sources • Very strong capital position • Significant loan growth in 2015 • Disciplined credit culture and risk management profile • Opportunity for growth in existing and new markets organically and through market dislocation • Well - established trust and financial management team • Quarterly dividends of $0.26 per share in 2015 and 2014, resulting in an annualized yield in excess of 5% 1 • Attractive valuation of 139% of Tangible Book Value and 14.9x LTM EPS 1 Investment Considerations 16 1) Source : SNL Financial – market data as of November 5, 2015

17 Contact Information President and CEO: Brad Scovill BradleyS@cnbankpa.com ; 570 - 723 - 2102 Treasurer and CFO: Mark Hughes MarkH@cnbankpa.com ; 570 - 724 - 8533 Online: www.cnbankpa.com www.cntrustpa.com www.cnfinancialservices.com