Attached files
| file | filename |
|---|---|
| 8-K - 8-K - KAPSTONE PAPER & PACKAGING CORP | a15-21737_18k.htm |
| EX-99.1 - EX-99.1 - KAPSTONE PAPER & PACKAGING CORP | a15-21737_1ex99d1.htm |
Exhibit 99.2
2015 Third Quarter Review Roger W. Stone Chairman and Chief Executive Officer Andrea K. Tarbox Vice President and Chief Financial Officer October 28, 2015 1
Forward Looking Statements Forward-Looking Statements The information in this presentation and statements made during this presentation may contain certain forward-looking statements within the meaning of federal securities laws. These statements reflect management’s expectations regarding future events and operating performance. Risk Factors These forward-looking statements involve a number of risks and uncertainties. A list of the factors that could cause actual results to differ materially from those expressed in, or underlying, any forward-looking statements can be found in the Company’s filings with the Securities and Exchange Commission, such as its annual and quarterly reports. The Company disclaims any obligation t revise or update such statements to reflect the occurrence of events after the date of this presentation. Non-GAAP Financial Measures This presentation refers to non-U.S. GAAP financial information. non U.S. GAAP to U.S. GAAP financial measures is available website at KapStonepaper.com under Investors. A reconciliation of onthecompany’s 2
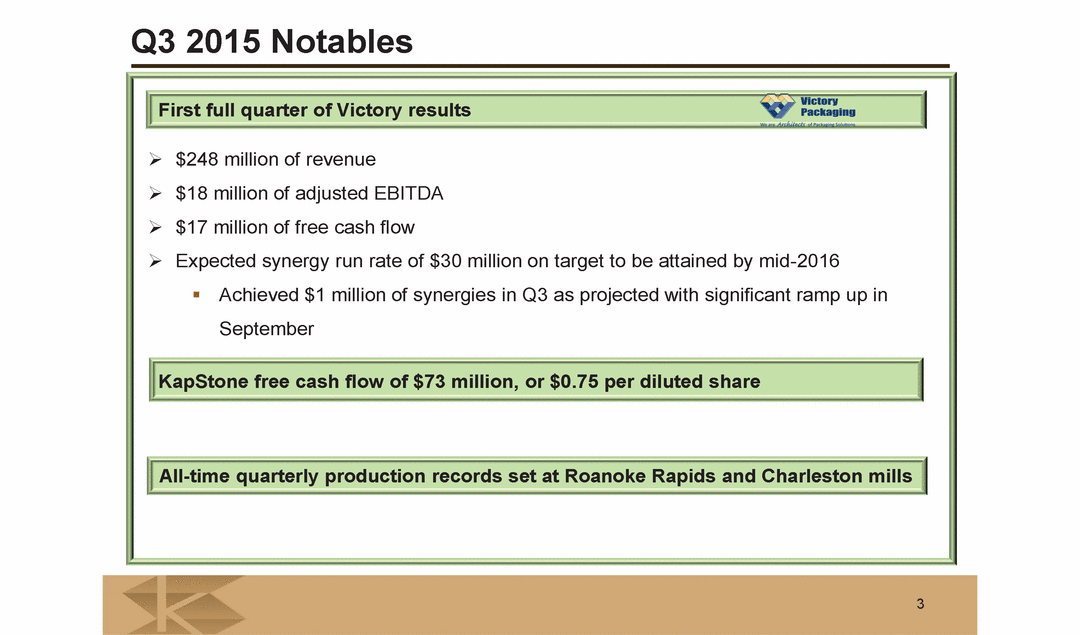
Q3 2015 Notables First full quarter of Victory results ¾ ¾ ¾ ¾ $248 million of revenue $18 million of adjusted EBITDA $17 million of free cash flow Expected synergy run rate of $30 million on target to be attained by mid-2016 as projected with significant ramp ƒ Achieved $1 million of synergies in Q3 September up in KapStone free cash flow of $73 million, or $0.75 per diluted share All-time quarterly production records set at Roanoke Rapids and Charleston mills 3
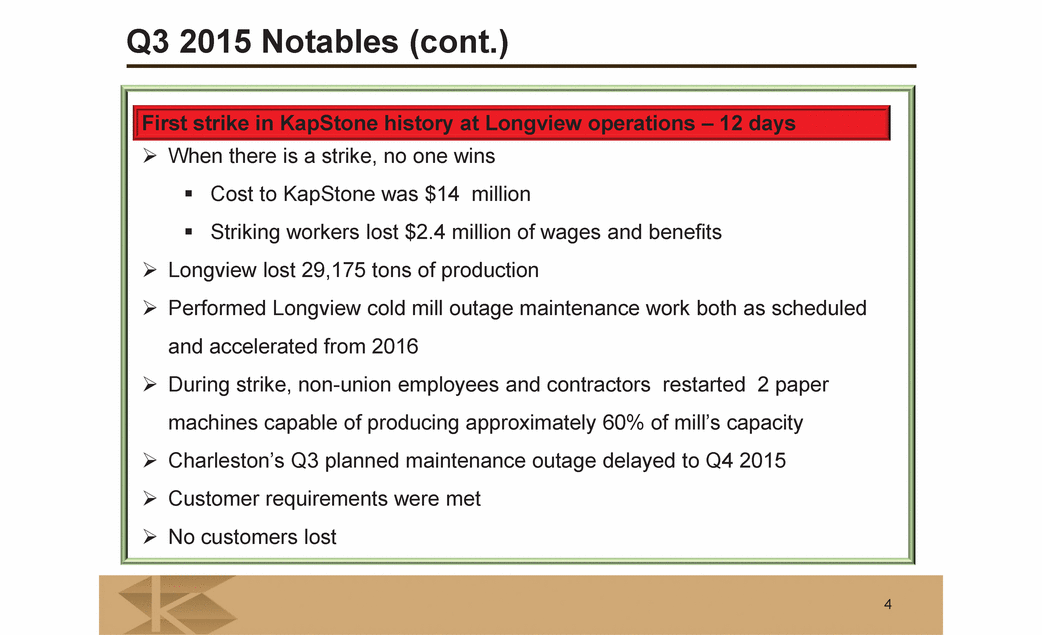
Q3 2015 Notables (cont.) First strike in KapStone history at Longview operations – 12 days ¾ When there is a strike, no one wins ƒ ƒ Cost to KapStone was $14 million Striking workers lost $2.4 million of wages and benefit ¾ ¾ Longview lost 29,175 tons of production Performed Longview cold mill outage maintenance work both as scheduled and accelerated from 2016 During strike, non-union employees and contractorsrestarted2 paper machines capable of producing approximately 60% of mill’s capacity Charleston’s Q3 planned maintenance outage delayed to Q4 2015 Customer requirements were met No customers lost ¾ ¾ ¾ ¾ 4
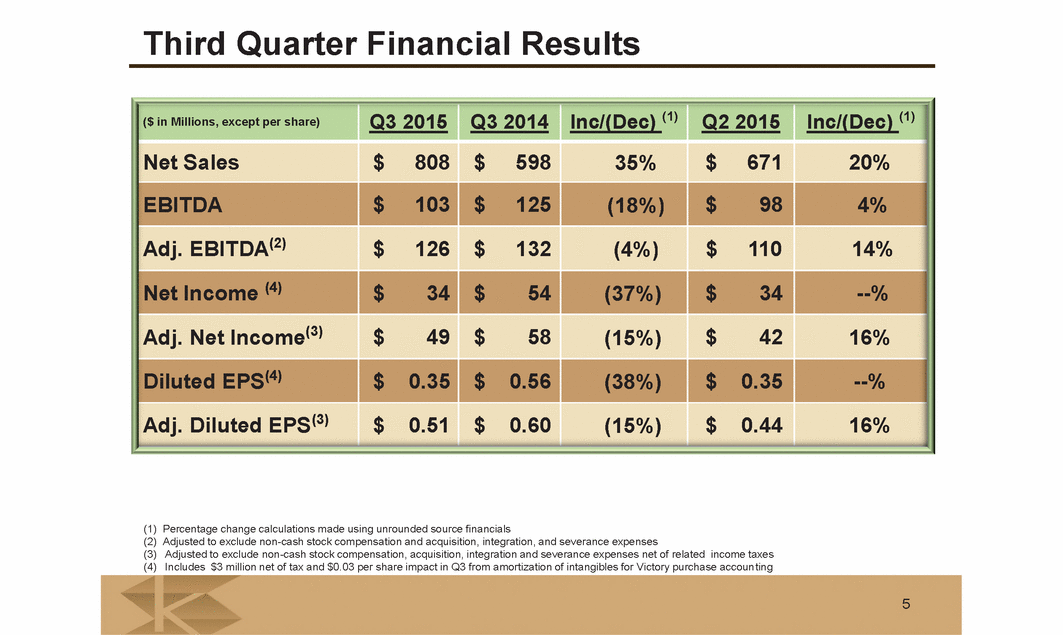
Third Quarter Financial Results (1) (2) (3) (4) Percentage change calculations made using unrounded source financials Adjusted to exclude non-cash stock compensation and acquisition, integration, and severance expenses Adjusted to exclude non-cash stock compensation, acquisition, integration and severance expenses net of related income taxes Includes $3 million net of tax and $0.03 per share impact in Q3 from amortization of intangibles for Victory purchase accounting 5 ($ in Millions, except per share) Q3 2015 Q3 2014 Inc/(Dec) (1) Q2 2015 Inc/(Dec) (1) Net Sales $ 808 $ 598 35% $ 671 20% EBITDA $103 $125 (18%) $98 4% Adj. EBITDA(2) $126 $132 (4%) $110 14% Net Income (4) $ 34 $ 54 (37%) $ 34 --% Adj. Net Income(3) $49 $58 (15%) $42 16% Diluted EPS(4) $0.35 $0.56 (38%) $0.35 --% Adj. Diluted EPS(3) $0.51 $0.60 (15%) $0.44 16%
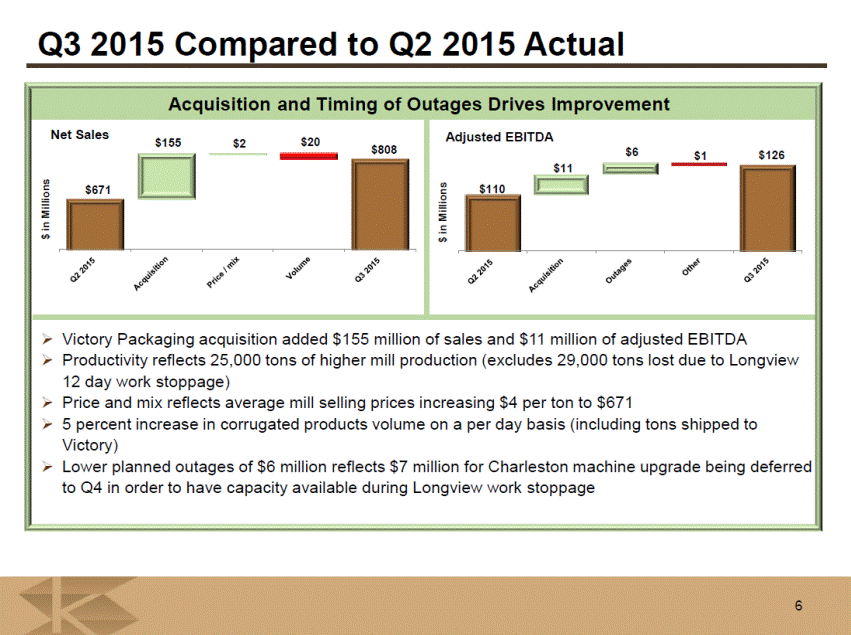
Q3 2015 Compared to Q2 2015 Actual Acquisition and Timing of Outages Drives Improvement Net Sales Adjusted EBITDA $671 $155 $2 $20 $808 $110 $11 $6 $1 $126 Victory Packaging acquisition added $155 million of sales and $11 million of adjusted EBITDA Productivity reflects 25,000 tons of higher mill production (excludes 29,000 tons lost due to Longview 12 day work stoppage) Price and mix reflects average mill selling prices increasing $4 per ton to $671 5 percent increase in corrugated products volume on a per day basis (including tons shipped to Victory) Lower planned outages of $6 million reflects $7 million for Charleston machine upgrade being deferred to Q4 in order to have capacity available during Longview work stoppage 6 $ in Millions $ in Millions
Q3 2015 Compared to Q3 2014 Actual Acquisition is Key Driver YOY While PrAidcjuestaednEdBMITDixA Declines Continue Net Sales $18 $10 $1 $2 $4 $132 $3 $6 $248 $9 $3 $24 $808 $2 $ 26 $598 ¾ ¾ Victory Packaging acquisition added $248 million in sales and $18 million of adjusted EBITDA Collectively, unfavorable price/mix and FX drove mill selling prices $18 per ton lower ƒ ƒ ƒ Strong dollar negatively impacted export containerboard prices FX loss on saturating kraft sales due to lower Euro Higher domestic kraft paper prices partially offset declines ¾ ¾ ¾ Lower sales volume reflects impact of Longview 12 day work stoppage (29,000 tons) Change in outage costs was low as a planned outage with a cost of $7 million was deferred to Q4 Inflation negatively impacted adjusted EBITDA by $6 million ƒ ƒ Compensation and benefit increases Fiber costs about 6 percent higher in the Pacific Northwest 7 $ in Millions $ in Millions

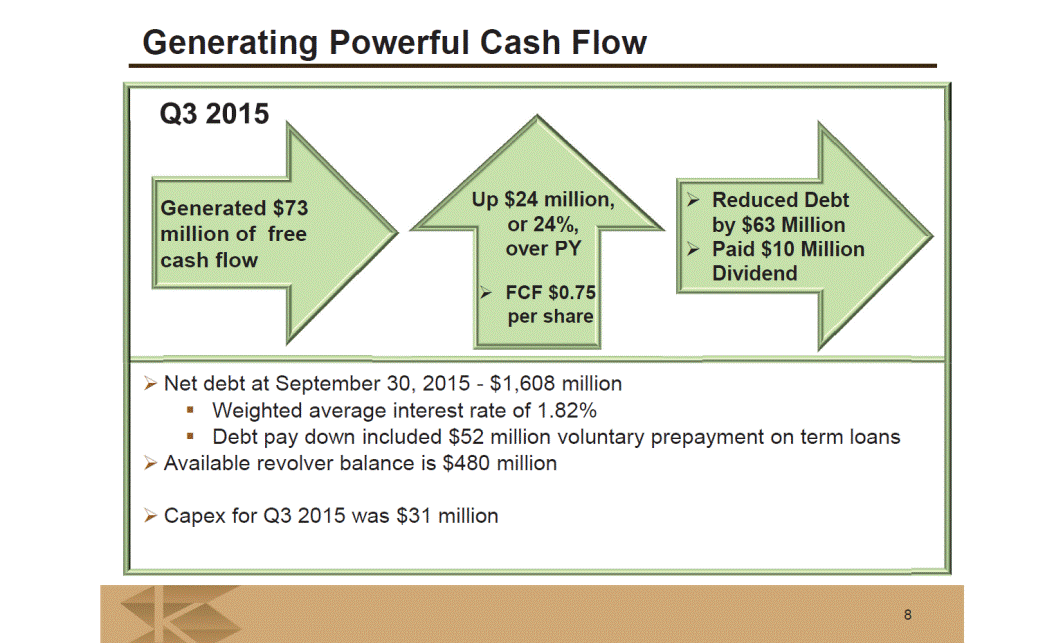
8 Generating Powerful Cash Flow or 24%, FCF $per share Q3 2015 cash Net debt at September - $1,608 Weighted average interest of 1.82% million Capex for Q3 2015 Debt $63 Million Dividend Up $24 million, over PY 0.75 Generated $73 million of free flow 30, 2015 million rate Debt pay down included $52 voluntary prepayment on term loans Available revolver balance is $480 million was $31 million Reduced by Paid $10 Million
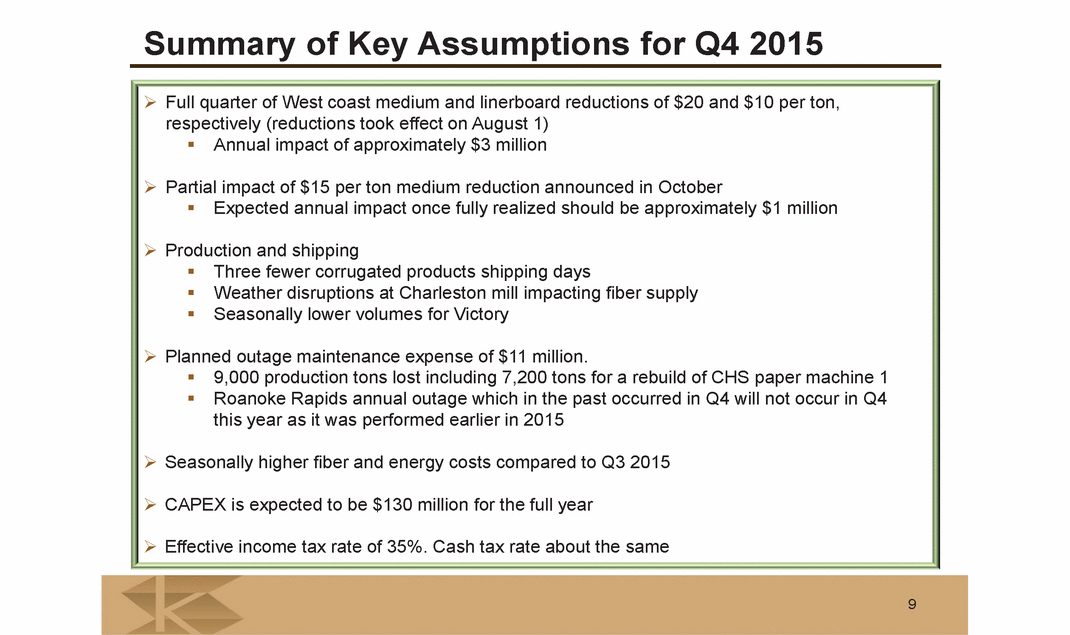
Summary of Key Assumptions for Q4 2015 ¾ Full quarter of West coast medium and linerboard reductions of $20 and $10 per ton, respectively (reductions took effect on August 1) ƒ Annual impact of approximately $3 million ¾ Partial impact of $15 per ton medium reduction announced in October ƒ Expected annual impact once fully realized should be approximately $1 million ¾ Production and shipping ƒ ƒ ƒ Three fewer corrugated products shipping days Weather disruptions at Charleston mill impacting fiber supply Seasonally lower volumes for Victory ¾ Planned outage maintenance expense of $11 million. ƒ ƒ 9,000 production tons lost including 7,200 tons for a rebuild of CHS paper machine 1 Roanoke Rapids annual outage which in the past occurred in Q4 will not occur in Q4 this year as it was performed earlier in 2015 ¾ Seasonally higher fiber and energy costs compared to Q3 2015 ¾ CAPEX is expected to be $130 million for the full year ¾ Effective income tax rate of 35%. Cash tax rate about the same 9
Appendix

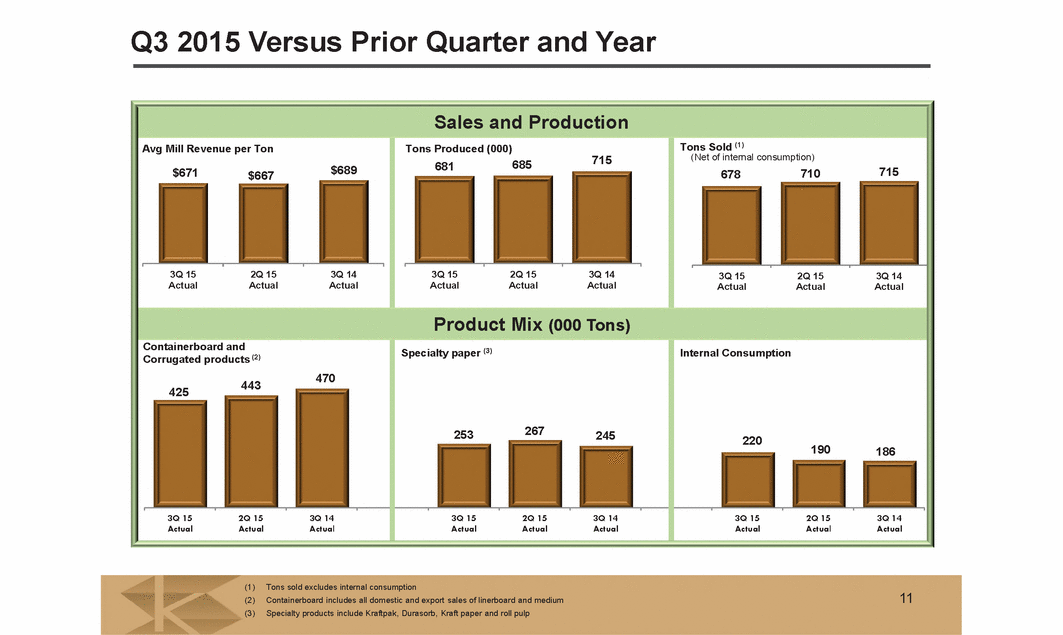
Q3 2015 Versus Prior Quarter and Year Sales ad Production Tons Sold (1) (Net of internal consumption) Avg Mill Revenue per Ton Tons Produced (000) 681 715 685 $689 715 $671 710 678 $667 3Q 15 Actual 2Q 15 Actual 3Q 14 Actual 3Q 15 Actual 2Q 15 Actual 3Q 14 Actual 3Q 15 Actual 2Q 15 Actual 3Q 14 Actual Product Mix (000 Tons) Containerboard and Corrugated products (2) Specialty paper (3) Internal Consumption 470 443 425 267 253 245 220 190 186 3Q 15 Actual 2Q 15 Actual 3Q 14 Actual 3Q 15 Actual 2Q 15 Actual 3Q 14 Actual 3Q 15 Actual 2Q 15 Actual 3Q 14 Actual (1) (2) (3) Tons sold excludes internal consumption Containerboard includes all domestic and export sales of linerboard and medium Specialty products include Kraftpak, Durasorb, Kraft paper and roll pulp 11
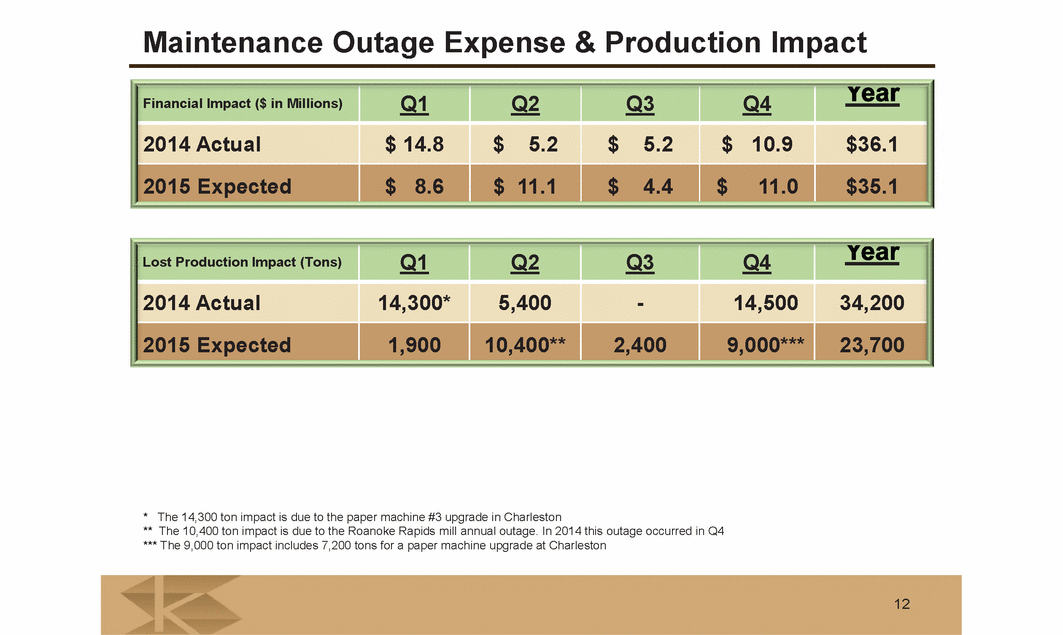
Maintenance Outage Expense & Production Impact * The 14,300 ton impact is due to the paper machine #3 upgrade in Charleston ** The 10,400 ton impact is due to the Roanoke Rapids mill annual outage. In 2014 this outage occurred in Q4 *** The 9,000 ton impact includes 7,200 tons for a paper machine upgrade at Charleston 12 Lost Production Impact (Tons) Q Q2 Q3 Q4 Year 2014 Actual 14,300* 5,400 - 14,500 34,200 2015 Expected 1,900 10,400** 2,400 9,000** 23,700 Financial Impact ($ in Millions) Q1 Q2 Q3 Q4 Year 2014 Actual $ 14.8 $5.2 $5.2 $10.9 $36.1 2015 Expected $8.6 $11.1 $4.4 $11.0 $35.1