Attached files
| file | filename |
|---|---|
| EX-32.1 - CERTIFICATION - ALLTEMP, INC. | f10k2015ex32i_sourcefin.htm |
| EX-31.2 - CERTIFICATION - ALLTEMP, INC. | f10k2015ex31ii_sourcefin.htm |
| EX-32.2 - CERTIFICATION - ALLTEMP, INC. | f10k2015ex32ii_sourcefin.htm |
| EX-31.1 - CERTIFICATION - ALLTEMP, INC. | f10k2015ex31i_sourcefin.htm |
UNITED STATES
SECURITIES AND EXCHANGE COMMISSION
Washington, D.C. 20549
FORM 10-K
(Mark One)
☒ ANNUAL REPORT PURSUANT TO SECTION 13 OR 15(d) OF THE SECURITIES EXCHANGE ACT OF 1934
For the fiscal year ended June 30, 2015
or
☐ TRANSITION REPORT PURSUANT TO
SECTION 13 OR 15(d) OF THE SECURITIES EXCHANGE ACT OF 1934
For the transition period from ___________ to ___________
Commission file number 000-55122
SOURCE FINANCIAL, INC.
(Exact name of registrant as specified in its charter).
| Delaware | 80-0142655 | |
|
State or other jurisdiction of |
(I.R.S. Employer | |
|
Level 6/97 Pacific Highway North Sydney NSW 2060 Australia |
||
| (Address of principal executive offices) | (Zip Code) |
Registrant’s telephone number, including area code: +61 2 8907-2500
Securities registered under Section 12(b) of the Act:
| Title of each class: | Name of each exchange on which registered: | |
| None | None |
Securities registered under Section 12(g) of the Act:
Common Stock, $.001 par value
Indicate by check mark if the registrant is a well-known seasoned issuer, as defined in Rule 405 of the Securities Act. Yes o No x
Indicate by check mark if the registrant is not required to file reports pursuant to Section 13 or Section 15(d) of the Act. Yes x No o
Indicate by check mark whether the registrant (1) has filed all reports required to be filed by Section 13 or 15(d) of the Securities Exchange Act of 1934 during the preceding 12 months (or for such shorter period that the registrant was required to file such reports), and (2) has been subject to such filing requirements for the past 90 days. Yes x No o
Indicate by check mark whether the registrant has submitted electronically and posted on its corporate Web site, if any, every Interactive Data File required to be submitted and posted pursuant to Rule 405 of Regulation S-T (§232.405 of this chapter) during the preceding 12 months (or for such shorter period that the registrant was required to submit and post such files). Yes x No o
Indicate by check mark if disclosure of delinquent filers pursuant to Item 405 of Regulation S-K (§229.405 of this chapter) is not contained herein, and will not be contained, to the best of registrant’s knowledge, in definitive proxy or information statements incorporated by reference in Part III of this Form 10-K or any amendment to this Form 10-K. o
Indicate by check mark whether the registrant is a large accelerated filer, an accelerated filer, a non-accelerated filer, or a smaller reporting company. See the definitions of “large accelerated filer,” “accelerated filer” and “smaller reporting company” in Rule 12b-2 of the Exchange Act.
| Large accelerated filer | o | Accelerated filer | o | |
|
Non-accelerated filer (Do not check if a smaller reporting company) |
o | Smaller reporting company | x |
Indicate by check mark whether the registrant is a shell company (as defined in Rule 12b-2 of the Act). Yes o No x
The aggregate market value of the voting and non-voting common equity of the registrant held by non-affiliates computed by reference to the price at which the common equity was last sold, or the average bid and asked price of such common equity, as of the last business day of the registrant’s most recently completed second fiscal quarter ended December 31, 2014 was $1,474,231.
As of September 15, 2015, the registrant had outstanding 8,791,632 shares of common stock.
Documents Incorporated by Reference: None.
TABLE OF CONTENTS
| i |
CAUTIONARY NOTE REGARDING FORWARD-LOOKING STATEMENTS
This Annual Report on Form 10-K (this “Report”) contains “forward-looking statements” within the meaning of the Section 27A of the Securities Act of 1933, as amended (the “Securities Act”), and Section 21E of the Securities Exchange Act of 1934, as amended (the “Exchange Act”). Any statements about our expectations, beliefs, plans, predictions, forecasts, objectives, assumptions, or future events or performance are not historical facts and may be forward-looking. These statements are often, but not always, made through the use of words or phrases such as “anticipate,” “believes,” “can,” “could,” “may,” “predicts,” “potential,” “should,” “will,” “estimate,” “plans,” “projects,” “continuing,” “ongoing,” “expects,” “intends,” and similar words or phrases. Accordingly, these statements are only predictions and involve estimates, known and unknown risks, assumptions, and uncertainties that could cause actual results to differ materially from those expressed in them. Our actual results could differ materially from those anticipated in such forward-looking statements as a result of several factors more fully described in Item 1A of this Report under the caption “Risk Factors” and elsewhere in this Report, including the exhibits hereto.
All forward-looking statements are necessarily only estimates of future results, and actual results may differ materially from expectations. The inclusion of this forward-looking information should not be regarded as a representation by us or any other person that the future plans, estimates, or expectations contemplated by us will be achieved. We have based these forward-looking statements largely on our current expectations and projections about future events and financial trends that we believe may affect our financial condition, results of operations, business strategy, and financial needs. There are important factors that could cause our actual results, level of activity, performance, or achievements to differ materially from the results, level of activity, performance, or achievements expressed or implied by the forward-looking statements, including, but not limited to, statements regarding (i) our asset growth and sources of funding; (ii) our expansion into different consumer segments; (iii) our financing plans; (iv) the impact of regulations on us; (v) our exposure to market risks, including interest rate risk and equity price risk; (vi) our exposure to credit risks, including credit default risk and settlement risk; (vii) our competition; (viii) our projected capital expenditures; (ix) our capitalization requirements and level of reserves; (x) our liquidity; (xi) trends affecting the economy generally; and (xii) trends affecting our financial condition and our results of operations. Examples of these important factors, in addition to those discussed elsewhere in this Report, that could cause our actual results to differ substantially from those anticipated in our forward-looking statements, include, among others:
| ● | Adverse economic conditions in the United States, Australia and worldwide may negatively impact our results; |
| ● | Our business could suffer if our access to funding is reduced; |
| ● | We face significant risks implementing our growth strategy, some of which are outside our control; |
| ● | Our financial condition, liquidity, and results of operations depend on the credit performance of our loans; |
| ● | Loss of our key management or other personnel, or an inability to attract such management and personnel, could negatively impact our business; and |
| ● | We operate in a highly regulated industry and continually changing federal, state, and local laws and regulations could materially adversely affect our business. |
You are, therefore, cautioned not to place undue reliance on such statements which should be read in conjunction with the other cautionary statements that are included elsewhere in this Report. Any forward-looking statement speaks only as of the date on which it is made and we undertake no obligation to update or revise any forward-looking statement to reflect events or circumstances after the date on which the statement is made or to reflect the occurrence of unanticipated events, except as may be required under applicable securities laws. You are advised, however, to consult any additional disclosures we make in our reports filed with the Securities and Exchange Commission (“SEC”). This discussion is provided as permitted by the Private Securities Litigation Reform Act of 1995.
Use of Certain Defined Terms
Except where the context otherwise requires and for the purposes of this Report only:
| ● | “AUD” or “A$” refer to the legal currency of Australia; |
| ● | “Source,” “Company,” “we,” “us,” and “our” refer to the combined businesses of Source Financial, Inc., a Delaware corporation, and its subsidiaries, Moneytech Limited, an Australian company (“Moneytech”) and its subsidiaries. For all periods prior to June 30, 2013, the date of the Moneytech Acquisition, these terms refer to Source Financial, Inc., and its predecessors and their respective consolidated subsidiaries; |
| ● | “Exchange Act” refers to the Securities Exchange Act of 1934, as amended; |
| ● | “SEC” refers to the Securities and Exchange Commission; |
| ● | “Securities Act” refers to the Securities Act of 1933, as amended; |
| ● | “Series B Shares” refers to the Company’s Series B Preferred Stock; and |
| ● | “U.S. dollars,” “dollars”, “USD” and “$” refer to the legal currency of the United States. |
| ii |
Acquisition of Moneytech Limited
Share Exchange
On June 30, 2013, Source Financial, Inc. (formerly known as Wiki Group, Inc.) acquired all of the outstanding shares of Moneytech Limited, an Australian company (“Moneytech”) pursuant to a Share Exchange Agreement dated May 30, 2013 (the “Exchange Agreement”) in exchange, for 5,300,000 shares of our common stock (the “Share Exchange”). As a result of the Share Exchange, Moneytech became a wholly-owned subsidiary of our company, with the Moneytech shareholders owning in excess of 50% of our outstanding shares on a fully diluted basis.
Issuance of Series B Shares
In connection with our acquisition of Moneytech, we issued 5,000 shares of our Series B Preferred Stock to Hugh Evans, the Chairman and Managing Director of Moneytech. The holder of the Series B Shares has the right, until June 30, 2018, to (A) elect the majority of our Board of Directors and (B) vote on all other matters presented to the holders of common stock (the “Common Shareholders”), with each Series B Share having a number of votes equal to 1,000 shares of common stock. After June 30, 2018, the Series B Shares will have no voting rights and we will have the right to purchase the Series B Shares at a per share price equal to one tenth of a cent ($0.001). As the holder of the Series B Shares, Mr. Evans will be able to elect a majority of our Board of Directors until June 30, 2018, and as the holder of a majority of our outstanding voting shares, Mr. Evans has effective control over our business, including matters requiring the approval of our stockholders, such as the approval of significant corporate transactions.
As a result of the consummation of the Share Exchange Agreement, the shareholders of Moneytech in combination with Hugh Evans, became our controlling stockholders. Consequently, the Share Exchange has been accounted for as a recapitalization of Moneytech effected by a share exchange in which for accounting and financial reporting purposes Moneytech is considered the acquirer. Consequently, the historical consolidated financial statements of Moneytech are now our historical financial statements, and the assets and liabilities of Source as of June 30, 2013, have been brought forward at their book value and no goodwill has been recognized.
Escrow Arrangement Concerning WikiTechnologies and Separation Agreement
In connection with the Share Exchange, our two principal stockholders prior to consummation of the share exchange deposited in escrow an aggregate of 2,240,000 shares of our common stock (the “Escrow Shares”), and we deposited in escrow all outstanding shares of the common stock of WikiTechnologies, Inc. (the “WTI Escrow Shares,”) our only operating subsidiary prior to the Share Exchange. The terms of the escrow arrangement were such that if WikiTechnologies failed to achieve certain financial benchmarks we could elect to retain the Escrow Shares by delivering the WTI Escrow Shares to the two stockholders.
On February 11, 2014, we entered into a Separation Agreement with the two stockholders, pursuant to which (i) the WTI Escrow Shares were delivered to them, as a result of which we no longer own any equity interest in WTI, and (ii) 2,140,000 of the Escrow Shares were cancelled, with the remaining 100,000 shares delivered to a noteholder of WTI. The cancellation of the 2,140,000 shares effectively increased the percentage of our then outstanding shares owned by the former shareholders of Moneytech.
Corporate History
Source Financial, Inc., formerly known as Wiki Group, Inc., was incorporated on June 24, 1988 under the laws of the State of Delaware under the name Windsor Capital Corp.
In February 2008, we became an Internet person-to-person lending service as a result of our acquisition from Spider Investments, LLC, of all right, title and interest in and to www.swapadebt.com, a person-to-person lending website, in consideration for shares of our common stock.
| 1 |
On May 4, 2011, we authorized a 10- for-1 forward split of our common stock and increased the number of our authorized shares of common stock to 750,000,000. On July 31, 2011, we authorized a 1-for-10 reverse stock split and reduced the number of our authorized shares of common stock to 150,000,000.
On February 10, 2012, pursuant to an Agreement and Plan of Merger (the “Merger Agreement”), we acquired all of the outstanding equity of WikiPay, Inc., in exchange for shares of our Series A Preferred Stock (the “Series A Preferred Shares”) convertible into sixty percent (60%) of our then outstanding shares of common stock on a fully diluted basis.
On February 6, 2012, we increased the number of our authorized shares of common stock to 250,000,000.
On December 7, 2012 we increased the number of our authorized shares of common stock to 500,000,000.
On March 21, 2013, we effected a 1-for-100 reverse split of our authorized and issued common stock and changed our corporate name to Source Financial, Inc.
On October 3, 2013, we amended and restated our certificate of incorporation to decrease the number of our authorized shares of common stock and preferred stock to 50,000,000 and 1,000,000, respectively.
On June 30, 2013, we consummated the Exchange Agreement whereby Moneytech became a wholly-owned subsidiary of our company and the Moneytech shareholders acquired in excess of 50% of our outstanding shares on a fully diluted basis.
On February 14, 2014, pursuant to the Settlement Agreement, we relinquished our ownership interest in WikiTechnologies.
On July 16, 2015 we amended our certificate of incorporation to decrease the number of our authorized shares of common stock from 50,000,000 to 12,000,000 shares and the number of our authorized shares of preferred stock from 1,000,000 to 10,000 shares.
The following chart reflects our organizational structure:
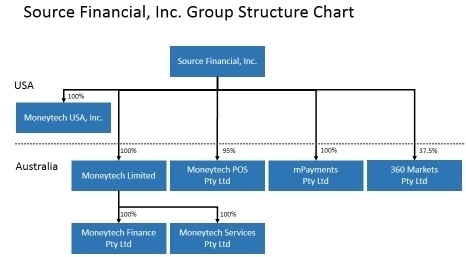
Our principal executive offices are located at Level 6/97 Pacific Highway, North Sydney NSW 2060, Australia, and our telephone number is +61 2 8907-2500. Our Internet address is www.sourcefinancial.com. Information on, or accessible through, our website is not part of this report.
| 2 |
Operational Overview
We provide commercial asset based lending, including accounts receivable, trade financing and other financial services to small to medium sized businesses and individuals in Australia through Moneytech and its subsidiaries, with a focus on utilizing leading edge technology to deliver these services.
Moneytech commenced operations in 2003 as an Australian based, technology driven, commercial finance company. Moneytech has an AUD$50 million securitized wholesale debt facility (the “Wholesale Facility,” “Receivables Purchase Agreement” or “RPA”) with the structured finance division of Westpac Banking Corporation (“Westpac”), one of the four leading Australian banks. In April 2015, Moneytech issued AUD$25 million of notes subordinated to the RPA (the “Subordinated Notes”). Moneytech uses the proceeds of the Subordinated Notes and the Wholesale Facility to offer asset based, trade finance or accounts receivable finance and working capital solutions to small and medium enterprises (‘SME’s’) throughout Australia. Moneytech has built a portfolio of more than 3,500 active high-quality business customers with its existing range of financing solutions and has experienced strong organic growth since inception.
To distinguish itself from traditional asset based lenders, and to manage and facilitate the advance of money to its customers, Moneytech has developed, operates and maintains its own real time core money transfer platform called The Moneytech Exchange. The Moneytech Exchange stores and tracks every invoice and payment entered into the system and automatically communicates with the major Australian transactional banks to settle thousands of transactions per day, in real time. The Moneytech Exchange is fully automated, real time and online. Human intervention only occurs to manage exceptions and provide necessary transaction approvals or authorizations. The Moneytech Exchange provides significant benefits over traditional non-technology based systems such as:
| ● | Simple, secure two factor authenticated login to initiate transactions through the web; |
| ● | Automatic processing up to pre-approved limits; |
| ● | Same day settlement for all transactions; |
| ● | Real-time reporting for all parties to each transaction, allowing for easy record keeping, reconciliation and auditing; and |
| ● | Parameters can be assigned to each transaction to vary the cost, settlement timeframe and interest rate, depending on the industry, product, payment terms or any other criteria. |
Moneytech has invested approximately AUD$10 million developing this banking platform technology, including approximately AUD$1,606,739, AUD$1,376,613 and AUD$1,161,340 in the fiscal years ended June 30, 2015, 2014 and 2013, respectively, and continues to invest in research and development to expand and improve its technology and product suite to maintain and further its competitive position.
Although the Moneytech Exchange was developed in conjunction with our commercial asset based lending business, it can be used to provide a variety of money transfer services and we are in the process of allowing the public to access the Moneytech Exchange to effect money transfers. In addition, Moneytech holds an Australian Financial Services License, or AFSL and is a BPAY Authorized PIM (“Bill Pay” “Payment Institution Member”). As a BPAY PIM Moneytech is authorized by BPAY, Australia’s leading bill payment service accepted by all the major Australian banks, to manage stored value accounts for BPAY customers. As the holder of an AFSL, Moneytech is allowed to issue Non Cash Payment Products (which includes Visa cards, gift and prepaid cards, loyalty rewards program cards) for the benefit of its business partners. As an AFSL holder, Moneytech is also authorized to operate a financial services business in Australia and it currently provides advice regarding foreign exchange contracts and derivatives, deals in foreign exchange contracts and derivatives and makes a market in foreign exchange contracts and derivatives.
For the fiscal years ended June 30, 2015, 2014 and 2013 receivables financing accounted for approximately 81%, 89% and 87%, respectively, of total revenue, and payment services accounted for approximately 17%, 9% and 11%, respectively, of total revenue.
We are seeking financing to expand Moneytech’s asset based credit solutions operations in Australia through a combination of organic growth and strategic acquisitions and we are considering introducing those operations in the United States, most likely through a strategic acquisition. As of the date of this Report, we do not have any understandings, commitments or agreements with respect to any acquisitions. See “Business Strategy.”
Our Services – Provision of Capital
Credit Express
Moneytech offers two products which provide small and medium sized businesses with access to capital – Credit Express and Confirmed Capital. The underwriting criteria, fee structure and approval process for both of these products is discussed below.
| 3 |
Credit Express offers approved businesses, including retailers, resellers, wholesalers and manufacturers (“Buyers” or “Sellers”), commercial lines of credit and provides them access to the Moneytech Exchange. The Moneytech Exchange allows pre-approved Buyers and Sellers to automatically access financing up to pre-approved limits when a Buyer purchases inventory from a Seller. Moneytech’s client may be either the Buyer or Seller, depending upon which party requests the financing and only the party which requests the financing needs to be pre-approved.
Each transaction is conducted electronically and is based on predetermined criteria to ensure that the Moneytech receivable is acceptable to the provider of its Wholesale Facility. By utilizing Credit Express:
| ● | Buyers are able to fund the purchase of inventory with Moneytech delivering the proceeds directly to the Seller’s bank account; or |
| ● | Sellers can fund working capital without having to wait for Buyers to pay invoices. After paying the Seller directly for the goods, Moneytech assumes the risk and collects the money from the Buyer, relieving the Seller of collection costs and cash flow challenges. |
Confirmed Capital
Confirmed Capital is unique because of its accounts receivable/asset based financing capability in that Moneytech funds 100% of the face amount of invoices on the day each transaction is conducted. This is more flexible than other accounts receivable financiers who typically provide a maximum of 80% of the invoice value and release funds periodically. Moneytech’s “Moneytech Exchange” stores every invoice and payment entered into the system and automatically communicates with the major Australian banks multiple times each business day. This enables Moneytech to check the status of each customer’s account automatically, facilitating additional advances and enabling Moneytech to receive alerts advising it as to which customers are in default. This ease of access decreases Moneytech’s risk of loss by allowing it to automatically monitor thousands of clients and increases its efficiency.
For both Credit Express and Confirmed Capital, customers have agreed repayment terms (which may include an interest free period) for repayment of the amount advanced by Moneytech. In addition to an ownership or security interest in the goods which are the subject of a transaction or an interest in the receivable, Moneytech often secures the credit provided by having its customer grant liens on all or a portion of its assets, or by providing personal guarantees. Moneytech generates profits by charging an interest on the amounts funded above its own cost of funds and by charging service fees on transactions and account management fees. To the maximum extent possible Moneytech seeks to pass along to its customers at a mark-up, every fee incurred by it under the Wholesale Facility. Further, if the Wholesale Facility requires that Moneytech deposit funds to secure its lender, it requires its customers to fund such deposits.
Fee Structure
Moneytech has two primary ways of charging fees to clients for Credit Express and Confirmed Capital:
| (a) | Moneytech charges an interest rate on amounts outstanding in excess of the rate incurred by Moneytech’s to access its funds; and |
| (b) | Moneytech charges an initial transaction fee when a customer is accepted and seeks to charge a fee for performing each transaction, calculated as either a percentage of the transaction value or a fixed amount, or a combination of the two, but in all events in excess of the corresponding fee charged Moneytech by its lender. |
The actual fees charged to clients on an ongoing basis are usually a combination of the above, but depending on the terms of the facility may be limited to only an interest rate or only a fee for conducting the transaction.
Pre-Approval Process
Customers seeking access to either Confirmed Capital or Credit Express are required to complete an application on-line or manually downloaded from the Moneytech Exchange and furnish financial and other information concerning the applicant, all of which is input and stored on the Moneytech Exchange. The application contains terms and conditions which applicants must review and acknowledge.
Moneytech assesses the creditworthiness of each applicant using on-line verification services and in certain instances third party sources, and regularly reviews and conducts audits of customer accounts.
| 4 |
Where a customer displays a good credit history, Moneytech may offer an increased credit limit. In such cases, Moneytech will issue the account holder a letter of acceptance subject to acceptance by the account holder. The letter of acceptance states that in the event the offer is accepted, the account holder shall remain subject to the terms and conditions of the original Buyer Account Application form and Moneytech Buyer Terms and Conditions. This ensures that Moneytech is in a position to reduce the credit limit or put the account on hold in the event of default.
Underwriting Standards
When a new Business Account is opened, a credit limit must be established for all authorized Account members/users. This is achieved by assessing each applicant’s personal circumstances. Determination of individual credit limits are based on the assessment criteria described in Moneytech’s Statement of Credit Policy. The criteria are both qualitative and quantitative, and include but are not limited to: current and historic financial performance of the business based on assessment of its income statement and balance sheet, the net asset position of any individuals or entities providing guarantees in support of the application, the tenure of the business, the industry in which the business operates, and credit reports from reporting agencies on both the applicant and the principals or proprietors of the applicant.
No credit limit must be set above that which this Credit Policy allows unless the Credit and Risk Committee approve it. The Managing Director reserves the right to veto such approval. Generally speaking, unless the benefits associated with the proposed Credit Limit significantly outweigh the risks involved, no such limit increases will be approved. For credit limits not in excess of $50,000, the approval of the designated money manager and Moneytech’s national credit manager are required; for credit limits in excess of $50,000 to $150,000, the approval of the money manager and one member of Moneytech’s Credit and Risk Committee is required; and for credit limits in excess of $150,000, the approval of the money manager, two members of Moneytech’s Credit and Risk Committee and Moneytech’s insurer is required.
There is a constant review process where the credit limits of existing customers are re-assessed based on need and application by individual Accounts. The credit limit re-assessment process is critical to ensuring customer growth within the confines of our commercial risk framework. Accounts that change adversely against their original risk category must be reassessed and adjusted with reference to the account holder’s circumstances and the then current assessment criteria.
The Moneytech Exchange prevents customers from exceeding their credit limits except where the account is delinquent or when interest or fees and charges are added to the account balance.
Collateral
Moneytech routinely obtains liens on customer assets and also requires personal guarantees (other than public companies) which often are secured by liens on individuals’ assets.
Profitability
Profitability for the account of any customer is determined by measuring the difference between Moneytech’s revenue derived from the transaction fees or interest rates charged to the customer and the interest rates and fees charged by Moneytech’s senior debt provider to it. Moneytech internally targets a gross profit margin of 50% using these measures. Facilities may have a higher or lower margin, depending on the amount of risk Moneytech determines (based on its credit and collections policy) is present in the deal. Moneytech will target higher margins where it believes the risk is relatively higher, and will accept lower margins where it has determined that the risk is relatively low.
Recent and Historical Statistics as to Nonpayment
The percentage of delinquent balances in our portfolio was 1.56% and 1.53% as of June 30, 2015 and 2014, respectively. The percentage of delinquent balances in our portfolio averaged 1.69% and 1.77% in the fiscal years ended June 30, 2015 and 2014, respectively. The average collection period in our portfolio was 52 days at June 30, 2015, up from 45 days at June 30, 2014 and 2013. Bad debts as a percentage of amount funded was 0.03% and 0.40% in the fiscal years ended June 30, 2015 and 2014 respectively.
Actions Taken in the Event of Nonpayment
In the event of non-payment, a Moneytech staff member will first contact the Buyer to request prompt payment. If a payment or an acceptable payment arrangement is not forthcoming, Moneytech will take such further actions as it deems appropriate, including utilizing a collections agent to pursue the debt.
| 5 |
Our Services -- Money Transfers and Payment Solutions; Foreign Exchange
mPayments Pty Ltd – Payment Processing, Point of Sale and Payment Aggregation Solutions
The Moneytech Exchange was initially developed to facilitate the movement and tracking of money against debtor and trade finance facilities. The Moneytech Exchange can be used to allow members of the general public, for a fee, to conduct transactions and disburse funds to multiple beneficiaries in real time particularly where existing transactional banking facilities are not adequate or are cost prohibitive or inefficient.
There are approximately 5,000 newspaper outlets in Australia which, in addition to newspapers and magazines, distribute cigarettes, snacks and similar items. We are currently working with a product and service aggregator, pursuant to an arrangement whereby at the cost of the store operator or service aggregator, the aggregator establishes kiosks in the storefronts of Australian newsagents, in which the software is installed to bring in-store, online and mobile solutions for new financial products and services to be promoted through the news agents in Australia. In addition to news agents, Moneytech seeks to install the hardware or software necessary to access its system in pharmacies, other retail outlets and taxicabs. To date, Moneytech’s software has been installed in over 800 outlets and in excess of 25,000 transactions are conducted monthly using its mPay software to pay a bill or transfer money to a third party. Moneytech will continue to seek to install software necessary to access its system in kiosks and transmission devices in other locations where the business owner seeks to provide its customers with the ability to transfer funds or utilize their credit cards. Because the kiosk or associated hardware on which Moneytech’s software is installed, is not controlled by Moneytech, in many instances the hardware is not exclusive to Moneytech and the store owner can choose to offer competing services.
Card Solutions
Moneytech has secured an AFSL allowing it to further develop its financial services business and product suite. Moneytech is authorized to distribute Visa and Electronic Funds Transfer at Point of Sale (“eftpos”) Gift and Prepaid Cards. To do this, Moneytech has partnered with an Australian bank and Authorized Deposit taking Institution to deliver Gift and Prepaid Card solutions to the market. Moneytech profits from gift card programs primarily by charging a fee for each card issued and fees for each transaction conducted using the card. Moneytech has the ability to issue Non Cash Payment Products (which includes gift and prepaid cards, loyalty and rewards programs) in its own right for the benefit of its business partners.
Moneytech’s Card Solutions businesses is not currently producing significant amount of revenues. As these are service businesses, they do not have the credit risk associated with Credit Express and Confirmed Capital. Moneytech will earn a fee on all cards issued as part of a Card Solutions Program or each transmission of funds utilizing mPay.
Moneytech will seek to expand its Card Solutions business by soliciting manufacturers, distributors and retailers interested in giving consumers gift cards as an inducement for their patronage.
360 Markets Pty Ltd: Foreign Exchange Services
As the holder of an Australian Financial Services License, or AFSL, Moneytech Limited is authorized to operate a financial services business in Australia. The license authorizes the provision of financial product advice in foreign exchange contracts and derivatives, dealing in foreign exchange contracts and derivatives and making a market in foreign exchange contracts and derivatives. Moneytech Limited is not authorized to use the term ‘Broker’ by its AFSL and is not a participant member of a licensed market that covers dealings in securities (e.g. Australian Securities Exchange) or derivatives (e.g. Sydney Futures Exchange).
To facilitate the development of a foreign exchange business, 360 Markets Pty. Limited (“360 Markets”) was founded in 2010 in conjunction with a senior foreign exchange dealer previously employed by the Commonwealth Bank of Australia, the largest Australian commercial bank. At the time 360 Markets was founded, Moneytech acquired a 37.5% interest therein. The balance of the equity in 360 Markets was acquired by the individual responsible for its activities. Further, Moneytech granted 360 Markets a sublicense to engage in foreign exchange transactions in Australia as an Authorized Representative of Moneytech and entered into an agreement with 360 Markets whereby Moneytech will receive a commission on revenues generated by 360 Markets for services it provides to parties referred by Moneytech and Moneytech will pay 360 Markets a commission for services Moneytech provides for clients referred by Moneytech. The amount of such referral fees is determined by negotiation between Moneytech and the individual who owns the balance of the equity in 360 Markets and is generally based on the gross margin anticipated to be generated. Thus, Moneytech will profit from the activities of 360 Markets through the receipt of referral fees and as the holder of an equity interest therein. Moneytech intends to offer the services of 360 Markets to those of its customers that engage in international transactions and have the need to purchase currencies other than Australian dollars.
| 6 |
360 Markets derives its revenue predominantly by buying and selling different currencies for its customers and charging prices in excess of those paid to the two major financial institutions from which it acquires currencies. The “spread” charged on a particular transaction is based on various factors, including, among others, the size of the transaction and the significance of the customer relationship. 360 Markets will receive orders to buy or sell currencies at market plus an agreed spread or by quotation. For orders where it quotes a price, it mitigates its foreign exchange risk by executing the transaction with its supplier as soon after the order is received as is practical and by quoting a spread that is sufficiently large to cover movements in the price during the period the quote is open. 360 Markets also offers its customers the ability to buy and sell exchange traded foreign exchange derivatives which it sources from the same suppliers it uses for its spot foreign exchange transactions. These are transacted on similar terms to the foreign exchange spot transactions and currently form a minor part of its business. 360 Markets does not take any positions in foreign exchange or foreign exchange derivatives as principal other than during the very short quotation period.
During the year ended June 30, 2014 and the year ended June 30, 2015, 360 Markets generated revenues of $381,825 and $503,106, respectively.
Business Strategy
In Australia, the banking environment is dominated by the “Big Four” Australian banks --- Commonwealth Bank of Australia (CBA), National Australia Bank (NAB), Australia and New Zealand Banking Group (ANZ) and Westpac Banking Corporation “Westpac”). This oligopoly has resulted in a particularly risk averse and high priced lending environment, and many viable Australian business are limited in both their access to capital and their options for obtaining business loans. The SME space is especially under-serviced in this regard. This represents an opportunity for non-bank lenders, such as Moneytech, to target both high growth and established Small to Medium Enterprises with unique financial solutions, including Confirmed Capital and Credit Express.
Moneytech believes it is in a strong position to capitalize on this opportunity, as:
| 1. | Moneytech’s product offerings (particularly Confirmed Capital and Credit Express) are unique and market leading in that they can finance up to 100% of the value of an individual invoice and track the details of each transaction in real time utilizing Moneytech’s proprietary Moneytech Exchange system. | |
| 2. | Moneytech’s small size relative to the “Big Four” allows it to be more agile, responding to and developing opportunities which the Australian banks are either unwilling or unable to develop or are too slow to respond to. | |
| 3. | Moneytech has a full suite of financial products, both transactional and lending, all operated through the Moneytech Exchange, affording it a competitive advantage over similar non-bank lenders. | |
| 4. | Moneytech has an ongoing and historic entrepreneurial spirit with a customer focus, aiming to creatively and profitably satisfy customer needs and exceed customer expectations in the delivery of financial products. |
To capitalize on our opportunities in the Australian market we engage in marketing campaigns to increase the number of customers served by Moneytech. As a first step in this effort, we have engaged a business development officer to develop a marketing program and establish the relationships necessary to cross sell our services. Any significant increase in the number of customers served and the volume of loans provided by us will require that we increase the credit facility we rely upon to service our customers. If we are successful in obtaining financing to finance expansion of our business in Australia, we will seek to increase our Wholesale Facility with Westpac or find another lender which will provide us with the credit necessary to expand our business at lower costs. We cannot assure you that we will be successful in increasing our Wholesale Facility, that we will be able to find another lender that will provide the necessary credit increase or that any increase will be on terms that will allow the expansion of our business to be profitable.
A number of our Australian customers regularly purchase goods from or supply goods to U.S. based counterparties or otherwise engage in dollar denominated transactions. To enable us to serve the needs of these customers without the exchange rate risk associated with AUD, we intend to seek to obtain a loan facility denominated in U.S. dollars from a U.S. institutional lender.
In addition to expanding our asset based lending business in Australia, we are actively developing a money transfer business in Australia. The Moneytech Exchange, developed to facilitate the movement and tracking of funds in connection with our debtor and trade finance facilities, provides us with a platform to conduct financial transactions and disburse funds to and from multiple parties in real time. We are currently working with HUBBED, a product and service aggregator, to establish kiosks in the storefronts of Australian news agents, bringing in-store, online and mobile solutions for new financial products and services to be promoted through the news agents. We also seek to have the hardware or software necessary to access our system in other retail outlets and taxi cabs. Moneytech has already installed kiosks or the software necessary to access its system in more than 800 locations.
While seeking to grow our businesses organically in Australia, we will also attempt to identify and acquire one or more asset based lenders in Australia and the United States. Management believes that an acquisition in the U.S. would accelerate our efforts to enter the U.S. market and provide us with a management team with knowledge of the U.S. market. An acquisition of a traditional asset based lender in either Australia or the U.S. should allow us to upgrade the services such lender provides to its customers, although we cannot assure you that such acquisition will result in upgrading the services furnished to such lender’s customers. If we enter the U.S. market, we intend to aggressively market our asset based lending products and money transfer solutions targeted at businesses while we commence a marketing and advertising campaign for our money transfer products aimed at the consumer market in an effort to attract a large base of individual users, particularly those in the unbanked community. As of the date of this Report, we do not have any understandings, commitments or agreements with respect to any acquisitions.
| 7 |
Moneytech’s Markets
Moneytech operates in the commercial financial services market in Australia, targeting small to medium businesses (revenues between $1 million and $100 million) for their asset based lending solutions (including trade and accounts receivable finance) generally seeking loans of up to $5 million. Any business involved in the provision of products or services to other businesses which requires funds to grow or that is not satisfied with its existing finance provider is a candidate for a Moneytech financial solution. Inasmuch as Moneytech’s services are generally provided to smaller businesses which are not eligible for loans from larger, established lenders, its customers are more likely to default than larger, more established borrowers. Businesses sourcing their products overseas for resale to business in Australia are a particularly good fit, as Moneytech is able to assist them with the payment of their overseas supplier, the hedging and conversion into a foreign currency, and the conversion of their receivables into cash. When doing business with such customers, although Moneytech may provide foreign exchange services, it does not assume the foreign exchange risk. If a client wishes to pay Moneytech in a currency other than the one provided by Moneytech, the client will be required to enter a currency hedge for the protection of Moneytech.
Moneytech believes that the number of potential customers for its financial services will increase as banks and other financial institutions in Australia raise the minimum size of the loans they are willing to make and the categories of eligible potential borrowers.
Sales and Marketing
To date Moneytech has grown its credit line portfolio largely by word of mouth recommendations from its customers to other businesses. Moneytech is actively seeking experienced business development officers (“BDOs”) to grow amounts funded. These BDOs will work with providers of products and services to small and medium businesses, such as traditional banks, lawyers and accountants to develop a referral network. As financing becomes available we will engage in select media advertising in key metropolitan markets and increase our internet advertising.
The Moneytech Exchange has been developed to the point where Moneytech can offer its customers funds transfer services (mPay)’s, debit and gift cards solutions and foreign exchange services. In determining which of our products to devote our marketing dollars, we will analyze the market potential for each of these products to determine which can more readily achieve positive cash flow and allocate our marketing dollars accordingly.
Competition
The commercial finance and financial service industry in Australia has traditionally been dominated by the Big 4 Australian banks— Commonwealth Bank, Westpac Banking Corporation, Australia and New Zealand Banking Group and National Australia Bank. More recently, these banks have been decreasing the loans and other financial services provided to smaller and medium sized businesses, preferring to service larger customers or act as the lender to companies such as Moneytech which then deal directly with smaller businesses. Nevertheless, the competition to provide financing to small and medium sized businesses remains intense. Competitive factors vary depending upon the financial services products offered, the nature of the customer and geographic region. Competitive forces may limit our ability to charge our customary fees and raise fees to our customers in the future. Pressure on our margins is intense and we cannot assure you that we will be able to successfully compete with our competitors. We are currently an insignificant competitor in our industry, which includes national, regional and local independent banks and finance companies and other full service financing organizations. Many of these competitors are larger than we are and have access to capital at a lower cost than we do.
Government Regulation
Australia
The Australian Securities and Investments Commission (ASIC) regulates corporations, markets and financial services in Australia and the Australian Prudential Regulatory Authority (APRA) oversees banks, credit unions, building societies, general insurance and reinsurance companies, life insurance companies, friendly societies and most members of the superannuation industry. The Reserve Bank of Australia serves as the central bank of Australia and is responsible for the payments system.
Receivables and purchase order financing in the style provided by Moneytech in Australia is not subject to regulation in Australia, as confirmed in an interpretation issued by the Australian Securities and Investment Commission concerning the exemption available to factoring arrangements under the Corporations Act 2001.
| 8 |
Moneytech’s payment services activity is considered a regulated financial activity and is conducted by virtue of having an Australian Financial Services License (AFSL) and by being a member of BPAY. Moneytech’s foreign exchange services activity is considered a regulated financial activity and is conducted by virtue of having an AFSL. An AFSL is granted by ASIC. As the holder of an AFSL, Moneytech is authorized to conduct a financial services business providing financial product advice for deposit and payment products, derivatives and foreign exchange contracts; dealing in these financial products for its own account or on behalf of another person and making a market in foreign exchange contracts and derivatives to retail and wholesale clients. The conditions of the license require compliance with various key person, financial services laws compliance measures, training, notification, financial, reporting, dispute resolution and documentation requirements.
BPAY is an electronic bill payment system in Australia which enables payments to be made through a financial institution’s on-line or telephone banking facility to merchants who are registered BPAY billers. BPAY is not subject to regulation by the Australian Payments Clearing Association or otherwise. BPAY is the registered trading name of BPAY Pty Ltd., a wholly-owned subsidiary of CreditLink Services, which is owned by Australia’s four major banks.
Moneytech Limited was accepted as a Payer Institution Member, or PIM, and was authorized to commence participating in the BPAY system commencing March 6, 2013. BPAY is offered by over 150 financial institutions and on more than 45,000 bills. The BPAY system supports its members in the provision of BPAY payments to their customers. Its members work across the banking system to provide seamless and convenient customer payments. There are three membership types: Participant Members, Associate Members and Payer Institution Members. Participant Members are Australian deposit-taking Institutions (ADIs) who directly settle their BPAY inter-institutional settlement obligations with other Participant Members. Associate Members are ADIs who don’t directly settle their BPA inter-institutional settlement obligations, instead settling through a Payment Member. Payer Institution Members (PIMs) are organizations, not necessarily ADIs, that manage stored value accounts for customers. A PIM is represented by a Participant Member and cannot be a Biller Institution.
BPAY members are required to comply with Rules and Operating Procedures established by BPAY, but are not otherwise subject to regulation by any of the Australian regulatory bodies.
United States
Non-bank asset based lenders engaged in traditional factoring and accounts receivables/asset based lending activities are not subject to federal and state regulation with respect to their finance activities. However, we cannot assure you that if we decide to enter the U.S. marketplace, alternative assets based lenders, like us, will not become subject to federal and state regulation, and impose regulatory requirements, which may limit the fees we may charge our customers and impose monetary penalties for violations of such regulatory requirements, increasing the cost of conducting their businesses. Recent legislation adopted particularly at the Federal level, such as the Dodd-Frank Act, which among other things, authorized various studies concerning the operations of financial institutions and the effects of their activities on the U.S. economy following the disastrous consequences in 2008 resulting from defaults on collateralized obligations, and the creation of the Consumer Financial Protection Bureau, which was created to regulate certain types of consumer financing transactions, and regulations adopted pursuant to such legislation, and future legislative and regulatory initiatives may impose certain regulatory requirements on non-bank financial services companies engaged in asset based lending and money transfers by individuals. If adopted, these laws also could:
| ● | Regulate credit granting activities, including establishing licensing requirements, if any, in various jurisdictions; |
| ● | Require disclosures to customers; |
| ● | Govern secured transactions; |
| ● | Set collection, foreclosure, repossession and claims handling procedures and other trade practices; |
| ● | Prohibit discrimination in the extension of credit, and |
| ● | Regulate the use and reporting of information related to a seller’s credit experience and other data collection. |
Intellectual Property
Our intellectual property, which includes trademarks, copyrights, domain names and software and trade secrets, is key to our success. We have expended significant amounts developing the software which constitutes the Moneytech Exchange. We have obtained no significant patents protecting these or our other products but rely upon trade secret laws in Australia. We routinely seek to protect our proprietary rights by entering into confidentiality and non-disclosure agreements with our employees, contractors, customers and other parties with whom we conduct business in order to protect our proprietary information.
| 9 |
In addition to our software we have developed and use trademarks registered in Australia, particularly relating to corporate, brand and product names. Registration of a trademark in Australia affords the owner nationwide exclusive trademark rights in the registered mark in Australia and the ability to prevent others from using the same or similar marks in Australia. However, to the extent a common law user has made prior use of the mark in connection with similar goods or services in a particular geographic area, the nationwide rights conferred by federal registration would be subject to that geographic area. We continue to seek to develop goodwill and brand recognition for our trademarks in Australia, and we intend to register additional trademarks in foreign countries where our products or services are or may be sold or used in the future. We cannot assure you, however, that our current trademarks or any trademarks we may use or register in the future will afford us any significant competitive advantage.
In recent years, many software companies have filed applications for patents covering their technologies. Many of these patents have yet to be litigated. Other competitors may develop technologies that are similar or superior to our technology and may receive and seek to enforce patents on such technology. We are not aware of any issued or pending patents that may be asserted against us.
Research and Development
To date we have invested approximately AUD$10 million developing the Moneytech Exchange, including approximately AUD$1,606,739, AUD$1,376,613 and AUD$1,161,340 in the fiscal years ended June 30, 2015, 2014 and 2013, respectively. The design and technical development of The Moneytech Exchange and our payment services platform are completed and both are operational. Although we will continue to upgrade and add additional functionality to The Moneytech Exchange and our payment services platform, we anticipate that our expenditures on research and development will decrease substantiality as a percentage of our revenues.
Employees
As of September 15, 2015, we had a total of 18 full time employees, 2 part time employees, 2 full-time contractors and 1 part-time contractor.
None of our employees are parties to a collective bargaining agreement. We consider our relationship with our employees to be satisfactory.
The purchase of our common stock involves a very high degree of risk.
In evaluating us and our business, you should carefully consider the risks and uncertainties described below and the other information and our consolidated financial statements and related notes included herein. The risks provided below may not be all the risks we face. If any of events described in the risks below actually occurs, our financial condition or operating results may be materially and adversely affected, the price of our common stock may decline, perhaps significantly, and you could lose all or a part of your investment.
Risks Related to Our Business
Adverse economic conditions in Australia, the United States and worldwide may negatively impact our results.
We are subject to changes in general economic conditions that are beyond our control. During periods of economic slowdown, delinquencies, defaults, and losses, generally increase while collections decrease. These periods may also be accompanied by increased unemployment rates and decreased consumer demand, which negatively impact businesses being lent to, weakening the collectability of the purchase orders we finance, increasing the risk that an event of default from one of our customers will eventuate in a loss. In addition, during an economic slowdown or recession, our servicing costs may increase without a corresponding increase in our finance charge income. Furthermore, our business is significantly affected by monetary and regulatory policies of the Reserve Bank of Australia, the Australian Federal Government and its agencies, the U.S. federal government and the US Federal Reserve. Changes in the policies of the institutions are influenced by macroeconomic conditions and other factors that are beyond our control and could have a material adverse effect on us through interest rate changes, costs of compliance with increased regulation, and other factors.
The process we use to estimate losses inherent in our credit exposure requires complex judgments, including analysis of individual industries, forecasts of economic conditions and how those economic conditions might impair the ability of our borrowers to repay their facility. The degree of uncertainty concerning economic conditions may adversely affect the accuracy of our estimates, which may, in turn, impact the reliability of the process and the quality of our assets.
| 10 |
Our business could be negatively impacted if our access to funding is reduced.
We have available an AUD$50 million Wholesale Facility with Westpac which is renewed annually on an agreed anniversary date. Our borrowing limit under the RPA is AUD$50 million, subject to interim agreed upon limits determined by various tests and covenants. As at June 30, 2015 the total amount drawn against the facility was $6,052,789. The facility has been renewed until December 31, 2015. In April 2015 we issued AUD$25 million in notes subordinated to the RPA and reduced the interim agreed upon credit limit to AUD$25 million. We cannot guarantee that the RPA will be renewed on the current maturity date or thereafter, on reasonable terms, or at all. We require additional capital or the expansion of our borrowing capacity to substantially increase the aggregate amount of credit lines we provide. The availability of additional financing depends, in part, on factors outside of our control, and the availability of bank liquidity in general. We may also experience the occurrence of events of default or breach of financial covenants, which could reduce our access to funding. In the event of a sudden or unexpected shortage of funds in the banking system, we cannot be sure that we will be able to maintain necessary levels of funding without incurring high funding costs, a reduction in the availability of financing or the liquidation of certain assets.
Downsizing our business would have a material adverse effect on our financial position, liquidity and results of operations.
Our business could be negatively impacted if we no longer receive grants from the Australian Government.
A significant portion of the amounts paid to develop the Moneytech Exchange represents funds received from the Australian Government pursuant to a research and development grant program. Such grants represented approximately 43% and 45% of our research and development budgets in the fiscal years ended June 30, 2015 and 2014, respectively. Although the acquisition of Moneytech by us should not adversely impact Moneytech’s ability to qualify for such grants, as we grow, we may no longer be eligible for such grants. The inability to receive grants in the future commensurate with those received in the past could force us to reduce the amounts spent on research and development and could adversely affect our business and our financial results.
Our indebtedness and other obligations are significant and impose restrictions on our business.
We have a significant amount of indebtedness and are dependent upon our Wholesale Loan Facility and the proceeds of our Subordinated Notes.
Our Wholesale Facility or RPA and the documents underlying the Subordinated Notes imposes various constraints on the operation of our business, reduces operational flexibility and creates default risks. The RPA and Subordinated Notes contain a cash reserve requirements which require us to deposit money in a bank account in accordance with an agreed upon formula. We are required to hold these funds in restricted cash accounts to provide additional collateral for borrowings under the borrowing facilities. Additionally, the receivables purchase facility and the Subordinated Notes contain various covenants requiring in certain cases minimum financial ratios, asset quality, and portfolio performance ratios. Generally, these limits are calculated in respect of our clients as a group; however for certain obligors, delinquency, net loss and dilution are calculated with respect to the individual obligor.
Failure to meet any of these covenants could result in an event of default under the RPA or Subordinated Notes. If an event of default occurs, the lender could elect to declare all amounts outstanding to be immediately due and payable, enforce its interest against collateral pledged under the RPA or Subordinated Notes or restrict our ability to obtain additional borrowings under the RPA.
If our debt service obligations increase, whether due to the increased cost of existing indebtedness or the incurrence of additional indebtedness, we may be required to dedicate a significant portion of our cash flow from operations to the payment of principal of, and interest on, our indebtedness, which would reduce the funds available for other purposes. Our indebtedness also could limit our ability to withstand competitive pressures and reduce our flexibility in responding to changing business and economic conditions.
We purchase accounts receivable primarily from and make purchase order advances primarily to, small to medium companies, which present a greater risk of loss than purchasing accounts receivable from and purchase order advances to larger companies.
Our portfolio consists primarily of accounts receivable and purchase order advances from small to medium businesses with annual revenues ranging from $5 million to $50 million. Compared to larger, publicly owned firms, these companies generally have more limited access to capital and higher funding costs, may be in a weaker financial position and may need more capital to expand or compete. These financial challenges may make it difficult for our clients to continue as a going concern. Accordingly, advances made to these types of clients entail higher risks than advances made to companies who are able to access traditional credit sources. In part because of their smaller size, our clients may:
| ● | Experience significant variations in operating results; |
| 11 |
| ● | Have narrower product lines and market shares than their larger competitors; |
| ● | Be particularly vulnerable to changes in customer preferences and market conditions; |
| ● | Be more dependent than larger companies on one or more major customers or suppliers, the loss of which could materially impair their business, financial condition and prospects; |
| ● | Face intense competition, including from companies with greater financial, technical, managerial and marketing resources; |
| ● | Depend on the management talents and efforts of a single individual or a small group of persons for their success, the death, disability or resignation of whom could materially harm the client’s financial condition or prospects; and |
| ● | Have less skilled or experienced management personnel than larger companies. |
Accordingly, any of these factors could impair a client’s cash flow or result in other events, such as bankruptcy, which could limit our ability to collect on the client’s purchased accounts receivable or purchase order advances, and may lead to losses in our portfolio and a decrease in our revenues, net income and assets.
Our financial condition, liquidity, and results of operations depend on the credit performance of the credit facilities we provide to our customers.
While our underwriting guidelines were designed to establish that the obligors on the receivables we purchase represent a reasonable credit risk, the receivables we purchase nonetheless are likely to experience higher default rates than a portfolio of obligors comprised of large companies. In the event of a default, the most practical alternative may be to engage in collection action against the obligor or, if permitted under the terms of our agreement, the customer who sold the receivable to us. The realizable value of a receivable may not cover the outstanding account balance and costs of recovery, and if collection of the receivables does not yield sufficient proceeds to repay the receivables in full could result in losses on those receivables.
Our allowance for purchased receivable losses and impairments may prove to be insufficient to absorb probable losses inherent in our portfolio.
We maintain an allowance for bad or doubtful debts that we believe is appropriate to provide for probable losses inherent in our portfolio. The determination of the appropriate level of the allowance for bad or doubtful debts and impairment reserves inherently involves a high degree of subjectivity and requires us to make significant estimates of current credit risks and future trends, all of which are subject to change. Changes in economic conditions affecting clients, new information regarding our clients or their obligors, and other factors, both within and outside of our control, may require an increase in the allowance for purchased receivable losses. Furthermore, growth in our funding book generally would lead to an increase in the provision for purchased receivable losses. If the net write-offs exceed the allowance for bad and doubtful debt, we will need to make additional provisions to increase the allowance for bad and doubtful debt. There is no accurate method for predicting losses, and we cannot assure you that provision for bad and doubtful debts will be sufficient to cover actual losses. Any increases in the allowance for bad and doubtful debts will result in a decrease in net income and may have a material adverse effect on us.
Poor portfolio performance may trigger credit enhancement provisions in our Receivables Purchase Agreement.
Our RPA and the Subordinated Notes impose net loss ratio limits, dilution and day sales outstanding limits that, if exceeded, would increase the level of credit enhancement requirements for that facility and redirect all excess cash to our lender. Generally, these limits are calculated based on the aggregate portfolio performance across all clients; however, delinquency, net loss ratios and dilutions are calculated with respect to some individual obligors.
If, at any measurement date, a trigger was hit with respect to any financing, provisions of the financing agreements would increase the level of credit enhancement requirements for that financing and redirect all excess cash to the credit provider. During this period, excess cash flow, if any, from the Facility would be used to fund the increased credit enhancement levels rather than being distributed to us. Once an impacted trust reaches the new requirement, we would return to receiving a residual distribution from the trust.
There is a risk that in the event portfolio performance was not adequate, triggering credit enhancement criteria, and that there was not sufficient cash-flow from our business to satisfy the increase in enhancement required, that our credit provider could cease its support of our business which would have a materially adverse effect on our business.
Competition may adversely impact our results.
The financial services sector in which we operate is highly competitive and could become even more so, particularly in those segments which are perceived as providing higher growth prospects. Factors contributing to this include industry deregulation, mergers and acquisitions, changes in customers’ needs and preferences, entry of new participants, development of new distribution and service methods and increased diversification of products by competitors. For example, changes in the financial services sector have made it possible for non-bank financial institutions to offer products and services traditionally provided by banks, such as automatic payment systems, mortgages and credit cards.
| 12 |
The effect of competitive market conditions may have a material adverse effect on our financial performance and position. For example, increasing competition for customers can lead to a compression in our net interest margin, or increased advertising and related expenses to attract and retain customers.
The asset backed lending market is served by a variety of entities, including, banks, credit unions, and independent finance companies. Our competitors may provide financing on terms more favorable to customers than we offer. Many of these competitors also have long-standing relationships with potential clients.
We anticipate that we will encounter greater competition as we expand our operations.
The market for providing loans and other financial services to small to medium size businesses is highly competitive and we expect that competition will increase. Current competitors have significantly greater financial, technical and marketing resources than we do. We expect that more companies will enter this sector of the financial services market. We may not be able to compete successfully against either current or future competitors. Increased competition could result in reduced revenue, lower margins or loss of market share, any of which could significantly harm our business.
Failure to obtain insurance on favorable terms may result in unexpected losses.
The receivables due Moneytech from its customers or their counterparties are insured pursuant to a policy issued by Euler Hermes, a Standard & Poor’s rated Trade Credit insurance provider. Pursuant to this policy, Moneytech would bear the first $500,000 of losses incurred in any calendar year, after which any bad debt losses are borne by Euler Hermes. This policy is renewed annually. No assurances can be made that we will be able to continue to insure bad debt losses or that we will be able to obtain policy coverage with premiums that are cost effective. If we are unable to renew our bad debt insurance policy or the premiums for coverage become cost prohibitive, we may face larger than expected losses from bad debts.
Changes in interest rates may adversely impact our profitability and risk profile.
Our profitability may be directly affected by interest rate levels and fluctuations in interest rates. As interest rates change, our gross interest rate spread on new facilities either increases or decreases because the rates we charge on the facilities we provide is limited by market and competitive conditions, restricting our ability to pass on increased interest costs to the consumer. Additionally, although the majority of our clients are small to medium businesses and are not highly sensitive to interest rate movement, increases in interest rates may reduce the volume of facilities we originate.
A security breach or a cyber attack could adversely affect our business.
In the normal course of business, we receive, process and retain sensitive and confidential personal and business information and may, subject to applicable law, share that information with third parties. Our facilities and systems, and those of third parties to which we provide information, could be vulnerable to external or internal security breaches, acts of vandalism, computer viruses, misplaced or lost data, programming or human errors, or other similar events. A security breach or cyber attack of our systems could interrupt or damage our operations or harm our reputation. If third parties or our employees penetrate our network security or otherwise misappropriate our customers’ confidential information or contract information, or if we give third parties or our employees improper access to consumers’ confidential information or contract information, we could be subject to liability. This liability could include investigations, fines, or penalties imposed by regulatory agencies, including the loss of necessary permits or licenses. This liability could also include identity theft or other similar fraud-related claims, claims for other misuses, or losses of personal information, including for unauthorized marketing purposes or claims alleging misrepresentation of our privacy and data security practices.
We rely on encryption and authentication technology both licensed from third parties and developed in house to provide the security and authentication necessary to effect secure online transmission of confidential information. Advances in computer capabilities, new discoveries in the field of cryptography, or other events or developments may result in a compromise or breach of the algorithms that we use to protect sensitive data. A party who is able to circumvent our security measures could misappropriate proprietary information or cause interruptions in our operations. We may be required to expend capital and other resources to protect against such security breaches or cyber attacks or to alleviate problems caused by such breaches or attacks. Our failure to prevent security breaches and cyber attacks, whether due to an external cyber-security incident, a programming error, or other cause, could damage our reputation, expose us to mitigation costs and the risks of private litigation and government enforcement, disrupt our business, or otherwise have a material adverse effect on our sales and results of operations.
| 13 |
We apply underwriting criteria we have developed to assess the credit worthiness of each prospective customer.
We rely upon our judgment in applying underwriting criteria we have developed to assess whether to extend financing to a particular customer and the fees and other charges to assess such customer. If we exercise poor judgment in assessing the credit quality of prospective clients or the underwriting criteria we choose to rely upon cause us to extend financing to clients which later default, it would have a material adverse effect on our financial position, liquidity and results of operations.
We depend on the accuracy and completeness of information about our clients and obligors and any misrepresented information could adversely affect our business, results of operations and financial condition.
In deciding whether to purchase particular receivables or to enter into other transactions with our clients and their obligors, we rely on information furnished to us by or on behalf of our clients and counterparties, including financial statements and other financial information. We are vulnerable to fraud by our customers and employees. We also rely on representations made by our clients and counterparties as to the accuracy and completeness of that information and, with respect to financial statements, on reports of independent third parties. If any of this information is intentionally or negligently misrepresented, such as a fraudulent invoice, and such misrepresentation is not detected, purchased invoices may be worthless, or worth significantly less than expected. Whether a misrepresentation is made by our client, another party, or one of our employees, we generally bear the risk of loss associated with the misrepresentation. Any such misrepresented information could adversely affect our business, financial condition, and results of operations.
We are subject to operational risk, which may adversely impact our results.
Operational risk refers to risks arising from day-to-day operational activities which may result in direct or indirect loss. These losses may result from both internal and external events. We are highly dependent on information systems and technology and there is a risk that these, or the services they use or depend on, might fail. Our daily operations are computer based. The exposure to systems risks includes: complete or partial failure of information technology systems; inadequacy of internal or third party information technology systems, due to, among other things, failure to keep pace with industry developments; and capacity of the existing systems to effectively accommodate planned growth and integrate existing and future acquisitions and alliances. Any failure in these systems could result in business interruption, the loss of customers, damaged reputation and weakening of our competitive position and could adversely impact our business and have a material adverse effect on our financial condition and loss of operations.
We are potentially exposed to failings by third party providers, including outsourcing, to natural disasters, political, security and social events and to failings in the financial services sector.
We cannot assure you that any business we acquire will benefit from its acquisition by us.
We cannot assure you we will realize any of the perceived benefits to our business from any future acquisitions. The past performance of Moneytech is not necessarily indicative of future performance. The process of combining businesses acquired involves certain risks, including exposure to unknown liabilities of the acquired companies, and may cause fundamental changes to their businesses or in their operations. In addition, our operating results may be affected by the additional expenses we incur in integrating them into our organization and the significant increase in expenses relating to financial statement preparation and compliance with controls and procedures standards established by the Sarbanes-Oxley Act of 2002.
Our inability to successfully manage the growth of our business may have a material adverse effect on our business, results of operations and financial condition.
We intend to continue our growth strategy to (i) expand our portfolio by increasing market penetration and market share through new customer acquisitions and (ii) grow our other businesses such as our payments aggregation and processing business, our gift card business and our foreign exchange business. Our ability to execute this growth strategy is subject to significant risks, some of which are beyond our control, including:
| ● | The inherent uncertainty regarding general economic conditions; |
| ● | Our ability to obtain adequate financing for our expansion plans; |
| ● | The prevailing laws and regulatory environment of each territory and country in which we operate or seek to operate, and, To the extent applicable, laws and regulations, which are subject to change at any time; |
| ● | The degree of competition in new markets and its effect on our ability to attract new customers; and |
| ● | Our ability to recruit qualified personnel, in particular in areas where we face a great deal of competition. |
| 14 |
As part of our growth we expect to experience growth in the number of employees and the scope of our operations. This could result in increased responsibilities for management.
Our future success will be highly dependent upon our ability to manage successfully the expansion of our operations. Our ability to manage and support our growth effectively will be substantially dependent on our ability to implement adequate improvements to financial, inventory, management controls, reporting, and hire sufficient numbers of financial, accounting, administrative, and management personnel. We may not succeed in our efforts to identify, attract and retain experienced accounting and financial personnel.
Our future success also depends on our ability to address potential market opportunities and to manage expenses to match our ability to finance operations. The need to control our expenses will place a significant strain on our management and operational resources. If we are unable to control our expenses effectively, our business, results of operations and financial condition may be adversely affected.
Our growth strategies require significant capital investments and may require us to seek external financing, which may not be available on terms favorable to us.
Our business operations and growth strategies require substantial capital investments, the availability of which depends on our ability to generate cash flow from operations, borrow funds on satisfactory terms and raise funds in the capital markets. Our ability to arrange for financing to support our capital expenditures and the cost of such financing are dependent on numerous factors, including general economic and capital markets conditions, interest rates and credit availability from banks or other lenders, many of which are beyond our control. In addition, increases in interest rates or the failure to obtain external financing on terms favorable to us will affect our financing costs and our results of operations. We may not be able to obtain financing in amounts or on terms acceptable to us,
A reduction in demand for our services and failure by us to adapt to such reduction could adversely affect our business and results of operations.
The demand for a particular service we offer may be reduced due to a variety of factors, such as regulatory restrictions that decrease customer access to particular services, the availability of competing services or changes in customers' preferences or financial conditions. Should we fail to adapt to significant changes in our customers' demand for, or access to, our services, our revenues could decrease significantly and our operations could be harmed. Even if we do make changes to existing services or introduce new services to fulfill customer demand, customers may resist or may reject such services. Moreover, the effect of any change in our services on the results of our business may not be fully ascertainable until the change has been in effect for some time and by that time it may be too late to make further modifications to such service without causing further harm to our business, results of operations and financial condition.
Fluctuations in exchange rates could adversely affect our business as well as result in foreign currency exchange losses in our US dollar financials.
Our financial statements are expressed in U.S. dollars. The functional currency of Moneytech is Australian dollars. The value of the Australian dollar against the U.S. dollar and other currencies is affected by, among other things, changes in political and economic conditions and U.S. and Australian foreign exchange policies. Any material change in the exchange ratio between the Australian dollar and the U.S dollar may materially and adversely affect our reported amounts in US dollars of cash flows, revenues, earnings and financial position and the value of, and any dividends payable to, our shares of common stock in US dollars.
Loss of our management and other key personnel, or an inability to attract such management and other key personnel, could negatively impact our business.
The successful implementation of our strategy depends in part on our ability to retain our experienced management team, particularly Hugh Evans, our President and Chief Executive Officer and key employees, and on our ability to attract appropriately qualified new personnel. Hugh Evans has extensive experience in the small business and consumer internet-based finance industry. He has a proven track record of successfully operating our business. The loss of any key member of our management team or other key employees could hinder or delay our ability to implement our growth strategy effectively. Further, if we are unable to attract appropriately qualified new personnel as we expand, we may not be successful in implementing our growth strategy. In either instance, our profitability and financial performance could be adversely affected. Experienced management and other key personnel in the financial services industry are in demand and competition for their talents is intense. Furthermore, we do not maintain key person insurance on any of our management personnel. Failure to attract and retain qualified employees or the loss of any member of our management may result in a loss of organizational focus, poor operating execution or an inability to identify and execute potential strategic initiatives. This could, in turn, materially and adversely affect our business, financial condition and results of operations.
| 15 |
Our senior management lacks experience managing a public company and complying with laws applicable to a U.S. public company.
Our senior management has no experience in complying with laws and regulations applicable to U.S. publicly-traded companies, including the United States federal and state securities laws and regulations and the U.S. Sarbanes–Oxley Act of 2002. For example, we are required to file periodic and other reports and to comply with U.S. securities and other laws, which did not apply to Moneytech prior to the Share Exchange. These obligations can be burdensome and complicated, and failure to comply with such obligations could have a material adverse effect on our company. In addition, we expect that the process of learning about such new obligations as a public company in the United States will require senior management to devote time and resources to such efforts that might otherwise be spent on the operation of our business.
The obligations associated with being a public company will require significant resources and management attention, which will increase our costs of operations and may divert focus from our business operations.
As a publicly traded company, we are required to file with the SEC periodic reports containing our consolidated financial statements within a specified time following the completion of quarterly and annual periods. As a public company, we incur significant legal, accounting, insurance, and other expenses. Compliance with these reporting requirements and other rules of the SEC will increase our legal and financial compliance costs and make some activities more time consuming and costly. Furthermore, the need to establish the corporate infrastructure demanded of a public company may divert management’s attention from implementing our strategy, which could prevent us from successfully implementing our strategic initiatives and improving our business, results of operations, and financial condition. We have made, and will continue to make, changes to our internal controls and procedures for financial reporting and accounting systems to meet our reporting obligations as a public company. However, we cannot predict or estimate the amount of additional costs we may incur in order to comply with these requirements. We anticipate that these costs will materially increase our total costs and expenses.
We are required to make significant estimates and assumptions in the preparation of our financial statements and our estimates and assumptions may not be accurate.
The preparation of our consolidated financial statements in conformity with generally accepted accounting principles in the United States of America (“GAAP”) requires our management to make significant estimates and assumptions that affect the reported amounts of assets and liabilities and disclosures of contingent assets and liabilities at the date of the consolidated financial statements, and the reported amounts of income and expense during the reporting periods. We use estimates and assumptions in determining the residual values of delinquent receivables. Critical estimates are made by management in determining, among other things, the allowance for loan losses, amounts of impairment, and valuation of income tax assets or tax refunds. If our underlying estimates and assumptions prove to be incorrect, our financial condition and results of operations may be materially different from that reported in our financial statements.
The failure of third parties who provide products, services or support to us to maintain their products, services or support could disrupt our operations or result in a loss of revenue.
We are reliant on third parties to provide certain products, services and support that is material to our business. In the event such parties become unwilling or unable to continue to provide such products, services or support to us, our business operations could be disrupted and our revenue could be materially and adversely affected.
We may not be successful at entering new businesses or broadening the scope of our existing service offerings.
We may enter into new businesses that are adjacent or complementary to our existing businesses and that broaden the scope of our existing service offerings. We cannot assure you that we will be successful in integrating the operations of any new businesses we acquire with our existing businesses, or that the failure to integrate such businesses, or the operation of such acquired businesses, will not have a material and adverse effect on our results operations, liquidity or capital resources.
Our information technology may not support our future volumes and business strategies.
We rely on our proprietary origination and servicing platforms that utilize database-driven software applications. We employ a team of engineers, information technology analysts, and website designers to ensure that our information technology systems remain on the cutting edge. However, due to the rapid changes in technology, there can be no assurance that our information technology systems will continue to be adequate for our business or provide a competitive advantage.
| 16 |
Our network and information systems are important to our operating activities and any network and information system shutdowns could disrupt our ability to process applications, originate financing facilities, or service our existing portfolio, which could have a material adverse impact on our operating activities. Shutdowns may be caused by unforeseen catastrophic events, including natural disasters, terrorist attacks, large-scale power outages, software or hardware defects, computer viruses, cyber attacks, external or internal security breaches, acts of vandalism, misplaced or lost data, programming or human errors, difficulties in migrating technology facilities from one location to another, or other similar events. We cannot be certain that our disaster recovery plan will function as intended, or otherwise resolve or compensate for such effects. Failure of our disaster recovery plan, if and when experienced, may have a material adverse effect on our revenue and ability to support and service our customer base.
Failure to protect our intellectual property rights may materially and adversely affect our competitive position and operations, and we may be exposed to infringement or misappropriation claims by third parties.
Our success is in part attributable to the technologies, know-how and other intellectual property that we have developed or acquired. We rely upon a combination of trade secrets, confidentiality policies, non-disclosure and other contractual arrangements, and trademark laws to protect our intellectual property rights. There can be no assurance that the steps we have taken to protect our intellectual property rights are adequate to prevent or deter infringement or other misappropriation of our intellectual property. We may not be able to detect unauthorized uses or take appropriate and timely steps to enforce our intellectual property rights. Any significant infringement of our proprietary technologies and processes or our intellectual property rights could weaken our competitive position and have an adverse effect on our operations. To protect our intellectual property rights, we may have to commence legal proceedings or otherwise spend significant amounts of time and money. We cannot assure you that we will prevail in such proceedings. The occurrence of any unauthorized use of or other infringement to our intellectual property rights, it could result in potential damage to our competitive position.
We may be subject to litigation involving claims of patent or trademark infringement or the violation of intellectual property rights of third parties. The defence of intellectual property suits, patent opposition proceedings and related legal and administrative proceedings can be costly and time-consuming and may significantly divert the efforts and resources of our technical and management personnel. An adverse determination in any litigation or proceedings to which we become a party could subject us to significant liability to third parties, require us to seek licenses from third parties, pay ongoing royalties, or redesign our products or subject us to injunctions prohibiting the manufacture and sale of our products or the use of our technologies, which could materially and adversely affect our business, financial condition or results of operations. Protracted litigation could also result in our customers or potential customers deferring or limiting their purchase or use of our products until resolution of such litigation, which could adversely affect our business.
Catastrophic events may negatively affect our business, financial condition, and results of operations.
Natural disasters, acts of war, terrorist attacks, and the escalation of military activity in response to these attacks or otherwise may have negative and significant effects, such as imposition of increased security measures, changes in applicable laws, market disruptions, and job losses. These events may have an adverse effect on the economy in general. Moreover, the potential for future terrorist attacks and the national and international responses to these threats could affect our business in ways that cannot be predicted. The effect of any of these events or threats could have a material adverse effect on our business, results of operations and financial condition.
Regulatory Risks
If our asset-based financing business in Australia were to become subject to more extensive regulation under Australian law, our business, financial condition, liquidity and results of operations would be materially and adversely affected.
Our asset based lending activities, including factoring receivables and purchase order financing, are not subject to governmental regulation in Australia, since we are deemed not to make loans. Nevertheless, if any of the transactions entered into by us are deemed to be loans or financing transactions instead of a true purchase of accounts receivable, then various laws and regulations we would become subject to numerous laws and regulations otherwise not applicable to our principal activities in Australia and could limit the fees and other charges we are able to charge our customers and may further subject us to penalties under such regulations. These laws and regulations would also:
| ● | Regulate our credit granting activities, and require that we obtain additional licenses; |
| ● | Require additional disclosures to customers; |
| ● | Govern the manner in which we conduct secured transactions; | |
| ● | Set collection, foreclosure, repossession and claims handling procedures and other trade practices; |
| 17 |
| ● | Prohibit discrimination in the extension of credit, and | |
| ● | Regulate our use and reporting of information related to a seller’s credit experience and other data collection. |
This could have a material adverse effect on our business, financial condition, liquidity and results of operations.
If we are found to be subject to or in violation of any laws or regulations, including those in Australia, the United States and other jurisdictions governing money transmission, electronic funds transfers, money laundering, terrorist financing, sanctions, consumer protection, banking and lending, it could be subject to liability, licensure and regulatory approval and may be forced to change its business practices.
Moneytech’s planned electronic payments business and money transfer business will be subject to the laws and regulations of Australia, and those of the United States if we decide to engage in those businesses in the United States, including those governing money transmission, electronic funds transfers, money laundering, terrorist financing, sanctions, consumer protection, banking and lending. The legal and regulatory requirements that apply to our payments businesses vary from country to country. While we have programs focused on compliance with applicable laws and regulations, there can be no assurance that we will not be subject to fines or other enforcement actions in one or more jurisdictions or be required to make changes to our business practices or compliance programs to comply in the future if our business should expand outside of Australia.
If Moneytech were to become a money transmitter in the United States, it would become subject to restrictions on its investment of customer funds, reporting requirements, bonding requirements, and inspection by state regulatory agencies. If Moneytech were found to be in violation of money services laws or regulations, we could be subject to criminal or civil penalties, be forced to alter our business practices or be required to obtain additional licenses or regulatory approvals that could impose substantial costs on us. Any change to our business practices that makes our services less attractive to customers or prohibits the use of our services by residents of a particular jurisdiction could harm our business.
We also would be subject to various anti-money laundering and counter-terrorist financing laws and regulations around the world that prohibit, among other things, involvement in transferring the proceeds of criminal activities. Any errors, failures or delays in complying with federal, state or foreign anti-money laundering and counter-terrorist financing laws could result in significant criminal and civil lawsuits, penalties and forfeiture of significant assets or other enforcement actions.
Entry into the US market or that of any other country will require significant expenditures to develop necessary compliance programs.
We have yet to determine what services we will offer and how we will provide such services were we to enter the U.S. money transfer or finance markets. Before we could provide any such services we would have to determine what regulations would be applicable to our business and develop appropriate compliance programs. We are likely to incur significant expenses in determining what laws and regulations are applicable to our business and developing appropriate compliance programs.
Risks Related to Our Common Stock and Our Status as a Public Company
There is currently a limited trading market for our common stock and an active, liquid trading market for our common stock may not develop, which could adversely affect the liquidity and price of our common stock.
Our common stock is quoted on the OTCQX quotation service. There is currently a limited trading market for our common stock. If an active, liquid trading market does not develop, you may have difficulty selling your shares of common stock at an attractive price, or at all. An inactive market may also impair our ability to raise capital by selling our common stock and may impair our ability to acquire other companies, products or technologies by using our common stock as consideration.
The market price of our common stock could decline due to the large number of outstanding shares of our common stock eligible for future sale.
Sales of substantial amounts of our common stock in the public market, or the perception that these sales could occur, could cause the market price of our common stock to decline. These sales could also make it more difficult for us to sell equity or equity-related securities in the future, at a time and price that we deem appropriate.
| 18 |
Holders of our shares, including members of our management, could choose to pledge their shares as collateral for loans and might not be required to disclose such arrangements. A subsequent decline in the price of our shares could cause the lender to foreclose upon the pledged shares and sell them into the market, leading to a further decline in the price of our shares.
Hugh Evans, our President and Chief Executive Officer, has significant influence over us, including control over decisions that require the approval of stockholders, which could limit your ability to influence the outcome of key transactions, including a change of control.
Hugh Evans, our Chief Executive Officer and President, owns a majority of our outstanding voting shares, and consequently has continue effective control over our business, including matters requiring the approval of our stockholders, such as election of directors, approval of significant corporate transactions and the timing and distribution of dividends, if any. In addition, his ownership of the Series B Shares entitles him to elect a majority of our directors until July 1, 2018, and as a result Mr. Evans will control our policies and operations, including, among other things, the appointment of management, future issuances of our common stock or other securities, the payment of dividends, if any, on our common stock, the incurrence of debt by us, and the entering into of extraordinary transactions.
Mr. Evans may have interests that do not align with the interests of our other stockholders, including with regard to pursuing acquisitions, divestitures, and other transactions that, in his judgment, could enhance his equity value, even though such transactions might involve risks to our other stockholders. For example, Mr. Evans could cause us to make acquisitions that increase our indebtedness. Mr. Evans will have effective control over our decisions to enter into such corporate transactions regardless of whether others believe that any transaction is in our best interests. Such control may have the effect of delaying, preventing, or deterring a change of control of our company, could deprive stockholders of an opportunity to receive a premium for their common stock as part of a sale of our company, and might ultimately affect the market price of our common stock.
Since our principal assets are located in Australia, and most of our officers and directors are not residents of the United States, it may be difficult or impossible for you to bring an action against us or against these individuals in Australia in the event that you believe that your rights have been infringed under the securities laws or otherwise, or to enforce any judgments rendered against us or our officers and/or directors.
Our principal assets are located in Australia, and all of our officers and all but one of our directors are not residents of the United States. Therefore, it may be difficult to effect service of process on such persons in the United States, and it may be difficult to enforce any judgments rendered by any courts of the United States against us or these officers and directors. Furthermore, it may be difficult or impossible for you to bring an action against us or against these individuals in Australia in the event that you believe that your rights have been infringed under the securities laws or otherwise. Even if you are successful in bringing an action of this kind, the laws of Australia may render you unable to enforce a judgment against our assets or the assets of our directors or officers that are not residents of the United States. There is doubt as to the enforceability in the Commonwealth of Australia, in original actions or in actions for enforcement of judgments of U.S. courts, of civil liabilities predicated solely upon federal or state securities laws of the U.S., especially in the case of enforcement of judgments of U.S. courts where the defendant has not been properly served in Australia. As a result of all of the above, our shareholders may have more difficulty in protecting their interests through actions against our management, directors or major shareholders compared to shareholders of a corporation doing business entirely within the United States.
Certain provisions of our amended and restated certificate of incorporation may have anti-takeover effects, which could limit the price investors might be willing to pay in the future for our common stock. In addition, Delaware law may inhibit takeovers of us and could limit our ability to engage in certain strategic transactions our board of directors believes would be in the best interests of stockholders.
Certain provisions of our amended and restated certificate of incorporation and bylaws could discourage unsolicited takeover proposals that stockholders might consider to be in their best interests. Among other things, our amended and restated certificate of incorporation and bylaws may include provisions that:
| ● | Do not permit cumulative voting in the election of directors, which would otherwise allow less than a majority of stockholders to elect director candidates; |
| ● | Limit the ability of our stockholders to nominate candidates for election to our board of directors; |
| ● | Authorize the issuance of “blank check” preferred stock without any need for action by stockholders; and |
| ● | Limit the ability of stockholders to call special meetings of stockholders. |
The foregoing factors, as well as the significant common stock ownership by Hugh Evans, could impede a merger, takeover, or other business combination or discourage a potential investor from making a tender offer for our common stock, which, under certain circumstances, could reduce the market value of our common stock.
| 19 |
In addition, Section 203 of the Delaware General Corporation Law (the “DGCL”), generally affects the ability of an “interested stockholder” to engage in certain business combinations, including mergers, consolidations, or acquisitions of additional shares, for a period of three years following the time that the stockholder becomes an “interested stockholder.” An “interested stockholder” is defined to include persons owning directly or indirectly 15% or more of the outstanding voting stock of a corporation.
We currently do not intend to pay any dividends on our shares in the immediate future.
We currently do not intend to pay dividends on our shares. We cannot give any assurance that we will declare dividends of any amounts, at any rate or at all in the future. Future dividends, if any, will be at the discretion of our board of directors, and will depend upon our results of operations, cash flow, financial condition, the terms of any bank loan, line of credit or funding agreement to which we are party, as well as our capital needs, future prospects and other factors that our directors may deem appropriate.
The market price of our common stock may be volatile, which could cause the value of an investment in our common stock to decline.
The market price of our common stock may fluctuate substantially due to a variety of factors, many of which are beyond our control, including:
| ● | General market conditions; |
| ● | Domestic and international economic factors unrelated to our performance; |
| ● | Actual or anticipated fluctuations in our quarterly operating results; |
| ● | Changes in or failure to meet publicly disclosed expectations as to our future performance; |
| ● | Downgrades in securities analysts’ estimates of our financial performance or lack of research and reports by industry analysts; |
| ● | Changes in market valuations or earnings of similar companies; |
| ● | Any future sales of our common stock or other securities; |
| ● | Additions or departures of key personnel; |
| ● | Fluctuations in foreign exchange rates; |
| ● | Regulatory developments in Australia affecting us or our competitors; and |
| ● | Release or expiry of transfer restrictions on our outstanding shares. |
The stock markets in general have experienced substantial volatility that has often been unrelated to the operating performance of particular companies. These types of broad market fluctuations may adversely affect the trading price of our common stock. In the past, stockholders have sometimes instituted securities class action litigation against companies following periods of volatility in the market price of their securities. Any similar litigation against us could result in substantial costs, divert management’s attention and resources, and harm our business or results of operations. For example, we are currently operating in, and have benefited from, a protracted period of historically low interest rates that will not be sustained indefinitely, and future fluctuations in interest rates could cause an increase in volatility of the market price of our common stock.
Item 1B. Unresolved Staff Comments
Not applicable.
Our corporate Australian headquarters are located at Level6/97 Pacific Highway, North Sydney NSW 2060 Australia, where we lease approximately 350 square meters of office and operations space pursuant to lease agreements expiring in August 2016. The annual rent for the premises is AUD$168,725. In addition, we occupy an office on Albany Highway, Victoria Park, Western Australia on a month by month basis. The monthly rent for the premises is AUD $1,420.
Management believes the terms of the leases are consistent with market standards and were arrived at through arm’s-length negotiation.
| 20 |
From time to time, we may become involved in various lawsuits and legal proceedings, which arise, in the ordinary course of business. However, litigation is subject to inherent uncertainties, and an adverse result in these or other matters may arise from time to time that may harm our business. We are currently not aware of any legal proceedings or claims that we believe will have a material adverse effect on our business, financial condition or operating results.
Item
4. Mine Safety Disclosures.
Not Applicable.
| 21 |
Item 5. Market for Registrant’s Common Equity, Related Stockholder Matters and Issuer Purchases of Equity Securities.
Market for Our Common Stock
Our common stock is quoted on the OTCQX under the symbol “SRCF.” The OTCQX is a quotation service that displays real-time quotes, last-sale prices, and volume information in over-the-counter (“OTC”) equity securities. An OTCQX equity security generally is any equity that is not listed or traded on a national securities exchange.
Price Range of Common Stock
The following table shows, for the periods indicated, the high and low closing sale prices per share of our common stock as reported by the OTCQX quotation service.
| High | Low | |||||||
| Fiscal Year 2014 | ||||||||
| First quarter ended September 30, 2013 | $ | 2.00 | $ | 1.02 | ||||
| Second quarter ended December 31, 2013 | $ | 2.50 | $ | 1.17 | ||||
| Third quarter ended March 31, 2014 | $ | 1.43 | $ | 0.78 | ||||
| Fourth quarter ended June 30, 2014 | $ | 2.00 | $ | 0.90 | ||||
| Fiscal Year 2015 | ||||||||
| First quarter ended September 30, 2014 | $ | 1.35 | $ | 0.55 | ||||
| Second quarter ended December 31, 2014 | $ | 0.70 | $ | 0.20 | ||||
| Third quarter ended March 31, 2015 | $ | 0.33 | $ | 0.26 | ||||
| Fourth quarter ended June 30, 2015 | $ | 1.03 | $ | 0.22 | ||||
Approximate Number of Equity Security Holders
As of July 6, 2015, there were approximately 421 stockholders of record. Because shares of our common stock are held by depositaries, brokers and other nominees, the number of beneficial holders of our shares is substantially larger than the number of stockholders of record.
Dividends
Since inception we have not paid any dividends on our common stock. We currently do not anticipate paying any cash dividends in the foreseeable future on our common stock. Although we intend to retain our earnings, if any, to finance the exploration and growth of our business, our Board of Directors will have the discretion to declare and pay dividends in the future.
Payment of dividends in the future will depend upon our earnings, growth, capital requirements, and other factors, which our Board of Directors may deem relevant.
Sales of Unregistered Securities
Except as disclosed in our Form 10-Qs and Form 8-Ks, we did not issue or sell any securities in transactions exempt from the registration requirements of the Securities Act during the fiscal year ended June 30, 2015.
Purchases of Our Equity Securities
No repurchases of our common stock were made by our company or its affiliates during the fourth quarter of our fiscal year ended June 30, 2015.
| 22 |
Equity Compensation Plan Information
The following table sets forth certain information as of June 30, 2015, our most recently complete fiscal year, with respect to compensation plans (including individual compensation arrangements) under which our equity securities are authorized for issuance.
| Equity Compensation Plan Information | ||||||||||||
| Plan category | Number of securities to be issued upon exercise of outstanding options, warrants and rights | Weighted-average exercise price of outstanding options, warrants and rights |
Number of securities remaining available for future issuance under equity compensation plans (excluding securities reflected in column (a)) | |||||||||
| (a) | (b) | (c) | ||||||||||
| Equity compensation plans approved by security holders | None | — | — | |||||||||
| Equity compensation plans not approved by security holders | 350,000 | $ | 1.96 | 2,150,000 | ||||||||
| Total | 350,000 | 2,150,000 | ||||||||||
The outstanding options include options to purchase an aggregate of 225,000 shares granted to our non-employee directors under our 2013 Omnibus Incentive Plan, at an exercise price of $2.00 per share, of which a total of 172,812 were exercisable at June 30, 2015. See. “Executive Compensation – 2013 Omnibus Incentive Plan.”
Item 6. Selected Financial Data.
Not applicable because we are a smaller reporting company.
Item 7. Management’s Discussion and Analysis of Financial Condition and Results of Operations
The following discussion of our financial condition and results of operations should be read in conjunction with the audited and unaudited financial statements and the notes to those statements included elsewhere in this Report. This discussion contains forward-looking statements that involve risks and uncertainties. You should specifically consider the various risk factors identified in this Report that could cause actual results to differ materially from those anticipated in these forward-looking statements.
Overview
We provide commercial asset based lending including accounts receivable and trade financing and other financial services to small to medium sized businesses and individuals in Australia through Moneytech and its subsidiaries, with a focus on utilizing leading edge technology to deliver these services.
On June 30, 2013, we acquired Moneytech in exchange for 5,300,000 shares of our common stock (the “Share Exchange”). As a result of the Share Exchange, Moneytech has become our wholly-owned subsidiary, and the former shareholders of Moneytech own in excess of 50% of our outstanding shares of common stock on a fully diluted basis. In connection with acquisition of Moneytech, we issued 5,000 shares of our Series B Preferred Stock to Hugh Evans, the Chairman and Managing Director of Moneytech. The Series B Shares enable Mr. Evans, until June 30, 2018, to (A) elect the majority of our Board of Directors and (B) vote on all other matters presented to the holders of our common stock (the “Common Shareholders”), with each vote per Series B Share equal to 1,000 shares of common stock. After June 30, 2018, the Series B Shares will have no voting rights and may be redeemed by us for a per share price one tenth of a cent ($0.001).
The Share Exchange was accounted for as a recapitalization of Moneytech effected by a share exchange, where Moneytech is considered the acquirer for accounting and financial reporting purposes. Our net assets and liabilities as of the date of the consummation of the Share Exchange were brought forward at their book value and no goodwill was recognized. Consequently, the historical consolidated financial statements of Moneytech are now the historical financial statements of Source Financial, Inc.
| 23 |
Moneytech commenced operations in 2003 as an Australian based, technology driven, commercial finance company. Moneytech has an AUD$50 million securitized wholesale debt facility (the “Wholesale Facility,” “Receivables Purchase Agreement” or “RPA”) with Westpac and in April 2015 issued AUD$25 million in Subordinated Notes. Moneytech uses the Wholesale Facility and the proceeds of the Subordinated Notes to offer asset based, trade finance or accounts receivable finance and working capital solutions to small and medium enterprises (“SME’s”) throughout Australia. Moneytech has been in operation for over twelve years.
To distinguish itself from traditional asset based lenders, and to manage and facilitate the advance of money to its customers, Moneytech has developed, operates and maintains its own real time core money transfer platform called The Moneytech Exchange. The Moneytech Exchange stores and tracks every invoice and payment entered into the system and automatically communicates with the major Australian transactional banks to settle thousands of transactions per day, in real time. The Moneytech Exchange is fully automated, real time and online. Human intervention only occurs to manage exceptions and provide necessary transaction approvals or authorizations.
The following chart reflects our organizational structure.
Our objective is to become a leading provider of commercial lines of credit and financial services, in particular money transfer services, to small and medium businesses in Australia. We seek to differentiate our services by developing and utilizing leading edge technologies to deliver our services. Moneytech currently provides asset based lines of credit in Australia using funds made available under its RPA with Westpac. We also provide payment processing (money transfer) solutions in Australia. We are seeking financing to expand Moneytech’s asset based credit solutions operations in Australia through a combination of organic growth and strategic acquisitions and we are considering introducing those operations in the United States, most likely through a strategic acquisition. We do not have any understandings, commitments or understandings with respect to any acquisitions.
Discontinued operations
In February 2014, management returned WikiTechnologies, Inc. to former management of the Company as per the terms of the Share Exchange Agreement dated May 30, 2013 and the Settlement Agreement dated February 11, 2014.
Net income attributable to our shareholders, and the associated return on equity, are the primary metrics by which we judge the performance of our business. Accordingly, we closely monitor the primary drivers of net income:
| ● | Net financing income - We track the split between the interest income, finance charges and fee income earned on the funds we lend and the interest, finance charges and fees incurred on our Wholesale Facility and Subordinated Notes, and continually monitor the components of our yield and our cost of funds. In addition, we monitor external rate trends, including the Reserve Bank of Australia cash rate. |
| 24 |
| ● | Net bad debt losses - Other than our cost of funds- interest expense and related fees- the largest driver of business profitability is the minimization of bad debts. Each asset based line of credit is priced based on an industry and individual customer risk profile developed by us. Delinquencies negatively impact our business performance. Our profitability is directly connected to our net credit losses; therefore, we closely analyze credit performance and seek to limit our exposure when feasible through the purchase of credit insurance. Our target customer is a business that has financing requirements (in terms of size and time to funding) that make them poor candidates for loans from larger Australian commercial banks. Our lending criteria have, to date, resulted in a relatively low level of overdue and delinquent balances and correspondingly low levels of bad debt. We extend Credit for a maximum of 122 days. Amounts outstanding beyond their due date are considered overdue and amount overdue for more than 30 days are considered delinquent. We monitor credit quality within our portfolio by observing trends in “average collection periods” “Days Sales Outstanding,” delinquent balances as a percentage of our portfolio and single obligor concentration limits and expect our bad debt to be approximately 0.15% of amounts funded. We assess the recoverability of each delinquent balance when determining the required amount of bad debt reserve. |
| ● | Costs and expenses - We assess our operational efficiency using our cost-to-income ratio. We perform extensive analysis to determine whether observed fluctuations in cost and expense levels indicate a trend or are the nonrecurring impact of large projects. Our cost and expense analysis also includes a loan- and portfolio-level review of origination and servicing costs to assist us in assessing profitability by pool and vintage. Portfolio volume and rate of turnover determine the magnitude of the impact of each of the above factors on our earnings, we also closely monitor new business volume and business growth. |
The accounts of Moneytech and its wholly owned subsidiaries are maintained, and its consolidated financial statements are expressed, in Australian dollars. Such financial statements were translated into United States Dollars to prepare the consolidated financial statements included in this Report. All assets and liabilities were translated at the exchange rate at the date of each balance sheet, stockholder’s equity is translated at the historical rates as of the date of each balance sheet and income statement items are translated at the average exchange rate for the period. Transactions in foreign currencies are initially recorded at the functional currency rate ruling at the date of transaction. Any differences between the initially recorded amount and the settlement amount are recorded as a gain or loss on foreign currency transaction in the consolidated statements of operations. The resulting translation adjustments are reported under other comprehensive income as a component of shareholders’ equity.
| 25 |
Results of Operations
Years ended June 30, 2015 and 2014
The following discussion of our results of operations constitutes management’s review of the factors that affected our financial and operating performance for the years ended June 30, 2015 and 2014. This discussion should be read in conjunction with the consolidated financial statements and notes thereto contained elsewhere in this report.
Set forth below are certain items from our operating statements for the years ended June 30, 2015 and 2014:
| For the year ended | $ | % | ||||||||||||||
| June 30 | Increase | Increase | ||||||||||||||
| 2015 | 2014 | (Decrease) | (Decrease) | |||||||||||||
| USD | USD | USD | ||||||||||||||
| Revenue | $ | 4,740,855 | $ | 5,810,936 | $ | (1,070,081 | ) | (18 | )% | |||||||
| Confirmed capital and credit express | 3,845,695 | 5,177,446 | (1,331,751 | ) | (26 | )% | ||||||||||
| Interest revenue | 2,350,643 | 3,731,020 | (1,380,377 | ) | (37 | )% | ||||||||||
| Fees | 1,487,166 | 1,338,627 | 148,539 | 11 | % | |||||||||||
| Other revenue | 7,886 | 107,799 | (99,913 | ) | (93 | )% | ||||||||||
| Payment services | 789,853 | 495,780 | 294,073 | 59 | % | |||||||||||
| Terminal sales and transactions | 526,524 | 159,324 | 367,200 | 230 | % | |||||||||||
| Hubbed | 175,468 | 189,983 | (14,515 | ) | (8 | )% | ||||||||||
| Giftcard program revenue | 87,861 | 144,925 | (57,064 | ) | (39 | )% | ||||||||||
| Other revenue | - | 1,548 | (1,548 | ) | (100 | )% | ||||||||||
| Other revenue | 105,307 | 137,710 | (32,403 | ) | (24 | )% | ||||||||||
| 360FX customer referral | 103,966 | 93,470 | 10,496 | 11 | % | |||||||||||
| Foreign exchange | 1,097 | 44,658 | (43,561 | ) | (98 | )% | ||||||||||
| Other revenue | 244 | (418 | ) | 662 | (158 | )% | ||||||||||
| Cost of revenue | 3,418,492 | 3,056,524 | 361,968 | 12 | % | |||||||||||
| Confirmed capital and credit express | 2,276,848 | 2,235,368 | 41,480 | 2 | % | |||||||||||
| Interest expense | 1,784,043 | 1,695,288 | 88,755 | 5 | % | |||||||||||
| Account Issuing Expenses | 226,464 | 257,791 | (31,327 | ) | (12 | )% | ||||||||||
| Insurance | 231,627 | 189,468 | 42,159 | 22 | % | |||||||||||
| Other | 34,714 | 92,821 | (58,107 | ) | (63 | )% | ||||||||||
| Payment services | 464,289 | 144,256 | 320,033 | 222 | % | |||||||||||
| Terminal sales and transactions | 325,216 | 116,657 | 208,559 | 179 | % | |||||||||||
| Hubbed | 17,838 | 5,486 | 12,352 | 225 | % | |||||||||||
| Gift card expenses | 121,235 | 22,113 | 99,122 | 448 | % | |||||||||||
| Other | - | - | - | - | ||||||||||||
| Depreciation and amortization | 673,416 | 676,339 | (2,923 | ) | (0 | )% | ||||||||||
| Other cost of revenue | 3,939 | 561 | 3,378 | 602 | % | |||||||||||
| Gross profit | 1,322,363 | 2,754,412 | (1,432,049 | ) | (52 | )% | ||||||||||
| Operating expenses | 2,924,109 | 3,707,114 | (783,005 | ) | ||||||||||||
| Compensation expenses | 1,242,789 | 1,060,905 | 181,884 | 17 | % | |||||||||||
| Research and development expense | 815,847 | 557,393 | 258,454 | 46 | % | |||||||||||
| Bad debt expenses | 58,788 | 795,112 | (736,324 | ) | (93 | )% | ||||||||||
| Bad debts recovered | (142,389 | ) | (3,234 | ) | (139,155 | ) | 4,303 | % | ||||||||
| Professional expenses | 299,567 | 612,763 | (313,196 | ) | (51 | )% | ||||||||||
| Occupancy expenses | 227,048 | 250,651 | (23,603 | ) | (9 | )% | ||||||||||
| Depreciation expense | 56,115 | 61,716 | (5,601 | ) | (9 | )% | ||||||||||
| General and administration expenses | 366,344 | 371,808 | (5,464 | ) | (1 | )% | ||||||||||
| (Loss) income from operations | (1,601,746 | ) | (952,702 | ) | (649,044 | ) | 68 | % | ||||||||
| Other income | 761,395 | 714,793 | 46,602 | 7 | % | |||||||||||
| (Loss) income before income tax | (840,351 | ) | (237,909 | ) | (602,442 | ) | 253 | % | ||||||||
| Income tax expense | 180,446 | 327,539 | (147,093 | ) | (45 | )% | ||||||||||
| Net (loss) income from continuing operations | (1,020,797 | ) | (565,448 | ) | (455,349 | ) | 81 | % | ||||||||
| Net result from discontinued operations | - | (301,280 | ) | 301,280 | NA | |||||||||||
| Net (loss) income | (1,020,797 | ) | (866,728 | ) | (154,069 | ) | 18 | % | ||||||||
| Other comprehensive loss | ||||||||||||||||
| Foreign currency translation | (1,250,283 | ) | 214,996 | (1,465,279 | ) | (682 | )% | |||||||||
| Comprehensive loss | $ | (2,271,080 | ) | $ | (651,732 | ) | $ | (1,619,348 | ) | 248 | % | |||||
| 26 |
The following table reflects the movements in our revenues and cost of revenues in our functional currency; Australian Dollars, for the years ended June 30, 2015 and 2014.
| % | ||||||||||||||||||||
| For the year ended | a$ | % | Revenue
/ Cost of |
|||||||||||||||||
| June 30 | Increase | Increase | revenue | |||||||||||||||||
| 2015 | 2014 | (Decrease) | (Decrease) | move | ||||||||||||||||
| AUD | AUD | AUD | ||||||||||||||||||
| Revenue | $ | 5,657,347 | $ | 6,325,172 | $ | (667,825 | ) | (11 | )% | (11 | )% | |||||||||
| Confirmed capital and credit express | 4,589,138 | 5,635,622 | (1,046,484 | ) | (19 | )% | (17 | )% | ||||||||||||
| Interest revenue | 2,805,066 | 4,061,196 | (1,256,130 | ) | (31 | )% | (20 | )% | ||||||||||||
| Fees | 1,774,662 | 1,457,088 | 317,574 | 22 | % | 5 | % | |||||||||||||
| Other revenue | 9,410 | 117,338 | (107,928 | ) | (92 | )% | (2 | )% | ||||||||||||
| Payment services | 942,545 | 539,654 | 402,891 | 75 | % | 6 | % | |||||||||||||
| Terminal sales and transactions | 628,310 | 173,423 | 454,887 | 262 | % | 7 | % | |||||||||||||
| Hubbed | 209,389 | 206,795 | 2,594 | 1 | % | 0 | % | |||||||||||||
| Giftcard program revenue | 104,846 | 157,750 | (52,904 | ) | (34 | )% | (1 | )% | ||||||||||||
| Other revenue | - | 1,686 | (1,686 | ) | (100 | )% | (0 | )% | ||||||||||||
| Other revenue | 125,664 | 149,896 | (24,232 | ) | (16 | )% | (0 | )% | ||||||||||||
| 360FX customer referral | 124,064 | 101,742 | 22,322 | 22 | % | 0 | % | |||||||||||||
| Foreign exchange | 1,309 | 48,610 | (47,301 | ) | (97 | )% | (1 | )% | ||||||||||||
| Other revenue | 291 | (456 | ) | 747 | (164 | )% | 0 | % | ||||||||||||
| Cost of revenue | 4,079,347 | 3,327,011 | 752,336 | 23 | % | 23 | % | |||||||||||||
| Confirmed capital and credit express | 2,717,002 | 2,433,187 | 283,815 | 12 | % | 9 | % | |||||||||||||
| Interest expense | 2,128,929 | 1,845,312 | 283,617 | 15 | % | 9 | % | |||||||||||||
| Account Issuing Expenses | 276,405 | 280,604 | (4,199 | ) | (1 | )% | (0 | )% | ||||||||||||
| Insurance | 270,243 | 206,235 | 64,008 | 31 | % | 2 | % | |||||||||||||
| Other | 41,425 | 101,036 | (59,611 | ) | (59 | )% | (2 | )% | ||||||||||||
| Payment services | 554,045 | 157,022 | 397,023 | 253 | % | 12 | % | |||||||||||||
| Terminal sales and transactions | 388,086 | 126,980 | 261,106 | 206 | % | 8 | % | |||||||||||||
| Hubbed | 21,287 | 5,972 | 15,315 | 256 | % | 0 | % | |||||||||||||
| Gift card expenses | 144,672 | 24,070 | 120,602 | 501 | % | 4 | % | |||||||||||||
| Other | - | - | - | - | - | |||||||||||||||
| Depreciation and amortization | 803,599 | 736,192 | 67,407 | 9 | % | 2 | % | |||||||||||||
| Other cost of revenue | 4,701 | 610 | 4,091 | 671 | % | 0 | % | |||||||||||||
| Gross profit | $ | 1,578,000 | $ | 2,998,161 | $ | (1,420,161 | ) | (47 | )% | |||||||||||
Revenue
Presentation currency - US$
Consolidated revenue from continuing operations for the year ended June 30, 2015 was approximately $4,740,855, a decrease of $1,070,081 or 18% from our consolidated revenue from continuing operations for the year ended June 30, 2014 of $5,810,936. Confirmed capital and credit express revenue decreased $1,331,751 or 26%. While our Payment services revenue increased $294,073 or 59% over the previous fiscal year. We also experienced a decrease in Other revenue of $32,403 or 24%..
The decrease in Confirmed Capital revenues was mainly attributable to the reduction of non-recurring interest and penalties paid by customers in 2014 in connection with the work out of their 2014 defaulted loans. We did not experience any similar significant defaults in fiscal 2015. The non-recurring revenue in 2014 year was $1,214,413 or 91% of the decrease in revenue in 2015 of $1,331,751. The lines of credit we funded were approximately $186 million during the year ended June 30, 2015 and $200 million during the year ended June 30, 2014. The reduction in lines of credit we funded in fiscal 2015 was a direct result of defaulted customers which had not been replaced immediately.
The increase in payment services revenue is primarily attributable to an increase in revenues in Mpos of $367,200 or 230%. Mpos provides point of sale terminals for customers in Australia. During the year ended June 30, 2015 we entered into new terminal and merchant acquiring agreements and sold or leased 598 new terminals to merchants. This activity took place in the second half of the year and the terminal sales and transactions revenue earned from the new infrastructure amounted to $423,625. We anticipate terminal sales will increase in fiscal 2016 as a result of extending our customer base to a broader retail customer market and marketing the new terminals for the full fiscal year. This will result in both increased terminal revenue and transaction revenue for Mpos. We also experienced a decrease in gift card revenues of $57,064 or 39% and a decrease in Hubbed revenues of $14,515 or 8%. The gift cards decrease is primarily attributable to lower card activity by our existing customers in fiscal 2015. The Hubbed revenues decrease is primarily attributable to the change in exchange rate year on year.
| 27 |
Other revenue decreased $32,403 and this is primarily attributable to a decrease in foreign exchange services for customers.
Functional currency - A$
Consolidated revenue from continuing operations for the year ended June 30, 2015 was approximately $5,657,347, a decrease of $667,825 or 11% from our consolidated revenue from continuing operations for the year ended June 30, 2014 of $6,325,172. Revenue decreased primarily as a result of a $1,046,484 or 19% decrease in Confirmed Capital and Credit Express revenues which was partially offset by an increase in payment services revenues of $402,891 or 75%. A decrease in Other revenue of $24,232 or 16% accounts for the remainder.
The decrease in Confirmed Capital revenues was mainly attributable to the reduction of non-recurring interest and penalties paid by customers in 2014 in connection with the work out of their 2014 defaulted loans. We did not experience any similar significant defaults in fiscal 2015. The non-recurring revenue in 2014 year was $1,321,871 or 126% of the decrease in revenue in 2015 of $1,046,484. The lines of credit we funded were approximately $203 million during the year ended June 30, 2015 and $218 million during the year ended June 30, 2014. The reduction in lines of credit we funded in fiscal 2015 was a direct result of defaulted customers which had not been replaced immediately.
The increase in payment services revenue is primarily attributable to an increase in revenues in Mpos of $454,887 or 262%. Mpos provides point of sale terminals for customers in Australia. During the year ended June 30, 2015 we entered into new terminal and merchant acquiring agreements and sold or leased 598 new terminals to merchants. This activity took place in the second half of the year and the terminal sales and transactions revenue earned from the new infrastructure amounted to $505,519. We anticipate terminal sales will increase in fiscal 2016 as a result of extending our customer base to a broader retail customer market and marketing the new terminals for the full fiscal year. This will result in both increased terminal revenue and transaction revenue for Mpos. We also experienced a decrease in gift card revenues of $52,904 or 34% which is primarily attributable to lower card activity by our existing customers in fiscal 2015. Slight changes in Hubbed and Other revenue account for the remainder.
Other revenue decreased slightly and this is primarily attributable to a decrease in foreign exchange services for customers.
Cost of Revenue; Gross Profit
Presentation currency - US$
Cost of revenue from continuing operations, which is composed principally of the interest, fees and insurance we pay related to funds borrowed and the amortization expense of capitalized research and development costs was $3,418,492 in the year ended June 30, 2015, an increase of $361,968 or 12% from our cost of revenue of $3,056,524 for the year ended June 30, 2014. Costs of revenue increased 12% primarily as a result of increases in Payment Services of 222% or $320,033 and increases in Confirmed Capital and Credit Express costs of 2% or $41,480. A slight decrease of$2,923 in depreciation and amortization costs accounted for the remainder.
The Payment Services cost increase of $320,033 is primarily attributable to an increase in costs of the new terminals deployed to Mpos customers. We also experienced an increase in gift card costs of $99,122 or 448% and an increase in Hubbed costs of $12,352 or 225%. The gift cards increase is primarily attributable to a settlement payment related to breakage of $101,895 in June 2015. The Hubbed costs increase is primarily attributable to increased transactions processed during the year following growth in news agents serviced from 250 in fiscal 2014 to more than 800 in fiscal 2015.
The increase in Confirmed Capital and Credit Express costs is mainly attributable to an increase of 5% or $88,755 in interest expense, an increase of 22% or $42,159 in insurance costs, partially offset by a 63% or $58,107decrease in fees associated with new accounts and a decrease in existing account expenses of 12% or $ 31,327. Our interest expense increased slightly year over year as a slight decrease in the volume of credit lines funded year to date was offset by fee increases attributable to unused facility fees and the increased cost of funding related to the new Subordinated Notes . The unused facility fee accounted for approximately $41,326 or 47% of the $88,755 increase. The increase in insurance costs of 22% is attributable to an increase in premium as a result of increases in amounts funded. The decrease in fees associated with new accounts of 63% is mainly attributable to documentation expenses in the prior year that were not repeated in the current year. Existing account expenses, which mainly include merchant service costs charged to us when customers pay with credit cards decreased by 12% and this is primarily attributable to the change in exchange rate year on year.
Our gross profit from continuing operations, decreased $1,432,049 from $2,754,412 in the year ended June 30, 2014 to $1,322,363 in the year ended June 30, 2015. This was primarily attributable to net interest margin and fee revenue decreases at Confirmed Capital and Credit Express as described above.
| 28 |
Functional currency - A$
Cost of revenue from continuing operations, which is composed principally of the interest, fees and insurance we pay related to funds borrowed and the amortization expense of capitalized research and development costs was $4,079,347 in the year ended June 30, 2015, an increase of $752,336 or 23% from our cost of revenue of $3,327,011 for the year ended June 30, 2014. Costs of revenue increased 23% primarily as a result of increases in Payment Services of 253% or $397,023 and increases in Confirmed Capital and Credit Express costs of 12% or $283,815. An increase of 9% or $67,407 in depreciation and amortization costs accounted for the remainder.
The Payment Services cost increase of $397,023 is primarily attributable to an increase in costs of the new terminals deployed to Mpos customers. We also experienced an increase in gift card costs of $120,602 or 501% and an increase in Hubbed costs of $15,315 or 256%. The gift cards increase is primarily attributable to a settlement payment related to breakage of $121,593 in June 2015. The Hubbed costs increase is primarily attributable to increased transactions processed during the year following growth in news agents serviced from 250 in fiscal 2014 to more than 800 in fiscal 2015.
The increase in Confirmed Capital and Credit Express costs off $283,815 is mainly attributable to an increase of 15% or $283,617 in interest expense, an increase of 31% or $64,008 in insurance costs, partially offset by a 59% or $59,611decrease in fees associated with new accounts and a decrease in existing account expenses of 1% or $ 4,199. Our interest expense increased slightly year over year as a slight decrease in the volume of credit lines funded year to date was offset by fee increases attributable to unused facility fees and the increased cost of funding related to the new Subordinated Notes . The unused facility fee accounted for approximately $49,315 or 17% of the $283,617 increase. The increase in insurance costs of 31% is attributable to an increase in premium as a result of increases in amounts funded. The decrease in fees associated with new accounts of 59% is mainly attributable to documentation expenses in the prior year that were not repeated in the current year. Existing account expenses, which mainly include merchant service costs charged to us when customers pay with credit cards, decreased 1% and accounted for the remainder.
Our gross profit from continuing operations, decreased $1,420,161 from $2,998,161 in the year ended June 30, 2014 to $1,578,000 in the year ended June 30, 2015. This was primarily attributable to net interest margin and fee revenue decreases at Confirmed Capital and Credit Express as described above.
Operating Expenses; Bad Debt Expense; Income from Operations
Apart from the costs under our RPA and Subordinated Notes, the other significant factor in determining our overall profitability is our operating expenses, in particular our bad debt expense. Our bad debt expense for the year ended June 30, 2015 was $58,788, representing a decrease of $736,324 from bad debt expense of $795,112 for the year ended June 30, 2014. We regularly evaluate the credit quality of our customers and this decrease is attributable to changes in the assessment of several customer balances in line with our credit and collections policy as well as the write off in the prior year of a claim for the 2010 insurance year denied by our insurers.
The percentage of delinquent balances in our portfolio was 1.56% and 1.53% as of June 30, 2015 and 2014 respectively. The percentage of delinquent balances in our portfolio averaged 1.69% and 1.77% in the years ended June 30, 2015 and 2014 respectively. The average collection period in our portfolio was 52 days at June 30, 2015, up from 45 days at June 30, 2014 and 2013. Bad debts as a percentage of amount funded was 0.03% and 0.40% in the years ended June 30, 2015 and 2014 respectively.
Our total operating expenses from continuing operations (other than bad debt) increased by $92,474 or 3% from $2,915,236 in the year ended June 30, 2014 to $3,007,710 in the year ended June 30, 2015. This increase is primarily attributed to compensation costs ($181,884 or 17%), research and development expense ($258,454 or 46%) and is offset by a decrease in professional expenses ($313,196 or 51%). The compensation costs increase reflects costs of adding our Management, Business Development officer, other staff and non-executive directors that were not employed prior to June 30, 2014. These costs are expected to remain in fiscal 2016. The research and development expense increase reflects increased expenditure on items that are not capitalized. The professional expenses decrease primarily reflects a decrease in legal fees ($326,782). Legal fees have decreased because activity associated with the Company’s registration statement has ceased following the withdrawal of our registration statement in the third quarter 2015 and a renegotiation of previously recorded legal fees. The general and administration expenses increase includes terminal impairment losses of $28,051 which are not expected to be repeated in fiscal 2016.
| 29 |
Other Income; Provision for income taxes; net (loss) income
To date, our other expense (income) has consisted of financing costs other than those incurred under the RPA and in connection with the Subordinated Notes, offset by interest income on the cash reserves we are required to maintain under the RPA and the Subordinated Notes, and research and development grants received from the Australian government. In the year ended June 30, 2015 we accrued AUD $752,620 (USD $630,696) for research grants we expect to receive later this year from the Australian government.
Under the Australian grant program, we are eligible for government grants equal to 43% of the amounts spent on research and development. Grant processing and payment takes place annually and payment of the grant is not discretionary if the applicable criteria are met. The company prepares the claim and the expected payment is accrued as income when the grant criteria are met. Much of the related expense is capitalized and amortized as a part of cost of revenues, generally over the following 10 years.
Our net loss from continuing operations before tax for the year ended June 30, 2015 was $840,351, as opposed to a net loss of $237,909 for the year ended June 30, 2014. As a result of $180,446 in taxes incurred in the year ended June 30, 2015, we incurred a net loss after tax for the year ended June 30, 2015 of $1,020,797, as compared to net loss after tax for the year ended June 30, 2014 of $565,448. No tax benefit has been recognized for the losses incurred in the United States because management believes it more likely than not that these assets will not be realized in the near future. Operations in Australia were not profitable as a result of a decrease in net interest margin and the lines of credit funded as well as the higher overhead associated with operating a listed company.
Net loss from discontinued operations.
In January 2014, management decided to return the ‘Wiki Technologies’ entity to two former shareholders of the Company in accordance with the terms set forth in the terms of the Share Exchange Agreement. Revenue and expenses, and gains and losses relating to the discontinued business have been reclassified from the results of continuing operations and are reflected as net loss from discontinued operations.
Other comprehensive income.
Our other comprehensive income consists of gains and losses in net asset value that occur when movements in foreign exchange rates occur. These gains or losses are primarily as a result of changes in the AUD/USD exchange rate. We cannot and do not attempt to predict movements in these exchange rates. The changes in net asset value occur because our net assets and operational activity are principally in Australian Dollars. We do not hedge the foreign exchange rate exposure. If we initiate operations in the United States, the impact of foreign exchange rates on our results of operations will decrease.
The average AUD/USD exchange rates were 1 to 0.9187 and 1 to 0.8380 in the year ended June 30, 2014 and the year ended June 30, 2015, respectively.
Comparison of Balance Sheet Data as at June 30, 2015 and June 30, 2014
Set forth below are certain items from our Consolidated Balance Sheets at June 30, 2015 and 2014:
| June 30 | June 30 | |||||||
| 2015 | 2014 | |||||||
| Cash and cash equivalents | $ | 8,075,078 | $ | 10,730,743 | ||||
| Trade receivables, net | $ | 19,651,268 | $ | 24,870,297 | ||||
| Total Assets | $ | 33,362,460 | $ | 42,251,766 | ||||
| Wholesale Loan Facility | $ | 6,052,789 | $ | 27,746,303 | ||||
| Subordinated notes, net | $ | 18,471,471 | $ | - | ||||
| Total Liabilities | $ | 28,934,821 | $ | 35,696,108 | ||||
| Total Stockholder's Equity | $ | 4,427,639 | $ | 6,555,658 | ||||
Cash and cash equivalents have decreased as a result of a reduction in monies received on behalf of customers which has resulted in an equivalent decrease in our Trade and other payables.
| 30 |
AUD $25 million of Subordinated Notes were issued in April 2015. The monies received from the issuance of these Subordinated Notes were used to repay the Wholesale Loan Facility.
Liquidity and Capital Resources
Our ability to offer asset backed credit lines is determined by the amount of funds we can borrow which is influenced by the amount of our capital. We require a significant amount of liquidity to offer our asset backed credit lines and our rate of growth and profitability will, for the foreseeable future, largely be determined by our ability to raise equity or borrow funds to make available to our clients and the effective cost of such funds.
Credit Facilities
Receivable Purchase Agreement
In 2005 we entered into a Receivables Purchase Agreement (the “Wholesale Facility” or the “RPA”) with one of the “Big Four” Australian Banks which has been renewed annually each year thereafter. Pursuant to this Agreement we electronically offer eligible receivables to our lender for purchase on a nightly basis. These offerings are then settled by the lender on a daily basis. The funds we receive upon settlement are automatically and electronically delivered to our customers. Our gross profit is represented by the difference between what we charge our customers in interest, finance charges and fees and what we pay to our lender. Our borrowing limit under the RPA is AUD$50 million, subject to interim agreed upon limits determined by various tests and covenants. As at June 30, 2015 our borrowing capacity was limited to AUD $25 million and the total amount drawn against the facility was $6,052,789. The agreement is renewed annually on an agreed anniversary date, the latest of which was December 31, 2014. The facility has been renewed until December 31, 2015.
We pay an interest rate on all borrowed monies under the RPA which is directly linked to the Reserve Bank of Australia cash-rate, a utilization fee charged on monies available to be borrowed but not utilized, an annual line fee and fees for electronically accessing the facility. The Facility contains a number of covenants relating to our financial performance and performance of our receivables portfolio including but not limited to net profit targets, maximum dilution ratios, concentration limits, maximum delinquency ratios and cash reserve requirements. As of the date hereof we are in compliance with all covenants imposed by the RPA.
We, in turn, provide our customers with funds provided by the RPA. We charge each of our clients, interest at a rate above that charged by our lender and seek to have our clients pay a fee corresponding to each of the fees charged to us in respect of their loans. To the extent that the RPA requires that we deposit monies into an account to partially secure repayment of our loans, we seek to have those funds advanced by our customers as a condition of their credit lines. The cash reserve we are required to maintain pursuant to the RPA is included under Cash and cash equivalents on our balance sheet.
Subordinated Notes
In April 2015 we issued AUD $25 million of subordinated notes. The notes mature in 7 years and have similar conditions, including financial covenants and restrictions as to use of proceeds, to the wholesale facility and are subordinate to that facility. The costs of the Subordinated Note issuance were approximately AUD $1 million and the proceeds to the company were approximately AUD $24 million. The Subordinated Notes bear interest at a rate of 4.65% per annum above the Australian BBSW rate. The BBSW rate as of the date of settlement, April 10, 2015, was 2.26% per annum. The Notes can be redeemed early at increased cost to the Company or at the request of the holder in the event of a change in control.
In conjunction with the note issuance, the RPA interim agreed upon facility limit was decreased from AUD $40 million to AUD $25 million as of April 16, 2015.
| 31 |
Comparison of the Statement of Cash Flows for the Fiscal Years Ended June 30, 2015 and 2014
Set forth below are certain items from our Statement of Cash Flows for the years ended June 30, 2015 and 2014:
| For the years ended | ||||||||
| June 30 | ||||||||
| 2015 | 2014 | |||||||
| Net cash (used in) provided by operating activities | $ | (2,787,916 | ) | $ | 4,814,761 | |||
| Net cash (used in) investing activities | (572,621 | ) | (880,813 | ) | ||||
| Net cash provided by (used in) financing activities | 2,625,601 | (651,393 | ) | |||||
| Net cash (used in) discontinued operations | - | (65,288 | ) | |||||
| Effect of exchange rate changes on cash and cash equivalents | (1,920,729 | ) | 307,649 | |||||
| Net cash (outflow) inflow | $ | (2,655,665 | ) | $ | 3,524,916 | |||
Net cash provided by (used in) operating activities
During the year ended June 30, 2015, we used approximately $2,787,916 of cash in our operating activities. This reflects our net loss from continuing operations of $1,020,797 plus $1,767,119 used by changes in operating assets and liabilities and adjustments for non-cash items. Cash provided by working capital items was primarily impacted by a decrease in trade payables of $2,978,562 due to a decrease in cash received on customer accounts that was not related to amounts funded by the Company. Adjustments for non-cash items consisted of depreciation and amortization in the amount of $729,531, subordinated notes costs amortization of $41,839, stock options and shares issued for compensation of $143,061 and gain on equity method investment of $743.
During the year ended June 30, 2014, we generated approximately $4,814,761of cash in our operating activities. This reflects our net loss from continuing operations of $565,448 plus $5,380,209 provided by changes in operating assets and liabilities and adjustments for non-cash items. Cash provided by working capital items was primarily impacted by an increase in trade payables of $3,157,082 due to an increase in cash received on customer accounts that was not related to amounts funded by the Company. Adjustments for non-cash items consisted of depreciation and amortization in the amount of $738,056 and stock options and shares issued for compensation of $126,231.
Net cash (used in) investing activities
During the year ended June 30, 2015, net cash used in investing activities of $572,621 was primarily impacted by $518,155 in capitalized costs incurred on the development of intangible assets, principally software related to The Moneytech Exchange and mPay.
During the year ended June 30, 2014, net cash used in investing activities of $880,813 was primarily impacted by $753,547 in capitalized costs incurred on the development of intangible assets, principally software related to The Moneytech Exchange and mPay.
Net cash (used in) provided by financing activities
During the year ended June 30, 2015, net cash provided by financing activities of $2,625,601 primarily reflects the 7 year subordinated notes issued during the year providing $20,113,229, offset by a decrease in our borrowings under the Wholesale Loan Facility of $18,078,542. Additions to our capital reserve accounts by our customers of $590,914 account for the difference.
During the year ended June 30, 2014, net cash used in financing activities of $651,393 primarily reflects withdrawals from our capital reserve accounts by our customers of $1,890,240. An increase in our borrowings under the Wholesale Loan Facility of $1,238,847 accounts for the difference.
Net cash provided by discontinued operations
During the year ended June 30, 2014, net cash used by discontinued operations of $65,288 primarily reflects the losses of the Wiki business of $301,280 offset by adjustments for non-cash items and changes in operating assets and liabilities providing $91,899. Net cash provided by financing activities of $150,000 and used by investing activities of $5,907 accounts for the difference.
Net cash inflow
During the year ended June 30, 2015, net cash decreased by $2,655,665 as compared to the year ended June 30, 2014, where net cash increased by $3,524,916.
| 32 |
Insurance
As a condition of the RPA and Subordinated Notes, the receivables due Moneytech from its customers or their counterparties are insured pursuant to a policy issued by Euler Hermes, a Standard & Poor’s rated trade credit insurance provider. Pursuant to this policy, Moneytech would bear the first $500,000 of losses incurred in any calendar year, after which any bad debt losses are borne by Euler Hermes. This policy is renewed annually.
The following tables show, since claim year 2010 (each claim year ends on December 31) the amount of claims submitted to Euler Hermes for reimbursement, the amounts recognized or denied, the payments received to date and amounts remaining to be paid.
| Fiscal year | Fiscal year | Fiscal year | Fiscal year | Fiscal year | ||||||||||||||||
| Jun
30, 2011 | Jun
30, 2012 | Jun
30, 2013 | Jun
30, 2014 | Jun
30, 2015 | ||||||||||||||||
| AUD | AUD | AUD | AUD | AUD | ||||||||||||||||
| Opening balance | $ | - | $ | - | $ | 520,012 | $ | 295,145 | $ | 34,061 | ||||||||||
| Claims recognised | - | 520,012 | 18,344 | 37,432 | - | |||||||||||||||
| Claims paid | - | - | (224,866 | ) | (139,717 | ) | (34,061 | ) | ||||||||||||
| Claims denied | - | - | (18,344 | ) | (158,800 | ) | - | |||||||||||||
| Closing balance | $ | - | $ | 520,012 | $ | 295,145 | $ | 34,061 | $ | - | ||||||||||
| Claim
year 2010 | Claim
year 2011 | Claim
year 2012 | Claim
year 2013 | Claim
year 2014 | Claim
year 2015 | |||||||||||||||||||
| AUD | AUD | AUD | AUD | AUD | AUD | |||||||||||||||||||
| Claims submitted | $ | 960,068 | $ | 615,720 | ||||||||||||||||||||
| Policy excess | (500,000 | ) | (500,000 | ) | ||||||||||||||||||||
| Claims denied | (158,800 | ) | (18,344 | ) | No claim submitted as credit losses do not exceed the policy excess of $500,000 | |||||||||||||||||||
| Claims paid | (301,268 | ) | (97,376 | ) | ||||||||||||||||||||
| Claims in progress | $ | - | $ | - | $ | - | $ | - | $ | - | $ | - | ||||||||||||
| Progression toward the deductible | N/A | N/A | $ | 146,221 | $ | 80,674 | $ | 348,230 | $ | 153,663 | ||||||||||||||
| 1 | Claim amounts for claim years 2010 and 2011 were recognised in the 2012 fiscal year. In fiscal year 2011, there was no expectation of a claim for claim year 2010. In fiscal 2012, there was a change in circumstances relating to a debt attributable to claim year 2010 which resulted in a claim becoming possible. | |
| 2 | Claim years run January 1 to December 31 each year. | |
| 3 | Claims are not submitted until the policy excess is reached |
Commitments for Capital Expenditures
We do not have any commitments for capital expenditures.
The design and technical development of The Moneytech Exchange is completed and it is operational. Although we will continue to upgrade and add additional functionality to The Moneytech Exchange and will need to add additional personnel as we grow, the rate of growth of these expenses should be less than the rate of growth of our revenue. Further, we anticipate that as we expand our portfolio and increase the number of services we offer, the rate of growth in the lines of credit we service and in our revenues will exceed the rate of growth in our operating expenses. There are a number of reasons for this, the most significant being that most of the expense involved with any debtor/obligor is incurred when the relationship is established. In the absence of a default or other triggering event, so long as a debtor/obligor is online, it generates revenue for us with little impact on our operating expenses.
In addition to the upgrade and addition of functionality to The Moneytech Exchange, we will also incur expenditure on research and development of our payments services platform and functionality.
Off Balance Sheet Items
We do not have any off-balance sheet arrangements, financings, or other relationships with unconsolidated entities or other persons, also known as “special purpose entities” (SPEs).
| 33 |
Critical Accounting Policies
Use of Estimates
Our discussion and analysis of our financial condition and results of operations are based upon our consolidated financial statements, which have been prepared in accordance with accounting principles generally accepted in the United States. The preparation of these financial statements requires us to make estimates and judgments that affect the reported amounts of assets, liabilities, revenues and expenses, and related disclosure of contingent assets and liabilities. We continually evaluate our estimates, including those related to bad debts, recovery of long-lived assets, income taxes, and the impact of changes in currency exchange rates. We base our estimates on historical experience and on various assumptions that we believe to be reasonable under the circumstances, the results of which form the basis for making judgments about the carrying values of assets and liabilities that are not readily apparent from other sources. Any future changes to these estimates and assumptions could cause a material change to our reported amounts of revenues, expenses, assets and liabilities. Actual results may differ from these estimates under different assumptions or conditions. While our significant accounting policies are described in Note 3 to our consolidated financial statements, we believe the following accounting policies are the most critical to aid you in fully understanding and evaluating our financial statements and our management’s discussion and analysis.
The preparation of financial statements in conformity with US GAAP requires management to make certain estimates and assumptions that affect the reported amounts of assets and liabilities and disclosure of contingent assets and liabilities at the date of the financial statements and the reported amounts of revenues and expenses during the reporting period. Actual results could differ from those estimates. Significant estimates include collectability of accounts receivable and recoverability of long-term assets.
Allowance for Doubtful Accounts
The Company maintains reserves for potential credit losses on accounts receivable. Management reviews the composition of accounts receivable and analyzes historical bad debts, customer concentrations, customer credit worthiness, current economic trends and changes in customer payment patterns to evaluate the adequacy of these reserves.
Revenue Recognition
Revenue is recognized when persuasive evidence of an arrangement exists, delivery has occurred, the fee is fixed or determinable, and collectability is probable. Revenue generally is recognized net of allowances for returns and any taxes collected from customers and subsequently remitted to governmental authorities.
Concentration of Credit Risk
Financial instruments that potentially subject the Company to concentrations of credit risk are cash, accounts receivable and other receivables arising from its normal business activities. The Company places its cash in what it believes to be credit-worthy financial institutions. The Company has a diversified customer base, most of which are in Australia. The Company controls credit risk related to accounts receivable through credit approvals, credit limits and monitoring procedures. The Company routinely assesses the financial strength of its customers and, based upon factors surrounding the credit risk, establishes an allowance, if required, for uncollectible accounts and, as a consequence, believes that its accounts receivable credit risk exposure beyond such allowance is limited.
Cost of Revenue
Cost of revenue includes; programs licensed; operating costs including costs of funds and related product support service centers to drive traffic to our websites, costs incurred to support and maintain products and services, including inventory valuation adjustments; costs associated with the delivery of consulting services; and the amortization of capitalized intangible software costs. Capitalized intangible software costs are amortized over the estimated lives of the products.
Exchange (Loss) Gain
During the years ended June 30, 2015 and 2014, the transactions of Moneytech and its wholly owned subsidiaries were denominated in foreign currency and were recorded in Australian dollar (AUD) at the rates of exchange in effect when the transactions occurred. Exchange gains and losses are recognized for the different foreign exchange rates applied when the foreign currency assets and liabilities are settled.
Foreign Currency Translation and Comprehensive (Loss) Income
The accounts of Moneytech and its wholly owned subsidiaries were maintained, and its financial statements were expressed, in AUD. Such financial statements were translated into USD with the AUD as the functional currency. All assets and liabilities were translated at the exchange rate at the balance sheet date, stockholder’s equity is translated at the historical rates and income statement items are translated at the average exchange rate for the period. Transactions in foreign currencies are initially recorded at the functional currency rate ruling at the date of transaction. Any differences between the initially recorded amount and the settlement amount are recorded as a gain or loss on foreign currency transaction in the consolidated statements of operations. The resulting translation adjustments are reported under other comprehensive income as a component of shareholders’ equity.
| 34 |
Recently Issued Accounting Pronouncements
In April 2015, the FASB issued ASU 2015-03, Simplifying the Presentation of Debt Issuance Costs which changes the presentation of debt issuance costs in financial statements. ASU 2015-03 requires an entity to present such costs in the balance sheet as a direct deduction from the related debt liability rather than as an asset. Amortization of the costs will continue to be reported as interest expense. It is effective for fiscal years and interim periods within those fiscal years beginning after December 15, 2015. Early adoption is permitted. The new guidance will be applied retrospectively to each prior period presented. The Company has early adopted this pronouncement, there is no impact on comparative periods.
In July 2015, the FASB issued ASU 2015-11, Inventory — Simplifying the Measurement of Inventory. ASU 2015-11 requires inventory to be subsequently measured using the lower of cost and net realizable value, thereby eliminating the market value approach. Net realizable value is defined as the “estimated selling prices in the ordinary course of business, less reasonably predictable costs of completion, disposal and transportation.” ASU 2015-11 is effective for reporting periods beginning after December 15, 2016 and is applied prospectively. Early adoption is permitted. The Company is evaluating the impact, if any, of adopting this new accounting guidance on its financial statements.
Other recent accounting pronouncements issued by the FASB, including its Emerging Issues Task Force, the American Institute of Certified Public Accountants, and the Securities and Exchange Commission did not or are not believed by management to have a material impact on the Company's present or future consolidated financial statements.
Item 7A. Quantitative and Qualitative Disclosures About Market Risk.
Not applicable because we are a smaller reporting company.
Item 8. Financial Statements and Supplementary Data.
The financial statements start on page F-1.
Item 9. Changes in and Disagreements with Accountants on Accounting and Financial Disclosure.
None
Item 9A. Controls and Procedures.
Evaluation of Disclosure Controls and Procedures
Our
management is responsible for maintaining disclosure controls and procedures that are designed to ensure that information required
to be disclosed in the reports that the Company files or submits under the Securities Exchange Act of 1934 (the “Exchange
Act”) is recorded, processed, summarized and reported within the time periods specified in the Securities and Exchange Commission’s
rules and forms. In addition, the disclosure controls and procedures must ensure that such information is accumulated and communicated
to the Company’s management, including its Chief Executive Officer and Chief Financial Officer, as appropriate, to allow
timely decisions regarding required financial and other required disclosures.
At June 30, 2015, an evaluation of the effectiveness of our disclosure controls and procedures (as defined in Rules 13(a)-15(e) and 15(d)-15(e) of the Securities Exchange Act of 1934 (the “Exchange Act”)) was carried out under the supervision and with the participation of Hugh Evans, our Chief Executive Officer, and Brian Pullar, our Chief Financial Officer. Based on their evaluation of our disclosure controls and procedures, they concluded that at June 30, 2015, such disclosure controls and procedures were effective.
Management’s Annual Report on Internal Control over Financial Reporting
Our management is responsible for establishing and maintaining adequate internal control over our financial reporting. Internal control over financial reporting is a process designed to provide reasonable assurance to our management and board of directors regarding the reliability of financial reporting and the preparation of financial statements for external purposes in accordance with U.S. generally accepted accounting principles.
| 35 |
Our internal control over financial reporting includes those policies and procedures that (i) pertain to the maintenance of records that in reasonable detail accurately and fairly reflect our transactions; (ii) provide reasonable assurance that transactions are recorded as necessary for preparation of our financial statements; (iii) provide reasonable assurance that receipts and expenditures of company assets are made in accordance with management authorization; and (iv) provide reasonable assurance that unauthorized acquisition, use or disposition of company assets that could have a material effect on our financial statements would be prevented or detected on a timely basis.
Because of its inherent limitations, internal control over financial reporting may not prevent or detect misstatements. Also, projections of any evaluation of effectiveness to future periods are subject to the risk that controls may become inadequate because changes in conditions may occur or the degree of compliance with the policies or procedures may deteriorate.
Our management has conducted an evaluation, under the supervision and with the participation of Hugh Evans, our Chief Executive Officer, and Brian Pullar, our Chief Financial Officer, of the effectiveness of our internal controls over financial reporting as of June 30, 2015. This evaluation was based on criteria set forth by the Committee of Sponsoring Organizations of the Treadway Commission, or COSO, Internal Control-Integrated Framework. Based upon such assessment, they concluded that our internal controls over financial reporting were effective as of June 30, 2015.
This Report shall not be deemed to be filed for purposes of Section 18 of the Securities Exchange Act of 1934, or otherwise subject to the liabilities of that section, and is not incorporated by reference into any filing of the Company, whether made before or after the date hereof, regardless of any general incorporation language in such filing.
This annual report does not include an attestation report of our registered public accounting firm regarding internal control over financial reporting. The rules of the Securities and Exchange Commission do not require an attestation of the Management’s report by our registered public accounting firm in this annual report.
Changes in Internal Controls
There have been no changes in our internal control over financial reporting that occurred during the fourth quarter of our fiscal year ended June 30, 2015 that have materially affected, or are reasonable likely to materially affect, our internal control over financial reporting. Given the limitations of our accounting personnel, we need to take additional steps to insure that our financial statements are in accordance with US GAAP.
None.
| 36 |
Item 10. Directors, Executive Officers and Corporate Governance.
Our directors and executive officers are:
| Name | Age | Position | ||
| Hugh Evans | 51 | President, Chief Executive Officer and a Director | ||
| Brian M. Pullar | 44 | Chief Financial Officer | ||
| Klaus Selinger | 62 | Chairman of the Board | ||
| John Wolfgang | 68 | Director |
Hugh Evans has served as Chief Executive Officer, President, Chief Financial Officer and a Director of the Company since June 30, 2013. Mr. Evans founded Moneytech in 2003, and has served as its Chairman and Managing Director since its inception. Mr. Evans has a commercial background in high growth businesses, mergers and acquisitions, and divestments, with a strong financial, sales and technology focus.
Mr. Evans was the founder and CEO of Agate Technology, which he developed and built to become a leading niche storage distribution company in both Australia and New Zealand. Mr. Evans served as Chief Executive Officer of Agate Technology from 1991 to 1999. Agate Technology was acquired by the South African conglomerate Siltek in 1999. Mr. Evans also has been responsible for the organization and sale of three other technology businesses. The prior experience of Mr. Evans as an executive officer and director of Moneytech Limited prior to the consummation of the Share Exchange qualifies him to serve as a director of our company.
Brian Pullar has been our Chief Financial officer since October 16, 2013. Mr. Pullar is a Chartered Accountant (Australia and South Africa) with nearly twenty years of experience in financial services. He was a Senior Vice President at Citigroup in Australia, where he worked from June 2000 until January 2013. Having joined as an accountant within the finance function, his responsibilities subsequently included Regulatory Reporting Manager (2.5 years), Financial Controller (4 years) and Product Controller (3 years). He worked across the institutional stock broking / advisory, corporate and retail banking businesses.
Prior to Citigroup he worked in London with Abbey National Treasury Services from September 1999 to April 2000, as a Project Accountant, with Warburg Dillon Read from October 1998 to May 1999, as a Consultant, and from July 1997 to June 1998, as a Market Risk Analyst with Credit Suisse Financial Products. From January 1994 to March 1997, Mr. Pullar was employed as a Trainee and Qualified Accountant by Ernst and Young in Johannesburg and Los Angeles.
Mr. Pullar’s skills include financial controlling, financial management, statutory accounts preparation, regulatory reporting and capital requirements for banks and broker dealers, as well as product accounting and control, financial and regulatory systems implementation and liaison with regulatory authorities.
Klaus Selinger has served as a Director since June 30, 2013 and Chairman of the Board since July 2013. He has a background in Financial Markets and Financial Systems, and has assisted in the development of complex financial solutions, including off-balance sheet finance structures, venture capital raising and equity finance. Since 2009, Mr. Selinger has been a principal of Dequity Partners, a financial services firm based in Sydney, Australia. Mr. Selinger was the Chief Executive Officer of Jacobsen Entertainment Ltd, an Australian entertainment industry firm, formerly listed on the Sydney Australia Stock Exchange, from 2002 to 2003, and Chief Executive Officer of Bioenergy Corporation Ltd, a PNG incorporated biofuel firm formerly listed on the Sydney Australia Stock Exchange, from 1989 to 1991. He is a certified practicing accountant in Australia and in that capacity served as a member of Charles J. Berg & Partners from 1972 to 1982, Mann Judd and Rowlands from 1984 to 1990.Mr. Selinger received a Bachelor of Business degree in Accounting from the University of Technology, Sydney, Australia. Mr. Selinger’s varied management experience with a number of listed companies qualifies him to serve as a director of our Company.
| 37 |
John Wolfgang has served as a Director since June 30, 2013. From January 1, 2014 until December 31, 2014, he was a Senior Consultant to UHY Advisors N.Y., Inc. For 45 years prior to January 1, 2014 Mr. Wolfgang was an audit partner of the accounting firm of UHY LLP or its predecessor and served on the management committee of UHY LLP, which sets policy for the audit practice of the firm, until December 31, 2012. Mr. Wolfgang has extensive experience in and has overseen the audits of listed public entities operating globally and has experience in advising businesses with multi-national presence on complex tax and accounting issues. Mr Wolfgang served on the Board of Directors of Urbach Hacker Young International Ltd (“UHYI”) for the past 26 years Until October 31, 2014. Mr. Wolfgang was Chairman of the UHYI Board for 5 years until October, 2012. UHYI is the 23rd largest global accounting and consulting networks with presence in 87 countries worldwide. Mr. Wolfgang serves as Chairman of the Audit Committee. Mr. Wolfgang is qualified to serve as a director by virtue of his experience in auditing public companies and serving on the boards of numerous private and public companies.
Each of our Directors is elected annually and serves until his successor is duly elected and qualified or until his earlier death, resignation or removal. Our officers are elected annually and serve at the discretion of our Board of Directors.
Director Independence
Our Board of Directors has determined that Klaus Selinger and John Wolfgang are "independent directors" within the meaning of NYSE MKT Rule 803A.
Board Committees
We maintain the following committees of the Board of Directors: the Audit Committee, the Compensation Committee and the Nominating Committee. Each committee is comprised of a majority of directors who are “independent” within the meaning of NYSE MKT Rule 803A. Each committee acts pursuant to a separate written charter, and each such charter has been adopted and approved by the Board of Directors. Copies of the committee charters are available on our website at sourcefinancial.com under the heading “Investor Relations.”
Audit Committee. Messrs. Wolfgang and Selinger are members of the Audit Committee. Mr. Wolfgang serves as Chairman of the Audit Committee and also qualifies as an "audit committee financial expert," as that term is defined in Item 407(d)(5)(ii) of Regulation S-K. The Board has determined that each member of our Audit Committee meets the financial literacy requirements under the Sarbanes-Oxley Act and SEC rules and the independence requirements under NYSE MKT Rule 803A. We did not have an Audit Committee prior to the acquisition of Moneytech on June 30, 2013.
Our Audit Committee is responsible for preparing reports, statements and charters required by the federal securities laws, as well as:
| ● | Overseeing and monitoring the integrity of our consolidated financial statements, our compliance with legal and regulatory requirements as they relate to financial statements or accounting matters, and our internal accounting and financial controls |
| ● | Preparing the report that SEC rules require be included in our annual proxy statement; |
| ● | Overseeing and monitoring our independent registered public accounting firm's qualifications, independence and Performance; |
| ● | Providing the Board with the results of its monitoring and its recommendations; and |
| ● | Providing to the Board additional information and materials as it deems necessary to make the Board aware of significant financial matters that require the attention of the Board. |
Compensation Committee. Messrs. Selinger (Chairman) and Wolfgang are members of the Compensation Committee.
The Compensation Committee is responsible for:
| ● | Establishing the Company’s general compensation policy, in consultation with the Company’s senior management, and overseeing the development and implementation of compensation programs |
| ● | Reviewing and approving corporate goals and objectives relevant to the compensation of the CEO, and evaluating the performance of the CEO at least annually in light of those goals and objectives and communicating the results of such evaluation to the CEO and the Board, and has the sole authority to determine the CEO’s compensation level based on this evaluation, subject to ratification by the independent directors on the Board. In determining the incentive component of CEO compensation, the Committee will consider, among other factors, the Company’s performance and relative stockholder return, the value of similar incentive awards to CEOs at comparable companies, the awards given to the CEO in past years, and such other factors as the Committee may determine to be appropriate. |
| ● | Reviewing and approving the compensation of all other executive officers of the Company, such other managers as may be directed by the Board, and the directors of the Company. |
| ● | Overseeing the Board’s benefit and equity compensation plans, overseeing the activities of the individuals and committees responsible for administering these plans, and discharging any responsibilities imposed on the Committee by any of these plans. |
| 38 |
| ● | Approving issuances under, or any material amendments to, any stock option or other similar plan pursuant to which a person not previously an employee or director of the Company, as an inducement material to the individual’s entering into employment with the Company, will acquire stock or options. |
| ● | In consultation with management, overseeing regulatory compliance with respect to compensation matters, including overseeing the Company’s policies on structuring compensation programs to preserve related tax objectives. |
| ● | Reviewing and approving any severance or similar termination payments proposed to be made to any current or former officer of the Company. |
| ● | Preparing an annual report on executive compensation for inclusion in our proxy statement for the election of directors, if required under the applicable SEC rules. |
Corporate Governance Committee. Messrs. Wolfgang (Chairman) and Selinger are members of the Corporate Governance Committee.
Our Corporate Governance Committee’s purpose is to ensure the Company has appropriate ethical standards and corporate governance policies and practices. The Committee is responsible for:
| ● | Governance policies in light of best practice, regulatory developments and the needs of the company including policies for continuous disclosure and dealings in securities. |
| ● | Delegation of authority to the CEO & Managing Director to facilitate an efficient and timely decision making process for managements day to day running of the business. |
Nominating Committee. Our Nominating Committee is composed of Messrs. Wolfgang and Selinger. The purpose of the Nominating Committee is to seek and nominate qualified candidates for election or appointment to our Board of Directors. The Nominating Committee will seek candidates for election and appointment that possess the integrity, leadership skills and competency required to direct and oversee the Company’s management in the best interests of its stockholders, customers, employees, communities it serves and other affected parties.
A candidate must be willing to regularly attend Committee and Board of Directors meetings, to develop a strong understanding of the Company, its businesses and its requirements, to contribute his or her time and knowledge to the Company and to be prepared to exercise his or her duties with skill and care. In addition, each candidate should have an understanding of all corporate governance concepts and the legal duties of a director of a public company.
Stockholders may contact the Nominating Committee Chairman, the Chairman of the Board or the Corporate Secretary in writing when proposing a nominee. This correspondence should include a detailed description of the proposed nominee’s qualifications and a method to contact that nominee if the Nominating Committee so chooses.
Stockholder Communications
Any stockholder who desires to contact any of our Directors can write to Source Financial, Inc., c/o Moneytech Limited, Level 6/97 Pacific Highway, North Sydney NSW 2060, Australia, Attention: Stockholder Relations. Your letter should indicate that you are a Source Financial, Inc. stockholder. Depending on the subject matter, our stockholder relations personnel will:
| ● | Forward the communication to the Director(s) to whom it is addressed |
| ● | Forward the communication to the appropriate management personnel |
| ● | Attempt to handle the inquiry directly, for example where it is a request for information about the Company, or it is a stock-related matter; or |
| ● | Not forward the communication if it is primarily commercial in nature or if it relates to an improper or irrelevant topic |
| 39 |
Director Compensation
| Name and Principal Position | Period | Year | Salary ($) | Bonus | Stock
awards | Option awards ($) | Non Equity Incentive Plan Information ($) | Nonqualified
deferred compensation earnings ($) | All other compensation ($) | Total ($) | ||||||||||||||||||||||||||||
| Klaus Selinger | 12 months | 2015 | 50,000 | - | - | 50,492 | - | - | - | 100,492 | ||||||||||||||||||||||||||||
| John Wolfgang | 12 months | 2015 | 60,000 | - | - | 50,492 | - | - | - | 110,492 | ||||||||||||||||||||||||||||
| Richard Allely | 10 months | 2015 | 41,667 | - | - | 42,077 | - | - | - | 83,743 | ||||||||||||||||||||||||||||
Employee directors do not receive any compensation for their services as directors. Non-employee directors receive an annual retainer of $50,000, and the Chairman of the Audit Committee receives an additional $10,000 per annum. Non-employee directors also are eligible to receive option grants from our company. The compensation committee will assist the directors in reviewing and approving the compensation structure for our directors. In addition, non-employee directors are entitled to be reimbursed for their actual travel expenses for each Board of Directors meeting attended.
On July 19, 2013, we granted options to purchase 75,000 shares of common stock pursuant to the 2013 Omnibus Incentive Plan to each of Messrs. Klaus Selinger, John Wolfgang and Richard Allely, our non-employee directors. The Options shall continue in force through June 30, 2020 (the "Expiration Date"), unless sooner terminated as provided herein and in the Plan. Subject to the provisions of the Plan, the right to exercise the Options shall vest as to 2,083 shares on September 30, 2013, and as to an additional 2,083 shares on the last day of each calendar month thereafter through and including August 31, 2016, except that the right to exercise the Options shall vest as to an additional 2,095 shares on August 31, 2016, and the exercise price per share of the Options vesting as of any date shall be $2.00. The options will vest immediately upon the occurrence of a Change in Control, as defined in the 2013 Omnibus Incentive Plan.
On September 9, 2015 our Board of Directors authorized the issuance of 160,000 restricted shares of common stock to Klaus Selinger, Chairman of our Board of Directors, for services rendered at a fair value of $0.40 per share.
On September 9, 2015, our Board of Directors granted options to purchase 75,000 shares of common stock pursuant to the 2013 Omnibus Incentive Plan to each of Messrs. Klaus Selinger and John Wolfgang, our non-employee directors. The options vest in monthly installments on the last day of each calendar month commencing October 31, 2015 until fully vested on September 30, 2016 and are exercisable to the extent vested commencing March 9, 2016 at an initial exercise price of $0.40 per share. The expiration date of the options is September 9, 2025. The options will vest immediately upon the occurrence of a Change in Control, as defined in the 2013 Omnibus Incentive Plan.
Risk Oversight
Enterprise risks are identified and prioritized by management and each prioritized risk is assigned to the full board for oversight. These risks include, without limitation, the following:
Risks and exposures associated with strategic, financial and execution risks and other current matters that may present material risk to our operations, plans, prospects or reputation.
Risks and exposures associated with financial matters, particularly financial reporting, tax, accounting, disclosure, internal control over financial reporting, financial policies, investment guidelines and credit and liquidity matters.
Risks and exposures relating to corporate governance; and management and director succession planning.
Risks and exposures associated with leadership assessment, and compensation programs and arrangements, including incentive plans.
Board Leadership Structure
The Chairman of the Board presides at all meetings of the Board. The Chairman is appointed on an annual basis by at least a majority vote of the remaining directors. Currently, the offices of Chairman of the Board and Chief Executive Officer are separated, with Klaus Selinger as Chairman of the Board and Hugh Evans as our Chief Executive Officer.
| 40 |
Section 16(a) Beneficial Ownership Reporting Compliance
Section 16(a) of the Securities Exchange Act of 1934 requires our directors, executive officers and beneficial owners of more than 10% of our common stock to file with the SEC reports of their holdings of, and transactions in, our common stock. Based solely upon our review of copies of such reports and written representations from reporting persons that were provided to us, we believe that our officers, directors and 10% stockholders complied with these reporting requirements with respect to our fiscal year ended June 30, 2015.
Code of Ethics
We have adopted a code of ethics that applies to our Chief Executive Officer and Chief Financial Officer containing written standards that are reasonably designed to deter wrongdoing and to promote:
| ● | Honest and ethical conduct, including the ethical handling of actual or apparent conflicts of interest between personal and professional relationships |
| ● | Full, fair, accurate, timely and understandable disclosure in reports and documents that the Company files with, or submits to, the Securities & Exchange Commission and in other public communications made by the Company |
| ● | Compliance with applicable governmental law, rules and regulations |
| ● | The prompt internal reporting of violations of the code to an appropriate person or persons identified in the code; and |
| ● | Accountability for adherence to the code |
Item 11. Executive Compensation
The following summary compensation table sets forth the total compensation earned by, paid to, or accrued for the year ended June 30, 2015 (“Fiscal 2015”), to our principal executive officer and the commercial director of Moneytech, our principal operating subsidiary, the only other individual whose total compensation was in excess of $100,000 for services rendered in all capacities for the year ended June 30, 2015 (“Fiscal 2015”).
Summary Compensation Table
| Name and Principal Position | Period | Year | Salary ($) | Bonus ($) | Stock awards ($) | Option awards ($) | Non
Equity Incentive Plan Information ($) | Nonqualified deferred compensation earnings ($) | All
other compensation ($) | Total ($) | ||||||||||||||||||||||||||||
| Hugh Evans | 12 months | 2015 | 342,293 | - | - | - | - | - | 20,324 | 362,618, | 1 | |||||||||||||||||||||||||||
| (CEO) | 12 months | 2014 | 310,148 | - | - | - | - | - | 11,601 | 321,749 | 1 | |||||||||||||||||||||||||||
| Mark Cameron | 12 months | 2015 | 115,876 | - | - | - | - | - | 11,008 | 126,884 | ||||||||||||||||||||||||||||
| (Commercial Director, Moneytech) | 12 months | 2014 | 120,399 | - | - | - | - | - | 11,137 | 131,536 | ||||||||||||||||||||||||||||
| 1 | Of the amounts ascribed to Mr. Evans as salary in the table above, during the years ended June 30, 2015 and 2014, we paid a company controlled by Mr. Evans, $128,353 and $184,735, respectively. |
Executive Compensation Policies as They Relate to Risk Management
Moneytech has only been part of a public company since June 30, 2013. Its payment policies in respect of nearly all of its employees are still indicative of those associated with a private company in Australia. The Compensation Committee and Management have considered whether our compensation policies might encourage inappropriate risk taking by the Company’s executive officers and other employees. The Compensation Committee has determined that the current compensation structure aligns the interests of the executive officers with those of the Company without providing rewards for excessive risk taking by awarding a mix of fixed and performance based or discretionary bonuses with the performance based compensation focused on profits as opposed to revenue growth.
Of those employees which introduce new clients to the business or review the credit quality of clients, the compensation of credit analysts is all fixed and salesman are paid predominately fixed salaries with small monthly bonuses.
| 41 |
During the fiscal years ended June 30, 2015 and 2014, approximately 1.88% and 3.0%, respectively, of the total compensation paid to employees was paid in performance-based compensation, including commissions and bonuses.
Equity Awards; Option Exercises and Fiscal Year-End Option Value Table
None of the named executive officers exercised any stock options during the year ended June 30, 2015, or held any outstanding stock options as of June 30, 2015.
2013 Omnibus Incentive Plan
On April 8, 2013, we approved and adopted an Omnibus Incentive Plan, which reserved 2,500,000 shares of common stock. This plan was implemented to recognize and provide additional incentive to our directors, employees, consultants, advisors and affiliates to establish and sustain our growth and financial success.
On July 19, 2013, we granted options to purchase 75,000 shares of common stock pursuant to the 2013 Omnibus Incentive Plan to each of Messrs. Klaus Selinger, John Wolfgang and Richard Allely, our non-employee directors, at an exercise price of $2.00 per share. The options vest as to 2,083 shares on September 30, 2013, and as to an additional 2,083 shares on the last day of each calendar month thereafter through and including August 31, 2016, except that the right to exercise the options shall vest as to an additional 2,095 shares on August 31, 2016. The options will vest immediately upon the occurrence of a Change in Control, as defined in the 2013 Omnibus Incentive Plan. The options expire on June 30, 2020. In May 2015, Richard Allely resigned. At that time, 41,660 options had vested. Upon his resignation all vesting ceased and the vested options were subject to forfeiture if not exercised within three months of resignation. The vested options were not exercised within the three month period and those options were forfeited.
On September 9, 2015, our Board of Directors authorized the issuance of 960,000 restricted shares of common stock to Hugh Evans, our CEO, and 160,000 restricted shares of common stock to Klaus Selinger, Chairman of our Board of Directors, as stock awards for services rendered.
On September 9, 2015, our Board of Directors granted stock options to purchase a total of 2,225,000 shares of common stock to directors, officers and other employees pursuant to our 2013 Omnibus Stock Incentive Plan, including options to purchase 1,000,000 shares granted to Hugh Evans, our CEO, options to purchase 400,000 shares granted to Mark Cameron, Commercial Director of Moneytech Ltd., options to purchase 25,000 shares granted to Brian Pullar, our CFO, and options to purchase 75,000 shares granted to each of Klaus Selinger and John Wolfgang, non-employee directors. The options vest in monthly installments on the last day of each calendar month commencing October 31, 2015 until fully vested on September 30, 2017 (except that the options granted to Messrs. Selinger and Wolfgang become fully vested on September 30, 2016), and are exercisable to the extent vested commencing March 9, 2016 at an initial exercise price of $0.40 per share, except that the initial exercise price of the options granted to Mr. Evans is $0.44 per share. The options will vest immediately upon the occurrence of a Change in Control, as defined in the 2013 Omnibus Incentive Plan. The expiration date of all of the options is September 9, 2025.
Employment Agreements
Hugh Evans has served as Managing Director of Moneytech since March 1, 2004 pursuant to an Employment Agreement. The Employment Agreement provides for a salary of $250,000 per annum, plus commissions, including a guaranteed annual contribution equal to 9.25% of his salary to his superannuation fund. The Employment Agreement may be terminated by Moneytech or Mr. Evans upon four weeks prior written notice and Moneytech may terminate Mr. Evans employment immediately for cause (as defined in the Employment Agreement).
The Employment Agreement includes restrictive covenants which prohibit Mr. Evans personally or on behalf of any person, firm or company (other than the Moneytech Group):
(a) for a period of twelve months from the termination of his employment with Moneytech from (i) soliciting clients or customers of Moneytech and its subsidiaries (the “Moneytech Group”) within Australia or New Zealand for any business conducted by Moneytech Group, or (ii) soliciting, interfering with or endeavoring to entice away from Moneytech Group any person, firm or company who at any time during the term of his employment was a customer or client of Moneytech Group; and
(b) for a period of six months from the termination of his employment with Moneytech from (i) approaching, enticing, endeavoring to entice away from the Moneytech Group any person, firm or company which during the six months before such termination was a director, employee, consultant, agent, representative, associate or advisor to any company within the Moneytech Group, or (ii) accepting any employment, which would require Mr. Evans to reveal any confidential information of the Moneytech Group without Moneytech Group’s prior written consent.
| 42 |
Item 12. Security Ownership of Certain Beneficial Owners and Management and Related Stockholder Matters.
Security Ownership
The following table sets forth information about the beneficial ownership of our common stock as of September 11, 2015 by:
| ● | each person known to us to be the beneficial owner of more than 5% of our common stock and our series B preferred stock, our only voting securities |
| ● | each named executive officer |
| ● | each of our directors; and |
| ● | all of our executive officers and directors as a group |
Unless otherwise noted below, the address of each beneficial owner listed on the table is c/o Source Financial, Inc., Level6/97 Pacific Highway, North Sydney NSW 2060, Australia. We have determined beneficial ownership in accordance with the rules of the SEC. Except as indicated by the footnotes below, we believe, based on the information furnished to us, that the persons and entities named in the tables below have sole voting and investment power with respect to all shares of common stock that they beneficially own, subject to applicable community property laws, where applicable.
In computing the number of shares of common stock beneficially owned by a person and the percentage ownership of that person, we deemed outstanding shares of common stock subject to options or warrants held by that person that are currently exercisable or exercisable within 60 days of September 11, 2015. We, however, did not deem these shares outstanding for the purpose of computing the percentage ownership of any other person.
Applicable percentage voting power is based on 8,791,632 shares of common stock and 5,000 shares of Series B Preferred Stock outstanding on September 11, 2015. Holders of the Company’s Series B Shares are entitled to elect a majority of our Board of Directors through June 30, 2018 and vote together with holders of common stock as a single class on all matters presented to holders of our common stock, with each vote per Series B Share equal to 1,000 shares of common stock.
| 43 |
| Shares Beneficially Owned | ||||||||||||||||||||
| Common Stock | Series B Preferred Stock | |||||||||||||||||||
| Shares | Percent | Shares | Percent | Voting Power (1) | ||||||||||||||||
| Directors and Named Executive Officers: | ||||||||||||||||||||
| Hugh Evans | 3,061,650 | (2) | 34.82 | % | 5,000 | 100 | % | 58.45 | % | |||||||||||
| Klaus Selinger | 214,158 | (3) | 2.36 | % | - | - | 1.52 | % | ||||||||||||
| John Wolfgang | 54,158 | (4) | 0.60 | % | - | - | 0.39 | % | ||||||||||||
| Mark Cameron | 0 | (5) | 0.00 | % | - | - | 0.00 | % | ||||||||||||
| All directors and executive officers as a group (5 persons, 3 of whom own shares) | 3,329,966 | (2)(3)(4) | 36.75 | % | 5,000 | 100 | % | 59.25 | % | |||||||||||
| Holders of More than 5% | ||||||||||||||||||||
| Christopher John Taylor and Angus James Taylor ATF CTJ Super Fund (549,590) Christopher John Taylor and Angus James Taylor ATF The Taylor Family Superannuation Fund No.2 (80,090) | 629,680 | 7.16 | % | 4.57 | % | |||||||||||||||
* Less than 1%
| (1) | Percentage total voting power represents voting power with respect to all shares of our common stock and Series B preferred stock, as a single class. Except as provided in the certificate of designation creating the Series B preferred stock or as may be required by law, the holder of Series B Shares and holders of common stock vote together as a single class on all matters upon which holders of common stock are entitled to vote with holders of Series B Shares entitled to 1,000 votes per share of Series B Shares through June 30, 2018 and each holder of common stock entitled to one vote per share of common stock. The holder(s) of Series B Shares are entitled to elect a majority of the members of our Board of Directors through June 30, 2018. |
| (2) | Includes 960,000 shares registered in the name of Mr. Evans, 2,001,514 shares of common stock registered in the name of BIX Holdings Pty Ltd ATF The Atherstone Trust & The Evans Family Superannuation Trust, a family trust of which Mr. Evans is the trustee and 100,136 shares owned by his wife. Does not include 41,640 shares which Mr Evans may acquire when he is first eligible to exercise options granted on March 9, 2016, that will have vested within 60 days and 8,328 shares which his wife may acquire, when she is first eligible to exercise options granted on March 9, 2016, that will have vested within 60 days. |
| (3) | Consists of 160,000 shares registered in the name of Mr. Selinger and 54,158 shares which he may acquire within 60 days upon exercise of options at an exercise price of $2.00 per share. Does not include 6,250 shares which Mr Selinger may acquire when he is first eligible to exercise options granted on March 9, 2016, that will have vested within 60 days. |
| (4) | Represents shares that may be acquired upon exercise of options at an exercise price of $2.00 per share. Does not include 6,250 shares which Mr Wolfgang may acquire when he is first eligible to exercise options granted on March 9, 2016, that will have vested within 60 days. |
| (5) | Does not include 16,656 shares which Mr Cameron may acquire when he is first eligible to exercise options granted on March 9, 2016, that will have vested within 60 days. |
Item 13. Certain Relationships and Related Transactions, and Director Independence
The following is a summary of material provisions of various transactions we have entered into with our executive officers, directors (including nominees), 5% or greater stockholders and any of their immediate family members or entities affiliated with them since July 1, 2013. We believe the terms and conditions set forth in such agreements are reasonable and customary for transactions of this type.
In the years ended June 30, 2015, 2014 and 2013 we paid a company controlled by Mr. Evans $128,353, $226,076 and $209,500, respectively. Of the amounts paid to a company controlled by Mr. Evans in the years ended June 30, 2015, 2014 and 2013, $128,353, $184,735 and $163,289, respectively, related to the salary due him and attributed to him in the summary compensation table above.
Approval of Related-Party Transactions
Transactions by us with related parties are subject to a formal written policy, as well as regulatory requirements and restrictions. Our policy has been revised to ensure compliance with all applicable requirements of the SEC concerning related-party transactions.
| 44 |
Under our policy, our directors and director nominees, executive officers and holders of more than 5% of our common stock, including their immediate family members, are not be permitted to enter into a related party transaction with us, as described below, without the consent of our Audit Committee. Any request for us to enter into a transaction in which the amount involved exceeds $120,000 and any such party has a direct or indirect material interest, subject to certain exceptions will be required to be presented to our Audit Committee for review, consideration and approval. Management will be required to report to our Audit Committee any such related party transaction and such related party transaction will be reviewed and approved or disapproved by the disinterested members of our Audit Committee.
Director Independence
Our Board of Directors has determined that Klaus Selinger and John Wolfgang are "independent directors" within the meaning of NYSE MKT Rule 803A.
Item 14. Principal Accounting Fees and Services.
The following is a summary of the fees billed to us Lichter Yu and Associates for professional services rendered for the fiscal years ended June 30, 2015 and 2014:
| Fiscal Year Ended | ||||||||
| June
30, 2015 | June
30, 2014 | |||||||
| Audit Fees | $ | 90,000 | $ | 85,000 | ||||
| Audit Related Fees | $ | 3,857 | $ | 3,857 | ||||
| Tax Fees | $ | 5,800 | $ | 5,800 | ||||
| All Other Fees | - | - | ||||||
| $ | 99,657 | $ | 95,157 | |||||
Audit Fees. Consists of fees billed for professional services rendered for the audit of our consolidated financial statements and review of interim consolidated financial statements included in quarterly reports and services that are normally provided in connection with statutory and regulatory filings or engagements.
Audit Related Fees. Consists of fees billed for assurance and related services that are reasonably related to the performance of the audit or review of our consolidated financial statements and are not reported under "Audit Fees".
Tax Fees. Consists of fees billed for professional services for tax compliance, tax advice and tax planning. These services include preparation of federal and state income tax returns.
All Other Fees. Consists of fees for product and services other than the services reported above.
Board of Directors' Pre-Approval Policies
Our Board of Directors' policy is to pre-approve all audit and permissible non-audit services provided by the independent auditors. These services may include audit services, audit related services, tax services, and other services. Pre-approval is generally provided for up to one year, and any pre-approval is detailed as to the particular service or category of services and is generally subject to a specific budget. The independent auditors and management are required to periodically report to the Board of Directors regarding the extent of services provided by the independent auditors in accordance with this pre-approval and the fees for the services performed to date. The Board of Directors may also pre-approve particular services on a case-by-case basis.
Our Board of Directors has reviewed and discussed with Lichter, Yu and Associates., our audited consolidated financial statements contained in this Annual Report on Form 10-K for the fiscal years ended June 30, 2015 and 2014. The Board of Directors also has discussed with Lichter, Yu and Associates the matters required to be discussed pursuant to SAS No. 61 (Codification of Statements on Auditing Standards, AU Section 380), which includes, among other items, matters related to the conduct of the audit of our consolidated financial statements.
Our Board of Directors has received and reviewed the written disclosures and the letter from Lichter, Yu and Associates required by Independence Standards Board Standard No. 1 (Independence Discussions with Audit Committees), and has discussed with Lichter, Yu and Associates its independence from our company.
Our Board of Directors has considered whether the provision of services other than audit services is compatible with maintaining auditor independence. Based on the review and discussions referred to above, the Board of Directors determined that the audited consolidated financial statements be included in our Annual Report on Form 10-K for our fiscal year ended June 30, 2015 for filing with the SEC.
| 45 |
Item 15. Exhibits, Financial Statement Schedules.
(a) The following documents are filed as part of this report:
(1) Financial Statements
The audited consolidated balance sheet of the Company and its subsidiaries as of June 30, 2015 and June 30, 2014, the related condensed statements of operations, changes in stockholders’ equity and cash flows for the years then ended, the footnotes thereto, and the report of Lichter, Yu and Associates, independent auditors, are filed herewith.
(2) Financial Statement Schedules: None
(3) Exhibits:
Exhibit Number |
Description | |
| 2.1 | Agreement and Plan of Merger dated February 10, 2012 (incorporated by reference to Exhibit 2.1 to Current Report on Form 8-K filed on February 14, 2012). | |
| 2.2 | Share Exchange Agreement (incorporated by reference to Exhibit 2.2 to Amendment No. 1 to Registration Statement on Form S-1 (File No. 333-196225) filed on August 4, 2014). | |
| 3.1 | Amended and Restated Certificate of Incorporation (incorporated by reference to Exhibit 3.1 to Annual Report on Form 10-K filed on October 15, 2013). | |
| 4.1 | Form of 12% convertible promissory note (incorporated by reference to Exhibit 4.1 to Annual Report on Form 10-K filed on May 1, 2013). | |
| 10.1 | Employment Agreement between Moneytech and Hugh Evans (incorporated by reference to Exhibit 10.1 to Annual Report on Form 10-K filed on October 15, 2013). | |
| 10.2 | Employment Agreement between WikiTechnologies and Edward DeFeudis (incorporated by reference to Exhibit 10.2 to Annual Report on Form 10-K filed on October 15, 2013). | |
| 10.3 | Employment Agreement between WikiTechnologies and Marco Garibaldi (incorporated by reference to Exhibit 10.3 to Annual Report on Form 10-K filed on October 15, 2013). | |
| 10.4 | Receivables Purchase Agreement, as amended (incorporated by reference to Exhibit 10.4 to Annual Report on Form 10-K filed on October 15, 2013). | |
| 10.5 | Omnibus Incentive Plan (incorporated by reference to Exhibit 10.1 to Current Report on Form 8-K filed on April 9, 2013). | |
| 10.6 | Restricted Stock Option Agreement effective May 9, 2013 with Edward DeFeudis (incorporated by reference to Exhibit 10.1 to Quarterly Report on Form 10-Q filed on August 5, 2013). | |
| 10.7 | Restricted Stock Option Agreement effective May 9, 2013 with Marco Garibaldi (incorporated by reference to Exhibit 10.2 to Quarterly Report on Form 10-Q filed on August 5, 2013). | |
| 10.8 | Stock Option Agreement dated July 19, 2013 with Klaus Selinger (incorporated by reference to Exhibit 10.8 to Annual Report on Form 10-K filed on October 15, 2013). | |
| 10.9 | Stock Option Agreement dated July 19, 2013 with John Wolfgang (incorporated by reference to Exhibit 10.9 to Annual Report on Form 10-K filed on October 15, 2013). | |
| 10.10 | Stock Option Agreement dated July 19, 2013 with Richard Allely (incorporated by reference to Exhibit 10.10 to Annual Report on Form 10-K filed on October 15, 2013). |
| 46 |
| 10.11 | Lease dated September 13, 2011 for Suites 101A and 101B, Level 6, 97-103 Pacific Highway, North Sydney, Australia (incorporated by reference to Exhibit 10.11 to Annual Report on Form 10-K filed on October 15, 2013). | |
| 10.12 | Lease dated July 25, 2013 for Suite 8, 842 Albany Highway, Victoria Park, Australia (incorporated by reference to Exhibit 10.12 to Annual Report on Form 10-K filed on October 15, 2013). | |
| 10.13 | Escrow Agreement (incorporated by reference to Exhibit 10.1 to Current Report on Form 8-K filed on July 5, 2013). | |
| 10.14 | Letter Agreement dated May 28, 2013 with Hugh Evans concerning Series B Preferred Stock (incorporated by reference to Exhibit 10.2 to Current Report on Form 8-K filed on June 5, 2013). | |
| 10.15 | Service Agreement dated April 19, 2013 by and among Source, WikiTechnologies and 24 Seven Technologies, Inc. (incorporated by reference to Exhibit 10.15 to Annual Report on Form 10-K filed on October 15, 2013). | |
| 10.16 | Consulting Agreement between Source and Market Street Investor Relations LLC, dated July 9, 2013 (incorporated by reference to Exhibit 10.16 to Annual Report on Form 10-K filed on October 15, 2013). | |
| 10.17 | Note Purchase Agreement with Robert Pearson dated October 31, 2012 (incorporated by reference to Exhibit 10.2 to Annual Report on Form 10-K filed on May 1, 2013). | |
| 10.18 | Note Cancellation Agreement dated November 15, 2012 (incorporated by reference to Exhibit 10.3 to Annual Report on Form 10-K filed on May 1, 2013). | |
| 10.19 | Separation Agreement dated February 11, 2014 (incorporated by reference to Exhibit 10.1 to Current Report on Form 8-K filed on February 18, 2014). | |
| 10.20 | Australian Financial Services License. (Incorporated by reference to Exhibit 10.20 to Annual Report on Form 10-K/A filed on May 1, 2014). | |
| 10.21 | Distributor Program Agreement between mPayments Pty Limited and Hubbed Pty Limited (incorporated by reference to Exhibit 10.21 to Annual Report on Form 10-K/A filed on May 1, 2014). | |
| 10.22 | Referral Agreement dated April 30, 2013 between Hubbed Pty Limited and Moneytech Services Pty Limited (incorporated by reference to Exhibit 10.22 to Annual Report on Form 10-K/A filed on May 1, 2014). | |
| 10.23 | Letter dated March 13, 2014 from Westpac extending and amending the Westpac Receivables Purchase Agreement. (Incorporated by reference to Exhibit 10.23 to Annual Report on Form 10-K/A filed on May 1, 2014). | |
| 10.24 | Tripartite Agreement dated January 13, 2013 by and among Moneytech Limited, Moneytech Services Pty Limited and 360 Markets Pty Limited (incorporated by reference to Exhibit 10.24 to Annual Report on Form 10-K/A filed on May 1, 2014). | |
| 10.25 | Authorised Representative Agreement dated September 3, 2012 between Moneytech Limited and 360 Pty Limited (incorporated by reference to Exhibit 10.25 to Annual Report on Form 10-K/A filed on May 1, 2014). |
| 10.26 | Employment Agreement dated April 7, 2014 between Moneytech Services Pty Limited and David Frost.(incorporated by reference to Exhibit 10.26 to Registration Statement on Form S-1 (File No. 333-196225) filed on May 23, 2014). | |
| 10.27 | Euler Hermes Insurance Policy (incorporated by reference to Exhibit 10.27 to Registration Statement on Form S-1 (File No. 333-196225) filed on May 23, 2014). | |
| 10.28 | Master Agreement entered into on May 28, 2014 by and among Moneytech Limited, Moneytech Services Pty Limited, 360 Markets Pty Limited and Jason Hugo. | |
| 14.1 | Code of Ethics (incorporated by reference to Exhibit 14.1 to Form 10-K/A filed on May 1, 2014). | |
| 16.1 | Letter from P.S. Stephenson & Co., P.C. (incorporated by reference to Exhibit 16.1 to Current Report on Form 8-K/A filed on September 27, 2013). |
| 47 |
| 21.1 | Subsidiaries (incorporated by reference to Exhibit 21.1 to Annual Report on Form 10-K/A filed on May 1, 2014). | |
| 31.1 | Certifications of Chief Executive Officer pursuant to Rule 13a-14(a) or 15d-14(a) under the Securities Exchange Act of 1934, as amended, as adopted pursuant to Section 302 of the Sarbanes-Oxley Act of 2002. | |
| 31.2 | Certifications of Chief Financial Officer pursuant to Rule 13a-14(a) or 15d-14(a) under the Securities Exchange Act of 1934, as amended, as adopted pursuant to Section 302 of the Sarbanes-Oxley Act of 2002. |
| 32.1 | Certifications of Chief Executive Officer pursuant to 18 U.S.C. SEC. 1350 (Section 906 of Sarbanes-Oxley Act of 2002) | |
| 32.2 | Certifications of Chief Financial Officer pursuant to 18 U.S.C. SEC. 1350 (Section 906 of Sarbanes-Oxley Act of 2002) |
| 101.INS | XBRL Instance Document | |
| 101.SCH | XBRL Taxonomy Extension Schema Document | |
| 101.CAL | XBRL Taxonomy Extension Calculation Linkbase Document | |
| 101.DEF | XBRL Taxonomy Extension Definition Linkbase Document | |
| 101.LAB | XBRL Taxonomy Extension Label Linkbase Document | |
| 101.PRE | XBRL Taxonomy Extension Presentation Linkbase Document |
| 48 |
SIGNATURES
Pursuant to the requirements of Section 13 or 15(d) of the Securities Exchange Act of 1934, the registrant has duly caused this report to be signed on its behalf by the undersigned, thereunto duly authorized.
| Source Financial, Inc. | ||
| By: | /s/ Hugh Evans | |
| Dated: September 17, 2015 | Hugh Evans | |
| President and Chief Executive Officer | ||
| (principal executive officer) | ||
| By: | /s/ Brian M. Pullar | |
| Dated: September 17, 2015 | Brian M. Pullar | |
| Chief Financial Officer | ||
| (principal financial and accounting officer) | ||
Pursuant to the requirements of the Securities Exchange Act of 1934, this report has been signed below by the following persons in the capacities on September 17, 2015.
| Signature | Title | |
| /s/ Hugh Evans | President, Chief Executive Officer and a Director | |
| Hugh Evans | (Principal Executive Officer) | |
| /s/ Brian Pullar | Chief Financial Officer (Principal Financial and | |
| Brian M. Pullar | Accounting Officer) | |
| /s/ Klaus Selinger | Chairman of the Board and a Director | |
| Klaus Selinger | ||
| /s/ John Wolfgang | Director | |
| John Wolfgang | ||
| 49 |
SOURCE FINANCIAL, INC. AND SUBSIDIARIES
CONSOLIDATED FINANCIAL STATEMENTS
JUNE 30, 2015
| F-1 |
INDEX TO CONSOLIDATED FINANCIAL STATEMENTS
SOURCE FINANCIAL, INC. AND SUBSIDIARIES
| Consolidated Financial Statements for the Years Ended June 30, 2015 and 2014 |
| F-2 |
LICHTER, YU AND ASSOCIATES, INC.
CERTIFIED PUBLIC ACCOUNTANTS
16133 VENTURA BLVD., SUITE 450
ENCINO, CALIFORNIA 91436
TEL (818)789-0265 FAX (818) 789-3949
Report of Independent Registered Public Accounting Firm
Board of Directors and Stockholders of
Source Financial, Inc. and Subsidiaries
We have audited the accompanying consolidated balance sheets of Source Financial, Inc. and Subsidiaries (the “Company”) as of June 30, 2015 and 2014, and the related consolidated statements of operations and comprehensive loss, stockholders’ equity, and cash flows for the years ended June 30, 2015 and 2014. These financial statements are the responsibility of the Company’s management. Our responsibility is to express an opinion on these financial statements based on our audits.
We conducted our audits in accordance with the standards of the Public Company Accounting Oversight Board (United States). Those standards require that we plan and perform the audit to obtain reasonable assurance about whether the financial statements are free of material misstatement. An audit includes examining, on a test basis, evidence supporting the amounts and disclosures in the financial statements. An audit also includes assessing the accounting principles used and significant estimates made by management, as well as evaluating the overall financial statement presentation. We believe that our audits provide a reasonable basis for our opinion.
In our opinion, the consolidated financial statements referred to above present fairly, in all material respects, the financial position of Source Financial, Inc. and Subsidiaries as of June 30, 2015 and 2014, and the results of their operations and their cash flows for the years ended June 30, 2015 and 2014, in conformity with accounting principles generally accepted in the United States of America.
/s/ Lichter, Yu and Associates, Inc.
Encino, California
September 15, 2015
| F-3 |
SOURCE FINANCIAL, INC. AND SUBSIDIARIES
| June
30, 2015 | June
30, 2014 | |||||||
| ASSETS | ||||||||
| CURRENT ASSETS | ||||||||
| Cash and cash equivalents | $ | 8,075,078 | $ | 10,730,743 | ||||
| Trade receivables, net | 19,651,268 | 24,870,297 | ||||||
| Terminal financing receivables, current, net | 111,364 | - | ||||||
| Inventories | 157,144 | 18,450 | ||||||
| Deferred tax asset | 230,400 | 282,600 | ||||||
| Other current assets | 779,851 | 837,705 | ||||||
| TOTAL CURRENT ASSETS | 29,005,105 | 36,739,795 | ||||||
| NON-CURRENT ASSETS | ||||||||
| Intangible assets, net | 2,914,253 | 3,632,536 | ||||||
| Deferred tax asset | 885,383 | 1,288,887 | ||||||
| Property, plant and equipment, net | 326,899 | 519,321 | ||||||
| Terminal financing receivables, non-current, net | 172,068 | - | ||||||
| Investment in equity affiliates | 681 | - | ||||||
| Goodwill | 58,071 | 71,227 | ||||||
| TOTAL NON-CURRENT ASSETS | 4,357,355 | 5,511,971 | ||||||
| TOTAL ASSETS | $ | 33,362,460 | $ | 42,251,766 | ||||
| LIABILITIES AND STOCKHOLDERS' EQUITY | ||||||||
| CURRENT LIABILITIES | ||||||||
| Trade and other payables | $ | 3,114,185 | $ | 7,023,958 | ||||
| Wholesale loan facility | 6,052,789 | 27,746,303 | ||||||
| Cash reserve | 1,257,984 | 878,747 | ||||||
| TOTAL CURRENT LIABILITIES | 10,424,958 | 35,649,008 | ||||||
| NON-CURRENT LIABILITIES | ||||||||
| Subordinated notes, net | 18,471,471 | - | ||||||
| Shareholder's loan | 38,392 | 47,100 | ||||||
| TOTAL NON-CURRENT LIABILITIES | 18,509,863 | 47,100 | ||||||
| TOTAL LIABILITIES | 28,934,821 | 35,696,108 | ||||||
| STOCKHOLDERS' EQUITY | ||||||||
| Preferred stock, $0.01 par value, 1,000,000 shares authorized, none issued and outstanding net | - | - | ||||||
| Designated as Series B Preferred stock, $0.01 par value, 5,000 shares authorized, 5,000 issued and outstanding | 50 | 50 | ||||||
| Common Stock, $0.001 par value, 50,000,000 shares authorized, 7,671,632 issued and outstanding at June 30, 2015 and 2014, respectively | 7,672 | 7,672 | ||||||
| Additional paid-in capital | 15,170,976 | 15,027,915 | ||||||
| Other accumulated comprehensive loss | (2,115,049 | ) | (864,766 | ) | ||||
| Accumulated deficit | (8,636,010 | ) | (7,615,213 | ) | ||||
| TOTAL STOCKHOLDERS' EQUITY | 4,427,639 | 6,555,658 | ||||||
| TOTAL LIABILITIES AND STOCKHOLDERS' EQUITY | $ | 33,362,460 | $ | 42,251,766 | ||||
The accompanying notes are an integral part of these consolidated financial statements
| F-4 |
SOURCE FINANCIAL, INC. AND SUBSIDIARIES
CONSOLIDATED STATEMENTS OF OPERATIONS AND COMPREHENSIVE LOSS
| Years ended | ||||||||
| June
30, 2015 | June
30, 2014 | |||||||
| Revenue | $ | 4,740,855 | $ | 5,810,936 | ||||
| Cost of revenue | 3,418,492 | 3,056,524 | ||||||
| Gross profit | 1,322,363 | 2,754,412 | ||||||
| Operating Expenses | ||||||||
| Compensation expenses | 1,242,789 | 1,060,905 | ||||||
| Research and development expense | 815,847 | 557,393 | ||||||
| Bad debt expenses | 58,788 | 795,112 | ||||||
| Bad debts recovered | (142,389 | ) | (3,234 | ) | ||||
| Professional expenses | 299,567 | 612,763 | ||||||
| Occupancy expenses | 227,048 | 250,651 | ||||||
| Depreciation expense | 56,115 | 61,716 | ||||||
| General and administration expenses | 366,344 | 371,808 | ||||||
| Total operating expenses | 2,924,109 | 3,707,114 | ||||||
| Loss from operations | (1,601,746 | ) | (952,702 | ) | ||||
| Other Income (Expense) | ||||||||
| Research and development grant | 630,696 | 617,922 | ||||||
| Interest income | 143,997 | 108,992 | ||||||
| Gain on equity method investment | 743 | - | ||||||
| Other income (expense) | (14,041 | ) | (12,121 | ) | ||||
| Total Other Income | 761,395 | 714,793 | ||||||
| Loss from continuing operations before income taxes | (840,351 | ) | (237,909 | ) | ||||
| Provision for income taxes | 180,446 | 327,539 | ||||||
| Net loss from continuing operations | (1,020,797 | ) | (565,448 | ) | ||||
| Net loss from discontinued operations | - | (301,280 | ) | |||||
| Net loss | (1,020,797 | ) | (866,728 | ) | ||||
| Other comprehensive (loss) income | ||||||||
| Foreign currency translation | (1,250,283 | ) | 214,996 | |||||
| Comprehensive loss | $ | (2,271,080 | ) | $ | (651,732 | ) | ||
| Net loss per share | ||||||||
| Basic and Diluted: | ||||||||
| Continuing operations | $ | (0.133 | ) | $ | (0.060 | ) | ||
| Discontinued | - | (0.032 | ) | |||||
| Total | $ | (0.133 | ) | $ | (0.092 | ) | ||
| Weighted average number of shares used in computing basic and diluted net (loss) per share: | ||||||||
| Basic | 7,671,632 | 9,402,356 | ||||||
| Diluted | 7,671,632 | 9,402,356 | ||||||
The accompanying notes are an integral part of these consolidated financial statements
| F-5 |
SOURCE FINANCIAL, INC. AND SUBSIDIARIES
CONSOLIDATED STATEMENTS OF STOCKHOLDERS’ EQUITY
| Common Stock | Preferred Stock | Additional Paid in | Comprehensive | Accumulated | Stockholders' | |||||||||||||||||||||||||||
| Shares | Amount | Shares | Amount | Capital | Loss | Deficit | Equity | |||||||||||||||||||||||||
| Balance June 30, 2013 | 10,300,000 | $ | 1,030,000 | 5,000 | $ | 50 | $ | 14,462,575 | $ | (1,079,762 | ) | $ | (6,748,485 | ) | $ | 7,664,378 | ||||||||||||||||
| Issuance of stock options | - | - | - | - | 194,979 | - | - | 194,979 | ||||||||||||||||||||||||
| Change in par value of shares | - | (1,019,700 | ) | - | - | 1,019,700 | - | - | - | |||||||||||||||||||||||
| Cancellation of stock | (150,000 | ) | (150 | ) | - | - | 150 | - | - | - | ||||||||||||||||||||||
| Cancellation of stock | (2,140,000 | ) | (2,140 | ) | - | - | (88,754 | ) | - | - | (90,894 | ) | ||||||||||||||||||||
| Cancellation of shares to be issued | (338,368 | ) | (338 | ) | - | - | (560,735 | ) | - | - | (561,073 | ) | ||||||||||||||||||||
| Net gain (loss) for the year ended June 30, 2014 | - | - | - | - | - | 214,996 | (866,728 | ) | (651,732 | ) | ||||||||||||||||||||||
| Balance June 30, 2014 | 7,671,632 | 7,672 | 5,000 | 50 | 15,027,915 | (864,766 | ) | (7,615,213 | ) | 6,555,658 | ||||||||||||||||||||||
| Issuance of stock options | - | - | - | - | 143,061 | - | - | 143,061 | ||||||||||||||||||||||||
| Net loss for the year ended June 30, 2015 | - | - | - | - | - | (1,250,283 | ) | (1,020,797 | ) | (2,271,080 | ) | |||||||||||||||||||||
| Balance June 30, 2015 | 7,671,632 | $ | 7,672 | 5,000 | $ | 50 | $ | 15,170,976 | $ | (2,115,049 | ) | $ | (8,636,010 | ) | $ | 4,427,639 | ||||||||||||||||
The accompanying notes are an integral part of these consolidated financial statements
| F-6 |
SOURCE FINANCIAL, INC. AND SUBSIDIARIES
CONSOLIDATED STATEMENTS OF CASH FLOWS
| Years ended | ||||||||
| June
30, 2015 | June
30, 2014 | |||||||
| Net loss | $ | (1,020,797 | ) | $ | (866,728 | ) | ||
| Net loss from discontinued operations | - | (301,280 | ) | |||||
| Net loss from continuing operations | (1,020,797 | ) | (565,448 | ) | ||||
| Adjustments to reconcile net loss to net cash (used in) provided by operating activities: | ||||||||
| Depreciation and amortization | 729,531 | 738,056 | ||||||
| Subordinated notes costs amortization | 41,839 | - | ||||||
| Stock options issued for compensation | 143,061 | 126,231 | ||||||
| Gain on equity method investment | (743 | ) | - | |||||
| (Increase) decrease in assets: | ||||||||
| Trade receivables, net | 682,133 | 782,645 | ||||||
| Inventories | (155,053 | ) | 203,687 | |||||
| Deferred tax asset | 180,508 | 327,547 | ||||||
| Financing receivables | (309,265 | ) | - | |||||
| Other assets | (100,568 | ) | 44,961 | |||||
| (Decrease) increase in current liabilities: | ||||||||
| Trade payables | (2,978,562 | ) | 3,157,082 | |||||
| Net cash (used in) provided by operating activities | (2,787,916 | ) | 4,814,761 | |||||
| Cash flows from investing activities | ||||||||
| Purchase of property, plant and equipment | (54,466 | ) | (127,266 | ) | ||||
| Development of intangible assets | (518,155 | ) | (753,547 | ) | ||||
| Net cash used in investing activities | (572,621 | ) | (880,813 | ) | ||||
| Cash flows from financing activities | ||||||||
| Wholesale loan facility, net | (18,078,542 | ) | 1,238,847 | |||||
| Capital Reserve | 590,914 | (1,890,240 | ) | |||||
| Proceeds from issuance of subordinated notes, net | 20,113,229 | - | ||||||
| Net cash provided by (used in) financing activities | 2,625,601 | (651,393 | ) | |||||
| Net cash (used in) provided by continuing operations | (734,936 | ) | 3,282,555 | |||||
| Cash flows from discontinued operations | ||||||||
| Net cash used in operating activities from discontinued operations | - | (209,381 | ) | |||||
| Net cash used in investing activities from discontinued operations | - | (5,907 | ) | |||||
| Net cash provided by financing activities from discontinued operations | - | 150,000 | ||||||
| Net cash used in discontinued operations | - | (65,288 | ) | |||||
| Effect of exchange rate changes on cash and cash equivalents | (1,920,729 | ) | 307,649 | |||||
| Net (decrease) increase in cash and cash equivalents | (2,655,665 | ) | 3,524,916 | |||||
| Cash and cash equivalents at beginning of period - continuing operations | 10,730,743 | 7,140,539 | ||||||
| Cash and cash equivalents at beginning of period - discontinued operations | - | 65,288 | ||||||
| Cash and cash equivalents at the end of the period | $ | 8,075,078 | $ | 10,730,743 | ||||
| Supplemental disclosures | ||||||||
| Cash paid during the period for: | ||||||||
| Income tax payments | $ | - | $ | - | ||||
| Interest payments | $ | 1,784,043 | $ | 1,695,288 | ||||
| Supplemental schedule of non-cash financing activities: | ||||||||
| Issuance of stock options | $ | 143,061 | $ | 115,492 | ||||
| Cancellation of shares to be issued and recorded as other liability | $ | - | $ | 560,735 | ||||
The accompanying notes are an integral part of these consolidated financial statements
| F-7 |
SOURCE FINANCIAL, INC. AND SUBSIDIARIES
NOTES TO CONSOLIDATED FINANCIAL STATEMENTS
Note 1 – BASIS OF PRESENTATION AND ORGANIZATION
Basis of Presentation
Source Financial, Inc., formerly known as The Wiki Group, Inc., (the “Company” or “Source”) was incorporated under the laws of the State of Delaware on June 24, 1988 as Windsor Capital Corp. Between March 2001 and January 2008 the Company amended and restated its Articles of Incorporation and changed its corporate name to Energy Control Technology, Inc., 5Fifty5.com, Inc., Swap-A-Debt, Inc., WikiLoan, Inc. and finally Wiki Group, Inc. on March 12, 2012.
Moneytech Limited (“Moneytech”) was incorporated under the laws of Australia on September 9, 2003, and (through its wholly owned subsidiaries Moneytech Finance Pty Ltd, mPayments Pty Ltd., Moneytech POS Pty Ltd. and Moneytech Services Pty Ltd.) offers working capital, trade and debtor finance solutions, to small and medium sized businesses in Australia.
On June 30, 2013, Source acquired Moneytech and its wholly owned subsidiaries, Moneytech Finance Pty. Ltd., mPayments Pty. Ltd., Moneytech POS Pty. Ltd. and Moneytech Services Pty. Ltd. pursuant to a Share Exchange Agreement. Under the terms of the Exchange Agreement, all stockholders of Moneytech received a total of 5,300,000 shares of voting common stock of Source in exchange for all outstanding shares of Moneytech. In addition, pursuant to a separate agreement, the President of Moneytech received 5,000 shares of Preferred Series B Stock. Under accounting principles generally accepted in the United States, the share exchange is considered to be a capital transaction in substance, rather than a business combination. That is, the share exchange is equivalent to the issuance of stock by Moneytech for the net monetary assets of Source accompanied by a recapitalization, and is accounted for as a change in capital structure. Accordingly, the accounting for the share exchange will be identical to that resulting from a reverse acquisition, except no goodwill will be recorded. Under share reverse takeover accounting, the post reverse acquisition comparative historical financial statements of the legal acquirer, Source are those of the legal acquiree, Moneytech, which is considered to be the accounting acquirer. Share and per share amounts stated have been retroactively adjusted to reflect the merger.
Organization
Moneytech delivers its product offerings through ‘The Moneytech Exchange’, which is a real-time core banking platform, developed in-house and which continues to be upgraded with the support of the Australian Federal Government’s Research and Development program.
The Moneytech Exchange serves as the backbone of its business in Australia by providing internet banking style access to Moneytech’s customers and serving as the back-office systems to Moneytech’s staff.
The Company offers a range of innovative financial products and services to businesses and consumers in Australia through its principal operating subsidiaries, Moneytech Limited, mPayments Pty Ltd and Moneytech POS Pty Ltd. In fiscal 2013, the Company formed a new corporation in the United States, Moneytech USA, Inc. It was inactive in fiscal 2014 and 2015.
When used in these notes, the terms "Company," "we," "our," or "us" mean Source Financial, Inc. and its subsidiaries.
Note 2 – DISCONTINUED OPERATIONS
In connection with the Share Exchange, two of our shareholders prior to consummation of the share exchange, deposited in escrow an aggregate of 2,240,000 shares of our common stock (the “Escrow Shares”), and we deposited in escrow all outstanding shares of the common stock of WikiTechnologies, Inc. (the “WTI Escrow Shares,”) our only operating subsidiary prior to the Share Exchange. The terms of the escrow arrangement were such that if WikiTechnologies failed to achieve certain financial benchmarks we could elect to retain the Escrow Shares by delivering the WTI Escrow Shares to the two shareholders.
On February 11, 2014, we entered into a Separation Agreement with the two shareholders, pursuant to which (i) the WTI Escrow Shares were delivered to them, as a result of which we no longer own any equity interest in WTI, and (ii) 2,140,000 of the GD Escrow Shares were cancelled, with the remaining 100,000 shares delivered to a noteholder of WTI (the “Noteholder”). The cancellation of the 2,140,000 shares effectively increased the percentage of our then outstanding shares owned by the former shareholders of Moneytech.
Revenue and expenses, and gains and losses relating to the discontinued business have been reclassified from the results of continuing operations and are reflected as net loss from discontinued operations in the statement of operations and comprehensive loss.
| F-8 |
As this is a non-reciprocal transfer of non-monetary assets with a certain group of shareholders, this transfer has been recorded at the fair value of the asset transferred. Management believes the net book value of the assets transferred, which is the same as the investment in Wiki Technologies, Inc., is the reasonable fair market value. It has been booked on transfer date at the recorded amount (less any impairment on assets distributed) in accordance with modifications of the basic principle of using Fair Value. As such no gain or loss on disposal has been reported.
The assets and liabilities and operating results of the discontinued operation are summarized as follows:
| NET RESULT FROM DISCONTINUED OPERATIONS | For the year ended | |||||||
| June 30 | ||||||||
| 2015 | 2014 | |||||||
| Revenue | $ | - | $ | 2,647 | ||||
| Cost of Revenue | - | 70,460 | ||||||
| Gross Loss | - | (67,813 | ) | |||||
| Operating Expenses | - | 234,027 | ||||||
| Loss from operations | - | (301,840 | ) | |||||
| Other income | - | 560 | ||||||
| Loss before tax | - | (301,280 | ) | |||||
| Tax | - | - | ||||||
| Loss after tax | $ | - | $ | (301,280 | ) | |||
The discontinued operations of Wiki Technologies, Inc. were reported in the United States of America segment in our geographic segment information as per Note 19.
Note 3 – SUMMARY OF SIGNIFICANT ACCOUNTING POLICIES
Principles of Consolidation
The consolidated financial statements include the accounts of Source Financial (“Source”) and its wholly owned subsidiaries Moneytech Limited (“Moneytech”), Moneytech Finance Pty Ltd, mPayments Pty Ltd., Moneytech POS Pty Ltd., Moneytech Services Pty Ltd and Moneytech USA, collectively referred to as the Company. All material intercompany accounts, transactions and profits were eliminated in consolidation.
Equity Investments
The Company uses the equity method of accounting for investments when the percentage of ownership of the investment is between 20% and 50%. The Company includes the proportionate share of the profit or loss as part of the carrying value of the investment.
Use of Estimates
The preparation of financial statements in conformity with US GAAP requires management to make certain estimates and assumptions that affect the reported amounts of assets and liabilities and disclosure of contingent assets and liabilities at the date of the financial statements and the reported amounts of revenues and expenses during the reporting period. Actual results could differ from those estimates. Significant estimates include collectability of accounts receivable, accounts payable, sales returns and recoverability of long-term assets.
Exchange (Loss) Gain
During the year ended June 30, 2015 and 2014, the transactions of Moneytech and its wholly owned subsidiaries were denominated in foreign currency and were recorded in Australian dollar (AUD) at the rates of exchange in effect when the transactions occurred. Exchange gains and losses are recognized for the different foreign exchange rates applied when the foreign currency assets and liabilities are settled.
Foreign Currency Translation and Comprehensive (Loss) Income
The accounts of Moneytech Limited and its wholly owned subsidiaries were maintained, and its financial statements were expressed, in AUD. Such financial statements were translated into USD with the AUD as the functional currency. All assets and liabilities were translated at the exchange rate at the balance sheet date, stockholders’ equity is translated at the historical rates and income statement items are translated at the average exchange rate for the period. Transactions in foreign currencies are initially recorded at the functional currency rate ruling at the date of transaction. Any differences between the initially recorded amount and the settlement amount are recorded as a gain or loss on foreign currency transaction in the consolidated statements of operations. The resulting translation adjustments are reported under other comprehensive income as a component of shareholders’ equity.
| F-9 |
Reportable Segment
The Company has one reportable segment. The Company’s activities are interrelated and each activity is dependent upon and supportive of the other. Accordingly, all significant operating decisions are based on analysis of financial products provided as a single business unit.
Revenue Recognition
Revenue is recognized when persuasive evidence of an arrangement exists, delivery has occurred, the fee is fixed or determinable, and collectability is probable. Revenue generally is recognized net of allowances for returns and any taxes collected from customers and subsequently remitted to governmental authorities.
Cost of Revenue
Cost of revenue includes: programs licensed, operating costs including costs of funds and related product support service centers to drive traffic to our websites, costs incurred to support and maintain products and services, including inventory valuation adjustments, costs associated with the delivery of consulting services, and the amortization of capitalized intangible software costs. Capitalized intangible software costs are amortized over the estimated lives of the products.
Research and Development
Research and development expenses include payroll, employee benefits, and other headcount-related expenses associated with product development. Research and development expenses also include third-party development and programming costs, localization costs incurred to translate software for international markets, and the amortization of purchased software code and services content. Such costs related to software development are included in research and development expense until the point that technological feasibility is reached, which for our software products is generally shortly before the products are put into service. Once technological feasibility is reached, such costs are capitalized and amortized to cost of revenue over the estimated lives of the products. Certain research and development costs are eligible for reimbursement by the Australian government. Research and development expense is included as an operating expense and research and development grant income is reported as other income.
Income Taxes
The Company uses the asset and liability method to account for income taxes as prescribed by Accounting Standards Codification (“ASC”) 740, Income Taxes. Deferred tax assets and liabilities are determined based on the difference between the financial statement and tax bases of assets and liabilities as measured by the enacted tax rates which will be in effect when these differences reverse. Deferred tax expense (benefit) is the result of changes in deferred tax assets and liabilities. Deferred income tax assets and liabilities are adjusted to recognize the effects of changes in tax laws or enacted tax rates in the period during which they are signed into law.
The Company may recognize the tax benefit from an uncertain tax position claimed on a tax return only if it is more likely than not that the tax position will be sustained on examination by the taxing authorities, based on the technical merits of the position. The tax benefits recognized in the financial statements from such a position should be measured based on the largest benefit that has a greater than 50% likelihood of being realized upon ultimate settlement. The authoritative standards issued by the Financial Accounting Standards Board (“FASB”) also provide guidance on de-recognition, classification, interest and penalties on income taxes, accounting in interim periods and requires increased disclosures. The factors used to assess the likelihood of realization are the Company’s forecast of future taxable income and available tax planning strategies that could be implemented to realize the net deferred tax assets. Under ASC 740, Income Taxes, a valuation allowance is required when it is more likely than not that all or some portion of the deferred tax assets will not be realized through generating sufficient future taxable income. Failure to achieve forecasted taxable income in applicable tax jurisdictions could affect the ultimate realization of deferred tax assets and could result in an increase in the Company’s effective tax rate on future earnings.
Concentration of Credit Risk
Financial instruments that potentially subject the Company to concentrations of credit risk are cash, accounts receivable and other receivables arising from its normal business activities. The Company places its cash in what it believes to be credit-worthy financial institutions. The Company has a diversified customer base, most of which are in Australia. The Company controls credit risk related to accounts receivable through credit approvals, credit limits and monitoring procedures. The Company routinely assesses the financial strength of its customers and, based upon factors surrounding the credit risk, establishes an allowance, if required, for uncollectible accounts and, as a consequence, believes that its accounts receivable credit risk exposure beyond such allowance is limited.
| F-10 |
Risks and Uncertainties
The Company is subject to risks from, among other things, competition associated with the industry in general, other risks associated with financing, liquidity requirements, rapidly changing customer requirements, limited operating history, foreign currency exchange rates and the volatility of public markets.
Contingencies
Loss contingencies, including litigation related contingencies, are included in the Consolidated Statements of Operations when the Company concludes that a loss is both probable and reasonably estimable. Legal fees related to litigation-related matters are expensed as incurred and included in the Consolidated Statements of Operations under the Selling, general and administrative line item. No amount for loss was recorded as of June 30, 2015 and 2014.
Cash and Cash Equivalents
The Company considers all highly liquid investments with original maturities less than or equal to three months at the date of purchase to be cash and cash equivalents. Cash and cash equivalents are stated at cost, which approximates fair value, and consist of bank deposits and certificates of deposit that are readily convertible into cash. The Company maintains its cash deposits and cash equivalents at well-known, stable financial institutions in Australia and not covered by insurance.
Allowance for Doubtful Accounts
The Company maintains reserves for potential credit losses on accounts receivable. Management reviews the composition of accounts receivable and analyzes historical bad debts, customer concentrations, customer credit worthiness, current economic trends and changes in customer payment patterns to evaluate the adequacy of these reserves.
Bad Debt Insurance
As a condition of the RPA (see Note 11) and Subordinated Notes (see Note 13), Moneytech maintains credit insurance on the receivables due Moneytech from its customers or their counterparties. Pursuant to this policy, Moneytech would bear the first $500,000 of aggregate losses incurred due to defaults in any calendar year, after which any bad debt losses are reimbursed by the insurance company. This policy is renewed annually. A receivable from the insurance company is recognized when the criteria set forth in the policy, inclusive of bad debt expenses in excess of $500,000 in any year, are met. The amount recorded as a receivable is offset against bad debt expense. As of June 30, 2015 and 2014, the Company had insurance claims receivables of $0 and $32,085, respectively.
Inventory
Inventories are valued at the lower of cost (determined on a weighted average basis) or market. Management compares the cost of inventories with the market value and allowance is made to write down inventories to market value, if lower. As of June 30, 2015 and 2014, inventory only consisted of finished goods.
Property, Plant & Equipment
Property and equipment is stated at cost and depreciated using the straight-line method over the shorter of the estimated useful life of the asset or the lease term. The estimated useful lives of our property and equipment are generally as follows:
| Computer software | 3 to 10 years |
| Computer hardware | 5 to 15 years |
| Furniture and equipment | 3 to 5 years |
As of June 30, 2015 and 2014, Property, Plant & Equipment consisted of the following:
| June 30 | June 30 | |||||||
| 2015 | 2014 | |||||||
| Office equipment | $ | 30,230 | $ | 37,079 | ||||
| Furniture and fixtures | 193,822 | 237,734 | ||||||
| Terminals | 45,483 | 87,319 | ||||||
| Computers and software | 1,177,253 | 1,365,207 | ||||||
| Accumulated Depreciation | (1,119,889 | ) | (1,208,018 | ) | ||||
| $ | 326,899 | $ | 519,321 | |||||
| F-11 |
For the years ended June 30, 2015 and 2014, depreciation expense consisted of the following:
| Years ended | ||||||||
| June 30 | ||||||||
| 2015 | 2014 | |||||||
| Depreciation, cost of revenue | $ | 103,642 | $ | 150,107 | ||||
| Depreciation, operating | 56,115 | 61,716 | ||||||
| Total depreciation expense | $ | 159,757 | $ | 211,823 | ||||
Fair Value of Financial Instruments
For certain of the Company’s financial instruments, including cash and equivalents, restricted cash, accounts receivable, accounts payable, accrued liabilities and short-term debt, the carrying amounts approximate their fair values due to their short maturities. ASC Topic 820, “Fair Value Measurements and Disclosures,” requires disclosure of the fair value of financial instruments held by the Company. ASC Topic 825, “Financial Instruments,” defines fair value, and establishes a three-level valuation hierarchy for disclosures of fair value measurement that enhances disclosure requirements for fair value measures. The carrying amounts reported in the consolidated balance sheets for receivables and current liabilities each qualify as financial instruments and are a reasonable estimate of their fair values because of the short period of time between the origination of such instruments and their expected realization and their current market rate of interest. The three levels of valuation hierarchy are defined as follows:
Level 1 inputs to the valuation methodology are quoted prices for identical assets or liabilities in active markets.
Level 2 inputs to the valuation methodology include quoted prices for similar assets and liabilities in active markets, and inputs that are observable for the asset or liability, either directly or indirectly, for substantially the full term of the financial instrument.
Level 3 inputs to the valuation methodology are unobservable and significant to the fair value measurement.
The Company analyzes all financial instruments with features of both liabilities and equity under ASC 480, “Distinguishing Liabilities from Equity,” and ASC 815.
As of June 30, 2015 and 2014, the Company did not identify any assets and liabilities that are required to be presented on the balance sheet at fair value.
Earnings per Share (EPS)
Basic EPS is computed by dividing income available to common shareholders and equivalents by the weighted average number of common shares and equivalents outstanding for the period. Diluted EPS is computed similar to basic net income per share except that the denominator is increased to include the number of additional common shares that would have been outstanding if all the potential common shares, warrants and stock options had been issued and if the additional common shares were dilutive. Diluted EPS is based on the assumption that all dilutive convertible shares and stock options were converted or exercised. Dilution is computed by applying the treasury stock method for the outstanding options and the if-converted method for the outstanding convertible preferred shares. Under the treasury stock method, options and warrants are assumed to be exercised at the beginning of the period (or at the time of issuance, if later), and as if funds obtained thereby were used to purchase common stock at the average market price during the period. Under the if-converted method, convertible outstanding instruments are assumed to be converted into common stock at the beginning of the period (or at the time of issuance, if later).
| F-12 |
The following table sets forth the computation of basic and diluted earnings per share for the years ended June 30, 2015 and 2014:
| Years ended | ||||||||
| June 30 | ||||||||
| 2015 | 2014 | |||||||
| Net loss from continuing operations | $ | (1,020,797 | ) | $ | (565,448 | ) | ||
| Net loss from discontinued operations | - | (301,280 | ) | |||||
| Net loss | $ | (1,020,797 | ) | $ | (866,728 | ) | ||
Weighted average number of shares used in computing basic and diluted net loss per share:
| Basic | 7,671,632 | 9,402,356 | ||||||
| Dilutive effect of stock options | - | - | ||||||
| Diluted | 7,671,632 | 9,402,356 |
| Year ended | ||||||||
| June 30 | ||||||||
| 2015 | 2014 | |||||||
| Net loss per share | ||||||||
| Basic and diluted: | ||||||||
| Continuing operations | $ | (0.133 | ) | $ | (0.060 | ) | ||
| Discontinued | - | (0.032 | ) | |||||
| Total | $ | (0.133 | ) | $ | (0.092 | ) | ||
Options to purchase up to 172,812 and 83,243 shares of common stock were anti-dilutive during the years ended June 30, 2015 and 2014 respectively.
Goodwill
Goodwill, which represents the excess of purchase price over the fair value of net assets acquired, is carried at cost. Goodwill is tested for impairment on an annual basis during the fourth quarter of each fiscal year or more frequently if events or changes in circumstances indicate that the asset might be impaired. The Company first performs a qualitative assessment to determine if the quantitative impairment test is required. If changes in circumstances indicate an asset may be impaired, the Company performs the quantitative impairment test. In accordance with accounting standards, a two-step quantitative method is used for determining goodwill impairment. In the first step, we determine the fair value of our reporting unit (generic pharmaceuticals). If the net book value of our reporting unit exceeds its fair value, we would then perform the second step of the impairment test which requires allocation of our reporting unit’s fair value to all of its assets and liabilities using the acquisition method prescribed under authoritative guidance for business combinations. Any residual fair value is allocated to goodwill. An impairment charge is recognized only if the implied fair value of our reporting unit’s goodwill is less than its carrying amount.
Intangible Assets
The Company records identifiable intangible assets at fair value on the date of acquisition and evaluates the useful life of each asset. Finite-lived intangible assets primarily consist of software development capitalized. Finite-lived intangible assets are amortized on a straight-line basis and are tested for recoverability if events or changes in circumstances indicate that their carrying amounts may not be recoverable. These intangibles have useful lives ranging from 1 to 10 years. No events or changes in circumstances indicate that impairment existed as of June 30, 2015.
Stock-Based Compensation
Stock-based compensation costs are recognized over the vesting period, using a straight-line method, based on the fair value of the instrument on the date of grant less an estimate for expected forfeitures. The Company uses the Black-Scholes valuation model to determine the fair value of stock options and the stock price on the grant date to value restricted stock. The Black-Scholes valuation model includes various assumptions, including the expected volatility, the expected life of the award, dividend yield, and the risk-free interest rate. These assumptions involve inherent uncertainties based on market conditions which are generally outside the Company’s control. Changes in these assumptions could have a material impact on share-based compensation costs recognized in the financial statements.
| F-13 |
Recently Issued Accounting Pronouncements
In April 2015, the FASB issued ASU 2015-03, Simplifying the Presentation of Debt Issuance Costs which changes the presentation of debt issuance costs in financial statements. ASU 2015-03 requires an entity to present such costs in the balance sheet as a direct deduction from the related debt liability rather than as an asset. Amortization of the costs will continue to be reported as interest expense. It is effective for fiscal years and interim periods within those fiscal years beginning after December 15, 2015. Early adoption is permitted. The new guidance will be applied retrospectively to each prior period presented. The Company has early adopted this pronouncement, there is no impact on comparative periods.
In July 2015, the FASB issued ASU 2015-11, Inventory — Simplifying the Measurement of Inventory. ASU 2015-11 requires inventory to be subsequently measured using the lower of cost and net realizable value, thereby eliminating the market value approach. Net realizable value is defined as the “estimated selling prices in the ordinary course of business, less reasonably predictable costs of completion, disposal and transportation.” ASU 2015-11 is effective for reporting periods beginning after December 15, 2016 and is applied prospectively. Early adoption is permitted. The Company is evaluating the impact, if any, of adopting this new accounting guidance on its financial statements.
Other recent accounting pronouncements issued by the FASB, including its Emerging Issues Task Force, the American Institute of Certified Public Accountants, and the Securities and Exchange Commission did not or are not believed by management to have a material impact on the Company's present or future consolidated financial statements.
Reclassification
Certain prior year amounts have been reclassified for consistency with the current period presentation. These reclassifications had no effect on the reported results of operations or cash flow.
Note 4 – TRADE RECEIVABLES, NET
Trade receivables consist principally of accounts receivable and trade financing and other financial services to small to medium sized businesses and individuals, principally in Australia. Trade receivables are recorded at the invoiced amount and net of allowances for doubtful accounts. Trade receivables bear interest. The allowance for doubtful accounts represents management’s estimate of the amount of probable credit losses in existing accounts receivable, as determined from a review of past due balances and other specific account data. The assessment includes actually incurred historical data as well as current economic conditions. Account balances are written off against the allowance when management determines the receivable is uncollectible.
Collectability of trade receivables is reviewed on an ongoing basis. Debts which are known to be uncollectable are written off by reducing the carrying amount directly. A provision for impairment of trade receivables is raised when there is objective evidence that the consolidated entity or parent entity will not be able to collect all amounts due according to the original terms of the receivables. Significant financial difficulties of the debtor, probability that the debtor will enter bankruptcy or financial reorganization and default or delinquency in payments (more than 30 days overdue) are considered indicators that the trade receivable may be impaired. The amount of the impairment allowance is the difference between the asset’s carrying amount and the present value of estimated future cash flows, discounted at the original effective interest rate. Cash flows relating to short-term receivables are not discounted if the effect of discounting is immaterial.
Trade receivables that are past their normal payment terms are overdue and once 30 days past due are considered delinquent. Minimum payment terms vary by product. The maximum payment term for all products is 122 days. All trade receivables that are overdue are individually assessed for impairment.
Trade receivables are placed on non-accrual status when legal action commences. Payments received while on non-accrual status will be allocated to the oldest amount outstanding. Accrual of interest will not resume until all amounts owing have been settled.
As of June 30, 2015 and 2014, trade receivables consist of the following:
| June 30 | June 30 | |||||||
| 2015 | 2014 | |||||||
| Trade receivables | $ | 20,231,293 | $ | 25,573,699 | ||||
| Allowance for bad debt | (580,025 | ) | (703,402 | ) | ||||
| Total trade receivables, net | $ | 19,651,268 | $ | 24,870,297 | ||||
| F-14 |
| AGE ANALYSIS OF PAST DUE TRADE | June 30 | June 30 | ||||||
| RECEIVABLES | 2015 | 2014 | ||||||
| 1 - 30 Days Past Due | $ | 665,728 | $ | 695,116 | ||||
| 31 - 60 Days Past Due | 86,328 | 59,212 | ||||||
| Greater than 60 Days Past Due | 916,106 | 890,205 | ||||||
| Total Past Due | 1,668,162 | 1,644,533 | ||||||
| Current | 18,563,131 | 23,929,166 | ||||||
| Total Trade Receivables | $ | 20,231,293 | $ | 25,573,699 | ||||
| Recorded Investment > 60 Days and accruing | $ | 268,375 | $ | 23,007 | ||||
| ALLOWANCE FOR DOUBTFUL DEBTS | Year ended | Year ended | ||||||
| June 30 | June 30 | |||||||
| 2015 | 2014 | |||||||
| Allowance for doubtful debts | ||||||||
| Beginning balance | $ | 703,402 | 731,475 | |||||
| Charge-offs | (26,199 | ) | (736,738 | ) | ||||
| Recoveries | - | - | ||||||
| Provision | 33,347 | 686,942 | ||||||
| Other comprehensive income (fx differences) | (130,525 | ) | 21,723 | |||||
| Ending balance | $ | 580,025 | $ | 703,402 | ||||
| Ending balance - individually evaluated for impairment | $ | 552,180 | $ | 667,508 | ||||
| Ending balance - collectively evaluated for impairment | $ | 27,845 | $ | 35,894 | ||||
Reconciliation to bad debts expense in the Statement of Operations
| Provision | $ | 33,347 | $ | 686,942 | ||||
| Other bad debt expenses / credits not reflected in provision | 25,441 | 108,169 | ||||||
| Bad debts expense per Statement of Operations | $ | 58,788 | $ | 795,111 |
Bad debt expenses not reflected in the provision include direct costs associated with pursuing an overdue receivable. If these costs are recovered they result in a credit.
| TRADE RECEIVABLE BALANCES ASSESSED FOR IMPAIRMENT | June 30 | June 30 | ||||||
| 2015 | 2014 | |||||||
| Ending balance | $ | 20,231,293 | $ | 25,573,699 | ||||
| Ending balance - individually evaluated for impairment | $ | 639,279 | $ | 1,079,337 | ||||
| Ending balance - collectively evaluated for impairment | $ | 19,592,014 | $ | 24,494,362 | ||||
| TRADE RECEIVABLES ON A NON ACCRUAL BASIS | June 30 | June 30 | ||||||
| 2015 | 2014 | |||||||
| Trade receivables | $ | 639,279 | $ | 1,079,337 | ||||
| Total Financing Receivables | $ | 639,279 | $ | 1,079,337 | ||||
| F-15 |
| IMPAIRED LOANS | June 30, 2015 | |||||||||||||||||||
| Recorded Investment | Unpaid principal balance | Related allowance | Average recorded investment | Interest income recognised | ||||||||||||||||
| With no allowance recorded | ||||||||||||||||||||
| Trade receivables | $ | - | $ | - | $ | - | $ | - | $ | - | ||||||||||
| $ | - | $ | - | $ | - | $ | - | $ | - | |||||||||||
| With an allowance recorded | ||||||||||||||||||||
| Trade receivables | $ | 639,279 | $ | 441,661 | $ | 552,180 | $ | 756,900 | $ | 8,478 | ||||||||||
| $ | 639,279 | $ | 441,661 | $ | 552,180 | $ | 756,900 | $ | 8,478 | |||||||||||
| Total | ||||||||||||||||||||
| Trade receivables | $ | 639,279 | $ | 441,661 | $ | 552,180 | $ | 756,900 | $ | 8,478 | ||||||||||
| $ | 639,279 | $ | 441,661 | $ | 552,180 | $ | 756,900 | $ | 8,478 | |||||||||||
| June 30, 2014 | ||||||||||||||||||||
| Recorded Investment | Unpaid principal balance | Related allowance | Average recorded investment | Interest income recognised | ||||||||||||||||
| With no allowance recorded | ||||||||||||||||||||
| Trade receivables | $ | - | $ | - | $ | - | $ | - | $ | - | ||||||||||
| $ | - | $ | - | $ | - | $ | - | $ | - | |||||||||||
| With an allowance recorded | ||||||||||||||||||||
| Trade receivables | $ | 1,079,337 | $ | 797,842 | $ | 667,508 | $ | 1,354,838 | $ | 78,488 | ||||||||||
| $ | 1,079,337 | $ | 797,842 | $ | 667,508 | $ | 1,354,838 | $ | 78,488 | |||||||||||
| Total | ||||||||||||||||||||
| Trade receivables | $ | 1,079,337 | $ | 797,842 | $ | 667,508 | $ | 1,354,838 | $ | 78,488 | ||||||||||
| $ | 1,079,337 | $ | 797,842 | $ | 667,508 | $ | 1,354,838 | $ | 78,488 | |||||||||||
Note 5 – TERMINAL FINANCING RECEIVABLES, NET
The Company, as lessor, entered into terminal lease agreements, which were recorded as sales type leases, during the year ended June 30, 2015. The following are balances due as of June 30, 2015 and June 30, 2014. The leases require monthly payments, have a term of 30 months and bear interest at an effective rate of 12.49% per annum.
| June 30 | June 30 | |||||||
| 2015 | 2014 | |||||||
| Current | $ | 111,364 | $ | - | ||||
| Non-current | 172,068 | - | ||||||
| $ | 283,432 | $ | - | |||||
| Terminal financing receivables repayments schedule. | ||||
| 12 months ended: | USD $ | |||
| June 30, 2016 | $ | 111,364 | ||
| June 30, 2017 | 125,273 | |||
| June 30, 2018 | 46,795 | |||
| $ | 283,432 | |||
| F-16 |
Note 6 – INVENTORY
Inventory consists of the following as of June 30, 2015 and 2014:
| June 30 | June 30 | |||||||
| 2015 | 2014 | |||||||
| Terminals | $ | 146,650 | $ | - | ||||
| Prepaid gift cards or other | 10,494 | 18,450 | ||||||
| $ | 157,144 | $ | 18,450 | |||||
Note 7 – OTHER ASSETS
Other assets consist of the following as of June 30, 2015 and 2014:
| June 30 | June 30 | |||||||
| 2015 | 2014 | |||||||
| Research & development grant receivable | $ | 555,289 | $ | 555,780 | ||||
| Insurance claim receivable | - | 32,085 | ||||||
| Prepayment | 53,561 | 43,697 | ||||||
| Other assets | 171,001 | 206,143 | ||||||
| $ | 779,851 | $ | 837,705 | |||||
Note 8 – INTANGIBLE ASSETS
Intangible assets consist of the following as of June 30, 2014 and 2015:
| June 30 | June 30 | |||||||
| 2015 | 2014 | |||||||
| Moneytech and mPayments software | $ | 5,874,178 | $ | 6,608,596 | ||||
| Accumulated amortization | (2,959,925 | ) | (2,976,060 | ) | ||||
| $ | 2,914,253 | $ | 3,632,536 | |||||
The intangible assets are amortized over 10-12 years. Amortization expense of $569,774 and $526,233 was included in cost of revenues for the years ended June 30, 2015 and 2014, respectively.
Amortization for the Company’s intangible assets over the next five fiscal years from June 30, 2015 is estimated to be:
| Years ending June 30, | ||||
| 2016 | $ | 544,412 | ||
| 2017 | 544,412 | |||
| 2018 | 544,412 | |||
| 2019 | 544,412 | |||
| 2020 | 544,412 | |||
| Thereafter | 192,193 | |||
| Total | $ | 2,914,253 | ||
Note 9 – GOODWILL
As of June 30, 2015 and 2014, the Goodwill was comprised of the following:
| June 30 | June 30 | |||||||
| 2015 | 2014 | |||||||
| Acquisition cost of Moneytech POS Pty Ltd. | $ | 82,560 | $ | 101,265 | ||||
| Fixed assets received | (45,994 | ) | (56,414 | ) | ||||
| Liability assumed | 21,505 | 26,376 | ||||||
| Acquisition cost assigned to goodwill | $ | 58,071 | $ | 71,227 | ||||
| F-17 |
Note 10 – TRADE AND OTHER PAYABLES
As of June 30, 2015 and 2014, trade and other payables consist of the following:
| June 30 | June 30 | |||||||
| 2015 | 2014 | |||||||
| Trade payables | $ | 1,923,404 | $ | 6,195,424 | ||||
| Accrued consulting costs | 561,073 | 561,073 | ||||||
| Employee benefits | 245,159 | 161,906 | ||||||
| Other liabilities | 384,549 | 105,555 | ||||||
| Total payables | $ | 3,114,185 | $ | 7,023,958 | ||||
Note 11 – LINE OF CREDIT AND CASH RESERVE LIABILITIES
| June 30 | June 30 | |||||||
| 2015 | 2014 | |||||||
| Wholesale loan facility | $ | 6,052,789 | $ | 27,746,303 | ||||
| Cash reserve liabilities | 1,257,984 | 878,747 | ||||||
| $ | 7,310,773 | $ | 28,625,050 | |||||
Wholesale Loan Facility
The Company had a secured line of credit under a Receivables Purchase Agreement (“RPA”) with a bank in Sydney Australia for up to AUD$25 million and AUD$40 million as of June 30, 2015 and June 30, 2014, respectively. The line of credit is secured mainly by trade receivables. Interest is charged at the bank’s reserve rate plus an agreed upon margin from the bank. The agreement is renewed annually on an agreed anniversary date, the latest of which was December 15, 2014. The facility has been renewed until December 31, 2015. Interest expense charged to cost of revenue related to the loan for the years ended June 30, 2015 and 2014 was approximately USD $1,412,578 and USD $1,695,288 respectively.
On April 10, 2015 the Company issued AUD $25 million of subordinated notes. Subsequent to the issue of the subordinated notes, as of April 16, 2015, the RPA interim, agreed upon, facility limit was decreased from AUD $40 million to AUD $25 million.
Cash Reserve
The Company is required to maintain certain cash reserves with its senior debt provider in accordance with the RPA. The Required Cash Reserve amount may be provided by the Company or its customers and is held in a ‘Cash Reserve Account’ with its senior debt provider in accordance with the RPA’s terms and conditions. The Required Cash Reserve balance is adjusted based on the RPA and the total facility limit provided to the Company by the senior lender.
Note 12 – SHAREHOLDER’S LOAN
| June 30 | June 30 | |||||||
| 2015 | 2014 | |||||||
| Shareholder's loan | $ | 38,392 | $ | 47,100 | ||||
The Company has a loan payable in the amount of AUD$50,000 to a shareholder. The loan is due and payable on September 30, 2017. Interest of 8% is only payable if Moneytech has positive retained earnings at the time of repayment.
Note 13 – SUBORDINATED NOTES, NET
| June 30 | June 30 | |||||||
| 2015 | 2014 | |||||||
| Subordinated notes issued | $ | 19,200,000 | $ | - | ||||
| Issuance costs | (766,873 | ) | - | |||||
| Subordinated notes, net proceeds | $ | 18,433,127 | $ | - | ||||
| Issuance costs amortised | 38,344 | - | ||||||
| Subordinated notes, net | $ | 18,471,471 | $ | - | ||||
In April 2015 the Company issued AUD $25 million of subordinated notes. The notes mature in 7 years and have similar conditions, including financial covenants and restrictions as to use of proceeds, to the wholesale facility and are sub-ordinate to that facility. The costs of the subordinated notes issuance were AUD $998,533 and the proceeds to the company were AUD $24,001,467. The subordinated notes bear interest at a rate of 4.65% per annum above the Australian BBSW rate. The BBSW rate as of the date of settlement, April 10, 2015, was 2.26% per annum. The notes can be redeemed early at increased cost to the Company or at the request of the holder in the event of a change in control.
| F-18 |
| Year ended | Year ended | |||||||
| June 30 | June 30 | |||||||
| 2015 | 2014 | |||||||
| Issuance costs amortized during the year | $ | 41,839 | $ | - | ||||
| Interest paid during the year | 325,277 | - | ||||||
| Reported as Interest expense in cost of revenue | $ | 367,116 | $ | - | ||||
Interest expense charged to cost of revenue related to the notes for the year ended June 30, 2015 was USD $367,116.
Note 14 – STOCKHOLDERS’ EQUITY
Preferred Stock
The Company has 1,000,000 undesignated shares of Preferred Stock authorized, each having a par value of $0.01. There were 5,000 shares of Series B Preferred Stock authorized, issued and outstanding as of June 30, 2015 and 2014 (the “Series B Preferred Shares”). Under the terms of the Series B Preferred Stock Certificate of Designation, the holder(s) of the Series B Preferred Shares have the right, until June 30, 2018, to (A) elect the majority of the Company’s Board of Directors and (B) vote on all other matters to come before the holders of common stock (the “Common Stock”) with each vote per share of Series B Preferred Stock equal to 1,000 shares of Common Stock.
After June 30, 2018, the Series B Preferred Shares shall have no voting rights and shall be redeemable by the Company for the sum of one tenth of a cent ($0.001) per Series B Preferred Share. The Series B Preferred Shares will not have any conversion rights and shall not be entitled to receive any dividends, distributions, or other economic or financial interest in the Company, and in the event of a liquidation, dissolution, or winding up of the Company, whether voluntary or involuntary, the holders of Class B Preferred Shares will be entitled to receive out of the Company’s assets, whether such assets are capital or surplus, of any nature, the sum of one-tenth of a cent ($0.001) per Series B Preferred Share, after payment to the holders of the Common Stock and the holders of any other series or class of the Company’s equity securities ranking senior to the Common Stock.
Common Stock
The Company has 50,000,000 shares of Common Stock authorized, each having a par value of $0.001, as of June 30, 2015 and 2014 after giving effect to the authorized shares discussed below. There were 7,671,632 shares issued and outstanding as of June 30, 2015 and 2014.
On October 3, 2013, the Company amended and restated its certificate of incorporation to decrease the number of authorized shares of Common Stock and Preferred Stock to 50,000,000 and 1,000,000 respectively. The Company also reduced the par value of the Common Stock to $0.001 from $0.10.
On October 29, 2013, 150,000 shares which had previously been issued to contractors were cancelled because performance criteria relating to the issuance of these shares had not been met.
On February 11, 2014, 2,140,000 shares which had previously been issued to Edward DeFeudis and Marco Garibaldi were returned for cancellation as per the terms of the Separation Settlement agreement as further detailed in Footnote 2.
On February 11, 2014, 100,000 of the shares returned in the Separation Agreement were issued to a note holder of Wiki as further detailed in Footnote 2.
On July 16, 2015 the number of authorized shares of common stock was reduced from 50,000,000 to 12,000,000 shares and the number of authorized shares of preferred stock was reduced from 1,000,000 to 10,000 shares.
Note 15 – STOCK COMPENSATION
Restricted shares
On July 23, 2013, the Company entered into a consulting agreement to promote the Company's image in both the industry and capital markets. In connection with the agreements, the Company agreed to issue 170,632 shares of Common Stock valued at $2.02 (stock price at grant date). During the year ended June 30, 2014, the Company determined that performance had not occurred and would not be satisfactorily undertaken and consequently the Company terminated the agreement with the consultant and will not be delivering 170,632 shares of Common stock.
| Number
of Shares | ||||||||
| June 30 | June 30 | |||||||
| 2015 | 2014 | |||||||
| Granted but not issued at July 1 | - | 338,368 | ||||||
| Issued during nine months ended June 30 | - | - | ||||||
| Granted during nine months ended June 30 | - | 170,632 | ||||||
| Cancelled during nine months ended June 30 | - | (150,000 | ) | |||||
| Granted but not issued at June 30 | - | 359,000 | ||||||
| F-19 |
The shares granted but not issued at July 1 were cancelled due to non-performance as of June 30, 2014.
On September 9, 2015 The Board of Directors awarded an Officer (960,000) and Director (160,000) restricted shares at a fair value of $0.40 per share.
Note 16 – STOCK OPTIONS
On April 19, 2013, the Company entered into an agreement with a software developer. Upon achievement of certain milestones, the contractor could receive up to 100,000 Performance Based Stock Options at an exercise price of $2.50 per share. The options vested and became exercisable immediately upon grant with a 3 year life. As of June 30, 2015, 14,500 of the Performance Based Stock Options are vested. As a result of the return of WTI, as further detailed in footnote 2, no additional shares can be vested. The Fair Value of the options was calculated using the following assumptions: estimated life of three years, volatility of 351%, risk free interest rate of .35%, and dividend yield of 0%. The grant date Fair Value of options was $249,995.
On July 19, 2013, the Company granted 75,000 Stock Options to each of the three non-employee directors pursuant to the Omnibus Incentive Plan. These Stock Options are exercisable at an exercise price of $2.02 per share. The options vest as to 2,083 shares per non-employee director on September 30, 2013, and as to an additional 2,083 shares each on the last day of each calendar month thereafter through and including August 31, 2016, except that the right to exercise the Options shall vest as to an additional 2,095 shares on the last day of August 31, 2016. The options become exercisable immediately upon vesting and continue in force through June 30, 2020 (the "Expiration Date"), unless sooner terminated as provided herein and in the Plan. The Fair Value of the options was calculated using the following assumptions: estimated life of seven years, volatility of 755 %, risk free interest rate of 2.02%, and dividend yield of 0%. The grant date Fair Value of options was $454,500. In May 2015, a non-employee director resigned. At that time, 41,660 options had vested. Upon his resignation all vesting ceased and the vested options were subject to forfeiture if not exercised within three months of resignation. The vested options were not exercised within the three month period and those options were forfeited..
On August 22, 2013, the Company granted 25,000 Stock Options to a contractor. These Stock Options are exercisable at an exercise price of $1.30 per share. The options vested and became exercisable immediately upon granting and continue in force through August 22, 2016 (the "Expiration Date"), unless sooner terminated as provided by the agreement. The Fair Value of the options was calculated using the following assumptions: estimated life of three years, volatility of 843%, risk free interest rate of .82%, and dividend yield of 0%. The grant date Fair Value of options was $32,500.
The Company recorded $143,060 and $194,979 option expense in the year ended June 30, 2015 and 2014, respectively.
| F-20 |
The following is a summary of the activity and position as of the year ended June 30, 2015 and 2014.
| Stock Options | ||||||||
| Years ended | ||||||||
| June 30 | ||||||||
| 2015 | 2014 | |||||||
| Outstanding at July 1 | 350,000 | 100,000 | ||||||
| Granted | - | 250,000 | ||||||
| Exercised | - | - | ||||||
| Expired | - | - | ||||||
| Outstanding at June 30 | 350,000 | 350,000 | ||||||
| Exercisable at June 30 | 172,812 | 101,990 | ||||||
Options outstanding at June 30, 2015 and 2014 are as follows:
| Weighted | ||||||||||||
| Average | Weighted | Weighted | ||||||||||
| Remaining | Average | Average | ||||||||||
| Life | Exercise | Exercise | ||||||||||
| Options | (Years) | Price | Options | Price | ||||||||
| Year | Exercise Price | (Outstanding) | (Outstanding) | (Outstanding) | (Exercisable) | (Exercisable) | ||||||
| 2015 | $1.30 to $2.50 | 350,000 | 4.41 | $1.96 | 172,812 | $1.94 | ||||||
| 2014 | $1.30 to $2.50 | 350,000 | 5.41 | $2.09 | 101,990 | $1.90 |
The fair value of the equity instruments granted was determined using the closing price on the day the shares were granted in the case of shares issued and using the Black and Scholes option valuation model in the case of share options granted.
On September 9, 2015 The Board of Directors awarded 2,225,000 options to Officers, employees and Directors. The options vest over 12 month (150,000 options) and 24 month (2,075,000 options) periods and may be exercised for a period of 10 years with exercise prices of $0.40 (1,225,000 options) and $0.44 (1,000,000 options) per option.
Note 17 – RELATED PARTY TRANSACTIONS
During the years ended June 30, 2015 and 2014, the Company paid a company controlled by the President of Moneytech for consulting services $128,353 and $226,076, respectively. This arrangement was terminated as of January 31, 2015.
Note 18 – INCOME TAX
The following is the income tax expense reflected in the Statement of Operations for the years ended June 30, 2015 and 2014:
| INCOME TAX EXPENSE | Years ended | Years ended | Years ended | |||||||||||||||||||||
| June 30 | June 30 | June 30 | ||||||||||||||||||||||
| 2015 | 2014 | 2015 | 2014 | 2015 | 2014 | |||||||||||||||||||
| Australia | United States | Total | ||||||||||||||||||||||
| Income tax expense - current | $ | - | $ | - | $ | - | $ | - | $ | - | $ | - | ||||||||||||
| Income tax expense - deferred | 180,446 | 327,539 | - | - | 180,446 | 327,539 | ||||||||||||||||||
| Total | $ | 180,446 | $ | 327,539 | $ | - | $ | - | $ | 180,446 | $ | 327,539 | ||||||||||||
| F-21 |
The following are the components of income before income tax reflected in the Statement of Operations for the years ended June 30, 2015 and 2014:
| COMPONENTS OF INCOME BEFORE INCOME TAX | Years ended | Years ended | Years ended | |||||||||||||||||||||
| June 30 | June 30 | June 30 | ||||||||||||||||||||||
| 2015 | 2014 | 2015 | 2014 | 2015 | 2014 | |||||||||||||||||||
| Australia | United States | Total | ||||||||||||||||||||||
| (Loss) income from continuing operations | $ | (156,461 | ) | $ | 623,336 | $ | (683,890 | ) | $ | (861,245 | ) | $ | (840,351 | ) | $ | (237,909 | ) | |||||||
| Net loss from discontinued operations | - | - | - | (301,280 | ) | - | (301,280 | ) | ||||||||||||||||
| (Loss) income before Income tax | $ | (156,461 | ) | $ | 623,336 | $ | (683,890 | ) | $ | (1,162,525 | ) | $ | (840,351 | ) | $ | (539,189 | ) | |||||||
| Income tax | $ | 180,446 | $ | 327,539 | $ | - | $ | - | $ | 180,446 | $ | 327,539 | ||||||||||||
| Effective tax rate | (115 | )% | 53 | % | - | % | - | % | (21 | )% | (61 | )% | ||||||||||||
The following is a reconciliation of the provision for income taxes at the US federal income tax rate to the income taxes reflected in the Statement of Operations for the years ended June 30, 2015 and 2014:
| INCOME TAX RATE RECONCILIATION | Years ended | Years ended | Years ended | |||||||||||||||||||||
| June 30 | June 30 | June 30 | ||||||||||||||||||||||
| 2015 | 2014 | 2015 | 2014 | 2015 | 2014 | |||||||||||||||||||
| Australia | United States | Total | ||||||||||||||||||||||
| US statutory rates | 34 | % | 34 | % | 34 | % | 34 | % | 34 | % | 34 | % | ||||||||||||
| Tax rate difference | (4 | )% | (4 | )% | (4 | )% | (4 | )% | (4 | )% | (4 | )% | ||||||||||||
| Research and development grant income | 121 | % | (26 | )% | - | % | - | % | 23 | % | 31 | % | ||||||||||||
| Research and development grant eligible expenditure | (156 | )% | 25 | % | - | % | - | % | (30 | )% | (28 | )% | ||||||||||||
| Research and development grant eligible amortisation | (109 | )% | 23 | % | - | % | - | % | (20 | )% | (27 | )% | ||||||||||||
| USA losses | - | % | - | % | (30 | )% | (30 | )% | (24 | )% | (67 | )% | ||||||||||||
| Other | (1 | )% | 1 | % | - | % | - | % | - | % | - | % | ||||||||||||
| Tax expenses at actual rate | (115 | )% | 53 | % | - | % | - | % | (21 | )% | (61 | )% | ||||||||||||
The following are the components of deferred tax reflected in the Statement of Operations for the years ended June 30, 2015 and 2014:
| COMPONENTS OF DEFERRED TAX EXPENSE | Years ended | Years ended | Years ended | |||||||||||||||||||||
| June 30 | June 30 | June 30 | ||||||||||||||||||||||
| 2015 | 2014 | 2015 | 2014 | 2015 | 2014 | |||||||||||||||||||
| Australia | United States | Total | ||||||||||||||||||||||
| Tax losses carried forward | $ | 204,548 | $ | 331,073 | $ | - | $ | - | $ | 204,548 | $ | 331,073 | ||||||||||||
| Doubtful debts reserve | (2,144 | ) | 14,939 | - | - | (2,144 | ) | 14,939 | ||||||||||||||||
| Accruals | (21,958 | ) | (18,473 | ) | - | - | (21,958 | ) | (18,473 | ) | ||||||||||||||
| $ | 180,446 | $ | 327,539 | $ | - | $ | - | $ | 180,446 | $ | 327,539 | |||||||||||||
The following are the components of deferred tax reflected in the Balance Sheet as of June 30, 2015 and 2014:
| COMPONENTS OF DEFERRED TAX ASSET | June 30 | June 30 | June 30 | June 30 | June 30 | June 30 | ||||||||||||||||||
| 2015 | 2014 | 2015 | 2014 | 2015 | 2014 | |||||||||||||||||||
| Australia | United States | Total | ||||||||||||||||||||||
| Tax losses carried forward | $ | 875,244 | $ | 1,303,475 | $ | - | $ | - | $ | 875,244 | $ | 1,303,475 | ||||||||||||
| Doubtful debts reserve | 174,008 | 211,021 | - | - | 174,008 | 211,021 | ||||||||||||||||||
| Accruals | 66,587 | 56,991 | - | - | 66,587 | 56,991 | ||||||||||||||||||
| $ | 1,115,839 | $ | 1,571,487 | $ | - | $ | - | $ | 1,115,839 | $ | 1,571,487 | |||||||||||||
| Deferred tax assets - current | $ | 230,400 | $ | 282,600 | $ | - | $ | - | $ | 230,400 | $ | 282,600 | ||||||||||||
| Deferred tax assets - non current | 885,439 | 1,288,887 | - | - | 885,439 | 1,288,887 | ||||||||||||||||||
| $ | 1,115,839 | $ | 1,571,487 | $ | - | $ | - | $ | 1,115,839 | $ | 1,571,487 | |||||||||||||
| F-22 |
Deferred income taxes arise from temporary differences between the tax and financial statement recognition of revenue and expense. In evaluating the ability to recover the deferred tax assets within the jurisdiction from which they arise, the Company considered all available positive and negative evidence, including scheduled reversals of deferred tax liabilities, projected future taxable income, tax planning strategies and recent financial operations. In projecting future taxable income, the Company began with historical results adjusted for changes in accounting policies and incorporates assumptions including the amount of future pretax operating income, the reversal of temporary differences, and the implementation of feasible and prudent tax planning strategies. These assumptions require significant judgment about the forecasts of future taxable income and are consistent with the plans and estimates the Company are using to manage the underlying businesses. In evaluating the objective evidence that historical results provide, the Company considers three years of cumulative operating income (loss).
As of June 30, 2015, Moneytech had approximately $2,917,479 in net operating loss (“NOL”) carry forward available to offset future taxable income in Australia. The NOLs can be carried forward without expiration in Australia. Management believes that all NOLs will be utilized in the near future and therefore no allowance was made.
As of June 30, 2015, Source had NOL’s of approximately $13 million dollars to offset future taxable income in the US. Federal NOLs can generally be carried forward 20 years. However, under Internal Revenue Code section 382 due to the change in ownership there are certain limitations placed on the NOL carryover and Source may only use approximately $161,500 per year of the available NOL. The deferred tax assets of the US entities at June 30, 2015 were fully reserved. Management believes it is more likely than not that these assets will not be realized in the near future.
Note 19 – GEOGRAPHIC SEGMENT INFORMATION
As a result of the reverse merger on June 30, 2013 the Company operated in two regions: Australia and the United States of America. As a result of the Separation Agreement, see Note 2, the Company now operates only in Australia. All inter-company transactions are eliminated in consolidation.
For the years ended June 30, 2015 and 2014, geographic segment information is as follows:
| Year Ended June 30, 2015 | Year Ended June 30, 2014 | |||||||||||||||||||||||||||||||
| Australia | USA | Elimination | Consolidated | Australia | USA | Elimination | Consolidated | |||||||||||||||||||||||||
| Revenue | $ | 4,740,855 | $ | - | $ | - | $ | 4,740,855 | $ | 5,810,936 | $ | - | $ | - | $ | 5,810,936 | ||||||||||||||||
| Cost of Revenue | 3,418,492 | - | - | 3,418,492 | 3,056,524 | - | - | 3,056,524 | ||||||||||||||||||||||||
| Total Expenses | 2,924,109 | - | - | 2,924,109 | 2,544,589 | 1,162,525 | - | 3,707,114 | ||||||||||||||||||||||||
| Other Income (Expense) | 761,395 | - | - | 761,395 | 714,793 | - | - | 714,793 | ||||||||||||||||||||||||
| Net Income (Loss) before tax from continuing operations | (840,351 | ) | - | - | (840,351 | ) | 924,616 | (1,162,525 | ) | - | (237,909 | ) | ||||||||||||||||||||
| Discontinued operations | - | - | - | - | - | (301,280 | ) | - | (301,280 | ) | ||||||||||||||||||||||
| Assets | 33,362,460 | - | - | 33,362,460 | 42,251,766 | - | - | 42,251,766 | ||||||||||||||||||||||||
| Debt | 28,934,821 | - | - | 28,934,821 | 35,135,035 | 561,073 | - | 35,696,108 | ||||||||||||||||||||||||
Note 20 – EQUITY INVESTMENT
On January 16, 2013 the Company entered into an agreement whereby it received a 37.5% equity interest in 360 Market Pty. Limited (“360”) in exchange for allowing 360 to utilize certain license rights. There was no exchange of cash or debt for the transaction and it was accounted for at its fair value of $0. The investment is accounted for by the equity method since the Company obtained a 37.5% equity interest.
360 incurred continuous losses from inception through December 31, 2014, and as a result the Company did not recognize any income or return from the investment for the periods ended December 31, 2014 and earlier as doing so would have created a negative carrying value in the investment account. The Company discontinued using the equity method rather than establish a negative balance for periods through December 31, 2014.
During the year ended June 30, 2015, 360 was profitable and absorbed its accumulated losses.
The Company expects this performance to continue and as a result the Company has commenced recording 37.5% of the accumulated profits to date as income in the year ended June 30, 2015. A gain on equity method investment of $743 has been reported in the Statement of Operations and Comprehensive Loss for the year ended June 30, 2015. As a result of the current period 360 profits the Company has recorded an Investment in equity affiliate of $681 in the Balance Sheet as at June 30, 2015.
Note 21 – COMMITMENTS
The Company leases two offices in Australia under renewable operating leases expiring on August 31, 2016 and July 31, 2015.
| F-23 |
Our corporate Australian headquarters are located at Level6/97 Pacific Highway, North Sydney NSW 2060 Australia, where we lease approximately 350 square meters of office and operations space pursuant to lease agreements expiring in August 2016. The annual rent for the premises is AUD $168,725. In addition we occupy an office on Albany Highway, Victoria Park, Western Australia. The initial term of the lease for this space expires July 31, 2015, at which time the lease will continue on a month by month basis. The monthly rent for the premises is AUD $1,420.
For the years ended June 30, 2015 and 2014, the aggregate rental expense was USD $125,562 and USD $137,695, respectively.
Future minimum rental payments required under operating leases as of June 30, 2015 are as follows:
| USD $ | ||||||
| Fiscal | 2016 | $ | 130,511 | |||
| 2017 | 21,597 | |||||
| $ | 152,108 | |||||
Note 22 – SUBSEQUENT EVENTS
Management has evaluated events subsequent through September 15, 2015 for transactions and other events that may require adjustment of and/or disclosure in such financial statements.
As of July 16, 2015 the number of authorized shares of common stock was reduced from 50,000,000 to 12,000,000 shares and the number of authorized shares of preferred stock was reduced from 1,000,000 to 10,000 shares.
On September 9, 2015 The Board of Directors awarded an Officer (960,000) and Director (160,000) restricted shares at a fair value of $0.40 per share.
On September 9, 2015 The Board of Directors awarded 2,225,000 options to Officers, employees and Directors. The options vest over 12 month (150,000 options) and 24 month (2,075,000 options) periods and may be exercised for a period of 10 years with exercise prices of $0.40 (1,225,000 options) and $0.44 (1,000,000 options) per option.
F-24