Attached files
| file | filename |
|---|---|
| EX-4.1 - EX-4.1 - LANCASTER COLONY CORP | stockcert.htm |
| EX-32 - EX-32 - LANCASTER COLONY CORP | lanc-2015630exhibit32.htm |
| EX-23 - EX-23 - LANCASTER COLONY CORP | lanc-2015630exhibit23.htm |
| EX-21 - EX-21 - LANCASTER COLONY CORP | lanc-2015630exhibit21.htm |
| EX-31.2 - EX-31.2 - LANCASTER COLONY CORP | lanc-2015630exhibit312.htm |
| EX-10.2 - EX-10.2 - LANCASTER COLONY CORP | lanc-2015630exhibit102.htm |
| EX-31.1 - EX-31.1 - LANCASTER COLONY CORP | lanc-2015630exhibit311.htm |
UNITED STATES SECURITIES AND EXCHANGE COMMISSION
WASHINGTON, DC 20549
Form 10-K |
(Mark One)
x | ANNUAL REPORT PURSUANT TO SECTION 13 OR 15(d) OF THE SECURITIES EXCHANGE ACT OF 1934 |
For the fiscal year ended June 30, 2015
or
¨ | TRANSITION REPORT PURSUANT TO SECTION 13 OR 15(d) OF THE SECURITIES EXCHANGE ACT OF 1934 |
For the transition period from to
Commission file number 000-04065
Lancaster Colony Corporation | ||
(Exact name of registrant as specified in its charter) | ||
Ohio | 13-1955943 | |
(State or other jurisdiction of incorporation or organization) | (I.R.S. Employer Identification No.) | |
37 West Broad Street Columbus, Ohio | 43215 | |
(Address of principal executive offices) | (Zip Code) | |
614-224-7141 | ||
(Registrant’s telephone number, including area code) | ||
Securities registered pursuant to Section 12(b) of the Act: | ||
Title of each class | Name of each exchange on which registered | |
Common Stock, without par value | NASDAQ Global Select Market | |
Securities registered pursuant to Section 12(g) of the Act:
None
Indicate by check mark if the registrant is a well-known seasoned issuer, as defined in Rule 405 of the Securities Act. Yes x No ¨
Indicate by check mark if the registrant is not required to file reports pursuant to Section 13 or Section 15(d) of the Act. Yes ¨ No x
Indicate by check mark whether the registrant (1) has filed all reports required to be filed by Section 13 or 15(d) of the Securities Exchange Act of 1934 during the preceding 12 months (or for such shorter period that the registrant was required to file such reports), and (2) has been subject to such filing requirements for the past 90 days. Yes x No ¨
Indicate by check mark whether the registrant has submitted electronically and posted on its corporate Web site, if any, every Interactive Data File required to be submitted and posted pursuant to Rule 405 of Regulation S-T (§232.405 of this chapter) during the preceding 12 months (or for such shorter period that the registrant was required to submit and post such files). Yes x No ¨
Indicate by check mark if disclosure of delinquent filers pursuant to Item 405 of Regulation S-K (§229.405 of this chapter) is not contained herein, and will not be contained, to the best of registrant’s knowledge, in definitive proxy or information statements incorporated by reference in Part III of this Form 10-K or any amendment to this Form 10-K. x
Indicate by check mark whether the registrant is a large accelerated filer, an accelerated filer, a non-accelerated filer, or a smaller reporting company. See the definitions of “large accelerated filer,” “accelerated filer” and “smaller reporting company” in Rule 12b-2 of the Exchange Act. (Check one.)
Large accelerated filer | x | Accelerated filer | ¨ | |
Non-accelerated filer | ¨ | (Do not check if a smaller reporting company) | Smaller reporting company | ¨ |
Indicate by check mark whether the registrant is a shell company (as defined by Rule 12b-2 of the Act). Yes ¨ No x
The aggregate market value of Common Stock held by non-affiliates of the registrant computed by reference to the price at which such Common Stock was last sold as of December 31, 2014 was $1,731.0 million.
As of August 4, 2015, there were 27,360,000 shares of Common Stock, without par value, outstanding.
DOCUMENTS INCORPORATED BY REFERENCE
Portions of the registrant’s definitive proxy statement to be filed for its November 2015 Annual Meeting of Shareholders are incorporated by reference into Part III of this Annual Report on Form 10-K.
LANCASTER COLONY CORPORATION AND SUBSIDIARIES
TABLE OF CONTENTS
Item 1. | ||
Item 1A. | ||
Item 1B. | ||
Item 2. | ||
Item 3. | ||
Item 4. | ||
Item 5. | ||
Item 6. | ||
Item 7. | ||
Item 7A. | ||
Item 8. | ||
Item 9. | ||
Item 9A. | ||
Item 9B. | ||
Item 10. | ||
Item 11. | ||
Item 12. | ||
Item 13. | ||
Item 14. | ||
Item 15. | ||
2
PART I
Item 1. Business
GENERAL
Lancaster Colony Corporation, an Ohio corporation, is a manufacturer and marketer of specialty food products for the retail and foodservice markets. We began our operations in 1961 as a Delaware corporation. In 1992, we reincorporated as an Ohio corporation. Our principal executive offices are located at 37 West Broad Street, Columbus, Ohio 43215 and our telephone number is 614-224-7141.
In recent years, our strategy has shifted away from operating businesses in a variety of industries towards emphasizing the growth and success we have achieved in our Specialty Foods business. Consistent with this strategy, on January 30, 2014, we sold effectively all of the net operating assets of our candle manufacturing and marketing operations. This sale marked the divestiture of our last remaining non-food business. The financial results of these operations, previously included in our Glassware and Candles segment, are reported as discontinued operations for all periods presented.
As used in this Annual Report on Form 10-K and except as the context otherwise may require, the terms “we,” “us,” “our,” “registrant,” or “the Company” mean Lancaster Colony Corporation and its consolidated subsidiaries, except where it is clear that the term only means the parent company. Unless otherwise noted, references to “year” pertain to our fiscal year which ends on June 30; for example, 2015 refers to fiscal 2015, which is the period from July 1, 2014 to June 30, 2015.
Available Information
Our Internet web site address is http://www.lancastercolony.com. Our annual reports on Form 10-K, quarterly reports on Form 10-Q, current reports on Form 8-K and amendments to those reports filed or furnished pursuant to Section 13(a) or 15(d) of the Securities Exchange Act of 1934 are available free of charge through our website as soon as reasonably practicable after such material is electronically filed with, or furnished to, the Securities and Exchange Commission. The information contained on our web site or connected to it is not incorporated into this Annual Report on Form 10-K.
DESCRIPTION OF AND FINANCIAL INFORMATION ABOUT BUSINESS SEGMENT
We operate in one business segment – “Specialty Foods.” The financial information relating to our business segment for the three years ended June 30, 2015, 2014 and 2013 is included in Note 10 to the consolidated financial statements, and located in Part II, Item 8 of this Annual Report on Form 10-K. Further description of the business segment within which we operate is provided below.
Specialty Foods Segment
The food products we manufacture and sell include: salad dressings and sauces marketed under the brand names “Marzetti,” “Cardini’s,” “Simply Dressed,” “Katherine’s Kitchen” and “Girard’s”; fruit glazes, vegetable dips and fruit dips marketed under the brand name “Marzetti”; Greek yogurt vegetable dips and hummus marketed under the brand name “Otria”; frozen garlic breads marketed under the brand names “New York BRAND,” “Mamma Bella” and “Mamma Bella's”; frozen Parkerhouse style yeast dinner rolls and sweet rolls, as well as biscuits, marketed under the brand names “Sister Schubert’s,” “Marshall’s” and “Mary B’s”; premium dry egg noodles marketed under the brand names “Inn Maid” and “Amish Kitchen”; frozen specialty noodles marketed under the brand names “Reames” and “Aunt Vi’s”; croutons and related products marketed under the brand names “New York BRAND,” “Texas Toast,” “Chatham Village,” “Cardini’s,” “Simply Dressed” and “Marzetti”; snack sticks marketed under the brand name “New York BRAND”; flatbread wraps and pizza crusts marketed under the brand name “Flatout” and caviar marketed under the brand name “Romanoff.” We also manufacture and sell other products pursuant to brand license agreements, including Olive Garden® dressing, Jack Daniel's® mustards, Hungry Girl® flatbreads and Ortalli® balsamic vinegar. A portion of our sales are products sold under private label to retailers, distributors and restaurants primarily in the United States. Additionally, a small portion of our sales are dressing packets, frozen specialty noodles, pasta and flatbreads sold to industrial customers for use as ingredients or components in their products.
Sales are made to retail and foodservice markets. The dressings, sauces, croutons, fruit glazes, vegetable dips, fruit dips, flatbreads, frozen breads and yeast rolls we sell in the retail markets are sold primarily through sales personnel, food brokers and distributors throughout the United States. The dry egg noodles, frozen specialty noodles, pasta and flatbreads we sell in the retail, foodservice and industrial markets are sold primarily through sales personnel, food brokers and distributors. We have strong placement of products in U.S. grocery produce departments through our refrigerated salad dressings, vegetable and fruit dips, and croutons. Our flatbread products are generally placed in the deli section of the grocery store. We also have products typically marketed in grocery aisles involving shelf-stable salad dressing, dry egg noodles and croutons. Within the frozen aisles of grocery retailers, we also have prominent market positions of frozen yeast rolls, garlic breads and egg noodles. Products we sell in the foodservice markets are often custom-formulated and include salad dressings, sandwich and dipping sauces, frozen breads and yeast rolls.
3
Net sales attributable to McLane Company, Inc. (“McLane”), a wholesale distribution subsidiary of Berkshire Hathaway, Inc., totaled 18%, 18% and 13% of consolidated net sales for 2015, 2014 and 2013, respectively. Net sales attributable to Wal-Mart Stores, Inc. (“Wal-Mart”) totaled 16%, 17% and 17% of consolidated net sales for 2015, 2014 and 2013, respectively. No other customer accounted for more than 10% of our total net sales during these years. Although we have the leading market share in several product categories, all of the markets in which we sell food products are highly competitive in the areas of price, quality and customer service.
We continue to rely upon our strong retail brands, innovation expertise, geographic and channel expansion and customer relationships for future growth. Our category-leading retail brands and commitment to new product development helps drive increased consumer demand in our retail markets. In foodservice markets, we grow our business with established customers and pursue new opportunities by leveraging our culinary skills and experience to support the development of new products and menu offerings. Acquisitions are also part of our future growth plans, with a focus on fit and value.
A significant portion of our product lines is manufactured at our 15 food plants located throughout the United States. Certain items are also manufactured and packaged by third parties located in the United States, Canada and Europe.
Efficient and cost-effective production remains a key focus. In 2015 we completed a significant processing capacity expansion at our Horse Cave, Kentucky dressing facility to help improve throughput and meet demand for our dressing products. Our 2013 crouton manufacturing capacity expansion and our 2011 frozen yeast rolls plant expansion are other examples of our efforts to meet customer demand and to achieve efficiency goals.
Our operations are affected by seasonal fluctuations primarily in the fiscal second quarter and the Easter holiday season when sales of frozen retail products tend to be most pronounced. The impacts on working capital are not significant. We do not utilize any franchises or concessions. In addition to the owned and licensed trademarks, discussed above, we also own and operate under innumerable other intellectual property rights, including patents, copyrights, formulas, proprietary trade secrets, technologies, know-how processes and other unregistered rights. We consider all of our owned and licensed intellectual property rights to be essential to our business.
NET SALES BY CLASS OF PRODUCTS
The following table sets forth information with respect to the percentage of net sales contributed by each class of similar products that account for at least 10% of our consolidated net sales in any year from 2013 through 2015:
2015 | 2014 | 2013 | |||
Specialty Foods | |||||
Non-frozen | 67% | 65% | 64% | ||
Frozen | 33% | 35% | 36% | ||
RESEARCH AND DEVELOPMENT
The estimated amount spent during each of the last three years on research and development activities determined in accordance with generally accepted accounting principles was less than 1% of net sales.
BACKLOG
Orders are generally filled in three to seven days. We do not view the amount of backlog at any particular point in time as a meaningful indicator of longer-term shipments.
COMPETITION
All the markets in which we sell products are highly competitive. We face competition from a number of manufacturers of various sizes and capabilities. We compete with other branded products, as well as an increasing presence of private label goods. We also compete with both domestic and foreign manufacturers of various sizes in the United States and internationally. Our ability to compete depends upon a variety of factors, including the position of our branded goods within various categories, product quality, product innovation, promotional and marketing activity, pricing and our ability to service customers.
ENVIRONMENTAL MATTERS
Our operations are subject to various Federal, state and local environmental protection laws. Based upon available information, compliance with these laws and regulations did not in 2015, and is not expected to have in 2016, a material effect upon the level of capital expenditures, earnings or our competitive position.
4
EMPLOYEES AND LABOR RELATIONS
As of June 30, 2015 we had 2,600 employees, 21% of which are represented under various collective bargaining contracts. 7% of our employees are represented under a collective bargaining contract that will expire within one year. While we believe that labor relations with all our employees are satisfactory, a prolonged labor dispute or an organizing attempt could have a material effect on our business and results of operations.
FOREIGN OPERATIONS AND EXPORT SALES
Over 95% of our products are sold in the United States. Foreign operations and export sales have not been significant in the past and are not expected to be significant in the future based upon existing operations. We do not have any fixed assets located outside of the United States.
RAW MATERIALS
During 2015, we obtained adequate supplies of raw materials and packaging. We rely on a variety of raw materials and packaging for the day-to-day production of our products, including soybean oil, various sweeteners, eggs, dairy-related products, flour, various films and plastic and paper packaging materials.
We purchase the majority of these materials on the open market to meet current requirements, but we also have some fixed-price contracts with terms generally one year or less. See further discussion in our “Risk Factors” section below and our contractual obligations disclosure in Management’s Discussion and Analysis of Financial Condition and Results of Operations (“MD&A”). Although the availability and price of certain of these materials are influenced by weather, disease and the level of global demand, we anticipate that future sources of supply will generally be available and adequate for our needs.
Item 1A. Risk Factors
An investment in our common stock is subject to certain risks inherent in our business. Before making an investment decision, you should carefully consider the risks and uncertainties described below, together with all of the other information included or incorporated by reference in this Annual Report on Form 10-K.
If any of the following risks occur, our financial condition and results of operations could be materially and adversely affected. If this were to happen, the value of our common stock could decline significantly.
Increases in the costs or limitations to the availability of raw materials we use to produce our products could adversely affect our business by increasing our costs to produce goods.
Our principal raw-material needs include soybean oil, various sweeteners, eggs, dairy-related products, flour, various films, plastic and paper packaging materials and water. Our ability to manufacture and/or sell our products may be impaired by damage or disruption to our manufacturing or distribution capabilities, or to the capabilities of our suppliers or contract manufacturers, due to factors that are hard to predict or beyond our control, such as adverse weather conditions, natural disasters, fire, terrorism, pandemics, strikes or other events. Production of the agricultural commodities used in our business may also be adversely affected by drought, water scarcity, temperature extremes, scarcity of suitable agricultural land, worldwide demand, livestock disease (for example, avian influenza), crop disease and/or crop pests.
We purchase a majority of our key raw materials on the open market. Our ability to avoid the adverse effects of a pronounced, sustained price increase in our raw materials is limited. We have observed increased volatility in the costs of many of these raw materials in recent years. Beginning in the fourth quarter of 2015, we experienced a significant increase in our egg-based ingredient costs as a direct result of a highly pathogenic strain of avian influenza that affected the primary egg-producing region in the United States. This increase was very sudden and significant and it adversely affected our results for the quarter. In 2011 and 2012, commodity markets for grain-based products on which our food products depend, including dairy, soybean oil and flour products, rose significantly and were unusually volatile due to market concerns over weather, disease, grain-based fuel sources and worldwide demand. Further, fluctuating petroleum prices have impacted our costs of resin-based packaging and our costs of inbound freight on all purchased materials.
We try to limit our exposure to price fluctuations for raw materials by periodically entering into longer-term, fixed-price contracts for certain raw materials, but there can be no assurance that we will be successful in limiting our exposure to these price fluctuations. We may experience further increases in the costs of raw materials, and we may try to offset such cost increases with higher prices or other measures. However, we may be unable to successfully implement offsetting measures. Such further cost increases, as well as an inability to effectively implement additional measures to offset higher costs, could have a material adverse effect on our business and results of operations.
5
McLane, a foodservice distributor, is our largest customer and an adverse change in the financial condition of its business could have a material adverse impact on our results of operations and cash flows. Additionally, the loss of, or a significant reduction in, our business with the underlying foodservice customers could cause our sales and net income to decrease.
Our net sales to McLane represented 18% of consolidated net sales for the year ended June 30, 2015. Our accounts receivable balance from McLane as of June 30, 2015 was $8.7 million. McLane is a large national distributor that sells and distributes our products to several of our foodservice national chain customers, principally in the quick service and casual dining channels. In general, our foodservice national chain customers have direct relationships with us, but many choose to buy our products through McLane, who acts as their distributor. McLane orders our products on behalf of these customers and we invoice McLane for these sales. Thus, unfavorable changes in the financial condition of McLane, or the loss of, or a significant reduction in, our business with McLane, could have a material adverse effect on our sales and profitability. In addition, the loss of, or significant reduction in our business with the underlying foodservice customers, or other disruptions, such as decreased consumer demand or stronger competition, could also have a material adverse effect on our business and results of operations. We believe that our relationship with McLane and the underlying foodservice customers is good, but we cannot assure that we will be able to maintain these relationships. McLane and the underlying foodservice customers are not typically committed to long-term contractual obligations with us, and they may switch to other suppliers that offer lower prices, differentiated products or customer service that McLane and/or the underlying foodservice customers perceive to be more favorable. In addition, changes in the general business model of McLane, or the underlying foodservice customers, could affect the profitability.
Wal-Mart is our second largest customer and an adverse change in the financial condition of its business could have a material adverse impact on our results of operations and cash flows. Additionally, the loss of, or a significant reduction in, its business could cause our sales and net income to decrease.
Our net sales to Wal-Mart represented 16% of consolidated net sales for the year ended June 30, 2015. Our accounts receivable balance from Wal-Mart as of June 30, 2015 was $16.4 million. While our relationship with Wal-Mart has been long-standing and believed to be good, we cannot assure that we will be able to maintain this relationship. Wal-Mart is not contractually obligated to purchase from us. In addition, changes in Wal-Mart’s general business model, such as reducing the branded products we market, or devoting more shelf space to private label products, could adversely affect the profitability of our business with Wal-Mart, even if we maintain a good relationship. The loss of, or a significant reduction in, this business could have a material adverse effect on our sales and profitability. Unfavorable changes in Wal-Mart’s financial condition or other disruptions to Wal-Mart, such as decreased consumer demand or stronger competition, could also have a material adverse effect on our business and results of operations.
Competitive conditions within our markets could impact our sales volumes and operating margins.
Competition within all of our markets is intense and is expected to remain so. Numerous competitors exist, many of which are larger than us in size. These competitive conditions could lead to significant downward pressure on the prices of our products, which could have a material adverse effect on our sales and profitability.
Competitive considerations in the various product categories in which we sell are numerous and include price, product innovation, product quality, brand recognition and loyalty, effectiveness of marketing, promotional activity and the ability to identify and satisfy consumer preferences and trends. In order to protect existing market share or capture increased market share among our retail and foodservice channels, we may decide to increase our spending on marketing, advertising and new product innovation. The success of marketing, advertising and new product innovation is subject to risks, including uncertainties about trade and consumer acceptance. As a result, any increased expenditures we make may not maintain or enhance market share and could result in lower profitability.
We may be subject to product recalls or other claims for mislabeled, adulterated, contaminated or spoiled food products.
Our results of operations could be impacted by both real and unfounded claims regarding our products, our competitors’ products and our suppliers’ products. Under adverse circumstances, we may need to recall some of our products if they are, or have the potential to be, mislabeled, adulterated or contaminated. Any of these circumstances could necessitate a voluntary or mandatory recall due to a substantial product hazard, a need to change a product’s labeling or out of an abundance of caution for consumer safety. A pervasive product recall may have an adverse effect on our results of operations due to the costs of a recall, related legal claims, the destruction of product inventory, lost sales due to the unavailability of product for a period of time, or a loss of customer and consumer sentiment. In addition, we may also be liable if any of our products causes bodily injury.
Any claim or product recall could stem from, or result in, noncompliance with federal or state food laws and regulations. Such an action could force us to stop selling our products and create significant adverse publicity that could harm our credibility and decrease market acceptance of our products.
6
If we are required to defend against a product liability or other claim, whether or not we are found liable under the claim, we could incur substantial costs, our reputation could suffer and our customers might substantially reduce their existing or future orders from us.
Adverse publicity or consumer concern regarding the safety and quality of food products or health concerns, whether with our products or for food products in the same food group as our products, may result in the loss of sales.
We are highly dependent upon consumers’ perception of the safety, quality and possible dietary attributes of our products. As a result, substantial negative publicity concerning one or more of our products, or other foods similar to or in the same food group as our products, could lead to a loss of consumer confidence in our products, removal of our products from retailers’ shelves and/or reduced prices and sales of our products. Product quality issues, actual or perceived, or allegations of product contamination, even when false or unfounded, could hurt the image of our brands and cause consumers to choose other products. Furthermore, any product recall, whether our own or by a third party within one of our categories or due to real or unfounded allegations, could damage our brand image and reputation. Any of these events could have a material adverse effect on our business, results of operations and financial condition.
If we conduct operations in a market channel that suffers a loss in consumer confidence as to the safety and quality of food products, our business could be materially affected. The food industry has recently been subject to negative publicity concerning the health implications of GMOs, obesity, trans fat, diacetyl, artificial growth hormones, and bacterial contamination, such as salmonella and listeria. Consumers may increasingly require that foods meet stricter standards than are required by applicable governmental agencies, thereby increasing the cost of manufacturing such foods and ingredients. Developments in any of these areas, including, but not limited to, a negative perception about our formulations could cause our operating results to differ materially from expected results. Any of these events could materially reduce our sales, materially increase our costs and have a material adverse effect on our business, results of operations and financial condition.
We rely on the value of the brands we sell, and the failure to maintain and enhance these brands could adversely affect our business.
We rely on the success of our well-recognized brand names. Maintaining and enhancing our brand image and recognition is essential to our long-term success and maintaining license agreements under which we market and sell certain brands is important to our business. The failure to do either could have a material adverse effect on our business, financial condition and results of operations. We seek to maintain and enhance our brands through a variety of efforts, including the delivery of quality products, extending our brands into new markets and new products and investing in marketing and advertising. The costs of maintaining and enhancing our brands, including maintaining our rights to brands under license agreements, may increase, and these increased costs could have a material adverse impact on our business, financial condition and results of operations.
We manufacture and sell numerous products pursuant to brand license agreements, including without limitation Olive Garden® dressing, Jack Daniel's® mustards, Hungry Girl® flatbreads and Ortalli® balsamic vinegar. We believe that our relationships with our brand licensors are good, but we cannot assure that we will maintain those relationships. Many of our brand license agreements can be terminated or not renewed at the option of the licensor upon short notice to us. The termination of our brand license agreements, the failure to renew our brand license agreements on terms favorable to us, or the impairment of our relationship with our brand licensors could have a material adverse effect on our sales, profitability and results of operations.
In addition, we increasingly rely on electronic marketing, such as social media platforms and the use of online marketing strategies, to support and enhance our brands. This marketplace is growing and evolving quickly and allows for the rapid dissemination of information regarding our brands by us and consumers. We may not be able to successfully adapt our marketing efforts to this marketplace, which could have a material adverse impact on our business, financial condition and results of operations. Further, negative opinions or commentary posted online regarding our brands, regardless of their underlying merits or accuracy, could diminish the value of our brands and adversely affect our business, financial condition and results of operations.
7
We rely on the performance of major retailers, wholesalers, food brokers, distributors, foodservice customers and mass merchants for the success of our business, and should they perform poorly or give higher priority to other brands or products, our business could be adversely affected.
We sell our products principally to retail outlets and foodservice customers, including traditional supermarkets, mass merchants, warehouse clubs, specialty food distributors, foodservice distributors and national restaurant chain accounts. The replacement by or poor performance of our major wholesalers, retailers or chains, or our foodservice customers, or our inability to collect accounts receivable from our customers, could have a material adverse effect on our results of operations and financial condition.
In addition, many of our retail customers offer branded and private label products that compete directly with our products for shelf space and consumer purchases. Accordingly, there is a risk that these customers may give higher priority or promotional support to their own products or to the products of our competitors or discontinue the use of our products in favor of their own products or other competing products. Failure to maintain our retail shelf space or priority with these customers could have a material adverse effect on our business and results of operations.
Increases in energy-related costs could negatively affect our business by increasing our costs to produce goods.
We are subject to volatility in energy-related costs that affect the cost of producing and distributing our products, including our petroleum-derived packaging materials. Increases in these types of costs could have a material adverse effect on our business and results of operations.
Manufacturing capacity constraints may have a material adverse effect on us.
Our current manufacturing facilities may be inadequate to meet significantly increased demand for some of our food products. Our ability to increase our manufacturing capacity depends on many factors, including the availability of capital, steadily increasing consumer demand, tool delivery, construction lead-times, installation, qualification, regulatory permitting and regulatory requirements.
A lack of sufficient manufacturing capacity to meet demand could cause our product quality and/or customer service levels to decrease, which may negatively affect customer demand for our products and customer relations generally, and which could have a material adverse effect on us. In addition, operating our facilities at or near capacity may also increase our production and distribution costs and negatively affect relations with our employees, which could result in higher employee turnover, labor disputes, and disruptions in our operations.
A disruption of production at certain manufacturing facilities could result in an inability to provide adequate levels of customer service.
Because we source certain products from single manufacturing sites, it is possible that we could experience a production disruption that results in a reduction or elimination of the availability of some of our products. Should we not be able to obtain alternate production capability in a timely manner, or on favorable terms, a negative impact on our operations could result, including the potential for long-term loss of product placement with various customers.
The availability and cost of transportation for our products is vital to our success, and the loss of availability or increase in the cost of transportation could have an unfavorable impact on our business and results of operations.
Our ability to obtain adequate and reasonably priced methods of transportation to distribute our products is a key factor to our success. A substantial portion of our products requires the use of refrigerated trailers for shipping. Delays in transportation, including weather-related delays, could have a material adverse effect on our business and results of operations. Further, increased line haul costs due to industry capacity constraints and high fuel costs could also negatively impact our financial results. We are often required to pay fuel surcharges that fluctuate with the price of diesel fuel to third-party transporters of our products. These fuel surcharges can be substantial and would increase our cost of goods sold. If we were unable to pass those higher costs to our customers in the form of price increases, those higher costs could have a material adverse effect on our business and results of operations.
Our inability to successfully renegotiate collective bargaining contracts and any prolonged work stoppages or other business disruptions could have an adverse effect on our business and results of operations.
We believe that our labor relations with employees under collective bargaining contracts are satisfactory, but our inability to negotiate the renewal of these contracts could have a material adverse effect on our business and results of operations. Any prolonged work stoppages could also have an adverse effect on our results of operations. Our next labor contract negotiation relates to our Bedford Heights, Ohio plant facility, which produces various garlic bread products. The expiration date of this labor contract is April 30, 2016.
8
We are also subject to risks of other business disruptions associated with our dependence on our production facilities and our distribution systems. Natural disasters, terrorist activity or other unforeseen events could interrupt our production or distribution and have a material adverse effect on our business and results of operations, including the potential for long-term loss of product placement with our customers.
Technology failures could disrupt our operations and negatively impact our business.
We increasingly rely on information technology systems to conduct and manage our business operations, including the processing, transmitting, and storing of electronic information. For example, our sales group and our production and distribution facilities utilize information technology to increase efficiencies and limit costs. Furthermore, a significant portion of the communications between our personnel, customers, and suppliers depends on information technology. Our information technology systems may be vulnerable to a variety of interruptions due to events beyond our control, including, but not limited to, natural disasters, terrorist attacks, telecommunications failures and other security issues. If we are unable to adequately protect against these vulnerabilities, our operations could be disrupted, or we may suffer financial damage or loss because of lost or misappropriated information.
Cyber attacks or other breaches of network or other information technology security could have an adverse effect on our business.
Cyber attacks or other breaches of network or information technology security may cause equipment failures or disruptions to our operations. Our inability to operate our networks as a result of such events, even for a limited period of time, may result in significant expenses. Cyber attacks, which include the use of malware, computer viruses and other means for disruption or unauthorized access, have increased in frequency, scope and potential harm in recent years. To date, we have not been subject to cyber attacks or other cyber incidents that, individually or in the aggregate, have been material to our operations or financial condition. While we believe we take reasonable steps to protect the security of our information relative to our perceived risks, our preventative actions may be insufficient to defend against a major cyber attack in the future. The costs associated with a major cyber attack could include increased expenditures on cyber security measures, lost revenues from business interruption, litigation, regulatory fines and penalties and damage to our reputation. If we fail to prevent the theft of valuable information such as financial data, sensitive information about the Company and intellectual property, or if we fail to protect the privacy of customer, consumer and employee confidential data against breaches of network or information technology security, it would result in damage to our reputation and brand image, which could adversely impact our employee, customer and investor relations. Any of these occurrences could have a material adverse effect on our business, results of operations, financial condition and cash flows.
We are subject to Federal, state and local government regulations that could adversely affect our business and results of operations.
Our business operations are subject to regulation by various Federal, state and local government entities and agencies. As a producer of food products for human consumption, our operations are subject to stringent production, packaging, quality, labeling and distribution standards, including regulations promulgated under the Federal Food, Drug and Cosmetic Act and the Food Safety Modernization Act. We cannot predict whether future regulation by various Federal, state and local governmental entities and agencies would adversely affect our business and results of operations.
In addition, our business operations and the past and present ownership and operation of our properties, including idle properties, are subject to extensive and changing Federal, state and local environmental laws and regulations pertaining to the discharge of materials into the environment, the handling and disposition of wastes (including solid and hazardous wastes) or otherwise relating to protection of the environment. Although most of our properties have been subjected to periodic environmental assessments, these assessments may be limited in scope and may not include or identify all potential environmental liabilities or risks associated with any particular property. We cannot be certain that our environmental assessments have identified all potential environmental liabilities or that we will not incur material environmental liabilities in the future.
We cannot assure that environmental issues relating to presently known matters or identified sites or to other matters or sites will not require additional, currently unanticipated investigation, assessment or expenditures. If we do incur or discover any material environmental liabilities or potential environmental liabilities in the future, we may face significant remediation costs and find it difficult to sell or lease any affected properties.
Increased government regulations to limit carbon dioxide and other greenhouse gas emissions as a result of concern over climate change may result in increased compliance costs, capital expenditures and other financial obligations for us. We use significant amounts of water, natural gas, diesel fuel, and electricity in the manufacture and distribution of our products. Legislation or regulations affecting these inputs could affect our profitability. In addition, climate change legislation or regulations could affect our ability to procure needed commodities at costs and in quantities we currently experience and may require us to make additional unplanned expenditures.
9
We may incur liabilities related to multiemployer pension plans which could adversely affect our financial results.
We contribute to two multiemployer pension plans under certain collective bargaining contracts that provide pension benefits to employees and retired employees who are part of the plan. Generally, as a contributor, we are responsible for making periodic contributions to these plans. Our required contributions to these plans could increase, however, based upon a number of factors, including our ability to renegotiate collective bargaining contracts successfully, current and future regulatory requirements, the performance of the pension plan’s investments, the number of participants who are entitled to receive benefits from the plan, a shrinking contribution base as a result of the insolvency or withdrawal of other companies that currently contribute to these plans, the inability or failure of withdrawing companies to pay their withdrawal liability, low interest rates and other funding deficiencies. An increase in our required contributions to these plans could have a material adverse effect on our business, financial condition, results of operations and cash flows.
In addition, if we choose to voluntarily withdraw from a plan, we would be responsible for our proportionate share of the plan’s underfunded vested liability. We currently estimate that our liability for a complete withdrawal from both plans could exceed $14 million. However, that amount can vary at any given time based upon a number of factors, including current and future regulatory requirements, the performance of the pension plan’s investments, the number of participants who are entitled to receive benefits from the plan, the number of other contributors who participate in or withdraw from the plan and whether the plan is terminated. These factors may cause our withdrawal liability to increase, which could have a material adverse effect on our business, results of operations, financial condition and cash flow.
We may not be able to successfully consummate proposed acquisitions or divestitures and integrating acquired businesses may present financial, managerial and operational challenges.
We continually evaluate acquiring other businesses that would strategically fit within our operations. If we are unable to consummate, successfully integrate and grow these acquisitions and to realize contemplated revenue growth, synergies and cost savings, including without limitation with respect to our March 2015 acquisition of Flatout, our financial results could be adversely affected. In addition, we may, from time to time, divest businesses, product lines or other operations that are less of a strategic fit within our portfolio or do not meet our growth or profitability targets. As a result, our profitability may be impacted by either gains or losses on the sales of divested assets or lost operating income or cash flows from those businesses.
We may incur asset impairment or restructuring charges related to acquired or divested assets, which may reduce our profitability and cash flows. Finally, a buyer’s inability to fulfill contractual obligations that were assigned as part of a divestiture, including those relating to customer contracts, could lead to future financial loss on our part. These potential acquisitions or divestitures present financial, managerial and operational challenges, including diversion of management attention from ongoing businesses, difficulty with integrating or separating personnel and financial and other systems, increased expenses, assumption of unknown liabilities, indemnities and potential disputes with the buyers or sellers.
A future increase in our indebtedness could adversely affect our profitability and operational flexibility.
Although we did not have any outstanding debt as of June 30, 2015, we may incur indebtedness for a variety of reasons, including acquisitions or potential changes in capitalization that might require significant cash expenditures. A consequence of such indebtedness could be a reduction in the level of our profitability due to higher interest expense. Depending on the future extent and availability of our borrowings, we could also become more vulnerable to economic downturns, require a reduction in or curtailment of cash dividends or share repurchases, reduce or delay beneficial expansion or investment plans, or otherwise be unable to meet our obligations when due. For more information regarding our debt, see the “Liquidity and Capital Resources” section in Item 7 of this Annual Report on Form 10-K.
Restructuring and impairment charges could have a material adverse effect on our financial results.
We did not record any restructuring and impairment charges for the three-year period ended June 30, 2015. However, future events may occur that could adversely affect the reported value of our assets and require impairment charges. Such events may include, but are not limited to, strategic decisions made in response to changes in economic and competitive conditions, the impact of the economic environment on our customer base, or a material adverse change in our relationship with significant customers.
10
The loss of the services of one or more members of our senior management team could have a material adverse effect on our business, financial condition and results of operations.
Our operations and prospects depend in large part on the performance of our senior management team, several of which are long-serving employees with significant knowledge of our business model and operations. Should we not be able to find qualified replacements for any of these individuals if their services were no longer available, our ability to manage our operations or successfully execute our business strategy may be materially and adversely affected.
Mr. Gerlach, our Chief Executive Officer and Chairman of our Board of Directors, has a significant ownership interest in our Company.
As of June 30, 2015, Mr. Gerlach owned or controlled 30% of the outstanding shares of our common stock. Accordingly, Mr. Gerlach has significant influence on all matters submitted to a vote of the holders of our common stock, including the election of directors. Mr. Gerlach’s voting power also may have the effect of discouraging transactions involving an actual or a potential change of control of our Company, regardless of whether a premium is offered over then-current market prices.
The interests of Mr. Gerlach may conflict with the interests of other holders of our common stock. This conflict of interest may have an adverse effect on the price of our common stock.
Anti-takeover provisions could make it more difficult for a third party to acquire us.
Certain provisions of our charter documents, including provisions limiting the ability of shareholders to raise matters at a meeting of shareholders without giving advance notice and provisions classifying our Board of Directors, may make it more difficult for a third party to acquire us or influence our Board of Directors. This may have the effect of delaying or preventing changes of control or management, which could have an adverse effect on the market price of our stock.
Additionally, Ohio corporate law contains certain provisions that could have the effect of delaying or preventing a change of control. The Ohio Control Share Acquisition Act found in Chapter 1701 of the Ohio Revised Code provides that certain notice and informational filings and a special shareholder meeting and voting procedures must be followed prior to consummation of a proposed “control share acquisition,” as defined in the Ohio Revised Code. Assuming compliance with the prescribed notice and information filings, a proposed control share acquisition may be accomplished only if, at a special meeting of shareholders, the acquisition is approved by both a majority of the voting power represented at the meeting and a majority of the voting power remaining after excluding the combined voting power of the “interested shares,” as defined in the Ohio Revised Code. The Interested Shareholder Transactions Act found in Chapter 1704 of the Ohio Revised Code generally prohibits certain transactions, including mergers, majority share acquisitions and certain other control transactions, with an “interested shareholder,” as defined in the Ohio Revised Code, for a three-year period after becoming an interested shareholder, unless our Board of Directors approved the initial acquisition. After the three-year waiting period, such a transaction may require additional approvals under this Act, including approval by two-thirds of our voting shares and a majority of our voting shares not owned by the interested shareholder. The application of these provisions of the Ohio Revised Code, or any similar anti-takeover law adopted in Ohio, could have the effect of delaying or preventing a change of control, which could have an adverse effect on the market price of our stock.
Also, our Board of Directors has the authority to issue up to 1,150,000 shares of Class B Voting Preferred Stock and 1,150,000 shares of Class C Nonvoting Preferred Stock and to determine the price, rights, preferences, privileges and restrictions of those shares without any further vote or action by the shareholders. The rights of the holders of our common stock may be subject to, and may be adversely affected by, the rights of the holders of any Class B Voting Preferred Stock and Class C Nonvoting Preferred Stock that may be issued in the future. The Company could use these rights to put in place a shareholder rights plan, or “poison pill,” that could be used in connection with a bid or proposal of acquisition for an inadequate price.
Disruptions in the financial markets may adversely affect our ability to access capital in the future.
We may need financing in the future to conduct our operations, expand our business, or refinance future indebtedness. Disruptions in global financial markets and banking systems may make credit and capital markets more difficult for companies to access, even for some companies with established revolving or other credit facilities. Any sustained weakness in the general economic conditions and/or financial markets in the U.S. or globally could adversely affect our ability to raise capital on favorable terms or at all.
From time to time, we may rely on access to financial markets as a source of liquidity for working capital requirements, acquisitions, and general corporate purposes. Our access to funds under our revolving credit facility is dependent on the ability of the financial institutions that are parties to that facility to meet their funding commitments. The obligations of the financial institutions under our revolving credit facility are several and not joint and, as a result, a funding default by one or more institutions does not need to be made up by the others.
11
Long-term volatility and disruptions in the capital and credit markets as a result of uncertainty, changing or increased regulation of financial institutions, reduced alternatives, or failure of significant financial institutions could adversely affect our access to the liquidity that may be needed for our businesses in the longer term. Such disruptions could require us to take measures to conserve cash until the markets stabilize or until alternative credit arrangements or other funding for our business needs can be arranged. Disruptions in the capital and credit markets could result in higher interest rates on publicly issued debt securities and increased costs under credit facilities. Continuation of these disruptions could increase interest rates and the cost of capital and could adversely affect our results of operations and financial position.
Item 1B. Unresolved Staff Comments
None.
Item 2. Properties
We use 1.8 million square feet of space for our operations. Of this space, 0.5 million square feet are leased.
The following table summarizes our locations (including aggregation of multiple facilities) that are considered the principal manufacturing and warehousing operations of our Specialty Foods segment:
Location | Principal Products Involved | Terms of Occupancy | ||
Altoona, IA (4) | Frozen pasta | Owned/Leased | ||
Bedford Heights, OH (2) | Frozen breads | Owned/Leased | ||
Columbus, OH (2) | Sauces, dressings, dips, distribution of frozen foods | Owned/Leased | ||
Grove City, OH | Distribution of non-frozen foods | Owned | ||
Horse Cave, KY | Sauces, dressings, dips, frozen rolls | Owned | ||
Luverne, AL | Frozen rolls | Owned | ||
Milpitas, CA (5) | Sauces and dressings | Owned/Leased | ||
Saline, MI (1) | Flatbread wraps and pizza crusts | Owned/Leased | ||
Wareham, MA (3) | Croutons | Leased | ||
(1) | Part leased for term expiring in fiscal 2016 |
(2) | Part leased for term expiring in fiscal 2017 |
(3) | Fully leased for term expiring in fiscal 2019 |
(4) | Part leased for term expiring in fiscal 2020 |
(5) | Part leased for term expiring in fiscal 2021 |
Item 3. Legal Proceedings
From time to time we are a party to various legal proceedings. While we believe that the ultimate outcome of these various proceedings, individually and in the aggregate, will not have a material effect on our consolidated financial statements, litigation is always subject to inherent uncertainties, and unfavorable rulings could occur. An unfavorable ruling could include monetary damages or an injunction prohibiting us from manufacturing or selling one or more products or could lead to us altering the manner in which we manufacture or sell one or more products, which could have a material impact on net income for the period in which the ruling occurs and future periods.
Item 4. Mine Safety Disclosures
Not applicable.
12
PART II
Item 5. Market for Registrant’s Common Equity, Related Stockholder Matters and Issuer Purchases of Equity Securities
Our common stock trades on The NASDAQ Global Select Market under the symbol LANC. The following table sets forth the high and low prices for Lancaster Colony Corporation common shares and the dividends paid for each quarter of 2015 and 2014. Stock prices were provided by The NASDAQ Stock Market LLC.
Stock Prices | Dividends Paid Per Share | ||||||||||
High | Low | ||||||||||
2015 | |||||||||||
First Quarter | $ | 97.44 | $ | 84.48 | $ | 0.44 | |||||
Second Quarter | $ | 96.95 | $ | 81.96 | 0.46 | ||||||
Third Quarter | $ | 96.43 | $ | 86.85 | 0.46 | ||||||
Fourth Quarter | $ | 97.77 | $ | 87.23 | 0.46 | ||||||
Year | $ | 1.82 | |||||||||
2014 | |||||||||||
First Quarter | $ | 86.13 | $ | 70.29 | $ | 0.40 | |||||
Second Quarter | $ | 89.95 | $ | 76.56 | 0.44 | ||||||
Third Quarter | $ | 99.73 | $ | 81.91 | 0.44 | ||||||
Fourth Quarter | $ | 99.69 | $ | 85.12 | 0.44 | ||||||
Year | $ | 1.72 | |||||||||
The number of shareholders of record as of August 4, 2015 was approximately 780. This is not the actual number of beneficial owners of our common stock, as shares are held in “street name” by brokers and others on behalf of individual owners. The highest and lowest prices for our common stock from July 1, 2015 to August 4, 2015 were $95.43 and $89.62.
We have increased our regular cash dividends for 52 consecutive years. Future dividends will depend on our earnings, financial condition and other factors.
Issuer Purchases of Equity Securities
In November 2010, our Board of Directors approved a share repurchase authorization of 2,000,000 shares, of which 1,419,682 shares remained authorized for future repurchases at June 30, 2015. This share repurchase authorization does not have a stated expiration date. In the fourth quarter, we did not repurchase any of our common stock.
Period | Total Number of Shares Purchased | Average Price Paid Per Share | Total Number of Shares Purchased as Part of Publicly Announced Plans | Maximum Number of Shares that May Yet be Purchased Under the Plans | ||||||||
April 1-30, 2015 | — | $ | — | — | 1,419,682 | |||||||
May 1-31, 2015 | — | $ | — | — | 1,419,682 | |||||||
June 1-30, 2015 | — | $ | — | — | 1,419,682 | |||||||
Total | — | $ | — | — | 1,419,682 | |||||||
13
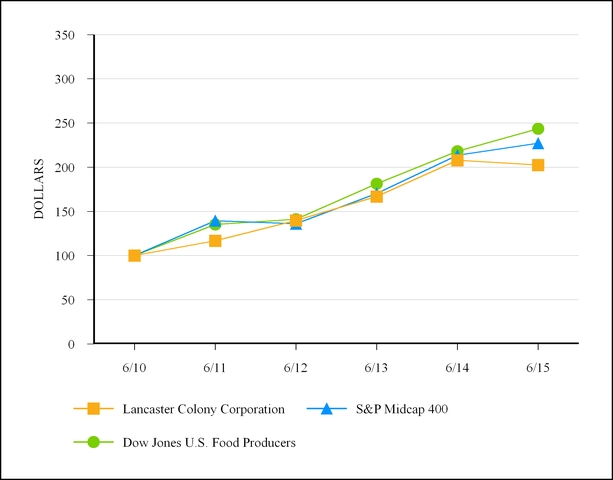
PERFORMANCE GRAPH
COMPARISON OF FIVE-YEAR CUMULATIVE TOTAL SHAREHOLDER RETURN
OF LANCASTER COLONY CORPORATION, THE S&P MIDCAP 400 INDEX
AND THE DOW JONES U.S. FOOD PRODUCERS INDEX
The graph set forth below compares the five-year cumulative total return from investing $100 on June 30, 2010 in each of our Common Stock, the S&P Midcap 400 Index and the Dow Jones U.S. Food Producers Index. It is assumed that all dividends are reinvested.
Cumulative Total Return (Dollars) | ||||||||||||
6/10 | 6/11 | 6/12 | 6/13 | 6/14 | 6/15 | |||||||
Lancaster Colony Corporation | 100.00 | 116.76 | 139.68 | 166.97 | 207.85 | 202.47 | ||||||
S&P Midcap 400 | 100.00 | 139.38 | 136.13 | 170.42 | 213.43 | 227.08 | ||||||
Dow Jones U.S. Food Producers | 100.00 | 135.30 | 141.23 | 181.43 | 218.21 | 243.53 | ||||||
There can be no assurance that our stock performance will continue into the future with the same or similar trends depicted in the above graph.
14
Item 6. Selected Financial Data
LANCASTER COLONY CORPORATION AND SUBSIDIARIES
FIVE YEAR FINANCIAL SUMMARY
Years Ended June 30, | |||||||||||||||||||
(Thousands Except Per Share Figures) | 2015 | 2014 | 2013 | 2012 | 2011 | ||||||||||||||
Operations | |||||||||||||||||||
Net Sales (1) | $ | 1,104,514 | $ | 1,041,075 | $ | 1,013,803 | $ | 988,937 | $ | 922,856 | |||||||||
Gross Margin (1) | $ | 257,692 | $ | 248,568 | $ | 244,707 | $ | 223,428 | $ | 223,785 | |||||||||
Percent of Net Sales | 23.3 | % | 23.9 | % | 24.1 | % | 22.6 | % | 24.2 | % | |||||||||
Income From Continuing Operations Before Income Taxes (1) | $ | 154,552 | $ | 153,279 | $ | 153,818 | $ | 141,216 | $ | 143,288 | |||||||||
Percent of Net Sales | 14.0 | % | 14.7 | % | 15.2 | % | 14.3 | % | 15.5 | % | |||||||||
Taxes Based on Income (1) | $ | 52,866 | $ | 52,293 | $ | 49,958 | $ | 48,867 | $ | 48,908 | |||||||||
Income From Continuing Operations (1) | $ | 101,686 | $ | 100,986 | $ | 103,860 | $ | 92,349 | $ | 94,380 | |||||||||
Percent of Net Sales | 9.2 | % | 9.7 | % | 10.2 | % | 9.3 | % | 10.2 | % | |||||||||
Continuing Operations Diluted Net Income Per Common Share (1) | $ | 3.72 | $ | 3.69 | $ | 3.79 | $ | 3.38 | $ | 3.41 | |||||||||
Cash Dividends Per Common Share - Regular | $ | 1.82 | $ | 1.72 | $ | 1.52 | $ | 1.41 | $ | 1.29 | |||||||||
Cash Dividends Per Common Share - Special | $ | — | $ | — | $ | 5.00 | $ | — | $ | — | |||||||||
Financial Position | |||||||||||||||||||
Total Assets | $ | 714,944 | $ | 638,630 | $ | 619,964 | $ | 682,635 | $ | 622,089 | |||||||||
Property, Plant and Equipment-Net (1) | $ | 172,311 | $ | 168,674 | $ | 168,074 | $ | 161,029 | $ | 161,064 | |||||||||
Property Additions (1) (2) | $ | 18,298 | $ | 15,645 | $ | 23,460 | $ | 15,506 | $ | 34,395 | |||||||||
Depreciation and Amortization (1) | $ | 21,111 | $ | 18,993 | $ | 17,617 | $ | 17,589 | $ | 15,513 | |||||||||
Long-Term Debt | $ | — | $ | — | $ | — | $ | — | $ | — | |||||||||
Shareholders’ Equity | $ | 580,918 | $ | 528,597 | $ | 501,222 | $ | 564,267 | $ | 517,539 | |||||||||
Per Common Share | $ | 21.23 | $ | 19.33 | $ | 18.34 | $ | 20.68 | $ | 18.90 | |||||||||
Weighted Average Common Shares Outstanding-Diluted | 27,327 | 27,308 | 27,285 | 27,265 | 27,689 | ||||||||||||||
(1) | Amounts exclude the impact of the discontinued Glassware & Candles segment operations for all years presented. |
(2) | Amount for 2015 excludes property of $6.9 million obtained in the Flatout acquisition. |
15
Item 7. Management’s Discussion and Analysis of Financial Condition and Results of Operations
Our fiscal year begins on July 1 and ends on June 30. Unless otherwise noted, references to “year” pertain to our fiscal year; for example, 2015 refers to fiscal 2015, which is the period from July 1, 2014 to June 30, 2015.
The following discussion should be read in conjunction with the “Selected Financial Data” in Item 6 and our consolidated financial statements and the notes thereto in Item 8 of this Annual Report on Form 10-K. The forward-looking statements in this section and other parts of this report involve risks, uncertainties and other factors, including statements regarding our plans, objectives, goals, strategies, and financial performance. Our actual results could differ materially from the results anticipated in these forward-looking statements as a result of factors set forth under the caption “Forward-Looking Statements” and those set forth in Item 1A.
OVERVIEW
Business Overview
Lancaster Colony Corporation is a manufacturer and marketer of specialty food products for the retail and foodservice markets.
We previously manufactured and marketed candles for the food, drug and mass markets until that business was sold on January 30, 2014. While much less significant, we also previously sold candles, glassware and various other products to customers in certain commercial markets. These commercial product lines were sold in May 2013. The financial results of these operations, previously included in our Glassware and Candles segment, are reported as discontinued operations for all periods presented herein.
Consistent with our current acquisition strategy, in March 2015 we acquired all of the issued and outstanding capital stock of Flatout Holdings, Inc. (“Flatout”), a privately owned manufacturer and marketer of flatbread wraps and pizza crusts based in Saline, Michigan. The purchase price was $92.2 million, net of cash acquired. This transaction is discussed in further detail in Note 2 to the consolidated financial statements.
We expect that part of our future growth will result from additional acquisitions. We continue to review potential acquisitions that we believe will complement our existing product lines, enhance our gross margins and/or offer good expansion opportunities in a manner that fits our overall strategic goals.
Our operations are organized into one reportable segment: “Specialty Foods.” Our sales are predominately domestic.
Our business has the potential to achieve future growth in sales and profitability due to attributes such as:
• | leading retail market positions in several branded products with a high-quality perception; |
• | recognized innovation in retail products; |
• | a broad customer base in both retail and foodservice accounts; |
• | well-regarded culinary expertise among foodservice accounts; |
• | recognized leadership in foodservice product development; |
• | experience in integrating complementary business acquisitions; and |
• | historically strong cash flow generation that supports growth opportunities. |
Our goal is to grow both retail and foodservice sales over time by:
• | leveraging the strength of our retail brands to increase current product sales; |
• | introducing new retail products and expanding into new channels; |
• | growing our foodservice sales through the strength of our reputation in product development and quality; and |
• | pursuing acquisitions that meet our strategic criteria. |
In retail markets, we utilize numerous branded products to support growth and maintain market competitiveness. We place great emphasis on our product innovation and development efforts so as to enhance growth by providing distinctive new products or extensions of our current product lines to meet the evolving needs and preferences of consumers.
Our foodservice sales primarily consist of products sold to restaurant chains, either directly or through distributors. Over the long-term, we have experienced broad-based growth in our foodservice sales, as we build on our strong reputation for product development and quality.
We have made substantial capital investments to support our existing food operations and future growth opportunities. For example, in 2015 we completed a significant processing capacity expansion at our Horse Cave, Kentucky dressing facility to help meet demand for our dressing products. In 2013 we expanded our crouton manufacturing capacity to provide capacity for potential future sales growth as well as improve operating efficiencies. Based on our current plans and expectations, we believe our capital expenditures for 2016 could total approximately $15 to $20 million. We anticipate we will be able to fund all of our capital needs in 2016 with cash generated from operations.
16
Summary of 2015 Results
Consolidated net sales reached $1,105 million during 2015, increasing by 6% as compared to prior-year net sales of $1,041 million, driven by growth in both retail and foodservice markets. Flatout was not material to the 2015 results.
Gross margin increased 4% to $257.7 million from the prior-year total of $248.6 million. The benefits of higher sales volumes were somewhat offset by the impact of dressing production capacity constraints, higher freight costs, increased placement costs for new products, certain nonrecurring charges related to Flatout and lower foodservice pricing.
Net income totaled $101.7 million in 2015, or $3.72 per diluted share, compared to net income of $75.0 million, or $2.74 per diluted share, in 2014, which included an after-tax loss on the sale of our candle manufacturing and marketing operations of $29.1 million. Net income in 2013 totaled $109.2 million, or $3.99 per diluted share.
Looking Forward
For 2016, we expect incremental benefit from our recently acquired Flatout business, as well as volume-driven growth from both retail and foodservice sales channels. We will also continue to consider acquisition opportunities that are consistent with our growth strategy and represent good value or otherwise provide significant strategic benefits. Among the many influences that may impact our ability to improve sales and operating margins in the coming year are the impact of higher egg costs resulting from the avian influenza outbreak, the success of our continued investment in innovation and new products, the integration and growth of Flatout and the level of efficiency gains we are ultimately able to achieve from our dressing capacity expansion and other cost-saving initiatives.
Based on current market conditions, we foresee modestly unfavorable material cost comparisons in 2016, due mainly to the impact of the outbreak of avian influenza on the price of eggs. However, we anticipate higher egg material costs to be offset, in part, beginning in the first quarter of the fiscal year by various pricing actions with our customers. Future changes in the cost of eggs, as well as other material costs, will be influenced by the climate, economy, regulatory environment and the pace of recovery of the egg producers from the avian influenza outbreak.
Overall, we continue to limit some of our exposure to volatile swings in food commodity costs through a structured purchasing program for certain key materials such as soybean oil and flour. Changes in other notable recurring costs, such as marketing, transportation and production costs, may also impact our overall results.
For a more-detailed discussion of the effect of commodity costs, see the “Impact of Inflation” section of this MD&A below.
We will continue to periodically reassess our allocation of capital to ensure that we maintain adequate operating flexibility while providing appropriate levels of cash returns to our shareholders, whether through share repurchases or cash dividends, including special dividends, if appropriate.
REVIEW OF CONSOLIDATED OPERATIONS
Net Sales and Gross Margin
Year Ended June 30, | Change | ||||||||||||||||||||||||
(Dollars in thousands) | 2015 | 2014 | 2013 | 2015 vs. 2014 | 2014 vs. 2013 | ||||||||||||||||||||
Net Sales | $ | 1,104,514 | $ | 1,041,075 | $ | 1,013,803 | $ | 63,439 | 6 | % | $ | 27,272 | 3 | % | |||||||||||
Gross Margin | $ | 257,692 | $ | 248,568 | $ | 244,707 | $ | 9,124 | 4 | % | $ | 3,861 | 2 | % | |||||||||||
Gross Margin as a Percentage of Net Sales | 23.3 | % | 23.9 | % | 24.1 | % | |||||||||||||||||||
2015 to 2014
In March 2015 we acquired Flatout and its results of operations have been included in our consolidated financial statements from the date of acquisition, but such results were not material to our consolidated financial statements, with Flatout contributing $13 million in net sales to our 2015 results.
Consolidated net sales for the year ended June 30, 2015 increased 6% to a new record of $1,105 million from the prior-year record total of $1,041 million. This growth was primarily driven by volume and mix. Retail net sales increased 6% due to higher sales of New York BRAND® frozen garlic bread and Olive Garden® retail dressings and the impact of Flatout, but were offset in part by increased promotional spending on some retail product offerings and by placement costs for new products. Foodservice net sales also improved 6% primarily due to increased sales to national chain restaurants. Our overall sales volume, as measured by pounds shipped, improved by 5%. Incremental net sales from Flatout accounted for less than 1% of the volume increase. The influence of a more favorable sales mix was estimated to be less than 1%. The net impact of pricing for
17
both retail and foodservice was insignificant. As a percentage of net sales, sales of retail products remained relatively unchanged at 51%.
Our gross margin as a percentage of net sales declined to 23.3% in 2015 compared with 23.9% in 2014 as the benefits from the improved sales volumes and modestly lower material costs were offset by increased operating costs due to capacity constraints in our dressing manufacturing, higher freight expense, increased placement costs for new products and certain nonrecurring charges related to Flatout. The higher levels of operating inefficiencies were most pronounced during the first half of 2015. We estimate that lower ingredient costs beneficially affected our gross margins by less than 1% of net sales.
2014 to 2013
Consolidated net sales for the year ended June 30, 2014 increased by 3% to a then record of $1,041 million from the prior-year record total of $1,014 million. In general, the overall increase was driven by higher sales volumes for both retail and foodservice. For our sales to the retail channel, which increased 2%, growth was achieved among several non-frozen product lines, including salad dressings and croutons. Sales of products for national account customers drove most of the increase of 3% in foodservice sales, although this was offset in part by lower pricing to these customers. As measured by pounds shipped, total volume is estimated to have improved by 4%. In 2014, deflationary trends affected net sales to the foodservice channel due to lower commodity costs. Lower foodservice pricing represented less than 1% of net sales in 2014. Similarly, the impact of pricing was slight on retail sales, although trade promotional intensity increased, in part to support a greater investment in new product introductions. As a percentage of net sales, sales of retail products declined slightly to 51% from 52% in 2013.
Our gross margin as a percentage of net sales was 23.9% in 2014 compared with 24.1% in 2013. The 2014 gross margin percentage reflected the improved sales volumes and favorable ingredient costs (especially for soybean oil, sweeteners and eggs), but these benefits were offset by increased trade promotion costs, which included increased costs related to new product introductions, and lower pricing in the foodservice channel, as well as increased distribution costs and plant inefficiencies. We estimate that lower material costs beneficially affected results by 1% of net sales.
Selling, General and Administrative Expenses
Year Ended June 30, | Change | ||||||||||||||||||||||||
(Dollars in thousands) | 2015 | 2014 | 2013 | 2015 vs. 2014 | 2014 vs. 2013 | ||||||||||||||||||||
SG&A Expenses | $ | 102,831 | $ | 94,801 | $ | 90,784 | $ | 8,030 | 8 | % | $ | 4,017 | 4 | % | |||||||||||
SG&A Expenses as a Percentage of Net Sales | 9.3 | % | 9.1 | % | 9.0 | % | |||||||||||||||||||
Selling, general and administrative expenses for 2015 totaled $102.8 million and increased 8% as compared with the 2014 total of $94.8 million, which had increased 4% from the 2013 total of $90.8 million. The 2015 increase in these costs reflected higher consumer promotional spending on new products, transaction expenses related to the Flatout acquisition and increased amortization expense attributable to the Flatout intangible assets. The 2014 increase was influenced by higher sales and greater marketing and personnel costs.
Operating Income
Year Ended June 30, | Change | ||||||||||||||||||||||||
(Dollars in thousands) | 2015 | 2014 | 2013 | 2015 vs. 2014 | 2014 vs. 2013 | ||||||||||||||||||||
Operating Income | |||||||||||||||||||||||||
Specialty Foods | $ | 167,095 | $ | 165,383 | $ | 165,710 | $ | 1,712 | 1 | % | $ | (327 | ) | — | % | ||||||||||
Corporate Expenses | (12,234 | ) | (11,616 | ) | (11,787 | ) | (618 | ) | 5 | % | 171 | (1 | )% | ||||||||||||
Total | $ | 154,861 | $ | 153,767 | $ | 153,923 | $ | 1,094 | 1 | % | $ | (156 | ) | — | % | ||||||||||
Operating Income as a Percentage of Net Sales | |||||||||||||||||||||||||
Specialty Foods | 15.1 | % | 15.9 | % | 16.3 | % | |||||||||||||||||||
Total | 14.0 | % | 14.8 | % | 15.2 | % | |||||||||||||||||||
Due to the factors discussed above, the Specialty Foods segment's operating income for 2015 totaled $167.1 million, a 1% increase from 2014 operating income of $165.4 million. The 2014 total was essentially comparable to the 2013 operating income of $165.7 million.
The level of the 2015 corporate expenses presented above was consistent with our expectations and was similar to those of 2014 and 2013.
18
Interest Income and Other – Net
Interest income and other was not material in 2015, 2014 and 2013 due to the nominal interest rates earned by us on our cash balances, our customers being largely invoiced in U.S. dollars and our capital structure.
Income From Continuing Operations Before Income Taxes
As affected by the factors discussed above, our income from continuing operations before income taxes for 2015 of $154.6 million increased 1% from the 2014 total of $153.3 million. The 2013 income from continuing operations before income taxes was $153.8 million.
Taxes Based on Income
Our effective tax rate was 34.2%, 34.1% and 32.5% in 2015, 2014 and 2013, respectively. The lower 2013 effective rate, compared to 2015 and 2014, was influenced by an increased deduction for dividends paid to our frozen ESOP Plan due to the $5.00 per share special dividend paid in December 2012, a higher qualified production activities deduction and a lower state rate, as influenced by the release of reserves associated with uncertain tax positions. See Note 9 to the consolidated financial statements for a reconciliation of the statutory effective rates for each year.
Income From Continuing Operations
As a result of a higher level of operating income and the changes in the effective tax rates discussed above, income from continuing operations for 2015 of $101.7 million increased modestly from 2014 income from continuing operations of $101.0 million. Income from continuing operations was $103.9 million in 2013. Diluted weighted average common shares outstanding for each of the years ended June 30, 2015, 2014 and 2013 have remained relatively stable. As a result, and due to the change in income from continuing operations for each year, diluted income from continuing operations per share totaled $3.72, $3.69 and $3.79 for 2015, 2014 and 2013, respectively.
Discontinued Operations
There were no discontinued operations in 2015. In 2014, we recorded a loss from discontinued operations of $26.0 million, net of tax, or $0.95 per diluted share, including an after-tax loss of $29.1 million on the sale of our candle manufacturing and marketing operations in January 2014. Income from discontinued operations, net of tax, was $3.1 million in 2014. In 2013, we recorded income from discontinued operations of $5.4 million, or $0.20 per diluted share.
Net Income
As influenced by the factors discussed above, net income for 2015 of $101.7 million increased from the 2014 net income of $75.0 million, which had decreased from 2013 net income of $109.2 million. Diluted net income per share totaled $3.72 in 2015, an increase from the 2014 total of $2.74 per diluted share due primarily to the 2014 loss on the sale of discontinued operations. The 2013 net income per share totaled $3.99 per diluted share.
FINANCIAL CONDITION
Liquidity and Capital Resources
We need to maintain sufficient flexibility in our future capital structure in order to ensure that our capitalization is adequate to support our future internal growth prospects, acquire food businesses consistent with our strategic goals, and maintain cash returns to our shareholders through cash dividends and share repurchases. Our balance sheet retained fundamental financial strength during 2015, and we ended the year with $182 million in cash and equivalents, along with shareholders’ equity of $581 million and no debt.
Under our unsecured revolving credit facility (“Facility”), we may borrow up to a maximum of $120 million at any one time. Loans may be used for general corporate purposes. We had no borrowings outstanding under this Facility at June 30, 2015. At June 30, 2015, we had $4.7 million of standby letters of credit outstanding, which reduced the amount available for borrowing on the Facility. The Facility expires in April 2017, and all outstanding amounts are then due and payable. Interest is variable based upon formulas tied to LIBOR or an alternative base rate defined in the credit agreement, at our option. We must also pay facility fees that are tied to our then-applicable consolidated leverage ratio. When we have outstanding borrowings under this Facility, they will be classified as long-term debt due to the long-term nature of this Facility.
The Facility contains certain restrictive covenants, including limitations on indebtedness, asset sales and acquisitions, and financial covenants relating to interest coverage and leverage. At June 30, 2015, we were in compliance with all applicable provisions and covenants of the Facility, and we exceeded the requirements of the financial covenants by substantial margins.
We currently expect to remain in compliance with the Facility’s covenants for the foreseeable future. However, a default under the Facility could accelerate the repayment of any outstanding indebtedness and limit our access to additional credit
19
available under the Facility. Such an event could require a reduction in or curtailment of cash dividends or share repurchases, reduce or delay beneficial expansion or investment plans, or otherwise impact our ability to meet our obligations when due. At June 30, 2015, we were not aware of any event that would constitute a default under the Facility.
We believe that internally generated funds and our existing balances in cash and equivalents, in addition to our currently available bank credit arrangements, should be adequate to meet our cash requirements through 2016. If we were to borrow outside of our Facility under current market terms, our average interest rate may increase significantly and have an adverse effect on our results of operations.
Cash Flows
Year Ended June 30, | Change | ||||||||||||||||||||||||
(Dollars in thousands) | 2015 | 2014 | 2013 | 2015 vs. 2014 | 2014 vs. 2013 | ||||||||||||||||||||
Provided By Operating Activities | $ | 132,772 | $ | 129,091 | $ | 131,682 | $ | 3,681 | 3 | % | $ | (2,591 | ) | (2 | )% | ||||||||||
(Used In) Provided By Investing Activities | $ | (112,325 | ) | $ | 8,475 | $ | (22,378 | ) | $ | (120,800 | ) | N/M | $ | 30,853 | 138 | % | |||||||||
Used In Financing Activities | $ | (49,784 | ) | $ | (49,412 | ) | $ | (177,554 | ) | $ | (372 | ) | (1 | )% | $ | 128,142 | 72 | % | |||||||
Cash flow provided by operating activities remains the primary source of financing for our internal growth.
Cash provided by operating activities in 2015 totaled $132.8 million, an increase of 3% as compared with the 2014 total of $129.1 million, which decreased 2% from the 2013 total of $131.7 million. The change in cash provided by operating activities from the prior year was largely influenced by the discontinued operations resulting from the sale of our candle manufacturing and marketing operations, which were sold in January 2014. See Note 3 to the consolidated financial statements for further information regarding this sale. The 2014 cash provided by operating activities, as reflective of the discontinued operations, was also impacted by the relative changes in working capital, particularly accounts receivable and accrued liabilities and the change in net income from 2013.
Cash used in investing activities totaled $112.3 million in 2015 as compared to a source of $8.5 million in 2014 and a use of $22.4 million in 2013. The cash used in investing activities in 2015 reflects $92.2 million paid for the acquisition of Flatout in March 2015, as well as a higher level of capital expenditures in 2015, the majority of this being spent on our processing capacity expansion project at our Horse Cave, Kentucky dressing facility which was essentially complete at December 31, 2014. The 2014 increase in cash provided by investing activities is due to the proceeds from the sale of our candle manufacturing and marketing operations, as well as a decrease in capital expenditures from the 2013 level, which included expenditures for expanded crouton manufacturing capacity. Capital expenditures totaled $18.3 million in 2015, compared to $16.0 million in 2014 and $24.1 million in 2013. Based on our current plans and expectations, we believe our capital expenditures for 2016 could total approximately $15 to $20 million.
Financing activities used net cash totaling $49.8 million, $49.4 million and $177.6 million in 2015, 2014 and 2013, respectively. The higher level in 2013 was primarily due to the $5.00 per share special dividend that was paid in December 2012. The dividend payout rate for 2015 was $1.82 per share as compared to $1.72 per share in 2014 and $1.52 per share, excluding the special dividend, in 2013. This past fiscal year marked the 52nd consecutive year in which our dividend rate was increased. Cash utilized for share repurchases totaled $0.6 million, $3.1 million and $0.6 million in 2015, 2014 and 2013, respectively. Our Board of Directors approved a share repurchase authorization of 2,000,000 shares in November 2010. At June 30, 2015, 1,419,682 shares from this authorization remained authorized for future purchase.
The future levels of share repurchases and declared dividends are subject to the periodic review of our Board of Directors and are generally determined after an assessment is made of various factors, such as anticipated earnings levels, cash flow requirements and general business conditions.
Our ongoing business activities continue to be subject to compliance with various laws, rules and regulations as may be issued and enforced by various Federal, state and local agencies. With respect to environmental matters, costs are incurred pertaining to regulatory compliance and, upon occasion, remediation. Such costs have not been, and are not anticipated to become, material.
We are contingently liable with respect to lawsuits, taxes and various other matters that routinely arise in the normal course of business. We do not have any related party transactions that materially affect our results of operations, cash flow or financial condition.
20
OFF-BALANCE SHEET ARRANGEMENTS, CONTRACTUAL OBLIGATIONS AND COMMITMENTS
We do not have off-balance sheet arrangements, financings, or other relationships with unconsolidated entities or other persons, also known as “Variable Interest Entities,” that have or are reasonably likely to have a current or future material effect on our financial condition, changes in financial condition, revenues or expenses, results of operations, liquidity or capital expenditures.
We have various contractual obligations that are appropriately recorded as liabilities in our consolidated financial statements. Certain other items, such as purchase obligations, are not recognized as liabilities in our consolidated financial statements. Examples of items not recognized as liabilities in our consolidated financial statements are commitments to purchase raw materials or inventory that has not yet been received as of June 30, 2015 and future minimum lease payments for the use of property and equipment under operating lease agreements.
The following table summarizes our contractual obligations as of June 30, 2015 (dollars in thousands):
Payment Due by Period | |||||||||||||||||||
Contractual Obligations | Total | Less than 1 Year | 1-3 Years | 3-5 Years | More than 5 Years | ||||||||||||||
Operating Lease Obligations (1) | $ | 15,548 | $ | 4,754 | $ | 6,608 | $ | 3,902 | $ | 284 | |||||||||
Purchase Obligations (2) | 130,730 | 122,685 | 7,420 | 625 | — | ||||||||||||||
Other Noncurrent Liabilities (as reflected on Consolidated Balance Sheet) (3) | 647 | — | 647 | — | — | ||||||||||||||
Total | $ | 146,925 | $ | 127,439 | $ | 14,675 | $ | 4,527 | $ | 284 | |||||||||
(1) | Operating leases are primarily entered into for warehouse and office facilities and certain equipment. See Note 5 to the consolidated financial statements for further information. |
(2) | Purchase obligations represent purchase orders and longer-term purchase arrangements related to the procurement of raw materials, supplies, services, and property, plant and equipment. |
(3) | This amount does not include $23.0 million of other noncurrent liabilities recorded on the balance sheet, which consist of the underfunded pension liability, other post employment benefit obligations, tax liabilities, noncurrent workers compensation obligations, deferred compensation and interest on deferred compensation. These items are excluded, as it is not certain when these liabilities will become due. See Notes 9, 12, 13 and 14 to the consolidated financial statements for further information. |
IMPACT OF INFLATION
Our business results can be influenced by significant changes in the costs of our raw materials. We attempt to mitigate the impact of inflation on our raw materials by entering into longer-term fixed-price contracts for a portion of our most significant commodities, soybean oil and flour. However, we remain exposed to events and trends in the marketplace for our other raw-material and packaging costs. While we attempt to pass through sustained increases in material costs via price adjustments on our retail and foodservice products, such price adjustments will often lag the changes in the related input costs.
For 2015, 2014 and 2013 the net impact of inflation was not significant. As we transition from 2015 to 2016 we have seen a marked increase in the price of egg-based ingredients due to a significant outbreak of avian influenza in the United States. We continue to assess the ongoing impact of this event, as well as the impact of pricing adjustments we plan to pass through to our retail and foodservice customers.
We are also exposed to the impacts of general inflation, especially in the areas of annual wage adjustments and benefit costs. Over time, we attempt to minimize the exposure to such cost increases through greater manufacturing and distribution efficiencies, the improvement of work processes and strategic investments in plant equipment.
CRITICAL ACCOUNTING POLICIES AND ESTIMATES
This MD&A discusses our consolidated financial statements, which have been prepared in accordance with U.S. generally accepted accounting principles. The preparation of these consolidated financial statements requires that we make estimates and assumptions that affect the reported amounts of assets and liabilities and the disclosure of contingent assets and liabilities at the date of the consolidated financial statements and the reported amounts of revenues and expenses during the reporting period. On an ongoing basis, we evaluate our estimates and judgments, including, but not limited to, those related to accounts receivable, inventories, marketing and distribution costs, asset impairments and self-insurance reserves. We base our estimates and judgments on historical experience and on various other factors that are believed to be reasonable under the
21
circumstances, the results of which form the basis for making judgments about the carrying value of assets and liabilities that are not readily apparent from other sources. Actual results may differ from these estimates under different assumptions or conditions. Historically, the aggregate differences, if any, between our estimates and actual amounts in any year have not had a significant impact on our consolidated financial statements. While a summary of our significant accounting policies can be found in Note 1 to the consolidated financial statements, we believe the following critical accounting policies, among others, affect our more significant judgments and estimates used in the preparation of our consolidated financial statements.
Revenue Recognition
We recognize revenue upon transfer of title and risk of loss, provided that evidence of an arrangement exists, pricing is fixed or determinable, and collectability is probable. Net sales are recorded net of estimated sales discounts, returns, trade promotions and certain other sales incentives, including coupon redemptions and rebates.
Receivables and Related Allowances
We evaluate the adequacy of our allowances for customer deductions considering several factors including historical experience, specific trade programs and existing customer relationships. We also provide an allowance for doubtful accounts based on the aging of accounts receivable balances, historical write-off experience and on-going reviews of our trade receivables. Measurement of potential losses requires credit review of existing customer relationships, consideration of historical loss experience, including the need to adjust for current conditions, and judgments about the probable effects of relevant observable data, including present economic conditions such as delinquency rates and the economic health of customers.
Goodwill and Other Intangible Assets
Goodwill is not amortized. It is evaluated annually at April 30, by applying impairment testing procedures, as appropriate. Other intangible assets are amortized on a straight-line basis over their estimated useful lives to Selling, General and Administrative Expenses. We evaluate the future economic benefit of the recorded goodwill and other intangible assets when events or circumstances indicate potential recoverability concerns. Carrying amounts are adjusted appropriately when determined to have been impaired.
Accrued Distribution
We often incur various freight and other related costs associated with shipping products to the customer. We provide accruals for the costs of distribution based on historical information as may be modified by estimates of actual costs incurred.
Accruals for Self-Insurance
Self-insurance accruals are made for certain claims associated with employee health care, workers’ compensation and general liability insurance. These accruals include estimates that may be based on historical loss development factors.
Accounting for Pension Plans and Other Postretirement Benefit Plans
To determine our ultimate obligation under our defined benefit pension plans and our other postretirement benefit plans, we must estimate the future cost of benefits and attribute that cost to the time period during which each covered employee works. To record the related net assets and obligation of such benefit plans, we use assumptions related to inflation, investment returns, mortality, employee turnover, medical costs and discount rates. To determine the discount rate, we, along with our third-party actuaries, consider several factors, including the current rates of various bond indices, such as the Moody’s Aa long-term bond index, yield curve analysis results from our actuaries based on expected cash flows of our plans, and the past history of discount rates used for the plan valuation. We, along with our third-party actuaries, review all of these assumptions on an ongoing basis to ensure that the most reasonable information available is being considered. Changes in assumptions and future investment returns could potentially have a material impact on pension expense and related funding requirements. We recognize the overfunded or underfunded status of our defined benefit plans as an asset or liability in our Consolidated Balance Sheets. Any changes in that funded status caused by subsequent plan revaluations are recognized through comprehensive income. We may also experience future plan settlements or curtailments having unanticipated effects on operating results.
RECENTLY ISSUED ACCOUNTING STANDARDS
In July 2015, the Financial Accounting Standards Board (“FASB”) issued new accounting guidance which requires entities to measure most inventory “at the lower of cost or net realizable value,” thereby simplifying current guidance. Under current guidance an entity must measure inventory at the lower of cost or market, where market is defined as one of three different measures, one of which is net realizable value. The guidance will be effective prospectively for fiscal years, and interim periods within those years, beginning after December 15, 2016. We are currently evaluating the impact of this guidance.
22
In May 2014, the FASB issued new accounting guidance for the recognition of revenue under the principle: “Recognize revenue to depict the transfer of promised goods or services to customers in an amount that reflects the consideration to which the entity expects to be entitled in exchange for those goods or services.” Following a one-year deferral of the effective date, the guidance will be effective for fiscal years, and interim periods within those years, beginning after December 15, 2017 and will require either retrospective application to each prior period presented or retrospective application with the cumulative effect of initially applying the standard recognized at the date of adoption. We are currently evaluating the impact of this guidance.
RECENTLY ADOPTED ACCOUNTING STANDARDS
There were no recently adopted accounting pronouncements that impacted our consolidated financial statements.
FORWARD-LOOKING STATEMENTS
We desire to take advantage of the “safe harbor” provisions of the Private Securities Litigation Reform Act of 1995 (the “PSLRA”). This Annual Report on Form 10-K contains various “forward-looking statements” within the meaning of the PSLRA and other applicable securities laws. Such statements can be identified by the use of the forward-looking words “anticipate,” “estimate,” “project,” “believe,” “intend,” “plan,” “expect,” “hope” or similar words. These statements discuss future expectations; contain projections regarding future developments, operations or financial conditions; or state other forward-looking information. Such statements are based upon assumptions and assessments made by us in light of our experience and perception of historical trends, current conditions, expected future developments and other factors we believe to be appropriate. These forward-looking statements involve various important risks, uncertainties and other factors that could cause our actual results to differ materially from those expressed in the forward-looking statements. Actual results may differ as a result of factors over which we have no, or limited, control including, without limitation, the specific influences outlined below. Management believes these forward-looking statements to be reasonable; however, one should not place undue reliance on such statements that are based on current expectations. Forward-looking statements speak only as of the date they are made, and we undertake no obligation to update such forward-looking statements, except as required by law.
Items which could impact these forward-looking statements include, but are not limited to, those risk factors identified in Item 1A and:
• | fluctuations in the cost and availability of egg-based ingredients; |
• | fluctuations in the cost and availability of other raw materials and packaging; |
• | the reaction of customers or consumers to the effect of price increases we may implement; |
• | the potential for loss of larger programs or key customer relationships; |
• | the effect of consolidation of customers within key market channels; |
• | price and product competition; |
• | the success and cost of new product development efforts; |
• | the lack of market acceptance of new products; |
• | the possible occurrence of product recalls or other defective or mislabeled product costs; |
• | changes in demand for our products, which may result from loss of brand reputation or customer goodwill; |
• | maintenance of competitive position with respect to other manufacturers; |
• | adverse changes in freight, energy or other costs of producing, distributing or transporting our products; |
• | capacity constraints that may affect our ability to meet demand or may increase our costs; |
• | dependence on contract manufacturers; |
• | efficiencies in plant operations; |
• | stability of labor relations; |
• | the outcome of any litigation or arbitration; |
• | the impact of fluctuations in our pension plan asset values on funding levels, contributions required and benefit costs; |
• | the ability to successfully integrate and grow the Flatout business; |
• | the extent to which future business acquisitions are completed and acceptably integrated; |
• | dependence on key personnel; |
• | changes in financial markets; |
• | access to any required financing; |
• | changes in estimates in critical accounting judgments; and |
• | certain other risk factors, including those discussed in other filings we have submitted to the Securities and Exchange Commission. |
23
Item 7A. Quantitative and Qualitative Disclosures About Market Risk
We have exposure to market risks primarily from changes in raw material prices. In recent years, due to the absence of any borrowings, we have not had exposure to changes in interest rates. We also have not had exposure to market risk associated with derivative financial instruments or derivative commodity instruments.
RAW MATERIAL PRICE RISK
We purchase a variety of commodities and other raw materials, such as soybean oil, flour and dairy-based materials, which we use to manufacture our products. The market prices for these commodities are subject to fluctuation based upon a number of economic factors and may become volatile at times. As we transition from 2015 to 2016 we have seen a marked increase in the price of egg-based ingredients due to a significant outbreak of avian influenza in the United States. While we do not use any derivative commodity instruments to hedge against commodity price risk, we do actively manage a portion of the risk through a structured purchasing program for certain key materials such as soybean oil and flour. This program gives us more predictable input costs, which may help stabilize our short-term margins during periods of volatility in commodity markets.
Item 8. Financial Statements and Supplementary Data
24
REPORT OF INDEPENDENT REGISTERED PUBLIC ACCOUNTING FIRM
To the Board of Directors and Shareholders of
Lancaster Colony Corporation
Columbus, Ohio
We have audited the accompanying consolidated balance sheets of Lancaster Colony Corporation and subsidiaries (the “Company”) as of June 30, 2015 and 2014 and the related consolidated statements of income, comprehensive income, shareholders’ equity, and cash flows for each of the three years in the period ended June 30, 2015. Our audits also included the financial statement schedule listed in the table of contents at Item 15. These consolidated financial statements and financial statement schedule are the responsibility of the Company’s management. Our responsibility is to express an opinion on these consolidated financial statements and financial statement schedule based on our audits.
We conducted our audits in accordance with the standards of the Public Company Accounting Oversight Board (United States). Those standards require that we plan and perform the audit to obtain reasonable assurance about whether the consolidated financial statements are free of material misstatement. An audit includes examining, on a test basis, evidence supporting the amounts and disclosures in the consolidated financial statements. An audit also includes assessing the accounting principles used and significant estimates made by management, as well as evaluating the overall financial statement presentation. We believe that our audits provide a reasonable basis for our opinion.
In our opinion, such consolidated financial statements present fairly, in all material respects, the financial position of the Company as of June 30, 2015 and 2014, and the results of its operations and its cash flows for each of the three years in the period ended June 30, 2015, in conformity with accounting principles generally accepted in the United States of America. Also, in our opinion, such financial statement schedule, when considered in relation to the basic consolidated financial statements taken as a whole, presents fairly, in all material respects, the information set forth therein.
We have also audited, in accordance with the standards of the Public Company Accounting Oversight Board (United States), the Company’s internal control over financial reporting as of June 30, 2015, based on the criteria established in Internal Control - Integrated Framework (2013) issued by the Committee of Sponsoring Organizations of the Treadway Commission and our report dated August 28, 2015, expressed an unqualified opinion on the Company’s internal control over financial reporting.
/s/ Deloitte & Touche LLP |
Deloitte & Touche LLP |
Columbus, Ohio
August 28, 2015
25
LANCASTER COLONY CORPORATION AND SUBSIDIARIES
CONSOLIDATED BALANCE SHEETS
June 30, | |||||||
(Amounts in thousands, except share data) | 2015 | 2014 | |||||
ASSETS | |||||||
Current Assets: | |||||||
Cash and equivalents | $ | 182,202 | $ | 211,539 | |||
Receivables (less allowance for doubtful accounts, 2015-$206; 2014-$432) | 62,437 | 57,808 | |||||
Inventories: | |||||||
Raw materials | 30,655 | 28,069 | |||||
Finished goods | 47,244 | 46,447 | |||||
Total inventories | 77,899 | 74,516 | |||||
Deferred income taxes and other current assets | 20,460 | 23,428 | |||||
Total current assets | 342,998 | 367,291 | |||||
Property, Plant and Equipment: | |||||||
Land, buildings and improvements | 113,844 | 107,690 | |||||
Machinery and equipment | 253,143 | 238,791 | |||||
Total cost | 366,987 | 346,481 | |||||
Less accumulated depreciation | 194,676 | 177,807 | |||||
Property, plant and equipment-net | 172,311 | 168,674 | |||||
Other Assets: | |||||||
Goodwill | 143,788 | 89,840 | |||||
Other intangible assets-net | 47,771 | 5,376 | |||||
Other noncurrent assets | 8,076 | 7,449 | |||||
Total | $ | 714,944 | $ | 638,630 | |||
LIABILITIES AND SHAREHOLDERS’ EQUITY | |||||||
Current Liabilities: | |||||||
Accounts payable | $ | 38,823 | $ | 37,907 | |||
Accrued liabilities | 35,821 | 31,165 | |||||
Total current liabilities | 74,644 | 69,072 | |||||
Other Noncurrent Liabilities | 23,654 | 22,208 | |||||
Deferred Income Taxes | 35,728 | 18,753 | |||||
Commitments and Contingencies | |||||||
Shareholders’ Equity: | |||||||
Preferred stock-authorized 3,050,000 shares; outstanding-none | |||||||
Common stock-authorized 75,000,000 shares; outstanding-2015-27,360,581 shares; 2014-27,339,421 shares | 107,767 | 104,789 | |||||
Retained earnings | 1,219,119 | 1,167,211 | |||||
Accumulated other comprehensive loss | (10,057 | ) | (8,061 | ) | |||
Common stock in treasury, at cost | (735,911 | ) | (735,342 | ) | |||
Total shareholders’ equity | 580,918 | 528,597 | |||||
Total | $ | 714,944 | $ | 638,630 | |||
See accompanying notes to consolidated financial statements.
26
LANCASTER COLONY CORPORATION AND SUBSIDIARIES
CONSOLIDATED STATEMENTS OF INCOME
Years Ended June 30, | |||||||||||
(Amounts in thousands, except per share data) | 2015 | 2014 | 2013 | ||||||||
Net Sales | $ | 1,104,514 | $ | 1,041,075 | $ | 1,013,803 | |||||
Cost of Sales | 846,822 | 792,507 | 769,096 | ||||||||
Gross Margin | 257,692 | 248,568 | 244,707 | ||||||||
Selling, General and Administrative Expenses | 102,831 | 94,801 | 90,784 | ||||||||
Operating Income | 154,861 | 153,767 | 153,923 | ||||||||
Interest Income and Other-Net | (309 | ) | (488 | ) | (105 | ) | |||||
Income From Continuing Operations Before Income Taxes | 154,552 | 153,279 | 153,818 | ||||||||
Taxes Based on Income | 52,866 | 52,293 | 49,958 | ||||||||
Income From Continuing Operations | 101,686 | 100,986 | 103,860 | ||||||||
Discontinued Operations, Net of Tax: | |||||||||||
Income from discontinued operations | — | 3,058 | 5,389 | ||||||||
Loss on sale of discontinued operations | — | (29,058 | ) | — | |||||||
Total discontinued operations | — | (26,000 | ) | 5,389 | |||||||
Net Income | $ | 101,686 | $ | 74,986 | $ | 109,249 | |||||
Income Per Common Share From Continuing Operations: | |||||||||||
Basic | $ | 3.72 | $ | 3.70 | $ | 3.80 | |||||
Diluted | $ | 3.72 | $ | 3.69 | $ | 3.79 | |||||
(Loss) Income Per Common Share From Discontinued Operations: | |||||||||||
Basic and diluted | $ | — | $ | (0.95 | ) | $ | 0.20 | ||||
Net Income Per Common Share: | |||||||||||
Basic | $ | 3.72 | $ | 2.75 | $ | 4.00 | |||||
Diluted | $ | 3.72 | $ | 2.74 | $ | 3.99 | |||||
Weighted Average Common Shares Outstanding: | |||||||||||
Basic | 27,300 | 27,264 | 27,252 | ||||||||
Diluted | 27,327 | 27,308 | 27,285 | ||||||||
See accompanying notes to consolidated financial statements.
27
LANCASTER COLONY CORPORATION AND SUBSIDIARIES
CONSOLIDATED STATEMENTS OF COMPREHENSIVE INCOME
Years Ended June 30, | |||||||||||
(Amounts in thousands) | 2015 | 2014 | 2013 | ||||||||
Net Income | $ | 101,686 | $ | 74,986 | $ | 109,249 | |||||
Other Comprehensive (Loss) Income: | |||||||||||
Defined Benefit Pension and Postretirement Benefit Plans: | |||||||||||
Net (loss) gain arising during the period, before tax | (3,563 | ) | 96 | 5,322 | |||||||
Amortization of loss, before tax | 401 | 433 | 665 | ||||||||
Amortization of transition asset, before tax | — | — | (1 | ) | |||||||
Amortization of prior service asset, before tax | (5 | ) | (5 | ) | (5 | ) | |||||
Total Other Comprehensive (Loss) Income, Before Tax | (3,167 | ) | 524 | 5,981 | |||||||
Tax Attributes of Items in Other Comprehensive (Loss) Income: | |||||||||||
Net (loss) gain arising during the period, tax | 1,318 | (36 | ) | (1,965 | ) | ||||||
Amortization of loss, tax | (149 | ) | (160 | ) | (247 | ) | |||||
Amortization of transition asset, tax | — | — | — | ||||||||
Amortization of prior service asset, tax | 2 | 2 | 2 | ||||||||
Total Tax Benefit (Expense) | 1,171 | (194 | ) | (2,210 | ) | ||||||
Other Comprehensive (Loss) Income, Net of Tax | (1,996 | ) | 330 | 3,771 | |||||||
Comprehensive Income | $ | 99,690 | $ | 75,316 | $ | 113,020 | |||||
See accompanying notes to consolidated financial statements.
28
LANCASTER COLONY CORPORATION AND SUBSIDIARIES
CONSOLIDATED STATEMENTS OF CASH FLOWS
Years Ended June 30, | |||||||||||
(Amounts in thousands) | 2015 | 2014 | 2013 | ||||||||
Cash Flows From Operating Activities: | |||||||||||
Net income | $ | 101,686 | $ | 74,986 | $ | 109,249 | |||||
Adjustments to reconcile net income to net cash provided by operating activities: | |||||||||||
Depreciation and amortization | 21,111 | 20,407 | 20,114 | ||||||||
Deferred income taxes and other noncash changes | 306 | 2,720 | 1,278 | ||||||||
Stock-based compensation expense | 3,040 | 2,472 | 2,901 | ||||||||
Excess tax benefit from stock-based compensation | (563 | ) | (1,020 | ) | (794 | ) | |||||
(Gain) loss on sale of property | — | (6 | ) | 753 | |||||||
Loss on sale of discontinued operations | — | 44,033 | — | ||||||||
Pension plan activity | (591 | ) | (243 | ) | (61 | ) | |||||
Changes in operating assets and liabilities: | |||||||||||
Receivables | (1,900 | ) | (6,881 | ) | 1,522 | ||||||
Inventories | 366 | 1,122 | (1,321 | ) | |||||||
Other current assets | 5,229 | (1,147 | ) | (4,853 | ) | ||||||
Accounts payable and accrued liabilities | 4,088 | (7,352 | ) | 2,894 | |||||||
Net cash provided by operating activities | 132,772 | 129,091 | 131,682 | ||||||||
Cash Flows From Investing Activities: | |||||||||||
Cash paid for acquisition, net of cash acquired | (92,217 | ) | — | — | |||||||
Payments on property additions | (18,298 | ) | (15,961 | ) | (24,147 | ) | |||||
Proceeds from sale of property | — | 6 | 2,836 | ||||||||
Proceeds from sale of discontinued operations | — | 25,610 | — | ||||||||
Other-net | (1,810 | ) | (1,180 | ) | (1,067 | ) | |||||
Net cash (used in) provided by investing activities | (112,325 | ) | 8,475 | (22,378 | ) | ||||||
Cash Flows From Financing Activities: | |||||||||||
Purchase of treasury stock | (569 | ) | (3,120 | ) | (609 | ) | |||||
Payment of dividends | (49,778 | ) | (46,988 | ) | (178,063 | ) | |||||
Excess tax benefit from stock-based compensation | 563 | 1,020 | 794 | ||||||||
(Decrease) increase in cash overdraft balance | — | (324 | ) | 324 | |||||||
Net cash used in financing activities | (49,784 | ) | (49,412 | ) | (177,554 | ) | |||||
Net change in cash and equivalents | (29,337 | ) | 88,154 | (68,250 | ) | ||||||
Cash and equivalents at beginning of year | 211,539 | 123,385 | 191,635 | ||||||||
Cash and equivalents at end of year | $ | 182,202 | $ | 211,539 | $ | 123,385 | |||||
See accompanying notes to consolidated financial statements.
29
LANCASTER COLONY CORPORATION AND SUBSIDIARIES
CONSOLIDATED STATEMENTS OF SHAREHOLDERS’ EQUITY
(Amounts in thousands, except per share data) | Common Stock Outstanding | Retained Earnings | Accumulated Other Comprehensive Loss | Treasury Stock | Total Shareholders’ Equity | ||||||||||||||||||
Shares | Amount | ||||||||||||||||||||||
Balance, June 30, 2012 | 27,287 | $ | 100,015 | $ | 1,208,027 | $ | (12,162 | ) | $ | (731,613 | ) | $ | 564,267 | ||||||||||
Net income | 109,249 | 109,249 | |||||||||||||||||||||
Net pension and postretirement benefit gains, net of $2,210 tax effect | 3,771 | 3,771 | |||||||||||||||||||||
Cash dividends - common stock ($6.52 per share) | (178,063 | ) | (178,063 | ) | |||||||||||||||||||
Purchase of treasury stock | (8 | ) | (609 | ) | (609 | ) | |||||||||||||||||
Stock-based plans, including excess tax benefits | 45 | (294 | ) | (294 | ) | ||||||||||||||||||
Stock-based compensation expense | 2,901 | 2,901 | |||||||||||||||||||||
Balance, June 30, 2013 | 27,324 | 102,622 | 1,139,213 | (8,391 | ) | (732,222 | ) | 501,222 | |||||||||||||||
Net income | 74,986 | 74,986 | |||||||||||||||||||||
Net pension and postretirement benefit gains, net of $194 tax effect | 330 | 330 | |||||||||||||||||||||
Cash dividends - common stock ($1.72 per share) | (46,988 | ) | (46,988 | ) | |||||||||||||||||||
Purchase of treasury stock | (42 | ) | (3,120 | ) | (3,120 | ) | |||||||||||||||||
Stock-based plans, including excess tax benefits | 57 | (305 | ) | (305 | ) | ||||||||||||||||||
Stock-based compensation expense | 2,472 | 2,472 | |||||||||||||||||||||
Balance, June 30, 2014 | 27,339 | 104,789 | 1,167,211 | (8,061 | ) | (735,342 | ) | 528,597 | |||||||||||||||
Net income | 101,686 | 101,686 | |||||||||||||||||||||
Net pension and postretirement benefit losses, net of ($1,171) tax effect | (1,996 | ) | (1,996 | ) | |||||||||||||||||||
Cash dividends - common stock ($1.82 per share) | (49,778 | ) | (49,778 | ) | |||||||||||||||||||
Purchase of treasury stock | (6 | ) | (569 | ) | (569 | ) | |||||||||||||||||
Stock-based plans, including excess tax benefits | 28 | (62 | ) | (62 | ) | ||||||||||||||||||
Stock-based compensation expense | 3,040 | 3,040 | |||||||||||||||||||||
Balance, June 30, 2015 | 27,361 | $ | 107,767 | $ | 1,219,119 | $ | (10,057 | ) | $ | (735,911 | ) | $ | 580,918 | ||||||||||
See accompanying notes to consolidated financial statements.
30
LANCASTER COLONY CORPORATION AND SUBSIDIARIES
NOTES TO CONSOLIDATED FINANCIAL STATEMENTS
(Tabular amounts in thousands, except per share data)
Note 1 – Summary of Significant Accounting Policies
Principles of Consolidation
The accompanying consolidated financial statements include the accounts of Lancaster Colony Corporation and our wholly-owned subsidiaries, collectively referred to as “we,” “us,” “our,” “registrant,” or the “Company.” Intercompany transactions and accounts have been eliminated in consolidation. Our fiscal year begins on July 1 and ends on June 30. Unless otherwise noted, references to “year” pertain to our fiscal year; for example, 2015 refers to fiscal 2015, which is the period from July 1, 2014 to June 30, 2015.
Discontinued Operations
On January 30, 2014, we sold effectively all of the net operating assets of our candle manufacturing and marketing operations. The financial results of these operations are reported as discontinued operations for all periods presented herein. See further discussion and disclosure about discontinued operations in Note 3.
Use of Estimates
The preparation of the consolidated financial statements in conformity with U.S. generally accepted accounting principles (“GAAP”) requires that we make estimates and assumptions that affect the amounts reported in the consolidated financial statements and accompanying notes. Significant estimates included in these consolidated financial statements include allowances for doubtful accounts receivable and customer deductions, net realizable value of inventories, useful lives for the calculation of depreciation and amortization, impairments of long-lived assets, distribution accruals, tax contingency reserves for uncertain tax positions, pension and postretirement assumptions and self-insurance accruals. Actual results could differ from these estimates.
Cash and Equivalents
We consider all highly liquid investments purchased with original maturities of three months or less to be cash equivalents. The carrying amounts of our cash and equivalents, including money market funds and commercial paper, approximate fair value due to their short maturities and are considered level 1 investments, which have quoted market prices in active markets for identical assets. As a result of our cash management system, checks issued but not presented to the banks for payment may create negative book cash balances. When such negative balances exist, they are included in other accrued liabilities.
Receivables and Related Allowances
We evaluate the adequacy of our allowances for customer deductions considering several factors including historical experience, specific trade programs and existing customer relationships. We also provide an allowance for doubtful accounts based on the aging of accounts receivable balances, historical write-off experience and on-going reviews of our trade receivables. Measurement of potential losses requires credit review of existing customer relationships, consideration of historical loss experience, including the need to adjust for current conditions, and judgments about the probable effects of relevant observable data, including present economic conditions such as delinquency rates and the economic health of customers.
Credit Risk
Financial instruments that potentially subject us to concentrations of credit risk consist primarily of cash and equivalents and trade accounts receivable. By policy, we limit the amount of credit exposure to any one institution or issuer. Our concentration of credit risk with respect to trade accounts receivable is mitigated by our credit evaluation process and by having a large and diverse customer base. However, see Note 10 with respect to our accounts receivable with Wal-Mart Stores, Inc. and McLane Company, Inc., a wholesale distribution subsidiary of Berkshire Hathaway, Inc.
Inventories
Inventories are valued at the lower of cost or market and are costed by various methods that approximate actual cost on a first-in, first-out basis. Due to the nature of our business, work in process inventory is not a material component of inventory. When necessary, we provide allowances to adjust the carrying value of our inventory to the lower of cost or net realizable value, including any costs to sell or dispose. The determination of whether inventory items are slow moving, obsolete or in excess of needs requires estimates about the future demand for our products. The estimates as to future demand used in the
31
LANCASTER COLONY CORPORATION AND SUBSIDIARIES
NOTES TO CONSOLIDATED FINANCIAL STATEMENTS
(Tabular amounts in thousands, except per share data)
valuation of inventory are subject to the ongoing success of our products and may differ from actual due to such factors as changes in customer and consumer demand.
Property, Plant and Equipment
Property, plant and equipment are stated at cost less accumulated depreciation, except for those acquired as part of a business combination, which are stated at fair value at the time of purchase. We use the straight-line method of computing depreciation for financial reporting purposes based on the estimated useful lives of the corresponding assets. Estimated useful lives for buildings and improvements range generally from 10 to 40 years while machinery and equipment range generally from three to 15 years. For tax purposes, we generally compute depreciation using accelerated methods.
Purchases of property, plant and equipment included in accounts payable and excluded from the property additions and the change in accounts payable in the Consolidated Statements of Cash Flows at June 30 were as follows:
2015 | 2014 | 2013 | |||||||||
Construction in progress in accounts payable | $ | 189 | $ | 2,755 | $ | 332 | |||||
The following table sets forth depreciation expense in each of the years ended June 30:
2015 | 2014 | 2013 | |||||||||
Depreciation expense | $ | 18,867 | $ | 17,419 | $ | 16,036 | |||||
Long-Lived Assets
We monitor the recoverability of the carrying value of our long-lived assets by periodically considering whether indicators of impairment are present. If such indicators are present, we determine if the assets are recoverable by comparing the sum of the undiscounted future cash flows to the assets’ carrying amounts. Our cash flows are based on historical results adjusted to reflect our best estimate of future market and operating conditions. If the carrying amounts are greater, then the assets are not recoverable. In that instance, we compare the carrying amounts to the fair value to determine the amount of the impairment to be recorded.
Goodwill and Other Intangible Assets
Goodwill is not amortized. It is evaluated annually at April 30, by applying impairment testing procedures, as appropriate. Other intangible assets are amortized on a straight-line basis over their estimated useful lives to Selling, General and Administrative Expenses. We evaluate the future economic benefit of the recorded goodwill and other intangible assets when events or circumstances indicate potential recoverability concerns. Carrying amounts are adjusted appropriately when determined to have been impaired. See further discussion regarding goodwill and other intangible assets in Note 7.
Accrued Marketing and Distribution
Various marketing programs are offered to customers to reimburse them for a portion or all of their promotional activities related to our products. Additionally, we often incur various costs associated with shipping products to the customer. We provide accruals for the costs of marketing and distribution based on historical information as may be modified by estimates of actual costs incurred.
Accruals for Self-Insurance
Self-insurance accruals are made for certain claims associated with employee health care, workers’ compensation and general liability insurance. These accruals include estimates that are primarily based on historical loss development factors.
Shareholders’ Equity
We are authorized to issue 3,050,000 shares of preferred stock consisting of 750,000 shares of Class A Participating Preferred Stock with $1.00 par value, 1,150,000 shares of Class B Voting Preferred Stock without par value and 1,150,000 shares of Class C Nonvoting Preferred Stock without par value. Our Board of Directors approved a share repurchase authorization of 2,000,000 shares in November 2010. At June 30, 2015, 1,419,682 shares remained authorized for future purchase.
32
LANCASTER COLONY CORPORATION AND SUBSIDIARIES
NOTES TO CONSOLIDATED FINANCIAL STATEMENTS
(Tabular amounts in thousands, except per share data)
Revenue Recognition
We recognize revenue upon transfer of title and risk of loss, provided that evidence of an arrangement exists, pricing is fixed or determinable, and collectability is probable. Net sales are recorded net of estimated sales discounts, returns, trade promotions and certain other sales incentives, including coupon redemptions and rebates.
Advertising Expense
We expense advertising as it is incurred. The following table summarizes advertising expense as a percentage of net sales in each of the years ended June 30:
2015 | 2014 | 2013 | ||||||
Advertising expense as a percentage of net sales | 2 | % | 2 | % | 2 | % | ||
Distribution Costs
Distribution fees billed to customers are included in Net Sales, while our distribution costs incurred are included in Cost of Sales.
Stock-Based Employee Compensation Plans
We account for our stock-based employee compensation plans in accordance with GAAP for stock-based compensation, which requires the measurement and recognition of the cost of employee services received in exchange for an award of equity instruments based on the grant-date fair value of the award. The cost of the employee services is recognized as compensation expense over the period that an employee provides service in exchange for the award, which is typically the vesting period. We intend to solicit shareholder approval for adoption of a new equity compensation plan at our November 2015 Annual Meeting of Shareholders, as the 2005 Plan expired in May 2015. See further discussion and disclosure in Note 11.
Income Taxes
Our income tax expense, deferred tax assets and liabilities and reserves for unrecognized tax benefits reflect management’s best assessment of estimated future taxes to be paid. We are subject to income taxes in numerous domestic jurisdictions.
Our annual tax rate is determined based on our income, statutory tax rates and the permanent tax impacts of items treated differently for tax purposes than for financial reporting purposes. Tax law requires certain items be included in the tax return at different times than the items are reflected in the financial statements. Some of these differences are permanent, such as expenses that are not deductible in our tax return, and some differences are temporary, reversing over time, such as depreciation expense. These temporary differences create deferred tax assets and liabilities. The effect of a change in tax rates on deferred tax assets and liabilities is recognized in income in the period that includes the enactment date. Realization of certain deferred tax assets is dependent upon generating sufficient taxable income in the appropriate jurisdiction prior to the expiration of the carryforward periods. Although realization is not assured, management believes it is more likely than not that our deferred tax assets will be realized and thus we have not recorded any valuation allowance for the years ended June 30, 2015 or 2014.
In accordance with accounting literature related to uncertainty in income taxes, tax benefits and liabilities from uncertain tax positions that are recognized in the financial statements are measured based on the largest attribute that has a greater than fifty percent likelihood of being realized upon ultimate settlement.
Changes in tax laws and rates could also affect recorded deferred tax assets and liabilities in the future. Management is not aware of any such changes that would have a material effect on our results of operations, cash flow or financial position. See further discussion in Note 9.
Earnings Per Share
Earnings per share (“EPS”) is computed based on the weighted average number of shares of common stock and common stock equivalents (restricted stock and stock-settled stock appreciation rights) outstanding during each period. Unvested shares of restricted stock granted to employees are considered participating securities since employees receive nonforfeitable dividends prior to vesting and, therefore, are included in the earnings allocation in computing EPS under the two-class method. Basic EPS excludes dilution and is computed by dividing income available to common shareholders by the weighted average number of common shares outstanding during the period. Diluted EPS is computed by dividing income available to common shareholders by the diluted weighted average number of common shares outstanding during the period, which includes the dilutive potential common shares associated with nonparticipating restricted stock and stock-settled stock appreciation rights.
33
LANCASTER COLONY CORPORATION AND SUBSIDIARIES
NOTES TO CONSOLIDATED FINANCIAL STATEMENTS
(Tabular amounts in thousands, except per share data)
Basic and diluted income per common share from continuing operations were calculated as follows:
2015 | 2014 | 2013 | |||||||||
Income from continuing operations | $ | 101,686 | $ | 100,986 | $ | 103,860 | |||||
Income from continuing operations available to participating securities | (143 | ) | (174 | ) | (326 | ) | |||||
Income from continuing operations available to common shareholders | $ | 101,543 | $ | 100,812 | $ | 103,534 | |||||
Weighted average common shares outstanding - basic | 27,300 | 27,264 | 27,252 | ||||||||
Incremental share effect from: | |||||||||||
Nonparticipating restricted stock | 3 | 3 | 3 | ||||||||
Stock-settled stock appreciation rights | 24 | 41 | 30 | ||||||||
Weighted average common shares outstanding - diluted | 27,327 | 27,308 | 27,285 | ||||||||
Income per common share from continuing operations - basic | $ | 3.72 | $ | 3.70 | $ | 3.80 | |||||
Income per common share from continuing operations - diluted | $ | 3.72 | $ | 3.69 | $ | 3.79 | |||||
Comprehensive Income and Accumulated Other Comprehensive Loss
Comprehensive income includes changes in equity that result from transactions and economic events from non-owner sources. Comprehensive income is composed of two subsets – net income and other comprehensive income (loss). Included in other comprehensive income (loss) are pension and postretirement benefits adjustments.
The following table presents the amounts reclassified out of accumulated other comprehensive loss by component:
2015 | 2014 | ||||||
Accumulated other comprehensive loss at beginning of year | $ | (8,061 | ) | $ | (8,391 | ) | |
Defined Benefit Pension Plan Items: | |||||||
Net (loss) gain arising during the period | (3,408 | ) | 65 | ||||
Amortization of unrecognized net loss (1) | 429 | 460 | |||||
Postretirement Benefit Plan Items: | |||||||
Net (loss) gain arising during the period | (155 | ) | 31 | ||||
Amortization of unrecognized net gain (1) | (28 | ) | (27 | ) | |||
Amortization of prior service asset (1) | (5 | ) | (5 | ) | |||
Total other comprehensive (loss) income, before tax | (3,167 | ) | 524 | ||||
Total tax benefit (expense) | 1,171 | (194 | ) | ||||
Other comprehensive (loss) income, net of tax | (1,996 | ) | 330 | ||||
Accumulated other comprehensive loss at end of year | $ | (10,057 | ) | $ | (8,061 | ) | |
(1) Included in the computation of net periodic benefit income/cost. See Notes 12 and 13 for additional information.
Recently Issued Accounting Standards
In July 2015, the Financial Accounting Standards Board (“FASB”) issued new accounting guidance which requires entities to measure most inventory “at the lower of cost or net realizable value,” thereby simplifying current guidance. Under current guidance an entity must measure inventory at the lower of cost or market, where market is defined as one of three different measures, one of which is net realizable value. The guidance will be effective prospectively for fiscal years, and interim periods within those years, beginning after December 15, 2016. We are currently evaluating the impact of this guidance.
In May 2014, the FASB issued new accounting guidance for the recognition of revenue under the principle: “Recognize revenue to depict the transfer of promised goods or services to customers in an amount that reflects the consideration to which the entity expects to be entitled in exchange for those goods or services.” Following a one-year deferral of the effective date, the guidance will be effective for fiscal years, and interim periods within those years, beginning after December 15, 2017 and will require either retrospective application to each prior period presented or retrospective application with the cumulative effect of initially applying the standard recognized at the date of adoption. We are currently evaluating the impact of this guidance.
34
LANCASTER COLONY CORPORATION AND SUBSIDIARIES
NOTES TO CONSOLIDATED FINANCIAL STATEMENTS
(Tabular amounts in thousands, except per share data)
Note 2 – Acquisition
On March 13, 2015, we acquired all of the issued and outstanding capital stock of Flatout Holdings, Inc. (“Flatout”), a privately owned manufacturer and marketer of flatbread wraps and pizza crusts based in Saline, Michigan. The purchase price, net of cash acquired, was $92.2 million and was funded by cash on hand. The purchase price was subject to a net working capital adjustment, which was settled in July 2015. Flatout is reported in our Specialty Foods segment, and its results of operations have been included in our consolidated financial statements from the date of acquisition, but such results were not material to our consolidated financial statements.
The following preliminary purchase price allocation is based on the fair value of the net assets acquired, as adjusted for the final net working capital adjustment recorded as of June 30:
Balance Sheet Captions | Allocation | ||
Receivables | $ | 2,479 | |
Inventories | 3,748 | ||
Other current assets | 212 | ||
Property, plant and equipment | 6,937 | ||
Goodwill (not tax deductible) | 53,948 | ||
Other intangible assets | 44,000 | ||
Current liabilities | (2,445 | ) | |
Deferred tax liabilities | (16,651 | ) | |
Net assets acquired | $ | 92,228 | |
Further adjustments may occur to the allocation above as certain tax aspects of the transaction are finalized during the measurement period.
The goodwill recognized above arose because the purchase price for Flatout reflects a number of factors including the future earnings and cash flow potential of Flatout and the avoidance of the time and costs which would be required (and the associated risks that would be encountered) to enhance our existing product offerings and enter the supermarket deli department. Goodwill also results from the workforce acquired with Flatout, as well as the impact of deferred tax liabilities established on the acquired assets.
We have determined the values and lives of the other intangible assets listed in the allocation above as: $34.5 million for the tradename with a 30-year life; $5.0 million for the customer relationships with a 10-year life; $3.9 million for the technology / know-how with a 10-year life and $0.6 million for the non-compete agreements with a 5-year life.
Pro forma results of operations have not been presented herein as the acquisition was not considered material to our results of operations.
Note 3 – Discontinued Operations
On January 30, 2014, we sold effectively all of the net operating assets of our candle manufacturing and marketing operations for $28 million in cash. Net proceeds from the sale, after post-closing adjustments and transaction costs, totaled $25.6 million. The transaction resulted in a pretax loss of $44.0 million and a tax benefit of $15.0 million, which were recorded in the year ended June 30, 2014. The financial results of these operations are reported as discontinued operations for all periods presented herein. The discontinued operations, previously included in our Glassware and Candles segment, had net sales of $89.4 million and $152.1 million for the years ended June 30, 2014 and 2013, respectively, and a pretax loss of $39.4 million, including the pretax loss on sale, for the year ended June 30, 2014, and pretax income of $8.2 million for the year ended June 30, 2013.
Note 4 – Long-Term Debt
At June 30, 2015 and 2014, we had an unsecured credit facility (“Facility”) under which we may borrow, on a revolving credit basis, up to a maximum of $120 million at any one time, with potential to expand the total credit availability to $200 million subject to us obtaining consent of the issuing banks and certain other conditions. The Facility expires on April 18, 2017, and all outstanding amounts are then due and payable. Interest is variable based upon formulas tied to LIBOR or an alternative base rate defined in the credit agreement, at our option. We must also pay facility fees that are tied to our then-applicable consolidated leverage ratio. Loans may be used for general corporate purposes. When we have outstanding borrowings under this Facility, they will be classified as long-term debt due to the long-term nature of this Facility.
35
LANCASTER COLONY CORPORATION AND SUBSIDIARIES
NOTES TO CONSOLIDATED FINANCIAL STATEMENTS
(Tabular amounts in thousands, except per share data)
At June 30, 2015 and 2014, we had no borrowings outstanding under this Facility. At June 30, 2015, we had $4.7 million of standby letters of credit outstanding, which reduced the amount available for borrowing on the Facility. We paid no interest in 2015 and 2014. At June 30, 2015 and 2014, we exceeded the requirements of the financial covenants by substantial margins.
The Facility contains certain restrictive covenants, including limitations on indebtedness, asset sales and acquisitions. There are two principal financial covenants: an interest expense test that requires us to maintain an interest coverage ratio not less than 2.5 to 1 at the end of each fiscal quarter; and an indebtedness test that requires us to maintain a consolidated leverage ratio not greater than 3 to 1 at all times. The interest coverage ratio is calculated by dividing Consolidated EBIT (as defined more specifically in the credit agreement) by Consolidated Interest Expense (as defined more specifically in the credit agreement), and the leverage ratio is calculated by dividing Consolidated Debt (as defined more specifically in the credit agreement) by Consolidated EBITDA (as defined more specifically in the credit agreement).
Note 5 – Commitments
We have operating leases with initial noncancelable lease terms in excess of one year covering the rental of various facilities and equipment, which expire at various dates through fiscal year 2021. Certain of these leases contain renewal options, some provide options to purchase during the lease term and some require contingent rentals. The future minimum rental commitments due under these leases are summarized as follows:
2016 | $ | 4,754 | |
2017 | $ | 3,814 | |
2018 | $ | 2,794 | |
2019 | $ | 2,755 | |
2020 | $ | 1,147 | |
Thereafter | $ | 284 | |
Total rent expense, including short-term cancelable leases, during the years ended June 30 is summarized as follows:
2015 | 2014 | 2013 | |||||||||
Operating leases: | |||||||||||
Minimum rentals | $ | 5,036 | $ | 5,079 | $ | 4,780 | |||||
Contingent rentals | 6 | 86 | 122 | ||||||||
Short-term cancelable leases | 900 | 793 | 1,093 | ||||||||
Total | $ | 5,942 | $ | 5,958 | $ | 5,995 | |||||
Note 6 – Contingencies
In addition to the items discussed below, at June 30, 2015, we were a party to various claims and litigation matters arising in the ordinary course of business. Such matters did not have a material effect on the current-year results of operations and, in our opinion, their ultimate disposition will not have a material effect on our consolidated financial statements.
21% of our employees are represented under various collective bargaining contracts. Our next labor contract negotiation relates to our Bedford Heights, Ohio plant facility, which produces various garlic bread products. The expiration date of this labor contract is April 30, 2016. 7% of our employees are represented under this collective bargaining contract. While we believe that labor relations with employees under collective bargaining contracts are satisfactory, a prolonged labor dispute could have a material effect on our business and results of operations.
36
LANCASTER COLONY CORPORATION AND SUBSIDIARIES
NOTES TO CONSOLIDATED FINANCIAL STATEMENTS
(Tabular amounts in thousands, except per share data)
Note 7 – Goodwill and Other Intangible Assets
Goodwill attributable to the Specialty Foods segment was $143.8 million and $89.8 million at June 30, 2015 and 2014, respectively. The increase in goodwill is the result of the acquisition of Flatout on March 13, 2015. See further discussion in Note 2.
The following table is a rollforward of goodwill from June 30, 2014 to June 30, 2015:
Carrying Value | |||
Goodwill at beginning of year | $ | 89,840 | |
Goodwill acquired during the year | 53,948 | ||
Goodwill at end of year | $ | 143,788 | |
The following table summarizes our identifiable other intangible assets, all included in the Specialty Foods segment, at June 30. The increase in the intangible assets is the result of the acquisition of Flatout on March 13, 2015; such amounts are preliminary and subject to further review over the measurement period. See further discussion in Note 2.
2015 | 2014 | ||||||
Tradename (30-year life) | |||||||
Gross carrying value | $ | 34,500 | $ | — | |||
Accumulated amortization | (365 | ) | — | ||||
Net carrying value | $ | 34,135 | $ | — | |||
Trademarks (40-year life) | |||||||
Gross carrying value | $ | 370 | $ | 370 | |||
Accumulated amortization | (223 | ) | (214 | ) | |||
Net carrying value | $ | 147 | $ | 156 | |||
Customer Relationships (10 to 15-year life) | |||||||
Gross carrying value | $ | 18,020 | $ | 13,020 | |||
Accumulated amortization | (8,882 | ) | (7,800 | ) | |||
Net carrying value | $ | 9,138 | $ | 5,220 | |||
Technology / Know-how (10-year life) | |||||||
Gross carrying value | $ | 3,900 | $ | — | |||
Accumulated amortization | (114 | ) | — | ||||
Net carrying value | $ | 3,786 | $ | — | |||
Non-compete Agreements (5-year life) | |||||||
Gross carrying value | $ | 600 | $ | — | |||
Accumulated amortization | (35 | ) | — | ||||
Net carrying value | $ | 565 | $ | — | |||
Total net carrying value | $ | 47,771 | $ | 5,376 | |||
Amortization expense for our other intangible assets, which is reflected in Selling, General and Administrative Expenses, was as follows in each of the years ended June 30:
2015 | 2014 | 2013 | |||||||||
Amortization expense | $ | 1,605 | $ | 946 | $ | 945 | |||||
37
LANCASTER COLONY CORPORATION AND SUBSIDIARIES
NOTES TO CONSOLIDATED FINANCIAL STATEMENTS
(Tabular amounts in thousands, except per share data)
Total annual amortization expense for each of the next five years is estimated to be as follows:
2016 | $ | 2,905 | |
2017 | $ | 2,764 | |
2018 | $ | 2,764 | |
2019 | $ | 2,764 | |
2020 | $ | 2,729 | |
Note 8 – Liabilities
Accrued liabilities at June 30 were composed of:
2015 | 2014 | ||||||
Compensation and employee benefits | $ | 21,969 | $ | 19,635 | |||
Distribution | 5,445 | 6,440 | |||||
Other taxes | 1,182 | 1,219 | |||||
Marketing | 1,830 | 1,815 | |||||
Other | 5,395 | 2,056 | |||||
Total accrued liabilities | $ | 35,821 | $ | 31,165 | |||
Other noncurrent liabilities at June 30 were composed of:
2015 | 2014 | ||||||
Workers compensation | $ | 8,477 | $ | 9,450 | |||
Gross tax contingency reserve | 1,487 | 963 | |||||
Pension benefit liability | 5,070 | 2,946 | |||||
Postretirement benefit liability | 2,806 | 2,608 | |||||
Deferred compensation and accrued interest | 4,411 | 4,055 | |||||
Other | 1,403 | 2,186 | |||||
Total other noncurrent liabilities | $ | 23,654 | $ | 22,208 | |||
Note 9 – Income Taxes
We file a consolidated Federal income tax return. Taxes based on income from continuing operations for the years ended June 30 have been provided as follows:
2015 | 2014 | 2013 | |||||||||
Currently payable: | |||||||||||
Federal | $ | 47,601 | $ | 48,718 | $ | 45,350 | |||||
State and local | 5,229 | 4,526 | 3,475 | ||||||||
Total current provision | 52,830 | 53,244 | 48,825 | ||||||||
Deferred Federal, state and local provision (benefit) | 36 | (951 | ) | 1,133 | |||||||
Total taxes based on income | $ | 52,866 | $ | 52,293 | $ | 49,958 | |||||
Certain tax benefits recorded directly to common stock for each of the years ended June 30 were as follows:
2015 | 2014 | 2013 | |||||||||
Tax benefits recorded directly to common stock | $ | 563 | $ | 1,020 | $ | 794 | |||||
38
LANCASTER COLONY CORPORATION AND SUBSIDIARIES
NOTES TO CONSOLIDATED FINANCIAL STATEMENTS
(Tabular amounts in thousands, except per share data)
For the years ended June 30, our effective tax rate varied from the statutory Federal income tax rate as a result of the following factors:
2015 | 2014 | 2013 | ||||||
Statutory rate | 35.0 | % | 35.0 | % | 35.0 | % | ||
State and local income taxes | 2.2 | 2.0 | 1.5 | |||||
ESOP dividend deduction | (0.2 | ) | (0.2 | ) | (0.8 | ) | ||
Domestic manufacturing deduction for qualified income | (3.0 | ) | (3.0 | ) | (3.1 | ) | ||
Other | 0.2 | 0.3 | (0.1 | ) | ||||
Effective rate | 34.2 | % | 34.1 | % | 32.5 | % | ||
The tax effect of temporary differences that give rise to significant portions of the deferred tax assets and deferred tax liabilities at June 30 were comprised of:
2015 | 2014 | ||||||
Deferred tax assets: | |||||||
Inventories | $ | 1,179 | $ | 720 | |||
Employee medical and other benefits | 11,135 | 10,149 | |||||
Receivable and other allowances | 5,652 | 4,410 | |||||
Intangible assets | — | 482 | |||||
Other accrued liabilities | 2,229 | 2,413 | |||||
Total deferred tax assets | 20,195 | 18,174 | |||||
Deferred tax liabilities: | |||||||
Property, plant and equipment | (22,968 | ) | (21,307 | ) | |||
Intangible assets | (15,223 | ) | — | ||||
Goodwill | (4,869 | ) | (4,212 | ) | |||
Other | (75 | ) | (79 | ) | |||
Total deferred tax liabilities | (43,135 | ) | (25,598 | ) | |||
Net deferred tax liability | $ | (22,940 | ) | $ | (7,424 | ) | |
Net current deferred tax assets and prepaid Federal, state and local income taxes were included in Deferred Income Taxes and Other Current Assets on the Consolidated Balance Sheets. The related balances at June 30 were as follows:
2015 | 2014 | ||||||
Net current deferred tax assets | $ | 12,788 | $ | 11,329 | |||
Prepaid Federal, state and local income taxes | $ | 4,402 | $ | 9,688 | |||
Cash payments for income taxes for each of the years ended June 30 were as follows:
2015 | 2014 | 2013 | |||||||||
Cash payments for income taxes | $ | 43,027 | $ | 37,277 | $ | 56,992 | |||||
The gross tax contingency reserve at June 30, 2015 was $1.5 million and consisted of tax liabilities of $1.0 million and interest and penalties of $0.5 million. The unrecognized tax benefits recorded as the gross tax contingency reserve noted in the following table for June 30, 2015 and 2014 would affect our effective tax rate, if recognized.
39
LANCASTER COLONY CORPORATION AND SUBSIDIARIES
NOTES TO CONSOLIDATED FINANCIAL STATEMENTS
(Tabular amounts in thousands, except per share data)
The following table sets forth changes in our total gross tax contingency reserve (including interest and penalties):
2015 | 2014 | ||||||
Balance, beginning of year | $ | 963 | $ | 912 | |||
Tax positions related to the current year: | |||||||
Additions | 54 | 66 | |||||
Reductions | — | — | |||||
Tax positions related to prior years: | |||||||
Additions | 516 | 39 | |||||
Reductions | (46 | ) | (54 | ) | |||
Settlements | — | — | |||||
Balance, end of year | $ | 1,487 | $ | 963 | |||
We have not classified any of the gross tax contingency reserve at June 30, 2015 as a current liability as none of these amounts are expected to be resolved within the next 12 months. Consequently, the entire liability of $1.5 million was included in other noncurrent liabilities. We expect that the amount of these liabilities will change within the next 12 months; however, we do not expect the change to have a significant effect on our financial position or results of operations.
We recognize interest and penalties related to these tax liabilities in income tax expense. For each of the years ended June 30, we recognized the change in the accrual for net tax-related interest and penalties as follows:
2015 | 2014 | ||||||
Expense recognized for net tax-related interest and penalties | $ | 87 | $ | 9 | |||
We had accrued interest and penalties at June 30 as follows:
2015 | 2014 | ||||||
Accrued interest and penalties included in the gross tax contingency reserve | $ | 479 | $ | 392 | |||
We file income tax returns in the U.S. and various state and local jurisdictions. With limited exceptions, we are no longer subject to examination of U.S. Federal or state and local income taxes for years prior to 2012.
The American Jobs Creation Act provided a tax deduction calculated as a percentage of qualified income from manufacturing in the United States. The deduction percentage for 2015 was 9%. In accordance with FASB guidance, this deduction is treated as a special deduction, as opposed to a tax rate reduction and is properly reflected in the effective tax rate table.
Note 10 – Business Segment Information
We operate our business in one reportable segment, “Specialty Foods.” Our management evaluates segment performance based on sales and operating income.
The following table sets forth information with respect to the amount of net sales contributed by each class of similar products of our consolidated net sales in each of the years ended June 30:
2015 | 2014 | 2013 | |||||||||
Specialty Foods | |||||||||||
Non-frozen | $ | 741,726 | $ | 681,872 | $ | 649,447 | |||||
Frozen | 362,788 | 359,203 | 364,356 | ||||||||
Total | $ | 1,104,514 | $ | 1,041,075 | $ | 1,013,803 | |||||
Our Corporate Expenses include various expenses of a general corporate nature, as well as costs related to certain divested or closed nonfood operations, including the expense associated with retirement plans applicable to those closed units. These corporate expenses are generally not directly attributable to the Specialty Foods segment and therefore have not been allocated to the segment.
40
LANCASTER COLONY CORPORATION AND SUBSIDIARIES
NOTES TO CONSOLIDATED FINANCIAL STATEMENTS
(Tabular amounts in thousands, except per share data)
The following sets forth certain additional financial segment information for the years ended June 30 and certain items retained at the corporate level:
2015 | 2014 | 2013 | |||||||||
Net Sales (1) (3) | $ | 1,104,514 | $ | 1,041,075 | $ | 1,013,803 | |||||
Operating Income (1) (3) | |||||||||||
Specialty Foods | $ | 167,095 | $ | 165,383 | $ | 165,710 | |||||
Corporate Expenses | (12,234 | ) | (11,616 | ) | (11,787 | ) | |||||
Total | $ | 154,861 | $ | 153,767 | $ | 153,923 | |||||
Identifiable Assets (2) | |||||||||||
Specialty Foods | $ | 514,605 | $ | 405,416 | $ | 392,494 | |||||
Corporate | 200,339 | 233,214 | 148,892 | ||||||||
Assets of Discontinued Operations | — | — | 78,578 | ||||||||
Total | $ | 714,944 | $ | 638,630 | $ | 619,964 | |||||
Capital Expenditures (3) | |||||||||||
Specialty Foods | $ | 18,230 | $ | 15,578 | $ | 23,341 | |||||
Corporate | 68 | 67 | 119 | ||||||||
Total | $ | 18,298 | $ | 15,645 | $ | 23,460 | |||||
Depreciation and Amortization (3) | |||||||||||
Specialty Foods | $ | 20,929 | $ | 18,785 | $ | 17,469 | |||||
Corporate | 182 | 208 | 148 | ||||||||
Total | $ | 21,111 | $ | 18,993 | $ | 17,617 | |||||
(1) | All intercompany transactions have been eliminated. |
(2) | Segment identifiable assets include those assets used in its operations and other intangible assets allocated to purchased businesses. Corporate assets consist principally of cash and equivalents, prepaid Federal, state and local income taxes and deferred income taxes. |
(3) | Financial information reflects continuing operations. |
Net sales attributable to McLane Company, Inc. (“McLane”), a wholesale distribution subsidiary of Berkshire Hathaway, Inc., and Wal-Mart Stores, Inc. (“Wal-Mart”) for each of the years ended June 30 were as follows:
2015 | 2014 | 2013 | |||||||||
Net sales to McLane | $ | 202,218 | $ | 186,817 | $ | 132,872 | |||||
As a percentage of consolidated net sales | 18 | % | 18 | % | 13 | % | |||||
Net sales to Wal-Mart | $ | 177,354 | $ | 175,388 | $ | 168,976 | |||||
As a percentage of consolidated net sales | 16 | % | 17 | % | 17 | % | |||||
Accounts receivable attributable to Wal-Mart and McLane at June 30 as a percentage of consolidated accounts receivable were as follows:
2015 | 2014 | ||||
Accounts receivable as a percentage of consolidated accounts receivable: | |||||
Wal-Mart | 26 | % | 27 | % | |
McLane | 14 | % | 13 | % | |
41
LANCASTER COLONY CORPORATION AND SUBSIDIARIES
NOTES TO CONSOLIDATED FINANCIAL STATEMENTS
(Tabular amounts in thousands, except per share data)
Note 11 – Stock-Based Compensation
Our shareholders previously approved the adoption of and subsequent amendments to the Lancaster Colony Corporation 2005 Stock Plan (the “2005 Plan”). The 2005 Plan reserved 2,000,000 common shares for issuance to our employees and directors, and all awards granted under the 2005 Plan will be exercisable at prices not less than fair market value as of the date of the grant. The vesting period for awards granted under the 2005 Plan varies as to the type of award granted, but generally these awards have a maximum term of five years. We intend to solicit shareholder approval for adoption of a new equity compensation plan at our November 2015 Annual Meeting of Shareholders, as the 2005 Plan expired in May 2015.
Stock-Settled Stock Appreciation Rights
We use periodic grants of stock-settled stock appreciation rights (“SSSARs”) as a vehicle for rewarding certain employees with long-term incentives for their efforts in helping to create long-term shareholder value. We calculate the fair value of SSSARs grants using the Black-Scholes option-pricing model. Our policy is to issue shares upon SSSARs exercise from new shares that had been previously authorized.
In 2015, 2014 and 2013, we granted SSSARs to various employees under the terms of the 2005 Plan. The following table summarizes information relating to these grants:
2015 | 2014 | 2013 | |||||||||
SSSARs granted | 149 | 146 | 108 | ||||||||
Weighted average grant date fair value per right | $ | 9.94 | $ | 11.84 | $ | 9.04 | |||||
Weighted average assumptions used in fair value calculations: | |||||||||||
Risk-free interest rate | 0.86 | % | 0.75 | % | 0.33 | % | |||||
Dividend yield | 2.02 | % | 1.97 | % | 2.09 | % | |||||
Volatility factor of the expected market price of our common stock | 19.62 | % | 22.35 | % | 23.23 | % | |||||
Weighted average expected life in years | 2.71 | 3.12 | 2.67 | ||||||||
For these grants, the volatility factor was estimated based on actual historical volatility of our stock for a time period equal to the term of the SSSARs. The expected average life was determined based on historical exercise experience for this type of grant. The SSSARs we grant vest one-third on the first anniversary of the grant date, one-third on the second anniversary of the grant date and one-third on the third anniversary of the grant date. As needed, we estimate a forfeiture rate for our SSSARs grants based on historical experience.
We recognize compensation expense over the requisite service period. Compensation expense was reflected in Cost of Sales or Selling, General and Administrative Expenses based on the grantees’ salaries expense classification. We recorded tax benefits and excess tax benefits related to SSSARs. These excess tax benefits were included in the financing section of the Consolidated Statements of Cash Flows. The following table summarizes our continuing operations SSSARs compensation expense and tax benefits recorded for each of the years ended June 30:
2015 | 2014 | 2013 | |||||||||
Compensation expense | $ | 1,288 | $ | 1,092 | $ | 1,316 | |||||
Tax benefits | $ | 451 | $ | 382 | $ | 461 | |||||
Intrinsic value of exercises | $ | 1,162 | $ | 2,692 | $ | 1,851 | |||||
Excess tax benefits | $ | 410 | $ | 942 | $ | 659 | |||||
The total fair values of SSSARs vested for each of the years ended June 30 were as follows:
2015 | 2014 | 2013 | |||||||||
Fair value of vested rights | $ | 1,252 | $ | 1,145 | $ | 1,476 | |||||
42
LANCASTER COLONY CORPORATION AND SUBSIDIARIES
NOTES TO CONSOLIDATED FINANCIAL STATEMENTS
(Tabular amounts in thousands, except per share data)
The following table summarizes the activity relating to SSSARs granted under the 2005 Plan for the year ended June 30, 2015:
Number of Rights | Weighted Average Exercise Price | Weighted Average Remaining Contractual Life in Years | Aggregate Intrinsic Value | |||||||||
Outstanding at beginning of year | 358 | $ | 76.75 | |||||||||
Exercised | (81 | ) | $ | 65.77 | ||||||||
Granted | 149 | $ | 91.13 | |||||||||
Forfeited | (31 | ) | $ | 79.42 | ||||||||
Outstanding at end of year | 395 | $ | 84.24 | 3.58 | $ | 2,653 | ||||||
Exercisable and vested at end of year | 128 | $ | 75.55 | 2.48 | $ | 1,956 | ||||||
Vested and expected to vest at end of year | 386 | $ | 84.26 | 3.58 | $ | 2,581 | ||||||
The following table summarizes information about the SSSARs outstanding by grant year at June 30, 2015:
Outstanding | Exercisable | |||||||||||
Weighted Average | ||||||||||||
Grant Years | Range of Exercise Prices | Number Outstanding | Remaining Contractual Life in Years | Exercise Price | Number Exercisable | Weighted Average Exercise Price | ||||||
2015 | $91.13 | 149 | 4.66 | $91.13 | — | $— | ||||||
2014 | $79.78-$89.29 | 131 | 3.65 | $89.14 | 43 | $89.14 | ||||||
2013 | $72.67 | 56 | 2.66 | $72.67 | 26 | $72.67 | ||||||
2012 | $63.50-$68.12 | 52 | 1.65 | $68.05 | 52 | $68.05 | ||||||
2011 | $57.78 | 7 | 0.65 | $57.78 | 7 | $57.78 | ||||||
At June 30, 2015, there was $1.9 million of unrecognized compensation expense related to SSSARs that we will recognize over a weighted-average period of 2 years.
Restricted Stock
We use periodic grants of restricted stock as a vehicle for rewarding our nonemployee directors and certain employees with long-term incentives for their efforts in helping to create long-term shareholder value.
In 2015, 2014 and 2013, we granted shares of restricted stock to various employees under the terms of the 2005 Plan. The following table summarizes information relating to these grants:
2015 | 2014 | 2013 | |||||||||
Employees | |||||||||||
Restricted stock granted | 9 | 24 | 8 | ||||||||
Grant date fair value | $ | 845 | $ | 2,190 | $ | 572 | |||||
Weighted average grant date fair value per award | $ | 91.13 | $ | 89.21 | $ | 72.67 | |||||
The restricted stock under these employee grants vests on the third anniversary of the grant date. As needed, we estimate a forfeiture rate for our restricted stock grants based on historical experience. Under the terms of our grants, employees receive dividends on unforfeited restricted stock regardless of their vesting status. In 2015, 2014 and 2013, 20,000, 6,000 and 23,000 shares, respectively, of employee restricted stock vested.
43
LANCASTER COLONY CORPORATION AND SUBSIDIARIES
NOTES TO CONSOLIDATED FINANCIAL STATEMENTS
(Tabular amounts in thousands, except per share data)
In 2015, 2014 and 2013, we also granted shares of restricted stock to our nonemployee directors under the terms of the 2005 Plan. The following table summarizes information relating to each of these grants:
2015 | 2014 | 2013 | |||||||||
Nonemployee directors | |||||||||||
Restricted stock granted | 7 | 6 | 7 | ||||||||
Grant date fair value | $ | 639 | $ | 490 | $ | 490 | |||||
Weighted average grant date fair value per award | $ | 92.92 | $ | 84.42 | $ | 73.29 | |||||
The 2015 grant vests over a one-year period, and all of these shares are expected to vest. Dividends earned on the stock during the vesting period will be paid to the directors at the time the stock vests. In 2015, 2014 and 2013, 6,000, 7,000 and 7,000 shares, respectively, of nonemployee director restricted stock vested, and the directors were paid the related dividends.
We recognize compensation expense over the requisite service period. Compensation expense was reflected in Cost of Sales or Selling, General and Administrative Expenses based on the grantees’ salaries expense classification. We recorded tax benefits and excess tax benefits related to restricted stock. These excess tax benefits were included in the financing section of the Consolidated Statements of Cash Flows. The following table summarizes our continuing operations restricted stock compensation expense and tax benefits recorded for each of the years ended June 30:
2015 | 2014 | 2013 | |||||||||
Compensation expense | $ | 1,752 | $ | 1,434 | $ | 1,411 | |||||
Tax benefits | $ | 613 | $ | 502 | $ | 494 | |||||
Excess tax benefits | $ | 153 | $ | 78 | $ | 135 | |||||
The total fair values of restricted stock vested for each of the years ended June 30 were as follows:
2015 | 2014 | 2013 | |||||||||
Fair value of vested shares | $ | 1,836 | $ | 931 | $ | 1,842 | |||||
The following table summarizes the activity relating to restricted stock granted under the 2005 Plan for the year ended June 30, 2015:
Number of Shares | Weighted Average Grant Date Fair Value | |||||
Unvested restricted stock at beginning of year | 58 | $ | 79.09 | |||
Granted | 16 | $ | 91.89 | |||
Vested | (26 | ) | $ | 71.84 | ||
Forfeited | (3 | ) | $ | 79.64 | ||
Unvested restricted stock at end of year | 45 | $ | 87.71 | |||
At June 30, 2015, there was $2.2 million of unrecognized compensation expense related to restricted stock that we will recognize over a weighted-average period of 2 years.
Note 12 – Pension Benefits
Defined Benefit Pension Plans
We sponsor multiple defined benefit pension plans that covered certain workers under collective bargaining contracts. However, as a result of prior-years’ restructuring activities, for all periods presented, we no longer have any active employees continuing to accrue service cost or otherwise eligible to receive plan benefits. Benefits being paid under the plans are primarily based on negotiated rates and years of service. We contribute to these plans at least the minimum amount required by regulation.
At the end of the year, we discount our plan liabilities using an assumed discount rate. In estimating this rate, we, along with our third-party actuaries, review the timing of future benefit payments, bond indices, consider yield curve analysis results and the past history of discount rates.
44
LANCASTER COLONY CORPORATION AND SUBSIDIARIES
NOTES TO CONSOLIDATED FINANCIAL STATEMENTS
(Tabular amounts in thousands, except per share data)
The actuarial present value of benefit obligations summarized below was based on the following assumption:
2015 | 2014 | ||||
Weighted-average assumption as of June 30 | |||||
Discount rate | 4.12 | % | 4.02 | % | |
The net periodic benefit costs were determined utilizing the following beginning-of-the-year assumptions:
2015 | 2014 | 2013 | ||||||
Discount rate | 4.02 | % | 4.57 | % | 3.78 | % | ||
Expected long-term return on plan assets | 7.00 | % | 7.00 | % | 7.00 | % | ||
In determining the long-term expected return on plan assets, we consider our related investment guidelines, our expectations of long-term rates of return by asset category, our target asset allocation weighting and historical rates of return and volatility for equity and fixed income investments. The investment strategy for plan assets is to control and manage investment risk through diversification among asset classes, investment managers/funds and investment styles. The plans’ investment guidelines have been designed to meet the intended objective that plan assets earn at least nominal returns equal to or in excess of the plans’ liability growth rate. In consideration of the current average age of the plans’ participants, the investment guidelines are based upon an investment horizon of at least 10 years.
The target and actual asset allocations for our plans at June 30 by asset category were as follows:
Target Percentage of Plan Assets at June 30 | Actual Percentage of Plan Assets | ||||||
2015 | 2015 | 2014 | |||||
Cash and equivalents | 0%-10% | 2 | % | 3 | % | ||
Equity securities | 30%-70% | 49 | 53 | ||||
Fixed income | 30%-70% | 49 | 44 | ||||
Total | 100 | % | 100 | % | |||
Our target asset allocations are maintained through ongoing review and periodic rebalancing of equity and fixed income investments with assistance from an independent outside investment consultant. Also, the plan assets are diversified among asset classes, asset managers or funds and investment styles to avoid concentrations of risk. We expect that a modest allocation to cash will exist within the plans because each investment manager is likely to hold limited cash in a portfolio.
We categorize our plan assets within a three-level fair value hierarchy as follows:
Level 1 – Quoted market prices in active markets for identical assets.
Level 2 – Observable market based inputs or unobservable inputs that are corroborated by market data.
Level 3 – Unobservable inputs that are not corroborated by market data.
45
LANCASTER COLONY CORPORATION AND SUBSIDIARIES
NOTES TO CONSOLIDATED FINANCIAL STATEMENTS
(Tabular amounts in thousands, except per share data)
The following table summarizes the fair values and levels, within the fair value hierarchy, for our plan assets at June 30:
June 30, 2015 | |||||||||||||||
Asset Category | Level 1 | Level 2 | Level 3 | Total | |||||||||||
Cash and equivalents | $ | 522 | $ | — | $ | — | $ | 522 | |||||||
Money market funds | 181 | — | — | 181 | |||||||||||
U.S. government obligations | — | 4,266 | — | 4,266 | |||||||||||
Municipal obligations | — | 161 | — | 161 | |||||||||||
Corporate obligations | — | 3,174 | — | 3,174 | |||||||||||
Mortgage obligations | — | 1,857 | — | 1,857 | |||||||||||
Mutual funds fixed income | 8,820 | — | — | 8,820 | |||||||||||
Mutual funds equity | 18,165 | — | — | 18,165 | |||||||||||
Total | $ | 27,688 | $ | 9,458 | $ | — | $ | 37,146 | |||||||
June 30, 2014 | |||||||||||||||
Asset Category | Level 1 | Level 2 | Level 3 | Total | |||||||||||
Cash and equivalents | $ | 550 | $ | — | $ | — | $ | 550 | |||||||
Money market funds | 460 | — | — | 460 | |||||||||||
U.S. government obligations | — | 3,821 | — | 3,821 | |||||||||||
Corporate obligations | — | 2,921 | — | 2,921 | |||||||||||
Mortgage obligations | — | 2,181 | — | 2,181 | |||||||||||
Mutual funds fixed income | 8,300 | — | — | 8,300 | |||||||||||
Mutual funds equity | 20,492 | — | — | 20,492 | |||||||||||
Total | $ | 29,802 | $ | 8,923 | $ | — | $ | 38,725 | |||||||
The plan assets classified at Level 1 include money market funds and mutual funds. Quoted market prices in active markets for identical assets are available for investments in this category.
The plan assets classified at Level 2 include fixed income securities consisting of government securities, municipal obligations, corporate obligations and mortgage obligations. For these types of securities, market prices are observable for identical or similar investment securities but not readily accessible for each of those investments individually at the measurement date. For these assets, we obtain pricing information from an independent pricing service. The pricing service uses various pricing models for each asset class that are consistent with what other market participants would use. The inputs and assumptions to the model of the pricing service are derived from market observable sources including as applicable: benchmark yields, reported trades, broker/dealer quotes, issuer spreads, two-sided markets, benchmark securities, bids, offers and reference data including market research publications.
Relevant information with respect to our pension benefits as of June 30 can be summarized as follows:
2015 | 2014 | ||||||
Change in benefit obligation | |||||||
Benefit obligation at beginning of year | $ | 41,233 | $ | 39,519 | |||
Interest cost | 1,612 | 1,754 | |||||
Actuarial loss | 1,414 | 2,241 | |||||
Benefits paid | (2,217 | ) | (2,281 | ) | |||
Benefit obligation at end of year | $ | 42,042 | $ | 41,233 | |||
46
LANCASTER COLONY CORPORATION AND SUBSIDIARIES
NOTES TO CONSOLIDATED FINANCIAL STATEMENTS
(Tabular amounts in thousands, except per share data)
2015 | 2014 | ||||||
Change in plan assets | |||||||
Fair value of plan assets at beginning of year | $ | 38,725 | $ | 36,243 | |||
Actual return on plan assets | 638 | 4,763 | |||||
Employer contributions | — | — | |||||
Benefits paid | (2,217 | ) | (2,281 | ) | |||
Fair value of plan assets at end of year | $ | 37,146 | $ | 38,725 | |||
2015 | 2014 | ||||||
Reconciliation of funded status | |||||||
Net accrued benefit cost | $ | (4,896 | ) | $ | (2,508 | ) | |
2015 | 2014 | ||||||
Amounts recognized in the consolidated balance sheets consist of | |||||||
Prepaid benefit cost (noncurrent assets) | $ | 174 | $ | 438 | |||
Accrued benefit liability (noncurrent liabilities) | (5,070 | ) | (2,946 | ) | |||
Net amount recognized | $ | (4,896 | ) | $ | (2,508 | ) | |
2015 | 2014 | ||||||
Accumulated benefit obligation | $ | 42,042 | $ | 41,233 | |||
The following table discloses, in the aggregate, those plans with benefit obligations in excess of the fair value of plan assets at the June 30 measurement date:
2015 | 2014 | ||||||
Benefit obligations | $ | 38,980 | $ | 38,170 | |||
Fair value of plan assets at end of year | $ | 33,910 | $ | 35,224 | |||
Amounts recognized in accumulated other comprehensive loss at June 30 were as follows:
2015 | 2014 | ||||||
Net actuarial loss | $ | 16,564 | $ | 13,585 | |||
Income taxes | (6,120 | ) | (5,019 | ) | |||
Total | $ | 10,444 | $ | 8,566 | |||
The amount in accumulated other comprehensive loss expected to be recognized as a component of net periodic benefit cost during the next fiscal year is as follows:
2016 | |||
Net actuarial loss | $ | 542 | |
The following table summarizes the components of net periodic benefit income for our pension plans at June 30:
2015 | 2014 | 2013 | |||||||||
Components of net periodic benefit income | |||||||||||
Interest cost | $ | 1,612 | $ | 1,754 | $ | 1,633 | |||||
Expected return on plan assets | (2,632 | ) | (2,457 | ) | (2,380 | ) | |||||
Amortization of unrecognized net loss | 429 | 460 | 687 | ||||||||
Amortization of unrecognized net asset existing at transition | — | — | (1 | ) | |||||||
Net periodic benefit income | $ | (591 | ) | $ | (243 | ) | $ | (61 | ) | ||
We have not yet finalized our anticipated funding level for 2016, but based on initial estimates, we do not expect to make any contributions to our pension plans during 2016.
47
LANCASTER COLONY CORPORATION AND SUBSIDIARIES
NOTES TO CONSOLIDATED FINANCIAL STATEMENTS
(Tabular amounts in thousands, except per share data)
Benefit payments estimated for future years are as follows:
2016 | $ | 2,294 | |
2017 | $ | 2,304 | |
2018 | $ | 2,322 | |
2019 | $ | 2,354 | |
2020 | $ | 2,405 | |
2021 - 2025 | $ | 12,752 | |
Note 13 – Postretirement Benefits
Postretirement Medical and Life Insurance Benefit Plans
We and certain of our operating subsidiaries provide multiple postretirement medical and life insurance benefit plans. We recognize the cost of benefits as the employees render service. Postretirement benefits are funded as incurred. At the end of the year, we discount our plan liabilities using an assumed discount rate. In estimating this rate, we, along with our third-party actuaries, review the projected timing of future benefit payments, bond indices, consider yield curve analysis results and the past history of discount rates.
The actuarial present value of benefit obligations summarized below was based on the following assumption:
2015 | 2014 | ||||
Weighted-average assumption as of June 30 | |||||
Discount rate | 4.12 | % | 4.02 | % | |
The net periodic benefit costs were determined utilizing the following beginning-of-the-year assumptions:
2015 | 2014 | 2013 | ||||||
Discount rate | 4.02 | % | 4.57 | % | 3.78 | % | ||
Health care cost trend rate - pre-Medicare eligible claims | 7.50 | % | 8.00 | % | 10.00 | % | ||
Health care cost trend rate - Medicare eligible claims | 6.75 | % | 7.00 | % | 7.00 | % | ||
Relevant information with respect to our postretirement medical and life insurance benefits as of June 30 can be summarized as follows:
2015 | 2014 | ||||||
Change in benefit obligation | |||||||
Benefit obligation at beginning of year | $ | 2,779 | $ | 2,934 | |||
Service cost | 32 | 31 | |||||
Interest cost | 108 | 130 | |||||
Actuarial loss (gain) | 155 | (31 | ) | ||||
Curtailment gain | — | (161 | ) | ||||
Plan participant contributions | 49 | 53 | |||||
Benefits paid | (148 | ) | (177 | ) | |||
Benefit obligation at end of year | $ | 2,975 | $ | 2,779 | |||
2015 | 2014 | ||||||
Change in plan assets | |||||||
Employer contributions | $ | 99 | $ | 124 | |||
Plan participant contributions | 49 | 53 | |||||
Benefits paid | (148 | ) | (177 | ) | |||
Fair value of plan assets at end of year | $ | — | $ | — | |||
48
LANCASTER COLONY CORPORATION AND SUBSIDIARIES
NOTES TO CONSOLIDATED FINANCIAL STATEMENTS
(Tabular amounts in thousands, except per share data)
2015 | 2014 | ||||||
Reconciliation of funded status | |||||||
Net accrued benefit cost | $ | (2,975 | ) | $ | (2,779 | ) | |
2015 | 2014 | ||||||
Amounts recognized in the consolidated balance sheets consist of | |||||||
Current accrued benefit liability | $ | (169 | ) | $ | (171 | ) | |
Noncurrent accrued benefit liability | $ | (2,806 | ) | $ | (2,608 | ) | |
2015 | 2014 | ||||||
Accumulated benefit obligation | $ | 2,975 | $ | 2,779 | |||
Amounts recognized in accumulated other comprehensive loss at June 30 were as follows:
2015 | 2014 | ||||||
Net actuarial gain | $ | (605 | ) | $ | (788 | ) | |
Prior service benefit | (8 | ) | (13 | ) | |||
Income taxes | 226 | 296 | |||||
Total | $ | (387 | ) | $ | (505 | ) | |
Amounts in accumulated other comprehensive loss expected to be recognized as components of net periodic benefit cost during the next fiscal year are as follows:
2016 | |||
Prior service asset amortization | $ | (5 | ) |
Unrecognized gain amortization | (17 | ) | |
Total | $ | (22 | ) |
The following table summarizes the components of net periodic benefit cost (income) for our postretirement plans at June 30:
2015 | 2014 | 2013 | |||||||||
Components of net periodic benefit cost (income) | |||||||||||
Service cost | $ | 32 | $ | 31 | $ | 31 | |||||
Interest cost | 108 | 130 | 113 | ||||||||
Curtailment benefit | — | (161 | ) | — | |||||||
Amortization of unrecognized net gain | (28 | ) | (27 | ) | (22 | ) | |||||
Amortization of prior service asset | (5 | ) | (5 | ) | (5 | ) | |||||
Net periodic benefit cost (income) | $ | 107 | $ | (32 | ) | $ | 117 | ||||
The above noted net periodic benefit cost (income) includes income of $0.1 million for 2014, and an immaterial amount for 2013, that are presented in discontinued operations because those amounts relate to sold operations. In 2014, our plans experienced a curtailment due to a significant reduction in future service as a result of the sale of our candle manufacturing and marketing operations.
We expect to contribute approximately $0.2 million to our postretirement benefit plans in 2016.
49
LANCASTER COLONY CORPORATION AND SUBSIDIARIES
NOTES TO CONSOLIDATED FINANCIAL STATEMENTS
(Tabular amounts in thousands, except per share data)
Benefit payments estimated for future years are as follows:
2016 | $ | 169 | |
2017 | $ | 160 | |
2018 | $ | 168 | |
2019 | $ | 175 | |
2020 | $ | 182 | |
2021 - 2025 | $ | 923 | |
The following table summarizes the health care costs trend assumptions for other postretirement benefit measurement purposes:
2015 | 2014 | ||||
Pre-Medicare eligible claims: | |||||
Health care cost trend rate assumed for next fiscal year | 7.50 | % | 7.50 | % | |
Ultimate health care cost trend rate | 5.00 | % | 5.00 | % | |
Year that rate reaches ultimate trend rate | 2024 | 2021 | |||
Medicare eligible claims: | |||||
Health care cost trend rate assumed for next fiscal year | 8.00 | % | 6.75 | % | |
Ultimate health care cost trend rate | 5.00 | % | 5.00 | % | |
Year that rate reaches ultimate trend rate | 2024 | 2021 | |||
Assumed health care cost rates can have a significant effect on the amounts reported for the health care plans. A one-percentage-point change in assumed health care cost trend rates would have the following effect:
1-Percentage-Point Increase | 1-Percentage-Point Decrease | ||||||
Effect on total of service and interest cost components | $ | 10 | $ | (8 | ) | ||
Effect on postretirement benefit obligation as of June 30, 2015 | $ | 233 | $ | (203 | ) | ||
Note 14 – Defined Contribution and Other Employee Plans
Defined Contribution Plans
We sponsored four defined contribution plans established pursuant to Section 401(k) of the Internal Revenue Code during 2015. Contributions are determined under various formulas, and we contributed to two of the plans in 2015. Costs related to such plans for each of the years ended June 30 were as follows:
2015 | 2014 | 2013 | |||||||||
Costs related to defined contribution plans | $ | 888 | $ | 808 | $ | 724 | |||||
Multiemployer Plans
Certain of our subsidiaries participate in multiemployer plans that provide pension benefits to retiree workers under collective bargaining contracts at such locations. These plans generally provide for retirement, death and/or termination benefits for eligible employees within the applicable collective bargaining contract, based on specific eligibility/participation requirements, vesting periods and benefit formulas. The risks of participating in these multiemployer plans are different from single-employer plans in the following aspects: (1) assets contributed to the multiemployer plan by one employer may be used to provide benefits to employees of other participating employers, (2) if a participating employer stops contributing to the plan, the unfunded obligations of the plan may be borne by the remaining participating employers and (3) if we choose to stop participating in any of our multiemployer plans, we may be required to pay those plans an amount based on the underfunded status of the plan, referred to as a withdrawal liability.
50
LANCASTER COLONY CORPORATION AND SUBSIDIARIES
NOTES TO CONSOLIDATED FINANCIAL STATEMENTS
(Tabular amounts in thousands, except per share data)
Our participation in these plans for the annual period ended June 30, 2015 is reflected in the following table. All information in the table is as of December 31 of the relevant year, except contributions which are based on our fiscal year, or except as otherwise noted. The EIN-PN column provides the Employer Identification Number (“EIN”) and the Plan Number (“PN”). The pension protection act zone status is based on information that we received from the plan. Among other factors, generally, plans in critical status (red zone) are less than 65 percent funded, plans in endangered or seriously endangered status (yellow zone or orange zone, respectively) are less than 80 percent funded, and plans at least 80 percent funded are said to be in the green zone. The FIP/RP status pending/implemented column indicates plans for which a funding improvement plan (“FIP”) or a rehabilitation plan (“RP”) is either pending or has been implemented by the trustees of each plan. There have been no significant changes that affect the comparability of 2015, 2014 or 2013 contributions.
Pension Protection Act Zone Status | Fiscal Year Contributions | |||||||||||||||||||||||
Plan Name | EIN/PN | 2014 | 2013 | FIP/RP Status Pending / Implemented | 2015 | 2014 | 2013 | Surcharge Imposed | Expiration Date of Collective Bargaining Agreement | |||||||||||||||
Cleveland Bakers and Teamsters Pension Fund | 34-0904419-001 | Red 12/31/13 | Red 12/31/12 | Yes, Implemented | $ | 1,501 | $ | 1,332 | $ | 1,324 | No | 4/30/2016 | ||||||||||||
Western Conference of Teamsters Pension Plan | 91-6145047-001 | Green 12/31/13 | Green 12/31/12 | No | 440 | 397 | 390 | No | 12/15/2018 | |||||||||||||||
Total contributions to multiemployer plans | $ | 1,941 | $ | 1,729 | $ | 1,714 | ||||||||||||||||||
Our contributions to the Cleveland Bakers and Teamsters Pension Fund exceeded 5% of the total contributions to the plan in the plan years ended December 31, 2013, 2012 and 2011.
In addition to pension benefits provided under these two multiemployer plans, we also contribute amounts for health and welfare benefits that are defined by each plan. These benefits are not vested. The contributions required by our participation in these plans for each of the years ended June 30 were as follows:
2015 | 2014 | 2013 | |||||||||
Multiemployer health and welfare plan contributions | $ | 3,796 | $ | 3,367 | $ | 3,666 | |||||
Deferred Compensation Plan
We offer a deferred compensation plan for select employees who may elect to defer a certain percentage of annual compensation. We do not match any contributions. Each participant earns interest based upon the prime rate of interest, adjusted semi-annually, on their respective deferred compensation balance. Participants are paid out upon retirement or termination.
The following table summarizes our liability for total deferred compensation and accrued interest at June 30:
2015 | 2014 | ||||||
Liability for deferred compensation and accrued interest | $ | 4,411 | $ | 4,055 | |||
Deferred compensation expense for each of the years ended June 30 was as follows:
2015 | 2014 | 2013 | |||||||||
Deferred compensation expense | $ | 136 | $ | 131 | $ | 118 | |||||
51
LANCASTER COLONY CORPORATION AND SUBSIDIARIES
NOTES TO CONSOLIDATED FINANCIAL STATEMENTS
(Tabular amounts in thousands, except per share data)
Note 15 – Selected Quarterly Financial Data (Unaudited)
First Quarter | Second Quarter | Third Quarter | Fourth Quarter | Fiscal Year | |||||||||||||||
2015 | |||||||||||||||||||
Net Sales | $ | 259,987 | $ | 303,411 | $ | 263,400 | $ | 277,716 | $ | 1,104,514 | |||||||||
Gross Margin | $ | 57,424 | $ | 78,653 | $ | 56,625 | $ | 64,990 | $ | 257,692 | |||||||||
Income From Continuing Operations | $ | 22,761 | $ | 32,954 | $ | 20,403 | $ | 25,568 | $ | 101,686 | |||||||||
Net Income | $ | 22,761 | $ | 32,954 | $ | 20,403 | $ | 25,568 | $ | 101,686 | |||||||||
Diluted Income Per Common Share (1): | |||||||||||||||||||
Continuing Operations | $ | 0.83 | $ | 1.20 | $ | 0.75 | $ | 0.93 | $ | 3.72 | |||||||||
Net Income | $ | 0.83 | $ | 1.20 | $ | 0.75 | $ | 0.93 | $ | 3.72 | |||||||||
First Quarter | Second Quarter | Third Quarter | Fourth Quarter | Fiscal Year | |||||||||||||||
2014 | |||||||||||||||||||
Net Sales | $ | 248,137 | $ | 292,281 | $ | 241,849 | $ | 258,808 | $ | 1,041,075 | |||||||||
Gross Margin | $ | 57,171 | $ | 81,623 | $ | 51,908 | $ | 57,866 | $ | 248,568 | |||||||||
Income From Continuing Operations | $ | 24,052 | $ | 37,133 | $ | 18,900 | $ | 20,901 | $ | 100,986 | |||||||||
Income (Loss) From Discontinued Operations, Net of Tax | $ | 749 | $ | 2,101 | $ | (29,276 | ) | $ | 426 | $ | (26,000 | ) | |||||||
Net Income (Loss) | $ | 24,801 | $ | 39,234 | $ | (10,376 | ) | $ | 21,327 | $ | 74,986 | ||||||||
Diluted Income (Loss) Per Common Share (1): | |||||||||||||||||||
Continuing Operations | $ | 0.88 | $ | 1.36 | $ | 0.69 | $ | 0.76 | $ | 3.69 | |||||||||
Discontinued Operations | $ | 0.03 | $ | 0.08 | $ | (1.07 | ) | $ | 0.02 | $ | (0.95 | ) | |||||||
Net Income (Loss) | $ | 0.91 | $ | 1.44 | $ | (0.38 | ) | $ | 0.78 | $ | 2.74 | ||||||||
(1) | Diluted income (loss) per common share amounts are calculated independently for each of the quarters presented. Accordingly, the sum of the quarterly income (loss) per common share amounts may not agree with the fiscal year. |
52
Item 9. Changes in and Disagreements With Accountants on Accounting and Financial Disclosure
None.
Item 9A. Controls and Procedures
We maintain disclosure controls and procedures that are designed to ensure that information required to be disclosed in the reports that we file or submit under the Securities Exchange Act of 1934 is recorded, processed, summarized and reported within the time periods specified in the Securities and Exchange Commission’s (“SEC”) rules and forms, and that such information is accumulated and communicated to our management, including our Chief Executive Officer and Chief Financial Officer, as appropriate, to allow for timely decisions regarding required disclosure. In designing and evaluating the disclosure controls and procedures, management recognizes that any controls and procedures, no matter how well-designed and operated, can provide only reasonable assurance of achieving the desired control objectives, and management must apply its judgment in evaluating the cost–benefit relationship of possible controls and procedures.
As required by SEC Rule 13a-15(b), we carried out an evaluation, under the supervision and with the participation of our management, including our Chief Executive Officer and our Chief Financial Officer, of the effectiveness of the design and operation of our disclosure controls and procedures as of the end of the period covered by this Annual Report on Form 10-K. Based on the foregoing, our Chief Executive Officer and Chief Financial Officer concluded that our disclosure controls and procedures were effective at the reasonable assurance level as of June 30, 2015.
REPORT OF MANAGEMENT
Internal control over financial reporting refers to the process designed by, or under the supervision of, our Chief Executive Officer and Chief Financial Officer, and effected by our Board of Directors, management and other personnel, to provide reasonable assurance regarding the reliability of financial reporting and the preparation of financial statements for external purposes in accordance with generally accepted accounting principles, and includes those policies and procedures that:
1. | Pertain to the maintenance of records that in reasonable detail accurately and fairly reflect the transactions and dispositions of our assets; |
2. | Provide reasonable assurance that transactions are recorded as necessary to permit preparation of financial statements in accordance with generally accepted accounting principles, and that our receipts and expenditures are being made only in accordance with authorizations of management and our directors; and |
3. | Provide reasonable assurance regarding prevention or timely detection of an unauthorized acquisition, use or disposition of our assets that could have a material effect on the financial statements. |
Internal control over financial reporting cannot provide absolute assurance of achieving financial reporting objectives because of its inherent limitations. Internal control over financial reporting is a process that involves human diligence and compliance and is subject to lapses in judgment and breakdowns resulting from human failures. Internal control over financial reporting also can be circumvented by collusion or improper management override. Because of such limitations, there is a risk that material misstatements may not be prevented or detected on a timely basis by internal control over financial reporting. However, these inherent limitations are known features of the financial reporting process. Therefore, it is possible to design into the process safeguards to reduce, though not eliminate, this risk.
Management is responsible for establishing and maintaining adequate internal control over financial reporting. Management has used the framework set forth in the report entitled Internal Control – Integrated Framework (2013) published by the Committee of Sponsoring Organizations (COSO) of the Treadway Commission to evaluate the effectiveness of our internal control over financial reporting. Management has concluded that our internal control over financial reporting was effective as of the end of the most recent year.
On March 13, 2015 we acquired Flatout. As allowed by the SEC guidance, we have excluded this business from our assessment of internal control over financial reporting due to the proximity of the acquisition date to the date of our assessment. The total assets (including goodwill and intangible assets), net sales and net income of Flatout represent 16%, 1% and less than 1% of consolidated total assets, net sales and net income as of and for the year ended June 30, 2015, respectively.
Our internal control over financial reporting has been audited by Deloitte & Touche LLP, an independent registered public accounting firm. Their opinion, as to the effectiveness of our internal control over financial reporting, is stated in their report, which is set forth on the following page.
There has been no change in our internal control over financial reporting during our most recent quarter that has materially affected, or is reasonably likely to materially affect, our internal control over financial reporting.
53
REPORT OF INDEPENDENT REGISTERED PUBLIC ACCOUNTING FIRM
To the Board of Directors and Shareholders of
Lancaster Colony Corporation
Columbus, Ohio
We have audited the internal control over financial reporting of Lancaster Colony Corporation and subsidiaries (the “Company”) as of June 30, 2015, based on criteria established in Internal Control - Integrated Framework (2013) issued by the Committee of Sponsoring Organizations of the Treadway Commission. As described in Report of Management, management excluded from its assessment the internal control over financial reporting at Flatout, Inc., which was acquired on March 13, 2015, and whose financial statements constitute 16% of total assets, 1% of net sales and less than 1% of net income of the consolidated financial statement amounts as of and for the year ended June 30, 2015. Accordingly, our audit did not include the internal control over financial reporting at Flatout, Inc. The Company’s management is responsible for maintaining effective internal control over financial reporting and for its assessment of the effectiveness of internal control over financial reporting, included in the accompanying Report of Management. Our responsibility is to express an opinion on the Company’s internal control over financial reporting based on our audit.
We conducted our audit in accordance with the standards of the Public Company Accounting Oversight Board (United States). Those standards require that we plan and perform the audit to obtain reasonable assurance about whether effective internal control over financial reporting was maintained in all material respects. Our audit included obtaining an understanding of internal control over financial reporting, assessing the risk that a material weakness exists, testing and evaluating the design and operating effectiveness of internal control based on the assessed risk, and performing such other procedures as we considered necessary in the circumstances. We believe that our audit provides a reasonable basis for our opinion.
A company’s internal control over financial reporting is a process designed by, or under the supervision of, the company’s principal executive and principal financial officers, or persons performing similar functions, and effected by the company’s board of directors, management, and other personnel to provide reasonable assurance regarding the reliability of financial reporting and the preparation of financial statements for external purposes in accordance with generally accepted accounting principles. A company’s internal control over financial reporting includes those policies and procedures that (1) pertain to the maintenance of records that, in reasonable detail, accurately and fairly reflect the transactions and dispositions of the assets of the company; (2) provide reasonable assurance that transactions are recorded as necessary to permit preparation of financial statements in accordance with generally accepted accounting principles, and that receipts and expenditures of the company are being made only in accordance with authorizations of management and directors of the company; and (3) provide reasonable assurance regarding prevention or timely detection of unauthorized acquisition, use, or disposition of the company’s assets that could have a material effect on the financial statements.
Because of the inherent limitations of internal control over financial reporting, including the possibility of collusion or improper management override of controls, material misstatements due to error or fraud may not be prevented or detected on a timely basis. Also, projections of any evaluation of the effectiveness of the internal control over financial reporting to future periods are subject to the risk that the controls may become inadequate because of changes in conditions, or that the degree of compliance with the policies or procedures may deteriorate.
In our opinion, the Company maintained, in all material respects, effective internal control over financial reporting as of June 30, 2015, based on the criteria established in Internal Control - Integrated Framework (2013) issued by the Committee of Sponsoring Organizations of the Treadway Commission.
We have also audited, in accordance with the standards of the Public Company Accounting Oversight Board (United States), the consolidated financial statements and financial statement schedule as of and for the year ended June 30, 2015 of the Company and our report dated August 28, 2015, expressed an unqualified opinion on those consolidated financial statements and financial statement schedule.
/s/ Deloitte & Touche LLP |
Deloitte & Touche LLP |
Columbus, Ohio
August 28, 2015
54
Item 9B. Other Information
None.
PART III
Item 10. Directors, Executive Officers and Corporate Governance
The information regarding our directors and executive officers, including the identification of the Audit Committee and the Audit Committee financial expert, is incorporated by reference to the information contained in our definitive proxy statement for our November 2015 Annual Meeting of Shareholders (“2015 Proxy Statement”) to be filed with the SEC pursuant to Regulation 14A promulgated under the Exchange Act.
The information regarding Section 16(a) beneficial ownership reporting compliance is incorporated by reference to the material under the heading “Section 16(a) Beneficial Ownership Reporting Compliance” in our 2015 Proxy Statement.
The information regarding changes, if any, in procedures by which shareholders may recommend nominees to our Board of Directors is incorporated by reference to the information contained in our 2015 Proxy Statement.
The information regarding our Code of Business Ethics is incorporated by reference to the information contained in our 2015 Proxy Statement.
Item 11. Executive Compensation
The information regarding executive officer and director compensation is incorporated by reference to the information contained in our 2015 Proxy Statement.
The information regarding Compensation Committee interlocks and insider participation and the Compensation Committee Report is incorporated by reference to the information contained in our 2015 Proxy Statement.
Item 12. Security Ownership of Certain Beneficial Owners and Management and Related Stockholder Matters
The information regarding security ownership of certain beneficial owners and management and securities authorized for issuance under our equity compensation plans is incorporated by reference to the information contained in our 2015 Proxy Statement.
Item 13. Certain Relationships and Related Transactions, and Director Independence
The information regarding certain relationships and related transactions and director independence is incorporated by reference to the information contained in our 2015 Proxy Statement.
Item 14. Principal Accounting Fees and Services
Information regarding fees paid to and services provided by our independent registered public accounting firm during the fiscal years ended June 30, 2015 and 2014 and the pre-approval policies and procedures of the Audit Committee is incorporated by reference to the information contained in our 2015 Proxy Statement.
55
PART IV
Item 15. Exhibits, Financial Statement Schedules
(a) (1) Financial Statements. The following consolidated financial statements as of June 30, 2015 and 2014 and for each of the three years in the period ended June 30, 2015, together with the report thereon of Deloitte & Touche LLP dated August 28, 2015, are included in Item 8 of this report:
Report of Independent Registered Public Accounting Firm
Consolidated Balance Sheets as of June 30, 2015 and 2014
Consolidated Statements of Income for the years ended June 30, 2015, 2014 and 2013
Consolidated Statements of Comprehensive Income for the years ended June 30, 2015, 2014 and 2013
Consolidated Statements of Cash Flows for the years ended June 30, 2015, 2014 and 2013
Consolidated Statements of Shareholders’ Equity for the years ended June 30, 2015, 2014 and 2013
Notes to Consolidated Financial Statements
(a) (2) Financial Statement Schedules. Included in Part IV of this report is the following additional financial data that should be read in conjunction with the consolidated financial statements included in Item 8 of this report:
Schedule II - Valuation and Qualifying Accounts.
Supplemental schedules not included with the additional financial data have been omitted because they are not applicable or the required information is shown in the consolidated financial statements or notes thereto.
(a) (3) Exhibits Required by Item 601 of Regulation S-K and Item 15(b). See Index to Exhibits following “Schedule II – Valuation and Qualifying Accounts.”
56
SIGNATURES
Pursuant to the requirements of Section 13 and 15(d) of the Securities Exchange Act of 1934, the registrant has duly caused this report to be signed on its behalf by the undersigned, thereunto duly authorized.
LANCASTER COLONY CORPORATION | |
(Registrant) | |
By: | /s/ JOHN B. GERLACH, JR. |
John B. Gerlach, Jr. | |
Chairman, Chief Executive Officer, | |
President and Director | |
Date: | August 28, 2015 |
Pursuant to the requirements of the Securities Exchange Act of 1934, this report has been signed below by the following persons on behalf of the registrant and in the capacities and on the dates indicated.
Signatures | Title | Date | ||
/S/ JOHN B. GERLACH, JR. | Chairman, | August 28, 2015 | ||
John B. Gerlach, Jr. | Chief Executive Officer, | |||
President and Director | ||||
(Principal Executive Officer) | ||||
/S/ DOUGLAS A. FELL | Treasurer, Vice President, | August 28, 2015 | ||
Douglas A. Fell | Assistant Secretary | |||
and Chief Financial Officer | ||||
(Principal Financial and | ||||
Accounting Officer) | ||||
/S/ JAMES B. BACHMANN | Director | August 19, 2015 | ||
James B. Bachmann | ||||
/S/ NEELI BENDAPUDI | Director | August 19, 2015 | ||
Neeli Bendapudi | ||||
/S/ JOHN L. BOYLAN | Director | August 19, 2015 | ||
John L. Boylan | ||||
/S/ KENNETH L. COOKE | Director | August 19, 2015 | ||
Kenneth L. Cooke | ||||
/S/ ROBERT L. FOX | Director | August 19, 2015 | ||
Robert L. Fox | ||||
/S/ ALAN F. HARRIS | Director | August 19, 2015 | ||
Alan F. Harris | ||||
/S/ ROBERT P. OSTRYNIEC | Director | August 19, 2015 | ||
Robert P. Ostryniec | ||||
/S/ ZUHEIR SOFIA | Director | August 19, 2015 | ||
Zuheir Sofia | ||||
57
LANCASTER COLONY CORPORATION AND SUBSIDIARIES
SCHEDULE II. VALUATION AND QUALIFYING ACCOUNTS
For each of the three years in the period ended June 30, 2015
Column A | Column B | Column C | Column D | Column E | ||||||||||||||||
Description | Balance at Beginning of Year | Additions Charged to Costs and Expenses | Additions Charged to Other Accounts (A) | Deductions (B) | Balance at End of Year | |||||||||||||||
Reserves deducted from asset to which they apply - Allowance for doubtful accounts (amounts in thousands): | ||||||||||||||||||||
Year Ended June 30, 2013 | $ | 361 | $ | 5 | $ | — | $ | 26 | $ | 340 | ||||||||||
Year Ended June 30, 2014 | $ | 340 | $ | 96 | $ | — | $ | 4 | $ | 432 | ||||||||||
Year Ended June 30, 2015 | $ | 432 | $ | (263 | ) | $ | 41 | $ | 4 | $ | 206 | |||||||||
Notes:
(A) | Represents balance acquired in 2015 acquisition of Flatout. |
(B) | Represents uncollectible accounts written-off net of recoveries. |
58
LANCASTER COLONY CORPORATION AND SUBSIDIARIES
FORM 10-K
JUNE 30, 2015
INDEX TO EXHIBITS
Exhibit Number | Description | |
2.1 | Stock Purchase Agreement, dated as of March 13, 2015 by and among T. Marzetti Company, as Buyer, Flatout Holdings, Inc., as the Company, the shareholders of the Company, as Sellers, and NCP-Flatout Seller Rep LLC as Sellers’ Representative (incorporated by reference to Exhibit 2.1 to the Current Report on Form 8-K (000-04065), filed March 16, 2015). | |
2.2 | Asset Purchase Agreement Between Lancaster Colony Corporation and CL Products International, LLC, dated as of January 30, 2014 (incorporated by reference to Exhibit 2.1 to the Current Report on Form 8-K (000-04065), filed January 30, 2014). | |
3.1 | Amended and Restated Articles of Incorporation of Lancaster Colony Corporation (incorporated by reference to Exhibit 3.1 to the Quarterly Report on Form 10-Q (000-04065), filed February 9, 2009). | |
3.2 | Amended and Restated Regulations of Lancaster Colony Corporation (incorporated by reference to Exhibit 3.2 to the Quarterly Report on Form 10-Q (000-04065), filed February 9, 2009). | |
4.1* | Specimen Certificate of Common Stock. | |
10.1 | Credit Agreement, dated as of April 18, 2012, by and among Lancaster Colony Corporation, the Lenders (as defined therein) and JPMorgan Chase Bank, NA (incorporated by reference to Exhibit 10.1 to the Current Report on Form 8-K (000-04065), filed April 23, 2012). | |
10.2* | Joinder and Amendment Agreement, dated as of May 5, 2015, by and among Lancaster Colony Corporation, the Lenders and JPMorgan Chase Bank, NA. | |
10.3(a) | Lancaster Colony Corporation Executive Employee Deferred Compensation Plan (incorporated by reference to Exhibit 10.9 to the Annual Report on Form 10-K (000-04065), filed September 26, 2000). | |
10.4(a) | 2004 Amendment to Lancaster Colony Corporation Executive Employee Deferred Compensation Plan (incorporated by reference to Exhibit 10.1 to the Current Report on Form 8-K (000-04065), filed January 3, 2005). | |
10.5(a) | Lancaster Colony Corporation 2005 Executive Employee Deferred Compensation Plan (incorporated by reference to Exhibit 99.2 to the Current Report on Form 8-K (000-04065), filed February 25, 2005). | |
10.6(a) | Lancaster Colony Corporation Amended and Restated 2005 Stock Plan (incorporated by reference to Exhibit 10.1 to the Current Report on Form 8-K (000-04065), filed November 19, 2010). | |
10.7(a) | Form of Restricted Stock Award Agreement for Directors under the Lancaster Colony Corporation 2005 Stock Plan (incorporated by reference to Exhibit 10.1 to the Quarterly Report on Form 10-Q (000-04065), filed February 9, 2011). | |
10.8(a) | Form of Stock Appreciation Rights Award Agreement for employees and consultants under the Lancaster Colony Corporation 2005 Stock Plan (incorporated by reference to Exhibit 10.2 to the Quarterly Report on Form 10-Q (000-04065), filed May 7, 2015). | |
10.9(a) | Form of Restricted Stock Award Agreement for employees and consultants under the Lancaster Colony Corporation 2005 Stock Plan (incorporated by reference to Exhibit 10.1 to the Quarterly Report on Form 10-Q (000-04065), filed May 7, 2015). | |
10.10(a) | Amended and Restated Key Employee Severance Agreement, dated December 3, 2008, between Lancaster Colony Corporation and Bruce L. Rosa (incorporated by reference to Exhibit 10.2 to the Quarterly Report on Form 10-Q (000-04065), filed February 9, 2009). | |
10.11(a) | Description of Executive Bonus Arrangements (incorporated by reference to Exhibit 10.9 to the Annual Report on Form 10-K (000-04065), filed September 10, 2004). | |
21* | Subsidiaries of Registrant. | |
23* | Consent of Independent Registered Public Accounting Firm. | |
59
Exhibit Number | Description | |
31.1* | Certification of CEO pursuant to Rule 13a-14(a)/15d-14(a) of the Securities Exchange Act of 1934. | |
31.2* | Certification of CFO pursuant to Rule 13a-14(a)/15d-14(a) of the Securities Exchange Act of 1934. | |
32** | Certification of CEO and CFO pursuant to 18 U.S.C. Section 1350, as adopted pursuant to Section 906 of the Sarbanes-Oxley Act of 2002. | |
101.INS* | XBRL Instance Document | |
101.SCH* | XBRL Taxonomy Extension Schema Document | |
101.CAL* | XBRL Taxonomy Extension Calculation Linkbase Document | |
101.DEF* | XBRL Taxonomy Extension Definition Linkbase Document | |
101.LAB* | XBRL Taxonomy Extension Label Linkbase Document | |
101.PRE* | XBRL Taxonomy Extension Presentation Linkbase Document | |
(a) | Indicates a management contract or compensatory plan, contract or arrangement in which any Director or any Executive Officer participates. | |
* | Filed herewith | |
** | Furnished herewith | |
60