Attached files
| file | filename |
|---|---|
| EX-31.1 - EXHIBIT 31.1 - LANDEC CORP \CA\ | ex31-1.htm |
| EX-32.1 - EXHIBIT 32.1 - LANDEC CORP \CA\ | ex32-1.htm |
| EX-23.1 - EXHIBIT 23.1 - LANDEC CORP \CA\ | ex23-1.htm |
| EX-31.2 - EXHIBIT 31.2 - LANDEC CORP \CA\ | ex31-2.htm |
| EX-32.2 - EXHIBIT 32.2 - LANDEC CORP \CA\ | ex32-2.htm |
UNITED STATES
SECURITIES AND EXCHANGE COMMISSION
Washington, D.C. 20549
FORM 10-K
|
[X] |
ANNUAL REPORT PURSUANT TO SECTION 13 OR 15(d) OF THE SECURITIES EXCHANGE ACT OF 1934 |
For the Fiscal Year Ended May 31, 2015, or
|
[ ] |
TRANSITION REPORT PURSUANT TO SECTION 13 OR 15(d) OF THE SECURITIES EXCHANGE ACT OF 1934 |
For the Transition period for _________ to _________.
Commission file number: 0-27446
LANDEC CORPORATION
(Exact name of registrant as specified in its charter)
|
Delaware |
94-3025618 |
|
(State or other jurisdiction of |
(IRS Employer |
|
incorporation or organization) |
Identification Number) |
3603 Haven Avenue
Menlo Park, California 94025
(Address of principal executive offices)
Registrant's telephone number, including area code:
(650) 306-1650
Securities registered pursuant to Section 12(b) of the Act:
|
Title of each class |
Name of each exchange on which registered |
|
Common Stock |
The NASDAQ Global Select Stock Market |
Securities registered pursuant to Section 12(g) of the Act:
None
(Title of Class)
Indicate by check mark if the registrant is a well-known seasoned issuer, as defined in Rule 405 of the Securities Act.
Yes ___ No X
Indicate by check mark if the registrant is not required to file reports pursuant to Section 13 or Section 15(d) of the Act.
Yes ___ No X
Indicate by check mark whether the registrant (1) has filed all reports required to be filed by Section 13 or 15(d) of the Act during the preceding 12 months (or for such shorter period that the registrant was required to file such reports), and (2) has been subject to such filing requirements for the past 90 days.
Yes X No ___
Indicate by check mark whether the registrant has submitted electronically and posted on its corporate Website, if any, every Interactive Data File required to be submitted and posted pursuant to Rule 405 of Regulation S-T during the preceding 12 months (or for such shorter period that the registrant was required to submit and post such files).
Yes X No ___
Indicate by check mark if disclosure of delinquent filers pursuant to Item 405 of Regulation S-K is not contained herein, and will not be contained, to the best of registrant’s knowledge, in definitive proxy or information statements incorporated by reference in Part III of this Form 10-K or any amendment to this Form 10-K. __
Indicate by check mark whether the registrant is a large accelerated filer, an accelerated filer, a non-accelerated filer or a smaller reporting company. See definition of “large accelerated filer” and “accelerated filer” and “smaller reporting company” in Rule 12b-2 of the Exchange Act.
Large Accelerated Filer ___ Accelerated Filer X
Non Accelerated Filer ___ Smaller Reporting Company ___
Indicate by check mark whether the registrant is a shell company (as defined in Rule 12b-2 of the Act).
Yes ___ No X
The aggregate market value of voting stock held by non-affiliates of the Registrant was approximately $344,754,000 as of November 30, 2014, the last business day of the registrant’s most recently completed second fiscal quarter, based upon the closing sales price on The NASDAQ Global Select Market reported for such date. Shares of Common Stock held by each officer and director and by each person who owns 10% or more of the outstanding Common Stock have been excluded from such calculation in that such persons may be deemed to be affiliates. This determination of affiliate status is not necessarily a conclusive determination for other purposes.
As of July 17, 2015, there were 27,009,342 shares of Common Stock outstanding.
DOCUMENTS INCORPORATED BY REFERENCE
Portions of the registrant’s definitive proxy statement relating to its October 2015 Annual Meeting of Stockholders which statement will be filed not later than 120 days after the end of the fiscal year covered by this report, are incorporated by reference in Part III hereof.
LANDEC CORPORATION
ANNUAL REPORT ON FORM 10-K
TABLE OF CONTENTS
|
Item No. |
Description |
Page |
|
Part I |
||
|
1. |
Business |
4 |
|
1A. |
Risk Factors |
13 |
|
1B. |
Unresolved Staff Comments |
21 |
|
2. |
Properties |
21 |
|
3. |
Legal Proceedings |
21 |
|
4. |
Mine Safety Disclosures |
21 |
|
Part II |
||
|
5. |
Market for Registrant’s Common Equity, Related Stockholder Matters and Issuer Purchases of Equity Securities |
22 |
|
6. |
Selected Financial Data |
22 |
|
7. |
Management’s Discussion and Analysis of Financial Condition and Results of Operations |
23 |
|
7A. |
Quantitative and Qualitative Disclosures about Market Risk |
41 |
|
8. |
Financial Statements and Supplementary Data |
41 |
|
9. |
Changes in and Disagreements with Accountants on Accounting and Financial Disclosure |
41 |
|
9A. |
Controls and Procedures |
42 |
|
9B. |
Other Information |
43 |
|
Part III |
||
|
10. |
Directors, Executive Officers and Corporate Governance |
44 |
|
11. |
Executive Compensation |
44 |
|
12. |
Security Ownership of Certain Beneficial Owners and Management and Related Stockholder Matters |
44 |
|
13. |
Certain Relationships and Related Transactions, and Director Independence |
44 |
|
14. |
Principal Accountant Fees and Services |
44 |
|
Part IV |
||
|
15. |
Exhibits and Financial Statement Schedules |
45 |
PART I
Item 1. Business
This report contains forward-looking statements within the meaning of Section 21E of the Securities Exchange Act of 1934. Words such as “projected,” “expects,” “believes,” “intends,” “assumes” and similar expressions are used to identify forward-looking statements. These statements are made based upon current expectations and projections about our business and assumptions made by our management and are not guarantees of future performance, nor do we assume any obligation to update such forward-looking statements after the date this report is filed. Our actual results could differ materially from those projected in the forward-looking statements for many reasons, including the risk factors listed in Item 1A. “Risk Factors” and the factors discussed below.
Corporate Overview
Landec Corporation and its subsidiaries (“Landec” or the “Company”) design, develop, manufacture and sell differentiated products for food and biomaterials markets and license technology applications to partners. The Company is focused on health and wellness solutions and applications within the packaged food and biomaterial markets. In our Apio, Inc. (“Apio”) food business, we are committed to offering healthy, fresh produce products conveniently packaged to consumers. Apio also exports whole fruit and vegetables, predominantly to Asia through its subsidiary, Cal Ex Trading Company (“Cal-Ex”). In our Lifecore Biomedical, Inc. (“Lifecore”) biomaterials business, we commercialize products that enable people to stay more active as they grow older.
Landec’s food and biomaterials businesses utilize polymer chemistry technology, a key differentiating factor. Both core businesses focus on business-to-business selling such as selling directly to retail grocery store chains and club stores for Apio and directly to large ophthalmic suppliers for Lifecore. Both core businesses also benefit from the momentum that underlies consumer interest in healthy living - eating better and staying active.
Within our two core businesses, Landec has three operating segments – Food Products Technology, Food Export and HA-based Biomaterials, each of which is described below. Financial information concerning each of these segments for fiscal years 2015, 2014 and 2013 is summarized in Note 11 to the Consolidated Financial Statements.
Apio operates our Food Products Technology business, which combines our proprietary BreatheWay® food packaging technology with the capabilities of a large national food supplier and value-added produce processor which sells products under the Eat Smart® and GreenLine® brands and under private labels. In Apio’s value-added operations, produce is processed by trimming, washing, mixing, and packaging in bags and trays that in most cases incorporate Landec’s BreatheWay membrane technology. The BreatheWay membrane increases shelf life and reduces shrink (waste) for retailers and helps ensure that consumers receive fresh produce by the time the product makes its way through the supply chain. Apio also licenses the BreatheWay technology to partners such as Chiquita Brands International, Inc. (“Chiquita”) for packaging and distribution of bananas and to Windset Holding 2010 Ltd., a Canadian corporation (“Windset”), for packaging of greenhouse grown cucumbers and peppers.
Apio also operates the Food Export business. The Food Export business purchases and sells whole fruit and vegetable products predominantly to Asian markets.
Lifecore operates our HA-based Biomaterials business and is principally involved in the manufacture of pharmaceutical-grade sodium hyaluronate (“HA”) products. Sodium hyaluronate is a naturally occurring polysaccharide that is widely distributed in the extracellular matrix in animals and humans. Based upon Lifecore’s expertise working with highly viscous HA, the Company also specializes in aseptic filling services, as a contract development and manufacturing organization (CDMO), for difficult to handle (viscous) medicines filled in finished dose syringes.
Landec was incorporated in California on October 31, 1986 and reincorporated as a Delaware corporation on November 6, 2008. Our common stock is listed on The NASDAQ Global Select Market under the symbol “LNDC”.
Technology Overview
The Company has two proprietary polymer technology platforms: 1) Intelimer® materials, which are the key technology behind our BreatheWay membrane technology, and 2) hyaluronan biopolymers. The Company’s materials are generally proprietary as a result of being patented or due to being specially formulated for specific customers to meet specific commercial applications and/or specific regulatory requirements. The Company’s polymer technologies, its customer relationships and trade names and its strong channels of distribution, are the foundation and key differentiating advantages on which Landec has built its business.
A) Intelimer Polymers
Intelimer polymers are crystalline, hydrophobic polymers that use a temperature switch to control and modulate properties such as viscosity, permeability and adhesion when varying the materials’ temperature above and below the temperature switch. The sharp temperature switch is adjustable at relatively low temperatures (0°C to 100°C) and the changes resulting from the temperature switch are relatively easy to maintain in industrial and commercial environments. For instance, Intelimer polymers can change within the range of one or two degrees Celsius from a non-adhesive state to a highly tacky, adhesive state; from an impermeable state to a highly permeable state; or from a solid state to a viscous liquid state.
Landec's proprietary polymer technology is based on the structure and phase behavior of Intelimer materials. The abrupt thermal transitions of specific Intelimer materials are achieved through the controlled use of hydrocarbon side chains that are attached to a polymer backbone. Below a pre-determined switch temperature, the polymer's side chains align through weak hydrophobic interactions resulting in a crystalline structure. When this side chain crystallizable polymer is heated to, or above, this switch temperature, these interactions are disrupted and the polymer is transformed into an amorphous, viscous state. Because this transformation involves a physical and not a chemical change, this process can be repeatedly reversible. Landec can set the polymer switch temperature anywhere between 0°C to 100°C by varying the average length of the side chains.
Landec's Intelimer materials are readily available and are generally synthesized from long side-chain acrylic monomers that are derived primarily from natural materials such as coconut and palm oils that are highly purified and designed to be manufactured economically through known synthetic processes. These acrylic-monomer raw materials are then polymerized by Landec leading to many different side-chain crystallizable polymers whose properties vary depending upon the initial materials and the synthetic process. Intelimer materials can be made into many different forms, including films, coatings, microcapsules and discrete forms. Intelimer polymers are the coatings on the substrate used to form our BreatheWay membranes.
BreatheWay Membrane Packaging
Certain types of fresh-cut and whole produce can spoil or discolor rapidly when packaged in conventional packaging materials and, therefore, are limited in their ability to be distributed broadly to markets. The Company’s proprietary BreatheWay packaging technology utilizes Landec’s Intelimer polymer technology to naturally extend the shelf life and quality of fresh-cut and whole produce.
After harvesting, vegetables and fruit continue to respire, consuming oxygen and releasing carbon dioxide. Too much or too little oxygen can result in premature spoilage and decay. The respiration rate of produce varies for each fruit and vegetable. Conventional packaging films used today, such as polyethylene and polypropylene, can be made with modest permeability to oxygen and carbon dioxide, but often do not provide the optimal atmosphere for the packaged produce. To achieve optimal product performance, each fruit or vegetable requires its own unique package atmosphere conditions. The challenge facing the industry is to develop packaging that meets the highly variable needs that each product requires in order to achieve value-creating performance. The Company believes that its BreatheWay packaging technology possesses all of the critical functionalities required to serve this diverse market. In creating a product package, a BreatheWay membrane is applied over a small cutout section or an aperture of a flexible film bag or plastic tray. This highly permeable “window” acts as the mechanism to provide the majority of the gas transmission requirements for the entire package. These membranes are designed to provide three principal benefits:
High Permeability. Landec's BreatheWay packaging technology is designed to permit transmission of oxygen and carbon dioxide at 300 to 1,000 times the rate of conventional packaging films. The Company thinks that these higher permeability levels will facilitate the packaging diversity required to market many types of fresh-cut and whole produce in many package sizes and configurations.
Ability to Adjust Oxygen and Carbon Dioxide Ratios. BreatheWay packaging can be tailored with carbon dioxide to oxygen transfer ratios ranging from 1.0 to 12.0 to selectively transmit oxygen and carbon dioxide at optimum rates to sustain the quality and shelf life of packaged produce. Other high permeability packaging materials, such as micro-perforated films cannot differentially control carbon dioxide permeability, resulting in sub-optimal package atmosphere conditions for many produce products.
Temperature Responsiveness. Landec has developed breathable membranes that can be designed to increase or decrease permeability in response to environmental temperature changes. The Company has developed packaging that responds to higher oxygen requirements at elevated temperatures but is also reversible, and returns to its original state as temperatures decline. As the respiration rate of fresh produce also increases with temperature, the BreatheWay membrane’s temperature responsiveness allows packages to compensate for the change in produce respiration by automatically adjusting gas permeation rates. By doing so, detrimental package atmosphere conditions are avoided and improved quality is maintained through the distribution chain.
B) Sodium Hyaluronate (HA)
Sodium hyaluronate is a non-crystalline, hydrophilic polymer that exists naturally as part of the extracellular matrix in many tissues within the human body, most notably within the aqueous humor of the eye, synovial fluid, skin and umbilical cord. The viscoelastic properties and water solubility of HA make it ideal for medical applications where space maintenance, lubricity or tissue protection are critical. Because of its widespread presence in tissues, its critical role in normal physiology, and its high degree of biocompatibility, the Company believes that hyaluronan will continue to be used in existing applications and for an increasing variety of other medical applications.
Sodium hyaluronate can primarily be produced in two ways, either through bacterial fermentation or through extraction from rooster combs. Lifecore produces HA only from fermentation, using an extremely efficient microbial fermentation process and a highly effective purification operation.
Sodium hyaluronate was first demonstrated to have commercial medical utility as a viscoelastic solution in cataract surgery. In this application, it is used for maintaining the space in the anterior chamber and protecting corneal tissue during the removal and implantation of intraocular lenses. The first ophthalmic HA product, produced by extraction from rooster comb tissue, became commercially available in the United States in 1981. In 1985, Lifecore introduced the bacterial fermentation process to manufacture premium HA and received patent protection until 2002. HA-based products, produced either by rooster comb extraction or by fermentation processes such as Lifecore’s, have since gained widespread acceptance in ophthalmology and are currently used in the majority of cataract extraction procedures in the world. HA has also become a significant component in several products used in orthopedics. Lifecore’s HA is used as a viscous carrier for allogeneic freeze-dried demineralized bone used in spinal surgery, and as the active component of devices to treat the symptoms of osteoarthritis, and as a component to provide increased lubricity to medical devices. Lifecore’s HA has also been utilized in veterinary drug applications to treat traumatic arthritis.
Description of Business Segments
In this Description of Business Segments section, “Apio” and the “Food Products Technology business” will be used interchangeably; however, when describing Apio’s export business it will be referred to as the “Food Export business”.
A) Food Products Technology Business
The Food Products Technology business had revenues of $430 million for the fiscal year ended May 31, 2015, $361 million for the fiscal year ended May 25, 2014 and $320 million for the fiscal year ended May 26, 2013.
Based in Guadalupe, California, Apio’s primary business is fresh-cut and whole value-added products typically packaged in our proprietary BreatheWay packaging. Apio’s fresh-cut value-added products business markets a variety of fresh-cut and whole vegetables to the top retail grocery chains, club stores and food service operators. During the fiscal year ended May 31, 2015, Apio shipped approximately 32 million cartons of produce to its customers throughout North America, primarily in the United States.
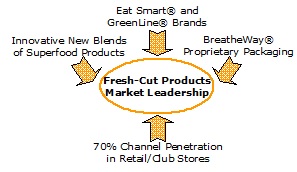
Most vegetable products packaged in our BreatheWay packaging have 17 to 20 days of shelf life. In addition to packaging innovation, Landec’s Apio food business develops innovative blends and combinations of vegetables that are sold in flexible film bags or rigid trays. More recently, the Company has launched a family of salad kits that are comprised of “superfood” mixtures of vegetables with healthy toppings/dressings. The launch of the first of these products called Sweet Kale Salad has broken all of Apio’s records for speed of adoption with weekly sales of over $2 million as of May 2015. Additionally, we have launched several other superfood salad kits including Ginger Bok Choy, Wild Greens and Quinoa, Beets and Greens, Kale and Chard Stir Fry and Shanghai Stir Fry. The Company’s expertise includes accessing leading culinary experts and nutritionists nationally to help in the new product development process. We believe that our new products are “on trend” and strong market acceptance supports this belief. Recent statistics show that more than two-thirds (68.8%) of adults are considered to be overweight or obese and more than one-third (35.7%) of adults are considered to be obese. More and more consumers are beginning to make better food choices in their schools, homes and in restaurants and that is where our superfood products can fit into consumers daily healthy food choices.
In addition to proprietary packaging technology and a strong new product development pipeline, the Company has strong channels of distribution throughout North America with retail grocery store chains and club stores. Landec has one or more of its products in approximately 70% of all retail and club store sites in North America giving us a strong platform for introducing new products.
The Company sells its products under the nationally-known brands EatSmart and GreenLine. The Company also periodically licenses its BreatheWay packaging technology to partners such as Chiquita for packaging bananas and to Windset for packaging peppers and cucumbers that are grown hydroponically in greenhouses. These packaging license relationships generate revenues either from product sales or royalties once commercialized. The Company is engaged in the testing and development of other BreatheWay products. Landec manufactures its BreatheWay packaging through selected qualified contract manufacturers.
Apio Business Model
Landec is working with leaders in club stores, retail grocery chains and food service customers. The Company thinks it will have growth opportunities for the next several years through new customers and the introduction of innovative products in the United States, expansion of its existing customer relationships, and export and shipment of specialty packaged produce.
There are five major distinguishing characteristics of Apio that provide competitive advantages in the Food Products Technology market:
Value-Added Supplier: Apio has structured its business as a marketer and seller of branded and private label fresh-cut and whole value-added produce. It is focused on selling products under its Eat Smart and GreenLine brands and private label brands for its fresh-cut and whole value-added products. As retail grocery chains, club stores and food service operators consolidate, Apio is well positioned as a single source of a broad range of products.
Reduced Farming Risks: Apio reduces its farming risk by not taking ownership of farmland, and instead, contracts with growers for produce and during certain times of the year, enters into joint ventures with growers for produce. The year-round sourcing of produce is a key component to the fresh-cut and whole value-added processing business.
Access to Customer Base: Apio has strategically invested in the rapidly growing fresh-cut and whole value-added business. Apio’s value-added processing plant in Guadalupe, CA, is automated with state-of-the-art vegetable processing equipment. Apio operates one large central processing facility in one of the lowest cost growing regions in California, the Santa Maria Valley, and for the majority of its non-green bean vegetable business, uses its packaging technology for nationwide delivery. With the acquisition of GreenLine, Apio now has three East Coast processing facilities and five East Coast distribution centers for nationwide delivery of green beans and Apio has begun processing non-green bean products in one of its East Coast processing facilities to meet the next-day delivery needs of customers.
Expanded Product Line Using Technology and Unique Blends: Apio, through the use of its BreatheWay packaging technology, is introducing new value-added products each year. These new product offerings range from various sizes of fresh-cut bagged products, to vegetable trays, to whole produce, to vegetable salads and to snack packs. During the last twelve months, Apio has introduced nine new unique products.
Products Currently in Approximately 70% of U.S. Retail Grocery Stores: With the acquisition of GreenLine, Apio now has products in approximately 70% of all U.S. retail grocery stores. This gives Apio the opportunity to cross sell Eat Smart value-added products to GreenLine customers and GreenLine value-added products to Eat Smart customers.
Windset
The Company thinks that hydroponically grown produce using Windset’s (see Note 2 to the Consolidated Financial Statements for a description of the Company’s investment in Windset) know-how and growing practices will result in higher yields with competitive growing costs that will provide dependable year round supply to Windset’s customers. In addition, the produce grown in Windset’s greenhouses has a very high safety profile as no soil is used in the growing process. Windset owns and operates greenhouses in British Columbia, Canada and in Nevada and California. In addition to growing produce in its own greenhouses, Windset has numerous marketing arrangements with other greenhouse growers and utilizes buy/sell arrangements to meet fluctuation in demand from their customers.
B) Food Export Business
Food Export revenues consist of revenues generated from the purchase and sale of primarily whole commodity fruit and vegetable products to Asia through Apio’s export business, Cal-Ex. The Food Export business is a commission-based buy/sell business that typically realizes a gross margin in the 5-10% range.
The Food Export business had revenues of $68 million for the fiscal year ended May 31, 2015, $70 million for the fiscal year ended May 25, 2014 and $79 million for the fiscal year ended May 26, 2013.
Apio is strategically positioned with Cal-Ex to benefit from the growing population and wealth in Asia and other parts of the world over the next decade. Through Cal-Ex, Apio is currently one of the largest U.S. exporters of broccoli to Asia. Other large export items include apples, grapes, stonefruit and citrus.
C) HA-based Biomaterials
Our HA-based Biomaterials business operates through our Lifecore subsidiary. Lifecore had revenues of $40 million for the fiscal year ended May 31, 2015, $46 million for the fiscal year ended May 25, 2014 and $41 million for the fiscal year ended May 26, 2013.
Lifecore operates our medical materials business and is principally involved in the manufacture of pharmaceutical-grade sodium hyaluronate products in the form of injectable products for ophthalmologic and orthopedic applications. There is now a greater percentage of Americans age 65 and older than at any other time in U.S. history and currently over 45 million Americans are 65 years of age or older and this trend is going to accelerate dramatically over the upcoming years. As our population ages, eye surgeries such as cataract surgeries, will increase and patients will increasingly seek joint therapy as cartilage and soft tissue deteriorates. HA injections are a primary course of treatment for such conditions and Lifecore has built a leadership position in the markets it serves. The World Health Organization estimates that by 2020, 32 million cataract operations will be performed worldwide, up from 12 million in 2000. Lifecore’s expertise includes its ability to ferment, separate, purify, and aseptically fill HA for injectable product use. In addition to ophthalmic and orthopedic uses, veterinary medicine is another application for Lifecore’s HA. Lifecore leverages its fermentation process to manufacture premium, pharmaceutical-grade HA and uses its aseptic filling capabilities to also deliver private-labeled HA finished products to its customers. Lifecore sells its products through partners in the U.S., Europe and South America. Lifecore has built its reputation as a premium supplier of HA.
Lifecore’s products are primarily sold to strategic marketing partners for use in three medical areas: (1) Ophthalmic, (2) Orthopedic and (3) Veterinary. In addition, Lifecore provides product development services to its partners for HA-based, as well as non-HA based, fermented products and aseptically formulated products. These services include activities such as tech transfer, material component changes, analytical method development, pilot studies, stability studies, process validation, and clinical production.
By leveraging its fermentation process and aseptic formulation and filling expertise, Lifecore has become a leader in the supply of HA-based products for multiple applications, and has taken advantage of non-HA device and drug opportunities by leveraging its expertise in manufacturing and aseptic syringe filling capabilities. Elements of Lifecore’s strategy include the following:
• Establish strategic relationships with market leaders. Lifecore will continue to develop applications for products with partners who have strong marketing, sales and distribution capabilities to end-user markets. Through its strong reputation and history of providing pharmaceutical grade HA and products, Lifecore has been able to establish long-term relationships with the market leading ophthalmic surgical companies, and leverages those partnerships to attract new relationships in other medical markets.
• Expand medical applications for HA. Due to the growing knowledge of the unique characteristics of HA, and the role it plays in normal physiology, Lifecore continues to identify and pursue opportunities for the use of HA in other medical applications, such as wound care, aesthetic surgery, drug delivery, device coatings and through pharmaceutical sales to academic and corporate research customers. Further applications may involve expanding process development activity and/or additional licensing of technology.
• Utilize manufacturing infrastructure to pursue contract aseptic filling and fermentation opportunities. Lifecore has made strategic capital investments in its contract manufacturing and development business focusing on extending its aseptic filling capacity and capabilities. It is investing in this segment to meet increasing partner demand and attract new contract filling opportunities. Lifecore is using its manufacturing capabilities to provide contract manufacturing and development services to its partners in the area of sterile pre-filled syringes and fermentation and purification requirements.
• Maintain flexibility in product development and supply relationships. Lifecore’s vertically integrated development and manufacturing capabilities allow it to establish a variety of contractual relationships with global corporate partners. Lifecore’s role in these relationships extends from supplying HA raw materials to providing tech transfer and development services to manufacturing aseptically-packaged, finished sterile products and to assuming full supply chain responsibilities.
Trademarks/Trade names
Intelimer®, Landec®, Apio™, Eat Smart®, BreatheWay®, GreenLine®, Clearly Fresh™, Lifecore®, LUROCOAT® and Ortholure™ are some of the trademarks or registered trademarks and trade names of the Company in the United States and other countries. This Annual Report on Form 10-K also refers to the trademarks of other companies.
Sales and Marketing
Apio is supported by dedicated sales and marketing resources. Apio has 42 sales and marketing employees, located in central California and throughout the U.S., supporting the Food Products Technology business and the Food Export business. During fiscal years 2015, 2014 and 2013, sales to the Company’s top five customers accounted for approximately 46%, 42% and 40%, respectively, of its revenues, with the top two customers, both from the Food Products Technology segment, Costco Wholesale Corporation (“Costco”) which accounted for approximately 21%, 21%, and 16%, respectively, and Wal-mart, Inc. (“Wal-mart”) which accounted for approximately 11%, 11%, and 13%, respectively, of the Company’s revenues. A loss of either of these customers would have a material adverse effect on the Company’s business.
Lifecore sells products to partners under supply agreements and also through distribution agreements. Excluding research sales, Lifecore does not sell to end users and, therefore, does not have the traditional infrastructure of a dedicated sales force and marketing employees and its name recognition allows Lifecore to attract new customers and offer its services with a minimal marketing and sales infrastructure.
Seasonality
Apio’s sales are seasonal. The Food Products Technology business can be affected by seasonal weather factors, such as the high cost of sourcing product due to a shortage of essential value-added produce items, which have impacted quarterly results in the past. The Food Export business also typically recognizes a much higher percentage of its revenues and profit during the first half of Landec’s fiscal year compared to the second half. Lifecore’s business is not significantly affected by seasonality.
Manufacturing and Processing
Food Products Technology Business
The manufacturing process for the Company's proprietary BreatheWay packaging products is comprised of polymer manufacturing, membrane manufacturing and label package conversion. A third party toll manufacturer currently makes virtually all of the polymers for the BreatheWay packaging system. Select outside contractors currently manufacture the breathable membranes, and Apio performs the label package conversion in its various processing facilities.
Apio processes a large majority of its fresh-cut, value-added non-green bean products in its processing facility located in Guadalupe, California. Cooling of produce is done through third parties and Apio Cooling LP, a separate consolidated subsidiary in which Apio has a 60% ownership interest and is the general partner.
Apio processes its fresh-cut, value-added green bean products in four processing plants located in Guadalupe, California; Bowling Green, Ohio; Hanover, Pennsylvania; and Vero Beach, Florida.
Hyaluronan-based Biomaterials Business
The commercial production of HA by Lifecore requires fermentation, separation and purification capabilities. Products are supplied in a variety of bulk and single dose configurations.
Lifecore produces its HA through a bacterial fermentation process. Medical grade HA was initially commercially available only through an extraction process from rooster combs. Lifecore believes that the fermentation manufacturing approach is superior to rooster comb extraction because of greater efficiency and flexibility, a more favorable long-term regulatory environment, and better economies of scale in producing large commercial quantities. Today’s HA competitors are primarily utilizing a fermentation process.
Lifecore’s 114,000 square foot facility in Chaska, Minnesota is used primarily for the HA manufacturing process, formulation and aseptic syringe and bulk filling. The Company considers that the current inventory on-hand, together with its manufacturing capacity, will be sufficient to allow it to meet the needs of its current customers for the foreseeable future.
Lifecore provides versatility in the manufacturing of various types of finished products. It supplies several different forms of HA in a variety of molecular weight fractions as powders, solutions and gels, and in a variety of bulk and single-use finished packages. Lifecore continues to conduct development work designed to improve production efficiencies and expand its capabilities to achieve a wider range of HA product specifications in order to address the broadening opportunities for using HA in medical applications.
The FDA inspects the Company’s manufacturing systems periodically and requires compliance with the FDA’s Quality System Regulation (“QSR”). In addition, Lifecore’s customers conduct intensive quality audits of the facility and its operations. Lifecore also periodically contracts with independent regulatory consultants to conduct audits of its operations. Similar to other manufacturers subject to regulatory and customer specific requirements, Lifecore’s facility was designed to meet applicable regulatory requirements and has been cleared for the manufacturing of both device and pharmaceutical products. The Company maintains a Quality System which complies with applicable standards and regulations: FDA Medical Device Quality System requirements (21 CFR 820); FDA Drug Good Manufacturing Practices (21 CFR 210-211); European Union Good Manufacturing Practices (EudraLex Volume 4); Medical Device Quality Management System (ISO 13485); European Medical Device Directive; Canadian Medical Device Regulations; International Guide for Active Pharmaceutical Ingredients (ICH Q7), and Australian Therapeutic Goods Regulations). Compliance with these international standards of quality greatly assists in the marketing of Lifecore’s products globally.
General
Several of the raw materials used in manufacturing certain of the Company’s products are currently purchased from a single source. Although to date the Company has not experienced difficulty acquiring materials for the manufacture of its products, no assurance can be given that interruptions in supplies will not occur in the future, that the Company will be able to obtain substitute vendors, or that the Company will be able to procure comparable materials at similar prices and terms within a reasonable time. Any such interruption of supply could have a material adverse effect on the Company’s ability to manufacture and distribute its products and, consequently, could materially and adversely affect the Company’s business, operating results and financial condition.
Research and Development
Landec is focusing its research and development resources on both existing and new product applications. Expenditures for research and development for the fiscal years ended May 31, 2015, May 25, 2014 and May 26, 2013 were $7.0 million, $7.2 million and $9.3 million, respectively. Research and development expenditures funded by corporate or governmental partners were zero during fiscal years 2015 and 2014 and $688,000 during fiscal year 2013. The Company may seek funds for applied materials research programs from U.S. government agencies as well as from commercial entities. The Company anticipates that it will continue to incur significant research and development expenditures in order to maintain its competitive position with a continuing flow of innovative, high-quality products and services. As of May 31, 2015, Landec had 64 employees engaged in research and development with experience in polymer and analytical chemistry, product application, product formulation, and mechanical and chemical engineering.
Competition
The Company operates in highly competitive and rapidly evolving fields, and new developments are expected to continue at a rapid pace. Competition from large food processors, packaging companies, and medical and pharmaceutical companies is intense. Many of these competitors have substantially greater financial and technical resources and production and marketing capabilities than the Company, and many have substantially greater experience in conducting field trials, obtaining regulatory approvals and manufacturing and marketing commercial products. There can be no assurance that these competitors will not succeed in developing alternative technologies and products that are more effective, easier to use or less expensive than those which have been or are being developed by the Company or that would render the Company's technology and products obsolete and non-competitive.
Patents and Proprietary Rights
The Company's success depends in large part on its ability to obtain patents, maintain trade secret protection and operate without infringing on the proprietary rights of third parties. The Company has had 48 U.S. patents issued of which 33 remain active as of May 31, 2015 with expiration dates ranging from 2015 to 2031. There can be no assurance that any of the pending patent applications will be approved, that the Company will develop additional proprietary products that are patentable, that any patents issued to the Company will provide the Company with competitive advantages or will not be challenged by any third parties or that the patents of others will not prevent the commercialization of products incorporating the Company's technology. Furthermore, there can be no assurance that others will not independently develop similar products, duplicate any of the Company's products or design around the Company's patents. Any of the foregoing results could have a material adverse effect on the Company's business, operating results and financial condition.
The commercial success of the Company will also depend, in part, on its ability to avoid infringing patents issued to others. If the Company were determined to be infringing any third party patent, the Company could be required to pay damages, alter its products or processes, obtain licenses or cease certain activities. In addition, if patents are issued to others which contain claims that compete or conflict with those of the Company and such competing or conflicting claims are ultimately determined to be valid, the Company may be required to pay damages, to obtain licenses to these patents, to develop or obtain alternative technology or to cease using such technology. If the Company is required to obtain any licenses, there can be no assurance that the Company will be able to do so on commercially favorable terms, if at all. The Company's failure to obtain a license to any technology that it may require to commercialize its products could have a material adverse impact on the Company's business, operating results and financial condition.
Government Regulation
Government regulation in the United States and other countries is a significant factor in the marketing of certain of the Company’s products and in the Company’s ongoing research and development activities. Some of the Company’s products are subject to extensive and rigorous regulation by the FDA, which regulates some of the products as medical devices and which, in some cases, requires Pre-Market Approval (“PMA”), and by foreign countries, which regulate some of the products as medical devices or drugs. Under the Federal Food, Drug, and Cosmetic Act (“FDC Act”), the FDA regulates the clinical testing, manufacturing, labeling, distribution, sale and promotion of medical devices in the United States.
Other regulatory requirements are placed on the manufacture, processing, packaging, labeling, distribution, recordkeeping and reporting of a medical device and on the quality control procedures, such as the FDA’s device QSR regulations. Manufacturing facilities are subject to periodic inspections by the FDA to assure compliance with device QSR requirements, along with pre-approval inspection (PAI) for PMA product introduction. Lifecore’s facility is subject to inspections as both a device and a drug manufacturing operation. For PMA devices, the Company that owns the product submission is required to submit an annual report and to obtain approval of a PMA supplement for modifications to the device or its labeling. Other applicable FDA requirements include the medical device reporting (“MDR”) regulation, which requires that the Company provide information to the FDA regarding deaths or serious injuries alleged to have been associated with the use of its devices, as well as product malfunctions that would likely cause or contribute to death or serious injury if the malfunction were to recur.
Employees
As of May 31, 2015, Landec had 550 full-time employees, of whom 442 were dedicated to research, development, manufacturing, quality control and regulatory affairs and 108 were dedicated to sales, marketing and administrative activities. Landec intends to recruit additional personnel in connection with the development, manufacturing and marketing of its products. None of Landec's employees are represented by a union, and Landec considers its relationship with its employees to be good.
Available Information
Landec’s website is http://www.landec.com. Landec makes available free of charge its annual, quarterly and current reports, and any amendments to those reports, as soon as reasonably practicable after electronically filing such reports with the SEC. Information contained on our website is not part of this Report.
Item 1A. Risk Factors
Landec desires to take advantage of the “Safe Harbor” provisions of the Private Securities Litigation Reform Act of 1995 and of Section 21E and Rule 3b-6 under the Securities Exchange Act of 1934. Specifically, Landec wishes to alert readers that the following important factors could in the future affect, and in the past have affected, Landec’s actual results and could cause Landec’s results for future periods to differ materially from those expressed in any forward-looking statements made by or on behalf of Landec. Landec assumes no obligation to update such forward-looking statements.
Adverse Weather Conditions and Other Acts of God May Cause Substantial Decreases in Our Sales and/or Increases in Our Costs
Our Food Products Technology business is subject to weather conditions that affect commodity prices, crop quality and yields, and decisions by growers regarding crops to be planted. Crop diseases and severe conditions, particularly weather conditions such as unexpected or excessive rain or other precipitation, unseasonable temperature fluctuations, floods, droughts, frosts, windstorms, earthquakes and hurricanes, may adversely affect the supply of vegetables and fruits used in our business, which could reduce the sales volumes and/or increase the unit production costs. Because a significant portion of the costs are fixed and contracted in advance of each operating year, volume declines reflecting production interruptions or other factors could result in increases in unit production costs which could result in substantial losses and weaken our financial condition.
We Depend on Our Infrastructure to Have Sufficient Capacity to Handle Our On-Going Production Needs
We have an infrastructure that has sufficient capacity for our on-going production needs, but if we lose machinery or facilities due to natural disasters or mechanical failure, we may not be able to operate at a sufficient capacity to meet our production needs. This could have a material adverse effect on our business, which could impact our results of operations and our financial condition.
Our Future Operating Results Are Likely to Fluctuate Which May Cause Our Stock Price to Decline
In the past, our results of operations have fluctuated significantly from quarter to quarter and are expected to continue to fluctuate in the future. Apio can be affected by seasonal and weather factors which have impacted our financial results in the past due to shortages of essential value-added produce items. In addition, the quarterly fair market value change in our Windset investment can fluctuate substantially quarter to quarter. Our earnings may also fluctuate based on our ability to collect accounts receivable from customers and notes receivable from growers and on price fluctuations in the fresh vegetable and fruit markets. Other factors that affect our operations include:
our ability and our growers ability to obtain an adequate supply of labor,
our growers ability to obtain an adequate supply of water,
the seasonality and availability of our supplies,
our ability to process produce during critical harvest periods,
the timing and effects of ripening,
the degree of perishability,
the effectiveness of worldwide distribution systems,
total worldwide industry volumes,
the seasonality and timing of consumer demand,
foreign currency fluctuations, and
foreign importation restrictions and foreign political risks.
As a result of these and other factors, we expect to continue to experience fluctuations in quarterly operating results.
We May Not Be Able to Achieve Acceptance of Our New Products in the Marketplace
Our success in generating significant sales of our products depends in part on our ability and that of our partners and licensees to achieve market acceptance of our new products and technology. The extent to which, and rate at which, we achieve market acceptance and penetration of our current and future products is a function of many variables including, but not limited to:
price,
safety,
efficacy,
reliability,
conversion costs,
regulatory approvals,
marketing and sales efforts, and
general economic conditions affecting purchasing patterns.
We may not be able to develop and introduce new products and technologies in a timely manner or new products and technologies may not gain market acceptance. We or our partners/customers are in the early stage of product commercialization of certain Intelimer-based specialty packaging, HA-based products and other Intelimer polymer products. We expect that our future growth will depend in large part on our or our partners/customers ability to develop and market new products in our target markets and in new markets. In particular, we expect that our ability to compete effectively with existing food products companies will depend substantially on developing, commercializing, achieving market acceptance of and reducing the cost of producing our products. In addition, commercial applications of our temperature switch polymer technology are relatively new and evolving. Our failure to develop new products or the failure of our new products to achieve market acceptance would have a material adverse effect on our business, results of operations and financial condition.
We Face Strong Competition in the Marketplace
Competitors may succeed in developing alternative technologies and products that are more effective, easier to use or less expensive than those which have been or are being developed by us or that would render our technology and products obsolete and non-competitive. We operate in highly competitive and rapidly evolving fields, and new developments are expected to continue at a rapid pace. Competition from large food products, industrial, medical and pharmaceutical companies is expected to be intense. In addition, the nature of our collaborative arrangements may result in our corporate partners and licensees becoming our competitors. Many of these competitors have substantially greater financial and technical resources and production and marketing capabilities than we do, and may have substantially greater experience in conducting clinical and field trials, obtaining regulatory approvals and manufacturing and marketing commercial products.
We Have a Concentration of Manufacturing for Apio and Lifecore and May Have to Depend on Third Parties to Manufacture Our Products
Any disruptions in our primary manufacturing operation at Apio’s facilities in Guadalupe, California or Bowling Green, Ohio or Lifecore’s facility in Chaska, Minnesota would reduce our ability to sell our products and would have a material adverse effect on our financial results. Additionally, we may need to consider seeking collaborative arrangements with other companies to manufacture our products. If we become dependent upon third parties for the manufacture of our products, our profit margins and our ability to develop and deliver those products on a timely basis may be adversely affected. Failures by third parties may impair our ability to deliver products on a timely basis and impair our competitive position. We may not be able to continue to successfully operate our manufacturing operations at acceptable costs, with acceptable yields, and retain adequately trained personnel.
Our Dependence on Single-Source Suppliers and Service Providers May Cause Disruption in Our Operations Should Any Supplier Fail to Deliver Materials
We may experience difficulty acquiring materials or services for the manufacture of our products or we may not be able to obtain substitute vendors. In addition, we may not be able to procure comparable materials at similar prices and terms within a reasonable time. Several services that are provided to Apio are obtained from a single provider. Several of the raw materials we use to manufacture our products are currently purchased from a single source, including some monomers used to synthesize Intelimer polymers, substrate materials for our breathable membrane products and raw materials for our HA products. Any interruption of our relationship with single-source suppliers or service providers could delay product shipments and materially harm our business.
Any New Business Acquisition Will Involve Uncertainty Relating to Integration
We have acquired other businesses in the past and may make additional acquisitions in the future. The successful integration of new business acquisitions may require substantial effort from the Company's management. The diversion of the attention of management and any difficulties encountered in the transition process could have a material adverse effect on the Company's ability to realize the anticipated benefits of the acquisitions. The successful combination of new businesses also requires coordination of research and development activities, manufacturing, sales and marketing efforts. In addition, the process of combining organizations located in different geographic regions could cause the interruption of, or a loss of momentum in, the Company's activities. There can be no assurance that the Company will be able to retain key management, technical, sales and customer support personnel, or that the Company will realize the anticipated benefits of any acquisitions, and the failure to do so would have a material adverse effect on the Company's business, results of operations and financial condition.
We May Be Unable to Adequately Protect Our Intellectual Property Rights or May Infringe Intellectual Property Rights of Others
We may receive notices from third parties, including some of our competitors, claiming infringement by our products of their patent and other proprietary rights. Regardless of their merit, responding to any such claim could be time-consuming, result in costly litigation and require us to enter royalty and licensing agreements which may not be offered or available on terms acceptable to us. If a successful claim is made against us and we fail to develop or license a substitute technology, we could be required to alter our products or processes and our business, results of operations or financial position could be materially adversely affected. Our success depends in large part on our ability to obtain patents, maintain trade secret protection and operate without infringing on the proprietary rights of third parties. Any pending patent applications we file may not be approved and we may not be able to develop additional proprietary products that are patentable. Any patents issued to us may not provide us with competitive advantages or may be challenged by third parties. Patents held by others may prevent the commercialization of products incorporating our technology. Furthermore, others may independently develop similar products, duplicate our products or design around our patents.
Our Operations Are Subject to Regulations that Directly Impact Our Business
Our products and operations are subject to governmental regulation in the United States and foreign countries. The manufacture of our products is subject to periodic inspection by regulatory authorities. We may not be able to obtain necessary regulatory approvals on a timely basis or at all. Delays in receipt of or failure to receive approvals or loss of previously received approvals would have a material adverse effect on our business, financial condition and results of operations. Although we have no reason to believe that we will not be able to comply with all applicable regulations regarding the manufacture and sale of our products and polymer materials, regulations are always subject to change and depend heavily on administrative interpretations and the country in which the products are sold. Future changes in regulations or interpretations relating to matters such as safe working conditions, laboratory and manufacturing practices, environmental controls, and disposal of hazardous or potentially hazardous substances may adversely affect our business.
We are subject to FDA rules and regulations concerning the safety of the food products handled and sold by Apio, and the facilities in which they are packed and processed. Failure to comply with the applicable regulatory requirements can, among other things, result in:
fines, injunctions, civil penalties, and suspensions,
withdrawal of regulatory approvals,
product recalls and product seizures, including cessation of manufacturing and sales,
operating restrictions, and
criminal prosecution.
We may be required to incur significant costs to comply with the laws and regulations in the future which may have a material adverse effect on our business, operating results and financial condition.
Our food packaging products are subject to regulation under the FDC Act. Under the FDC Act, any substance that when used as intended may reasonably be expected to become, directly or indirectly, a component or otherwise affect the characteristics of any food may be regulated as a food additive unless the substance is generally recognized as safe. Food packaging materials are generally not considered food additives by the FDA because these products are not expected to become components of food under their expected conditions of use. We consider our breathable membrane product to be a food packaging material not subject to regulation or approval by the FDA. We have not received any communication from the FDA concerning our breathable membrane product. If the FDA were to determine that our breathable membrane products are food additives, we may be required to submit a food additive petition for approval by the FDA. The food additive petition process is lengthy, expensive and uncertain. A determination by the FDA that a food additive petition is necessary would have a material adverse effect on our business, operating results and financial condition.
Our Food Products Technology business is subject to the Perishable Agricultural Commodities Act (“PACA”). PACA regulates fair trade standards in the fresh produce industry and governs all the products sold by Apio. Our failure to comply with the PACA requirements could among other things, result in civil penalties, suspension or revocation of a license to sell produce, and in the most egregious cases, criminal prosecution, which could have a material adverse effect on our business.
Lifecore’s existing products and its products under development are considered to be medical devices and therefore, require clearance or approval by the FDA before commercial sales can be made in the United States. The products also require the approval of foreign government agencies before sales may be made in many other countries. The process of obtaining these clearances or approvals varies according to the nature and use of the product. It can involve lengthy and detailed safety, efficacy and clinical studies, as well as extensive site inspections and lengthy regulatory agency reviews. There can be no assurance that any of the Company’s clinical studies will show safety or effectiveness; that any of the Company’s products that require FDA clearance or approval will obtain such clearance or approval on a timely basis, on terms acceptable to the Company for the purpose of actually marketing the products, or at all; or that following any such clearance or approval previously unknown problems will not result in restrictions on the marketing of the products or withdrawal of clearance or approval.
In addition, most of the existing products being sold by Lifecore and its customers are subject to continued regulation by the FDA, various state agencies and foreign regulatory agencies which regulate manufacturing, labeling and record keeping procedures for such products. Marketing clearances or approvals by these agencies can be withdrawn due to failure to comply with regulatory standards or the occurrence of unforeseen problems following initial clearance or approval. These agencies can also limit or prevent the manufacture or distribution of Lifecore’s products. A determination that Lifecore is in violation of such regulations could lead to the imposition of civil penalties, including fines, product recalls or product seizures, injunctions, and, in extreme cases, criminal sanctions.
Federal, state and local regulations impose various environmental controls on the use, storage, discharge or disposal of toxic, volatile or otherwise hazardous chemicals and gases used in some of our manufacturing processes. Our failure to control the use of, or to restrict adequately the discharge of, hazardous substances under present or future regulations could subject us to substantial liability or could cause our manufacturing operations to be suspended and changes in environmental regulations may impose the need for additional capital equipment or other requirements.
We Depend on Strategic Partners and Licenses for Future Development
Our strategy for development, clinical and field testing, manufacture, commercialization and marketing for some of our current and future products includes entering into various collaborations with corporate partners, licensees and others. We are dependent on our corporate partners to develop, test, manufacture and/or market some of our products. Although we believe that our partners in these collaborations have an economic motivation to succeed in performing their contractual responsibilities, the amount and timing of resources to be devoted to these activities are not within our control. Our partners may not perform their obligations as expected or we may not derive any additional revenue from the arrangements. Our partners may not pay any additional option or license fees to us or may not develop, market or pay any royalty fees related to products under such agreements. Moreover, some of the collaborative agreements provide that they may be terminated at the discretion of the corporate partner, and some of the collaborative agreements provide for termination under other circumstances. Our partners may pursue existing or alternative technologies in preference to our technology. Furthermore, we may not be able to negotiate additional collaborative arrangements in the future on acceptable terms, if at all, and our collaborative arrangements may not be successful.
Our Reputation and Business May Be Harmed if Our Computer Network Security or Any of the Databases Containing Our Trade Secrets, Proprietary Information or the Personal Information of Our Employees Are Compromised, Which Could Cause a Material Adverse Effect on Our Results of Operations.
Cyber attacks or security breaches could compromise our confidential business information, cause a disruption in the Company’s operations or harm our reputation. We maintain numerous information assets, including intellectual property, trade secrets and other sensitive information critical to the operation and success of our business on computer networks, and such information may be compromised in the event that the security of such networks is breached. We also maintain confidential information regarding our employees and job applicants, including personal identification information. The protection of employee and company data in the information technology systems we utilize (including those maintained by third-party providers) is critical. Despite the efforts by us to secure computer networks utilized for our business, security could be compromised, confidential information, such as Company information assets and personally identifiable employee information, could be misappropriated or system disruptions could occur.
In addition, we may not have the resources or technical sophistication to anticipate or prevent rapidly evolving types of cyber attacks. Attacks may be targeted at us, our customers or others who have entrusted us with information. Actual or anticipated attacks may cause us to incur increasing costs, including costs to deploy additional personnel and protection technologies, train employees and engage third-party experts and consultants. Advances in computer capabilities, new technological discoveries or other developments may result in the technology used by us to protect sensitive Company data being breached or compromised. Furthermore, actual or anticipated cyber attacks or data breaches may cause significant disruptions to our network operations, which may impact our ability to deliver shipments or respond to customer needs in a timely or efficient manner.
Data and security breaches could also occur as a result of non-technical issues, including an intentional or inadvertent breach by our employees or by persons with whom we have commercial relationships that result in the unauthorized release of confidential information related to our business or personal information of our employees. Any compromise or breach of our computer network security could result in a violation of applicable privacy and other laws, costly investigations and litigation and potential regulatory or other actions by governmental agencies. As a result of any of the foregoing, we could experience adverse publicity, the compromise of valuable information assets, loss of sales, the cost of remedial measures and/or significant expenditures to reimburse third parties for resulting damages, any of which could adversely impact our brand, our business and our results of operations.
The Global Economy is Experiencing Continued Volatility, Which May Have an Adverse Effect on Our Business
In recent years, the U.S. and international economy and financial markets experienced a significant slowdown and volatility due to uncertainties related to the availability of credit, energy prices, difficulties in the banking and financial services sectors, softness in the housing market, diminished market liquidity, geopolitical conflicts, falling consumer confidence and high unemployment rates. Ongoing volatility in the economy and financial markets could further lead to reduced demand for our products, which in turn, would reduce our revenues and adversely affect our business, financial condition and results of operations. In particular, volatility in the global markets have resulted in softer demand and more conservative purchasing decisions by customers, including a tendency toward lower-priced products, which could negatively impact our revenues, gross margins and results of operations. In addition to a reduction in sales, our profitability may decrease because we may not be able to reduce costs at the same rate as our sales decline. We cannot predict the ultimate severity or length of the current period of volatility, whether the recent signs of economic recovery will prove sustainable, or the timing or severity of future economic or industry downturns.
Given the current uncertain economic environment, our customers, suppliers and partners may have difficulties obtaining capital at adequate or historical levels to finance their ongoing business and operations, which could impair their ability to make timely payments to us. This may result in lower sales and/or inventory that may not be saleable or bad debt expense for Landec. In addition to the impact of the current market uncertainty on our customers, some of our vendors and growers may experience a reduction in their availability of funds and cash flows, which could negatively impact their business as well as ours. A further worsening of the economic environment or continued or increased volatility of the U.S. economy, including increased volatility in the credit markets, could adversely impact our customers’ and vendors’ ability or willingness to conduct business with us on the same terms or at the same levels as they have historically. Further, this economic volatility and uncertainty about future economic conditions makes it challenging for Landec to forecast its operating results, make business decisions, and identify the risks that may affect its business, sources and uses of cash, financial condition and results of operations.
Our International Sales May Expose Our Business to Additional Risks
For fiscal year 2015, approximately 30% of our total revenues were derived from product sales to international customers. A number of risks are inherent in international transactions. International sales and operations may be limited or disrupted by any of the following:
regulatory approval process,
government controls,
export license requirements,
political instability,
price controls,
trade restrictions,
changes in tariffs, or
difficulties in staffing and managing international operations.
Foreign regulatory agencies have or may establish product standards different from those in the United States, and any inability on our part to obtain foreign regulatory approvals on a timely basis could have a material adverse effect on our international business, and our financial condition and results of operations. While our foreign sales are currently priced in dollars, fluctuations in currency exchange rates may reduce the demand for our products by increasing the price of our products in the currency of the countries in which the products are sold. Regulatory, geopolitical and other factors may adversely impact our operations in the future or require us to modify our current business practices.
Cancellations or Delays of Orders by Our Customers May Adversely Affect Our Business
During fiscal year 2015, sales to our top five customers accounted for approximately 46% of our revenues, with our two largest customers from our Food Products Technology segment, Costco and Wal-mart accounting for approximately 21% and 11%, respectively, of our revenues. We expect that, for the foreseeable future, a limited number of customers may continue to account for a substantial portion of our revenues. We may experience changes in the composition of our customer base as we have experienced in the past. The reduction, delay or cancellation of orders from one or more major customers for any reason or the loss of one or more of our major customers could materially and adversely affect our business, operating results and financial condition. In addition, since some of the products processed by Apio and Lifecore are sole sourced to customers, our operating results could be adversely affected if one or more of our major customers were to develop other sources of supply. Our current customers may not continue to place orders, orders by existing customers may be canceled or may not continue at the levels of previous periods or we may not be able to obtain orders from new customers.
Our Sale of Some Products May Expose Us to Product Liability Claims
The testing, manufacturing, marketing, and sale of the products we develop involve an inherent risk of allegations of product liability. If any of our products were determined or alleged to be contaminated or defective or to have caused a harmful accident to an end-customer, we could incur substantial costs in responding to complaints or litigation regarding our products and our product brand image could be materially damaged. Such events may have a material adverse effect on our business, operating results and financial condition. Although we have taken and intend to continue to take what we consider to be appropriate precautions to minimize exposure to product liability claims, we may not be able to avoid significant liability. We currently maintain product liability insurance. While we think the coverage and limits are consistent with industry standards, our coverage may not be adequate or may not continue to be available at an acceptable cost, if at all. A product liability claim, product recall or other claim with respect to uninsured liabilities or in excess of insured liabilities could have a material adverse effect on our business, operating results and financial condition.
Our Stock Price May Fluctuate in Response to Various Conditions, Many of Which Are Beyond Our Control
The market price of our common stock may fluctuate significantly in response to numerous factors, many of which are beyond our control, including the following:
technological innovations applicable to our products,
our attainment of (or failure to attain) milestones in the commercialization of our technology,
our development of new products or the development of new products by our competitors,
new patents or changes in existing patents applicable to our products,
our acquisition of new businesses or the sale or disposal of a part of our businesses,
development of new collaborative arrangements by us, our competitors or other parties,
changes in government regulations applicable to our business,
changes in investor perception of our business,
fluctuations in our operating results, and
changes in the general market conditions in our industry.
Fluctuations in our quarterly results may, particularly if unforeseen, cause us to miss projections which might result in analysts or investors changing their valuation of our stock.
Lapses in Disclosure Controls and Procedures or Internal Control Over Financial Reporting Could Materially and Adversely Affect the Company’s Operations, Profitability or Reputation.
We are committed to maintaining high standards of internal control over financial reporting and disclosure controls and procedures. Nevertheless, lapses or deficiencies in disclosure controls and procedures or in our internal control over financial reporting may occur from time to time. On January 2, 2013, we reported that our audit committee reached a determination to restate our previously-filed interim financial statements for the quarter ended August 26, 2012 and that our previously-filed interim financial statements for the quarter ended August 26, 2012 should not be relied upon. We also reported management’s determination that a material weakness existed in our internal control over financial reporting at August 26, 2012. As a result of the material weakness, management also concluded that our disclosure controls and procedures were not effective at August 26, 2012.
There can be no assurance that our disclosure controls and procedures will be effective in preventing a material weakness or significant deficiency in internal control over financial reporting from occurring in the future. Any such lapses or deficiencies may materially and adversely affect our business and results of operations or financial condition, restrict our ability to access the capital markets, require us to expend resources to correct the lapses or deficiencies, expose us to regulatory or legal proceedings, harm our reputation, or otherwise cause a decline in investor confidence.
We May Be Exposed to Employment Related Claims and Costs that Could Materially Adversely Affect Our Business
We have been subject in the past, and may be in the future, to claims by employees based on allegations of discrimination, negligence, harassment and inadvertent employment of undocumented workers or unlicensed personnel, and we may be subject to payment of workers' compensation claims and other similar claims. We could incur substantial costs and our management could spend a significant amount of time responding to such complaints or litigation regarding employee claims, which may have a material adverse effect on our business, operating results and financial condition.
We Are Dependent on Our Key Employees and if One or More of Them Were to Leave, We Could Experience Difficulties in Replacing Them, Efficiently or Effectively Transitioning Their Replacements and Our Operating Results Could Suffer
The success of our business depends to a significant extent on the continued service and performance of a relatively small number of key senior management, technical, sales, and marketing personnel. It has been announced that in October 2015 Molly Hemmeter, Landec’s current COO, will become the new CEO of the Company, succeeding Gary Steele, who has served as the Company’s CEO since September 1991 and is retiring as CEO, but will remain on the Company’s Board of Directors. The loss of any of our key personnel for an extended period would likely harm our business. In addition, competition for senior level personnel with knowledge and experience in our different lines of business is intense. If any of our key personnel were to leave, we would need to devote substantial resources and management attention to replace them. As a result, management attention may be diverted from managing our business, and we may need to pay higher compensation to replace these employees.
We May Issue Preferred Stock with Preferential Rights that Could Affect Your Rights
The issuance of shares of preferred stock could have the effect of making it more difficult for a third party to acquire a majority of our outstanding stock, and the holders of such preferred stock could have voting, dividend, liquidation and other rights superior to those of holders of our Common Stock.
We Have Never Paid any Dividends on Our Common Stock
We have not paid any dividends on our Common Stock since inception and do not expect to in the foreseeable future. Any dividends may be subject to preferential dividends payable on any preferred stock we may issue.
Our Profitability Could Be Materially and Adversely Affected if it Is Determined that the Book Value of Goodwill is Higher than Fair Value
Our balance sheet includes an amount designated as “goodwill” that represents a portion of our assets and our stockholders’ equity. Goodwill arises when an acquirer pays more for a business than the fair value of the tangible and separately measurable intangible net assets. In accordance with accounting guidance, goodwill is tested for impairment at least annually and more frequently if circumstances indicate a possible impairment. If we determine at any time in the future that the book value of goodwill is higher than fair value then the difference must be written off, which could materially and adversely affect our reported profitability.
Item 1B. Unresolved Staff Comments
None.
Item 2. Properties
As of May 31, 2015, the Company owned or leased properties in Menlo Park, Arroyo Grande and Guadalupe California; Chaska, Minnesota; Bowling Green and McClure, Ohio; Hanover, Pennsylvania; Vero Beach, Florida; Rock Hill, South Carolina and Rock Tavern, New York as described below.
|
Location |
Business Segment |
Ownership |
Facilities |
Acres of Land |
Lease Expiration | |||||
|
Menlo Park, CA |
Corporate |
Leased |
14,600 square feet of office and laboratory space |
— |
12/31/16 | |||||
|
Chaska, MN |
HA-based Biomaterials |
Owned |
114,000 square feet of office, laboratory and manufacturing space |
27.5 |
— | |||||
|
Guadalupe, CA |
Food Products Technology |
Owned |
199,000 square feet of office space, manufacturing and cold storage |
17.7 |
— | |||||
|
Bowling Green, OH |
Food Products Technology |
Owned |
55,900 square feet of office space, manufacturing and cold storage |
7.7 |
— | |||||
|
Hanover, PA |
Food Products Technology |
Owned |
18,700 square feet of office space, manufacturing and cold storage |
15.3 |
— | |||||
|
Vero Beach, FL |
Food Products Technology |
Leased |
9,200 square feet of office space, manufacturing and cold storage |
— |
12/31/17 | |||||
|
Rock Hill, SC |
Food Products Technology |
Owned |
16,400 square feet of cold storage and office space |
3.6 |
— | |||||
|
Rock Tavern, NY |
Food Products Technology |
Leased |
7,700 square feet of cold storage and office space |
— |
8/23/23 | |||||
|
McClure, OH |
Food Products Technology |
Leased |
Farm land |
185 |
12/31/17 | |||||
|
Guadalupe, CA |
Food Products Technology |
Leased |
105,000 square feet of parking space |
2.4 |
9/30/18 | |||||
|
Guadalupe, CA |
Food Products Technology |
Leased |
5,300 square feet of office space |
— |
5/31/17 | |||||
|
Arroyo Grande, CA |
Food Export |
Leased |
1,100 square feet of office space |
— |
Month-to- Month |
The obligations of the Company under its credit agreement with BMO Harris Bank N.A. (“BMO Harris”) are secured by a lien on the Chaska, MN land and building. The obligations of the Company under its credit agreement with General Electric Capital Corporation (“General Electric”) are secured by a lien on all of the land and buildings of the Food Products Technology segment.
Item 3. Legal Proceedings
As of the date of this report, the Company is not a party to any legal proceedings.
Item 4. Mine Safety Disclosures
Not applicable.
PART II
Item 5. Market for Registrant’s Common Equity, Related Stockholder Matters and Issuer Purchases of Equity Securities
Market Information
The Common Stock is traded on The NASDAQ Global Select Market under the symbol “LNDC”. The following table sets forth for each period indicated the high and low sales prices for the Common Stock.
|
Fiscal Year Ended May 31, 2015 |
High |
Low |
||||||
|
4th Quarter ending May 31, 2015 |
$ | 15.16 | $ | 13.38 | ||||
|
3rd Quarter ending March 1, 2015 |
$ | 14.73 | $ | 12.66 | ||||
|
2nd Quarter ending November 30, 2014 |
$ | 13.64 | $ | 10.75 | ||||
|
1st Quarter ending August 31, 2014 |
$ | 13.26 | $ | 11.15 | ||||
|
Fiscal Year Ended May 25, 2014 |
High |
Low |
||||||
|
4th Quarter ending May 25, 2014 |
$ | 12.16 | $ | 10.19 | ||||
|
3rd Quarter ending February 23, 2014 |
$ | 12.62 | $ | 10.08 | ||||
|
2nd Quarter ending November 24, 2013 |
$ | 13.57 | $ | 11.34 | ||||
|
1st Quarter ending August 25, 2013 |
$ | 15.82 | $ | 13.21 | ||||
Holders
There were approximately 48 holders of record of 27,009,342 shares of outstanding Common Stock as of July 17, 2015. Since certain holders are listed under their brokerage firm’s names, the actual number of stockholders is higher.
Dividends
The Company has not paid any dividends on the Common Stock since its inception. The Company presently intends to retain all future earnings, if any, for its business and does not anticipate paying cash dividends on its Common Stock in the foreseeable future.
Issuer Purchases of Equity Securities
There were no shares repurchased by the Company during fiscal years 2015 or 2014. The Company may still repurchase up to $3.8 million of the Company’s Common Stock under the Company’s stock repurchase plan announced on July 14, 2010.
Item 6. Selected Financial Data
The information set forth below is not necessarily indicative of the results of future operations and should be read in conjunction with the information contained in Item 7 – “Management’s Discussion and Analysis of Financial Condition and Results of Operations” and the Consolidated Financial Statements and Notes to Consolidated Financial Statements contained in Item 8 of this report.
|
Year Ended May 31, 2015 |
Year Ended May 25, 2014 |
Year Ended May 26, 2013 |
Year Ended May 27, 2012 |
Year Ended May 29, 2011 |
||||||||||||||||
|
Statement of Income Data: |
||||||||||||||||||||
|
(in thousands) |
||||||||||||||||||||
|
Product sales |
$ | 539,257 | $ | 476,813 | $ | 441,708 | $ | 317,552 | $ | 276,729 | ||||||||||
|
Cost of product sales |
473,850 | 414,249 | 378,948 | 265,414 | 230,034 | |||||||||||||||
|
Gross profit |
65,407 | 62,564 | 62,760 | 52,138 | 46,695 | |||||||||||||||
|
Operating costs and expenses: |
||||||||||||||||||||
|
Research and development |
6,988 | 7,204 | 9,294 | 9,625 | 9,275 | |||||||||||||||
|
Selling, general and administrative |
39,958 | 35,170 | 32,531 | 26,515 | 24,608 | |||||||||||||||
|
Other operating (income)/expenses |
— | — | (3,933 | ) | 1,421 | 4,780 | ||||||||||||||
|
Total operating costs and expenses |
46,946 | 42,374 | 37,892 | 37,561 | 38,663 | |||||||||||||||
|
Operating profit |
18,461 | 20,190 | 24,868 | 14,577 | 8,032 | |||||||||||||||
|
Dividend income |
1,417 | 1,125 | 1,125 | 1,125 | 328 | |||||||||||||||
|
Interest income |
315 | 260 | 179 | 180 | 430 | |||||||||||||||
|
Interest expense and other |
(1,829 | ) | (1,650 | ) | (2,008 | ) | (929 | ) | (820 | ) | ||||||||||
|
Other income |
3,107 | 10,000 | 8,100 | 5,331 | 472 | |||||||||||||||
|
Net income before taxes |
21,471 | 29,925 | 32,264 | 20,284 | 8,442 | |||||||||||||||
|
Income tax expense |
(7,746 | ) | (10,583 | ) | (9,452 | ) | (7,185 | ) | (4,181 | ) | ||||||||||
|
Consolidated net income |
13,725 | 19,342 | 22,812 | 13,099 | 4,261 | |||||||||||||||
|
Non-controlling interest |
(181 | ) | (197 | ) | (225 | ) | (403 | ) | (341 | ) | ||||||||||
|
Net income applicable to common stockholders |
$ | 13,544 | $ | 19,145 | $ | 22,587 | $ | 12,696 | $ | 3,920 | ||||||||||
|
Basic net income per share |
$ | 0.50 | $ | 0.72 | $ | 0.87 | $ | 0.49 | $ | 0.15 | ||||||||||
|
Diluted net income per share |
$ | 0.50 | $ | 0.71 | $ | 0.85 | $ | 0.49 | $ | 0.15 | ||||||||||
|
Shares used in per share computation: |
||||||||||||||||||||
|
Basic |
26,884 | 26,628 | 25,830 | 25,849 | 26,397 | |||||||||||||||
|
Diluted |
27,336 | 27,120 | 26,626 | 26,126 | 26,626 | |||||||||||||||
|
May 31, 2015 |
May 25, 2014 |
May 26, 2013 |
May 27, 2012 |
May 29, 2011 |
||||||||||||||||
|
Balance Sheet Data: |
||||||||||||||||||||
|
(in thousands) |
||||||||||||||||||||
|
Cash and cash equivalents |
$ | 14,127 | $ | 14,243 | $ | 13,718 | $ | 22,177 | $ | 8,135 | ||||||||||
|
Total assets |
346,465 | 313,623 | 290,942 | 277,692 | 206,312 | |||||||||||||||
|
Long-term debt |
42,519 | 34,372 | 40,305 | 47,317 | 19,830 | |||||||||||||||
|
Retained earnings |
85,098 | 71,554 | 52,409 | 29,822 | 17,126 | |||||||||||||||
|
Total stockholders’ equity |
$ | 218,432 | $ | 203,069 | $ | 178,693 | $ | 149,742 | $ | 136,055 | ||||||||||
Item 7. Management’s Discussion and Analysis of Financial Condition and Results of Operations
The following discussion should be read in conjunction with the Company’s Consolidated Financial Statements contained in Item 8 of this report. Except for the historical information contained herein, the matters discussed in this report are forward-looking statements within the meaning of Section 21E of the Securities Exchange Act of 1934. These forward-looking statements involve certain risks and uncertainties that could cause actual results to differ materially from those in the forward-looking statements. Potential risks and uncertainties include, without limitation, those mentioned in this report and, in particular, the factors described in Item 1A. "Risk Factors.” Landec undertakes no obligation to revise any forward-looking statements in order to reflect events or circumstances that may arise after the date of this report.
Overview
Landec Corporation and its subsidiaries (“Landec” or the “Company”) design, develop, manufacture and sell differentiated products for food and biomaterials markets and license technology applications to partners. The Company has two proprietary polymer technology platforms: 1) Intelimer polymers, and 2) hyaluronan (“HA”) biopolymers. The Company’s HA biopolymers are proprietary in that they are specially formulated for specific customers to meet strict regulatory requirements. The Company’s polymer technologies, along with its customer relationships and trade names, are the foundation, and a key differentiating advantage upon which Landec has built its business. The Company sells specialty packaged branded Eat Smart and GreenLine and private label fresh-cut vegetables and whole produce to retailers, club stores and foodservice operators, primarily in the United States, Canada and Asia through its Apio, Inc. (“Apio”) subsidiary and sells HA-based biomaterials through its Lifecore Biomedical, Inc. (“Lifecore”) subsidiary.
Landec has three operating segments – Food Products Technology, Food Export, and HA-based Biomaterials. The Food Products Technology segment combines the Company’s BreatheWay packaging technology with Apio’s branded Eat Smart and GreenLine and private label fresh-cut and whole produce business. The Food Export business is operated through Apio’s Cal-Ex export company which purchases and sells whole fruit and vegetable products to predominantly Asian markets. The HA-based Biomaterials business sells products utilizing HA in the ophthalmic, orthopedic and veterinary segments and also supplies HA to customers pursuing other medical applications, such as aesthetic surgery, medical device coatings, tissue engineering and pharmaceuticals. See "Business - Description of Business Segments".
As of May 31, 2015, the Company’s retained earnings were $85 million. The Company may incur losses in the future. The amount of future net profits, if any, is uncertain and there can be no assurance that the Company will be able to sustain profitability in future years.
Critical Accounting Policies and Use of Estimates
Use of Estimates
The preparation of financial statements in conformity with U.S. generally accepted accounting principles requires management to make certain estimates and judgments that affect the amounts reported in the financial statements and accompanying notes. The accounting estimates that require management’s most significant and subjective judgments include revenue recognition; sales returns and allowances; self insurance liabilities; recognition and measurement of current and deferred income tax assets and liabilities; the assessment of recoverability of long-lived assets; the valuation of intangible assets and inventory; the valuation of investments; and the valuation and recognition of stock-based compensation.
These estimates involve the consideration of complex factors and require management to make judgments. The analysis of historical and future trends can require extended periods of time to resolve, and are subject to change from period to period. The actual results may differ from management’s estimates.
Allowance for Doubtful Accounts
The Company maintains allowances for doubtful accounts for estimated losses resulting from the inability of its customers to make required payments. The allowance for doubtful accounts is based on review of the overall condition of accounts receivable balances and review of significant past due accounts. If the financial condition of the Company’s customers were to deteriorate, resulting in an impairment of their ability to make payments, additional allowances may be required.
Inventories
Inventories are stated at the lower of cost or market. If the cost of the inventories exceeds their expected market value, provisions are recorded currently for the difference between the cost and the market value. These provisions are determined based on specific identification for unusable inventory and an additional reserve, based on historical losses, for inventory currently considered to be usable.
Revenue Recognition
Revenue from product sales is recognized when there is persuasive evidence that an arrangement exists, title has transferred, the price is fixed and determinable, and collectability is reasonably assured. Allowances are established for estimated uncollectible amounts, product returns, and discounts based on specific identification and historical losses.
Apio’s Food Products Technology revenues generally consist of revenues generated from the sale of specialty packaged fresh-cut and whole value-added processed vegetable products that are generally washed and packaged in our proprietary packaging and sold under Apio’s Eat Smart and GreenLine brands and various private labels. Revenue is generally recognized upon shipment of these products to customers. The Company takes title to all produce it trades and/or packages, and therefore, records revenues and cost of sales at gross amounts in the Consolidated Statements of Comprehensive Income.
In addition, Food Products Technology value-added revenues include the revenues generated from Apio Cooling, LP, a vegetable cooling operation in which Apio is the general partner with a 60% ownership position and from the sale of BreatheWay packaging to license partners. Revenue is recognized on the vegetable cooling operations as cooling and storage services are provided to our customers. Sales of BreatheWay packaging are recognized when shipped to our customers.
Apio’s Food Export revenues consist of revenues generated from the purchase and sale of primarily whole commodity fruit and vegetable products to Asia by Cal-Ex. As most Cal-Ex customers are in countries outside of the U.S., title transfers and revenue is generally recognized upon arrival of the shipment in the foreign port. Apio records revenue equal to the sale price to third parties because it takes title to the product while in transit.
Our HA-based Biomaterials business principally generates revenue through the sale of products containing HA. Lifecore primarily sells products to customers in three medical areas: (1) Ophthalmic, which represented approximately 60% of Lifecore’s revenues in fiscal year 2015, (2) Orthopedic, which represented approximately 20% of Lifecore’s revenues in fiscal year 2015 and (3) Veterinary/Other. The vast majority of revenues from our HA-based Biomaterials business are recognized upon shipment.
Lifecore’s business development revenues, a portion of which are included in all three medical areas, are related to contract research and development (R&D) services and multi-element arrangement services with customers where the Company provides products and/or services in a bundled arrangement.
Contract R&D revenue is recorded as earned, based on the performance requirements of the contract. Non-refundable contract fees for which no further performance obligations exist, and there is no continuing involvement by the Company, are recognized on the earlier of when the payment is received or collection is assured.
For sales arrangements that contain multiple elements, the Company splits the arrangement into separate units of accounting if the individually delivered elements have value to the customer on a standalone basis. The Company also evaluates whether multiple transactions with the same customer or related party should be considered part of a multiple element arrangement, whereby the Company assesses, among other factors, whether the contracts or agreements are negotiated or executed within a short time frame of each other or if there are indicators that the contracts are negotiated in contemplation of each other. The Company then allocates revenue to each element based on a selling price hierarchy. The relative selling price for a deliverable is based on its vendor-specific objective evidence (VSOE), if available, third-party evidence (TPE), if VSOE is not available, or estimated selling price, if neither VSOE nor TPE is available. The Company then recognizes revenue on each deliverable in accordance with its policies for product and service revenue recognition. The Company is not typically able to determine VSOE or TPE, and therefore, uses the estimated selling price to allocate revenue between the elements of an arrangement.
The Company limits the amount of revenue recognition for delivered elements to the amount that is not contingent on the future delivery of products or services or future performance obligations or subject to customer-specific cancellation rights. The Company evaluates each deliverable in an arrangement to determine whether they represent separate units of accounting. A deliverable constitutes a separate unit of accounting when it has stand-alone value, and for an arrangement that includes a general right of return relative to the delivered products or services, delivery or performance of the undelivered product or service is considered probable and is substantially controlled by the Company. The Company considers a deliverable to have stand-alone value if the product or service is sold separately by the Company or another vendor or could be resold by the customer. Further, the revenue arrangements generally do not include a general right of return relative to the delivered products. Where the aforementioned criteria for a separate unit of accounting are not met, the deliverable is combined with the undelivered element(s) and treated as a single unit of accounting for the purposes of allocation of the arrangement consideration and revenue recognition. The Company allocates the total arrangement consideration to each separable element of an arrangement based upon the relative selling price of each element. Allocation of the consideration is determined at arrangement inception on the basis of each unit’s relative selling price. In instances where the Company has not established fair value for any undelivered element, revenue for all elements is deferred until delivery of the final element is completed and all recognition criteria are met.
Licensing revenue is recognized in accordance with prevailing accounting guidance. Initial license fees are deferred and amortized to revenue over the period of the agreement when a contract exists, the fee is fixed and determinable, and collectability is reasonably assured. Noncancellable, nonrefundable license fees are recognized over the period of the agreement, including those governing research and development activities and any related supply agreement entered into concurrently with the license when the risk associated with commercialization of a product is non-substantive at the outset of the arrangement.
From time to time, the Company offers customers sales incentives, which include volume rebates and discounts. These amounts are estimated on a quarterly basis and recorded as a reduction of revenue.
A summary of revenues by type of revenue arrangement as described above is as follows (in thousands):
|
Year ended May 31, 2015 |
Year ended May 25, 2014 |
Year ended May 26, 2013 |
||||||||||
|
Recorded upon shipment |
$ | 465,484 | $ | 398,938 | $ | 359,518 | ||||||
|
Recorded upon acceptance in foreign port |
67,714 | 69,710 | 78,442 | |||||||||
|
Revenue from multiple element arrangements |
4,253 | 6,811 | 1,773 | |||||||||
|
Revenue from license fees, R&D contracts and royalties/profit sharing |
1,806 | 1,354 | 1,975 | |||||||||
|
Total |
$ | 539,257 | $ | 476,813 | $ | 441,708 | ||||||
Goodwill and Other Intangibles
The Company’s intangible assets are comprised of customer relationships with an estimated useful life of twelve to thirteen years and trademarks/trade names and goodwill with indefinite lives (collectively, “intangible assets”), which the Company recognized in accordance with accounting guidance (i) upon the acquisition of GreenLine by Apio in April 2012, (ii) upon the acquisition of Lifecore in April 2010 and (iii) upon the acquisition of Apio in December 1999. Accounting guidance defines goodwill as “the excess of the cost of an acquired entity over the net of the estimated fair values of the assets acquired and the liabilities assumed at date of acquisition.” All intangible assets, including goodwill, associated with the acquisition of Lifecore was allocated to our HA-based Biomaterials reporting unit and the acquisitions of Apio and GreenLine were allocated to our Food Products Technology reporting unit pursuant to accounting guidance based upon the allocation of assets and liabilities acquired and consideration paid for each reporting unit. As of May 31, 2015, the HA-based Biomaterials reporting unit had $13.9 million of goodwill and the Food Products Technology reporting unit had $35.7 million of goodwill.
The Company tests its indefinite-lived intangible assets for impairment at least annually, in accordance with accounting guidance. For all indefinite-lived assets, including goodwill, the Company performs a qualitative analysis in accordance with ASC 350-30-35. Application of the impairment tests for indefinite-lived intangible assets requires significant judgment by management, including identification of reporting units, assignment of assets and liabilities to reporting units, assignment of intangible assets to reporting units which judgments are inherently uncertain.
During the fiscal quarter ended February 23, 2014, the Company voluntarily changed the date of its annual goodwill and indefinite-lived intangible assets impairment testing from the last day of the fiscal month in July to the first day of the fiscal fourth quarter. This voluntary change was preferable under the circumstances as it provides the Company with additional time to complete its annual goodwill and indefinite-lived intangible asset impairment testing in advance of its year-end reporting and results in better alignment with the Company’s strategic planning and forecasting process. This change was not applied retrospectively as it is impracticable to do so because retrospective application would require application of significant estimates and assumptions with the use of hindsight. Accordingly, the change was applied prospectively.
The Company tested its indefinite-lived intangible assets, including goodwill, for impairment as of March 2, 2015 and determined that no adjustments to the carrying values of these assets were necessary as of that date. As a result, it was not necessary to perform the two-step quantitative goodwill impairment test at the time. Subsequent to the 2015 annual impairment test, there have been no significant events or circumstances affecting the valuation of goodwill. As of May 31, 2015, there were no events or changes in circumstances that indicated that the carrying amount of intangible assets may not be recoverable or that goodwill should be tested for impairment. Therefore, there was no impairment to the carrying value of the Company's goodwill. There were no impairment losses for goodwill during fiscal years 2014 and 2013.
On a quarterly basis, the Company considers the need to update its most recent annual tests for possible impairment of its indefinite-lived intangible assets, based on management’s assessment of changes in its business and other economic factors since the most recent annual evaluation. Such changes, if significant or material, could indicate a need to update the most recent annual tests for impairment of the indefinite-lived intangible assets during the current period. The results of these tests could lead to write-downs of the carrying values of these assets in the current period.
In the annual impairment test, the Company first assesses qualitative factors to determine whether it is necessary to perform the two-step quantitative goodwill impairment test. In assessing the qualitative factors, management considers the impact of these key factors: macro-economic conditions, industry and market environment, overall financial performance of the Company, cash flow from operating activities, market capitalization and stock price. If management determines as a result of the qualitative assessment that it is more likely than not (that is, a likelihood of more than 50 percent) that the fair value of a reporting unit is less than its carrying amount, then the quantitative test is required. Otherwise, no further testing is required.
If a quantitative test is required, the Company compares the fair value of indefinite-lived intangible assets to its carrying value including goodwill. The Company determines the fair value using both an income approach and a market approach. Under the income approach, fair value is determined based on estimated future cash flows, discounted by an estimated weighted-average cost of capital, which reflects the overall level of inherent risk of the Company and the rate of return an outside investor would expect to earn. Under the market-based approach, information regarding the Company is utilized as well as publicly available industry information to determine earnings multiples that are used to value each reporting unit. If the carrying value of the reporting unit exceeds its fair value, the Company will determine the amount of impairment loss by comparing the implied fair value of goodwill with the carrying value of goodwill. An impairment charge is recognized for the excess of the carrying value of goodwill over its implied fair value.
Income Taxes
The Company accounts for income taxes in accordance with accounting guidance which requires that deferred tax assets and liabilities be recognized using enacted tax rates for the effect of temporary differences between the book and tax basis of recorded assets and liabilities. The Company maintains valuation allowances when it is likely that all or a portion of a deferred tax asset will not be realized. Changes in valuation allowances from period to period are included in the Company’s income tax provision in the period of change. In determining whether a valuation allowance is warranted, the Company takes into account such factors as prior earnings history, expected future earnings, unsettled circumstances that, if unfavorably resolved, would adversely affect utilization of a deferred tax asset, carryback and carryforward periods, and tax strategies that could potentially enhance the likelihood of realization of a deferred tax asset. At May 31, 2015, the Company had a valuation allowance of $1.2 million against deferred tax assets.
In addition to valuation allowances, the Company establishes tax-contingency accruals for uncertain tax positions. The tax-contingency accruals are adjusted in light of changing facts and circumstances, such as the progress of tax audits, case law and emerging legislation. The Company recognizes interest and penalties related to uncertain tax positions as a component of income tax expense. The Company’s effective tax rate includes the impact of tax-contingency accruals as considered appropriate by management.
A number of years may elapse before a particular matter, for which the Company has accrued, is audited and finally resolved. The number of years with open tax audits varies by jurisdiction. While it is often difficult to predict the final outcome or the timing of resolution of any particular tax matter, the Company believes its tax-contingency accruals are adequate to address known tax contingencies. Favorable resolution of such matters could be recognized as a reduction to the Company’s effective tax rate in the year of resolution. Unfavorable settlement of any particular issue could increase the effective tax rate. Any resolution of a tax issue may require the use of cash in the year of resolution. The Company’s tax-contingency accruals are presented in the balance sheet within accrued liabilities.
Stock-Based Compensation
The Company’s stock-based awards include stock option grants and restricted stock unit awards (RSUs).
The estimated fair value for stock options, which determines the Company’s calculation of compensation expense, is based on the Black-Scholes pricing model. In addition, the accounting guidance requires the estimation of the expected forfeitures of stock-based awards at the time of grant. As a result, the Company uses historical data to estimate pre-vesting forfeitures and records stock-based compensation expense only for those awards that are expected to vest and revises those estimates in subsequent periods if the actual forfeitures differ from the prior estimates.
Fair Value Measurements
The Company uses fair value measurement accounting for financial assets and liabilities and for financial instruments and certain other items measured at fair value. The Company has elected the fair value option for its investment in a non-public company (see Note 2 to the Consolidated Financial Statements). The Company has not elected the fair value option for any of its other eligible financial assets or liabilities.
The accounting guidance established a three-tier hierarchy for fair value measurements, which prioritizes the inputs used in measuring fair value as follows:
Level 1 – observable inputs such as quoted prices for identical instruments in active markets.
Level 2 – inputs other than quoted prices in active markets that are observable either directly or indirectly through corroboration with observable market data.
Level 3 – unobservable inputs in which there is little or no market data, which would require the Company to develop its own assumptions.
As of May 31, 2015, the only asset of the Company that was measured at fair value on a recurring basis was its minority interest investment in Windset.
The Company has elected the fair value option of accounting for its investment in Windset. The calculation of fair value utilizes significant unobservable inputs in the discounted cash flow models, including projected cash flows, growth rates and discount rates. As a result, the Company’s investment in Windset is considered to be a Level 3 measurement investment. The change in the fair market value of the Company’s investment in Windset for the fiscal years ended May 31, 2015 and May 25, 2014 was due to the Company’s 26.9% and 20.1%, respectively, minority interest in the change in the fair market value of Windset during those periods. In determining the fair value of the investment in Windset, the Company utilizes the following significant unobservable inputs in the discounted cash flow models:
|
At May 31, 2015 |
At May 25, 2014 |
|||||||
|
Annual consolidated revenue growth rates |
4 | % | 4 | % | ||||
|
Annual consolidated expense growth rates |
4 | % | 4 | % | ||||
|
Consolidated income tax rates |
15 | % | 15 | % | ||||
|
Consolidated discount rates |
15% to 21 | % | 16% to 22 | % | ||||
The revenue growth, expense growth and income tax rate assumptions, consider the Company's best estimate of the trends in those items over the discount period. The discount rate assumption takes into account the risk-free rate of return, the market equity risk premium and the company’s specific risk premium and then applies an additional discount for lack of marketability of the underlying securities. The discounted cash flow valuation model used by the Company has the following sensitivity to changes in inputs and assumptions (in thousands):
|
Impact on value of Windset investment as of May 31, 2015 |
||||
|
10% increase in revenue growth rates |
$ | 2,300 | ||
|
10% increase in expense growth rates |
$ | (1,200 | ) | |
|
10% increase in income tax rates |
$ | (100 | ) | |
|
10% increase in discount rates |
$ | (1,500 | ) | |
Imprecision in estimating unobservable market inputs can affect the amount of gain or loss recorded for a particular position. The use of different methodologies or assumptions to determine the fair value of certain financial instruments could result in a different estimate of fair value at the reporting date.
The following table summarizes the fair value of the Company’s assets and liabilities that are measured at fair value on a recurring basis, as of May 31, 2015 and May 25, 2014 (in thousands):
|
Fair Value at May 31, 2015 |
Fair Value at May 25, 2014 |
|||||||||||||||||||||||
|
Assets: |
Level 1 |
Level 2 |
Level 3 |
Level 1 |
Level 2 |
Level 3 |
||||||||||||||||||
|
Marketable securities |
$ | - | $ | - | $ | - | $ | - | $ | - | $ | - | ||||||||||||
|
Investment in private company |
- | - | 61,500 | - | - | 39,600 | ||||||||||||||||||
|
Total |
$ | - | $ | - | $ | 61,500 | $ | - | $ | - | $ | 39,600 | ||||||||||||
|
Liabilities: |
||||||||||||||||||||||||
|
Interest rate swap |
- | - | - | - | 44 | - | ||||||||||||||||||
|
Total |
$ | - | $ | - | $ | - | $ | - | $ | 44 | $ | - | ||||||||||||
Recent Accounting Pronouncements
Debt Issuance Costs
In April 2015, the Financial Accounting Standards Board (“FASB”) issued Accounting Standard Update (“ASU”) No. 2015-03, Simplifying the Presentation of Debt Issuance Cost ("ASU 2015-03"), which requires that debt issuance costs related to a recognized debt liability be presented in the balance sheet as a direct deduction from the carrying amount of that debt liability, consistent with debt discounts. The new guidance is effective for the Company beginning in the fourth quarter of fiscal year 2016, with early adoption permitted. Management is currently evaluating the impact that adoption of ASU 2015-03 will have on the Company’s Consolidated Financial Statements and disclosures.
Revenue Recognition
In May 2014, the FASB issued ASU No. 2014-09, Revenue from Contracts with Customers (Topic 606) ("ASU 2014-09"), which outlines a single comprehensive model for entities to use in accounting for revenue arising from contracts with customers and supersedes most current revenue recognition guidance, including industry-specific guidance. The standard requires entities to recognize revenue to depict the transfer of promised goods or services to customers in an amount that reflects the consideration to which the entity expects to be entitled in exchange for those goods or services. The new guidance also includes a cohesive set of disclosure requirements intended to provide users of financial statements with comprehensive information about the nature, amount, timing, and uncertainty of revenue and cash flows arising from a company’s contracts with customers. ASU 2014-09 will be effective beginning the first quarter of the Company's fiscal year 2019 and early application is not permitted. The standard allows for either “full retrospective” adoption, meaning the standard is applied to all of the periods presented, or “modified retrospective” adoption, meaning the standard is applied only to the most current period presented in the financial statements. Management is currently evaluating the effect ASU 2014-09 will have on the Company's Consolidated Financial Statements and disclosures.
Results of Operations
Fiscal Year Ended May 31, 2015 Compared to Fiscal Year Ended May 25, 2014
Revenues (in thousands):
|
Fiscal Year ended May 31, 2015 |
Fiscal Year ended May 25, 2014 |
Change |
||||||||||
|
Food Products Technology |
$ | 430,415 | $ | 360,728 | 19 | % | ||||||
|
Food Export |
67,837 | 69,827 | (3% | ) | ||||||||
|
Total Apio |
498,252 | 430,555 | 16 | % | ||||||||
|
HA-based Biomaterials |
40,432 | 45,704 | (12% | ) | ||||||||
|
Corporate |
573 | 554 | 3 | % | ||||||||
|
Total Revenues |
$ | 539,257 | $ | 476,813 | 13 | % | ||||||
Food Products Technology (Apio)
Apio’s Food Products Technology revenues consist of revenues generated from the sale of specialty packaged fresh-cut and whole value-added processed vegetable products that are washed and packaged in our proprietary packaging and sold under Apio’s Eat Smart and GreenLine brands and various private labels. In addition, Food Products Technology revenues include the revenues generated from Apio Cooling, LP, a vegetable cooling operation in which Apio is the general partner with a 60% ownership position and from the sale of BreatheWay packaging to license partners.
The increase in Apio's Food Products Technology revenues for the fiscal year ended May 31, 2015 compared to the same period last year was primarily due to a 12% increase in unit volume sales resulting primarily from new salad kit products which typically have a higher price per unit than historical offerings. In addition, fiscal year 2015 included an extra week compared to fiscal year 2014 as a result of the timing of the Company’s 2015 fiscal year end.
Food Export (Apio)
Apio’s Food Export revenues consist of revenues generated from the purchase and sale of primarily whole commodity fruit and vegetable products to Asia by Cal-Ex. Apio records revenue equal to the sale price to third parties because it takes title to the product while in transit.
The decrease in revenues in Apio’s Food Export business for the fiscal year ended May 31, 2015 compared with fiscal year 2014 was due to a 9% decrease in unit volume sales primarily as a result of a west coast longshoremans labor dispute which was partially offset by a favorable product mix to higher priced export products.
HA-based Biomaterials (Lifecore)
Lifecore principally generates revenue through the sale of products containing HA. Lifecore primarily sells products to customers in three medical areas: (1) Ophthalmic, which represented approximately 60% of Lifecore’s revenues in fiscal year 2015, (2) Orthopedic, which represented approximately 20% of Lifecore’s revenues in fiscal year 2015 and (3) Veterinary/Other.
The decrease in Lifecore's revenues for fiscal year 2015 compared to fiscal year 2014 was primarily due to a 29% decrease in revenues in Lifecore's fermentation business for Ophthalmic products as a result of lower shipments to a major customer as it aligns its inventory levels with newly stated corporate guidelines and a 25% decrease in business development revenues due to the delay in the timing of certain development activities. These decreases were partially offset by increased aseptic filling revenues.
Corporate
Corporate revenues are generated from the licensing agreements with corporate partners.
The increase in Corporate revenues for fiscal year 2015 compared to the same period of last year was not significant.
Gross Profit (in thousands):
|
Fiscal Year ended May 31, 2015 |
Fiscal Year ended May 25, 2014 |
Change |
||||||||||
|
Food Products Technology |
$ | 45,993 | $ | 36,318 | 27 | % | ||||||
|
Food Export |
4,252 | 5,340 | (20% | ) | ||||||||
|
Total Apio |
50,245 | 41,658 | 21 | % | ||||||||
|
HA-based Biomaterials |
14,609 | 20,456 | (29% | ) | ||||||||
|
Corporate |
553 | 450 | 23 | % | ||||||||
|
Total Gross Profit |
$ | 65,407 | $ | 62,564 | 5 | % | ||||||
General
There are numerous factors that can influence gross profit including product mix, customer mix, manufacturing costs, volume, sale discounts and charges for excess or obsolete inventory, to name a few. Many of these factors influence or are interrelated with other factors. The Company includes in cost of sales all of the costs related to the sale of products in accordance with U.S. generally accepted accounting principles. These costs include the following: raw materials (including produce, seeds, packaging, syringes and fermentation and purification supplies), direct labor, overhead (including indirect labor, depreciation, and facility related costs) and shipping and shipping-related costs. The following are the primary reasons for the changes in gross profit for the fiscal year ended May 31, 2015 compared to the same period last year as outlined in the table above.
Food Products Technology (Apio)
The increase in gross profit for Apio’s Food Products Technology business for fiscal year 2015 compared to the same period last year was primarily due to the gross profit generated from the 19% increase in revenues and from a favorable product mix change to a greater percentage of revenues coming from higher margin salad kit products versus the lower margin core packaged vegetable products. In addition, fiscal year 2014 Apio’s Food Products Technology business experienced higher than expected raw produce sourcing costs due to a variety of factors, most importantly the heavy rains in the Midwest and along the East Coast and cooler than normal temperatures in California.
Food Export (Apio)
Apio’s Food Export business is a buy/sell business that typically realizes a gross margin in the 5-10% range.
The decrease in gross profit for Apio’s export business for fiscal year 2015 compared to the same period last year was due to a 3% decrease in revenues and from higher costs to source the higher priced export produce resulting in a lower gross profit as a percent of sales. The gross margin during fiscal year 2015 was 6.3% compared to a gross margin of 7.6% during the same period last year.
HA-based Biomaterials (Lifecore)
Lifecore operates in the medical devices industry and has historically realized an overall gross margin percentage of approximately 35-50%.
The decrease in gross profit during fiscal year 2015 compared to the same period last year was due to the 12% decrease in revenues and from an unfavorable product mix change to a higher percentage of sales being from the lower margin aseptically filled products compared to the higher margin fermentation products and business development revenues in the prior year.
Corporate
The decrease in Corporate gross profit for fiscal year 2015 compared to the same period last year was not significant.
Operating Expenses (in thousands):
|
Fiscal Year ended May 31, 2015 |
Fiscal Year ended May 25, 2014 |
Change |
||||||||||
|
Research and Development: |
||||||||||||
|
Apio |
$ | 745 | $ | 1,105 | (33 | %) | ||||||
|
Lifecore |
4,806 | 4,739 | 1 | % | ||||||||
|
Corporate |
1,437 | 1,360 | 6 | % | ||||||||
|
Total R&D |
$ | 6,988 | $ | 7,204 | (3 | %) | ||||||
|
Selling, General and Administrative: |
||||||||||||
|
Apio |
$ | 27,380 | $ | 22,860 | 20 | % | ||||||
|
Lifecore |
4,057 | 4,251 | (5 | %) | ||||||||
|
Corporate |
8,521 | 8,059 | 6 | % | ||||||||
|
Total S,G&A |
$ | 39,958 | $ | 35,170 | 14 | % | ||||||
Research and Development
Landec’s research and development consisted primarily of product development and commercialization initiatives. Research and development efforts at Apio are focused on the Company’s proprietary BreatheWay membranes used for packaging produce, with a focus on extending the shelf-life of sensitive vegetables and fruit. In the Lifecore business, the research and development efforts are focused on new products and applications for HA and non-HA based biomaterials. For Corporate, the research and development efforts are primarily focused on supporting the development and commercialization of new products and new technologies in our food and HA businesses.
The decrease in R&D expenses for fiscal year 2015 compared to the same period last year was primarily due to a decrease in Apio R&D as products move from the development stage to commercialization offset by slight increases in R&D at Lifecore and Corporate.
Selling, General and Administrative (S,G&A)
Selling, general and administrative expenses consist primarily of sales and marketing expenses associated with Landec’s product sales and services, business development expenses and staff and administrative expenses.
The increase in S,G&A expenses for fiscal year 2015 compared to the same period last year was primarily due to a 20% increase in sales and marketing expenses at Apio primarily to promote our new salad kit products and from the addition of incremental headcount to assist in developing and promoting future products.
Non-operating income/(expense) (in thousands):
|
Fiscal Year ended May 31, 2015 |
Fiscal Year ended May 25, 2014 |
Change |
||||||||||
|
Dividend Income |
$ | 1,417 | $ | 1,125 | 26 | % | ||||||
|
Interest Income |
$ | 315 | $ | 260 | 21 | % | ||||||
|
Interest Expense |
$ | (1,829 | ) | $ | (1,650 | ) | 11 | % | ||||
|
Other Income |
$ | 3,107 | $ | 10,000 | (69 | %) | ||||||
|
Income Taxes |
$ | (7,746 | ) | $ | (10,583 | ) | (27 | %) | ||||
|
Non controlling Interest |
$ | (181 | ) | $ | (197 | ) | (8 | %) | ||||
Dividend Income
Dividend income is derived from the dividends accrued on our $22.0 million preferred stock investment in Windset which yields a cash dividend of 7.5% annually. The increase in dividend income for fiscal year 2015 compared to the same period last year was due to the Company increasing its preferred stock investment in Windset by $7.0 million on October 29, 2014.
Interest Income
The increase in interest income in fiscal year 2015 compared to fiscal year 2014 was not significant.
Interest Expense
The increase in interest expense during fiscal year 2015 compared to the same period last year was due to an $8.1 million net increase in long-term debt during fiscal year 2015.
Other Income
The decrease in other income for fiscal year 2015 was due to the change in the increase in the fair value of our Windset investment being lower in fiscal year 2015 compared to fiscal year 2014. In addition, other income during fiscal year 2015 included a $793,000 expense for the write off of the Company’s investment in Aesthetic Sciences, Inc.
Income Taxes
The decrease in the income tax expense for fiscal year 2015 was primarily due to a 28% decrease in net income before taxes compared to the same period last year.
Non controlling Interest
The non controlling interest consists of the limited partners’ equity interest in the net income of Apio Cooling, LP.
The decrease in non controlling interest for fiscal year 2015 compared to the same period last year was not significant.
Fiscal Year Ended May 25, 2014 Compared to Fiscal Year Ended May 26, 2013
Revenues (in thousands):
|
Fiscal Year ended May 25, 2014 |
Fiscal Year ended May 26, 2013 |
Change |
||||||||||
|
Food Products Technology |
$ | 360,728 | $ | 320,447 | 13 | % | ||||||
|
Food Export |
69,827 | 78,568 | (11 | %) | ||||||||
|
Total Apio |
430,555 | 399,015 | 8 | % | ||||||||
|
HA-based Biomaterials |
45,704 | 41,281 | 11 | % | ||||||||
|
Corporate |
554 | 1,412 | (61 | %) | ||||||||
|
Total Revenues |
$ | 476,813 | $ | 441,708 | 8 | % | ||||||
Food Products Technology (Apio)
Apio’s Food Products Technology revenues consist of revenues generated from the sale of specialty packaged fresh-cut and whole value-added processed vegetable products that are washed and packaged in our proprietary packaging and sold under Apio’s Eat Smart and GreenLine brands and various private labels. In addition, value-added revenues include the revenues generated from Apio Cooling, LP, a vegetable cooling operation in which Apio is the general partner with a 60% ownership position, and from the sale of BreatheWay packaging to license partners.
The increase in Apio's Food Products Technology revenues for the fiscal year ended May 25, 2014 compared to the same period last year was primarily due to a 8% increase in unit volume sales resulting primarily from expanded product offerings and a 10% unit volume increase in the fresh-cut vegetable category, according to Nielsen, coupled with new product introductions which typically have a higher price per unit than historical offerings.
Food Export (Apio)
Apio’s Food Export revenues consist of revenues generated from the purchase and sale of primarily whole commodity fruit and vegetable products to Asia by Cal-Ex. Apio records revenue equal to the sale price to third parties because it takes title to the product while in transit.
The decrease in revenues in Apio’s Food Export business for the fiscal year ended May 25, 2014 compared to the same period last year was due to a 6% decrease in unit volume sales primarily as a result of new Indonesian import quotas on fruit coupled with a product mix change to lower priced export items compared to fiscal year 2013.
HA-based Biomaterials (Lifecore)
Lifecore principally generates revenue through the sale of products containing HA. Lifecore primarily sells products to customers in three medical areas: (1) Ophthalmic, which represented approximately 60% of Lifecore’s revenues in fiscal year 2014, (2) Orthopedic, which represented approximately 20% of Lifecore’s revenues in fiscal year 2014 and (3) Veterinary/Other.
The increase in Lifecore’s revenues for fiscal year 2014 compared to the same period last year was due to a 32% increase in revenues in Lifecore’s aseptic filling business from increased sales to existing customers partially offset by a 13% decrease in fermentation sales.
Corporate
Corporate revenues are generated from the licensing agreements with corporate partners.
The decrease in Corporate revenues for fiscal year 2014 compared to the same period of last year was not significant.
Gross Profit (in thousands):
|
Fiscal Year ended May 25, 2014 |
Fiscal Year ended May 26, 2013 |
Change |
||||||||||
|
Food Products Technology |
$ | 36,318 | $ | 37,077 | (2 | %) | ||||||
|
Food Export |
5,340 | 5,274 | 1 | % | ||||||||
|
Total Apio |
41,658 | 42,351 | (2 | %) | ||||||||
|
HA-based Biomaterials |
20,456 | 19,102 | 7 | % | ||||||||
|
Corporate |
450 | 1,307 | (66 | %) | ||||||||
|
Total Gross Profit |
$ | 62,564 | $ | 62,760 | 0 | % | ||||||
General
There are numerous factors that can influence gross profit including product mix, customer mix, manufacturing costs, volume, sale discounts and charges for excess or obsolete inventory, to name a few. Many of these factors influence or are interrelated with other factors. The Company includes in cost of sales all of the costs related to the sale of products in accordance with U.S. generally accepted accounting principles. These costs include the following: raw materials (including produce, seeds, packaging, syringes and fermentation and purification supplies), direct labor, overhead (including indirect labor, depreciation, and facility related costs) and shipping and shipping-related costs. The following are the primary reasons for the changes in gross profit for the fiscal year ended May 25, 2014 compared to the same period last year as outlined in the table above.
Food Products Technology (Apio)
The decrease in gross profit for the Food Products Technology business for fiscal year 2014 compared to the same period last year was primarily due to much higher than expected operating costs including higher labor costs to meet higher than expected volumes and higher raw produce sourcing costs during primarily the first six months of fiscal year 2014 resulting from lower yields and poor quality due to a variety of factors, most importantly the heavy rains in the Midwest and along the East Coast and large temperatures swings in California throughout most of the year. The higher operating costs reduced Apio’s gross profit by approximately $9.3 million during fiscal year 2014 which was partially offset by the gross profit generated from the 13% increase in revenues.
Food Export (Apio)
Apio’s Food Export business is a buy/sell business that typically realizes a gross margin in the 5-8% range.
The increase in gross profit for Apio’s Food Export business for fiscal year 2014 compared to the same period last year was primarily due to favorable product mix changes to higher margin products, primarily into Indonesia, which resulted in a higher gross margin percentage during fiscal year 2014 of 7.6% compared to a gross margin percentage of 6.7% during fiscal year 2013. The favorable product mix was offset by the decrease in gross profit resulting from an 11% decrease in revenues.
HA-based Biomaterials (Lifecore)
Lifecore operates in the medical devices industry and has historically realized an overall gross margin percentage of approximately 35-50%.
The increase in gross profit for fiscal year 2014 compared to the same period last year was due to an 11%, or $4.4 million increase in revenues resulting from the increased sales of both historical products and new products to existing customers. The increase in gross profit from higher revenues was partially offset by an unfavorable product mix change to higher sales of lower margin aseptically filled products from higher margin fermentation sales.
Corporate
The decrease in Corporate gross profit for fiscal year 2014 compared to the same period last year was not significant.
Operating Expenses (in thousands):
|
Fiscal Year ended May 25, 2014 |
Fiscal Year ended May 26, 2013 |
Change |
||||||||||
|
Research and Development: |
||||||||||||
|
Apio |
$ | 1,105 | $ | 1,088 | 2 | % | ||||||
|
Lifecore |
4,739 | 4,930 | (4 | %) | ||||||||
|
Corporate |
1,360 | 3,276 | (58 | %) | ||||||||
|
Total R&D |
$ | 7,204 | $ | 9,294 | (22 | %) | ||||||
|
Selling, General and Administrative: |
||||||||||||
|
Apio |
$ | 22,860 | $ | 21,976 | 4 | % | ||||||
|
Lifecore |
4,251 | 4,595 | (7 | %) | ||||||||
|
Corporate |
8,059 | 5,960 | 35 | % | ||||||||
|
Total S,G&A |
$ | 35,170 | $ | 32,531 | 8 | % | ||||||
|
Other operating expenses: |
||||||||||||
|
Apio |
$ | — | $ | (3,933 | ) |
N/M |
||||||
|
Total Other Operating Expenses |
$ | — | $ | (3,933 | ) |
N/M |
||||||
Research and Development
Landec’s research and development consisted primarily of product development and commercialization initiatives. Research and development efforts at Apio are focused on the Company’s proprietary BreatheWay membranes used for packaging produce, with a focus on extending the shelf-life of sensitive vegetables and fruit. In the Lifecore business, the research and development efforts are focused on new products and applications for HA-based biomaterials. For Corporate, the research and development efforts are focused on supporting the development and commercialization of new products and new technologies in our food and HA businesses along with developing uses for our proprietary Intelimer polymers outside of our food and HA businesses.
The decrease in research and development expenses for fiscal year 2014 compared to last year was primarily due to a decrease in Corporate R&D because of the Company transitioning away from R&D and licensing collaborations to maintain focus on R&D efforts at its core food and HA businesses.
Selling, General and Administrative (S,G&A)
Selling, general and administrative expenses consist primarily of sales and marketing expenses associated with Landec’s product sales and services, business development expenses and staff and administrative expenses.
The increase in S,G&A expenses for fiscal year 2014 compared to the same period last year was primarily due to an increase in accounting and tax fees, public company costs and board of director fees in fiscal year 2014.
Other Operating Expenses
Other operating expenses in fiscal year 2013 consisted of a $3.9 million reversal of the earn-out liability at Apio associated with the GreenLine acquisition.
Non-operating income/(expense) (in thousands):
|
Fiscal Year ended May 25, 2014 |
Fiscal Year ended May 26, 2013 |
Change |
||||||||||
|
Dividend Income |
$ | 1,125 | $ | 1,125 | — | |||||||
|
Interest Income |
$ | 260 | $ | 179 | 45 | % | ||||||
|
Interest Expense |
$ | (1,650 | ) | $ | (2,008 | ) | (18 | %) | ||||
|
Other Income |
$ | 10,000 | $ | 8,100 | 23 | % | ||||||
|
Income Taxes |
$ | (10,583 | ) | $ | (9,452 | ) | 12 | % | ||||
|
Non controlling Interest |
$ | (197 | ) | $ | (225 | ) | (12 | %) | ||||
Dividend Income
Dividend income is derived from the dividends accrued on our $15 million preferred stock investment in Windset which yields a cash dividend of 7.5% annually. There was no change in dividend income in fiscal year 2014 compared to fiscal year 2013.
Interest Income
The increase in interest income for the fiscal year 2014 compared to the same period last year was not significant.
Interest Expense
The decrease in interest expense during fiscal year 2014 compared to the same period last year was due to the Company paying down its debt by $9.9 million during fiscal year 2014.
Other Income
The increase in other income for fiscal year 2014 compared to the same period last year is primarily due to the change in the fair market value of our Windset investment being $1.9 million higher in fiscal year 2014 compared to the increase in fiscal year 2013.
Income Taxes
The increase in the income tax expense for fiscal year 2014 was due to an increase in the effective tax rate for fiscal year 2014 to 36% compared to 30% in fiscal year 2013. The effective tax rates for last year was lower than this year as a result of the $3.9 million earn out adjustment last year which was not subject to income tax. The increase in income taxes due to the increase in the effective tax rate was partially offset by a 7% decrease in net income before taxes compared to the same period last year.
Non controlling Interest
The non controlling interest consists of the limited partners’ equity interest in the net income of Apio Cooling, LP.
The decrease in non controlling interest for fiscal year 2014 compared to the same period last year was not significant.
Liquidity and Capital Resources
As of May 31, 2015, the Company had cash and cash equivalents of $14.1 million, a net decrease of $116,000 from $14.2 million at May 25, 2014.
Cash Flow from Operating Activities
Landec generated $26.2 million of cash from operating activities during fiscal year 2015 compared to generating $21.0 million from operating activities during fiscal year 2014. The primary sources of cash from operating activities during fiscal year 2015 were from (1) $13.7 million of net income, (2) $8.7 million of depreciation/amortization and stock-based compensation expenses, (3) a $4.2 million net increase in deferred tax liabilities and (4) a net decrease of $3.3 million in working capital. Theses sources of cash were partially offset by the $3.9 million non-cash increase in the value of the Company’s investment in Windset.
The factors which decreased working capital during fiscal year 2015 were a $2.9 million increase in accounts payable due mainly to a $2.0 million increase at Apio due to costs from operations being $5.1 million higher in May 2015 compared to May 2014 and a $2.6 million increase in accrued compensation primarily from bonuses earned at Apio and Corporate for achieving financial performance targets. These decreases in working capital were partially offset by a $1.8 million increase in accounts receivable primarily due to Apio’s May 2015 revenues being $5.2 million higher than May 2014 revenues and from a $2.2 million increase in prepaid expenses and other current assets due to a $2.5 million increase at Apio primarily due to increased prepayments for raw product.
Cash Flow from Investing Activities
Net cash used in investing activities for fiscal year 2015 was $34.4 million compared to $13.3 million for the same period last year. The primary uses of cash in investing activities during fiscal year 2015 were for the purchase of $17.5 million of facilities and equipment primarily to support the growth of the Apio value-added and Lifecore businesses and the purchase of additional Windset shares of common stock and preferred stock for $18.0 million.
Cash Flow from Financing Activities
Net cash provided by financing activities for fiscal year 2015 was $8.2 million compared to $7.2 million used in financing activities for the same period last year. The net cash provided by financing activities during fiscal year 2015 was primarily due to $15.0 million of proceeds from long-term debt. These sources from financing activities were partially offset by $6.9 million of payments on the Company’s long-term debt.
Capital Expenditures
During the fiscal year ended May 31, 2015, Landec continued its expansion of Apio’s value-added processing facility and purchased vegetable processing equipment as well as made facility modifications and equipment purchases at Lifecore to support business growth. These expenditures represented the majority of the $17.5 million of capital expenditures during fiscal year 2015.
Debt
On August 19, 2004, Lifecore issued variable rate industrial revenue bonds (“IRBs”). These IRBs were assumed by Landec in the acquisition of Lifecore (see Note 6 to the Consolidated Financial Statements). The IRBs are collateralized by a bank letter of credit which is secured by a first mortgage on Lifecore’s facility in Chaska, Minnesota. In addition, Lifecore pays an annual remarketing fee equal to 0.125% and an annual letter of credit fee of 0.75%.
On April 23, 2012 in connection with the acquisition of GreenLine, Apio entered into three loan agreements with General Electric Capital Corporation and/or its affiliates (“GE Capital”), (collectively the “GE Debt Agreements”):
|
1) |
A five-year, $25.0 million asset-based working capital revolving line of credit, with an interest rate of LIBOR plus 2%, with availability based on the combination of the eligible accounts receivable and inventory balances of Apio and its subsidiaries. |
|
2) |
A $12.7 million capital equipment loan which matures in seven years payable in monthly principal and interest payments of $175,356 with interest based on a fixed rate of 4.39% per annum. |
|
3) |
A $19.2 million real estate loan, $1.2 million of which was paid in April 2013, and the remainder maturing in ten years. The real estate loan has a fifteen year amortization period due in monthly principal and interest payments of $141,962 with interest based on a fixed rate of 4.02% per annum. The principal balance remaining at the end of the ten year term is due in one lump sum on April 23, 2022. |
On July 17, 2014, Apio entered into an amendment with GE Capital, which amended the revolving line of credit dated April 23, 2012 among the parties. Under the amendment, the revolving line of credit increased from $25 million to $40 million, the interest rate was reduced from LIBOR plus 2.0% to LIBOR plus 1.75%, and the term was extended to July 17, 2019, among other changes. The availability under the revolving line of credit is based on the combination of the eligible accounts receivable and eligible inventory (availability was $30.3 million at May 31, 2015). Apio’s revolving line of credit has an unused fee of 0.375% per annum. At both May 31, 2015 and May 25, 2014, there was no outstanding balance under Apio’s revolving line of credit.
Also on July 17, 2014, Apio entered into a new equipment loan with GE Capital whereby Apio can borrow up to $25 million based on eligible equipment purchases between August 1, 2012 and August 31, 2015. Each borrowing under this new equipment loan has a five year term with a seven year amortization period. On August 28, 2014, Apio borrowed $7.1 million under the new equipment loan at a fixed rate of 3.68%. On November 24, 2014, Apio borrowed an additional $4.1 million under the new equipment loan at a fixed rate of 3.74%. The Company does not intend to borrow any more funds under this loan.
On May 15, 2015, GE Capital and Apio entered into a commitment letter, pursuant to which GE Capital committed to lend Apio up to approximately $14.7 million in equipment financing and approximately $7.7 million in real property financing. The equipment loan and the real property loan will be made pursuant to existing loan agreements dated as of April 23, 2012, as amended May 17, 2013 and July 17, 2014. The equipment loan is available to finance purchases of equipment between May 1, 2015 and June 30, 2017. Borrowings under the equipment loan will have a five-year term and a seven-year amortization. Interest on each borrowing under the equipment loan will be at a fixed rate based on an index rate plus a 5-year swap rate at the time of borrowing. The real property loan will be used to finance the expansion of Apio’s facility in Hanover, PA. The real property loan will have a 10-year term and a 20-year amortization. Interest will be at a fixed rate based on an index rate plus a 10-year swap rate on at the time of borrowing. No amounts had been borrowed under these committed loans as of May 31, 2015.
The GE real estate, equipment and line of credit agreements (collectively the “GE Debt Agreements”) are secured by liens on all of the property of Apio and its subsidiaries. The GE Debt Agreements contain customary events of default under which obligations could be accelerated or increased. The GE Capital real estate and equipment loans are guaranteed by Landec, and Landec has pledged its equity interest in Apio as collateral under the line of credit agreement. The GE Debt Agreements contain customary covenants, such as limitations on the ability to (1) incur indebtedness or grant liens or negative pledges on Apio’s assets; (2) make loans or other investments; (3) pay dividends, sell stock or repurchase stock or other securities; (4) sell assets; (5) engage in mergers; (6) enter into sale and leaseback transactions; or (7) make changes in Apio’s corporate structure. In addition, Apio must maintain a minimum fixed charge coverage ratio of 1.10 to 1.0 if the availability under its line of credit falls below $12.0 million. Apio was in compliance with all financial covenants as of May 31, 2015 and May 25, 2014.
On May 15, 2015, Apio and Bank of America (“BofA”) entered into a commitment letter and loan agreement, pursuant to which Apio will be permitted to borrow up to $15.0 million to finance equipment purchases made between October 1, 2014 and April 30, 2016 (the “BofA Loan”). Each borrowing under the BofA Loan will have a five-year term and will have a fixed interest rate based on the 2.5-year swap rate at the time of borrowing. Borrowings will be secured by equipment financed with proceeds of the BofA Loan. In addition, on May 15, 2015, Landec and BofA entered into a Guaranty, pursuant to which Landec guaranteed Apio’s payment obligations under the BofA Loan.
During fiscal year 2015, Apio capitalized $397,000 of loan origination fees from new equipment loans and/or amendments with GE Capital and BofA, no loan origination fees were capitalized in fiscal year 2014. Amortization of loan origination fees for Apio recorded to interest expense for fiscal years 2015, 2014 and 2013 were $206,000, $187,000 and $181,000, respectively. Unamortized loan origination fees were $1.2 million and $1.0 million at May 31, 2015 and May 25, 2014, respectively, and are included in other assets in the Consolidated Balance Sheets.
On May 23, 2012, Lifecore entered into two financing agreements with BMO Harris Bank N.A. and/or its affiliates (“BMO Harris”), collectively (the “Lifecore Loan Agreements”):
|
(1) |
A $12.0 million term loan which matures in four years due in monthly payments of $250,000 with interest payable monthly based on a variable interest rate of LIBOR plus 2% (the “Term Loan”). |
|
(2) |
A Reimbursement Agreement pursuant to which BMO Harris caused its affiliate Bank of Montreal to issue an irrevocable letter of credit in the amount of $3.5 million (the “Letter of Credit”) which is securing the IRBs described above. |
On May 22, 2015, Lifecore entered into a Credit and Security Agreement (the “Credit Agreement”) with BMO Harris which includes (a) a two-year, $10.0 million asset-based working capital revolving line of credit, with an interest rate of LIBOR plus 1.85%, with availability based on the combination of Lifecore’s eligible accounts receivable and inventory balances (availability was $9.4 million at May 31, 2015) and with no unused fee. As of May 31, 2015 no amounts were outstanding under this line of credit.
The obligations of Lifecore under the Lifecore Loan Agreements and Credit Agreement (collectively “Lifecore Debt Agreements”) are secured by liens on all of the property of Lifecore. The Lifecore Debt Agreements contain customary covenants, such as limitations on the ability to (1) incur indebtedness or grant liens or negative pledges on Lifecore’s assets; (2) make loans or other investments; (3) pay dividends or repurchase stock or other securities; (4) sell assets; (5) engage in mergers; (6) enter into sale and leaseback transactions; (7) adopt certain benefit plans; and (8) make changes in Lifecore’s corporate structure. In addition, under the Credit Agreement, Lifecore must maintain (a) a minimum fixed charge coverage ratio of 1.10 to 1.0 if Lifecore’s unrestricted cash balance is less than 50% of total funded debt at the end of each fiscal quarter and (b) a net debt cash flow leverage ratio of less than 2.0 to 1.0 at the end of each fiscal quarter. Lifecore was in compliance with all financial covenants as of May 31, 2015 and May 25, 2014. Unamortized loan origination fees for the Lifecore Debt Agreements were $48,000 and $98,000 at May 31, 2015 and May 25, 2014, respectively, and are included in other assets in the Consolidated Balance Sheets.
The market value of the Company’s debt approximates its recorded value as the interest rates on each debt instrument approximates current market rates.
The Term Loan was used to repay Lifecore’s former credit facility with Wells Fargo Bank, N.A. (“Wells Fargo”). The Letter of Credit (which replaces a letter of credit previously provided by Wells Fargo) provides liquidity and credit support for the IRBs.
In May 2010, the Company entered into a five-year interest rate swap agreement under the credit agreement with Wells Fargo which terminated in May 2015. The interest rate swap was designated as a cash flow hedge of future interest payments of LIBOR and had a notional amount of $20 million. As a result of the interest rate swap transaction, the Company fixed for a five-year period the interest rate at 4.24% subject to market based interest rate risk on $20 million of borrowings under the credit agreement with Wells Fargo. The Company’s obligations under the interest rate swap transaction as to the scheduled payments were guaranteed and secured on the same basis as its obligations under the credit agreement with Wells Fargo at the time the agreement was consummated. Upon entering into the new Term Loan with BMO Harris in May 2012, the Company used the proceeds from that loan to pay off the Wells Fargo credit facility. The swap with Wells Fargo was not terminated upon the extinguishment of the debt with Wells Fargo. The fair value of the swap arrangement as of May 31, 2015 and May 25, 2014 was zero and $44,000, respectively, and is included in other accrued liabilities in the accompanying Consolidated Balance Sheets.
Contractual Obligations
The Company’s material contractual obligations for the next five years and thereafter as of May 31, 2015, are as follows (in thousands):
|
Due in Fiscal Year Ended May |
||||||||||||||||||||||||||||
|
Obligation |
Total |
2016 |
2017 |
2018 |
2019 |
2020 |
Thereafter |
|||||||||||||||||||||
|
Debt principal payments |
$ | 42,519 | $ | 8,353 | $ | 5,567 | $ | 5,782 | $ | 6,005 | $ | 6,655 | $ | 10,157 | ||||||||||||||
|
Interest payments |
5,494 | 1,415 | 1,176 | 967 | 749 | 499 | 688 | |||||||||||||||||||||
|
Operating leases |
9,419 | 3,136 | 2,631 | 1,768 | 1,003 | 257 | 624 | |||||||||||||||||||||
|
Purchase commitments |
16,100 | 15,100 | 500 | 500 | — | — | — | |||||||||||||||||||||
|
Total |
$ | 73,532 | $ | 28,004 | $ | 9,874 | $ | 9,017 | $ | 7,757 | $ | 7,411 | $ | 11,469 | ||||||||||||||
The interest payment amounts above include: (1) the 4.39% fixed interest rate payments on the April 23, 2102 GE Capital equipment loan, (2) the 4.02% fixed interest rate payments on the GE Capital real estate loan, (3) the 3.68% fixed interest rate payments on the August 28, 2104 GE Capital equipment loan, (4) the 3.74% fixed interest rate payments on the November 24, 2014 GE Capital equipment loan, (5) the 2.79% fixed interest rate payments on the BofA equipment loan, (6) the estimated interest rate payment on the variable Term Loan with BMO Harris based on the four year historical average 30-day LIBOR plus 2% or 2.20% and (7) the estimated interest rate payment on the variable rate IRB based on the five year historical interest rate average for the Municipal Swap Index plus 20 basis points plus the letter of credit and remarketing fees of 0.875% resulting in a estimated rate of 1.21%.
Landec is not a party to any agreements with, or commitments to, any special purpose entities that would constitute material off-balance sheet financing other than the operating lease commitments.
Landec’s future capital requirements will depend on numerous factors, including the progress of its research and development programs; the continued development of marketing, sales and distribution capabilities; the ability of Landec to establish and maintain new collaborative and licensing arrangements; any decision to pursue additional acquisition opportunities; weather conditions that can affect the supply and price of produce, the timing and amount, if any, of payments received under licensing and research and development agreements; the costs involved in preparing, filing, prosecuting, defending and enforcing intellectual property rights; the ability to comply with regulatory requirements; the emergence of competitive technology and market forces; the effectiveness of product commercialization activities and arrangements; and other factors. If Landec’s currently available funds, together with the internally generated cash flow from operations were not sufficient to satisfy its capital needs, Landec would be required to seek additional funding through other arrangements with collaborative partners, additional bank borrowings and public or private sales of its securities. There can be no assurance that additional funds, if required, will be available to Landec on favorable terms, if at all.
Landec believes that its cash from operations, along with existing cash, cash equivalents and marketable securities will be sufficient to finance its operational and capital requirements for at least the next twelve months.
Item 7A. Quantitative and Qualitative Disclosures about Market Risk
Not significant.
Item 8. Financial Statements and Supplementary Data
See Item 15 of Part IV of this report.
Item 9. Changes in and Disagreements with Accountants on Accounting and Financial Disclosure
Not applicable.
Item 9A. Controls and Procedures
Evaluation of Disclosure Controls and Procedures
As of May 31, 2015 our management evaluated, with participation of our Chief Executive Officer and our Chief Financial Officer, the effectiveness of our disclosure controls and procedures as of the end of the period covered by this Annual Report on Form 10-K. Based on this evaluation, our Chief Executive Officer and our Chief Financial Officer have concluded that our disclosure controls and procedures are effective in ensuring that information required to be disclosed in reports filed under the Securities Exchange Act of 1934, as amended, is recorded, processed, summarized and reported within the time periods specified by the Securities and Exchange Commission, and are effective in providing reasonable assurance that information required to be disclosed by the Company in such reports is accumulated and communicated to the Company’s management, including its Chief Executive Officer and Chief Financial Officer, as appropriate to allow timely decisions regarding required disclosure.
Management’s Report on Internal Control over Financial Reporting
Our management is responsible for establishing and maintaining adequate internal control over financial reporting (as defined in Rule 13a-15(f) under the Securities Exchange Act of 1934, as amended). Our management assessed the effectiveness of our internal control over financial reporting as of May 31, 2015. In making this assessment, our management used the criteria set forth by the Committee of Sponsoring Organizations of the Treadway Commission (“COSO”) in Internal Control - Integrated Framework (2013 Framework). Our management has concluded that, as of May 31, 2015, our internal control over financial reporting was effective to provide reasonable assurance regarding the reliability of financial reporting and the preparation of financial statements for external purposes in accordance with generally accepted accounting principles.
Our management, including our Chief Executive Officer and Chief Financial Officer, does not expect that our disclosure controls and procedures or our internal control over financial reporting will prevent all error and all fraud. A control system, no matter how well conceived and operated, can provide only reasonable, not absolute, assurance that the objectives of the control system are met. Further, the design of a control system must reflect the fact that there are resource constraints, and the benefits of controls must be considered relative to their costs. Because of the inherent limitations in all control systems, no evaluation of controls can provide absolute assurance that all control issues and instances of fraud, if any, within the Company have been detected.
Our independent registered public accounting firm, Ernst & Young LLP, has issued an audit report on our internal control over financial reporting, which is included herein.
Changes in Internal Controls over Financial Reporting
There were no changes in our internal controls over financial reporting during the fiscal year ended May 31, 2015 that have materially affected, or are reasonably likely to materially affect, our internal controls over financial reporting.
REPORT OF INDEPENDENT REGISTERED PUBLIC ACCOUNTING FIRM
The Board of Directors and Stockholders of Landec Corporation
We have audited Landec Corporation and subsidiaries’ internal control over financial reporting as of May 31, 2015, based on criteria established in Internal Control—Integrated Framework issued by the Committee of Sponsoring Organizations of the Treadway Commission (2013 framework) (the COSO criteria). Landec Corporation and subsidiaries’ management is responsible for maintaining effective internal control over financial reporting, and for its assessment of the effectiveness of internal control over financial reporting included in the accompanying Management’s Report on Internal Control over Financial Reporting. Our responsibility is to express an opinion on the company’s internal control over financial reporting based on our audit.
We conducted our audit in accordance with the standards of the Public Company Accounting Oversight Board (United States). Those standards require that we plan and perform the audit to obtain reasonable assurance about whether effective internal control over financial reporting was maintained in all material respects. Our audit included obtaining an understanding of internal control over financial reporting, assessing the risk that a material weakness exists, testing and evaluating the design and operating effectiveness of internal control based on the assessed risk, and performing such other procedures as we considered necessary in the circumstances. We believe that our audit provides a reasonable basis for our opinion.
A company’s internal control over financial reporting is a process designed to provide reasonable assurance regarding the reliability of financial reporting and the preparation of financial statements for external purposes in accordance with generally accepted accounting principles. A company’s internal control over financial reporting includes those policies and procedures that (1) pertain to the maintenance of records that, in reasonable detail, accurately and fairly reflect the transactions and dispositions of the assets of the company; (2) provide reasonable assurance that transactions are recorded as necessary to permit preparation of financial statements in accordance with generally accepted accounting principles, and that receipts and expenditures of the company are being made only in accordance with authorizations of management and directors of the company; and (3) provide reasonable assurance regarding prevention or timely detection of unauthorized acquisition, use, or disposition of the company’s assets that could have a material effect on the financial statements.
Because of its inherent limitations, internal control over financial reporting may not prevent or detect misstatements. Also, projections of any evaluation of effectiveness to future periods are subject to the risk that controls may become inadequate because of changes in conditions, or that the degree of compliance with the policies or procedures may deteriorate.
In our opinion, Landec Corporation and subsidiaries maintained, in all material respects, effective internal control over financial reporting as of May 31, 2015, based on the COSO criteria.
We also have audited, in accordance with the standards of the Public Company Accounting Oversight Board (United States), the consolidated balance sheets of Landec Corporation and subsidiaries as of May 31, 2015 and May 25, 2014, and the related consolidated statements of comprehensive income, stockholders’ equity, and cash flows for each of the three years in the period ended May 31, 2015 and our report dated July 30, 2015 expressed an unqualified opinion thereon.
/s/ ERNST & YOUNG LLP
San Francisco, California
July 30, 2015
Item 9B. Other Information
None
PART III
|
Item 10. |
Directors, Executive Officers and Corporate Governance |
This information required by this item will be contained in the Registrant’s definitive proxy statement which the Registrant will file with the Commission no later than September 28, 2015 (120 days after the Registrant’s fiscal year end covered by this Report) and is incorporated herein by reference.
|
Item 11. |
Executive Compensation |
This information required by this item will be contained in the Registrant’s definitive proxy statement which the Registrant will file with the Commission no later than September 28, 2015 (120 days after the Registrant’s fiscal year end covered by this Report) and is incorporated herein by reference.
|
Item 12. |
Security Ownership of Certain Beneficial Owners and Management and Related Stockholder Matters |
This information required by this item will be contained in the Registrant’s definitive proxy statement which the Registrant will file with the Commission no later than September 28, 2015 (120 days after the Registrant’s fiscal year end covered by this Report) and is incorporated herein by reference.
|
Item 13. |
Certain Relationships and Related Transactions and Director Independence |
This information required by this item will be contained in the Registrant’s definitive proxy statement which the Registrant will file with the Commission no later than September 28, 2015 (120 days after the Registrant’s fiscal year end covered by this Report) and is incorporated herein by reference.
|
Item 14. |
Principal Accountant Fees and Services |
This information required by this item will be contained in the Registrant’s definitive proxy statement which the Registrant will file with the Commission no later than September 28, 2015 (120 days after the Registrant’s fiscal year end covered by this Report) and is incorporated herein by reference.
PART IV
|
Item 15. |
Exhibits and Financial Statement Schedules |
(a) 1. Consolidated Financial Statements of Landec Corporation
|
Page | ||
|
Report of Independent Registered Public Accounting Firm |
46 | |
|
Consolidated Balance Sheets at May 31, 2015 and May 25, 2014 |
47 | |
|
Consolidated Statements of Comprehensive Income for the Years Ended May 31, 2015, May 25, 2014 and May 26, 2013 |
48 | |
|
Consolidated Statements of Changes in Stockholders’ Equity for the Years Ended May 31, 2015, May 25, 2014 and May 26, 2013 |
49 | |
|
Consolidated Statements of Cash Flows for the Years Ended May 31, 2015, May 25, 2014 and May 26, 2013 |
50 | |
|
Notes to Consolidated Financial Statements |
51 | |
|
2. |
All schedules provided for in the applicable accounting regulations of the Securities and Exchange Commission have been omitted since they pertain to items which do not appear in the financial statements of Landec Corporation and its subsidiaries or to items which are not significant or to items as to which the required disclosures have been made elsewhere in the financial statements and supplementary notes and such schedules. |
|
|
3. |
Index of Exhibits |
78 |
|
The exhibits listed in the accompanying Index of Exhibits are filed or incorporated by reference as part of this report. |
REPORT OF INDEPENDENT REGISTERED PUBLIC ACCOUNTING FIRM
The Board of Directors and Stockholders of Landec Corporation
We have audited the accompanying consolidated balance sheets of Landec Corporation and subsidiaries as of May 31, 2015 and May 25, 2014, and the related consolidated statements of comprehensive income, stockholders’ equity, and cash flows for each of the three years in the period ended May 31, 2015. These financial statements are the responsibility of the Company's management. Our responsibility is to express an opinion on these financial statements based on our audits.
We conducted our audits in accordance with the standards of the Public Company Accounting Oversight Board (United States). Those standards require that we plan and perform the audit to obtain reasonable assurance about whether the financial statements are free of material misstatement. An audit includes examining, on a test basis, evidence supporting the amounts and disclosures in the financial statements. An audit also includes assessing the accounting principles used and significant estimates made by management, as well as evaluating the overall financial statement presentation. We believe that our audits provide a reasonable basis for our opinion.
In our opinion, the financial statements referred to above present fairly, in all material respects, the consolidated financial position of Landec Corporation and subsidiaries at May 31, 2015 and May 25, 2014, and the consolidated results of their operations and their cash flows for each of the three years in the period ended May 31, 2015, in conformity with U.S. generally accepted accounting principles.
We also have audited, in accordance with the standards of the Public Company Accounting Oversight Board (United States), Landec Corporation’s internal control over financial reporting as of May 31, 2015, based on criteria established in Internal Control-Integrated Framework issued by the Committee of Sponsoring Organizations of the Treadway Commission (2013 Framework) and our report dated July 30, 2015 expressed an unqualified opinion thereon.
/s/ ERNST & YOUNG LLP
San Francisco, California
July 30, 2015
LANDEC CORPORATION
CONSOLIDATED BALANCE SHEETS
(in thousands, except share and per share amounts)
|
ASSETS |
May 31, 2015 |
May 25, 2014 |
||||||
|
Current assets: |
||||||||
|
Cash and cash equivalents |
$ | 14,127 | $ | 14,243 | ||||
|
Accounts receivable, less allowance for doubtful accounts of $382 and $516 at May 31, 2015 and May 25, 2014, respectively |
46,173 | 44,421 | ||||||
|
Accounts receivable, related party |
306 | 304 | ||||||
|
Income taxes receivable |
152 | 2,000 | ||||||
|
Inventories, net |
25,027 | 24,735 | ||||||
|
Deferred taxes |
2,111 | 2,056 | ||||||
|
Prepaid expenses and other current assets |
5,306 | 3,170 | ||||||
|
Total current assets |
93,202 | 90,929 | ||||||
|
Investment in non-public company, non-fair value |
— | 793 | ||||||
|
Investment in non-public company, fair value |
61,500 | 39,600 | ||||||
|
Property and equipment, net |
84,465 | 74,140 | ||||||
|
Goodwill, net |
49,620 | 49,620 | ||||||
|
Trademarks/ trade names, net |
48,428 | 48,428 | ||||||
|
Customer relationships, net |
7,835 | 8,720 | ||||||
|
Other assets |
1,415 | 1,393 | ||||||
|
Total Assets |
$ | 346,465 | $ | 313,623 | ||||
| LIABILITIES AND STOCKHOLDERS’ EQUITY | ||||||||
|
Current liabilities: |
||||||||
|
Accounts payable |
$ | 34,765 | $ | 31,981 | ||||
|
Accounts payable, related party |
244 | 134 | ||||||
|
Income taxes payable |
1,229 | — | ||||||
|
Accrued compensation |
6,742 | 4,096 | ||||||
|
Other accrued liabilities |
3,983 | 4,871 | ||||||
|
Deferred revenue |
843 | 1,254 | ||||||
|
Current portion of long-term debt |
8,353 | 6,055 | ||||||
|
Total current liabilities |
56,159 | 48,391 | ||||||
|
Long-term debt |
34,166 | 28,317 | ||||||
|
Deferred taxes |
34,340 | 30,133 | ||||||
|
Other non-current liabilities |
1,691 | 2,021 | ||||||
|
Total liabilities |
126,356 | 108,862 | ||||||
|
Commitments and contingencies (Note 9) |
||||||||
|
Stockholders’ equity: |
||||||||
|
Common stock, $0.001 par value; 50,000,000 shares authorized; 26,990,490 and 26,815,253 shares issued and outstanding at May 31, 2015 and May 25, 2014, respectively |
27 | 27 | ||||||
|
Additional paid-in capital |
133,307 | 131,488 | ||||||
|
Retained earnings |
85,098 | 71,554 | ||||||
|
Total stockholders’ equity |
218,432 | 203,069 | ||||||
|
Non-controlling interest |
1,677 | 1,692 | ||||||
|
Total Equity |
220,109 | 204,761 | ||||||
|
Total Liabilities and Stockholders’ Equity |
$ | 346,465 | $ | 313,623 | ||||
See accompanying notes.
LANDEC CORPORATION
CONSOLIDATED STATEMENTS OF COMPREHENSIVE INCOME
(in thousands, except per share amounts)
|
Year Ended May 31, |
Year Ended May 25, |
Year Ended May 26, |
||||||||||
| 2015 | 2014 | 2013 | ||||||||||
|
Product sales |
$ | 539,257 | $ | 476,813 | $ | 441,708 | ||||||
|
Cost of product sales |
473,850 | 414,249 | 378,948 | |||||||||
|
Gross profit |
65,407 | 62,564 | 62,760 | |||||||||
|
Operating costs and expenses: |
||||||||||||
|
Research and development |
6,988 | 7,204 | 9,294 | |||||||||
|
Selling, general and administrative |
39,958 | 35,170 | 32,531 | |||||||||
|
Other operating expenses |
— | — | (3,933 | ) | ||||||||
|
Total operating costs and expenses |
46,946 | 42,374 | 37,892 | |||||||||
|
Operating income |
18,461 | 20,190 | 24,868 | |||||||||
|
Dividend income |
1,417 | 1,125 | 1,125 | |||||||||
|
Interest income |
315 | 260 | 179 | |||||||||
|
Interest expense |
(1,829 | ) | (1,650 | ) | (2,008 | ) | ||||||
|
Other income |
3,107 | 10,000 | 8,100 | |||||||||
|
Net income before taxes |
21,471 | 29,925 | 32,264 | |||||||||
|
Income tax expense |
(7,746 | ) | (10,583 | ) | (9,452 | ) | ||||||
|
Consolidated net income |
13,725 | 19,342 | 22,812 | |||||||||
|
Non-controlling interest |
(181 | ) | (197 | ) | (225 | ) | ||||||
|
Net income and comprehensive income applicable to common stockholders |
$ | 13,544 | $ | 19,145 | $ | 22,587 | ||||||
|
Basic net income per share |
$ | 0.50 | $ | 0.72 | $ | 0.87 | ||||||
|
Diluted net income per share |
$ | 0.50 | $ | 0.71 | $ | 0.85 | ||||||
|
Shares used in per share computation: |
||||||||||||
|
Basic |
26,884 | 26,628 | 25,830 | |||||||||
|
Diluted |
27,336 | 27,120 | 26,626 | |||||||||
See accompanying notes.
LANDEC CORPORATION
CONSOLIDATED STATEMENTS OF CHANGES IN
STOCKHOLDERS’ EQUITY
(in thousands, except share and per share amounts)
|
|
Additional |
|
Total |
|
||||||||||||||||||||
| Common Stock | Paid-in | Retained | Stockholders’ | Non-controlling | ||||||||||||||||||||
|
Shares |
Amount |
Capital |
Earnings |
Equity |
Interest |
|||||||||||||||||||
|
Balance at May 27, 2012 |
25,644,580 | $ | 26 | $ | 119,894 | $ | 29,822 | $ | 149,742 | $ | 1,816 | |||||||||||||
|
Issuance of common stock at $1.66 to $13.32 per share, net of taxes paid by Landec on behalf of employees |
597,537 | — | 3,416 | — | 3,416 | — | ||||||||||||||||||
|
Issuance of common stock for vested restricted stock units |
160,130 | — | — | — | — | — | ||||||||||||||||||
|
Taxes paid by Company for stock swaps and RSUs |
— | — | (49 | ) | — | (49 | ) | — | ||||||||||||||||
|
Stock-based compensation |
— | — | 1,695 | — | 1,695 | — | ||||||||||||||||||
|
Tax benefit from stock-based compensation expense |
— | — | 1,302 | — | 1,302 | — | ||||||||||||||||||
|
Non-controlling interest |
— | — | — | — | — | 225 | ||||||||||||||||||
|
Payments to non-controlling interest |
— | — | — | — | — | (320 | ) | |||||||||||||||||
|
Net and comprehensive income |
— | — | — | 22,587 | 22,587 | — | ||||||||||||||||||
|
Balance at May 26, 2013 |
26,402,247 | 26 | 126,258 | 52,409 | 178,693 | 1,721 | ||||||||||||||||||
|
Issuance of common stock at $5.63 to $13.32 per share, net of taxes paid by Landec on behalf of employees |
372,852 | 1 | 2,297 | — | 2,298 | — | ||||||||||||||||||
|
Issuance of common stock for vested restricted stock units |
40,154 | — | — | — | — | — | ||||||||||||||||||
|
Taxes paid by Company for stock swaps and RSUs |
— | — | (345 | ) | — | (345 | ) | — | ||||||||||||||||
|
Stock-based compensation |
— | — | 1,356 | — | 1,356 | — | ||||||||||||||||||
|
Tax benefit from stock-based compensation expense |
— | — | 1,922 | — | 1,922 | — | ||||||||||||||||||
|
Non-controlling interest |
— | — | — | — | — | 197 | ||||||||||||||||||
|
Payments to non-controlling interest |
— | — | — | — | — | (226 | ) | |||||||||||||||||
|
Net and comprehensive income |
— | — | — | 19,145 | 19,145 | — | ||||||||||||||||||
|
Balance at May 25, 2014 |
26,815,253 | 27 | 131,488 | 71,554 | 203,069 | 1,692 | ||||||||||||||||||
|
Issuance of common stock at $5.63 to $8.19 per share, net of taxes paid by Landec on behalf of employees |
102,745 | — | 122 | — | 122 | — | ||||||||||||||||||
|
Issuance of common stock for vested restricted stock units |
72,492 | — | — | — | — | — | ||||||||||||||||||
|
Taxes paid by Company for stock swaps and RSUs |
— | — | (343 | ) | — | (343 | ) | — | ||||||||||||||||
|
Stock-based compensation |
— | — | 1,577 | — | 1,577 | — | ||||||||||||||||||
|
Tax benefit from stock-based compensation expense |
— | — | 463 | — | 463 | — | ||||||||||||||||||
|
Non-controlling interest |
— | — | — | — | — | 181 | ||||||||||||||||||
|
Payments to non-controlling interest |
— | — | — | — | — | (196 | ) | |||||||||||||||||
|
Net and comprehensive income |
— | — | — | 13,544 | 13,544 | — | ||||||||||||||||||
|
Balance at May 31, 2015 |
26,990,490 | $ | 27 | $ | 133,307 | $ | 85,098 | $ | 218,432 | $ | 1,677 | |||||||||||||
See accompanying notes.
LANDEC CORPORATION
CONSOLIDATED STATEMENTS OF CASH FLOWS
(in thousands)
|
Year Ended |
Year Ended |
Year Ended |
||||||||||
|
May 31, |
May 25, |
May 26, |
||||||||||
|
Cash flows from operating activities: |
2015 |
2014 |
2013 |
|||||||||
|
Consolidated net income |
$ | 13,725 | $ | 19,342 | $ | 22,812 | ||||||
|
Adjustments to reconcile net income to net cash provided by operating activities: |
||||||||||||
|
Depreciation and amortization |
7,090 | 7,114 | 7,295 | |||||||||
|
Stock-based compensation expense |
1,577 | 1,356 | 1,695 | |||||||||
|
Deferred taxes |
4,152 | 5,605 | 6,511 | |||||||||
|
Change in investment in non-public company , fair value |
(3,900 | ) | (10,000 | ) | (8,100 | ) | ||||||
|
Tax benefit from stock based compensation |
(463 | ) | (1,922 | ) | (1,302 | ) | ||||||
|
Impairment of non-public company, non-fair value investment |
793 | — | — | |||||||||
|
Net loss (gain) on disposal of property and equipment |
(90 | ) | 329 | 217 | ||||||||
|
Earn out liability |
— | — | (3,933 | ) | ||||||||
|
Changes in assets and liabilities, net of effects from acquisitions: |
||||||||||||
|
Accounts receivable, net |
(1,752 | ) | (7,994 | ) | (4,121 | ) | ||||||
|
Accounts receivable, related party |
(2 | ) | 12 | (348 | ) | |||||||
|
Income taxes receivable |
2,313 | 5,025 | (3,754 | ) | ||||||||
|
Inventories, net |
(292 | ) | (622 | ) | (2,102 | ) | ||||||
|
Issuance of notes and advances receivable |
(5,691 | ) | (4,763 | ) | (4,173 | ) | ||||||
|
Collection of notes and advances receivable |
5,730 | 4,481 | 4,173 | |||||||||
|
Prepaid expenses and other current assets |
(2,175 | ) | (32 | ) | (278 | ) | ||||||
|
Accounts payable |
2,784 | (50 | ) | 8,826 | ||||||||
|
Accounts payable, related party |
110 | (91 | ) | 10 | ||||||||
|
Income taxes payable |
1,229 | — | — | |||||||||
|
Accrued compensation |
2,646 | 38 | (798 | ) | ||||||||
|
Other accrued liabilities |
(1,218 | ) | 3,211 | (2,486 | ) | |||||||
|
Deferred revenue |
(411 | ) | 6 | 1,086 | ||||||||
|
Net cash provided by operating activities |
26,155 | 21,045 | 21,230 | |||||||||
|
Cash flows from investing activities: |
||||||||||||
|
Purchases of property and equipment |
(17,511 | ) | (14,886 | ) | (8,877 | ) | ||||||
|
Investment in non-public company, fair value |
(18,000 | ) | — | — | ||||||||
|
Proceeds from sale of fixed assets |
1,071 | — | — | |||||||||
|
Purchase of marketable securities |
— | (1,417 | ) | (4,959 | ) | |||||||
|
Proceeds from maturities of marketable securities |
— | 2,962 | 3,414 | |||||||||
|
Net cash used in investing activities |
(34,440 | ) | (13,341 | ) | (10,422 | ) | ||||||
|
Cash flows from financing activities: |
||||||||||||
|
Proceeds from sale of common stock |
122 | 2,298 | 3,416 | |||||||||
|
Taxes paid by Company for stock swaps and RSUs |
(343 | ) | (1,271 | ) | (49 | ) | ||||||
|
Tax benefit from stock-based compensation expense |
463 | 1,922 | 1,302 | |||||||||
|
Earn out payment from Lifecore acquisition |
— | — | (9,650 | ) | ||||||||
|
Net change in other assets/liabilities |
(24 | ) | 31 | 712 | ||||||||
|
Proceeds from long term debt |
15,014 | — | — | |||||||||
|
Payments on long term debt |
(6,867 | ) | (5,933 | ) | (7,012 | ) | ||||||
|
Proceeds from lines of credit |
30,417 | 9,500 | — | |||||||||
|
Payments on lines of credit |
(30,417 | ) | (13,500 | ) | (7,666 | ) | ||||||
|
Payments to non-controlling interest. |
(196 | ) | (226 | ) | (320 | ) | ||||||
|
Net cash (used in) provided by financing activities |
8,169 | (7,179 | ) | (19,267 | ) | |||||||
|
Net increase (decrease) in cash and cash equivalents |
(116 | ) | 525 | (8,459 | ) | |||||||
|
Cash and cash equivalents at beginning of year |
14,243 | 13,718 | 22,177 | |||||||||
|
Cash and cash equivalents at end of year |
$ | 14,127 | $ | 14,243 | $ | 13,718 | ||||||
|
Supplemental disclosure of cash flows information: |
||||||||||||
|
Cash paid during the period for interest |
$ | 1,994 | $ | 1,504 | $ | 1,728 | ||||||
|
Cash paid during the period for income taxes, net of refunds received |
$ | 150 | $ | 50 | $ | 5,605 | ||||||
See accompanying notes.
LANDEC CORPORATION
NOTES TO CONSOLIDATED FINANCIAL STATEMENTS
1. Organization, Basis of Presentation, and Summary of Significant Accounting Policies
Organization
Landec Corporation and its subsidiaries (“Landec” or the “Company”) design, develop, manufacture and sell differentiated products for food and biomaterials markets and license technology applications to partners. The Company has two proprietary polymer technology platforms: 1) Intelimer® polymers, and 2) hyaluronan (“HA”) biopolymers. The Company’s HA biopolymers are proprietary in that they are specially formulated for specific customers to meet strict regulatory requirements. The Company’s polymer technologies, along with its customer relationships and trade names, are the foundation, and a key differentiating advantage upon which Landec has built its business. The Company sells specialty packaged branded Eat Smart® and GreenLine® and private label fresh-cut vegetables and whole produce to retailers, club stores and foodservice operators, primarily in the United States, Canada and Asia through its Apio, Inc. (“Apio”) subsidiary and sells HA-based biomaterials through its Lifecore Biomedical, Inc. (“Lifecore”) subsidiary.
Basis of Presentation
Basis of Consolidation
The consolidated financial statements are presented on the accrual basis of accounting in accordance with U.S. generally accepted accounting principles and include the accounts of Landec Corporation and its subsidiaries, Apio and Lifecore. All material inter-company transactions and balances have been eliminated.
Arrangements that are not controlled through voting or similar rights are reviewed under the guidance for variable interest entities (“VIEs”). A company is required to consolidate the assets, liabilities and operations of a VIE if it is determined to be the primary beneficiary of the VIE.
An entity is a VIE and subject to consolidation, if by design: a) the total equity investment at risk is not sufficient to permit the entity to finance its activities without additional subordinated financial support provided by any parties, including equity holders or b) as a group the holders of the equity investment at risk lack any one of the following three characteristics: (i) the power, through voting rights or similar rights to direct the activities of an entity that most significantly impact the entity’s economic performance, (ii) the obligation to absorb the expected losses of the entity, or (iii) the right to receive the expected residual returns of the entity. The Company reviewed the consolidation guidance and concluded that the partnership interest and equity investment in non-public companies by the Company are not VIEs.
Summary of Significant Accounting Policies
Use of Estimates
The preparation of financial statements in conformity with U.S. generally accepted accounting principles requires management to make certain estimates and judgments that affect the amounts reported in the financial statements and accompanying notes. The accounting estimates that require management’s most significant and subjective judgments include revenue recognition; sales returns and allowances; self insurance liabilities; recognition and measurement of current and deferred income tax assets and liabilities; the assessment of recoverability of long-lived assets; the valuation of intangible assets and inventory; the valuation of investments; and the valuation and recognition of stock-based compensation.
These estimates involve the consideration of complex factors and require management to make judgments. The analysis of historical and future trends can require extended periods of time to resolve and are subject to change from period to period. The actual results may differ from management’s estimates.
1. Organization, Basis of Presentation, and Summary of Significant Accounting Policies (continued)
Concentrations of Risk
Cash and cash equivalents, marketable securities, trade accounts receivable, grower advances and notes receivable are financial instruments that potentially subject the Company to concentrations of credit risk. Our Company policy limits, among other things, the amount of credit exposure to any one issuer and to any one type of investment, other than securities issued or guaranteed by the U.S. government. The Company routinely assesses the financial strength of customers and growers and, as a consequence, believes that trade receivables, grower advances and notes receivable credit risk exposure is limited. Credit losses for bad debt are provided for in the consolidated financial statements through a charge to operations. A valuation allowance is provided for known and anticipated credit losses. The recorded amounts for these financial instruments approximate their fair value.
Several of the raw materials we use to manufacture our products are currently purchased from a single source, including some monomers used to synthesize Intelimer polymers, substrate materials for our breathable membrane products and raw materials for our HA products.
The operations of Windset, in which the Company holds a 26.9% minority investment, are predominantly located in British Columbia and Santa Maria, California. Routinely, the Company evaluates the financial strength and ability for Windset to continue as a going concern.
During the fiscal year ended May 31, 2015, sales to the Company’s top five customers accounted for approximately 46% of total revenue with the top two customers from the Food Products Technology segment, Costco Wholesale Corporation (“Costco”) and Wal-mart, Inc. (“Wal-mart”) accounting for approximately 21% and 11%, respectively, of total revenues. In addition, approximately 30% of the Company’s total revenues were derived from product sales to international customers, none of which individually accounted for more than 5% of total revenues. As of May 31, 2015, the top two customers, Costco and Wal-mart represented approximately 15% and 13%, respectively, of total accounts receivable.
During the fiscal year ended May 25, 2014, sales to the Company’s top five customers accounted for approximately 42% of total revenue with the top two customers from the Food Products Technology segment, Costco Wholesale Corporation and Wal-mart, Inc. accounting for approximately 21% and 11%, respectively, of total revenues. In addition, approximately 29% of the Company’s total revenues were derived from product sales to international customers, none of which individually accounted for more than 5% of total revenues. As of May 25, 2014, the top two customers, Costco Wholesale Corporation and Wal-mart, Inc. represented approximately 16% and 12%, respectively, of total accounts receivable.
Impairment of Long-Lived Assets
Long-lived assets are reviewed for impairment whenever events or changes in circumstances indicate that their carrying amounts may not be recoverable. Recoverability of assets is measured by comparison of the carrying amount of the asset to the net undiscounted future cash flow expected to be generated from the asset. If the future undiscounted cash flows are not sufficient to recover the carrying value of the assets, the assets’ carrying value is adjusted to fair value. The Company regularly evaluates its long-lived assets for indicators of possible impairment.
Financial Instruments
The Company’s financial instruments are primarily composed of marketable securities, commercial-term trade payables, grower advances, notes receivable and debt instruments. For short-term instruments, the historical carrying amount approximates the fair value of the instrument. The fair value of long-term debt and lines of credit approximates their carrying value. Fair values for long-term financial instruments not readily marketable are estimated based upon discounted future cash flows at prevailing market interest rates. Based on these assumptions, management believes the fair market values of the Company’s financial instruments are not significantly different from their recorded amounts as of May 31, 2015 and May 25, 2014.
1. Organization, Basis of Presentation, and Summary of Significant Accounting Policies (continued)
Accounts Receivable and Sales Returns and Allowance for Doubtful Accounts
The Company carries its accounts receivable at their face amounts less an allowance for estimated sales returns and doubtful accounts. Sales return allowances are estimated based on historical sales return amounts. Further, on a periodic basis, the Company evaluates its accounts receivable and establishes an allowance for doubtful accounts and estimated losses resulting from the inability of its customers to make required payments. The allowance for doubtful accounts is determined based on review of the overall condition of accounts receivable balances and review of significant past due accounts. The allowance for doubtful accounts is based on specific identification of past due amounts and for accounts over 90-days past due. The changes in the Company’s allowance for sales returns and doubtful accounts are summarized in the following table (in thousands).
|
Balance at beginning of period |
Additions from acquisitions and adjustments charged to revenue and expenses |
Write offs, net of recoveries |
Balance at end of period |
|||||||||||||
|
Year ended May 26, 2013 |
$ | 512 | $ | 109 | $ | (38 | ) | $ | 583 | |||||||
|
Year ended May 25, 2014 |
$ | 583 | $ | 143 | $ | (210 | ) | $ | 516 | |||||||
|
Year ended May 31, 2015 |
$ | 516 | $ | — | $ | (134 | ) | $ | 382 | |||||||
Revenue Recognition
Revenue from product sales is recognized when there is persuasive evidence that an arrangement exists, title has transferred, the price is fixed and determinable, and collectability is reasonably assured. Allowances are established for estimated uncollectible amounts, product returns, and discounts based on specific identification and historical losses.
Apio’s Food Products Technology revenues generally consist of revenues generated from the sale of specialty packaged fresh-cut and whole value-added processed vegetable products that are generally washed and packaged in our proprietary packaging and sold under Apio’s Eat Smart and GreenLine brands and various private labels. Revenue is generally recognized upon shipment of these products to customers. The Company takes title to all produce it trades and/or packages, and therefore, records revenues and cost of sales at gross amounts in the Consolidated Statements of Comprehensive Income.
In addition, Food Products Technology value-added revenues include the revenues generated from Apio Cooling, LP, a vegetable cooling operation in which Apio is the general partner with a 60% ownership position and from the sale of BreatheWay® packaging to license partners. Revenue is recognized on the vegetable cooling operations as cooling and storage services are provided to our customers. Sales of BreatheWay packaging are recognized when shipped to our customers.
Apio’s Food Export revenues consist of revenues generated from the purchase and sale of primarily whole commodity fruit and vegetable products to Asia by Cal-Ex. As most Cal-Ex customers are in countries outside of the U.S., title transfers and revenue is generally recognized upon arrival of the shipment in the foreign port. Apio records revenue equal to the sale price to third parties because it takes title to the product while in transit.
Our HA-based Biomaterials business principally generates revenue through the sale of products containing HA. Lifecore primarily sells products to customers in three medical areas: (1) Ophthalmic, which represented approximately 60% of Lifecore’s revenues in fiscal year 2015, (2) Orthopedic, which represented approximately 20% of Lifecore’s revenues in fiscal year 2015 and (3) Veterinary/Other. The vast majority of revenues from our HA-based Biomaterials business are recognized upon shipment.
1. Organization, Basis of Presentation, and Summary of Significant Accounting Policies (continued)
Lifecore’s business development revenues, a portion of which are included in all three medical areas, are related to contract research and development (R&D) services and multi-element arrangement services with customers where the Company provides products and/or services in a bundled arrangement.
Contract R&D revenue is recorded as earned, based on the performance requirements of the contract. Non-refundable contract fees for which no further performance obligations exist, and there is no continuing involvement by the Company, are recognized on the earlier of when the payment is received or collection is assured.
For sales arrangements that contain multiple elements, the Company splits the arrangement into separate units of accounting if the individually delivered elements have value to the customer on a standalone basis. The Company also evaluates whether multiple transactions with the same customer or related party should be considered part of a multiple element arrangement, whereby the Company assesses, among other factors, whether the contracts or agreements are negotiated or executed within a short time frame of each other or if there are indicators that the contracts are negotiated in contemplation of each other. The Company then allocates revenue to each element based on a selling price hierarchy. The relative selling price for a deliverable is based on its vendor-specific objective evidence (VSOE), if available, third-party evidence (TPE), if VSOE is not available, or estimated selling price, if neither VSOE nor TPE is available. The Company then recognizes revenue on each deliverable in accordance with its policies for product and service revenue recognition. The Company is not typically able to determine VSOE or TPE, and therefore, uses the estimated selling price to allocate revenue between the elements of an arrangement.
The Company limits the amount of revenue recognition for delivered elements to the amount that is not contingent on the future delivery of products or services or future performance obligations or subject to customer-specific cancellation rights. The Company evaluates each deliverable in an arrangement to determine whether it represents a separate unit of accounting. A deliverable constitutes a separate unit of accounting when it has stand-alone value, and for an arrangement that includes a general right of return relative to the delivered products or services, delivery or performance of the undelivered product or service is considered probable and is substantially controlled by the Company. The Company considers a deliverable to have stand-alone value if the product or service is sold separately by the Company or another vendor or could be resold by the customer. Further, the revenue arrangements generally do not include a general right of return relative to delivered products. Where the aforementioned criteria for a separate unit of accounting are not met, the deliverable is combined with the undelivered element(s) and treated as a single unit of accounting for the purposes of allocation of the arrangement consideration and revenue recognition. The Company allocates the total arrangement consideration to each separable element of an arrangement based upon the relative selling price of each element. Allocation of the consideration is determined at arrangement inception on the basis of each unit’s relative selling price. In instances where the Company has not established fair value for any undelivered element, revenue for all elements is deferred until delivery of the final element is completed and all recognition criteria are met.
Licensing revenue is recognized in accordance with prevailing accounting guidance. Initial license fees are deferred and amortized to revenue over the period of the agreement when a contract exists, the fee is fixed and determinable, and collectability is reasonably assured. Noncancellable, nonrefundable license fees are recognized over the period of the agreement, including those governing research and development activities and any related supply agreement entered into concurrently with the license when the risk associated with commercialization of a product is non-substantive at the outset of the arrangement.
From time to time, the Company offers customers sales incentives, which include volume rebates and discounts. These amounts are estimated on a quarterly basis and recorded as a reduction of revenue.
1. Organization, Basis of Presentation, and Summary of Significant Accounting Policies (continued)
A summary of revenues by type of revenue arrangement as described above is as follows (in thousands):
|
Year ended May 31, 2015 |
Year ended May 25, 2014 |
Year ended May 26, 2013 |
||||||||||
|
Recorded upon shipment |
$ | 465,484 | $ | 398,938 | $ | 359,518 | ||||||
|
Recorded upon acceptance in foreign port |
67,714 | 69,710 | 78,442 | |||||||||
|
Revenue from multiple element arrangements |
4,253 | 6,811 | 1,773 | |||||||||
|
Revenue from license fees, R&D contracts and royalties/profit sharing |
1,806 | 1,354 | 1,975 | |||||||||
|
Total |
$ | 539,257 | $ | 476,813 | $ | 441,708 | ||||||
Shipping and Handling Costs
Amounts billed to third-party customers for shipping and handling are included as a component of revenues. Shipping and handling costs incurred are included as a component of cost of products sold and represent costs incurred to ship product from the sourcing locations to the end consumer markets.
Other Accounting Policies and Disclosures
Cash and Cash Equivalents
The Company records all highly liquid securities with three months or less from date of purchase to maturity as cash equivalents. Cash equivalents consist mainly of certificate of deposits (CDs), money market funds and U.S. Treasuries. The market value of cash equivalents approximates their historical cost given their short-term nature.
Inventories
Inventories are stated at the lower of cost (using the first-in, first-out method) or market. As of May 31, 2015 and May 25, 2014 inventories consisted of (in thousands):
|
May 31, 2015 |
May 25, 2014 |
|||||||
|
Finished goods |
$ | 13,271 | $ | 11,111 | ||||
|
Raw materials |
9,879 | 10,376 | ||||||
|
Work in progress |
1,877 | 3,248 | ||||||
|
Inventories, net |
$ | 25,027 | $ | 24,735 | ||||
If the cost of the inventories exceeds their net realizable value, provisions are recorded currently to reduce them to net realizable value. The Company also provides a provision for slow moving and obsolete inventories based on the estimate of demand for its products.
Advertising Expense
Advertising expenditures for the Company are expensed as incurred. Advertising expense for the Company for fiscal years 2015, 2014 and 2013 was $1.3 million, $447,000 and $445,000, respectively.
Notes and Advances Receivable
Apio issues notes and makes advances to produce growers for their crop and harvesting costs primarily for the purpose of sourcing crops for Apio's business. Notes receivable and advances are generally recovered during the growing season (less than one year) using proceeds from the crops sold to Apio. Notes are interest bearing obligations, evidenced by contracts and notes receivable. These notes and advances receivable are secured by perfected liens on crops, have terms that range from three to nine months, and are reviewed at least quarterly for collectability. A reserve is established for any note or advance deemed to not be fully collectible based upon an estimate of the crop value or the fair value of the security for the note or advance. There were no notes or advances outstanding at May 31, 2015.
1. Organization, Basis of Presentation, and Summary of Significant Accounting Policies (continued)
Related Party Transactions
The Company sold products to and earned license fees from Windset Holding 2010 Ltd., a Canadian corporation (“Windset”) during the last three fiscal years. During fiscal years 2015, 2014 and 2013, the Company recognized related party revenues of $537,000, $365,000, and $316,000, respectively. These amounts have been included in product sales in the accompanying Consolidated Statements of Comprehensive Income, from the sale of products to and license fees from Windset. The related receivable balances of $306,000 and $304,000 from Windset are included in accounts receivable, related party in the accompanying Consolidated Balance Sheets as of May 31, 2015 and May 25, 2014, respectively.
Additionally, unrelated to the revenue transactions above, the Company purchases produce from Windset for sale to third parties. During fiscal years 2015, 2014 and 2013, the Company recognized related party cost of product sales of $1.6 million, $1.6 million and $2.1 million, respectively, in the accompanying Consolidated Statements of Comprehensive Income, from the sale of products purchased from Windset. The related accounts payable of $244,000 and $134,000 from Windset are included in accounts payable, related party in the accompanying Consolidated Balance Sheets as of May 31, 2015 and May 25, 2014, respectively.
All related party transactions are monitored quarterly by the Company and approved by the Audit Committee of the Board of Directors.
Property and Equipment
Property and equipment are stated at cost. Expenditures for major improvements are capitalized while repairs and maintenance are charged to expense. Depreciation is expensed on a straight-line basis over the estimated useful lives of the respective assets, generally three to forty years for buildings and leasehold improvements and three to twenty years for furniture and fixtures, computers, capitalized software, capitalized leases, machinery, equipment and autos. Leasehold improvements are amortized on a straight-line basis over the lesser of the economic life of the improvement or the life of the lease.
The Company capitalizes software development costs for internal use in accordance with accounting guidance. Capitalization of software development costs begins in the application development stage and ends when the asset is placed into service. The Company amortizes such costs using the straight-line basis over estimated useful lives of three to seven years. During fiscal years 2015 and 2014, the Company capitalized $509,000 and $913,000 in software development costs, respectively. During fiscal year 2013, the Company did not capitalize any software development costs.
Long-Lived Assets
The Company’s Long-Lived Assets consist of property, plant and equipment, and intangible assets. Intangible assets are comprised of customer relationships with an estimated useful life of twelve to thirteen years (the “finite-lived intangible assets”) and trademarks/trade names and goodwill with indefinite lives (collectively, “the indefinite-lived intangible assets”), which the Company recognized in accordance with accounting guidance (i) upon the acquisition of GreenLine Holding Company (“GreenLine”) by Apio in April 2012, (ii) upon the acquisition of Lifecore in April 2010 and (iii) upon the acquisition of Apio in December 1999. Accounting guidance defines goodwill as “the excess of the cost of an acquired entity over the net of the estimated fair values of the assets acquired and the liabilities assumed at date of acquisition.” All intangible assets, including goodwill, associated with the acquisition of Lifecore was allocated to the HA-based Biomaterials reporting unit and the acquisitions of Apio and GreenLine were allocated to the Food Products Technology reporting unit pursuant to accounting guidance based upon the allocation of assets and liabilities acquired and consideration paid for each reporting unit. As of May 31, 2015, the HA-based Biomaterials reporting unit had $13.9 million of goodwill and the Food Products Technology reporting unit had $35.7 million of goodwill.
1. Organization, Basis of Presentation, and Summary of Significant Accounting Policies (continued)
Property, plant and equipment and finite-lived intangible assets are reviewed for possible impairment whenever events or changes in circumstances occur that indicate that the carrying amount of an asset (or asset group) may not be recoverable. The Company’s impairment review requires significant management judgment including estimating the future success of product lines, future sales volumes, revenue and expense growth rates, alternative uses for the assets and estimated proceeds from the disposal of the assets. The Company conducts quarterly reviews of idle and underutilized equipment, and reviews business plans for possible impairment indicators. Impairment is indicated when the carrying amount of the asset (or asset group) exceeds its estimated future undiscounted cash flows and the impairment is viewed as other than temporary. When impairment is indicated, an impairment charge is recorded for the difference between the asset’s book value and its estimated fair value. Depending on the asset, estimated fair value may be determined either by use of a discounted cash flow model or by reference to estimated selling values of assets in similar condition. The use of different assumptions would increase or decrease the estimated fair value of assets and would increase or decrease any impairment measurement.
The Company tests its indefinite-lived intangible assets for impairment at least annually, in accordance with accounting guidance. For all indefinite-lived assets, including goodwill, the Company performs a qualitative analysis in accordance with ASC 350-30-35. Application of the impairment tests for indefinite-lived intangible assets requires significant judgment by management, including identification of reporting units, assignment of assets and liabilities to reporting units, assignment of intangible assets to reporting units, which judgments are inherently uncertain.
During the fiscal quarter ended February 23, 2014, the Company voluntarily changed the date of its annual goodwill and indefinite-lived intangible assets impairment testing from the last day of the fiscal month in July to the first day of the fiscal fourth quarter. This voluntary change was preferable under the circumstances as it provides the Company with additional time to complete its annual goodwill and indefinite-lived intangible asset impairment testing in advance of its year-end reporting and results in better alignment with the Company’s strategic planning and forecasting process. This change was not applied retrospectively as it was impracticable to do so because retrospective application would have required application of significant estimates and assumptions with the use of hindsight. Accordingly, the change was applied prospectively.
The Company tested its indefinite-lived intangible assets, including goodwill, for impairment as of March 2, 2015 and determined that no adjustments to the carrying values of these assets were necessary as of that date. As a result, it was not necessary to perform the two-step quantitative goodwill impairment test at the time. Subsequent to the 2015 annual impairment test, there have been no significant events or circumstances affecting the valuation of goodwill. As of May 31, 2015, there were no events or changes in circumstances that indicated that the carrying amount of intangible assets may not be recoverable or that goodwill should be tested for impairment. Therefore, there was no impairment to the carrying value of the Company's goodwill. There were no impairment losses for goodwill during fiscal years 2014 and 2013.
On a quarterly basis, the Company considers the need to update its most recent annual tests for possible impairment of its indefinite-lived intangible assets, based on management’s assessment of changes in its business and other economic factors since the most recent annual evaluation. Such changes, if significant or material, could indicate a need to update the most recent annual tests for impairment of the indefinite-lived intangible assets during the current period. The results of these tests could lead to write-downs of the carrying values of these assets in the current period.
In the annual impairment test, the Company first assess qualitative factors to determine whether it is necessary to perform the two-step quantitative goodwill impairment test. In assessing the qualitative factors, management considers the impact of these key factors: macro-economic conditions, industry and market environment, overall financial performance of the Company, cash flow from operating activities, market capitalization and stock price. If management determines as a result of the qualitative assessment that it is more likely than not (that is, a likelihood of more than 50 percent) that the fair value of a reporting unit is less than its carrying amount, then the quantitative test is required. Otherwise, no further testing is required.
In a quantitative test, the Company compares the fair value of indefinite-lived intangible assets to its carrying value including goodwill. The Company determines the fair value using both an income approach and a market approach. Under the income approach, fair value is determined based on estimated future cash flows, discounted by an estimated weighted-average cost of capital, which reflects the overall level of inherent risk of the Company and the rate of return an outside investor would expect to earn. Under the market-based approach, information regarding the Company is utilized as well as publicly available industry information to determine earnings multiples that are used to value the Company. If the carrying value of the Company exceeds its fair value, the Company will determine the amount of impairment loss by comparing the implied fair value of goodwill with the carrying value of goodwill. An impairment charge is recognized for the excess of the carrying value of goodwill over its implied fair value.
Investment in Non-Public Company
In December 2005, Landec entered into a licensing agreement with Aesthetic Sciences for the exclusive rights to use Landec's Intelimer® materials technology for the development of dermal fillers worldwide under the agreement. The Company received shares of preferred stock in exchange for the license. As of March 1, 2015, the Company concluded that its investment in Aesthetic Sciences was other than temporarily impaired, and therefore wrote off its remaining $793,000 investment (see Note 2).
On February 15, 2011, the Company made an investment in Windset which is reported as an investment in non-public company, fair value, in the accompanying Consolidated Balance Sheets as of May 31, 2015 and May 25, 2014. The Company has elected to account for its investment in Windset under the fair value option (see Note 2).
Partial Self-Insurance on Employee Health Plan
The Company provides health insurance benefits to eligible employees under a self-insured plan whereby the Company pays actual medical claims subject to certain stop loss limits. The Company records self-insurance liabilities based on actual claims filed and an estimate of those claims incurred but not reported. Any projection of losses concerning the Company's liability is subject to a high degree of variability. Among the causes of this variability are unpredictable external factors such as inflation rates, changes in severity, benefit level changes, medical costs, and claims settlement patterns. This self-insurance liability is included in accrued liabilities and represents management's best estimate of the amounts that have not been paid as of May 31, 2015. It is reasonably possible that the expense the Company ultimately incurs could differ and adjustments to future reserves may be necessary.
Deferred Revenue
Cash received in advance of services performed are recorded as deferred revenue. At May 31, 2015, $843,000 was recognized as advances from customers. At May 25, 2014, $1.3 million was recognized as advances from customers.
Non-Controlling Interest
The Company reports all non-controlling interests as a separate component of stockholders’ equity. The non-controlling interest’s share of the income or loss of the consolidated subsidiary is reported as a separate line item in our Consolidated Statements of Comprehensive Income, following the consolidated net income caption.
In connection with the acquisition of Apio, Landec acquired Apio’s 60% general partner interest in Apio Cooling, a California limited partnership. Apio Cooling is included in the consolidated financial statements of Landec for all periods presented. The non-controlling interest balance of $1.7 at both May 31, 2015 and May 25, 2014 was comprised of the non-controlling limited partners’ interest in Apio Cooling.
1. Organization, Basis of Presentation, and Summary of Significant Accounting Policies (continued)
Income Taxes
The Company accounts for income taxes in accordance with accounting guidance which requires that deferred tax assets and liabilities be recognized using enacted tax rates for the effect of temporary differences between the book and tax basis of recorded assets and liabilities. The Company maintains valuation allowances when it is likely that all or a portion of a deferred tax asset will not be realized. Changes in valuation allowances from period to period are included in the Company’s income tax provision in the period of change. In determining whether a valuation allowance is warranted, the Company takes into account such factors as prior earnings history, expected future earnings, unsettled circumstances that, if unfavorably resolved, would adversely affect utilization of a deferred tax asset, carryback and carryforward periods, and tax strategies that could potentially enhance the likelihood of realization of a deferred tax asset. At May 31, 2015, the Company had a $1.2 million valuation allowance against its deferred tax assets.
In addition to valuation allowances, the Company establishes accruals for uncertain tax positions. The tax-contingency accruals are adjusted in light of changing facts and circumstances, such as the progress of tax audits, case law and emerging legislation. The Company recognizes interest and penalties related to uncertain tax positions as a component of income tax expense. The Company’s effective tax rate includes the impact of tax-contingency accruals as considered appropriate by management.
A number of years may elapse before a particular matter, for which the Company has accrued, is audited and finally resolved. The number of years with open tax audits varies by jurisdiction. While it is often difficult to predict the final outcome or the timing of resolution of any particular tax matter, the Company believes its tax-contingency accruals are adequate to address known tax contingencies. Favorable resolution of such matters could be recognized as a reduction to the Company’s effective tax rate in the year of resolution. Unfavorable settlement of any particular issue could increase the effective tax rate. Any resolution of a tax issue may require the use of cash in the year of resolution. The Company’s tax-contingency accruals are recorded in other accrued liabilities in the accompanying Consolidated Balance Sheets.
Per Share Information
Accounting guidance requires the presentation of basic and diluted earnings per share. Basic earnings per share excludes any dilutive effects of options, warrants and convertible securities and is computed using the weighted average number of common shares outstanding. Diluted earnings per share reflect the potential dilution as if securities or other contracts to issue common stock were exercised or converted into common stock. Diluted common equivalent shares consist of stock options and restricted stock units, calculated using the treasury stock method.
The following table sets forth the computation of diluted net income per share (in thousands, except per share amounts):
|
Fiscal Year Ended May 31, 2015 |
Fiscal Year Ended May 25, 2014 |
Fiscal Year Ended May 26, 2013 |
||||||||||
|
Numerator: |
||||||||||||
|
Net income applicable to Common Stockholders |
$ | 13,544 | $ | 19,145 | $ | 22,587 | ||||||
|
Denominator: |
||||||||||||
|
Weighted average shares for basic net income per share |
26,884 | 26,628 | 25,830 | |||||||||
|
Effect of dilutive securities: |
||||||||||||
|
Stock options and restricted stock units |
452 | 492 | 796 | |||||||||
|
Weighted average shares for diluted net income per share |
27,336 | 27,120 | 26,626 | |||||||||
|
Diluted net income per share |
$ | 0.50 | $ | 0.71 | $ | 0.85 | ||||||
Options to purchase 371,115, 333,993 and 88,022 shares of Common Stock at a weighted average exercise price of $14.02, $14.15 and $12.80 per share were outstanding during fiscal years ended May 31, 2015, May 25, 2014 and May 26, 2013, respectively, but were not included in the computation of diluted net income per share because the options’ exercise price were greater than the average market price of the Common Stock and, therefore, their inclusion would be antidilutive.
1. Organization, Basis of Presentation, and Summary of Significant Accounting Policies (continued)
Cost of Sales
The Company includes in cost of sales all the costs related to the sale of products. These costs include the following: raw materials (including produce, seeds, packaging, syringes and fermentation and purification supplies), direct labor, overhead (including indirect labor, depreciation, and facility related costs) and shipping and shipping related costs.
Research and Development Expenses
Costs related to both research and development contracts and Company-funded research is included in research and development expenses. Research and development costs are primarily comprised of salaries and related benefits, supplies, travel expenses, consulting expenses and corporate allocations.
Accounting for Stock-Based Compensation
The Company records compensation expense for stock-based awards issued to employees and directors in exchange for services provided based on the estimated fair value of the awards on their grant dates and is recognized over the required service periods (generally the vesting period). For nonstatutory options, the cash flows resulting from the tax benefit due to tax deductions in excess of the compensation expense recognized for those options (excess tax benefit) are classified as financing activities within the statement of cash flows. The Company’s stock-based awards include stock option grants and restricted stock unit awards (“RSUs”).
The following table summarizes the stock-based compensation for options and RSUs (in thousands):
|
Fiscal Year Ended May 31, 2015 |
Fiscal Year Ended May 25, 2014 |
Fiscal Year Ended May 26, 2013 |
||||||||||
|
Options |
$ | 561 | $ | 558 | $ | 788 | ||||||
|
RSUs |
1,016 | 798 | 907 | |||||||||
|
Total stock-based compensation expense |
$ | 1,577 | $ | 1,356 | $ | 1,695 | ||||||
The following table summarizes the stock-based compensation by income statement line item (in thousands):
|
Fiscal Year Ended May 31, 2015 |
Fiscal Year Ended May 25, 2014 |
Fiscal Year Ended May 26, 2013 |
||||||||||
|
Research and development |
$ | 38 | $ | 39 | $ | 718 | ||||||
|
Sales, general and administrative |
1,539 | 1,317 | 977 | |||||||||
|
Total stock-based compensation expense |
$ | 1,577 | $ | 1,356 | $ | 1,695 | ||||||
The estimated fair value for stock options, which determines the Company’s calculation of compensation expense, is based on the Black-Scholes option pricing model. RSUs are valued at the closing market price of the Company’s common stock on the date of grant. The Company uses the straight line single option method to calculate and recognize the fair value of stock-based compensation arrangements. In addition, the Company uses historical data to estimate pre-vesting forfeitures and records stock-based compensation expense only for those awards that are expected to vest and revises those estimates in subsequent periods if the actual forfeitures differ from the prior estimates.
The Black-Scholes option pricing model requires the input of highly subjective assumptions, including the expected stock price volatility and expected life of option awards, which have a significant impact on the fair value estimates. As of May 31, 2015, May 25, 2014 and May 26, 2013, the fair value of stock option grants was estimated using the following weighted average assumptions:
1. Organization, Basis of Presentation, and Summary of Significant Accounting Policies (continued)
|
Fiscal Year Ended May 31, 2015 |
Fiscal Year Ended May 25, 2014 |
Fiscal Year Ended May 26, 2013 |
||||||||||
|
Expected life (in years) |
3.25 | 3.50 | 3.76 | |||||||||
|
Risk-free interest rate |
1.00 | % | 0.71 | % | 0.48 | % | ||||||
|
Volatility |
0.32 | 0.41 | 0.53 | |||||||||
|
Dividend yield |
0 | % | 0 | % | 0 | % | ||||||
The weighted average estimated fair value of Landec employee stock options granted at grant date market prices during the fiscal years ended May 31, 2015, May 25, 2014 and May 26, 2013 was $3.42, $4.41 and $3.57 per share, respectively. No stock options were granted above or below grant date market prices during the fiscal years ended May 31, 2015, May 25, 2014 and May 26, 2013.
Fair Value Measurements
The Company uses fair value measurement accounting for financial assets and liabilities and for financial instruments and certain other items measured at fair value. The Company has elected the fair value option for its investment in a non-public company (see Note 2 to the Consolidated Financial Statements). The Company has not elected the fair value option for any of its other eligible financial assets or liabilities.
The accounting guidance established a three-tier hierarchy for fair value measurements, which prioritizes the inputs used in measuring fair value as follows:
Level 1 – observable inputs such as quoted prices for identical instruments in active markets.
Level 2 – inputs other than quoted prices in active markets that are observable either directly or indirectly through corroboration with observable market data.
Level 3 – unobservable inputs in which there is little or no market data, which would require the Company to develop its own assumptions.
As of May 31, 2015, the only asset of the Company that was measured at fair value on a recurring basis was its minority interest investment in Windset.
The Company has elected the fair value option of accounting for its investment in Windset. The calculation of fair value utilizes significant unobservable inputs in the discounted cash flow models, including projected cash flows, growth rates and discount rates. As a result, the Company’s investment in Windset is considered to be a Level 3 measurement investment. The change in the fair market value of the Company’s investment in Windset for the fiscal years ended May 31, 2015 and May 25, 2014 was due to the Company’s 26.9% and 20.1%, respectively, minority interest in the change in the fair market value of Windset during those periods. In determining the fair value of the investment in Windset, the Company utilizes the following significant unobservable inputs in the discounted cash flow models:
|
At May 31, 2015 |
At May 25, 2014 |
|||||||
|
Annual consolidated revenue growth rates |
4 | % | 4 | % | ||||
|
Annual consolidated expense growth rates |
4 | % | 4 | % | ||||
|
Consolidated income tax rates |
15 | % | 15 | % | ||||
|
Consolidated discount rates |
15% to 21 | % | 16% to 22 | % | ||||
The revenue growth, expense growth and income tax rate assumptions, consider the Company's best estimate of the trends in those items over the discount period. The discount rate assumption takes into account the risk-free rate of return, the market equity risk premium and the company’s specific risk premium and then applies an additional discount for lack of marketability of the underlying securities. The discounted cash flow valuation model used by the Company has the following sensitivity to changes in inputs and assumptions (in thousands):
1. Organization, Basis of Presentation, and Summary of Significant Accounting Policies (continued)
|
Impact on value of Windset investment as of May 31, 2015 |
||||
|
10% increase in revenue growth rates |
$ | 2,300 | ||
|
10% increase in expense growth rates |
$ | (1,200 | ) | |
|
10% increase in income tax rates |
$ | (100 | ) | |
|
10% increase in discount rates |
$ | (1,500 | ) | |
Imprecision in estimating unobservable market inputs can affect the amount of gain or loss recorded for a particular position. The use of different methodologies or assumptions to determine the fair value of certain financial instruments could result in a different estimate of fair value at the reporting date.
The following table summarizes the fair value of the Company’s assets and liabilities that are measured at fair value on a recurring basis, as of May 31, 2015 and May 25, 2014 (in thousands):
|
Fair Value at May 31, 2015 |
Fair Value at May 25, 2014 |
|||||||||||||||||||||||
|
Assets: |
Level 1 |
Level 2 |
Level 3 |
Level 1 |
Level 2 |
Level 3 |
||||||||||||||||||
|
Marketable securities |
$ | - | $ | - | $ | - | $ | - | $ | - | $ | - | ||||||||||||
|
Investment in private company |
- | - | 61,500 | - | - | 39,600 | ||||||||||||||||||
|
Total |
$ | - | $ | - | $ | 61,500 | $ | - | $ | - | $ | 39,600 | ||||||||||||
|
Liabilities: |
||||||||||||||||||||||||
|
Interest rate swap |
- | - | - | - | 44 | - | ||||||||||||||||||
|
Total |
$ | - | $ | - | $ | - | $ | - | $ | 44 | $ | - | ||||||||||||
Recent Accounting Pronouncements
Debt Issuance Costs
In April 2015, the Financial Accounting Standards Board (“FASB”) issued Accounting Standard Update (“ASU”) No. 2015-03, Simplifying the Presentation of Debt Issuance Cost ("ASU 2015-03"), which requires that debt issuance costs related to a recognized debt liability be presented in the balance sheet as a direct deduction from the carrying amount of that debt liability, consistent with debt discounts. The new guidance is effective for the Company beginning in the fourth quarter of fiscal year 2016, with early adoption permitted. Management is currently evaluating the impact that adoption of ASU 2015-03 will have on the Company’s Consolidated Financial Statements and disclosures.
Revenue Recognition
In May 2014, the FASB issued Accounting Standard Update (“ASU”) No. 2014-09, Revenue from Contracts with Customers (Topic 606) ("ASU 2014-09"), which outlines a single comprehensive model for entities to use in accounting for revenue arising from contracts with customers and supersedes most current revenue recognition guidance, including industry-specific guidance. The standard requires entities to recognize revenue to depict the transfer of promised goods or services to customers in an amount that reflects the consideration to which the entity expects to be entitled in exchange for those goods or services. The new guidance also includes a cohesive set of disclosure requirements intended to provide users of financial statements with comprehensive information about the nature, amount, timing, and uncertainty of revenue and cash flows arising from a company’s contracts with customers. ASU 2014-09 will be effective beginning the first quarter of the Company's fiscal year 2019 and early application is not permitted. The standard allows for either “full retrospective” adoption, meaning the standard is applied to all of the periods presented, or “modified retrospective” adoption, meaning the standard is applied only to the most current period presented in the financial statements. Management is currently evaluating the effect ASU 2014-09 will have on the Company's Consolidated Financial Statements and disclosures.
2. Investments in non-public companies
Aesthetic Sciences
In December 2005, Landec entered into a licensing agreement with Aesthetic Sciences for the exclusive rights to use Landec's Intelimer® materials technology for the development of dermal fillers worldwide under the agreement. The Company received shares of preferred stock in exchange for the license. Aesthetic Sciences sold the rights to its
2. Investments in non-public companies (continued)
Smartfil Injector System on July 16, 2010. The royalty period from the sale of the Smartfil Injector System began November 1, 2014 and as a result the Company obtained for the first time during the third quarter of fiscal year 2015 financial information for the products for which a royalty is due Aesthetic Sciences. Based on the review of this historical financial information and discussions with the acquirer, the Company concluded that its investment in Aesthetic Sciences was other than temporarily impaired, and therefore wrote off its remaining $793,000 investment in Aesthetic Sciences as of March 1, 2015 and is included in other income in the Consolidated Statements of Comprehensive Income.
Windset
On February 15, 2011, Apio entered into a share purchase agreement (the “Windset Purchase Agreement”) with Windset. Pursuant to the Windset Purchase Agreement, Apio purchased from Windset 150,000 Senior A preferred shares for $15 million and 201 common shares for $201. On July 15, 2014, Apio increased its investment in Windset by purchasing from the Newell Capital Corporation an additional 68 shares of common stock and 51,211 shares of junior preferred stock of Windset for $11.0 million. After this purchase, the Company’s common shares represent a 26.9% ownership interest in Windset. The non-voting Senior A preferred shares yield a cash dividend of 7.5% annually. The dividend is payable within 90 days of each anniversary of the execution of the Windset Purchase Agreement. The non-voting junior preferred stock does not yield a dividend unless declared by the Board of Directors of Windset and no such dividend has been declared.
The Windset Purchase Agreement includes a put and call option, which can be exercised on the sixth anniversary of the Windset Purchase Agreement whereby Apio can exercise the put to sell its common, Senior A preferred shares and junior preferred shares to Windset, or Windset can exercise the call to purchase those shares from Apio, in either case, at a price equal to 26.9% of the appreciation in the fair market value of Windset’s common shares from the date of the Company’s investment through the put and call date, plus the liquidation value of the preferred shares of $20.1 million ($15 million for the Senior A preferred shares and $5.1 million for the junior preferred shares). Under the terms of the arrangement with Windset, the Company is entitled to designate one of five members on the Board of Directors of Windset.
On October 29, 2014, Apio further increased its investment in Windset by purchasing 70,000 shares of Senior B preferred shares for $7.0 million. The Senior B Preferred Stock pays an annual dividend of 7.5% on the amount outstanding at each anniversary date of the Windset Purchase Agreement. The Senior B shares purchased by Apio have a put feature whereby Apio can sell back to Windset $1.5 million of shares on the first anniversary, an additional $2.75 million of shares on the second anniversary and the remaining $2.75 million on the third anniversary. After the third anniversary, Apio may at any time put any or all of the shares not previously sold back to Windset. At any time on or after February 15, 2017, Windset has the right to call any or all of the outstanding common shares and at such time must also call the same proportion of Senior A preferred shares, Senior B preferred shares and junior preferred shares owned by Apio. Windset’s partial call provision is restricted such that a partial call cannot result in Apio holding less than 10% of Windset’s common shares outstanding.
The investment in Windset does not qualify for equity method accounting as the investment does not meet the criteria of in-substance common stock due to returns through the annual dividend on the non-voting senior preferred shares that are not available to the common stock holders. As the put and call options require the Purchased Shares to be put or called in equal proportions, the Company has deemed that the investment, in substance, should be treated as a single security for purposes of accounting. The Company has adopted fair value option in the accounting for its investment in Windset effective on the acquisition date. The fair value of the Company’s investment in Windset utilizes significant unobservable inputs in the discounted cash flow models, including projected cash flows, growth rates and the discount rate, and is therefore considered a Level 3 for fair value measurement purposes (see Note 1). The Company believes that reporting its investment at fair value provides its investors with useful information on the performance of the Company’s investment and the anticipated appreciation in value as Windset expands its business.
The fair value of the Company’s investment in Windset was determined utilizing the Windset Purchase Agreement’s put/call calculation for value and a discounted cash flow model based on projections developed by Windset, and considers the put and call conversion options. These features impact the duration of the cash flows utilized to derive the estimated fair values of the investment. These two discounted cash flow models’ estimate for fair value, which generally approximate a similar result, is then weighted. Assumptions included in these discounted cash flow models will be evaluated quarterly based on Windset’s actual and projected operating results to determine the change in fair value.
2. Investments in non-public companies (continued)
During the year ended May 31, 2015, the Company recorded $1.4 million in dividends and in fiscal years ended May 25, 2014 and May 26, 2013, the Company recorded $1.1 million in dividend income. In addition, the Company recorded $3.9 million, $10.0 million and $8.1 million of income for fiscal years ended May 31, 2105, May 25, 2014 and May 26, 2013, respectively, which is included in other income in the Consolidated Statements of Comprehensive Income, from the increase in the fair market value of the Company’s investment in Windset.
The Company also entered into an exclusive license agreement with Windset, which was executed in June 2010, prior to contemplation of Apio’s investment in Windset.
3. Property and Equipment
Property and equipment consists of the following (in thousands):
|
Years of |
|||||||||||||
|
Useful Life |
May 31, 2015 |
May 25, 2014 |
|||||||||||
|
Land and building |
15- | 40 | $ | 57,426 | $ | 56,378 | |||||||
|
Leasehold improvements |
3- | 20 | 1,360 | 1,079 | |||||||||
|
Computer, capitalized software, machinery, equipment and auto |
3- | 20 | 68,260 | 53,715 | |||||||||
|
Furniture and fixtures |
3- | 7 | 804 | 824 | |||||||||
|
Construction in process |
6,837 | 6,975 | |||||||||||
|
Gross property and equipment |
134,687 | 118,971 | |||||||||||
|
Less accumulated depreciation and amortization |
(50,222 | ) | (44,831 | ) | |||||||||
|
Net property and equipment |
$ | 84,465 | $ | 74,140 | |||||||||
Depreciation and amortization expense for property and equipment for the fiscal years ended May 31, 2015, May 25, 2014 and May 26, 2013 was $6.2 million, $6.2 million and $6.3 million, respectively. There was no equipment under capital leases at May 31, 2015 or May 25, 2014. Amortization related to capitalized software was $158,000, $189,000 and $160,000 for fiscal years ended May 31, 2015, May 25, 2014 and May 26, 2013, respectively. The unamortized computer software costs as of both May 31, 2015 and May 25, 2014 was $1.1 million.
4. Intangible Assets
The carrying amount of goodwill as of May 31, 2015, May 25, 2014 and May 26, 2013 was $35.7 million for the Food Products Technology segment and $13.9 million for the Hyaluronan-based Biomaterials segment.
4. Intangible Assets (continued)
Information regarding Landec’s other intangible assets is as follows (in thousands):
|
Trademarks & Trade names |
Customer Relationships |
Total |
|||||||||||
|
Balance as of May 27, 2012 |
$ | 48,428 | $ | 10,557 | $ | 58,985 | |||||||
|
Amortization expense |
— | (951 | ) | (951 | ) | ||||||||
|
Balance as of May 26, 2013 |
48,428 | 9,606 | 58,034 | ||||||||||
|
Amortization expense |
— | (886 | ) | (886 | ) | ||||||||
|
Balance as of May 25, 2014 |
48,428 | 8,720 | 57,148 | ||||||||||
|
Amortization expense |
— | (885 | ) | (885 | ) | ||||||||
|
Balance as of May 31, 2015 |
$ | 48,428 | $ | 7,835 | $ | 56,263 | |||||||
Accumulated amortization of Trademark and Trade names as of both May 31, 2015 and May 25, 2014 was $872,000. Accumulated amortization of Customer Relationships as of May 31, 2015 and May 25, 2014 was $3.4 million and $2.5 million, respectively. Accumulated impairment losses as of both May 31, 2015 and May 25, 2014 were $4.8 million. Lifecore’s Customer Relationships amount of $3.7 million is being amortized over 12 years and Apio’s customer relationships amount of $7.5 million is being amortized over 13 years. The amortization expense for the next five fiscal years is estimated to be $885,000 per year.
5. Stockholders’ Equity
Holders of Common Stock are entitled to one vote per share.
Convertible Preferred Stock
The Company has authorized two million shares of preferred stock, and as of May 31, 2015 has no outstanding preferred stock.
Common Stock and Stock Option Plans
At May 31, 2015, the Company had 881,143 common shares reserved for future issuance under Landec equity incentive plans.
On October 10, 2013, following stockholder approval at the Annual Meeting of Stockholders of the Company, the 2013 Stock Incentive Plan (the “Plan”) became effective and replaced the Company’s 2009 Stock Incentive Plan. Employees (including officers), consultants and directors of the Company and its subsidiaries and affiliates are eligible to participate in the Plan.
The Plan provides for the grant of stock options (both nonstatutory and incentive stock options), stock grants, stock units and stock appreciation rights. Awards under the Plan will be evidenced by an agreement with the Plan participants and 2.0 million shares of the Company’s Common Stock (“Shares”) were initially available for award under the Plan. Under the Plan, no recipient may receive awards during any fiscal year that exceeds the following amounts: (i) stock options covering in excess of 500,000 Shares; (ii) stock grants and stock units covering in excess of 250,000 Shares in the aggregate; or (iii) stock appreciation rights covering more than 500,000 Shares. In addition, awards to non-employee directors are discretionary. However, a non-employee director may not be granted awards in excess of 30,000 Shares in the aggregate during any fiscal year. The exercise price of the options is the fair market value of the Company’s Common Stock on the date the options are granted.
On October 15, 2009, following stockholder approval at the Annual Meeting of Stockholders of the Company, the 2009 Stock Incentive Plan (the “2009 Plan”) became effective and replaced the Company’s 2005 Stock Incentive Plan. Employees (including officers), consultants and directors of the Company and its subsidiaries and affiliates were eligible to participate in the 2009 Plan. The 2009 Plan provided for the grant of stock options (both nonstatutory and incentive stock options), stock grants, stock units and stock appreciation rights. Under the 2009 Plan, 1.9 million Shares were initially available for awards and as of May 31, 2015, 865,834 options to purchase shares and restricted stock units (RSUs) were outstanding.
5. Stockholders’ Equity (continued)
On October 14, 2005, following stockholder approval at the Annual Meeting of Stockholders of the Company, the 2005 Stock Incentive Plan (“2005 Plan”) became effective. The 2005 Plan replaced the Company’s four then existing equity plans and no shares remain available for grant under those plans. Employees (including officers), consultants and directors of the Company and its subsidiaries and affiliates were eligible to participate in the 2005 Plan. The 2005 Plan provided for the grant of stock options (both nonstatutory and incentive stock options), stock grants, stock units and stock appreciation rights. Under the 2005 Plan, 861,038 Shares were initially available for awards, and as of May 31, 2015, 168,550 options to purchase shares were outstanding. The exercise price of the options was the fair market value of the Company’s Common Stock on the date the options were granted.
The 1995 Directors’ Stock Option Plan (the “Directors Plan”) provided that each person who became a non- employee director of the Company, who had not received a previous grant, be granted a nonstatutory stock option to purchase 20,000 shares of Common Stock on the date on which the optionee first became a non-employee director of the Company. Thereafter, on the date of each annual meeting of the stockholders each non-employee director was granted an additional option to purchase 10,000 shares of Common Stock if, on such date, he or she had served on the Company’s Board of Directors for at least six months prior to the date of such annual meeting. The exercise price of the options was the fair market value of the Company’s Common Stock on the date the options were granted. Options granted under this plan were exercisable and vested upon grant. Under the Directors Plan, 800,000 Shares were initially available for awards, and as of May 31, 2015, 10,000 options to purchase shares were outstanding. No shares remain available for grant under the Directors’ Plan.
Activity under all Landec equity incentive plans is as follows:
Stock-Based Compensation Activity
|
Restricted Stock Outstanding |
Stock Options Outstanding |
|||||||||||||||||||
|
RSUs and Options Available for Grant |
Number of Restricted Shares |
Weighted Average Grant Date Fair Value |
Number of Stock Options |
Weighted Average Exercise |
||||||||||||||||
|
Balance at May 27, 2012 |
449,643 | 348,166 | $ | 5.93 | 2,046,432 | $ | 6.50 | |||||||||||||
|
Granted |
(26,666 | ) | 6,666 | $ | 9.01 | 20,000 | $ | 9.01 | ||||||||||||
|
Awarded/Exercised |
— | (231,086 | ) | $ | 5.74 | (671,563 | ) | $ | 6.30 | |||||||||||
|
Forfeited |
— | (28,416 | ) | $ | 6.20 | (44,977 | ) | $ | 6.34 | |||||||||||
|
Plan shares expired |
— | — | — | (10,000 | ) | $ | 13.32 | |||||||||||||
|
Balance at May 26, 2013 |
422,977 | 95,330 | $ | 6.52 | 1,339,892 | $ | 6.58 | |||||||||||||
|
Additional shares reserved |
2,000,000 | — | — | — | — | |||||||||||||||
|
Granted |
(420,131 | ) | 128,631 | $ | 14.30 | 291,500 | $ | 14.30 | ||||||||||||
|
Awarded/Exercised |
— | (62,499 | ) | $ | 6.18 | (398,080 | ) | $ | 6.45 | |||||||||||
|
Forfeited |
— | (12,162 | ) | $ | 8.86 | (12,452 | ) | $ | 6.66 | |||||||||||
|
Plan shares expired |
(2,846 | ) | — | — | (5,000 | ) | $ | 13.32 | ||||||||||||
|
Balance at May 25, 2014 |
2,000,000 | 149,300 | $ | 13.17 | 1,215,860 | $ | 8.45 | |||||||||||||
|
Granted |
(1,118,857 | ) | 324,357 | $ | 13.97 | 794,500 | $ | 14.20 | ||||||||||||
|
Awarded/Exercised |
— | (79,219 | ) | $ | 11.57 | (205,419 | ) | $ | 6.55 | |||||||||||
|
Forfeited |
— | (1,667 | ) | $ | 14.30 | (2,223 | ) | $ | 14.30 | |||||||||||
|
Plan shares expired |
— | — | — | (66,000 | ) | $ | 11.32 | |||||||||||||
|
Balance at May 31, 2015 |
881,143 | 392,771 | $ | 14.15 | 1,736,718 | $ | 11.19 | |||||||||||||
5. Stockholders’ Equity (continued)
Upon vesting of certain RSUs and the exercise of certain options during fiscal years 2015, 2014 and 2013, certain RSUs and exercised options were net share-settled to cover the required exercise price and withholding tax and the remaining amounts were converted into an equivalent number of shares of Common Stock. The Company withheld shares with value equivalent to the exercise price for options and the employees' minimum statutory obligation for the applicable income and other employment taxes, and remitted the cash to the appropriate taxing authorities. The total shares withheld for fiscal years 2015, 2014 and 2013 were 112,443, 47,573 and 145,159 RSUs and options, respectively, which was based on the value of the option and/or RSUs on their exercise or vesting date as determined by the Company's closing stock price. Total payments for the employees' tax obligations to the taxing authorities during fiscal years 2015, 2014 and 2013 were approximately $343,000, $1.3 million and $49,000, respectively. These net-share settlements had the effect of share repurchases by the Company as they reduced and retired the number of shares that would have otherwise have been issued as a result of the vesting and did not represent an expense to the Company.
The following table summarizes information concerning stock options outstanding and exercisable at May 31, 2015:
| Options Outstanding | Options Exercisable | |||||||||||||||||||||||||||
|
Range of Exercise Prices |
Number of Shares Outstanding |
Weighted Average Remaining Contractual Life (in years) |
Weighted Average Exercise Price |
Aggregate Intrinsic Value |
Number of Shares Exercisable |
Weighted Average Exercise Price |
Aggregate Intrinsic Value |
|||||||||||||||||||||
|
$ 5.00 - $6.00 |
317,750 | 2.10 | $ | 5.65 | $ | 2,746,675 | 317,750 | $ | 5.65 | $ | 2,746,675 | |||||||||||||||||
|
$ 6.01 - $9.00 |
315,191 | 1.83 | $ | 6.46 | $ | 2,466,904 | 315,191 | $ | 6.46 | $ | 2,466,904 | |||||||||||||||||
|
$ 9.01 - $14.00 |
140,000 | 6.14 | $ | 12.57 | $ | 240,900 | 30,732 | $ | 10.55 | $ | 115,027 | |||||||||||||||||
|
$14.01- $14.39 |
963,777 | 6.39 | $ | 14.36 | $ | — | 185,791 | $ | 14.30 | $ | — | |||||||||||||||||
|
$ 5.00 - $14.39 |
1,736,718 | 4.76 | $ | 11.19 | $ | 5,454,479 | 849,464 | $ | 8.02 | $ | 5,328,606 | |||||||||||||||||
At May 31, 2015 and May 25, 2014 options to purchase 849,464 and 984,610 shares of Landec’s Common Stock were vested, respectively, and 887,254 and 231,250 were unvested, respectively. No options have been exercised prior to being vested. The aggregate intrinsic value in the table above represents the total pretax intrinsic value, based on the Company’s closing stock price of $14.29 on May 29, 2015, which would have been received by holders of stock options had all holders of stock options exercised their stock options that were in-the-money as of that date. The total number of in-the-money stock options exercisable as of May 31, 2015, was 663,673 shares. The aggregate intrinsic value of stock options exercised during the fiscal year 2015 was $1.5 million.
Option Awards
|
Outstanding Options |
Weighted Average Exercise Price |
Weighted Average Remaining Contract Term |
Aggregate Intrinsic Value |
|||||||||||||
|
Vested |
849,464 | $ | 8.02 | 2.74 | $ | 5,328,606 | ||||||||||
|
Expected to vest |
861,612 | $ | 14.22 | 6.69 | 123,261 | |||||||||||
|
Total |
1,711,076 | $ | 11.14 | 4.73 | $ | 5,451,867 | ||||||||||
As of May 31, 2015, there was $7.6 million of total unrecognized compensation expense related to unvested equity compensation awards granted under the Company’s incentive stock plans. Total expense is expected to be recognized over the weighted-average period of 2.6 years for both stock options and restricted stock awards.
Stock Repurchase Plan
On July 14, 2010, the Board of Directors of the Company approved the establishment of a stock repurchase plan which allows for the repurchase of up to $10 million of the Company’s Common Stock. The Company may repurchase its common stock from time to time in open market purchases or in privately negotiated transactions. The timing and actual number of shares repurchased is at the discretion of management of the Company and will depend on a variety of factors, including stock price, corporate and regulatory requirements, market conditions, the relative attractiveness of other capital deployment opportunities and other corporate priorities. The stock repurchase program does not obligate Landec to acquire any amount of its common stock and the program may be modified, suspended or terminated at any time at the Company's discretion without prior notice. During fiscal years 2015, 2014 and 2013, the Company did not purchase any shares on the open market.
6. Debt
Long-term debt consists of the following (in thousands):
|
May 31, 2015 |
May 25, 2014 |
|||||||
|
Real estate loan agreement with General Electric Capital Corporation (“GE Capital”); due in monthly principal and interest payments of $133,060 through May 1, 2022 with interest based on a fixed rate of 4.02% per annum |
$ | 15,172 | $ | 16,137 | ||||
|
Capital equipment loan with GE Capital; due in monthly principal and interest payments of $175,356 through May 1, 2019 with interest based on a fixed rate of 4.39% per annum |
7,705 | 9,430 | ||||||
|
Capital equipment loan with GE Capital; due in monthly principal and interest payments of $95,120 through September 1, 2019 with interest based on a fixed rate of 3.68% per annum |
6,476 | — | ||||||
|
Capital equipment loan with GE Capital; due in monthly principal and interest payments of $55,828 through December 1, 2019 with interest based on a fixed rate of 3.74% per annum |
3,907 | — | ||||||
|
Capital equipment loan with Bank of America (“BofA”); due in monthly principal and interest payments of $68,274 through June 28, 2020 with interest based on a fixed rate of 2.79% per annum |
3,819 | — | ||||||
|
Term note with BMO Harris; due in monthly payments of $250,000 through May 23, 2016 with interest payable monthly at LIBOR plus 2% per annum |
3,000 | 6,000 | ||||||
|
Industrial revenue bonds (“IRBs”) issued by Lifecore; due in annual payments through 2020 with interest at a variable rate set weekly by the bond remarketing agent (0.31% and 0.28% at May 31, 2015 and May 25, 2014, respectively) |
2,440 | 2,805 | ||||||
|
Total |
42,519 | 34,372 | ||||||
|
Less current portion |
(8,353 | ) | (6,055 | ) | ||||
|
Long-term portion |
$ | 34,166 | $ | 28,317 | ||||
6. Debt (continued)
The future minimum principal payments of the Company’s debt for each year presented are as follows (in thousands):
| GE and BofA | ||||||||||||||||||||
|
GE RE Loan |
M&E Loans |
BMO Harris |
IRB |
Total |
||||||||||||||||
|
FY 2016 |
1,005 | 3,973 | 3,000 | 375 | 8,353 | |||||||||||||||
|
FY 2017 |
1,047 | 4,130 | — | 390 | 5,567 | |||||||||||||||
|
FY 2018 |
1,089 | 4,293 | — | 400 | 5,782 | |||||||||||||||
|
FY 2019 |
1,134 | 4,461 | — | 410 | 6,005 | |||||||||||||||
|
FY 2020 |
1,180 | 5,050 | — | 425 | 6,655 | |||||||||||||||
|
Thereafter |
9,717 | — | — | 440 | 10,157 | |||||||||||||||
|
Total |
$ | 15,172 | $ | 21,907 | $ | 3,000 | $ | 2,440 | $ | 42,519 | ||||||||||
On July 17, 2014, Apio entered into an amendment with GE Capital, which amended the revolving line of credit dated April 23, 2012 among the parties. Under the amendment, the revolving line of credit increased from $25 million to $40 million, the interest rate was reduced from LIBOR plus 2.0% to LIBOR plus 1.75%, and the term was extended to July 17, 2019, among other changes. The availability under the revolving line of credit is based on the combination of the eligible accounts receivable and eligible inventory (availability was $30.3 million at May 31, 2015). Apio’s revolving line of credit has an unused fee of 0.375% per annum. At both May 31, 2015 and May 25, 2014, there was no outstanding balance under Apio’s revolving line of credit.
Also on July 17, 2014, Apio entered into a new equipment loan with GE Capital whereby Apio can borrow up to $25 million based on eligible equipment purchases between August 1, 2012 and August 31, 2015. Each borrowing under this new equipment loan has a five year term with a seven year amortization period. On August 28, 2014, Apio borrowed $7.1 million under the new equipment loan at a fixed rate of 3.68%. On November 24, 2014, Apio borrowed an additional $4.1 million under the new equipment loan at a fixed rate of 3.74%. The Company does not intend to borrow any more funds under this loan.
On May 15, 2015, GE Capital and Apio entered into a commitment letter, pursuant to which GE Capital committed to lend Apio up to approximately $14.7 million in equipment financing and approximately $7.7 million in real property financing. The equipment loan and the real property loan will be made pursuant to existing loan agreements dated as of April 23, 2012, as amended May 17, 2013 and July 17, 2014. No amounts had been borrowed under these committed loans as of May 31, 2015. The equipment loan is available to finance purchases of equipment between May 1, 2015 and June 30, 2017. Borrowings under the equipment loan will have a five-year term and a seven-year amortization. Interest on each borrowing under the equipment loan will be at a fixed rate based on an index rate plus a 5-year swap rate at the time of borrowing. The real property loan will be used to finance the expansion of Apio’s facility in Hanover, PA. The real property loan will have a 10-year term and a 20-year amortization. Interest will be at a fixed rate based on an index rate plus a 10-year swap rate on at the time of borrowing. No amounts had been borrowed under these committed loans as of May 31, 2015.
The GE real estate, equipment and line of credit agreements (collectively the “GE Debt Agreements”) are secured by liens on all of the property of Apio and its subsidiaries. The GE Debt Agreements contain customary events of default under which obligations could be accelerated or increased. The GE Capital real estate and equipment loans are guaranteed by Landec, and Landec has pledged its equity interest in Apio as collateral under the line of credit agreement. The GE Debt Agreements contain customary covenants, such as limitations on the ability to (1) incur indebtedness or grant liens or negative pledges on Apio’s assets; (2) make loans or other investments; (3) pay dividends, sell stock or repurchase stock or other securities; (4) sell assets; (5) engage in mergers; (6) enter into sale and leaseback transactions; or (7) make changes in Apio’s corporate structure. In addition, Apio must maintain a minimum fixed charge coverage ratio of 1.10 to 1.0 if the availability under its line of credit falls below $12.0 million. Apio was in compliance with all financial covenants as of May 31, 2015 and May 25, 2014.
6. Debt (continued)
On May 15, 2015, Apio and BofA entered into a commitment letter and loan agreement, pursuant to which Apio will be permitted to borrow up to $15.0 million to finance equipment purchases made between October 1, 2014 and April 30, 2016 (the “BofA Loan”). Each borrowing under the BofA Loan will have a five-year term and a seven-year amortization period and will have a fixed interest rate based on the 2.5-year swap rate at the time of borrowing. Borrowings will be secured by equipment financed with proceeds of the BofA Loan. In addition, on May 15, 2015, Landec and BofA entered into a Guaranty, pursuant to which Landec guaranteed Apio’s payment obligations under the BofA Loan.
During fiscal year 2015, Apio capitalized $397,000 of loan origination fees from new equipment loans and/or amendments with GE Capital and BofA. No loan origination fees were capitalized in fiscal year 2014. Amortization of loan origination fees for Apio recorded to interest expense for fiscal years 2015, 2014 and 2013 were $206,000, $187,000 and $181,000, respectively. Unamortized loan origination fees were $1.2 million and $1.0 million at May 31, 2015 and May 25, 2014, respectively, and are included in other assets in the Consolidated Balance Sheets.
On May 23, 2012, Lifecore entered into two financing agreements with BMO Harris Bank N.A. and/or its affiliates (“BMO Harris”), collectively (the “Lifecore Loan Agreements”):
|
(1) |
A $12.0 million term loan which matures in four years due in monthly payments of $250,000 with interest payable monthly based on a variable interest rate of LIBOR plus 2% (the “Term Loan”). |
|
(2) |
A Reimbursement Agreement pursuant to which BMO Harris caused its affiliate Bank of Montreal to issue an irrevocable letter of credit in the amount of $3.5 million (the “Letter of Credit”) which is securing the IRBs described above. |
On May 22, 2015, Lifecore entered into a Credit and Security Agreement (the “Credit Agreement”) with BMO Harris which includes (a) a two-year, $10.0 million asset-based working capital revolving line of credit, with an interest rate of LIBOR plus 1.85%, with availability based on the combination of Lifecore’s eligible accounts receivable and inventory balances (availability was $9.4 million at May 31, 2015) and with no unused fee and as of May 31, 2015 no amounts were outstanding under the line of credit.
The obligations of Lifecore under the Lifecore Loan Agreements and Credit Agreement (collectively “Lifecore Debt Agreements”) are secured by liens on all of the property of Lifecore. The Lifecore Debt Agreements contain customary covenants, such as limitations on the ability to (1) incur indebtedness or grant liens or negative pledges on Lifecore’s assets; (2) make loans or other investments; (3) pay dividends or repurchase stock or other securities; (4) sell assets; (5) engage in mergers; (6) enter into sale and leaseback transactions; (7) adopt certain benefit plans; and (8) make changes in Lifecore’s corporate structure. In addition, under the Credit Agreement, Lifecore must maintain (a) a minimum fixed charge coverage ratio of 1.10 to 1.0 if Lifecore’s unrestricted cash balance is less than 50% of total funded debt at the end of each fiscal quarter and (b) a net debt cash flow leverage ratio of less than 2.0 to 1.0 at the end of each fiscal quarter. Lifecore was in compliance with all financial covenants as of May 31, 2015 and May 25, 2014. Unamortized loan origination fees for the Lifecore Debt Agreements were $48,000 and $98,000 at May 31, 2015 and May 25, 2014, respectively, and are included in other assets in the Consolidated Balance Sheets.
The market value of the Company’s debt approximates its recorded value as the interest rates on each debt instrument approximates current market rates.
The Term Loan was used to repay Lifecore’s former credit facility with Wells Fargo Bank, N.A. (“Wells Fargo”). The Letter of Credit (which replaces a letter of credit previously provided by Wells Fargo) provides liquidity and credit support for the IRBs.
6. Debt (continued)
On August 19, 2004, Lifecore issued variable rate industrial revenue bonds (“IRBs”). These IRBs were assumed by Landec in the acquisition of Lifecore. The IRBs are collateralized by a bank letter of credit which is secured by a first mortgage on the Company’s facility in Chaska, Minnesota. In addition, the Company pays an annual remarketing fee equal to 0.125% and an annual letter of credit fee of 0.75%. The maturities on the IRBs are held in a sinking fund account, recorded in Other Current Assets in the accompanying Consolidated Balance Sheets, and are paid out each year on September 1st.
7. Derivative Financial Instruments
In May 2010, the Company entered into a five-year interest rate swap agreement under the credit agreement with Wells Fargo which terminated in May 2015. The interest rate swap was designated as a cash flow hedge of future interest payments of LIBOR and had a notional amount of $20 million. As a result of the interest rate swap transaction, the Company fixed for a five-year period the interest rate at 4.24% subject to market based interest rate risk on $20 million of borrowings under the credit agreement with Wells Fargo. The Company’s obligations under the interest rate swap transaction as to the scheduled payments were guaranteed and secured on the same basis as its obligations under the credit agreement with Wells Fargo at the time the agreement was consummated. Upon entering into the new Term Loan with BMO Harris in May 2012, the Company used the proceeds from that loan to pay off the Wells Fargo credit facility. The swap with Wells Fargo was not terminated upon the extinguishment of the debt with Wells Fargo. The fair value of the swap arrangement as of May 31, 2015 and May 25, 2014 was zero and $44,000, respectively, and is included in other accrued liabilities in the accompanying Consolidated Balance Sheets.
8. Income Taxes
The provision for income taxes consisted of the following (in thousands):
|
Year ended |
Year ended |
Year ended |
||||||||||
|
Current: |
May 31, 2015 |
May 25, 2014 |
May 26, 2013 |
|||||||||
|
Federal |
$ | 3,480 | $ | 4,785 | $ | 2,808 | ||||||
|
State |
43 | 157 | (18 | ) | ||||||||
|
Foreign |
71 | 56 | 56 | |||||||||
|
Total |
3,594 | 4,998 | 2,846 | |||||||||
|
Deferred: |
||||||||||||
|
Federal |
3,789 | 5,059 | 6,218 | |||||||||
|
State |
363 | 526 | 388 | |||||||||
|
Total |
4,152 | 5,585 | 6,606 | |||||||||
|
Income tax expense |
$ | 7,746 | $ | 10,583 | $ | 9,452 | ||||||
The actual provision for income taxes differs from the statutory U.S. federal income tax rate as follows (in thousands):
|
Year Ended May 31, 2015 |
Year Ended May 25, 2014 |
Year Ended May 26, 2013 |
||||||||||
|
Provision at U.S. statutory rate (1) |
$ | 7,451 | $ | 10,405 | $ | 11,214 | ||||||
|
State income taxes, net of federal benefit |
566 | 711 | 731 | |||||||||
|
Change in valuation allowance |
353 | 99 | 370 | |||||||||
|
Tax-exempt interest |
— | — | — | |||||||||
|
Tax credit carryforwards |
(375 | ) | (378 | ) | (801 | ) | ||||||
|
Domestic manufacturing deduction |
(369 | ) | (406 | ) | (172 | ) | ||||||
|
Change in value of contingent consideration |
— | — | (1,450 | ) | ||||||||
|
Other |
120 | 152 | (440 | ) | ||||||||
|
Total |
$ | 7,746 | $ | 10,583 | $ | 9,452 | ||||||
(1) Statutory rate was 35% for fiscal years 2015, 2014 and 2013.
8. Income Taxes (continued)
The decrease in income tax expense in fiscal year 2015 compared to fiscal year 2014 was primarily due to a 28% decrease in income before taxes. The increase in income tax expense in fiscal year 2014 compared to fiscal year 2013 is primarily due to the benefit received in fiscal year 2013 related to the change in value of contingent consideration, the absence of which increased the effective tax rate from 30% in fiscal year 2013 to 36% in fiscal year 2014 partially offset by a 7% decrease in net income before taxes.
The effective tax rates for fiscal year 2015 differ from the statutory federal income tax rate of 35% as a result of several factors, including state taxes, valuation allowance on the impairment of the investment in Aesthetic Sciences Corporation, and non-deductible stock-based compensation expense; partially offset by the domestic manufacturing deduction and state and federal research and development credits. The effective tax rates for fiscal year 2014 differ from the statutory federal income tax rate of 35% as a result of several factors, including state taxes, non-deductible stock-based compensation expense, disqualified dispositions of incentive stock options, domestic manufacturing deduction, the benefit of federal and state research and development credits, and the change in valuation allowance. The effective tax rates for fiscal year 2013 differ from the statutory federal income tax rate of 35% as a result of several factors, including state taxes, change in value of contingent consideration, non-deductible stock-based compensation expense, disqualified dispositions of incentive stock options, domestic manufacturing deduction, the benefit of federal and state research and development credits, and the change in valuation allowance.
Significant components of deferred tax assets and liabilities consisted of the following (in thousands):
|
May 31, 2015 |
May 25, 2014 |
|||||||
|
Deferred tax assets: |
||||||||
|
Net operating loss carryforwards |
$ | 3,415 | $ | 3,630 | ||||
|
Accruals and reserves |
1,964 | 1,746 | ||||||
|
Stock-based compensation |
662 | 723 | ||||||
|
Research and AMT credit carryforwards |
515 | 495 | ||||||
|
Other |
966 | 545 | ||||||
|
Gross deferred tax assets |
7,522 | 7,139 | ||||||
|
Valuation allowance |
(1,234 | ) | (881 | ) | ||||
|
Net deferred tax assets |
6,288 | 6,258 | ||||||
|
Deferred tax liabilities: |
||||||||
|
Basis difference in investment in non-public company |
(10,753 | ) | (9,270 | ) | ||||
|
Depreciation and amortization |
(7,186 | ) | (5,705 | ) | ||||
|
Goodwill and other indefinite life intangibles |
(20,578 | ) | (19,360 | ) | ||||
|
Deferred tax liabilities |
(38,517 | ) | (34,335 | ) | ||||
|
Net deferred tax liabilities |
$ | (32,229 | ) | $ | (28,077 | ) | ||
As of May 31, 2015, the Company had federal, California, Indiana, and other state net operating loss carryforwards of approximately $7.8 million, $0.8 million, $6.6 million, and $13.3 million respectively. These losses expire in different periods through 2032, if not utilized. Such net operating losses consist of excess tax benefits from employee stock option exercises and have not been recorded in the Company’s deferred tax assets. The Company will record approximately $500,000 of the gross California net operating loss to additional paid in capital as and when such excess tax benefits are ultimately realized. The Company acquired additional net operating losses through the acquisition of GreenLine. Utilization of these acquired net operating losses in a specific year is limited due to the “change in ownership” provision of the Internal Revenue Code of 1986 and similar state provisions. The net operating losses presented above for federal and state purposes is net of any such limitation.
The Company has California research and development tax credits carryforwards of approximately $1.6 million. The research and development tax credit carryforwards have an unlimited carryforward period for California purposes. Certain tax credit carryovers are attributable to excess tax benefits from employee stock option exercises and have not been recorded in the Company’s deferred tax assets. The Company will record $1.1 million of the gross California research and development credit to additional paid in capital as and when such excess tax benefits are ultimately realized.
8. Income Taxes (continued)
Valuation allowances are reviewed each period on a tax jurisdiction by jurisdiction basis to analyze whether there is sufficient positive or negative evidence to support a change in judgment about the realizability of the related deferred tax assets. Based on this analysis and considering all positive and negative evidence, the Company determined that a valuation allowance of $1.2 million should be recorded as a result of uncertainty around the utilization of certain state net operating losses and a book impairment loss on the Company's investment in Aesthetic Sciences as it is more likely than not that a portion of the deferred tax asset will not be realized in the foreseeable future. The valuation allowance increased by $353,000 in fiscal year 2015 primarily due to uncertainty around the utilization of certain state net operating losses and credits.
The accounting for uncertainty in income taxes recognized in an enterprise’s financial statements prescribes a recognition threshold and measurement attribute for the financial statement recognition and measurement of a tax position taken or expected to be taken in a tax return, and the derecognition of tax benefits, classification on the balance sheet, interest and penalties, accounting in interim periods, disclosure, and transition.
A reconciliation of the beginning and ending amount of unrecognized tax benefits is as follows (in thousands):
|
As of |
||||||||||||
|
May 31, 2015 |
May 25, 2014 |
May 26, 2013 |
||||||||||
|
Unrecognized tax benefits – beginning of the period |
$ | 1,035 | $ | 998 | $ | 766 | ||||||
|
Gross increases – tax positions in prior period |
17 | 7 | 103 | |||||||||
|
Gross decreases – tax positions in prior period |
(141 | ) | (48 | ) | — | |||||||
|
Gross increases – current-period tax positions |
76 | 78 | 129 | |||||||||
|
Lapse of statute of limitations |
— | — | — | |||||||||
|
Unrecognized tax benefits – end of the period |
$ | 987 | $ | 1,035 | $ | 998 | ||||||
As of May 31, 2015, the total amount of net unrecognized tax benefits was $987,000, of which, $800,000, if recognized, would affect the effective tax rate. As of May 25, 2014, the total amount of net unrecognized tax benefits was $1.0 million, of which, $817,000, if recognized, would affect the effective tax rate. The Company accrues interest and penalties related to unrecognized tax benefits in its provision for income taxes. The total amount of penalties and interest was not material as of May 31, 2015 and May 25, 2014. Additionally, the Company does not expect its unrecognized tax benefits to change materially within the next twelve months.
Due to tax attribute carryforwards, the Company is subject to examination for tax years 1997 forward for U.S. tax purposes. The Company is also subject to examination in various state jurisdictions for tax years 1998 forward, none of which were individually material.
9. Commitments and Contingencies
Operating Leases
Landec leases facilities and equipment under operating lease agreements with various terms and conditions, which expire at various dates through fiscal year 2023. Certain of these leases have renewal options.
9. Commitments and Contingencies (continued)
The approximate future minimum lease payments under these operating leases, excluding land leases, at May 31, 2015 are as follows (in thousands):
|
Amount |
||||
|
FY 2016 |
$ | 3,136 | ||
|
FY 2017 |
2,631 | |||
|
FY 2018 |
1,768 | |||
|
FY 2019 |
1,003 | |||
|
FY 2020 |
257 | |||
|
Thereafter |
624 | |||
|
Total |
$ | 9,419 | ||
Rent expense for operating leases, including month to month arrangements was $5.0 million, $4.4 million and $4.8 million for the fiscal years 2015, 2014 and 2013, respectively.
Capital Leases
There was no equipment under capital lease agreements at May 31, 2015.
Employment Agreements
Landec has entered into employment agreements with certain key employees. These agreements provide for these employees to receive incentive bonuses based on the financial performance of certain divisions in addition to their annual base salaries. The accrued incentive bonuses amounted to $1.0 million at May 31, 2015 and $656,000 at May 25, 2014.
Purchase Commitments
At May 31, 2015, the Company was committed to purchase $15.1 million of produce during fiscal year 2016 in accordance with contractual terms at market rates. Payments of $16.8 million were made in fiscal year 2015 under similar arrangements.
Loss Contingencies
As of May 31, 2015, the Company is not a party to any legal proceedings.
10. Employee Savings and Investment Plans
The Company sponsors a 401(k) plan which is available to substantially all of the Company’s employees. Landec’s Corporate Plan, which is available to all Landec employees (“Landec Plan”), allows participants to contribute from 1% to 50% of their salaries, up to the Internal Revenue Service (“IRS”) limitation into designated investment funds. The Company matches 67% on the first 6% contributed by an employee. Employee and Company contributions are fully vested at the time of the contributions. The Company retains the right, by action of the Board of Directors, to amend, modify, or terminate the plan. For fiscal years 2015, 2014 and 2013, the Company contributed $1.2 million, $1.1 million and $939,000, respectively, to the Landec Plan.
11. Business Segment Reporting
The Company manages its business operations through three strategic business units. Based upon the information reported to the chief operating decision maker, who is the Chief Executive Officer, the Company has the following reportable segments: the Food Products Technology segment, the Food Export segment and the Hyaluronan-based Biomaterials segment.
11. Business Segment Reporting (continued)
The Food Products Technology segment markets and packs specialty packaged whole and fresh-cut fruit and vegetables, the majority of which incorporate the BreatheWay specialty packaging for the retail grocery, club store and food services industry. In addition, the Food Products Technology segment sells BreatheWay packaging to partners for non-vegetable products. The Food Export segment consists of revenues generated from the purchase and sale of primarily whole commodity fruit and vegetable products to Asia and domestically. The HA-based Biomaterials segment sells products utilizing hyaluronan, a naturally occurring polysaccharide that is widely distributed in the extracellular matrix of connective tissues in both animals and humans, for medical use primarily in the Ophthalmic, Orthopedic and Veterinary markets. Corporate licenses Landec’s patented Intellicoat seed coatings to the farming industry and licenses the Company’s Intelimer polymers for personal care products and other industrial products. The Corporate segment also includes general and administrative expenses, non-Food Products Technology and non HA-based Biomaterials interest income and income tax expenses. Beginning in fiscal year 2013, the Food Products Technology, the Food Export and the Hyaluronan-based Biomaterials segments include charges for corporate services and tax sharing allocated from the Corporate segment. All of the assets of the Company are located within the United States of America.
The Company’s international sales by geography are based on the billing address of the customer and were as follows (in millions):
|
May 31, 2015 |
May 25, 2014 |
May 26, 2013 |
||||||||||
|
Canada |
$ | 79.7 | $ | 46.6 | $ | 27.8 | ||||||
|
Taiwan |
$ | 32.1 | $ | 30.7 | $ | 31.0 | ||||||
|
Indonesia |
$ | 9.0 | $ | 9.6 | $ | 21.0 | ||||||
|
China |
$ | 9.0 | $ | 8.2 | $ | 5.0 | ||||||
|
Japan |
$ | 8.5 | $ | 9.9 | $ | 10.6 | ||||||
|
Belgium |
$ | 6.8 | $ | 13.1 | $ | 16.6 | ||||||
|
All Other Countries |
$ | 18.4 | $ | 19.1 | $ | 20.8 | ||||||
Operations by segment consisted of the following (in thousands):
| Food Products | Hyaluronan-based | |||||||||||||||||||
|
Fiscal Year Ended May 31, 2015 |
Technology |
Food Export |
Biomaterials |
Corporate |
TOTAL |
|||||||||||||||
|
Net sales |
$ | 430,415 | $ | 67,837 | $ | 40,432 | $ | 573 | $ | 539,257 | ||||||||||
|
International sales |
$ | 80,500 | $ | 67,714 | $ | 15,246 | $ | — | $ | 163,460 | ||||||||||
|
Gross profit |
$ | 45,993 | $ | 4,252 | $ | 14,609 | $ | 553 | $ | 65,407 | ||||||||||
|
Net income (loss) |
$ | 17,145 | $ | 1,041 | $ | 3,838 | $ | (8,480 | ) | $ | 13,544 | |||||||||
|
Identifiable assets |
$ | 228,672 | $ | 27,746 | $ | 85,779 | $ | 4,268 | $ | 346,465 | ||||||||||
|
Depreciation and amortization |
$ | 4,766 | $ | 6 | $ | 2,184 | $ | 134 | $ | 7,090 | ||||||||||
|
Capital expenditures |
$ | 12,895 | $ | — | $ | 4,499 | $ | 117 | $ | 17,511 | ||||||||||
|
Dividend income |
$ | 1,417 | $ | — | $ | — | $ | — | $ | 1,417 | ||||||||||
|
Interest income |
$ | 32 | $ | — | $ | 254 | $ | 29 | $ | 315 | ||||||||||
|
Interest expense |
$ | 1,655 | $ | — | $ | 174 | $ | — | $ | 1,829 | ||||||||||
|
Income tax expense |
$ | 792 | $ | 48 | $ | 177 | $ | 6,729 | $ | 7,746 | ||||||||||
|
Fiscal Year Ended May 25, 2014 |
||||||||||||||||||||
|
Net sales |
$ | 360,728 | $ | 69,827 | $ | 45,704 | $ | 554 | $ | 476,813 | ||||||||||
|
International sales |
$ | 47,224 | $ | 69,710 | $ | 20,312 | $ | — | $ | 137,246 | ||||||||||
|
Gross profit |
$ | 36,318 | $ | 5,340 | $ | 20,456 | $ | 450 | $ | 62,564 | ||||||||||
|
Net income (loss) |
$ | 19,041 | $ | 1,973 | $ | 9,695 | $ | (11,564 | ) | $ | 19,145 | |||||||||
|
Identifiable assets |
$ | 196,257 | $ | 25,391 | $ | 85,858 | $ | 6,117 | $ | 313,623 | ||||||||||
|
Depreciation and amortization |
$ | 4,751 | $ | 6 | $ | 2,221 | $ | 136 | $ | 7,114 | ||||||||||
|
Capital expenditures |
$ | 10,950 | $ | — | $ | 3,877 | $ | 59 | $ | 14,886 | ||||||||||
|
Dividend income |
$ | 1,125 | $ | — | $ | — | $ | — | $ | 1,125 | ||||||||||
|
Interest income |
$ | 12 | $ | — | $ | 242 | $ | 6 | $ | 260 | ||||||||||
|
Interest expense |
$ | 1,402 | $ | — | $ | 248 | $ | — | $ | 1,650 | ||||||||||
|
Income tax expense |
$ | 33 | $ | 3 | $ | 17 | $ | 10,530 | $ | 10,583 | ||||||||||
|
Fiscal Year Ended May 26, 2013 |
||||||||||||||||||||
|
Net sales |
$ | 320,447 | $ | 78,568 | $ | 41,281 | $ | 1,412 | $ | 441,708 | ||||||||||
|
International sales |
$ | 27,532 | $ | 78,442 | $ | 26,792 | $ | — | $ | 132,766 | ||||||||||
|
Gross profit |
$ | 37,077 | $ | 5,274 | $ | 19,102 | $ | 1,307 | $ | 62,760 | ||||||||||
|
Net income (loss) |
$ | 20,526 | $ | 1,660 | $ | 6,835 | $ | (6,434 | ) | $ | 22,587 | |||||||||
|
Identifiable assets |
$ | 180,104 | $ | 21,737 | $ | 80,940 | $ | 8,161 | $ | 290,942 | ||||||||||
|
Depreciation and amortization |
$ | 4,761 | $ | 4 | $ | 2,379 | $ | 151 | $ | 7,295 | ||||||||||
|
Capital expenditures |
$ | 5,598 | $ | — | $ | 3,190 | $ | 89 | $ | 8,877 | ||||||||||
|
Dividend income |
$ | 1,125 | $ | — | $ | — | $ | — | $ | 1,125 | ||||||||||
|
Interest income |
$ | 42 | $ | — | $ | 137 | $ | — | $ | 179 | ||||||||||
|
Interest expense |
$ | 1,707 | $ | — | $ | 301 | $ | — | $ | 2,008 | ||||||||||
|
Income tax expense |
$ | 3,399 | $ | 339 | $ | 1,400 | $ | 4,314 | $ | 9,452 | ||||||||||
12. Quarterly Consolidated Financial Information (unaudited)
The following is a summary of the unaudited quarterly results of operations for fiscal years 2015, 2014 and 2013 (in thousands, except for per share amounts):
|
FY 2015 |
1st Quarter |
2nd Quarter |
3rd Quarter |
4th Quarter |
FY 2015 |
|||||||||||||||
|
Revenues |
$ | 133,614 | $ | 132,665 | $ | 138,530 | $ | 134,448 | $ | 539,257 | ||||||||||
|
Gross profit |
$ | 14,188 | $ | 15,666 | $ | 16,885 | $ | 18,668 | $ | 65,407 | ||||||||||
|
Net income |
$ | 2,353 | $ | 3,223 | $ | 3,772 | $ | 4,196 | $ | 13,544 | ||||||||||
|
Net income per basic share |
$ | 0.09 | $ | 0.12 | $ | 0.14 | $ | 0.16 | $ | 0.50 | ||||||||||
|
Net income per diluted share |
$ | 0.09 | $ | 0.12 | $ | 0.14 | $ | 0.15 | $ | 0.50 | ||||||||||
|
FY 2014 |
1st Quarter |
2nd Quarter |
3rd Quarter |
4th Quarter |
FY 2014 |
|||||||||||||||
|
Revenues |
$ | 109,479 | $ | 120,026 | $ | 126,379 | $ | 120,929 | $ | 476,813 | ||||||||||
|
Gross profit |
$ | 12,532 | $ | 13,734 | $ | 20,155 | $ | 16,143 | $ | 62,564 | ||||||||||
|
Net income |
$ | 4,752 | $ | 3,451 | $ | 6,400 | $ | 4,542 | $ | 19,145 | ||||||||||
|
Net income per basic share |
$ | 0.18 | $ | 0.13 | $ | 0.24 | $ | 0.17 | $ | 0.72 | ||||||||||
|
Net income per diluted share |
$ | 0.18 | $ | 0.13 | $ | 0.24 | $ | 0.17 | $ | 0.71 | ||||||||||
|
FY 2013 |
1st Quarter |
2nd Quarter |
3rd Quarter |
4th Quarter |
FY 2013 |
|||||||||||||||
|
Revenues |
$ | 102,074 | $ | 114,654 | $ | 117,867 | $ | 107,113 | $ | 441,708 | ||||||||||
|
Gross profit |
$ | 13,763 | $ | 18,459 | $ | 17,508 | $ | 13,030 | $ | 62,760 | ||||||||||
|
Net income (loss) |
$ | 4,366 | $ | 8,913 | $ | 4,789 | $ | 4,519 | $ | 22,587 | ||||||||||
|
Net income (loss) per basic share |
$ | 0.17 | $ | 0.35 | $ | 0.19 | $ | 0.17 | $ | 0.87 | ||||||||||
|
Net income (loss) per diluted share |
$ | 0.17 | $ | 0.34 | $ | 0.18 | $ | 0.17 | $ | 0.85 | ||||||||||
(b) Index of Exhibits.
|
Exhibit Number: |
Exhibit Title | ||
|
3.1 |
Certificate of Incorporation of Registrant, incorporated herein by reference to Exhibit 3.1 to the Registrant’s Current Report on Form 8-K dated November 7, 2008. | ||
|
3.2 |
Amended and Restated Bylaws of Registrant, incorporated herein by reference to Exhibit 3.1 to the Registrant’s Current Report on Form 8-K dated October 18, 2011. | ||
|
10.1 |
Form of Indemnification Agreement, incorporated herein by reference to Exhibit 10.1 to the Registrant’s Annual Report on Form 10-K for the fiscal year ended May 29, 2005. | ||
|
10.2* |
Form of Option Agreement for 1995 Directors’ Stock Option Plan, incorporated herein by reference to Exhibit 10.4 to the Registrant’s Annual Report on Form 10-K for the fiscal year ended October 31, 1996. | ||
|
10.3 |
Industrial Real Estate Lease dated March 1, 1993 between the Registrant and Wayne R. Brown & Bibbits Brown, Trustees of the Wayne R. Brown & Bibbits Brown Living Trust dated December 30, 1987, incorporated by reference to Exhibit 10.6 to the Registrant’s Registration Statement on Form S-1 (File No. 33-80723) declared effective on February 12, 1996. | ||
|
10.4* |
Form of Option Agreement for the 1996 Non-Executive Stock Option Plan, as amended, incorporated herein by reference to Exhibit 10.16 to the Registrant’s Annual Report on Form 10-K for the fiscal year ended October 31, 1996. | ||
|
10.5* |
1996 Amended and Restated Stock Option Plan, incorporated herein by reference to Exhibit 10.17 to the Registrant’s Quarterly Report on Form 10-Q for the fiscal quarter ended April 29, 2001. | ||
|
10.6* |
Form of Option Agreement for 1996 Amended and Restated Stock Option Plan, incorporated herein by reference to Exhibit 10.17 to the Registrant’s Quarterly Report on Form 10-Q for the fiscal quarter ended April 30, 1997. | ||
|
10.7* |
New Executive Stock Option Plan, incorporated herein by reference to Exhibit 10.30 to the Registrant’s Annual Report on Form 10-K for the fiscal year ended October 29, 2000. | ||
|
10.8* |
1996 Non-Executive Stock Option Plan, as amended, incorporated herein by reference to Exhibit 10.35 to the Registrant’s Annual Report on Form 10-K for the fiscal year ended October 28, 2001. | ||
|
10.9 |
Supply Agreement between the Registrant and Apio Fresh LLC and the Growers listed therein, dated as of July 3, 2003, incorporated herein by reference to Exhibit 2.3 to the Registrant’s Current Report on Form 8-K dated July 3, 2003. | ||
|
10.10* |
1995 Directors’ Stock Option Plan, as amended, incorporated herein by reference to Exhibit 10.53 to the Registrant’s Annual Report on Form 10-Q for the fiscal quarter ended May 25, 2003. | ||
|
10.11# |
License and research and development agreement between the Registrant and Air Products and Chemicals, Inc. dated March 14, 2006, incorporated herein by reference to Exhibit 10.63 to the Registrant’s Annual Report on Form 10-K for the fiscal year ended May 28, 2006. | ||
|
Exhibit Number: |
Exhibit Title | ||
|
10.12* |
2005 Stock Incentive Plan, incorporated herein by reference to Exhibit 99.1 to the Registrant's Current Report on Form 8-K dated October 14, 2005. | ||
|
| |||
|
10.13* |
Form of Stock Grant Agreement for 2005 Stock Incentive Plan, incorporated herein by reference to Exhibit 99.2 to the Registrant's Current Report on Form 8-K dated October 14, 2005. | ||
|
10.14* |
Form of Notice of Stock Option Grant and Stock Option Agreement for 2005 Stock Incentive Plan, incorporated herein by reference to Exhibit 10.66 to the Registrant’s Annual Report on Form 10-K for the fiscal year ended May 28, 2006. | ||
|
10.15* |
Form of Stock Unit Agreement for 2005 Stock Incentive Plan, incorporated herein by reference to Exhibit 10.67 to the Registrant’s Annual Report on Form 10-K for the fiscal year ended May 28, 2006. | ||
|
10.16* |
Form of Stock Appreciation Right Agreement for 2005 Stock Incentive Plan, incorporated herein by reference to Exhibit 99.5 to the Registrant's Current Report on Form 8-K dated October 14, 2005. | ||
|
10.17 |
Agreement and Plan of Merger between Landec Corporation, a California corporation, and the Registrant, dated as of November 6, 2008, incorporated herein by reference to Exhibit 2.1 to the Registrant’s Current Report on Form 8-K dated November 7, 2008. | ||
|
10.18* |
2009 Stock Incentive Plan, incorporated herein by reference to Exhibit 99.1 to the Registrant's Current Report on Form 8-K dated October 19, 2009. | ||
|
10.19* |
Form of Stock Grant Agreement for 2009 Stock Incentive Plan, incorporated herein by reference to Exhibit 99.2 to the Registrant's Current Report on Form 8-K dated October 19, 2009. | ||
|
10.20* |
Form of Notice of Stock Option Grant and Stock Option Agreement for 2009 Stock Incentive Plan, incorporated herein by reference to Exhibit 99.3 to the Registrant's Current Report on Form 8-K dated October 19, 2009. | ||
|
10.21* |
Form of Stock Unit Agreement for 2009 Stock Incentive Plan, incorporated herein by reference to Exhibit 99.4 to the Registrant's Current Report on Form 8-K dated October 19, 2009. | ||
|
10.22* |
Form of Stock Appreciation Right Agreement for 2009 Stock Incentive Plan, incorporated herein by reference to Exhibit 99.5 to the Registrant's Current Report on Form 8-K dated October 19, 2009. | ||
|
10.23 |
Stock Purchase Agreement by and among the Registrant, Lifecore Biomedical, Inc., Lifecore Biomedical, LLC and Warburg Pincus Private Equity IX, L.P., dated April 30, 2010, incorporated herein by reference to Exhibit 10.1 to the Registrant’s Current Report on Form 8-K dated May 5, 2010. | ||
|
10.24 |
Amended and Restated License, Supply and R&D Agreement dated November 27, 2009 by and among the Registrant, Landec Ag, LLC and Monsanto Company, incorporated by reference to Exhibit 10.25 to the Registrant’s Current Report on Form 8-K dated December 3, 2009. | ||
|
Exhibit Number: |
Exhibit Title | ||
|
10.25 |
Share Purchase Agreement, dated February 15, 2011, by and between Apio, Inc. and Windset Holdings 2010 Ltd., incorporated herein by reference to Exhibit 10.1 to the Registrant’s Current Report on Form 8-K dated February 18, 2011. | ||
|
10.26 |
Stock Purchase Agreement by and among Apio, Inc., GreenLine Holding Company and 2003 Riverside Capital Appreciation Fund, L.P., dated April 23, 2012, incorporated herein by reference to Exhibit 2.1 to the Registrant’s Current Report on Form 8-K dated April 27, 2012. | ||
|
10.27 |
Loan agreements by and between the Registrant, Apio, Inc. and General Electric Capital Corporation dated April 23, 2012, incorporated herein by reference to Exhibits 10.1 through 10.9 to the Registrant’s Current Report on Form 8-K dated May 27, 2012. | ||
|
10.28 |
Credit Agreement and Reimbursement Agreement by and between Lifecore Biomedical, LLC and BMO Harris Bank N.A. dated May 23, 2012, incorporated herein by reference to Exhibits 10.1 and 10.2 to the Registrant’s Current Report on Form 8-K dated May 29, 2012. | ||
|
10.29* |
Long-Term Incentive Plan, incorporated herein by reference to the Registrant’s Current Report on Form 8-K dated July 31, 2013. | ||
|
10.30* |
Employment Agreement between the Registrant and Gregory S. Skinner effective as of January 1, 2013, incorporated herein by reference to Exhibit 10.37 to the Registrant’s Current Report on Form 8-K dated December 10, 2012. | ||
|
10.31* |
Nonqualified Deferred Compensation Plan, incorporated herein by reference to the Registrant’s Current Report on Form 8-K dated July 31, 2013. | ||
|
10.32* |
2013 Stock Incentive Plan, incorporated herein by reference to Exhibit 99.1 to the Registrant's Current Report on Form 8-K dated October 11, 2013. | ||
|
10.33* |
Form of Stock Grant Agreement for 2013 Stock Incentive Plan, incorporated herein by reference to Exhibit 99.2 to the Registrant's Current Report on Form 8-K dated October 11, 2013. | ||
|
10.34* |
Form of Notice of Stock Option Grant and Stock Option Agreement for 2013 Stock Incentive Plan, incorporated herein by reference to Exhibit 99.3 to the Registrant's Current Report on Form 8-K dated October 11, 2013. | ||
|
10.35* |
Form of Stock Unit Agreement for 2013 Stock Incentive Plan, incorporated herein by reference to Exhibit 99.4 to the Registrant's Current Report on Form 8-K dated October 11, 2013. | ||
| 10.36* | Form of Stock Appreciation Right Agreement for 2013 Stock Incentive Plan, incorporated herein by reference to Exhibit 99.5 to the Registrant's Current Report on Form 8-K dated October 11, 2013. | ||
|
10.37* |
2015 Cash Bonus Plan, incorporated herein by reference to the Registrant’s Current Report on Form 8-K dated June 23, 2014. | ||
|
Exhibit Number: |
Exhibit Title | ||
|
10.38* |
Employment Agreement between the Registrant and Gary T. Steele effective as of May 26, 2014, incorporated herein by reference to Exhibit 10.35 to the Registrant’s Current Report on Form 8-K dated June 23, 2014. | ||
|
10.39 |
Stock Transfer Agreement dated July 15, 2014 among Apio, Inc., Newell Capital Corporation and Windset Holdings 2010 Ltd., incorporated herein by reference to Exhibit 10.1 to the Registrant’s Current Report on Form 8-K dated July 21, 2014. | ||
|
10.40 |
Second Amendment to Credit Agreement dated July 17, 2014 among Apio, Inc., Cal-Ex Trading Company, GreenLine Logistics, Inc. and General Electric Capital Corporation, incorporated herein by reference to Exhibit 10.2 to the Registrant’s Current Report on Form 8-K dated July 21, 2014. | ||
|
10.41 |
First Amendment to Loan Agreement dated as of August 28, 2014 among Apio, Inc., Apio Cooling LP and General Electric Capital Corporation, incorporated herein by reference to Exhibit 10.1 to the Registrant’s Current Report on Form 8-K dated September 2, 2014. | ||
|
10.42 |
Promissory Note dated as of August 28, 2014 by Apio, Inc., payable to GE Capital Commercial, Inc., incorporated herein by reference to Exhibit 10.2 to the Registrant’s Current Report on Form 8-K dated September 2, 2014. | ||
|
10.43 |
Third Amendment to Credit Agreement dated as of August 28, 2014 among Apio, Inc., Cal-Ex Trading Company, GreenLine Logistics, Inc. and General Electric Capital Corporation, incorporated herein by reference to Exhibit 10.3 to the Registrant’s Current Report on Form 8-K dated September 2, 2014. | ||
|
10.44 |
Senior B Preferred Share Purchase Agreement dated October 29. 2014 among Apio, Inc. and Windset Holdings 2010 Ltd., incorporated herein by reference to Exhibit 10.1 to the Registrant’s Current Report on Form 8-K dated November 4, 2014. | ||
|
10.45 |
Second Amendment to Loan Agreement dated as of November 24, 2014 among Apio, Inc., Apio Cooling LP and General Electric Capital Corporation, incorporated herein by reference to Exhibit 10.1 to the Registrant’s Current Report on Form 8-K dated December 3, 2014. | ||
|
10.46 |
Promissory Note dated as of November 24, 2014 by Apio, Inc., payable to GE Capital Commercial, Inc., incorporated herein by reference to Exhibit 10.2 to the Registrant’s Current Report on Form 8-K dated December 3, 2014. | ||
|
10.47 |
Proposal Letter dated April 2, 2015 between Banc of America Leasing & Capital, LLC, Apio, Inc. and Landec Corporation, incorporated herein by reference to Exhibit 10.1 to the Registrant’s Current Report on Form 8-K dated May 21, 2015. | ||
|
10.48 |
Master Loan and Security Agreement dated as of May 7, 2015 between Apio, Inc. and Banc of America Leasing & Capital, LLC, incorporated herein by reference to Exhibit 10.2 to the Registrant’s Current Report on Form 8-K dated May 21, 2015. | ||
|
10.49 |
Form of Equipment Security Note between Apio, Inc. and Banc of America Leasing & Capital, LLC, incorporated herein by reference to Exhibit 10.3 to the Registrant’s Current Report on Form 8-K dated May 21, 2015. | ||
|
Exhibit Number: |
Exhibit Title | ||
|
10.50 |
Guaranty dated as of May 7, 2015 between Landec Corporation and Banc of America Leasing & Capital, LLC, incorporated herein by reference to Exhibit 10.4 to the Registrant’s Current Report on Form 8-K dated May 21, 2015. | ||
|
10.51 |
Commitment Letter dated May 15, 2015 between General Electric Capital Corporation and Apio, Inc., incorporated herein by reference to Exhibit 10.5 to the Registrant’s Current Report on Form 8-K dated May 21, 2015. | ||
|
10.52* |
2016 Cash Bonus Plan, incorporated herein by reference to the Registrant’s Current Report on Form 8-K dated May 28, 2015. | ||
|
21.1 |
Subsidiaries of the Registrant at May 31, 2015 |
State of Incorporation | |
|
Apio, Inc. |
Delaware | ||
|
Lifecore Biomedical, Inc. |
Delaware | ||
|
23.1+ |
Consent of Independent Registered Public Accounting Firm | ||
|
24.1+ |
Power of Attorney – See signature page | ||
|
31.1+ |
CEO Certification pursuant to section 302 of the Sarbanes-Oxley Act of 2002 | ||
|
31.2+ |
CFO Certification pursuant to section 302 of the Sarbanes-Oxley Act of 2002 | ||
|
32.1+ |
CEO Certification pursuant to section 906 of the Sarbanes-Oxley Act of 2002 | ||
|
32.2+ |
CFO Certification pursuant to section 906 of the Sarbanes-Oxley Act of 2002 | ||
| 101.INS** | XBRL Instance | ||
| 101.SCH** | XBRL Taxonomy Extension Schema | ||
| 101.CAL** | XBRL Taxonomy Extension Calculation | ||
| 101.DEF** | XBRL Taxonomy Extension Definition | ||
| 101.LAB** | XBRL Taxonomy Extension Labels | ||
| 101.PRE** | XBRL Taxonomy Extension Presentation | ||
| * | Represents a management contract or compensatory plan or arrangement required to be filed as an exhibit to this report pursuant to Item 15(b) of Form 10-K. | ||
| ** |
Information is furnished and not filed or a part of a registration statement or prospectus for purposes of sections 11 or 12 of the Securities Act of 1933, as amended, is deemed not filed for purposes of section 18 of the Securities Exchange Act of 1934, as amended, and otherwise is not subject to liability under these sections. | ||
| + | Filed herewith. | ||
| # | Confidential treatment requested as to certain portions. The term “confidential treatment” and the mark “*” as used throughout the indicated Exhibit means that material has been omitted. | ||
SIGNATURES
Pursuant to the requirements of section 13 or 15(d) of the Securities Exchange Act of 1934, the Registrant has duly caused this Report on Form 10-K to be signed on its behalf by the undersigned, thereunto duly authorized, in the City of Menlo Park, State of California, on July 30, 2015.
|
|
|
| |
|
|
|
LANDEC CORPORATION |
|
|
|
|
|
|
|
|
By: |
/s/ Gregory S. Skinner |
|
|
|
|
Gregory S. Skinner |
|
| Vice President of Finance and Administration | |||
|
|
|
and Chief Financial Officer |
|
POWER OF ATTORNEY
KNOW ALL PERSONS BY THESE PRESENTS, that each person whose signature appears below hereby constitutes and appoints Gary T. Steele and Gregory S. Skinner, and each of them, as his attorney-in-fact, with full power of substitution, for him in any and all capacities, to sign any and all amendments to this Report on Form 10-K, and to file the same, with exhibits thereto and other documents in connection therewith, with the Securities and Exchange Commission, hereby ratifying and confirming our signatures as they may be signed by our said attorney to any and all amendments to said Report on Form 10-K.
Pursuant to the requirements of the Securities Exchange Act of 1934, this Report on Form 10-K has been signed by the following persons in the capacities and on the dates indicated:
|
Signature |
Title |
Date |
|
/s/ Gary T. Steele |
||
|
Gary T. Steele |
President and Chief Executive Officer and Director (Principal Executive Officer) |
July 30, 2015 |
|
/s/ Gregory S. Skinner |
||
|
Gregory S. Skinner |
Vice President of Finance and Administration and Chief Financial Officer (Principal Financial and Accounting Officer) |
July 30, 2015 |
|
/s/ Nicholas Tompkins |
||
|
Nicholas Tompkins |
Chairman of the Board of Apio, Inc. and Director |
July 30, 2015 |
|
/s/ Robert Tobin |
||
|
Robert Tobin |
Director |
July 30, 2015 |
|
/s/ Albert D. Bolles, Ph.D |
||
|
Albert D. Bolles, Ph.D |
Director |
July 30, 2015 |
|
/s/ Frederick Frank |
||
|
Frederick Frank |
Director |
July 30, 2015 |
|
/s/ Steven Goldby |
||
|
Steven Goldby |
Director |
July 30, 2015 |
|
/s/ Richard Dean Hollis |
||
|
Richard Dean Hollis |
Director |
July 30, 2015 |
|
/s/ Catherine A. Sohn |
||
|
Catherine A. Sohn |
Director |
July 30, 2015 |
|
/s/ Tonia Pankopf |
||
|
Tonia Pankopf |
Director |
July 30, 2015 |
EXHIBIT INDEX
|
Exhibit Number |
Exhibit Title | |
|
23.1 |
Consent of Independent Registered Public Accounting Firm | |
|
24.1 |
Power of Attorney. See signature page. | |
|
31.1 |
CEO Certification pursuant to section 302 of the Sarbanes-Oxley Act of 2002. | |
|
31.2 |
CFO Certification pursuant to section 302 of the Sarbanes-Oxley Act of 2002. | |
|
32.1 |
CEO Certification pursuant to section 906 of the Sarbanes-Oxley Act of 2002. | |
|
32.2 |
CFO Certification pursuant to section 906 of the Sarbanes-Oxley Act of 2002. |
- 84 -