Attached files
| file | filename |
|---|---|
| EX-32.1 - EXHIBIT 32.1 - LANDEC CORP \CA\ | ex32-1.htm |
| EX-31.1 - EXHIBIT 31.1 - LANDEC CORP \CA\ | ex31-1.htm |
| EX-32.2 - EXHIBIT 32.2 - LANDEC CORP \CA\ | ex32-2.htm |
| EXCEL - IDEA: XBRL DOCUMENT - LANDEC CORP \CA\ | Financial_Report.xls |
| EX-31.2 - EXHIBIT 31.2 - LANDEC CORP \CA\ | ex31-2.htm |
United States
SECURITIES AND EXCHANGE COMMISSION
Washington, D.C. 20549
FORM 10-Q
|
[X] |
QUARTERLY REPORT PURSUANT TO SECTION 13 OR 15(d) OF THE SECURITIES EXCHANGE ACT OF 1934 |
For the Fiscal Quarter Ended March 1, 2015, or
|
[ ] |
TRANSITION REPORT PURSUANT TO SECTION 13 OR 15(d) OF THE SECURITIES EXCHANGE ACT OF 1934 |
For the transition period from _____ to _________.
Commission file number: 0-27446
LANDEC CORPORATION
(Exact name of registrant as specified in its charter)
|
Delaware |
94-3025618 |
|
(State or other jurisdiction of |
(IRS Employer |
|
incorporation or organization) |
Identification Number) |
3603 Haven Avenue
Menlo Park, California 94025
(Address of principal executive offices, including zip code)
Registrant's telephone number, including area code:
(650) 306-1650
Indicate by check mark whether the registrant (1) has filed all reports required to be filed by Section 13 or 15(d) of the Securities Exchange Act of 1934 during the preceding 12 months (or for such shorter period that the registrant was required to file such reports), and (2) has been subject to such filing requirements for at least the past 90 days.
Yes X No
Indicate by check mark whether the registrant has submitted electronically and posted on its corporate Website, if any, every Interactive Data File required to be submitted and posted pursuant to Rule 405 of Regulation S-T during the preceding 12 months (or for such shorter period that the registrant was required to submit and post such files).
Yes X No
Indicate by check mark whether the registrant is a large accelerated filer, an accelerated filer, a non-accelerated filer or a smaller reporting company. See definition of “large accelerated filer” and “accelerated filer” and “smaller reporting company” in Rule 12b-2 of the Exchange Act.
Large Accelerated Filer ___ Accelerated Filer X
Non Accelerated Filer ___ Smaller Reporting Company ___
Indicate by check mark whether the registrant is a shell company (as defined in Rule 12b-2 of the Exchange Act).
Yes No X
As of March 26, 2015, there were 26,947,394 shares of Common Stock outstanding.
LANDEC CORPORATION
FORM 10-Q For the Fiscal Quarter Ended March 1, 2015
INDEX
|
Page | ||
|
Facing sheet |
1 | |
|
Index |
2 | |
|
Part I. |
Financial Information |
|
|
Item 1. |
Financial Statements |
|
| a) Consolidated Balance Sheets as of March 1, 2015 and May 25, 2014 | 3 | |
|
b) Consolidated Statements of Comprehensive Income for the Three Months and Nine Months Ended March 1, 2015 and February 23, 2014 |
4 | |
|
c) Consolidated Statements of Cash Flows for the Nine Months Ended March 1, 2015 and February 23, 2014 |
5 | |
|
d) Notes to Consolidated Financial Statements |
6 | |
|
Item 2. |
Management's Discussion and Analysis of Financial Condition and Results of Operations |
20 |
|
Item 3. |
Quantitative and Qualitative Disclosures About Market Risk |
30 |
|
Item 4 |
Controls and Procedures |
30 |
|
Part II. |
Other Information |
31 |
| Item 1. | Legal Proceedings | 31 |
|
Item 1A. |
Risk Factors |
31 |
|
Item 2. |
Unregistered Sales of Equity Securities and Use of Proceeds |
31 |
|
Item 3. |
Defaults Upon Senior Securities |
31 |
|
Item 4. |
Mine Safety Disclosures |
31 |
|
Item 5. |
Other Information |
31 |
|
Item 6. |
Exhibits |
31 |
|
Signatures |
32 |
PART I. FINANCIAL INFORMATION
Item 1. Financial Statements
LANDEC CORPORATION
CONSOLIDATED BALANCE SHEETS
(In thousands except shares and per share amounts)
|
March 1, 2015 |
May 25, 2014 |
|||||||
|
(unaudited) |
(1) | |||||||
|
ASSETS |
||||||||
|
Current Assets: |
||||||||
|
Cash and cash equivalents |
$ | 15,695 | $ | 14,243 | ||||
|
Accounts receivable, less allowance for doubtful accounts of $418 and $516 at March 1, 2015 and May 25, 2014, respectively |
45,275 | 44,421 | ||||||
|
Accounts receivable, related party |
35 | 304 | ||||||
|
Income taxes receivable |
1,211 | 2,000 | ||||||
|
Inventories, net |
24,662 | 24,735 | ||||||
|
Deferred taxes |
1,987 | 2,056 | ||||||
|
Prepaid expenses and other current assets |
3,626 | 3,170 | ||||||
|
Total Current Assets |
92,491 | 90,929 | ||||||
|
Investment in non-public company, non-fair value |
— | 793 | ||||||
|
Investment in non-public company, fair value |
61,100 | 39,600 | ||||||
|
Property and equipment, net |
78,960 | 74,140 | ||||||
|
Goodwill, net |
49,620 | 49,620 | ||||||
|
Trademarks/tradenames, net |
48,428 | 48,428 | ||||||
|
Customer relationships, net |
8,056 | 8,720 | ||||||
|
Other assets |
1,648 | 1,393 | ||||||
|
Total Assets |
$ | 340,303 | $ | 313,623 | ||||
|
LIABILITIES AND STOCKHOLDERS’ EQUITY |
||||||||
|
Current Liabilities: |
||||||||
|
Accounts payable |
$ | 28,166 | $ | 31,981 | ||||
|
Accounts payable, related party |
146 | 134 | ||||||
|
Accrued compensation |
4,744 | 4,096 | ||||||
|
Other accrued liabilities |
4,791 | 4,871 | ||||||
|
Deferred revenue |
1,102 | 1,254 | ||||||
|
Lines of credit |
9,300 | — | ||||||
|
Current portion of long-term debt |
7,591 | 6,055 | ||||||
|
Total Current Liabilities |
55,840 | 48,391 | ||||||
|
Long-term debt, less current portion |
32,901 | 28,317 | ||||||
|
Deferred taxes |
34,377 | 30,133 | ||||||
|
Other non-current liabilities |
1,686 | 2,021 | ||||||
|
Total Liabilities |
124,804 | 108,862 | ||||||
|
Stockholders’ Equity: |
||||||||
|
Common stock, $0.001 par value; 50,000,000 shares authorized; 26,898,178 and 26,815,253 shares issued and outstanding at March 1, 2015 and May 25, 2014, respectively |
27 | 27 | ||||||
|
Additional paid-in capital |
132,948 | 131,488 | ||||||
|
Retained earnings |
80,902 | 71,554 | ||||||
|
Total Stockholders’ Equity |
213,877 | 203,069 | ||||||
|
Non-controlling interest |
1,622 | 1,692 | ||||||
|
Total Equity |
215,499 | 204,761 | ||||||
|
Total Liabilities and Stockholders’ Equity |
$ | 340,303 | $ | 313,623 | ||||
(1) Derived from audited financial statements.
See accompanying notes.
LANDEC CORPORATION
CONSOLIDATED STATEMENTS OF COMPREHENSIVE INCOME
(Unaudited)
(In thousands, except per share amounts)
|
Three Months Ended |
Nine Months Ended |
|||||||||||||||
|
March 1, 2015 |
February 23, 2014 |
March 1, 2015 |
February 23, 2014 |
|||||||||||||
|
Product sales |
$ | 138,530 | $ | 126,379 | $ | 404,809 | $ | 355,884 | ||||||||
|
Cost of product sales |
121,645 | 106,224 | 358,071 | 309,463 | ||||||||||||
|
Gross profit |
16,885 | 20,155 | 46,738 | 46,421 | ||||||||||||
|
Operating costs and expenses: |
||||||||||||||||
|
Research and development |
1,755 | 1,723 | 5,375 | 5,568 | ||||||||||||
|
Selling, general and administrative |
10,298 | 8,700 | 29,106 | 25,969 | ||||||||||||
|
Total operating costs and expenses |
12,053 | 10,423 | 34,481 | 31,537 | ||||||||||||
|
Operating income |
4,832 | 9,732 | 12,257 | 14,884 | ||||||||||||
|
Dividend income |
413 | 281 | 1,015 | 844 | ||||||||||||
|
Interest income |
85 | 78 | 269 | 183 | ||||||||||||
|
Interest expense |
(510 | ) | (390 | ) | (1,365 | ) | (1,257 | ) | ||||||||
|
Other income |
1,307 | 400 | 2,707 | 8,100 | ||||||||||||
|
Net income before taxes |
6,127 | 10,101 | 14,883 | 22,754 | ||||||||||||
|
Income tax expense |
(2,324 | ) | (3,679 | ) | (5,409 | ) | (8,028 | ) | ||||||||
|
Consolidated net income |
3,803 | 6,422 | 9,474 | 14,726 | ||||||||||||
|
Non-controlling interest |
(31 | ) | (22 | ) | (126 | ) | (123 | ) | ||||||||
|
Net income and comprehensive income applicable to common stockholders |
$ | 3,772 | $ | 6,400 | $ | 9,348 | $ | 14,603 | ||||||||
|
Basic net income per share |
$ | 0.14 | $ | 0.24 | $ | 0.35 | $ | 0.55 | ||||||||
|
Diluted net income per share |
$ | 0.14 | $ | 0.24 | $ | 0.34 | $ | 0.54 | ||||||||
|
Shares used in per share computation |
||||||||||||||||
|
Basic |
26,886 | 26,697 | 26,863 | 26,574 | ||||||||||||
|
Diluted |
27,363 | 27,124 | 27,314 | 27,093 | ||||||||||||
See accompanying notes.
LANDEC CORPORATION
Consolidated StatementS of Cash Flows
(Unaudited)
(In thousands)
|
Nine Months Ended |
||||||||
|
March 1, 2015 |
February 23, 2014 |
|||||||
|
Cash flows from operating activities: |
||||||||
|
Consolidated net income |
$ | 9,474 | $ | 14,726 | ||||
|
Adjustments to reconcile net income to net cash provided by operating activities: |
||||||||
|
Depreciation and amortization |
5,177 | 5,364 | ||||||
|
Stock-based compensation expense |
1,139 | 992 | ||||||
|
Tax benefit from stock-based compensation expense |
(277 | ) | (1,909 | ) | ||||
|
Impairment of non-public company, non-fair value investment |
793 | — | ||||||
|
Net (gain) loss on disposal of property and equipment |
(53 | ) | 330 | |||||
|
Deferred taxes |
4,313 | 5,286 | ||||||
|
Change in investment in non-public company, fair value |
(3,500 | ) | (8,100 | ) | ||||
|
Changes in current assets and current liabilities: |
||||||||
|
Accounts receivable, net |
(854 | ) | (4,969 | ) | ||||
|
Accounts receivable, related party |
269 | 482 | ||||||
|
Income taxes receivable |
1,000 | 2,798 | ||||||
|
Inventories, net |
73 | (1,555 | ) | |||||
|
Issuance of notes and advances receivable |
(4,742 | ) | — | |||||
|
Collection of notes and advances receivable |
4,727 | — | ||||||
|
Prepaid expenses and other current assets |
(441 | ) | (203 | ) | ||||
|
Accounts payable |
(3,815 | ) | (1,845 | ) | ||||
|
Accounts payable, related party |
12 | (677 | ) | |||||
|
Accrued compensation |
648 | 147 | ||||||
|
Other accrued liabilities |
(415 | ) | 2,541 | |||||
|
Deferred revenue |
(152 | ) | 426 | |||||
|
Net cash provided by operating activities |
13,376 | 13,834 | ||||||
|
Cash flows from investing activities: |
||||||||
|
Purchases of property and equipment |
(10,202 | ) | (10,192 | ) | ||||
|
Investment in non-public company, fair value |
(18,000 | ) | — | |||||
|
Purchase of marketable securities |
— | (1,417 | ) | |||||
|
Proceeds from maturities of marketable securities |
— | 2,962 | ||||||
|
Proceeds from sale of fixed assets |
922 | — | ||||||
|
Net cash used in investing activities |
(27,280 | ) | (8,647 | ) | ||||
|
Cash flows from financing activities: |
||||||||
|
Proceeds from sale of common stock |
122 | 2,147 | ||||||
|
Taxes paid by Company for stock swaps and RSUs |
(12 | ) | (1,252 | ) | ||||
|
Tax benefit from stock-based compensation expense |
277 | 1,909 | ||||||
|
Proceeds from long-term debt |
11,194 | — | ||||||
|
Payments on long-term debt |
(5,074 | ) | (4,525 | ) | ||||
|
Proceeds from lines of credit |
30,417 | 3,500 | ||||||
|
Payments on lines of credit |
(21,117 | ) | (7,500 | ) | ||||
|
Change in other assets |
(255 | ) | 29 | |||||
|
Payments to minority interest holders |
(196 | ) | (226 | ) | ||||
|
Net cash provided by (used in) financing activities |
15,356 | (5,918 | ) | |||||
|
Net decrease in cash and cash equivalents |
1,452 | (731 | ) | |||||
|
Cash and cash equivalents at beginning of period |
14,243 | 13,718 | ||||||
|
Cash and cash equivalents at end of period |
$ | 15,695 | $ | 12,987 | ||||
See accompanying notes.
LANDEC CORPORATION
NOTES TO CONSOLIDATED FINANCIAL STATEMENTS
(Unaudited)
|
1. |
Organization, Basis of Presentation and Summary of Significant Accounting Policies |
Organization
Landec Corporation and its subsidiaries (“Landec” or the “Company”) design, develop, manufacture and sell differentiated products for food and biomaterials markets and license technology applications to partners. The Company has two proprietary polymer technology platforms: 1) Intelimer® polymers, and 2) hyaluronan (“HA”) biopolymers. The Company sells specialty packaged branded Eat Smart® and GreenLine® and private label fresh-cut vegetables and whole produce to retailers, club stores and foodservice operators, primarily in the United States, Canada and Asia through its Apio, Inc. (“Apio”) subsidiary and sells HA-based biomaterials through its Lifecore Biomedical, Inc. (“Lifecore”) subsidiary. The Company’s HA biopolymers are proprietary in that they are specially formulated for specific customers to meet strict regulatory requirements. The Company’s polymer technologies, along with its customer relationships and tradenames, are the foundation, and a key differentiating advantage upon which Landec has built its business.
Basis of Presentation
The accompanying unaudited consolidated financial statements of Landec have been prepared in accordance with accounting principles generally accepted in the United States for interim financial information and with the instructions for Form 10-Q and Article 10 of Regulation S-X. In the opinion of management, all adjustments (consisting of normal recurring accruals) have been made which are necessary to present fairly the financial position at March 1, 2015 and the results of operations and cash flows for all periods presented. Although Landec believes that the disclosures in these financial statements are adequate to make the information presented not misleading, certain information normally included in financial statements and related footnotes prepared in accordance with accounting principles generally accepted in the United States have been condensed or omitted in accordance with the rules and regulations of the Securities and Exchange Commission. The accompanying financial data should be reviewed in conjunction with the audited financial statements and accompanying notes included in Landec's Annual Report on Form 10-K for the fiscal year ended May 25, 2014.
The results of operations for the nine months ended March 1, 2015 are not necessarily indicative of the results that may be expected for an entire fiscal year because there is some seasonality in Apio’s food business, particularly, Apio’s Food Export business and the order patterns of Lifecore’s customers which may lead to significant fluctuations in Landec’s quarterly results of operations. In addition, the first quarter of fiscal year 2015 was a 14-week quarter which occurs once every six years compared to the standard 13-week quarter.
Basis of Consolidation
The consolidated financial statements are presented on the accrual basis of accounting in accordance with accounting principles generally accepted in the United States and include the accounts of Landec Corporation and its subsidiaries, Apio and Lifecore. All material inter-company transactions and balances have been eliminated.
Arrangements that are not controlled through voting or similar rights are reviewed under the guidance for variable interest entities (“VIEs”). A company is required to consolidate the assets, liabilities and operations of a VIE if it is determined to be the primary beneficiary of the VIE.
An entity is a VIE and subject to consolidation, if by design: a) the total equity investment at risk is not sufficient to permit the entity to finance its activities without additional subordinated financial support provided by any parties, including equity holders or b) as a group the holders of the equity investment at risk lack any one of the following three characteristics: (i) the power, through voting rights or similar rights to direct the activities of an entity that most significantly impact the entity’s economic performance, (ii) the obligation to absorb the expected losses of the entity, or (iii) the right to receive the expected residual returns of the entity. The Company reviewed the consolidation guidance and concluded that its partnership interest in Apio Cooling and its equity investments in non-public companies are not VIEs.
Use of Estimates
The preparation of financial statements in conformity with accounting principles generally accepted in the United States requires management to make certain estimates and judgments that affect the amounts reported in the financial statements and accompanying notes. The accounting estimates that require management’s most significant and subjective judgments include revenue recognition; sales returns and allowances; self insurance liabilities; recognition and measurement of current and deferred income tax assets and liabilities; the assessment of recoverability of long-lived assets; the valuation of intangible assets and inventory; the valuation of investments; and the valuation and recognition of stock-based compensation.
These estimates involve the consideration of complex factors and require management to make judgments. The analysis of historical and future trends can require extended periods of time to resolve and is subject to change from period to period. Actual results may differ from management’s estimates.
Cash and Cash Equivalents
The Company records all highly liquid securities with three months or less from date of purchase to maturity as cash equivalents. Cash equivalents consisted of money market funds of $1.5 million at both March 1, 2015 and May 25, 2014. The market value of cash equivalents approximates their historical cost given their short-term nature.
Financial Instruments
The Company’s financial instruments are primarily composed of marketable securities, commercial-term trade payables, grower advances, notes receivable and debt instruments. For short-term instruments, the historical carrying amount approximates the fair value of the instrument. The fair value of long-term debt and lines of credit approximates their carrying value. Fair values for long-term financial instruments not readily marketable are estimated based upon discounted future cash flows at prevailing market interest rates. Based on these assumptions, management believes the fair values of the Company’s financial instruments are not materially different from their recorded amounts as of March 1, 2015 and May 25, 2014.
Investments in Non-Public Companies
The Company’s investment in Aesthetic Sciences Corporation (“Aesthetic Sciences”), which had been reported as an investment in non-public company, non-fair value, in the accompanying Consolidated Balance Sheets, was carried at cost and adjusted for prior impairment losses. Based on recently received financial information from the acquirer of Aesthetic Sciences’ Smartfill™ Injector System (see Note 2), the Company determined during the three months ended March 1, 2015 that its investment was other than temporarily impaired and therefore, wrote off its remaining investment of $793,000 as of March 1, 2015.
On February 15, 2011, Apio purchased 150,000 senior preferred shares for $15 million and 201 common shares for $201 that were issued by Windset Holdings 2010 Ltd., a Canadian corporation (“Windset”). On July 15, 2014, Apio increased its investment in Windset by purchasing an additional 68 shares of common stock and 51,211 shares of junior preferred stock of Windset for $11.0 million. On October 29, 2014, Apio purchased an additional 70,000 senior preferred shares of Windset for $7.0 million. These investments are reported as an investment in non-public company, fair value, in the accompanying Consolidated Balance Sheets as of March 1, 2015 and May 25, 2014. The Company has elected to account for its investment in Windset under the fair value option (see Note 2).
Intangible Assets
The Company’s intangible assets are comprised of customer relationships with a finite estimated useful life of twelve to thirteen years and trademarks, tradenames and goodwill with indefinite lives.
Finite-lived intangible assets are reviewed for possible impairment whenever events or changes in circumstances occur that indicate that the carrying amount of an asset (or asset group) may not be recoverable. Indefinite lived intangible assets are reviewed for impairment at least annually. For non-goodwill indefinite-lived intangible assets, the Company performs a qualitative analysis in accordance with ASC 350-30-35. For goodwill, the Company has historically performed a quantitative analysis in accordance with ASC 350-20-35.
Partial Self-Insurance on Employee Health Plan
The Company provides health insurance benefits to eligible employees under a self-insured plan whereby the Company pays actual medical claims subject to certain stop loss limits. The Company records self-insurance liabilities based on actual claims filed and an estimate of those claims incurred but not reported. Any projection of losses concerning the Company's liability is subject to a high degree of variability. Among the causes of this variability are unpredictable external factors such as inflation rates, changes in severity, benefit level changes, medical costs, and claims settlement patterns. This self-insurance liability is included in accrued liabilities and represents management's best estimate of the amounts that have not been paid as of March 1, 2015 and May 25, 2014. It is reasonably possible that the expense the Company ultimately incurs could differ and adjustments to future reserves may be necessary.
Long-Term Incentive Plan
On July 25, 2013, the Landec Long-Term Incentive Plan (“LTIP”) was established which allows certain executives to earn a performance-based bonus that is based upon a cumulative operating income target for fiscal years 2014, 2015, and 2016. The LTIP was designed to align the interests of management with the long-term financial success of the Company. If the three-year cumulative operating income target had been met, approximately $2.0 million in bonuses would have been paid. Through fiscal year 2014, the Company was recording the estimated plan bonus on a straight-line basis over the 36-month LTIP period. As of August 31, 2014, the Company determined it was unlikely the three-year cumulative operating income target would be attained and therefore all LTIP bonus accruals were reversed at that date. The reversal resulted in a $677,000 reduction in selling, general, and administrative expenses during the nine months ended March 1, 2015 in the accompanying Consolidated Statements of Comprehensive Income. The long-term incentive bonuses accrued under this plan of zero and $677,000 are included in other non-current liabilities in the accompanying Consolidated Balance Sheets as of March 1, 2015 and May 25, 2014, respectively.
Fair Value Measurements
The Company uses fair value measurement accounting for financial assets and liabilities and for financial instruments and certain other items measured at fair value. The Company has elected the fair value option for its investment in a non-public company (see Note 2). The Company has not elected the fair value option for any of its other eligible financial assets or liabilities.
The accounting guidance established a three-tier hierarchy for fair value measurements, which prioritizes the inputs used in measuring fair value as follows:
|
|
Level 1 – |
observable inputs such as quoted prices for identical instruments in active markets. |
|
|
|
|
|
|
Level 2 – |
inputs other than quoted prices in active markets that are observable either directly or indirectly through corroboration with observable market data. |
|
|
|
|
|
|
Level 3 – |
unobservable inputs in which there is little or no market data, which would require the Company to develop its own assumptions. |
As of March 1, 2015, the Company held certain assets and liabilities that are required to be measured at fair value on a recurring basis, including an interest rate swap and a minority interest investment in Windset.
The fair value of the Company’s interest rate swap is determined based on model inputs that can be observed in a liquid market, including yield curves, and is categorized as a Level 2 measurement.
The Company has elected the fair value option of accounting for its investment in Windset. The calculation of fair value utilizes significant unobservable inputs, including projected cash flows, growth rates and discount rates. As a result, the Company’s investment in Windset is considered to be a Level 3 measurement investment. The change in the fair value of the Company’s investment in Windset for the nine months ended March 1, 2015 was due to the Company’s 26.9% minority interest in the change in the fair market value of Windset during the period. In determining the fair value of the investment in Windset, the Company utilizes the following significant unobservable inputs in the discounted cash flow models:
|
At March 1, 2015 |
At May 25, 2014 |
|||||||||
|
Revenue growth rates |
4% | 4% | ||||||||
|
Expense growth rates |
4% | 4% | ||||||||
|
Income tax rates |
15% | 15% | ||||||||
|
Discount rates |
15% | to | 21% | 16% | to | 22% | ||||
The revenue growth, expense growth and income tax rate assumptions, consider the Company's best estimate of the trends in those items over the discount period. The discount rate assumption takes into account the risk-free rate of return, the market equity risk premium and the company’s specific risk premium and then applies an additional discount for lack of liquidity of the underlying securities. The discounted cash flow valuation model used by the Company has the following sensitivity to changes in inputs and assumptions (in thousands):
|
Impact on value of Windset investment as of March 1, 2015 |
||||
|
10% increase in revenue growth rates |
$ | 2,100 | ||
|
10% increase in expense growth rates |
$ | (1,800 | ) | |
|
10% increase in income tax rates |
$ | (100 | ) | |
|
10% increase in discount rates |
$ | (1,700 | ) | |
Imprecision in estimating unobservable market inputs can affect the amount of gain or loss recorded for a particular position. The use of different methodologies or assumptions to determine the fair value of certain financial instruments could result in a different estimate of fair value at the reporting date.
The following table summarizes the fair value of the Company’s assets and liabilities that are measured at fair value on a recurring basis, as of March 1, 2015 and May 25, 2014 (in thousands):
|
Fair Value at March 1, 2015 |
Fair Value at May 25, 2014 |
|||||||||||||||||||||||
|
|
Level 1 |
Level 2 |
Level 3 |
Level 1 |
Level 2 |
Level 3 |
||||||||||||||||||
| Assets: | ||||||||||||||||||||||||
|
Investment in private company |
- | - | 61,100 | - | - | 39,600 | ||||||||||||||||||
|
Total |
$ | - | $ | - | $ | 61,100 | $ | - | $ | - | $ | 39,600 | ||||||||||||
|
Liabilities: |
||||||||||||||||||||||||
|
Interest rate swap |
- | 2 | - | - | 44 | - | ||||||||||||||||||
|
Total |
$ | - | $ | 2 | $ | - | $ | - | $ | 44 | $ | - | ||||||||||||
Revenue Recognition
Revenue from product sales is recognized when there is persuasive evidence that an arrangement exists, title has transferred, the price is fixed and determinable, and collectability is reasonably assured. Allowances are established for estimated uncollectible amounts, product returns, and discounts based on specific identification and historical losses.
Apio’s Food Products Technology revenues generally consist of revenues generated from the sale of specialty packaged fresh-cut and whole value-added processed vegetable products that are generally washed and packaged in the Company’s proprietary packaging and sold under Apio’s Eat Smart and GreenLine brands and various private labels. Revenue is generally recognized upon shipment of these products to customers. The Company takes title to all produce it trades and/or packages, and therefore, records revenues and cost of sales at gross amounts in the Consolidated Statements of Comprehensive Income.
In addition, Food Products Technology value-added revenues include the revenues generated from Apio Cooling, LP, a vegetable cooling operation in which Apio is the general partner with a 60% ownership position and from the sale of BreatheWay packaging to license partners. Revenue is recognized on the vegetable cooling operations as cooling and storage services are provided to the Company’s customers. Sales of BreatheWay packaging are recognized when shipped to the customer.
Apio’s Food Export revenues consist of revenues generated from the purchase and sale of primarily whole commodity fruit and vegetable products to Asia by Cal-Ex. As most Cal-Ex customers are in countries outside of the U.S., title transfers and revenue is generally recognized upon arrival of the shipment in the foreign port. Apio records revenue equal to the sale price to third parties because it takes title to the product while in transit.
The HA-based Biomaterials business principally generates revenue through the sale of products containing HA. Lifecore primarily sells products to customers in three medical areas: (1) Ophthalmic, which represented approximately 60% of Lifecore’s revenues in fiscal year 2014, (2) Orthopedic, which represented approximately 20% of Lifecore’s revenues in fiscal year 2014 and (3) Veterinary/Other. The vast majority of revenues from the Company’s HA-based Biomaterials business are recognized upon shipment.
Lifecore’s business development revenues, a portion of which are included in all three medical areas, are related to contract research and development (R&D) services and multi-element arrangement services with customers where the Company provides products and/or services in a bundled arrangement.
Contract R&D revenue is recorded as earned, based on the performance requirements of the contract. Non-refundable contract fees for which no further performance obligations exist, and there is no continuing involvement by the Company, are recognized on the earlier of when the payment is received or collection is assured.
For sales arrangements that contain multiple elements, the Company splits the arrangement into separate units of accounting if the individually delivered elements have value to the customer on a standalone basis. The Company also evaluates whether multiple transactions with the same customer or related party should be considered part of a multiple element arrangement, whereby the Company assesses, among other factors, whether the contracts or agreements are negotiated or executed within a short time frame of each other or if there are indicators that the contracts are negotiated in contemplation of each other. The Company then allocates revenue to each element based on a selling price hierarchy. The relative selling price for a deliverable is based on its vendor-specific objective evidence (VSOE), if available, third-party evidence (TPE), if VSOE is not available, or estimated selling price, if neither VSOE nor TPE is available. The Company then recognizes revenue on each deliverable in accordance with its policies for product and service revenue recognition. The Company is not typically able to determine VSOE or TPE, and therefore, uses the estimated selling price to allocate revenue between the elements of an arrangement.
The Company limits the amount of revenue recognition for delivered elements to the amount that is not contingent on the future delivery of products or services or future performance obligations or subject to customer-specific cancellation rights. The Company evaluates each deliverable in an arrangement to determine whether it represents a separate unit of accounting. A deliverable constitutes a separate unit of accounting when it has stand-alone value, and for an arrangement that includes a general right of return relative to the delivered products or services, delivery or performance of the undelivered product or service is considered probable and is substantially controlled by the Company. The Company considers a deliverable to have stand-alone value if the product or service is sold separately by the Company or another vendor or could be resold by the customer. Further, the revenue arrangements generally do not include a general right of return relative to delivered products. Where the aforementioned criteria for a separate unit of accounting are not met, the deliverable is combined with the undelivered element(s) and treated as a single unit of accounting for the purposes of allocation of the arrangement consideration and revenue recognition. The Company allocates the total arrangement consideration to each separable element of an arrangement based upon the relative selling price of each element. Allocation of the consideration is determined at arrangement inception on the basis of each unit’s relative selling price. In instances where the Company has not established fair value for any undelivered element, revenue for all elements is deferred until delivery of the final element is completed and all recognition criteria are met.
Licensing revenue is recognized in accordance with prevailing accounting guidance. Initial license fees are deferred and amortized to revenue over the period of the agreement when a contract exists, the fee is fixed and determinable, and collectability is reasonably assured. Noncancellable, nonrefundable license fees are recognized over the period of the agreement, including those governing research and development activities and any related supply agreement entered into concurrently with the license when the risk associated with commercialization of a product is non-substantive at the outset of the arrangement.
From time to time, the Company offers customers sales incentives, which include volume rebates and discounts. These amounts are estimated on a quarterly basis and recorded as a reduction of revenue.
A summary of revenues by type of revenue arrangement as described above is as follows (in thousands):
|
Three months ended March 1, 2015 |
Three months ended February 23, 2014 |
Nine months ended March 1, 2015 |
Nine months ended February 23, 2014 |
|||||||||||||
|
Recorded upon shipment |
$ | 128,502 | $ | 112,902 | $ | 344,506 | $ | 295,314 | ||||||||
|
Recorded upon acceptance in foreign port |
8,086 | 10,677 | 56,779 | 55,006 | ||||||||||||
|
Revenue from license fees, R&D contracts and royalties/profit sharing |
153 | 447 | 788 | 648 | ||||||||||||
|
Revenue from multiple element arrangements |
1,789 | 2,353 | 2,736 | 4,916 | ||||||||||||
|
Total |
$ | 138,530 | $ | 126,379 | $ | 404,809 | $ | 355,884 | ||||||||
New Accounting Pronouncements
Revenue Recognition
In May 2014, the FASB issued Accounting Standard Update (“ASU”) No. 2014-09, Revenue from Contracts with Customers (Topic 606) ("ASU 2014-09"), which outlines a single comprehensive model for entities to use in accounting for revenue arising from contracts with customers and supersedes most current revenue recognition guidance, including industry-specific guidance. The standard requires entities to recognize revenue to depict the transfer of promised goods or services to customers in an amount that reflects the consideration to which the entity expects to be entitled in exchange for those goods or services. The new guidance also includes a cohesive set of disclosure requirements intended to provide users of financial statements with comprehensive information about the nature, amount, timing, and uncertainty of revenue and cash flows arising from a company’s contracts with customers. ASU 2014-09 will be effective beginning the first quarter of the Company's fiscal year 2018 and early application is not permitted. The standard allows for either “full retrospective” adoption, meaning the standard is applied to all of the periods presented, or “modified retrospective” adoption, meaning the standard is applied only to the most current period presented in the financial statements. Management is currently evaluating the effect ASU 2014-09 will have on the Company's Consolidated Financial Statements and disclosures.
|
2. |
Investments in non-public companies |
In December 2005, Landec entered into a licensing agreement with Aesthetic Sciences for the exclusive rights to use Landec's Intelimer® materials technology for the development of dermal fillers worldwide under the agreement. The Company received shares of preferred stock in exchange for the license. Aesthetic Sciences sold the rights to its Smartfil Injector System on July 16, 2010. The royalty period from the sale of the Smartfil Injector System began November 1, 2014 and as a result the Company obtained for the first time during the third quarter of fiscal year 2015 financial information for the products for which a royalty is due Aesthetic Sciences. Based on the review of this historical financial information and discussions with the acquirer, the Company concluded that its investment in Aesthetic Sciences was other than temporarily impaired, and therefore wrote off its remaining $793,000 investment in Aesthetic Sciences as of March 1, 2015 and is included in other income in the Consolidated Statements of Comprehensive Income.
On February 15, 2011, Apio entered into a share purchase agreement (the “Windset Purchase Agreement”) with Windset. Pursuant to the Windset Purchase Agreement, Apio purchased from Windset 150,000 Senior A preferred shares for $15 million and 201 common shares for $201. On July 15, 2014, Apio increased its investment in Windset by purchasing from the Newell Capital Corporation an additional 68 shares of common stock and 51,211 shares of junior preferred stock of Windset for $11.0 million. After this purchase, the Company’s common shares represent a 26.9% ownership interest in Windset. The non-voting Senior A preferred shares yield a cash dividend of 7.5% annually. The dividend is payable within 90 days of each anniversary of the execution of the Windset Purchase Agreement The non-voting junior preferred stock does not yield a dividend unless declared by the Board of Directors of Windset and no such dividend has been declared.
The Windset Purchase Agreement includes a put and call option, which can be exercised on the sixth anniversary of the Windset Purchase Agreement whereby Apio can exercise the put to sell its common, Senior A preferred shares and junior preferred shares to Windset, or Windset can exercise the call to purchase those shares from Apio, in either case, at a price equal to 26.9% of the appreciation in the fair market value of Windset’s common shares from the date of the Company’s investment through the put and call date, plus the liquidation value of the preferred shares of $20.1 million ($15 million for the Senior A preferred shares and $5.1 million for the junior preferred shares). Under the terms of the arrangement with Windset, the Company is entitled to designate one of five members on the Board of Directors of Windset.
On October 29, 2014, Apio further increased its investment in Windset by purchasing 70,000 shares of Senior B preferred shares. The Senior B Preferred Stock pays an annual dividend of 7.5% on the amount outstanding at each anniversary date of the Windset Purchase Agreement. The Senior B shares purchased by Apio have a put feature whereby Apio can sell back to Windset $1.5 million of shares on the first anniversary, an additional $2.75 million of shares on the second anniversary and the remaining $2.75 million on the third anniversary. After the third anniversary, Apio may at any time put any or all of the shares not previously sold back to Windset. At any time on or after February 15, 2017, Windset has the right to call any or all of the outstanding common shares and at such time must also call the same proportion of Senior A preferred shares, Senior B preferred shares and junior preferred shares owned by Apio. Windset’s partial call provision is restricted such that a partial call cannot result in Apio holding less than 10% of Windset’s common shares outstanding.
The investment in Windset does not qualify for equity method accounting as the investment does not meet the criteria of in-substance common stock due to returns through the annual dividend on the non-voting senior preferred shares that are not available to the common stock holders. As the put and call options require the Purchased Shares to be put or called in equal proportions, the Company has deemed that the investment, in substance, should be treated as a single security for purposes of accounting.
During the three months ended March 1, 2015 and February 23, 2014, the Company recorded $413,000 and $281,000, respectively, in dividend income. During the nine months ended, March 1, 2015 and February 23, 2014, the Company recorded $1.0 million and $844,000, respectively, in dividend income. The change in the fair market value of the Company’s investment in Windset for the three months ended March 1, 2015 and February 23, 2014 was $2.1 million and $400,000, respectively, and is included in other income in the Consolidated Statements of Comprehensive Income. The change in the fair market value of the Company’s investment in Windset for the nine months ended March 1, 2015 and February 23, 2014 was $3.5 million and $8.1 million, respectively, and is included in other income in the Consolidated Statements of Comprehensive Income.
The Company also entered into an exclusive license agreement with Windset, which was executed in June 2010, prior to contemplation of Apio’s investment in Windset. The license agreement allows Windset the use of Landec’s proprietary breathable packaging to extend the shelf life of greenhouse grown cucumbers, peppers and tomatoes (“Exclusive Products”). In accordance with the agreement, Apio received and recorded a one-time upfront research and development fee of $100,000 and will receive license fees equal to 3% of net revenue of the Exclusive Products utilizing the proprietary breathable packaging technology, with or without the BreatheWay® trademark. The ongoing license fees are subject to annual minimums of $150,000 for each of the three types of exclusive product as each is added to the agreement. As of March 1, 2015, two products have been added to the agreement.
|
3. |
Stock-Based Compensation |
The Company records compensation expense for stock-based awards issued to employees and directors in exchange for services provided based on the estimated fair value of the awards on their grant dates and is recognized over the required service periods (generally the vesting period). For nonstatutory options, the cash flows resulting from the tax benefit due to tax deductions in excess of the compensation expense recognized for those options (excess tax benefit) are classified as financing activities within the statement of cash flows. The Company’s stock-based awards include stock option grants and restricted stock unit awards (“RSUs”).
The following table summarizes the stock-based compensation for options and RSUs (in thousands):
|
Three Months Ended March 1, 2015 |
Three Months Ended February 23, 2014 |
Nine Months Ended March 1, 2015 |
Nine Months Ended February 23, 2014 |
|||||||||||||
|
Options |
$ | 139,000 | $ | 131,000 | $ | 394,000 | $ | 416,000 | ||||||||
|
RSUs |
252,000 | 222,000 | 745,000 | 576,000 | ||||||||||||
|
Total stock-based compensation |
$ | 391,000 | $ | 353,000 | $ | 1,139,000 | $ | 992,000 | ||||||||
The following table summarizes the stock-based compensation by income statement line item:
|
Three Months Ended March 1, 2015 |
Three Months Ended February 23, 2014 |
Nine Months Ended March 1, 2015 |
Nine Months Ended February 23, 2014 |
|||||||||||||
|
Research and development |
$ | 8,000 | $ | 14,000 | $ | 28,000 | $ | 28,000 | ||||||||
|
Sales, general and administrative |
383,000 | 339,000 | 1,111,000 | 964,000 | ||||||||||||
|
Total stock-based compensation |
$ | 391,000 | $ | 353,000 | $ | 1,139,000 | $ | 992,000 | ||||||||
The estimated fair value for stock options, which determines the Company’s calculation of compensation expense, is based on the Black-Scholes option pricing model. RSUs are valued at the closing market price of the Company’s common stock on the date of grant. The Company uses the straight line single option method to calculate and recognize the fair value of stock-based compensation arrangements. In addition, the Company uses historical data to estimate pre-vesting forfeitures and records stock-based compensation expense only for those awards that are expected to vest and revises those estimates in subsequent periods if the actual forfeitures differ from the prior estimates.
As of March 1, 2015, there was $2.2 million of total unrecognized compensation expense related to unvested equity compensation awards granted under the Landec incentive stock plans. Total expense is expected to be recognized over the weighted-average period of 1.8 years for stock options and 1.7 years for RSUs.
|
4. |
Diluted Net Income Per Share |
The following table calculates diluted net income per share (in thousands, except per share amounts):
|
Three Months Ended March 1, 2015 |
Three Months Ended February 23, 2014 |
Nine Months Ended March 1, 2015 |
Nine Months Ended February 23, 2014 |
|||||||||||||
|
Numerator: |
||||||||||||||||
|
Net income applicable to Common Stockholders |
$ | 3,772 | $ | 6,400 | $ | 9,348 | $ | 14,603 | ||||||||
|
Denominator: |
||||||||||||||||
|
Weighted average shares for basic net income per share |
26,886 | 26,697 | 26,863 | 26,574 | ||||||||||||
|
Effect of dilutive securities: |
||||||||||||||||
|
Stock options and restricted stock units |
477 | 427 | 451 | 519 | ||||||||||||
|
Weighted average shares for diluted net income per share |
27,363 | 27,124 | 27,314 | 27,093 | ||||||||||||
|
Diluted net income per share |
$ | 0.14 | $ | 0.24 | $ | 0.34 | $ | 0.54 | ||||||||
For the three months ended March 1, 2015 and February 23, 2014, the computation of the diluted net income per share excludes the impact of options to purchase 390,657 shares and 342,500 shares of Common Stock, respectively, as such impacts would be antidilutive for these periods.
For the nine months ended March 1, 2015 and February 23, 2014, the computation of the diluted net income per share excludes the impact of options to purchase 349,076 shares and 332,037 shares of Common Stock, respectively, as such impacts would be antidilutive for these periods.
|
5. |
Income Taxes |
The provision for income taxes for the three and nine months ended March 1, 2015 was $2.3 million and $5.4 million, respectively. The effective tax rate for the nine months ended March 1, 2015 was 36%, compared to 35% for the first nine months of fiscal year 2014. The effective tax rate for the nine months ended March 1, 2015 was higher than the statutory federal income tax rate of 35% primarily due to several factors, including state taxes, valuation allowance on the impairment of the investment in Aesthetic Sciences Corporation, and non-deductible stock-based compensation expense; partially offset by the domestic manufacturing deduction and state and federal research and development credits.
As of both March 1, 2015 and May 25, 2014, the Company had unrecognized tax benefits of approximately $1.0 million. Included in the balance of unrecognized tax benefits as of March 1, 2015 and May 25, 2014 is approximately $800,000 and $807,000, respectively, of tax benefits that, if recognized, would result in an adjustment to the Company’s effective tax rate. The Company does not expect its unrecognized tax benefits to change significantly within the next twelve months.
The Company has elected to classify interest and penalties related to uncertain tax positions as a component of its provision for income taxes. The Company has accrued an insignificant amount of interest and penalties relating to the income tax on the unrecognized tax benefits as of March 1, 2015 and May 25, 2014.
Due to tax attribute carryforwards, the Company is subject to examination for tax years 1997 forward for U.S. tax purposes. The Company is also subject to examination in various state jurisdictions for tax years 1998 forward, none of which were individually material.
|
6. |
Inventories |
Inventories are stated at the lower of cost (first-in, first-out method) or market and consisted of the following (in thousands):
|
March 1, 2015 |
May 25, 2014 |
|||||||
|
Finished goods |
$ | 10,173 | $ | 11,111 | ||||
|
Raw materials |
11,090 | 10,376 | ||||||
|
Work in progress |
3,399 | 3,248 | ||||||
|
Total |
$ | 24,662 | $ | 24,735 | ||||
|
7. |
Debt |
Long-term debt consists of the following (in thousands):
|
March 1, 2015 |
May 25, 2014 |
|||||||
|
Real estate loan agreement with General Electric Capital Corporation (“GE Capital”); due in monthly principal and interest payments of $133,060 through May 1, 2022 with interest based on a fixed rate of 4.02% per annum |
$ | 15,417 | $ | 16,137 | ||||
|
Capital equipment loan with GE Capital; due in monthly principal and interest payments of $175,356 through May 1, 2019 with interest based on a fixed rate of 4.39% per annum |
8,145 | 9,430 | ||||||
|
Capital equipment loan with GE Capital; due in monthly principal and interest payments of $95,120 through September 1, 2019 with interest based on a fixed rate of 3.68% per annum |
6,702 | — | ||||||
|
Capital equipment loan with GE Capital; due in monthly principal and interest payments of $55,828 through December 1, 2019 with interest based on a fixed rate of 3.74% per annum |
4,038 | — | ||||||
|
Term note with BMO Harris Bank N.A. (“BMO Harris”); due in monthly payments of $250,000 through May 23, 2016 with interest payable monthly at LIBOR plus 2% per annum |
3,750 | 6,000 | ||||||
|
Industrial revenue bonds (“IRBs”) issued by Lifecore; due in annual payments through 2020 with interest at a variable rate set weekly by the bond remarketing agent (0.22% and 0.28% at March 1, 2015 and May 25, 2014, respectively) |
2,440 | 2,805 | ||||||
|
Total |
40,492 | 34,372 | ||||||
|
Less current portion |
(7,591 | ) | (6,055 | ) | ||||
|
Long-term portion |
$ | 32,901 | $ | 28,317 | ||||
On July 17, 2014, Apio entered into an amendment with GE Capital, which amended the revolving line of credit dated April 23, 2012 among the parties. Under the amendment, the revolving line of credit increased from $25 million to $40 million, the interest rate was reduced from LIBOR plus 2.0% to LIBOR plus 1.75%, the term was extended to July 17, 2019 and the parties made certain other insignificant changes. The availability under the revolving line of credit is based on the combination of the eligible accounts receivable and eligible inventory (availability was $18.8 million at March 1, 2015). Apio’s revolving line of credit has an unused fee of 0.375% per annum. At March 1, 2015 and May 25, 2014, $9.3 million and zero were outstanding under Apio’s revolving line of credit.
Also on July 17, 2014, Apio entered into a new equipment loan whereby Apio can borrow up to $25 million based on eligible equipment purchases between August 1, 2012 and August 31, 2015. Each borrowing under this new equipment loan has a five year term with a seven year amortization period. On August 28, 2014, Apio borrowed $7.1 million under the new equipment loan at a fixed rate of 3.68%. On November 24, 2014, Apio borrowed an additional $4.1 million under the new equipment loan at a fixed rate of 3.74%.
The GE Capital real estate, equipment and line of credit agreements (collectively the “GE Debt Agreements”) are secured by liens on all of the property of Apio and its subsidiaries. The GE Debt Agreements contain customary events of default under which obligations could be accelerated or increased. The GE Debt Agreements are guaranteed by Landec and Landec has pledged its equity interest in Apio as collateral under the line of credit agreement. The GE Debt Agreements contain customary covenants, such as limitations on the ability to (1) incur indebtedness or grant liens or negative pledges on Apio’s assets; (2) make loans or other investments; (3) pay dividends, sell stock or repurchase stock or other securities; (4) sell assets; (5) engage in mergers; (6) enter into sale and leaseback transactions; and (7) make changes in Apio’s corporate structure. In addition, Apio must maintain a minimum fixed charge coverage ratio of not less than 1.10 to 1.0 if the availability under its line of credit falls below $12.0 million. Apio was in compliance with all financial covenants as of March 1, 2015 and May 25, 2014.
During the nine months ended March 1, 2015, Apio capitalized $318,000 of loan origination fees from the revolving line of credit amendment and from the new equipment loan with GE Capital. These fees are being amortized over a five year period. Unamortized loan origination fees associated with all of the GE Capital debt agreements were $1.1 million and $1.0 million at March 1, 2015 and May 25, 2014, respectively, and are included in other assets in the Consolidated Balance Sheets.
Amortization of loan origination fees for Apio recorded to interest expense for the three months ended March 1, 2015 and February 23, 2014 were $54,000 and $47,000, respectively. Amortization of loan origination fees for Apio recorded to interest expense for the nine months ended March 1, 2015 and February 23, 2014 were $151,000 and $140,000, respectively.
On May 23, 2012, Lifecore entered into two financing agreements with BMO Harris and/or its affiliates, collectively (the “Lifecore Loan Agreements”):
|
1) |
A Credit and Security Agreement (the “Credit Agreement”) which includes (a) a one-year, $10.0 million asset-based working capital revolving line of credit, with an interest rate of LIBOR plus 1.85%, with availability based on the combination of Lifecore’s eligible accounts receivable and inventory balances (availability was $7.3 million at March 1, 2015) and with no unused fee (at March 1, 2015 and May 25, 2014, no amounts were outstanding under the line of credit) and (b) a $12.0 million term loan which matures in May 2016 due in monthly payments of $250,000 with interest payable monthly based on a variable interest rate of LIBOR plus 2% (the “Term Loan”). |
|
2) |
A Reimbursement Agreement pursuant to which BMO Harris caused its affiliate Bank of Montreal to issue an irrevocable letter of credit in the amount of $3.5 million (the “Letter of Credit”) which is securing the IRB described below. |
The obligations of Lifecore under the Lifecore Loan Agreements are secured by liens on all of the property of Lifecore. The Lifecore Loan Agreements contain customary covenants, such as limitations on the ability to (1) incur indebtedness or grant liens or negative pledges on Lifecore’s assets; (2) make loans or other investments; (3) pay dividends or repurchase stock or other securities; (4) sell assets; (5) engage in mergers; (6) enter into sale and leaseback transactions; (7) adopt certain benefit plans; and (8) make changes in Lifecore’s corporate structure. In addition, under the Credit Agreement, Lifecore must maintain (a) a minimum fixed charge coverage ratio of 1.10 to 1.0 and a minimum quick ratio of 1.25 to 1.00, both of which must be satisfied as of the end of each fiscal quarter and (b) a minimum tangible net worth of $29,000,000, measured as of the end of each fiscal year. Lifecore was in compliance with all financial covenants as of March 1, 2015 and May 25, 2014.
Unamortized loan origination fees for the Lifecore Loan Agreements were $61,000 and $98,000 at March 1, 2015 and May 25, 2014, respectively, and are included in other assets in the Consolidated Balance Sheets. Amortization of loan origination fees recorded to interest expense for both the three months ended March 1, 2015 and February 23, 2014 was $13,000. Amortization of loan origination fees recorded to interest expense for both the nine months ended March 1, 2015 and February 23, 2014 was $38,000.
The market value of the Company’s debt approximates its recorded value as the interest rate on each debt instrument approximates current market rates.
The Term Loan was used to repay Lifecore’s former credit facility with Wells Fargo Bank, N.A. (“Wells Fargo”). The Letter of Credit (which replaces a letter of credit previously provided by Wells Fargo) provides liquidity and credit support for the IRBs.
On August 19, 2004, Lifecore issued variable rate industrial revenue bonds (“IRBs”) which were assumed by Landec in the acquisition of Lifecore. The IRBs are collateralized by a bank letter of credit which is secured by a first mortgage on the Company’s facility in Chaska, Minnesota. In addition, the Company pays an annual remarketing fee equal to 0.125% and an annual letter of credit fee of 0.75% on the outstanding principal balance. The maturities on the IRBs are held in a sinking fund account, recorded in other assets in the accompanying Consolidated Balance Sheets, and are paid out each year on September 1st.
|
8. |
Derivative Financial Instruments |
In May 2010, the Company entered into a five-year interest rate swap agreement under its prior credit agreement with Wells Fargo, which expires on April 30, 2015. The interest rate swap was originally designated as a cash flow hedge of future interest payments of LIBOR and had a notional amount of $20 million. As a result of the interest rate swap transaction, the Company fixed for a five-year period the interest rate at 4.24% subject to market based interest rate risk on $20 million of borrowings under the credit agreement with Wells Fargo. The Company’s obligations under the interest rate swap transaction as to the scheduled payments were guaranteed and secured on the same basis as its obligations under the credit agreement with Wells Fargo at the time the agreement was consummated. Upon entering into the new Term Loan with BMO Harris, the Company used the proceeds from that loan to pay off the Wells Fargo credit facility. The swap with Wells Fargo was not terminated upon the extinguishment of the debt with Wells Fargo. The fair value of the swap arrangement as of March 1, 2015 and May 25, 2014 was $2,000 and $44,000, respectively, and is included in other accrued liabilities in the accompanying Consolidated Balance Sheets.
|
9. |
Related Party |
The Company sells products to and earns license fees from Windset. During the three months ended March 1, 2015 and February 23, 2014, the Company recognized revenues of $35,000 and $50,000, respectively. During the nine months ended March 1, 2015 and February 23, 2014, the Company recognized revenues of $230,000 and $81,000, respectively. These amounts have been included in product sales in the accompanying Consolidated Statements of Comprehensive Income, from the sale of products to and license fees from Windset. The related receivable balances of $35,000 and $304,000 are included in accounts receivable, related party, in the accompanying Consolidated Balance Sheets as of March 1, 2015 and May 25, 2014, respectively.
Additionally, unrelated to the revenue transactions above, the Company purchases produce from Windset for sale to third parties. During the three months ended March 1, 2015 and February 23, 2014, the Company recognized cost of product sales of $617,000 and $405,000, respectively. During the nine months ended March 1, 2015 and February 23, 2014, the Company recognized cost of product sales of $1.3 million and $1.2 million, respectively. These amounts have been included in cost of product sales in the accompanying Consolidated Statements of Comprehensive Income, from the sale of products purchased from Windset. The related accounts payable of $146,000 and $134,000 are included in accounts payable, related party in the accompanying Consolidated Balance Sheets as of March 1, 2015 and May 25, 2014, respectively.
All related party transactions are monitored quarterly by the Company and approved by the Audit Committee of the Board of Directors.
|
10. |
Stockholders’ Equity |
During the three months ended March 1, 2015, the Company granted options to purchase 90,000 shares of common stock and awarded 30,000 restricted stock units. During the nine months ended March 1, 2015, the Company granted options to purchase 120,000 shares of common stock and awarded 73,752 restricted stock units.
As of March 1, 2015 the Company has reserved 3.0 million shares of Common Stock for future issuance under its current and former equity plans.
On July 14, 2010, the Company announced that the Board of Directors of the Company had approved the establishment of a stock repurchase plan authorizing the repurchase of up to $10 million of the Company’s Common Stock. The Company may repurchase its common stock from time to time in open market purchases or in privately negotiated transactions. The timing and actual number of shares repurchased is at the discretion of management of the Company and will depend on a variety of factors, including stock price, corporate and regulatory requirements, market conditions, the relative attractiveness of other capital deployment opportunities and other corporate priorities. The stock repurchase program does not obligate Landec to acquire any amount of its common stock and the program may be modified, suspended or terminated at any time at the Company's discretion without prior notice. During the three and nine months ended March 1, 2015, the Company did not purchase any shares on the open market.
Consolidated Statements of Changes in Stockholders’ Equity (in thousands, except share amounts):
|
Common Stock Shares |
||||
|
Balance at May 25, 2014 |
26,815,253 | |||
|
Stock options exercised, net of shares tendered |
53,429 | |||
|
Vested restricted stock units, net of shares tendered |
29,496 | |||
|
Balance at March 1, 2015 |
26,898,178 | |||
|
Common Stock |
||||
|
Balance at May 25, 2014 |
$ | 27 | ||
|
Stock options exercised, net of shares tendered |
— | |||
|
Vested restricted stock units, net of shares tendered |
— | |||
|
Balance at March 1, 2015 |
$ | 27 | ||
|
Additional Paid-in Capital |
||||
|
Balance at May 25, 2014 |
$ | 131,488 | ||
|
Stock options exercised, net of shares tendered |
122 | |||
|
Vested restricted stock units, net of shares tendered |
— | |||
|
Taxes paid by Company for stock swaps and restricted stock units |
(12 | ) | ||
|
Stock-based compensation expense |
1,139 | |||
|
Tax benefit from stock based compensation |
211 | |||
|
Balance at March 1, 2015 |
$ | 132,948 | ||
|
Retained Earnings |
||||
|
Balance at May 25, 2014 |
$ | 71,554 | ||
|
Net income |
9,348 | |||
|
Balance at March 1, 2015 |
$ | 80,902 | ||
|
Non-controlling Interest |
||||
|
Balance at May 25, 2014 |
$ | 1,692 | ||
|
Non-controlling interest in net income |
126 | |||
|
Distributions to non-controlling interest |
(196 | ) | ||
|
Balance at March 1, 2015 |
$ | 1,622 |
|
11. |
Business Segment Reporting |
The Company manages its business operations through three strategic business units. Based upon the information reported to the chief operating decision maker, who is the Chief Executive Officer, the Company has the following reportable segments: the Food Products Technology segment, the Food Export segment and the Hyaluronan-based Biomaterials segment.
The Food Products Technology segment markets and packs specialty packaged whole and fresh-cut fruit and vegetables, the majority of which incorporate the BreatheWay specialty packaging for retail grocery, club store and food services industries. In addition, the Food Products Technology segment sells BreatheWay packaging to partners for non-vegetable products. The Food Export segment consists of revenues generated from the purchase and sale of primarily whole commodity fruit and vegetable products to Asia and domestically. The HA-based Biomaterials segment sells products utilizing hyaluronan, a naturally occurring polysaccharide that is widely distributed in the extracellular matrix of connective tissues in both animals and humans, for medical use primarily in the Ophthalmic, Orthopedic and Veterinary markets. Corporate licenses Landec’s patented Intellicoat® seed coatings to the farming industry and licenses the Company’s Intelimer polymers for personal care products and other industrial products. The Corporate segment also includes general and administrative expenses, non-Food Products Technology and non HA-based Biomaterials interest income and income tax expenses. All of the assets of the Company are located within the United States of America.
The Company’s international sales were as follows (in millions):
|
Three Months Ended |
Nine Months Ended |
|||||||||||||||
|
March 1, |
February 23, |
March 1, |
February 23, |
|||||||||||||
|
2015 |
2014 |
2015 |
2014 |
|||||||||||||
|
Canada |
$ | 21.6 | $ | 12.1 | $ | 56.8 | $ | 31.8 | ||||||||
|
Taiwan |
$ | 2.2 | $ | 2.6 | $ | 27.8 | $ | 27.2 | ||||||||
|
Indonesia |
$ | 1.6 | $ | 2.2 | $ | 8.1 | $ | 7.1 | ||||||||
| China | $ | 0.4 | $ | 1.3 | $ | 7.7 | $ | 6.6 | ||||||||
|
Japan |
$ | 1.1 | $ | 1.8 | $ | 6.2 | $ | 7.1 | ||||||||
|
Belgium |
$ | 5.7 | $ | 11.1 | $ | 5.8 | $ | 13.1 | ||||||||
|
All Other Countries |
$ | 5.3 | $ | 2.2 | $ | 13.5 | $ | 12.3 | ||||||||
Operations by segment consisted of the following (in thousands):
|
Three Months Ended March 1, 2015 |
Food Products Technology |
Food Export |
HA-based Biomaterials |
Corporate |
TOTAL |
|||||||||||||||
|
Net sales |
$ | 115,392 | $ | 8,199 | $ | 14,799 | $ | 140 | $ | 138,530 | ||||||||||
|
International sales |
$ | 21,423 | $ | 8,086 | $ | 8,394 | $ | — | $ | 37,903 | ||||||||||
|
Gross profit |
$ | 9,735 | $ | 771 | $ | 6,258 | $ | 121 | $ | 16,885 | ||||||||||
|
Net income (loss) |
$ | 2,949 | $ | (6 | ) | $ | 3,047 | $ | (2,218 | ) | $ | 3,772 | ||||||||
|
Depreciation and amortization |
$ | 1,232 | $ | 1 | $ | 568 | $ | 33 | $ | 1,834 | ||||||||||
|
Dividend income |
$ | 413 | $ | — | $ | — | $ | — | $ | 413 | ||||||||||
|
Interest income |
$ | 5 | $ | — | $ | 73 | $ | 7 | $ | 85 | ||||||||||
|
Interest expense |
$ | 467 | $ | — | $ | 43 | $ | — | $ | 510 | ||||||||||
|
Income tax expense |
$ | 323 | $ | — | $ | 496 | $ | 1,505 | $ | 2,324 | ||||||||||
|
Three Months Ended February 23, 2014 |
||||||||||||||||||||
|
Net sales |
$ | 95,431 | $ | 10,676 | $ | 20,176 | $ | 96 | $ | 126,379 | ||||||||||
|
International sales |
$ | 12,013 | $ | 10,676 | $ | 10,613 | $ | — | $ | 33,302 | ||||||||||
|
Gross profit |
$ | 7,282 | $ | 990 | $ | 11,787 | $ | 96 | $ | 20,155 | ||||||||||
|
Net income (loss) |
$ | 131 | $ | 206 | $ | 7,192 | $ | (1,129 | ) | $ | 6,400 | |||||||||
|
Depreciation and amortization |
$ | 1,040 | $ | 1 | $ | 504 | $ | 32 | $ | 1,577 | ||||||||||
|
Dividend income |
$ | 281 | $ | — | $ | — | $ | — | $ | 281 | ||||||||||
|
Interest income |
$ | 3 | $ | — | $ | 74 | $ | 1 | $ | 78 | ||||||||||
|
Interest expense |
$ | 332 | $ | — | $ | 58 | $ | — | $ | 390 | ||||||||||
|
Income tax expense |
$ | 468 | $ | 58 | $ | 2,028 | $ | 1,125 | $ | 3,679 | ||||||||||
|
Nine Months Ended March 1, 2015 |
||||||||||||||||||||
|
Net sales |
$ | 317,577 | $ | 56,902 | $ | 29,928 | $ | 402 | $ | 404,809 | ||||||||||
|
International sales |
$ | 57,334 | $ | 56,779 | $ | 11,762 | $ | — | $ | 125,875 | ||||||||||
|
Gross profit |
$ | 32,739 | $ | 3,507 | $ | 10,110 | $ | 382 | $ | 46,738 | ||||||||||
|
Net income (loss) |
$ | 10,239 | $ | 847 | $ | 1,493 | $ | (3,231 | ) | $ | 9,348 | |||||||||
|
Depreciation and amortization |
$ | 3,479 | $ | 3 | $ | 1,600 | $ | 95 | $ | 5,177 | ||||||||||
|
Dividend income |
$ | 1,015 | $ | — | $ | — | $ | — | $ | 1,015 | ||||||||||
|
Interest income |
$ | 31 | $ | — | $ | 211 | $ | 27 | $ | 269 | ||||||||||
|
Interest expense |
$ | 1,230 | $ | — | $ | 135 | $ | — | $ | 1,365 | ||||||||||
|
Income tax expense |
$ | 1,633 | $ | 139 | $ | 243 | $ | 3,394 | $ | 5,409 | ||||||||||
|
Nine Months Ended February 23, 2014 |
||||||||||||||||||||
|
Net sales |
$ | 262,957 | $ | 55,106 | $ | 37,539 | $ | 282 | $ | 355,884 | ||||||||||
|
International sales |
$ | 31,836 | $ | 55,005 | $ | 18,356 | $ | — | $ | 105,197 | ||||||||||
|
Gross profit |
$ | 24,383 | $ | 4,015 | $ | 17,800 | $ | 223 | $ | 46,421 | ||||||||||
|
Net income (loss) |
$ | 9,402 | $ | 1,209 | $ | 7,427 | $ | (3,435 | ) | $ | 14,603 | |||||||||
|
Depreciation and amortization |
$ | 3,566 | $ | 3 | $ | 1,692 | $ | 103 | $ | 5,364 | ||||||||||
|
Dividend income |
$ | 844 | $ | — | $ | — | $ | — | $ | 844 | ||||||||||
|
Interest income |
$ | 8 | $ | — | $ | 174 | $ | 1 | $ | 183 | ||||||||||
|
Interest expense |
$ | 1,064 | $ | — | $ | 193 | $ | — | $ | 1,257 | ||||||||||
|
Income tax expense |
$ | 2,434 | $ | 341 | $ | 2,094 | $ | 3,159 | $ | 8,028 | ||||||||||
During the nine months ended March 1, 2015 and February 23, 2014, sales to the Company’s top five customers accounted for 45% and 43%, respectively, of revenues. The Company’s top two customers, Costco Wholesale Corporation and Wal-Mart Stores, Inc., from the Food Products Technology segment accounted for 21% and 11% of revenues, respectively, for the nine months ended March 1, 2015 and 20% and 12% of revenues, respectively, for the nine months ended
February 23, 2014. The Company expects that, for the foreseeable future, a limited number of customers may continue to account for a significant portion of its net revenues.
|
Item 2. |
Management’s Discussion and Analysis of Financial Condition and Results of Operations |
The following discussion should be read in conjunction with the unaudited consolidated financial statements and accompanying notes included in Part I-Item 1 of this Form 10-Q and the audited consolidated financial statements and accompanying notes and Management’s Discussion and Analysis of Financial Condition and Results of Operations included in Landec’s Annual Report on Form 10-K for the fiscal year ended May 25, 2014.
Except for the historical information contained herein, the matters discussed in this report are forward-looking statements within the meaning of Section 21E of the Securities Exchange Act of 1934. These forward-looking statements involve certain risks and uncertainties that could cause actual results to differ materially from those in the forward-looking statements. Potential risks and uncertainties include, without limitation, those mentioned in this Form 10-Q and those mentioned in Landec’s Annual Report on Form 10-K for the fiscal year ended May 25, 2014. Landec undertakes no obligation to update or revise any forward-looking statements in order to reflect events or circumstances that may arise after the date of this report.
Critical Accounting Policies and Use of Estimates
There have been no material changes to the Company's critical accounting policies which are included and described in the Form 10-K for the fiscal year ended May 25, 2014 filed with the Securities and Exchange Commission on August 1, 2014.
The Company
Landec Corporation and its subsidiaries (“Landec” or the “Company”) design, develop, manufacture and sell differentiated products for food and biomaterials markets and license technology applications to partners. The Company has two proprietary polymer technology platforms: 1) Intelimer® polymers, and 2) hyaluronan (“HA”) biopolymers. The Company’s HA biopolymers are proprietary in that they are specially formulated for specific customers to meet strict regulatory requirements. The Company’s polymer technologies, along with its customer relationships and trade names, are the foundation, and a key differentiating advantage upon which Landec has built its business. The Company sells specialty packaged branded Eat Smart® and GreenLine® and private label fresh-cut vegetables and whole produce to retailers, club stores and foodservice operators, primarily in the United States, Canada and Asia through its Apio, Inc. (“Apio”) subsidiary and sells HA-based biomaterials through its Lifecore Biomedical, Inc. (“Lifecore”) subsidiary.
Landec has three core businesses – Food Products Technology, Food Export and HA-based Biomaterials – each of which is described below.
Apio, Landec’s wholly-owned subsidiary, operates the Company’s Food Products Technology business, which combines its proprietary BreatheWay® food packaging technology with the capabilities of a large national food supplier and value-added produce processor which sells products under the Eat Smart and GreenLine brands. In Apio’s value-added operations, produce is processed by trimming, washing, sorting, blending, and packaging into bags and trays that in most cases incorporate Landec’s BreatheWay membrane technology. The BreatheWay membrane increases shelf life and reduces shrink (waste) for retailers and, for certain products, eliminates the need for ice during the distribution cycle and helps to ensure that consumers receive fresh produce by the time the product makes its way through the supply chain. Apio also licenses the BreatheWay technology to partners such as Chiquita Brands International, Inc. (“Chiquita”) for packaging and distribution of bananas and to Windset Holding 2010 Ltd., a Canadian corporation (“Windset”), for packaging of greenhouse grown cucumbers, peppers and tomatoes.
Apio also operates the Food Export business through its subsidiary, Cal Ex Trading Company (“Cal-Ex”). The Export business purchases and sells whole fruit and vegetable commodities predominantly to Asian markets.
Lifecore, Landec’s wholly-owned subsidiary, operates the Company’s HA-based Biomaterials business and is principally involved in the development and manufacture of products utilizing hyaluronan, a naturally occurring polysaccharide that is widely distributed in the extracellular matrix of connective tissues in animals including humans. Lifecore’s products are sold worldwide for use primarily in three medical areas: (1) Ophthalmic, (2) Orthopedic and (3) Veterinary. In addition, Lifecore provides specialized aseptic fill and finish services in a cGMO validated manufacturing facility for supplying commercial, clinical and pre-clinical products. Lifecore also supplies limited quantities of HA, and raw materials to customers pursuing other medical applications, such as aesthetic surgery, medical device coatings, tissue engineering and pharmaceuticals. Lifecore leverages its fermentation process to manufacture premium, pharmaceutical-grade HA, and uses its aseptic filling capabilities to provide private-labeled HA finished goods to its customers. Furthermore, Lifecore manufactures and sells it own HA-based finished goods in several foreign markets. Lifecore is known as a premium supplier of HA with expertise in formulation and filling of difficult to handle products. Its name recognition allows Lifecore to attract new customers and sell new products and offer its services with a minimal marketing and sales infrastructure.
Landec also develops proprietary polymer technologies and applies them in a wide range of applications including seed coatings and treatments, controlled release systems, personal care products and pressure sensitive adhesives. These applications are commercialized through partnerships with third parties resulting in licensing and royalty revenues. For example, INCOTEC Holding North America, Inc. (“INCOTEC”) has an exclusive license to our Intellicoat® seed coating and treatments technology, Air Products and Chemicals, Inc. (“Air Products”) has an exclusive license to our Intelimer polymers for personal care products and Nitta Corporation (“Nitta”) licenses Landec’s proprietary pressure sensitive adhesives for use in the manufacture of electronic components by their customers.
Landec was incorporated on October 31, 1986. We completed our initial public offering in 1996 and our Common Stock is listed on The NASDAQ Global Select Market under the symbol “LNDC.” Our principal executive offices are located at 3603 Haven Avenue, Menlo Park, California 94025 and our telephone number is (650) 306-1650.
Description of Core Business
Landec participates in three core business segments: Food Products Technology, Food Export and Hyaluronan-based Biomaterials.
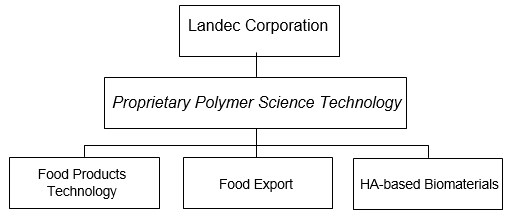
Food Products Technology Business
Based in Guadalupe, California, Apio’s primary business is fresh-cut and whole value-added products primarily packaged in our proprietary BreatheWay packaging. The fresh-cut value-added products business markets a variety of fresh-cut and whole vegetables to the top retail grocery chains, club stores and food service operators. During the fiscal year ended May 25, 2014, Apio shipped approximately twenty-eight million cartons of produce to its customers throughout North America, primarily in the United States.
There are five major distinguishing characteristics of Apio that provide competitive advantages in the Food Products Technology market:
Value-Added Supplier: Apio has structured its business as a marketer and seller of branded and private label fresh-cut and whole value-added produce. It is focused on selling products under its Eat Smart and GreenLine brands and private label brands for its fresh-cut and whole value-added products. As retail grocery chains, club stores and food service operators consolidate, Apio is well positioned as a single source of a broad range of products.
Reduced Farming Risks: Apio reduces its farming risk by not taking ownership of farmland, and instead, contracts with growers for produce and during certain times of the year, enters into joint ventures with growers for produce. The year-round sourcing of produce is a key component to the fresh-cut and whole value-added processing business.
Access to Customer Base: Apio has strategically invested in the rapidly growing fresh-cut and whole value-added business. Apio’s value-added processing plant in Guadalupe, CA, is automated with state-of-the-art vegetable processing equipment. Apio operates one large central processing facility in one of the lowest cost growing regions in California, the Santa Maria Valley, and for the majority of its non-green bean vegetable business, uses its packaging technology for nationwide delivery. With the acquisition of GreenLine, Apio has three East Coast processing facilities and five East Coast distribution centers for nationwide delivery of green beans and Apio now processes non-green bean products in one of our East Coast processing facilities to meet the next-day delivery needs of customers.
Expanded Product Line Using Technology and Unique Blends: Apio, through the use of its BreatheWay packaging technology, is introducing new value-added products each year. These new product offerings range from various sizes of fresh-cut bagged products, to vegetable trays, to whole produce, to vegetable salads and to snack packs.
Products Currently in Over 70% of U.S. Retail Grocery Stores: With the acquisition of GreenLine, Apio now has products in over 70% of all U.S. retail grocery stores. This gives Apio the opportunity to cross sell Eat Smart value-added products to GreenLine customers and GreenLine value-added products to Eat Smart customers.
The Company has launched a family of salad kits that are comprised of “superfood” mixtures of vegetables with healthy toppings/dressings. The launch of the first of these products called Sweet Kale Salad has broken all of Apio’s records for speed of adoption with weekly sales of approximately $1.5 million as of
February 2015. Additionally, we have launched several other superfood salad kits including Ginger Bok Choy, Wild Greens & Quinoa, Roasted Yam Salad, Beets & Greens Salad, Kale and Chard Stir Fry and Shanghai Stir Fry, as examples. The Company’s expertise includes accessing leading culinary experts and nutritionists nationally to help in the new product development process.
In addition to proprietary packaging technology and a strong new product development pipeline, the Company has strong channels of distribution throughout North America with retail grocery store chains and club stores. Landec has one or more of its products in over 70% of all retail and club store sites in North America giving us a strong platform for introducing new products.
The Company sells its products under the nationally-known brands EatSmart and GreenLine. The Company also periodically licenses its BreatheWay packaging technology to partners such as Chiquita for packaging bananas and to Windset for packaging peppers and cucumbers that are grown hydroponically in greenhouses. The Company is engaged in the testing and development of other BreatheWay products. These packaging license relationships generate revenues either from product sales or royalties once commercialized.
On February 15, 2011, Apio entered into a share purchase agreement (the “Windset Purchase Agreement”) with Windset. Pursuant to the Windset Purchase Agreement, Apio purchased from Windset 150,000 Senior A preferred shares for $15 million and 201 common shares for $201. On July 15, 2014, Apio increased its investment in Windset by purchasing from the Newell Capital Corporation an additional 68 shares of common stock and 51,211 shares of junior preferred stock of Windset for $11.0 million. After this purchase, the Company’s common shares represent a 26.9% interest in Windset. The non-voting Senior A preferred shares yield a cash dividend of 7.5% annually. The dividend is payable within 90 days of each anniversary of the execution of the Windset Purchase Agreement The non-voting junior preferred stock does not yield a dividend unless declared by the Board of Directors of Windset and no such dividend has been declared.
The Windset Purchase Agreement includes a put and call option, which can be exercised on the sixth anniversary of the Windset Purchase Agreement whereby Apio can exercise the put to sell its common, Senior A preferred shares and junior preferred shares to Windset, or Windset can exercise the call to purchase those shares from Apio, in either case, at a price equal to 26.9% of the appreciation in the fair market value of Windset’s common shares from the date of the Company’s investment through the put and call date, plus the liquidation value of the preferred shares of $20.1 million ($15 million for the Senior A preferred shares and $5.1 million for the junior preferred shares). Under the terms of the arrangement with Windset, the Company is entitled to designate one of five members on the Board of Directors of Windset.
On October 29, 2014, Apio further increased its investment in Windset by purchasing 70,000 shares of Senior B preferred shares. The Senior B Preferred Stock pays an annual dividend of 7.5% on the amount outstanding at each anniversary date of the Windset Purchase Agreement. The Senior B shares purchased by Apio have a put feature whereby Apio can sell back to Windset $1.5 million of shares on the first anniversary, an additional $2.75 million of shares on the second anniversary and the remaining $2.75 million on the third anniversary. After the third anniversary, Apio may at any time put any or all of the shares not previously sold back to Windset. At any time on or after February 15, 2017, Windset has the right to call any or all of the outstanding common shares and at such time must also call the same proportion of Senior A preferred shares, Senior B preferred shares and junior preferred shares owned by Apio. Windset’s partial call provision is restricted such that a partial call cannot result in Apio holding less than 10% of Windset’s common shares outstanding.
Food Export Business
Food Export revenues consist of revenues generated from the purchase and sale of primarily whole commodity fruit and vegetable products primarily to Asia through Apio’s export company, Cal-Ex. The Food Export business is a buy/sell business that realizes a margin on average in the 5-10% range.
Hyaluronan-based Biomaterials Business
Our HA-based Biomaterials business, operated through our Lifecore subsidiary, was acquired by Landec on April 30, 2010.
Lifecore uses its fermentation process and aseptic formulation and filling expertise to be a leader in the development of HA-based products for multiple applications and to take advantage of non-HA device and drug opportunities which leverage its expertise in manufacturing and aseptic syringe filling capabilities. Elements of Lifecore’s strategy include the following:
• Establish strategic relationships with market leaders. Lifecore will continue to develop applications for products with partners who have strong marketing, sales and distribution capabilities to end-user markets. Through its strong reputation and history of providing pharmaceutical grade HA and products, Lifecore has been able to establish long-term relationships with the market leading ophthalmic surgical companies, and leverages those partnerships to attract new relationships in other medical markets.
• Expand medical applications for HA. Due to the growing knowledge of the unique characteristics of HA, and the role it plays in normal physiology, Lifecore continues to identify opportunities for the use of HA in other medical applications, such as wound care, aesthetic surgery, drug delivery, device coatings and through pharmaceutical sales to academic and corporate research customers. As part of this effort, Lifecore continues to explore applications for its Corgel® Biohydrogel technology licensed from the Cleveland Clinic Foundation. Further applications may involve expanding process development activity and/or additional licensing of technology.
• Utilize manufacturing infrastructure to pursue contract aseptic filling and fermentation opportunities. Lifecore has made strategic capital investments in its contract manufacturing and development business focusing on extending its aseptic filling capacity and capabilities. It is investing in this segment to meet increasing partner demand and attract new contract filling opportunities. Lifecore is using its manufacturing capabilities to provide contract manufacturing and development services to its partners in the area of sterile pre-filled syringes and fermentation and purification requirements.
• Maintain flexibility in product development and supply relationships. Lifecore’s vertically integrated development and manufacturing capabilities allow it to establish a variety of contractual relationships with global corporate partners. Lifecore’s role in these relationships extends from supplying HA raw materials to providing tech transfer and development services to manufacturing aseptically-packaged, finished sterile products and to assuming full supply chain responsibilities.
Results of Operations
Revenues (in thousands):
|
Three months ended 3/1/15 |
Three months ended 2/23/14 |
Change |
Nine months ended 3/1/15 |
Nine months ended 2/23/14 |
Change |
|||||||||||||||||||
|
Food Products Technology |
$ | 115,392 | $ | 95,431 | 21 | % | $ | 317,577 | $ | 262,957 | 21 | % | ||||||||||||
|
Food Export |
8,199 | 10,676 | (23 | %) | 56,902 | 55,106 | 3 | % | ||||||||||||||||
|
Total Apio |
123,591 | 106,107 | 16 | % | 374,479 | 318,063 | 18 | % | ||||||||||||||||
|
HA-based Biomaterials |
14,799 | 20,176 | (27 | %) | 29,928 | 37,539 | (20 | %) | ||||||||||||||||
|
Corporate |
140 | 96 | 46 | % | 402 | 282 | 43 | % | ||||||||||||||||
|
Total Revenues |
$ | 138,530 | $ | 126,379 | 10 | % | $ | 404,809 | $ | 355,884 | 14 | % | ||||||||||||
Food Products Technology (Apio)
Apio’s Food Products Technology revenues consist of revenues generated from the sale of specialty packaged fresh-cut and whole value-added processed vegetable products that are washed and packaged in our proprietary packaging and sold under Apio’s Eat Smart and GreenLine brands and various private labels. In addition, Food Products Technology revenues include the revenues generated from Apio Cooling, LP, a vegetable cooling operation in which Apio is the general partner with a 60% ownership position and from the sale of BreatheWay packaging to license partners.
The increase in Apio’s Food Products Technology revenues for the three and nine months ended March 1, 2015 compared to the same periods of last year was primarily due to a 19% and 20%, respectively, increase in unit volume sales resulting primarily from new value-added products, coupled with new product introductions which typically have a higher price per unit than historical offerings. In addition, the first nine months of fiscal year 2015 included an extra week compared to the same period last year as a result of the timing of the Company’s 2015 fiscal year end.
Food Export (Apio)
Apio Food Export revenues consist of revenues generated from the purchase and sale of primarily whole commodity fruit and vegetable products to Asia by Cal-Ex. Apio records revenue equal to the sale price to third parties because it takes title to the product while in transit.
The decrease in revenues in Apio’s Food Export business for the three months ended March 1, 2015 compared to the same period last year was due to a 16% decrease in unit volume sales due primarily to a West Coast longshoreman’s labor dispute which severely impacted exports to Asia and an unfavorable product mix to lower priced export products.
The increase in revenues in Apio’s Food Export business for the nine months ended March 1, 2015 compared to the same period last year was due to a favorable product mix to higher priced export products, primarily during the first four months of fiscal 2015.
HA-based Biomaterials (Lifecore)
Lifecore’s HA-based Biomaterials business principally generates revenue through the sale of products containing HA. Lifecore primarily sells products to customers in three medical areas: (1) Ophthalmic, which represented approximately 60% of Lifecore’s revenues in fiscal year 2014, (2) Orthopedic, which represented approximately 20% of Lifecore’s revenues in fiscal year 2014, and (3) Veterinary/Other.
The decrease in Lifecore's revenues for the three and nine months ended March 1, 2015 compared to the same periods last year was primarily due to a 44% and 40%, respectively, decrease in revenues in Lifecore's fermentation business for Ophthalmic products as a result of lower shipments to a major customer as it aligns its inventory levels with newly stated corporate guidelines and a 15% and 36%, respectively, decrease in business development revenues due to the delay in the timing of certain development activities. These decreases were partially offset by increased aseptic filling revenues.
Corporate
Corporate revenues are generated from the licensing agreements primarily with Air Products, Nitta and INCOTEC.
The increase in Corporate revenues for the three and nine months ended March 1, 2015 compared to the same periods of the prior year was not significant.
Gross Profit (in thousands):
|
Three months ended 3/1/15 |
Three months ended 2/23/14 |
Change |
Nine months ended 3/1/15 |
Nine months ended 2/23/14 |
Change |
|||||||||||||||||||
|
Food Products Technology |
$ | 9,735 | $ | 7,282 | 34 | % | $ | 32,739 | $ | 24,383 | 34 | % | ||||||||||||
|
Food Export |
771 | 990 | (22 | %) | 3,507 | 4,015 | (13 | %) | ||||||||||||||||
|
Total Apio |
10,506 | 8,272 | 27 | % | 36,246 | 28,398 | 28 | % | ||||||||||||||||
|
HA-based Biomaterials |
6,258 | 11,787 | (47 | %) | 10,110 | 17,800 | (43 | %) | ||||||||||||||||
|
Corporate |
121 | 96 | 26 | % | 382 | 223 | 71 | % | ||||||||||||||||
|
Total Gross Profit |
$ | 16,885 | $ | 20,155 | (16 | %) | $ | 46,738 | $ | 46,421 | 1 | % | ||||||||||||
General
There are numerous factors that can influence gross profit including product mix, customer mix, manufacturing costs, volume, sale discounts and charges for excess or obsolete inventory, to name a few. Many of these factors influence or are interrelated with other factors. The Company includes in cost of sales all of the costs related to the sale of products in accordance with U.S. generally accepted accounting principles. These costs include the following: raw materials (including produce, packaging and syringes), direct labor, overhead (including indirect labor, depreciation, and facility related costs) and shipping and shipping-related costs. The following are the primary reasons for the changes in gross profit for the three and nine months ended March 1, 2015 compared to the same periods last year as outlined in the table above.
Food Products Technology (Apio)
The increase in gross profit for Apio’s Food Products Technology business for both the three and nine months ended March 1, 2015 compared to the same periods last year was primarily due to the gross profit generated from the 21% increase in revenues and from a favorable product mix change to a greater percentage of revenues coming from higher margin new products versus the lower margin core packaged vegetable products. In addition, during the same periods last year Apio’s Food Products Technology business experienced higher than expected raw produce sourcing cost due to a variety of factors, most importantly the heavy rains in the Midwest and along the East Coast and cooler than normal temperatures in California during the first nine months of last year.
Food Export (Apio)
Apio’s export business is a buy/sell business that realizes a commission-based margin in the 5-10% range. The decrease in gross profit for Apio’s export business for the three months ended March 1, 2015 compared to the same period last year was due to the 23% decrease in revenues. The decrease in gross profit for Apio’s export business during the nine months ended March 1, 2015 compared to the same period last year was due to higher costs to source the higher priced export produce resulting in a lower gross profit as a percent of sales. The gross profit as a percent of sales during the nine months ended March 1, 2015 was 6.2% compared to a gross margin of 7.3% during the same period last year.
HA-based Biomaterials (Lifecore)
The decrease in gross profit during the three and nine months ended March 1, 2015 compared to the same periods last year was due to the 27% and 20%, respectively, decrease in revenues and from an unfavorable product mix change to a higher percentage of sales being from the lower margin aseptically filled products compared to the higher margin fermentation products and business development revenues in the prior year.
Corporate
The increase in Corporate gross profit for the three and nine months ended March 1, 2015 compared to the same period of the prior year was not significant.
Operating Expenses (in thousands):
|
Three months ended 3/1/15 |
Three months ended 2/23/14 |
Change |
Nine months ended 3/1/15 |
Nine months ended 2/23/14 |
Change |
|||||||||||||||||||
|
Research and Development: |
||||||||||||||||||||||||
|
Apio |
$ | 188 | $ | 264 | (29 | %) | $ | 542 | $ | 875 | (38 | %) | ||||||||||||
|
Lifecore |
1,235 | 1,132 | 9 | % | 3,768 | 3,702 | 2 | % | ||||||||||||||||
|
Corporate |
332 | 327 | 2 | % | 1,065 | 991 | 7 | % | ||||||||||||||||
|
Total R&D |
$ | 1,755 | $ | 1,723 | 2 | % | $ | 5,375 | $ | 5,568 | (3 | %) | ||||||||||||
|
Selling, General and Administrative: |
||||||||||||||||||||||||
|
Apio |
$ | 7,116 | $ | 5,792 | 23 | % | $ | 20,169 | $ | 16,856 | 20 | % | ||||||||||||
|
Lifecore |
954 | 980 | (3 | %) | 3,013 | 3,143 | (4 | %) | ||||||||||||||||
|
Corporate |
2,228 | 1,928 | 16 | % | 5,924 | 5,970 | (1 | %) | ||||||||||||||||
|
Total S,G&A |
$ | 10,298 | $ | 8,700 | 18 | % | $ | 29,106 | $ | 25,969 | 12 | % | ||||||||||||
Research and Development (R&D)
Landec’s research and development consisted primarily of product development and commercialization initiatives. Research and development efforts at Apio are focused on the Company’s proprietary BreatheWay membranes used for packaging produce, with a focus on extending the shelf-life of sensitive vegetables and fruit. In the Lifecore business, the research and development efforts are focused on new products and applications for HA and non-HA based biomaterials. For Corporate, the research and development efforts are primarily focused on supporting the development and commercialization of new products and new technologies in our food and HA businesses.
The change in R&D expenses for the three and nine months ended March 1, 2015 compared to the same periods last year was primarily due to a decrease in Apio R&D as products move from the development stage to commercialization offset by slight increases in R&D at Lifecore and Corporate.
Selling, General and Administrative
Selling, general and administrative (“S,G&A”) expenses consist primarily of sales and marketing expenses associated with Landec’s product sales and services, business development expenses and staff and administrative expenses.
The increase in S,G&A expenses for both the three and nine months ended March 1, 2015 compared to the same period last year was primarily due to a 22% increase in sales and marketing expenses at Apio primarily to promote our new vegetable salads and stir fry products.
Other (in thousands):
|
Three months ended 3/1/15 |
Three months ended 2/23/14 |
Change |
Nine months ended 3/1/15 |
Nine months ended 2/23/14 |
Change |
|||||||||||||||||||
|
Dividend Income |
$ | 413 | $ | 281 | 47 | % | $ | 1,015 | $ | 844 | 20 | % | ||||||||||||
|
Interest Income |
$ | 85 | $ | 78 | 9 | % | $ | 269 | $ | 183 | 47 | % | ||||||||||||
|
Interest Expense |
$ | (510 | ) | $ | (390 | ) | 31 | % | $ | (1,365 | ) | $ | (1,257 | ) | 9 | % | ||||||||
|
Other Income |
$ | 1,307 | $ | 400 | 227 | % | $ | 2,707 | $ | 8,100 | (67 | %) | ||||||||||||
|
Income Taxes |
$ | (2,324 | ) | $ | (3,679 | ) | (37 | %) | $ | (5,409 | ) | $ | (8,028 | ) | (33 | %) | ||||||||
|
Non controlling Int. |
$ | (31 | ) | $ | (22 | ) | 41 | % | $ | (126 | ) | $ | (123 | ) | 2 | % | ||||||||
Dividend Income
Dividend income is derived from the dividends accrued on our $22.0 million preferred stock investment in Windset which yields a cash dividend of 7.5% annually. The increase in dividend income for the three and nine months ended March 1, 2015 compared to the same periods last year was due to the Company increasing its preferred stock investment in Windset by $7.0 million on October 29, 2014.
Interest Income
The increase in interest income for the three and nine months ended March 1, 2015 compared to the same periods last year was not significant.
Interest Expense
The increase in interest expense for the three and nine months ended March 1, 2015 compared to the same periods last year was due to a $6.1 million increase in long-term debt during the first nine months of fiscal 2015.
Other Income (Expense)
The changes in other income for the three and nine months ended March 1, 2015 were due to the change in the increase in the fair value of our Windset investment which was higher in the three months ended March 1, 2015 compared to the third quarter of last year and lower in the nine months ended March 1, 2015 compared to first nine of months of fiscal year 2014. In addition, other income for the three and nine months ended March 1, 2015 included a $793,000 expense for the write off of the Company’s investment in Aesthetic Sciences.
Income Taxes
The decrease in the income tax expense for the three and nine months ended March 1, 2015 is primarily due to a 39% and 35% decrease, respectively, in net income before taxes compared to the same periods last year.
Non-controlling Interest
The non-controlling interest consists of the limited partners’ equity interest in the net income of Apio Cooling, LP.
The change in the non-controlling interest for the three and nine months ended March 1, 2015 compared to the same periods last year was not significant.
Liquidity and Capital Resources
As of March 1, 2015, the Company had cash and cash equivalents of $15.7 million, a net increase of $1.5 million from $14.2 million at May 25, 2014.
Cash Flow from Operating Activities
Landec generated $13.4 million of cash from operating activities during the nine months ended March 1, 2015, compared to $13.8 million for the nine months ended February 23, 2014. The primary sources of cash from operating activities during the nine months ended March 1, 2015 were from (1) generating $9.5 million of net income, (2) $6.3 million of depreciation/amortization and stock based compensation expenses and (3) a $4.3 million net increase in deferred tax liabilities. These sources of cash were partially offset by the non-cash increase in the Company’s investment in Windset of $3.5 million and from a net increase of $3.7 million in working capital. The primary factor which increased working capital during the first nine months of fiscal year 2015 was a $3.8 million decrease in accounts payable. The decrease in accounts payable was primarily from a $3.7 million decrease in accounts payable at Apio due primarily to timing and that revenues in Apio’s export business were 44% lower during the third quarter of fiscal year 2015 compared to the fourth quarter of fiscal year 2014. In addition, the payable cycle for export is longer than the payable cycle from the rest of Apio’s businesses.
Cash Flow from Investing Activities
Net cash used in investing activities for the nine months ended March 1, 2015 was $27.3 million compared to $8.6 million for the same period last year. The primary uses of cash in investing activities during the first nine months of fiscal year 2015 were for the purchase of $10.2 million of equipment primarily to support the growth of the Apio value-added and Lifecore businesses and the purchase of additional Windset shares of common stock and preferred stock for $18.0 million.
Cash Flow from Financing Activities
Net cash provided by financing activities for the nine months ended March 1, 2015 was $15.4 million compared to $5.9 million used in financing activities for the same period last year. The net cash provided by financing activities during the first nine months of fiscal year 2015 was primarily due to $11.2 million of proceeds from long-term debt and $9.3 million of net borrowings under Apio’s line of credit. These sources from financing activities were partially offset by $5.1 million of payments on the Company’s long-term debt.
Capital Expenditures
During the nine months ended March 1, 2015, Landec purchased equipment to support the growth of the Apio value-added and Lifecore businesses. These expenditures represented the majority of the $10.2 million of capital expenditures.
Debt
On August 19, 2004, Lifecore issued variable rate industrial revenue bonds (“IRBs”). These IRBs were assumed by Landec in the acquisition of Lifecore. The IRBs are collateralized by a bank letter of credit which is secured by a first mortgage on Lifecore’s facility in Chaska, Minnesota. In addition, Lifecore pays an annual remarketing fee equal to 0.125% and an annual letter of credit fee of 0.75% on the outstanding principal balance.
On April 23, 2012 in connection with the acquisition of GreenLine Holding Company, Apio entered into three loan agreements with General Electric Capital Corporation and/or its affiliates (“GE Capital”):
|
1) |
A five-year, $25.0 million asset-based working capital revolving line of credit, with an interest rate of LIBOR plus 2%, with availability based on the combination of the eligible accounts receivable and inventory balances of Apio and its subsidiaries. |
|
2) |
A $12.7 million capital equipment loan which matures in seven years payable in monthly principal and interest payments of $175,356 with interest based on a fixed rate of 4.39% per annum. |
|
3) |
A $19.2 million real estate loan, $1.2 million of which was paid in April 2013, and the remainder maturing in ten years. The real estate loan has a fifteen year amortization period due in monthly principal and interest payments of $141,962 with interest based on a fixed rate of 4.02% per annum. The principal balance remaining at the end of the ten year term is due in one lump sum on April 23, 2022. |
On July 17, 2014, Apio entered into an amendment with GE Capital, which amended the revolving line of credit dated April 23, 2012. Under the amendment, the revolving line of credit increased from $25 million to $40 million, the interest rate was reduced from LIBOR plus 2.0% to LIBOR plus 1.75%, the term was extended to July 17, 2019 and the parties made certain other insignificant changes. The availability under the revolving line of credit is based on the combination of the eligible accounts receivable and eligible inventory (availability was $18.8 million at March 1, 2015). Apio’s revolving line of credit has an unused fee of 0.375% per annum. At March 1, 2015 and May 25, 2014, $9.3 million and zero were outstanding under Apio’s revolving line of credit.
Also on July 17, 2014, Apio entered into a new equipment loan whereby Apio can borrow up to $25 million based on eligible equipment purchases between August 1, 2012 and August 31, 2015. Each borrowing under this new equipment loan has a five year term with a seven year amortization period. On August 28, 2014, Apio borrowed $7.1 million under this new equipment loan at a fixed rate of 3.68%. On November 24, 2014, Apio borrowed an additional $4.1 million under the new equipment loan at a fixed rate of 3.74%.
The GE Capital real estate, equipment and line of credit agreements (collectively the “GE Debt Agreements”) are secured by liens on all of the property of Apio and its subsidiaries. The GE Debt Agreements contain customary events of default under which obligations could be accelerated or increased. The GE Debt Agreements are guaranteed by Landec and Landec has pledged its equity interest in Apio as collateral under the line of credit agreement. The GE Debt Agreements contain customary covenants, such as limitations on the ability to (1) incur indebtedness or grant liens or negative pledges on Apio’s assets; (2) make loans or other investments; (3) pay dividends, sell stock or repurchase stock or other securities; (4) sell assets; (5) engage in mergers; (6) enter into sale and leaseback transactions; and (7) make changes in Apio’s corporate structure. In addition, Apio must maintain a minimum fixed charge coverage ratio of not less than 1.10 to 1.0 if the availability under its line of credit falls below $12.0 million. Apio was in compliance with all financial covenants as of March 1, 2015 and May 25, 2014. Unamortized loan origination fees for the GE Debt Agreements were $1.1 million and $1.0 million at March 1, 2015 and May 25, 2014, respectively, and are included in other assets in the Consolidated Balance Sheets.
On May 23, 2012, Lifecore entered into two financing agreements with BMO Harris Bank N.A. and/or its affiliates (“BMO Harris”), collectively (the “Lifecore Loan Agreements”):
|
(1) |
A Credit and Security Agreement (the “Credit Agreement”) which includes (a) a two-year, $10.0 million asset-based working capital revolving line of credit, with an interest rate of LIBOR plus 1.85%, with availability based on the combination of Lifecore’s eligible accounts receivable and inventory balances (availability was $7.3 million at March 1, 2015) and with no unused fee (as of March 1, 2015 and May 25, 2014, no amounts were outstanding under the line of credit) and (b) a $12.0 million term loan which matures in four years due in monthly payments of $250,000 with interest payable monthly based on a variable interest rate of LIBOR plus 2% (the “Term Loan”). |
|
(2) |
A Reimbursement Agreement pursuant to which BMO Harris caused its affiliate Bank of Montreal to issue an irrevocable letter of credit in the amount of $3.5 million (the “Letter of Credit”) which is securing the IRBs described above. |
The obligations of Lifecore under the Lifecore Loan Agreements are secured by liens on all of the property of Lifecore. The Lifecore Loan Agreements contain customary covenants, such as limitations on the ability to (1) incur indebtedness or grant liens or negative pledges on Lifecore’s assets; (2) make loans or other investments; (3) pay dividends or repurchase stock or other securities; (4) sell assets; (5) engage in mergers; (6) enter into sale and leaseback transactions; (7) adopt certain benefit plans; and (8) make changes in Lifecore’s corporate structure. In addition, under the Credit Agreement, Lifecore must maintain (a) a minimum fixed charge coverage ratio of 1.10 to 1.0 and a minimum quick ratio of 1.25 to 1.00, both of which must be satisfied as of the end of each fiscal quarter and (b) a minimum tangible net worth of $29,000,000, measured as of the end of each fiscal year. Lifecore was in compliance with all financial covenants as of March 1, 2015 and May 25, 2014. Unamortized loan origination fees for the Lifecore Loan Agreements were $61,000 and $98,000 at March 1, 2015 and May 25, 2014, respectively, and are included in other assets in the Consolidated Balance Sheets.
The Term Loan was used to repay the Lifecore’s former credit facility with Wells Fargo Bank, N.A. (“Wells Fargo”). The Letter of Credit (which replaces a letter of credit previously provided by Wells Fargo) provides liquidity and credit support for the IRBs.
In May 2010, the Company entered into a five-year interest rate swap agreement under its prior credit agreement with Wells Fargo, which expires on April 30, 2015. The interest rate swap was originally designated as a cash flow hedge of future interest payments of LIBOR and had a notional amount of $20 million. As a result of the interest rate swap transaction, the Company fixed for a five-year period the interest rate at 4.24% subject to market based interest rate risk on $20 million of borrowings under the credit agreement with Wells Fargo. The Company’s obligations under the interest rate swap transaction as to the scheduled payments were guaranteed and secured on the same basis as its obligations under the credit agreement with Wells Fargo at the time the agreement was consummated. Upon entering into the new Term Loan with BMO Harris, the Company used the proceeds from that loan to pay off the Wells Fargo credit facility. The swap with Wells Fargo was not terminated upon the extinguishment of the debt with Wells Fargo. The fair value of the swap arrangement as of March 1, 2015 and May 25, 2014 was $2,000 and $44,000, respectively, and is included in other accrued liabilities in the accompanying Consolidated Balance Sheets.
Landec believes that its cash from operations, along with existing cash, cash equivalents and marketable securities will be sufficient to finance its operational and capital requirements for at least the next twelve months.
|
Item 3. |
Quantitative and Qualitative Disclosures about Market Risk |
There have been no material changes to the Company's market risk during the first nine months of fiscal year 2015.
|
Item 4. |
Controls and Procedures |
Evaluation of Disclosure Controls and Procedures
Our management evaluated, with the participation of our Chief Executive Officer and our Chief Financial Officer, the effectiveness of our disclosure controls and procedures as of the end of the period covered by this Quarterly Report on Form 10-Q. Based on this evaluation, our Chief Executive Officer and our Chief Financial Officer have concluded that our disclosure controls and procedures are effective in ensuring that information required to be disclosed in reports filed under the Exchange Act is recorded, processed, summarized and reported within the time periods specified by the Securities and Exchange Commission, and are effective in providing reasonable assurance that information required to be disclosed by the Company in such reports is accumulated and communicated to the Company’s management, including its Chief Executive Officer and Chief Financial Officer, as appropriate to allow timely decisions regarding required disclosure.
Changes in Internal Control over Financial Reporting
There were no changes in our internal controls over financial reporting during the fiscal quarter ended March 1, 2015 that have materially affected, or are reasonably likely to materially affect, our internal controls over financial reporting.
Part II. Other Information
|
Item1. |
Legal Proceedings |
As of the date of this report, the Company is not a party to any legal proceedings.
|
Item 1A. |
Risk Factors |
There have been no significant changes to the Company's risk factors which are included and described in the Form 10-K for the fiscal year ended May 25, 2014 filed with the Securities and Exchange Commission on August 1, 2014.
|
Item 2. |
Unregistered Sales of Equity Securities and Use of Proceeds |
There were no unregistered sales of equity securities or shares repurchased by the Company during the fiscal quarter ended on March 1, 2015.
|
Item 3. |
Defaults Upon Senior Securities |
None.
|
Item 4. |
Mine Safety Disclosures |
Not applicable
|
Item 5. |
Other Information |
None.
|
Item 6. |
Exhibits |
|
Exhibit Number |
Exhibit Title: | |
| 31.1+ | CEO Certification pursuant to section 302 of the Sarbanes-Oxley Act of 2002. | |
| 31.2+ | CFO Certification pursuant to section 302 of the Sarbanes-Oxley Act of 2002. | |
| 32.1+ | CEO Certification pursuant to section 906 of the Sarbanes-Oxley Act of 2002. | |
|
32.2+ |
CFO Certification pursuant to section 906 of the Sarbanes-Oxley Act of 2002. | |
| 101.INS** | XBRL Instance | |
| 101.SCH** | XBRL Taxonomy Extension Schema | |
| 101.CAL** | XBRL Taxonomy Extension Calculation | |
| 101.DEF** | XBRL Taxonomy Extension Definition | |
| 101.LAB** | XBRL Taxonomy Extension Labels | |
| 101.PRE** | XBRL Taxonomy Extension Presentation | |
| + | Filed herewith. | |
| ** XBRL | information is furnished and not filed or a part of a registration statement or prospectus for purposes of sections 11 or 12 of the Securities Act of 1933, as amended, is deemed not filed for purposes of section 18 of the Securities Exchange Act of 1934, as amended, and otherwise is not subject to liability under these sections. |
SIGNATURES
Pursuant to the requirements of the Securities Exchange Act of 1934, the Registrant has duly caused this Report to be signed on its behalf by the undersigned, thereunto duly authorized.
| LANDEC CORPORATION | ||||
|
|
By: |
/s/ |
Gregory S. Skinner |
|
|
|
|
Gregory S. Skinner |
||
|
|
|
Vice President, Finance and Chief Financial Officer | ||
|
|
|
(Principal Financial and Accounting Officer) | ||
Date: April 2, 2015
-32-