Attached files
| file | filename |
|---|---|
| 8-K - 8-K - Genesis Healthcare, Inc. | a15-16217_18k.htm |
| EX-23.1 - EX-23.1 - Genesis Healthcare, Inc. | a15-16217_1ex23d1.htm |
| EX-99.2 - EX-99.2 - Genesis Healthcare, Inc. | a15-16217_1ex99d2.htm |
| EX-23.2 - EX-23.2 - Genesis Healthcare, Inc. | a15-16217_1ex23d2.htm |
Exhibit 99.1
FC-GEN Operations Investment, LLC and Subsidiaries
Consolidated Financial Statements
December 31, 2014
Index to Consolidated Financial Statements
|
|
Page |
|
|
|
|
Report of Independent Registered Public Accounting Firm |
2 |
|
|
|
|
Consolidated Balance Sheets as of December 31, 2014 and 2013 |
3 |
|
|
|
|
Consolidated Statements of Operations for the years ended December 31, 2014, 2013 and 2012 |
4 |
|
|
|
|
Consolidated Statements of Comprehensive Income (Loss) for the years ended December 31, 2014, 2013 and 2012 |
5 |
|
|
|
|
Consolidated Statements of Stockholders’ Equity (Deficit) for the years ended December 31, 2014, 2013 and 2012 |
6 |
|
|
|
|
Consolidated Statements of Cash Flows for the years ended December 31, 2014, 2013 and 2012 |
7 |
|
|
|
|
Notes to Consolidated Financial Statements |
8 |
|
|
|
|
Quarterly Consolidated Financial Statements (Unaudited) |
39 |
|
|
|
|
Schedule II — Valuation and Qualifying Accounts |
40 |
|
|
|
|
Selected Financial Data |
41 |
|
|
|
|
Management’s Discussion and Analysis of Financial Condition and Results of Operations |
42 |
Report of Independent Registered Public Accounting Firm
The Board of Directors and Stockholders
Genesis Healthcare, Inc.:
We have audited the accompanying consolidated balance sheets of FC-GEN Operations Investment, LLC and subsidiaries (the Company) as of December 31, 2014 and 2013, and the related consolidated statements of operations, comprehensive income (loss), stockholders’ equity (deficit), and cash flows for each of the years in the three-year period ended December 31, 2014. In connection with our audits of the consolidated financial statements, we also have audited financial statement schedule “Schedule II. Valuation and Qualifying Accounts.” These consolidated financial statements and financial statement schedule are the responsibility of the Company’s management. Our responsibility is to express an opinion on these consolidated financial statements and financial statement schedule based on our audits.
We conducted our audits in accordance with the standards of the Public Company Accounting Oversight Board (United States). Those standards require that we plan and perform the audit to obtain reasonable assurance about whether the financial statements are free of material misstatement. An audit includes examining, on a test basis, evidence supporting the amounts and disclosures in the financial statements. An audit also includes assessing the accounting principles used and significant estimates made by management, as well as evaluating the overall financial statement presentation. We believe that our audits provide a reasonable basis for our opinion.
In our opinion, the consolidated financial statements referred to above present fairly, in all material respects, the financial position of FC-GEN Operations Investment, LLC and subsidiaries as of December 31, 2014 and 2013, and the results of their operations and their cash flows for each of the years in the three-year period ended December 31, 2014, in conformity with U.S. generally accepted accounting principles. Also in our opinion, the related financial statement schedule, when considered in relation to the basic consolidated financial statements taken as a whole, presents fairly, in all material respects, the information set forth therein.
|
|
/s/ KPMG LLP |
|
|
|
|
Philadelphia, Pennsylvania |
|
|
July 24, 2015 |
|
FC-GEN OPERATIONS INVESTMENT, LLC AND SUBSIDIARIES
CONSOLIDATED BALANCE SHEETS
(IN THOUSANDS, EXCEPT SHARE AND PER SHARE DATA)
|
|
|
December 31, 2014 |
|
December 31, 2013 |
| ||
|
|
|
|
|
|
| ||
|
Assets: |
|
|
|
|
| ||
|
Current assets: |
|
|
|
|
| ||
|
Cash and equivalents |
|
$ |
87,548 |
|
$ |
61,413 |
|
|
Restricted cash and investments in marketable securities |
|
38,211 |
|
72,930 |
| ||
|
Accounts receivable, net of allowances for doubtful accounts of $133,530 in 2014 and $106,093 in 2013 |
|
605,830 |
|
659,164 |
| ||
|
Prepaid expenses |
|
72,873 |
|
51,898 |
| ||
|
Other current assets |
|
33,511 |
|
35,734 |
| ||
|
Deferred income taxes |
|
58,213 |
|
45,888 |
| ||
|
Total current assets |
|
896,186 |
|
927,027 |
| ||
|
Property and equipment, net of accumulated depreciation of $502,176 in 2014 and $325,490 in 2013 |
|
3,493,250 |
|
3,550,950 |
| ||
|
Restricted cash and investments in marketable securities |
|
108,529 |
|
50,065 |
| ||
|
Other long-term assets |
|
140,119 |
|
119,466 |
| ||
|
Deferred income taxes |
|
160,531 |
|
125,303 |
| ||
|
Identifiable intangible assets, net of accumulated amortization of $42,661 in 2014 and $27,969 in 2013 |
|
173,112 |
|
194,513 |
| ||
|
Goodwill |
|
169,681 |
|
169,681 |
| ||
|
Total assets |
|
$ |
5,141,408 |
|
$ |
5,137,005 |
|
|
Liabilities and Stockholders’ Deficit: |
|
|
|
|
| ||
|
Current liabilities: |
|
|
|
|
| ||
|
Current installments of long-term debt |
|
$ |
12,518 |
|
$ |
16,268 |
|
|
Capital lease obligations |
|
2,875 |
|
2,857 |
| ||
|
Financing obligations |
|
1,138 |
|
1,288 |
| ||
|
Accounts payable |
|
195,339 |
|
188,159 |
| ||
|
Accrued expenses |
|
125,000 |
|
156,460 |
| ||
|
Accrued compensation |
|
192,838 |
|
185,099 |
| ||
|
Self-insurance reserves |
|
130,874 |
|
135,552 |
| ||
|
Total current liabilities |
|
660,582 |
|
685,683 |
| ||
|
Long-term debt |
|
525,728 |
|
473,165 |
| ||
|
Capital lease obligations |
|
1,002,762 |
|
972,760 |
| ||
|
Financing obligations |
|
2,911,200 |
|
2,785,103 |
| ||
|
Deferred income taxes |
|
19,215 |
|
29,993 |
| ||
|
Self-insurance reserves |
|
355,344 |
|
263,455 |
| ||
|
Other long-term liabilities |
|
124,067 |
|
110,727 |
| ||
|
Commitments and contingencies |
|
|
|
|
| ||
|
Stockholders’ deficit: |
|
|
|
|
| ||
|
Class A common stock (par $0.001, 175,000,000 shares authorized, issued and outstanding 49,864,878 at December 31, 2014 and December 31, 2013) |
|
50 |
|
50 |
| ||
|
Additional paid-in capital |
|
143,492 |
|
161,452 |
| ||
|
Accumulated deficit |
|
(603,254 |
) |
(349,269 |
) | ||
|
Accumulated other comprehensive income |
|
515 |
|
1,068 |
| ||
|
Total stockholders’ deficit before noncontrolling interests |
|
(459,197 |
) |
(186,699 |
) | ||
|
Noncontrolling interests |
|
1,707 |
|
2,818 |
| ||
|
Total stockholders’ deficit |
|
(457,490 |
) |
(183,881 |
) | ||
|
Total liabilities and stockholders’ deficit |
|
$ |
5,141,408 |
|
$ |
5,137,005 |
|
See accompanying notes to the consolidated financial statements.
FC-GEN OPERATIONS INVESTMENT, LLC AND SUBSIDIARIES
CONSOLIDATED STATEMENTS OF OPERATIONS
(IN THOUSANDS, EXCEPT PER SHARE DATA)
|
|
|
Year ended December 31, |
| |||||||
|
|
|
2014 |
|
2013 |
|
2012 |
| |||
|
|
|
|
|
|
|
|
| |||
|
Net revenues |
|
$ |
4,768,080 |
|
$ |
4,710,341 |
|
$ |
3,076,298 |
|
|
|
|
|
|
|
|
|
| |||
|
Salaries, wages and benefits |
|
2,904,094 |
|
2,898,860 |
|
1,946,383 |
| |||
|
Other operating expenses |
|
1,109,732 |
|
1,007,909 |
|
634,233 |
| |||
|
General and administrative costs |
|
147,030 |
|
152,555 |
|
107,997 |
| |||
|
Provision for losses on accounts receivable |
|
77,670 |
|
69,939 |
|
42,003 |
| |||
|
Lease expense |
|
131,898 |
|
131,231 |
|
35,367 |
| |||
|
Depreciation and amortization expense |
|
193,675 |
|
188,726 |
|
146,387 |
| |||
|
Interest expense |
|
442,724 |
|
426,975 |
|
323,641 |
| |||
|
Loss (gain) on early extinguishment of debt |
|
1,133 |
|
63 |
|
(1,777 |
) | |||
|
Investment income |
|
(3,399 |
) |
(4,150 |
) |
(3,782 |
) | |||
|
Other (income) loss |
|
(138 |
) |
450 |
|
(849 |
) | |||
|
Transaction costs |
|
13,353 |
|
5,878 |
|
29,755 |
| |||
|
Long-lived asset impairment |
|
31,399 |
|
9,999 |
|
— |
| |||
|
Equity in net loss (income) of unconsolidated affiliates |
|
416 |
|
691 |
|
(515 |
) | |||
|
|
|
|
|
|
|
|
| |||
|
Loss before income tax benefit |
|
(281,507 |
) |
(178,785 |
) |
(182,545 |
) | |||
|
Income tax benefit |
|
(44,022 |
) |
(9,179 |
) |
(11,633 |
) | |||
|
|
|
|
|
|
|
|
| |||
|
Loss from continuing operations |
|
(237,485 |
) |
(169,606 |
) |
(170,912 |
) | |||
|
Loss from discontinued operations, net of taxes |
|
(14,044 |
) |
(7,364 |
) |
(810 |
) | |||
|
|
|
|
|
|
|
|
| |||
|
Net loss |
|
(251,529 |
) |
(176,970 |
) |
(171,722 |
) | |||
|
Less net (income) loss attributable to noncontrolling interests |
|
(2,456 |
) |
(1,025 |
) |
448 |
| |||
|
Net loss attributable to FC-GEN Operations Investment, LLC |
|
$ |
(253,985 |
) |
$ |
(177,995 |
) |
$ |
(171,274 |
) |
|
|
|
|
|
|
|
|
| |||
|
Loss per common share: |
|
|
|
|
|
|
| |||
|
Basic and diluted: |
|
|
|
|
|
|
| |||
|
Weighted average shares outstanding for basic and diluted loss from continuing operations per share |
|
49,865 |
|
49,865 |
|
49,865 |
| |||
|
|
|
|
|
|
|
|
| |||
|
Basic and diluted net loss per common share: |
|
|
|
|
|
|
| |||
|
Loss from continuing operations attributable to FC-GEN Operations Investment, LLC |
|
$ |
(4.81 |
) |
$ |
(3.42 |
) |
$ |
(3.41 |
) |
|
Loss from discontinued operations, net of taxes |
|
(0.28 |
) |
(0.15 |
) |
(0.02 |
) | |||
|
Net loss attributable to FC-GEN Operations Investment, LLC |
|
$ |
(5.09 |
) |
$ |
(3.57 |
) |
$ |
(3.43 |
) |
See accompanying notes to the consolidated financial statements.
FC-GEN OPERATIONS INVESTMENT, LLC AND SUBSIDIARIES
CONSOLIDATED STATEMENTS OF COMPREHENSIVE INCOME (LOSS)
(IN THOUSANDS)
|
|
|
Year ended December 31, |
| |||||||
|
|
|
2014 |
|
2013 |
|
2012 |
| |||
|
Net loss |
|
$ |
(251,529 |
) |
$ |
(176,970 |
) |
$ |
(171,722 |
) |
|
Net unrealized (loss) gain on marketable securities, net of tax |
|
(553 |
) |
(1,916 |
) |
34 |
| |||
|
Comprehensive loss |
|
(252,082 |
) |
(178,886 |
) |
(171,688 |
) | |||
|
Less: comprehensive (income) loss attributable to noncontrolling interests |
|
(2,456 |
) |
(1,025 |
) |
448 |
| |||
|
Comprehensive loss attributable to FC-GEN Operations Investment, LLC |
|
$ |
(254,538 |
) |
$ |
(179,911 |
) |
$ |
(171,240 |
) |
See accompanying notes to the consolidated financial statements.
FC-GEN OPERATIONS INVESTMENT, LLC AND SUBSIDIARIES
CONSOLIDATED STATEMENTS OF STOCKHOLDERS’ EQUITY (DEFICIT)
(IN THOUSANDS)
|
|
|
|
|
|
|
|
|
|
|
Accumulated |
|
|
|
|
|
|
| |||||||
|
|
|
|
|
|
|
|
|
|
|
other |
|
|
|
|
|
Total |
| |||||||
|
|
|
Class A Common Stock |
|
Additional |
|
Accumulated |
|
comprehensive |
|
Stockholders’ |
|
Noncontrolling |
|
stockholders’ |
| |||||||||
|
|
|
Shares |
|
Amount |
|
paid-in capital |
|
deficit |
|
income (loss) |
|
deficit |
|
interests |
|
equity (deficit) |
| |||||||
|
|
|
|
|
|
|
|
|
|
|
|
|
|
|
|
|
|
| |||||||
|
Balance at December 31, 2011 |
|
49,865 |
|
$ |
50 |
|
$ |
177,065 |
|
$ |
— |
|
$ |
2,950 |
|
$ |
180,065 |
|
$ |
57 |
|
$ |
180,122 |
|
|
Net loss |
|
— |
|
— |
|
— |
|
(171,274 |
) |
— |
|
(171,274 |
) |
(448 |
) |
(171,722 |
) | |||||||
|
Net unrealized gain on marketable securities, net of tax |
|
— |
|
— |
|
— |
|
— |
|
34 |
|
34 |
|
— |
|
34 |
| |||||||
|
Contributions by stockholders |
|
— |
|
— |
|
25,000 |
|
— |
|
— |
|
25,000 |
|
— |
|
25,000 |
| |||||||
|
Distributions to stockholders |
|
— |
|
— |
|
(35,274 |
) |
— |
|
— |
|
(35,274 |
) |
— |
|
(35,274 |
) | |||||||
|
Acquisition of noncontrolling interest |
|
— |
|
— |
|
— |
|
— |
|
— |
|
— |
|
4,528 |
|
4,528 |
| |||||||
|
Consolidation of noncontrolling interests |
|
— |
|
— |
|
— |
|
— |
|
— |
|
— |
|
15 |
|
15 |
| |||||||
|
Distributions to noncontrolling interests |
|
— |
|
— |
|
— |
|
— |
|
— |
|
— |
|
(684 |
) |
(684 |
) | |||||||
|
Balance at December 31, 2012 |
|
49,865 |
|
$ |
50 |
|
$ |
166,791 |
|
$ |
(171,274 |
) |
$ |
2,984 |
|
$ |
(1,449 |
) |
$ |
3,468 |
|
$ |
2,019 |
|
|
Net loss |
|
— |
|
— |
|
— |
|
(177,995 |
) |
— |
|
(177,995 |
) |
1,025 |
|
(176,970 |
) | |||||||
|
Net unrealized loss on marketable securities, net of tax |
|
— |
|
— |
|
— |
|
— |
|
(1,916 |
) |
(1,916 |
) |
— |
|
(1,916 |
) | |||||||
|
Distributions to stockholders |
|
— |
|
— |
|
(5,339 |
) |
— |
|
— |
|
(5,339 |
) |
— |
|
(5,339 |
) | |||||||
|
Distributions to noncontrolling interests |
|
— |
|
— |
|
— |
|
— |
|
— |
|
— |
|
(1,675 |
) |
(1,675 |
) | |||||||
|
Balance at December 31, 2013 |
|
49,865 |
|
$ |
50 |
|
$ |
161,452 |
|
$ |
(349,269 |
) |
$ |
1,068 |
|
$ |
(186,699 |
) |
$ |
2,818 |
|
$ |
(183,881 |
) |
|
Net loss |
|
— |
|
— |
|
— |
|
(253,985 |
) |
— |
|
(253,985 |
) |
2,456 |
|
(251,529 |
) | |||||||
|
Net unrealized loss on marketable securities, net of tax |
|
— |
|
— |
|
— |
|
— |
|
(553 |
) |
(553 |
) |
— |
|
(553 |
) | |||||||
|
Distributions to stockholders |
|
— |
|
— |
|
(17,960 |
) |
— |
|
— |
|
(17,960 |
) |
— |
|
(17,960 |
) | |||||||
|
Distributions to noncontrolling interests |
|
— |
|
— |
|
— |
|
— |
|
— |
|
— |
|
(3,567 |
) |
(3,567 |
) | |||||||
|
Balance at December 31, 2014 |
|
49,865 |
|
$ |
50 |
|
$ |
143,492 |
|
$ |
(603,254 |
) |
$ |
515 |
|
$ |
(459,197 |
) |
$ |
1,707 |
|
$ |
(457,490 |
) |
See accompanying notes to the consolidated financial statements.
FC-GEN OPERATIONS INVESTMENT, LLC AND SUBSIDIARIES
CONSOLIDATED STATEMENTS OF CASH FLOWS
(IN THOUSANDS)
|
|
|
Year ended December 31, |
| |||||||
|
|
|
2014 |
|
2013 |
|
2012 |
| |||
|
|
|
|
|
|
|
|
| |||
|
Cash flows from operating activities: |
|
|
|
|
|
|
| |||
|
Net loss |
|
$ |
(251,529 |
) |
$ |
(176,970 |
) |
$ |
(171,722 |
) |
|
Adjustments to reconcile net loss to net cash provided by operating activities: |
|
|
|
|
|
|
| |||
|
Non-cash interest and leasing arrangements, net |
|
86,073 |
|
89,141 |
|
72,883 |
| |||
|
Other non-cash charges and (gains) |
|
3,947 |
|
2,853 |
|
(575 |
) | |||
|
Depreciation and amortization |
|
196,192 |
|
191,479 |
|
146,113 |
| |||
|
Provision for losses on accounts receivable |
|
78,552 |
|
71,538 |
|
42,159 |
| |||
|
Equity in net loss (income) of unconsolidated affiliates |
|
416 |
|
691 |
|
(515 |
) | |||
|
Provision for deferred taxes |
|
(58,293 |
) |
(25,693 |
) |
(9,811 |
) | |||
|
Long-lived asset impairment |
|
31,399 |
|
9,999 |
|
— |
| |||
|
Loss (gain) on early extinguishment of debt |
|
1,133 |
|
63 |
|
(1,777 |
) | |||
|
Changes in assets and liabilities: |
|
|
|
|
|
|
| |||
|
Transaction costs |
|
— |
|
(17,203 |
) |
(18,644 |
) | |||
|
Accounts receivable |
|
(33,568 |
) |
(109,844 |
) |
(45,290 |
) | |||
|
Accounts payable and other accrued expenses and other |
|
53,330 |
|
46,095 |
|
(2,849 |
) | |||
|
Net cash provided by operating activities |
|
107,652 |
|
82,149 |
|
9,972 |
| |||
|
Cash flows from investing activities: |
|
|
|
|
|
|
| |||
|
Capital expenditures |
|
(70,987 |
) |
(77,399 |
) |
(66,704 |
) | |||
|
Purchases of marketable securities |
|
(30,449 |
) |
(39,569 |
) |
(43,794 |
) | |||
|
Proceeds on maturity or sale of marketable securities |
|
30,188 |
|
26,227 |
|
36,758 |
| |||
|
Net change in restricted cash and equivalents |
|
(24,405 |
) |
4,235 |
|
(5,476 |
) | |||
|
Purchase of Sun, net of cash acquired |
|
— |
|
— |
|
(168,914 |
) | |||
|
Sale of hospice subsidiary |
|
— |
|
— |
|
75,306 |
| |||
|
Purchases of inpatient assets, net of cash acquired |
|
(1,878 |
) |
(12,200 |
) |
(5,175 |
) | |||
|
Sales of inpatient assets |
|
5,227 |
|
8,354 |
|
— |
| |||
|
Investment in joint ventures |
|
(2,309 |
) |
(6,182 |
) |
(2,000 |
) | |||
|
Other, net |
|
(1,062 |
) |
4,832 |
|
(2,900 |
) | |||
|
Net cash used in investing activities |
|
(95,675 |
) |
(91,702 |
) |
(182,899 |
) | |||
|
Cash flows from financing activities: |
|
|
|
|
|
|
| |||
|
Borrowings under revolving credit facility |
|
603,500 |
|
866,000 |
|
799,010 |
| |||
|
Repayments under revolving credit facility |
|
(549,000 |
) |
(828,000 |
) |
(714,010 |
) | |||
|
Proceeds from issuance of long-term debt |
|
960 |
|
15,095 |
|
317,322 |
| |||
|
Proceeds from tenant improvement draws under lease arrangements |
|
6,087 |
|
10,498 |
|
31,024 |
| |||
|
Repayment of long-term debt |
|
(17,947 |
) |
(35,085 |
) |
(226,024 |
) | |||
|
Debt issuance costs |
|
(7,915 |
) |
(746 |
) |
(21,335 |
) | |||
|
Distributions to noncontrolling interests |
|
(3,567 |
) |
(1,675 |
) |
(684 |
) | |||
|
Contributions by stockholders |
|
— |
|
— |
|
25,000 |
| |||
|
Distributions to stockholders |
|
(17,960 |
) |
(5,339 |
) |
(35,274 |
) | |||
|
Other, net |
|
— |
|
— |
|
(2,800 |
) | |||
|
Net cash provided by financing activities |
|
14,158 |
|
20,748 |
|
172,229 |
| |||
|
Net increase (decrease) in cash and equivalents |
|
26,135 |
|
11,195 |
|
(698 |
) | |||
|
Cash and equivalents: |
|
|
|
|
|
|
| |||
|
Beginning of period |
|
61,413 |
|
50,218 |
|
50,916 |
| |||
|
End of period |
|
$ |
87,548 |
|
$ |
61,413 |
|
$ |
50,218 |
|
|
Supplemental disclosure of cash flow information: |
|
|
|
|
|
|
| |||
|
Interest paid |
|
$ |
369,124 |
|
$ |
354,129 |
|
$ |
260,036 |
|
|
Taxes paid |
|
2,408 |
|
12,584 |
|
5,317 |
| |||
|
Non-cash financing activities: |
|
|
|
|
|
|
| |||
|
Capital leases |
|
$ |
13,096 |
|
$ |
(54,626 |
) |
$ |
680,909 |
|
|
Financing obligations |
|
80,284 |
|
43,934 |
|
21,282 |
| |||
|
Assumption of long-term debt |
|
— |
|
— |
|
113,340 |
| |||
See accompanying notes to the consolidated financial statements.
FC-GEN Operations Investment, LLC and Subsidiaries
Notes to Consolidated Financial Statements
(1) General Information
Description of Business
FC-GEN Operations Investment, LLC (the Company) provides inpatient services through 414 skilled nursing, assisted living and behavioral health centers located in 28 states. These centers are operated by wholly owned subsidiaries of the Company. Revenues of the Company’s owned, leased and otherwise consolidated centers constitute approximately 85% of its revenues.
The Company also provides, through wholly owned subsidiaries, a range of rehabilitation therapy services, including speech pathology, physical therapy, occupational therapy and respiratory health services. These services are provided by rehabilitation therapists and assistants employed or contracted at substantially all of the centers operated by the Company, as well as by contract to healthcare facilities operated by others. After the elimination of intercompany revenues, the rehabilitation therapy services business constitutes approximately 13% of the Company’s revenues.
The Company also provides, through wholly owned subsidiaries, an array of other specialty medical services, including, management services, physician services, staffing services and other healthcare related services, which comprise the balance of the Company’s revenues.
Skilled Merger - Purchase and Contribution Agreement
On August 18, 2014, Skilled Healthcare Group, Inc., a Delaware corporation (Skilled) entered into a Purchase and Contribution Agreement with the Company pursuant to which the businesses and operations of the Company and Skilled will be combined (the Combination). On February 2, 2015, the Company completed the Combination. See note 21 — “Subsequent Events.”
After completion of the transaction, the combined company now operates under the name Genesis Healthcare, Inc. and the Class A common stock of Skilled continues to trade on the NYSE under the symbol “GEN”. The current owners of the Company hold 74.25% of the economic interests in the combined entity post-transaction and the shareholders of Skilled hold the remaining 25.75% economic interest in the combined entity post-transaction. The Company obtained control over Skilled and, thus, is the accounting acquirer. Therefore, the transaction meets the definition of a reverse acquisition where the legal acquirer is the accounting acquiree. The acquisition method will be applied to the transaction based on Skilled’s stock price (level 1 valuation technique - quoted prices in active markets for identical assets or liabilities) as of the acquisition date. The consideration will be allocated to the legacy Skilled business that is being acquired on the acquisition date with any excess consideration over the fair value of the net assets acquired being recognized as goodwill. The Company’s assets and liabilities will remain at their historical costs.
Basis of Presentation
The accompanying consolidated financial statements have been prepared in accordance with U.S. generally accepted accounting principles. In the opinion of management, the consolidated financial statements include all necessary adjustments for a fair presentation of the financial position and results of operations for the periods presented.
(2) Summary of Significant Accounting Policies
Net Revenues and Accounts Receivable
The Company receives payments through reimbursement from Medicaid and Medicare programs and directly from individual residents (private pay), third-party insurers and long-term care facilities. The Company assesses collectibility on all accounts prior to providing services.
FC-GEN Operations Investment, LLC and Subsidiaries
Notes to Consolidated Financial Statements
The Company records revenue for inpatient services and the related receivables in the accounting records at the Company’s established billing rates in the period the related services are rendered. The provision for contractual adjustments, which represents the differences between the established billing rates and predetermined reimbursement rates, is deducted from gross revenue to determine net revenue. Retroactive adjustments that are likely to result from future examinations by third party payors are accrued on an estimated basis in the period the related services are rendered and adjusted as necessary in future periods based upon new information or final settlements.
The Company records revenue for rehabilitation therapy services and other ancillary services and the related receivables at the time services or products are provided or delivered to the customer. Upon delivery of products or services, the Company has no additional performance obligation to the customer.
Use of Estimates
The preparation of consolidated financial statements in conformity with U.S. generally accepted accounting principles requires management to make estimates and assumptions that affect the reported amounts of assets and liabilities and disclosure of contingent assets and liabilities at the date of the consolidated financial statements and the reported amounts of revenues and expenses during the reporting period. Actual results could differ from these estimates. Significant items subject to such estimates and assumptions include the useful lives of fixed assets, allowances for doubtful accounts and provisions for contractual adjustments, deferred tax assets, fixed assets, goodwill, identifiable intangible assets, investments, as well as reserves for employee benefit obligations, self-insurance liabilities, income tax uncertainties, asset retirement obligations and other contingencies. These estimates and assumptions are based on management’s best estimates and judgment. Management evaluates its estimates and assumptions on an ongoing basis using historical experience and other factors, including the current economic environment. Management believes its estimates to be reasonable under the circumstances. The current economic environment has increased the degree of uncertainty inherent in these estimates and assumptions. As future events and their effects cannot be determined with precision, actual results could differ significantly from these estimates.
Cash and Equivalents
Short-term investments that have a maturity of ninety days or less at acquisition are considered cash equivalents. Investments in cash equivalents are carried at cost, which approximates fair value.
Restricted Cash and Investments in Marketable Securities
Restricted cash includes cash and money market funds principally held by the Company’s wholly owned captive insurance subsidiary, which is substantially restricted to securing outstanding claims losses. The restricted cash and investments in marketable securities balances at December 31, 2014 and 2013 were $146.7 million and $123.0 million, respectively.
Restricted investments in marketable securities, comprised of fixed interest rate securities, are considered to be available-for-sale and accordingly are reported at fair value with unrealized gains and losses, net of related tax effects, included within accumulated other comprehensive income, a separate component of stockholders’ equity. Fair values for fixed interest rate securities are based on quoted market prices.
A decline in the market value of any security below cost that is deemed other-than-temporary is charged to income, resulting in the establishment of a new cost basis for the security. Realized gains and losses for securities classified as available for sale are derived using the specific identification method for determining the cost of securities sold.
Allowance for Doubtful Accounts
The Company evaluates the adequacy of its allowance for doubtful accounts by estimating allowance requirement percentages for each accounts receivable aging category for each type of payor. The Company has developed estimated allowance requirement percentages by utilizing historical collection trends and its understanding of the nature and
FC-GEN Operations Investment, LLC and Subsidiaries
Notes to Consolidated Financial Statements
collectibility of receivables in the various aging categories and the various lines of the Company’s business. The allowance percentages are developed by payor type as the accounts receivable from each payor type have unique characteristics. The allowance for doubtful accounts also considers accounts specifically identified as uncollectible. Accounts receivable that Company management specifically estimates to be uncollectible, based upon the age of the receivables, the results of collection efforts, or other circumstances, are reserved in the allowance for doubtful accounts until written-off.
Prepaid Expenses and Other Current Assets
Prepaid expenses and other current assets principally consist of expenses paid in advance of the provision of services, inventories of nursing center food and supplies, non-trade receivables and $9.0 million and $9.3 million of escrowed funds held by third parties at December 31, 2014 and 2013, respectively, in accordance with loan and other contractual agreements.
Property and Equipment
Property and equipment are recorded at cost. Depreciation is calculated using the straight-line method over estimated useful lives of 20-35 years for buildings, building improvements and land improvements, and 3-15 years for equipment, furniture and fixtures and information systems. Depreciation expense on leasehold improvements and assets held under capital leases is calculated using the straight-line method over the lesser of the lease term or the estimated useful life of the asset. Expenditures for maintenance and repairs necessary to maintain property and equipment in efficient operating condition are charged to operations as incurred. Costs of additions and betterments are capitalized.
Total depreciation expense from continuing operations for the years ended December 31, 2014, 2013 and 2012 was $184.3 million, $179.4 million, and $140.2 million, respectively.
Long-Lived Assets
The Company’s long-lived assets are reviewed for impairment whenever events or changes in circumstances indicate the carrying amount of an asset may not be recoverable. Recoverability of assets to be held and used is measured by comparison of the carrying amount of an asset to the future cash flows expected to be generated by the asset. If the carrying amount of an asset exceeds its estimated future undiscounted cash flows, an impairment charge is recognized to the extent the carrying amount of the asset exceeds the fair value of the asset. Assets to be disposed of are reported at the lower of the carrying amount or the fair value less costs to sell.
The Company performs an assessment of qualitative factors prior to the use of the two step quantitative method to determine if goodwill has been impaired. If such qualitative assessment does not indicate that it is more likely than not the fair value of the reporting is less than its carrying value, no further analysis is required. The Company performs its annual impairment assessment as of September 30, of each year or more frequently if adverse events or changes in circumstances indicate that the asset may be impaired. See note 19 — “Asset Impairment Charges.”
Self-Insurance Risks
The Company provides for self-insurance risks for both general and professional liability and workers’ compensation claims based on estimates of the ultimate costs for both reported claims and claims incurred but not reported. Estimated losses from asserted and incurred but not reported claims are accrued based on the Company’s estimates of the ultimate costs of the claims, which includes costs associated with litigating or settling claims, and the relationship of past reported incidents to eventual claims payments. All relevant information, including the Company’s own historical experience, the nature and extent of existing asserted claims and reported incidents, and independent actuarial analyses of this information is used in estimating the expected amount of claims. The reserves for loss for workers’ compensation risks are discounted based on actuarial estimates of claim payment patterns whereas the reserves for general and professional liability are recorded on an undiscounted basis. The Company also considers amounts that may be recovered from excess insurance carriers in estimating the ultimate net liability for such risks.
FC-GEN Operations Investment, LLC and Subsidiaries
Notes to Consolidated Financial Statements
Income Taxes
The Company is treated as a partnership for federal and state income tax purposes. Therefore, the consolidated financial statements do not include any provision for federal or state income taxes, except for the subsidiaries that continued to be treated as corporations for federal and state income tax purposes and for the few jurisdictions that tax partnership income. The Company’s financial results are allocated to the Company’s members. The Company’s members include these results on their separate tax returns.
For the Company’s subsidiaries treated as corporations for federal and state income tax purposes, the provision (benefit) for income taxes is based upon their annual reported income or loss for each respective accounting period. Deferred income taxes arise from the recognition of the tax consequences of temporary differences between the tax basis of assets and liabilities and their reported amounts in the consolidated financial statements. These temporary differences will result in taxable or deductible amounts in future years when the reported amounts of the assets are recovered or liabilities are settled. The Company also recognizes as deferred tax assets the future tax benefits from net operating loss (NOL) carryforwards. A valuation allowance is provided for these and other deferred tax assets if it is more likely than not that some portion or all of the net deferred tax assets will not be realized.
The Company records accrued interest and penalties associated with uncertain tax positions as income tax expense in the consolidated statement of operations.
Leases
Leasing transactions are a material part of the Company’s business. The following discussion summarizes various aspects of the Company’s accounting for leasing transactions and the related balances.
Capital Leases
Lease arrangements are capitalized when such leases convey substantially all the risks and benefits incidental to ownership. Capital leases are amortized over either the lease term or the life of the related assets, depending upon available purchase options and lease renewal features. Amortization related to capital leases is included in the consolidated statements of operations within depreciation and amortization expense.
Operating Leases
For operating leases, minimum lease payments, including minimum scheduled rent increases, are recognized as lease expense on a straight-line basis over the applicable lease terms and any periods during which the Company has use of the property but is not charged rent by a landlord. Lease terms, in most cases, provide for rent escalations and renewal options.
When the Company purchases businesses that have operating lease agreements, it recognizes the fair value of the lease arrangements as either favorable or unfavorable and records these amounts as other identifiable intangible assets or other long-term liabilities, respectively. Favorable and unfavorable leases are amortized to lease expense on a straight-line basis over the remaining term of the leases.
Sale/Leaseback Financing Obligation
Prior to recognition as a sale, or profit/loss thereon, sale/leaseback transactions are evaluated to determine if their terms transfer all of the risks and rewards of ownership as demonstrated by the absence of any other continuing involvement by the seller-lessee. A sale/leaseback transaction that does not qualify for sale/leaseback accounting because of any form of continuing involvement by the seller-lessee is accounted for as a financing transaction. Under the financing method: (1) the assets and accumulated depreciation remain on the consolidated balance sheet and continue to be depreciated over the remaining useful lives; (2) no gain is recognized; and (3) proceeds received by the Company from these transactions are recorded as a financing obligation.
FC-GEN Operations Investment, LLC and Subsidiaries
Notes to Consolidated Financial Statements
Asset Retirement Obligations
The fair value of a liability for an asset retirement obligation is recognized in the period when the asset is placed in service. The fair value of the liability is estimated using discounted cash flows. In subsequent periods, the retirement obligation is accreted to its future value or the estimate of the obligation at the asset retirement date. The accretion charge is reflected separately on the consolidated statement of operations. A corresponding retirement asset equal to the fair value of the retirement obligation is also recorded as part of the carrying amount of the related long-lived asset and depreciated over the asset’s useful life.
Recent Accounting Pronouncements
In April 2014, the FASB issued ASU No. 2014-08, Reporting Discontinued Operations and Disclosures of Disposals of Components of an Entity, (ASU 2014-08). This ASU requires an entity to report disposed components or components held-for-sale in discontinued operations if such components represent a strategic shift that has or will have a significant effect on operations and financial results. Additionally, expanded disclosure about discontinued operations and disposals of significant components that do not qualify for discontinued operations presentation will be required. The adoption of ASU 2014-08 is effective prospectively for disposals that occur within annual periods beginning on or after December 15, 2014, with early adoption permitted. The Company adopted ASU 2014-08 in the fourth quarter of 2014 and its adoption did not have a material impact on the consolidated financial statements.
In May 2014, the FASB issued ASU No. 2014-09, Revenue from Contracts with Customers, (ASU 2014-08). This ASU requires an entity to recognize revenue to depict the transfer of promised goods or services to customers in an amount that reflects the consideration to which the entity expects to be entitled in exchange for those goods or services. To achieve this core principle, the guidance provides that an entity should apply the following steps: (1) identify the contract(s) with a customer; (2) identify the performance obligations in the contract; (3) determine the transaction price; (4) allocate the transaction price to the performance obligations in the contract; and (5) recognize revenue when, or as, the entity satisfies a performance obligation. The ASU is effective beginning in the first quarter of our fiscal year 2017. Early adoption is not permitted. The Company is currently evaluating the impact to the consolidated financial statements.
(3) Significant Transactions and Events
Sun Merger
Effective December 1, 2012, the Company completed the acquisition of Sun Healthcare Group, Inc. and its subsidiaries (Sun) (the Sun Merger). Upon consummation of the Sun Merger, each issued and outstanding share of Sun common stock and common stock equivalent was tendered for $8.50 in cash. The purchase price totaled $228.4 million before considering cash acquired in connection with the Sun Merger. The Company also assumed $88.8 million of long-term debt in the Sun Merger, of which $87.5 million was refinanced on December 3, 2012. The operating results of Sun have been included in the accompanying consolidated financial statements of the Company since December 1, 2012.
Simultaneous with the Sun Merger, Sun’s hospice segment was sold to Life Choice Hospice, a provider of in-home hospice care, for approximately $85 million. Net cash sale proceeds of $75 million were used to repay the Term Loan Facility. The Company retained an approximate one-third interest in the sold hospice segment since it owned an approximate one-third interest in Life Choice Hospice’s parent company. Life Choice Hospice has since been merged into FC PAC Holdings, LLC. See note 15 — “Related Party Transactions.”
FC-GEN Operations Investment, LLC and Subsidiaries
Notes to Consolidated Financial Statements
Pro Forma Information
The acquired business contributed net revenues of $145.2 million and a net income of $0.7 million to the Company for the period from December 1, 2012 to December 31, 2012. The unaudited pro forma net effect of the Sun Merger assuming the acquisition occurred as of January 1, 2012 is as follows (in thousands, except per share amounts):
|
|
|
Pro Forma |
| |
|
|
|
Twelve months ended |
| |
|
|
|
December 31, 2012 |
| |
|
Revenues |
|
$ |
4,700,479 |
|
|
Loss attributable to FC-GEN Operations Investment, LLC |
|
(214,640 |
) | |
|
|
|
|
| |
|
Loss per share from continuing operations attributable FC-GEN Operations Investment, LLC: |
|
|
| |
|
Basic |
|
(4.30 |
) | |
|
Diluted |
|
(4.30 |
) | |
The unaudited pro forma financial data have been derived by combining the historical financial results of the Company and the operations acquired in the Sun Merger for the periods presented.
(4) Certain Significant Risks and Uncertainties
Revenue Sources
The Company receives revenues from Medicare, Medicaid, private insurance, self-pay residents, other third-party payors and long-term care facilities that utilize its rehabilitation therapy and other services. The Company’s inpatient services derives approximately 79% of its revenue from the Medicare and various state Medicaid programs.
The sources and amounts of the Company’s revenues are determined by a number of factors, including licensed bed capacity and occupancy rates of its inpatient facilities, the mix of patients and the rates of reimbursement among payors. Likewise, payment for ancillary medical services, including services provided by the Company’s rehabilitation therapy services business, vary based upon the type of payor and payment methodologies. Changes in the case mix of the patients as well as payor mix among Medicare, Medicaid and private pay can significantly affect the Company’s profitability.
It is not possible to quantify fully the effect of legislative changes, the interpretation or administration of such legislation or other governmental initiatives on the Company’s business and the business of the customers served by the Company’s rehabilitation therapy business. The potential impact of healthcare reform, which would initiate significant reforms to the United States healthcare system, including potential material changes to the delivery of healthcare services and the reimbursement paid for such services by the government or other third party payors, is uncertain at this time. Accordingly, there can be no assurance that the impact of any future healthcare legislation or regulation will not adversely affect the Company’s business. There can be no assurance that payments under governmental and private third-party payor programs will be timely, will remain at levels similar to present levels or will, in the future, be sufficient to cover the costs allocable to patients eligible for reimbursement pursuant to such programs. The Company’s financial condition and results of operations will be affected by the reimbursement process, which in the healthcare industry is complex and can involve lengthy delays between the time that revenue is recognized and the time that reimbursement amounts are settled.
Laws and regulations governing the Medicare and Medicaid programs are complex and subject to interpretation. The Company believes that it is in material compliance with all applicable laws and regulations and is not aware of any pending or threatened investigations involving material allegations of potential wrongdoing. While no such regulatory inquiries have been made, noncompliance with such laws and regulations can be subject to regulatory actions including fines, penalties, and exclusion from the Medicare and Medicaid programs.
FC-GEN Operations Investment, LLC and Subsidiaries
Notes to Consolidated Financial Statements
(5) Loss Per Share
The Company has a single class of common stock. Basic net loss per share was computed by dividing net loss by the weighted-average number of outstanding common shares for the period. Diluted earnings per share is computed by dividing loss plus the effect of assumed conversions (if applicable) by the weighted-average number of outstanding shares after giving effect to all potential dilutive common stock, including options, warrants, common stock subject to repurchase and convertible preferred stock, if any.
The computations of basic and diluted loss per share are consistent with any potentially dilutive adjustments to the numerator or denominator being anti-dilutive and therefore excluded from the dilutive calculation. A reconciliation of the numerator and denominator used in the calculation of basic and diluted net income per common share follows (in thousands, except per share data):
|
|
|
Year ended December 31, |
| |||||||
|
|
|
2014 |
|
2013 |
|
2012 |
| |||
|
|
|
|
|
|
|
|
| |||
|
Numerator: |
|
|
|
|
|
|
| |||
|
Loss from continuing operations |
|
$ |
(237,485 |
) |
$ |
(169,606 |
) |
$ |
(170,912 |
) |
|
Less: Net income (loss) attributable to noncontrolling interests |
|
2,456 |
|
1,025 |
|
(448 |
) | |||
|
Loss from continuing operations attributable to FC-GEN Operations Investment, LLC |
|
(239,941 |
) |
(170,631 |
) |
(170,464 |
) | |||
|
Loss from discontinued operations, net of income tax |
|
(14,044 |
) |
(7,364 |
) |
(810 |
) | |||
|
Net loss attributable to FC-GEN Operations Investment, LLC |
|
$ |
(253,985 |
) |
$ |
(177,995 |
) |
$ |
(171,274 |
) |
|
|
|
|
|
|
|
|
| |||
|
Denominator: |
|
|
|
|
|
|
| |||
|
Weighted average shares outstanding for basic and diluted net loss per share |
|
49,865 |
|
49,865 |
|
49,865 |
| |||
|
|
|
|
|
|
|
|
| |||
|
Basic and diluted net loss per common share: |
|
|
|
|
|
|
| |||
|
Loss from continuing operations attributable to FC-GEN Operations Investment, LLC |
|
$ |
(4.81 |
) |
$ |
(3.42 |
) |
$ |
(3.41 |
) |
|
Loss from discontinued operations, net of income tax |
|
(0.28 |
) |
(0.15 |
) |
(0.02 |
) | |||
|
Net loss attributable to FC-GEN Operations Investment, LLC |
|
$ |
(5.09 |
) |
$ |
(3.57 |
) |
$ |
(3.43 |
) |
(6) Segment Information
The Company has three reportable operating segments: (i) inpatient services; (ii) rehabilitation therapy services; and (iii) other services. For additional information on these reportable segments see note 1 — “General Information — Description of Business.”
FC-GEN Operations Investment, LLC and Subsidiaries
Notes to Consolidated Financial Statements
A summary of the Company’s segmented revenues follows:
|
|
|
Years Ended December 31, |
| |||||||||||||
|
|
|
2014 |
|
2013 |
|
2012 |
| |||||||||
|
|
|
Revenue |
|
Revenue |
|
Revenue |
|
Revenue |
|
Revenue |
|
Revenue |
| |||
|
|
|
(in thousands, except percentages) |
| |||||||||||||
|
|
|
|
| |||||||||||||
|
Revenues: |
|
|
|
|
|
|
|
|
|
|
|
|
| |||
|
|
|
|
|
|
|
|
|
|
|
|
|
|
| |||
|
Inpatient services: |
|
|
|
|
|
|
|
|
|
|
|
|
| |||
|
Skilled nursing facilities |
|
$ |
3,924,571 |
|
82.3 |
% |
$ |
3,847,857 |
|
81.7 |
% |
$ |
2,467,427 |
|
80.2 |
% |
|
Assisted living facilities |
|
107,034 |
|
2.2 |
% |
113,960 |
|
2.4 |
% |
77,335 |
|
2.5 |
% | |||
|
Administration of third party facilities |
|
10,297 |
|
0.2 |
% |
11,006 |
|
0.2 |
% |
10,743 |
|
0.3 |
% | |||
|
Elimination of administrative services |
|
(2,089 |
) |
0.0 |
% |
(2,146 |
) |
0.0 |
% |
(1,896 |
) |
-0.1 |
% | |||
|
Inpatient services, net |
|
4,039,813 |
|
84.7 |
% |
3,970,677 |
|
84.3 |
% |
2,553,609 |
|
83.0 |
% | |||
|
|
|
|
|
|
|
|
|
|
|
|
|
|
| |||
|
Rehabilitation therapy services: |
|
|
|
|
|
|
|
|
|
|
|
|
| |||
|
Total therapy services |
|
990,081 |
|
20.8 |
% |
993,459 |
|
21.1 |
% |
732,805 |
|
23.8 |
% | |||
|
Elimination intersegment rehabilitation therapy services |
|
(385,721 |
) |
-8.1 |
% |
(375,175 |
) |
-8.0 |
% |
(248,918 |
) |
-8.1 |
% | |||
|
Third party rehabilitation therapy services |
|
604,360 |
|
12.7 |
% |
618,284 |
|
13.1 |
% |
483,887 |
|
15.7 |
% | |||
|
|
|
|
|
|
|
|
|
|
|
|
|
|
| |||
|
Other services: |
|
|
|
|
|
|
|
|
|
|
|
|
| |||
|
Total other services |
|
154,011 |
|
3.2 |
% |
141,712 |
|
3.0 |
% |
53,713 |
|
1.7 |
% | |||
|
Elimination intersegment other services |
|
(30,104 |
) |
-0.6 |
% |
(20,332 |
) |
-0.4 |
% |
(14,911 |
) |
-0.5 |
% | |||
|
Third party other services |
|
123,907 |
|
2.6 |
% |
121,380 |
|
2.6 |
% |
38,802 |
|
1.3 |
% | |||
|
Total revenue |
|
$ |
4,768,080 |
|
100.0 |
% |
$ |
4,710,341 |
|
100.0 |
% |
$ |
3,076,298 |
|
100.0 |
% |
A summary of the Company’s condensed consolidated statement of operations follows:
|
|
|
Year ended December 31, 2014 |
| ||||||||||||||||
|
|
|
Inpatient |
|
Rehabilitation |
|
Other Services |
|
Corporate |
|
Eliminations |
|
Consolidated |
| ||||||
|
|
|
(In thousands) |
| ||||||||||||||||
|
|
|
|
|
|
|
|
|
|
|
|
|
|
| ||||||
|
Net revenues |
|
$ |
4,041,902 |
|
$ |
990,081 |
|
$ |
153,397 |
|
$ |
614 |
|
$ |
(417,914 |
) |
$ |
4,768,080 |
|
|
|
|
|
|
|
|
|
|
|
|
|
|
|
| ||||||
|
Salaries, wages and benefits |
|
1,987,550 |
|
817,144 |
|
99,400 |
|
102,820 |
|
— |
|
3,006,914 |
| ||||||
|
Other operating expenses |
|
1,472,321 |
|
78,532 |
|
54,464 |
|
44,210 |
|
(417,915 |
) |
1,231,612 |
| ||||||
|
Lease expense |
|
130,005 |
|
176 |
|
821 |
|
896 |
|
— |
|
131,898 |
| ||||||
|
Depreciation and amortization expense |
|
165,105 |
|
11,055 |
|
917 |
|
16,598 |
|
— |
|
193,675 |
| ||||||
|
Interest expense |
|
393,521 |
|
4 |
|
19 |
|
49,678 |
|
(498 |
) |
442,724 |
| ||||||
|
Loss on extinguishment of debt |
|
— |
|
— |
|
— |
|
1,133 |
|
— |
|
1,133 |
| ||||||
|
Investment income |
|
(2,492 |
) |
— |
|
— |
|
(1,405 |
) |
498 |
|
(3,399 |
) | ||||||
|
Other income |
|
(47 |
) |
— |
|
(91 |
) |
— |
|
— |
|
(138 |
) | ||||||
|
Transaction costs |
|
— |
|
— |
|
— |
|
13,353 |
|
— |
|
13,353 |
| ||||||
|
Long-lived asset impairment |
|
31,399 |
|
— |
|
— |
|
— |
|
— |
|
31,399 |
| ||||||
|
Equity in net (income) loss of unconsolidated affiliates |
|
(1,284 |
) |
— |
|
— |
|
— |
|
1,700 |
|
416 |
| ||||||
|
(Loss) income before income tax benefit |
|
(134,176 |
) |
83,170 |
|
(2,133 |
) |
(226,669 |
) |
(1,699 |
) |
(281,507 |
) | ||||||
|
Income tax benefit |
|
— |
|
— |
|
— |
|
(44,022 |
) |
— |
|
(44,022 |
) | ||||||
|
(Loss) income from continuing operations |
|
$ |
(134,176 |
) |
$ |
83,170 |
|
$ |
(2,133 |
) |
$ |
(182,647 |
) |
$ |
(1,699 |
) |
$ |
(237,485 |
) |
FC-GEN Operations Investment, LLC and Subsidiaries
Notes to Consolidated Financial Statements
|
|
|
Year ended December 31, 2013 |
| ||||||||||||||||
|
|
|
Inpatient |
|
Rehabilitation |
|
Other Services |
|
Corporate |
|
Eliminations |
|
Consolidated |
| ||||||
|
|
|
(In thousands) |
| ||||||||||||||||
|
|
|
|
|
|
|
|
|
|
|
|
|
|
| ||||||
|
Net revenues |
|
$ |
3,972,823 |
|
$ |
993,459 |
|
$ |
141,712 |
|
$ |
— |
|
$ |
(397,653 |
) |
$ |
4,710,341 |
|
|
|
|
|
|
|
|
|
|
|
|
|
|
|
| ||||||
|
Salaries, wages and benefits |
|
1,977,111 |
|
828,406 |
|
93,342 |
|
99,799 |
|
— |
|
2,998,658 |
| ||||||
|
Other operating expenses |
|
1,344,983 |
|
87,263 |
|
43,256 |
|
52,756 |
|
(397,653 |
) |
1,130,605 |
| ||||||
|
Lease expense |
|
129,296 |
|
198 |
|
843 |
|
894 |
|
— |
|
131,231 |
| ||||||
|
Depreciation and amortization expense |
|
160,954 |
|
10,607 |
|
1,027 |
|
16,138 |
|
— |
|
188,726 |
| ||||||
|
Interest expense |
|
378,461 |
|
10 |
|
525 |
|
48,515 |
|
(536 |
) |
426,975 |
| ||||||
|
Loss on extinguishment of debt |
|
63 |
|
— |
|
— |
|
— |
|
— |
|
63 |
| ||||||
|
Investment income |
|
(3,431 |
) |
— |
|
— |
|
(1,255 |
) |
536 |
|
(4,150 |
) | ||||||
|
Other loss |
|
— |
|
346 |
|
— |
|
104 |
|
— |
|
450 |
| ||||||
|
Transaction costs |
|
— |
|
— |
|
— |
|
5,878 |
|
— |
|
5,878 |
| ||||||
|
Long-lived asset impairment |
|
9,999 |
|
— |
|
— |
|
— |
|
— |
|
9,999 |
| ||||||
|
Equity in net (income) loss of unconsolidated affiliates |
|
(2,067 |
) |
— |
|
— |
|
1,066 |
|
1,692 |
|
691 |
| ||||||
|
(Loss) income before income tax benefit |
|
(22,546 |
) |
66,629 |
|
2,719 |
|
(223,895 |
) |
(1,692 |
) |
(178,785 |
) | ||||||
|
Income tax benefit |
|
— |
|
— |
|
— |
|
(9,179 |
) |
— |
|
(9,179 |
) | ||||||
|
(Loss) income from continuing operations |
|
$ |
(22,546 |
) |
$ |
66,629 |
|
$ |
2,719 |
|
$ |
(214,716 |
) |
$ |
(1,692 |
) |
$ |
(169,606 |
) |
|
|
|
Year ended December 31, 2012 |
| ||||||||||||||||
|
|
|
Inpatient |
|
Rehabilitation |
|
Other Services |
|
Corporate |
|
Eliminations |
|
Consolidated |
| ||||||
|
|
|
(In thousands) |
| ||||||||||||||||
|
|
|
|
|
|
|
|
|
|
|
|
|
|
| ||||||
|
Net revenues |
|
$ |
2,555,505 |
|
$ |
732,805 |
|
$ |
53,713 |
|
$ |
— |
|
$ |
(265,725 |
) |
$ |
3,076,298 |
|
|
|
|
|
|
|
|
|
|
|
|
|
|
|
| ||||||
|
Salaries, wages and benefits |
|
1,316,333 |
|
600,293 |
|
29,759 |
|
70,174 |
|
— |
|
2,016,559 |
| ||||||
|
Other operating expenses |
|
817,205 |
|
103,159 |
|
21,595 |
|
37,823 |
|
(265,725 |
) |
714,057 |
| ||||||
|
Lease expense |
|
34,971 |
|
261 |
|
23 |
|
112 |
|
— |
|
35,367 |
| ||||||
|
Depreciation and amortization expense |
|
124,782 |
|
6,869 |
|
86 |
|
14,650 |
|
— |
|
146,387 |
| ||||||
|
Interest expense |
|
307,262 |
|
— |
|
12 |
|
16,370 |
|
(3 |
) |
323,641 |
| ||||||
|
Gain on extinguishment of debt |
|
(1,777 |
) |
— |
|
— |
|
— |
|
— |
|
(1,777 |
) | ||||||
|
Investment income |
|
(2,956 |
) |
— |
|
— |
|
(829 |
) |
3 |
|
(3,782 |
) | ||||||
|
Other income |
|
— |
|
— |
|
— |
|
(849 |
) |
— |
|
(849 |
) | ||||||
|
Transaction costs |
|
— |
|
— |
|
— |
|
29,755 |
|
— |
|
29,755 |
| ||||||
|
Equity in net (income) loss of unconsolidated affiliates |
|
(1,527 |
) |
— |
|
— |
|
(339 |
) |
1,351 |
|
(515 |
) | ||||||
|
(Loss) income before income tax benefit |
|
(38,788 |
) |
22,223 |
|
2,238 |
|
(166,867 |
) |
(1,351 |
) |
(182,545 |
) | ||||||
|
Income tax benefit |
|
— |
|
— |
|
— |
|
(11,633 |
) |
— |
|
(11,633 |
) | ||||||
|
(Loss) income from continuing operations |
|
$ |
(38,788 |
) |
$ |
22,223 |
|
$ |
2,238 |
|
$ |
(155,234 |
) |
$ |
(1,351 |
) |
$ |
(170,912 |
) |
The following table presents the segment assets as of December 31, 2014 compared to December 31, 2013 (in thousands):
|
|
|
December 31, 2014 |
|
December 31, 2013 |
| ||
|
Inpatient services |
|
$ |
4,381,044 |
|
$ |
4,213,835 |
|
|
Rehabilitation services |
|
322,268 |
|
372,241 |
| ||
|
Other services |
|
44,814 |
|
48,634 |
| ||
|
Corporate and eliminations |
|
393,282 |
|
502,295 |
| ||
|
Total assets |
|
$ |
5,141,408 |
|
$ |
5,137,005 |
|
FC-GEN Operations Investment, LLC and Subsidiaries
Notes to Consolidated Financial Statements
The following table presents the segment goodwill as of December 31, 2014 compared to December 31, 2013 (in thousands):
|
|
|
December 31, 2014 |
|
December 31, 2013 |
| ||
|
|
|
|
|
|
| ||
|
Inpatient services |
|
$ |
132,756 |
|
$ |
132,756 |
|
|
Rehabilitation services |
|
25,097 |
|
25,097 |
| ||
|
Other services |
|
11,828 |
|
11,828 |
| ||
|
Total goodwill |
|
$ |
169,681 |
|
$ |
169,681 |
|
(7) Restricted Cash and Investments in Marketable Securities
The current portion of restricted cash and investments in marketable securities principally represents an estimate of the level of outstanding self-insured losses the Company expects to pay in the succeeding year through its wholly owned captive insurance company. See note 17 — “Commitments and Contingencies — Loss Reserves For Certain Self-Insured Programs.”
Restricted cash and equivalents and investments in marketable securities at December 31, 2014 consist of the following (in thousands):
|
|
|
|
|
|
|
Unrealized losses |
|
|
| |||||||
|
|
|
Amortized |
|
Unrealized |
|
Less than |
|
Greater |
|
Fair value |
| |||||
|
|
|
|
|
|
|
|
|
|
|
|
| |||||
|
Restricted cash and equivalents: |
|
|
|
|
|
|
|
|
|
|
| |||||
|
Cash |
|
$ |
35,791 |
|
$ |
— |
|
$ |
— |
|
$ |
— |
|
$ |
35,791 |
|
|
Money market funds |
|
599 |
|
— |
|
— |
|
— |
|
599 |
| |||||
|
|
|
|
|
|
|
|
|
|
|
|
| |||||
|
Restricted investments in marketable securities: |
|
|
|
|
|
|
|
|
|
|
| |||||
|
Mortgage/government backed securities |
|
8,499 |
|
— |
|
(27 |
) |
— |
|
8,472 |
| |||||
|
Corporate bonds |
|
38,704 |
|
238 |
|
(4 |
) |
(60 |
) |
38,878 |
| |||||
|
Government bonds |
|
62,246 |
|
997 |
|
(19 |
) |
(224 |
) |
63,000 |
| |||||
|
|
|
$ |
145,839 |
|
$ |
1,235 |
|
$ |
(50 |
) |
$ |
(284 |
) |
146,740 |
| |
|
Less: Current portion of restricted investments |
|
|
|
|
|
|
|
|
|
(38,211 |
) | |||||
|
Long-term restricted investments |
|
|
|
|
|
|
|
|
|
$ |
108,529 |
| ||||
FC-GEN Operations Investment, LLC and Subsidiaries
Notes to Consolidated Financial Statements
Restricted cash and equivalents and investments in marketable securities at December 31, 2013 consist of the following (in thousands):
|
|
|
|
|
|
|
Unrealized losses |
|
|
| |||||||
|
|
|
Amortized |
|
Unrealized |
|
Less than |
|
Greater |
|
Fair value |
| |||||
|
|
|
|
|
|
|
|
|
|
|
|
| |||||
|
Restricted cash and equivalents: |
|
|
|
|
|
|
|
|
|
|
| |||||
|
Cash |
|
$ |
11,386 |
|
$ |
— |
|
$ |
— |
|
$ |
— |
|
$ |
11,386 |
|
|
Money market funds |
|
1,072 |
|
— |
|
— |
|
— |
|
1,072 |
| |||||
|
|
|
|
|
|
|
|
|
|
|
|
| |||||
|
Restricted investments in marketable securities: |
|
|
|
|
|
|
|
|
|
|
| |||||
|
Mortgage/government backed securities |
|
5,500 |
|
58 |
|
— |
|
— |
|
5,558 |
| |||||
|
Corporate bonds |
|
39,856 |
|
454 |
|
(160 |
) |
— |
|
40,150 |
| |||||
|
Government bonds |
|
63,360 |
|
2,056 |
|
(587 |
) |
— |
|
64,829 |
| |||||
|
|
|
$ |
121,174 |
|
$ |
2,568 |
|
$ |
(747 |
) |
$ |
— |
|
122,995 |
| |
|
Less: Current portion of restricted investments |
|
|
|
|
|
|
|
|
|
(72,930 |
) | |||||
|
Long-term restricted investments |
|
|
|
|
|
|
|
|
|
$ |
50,065 |
| ||||
Maturities of restricted investments yielded proceeds of $22.9 million, $23.5 million and $10.3 million for the years ended December 31, 2014, 2013 and 2012, respectively.
Sales of investments yielded proceeds of $7.3 million, $2.7 million and $26.5 million for the years ended December 31, 2014, 2013 and 2012, respectively. Associated gross realized gain and (loss) for the year ended December 31, 2014 were $0.8 million and $(0.3) million, respectively. Associated gross realized gain and (loss) for the year ended December 31, 2013 were $1.7 million and $(0.4) million, respectively. Associated gross realized gain and (loss) for the year ended December 31, 2012 were $1.1 million and $(0.1) million, respectively.
The majority of the Company’s investments are investment grade government and corporate debt securities that have maturities of five years or less, and the Company has both the ability and intent to hold the investments until maturity.
Restricted investments in marketable securities held at December 31, 2014 mature as follows (in thousands):
|
|
|
Amortized |
|
Fair |
| ||
|
Due in one year or less |
|
$ |
24,389 |
|
$ |
24,526 |
|
|
Due after 1 year through 5 years |
|
81,847 |
|
82,806 |
| ||
|
Due after 5 years through 10 years |
|
3,213 |
|
3,018 |
| ||
|
|
|
$ |
109,449 |
|
$ |
110,350 |
|
Actual maturities may differ from stated maturities because borrowers may have the right to call or prepay certain obligations and may exercise that right with or without prepayment penalties.
The Company has issued letters of credit totaling $94.3 million at December 31, 2014 to its third party administrators and the Company’s excess insurance carriers. Restricted cash of $10.2 million and restricted investments with an amortized cost of $108.5 million and a market value of $109.4 million are pledged as security for these letters of credit as of December 31, 2014.
FC-GEN Operations Investment, LLC and Subsidiaries
Notes to Consolidated Financial Statements
(8) Property and Equipment
Property and equipment at December 31, 2014 and 2013 consist of the following (in thousands):
|
|
|
2014 |
|
2013 |
| ||
|
|
|
|
|
|
| ||
|
Land, buildings and improvements |
|
$ |
225,536 |
|
$ |
232,299 |
|
|
Capital lease land, buildings and improvements |
|
910,820 |
|
896,686 |
| ||
|
Financing obligation land, buildings and improvements |
|
2,526,792 |
|
2,440,678 |
| ||
|
Equipment, furniture and fixtures |
|
276,983 |
|
242,047 |
| ||
|
Construction in progress |
|
55,295 |
|
64,730 |
| ||
|
Gross property and equipment |
|
3,995,426 |
|
3,876,440 |
| ||
|
Less: accumulated depreciation |
|
(502,176 |
) |
(325,490 |
) | ||
|
Net property and equipment |
|
$ |
3,493,250 |
|
$ |
3,550,950 |
|
Construction in progress includes significant renovation projects at various locations. The Company undergoes such projects to enhance the value of the properties and improve earning potential of those operations. In addition, the Company is constructing three new skilled nursing facilities. A fourth newly constructed center was placed into service in the fourth quarter of 2014.
Asset impairment charges of $28.4 million were recognized on property and equipment in the year ended December 31, 2014 associated with the write-down of underperforming properties. Asset impairment charges of $10.0 million were recognized on property and equipment in the year ended December 31, 2013 associated with the write-down of underperforming properties. There were no asset impairment charges recognized in the year ended December 31, 2012. See note 19 — “Asset Impairment Charges - Long-Lived Assets with a Definite Useful Life.”
(9) Other Long-Term Assets
Other long-term assets at December 31, 2014 and 2013 consist of the following (in thousands):
|
|
|
2014 |
|
2013 |
| ||
|
|
|
|
|
|
| ||
|
Insurance claims recoverable |
|
$ |
67,973 |
|
$ |
50,781 |
|
|
Deferred financing fees, net |
|
21,153 |
|
19,264 |
| ||
|
Deposits and funds held in escrow |
|
21,247 |
|
21,052 |
| ||
|
Investments in unconsolidated affiliates |
|
24,505 |
|
22,612 |
| ||
|
Cost report receivables |
|
3,621 |
|
4,830 |
| ||
|
Notes receivable |
|
1,608 |
|
609 |
| ||
|
Other |
|
12 |
|
318 |
| ||
|
Other long-term assets |
|
$ |
140,119 |
|
$ |
119,466 |
|
Deferred financing fees are recorded net of accumulated amortization of $12.5 million and $12.9 million at December 31, 2014 and 2013, respectively.
FC-GEN Operations Investment, LLC and Subsidiaries
Notes to Consolidated Financial Statements
(10) Goodwill and Identifiable Intangible Assets
The changes in the carrying value of goodwill are as follows (in thousands):
|
|
|
Total |
| |
|
Balance at December 31, 2012 |
|
$ |
134,676 |
|
|
|
|
|
| |
|
Goodwill additions associated with Sun Merger |
|
35,005 |
| |
|
|
|
|
| |
|
Balance at December 31, 2013 |
|
$ |
169,681 |
|
|
|
|
|
| |
|
Balance at December 31, 2014 |
|
$ |
169,681 |
|
The Company has no accumulated amortization of goodwill.
Goodwill is an asset representing the future economic benefits arising from other assets acquired in a business combination that are not individually identified and separately recognized.
Identifiable intangible assets consist of the following at December 31, 2014 and 2013 (in thousands):
|
|
|
2014 |
|
Weighted |
| |
|
|
|
|
|
|
| |
|
Customer relationship assets, net of accumulated amortization of $24,039 |
|
$ |
74,765 |
|
10 |
|
|
Favorable leases, net of accumulated amortization of $18,622 |
|
47,791 |
|
9 |
| |
|
Trade names |
|
50,556 |
|
Indefinite |
| |
|
Identifiable intangible assets |
|
$ |
173,112 |
|
10 |
|
|
|
|
2013 |
|
Weighted |
| |
|
|
|
|
|
|
| |
|
Customer relationship assets, net of accumulated amortization of $14,970 |
|
$ |
83,834 |
|
11 |
|
|
Favorable leases, net of accumulated amortization of $12,999 |
|
60,123 |
|
10 |
| |
|
Trade names |
|
50,556 |
|
Indefinite |
| |
|
Identifiable intangible assets |
|
$ |
194,513 |
|
11 |
|
Acquisition-related identified intangible assets consist of customer relationship assets, favorable lease contracts and trade names.
· Customer relationship assets exist in the Company’s rehabilitation services, respiratory services, management services and medical staffing businesses. These assets are amortized on a straight-line basis over the expected period of benefit.
· Favorable lease contracts represent the estimated value of future cash outflows of operating lease contracts compared to lease rates that could be negotiated in an arms-length transaction at the time of measurement. Favorable lease contracts are amortized on a straight-line basis over the lease terms.
· The Company’s trade names have value, in particular in the rehabilitation business which markets its services to other providers of skilled nursing and assisted living services. The trade name asset has an
FC-GEN Operations Investment, LLC and Subsidiaries
Notes to Consolidated Financial Statements
indefinite life and is measured no less than annually or if indicators of potential impairment become apparent.
Amortization expense from continuing operations related to customer relationship assets, which is included in depreciation and amortization expense, for the years ended December 31, 2014, 2013 and 2012 was $9.1 million, $9.1 million and $5.9 million, respectively.
Amortization expense from continuing operations related to favorable leases, which is included in lease expense, for the years ended December 31, 2014, 2013 and 2012 was $9.3 million, $9.7 million and $4.1 million, respectively.
Based upon amounts recorded at December 31, 2014, total estimated amortization expense of identifiable intangible assets will be $15.9 million in 2015, $15.8 million in 2016, $15.6 million in 2017, $15.1 million in 2018, and $14.8 million in 2019 and $95.9 million, thereafter.
Asset impairment charges of $3.0 million were recognized on favorable lease assets in the year ended December 31, 2014 associated with the write-down of underperforming properties. No asset impairment charges were recognized in the years ended December 31, 2013 and 2012. See note 19 — “Asset Impairment Charges - Long-Lived Assets with a Definite Useful Life.”
(11) Long-Term Debt
Long-term debt at December 31, 2014 and 2013 consists of the following (in thousands):
|
|
|
2014 |
|
2013 |
| ||
|
Revolving credit facility |
|
$ |
254,500 |
|
$ |
200,000 |
|
|
Term loan facility, net of original issue discount of $11,375 in 2014 and $15,275 in 2013 |
|
219,297 |
|
220,142 |
| ||
|
Mortgages and other secured debt (recourse) |
|
14,488 |
|
14,468 |
| ||
|
Mortgages and other secured debt (non recourse) |
|
49,961 |
|
54,823 |
| ||
|
|
|
538,246 |
|
489,433 |
| ||
|
Less: |
|
|
|
|
| ||
|
Current installments of long-term debt |
|
(12,518 |
) |
(16,268 |
) | ||
|
Long-term debt |
|
$ |
525,728 |
|
$ |
473,165 |
|
On December 1, 2012 in connection with the Sun Merger, the Company entered into two amended senior secured asset-based revolving credit facilities which, at the time, had aggregate borrowing capacity of $375 million (the Revolving Credit Facilities) and a $325 million senior secured term loan facility (the Term Loan Facility) (collectively, the Credit Facilities). The Company used proceeds from the Credit Facilities to pay the Merger Consideration, repay all amounts outstanding under Sun’s previous credit facilities and to pay transaction costs. The amounts outstanding of $87.5 million under Sun’s former credit facilities was repaid with proceeds from the Credit Facilities. In connection with the Credit Facilities, the Company paid $19.6 million of lender fees related to the debt issuance that were capitalized as deferred financing costs.
On February 2, 2015 in connection with the Combination, the Company amended the Revolving Credit Facilitites. See note 21 — “Subsequent Events.”
Credit Facilities
The Credit Facilities, contain a number of restrictive covenants that, among other things, impose operating and financial restrictions on the Company and its subsidiaries. The Credit Facilities also require the Company to meet defined financial covenants, including a minimum level of consolidated liquidity, a maximum consolidated net leverage ratio and a minimum consolidated fixed charge coverage ratio, all as defined. The Credit Facilities also contain other
FC-GEN Operations Investment, LLC and Subsidiaries
Notes to Consolidated Financial Statements
customary covenants and events of default. At December 31, 2014, the Company is in compliance with its covenants. On January 21, 2014, the Company amended the Credit Facilities redefining certain restrictive covenants in exchange for fees of $4.3 million.
In 2013, pursuant to the Credit Facilities, the Company entered into an interest rate cap agreement for a notional amount of $250 million limiting the Company’s exposure to LIBOR interest rate fluctuations at 1.5%. The interest rate cap agreement expired on December 31, 2014.
Revolving Credit Facilities
The Revolving Credit Facilities had a combined maximum borrowing capacity of $375 million in 2012 and five-year terms. The larger of the two facilities is a $368 million facility and the smaller is a $7 million facility. The $7 million facility was established by certain wholly owned subsidiaries of the Company through which the Company leases real estate. This separate revolving credit facility was required when the owner of the real estate refinanced the outstanding debt, which is secured through the U.S. Department of Housing and Urban Development.
The Revolving Credit Facilities were amended in 2013 increasing the maximum borrowing capacity to $425 million. The larger of the two facilities is a $415 million facility and the smaller is a $10 million facility.
The Revolving Credit Facilities were established to provide the Company a source of financing to fund general working capital requirements. The Revolving Credit Facilities are secured by a first priority lien on eligible accounts receivable, cash, deposit accounts and certain other assets and property (the Revolving Credit Facility First Priority Collateral). The Revolving Credit Facilities have a second priority lien on the membership interests in the Company and substantially all of the Company’s assets.
Borrowings under the Revolving Credit Facilities may be in the form of revolving loans or swing line loans. Aggregate outstanding swing line loans have a sub-limit of $20 million. The Revolving Credit Facilities also provide a sub-limit of $125 million for letters of credit. Borrowing levels under the Revolving Credit Facilities are limited to a borrowing base that is computed based upon the level of Company eligible accounts receivable, as defined. In addition to paying interest on the outstanding principal borrowed under the revolving credit facilities, the Company is required to pay a commitment fee to the lenders for any unutilized commitments. The commitment fee rate is 0.375% per annum when the unused commitment is greater than $200 million and 0.50% per annum when the unused commitment is less than $200 million.
As of December 31, 2014, the Company had outstanding borrowings under the Revolving Credit Facilities of $254.5 million and had $101.1 million of drawn letters of credit securing insurance and lease obligations, leaving the Company with approximately $37.6 million of available borrowing capacity under the revolving credit facilities.
Borrowings under the revolving credit facility, as amended, bear interest at a rate equal to, at the Company’s option, either a base rate plus an applicable margin or at LIBOR plus an applicable margin. The base rate is determined by reference to the highest of (i) a lender-defined prime rate, (ii) the federal funds rate plus 3.0%, and (iii) the sum of LIBOR plus an applicable margin. The applicable margin with respect to base rate borrowings is 3.0% at December 31, 2014. The applicable margin with respect to LIBOR borrowings is 3.3% at December 31, 2014. Base rate borrowings under the revolving credit facility bore interest of approximately 6.3% at December 31, 2014. One-month LIBOR borrowings under the revolving credit facility bore interest of approximately 3.4% at December 31, 2014.
Term Loan Facility
The Term Loan Facility has a five-year term and is secured by a first priority lien on the membership interests in the Company, substantially all of the Company’s assets other than the Revolving Credit Facility First Priority Collateral and a second priority lien on the Revolving Credit Facility First Priority Collateral. The Term Loan Facility proceeds totaled $305.5 million, net of a $19.5 million original issue discount that will be amortized over the term of the Term Loan Facility.
FC-GEN Operations Investment, LLC and Subsidiaries
Notes to Consolidated Financial Statements
The term loan amortizes at a rate of $12.5 million per year. Beginning in 2014, the lenders have the right to elect ratable principal payments or defer principal recoupment until the end of the term. Principal payments for the year ended December 31, 2014 were $4.7 million.
Borrowings under the Term Loan Facility bear interest at a rate per annum equal to the applicable margin plus, at the Company’s option, either (1) LIBOR determined by reference to the costs of funds for Eurodollar deposits for the interest period relevant to such borrowings, or (2) a base rate determined by reference to the highest of (a) the lender defined prime rate, (b) the federal funds rate effective plus one half of one percent and (c) LIBOR described in sub clause (1) plus 1.0%. LIBOR based loans are subject to an interest rate floor of 1.5% and base rate loans are subject to a floor of 2.5%. Base rate borrowings under the Term Loan Facility bore interest of approximately 10.8% at December 31, 2014. One-month LIBOR borrowings under the Term Loan Facility bore interest of approximately 10.0% at December 31, 2014.
Other Debt
Mortgages and other secured debt (recourse). The Company carries two mortgage loans on two of its corporate office buildings. The loans are secured by the underlying real property and have fixed or variable rates of interest ranging from 1.9% to 4.3% at December 31, 2014, with maturity dates ranging from 2018 to 2019. The Company is a named co-borrower on a loan with a fixed interest rate of 5.5% with an anticipated settlement in 2015. The loan is offset with a receivable recorded on the consolidated balance sheet in prepaid expenses and other current assets.
Mortgages and other secured debt (non-recourse). Loans are carried by certain of the Company’s consolidated joint ventures. The loans consist principally of revenue bonds and secured bank loans. Loans are secured by the underlying real and personal property of individual facilities and have fixed or variable rates of interest ranging from 2.5% to 21.9% at December 31, 2014, with maturity dates ranging from 2018 to 2036. Loans are labeled “non-recourse” because neither the Company nor a wholly owned subsidiary is obligated to perform under the respective loan agreements.
The maturity of total debt of $538.2 million at December 31, 2014 is as follows: $12.5 million in fiscal 2015, $10.9 million in fiscal 2016, $458.9 million in fiscal 2017, $23.3 million in fiscal 2018, $2.3 million in fiscal 2019 and $30.3 million thereafter.
(12) Leases and Lease Commitments
The Company leases certain facilities under capital and operating leases. Future minimum payments for the next five years and thereafter under such leases at December 31, 2014 are as follows (in thousands):
|
Year ending December 31, |
|
Capital Leases |
|
Operating Leases |
| ||
|
|
|
|
|
|
| ||
|
2015 |
|
$ |
91,127 |
|
$ |
120,931 |
|
|
2016 |
|
93,157 |
|
120,110 |
| ||
|
2017 |
|
95,492 |
|
116,099 |
| ||
|
2018 |
|
97,840 |
|
116,880 |
| ||
|
2019 |
|
100,283 |
|
114,946 |
| ||
|
Thereafter |
|
3,054,144 |
|
305,268 |
| ||
|
Total future minimum lease payments |
|
3,532,043 |
|
$ |
894,234 |
| |
|
Less amount representing interest |
|
(2,526,406 |
) |
|
| ||
|
Capital lease obligation |
|
1,005,637 |
|
|
| ||
|
Less current portion |
|
(2,875 |
) |
|
| ||
|
Long-term capital lease obligation |
|
$ |
1,002,762 |
|
|
| |
FC-GEN Operations Investment, LLC and Subsidiaries
Notes to Consolidated Financial Statements
Capital Lease Obligations
The capital lease obligations represent the present value of minimum lease payments under such capital lease and cease use arrangements and bear imputed interest at rates ranging from 3.5% to 12.8% at December 31, 2014, and mature at dates ranging from 2015 to 2045.
The Company holds fixed price purchase options to acquire the land and buildings of 11 facilities for $55.6 million with expirations in 2025.
Deferred Lease Balances
At December 31, 2014 and 2013, the Company had $47.8 million and $60.1 million, respectively, of favorable leases net of accumulated amortization, included in other identifiable intangible assets and $31.4 million and $36.7 million, respectively, of unfavorable leases net of accumulated amortization included in other long-term liabilities on the consolidated balance sheet. The favorable leases will be amortized as an increase to lease expense over the remaining lease terms, which have a weighted average term of 9 years. The unfavorable leases will be amortized as a decrease to lease expense over the remaining lease terms, which have a weighted average term of 8 years.
Lease Covenants
Certain lease agreements contain a number of restrictive covenants that, among other things and subject to certain exceptions, impose operating and financial restrictions on the Company and its subsidiaries. These leases also require the Company to meet defined financial covenants, including a minimum level of consolidated liquidity, a maximum consolidated net leverage ratio, a minimum consolidated fixed charge coverage and a minimum level of tangible net worth. At December 31, 2014, the Company was not in compliance with one of its covenants under certain lease arrangements. The lessors granted waivers to the Company for such noncompliance.
On February 2, 2015 in connection with the Combination, the Company amended each of these lease agreements including the revision of the covenants to reflect the new capital structure of the combined company. See note 21 — “Subsequent Events.”
(13) Financing Obligation
Transaction with HCN
On April 1, 2011, the Company entered into a sale/leaseback transaction of 140 skilled nursing and assisted living facilities with Health Care REIT, Inc., a publicly held Real Estate Investment Trust (HCN) for a purchase price of $2.4 billion (the Sale Transaction). The Sale Transaction closed on April 1, 2011. Contemporaneously with the closing of the Sale Transaction, an indirect subsidiary of the Company (Tenant) entered into a master lease (the HCN Master Lease) with a subsidiary of HCN. Due to certain forms of continuing involvement, the HCN Master Lease, as amended, qualifies as a sale/leaseback transaction to be accounted for under the financing method.
As of December 31, 2014, Tenant operates 164 facilities subject to a financing obligation under the HCN Master Lease. The HCN Master Lease is supported by a guaranty from the Company. Annual cash base rent for these facilities is $255.8 million with an annual rent escalator equal to the lesser of a consumer price index factor or 3.35% for the first five lease years and not more than 2.9% thereafter. The initial lease term is for 15 years with a renewal option that can extend the lease term through December 31, 2040.
The amended HCN Master Lease previously required the Company or its affiliate to acquire from the landlord currently leased facilities for a total acquisition value of up to $320.0 million. Failure to acquire any portion of the minimum acquisition amount would have resulted in a two percent increase in rent applied to the amount not acquired below the contract minimum. There have been no acquisitions through December 31, 2014. In connection with the Combination, the requirement to acquire any of the leased facilities has been removed.
FC-GEN Operations Investment, LLC and Subsidiaries
Notes to Consolidated Financial Statements
The financing obligation represents the proceeds from the Sale Transaction that amortizes based on the present value of minimum lease payments under the HCN Master Lease and bears imputed interest at 8.8% at December 31, 2014, and matures in 2040.
The Company undergoes enhancement projects to increase the value of the properties and improve earning potential of those operations. In addition, the Company is constructing three new skilled nursing facilities. A fourth newly constructed center was placed into service in the fourth quarter of 2014. Because the Company is the primary tenant and integrally involved in the construction phase of these projects, the Company is capitalizing the cost of the construction and the associated obligation to the landlord funding the project.
Future minimum payments for the next five years and thereafter under such leases at December 31, 2014 are as follows (in thousands):
|
Year ending December 31, |
|
|
| |
|
|
|
|
| |
|
2015 |
|
$ |
259,763 |
|
|
2016 |
|
268,246 |
| |
|
2017 |
|
276,171 |
| |
|
2018 |
|
284,055 |
| |
|
2019 |
|
292,168 |
| |
|
Thereafter |
|
8,311,385 |
| |
|
Total future minimum lease payments |
|
9,691,788 |
| |
|
Less amount representing interest |
|
(6,779,450 |
) | |
|
Financing obligation |
|
$ |
2,912,338 |
|
|
Less current portion |
|
(1,138 |
) | |
|
Long-term financing obligation |
|
$ |
2,911,200 |
|
(14) Income Taxes
The provision (benefit) for income taxes was based upon management’s estimate of taxable income or loss for each respective accounting period. The Company recognizes an asset or liability for the deferred tax consequences of temporary differences between the tax bases of assets including net operating loss and credit carryforwards and liabilities and the amounts reported in the financial statements. These temporary differences would result in taxable or deductible amounts in future years when the reported amounts of the assets are recovered or liabilities are settled.
Effective April 1, 2011, there was a change in tax status, which resulted in the Company being treated as a partnership for federal and state income tax purposes. Pursuant to accounting standards, pre-existing deferred tax assets and liabilities of the Company, excluding corporate subsidiaries, were included in income tax expense in the year the Company became a non-taxable enterprise. The Company, excluding corporate subsidiaries, no longer is subject to corporate level US federal, state and local income taxes except in the District of Columbia, New Hampshire, Tennessee, Texas and Philadelphia. The Company maintains deferred taxes for these jurisdictions as does its corporate subsidiaries for US federal, state, foreign and local jurisdictions.
Effective December 1, 2012, the Company completed the Sun Merger. The Sun Merger was treated as a purchase for accounting and tax purposes. Sun and its subsidiaries file a consolidated corporate federal income tax return and state and local income tax returns. The Company did not elect under IRC Sec. 338(g) to treat the Sun Merger as a purchase of assets. As a result, the tax bases of its assets and attributes such as net operating losses and tax credit carryforwards were carried over and subject to the provisions of IRC Sec. 382.
After the Sun Merger, the Company owns two separate corporate consolidated taxable groups: GHC Ancillary group and Sun group. Management calculates a separate provision for each group. The Company combines the provisions in its consolidated financial statements.
FC-GEN Operations Investment, LLC and Subsidiaries
Notes to Consolidated Financial Statements
Income Tax Provision (Benefit)
Total income tax expense (benefit) was as follows (in thousands):
|
|
|
Year ended December 31, |
| |||||||
|
|
|
2014 |
|
2013 |
|
2012 |
| |||
|
|
|
|
|
|
|
|
| |||
|
Continuing operations |
|
$ |
(44,022 |
) |
$ |
(9,179 |
) |
$ |
(11,633 |
) |
|
Discontinued operations |
|
(4,440 |
) |
(6,017 |
) |
(536 |
) | |||
|
Noncontrolling interests |
|
(331 |
) |
(196 |
) |
(10 |
) | |||
|
Stockholders’ equity |
|
(368 |
) |
(1,271 |
) |
22 |
| |||
|
Total |
|
$ |
(49,161 |
) |
$ |
(16,663 |
) |
$ |
(12,157 |
) |
The components of the provision for income taxes on income (loss) from continuing operations for the periods presented were as follows (in thousands):
|
|
|
Year ended December 31, |
| |||||||
|
|
|
2014 |
|
2013 |
|
2012 |
| |||
|
|
|
|
|
|
|
|
| |||
|
Current: |
|
|
|
|
|
|
| |||
|
Federal |
|
$ |
7,569 |
|
$ |
7,355 |
|
$ |
(1,923 |
) |
|
State |
|
1,931 |
|
2,946 |
|
(412 |
) | |||
|
|
|
9,500 |
|
10,301 |
|
(2,335 |
) | |||
|
|
|
|
|
|
|
|
| |||
|
Deferred: |
|
|
|
|
|
|
| |||
|
Federal |
|
(47,050 |
) |
(15,935 |
) |
(9,305 |
) | |||
|
State |
|
(6,472 |
) |
(3,545 |
) |
7 |
| |||
|
|
|
(53,522 |
) |
(19,480 |
) |
(9,298 |
) | |||
|
Total |
|
$ |
(44,022 |
) |
$ |
(9,179 |
) |
$ |
(11,633 |
) |
At December 31, 2014 and 2013, the Company has established a valuation allowance in the amount of $23.2 million and $32.0 million, respectively. The valuation allowance in 2014 has been established mainly against the Company’s state net operating loss carryforwards that management expects will not be realized. The valuation allowance in 2013 has been established mainly against the Company’s discounted unpaid loss reserve deferred tax asset of the Company’s captive insurance company and the Company’s state net operating loss carryforwards that management expects will not be realized. The Company’s valuation allowance decreased by $8.8 million from December 31, 2013, due mainly to the release of a valuation allowance against the Company’s discounted unpaid loss reserve deferred tax asset of the Company’s captive insurance company.
In assessing the requirement for, and amount of, a valuation allowance in accordance with the more likely than not standard for all periods, the Company gives appropriate consideration to all positive and negative evidence related to the realization of the deferred tax assets. The assessment considers the nature, frequency and severity of current and cumulative losses, forecasts of future profitability, the duration of statutory carryforward periods and the Company’s experience with operating loss and tax credit expirations. A history of cumulative losses is a significant piece of negative evidence used in the assessment. If a history of cumulative losses is incurred for a tax jurisdiction, forecasts of future profitability are not used as positive evidence related to the realization of the deferred tax asset in the assessment.
The Company expects it will have sufficient taxable income in future periods from the reversal of existing taxable temporary differences, tax planning strategies and expected profitability to utilize the remaining deferred tax assets, net of valuation allowance, within the carryforward period. In arriving at this conclusion, the Company considered the profit generated before tax for years 2012 through 2014, as well as future reversals of existing temporary differences, tax planning strategies and projections of future profits before tax.
FC-GEN Operations Investment, LLC and Subsidiaries
Notes to Consolidated Financial Statements
The Company has $36.3 million in 2014 and $22.3 million in 2013 in deferred tax benefits from federal NOL carryforwards with expirations between 2020 and 2033 and $22.0 million in 2014 and $21.7 million in 2013 from state NOL carryforwards with expirations between 2015 and 2033. In addition, the Company has $8.2 million in 2014 and $7.0 million in 2013 of federal credit carryforwards which expire between 2018 and 2033, $1.1 million in 2014 and $0.7 million in 2013 of state credit carryforwards which expire between 2015 and 2018 and $4.7 million in 2014 and $4.8 million in 2013 of federal alternative minimum tax credit carryforwards with no expiration date.
The Internal Revenue Code imposes limitations on a corporation’s ability to utilize federal and state tax attributes (such as net unrealized built-in-deductions), including federal income tax credits, in the event of an “ownership change”. States may impose similar limitations. In general terms, an ownership change may result from transactions increasing the ownership of certain shareholders in the stock of a corporation by more than 50 percentage points over a three year period. On April 1, 2011, there was an ownership change of the GHC Ancillary group. On December 1, 2012, there was an ownership change of the Sun group.
Total income tax expense (benefit) for the periods presented differed from the amounts computed by applying the federal income tax rate of 35% to income (loss) before income taxes as illustrated below (in thousands):
|
|
|
Year ended December 31, |
| |||||||
|
|
|
2014 |
|
2013 |
|
2012 |
| |||
|
|
|
|
|
|
|
|
| |||
|
Computed “expected” benefit |
|
$ |
(98,527 |
) |
$ |
(62,575 |
) |
$ |
(63,891 |
) |
|
Increase (reduction) in income taxes resulting from: |
|
|
|
|
|
|
| |||
|
State and local income taxes, net of federal tax benefit |
|
1,931 |
|
2,987 |
|
(1,326 |
) | |||
|
Adjustment to income taxes for income not subject to corporate income tax |
|
64,575 |
|
52,390 |
|
64,085 |
| |||
|
Income tax credits |
|
(1,347 |
) |
(1,891 |
) |
(566 |
) | |||
|
Adjustment to deferred taxes, including credits and valuation allowance |
|
(12,502 |
) |
— |
|
(6,179 |
) | |||
|
Other, net |
|
1,848 |
|
(90 |
) |
(3,756 |
) | |||
|
Total income tax benefit |
|
$ |
(44,022 |
) |
$ |
(9,179 |
) |
$ |
(11,633 |
) |
The Company’s effective income tax rate was 15.6% in 2014, 5.13% in 2013 and 6.37% in 2012. The change in the effective income tax rate from 2013 to 2014 was largely due to a release of a valuation allowance in 2014 in the amount of $11.3 million. The change in the effective income tax rate from 2012 to 2013 was largely due to the release of an uncertain tax position reserve in 2012 in the amount of $11.5 million.
A significant portion of the Company’s 2014, 2013 and 2012 income (loss) before taxes is not subject to corporate income tax. However, in many jurisdictions in which the Company operates, it is obligated to remit income taxes on behalf of its members. The Company recorded these payments as distributions to its members.
The 2014 adjustment to the Company’s deferred taxes was mainly due to the release of a valuation allowance against the Company’s discounted unpaid loss reserve deferred tax asset of the Company’s captive insurance company. The 2012 adjustment to the Company’s deferred taxes was the result of a corporate subsidiaries conversion to a partnership for income tax purposes.
FC-GEN Operations Investment, LLC and Subsidiaries
Notes to Consolidated Financial Statements
The tax effects of temporary differences that give rise to significant portions of the deferred tax assets and deferred tax liabilities at December 31, 2014 and 2013 are presented below (in thousands):
|
|
|
2014 |
|
2013 |
| ||
|
|
|
|
|
|
| ||
|
Deferred Tax Assets: |
|
|
|
|
| ||
|
Accounts receivable |
|
$ |
30,793 |
|
$ |
24,783 |
|
|
Self insurance reserves |
|
62,810 |
|
62,027 |
| ||
|
Accrued liabilities and reserves |
|
16,391 |
|
16,895 |
| ||
|
Long-lived assets: real property |
|
89,856 |
|
58,059 |
| ||
|
Other long term liabilities |
|
17,246 |
|
23,621 |
| ||
|
Net operating loss carryforwards |
|
58,304 |
|
44,026 |
| ||
|
Discounted unpaid loss reserve |
|
8,336 |
|
11,289 |
| ||
|
General business credits |
|
14,016 |
|
12,481 |
| ||
|
Total deferred tax assets |
|
297,752 |
|
253,181 |
| ||
|
Valuation allowance |
|
(23,205 |
) |
(32,035 |
) | ||
|
Deferred tax assets, net of valuation allowance |
|
274,547 |
|
221,146 |
| ||
|
Deferred Tax Liabilities: |
|
|
|
|
| ||
|
Accrued liabilities and reserves |
|
(123 |
) |
(2,476 |
) | ||
|
Long-lived assets: tangible personal property |
|
(14,779 |
) |
(17,189 |
) | ||
|
Long-lived assets: intangible property |
|
(60,116 |
) |
(60,283 |
) | ||
|
Total deferred tax liabilities |
|
(75,018 |
) |
(79,948 |
) | ||
|
Net deferred tax assets |
|
$ |
199,529 |
|
$ |
141,198 |
|
Uncertain Tax Positions
The Company follows the provisions of the authoritative guidance for accounting for uncertainty in income taxes which clarifies the accounting for uncertain income tax issues recognized in an entity’s financial statements. The guidance prescribes a recognition threshold and measurement attribute for the financial statement recognition and measurement of a tax position taken or expected to be taken in an income tax return.
The Company, excluding its two corporate groups, is only subject to state and local income tax in certain jurisdictions. The Company’s two corporate groups are subject to federal, state and local income taxes. Significant judgment is required in evaluating its uncertain tax positions and determining its provision for income taxes. Under GAAP, the Company utilizes a two-step approach to recognizing and measuring uncertain tax positions. The first step is to evaluate the tax position for recognition by determining if the weight of available evidence indicates that it is more likely than not that the position will be sustained on audit, including resolution of related appeals or litigation processes. The second step is to measure the tax benefit as the largest amount that is more than 50% likely of being realized upon settlement.
The Company is subject to various federal and state income tax audits in the ordinary course of business. Such audits could result in increased tax payments, interest and penalties. While the Company believes its tax positions are appropriate, it cannot assure that the various authorities engaged in the examination of its income tax returns will not challenge the Company’s positions. The Company believes it has adequately reserved for its uncertain tax positions, though no assurance can be given that the final tax outcome of these matters will not be different. The Company adjusts these reserves in light of changing facts and circumstances, such as the closing of a tax audit or the expiration of the statute of limitations. To the extent that the final tax outcome of these matters is different than the amounts recorded, such differences will impact the provision for income taxes in the period in which such determination is made. The provision for income taxes includes the impact of reserve provisions and changes to reserves that are considered appropriate, as well as the related net interest.
FC-GEN Operations Investment, LLC and Subsidiaries
Notes to Consolidated Financial Statements
A reconciliation of unrecognized tax benefits follows (in thousands):
|
Balance, December 31, 2011 |
|
$ |
10,018 |
|
|
Additions based upon tax positions related to the current year |
|
— |
| |
|
Additions due to the acquisition of Sun Healthcare Group, Inc. |
|
24,212 |
| |
|
Reductions due to the conclusion of income tax examinations |
|
— |
| |
|
Reductions due to lapses of applicable statute of limitations |
|
— |
| |
|
Reduction due to the April 1, 2011 Health Care REIT transaction |
|
(10,018 |
) | |
|
Balance, December 31, 2012 |
|
24,212 |
| |
|
Additions based upon tax positions related to the current year |
|
— |
| |
|
Reductions due to the conclusion of income tax examinations |
|
— |
| |
|
Reductions due to lapses of applicable statute of limitations |
|
(3 |
) | |
|
Balance, December 31, 2013 |
|
24,209 |
| |
|
Additions based upon tax positions related to the current year |
|
24 |
| |
|
Reductions due to the conclusion of income tax examinations |
|
— |
| |
|
Reductions due to lapses of applicable statute of limitations |
|
— |
| |
|
Balance, December 31, 2014 |
|
$ |
24,233 |
|
The Company’s unrecognized tax benefits reserve for uncertain tax positions primarily relate to certain tax exposure items acquired as a result of the Sun Merger, the most significant item is an IRC 382 realized built-in-gain net operating loss carryforward. The liability related to the Sun Merger reserve was accounted for as part of the purchase price and was not charged to income tax expense.
All of the gross unrecognized tax benefits would affect the effective tax rate if recognized. Unrecognized tax benefits are adjusted in the period in which new information about a tax position becomes available or the final outcome differs from the amount recorded. Unrecognized tax benefits are not expected to change significantly over the next twelve months. The Company recognizes potential accrued interest related to unrecognized tax benefits in income tax expense. Penalties, if incurred, would also be recognized as a component of income tax expense. The amount of accrued interest related to unrecognized tax benefits as of December 31, 2014, 2013, and 2012 was $0.4 million, $0.4 million, and $0.3 million, respectively. Generally, the Company has open tax years for state purposes subject to tax audit on average of between three years to six years. The Company’s U.S. income tax returns from 2010 through 2013 are open and could be subject to examination.
(15) Related Party Transactions
The Company is wholly owned by private investors sponsored by affiliates of Formation Capital, LLC.
The Company made an investment of $1.0 million and received an approximate 6.8% interest in National Home Care Holdings, LLC, an unconsolidated joint venture affiliated with one of the Company’s sponsors.
The Company maintains an approximately 5.4% interest in FC PAC Holdings, LLC (FC PAC), an unconsolidated joint venture, affiliated with one of the Company’s sponsors. The Company contracts with FC PAC to provide hospice and diagnostic services in the normal course of business.
The Company provides rehabilitation services to certain facilities owned and operated by affiliates of the Company’s sponsors. These services resulted in revenue of $161.2 million, $148.5 million and $92.9 million in the years ended December 31, 2014, 2013, and 2012, respectively. The services resulted in accounts receivable balances of $37.6 million and $61.2 million at December 31, 2014 and 2013, respectively.
The Company is billed by an affiliate of the Company’s sponsors a monthly fee for the provision of administrative services. The fees billed were $2.5 million, $2.5 million and $2.6 million for the years ended December 31, 2014, 2013 and 2012, respectively. On February 2, 2015 in connection with the Combination, an affiliate of the Company’s
FC-GEN Operations Investment, LLC and Subsidiaries
Notes to Consolidated Financial Statements
sponsors received a transaction advisory fee of $3.0 million and the administrative services monthly fee was discontinued.
(16) Stockholders’ Equity (Deficit)
The Company’s authorized capital stock consists of 175,000,000 shares. 49,864,878 shares of $0.001 par value Class A common stock have been issued at December 31, 2014 and December 31, 2013.
Capital Transaction with Stockholders
During the years ended December 31, 2014, 2013 and 2012, the Company distributed $18.0 million, $5.3 million and $35.3 million, respectively, to the stockholders. In 2012, the stockholders contributed $25.0 million to the Company.
(17) Commitments and Contingencies
Loss Reserves For Certain Self-Insured Programs
General and Professional Liability and Workers’ Compensation
The Company self-insures for certain insurable risks, including general and professional liabilities and workers’ compensation liabilities through the use of self-insurance or retrospective and self-funded insurance policies and other hybrid policies, which vary by the states in which it operates, including a wholly owned captive insurance subsidiary that is domiciled in Bermuda, to provide for potential liabilities for general and professional liability claims and workers’ compensation claims. Policies are typically written for a duration of twelve months and are measured on a “claims made” basis. Regarding workers’ compensation, the Company self-insures to its deductible and purchases statutory required insurance coverage in excess of its deductible. There is a risk that amounts funded to the Company’s self-insurance programs may not be sufficient to respond to all claims asserted under those programs. Insurance reserves represent estimates of future claims payments. This liability includes an estimate of the development of reported losses and losses incurred but not reported. Provisions for changes in insurance reserves are made in the period of the related coverage. The Company also considers amounts that may be recovered from excess insurance carriers in estimating the ultimate net liability for such risks.
The Company’s management employs its judgment and periodically independent actuarial analysis in determining the adequacy of certain self-insured workers’ compensation and general and professional liability obligations booked as liabilities in the Company’s financial statements. The Company evaluates the adequacy of its self-insurance reserves on a quarterly basis or more often when it is aware of changes to its incurred loss patterns that could impact the accuracy of those reserves. The methods of making such estimates and establishing the resulting reserves are reviewed periodically and are based on historical paid claims information and nationwide nursing home trends. The foundation for most of these methods is the Company’s actual historical reported and/or paid loss data, over which it has effective internal controls. Any adjustments resulting therefrom are reflected in current earnings. Claims are paid over varying periods, and future payments may be different than the estimated reserves.
The Company utilizes third-party administrators (TPAs) to process claims and to provide it with the data utilized in its assessments of reserve adequacy. The TPAs are under the oversight of the Company’s in-house risk management and legal functions. These functions ensure that the claims are properly administered so that the historical data is reliable for estimation purposes. Case reserves, which are approved by the Company’s legal and risk management departments, are determined based on its estimate of the ultimate settlement and/or ultimate loss exposure of individual claims.
The reserves for loss for workers’ compensation risks are discounted based on actuarial estimates of claim payment patterns using a discount rate of approximately 1% for each policy period presented. The discount rate for the 2014 policy year is 0.83%. The discount rates are based upon the risk-free rate for the appropriate duration for the respective policy year. The removal of discounting would have resulted in an increased reserve for workers’ compensation risks of
FC-GEN Operations Investment, LLC and Subsidiaries
Notes to Consolidated Financial Statements
$4.8 million and $6.7 million as of December 31, 2014 and December 31, 2013, respectively. The reserves for general and professional liability are recorded on an undiscounted basis.
The provision for general and professional liability risks totaled $130.8 million, $87.4 million and $39.8 million for the years ended December 31, 2014, 2013 and 2012, respectively. The reserves for general and professional liability were $288.2 million and $224.6 million as of December 31, 2014 and December 31, 2013, respectively.
The provision for loss for workers’ compensation risks totaled $62.4 million, $52.2 million and $36.9 million for the years ended December 31, 2014, 2013 and 2012, respectively. The reserves for workers’ compensation risks were $198.0 million and $174.4 million as of December 31, 2014 and December 31, 2013, respectively.
Health Insurance
The Company offers employees an option to participate in self-insured health plans. Health insurance claims are paid as they are submitted to the plans’ administrators. The Company maintains an accrual for claims that have been incurred but not yet reported to the plans’ administrators and therefore have not been paid. The liability for the self-insured health plan is recorded in accrued compensation in the consolidated balance sheets. Although management believes that the amounts provided in the Company’s consolidated financial statements are adequate and reasonable, there can be no assurances that the ultimate liability for such self-insured risks will not exceed management’s estimates.
Financial Commitments
Requests for providing commitments to extend financial guarantees and extend credit are reviewed and approved by senior management subject to obligational authority limitations. Management regularly reviews outstanding commitments, letters of credit and financial guarantees, and the results of these reviews are considered in assessing the need for any reserves for possible credit and guarantee loss.
The Company has extended $10.5 million in working capital lines of credit to certain jointly owned and managed companies, including certain consolidated VIEs, of which $2.7 million was unused at December 31, 2014. Credit risk represents the accounting loss that would be recognized at the reporting date if the affiliate companies were unable to repay any amounts utilized under the working capital lines of credit. Commitments to extend credit to third parties are conditional agreements generally having fixed expiration or termination dates and specific interest rates and purposes.
The Company has posted $101.1 million of outstanding letters of credit at December 31, 2014. The letters of credit guarantee performance to third parties of various trade activities. The letters of credit are not recorded as liabilities on the Company’s consolidated balance sheet unless they are probable of being utilized by the third party. The financial risk approximates the amount of outstanding letters of credit.
Legal Proceedings
The Company is a party to litigation and regulatory investigations arising in the ordinary course of business. Management does not believe the results of such litigation and regulatory investigations, even if the outcome is unfavorable, would have a material adverse effect on the results of operations, financial position or cash flows of the Company.
Conditional Asset Retirement Obligations
Certain of the Company’s leased real estate assets contain asbestos. The asbestos is believed to be appropriately contained in accordance with environmental regulations. If these properties were demolished or subject to renovation activities that disturb the asbestos, certain environmental regulations are in place, which specify the manner in which the asbestos must be handled and disposed.
At December 31, 2014 and 2013, the Company has a liability for the asset retirement obligation associated primarily with the cost of asbestos removal aggregating approximately $5.0 million and $4.8 million, respectively, which is
FC-GEN Operations Investment, LLC and Subsidiaries
Notes to Consolidated Financial Statements
included in other long-term liabilities. The liability for each facility will be accreted to its settlement value, which is estimated to approximate $16.4 million through the estimated settlement dates extending from 2015 through 2042. Due to the time over which these obligations could be settled and the judgment used to determine the liability, the ultimate obligation may differ from the estimate. Upon settlement, any difference between actual cost and the estimate is recognized as a gain or loss in that period.
Annual accretion of the liability and depreciation expense is recorded each year for the impacted assets until the obligation year is reached, either by sale of the property, demolition or some other future event such as a government action.
Employment Agreements
The Company has employment agreements and arrangements with its executive officers and certain members of management. The agreements generally continue until terminated by the executive or the Company, and provide for severance payments under certain circumstances.
Management Incentive Plan
Upon a qualifying event, including, but not limited to (i) the sale of a substantial portion of the assets of the Company, (ii) a refinancing of a material portion of the indebtedness of the Company, or (iii) the contribution of a significant amount of capital to the Company in exchange for a membership interest, the Company is obligated to pay participants in an incentive plan a percentage of the net proceeds above a threshold with a maximum potential payment of $45.6 million. Such payment is not a return of capital and is therefore an expense of the Company at the time such an event occurs.
As a result of the Combination on February 2, 2015, the Company recognized expense of $45.6 million in 2015 related to the management incentive plan.
(18) Fair Value of Financial Instruments
The Company’s financial instruments consist primarily of cash and equivalents, restricted cash, trade accounts receivable, investments in marketable securities, accounts payable, short and long-term debt and derivative financial instruments.
The Company’s financial instruments, other than its trade accounts receivable and accounts payable, are spread across a number of large financial institutions whose credit ratings the Company monitors and believes do not currently carry a material risk of non-performance. Certain of the Company’s financial instruments, including its interest rate cap arrangements, contain an off-balance-sheet risk.
Recurring Fair Value Measures
Fair value is defined as an exit price (i.e., the price that would be received to sell an asset or paid to transfer a liability in an orderly transaction between market participants at the measurement date). The fair value hierarchy prioritizes the inputs to valuation techniques used to measure fair value into three broad levels as shown below. An instrument’s classification within the fair value hierarchy is determined based on the lowest level input that is significant to the fair value measurement.
|
Level 1 — |
|
Quoted prices (unadjusted) in active markets for identical assets or liabilities. |
|
Level 2 — |
|
Inputs that are observable for the asset or liability, either directly or indirectly through market corroboration, for substantially the full term of the asset or liability. |
|
Level 3 — |
|
Inputs that are unobservable for the asset or liability based on the Company’s own assumptions (about the assumptions market participants would use in pricing the asset or liability). |
FC-GEN Operations Investment, LLC and Subsidiaries
Notes to Consolidated Financial Statements
The tables below presents the Company’s assets and liabilities measured at fair value on a recurring basis as of December 31, 2014 and 2013, aggregated by the level in the fair value hierarchy within which those measurements fall (in thousands):
|
|
|
Fair Value Measurements at Reporting Date Using |
| ||||||||||
|
|
|
December 31, |
|
Quoted Prices in |
|
Significant Other |
|
Significant |
| ||||
|
|
|
2014 |
|
(Level 1) |
|
(Level 2) |
|
(Level 3) |
| ||||
|
Assets: |
|
|
|
|
|
|
|
|
| ||||
|
Cash and equivalents |
|
$ |
87,548 |
|
$ |
87,548 |
|
$ |
— |
|
$ |
— |
|
|
Restricted cash and equivalents |
|
36,390 |
|
36,390 |
|
— |
|
— |
| ||||
|
Restricted investments in marketable securities |
|
|
|
|
|
|
|
|
| ||||
|
Mortgage/government backed securities |
|
8,472 |
|
8,472 |
|
— |
|
— |
| ||||
|
Corporate bonds |
|
38,878 |
|
38,878 |
|
— |
|
— |
| ||||
|
Government bonds |
|
63,000 |
|
63,000 |
|
— |
|
— |
| ||||
|
Total |
|
$ |
234,288 |
|
$ |
234,288 |
|
$ |
— |
|
$ |
— |
|
|
|
|
Fair Value Measurements at Reporting Date Using |
| ||||||||||
|
|
|
December 31, |
|
Quoted Prices in |
|
Significant Other |
|
Significant |
| ||||
|
|
|
2013 |
|
(Level 1) |
|
(Level 2) |
|
(Level 3) |
| ||||
|
Assets: |
|
|
|
|
|
|
|
|
| ||||
|
Cash and equivalents |
|
$ |
61,413 |
|
$ |
61,413 |
|
$ |
— |
|
$ |
— |
|
|
Restricted cash and equivalents |
|
12,458 |
|
12,458 |
|
— |
|
— |
| ||||
|
Restricted investments in marketable securities |
|
|
|
|
|
|
|
|
| ||||
|
Mortgage/government backed securities |
|
5,558 |
|
5,558 |
|
— |
|
— |
| ||||
|
Corporate bonds |
|
40,150 |
|
40,150 |
|
— |
|
— |
| ||||
|
Government bonds |
|
64,829 |
|
64,829 |
|
— |
|
— |
| ||||
|
Total |
|
$ |
184,408 |
|
$ |
184,408 |
|
$ |
— |
|
$ |
— |
|
The Company places its cash and equivalents and restricted investments in marketable securities in quality financial instruments and limits the amount invested in any one institution or in any one type of instrument. The Company has not experienced any significant losses.
FC-GEN Operations Investment, LLC and Subsidiaries
Notes to Consolidated Financial Statements
Debt Instruments
The table below shows the carrying amounts and estimated fair values of the Company’s primary long-term debt instruments:
|
|
|
2014 |
|
2013 |
| ||||||||
|
|
|
Carrying Value |
|
Fair Value |
|
Carrying Value |
|
Fair Value |
| ||||
|
|
|
|
|
|
|
|
|
|
| ||||
|
Revolving credit facility |
|
$ |
254,500 |
|
$ |
254,500 |
|
$ |
200,000 |
|
$ |
200,000 |
|
|
Term loan facility, net of original issue discount of $11,375 in 2014 and $15,275 in 2013 |
|
219,297 |
|
229,677 |
|
220,142 |
|
220,142 |
| ||||
|
Mortgages and other secured debt (recourse) |
|
14,488 |
|
14,488 |
|
14,468 |
|
14,468 |
| ||||
|
Mortgages and other secured debt (non recourse) |
|
49,961 |
|
49,961 |
|
54,823 |
|
54,823 |
| ||||
|
|
|
$ |
538,246 |
|
$ |
548,626 |
|
$ |
489,433 |
|
$ |
489,433 |
|
The fair value of debt is based upon market prices or is computed using discounted cash flow analysis, based on the Company’s estimated borrowing rate at the end of each fiscal period presented. The Company believes that the inputs to the pricing models qualify as Level 2 measurements.
Non-Recurring Fair Value Measures
The Company recently applied the fair value measurement principles to certain of its non-recurring nonfinancial assets in connection with an impairment test.
The following table presents the Company’s hierarchy for nonfinancial assets measured at fair value on a non-recurring basis (in thousands):
|
|
|
Carrying Value |
|
Impairment Charges - |
| ||
|
Assets: |
|
|
|
|
| ||
|
Property and equipment, net |
|
$ |
3,493,250 |
|
$ |
28,359 |
|
|
Goodwill |
|
169,681 |
|
— |
| ||
|
Intangible assets |
|
173,112 |
|
3,040 |
| ||
|
|
|
Carrying Value |
|
Impairment Charges - |
| ||
|
Assets: |
|
|
|
|
| ||
|
Property and equipment, net |
|
$ |
3,550,950 |
|
$ |
9,999 |
|
|
Goodwill |
|
169,681 |
|
— |
| ||
|
Intangible assets |
|
194,513 |
|
— |
| ||
The fair value of tangible and intangible assets is determined using a discounted cash flow approach, which is a significant unobservable input (Level 3). The Company estimates the fair value using the income approach (which is a discounted cash flow technique). These valuation methods required management to make various assumptions, including, but not limited to, future profitability, cash flows and discount rates. The Company’s estimates are based
FC-GEN Operations Investment, LLC and Subsidiaries
Notes to Consolidated Financial Statements
upon historical trends, management’s knowledge and experience and overall economic factors, including projections of future earnings potential.
Developing discounted future cash flows in applying the income approach requires the Company to evaluate its intermediate to longer-term strategies, including, but not limited to, estimates about revenue growth, operating margins, capital requirements, inflation and working capital management. The development of appropriate rates to discount the estimated future cash flows requires the selection of risk premiums, which can materially impact the present value of future cash flows.
The Company estimated the fair value of acquired tangible and intangible assets using discounted cash flow techniques which included an estimate of future cash flows, consistent with overall cash flow projections used to determine the purchase price paid to acquire the business, discounted at a rate of return that reflects the relative risk of the cash flows.
The Company believes the estimates and assumptions used in the valuation methods are reasonable.
(19) Asset Impairment Charges
Long-Lived Assets with a Definite Useful Life
In the fourth quarter of 2014, 2013 and 2012, the Company’s long-lived assets with a definite useful life were tested for impairment at the lowest levels for which there are identifiable cash flows. The Company estimated the future net undiscounted cash flows expected to be generated from the use of the long-lived assets and then compared the estimated undiscounted cash flows to the carrying amount of the long-lived assets. The cash flow period was based on the remaining useful lives of the primary asset in each long-lived asset group, principally a building in the inpatient segment and customer relationship assets in the rehabilitation therapy services segment. For 2014 and 2013, the Company recognized impairment charges in the inpatient segment totaling $31.4 million and $10.0 million, respectively. There were no impairment charges in 2012.
Goodwill
The Company performed its annual goodwill impairment test as of September 30, 2014, 2013 and 2012 and determined that no impairment was necessary.
(20) Discontinued Operations
In the normal course of business, the Company continually evaluates the performance of its operating units, with an emphasis on selling or closing underperforming or non-strategic assets. Discontinued businesses are removed from the results of continuing operations. The results of operations in the current and prior year periods, along with any cost to exit such businesses in the year of discontinuation, are classified as discontinued operations in the consolidated statements of operations.
FC-GEN Operations Investment, LLC and Subsidiaries
Notes to Consolidated Financial Statements
The following table sets forth net revenues and the components of loss from discontinued operations (in thousands):
|
|
|
Year ended December 31, |
| |||||||
|
|
|
2014 |
|
2013 |
|
2012 |
| |||
|
|
|
|
|
|
|
|
| |||
|
Net revenues |
|
$ |
8,788 |
|
$ |
57,782 |
|
$ |
12,331 |
|
|
Net operating loss of discontinued businesses |
|
$ |
(16,559 |
) |
$ |
(10,783 |
) |
$ |
(1,346 |
) |
|
Loss on discontinuation of business |
|
(1,925 |
) |
(2,598 |
) |
— |
| |||
|
Income tax benefit |
|
4,440 |
|
6,017 |
|
536 |
| |||
|
Loss from discontinued operations, net of taxes |
|
$ |
(14,044 |
) |
$ |
(7,364 |
) |
$ |
(810 |
) |
Prior to October 1, 2014, the Company closed or transferred operations of four facilities with licensed beds of 440 located in the states of California and Massachusetts. During 2013, the Company closed or transferred the operations of 14 facilities with licensed beds of 1,462 located in the states of Oklahoma, Idaho, Wyoming, Tennessee, Kentucky and Massachusetts.
(21) Subsequent Events
The Combination with Skilled
As discussed in note 1 “General Information”, the closing of the Combination transaction occurred on February 2, 2015. After completion of the transaction, the combined company operates under the name Genesis Healthcare, Inc. (Genesis) and the Class A common stock of Skilled continues to trade on the NYSE under the symbol “GEN”. The pre-Combination owners of the Company now hold 74.25% of the economic interests in the combined entity post-transaction and the pre-Combination shareholders of Skilled now hold the remaining 25.75% economic interest in the combined entity following the Combination.
The Company has obtained control over Skilled and, thus, is the accounting acquirer. Therefore, the transaction meets the definition of a reverse acquisition where the legal acquirer is the accounting acquiree. The acquisition method will be applied to the transaction based on Skilled’s stock price (level 1 valuation technique-quoted prices in active markets for identical assets or liabilities) as of the acquisition date. The consideration will be allocated to the legacy Skilled business that is being acquired on the acquisition date with any excess consideration over the fair value of the net assets acquired being recognized as goodwill. The Company’s assets and liabilities will remain at their historical costs.
Because FC-GEN’s pre-transaction owners held an approximately 58% direct controlling interest in Skilled and a 74.25% economic and voting interest in the combined company, FC-GEN is considered to be the acquirer of Skilled for accounting purposes. Following the closing of the Combination, the combined results of Skilled and FC-GEN are consolidated with approximately 42% direct noncontrolling economic interest shown as noncontrolling interest in the financial statements of the combined entity. The 42% direct noncontrolling economic interest is in the form of membership units that are exchangeable on a 1 to 1 basis to public shares of the Company. The 42% direct noncontrolling economic interest will continue to decrease as membership units are converted to public shares of the Company.
Consideration Price Allocation
The total Skilled consideration price of $348.1 million was allocated to Skilled’s net tangible and identifiable intangible assets based upon the estimated fair values at February 2, 2015. The excess of the consideration price over the estimated fair value of the net tangible and identifiable intangible assets was recorded as goodwill. The allocation of the consideration price to property, plant and equipment, identifiable intangible assets and deferred income taxes was based upon valuation data and estimates. The Company has not finalized the analysis of the consideration price allocation and will continue its review during the measurement period. The aggregate goodwill arising from the Combination is based
FC-GEN Operations Investment, LLC and Subsidiaries
Notes to Consolidated Financial Statements
upon the expected future cash flows of the Skilled operations. Goodwill recognized from the Combination is the result of (i) the expected savings to be realized from achieving certain economies of scale and (ii) anticipated long-term improvements in Skilled’s core businesses. The Company has estimated $79.8 million of pre-existing Skilled goodwill that is deductible for income tax purposes related to the Combination.
The consideration price and related allocation are summarized as follows (in thousands):
|
Accounts receivable |
|
$ |
128,782 |
|
|
|
|
Deferred income taxes and other current assets |
|
42,533 |
|
|
| |
|
Property, plant and equipment |
|
495,692 |
|
|
| |
|
|
|
|
|
Weighted |
| |
|
Identifiable intangible assets: |
|
|
|
|
| |
|
Management contracts |
|
30,900 |
|
3.5 |
| |
|
Customer relationships |
|
13,400 |
|
10.0 |
| |
|
Favorable lease contracts |
|
18,220 |
|
12.8 |
| |
|
Trade names |
|
3,400 |
|
Indefinite |
| |
|
Total identifiable intangible assets |
|
65,920 |
|
|
| |
|
Deferred income taxes and other assets |
|
59,196 |
|
|
| |
|
Accounts payable and other current liabilities |
|
(115,292 |
) |
|
| |
|
Long-term debt, including amounts due within one year |
|
(428,342 |
) |
|
| |
|
Unfavorable lease contracts |
|
(11,480 |
) |
|
| |
|
Deferred income taxes and other long-term liabilities |
|
(142,574 |
) |
|
| |
|
Total identifiable net assets |
|
94,435 |
|
|
| |
|
Goodwill |
|
253,705 |
|
|
| |
|
Net assets |
|
$ |
348,140 |
|
|
|
Combination Financing
In connection with the Combination on February 2, 2015, Genesis entered into a $360.0 million Real Estate Bridge Loan, which is secured by a mortgage lien on the real property of 67 facilities and a second lien on certain receivables of the operators of such facilities. The Real Estate Bridge Loan is subject to a 24-month term with two extension options of 90-days each and accrues interest at a rate equal to LIBOR, plus 6.75%, plus an additional margin that ranges up to 7.00% based on the aggregate number of days the Real Estate Bridge Loan is outstanding. The interest rate is also subject to a LIBOR interest rate floor of 0.5%. The Real Estate Bridge Loan is subject to payments of interest only during the term with a balloon payment due at maturity, provided, that to the extent the subsidiaries receive any net proceeds from the sale and / or refinance of the underlying facilities such net proceeds are required to be used to repay the outstanding principal balance of the Real Estate Bridge Loan. The proceeds of the Real Estate Bridge Loan were used to repay Skilled’s first lien senior secured term loan, repay Skilled’s mortgage loans and asset based revolving credit facility with MidCap Financial with excess proceeds used to fund direct costs of the Combination with the Company. The Real Estate Bridge Loan currently has an outstanding principal balance of $360.0 million.
Also in connection with the Combination, on February 2, 2015 Genesis entered into new Revolving Credit Facilities. The new Revolving Credit Facilities consist of a senior secured, asset-based revolving credit facility of up to $550 million under three separate tranches: Tranche A-1, Tranche A-2 and FILO Tranche. Interest accrues at a per annum rate equal to either (x) a base rate (calculated as the highest of the (i) prime rate, (ii) the federal funds rate plus 3.00%, or (iii) LIBOR plus the excess of the applicable margin between LIBOR loans and base rate loans) plus an applicable margin or (y) LIBOR plus an applicable margin. The applicable margin is based on the level of commitments for all three tranches, and in regards to LIBOR loans (i) for Tranche A-1 ranges from 3.25% to 2.75%; (ii) for Tranche A-2 ranges from 3.00% to 2.50%; and (iii) for FILO Tranche is 5.00%. The Revolving Credit Facilities mature on February 2, 2020, provided that if the Term Loan Facility (defined below) or the Real Estate Bridge Loan is not refinanced with longer term debt or their terms not extended prior to their current maturities of December 4, 2017 and
FC-GEN Operations Investment, LLC and Subsidiaries
Notes to Consolidated Financial Statements
August 27, 2017, respectively, the Revolving Credit Facilities will mature 90 days prior to such maturity date, as applicable. Borrowing levels under the Revolving Credit Facilities are limited to a borrowing base that is computed based upon the level of our eligible accounts receivable, as defined. In addition to paying interest on the outstanding principal borrowed under the Revolving Credit Facilities, Genesis is required to pay a commitment fee to the lenders for any unutilized commitments. The commitment fee rate ranges from 0.375% per annum to 0.50% depending upon the level of unused commitment.
Prior to the Combination, the Company and certain of its subsidiaries became a party to a five-year Term Loan Facility. The Term Loan Facility is secured by a first priority lien on the membership interests in the Company, substantially all of the Company’s and its subsidiaries’ assets other than collateral held on a first priority basis by the Revolving Credit Facilities lender. Borrowings under the Term Loan Facility bear interest at a rate per annum equal to the applicable margin plus, at Genesis’ option, either (x) LIBOR or (y) a base rate determined by reference to the highest of (i) the lender defined prime rate, (ii) the federal funds rate effective plus one half of one percent and (iii) LIBOR described in subclause (x) plus 1.0%. LIBOR based loans are subject to an interest rate floor of 1.5% and base rate loans are subject to a floor of 2.5%. The Term Loan Facility matures on December 4, 2017. On September 24, 2014, the Company entered into an amendment to the Term Loan Facility providing for changes to the financial covenants and other provisions allowing for and accommodating the Combination. On February 2, 2015, the amendment to the Term Loan Facility became effective. The Term Loan Facility currently has an outstanding principal balance of $230.7 million.
Also in connection with the Combination on February 2, 2015, the Company and certain of its lessors amended the existing lease agreements. These amendments modified certain financial covenants to reflect the performance of the combined company. There were no other significant changes to the lease agreements.
Related Party Transactions
On March 31, 2015, the Company sold its investment in FC PAC Holdings, LLC (FC PAC), an unconsolidated joint venture in which it held an approximate 5.4% interest, for $26.4 million. The Company recognized a gain on sale of $8.4 million recorded as other income on the statement of operations. FC PAC ownership includes affiliates of Formation Capital, a private equity sponsor of the Company prior to the Combination, and also represented by members of the Company’s board of directors.
Lease Amendment
On April 1, 2015, the Company amended a master lease agreement with a major landlord real estate investment trust. The amendment resulted in a one-time buyout of rent for eight previously closed facilities for a payment of $9.1 million. The Company has the option to close six other facilities over the next two years if certain conditions are met. The initial term of the lease was extended by two years expiring December 31, 2027.
Acquisition from Revera
On June 15, 2015, the Company announced that it has signed an asset purchase agreement with Revera Inc., a leading owner, operator and investor in the senior living sector, to acquire 24 of its skilled nursing facilities along with its contract rehabilitation business for $240 million. The Company will acquire the real estate and operations of 20 of the skilled nursing facilities and enter into a long-term lease agreement with HCN to operate the other four additional skilled nursing facilities. The transaction is expected to close by this calendar year-end, subject to additional due diligence, regulatory and licensing approvals, and other customary conditions.
FC-GEN OPERATIONS INVESTMENT, LLC AND SUBSIDIARIES
QUARTERLY CONSOLIDATED FINANCIAL INFORMATION
(IN THOUSANDS, EXCEPT PER SHARE DATA)
(UNAUDITED)
|
|
|
Quarter ended |
| ||||||||||
|
|
|
March 31, 2014 |
|
June 30, 2014 |
|
September 30, 2014 |
|
December 31, 2014 |
| ||||
|
|
|
|
|
|
|
|
|
|
| ||||
|
Net revenues |
|
$ |
1,186,544 |
|
$ |
1,200,651 |
|
$ |
1,187,618 |
|
$ |
1,193,267 |
|
|
Net loss: |
|
|
|
|
|
|
|
|
| ||||
|
Loss from continuing operaitions |
|
(40,789 |
) |
(30,856 |
) |
(42,608 |
) |
(123,232 |
) | ||||
|
Net income attributable to noncontrolling interests |
|
(185 |
) |
(224 |
) |
(961 |
) |
(1,086 |
) | ||||
|
Loss from continuing operations attributable to FC-GEN Operations Investment, LLC |
|
(40,974 |
) |
(31,080 |
) |
(43,569 |
) |
(124,318 |
) | ||||
|
Loss from discontinued operations, net of taxes |
|
(3,194 |
) |
(1,176 |
) |
(1,191 |
) |
(8,483 |
) | ||||
|
Net loss attributable to FC-GEN Operations Investment, LLC |
|
(44,168 |
) |
(32,256 |
) |
(44,760 |
) |
(132,801 |
) | ||||
|
Loss per common share: |
|
|
|
|
|
|
|
|
| ||||
|
Basic and diluted: |
|
|
|
|
|
|
|
|
| ||||
|
Loss from continuing operaitions |
|
(0.82 |
) |
(0.62 |
) |
(0.86 |
) |
(2.47 |
) | ||||
|
Net income attributable to noncontrolling interests |
|
— |
|
— |
|
(0.02 |
) |
(0.02 |
) | ||||
|
Loss from continuing operations attributable to FC-GEN Operations Investment, LLC |
|
(0.82 |
) |
(0.62 |
) |
(0.88 |
) |
(2.49 |
) | ||||
|
Loss from discontinued operations, net of taxes |
|
(0.07 |
) |
(0.02 |
) |
(0.02 |
) |
(0.17 |
) | ||||
|
Net loss attributable to FC-GEN Operations Investment, LLC |
|
(0.89 |
) |
(0.64 |
) |
(0.90 |
) |
(2.66 |
) | ||||
|
|
|
|
|
|
|
|
|
|
| ||||
|
Shares used in computing loss per common share: |
|
|
|
|
|
|
|
|
| ||||
|
Basic and diluted: |
|
49,865 |
|
49,865 |
|
49,865 |
|
49,865 |
| ||||
|
|
|
Quarter ended |
| ||||||||||
|
|
|
March 31, 2013 |
|
June 30, 2013 |
|
September 30, 2013 |
|
December 31, 2013 |
| ||||
|
|
|
|
|
|
|
|
|
|
| ||||
|
Net revenues |
|
$ |
1,172,969 |
|
$ |
1,173,362 |
|
$ |
1,175,158 |
|
$ |
1,188,852 |
|
|
Net loss: |
|
|
|
|
|
|
|
|
| ||||
|
Loss from continuing operaitions |
|
(46,846 |
) |
(27,937 |
) |
(40,593 |
) |
(54,230 |
) | ||||
|
Net loss (income) attributable to noncontrolling interests |
|
332 |
|
(544 |
) |
(633 |
) |
(180 |
) | ||||
|
Loss from continuing operations attributable to FC-GEN Operations Investment, LLC |
|
(46,514 |
) |
(28,481 |
) |
(41,226 |
) |
(54,410 |
) | ||||
|
Loss from discontinued operations, net of taxes |
|
(1,588 |
) |
(2,191 |
) |
(2,943 |
) |
(642 |
) | ||||
|
Net loss attributable to FC-GEN Operations Investment, LLC |
|
(48,102 |
) |
(30,672 |
) |
(44,169 |
) |
(55,052 |
) | ||||
|
Loss per common share: |
|
|
|
|
|
|
|
|
| ||||
|
Basic and diluted: |
|
|
|
|
|
|
|
|
| ||||
|
Loss from continuing operaitions |
|
(0.93 |
) |
(0.57 |
) |
(0.82 |
) |
(1.09 |
) | ||||
|
Net loss (income) attributable to noncontrolling interests |
|
0.01 |
|
(0.01 |
) |
(0.01 |
) |
— |
| ||||
|
Loss from continuing operations attributable to FC-GEN Operations Investment, LLC |
|
(0.92 |
) |
(0.58 |
) |
(0.83 |
) |
(1.09 |
) | ||||
|
Loss from discontinued operations, net of taxes |
|
(0.04 |
) |
(0.04 |
) |
(0.06 |
) |
(0.01 |
) | ||||
|
Net loss attributable to FC-GEN Operations Investment, LLC |
|
(0.96 |
) |
(0.62 |
) |
(0.89 |
) |
(1.10 |
) | ||||
|
|
|
|
|
|
|
|
|
|
| ||||
|
Shares used in computing loss per common share: |
|
|
|
|
|
|
|
|
| ||||
|
Basic and diluted: |
|
49,865 |
|
49,865 |
|
49,865 |
|
49,865 |
| ||||
FC-GEN OPERATIONS INVESTMENT, LLC AND SUBSIDIARIES
SCHEDULE II - VALUATION AND QUALIFYING ACCOUNTS
FOR THE YEARS ENDED DECEMBER 31, 2014, 2013 and 2012
|
|
|
Balance at |
|
Charged to cost |
|
Deductions or |
|
Balance at end of |
| ||||
|
|
|
|
|
|
|
|
|
|
| ||||
|
Allowance for loss on accounts receivable |
|
|
|
|
|
|
|
|
| ||||
|
Year ended December 31, 2012 |
|
$ |
50,554 |
|
$ |
44,093 |
|
$ |
(26,228 |
) |
$ |
68,419 |
|
|
Year ended December 31, 2013 |
|
68,419 |
|
64,268 |
|
(26,594 |
) |
106,093 |
| ||||
|
Year ended December 31, 2014 |
|
$ |
106,093 |
|
$ |
70,950 |
|
$ |
(43,514 |
) |
$ |
133,530 |
|
(1) Amounts per year differ from the provision for losses on accounts receivable due to discontinued operations as well as managed
care coinsurance reserves and other adjustments, which are included in the provision for loss on accounts receivable but not in the
allowance for loss on accounts receivable.
FC-GEN OPERATIONS INVESTMENT, LLC AND SUBSIDIARIES
SELECTED HISTORICAL CONSOLIDATED FINANCIAL DATA
(IN THOUSANDS, EXCEPT PER SHARE DATA)
|
|
|
Year Ended December 31, |
| |||||||||||||
|
|
|
2014 |
|
2013 |
|
2012 |
|
2011 |
|
2010 |
| |||||
|
|
|
|
|
|
|
|
|
|
|
|
| |||||
|
Consolidated Statement of Operations Data: |
|
|
|
|
|
|
|
|
|
|
| |||||
|
Net revenues |
|
$ |
4,768,080 |
|
$ |
4,710,341 |
|
$ |
3,076,298 |
|
$ |
2,735,799 |
|
$ |
2,498,278 |
|
|
Expenses |
|
5,049,587 |
|
4,889,126 |
|
3,258,843 |
|
2,770,114 |
|
2,463,191 |
| |||||
|
(Loss) income before income tax (benefit) expense |
|
(281,507 |
) |
(178,785 |
) |
(182,545 |
) |
(34,315 |
) |
35,087 |
| |||||
|
Income tax (benefit) expense |
|
(44,022 |
) |
(9,179 |
) |
(11,633 |
) |
(129,873 |
) |
10,151 |
| |||||
|
(Loss) income from continuing operations |
|
(237,485 |
) |
(169,606 |
) |
(170,912 |
) |
95,558 |
|
24,936 |
| |||||
|
Loss from discontinued operations, net of taxes |
|
(14,044 |
) |
(7,364 |
) |
(810 |
) |
(1,551 |
) |
(19 |
) | |||||
|
Net (loss) income |
|
(251,529 |
) |
(176,970 |
) |
(171,722 |
) |
94,007 |
|
24,917 |
| |||||
|
Less net (income) loss attributable to noncontrolling interests |
|
(2,456 |
) |
(1,025 |
) |
448 |
|
716 |
|
(3,001 |
) | |||||
|
Net (loss) income attributable to FC-GEN Operations Investment, LLC |
|
$ |
(253,985 |
) |
$ |
(177,995 |
) |
$ |
(171,274 |
) |
$ |
94,723 |
|
$ |
21,916 |
|
|
|
|
|
|
|
|
|
|
|
|
|
| |||||
|
Loss per common share: |
|
|
|
|
|
|
|
|
|
|
| |||||
|
Weighted average shares outstanding for basic and diluted (loss) income from continuing operations per share |
|
49,865 |
|
49,865 |
|
49,865 |
|
49,865 |
|
49,865 |
| |||||
|
Basic and diluted net (loss) income per common share: |
|
|
|
|
|
|
|
|
|
|
| |||||
|
(Loss) income from continuing operations attributable to FC-GEN Operations Investment, LLC |
|
$ |
(4.81 |
) |
$ |
(3.42 |
) |
$ |
(3.41 |
) |
$ |
1.93 |
|
$ |
0.44 |
|
|
Loss from discontinued operations, net of taxes |
|
(0.28 |
) |
(0.15 |
) |
(0.02 |
) |
(0.03 |
) |
— |
| |||||
|
Net (loss) income attributable to FC-GEN Operations Investment, LLC |
|
$ |
(5.09 |
) |
$ |
(3.57 |
) |
$ |
(3.43 |
) |
$ |
1.90 |
|
$ |
0.44 |
|
|
|
|
|
|
|
|
|
|
|
|
|
| |||||
|
Other Financial Data: |
|
|
|
|
|
|
|
|
|
|
| |||||
|
Capital expenditures |
|
$ |
(70,987 |
) |
$ |
(77,399 |
) |
$ |
(66,704 |
) |
$ |
(69,247 |
) |
$ |
(47,598 |
) |
|
Net cash provided by operating activities |
|
107,652 |
|
82,149 |
|
9,972 |
|
15,549 |
|
122,995 |
| |||||
|
Net cash used in investing activities |
|
(95,675 |
) |
(91,702 |
) |
(182,899 |
) |
(165,629 |
) |
(58,026 |
) | |||||
|
Net cash provided by (used in) financing activities |
|
14,158 |
|
20,748 |
|
172,229 |
|
78,180 |
|
(51,726 |
) | |||||
|
|
|
December 31, |
| |||||||||||||
|
|
|
2014 |
|
2013 |
|
2012 |
|
2011 |
|
2010 |
| |||||
|
Balance Sheet Data: |
|
|
|
|
|
|
|
|
|
|
| |||||
|
Cash and equivalents |
|
$ |
87,548 |
|
$ |
61,413 |
|
$ |
50,218 |
|
$ |
50,916 |
|
$ |
122,816 |
|
|
Working capital |
|
235,604 |
|
241,344 |
|
235,757 |
|
190,251 |
|
287,883 |
| |||||
|
Property and equipment and leased facility assets, net |
|
3,493,250 |
|
3,550,950 |
|
3,704,547 |
|
2,850,718 |
|
1,817,665 |
| |||||
|
Total assets |
|
5,141,408 |
|
5,137,005 |
|
5,248,119 |
|
3,703,666 |
|
2,719,752 |
| |||||
|
Long-term debt, including current installments (recourse) |
|
488,285 |
|
434,610 |
|
404,766 |
|
77,000 |
|
1,670,563 |
| |||||
|
Long-term debt, including current installments (non-recourse) |
|
49,961 |
|
54,823 |
|
53,215 |
|
59,053 |
|
44,820 |
| |||||
|
Capital lease obligations, including current installments |
|
1,005,637 |
|
975,617 |
|
1,026,977 |
|
356,327 |
|
227,382 |
| |||||
|
Financing obligations, including current installments |
|
2,912,338 |
|
2,786,391 |
|
2,668,793 |
|
2,424,979 |
|
— |
| |||||
|
Stockholders’ (deficit) equity |
|
(457,490 |
) |
(183,881 |
) |
2,019 |
|
180,122 |
|
18,183 |
| |||||
Management’s Discussion and Analysis of Financial Condition and Results of Operations
This revised Management’s Discussion and Analysis of Financial Condition and Results of Operations (MD&A) supplements the disclosure contained in the MD&A in the Schedule 14C Information Statement filed by Skilled Healthcare Group, Inc. (“Skilled”) with the U.S. Securities and Exchange Commission (“SEC”) on January 9, 2015 (the “Information Statement”) to disclose the combination of the business and operations of FC-GEN Operations Investment, LLC (“FC-GEN”) and Skilled (“the Combination”). This MD&A is intended to assist in understanding and assessing the trends and significant changes in the results of operations and financial condition of FC-GEN as of the dates and for the periods presented and should be read in conjunction with the consolidated financial statements and related notes thereto included in this Exhibit. The information included in this Exhibit is presented only in connection with the filing of the financial statements described in the accompanying Current Report on Form 8-K. This information does not reflect events occurring after December 31, 2014. Therefore, this MD&A should be read in conjunction with the condensed consolidated financial statements and related notes included in this Exhibit, as well as the audited financial statements for the year ended December 31, 2014 filed by Genesis Healthcare, Inc. (“Genesis”) with the SEC on Form 8-K/A on February 26, 2015, the disclosure contained in the Information Statement and the disclosure contained in any other reports filed by Genesis with the SEC after December 31, 2014.
Historical results may not indicate future performance. Forward-looking statements included in this Exhibit, which reflect current views about future events, are based on assumptions and are subject to known and unknown risks and uncertainties that could cause actual results to differ materially from those contemplated by these statements. Factors that may cause differences between actual results and those contemplated by forward-looking statements include, but are not limited to, those discussed in Genesis’ Annual Report on Form 10-K for the year ended December 31, 2014, particularly in Item 1A, “Risk Factors,” which was filed with the SEC on February 20, 2015 (“Annual Report”), and in Genesis’ subsequent quarterly and current reports filed with the SEC after that date. As used in this Management’s Discussion and Analysis of Financial Condition and Results of Operations, the words, “we,” “our,” “us” and the “Company,” and similar terms, refer collectively to FC-GEN and its wholly-owned subsidiaries, unless the context requires otherwise.
All statements included or incorporated by reference in this Current Report on Form 8-K and the exhibits thereto, other than statements or characterizations of historical fact, are forward-looking statements within the meaning of the federal securities laws, including the Private Securities Litigation Reform Act of 1995. You can identify these statements by the fact that they do not relate strictly to historical or current facts. These statements contain words such as “may,” “will,” “project,” “might,” “expect,” “believe,” “anticipate,” “intend,” “could,” “would,” “estimate,” “continue,” “pursue,” “plans” or “prospect,” or the negative or other variations thereof or comparable terminology. They include, but are not limited to, statements about expectations and beliefs regarding future operations and financial performance. These forward-looking statements are based on expectations and projections about future events, and there can be no assurance that they will be achieved or occur, in whole or in part, in the timeframes anticipated or at all. Investors are cautioned that forward-looking statements are not guarantees of future performance or results and involve risks and uncertainties that cannot be predicted or quantified and, consequently, the actual performance of Genesis may differ materially from that expressed or implied by such forward-looking statements. These risks and uncertainties include, but are not limited to, those contained in Part I, Item 1A, “Risk Factors” of Genesis’ Annual Report on Form 10-K, filed on February 20, 2015, and others that are discussed in this Form 8-K and the exhibits thereto and could materially and adversely affect Genesis’ business, financial condition, prospects, operating results or cash flows. Genesis’ business is also subject to the risks that affect many other companies, such as employment relations, natural disasters, general economic conditions and geopolitical events. Further, additional risks not known to Genesis or that Genesis currently believes are immaterial may in the future materially and adversely affect Genesis’ business, operations, liquidity and stock
price. Any forward-looking statements contained herein are made only as of the date of the accompanying Current Report on Form 8-K. Genesis disclaims any obligation to update the forward-looking statements. Investors are cautioned not to place undue reliance on these forward-looking statements.
Business Overview
FC-GEN is a healthcare company that, through its wholly owned subsidiaries, is one of the largest operator of skilled nursing facilities in the United States based on number of beds and facilities. Through its inpatient services segment, it operates 414 skilled nursing, assisted living and behavioral health centers located in 28 states. Revenues of Genesis’ owned, leased and otherwise consolidated centers constitute approximately 85% of its revenues.
Through its rehabilitation therapy services segment, FC-GEN operates one of the largest post-acute contract therapy business in the United States based on the number of contracts, with nearly 1,400 contracts in 44 states. Rehabilitation therapy services include speech pathology, physical therapy, occupational therapy and respiratory therapy. These services are provided by rehabilitation therapists and assistants employed or contracted at substantially all of the centers it operates, as well as by contract to healthcare facilities operated by others. After the elimination of intercompany revenues, the rehabilitation therapy services business constitutes approximately 13% of FC-GEN’s revenues.
FC-GEN provides an array of other specialty medical services, including management services, physician services, staffing services and other healthcare related services, which comprise the balance of its revenues.
Recent Transactions
Purchase and Contribution Agreement
On August 18, 2014, FC-GEN entered into a Purchase and Contribution Agreement with Skilled pursuant to which its businesses and operations will be combined with the businesses and operations of Skilled. On February 2, 2015, the Combination was completed.
The following diagram depicts the organizational structure of us at the time of the Combination:
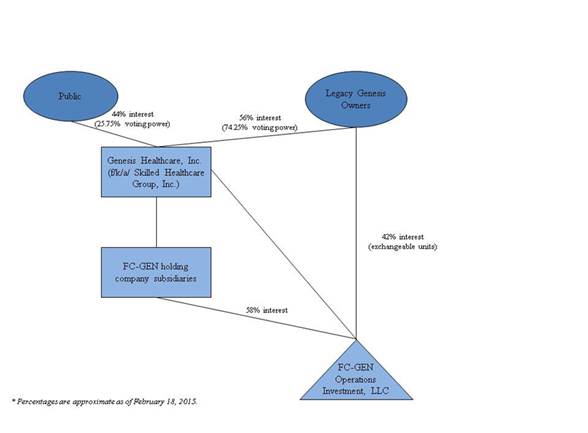
Upon completion of the Combination, we now operate under the name Genesis Healthcare, Inc. and our Class A common stock of the combined company continues to trade on the NYSE under the symbol “GEN”. Upon the closing of the Combination, the former owners of FC-GEN held 74.25% of the economic interests in the combined entity and the former shareholders of Skilled held the remaining 25.75% of the economic interests in the combined entity post-transaction, in each case on a fully-diluted, as-exchanged and as-converted basis. Under applicable accounting standards, FC-GEN was the accounting acquirer in the Combination, which was treated as a reverse acquisition. The acquisition method has been applied to the accounts of Skilled based on its stock price (level 1 valuation technique - quoted prices in active markets for identical assets or liabilities) as of the acquisition date. The consideration has been allocated to the legacy Skilled business that was acquired on the acquisition date with the excess consideration over the fair value of the net assets acquired recognized as goodwill. As of the effective date of the Combination, FC-GEN’s assets and liabilities remained at their historical costs.
Because FC-GEN’s pre-transaction owners held an approximately 58% direct controlling interest in Skilled and a 74.25% economic and voting interest in the combined company, FC-GEN is considered to be the acquirer of Skilled for accounting purposes. Following the closing of the Combination, the combined results of Skilled and FC-GEN are consolidated with approximately 42% direct noncontrolling economic interest shown as noncontrolling interest in the financial
statements of the combined entity. The 42% direct noncontrolling economic interest is in the form of membership units that are exchangeable on a 1 to 1 basis to public shares of ours. The 42% direct noncontrolling economic interest will continue to decrease as membership units are converted to public shares of ours.
Sun Healthcare Group Acquisition
Effective December 1, 2012, FC-GEN completed the acquisition (the “Sun Merger”) of Sun Healthcare Group, Inc. and its subsidiaries (“ Sun “). Upon consummation of the Sun Merger, each issued and outstanding share of Sun common stock and common stock equivalent was tendered for $8.50 in cash. The purchase price totaled $228.4 million before considering cash acquired in connection with the Sun Merger. FC-GEN also assumed $88.8 million of long-term debt in the Sun Merger, of which $87.5 million was refinanced on December 3, 2012. The operating results of Sun have been included in the accompanying consolidated financial statements of FC-GEN since December 1, 2012.
In connection with the Sun Merger, FC-GEN entered into (i) senior secured asset-based revolving credit facilities, initially having aggregate borrowing capacity of $375 million (the “ Revolving Credit Facilities “) and (ii) a new $325 million senior secured term loan facility (the “Term Loan Facility”); (collectively with the Revolving Credit Facilities, the “ New Credit Facilities “). FC-GEN used proceeds from the New Credit Facilities to pay the consideration for the Sun Merger, repay all amounts outstanding under Sun’s previous credit facilities and to pay transaction costs. Amounts outstanding under Sun’s former credit facilities were repaid with proceeds from the New Credit Facilities.
At the Sun Merger date, Sun and its subsidiaries operated 199 facilities in 25 states consisting of 179 skilled nursing facilities, 12 assisted or independent living facilities and 8 behavioral health facilities. Sun also operated a contract rehabilitation business serving over 500 sites of service in 36 states, a medical staffing business and a hospice business. The Sun Merger expanded FC-GEN’s service offerings to new markets and provided opportunities for significant operating synergies.
Simultaneous with the Sun Merger, Sun’s hospice segment was sold to a provider of hospice care, for approximately $85 million. Net cash sale proceeds of $75 million were used to repay a portion of the Term Loan Facility. FC-GEN retained an approximate one-third interest in the sold hospice segment since it already owned an approximate one-third interest in the hospice’s parent company.
In connection with the Sun Merger, FC-GEN amended leases with several landlords.
Operating results for 2012 included Transaction costs totaling $14.4 million. Deferred financing fees totaling $19.6 million related to the Sun Merger are considered directly attributable to the acquisition or issuance of the financial liabilities and therefore are recorded net against the liabilities.
Critical Accounting Policies and Estimates
A full discussion of FC-GEN’s critical accounting policies and estimates is provided in the accompanying notes to the audited consolidated financial statements for the year ended December 31, 2014.
FC-GEN’s management considers an understanding of its accounting policies to be essential to an understanding of its financial statements because their application requires significant judgment and reliance on certain estimates. There is measurement uncertainty relating to the accounting policies applied to revenue recognition, the allowance for doubtful accounts, valuation of long-lived assets, goodwill and intangibles, the valuation of self-insured liabilities, and accounting for income taxes. The recorded amounts for such items are based on management’s best available information and are subject to assumptions and judgments, which may change as time progresses; accordingly, actual results could differ from those estimated.
Revenue Recognition
FC-GEN receives payments through reimbursement from Medicaid and Medicare programs and directly from individual residents (private pay), third party insurers and long-term care facilities.
Within its inpatient services segment, revenue and related receivables are recorded in the accounting records at its established billing rates in the period the related services are rendered. The provision for contractual adjustments, which represents the difference between the established billing rates and the predetermined reimbursement rates, is deducted from gross revenue to determine net revenue. Retroactive adjustments that are likely to result from future examinations by third party payors are accrued on an estimated basis in the period the related services are rendered and adjusted as necessary in future periods based upon new information or final settlements.
Within its rehabilitation therapy services segment and ancillary service businesses, FC-GEN records revenues at the time services or products are provided or delivered to the customer. Upon delivery of services or products, it has no additional performance obligation to the customer.
Allowance for Doubtful Accounts
FC-GEN considers evidence of uncollectible trade receivables at both a specific asset and collective level. All individually significant receivables are assessed for collectability. Receivables that are not individually significant are assessed for collectability by grouping together receivables with similar risk characteristics.
FC-GEN utilizes the “aging method” to evaluate the adequacy of its allowance for doubtful accounts. This method is based upon applying estimated standard allowance requirement percentages to each accounts receivable aging category for each type of payor. FC-GEN has developed estimated standard allowance requirement percentages by utilizing historical collection trends and its understanding of the nature and collectability of receivables in the various aging categories and the various segments of its business. The standard allowance percentages are developed by payor type as the accounts receivable from each payor type have unique characteristics. Accounts receivable that it specifically estimates to be uncollectible, based upon the
age of the receivables, the results of collection efforts, or other circumstances, are fully reserved for in the allowance for doubtful accounts until they are written off.
FC-GEN continues to refine its assumptions and methodologies underlying the aging method. It believes the assumptions used in the aging method, coupled with historical collection pattern experience, suggest that its allowance for doubtful accounts is sufficient. However, because the assumptions underlying the aging method are based upon historical collection data, there is a risk that its current assumptions are not reflective of more recent collection patterns. Changes in overall collection patterns can be caused by market conditions and/or budgetary constraints of government funded programs such as Medicare and Medicaid. Such changes can adversely impact the collectability of receivables, but not be addressed in a timely fashion when using the aging method, until updates to its periodic historical collection studies are completed and implemented.
At least annually, FC-GEN updates its historical collection studies in order to evaluate the propriety of the assumptions underlying the aging method. Any changes to the underlying assumptions are implemented immediately. Changes to these assumptions can have a material impact on its provision for losses on accounts receivable, which is reported in the consolidated statements of operations.
The provision for losses on accounts receivable totaled $77.7 million, $69.9 million and $42.0 million for the years ended December 31, 2014, 2013 and 2012, respectively. The allowance for doubtful accounts was $133.5 million and $106.1 million as of December 31, 2014 and 2013, respectively.
Valuation of Long-lived Assets, Goodwill and Intangible Assets
FC-GEN periodically evaluates the carrying value of its long-lived assets other than goodwill for impairment indicators. If indicators of impairment are present, FC-GEN evaluates the carrying value of the related assets in relation to the future undiscounted cash flows of the underlying operations to assess recoverability of the assets. Measurement of the amount of the impairment, if any, may be based on independent appraisals, established market values of comparable assets or estimates of future cash flows expected. The estimates of these future cash flows are based on assumptions and projections believed by FC-GEN’s management to be reasonable and supportable. They require management’s subjective judgments and take into account assumptions about revenue and expense growth rates. These assumptions may vary by type of long-lived asset. Key triggering events include significant changes in the reimbursement environment and regulatory reform, among other things.
Goodwill is accounted for under the Financial Accounting Standards Board (“FASB”) Accounting Standards Codification (“ ASC “) Topic 805, Business Combinations, and represents the excess of the purchase price over the fair value of identifiable net assets acquired in business combinations accounted for as purchases. In accordance with FASB ASC Topic 350, Intangibles Goodwill and Other, goodwill is subject to periodic testing for impairment. Goodwill of a reporting unit is tested for impairment on an annual basis, or, if an event occurs or circumstances change that would reduce the fair value of a reporting unit below its carrying amount, between annual testing. FC-GEN has selected September 30 as the date to test goodwill for impairment on an annual basis.
Goodwill was $169.7 million as of December 31, 2014 and 2013. The majority of FC-GEN’s goodwill is assigned to its inpatient services reporting unit.
In 2014, FC-GEN performed a step-zero qualitative assessment of each of the reporting units and determined that is was not more likely than not that the fair value of each of the reporting units was less than the carrying amount. FC-GEN applied a market approach in its current year assessment given the announcement of the Combination and implied fair value based upon Skilled’s stock price at the time. As a result, the two-step goodwill impairment test described below was not required and no impairment of goodwill was recognized in 2014.
In 2013, FC-GEN performed a quantitative test for impairment of goodwill to assess the impact of changes in the regulatory and reimbursement environment. The quantitative analysis is a two-step process as follows:
· First, it compares the carrying amount of each of the reporting units to the fair value of each of the reporting units. If the carrying amount of each of its reporting units exceeds its fair value, FC-GEN must perform the second step of the process. If not, no further testing is needed. In 2013, it determined that the carrying amount of each of the reporting units did not exceed the fair value and accordingly did not perform the second step in the analysis. As a result, no impairment of goodwill was recognized in 2013.
· If the second part of the analysis is required, FC-GEN allocates the fair value of each of the reporting units to all assets and liabilities as if each of the reporting units had been acquired in a business combination at the date of the impairment test. FC-GEN then compares the implied fair value of each of the reporting units’ goodwill to its carrying amount. If the carrying amount of the goodwill exceeds its implied fair value, it recognizes an impairment loss in an amount equal to that excess.
Valuation of Self-Insured Liabilities—General and Professional Liability and Workers’ Compensation Insurance
FC-GEN self-insures for certain insurable risks, including general and professional liabilities and workers’ compensation liabilities through the use of self-insurance or retrospective and self-funded insurance policies and other hybrid policies, which vary by the states in which it operates. FC-GEN operates a wholly owned captive insurance subsidiary that is domiciled in Bermuda to provide for potential liabilities for general and professional liability claims and workers’ compensation claims. Policies are typically written for a duration of twelve months and are measured on a “claims made” basis. Regarding workers’ compensation, FC-GEN self-insures to its deductible and purchases statutory required insurance coverage in excess of its deductible. There is a risk that amounts funded to its self-insurance programs may not be sufficient to respond to all claims asserted under those programs. Insurance reserves represent estimates of future claims payments. This liability includes an estimate of the development of reported losses and losses incurred but not reported. Provisions for changes in insurance reserves are made in the period of the related coverage. FC-GEN also considers amounts that may be recovered from excess insurance carriers in estimating the ultimate liability for such risks.
FC-GEN management employs its judgment and periodically independent actuarial analysis in determining the adequacy of certain self-insured workers’ compensation and general and professional liability obligations booked as liabilities in its financial statements. FC-GEN evaluates the adequacy of its self-insurance reserves on a quarterly basis or more often when it is aware of changes to its incurred loss patterns that could impact the accuracy of those reserves. The methods of making such estimates and establishing the resulting reserves are reviewed periodically and are based on historical paid claims information and nationwide nursing home trends. The foundation for most of these methods is its actual historical reported and/or paid loss data. Any adjustments resulting therefrom are reflected in current earnings. Claims are paid over varying periods, and future payments may be different than the estimated reserves.
FC-GEN utilizes third-party administrators (“TPAs”) to process claims and to provide it with the data utilized in its assessments of reserve adequacy. The TPAs are under the oversight of FC-GEN’s in-house risk management and legal functions. These functions ensure that the claims are properly administered so that the historical data is reliable for estimation purposes. Case reserves, which are approved by its legal and risk management departments, are determined based on its estimate of the ultimate settlement and/or ultimate loss exposure of individual claims.
The reserves for loss for workers’ compensation risks are discounted based on actuarial estimates of claim payment patterns using a discount rate of approximately 1% for each policy period presented. The discount rate for the 2014 policy year is 0.83%. The discount rates are based upon the risk-free rate for the appropriate duration for the respective policy year. The removal of discounting would have resulted in an increased reserve for workers’ compensation risks of $4.8 million and $6.7 million as of December 31, 2014 and 2013, respectively. The reserves for general and professional liability are recorded on an undiscounted basis.
The changes in the number of self-insurance claims and the severity of those claims significantly impact the reserves for general and professional liability and worker’s compensation. The changes could have a material impact on the results of operations, either favorable or unfavorable. For example, a 1% variance in the reserve for general and professional liability and worker’s compensation would have a $4.9 million and $4.0 million impact on operating loss for the years ended December 31, 2014 and 2013, respectively.
The provision for general and professional liability risks totaled $130.8 million, $87.4 million and $39.8 million for the years ended December 31, 2014, 2013 and 2012, respectively. The reserves for general and professional liability were $288.2 million and $224.6 million as of December 31, 2014 and 2013, respectively.
The provision for loss for workers’ compensation risks totaled $62.4 million, $52.2 million and $36.9 million for the years ended December 31, 2014, 2013 and 2012, respectively. The reserves for workers’ compensation risks were $198.0 million and $174.4 million as December 31, 2014 and 2013, respectively.
Accounting for Income Taxes
Deferred tax is recognized in respect of temporary differences between the carrying amounts of assets and liabilities for financial reporting purposes and the amounts used for taxation purposes.
Deferred tax is measured at the tax rates that are expected to be applied to temporary differences when they reverse, based on the laws that have been enacted or substantively enacted by the reporting date. Deferred tax assets and liabilities are offset if there is a legally enforceable right to offset current tax liabilities and assets, and they relate to income taxes levied by the same tax authority on the same taxable entity, or on different tax entities, but they intend to settle current tax liabilities and assets on a net basis or their tax assets and liabilities will be realized simultaneously. The ultimate realization of deferred tax assets is dependent upon the generation of future taxable income during the periods in which those temporary differences become deductible. FC-GEN’s management considers the scheduled reversal of deferred tax liabilities, projected future taxable income and tax planning strategies in making this assessment.
Tax uncertainties are evaluated on the basis of whether it is more likely than not that a tax position will ultimately be sustained upon examination by the relevant taxing authorities. Tax uncertainties are measured using a probability adjusted or expected value model whereby amounts are recorded if there is uncertainty about a filing position, determined by multiplying the amount of the exposure by the probability that FC-GEN’s filing position will not be sustained. The assessment of tax uncertainties relies on estimates and assumptions and may involve a series of judgments about future events. New information may become available that causes FC-GEN to change its judgment regarding the adequacy of existing tax liabilities. Such changes to tax liabilities will impact tax expense in the period that such a determination is made.
Genesis recognized net deferred tax assets of $199.5 million and $141.2 million as of December 31, 2014 and 2013, respectively.
Generally, FC-GEN has open tax years for state purposes subject to tax audit on average of between three years to six years. Its U.S. income tax returns from 2010 through 2013 are open and could be subject to examination.
Recent Accounting Pronouncements
In April 2015, the FASB issued ASU No. 2015-03, Simplifying the Presentation of Debt Issuance Costs, (ASU 2015-03). This ASU requires an entity to present debt issuance costs as a direct deduction from the carrying amount of the related debt liability, consistent with debt discounts. The costs will continue to be amortized to interest expense using the effective interest method. The adoption of ASU 2015-03 is effective for fiscal years beginning after December 15, 2015, and interim periods within those fiscal years, with early adoption permitted. This ASU requires retrospective application to all prior periods presented in the financial statements. The adoption of ASU No. 2015-03 is not expected to have a material impact on FC-GEN’s consolidated financial condition and results of operations.
In May 2014, the FASB issued ASU No. 2014-09, Revenue from Contracts with Customers, (ASU 2014-08). This ASU requires an entity to recognize revenue to depict the transfer of promised goods or services to customers in an amount that reflects the consideration to which the entity expects to be entitled in exchange for those goods or services. To achieve this core principle, the guidance provides that an entity should apply the following steps: (1) identify the contract(s) with a customer; (2) identify the performance obligations in the contract; (3) determine the transaction
price; (4) allocate the transaction price to the performance obligations in the contract; and (5) recognize revenue when, or as, the entity satisfies a performance obligation. The ASU is effective beginning in the first quarter of our fiscal year 2017. Early adoption is not permitted. FC-GEN is currently evaluating the impact to the consolidated financial statements.
In April 2014, the FASB issued ASU No. 2014-08, Reporting Discontinued Operations and Disclosures of Disposals of Components of an Entity, (ASU 2014-08). This ASU requires an entity to report disposed components or components held-for-sale in discontinued operations if such components represent a strategic shift that has or will have a significant effect on operations and financial results. Additionally, expanded disclosure about discontinued operations and disposals of significant components that do not qualify for discontinued operations presentation will be required. The adoption of ASU 2014-08 is effective prospectively for disposals that occur within annual periods beginning on or after December 15, 2014, with early adoption permitted. FC-GEN adopted ASU 2014-08 in the fourth quarter of 2014 and its adoption did not have a material impact on the consolidated financial statements.
Key Financial Performance Indicators
In order to compare FC-GEN’s financial performance between periods, its management assesses the key performance indicators for all of its operating segments separately for the periods presented.
The following is a glossary of terms for some of FC-GEN’s key performance indicators:
“Actual Patient Days” is defined as the number of residents occupying a bed (or units in the case of an assisted living center) for one qualifying day in that period;
“Adjusted EBITDA” is defined as EBITDA adjusted for (1) the conversion to cash basis leases (2) newly acquired or constructed businesses with start-up losses and (3) other adjustments. See “Reasons for Non-GAAP Financial Disclosure” for an explanation of the adjustments and a description of FC-GEN’s uses of, and the limitations associated with non-GAAP measures.
“Adjusted EBITDAR” is defined as EBITDAR adjusted for (1) the conversion to cash basis leases (2) newly acquired or constructed businesses with start-up losses and (3) other adjustments. See “Reasons for Non-GAAP Financial Disclosure” for an explanation of the adjustments and a description of FC-GEN’s uses of, and the limitations associated with non-GAAP measures.
“Available Patient Days” is defined as the number of available beds (or units in the case of an assisted living center) multiplied by the number of days in that period;
“Average Daily Census” or “ADC” is the number of residents occupying a bed (or units in the case of an assisted living center) over a period of time, divided by the number of calendar days in that period;
“EBITDA” is defined as EBITDAR less lease expense. See “Reasons for Non-GAAP Financial Disclosure” for an explanation of the adjustments and a description of FC-GEN’s uses of, and the limitations associated with non-GAAP measures.
“EBITDAR” is defined as net income or loss before depreciation and amortization expense, interest expense, lease expense, loss (gain) on extinguishment of debt, other (income) loss, transaction costs, long-lived asset impairment, income tax expense (benefit) and loss from discontinued operations. See “Reasons for Non-GAAP Financial Disclosure” for an explanation of the adjustments and a description of FC-GEN’s uses of, and the limitations associated with non-GAAP measures.
“Insurance” refers collectively to commercial insurance and managed care payor sources, but does not include managed care payers serving Medicaid residents, which are included in the Medicaid category;
“Occupancy Percentage” is measured as the percentage of Actual Patient Days relative to the Available Patient Days;
“Skilled Mix” refers collectively to Medicare and Insurance payor sources.
“Therapist Efficiency” is computed by dividing billable labor minutes related to patient care by total labor minutes for the period.
Key performance indicators for FC-GEN’s business are set forth below, followed by a comparison and analysis of its financial results:
|
|
|
Year ended December 31, |
| |||||||
|
|
|
2014 |
|
2013 |
|
2012 |
| |||
|
|
|
(In thousands) |
| |||||||
|
Financial Results |
|
|
|
|
|
|
| |||
|
Net revenues |
|
$ |
4,768,080 |
|
$ |
4,710,341 |
|
$ |
3,076,298 |
|
|
EBITDAR |
|
532,537 |
|
584,537 |
|
349,979 |
| |||
|
EBITDA |
|
400,639 |
|
453,306 |
|
314,612 |
| |||
|
Adjusted EBITDAR |
|
589,816 |
|
589,673 |
|
360,393 |
| |||
|
Adjusted EBITDA |
|
140,617 |
|
159,564 |
|
89,296 |
| |||
INPATIENT SEGMENT:
|
|
|
Year ended December 31, |
| |||||||
|
|
|
2014 |
|
2013 |
|
2012 |
| |||
|
Occupancy Statistics - Inpatient |
|
|
|
|
|
|
| |||
|
Available licensed beds in service at end of period |
|
46,407 |
|
46,338 |
|
46,533 |
| |||
|
Available operating beds in service at end of period |
|
45,058 |
|
45,317 |
|
45,510 |
| |||
|
Available patient days based on licensed beds |
|
16,967,951 |
|
16,947,617 |
|
10,104,441 |
| |||
|
Available patient days based on operating beds |
|
16,463,613 |
|
16,564,662 |
|
9,915,718 |
| |||
|
Actual patient days |
|
14,679,338 |
|
14,627,220 |
|
8,955,654 |
| |||
|
Occupancy percentage - licensed beds |
|
86.5 |
% |
86.3 |
% |
88.6 |
% | |||
|
Occupancy percentage - operating beds |
|
89.2 |
% |
88.3 |
% |
90.3 |
% | |||
|
Skilled mix |
|
21.7 |
% |
21.8 |
% |
23.7 |
% | |||
|
Average daily census |
|
40,217 |
|
40,075 |
|
24,469 |
| |||
|
|
|
|
|
|
|
|
| |||
|
Revenue per patient day (skilled nursing facilities) |
|
|
|
|
|
|
| |||
|
Medicare Part A |
|
$ |
492 |
|
$ |
485 |
|
$ |
486 |
|
|
Medicare total (including Part B) |
|
530 |
|
522 |
|
525 |
| |||
|
Insurance |
|
450 |
|
444 |
|
463 |
| |||
|
Private and other |
|
316 |
|
301 |
|
311 |
| |||
|
Medicaid |
|
213 |
|
209 |
|
218 |
| |||
|
Medicaid (net of provider taxes) |
|
193 |
|
189 |
|
196 |
| |||
|
Weighted average (net of provider taxes) |
|
$ |
270 |
|
$ |
266 |
|
$ |
279 |
|
|
|
|
|
|
|
|
|
| |||
|
Patient days by payor (skilled nursing facilities) |
|
|
|
|
|
|
| |||
|
Medicare |
|
2,076,272 |
|
2,138,427 |
|
1,424,718 |
| |||
|
Insurance |
|
900,663 |
|
828,120 |
|
548,044 |
| |||
|
Total skilled mix days |
|
2,976,935 |
|
2,966,547 |
|
1,972,762 |
| |||
|
Private and other |
|
971,500 |
|
1,061,963 |
|
718,549 |
| |||
|
Medicaid |
|
9,759,092 |
|
9,609,372 |
|
5,647,479 |
| |||
|
Total Days |
|
13,707,527 |
|
13,637,882 |
|
8,338,790 |
| |||
|
|
|
|
|
|
|
|
| |||
|
Patient days as a percentage of total patient days (skilled nursing facilities) |
|
|
|
|
|
|
| |||
|
Medicare |
|
15.1 |
% |
15.7 |
% |
17.1 |
% | |||
|
Insurance |
|
6.6 |
% |
6.1 |
% |
6.6 |
% | |||
|
Skilled mix |
|
21.7 |
% |
21.8 |
% |
23.7 |
% | |||
|
Private and other |
|
7.1 |
% |
7.8 |
% |
8.6 |
% | |||
|
Medicaid |
|
71.2 |
% |
70.5 |
% |
67.7 |
% | |||
|
Total |
|
100.0 |
% |
100.0 |
% |
100.0 |
% | |||
|
Facilities at end of period |
|
|
|
|
|
|
|
|
Skilled nursing facilities |
|
|
|
|
|
|
|
|
Leased |
|
359 |
|
357 |
|
366 |
|
|
Owned |
|
2 |
|
3 |
|
6 |
|
|
Joint Venture |
|
5 |
|
5 |
|
4 |
|
|
Managed |
|
14 |
|
14 |
|
16 |
|
|
Total skilled nursing facilities |
|
380 |
|
379 |
|
392 |
|
|
Total licensed beds |
|
46,204 |
|
46,298 |
|
47,802 |
|
|
|
|
|
|
|
|
|
|
|
Assisted living facilities: |
|
|
|
|
|
|
|
|
Leased |
|
28 |
|
27 |
|
30 |
|
|
Owned |
|
1 |
|
— |
|
— |
|
|
Joint Venture |
|
1 |
|
1 |
|
1 |
|
|
Managed |
|
4 |
|
4 |
|
5 |
|
|
Total assisted living facilities |
|
34 |
|
32 |
|
36 |
|
|
Total licensed beds |
|
2,762 |
|
2,702 |
|
3,036 |
|
|
Total facilities |
|
414 |
|
411 |
|
428 |
|
|
Total Jointly Owned and Managed— (Unconsolidated) |
|
17 |
|
17 |
|
19 |
|
REHABILITATION THERAPY SEGMENT:
|
|
|
Year ended December 31, |
| |||||||
|
|
|
2014 |
|
2013 |
|
2012 |
| |||
|
Revenue mix %: |
|
|
|
|
|
|
| |||
|
Company-operated |
|
37 |
% |
36 |
% |
31 |
% | |||
|
Non-affiliated |
|
63 |
% |
64 |
% |
69 |
% | |||
|
Sites of service (at end of period) |
|
1,358 |
|
1,408 |
|
1,012 |
| |||
|
Revenue per site |
|
$ |
687,782 |
|
$ |
656,265 |
|
$ |
662,403 |
|
|
Therapist efficiency % |
|
68 |
% |
67 |
% |
65 |
% | |||
Reasons for Non-GAAP Financial Disclosure
The following discussion includes EBITDAR, Adjusted EBITDAR, EBITDA and Adjusted EBITDA, which are non-GAAP financial measures. For purposes of SEC Regulation G, a non-GAAP financial measure is a numerical measure of a registrant’s historical or future financial performance, financial position and cash flows that excludes amounts, or is subject to adjustments that have the effect of excluding amounts, that are included in the most directly comparable financial measure calculated and presented in accordance with GAAP in the statement of operations, balance sheet or statement of cash flows (or equivalent statements) of the registrant; or includes amounts, or is subject to adjustments that have the effect of including amounts, that are excluded from the most directly comparable financial measure so calculated and presented. In this regard, GAAP refers to generally accepted accounting principles in the United States. Pursuant to the requirements of Regulation G, FC-GEN has provided reconciliations of the non-GAAP financial measures to the most directly comparable GAAP financial measures.
FC-GEN’s management believes that the presentation of EBITDAR, Adjusted EBITDAR, EBITDA and Adjusted EBITDA provides useful information to investors regarding its results of operations because these financial measures are useful for trending, analyzing and benchmarking the performance and value of its business. By excluding certain expenses and other items that may not be indicative of its core business operating results, these non-GAAP financial measures:
· allow investors to evaluate its performance from management’s perspective, resulting in greater transparency with respect to supplemental information used by FC-GEN in its financial and operational decision making;
· facilitate comparisons with prior periods and reflect the principal basis on which management monitors financial performance;
· facilitate comparisons with the performance of others in the post-acute industry;
· provide better transparency as to the relationship each reporting period between its cash basis lease expense and the level of operating earnings available to fund its lease expense; and
· allow investors to view FC-GEN’s financial performance and condition in the same manner its significant landlords and lenders require it to report financial information to them in connection with determining its compliance with financial covenants.
FC-GEN uses EBITDAR, Adjusted EBITDAR, EBITDA and Adjusted EBITDA primarily as performance measures and believes that the GAAP financial measure most directly comparable to them is net income (loss). Management uses EBITDAR, Adjusted EBITDAR, EBITDA and Adjusted EBITDA as measures to assess the relative performance of its operating businesses, as well as the employees responsible for operating such businesses. EBITDAR, Adjusted EBITDAR, EBITDA and Adjusted EBITDA are useful in this regard because they do not include such costs as interest expense, income taxes and depreciation and amortization expense which may vary from business unit to business unit depending upon such factors as the method used to finance the original purchase of the business unit or the tax law in the state in which a business unit operates. By excluding such factors when measuring financial performance, many of which are outside of the control of the employees responsible for operating FC-GEN’s business units, management is better able to evaluate the operating performance of the business unit and the employees responsible for business unit performance. Consequently, management uses these non-GAAP measures to determine the extent to which its employees have met performance goals, and therefore may or may not be eligible for incentive compensation awards.
FC-GEN also uses EBITDAR, Adjusted EBITDAR, EBITDA and Adjusted EBITDA in its annual budget process. Management believes these non-GAAP measures facilitate internal comparisons to historical operating performance of prior periods and external comparisons to competitors’ historical operating performance. The presentation of these non-GAAP financial measures is consistent with its past practice and FC-GEN believes these measures further enable investors and analysts to compare current non-GAAP measures with non-GAAP measures presented in prior periods.
Although FC-GEN uses EBITDAR, Adjusted EBITDAR, EBITDA and Adjusted EBITDA as financial measures to assess the performance of its business, the use of these non-GAAP measures is limited because they do not consider certain material costs necessary to operate its business. These costs include FC-GEN’s lease expense (only in the case of EBITDAR and Adjusted EBITDAR), the cost to service its debt, the depreciation and amortization associated with its long-lived assets, losses (gains) on extinguishment of debt, transaction costs, long-lived asset impairment charges, federal
and state income tax expenses, the operating results of its discontinued businesses and the income or loss attributed to non-controlling interests. Because EBITDAR, Adjusted EBITDAR, EBITDA and Adjusted EBITDA do not consider these important elements of its cost structure, a user of FC-GEN’s financial information who relies on EBITDAR, Adjusted EBITDAR, EBITDA or Adjusted EBITDA as the only measures of its performance could draw an incomplete or misleading conclusion regarding FC-GEN’s financial performance. Consequently, a user of FC-GEN’s financial information should consider net income (loss) as an important measure of its financial performance because it provides the most complete measure of its performance.
Other companies may define EBITDAR, Adjusted EBITDAR, EBITDA and Adjusted EBITDA differently and, as a result, FC-GEN’s non-GAAP measures may not be directly comparable to those of other companies. EBITDAR, Adjusted EBITDAR, EBITDA and Adjusted EBITDA do not represent net income (loss), as defined by GAAP. EBITDAR, Adjusted EBITDAR, EBITDA and Adjusted EBITDA should be considered in addition to, not a substitute for, or superior to, GAAP financial measures.
The following tables provide reconciliations to EBITDAR, Adjusted EBITDAR, EBITDA and Adjusted EBITDA from net income (loss) the most directly comparable financial measure presented in accordance with GAAP:
FC-GEN OPERATIONS INVESTMENT, LLC
RECONCILIATION OF NET (LOSS) INCOME TO EBITDA, EBITDAR, ADJUSTED EBITDA AND ADJUSTED EBITDAR
(UNAUDITED)
(IN THOUSANDS)
|
|
|
|
|
Adjustments |
|
|
|
|
| ||||||||||
|
|
|
As reported |
|
|
|
Newly acquired |
|
|
|
|
|
As adjusted |
| ||||||
|
|
|
Year ended |
|
Conversion to |
|
businesses with |
|
Other |
|
Total |
|
Year ended |
| ||||||
|
|
|
(in thousands) |
| ||||||||||||||||
|
Net revenues |
|
$ |
4,768,080 |
|
$ |
— |
|
$ |
(18,526 |
) |
$ |
4,260 |
|
$ |
(14,266 |
) |
$ |
4,753,814 |
|
|
Salaries, wages and benefits |
|
3,006,914 |
|
— |
|
(16,233 |
) |
(2,579 |
) |
(18,812 |
) |
2,988,102 |
| ||||||
|
Other operating expenses |
|
1,231,612 |
|
— |
|
(8,372 |
) |
(44,361 |
) |
(52,733 |
) |
1,178,879 |
| ||||||
|
Lease expense |
|
131,898 |
|
320,306 |
|
(3,005 |
) |
— |
|
317,301 |
|
449,199 |
| ||||||
|
Depreciation and amortization expense |
|
193,675 |
|
(132,326 |
) |
(434 |
) |
— |
|
(132,760 |
) |
60,915 |
| ||||||
|
Interest expense |
|
442,724 |
|
(391,962 |
) |
— |
|
— |
|
(391,962 |
) |
50,762 |
| ||||||
|
Loss (gain) on extinguishment of debt |
|
1,133 |
|
— |
|
— |
|
(1,133 |
) |
(1,133 |
) |
— |
| ||||||
|
Other (income) loss |
|
(138 |
) |
— |
|
— |
|
138 |
|
138 |
|
— |
| ||||||
|
Investment income |
|
(3,399 |
) |
— |
|
— |
|
— |
|
— |
|
(3,399 |
) | ||||||
|
Transaction costs |
|
13,353 |
|
— |
|
— |
|
(13,353 |
) |
(13,353 |
) |
— |
| ||||||
|
Long-lived asset impairment |
|
31,399 |
|
— |
|
— |
|
(31,399 |
) |
(31,399 |
) |
— |
| ||||||
|
Equity in net income of unconsolidated affiliates |
|
416 |
|
— |
|
— |
|
— |
|
— |
|
416 |
| ||||||
|
Income tax (benefit) expense |
|
(44,022 |
) |
31,697 |
|
1,479 |
|
15,065 |
|
48,241 |
|
4,219 |
| ||||||
|
|
|
|
|
|
|
|
|
|
|
|
|
|
| ||||||
|
(Loss) income from continuing operations |
|
$ |
(237,485 |
) |
$ |
172,285 |
|
$ |
8,039 |
|
$ |
81,882 |
|
$ |
262,206 |
|
$ |
24,721 |
|
|
Loss (income) from discontinued operations, net of taxes |
|
14,044 |
|
(2,041 |
) |
— |
|
— |
|
(2,041 |
) |
12,003 |
| ||||||
|
Net income attributable to noncontrolling interests |
|
2,456 |
|
— |
|
— |
|
— |
|
— |
|
2,456 |
| ||||||
|
Net (loss) income attributable to FC-GEN Operations Investment, LLC |
|
$ |
(253,985 |
) |
$ |
174,326 |
|
$ |
8,039 |
|
$ |
81,882 |
|
$ |
264,247 |
|
$ |
10,262 |
|
|
|
|
|
|
|
|
|
|
|
|
|
|
|
| ||||||
|
Depreciation and amortization expense |
|
193,675 |
|
(132,326 |
) |
(434 |
) |
— |
|
(132,760 |
) |
60,915 |
| ||||||
|
Interest expense |
|
442,724 |
|
(391,962 |
) |
— |
|
— |
|
(391,962 |
) |
50,762 |
| ||||||
|
Loss (gain) on extinguishment of debt |
|
1,133 |
|
— |
|
— |
|
(1,133 |
) |
(1,133 |
) |
— |
| ||||||
|
Other (income) loss |
|
(138 |
) |
— |
|
— |
|
138 |
|
138 |
|
— |
| ||||||
|
Transaction costs |
|
13,353 |
|
— |
|
— |
|
(13,353 |
) |
(13,353 |
) |
— |
| ||||||
|
Long-lived asset impairment |
|
31,399 |
|
— |
|
— |
|
(31,399 |
) |
(31,399 |
) |
— |
| ||||||
|
Income tax (benefit) expense |
|
(44,022 |
) |
31,697 |
|
1,479 |
|
15,065 |
|
48,241 |
|
4,219 |
| ||||||
|
Loss (income) from discontinued operations, net of taxes |
|
14,044 |
|
(2,041 |
) |
— |
|
— |
|
(2,041 |
) |
12,003 |
| ||||||
|
Net income attributable to noncontrolling interests |
|
2,456 |
|
— |
|
— |
|
— |
|
— |
|
2,456 |
| ||||||
|
EBITDA / Adjusted EBITDA |
|
$ |
400,639 |
|
$ |
(320,306 |
) |
$ |
9,084 |
|
$ |
51,200 |
|
$ |
(260,022 |
) |
$ |
140,617 |
|
|
Lease expense |
|
131,898 |
|
320,306 |
|
(3,005 |
) |
— |
|
317,301 |
|
449,199 |
| ||||||
|
EBITDAR / Adjusted EBITDAR |
|
$ |
532,537 |
|
$ |
— |
|
$ |
6,079 |
|
$ |
51,200 |
|
$ |
57,279 |
|
$ |
589,816 |
|
|
|
|
|
|
Adjustments |
|
|
|
|
| ||||||||||
|
|
|
As reported |
|
|
|
Newly acquired |
|
|
|
|
|
As adjusted |
| ||||||
|
|
|
Year ended |
|
Conversion to |
|
businesses with |
|
Other |
|
Total |
|
Year ended |
| ||||||
|
|
|
(in thousands) |
| ||||||||||||||||
|
Net revenues |
|
$ |
4,710,341 |
|
$ |
— |
|
$ |
(21,131 |
) |
$ |
— |
|
$ |
(21,131 |
) |
$ |
4,689,210 |
|
|
Salaries, wages and benefits |
|
2,998,658 |
|
— |
|
(12,263 |
) |
(1,616 |
) |
(13,879 |
) |
2,984,779 |
| ||||||
|
Other operating expenses |
|
1,130,605 |
|
— |
|
(8,824 |
) |
(3,564 |
) |
(12,388 |
) |
1,118,217 |
| ||||||
|
Lease expense |
|
131,231 |
|
303,328 |
|
(4,450 |
) |
— |
|
298,878 |
|
430,109 |
| ||||||
|
Depreciation and amortization expense |
|
188,726 |
|
(131,839 |
) |
(247 |
) |
— |
|
(132,086 |
) |
56,640 |
| ||||||
|
Interest expense |
|
426,975 |
|
(377,556 |
) |
— |
|
— |
|
(377,556 |
) |
49,419 |
| ||||||
|
Loss (gain) on extinguishment of debt |
|
63 |
|
— |
|
— |
|
(63 |
) |
(63 |
) |
— |
| ||||||
|
Other (income) loss |
|
450 |
|
— |
|
— |
|
(450 |
) |
(450 |
) |
— |
| ||||||
|
Investment income |
|
(4,150 |
) |
— |
|
— |
|
— |
|
— |
|
(4,150 |
) | ||||||
|
Transaction costs |
|
5,878 |
|
— |
|
— |
|
(5,878 |
) |
(5,878 |
) |
— |
| ||||||
|
Long-lived asset impairment |
|
9,999 |
|
— |
|
— |
|
(9,999 |
) |
(9,999 |
) |
— |
| ||||||
|
Equity in net income of unconsolidated affiliates |
|
691 |
|
— |
|
— |
|
— |
|
— |
|
691 |
| ||||||
|
Income tax (benefit) expense |
|
(9,179 |
) |
32,021 |
|
723 |
|
3,352 |
|
36,096 |
|
26,917 |
| ||||||
|
|
|
|
|
|
|
|
|
|
|
|
|
|
| ||||||
|
(Loss) income from continuing operations |
|
$ |
(169,606 |
) |
$ |
174,046 |
|
$ |
3,930 |
|
$ |
18,218 |
|
$ |
196,194 |
|
$ |
26,588 |
|
|
Loss (income) from discontinued operations, net of taxes |
|
7,364 |
|
(57 |
) |
— |
|
— |
|
(57 |
) |
7,307 |
| ||||||
|
Net income attributable to noncontrolling interests |
|
1,025 |
|
— |
|
— |
|
— |
|
— |
|
1,025 |
| ||||||
|
Net (loss) income attributable to FC-GEN Operations Investment, LLC |
|
$ |
(177,995 |
) |
$ |
174,103 |
|
$ |
3,930 |
|
$ |
18,218 |
|
$ |
196,251 |
|
$ |
18,256 |
|
|
|
|
|
|
|
|
|
|
|
|
|
|
|
| ||||||
|
Depreciation and amortization expense |
|
188,726 |
|
(131,839 |
) |
(247 |
) |
— |
|
(132,086 |
) |
56,640 |
| ||||||
|
Interest expense |
|
426,975 |
|
(377,556 |
) |
— |
|
— |
|
(377,556 |
) |
49,419 |
| ||||||
|
Loss (gain) on extinguishment of debt |
|
63 |
|
— |
|
— |
|
(63 |
) |
(63 |
) |
— |
| ||||||
|
Other (income) loss |
|
450 |
|
— |
|
— |
|
(450 |
) |
(450 |
) |
— |
| ||||||
|
Transaction costs |
|
5,878 |
|
— |
|
— |
|
(5,878 |
) |
(5,878 |
) |
— |
| ||||||
|
Long-lived asset impairment |
|
9,999 |
|
— |
|
— |
|
(9,999 |
) |
(9,999 |
) |
— |
| ||||||
|
Income tax (benefit) expense |
|
(9,179 |
) |
32,021 |
|
723 |
|
3,352 |
|
36,096 |
|
26,917 |
| ||||||
|
Loss (income) from discontinued operations, net of taxes |
|
7,364 |
|
(57 |
) |
— |
|
— |
|
(57 |
) |
7,307 |
| ||||||
|
Net income attributable to noncontrolling interests |
|
1,025 |
|
— |
|
— |
|
— |
|
— |
|
1,025 |
| ||||||
|
EBITDA / Adjusted EBITDA |
|
$ |
453,306 |
|
$ |
(303,328 |
) |
$ |
4,406 |
|
$ |
5,180 |
|
$ |
(293,742 |
) |
$ |
159,564 |
|
|
Lease expense |
|
131,231 |
|
303,328 |
|
(4,450 |
) |
— |
|
298,878 |
|
430,109 |
| ||||||
|
EBITDAR / Adjusted EBITDAR |
|
$ |
584,537 |
|
$ |
— |
|
$ |
(44 |
) |
$ |
5,180 |
|
$ |
5,136 |
|
$ |
589,673 |
|
|
|
|
|
|
Adjustments |
|
|
|
|
| ||||||||||
|
|
|
As reported |
|
|
|
Newly acquired |
|
|
|
|
|
As adjusted |
| ||||||
|
|
|
Year ended |
|
Conversion to |
|
businesses with |
|
Other |
|
Total |
|
Year ended |
| ||||||
|
|
|
(in thousands) |
| ||||||||||||||||
|
Net revenues |
|
$ |
3,076,298 |
|
$ |
— |
|
$ |
— |
|
$ |
— |
|
$ |
— |
|
$ |
3,076,298 |
|
|
Salaries, wages and benefits |
|
2,016,559 |
|
— |
|
(623 |
) |
(3,968 |
) |
(4,591 |
) |
2,011,968 |
| ||||||
|
Other operating expenses |
|
714,057 |
|
— |
|
(182 |
) |
(5,641 |
) |
(5,823 |
) |
708,234 |
| ||||||
|
Lease expense |
|
35,367 |
|
235,947 |
|
(217 |
) |
— |
|
235,730 |
|
271,097 |
| ||||||
|
Depreciation and amortization expense |
|
146,387 |
|
(114,033 |
) |
— |
|
— |
|
(114,033 |
) |
32,354 |
| ||||||
|
Interest expense |
|
323,641 |
|
(301,116 |
) |
— |
|
— |
|
(301,116 |
) |
22,525 |
| ||||||
|
Loss (gain) on extinguishment of debt |
|
(1,777 |
) |
— |
|
— |
|
1,777 |
|
1,777 |
|
— |
| ||||||
|
Other (income) loss |
|
(849 |
) |
— |
|
— |
|
849 |
|
849 |
|
— |
| ||||||
|
Investment income |
|
(3,782 |
) |
— |
|
— |
|
— |
|
— |
|
(3,782 |
) | ||||||
|
Transaction costs |
|
29,755 |
|
— |
|
— |
|
(29,755 |
) |
(29,755 |
) |
— |
| ||||||
|
Equity in net income of unconsolidated affiliates |
|
(515 |
) |
— |
|
— |
|
— |
|
— |
|
(515 |
) | ||||||
|
Income tax (benefit) expense |
|
(11,633 |
) |
27,846 |
|
159 |
|
5,709 |
|
33,714 |
|
22,081 |
| ||||||
|
(Loss) income from continuing operations |
|
(170,912 |
) |
151,356 |
|
863 |
|
31,029 |
|
183,248 |
|
12,336 |
| ||||||
|
Loss (income) from discontinued operations, net of taxes |
|
810 |
|
— |
|
— |
|
— |
|
— |
|
810 |
| ||||||
|
Net loss attributable to noncontrolling interests |
|
(448 |
) |
— |
|
— |
|
— |
|
— |
|
(448 |
) | ||||||
|
|
|
|
|
|
|
|
|
|
|
|
|
|
| ||||||
|
Net (loss) income attributable to FC-GEN Operations Investment, LLC |
|
$ |
(171,274 |
) |
$ |
151,356 |
|
$ |
863 |
|
$ |
31,029 |
|
$ |
183,248 |
|
$ |
11,974 |
|
|
Depreciation and amortization expense |
|
146,387 |
|
(114,033 |
) |
— |
|
— |
|
(114,033 |
) |
32,354 |
| ||||||
|
Interest expense |
|
323,641 |
|
(301,116 |
) |
— |
|
— |
|
(301,116 |
) |
22,525 |
| ||||||
|
Loss (gain) on extinguishment of debt |
|
(1,777 |
) |
— |
|
— |
|
1,777 |
|
1,777 |
|
— |
| ||||||
|
Other (income) loss |
|
(849 |
) |
— |
|
— |
|
849 |
|
849 |
|
— |
| ||||||
|
Transaction costs |
|
29,755 |
|
— |
|
— |
|
(29,755 |
) |
(29,755 |
) |
— |
| ||||||
|
Income tax (benefit) expense |
|
(11,633 |
) |
27,846 |
|
159 |
|
5,709 |
|
33,714 |
|
22,081 |
| ||||||
|
Loss (income) from discontinued operations, net of taxes |
|
810 |
|
— |
|
— |
|
— |
|
— |
|
810 |
| ||||||
|
Net income attributable to noncontrolling interests |
|
(448 |
) |
— |
|
— |
|
— |
|
— |
|
(448 |
) | ||||||
|
EBITDA / Adjusted EBITDA |
|
$ |
314,612 |
|
$ |
(235,947 |
) |
$ |
1,022 |
|
$ |
9,609 |
|
$ |
(225,316 |
) |
$ |
89,296 |
|
|
Lease expense |
|
35,367 |
|
235,947 |
|
(217 |
) |
— |
|
235,730 |
|
271,097 |
| ||||||
|
EBITDAR / Adjusted EBITDAR |
|
$ |
349,979 |
|
$ |
— |
|
$ |
805 |
|
$ |
9,609 |
|
$ |
10,414 |
|
$ |
360,393 |
|
(a) FC-GEN’s leases are classified as either operating leases, capital leases or financing obligations pursuant to applicable guidance under U.S. GAAP. It views the primary provisions and economics of these leases, regardless of their accounting treatment, as being nearly identical. Virtually all of FC-GEN’s leases are structured with triple net terms, have fixed annual rent escalators and have long-term initial maturities with renewal options. Accordingly, in connection with its evaluation of the financial performance of the Company, FC-GEN reclassifies all of its leases to operating lease treatment and reflects lease expense on a cash basis. This approach allows management to better understand the relationship in each reporting period of its operating performance, as measured by EBITDAR and Adjusted EBITDAR, to the cash basis obligations to its landlords in that reporting period, regardless of the lease accounting treatment. This presentation and approach is also consistent with the financial reporting and covenant compliance requirements contained in all of its major lease and loan agreements. The following table summarizes the reclassification adjustments necessary to present all leases as operating leases on a cash basis.
|
|
|
Years ended December 31, |
| |||||||
|
|
|
2014 |
|
2013 |
|
2012 |
| |||
|
|
|
(in thousands) |
| |||||||
|
Lease expense: |
|
|
|
|
|
|
| |||
|
Cash rent - capital leases |
|
$ |
89,683 |
|
$ |
88,549 |
|
$ |
31,920 |
|
|
Cash rent - financing obligations |
|
242,918 |
|
229,452 |
|
216,489 |
| |||
|
Non-cash - operating lease arrangements |
|
(12,295 |
) |
(14,673 |
) |
(12,462 |
) | |||
|
Lease expense adjustments |
|
$ |
320,306 |
|
$ |
303,328 |
|
$ |
235,947 |
|
|
|
|
|
|
|
|
|
| |||
|
Depreciation and amortization expense: |
|
|
|
|
|
|
| |||
|
Captial lease accounting |
|
$ |
(35,385 |
) |
$ |
(35,116 |
) |
$ |
(11,988 |
) |
|
Financing obligation accounting |
|
(96,941 |
) |
(96,723 |
) |
(102,045 |
) | |||
|
Depreciation and amortization expense adjustments |
|
$ |
(132,326 |
) |
$ |
(131,839 |
) |
$ |
(114,033 |
) |
|
|
|
|
|
|
|
|
| |||
|
Interest expense: |
|
|
|
|
|
|
| |||
|
Captial lease accounting |
|
$ |
(100,846 |
) |
$ |
(98,870 |
) |
$ |
(31,540 |
) |
|
Financing obligation accounting |
|
(291,116 |
) |
(278,686 |
) |
(269,576 |
) | |||
|
Interest expense adjustments |
|
$ |
(391,962 |
) |
$ |
(377,556 |
) |
$ |
(301,116 |
) |
|
Total pre-tax lease accounting adjustments |
|
$ |
(203,982 |
) |
$ |
(206,067 |
) |
$ |
(179,202 |
) |
(b) The acquisition and construction of new businesses has become an important element of FC-GEN’s growth strategy. Many of the businesses it acquires have a history of operating losses and continue to generate operating losses in the months that follow their acquisition. Newly constructed or developed businesses also generate losses while in their start-up phase. FC-GEN views these losses as both a temporary and an expected component of our long-term investment in the new venture. FC-GEN adjusts these losses when computing Adjusted EBITDAR and Adjusted EBITDA in order to better evaluate the performance of its core business. The activities of such businesses are adjusted when computing Adjusted EBITDAR and Adjusted EBITDA until such time as a new business generates positive Adjusted EBITDA. The operating performance of new businesses are no longer adjusted when computing Adjusted EBITDAR and Adjusted EBITDA beginning the period in which a new business generates positive Adjusted EBITDA and all periods thereafter. There were seven, six and two acquired or newly constructed businesses eliminated from FC-GEN’s reported results when computing adjusted results for the years ended December 31, 2014, 2013 and 2012, respectively.
(c) Other adjustments represent costs or gains associated with transactions or events that FC-GEN does not believe are reflective of its core recurring operating business. The following items were realized in the periods presented:
|
|
|
Years ended December 31, |
| |||||||
|
|
|
2014 |
|
2013 |
|
2012 |
| |||
|
|
|
(in thousands) |
| |||||||
|
Severance and restructuring (1) |
|
$ |
8,975 |
|
$ |
3,254 |
|
$ |
6,257 |
|
|
Regulatory defense and related costs (2) |
|
5,085 |
|
310 |
|
2,054 |
| |||
|
New business development costs (3) |
|
1,641 |
|
— |
|
— |
| |||
|
New contract obligation assumption (4) |
|
— |
|
1,616 |
|
1,298 |
| |||
|
Prior period GLPL insurance adjustment (5) |
|
35,499 |
|
— |
|
— |
| |||
|
Transaction costs (6) |
|
13,353 |
|
5,878 |
|
29,755 |
| |||
|
Long-lived asset impairments (7) |
|
31,399 |
|
9,999 |
|
— |
| |||
|
Loss (gain) on early extinguishment of debt |
|
1,133 |
|
63 |
|
(1,777 |
) | |||
|
Other loss (income) |
|
(138 |
) |
450 |
|
(849 |
) | |||
|
Tax benefit from total adjustments |
|
(15,065 |
) |
(3,352 |
) |
— |
| |||
|
Total other adjustments |
|
$ |
81,882 |
|
$ |
18,218 |
|
$ |
36,738 |
|
(1) FC-GEN incurred costs related to the termination, severance and restructuring of certain components of its business.
(2) FC-GEN incurred legal defense and other related costs in connection with certain matters in dispute or under appeal with regulatory agencies.
(3) FC-GEN incurred business development costs in connection with the evaluation and start-up of services outside its existing service offerings.
(4) FC-GEN incurred a paid time off obligation upon assumption of two significant rehabilitation therapy contracts.
(5) FC-GEN incurred a cumulative GLPL insurance adjustment for the development of prior period claims associated with the acquisition of Sun Healthcare Group, Inc.
(6) FC-GEN incurred costs associated with transactions including the acquisition of Sun Healthcare Group, Inc., the combination with Skilled Healthcare Group, Inc. and other transactions.
(7) FC-GEN incurred non-cash charges in connection with its annual long-lived impairment testing.
Results of Operations
A summary of FC-GEN’s results of operations follows:
|
|
|
For the year ended |
|
|
|
|
|
|
|
|
| |||||||||||||||
|
|
|
2014 |
|
2013 |
|
2012 |
|
2014 vs 2013 |
|
2013 vs 2012 |
| |||||||||||||||
|
|
|
Revenue |
|
Revenue |
|
Revenue |
|
Revenue |
|
Revenue |
|
Revenue |
|
Increase / (Decrease) |
|
Increase / (Decrease) |
| |||||||||
|
|
|
Dollars |
|
Percentage |
|
Dollars |
|
Percentage |
|
Dollars |
|
Percentage |
|
Dollars |
|
Percentage |
|
Dollars |
|
Percentage |
| |||||
|
|
|
(in thousands, except percentatges) |
| |||||||||||||||||||||||
|
Inpatient services: |
|
|
|
|
|
|
|
|
|
|
|
|
|
|
|
|
|
|
|
|
| |||||
|
Skilled Nursing facilities |
|
$ |
3,924,571 |
|
82.3 |
% |
$ |
3,847,858 |
|
81.7 |
% |
$ |
2,467,427 |
|
80.2 |
% |
$ |
76,713 |
|
2.0 |
% |
$ |
1,380,431 |
|
55.9 |
% |
|
Assisted living facilities |
|
107,034 |
|
2.2 |
% |
113,960 |
|
2.4 |
% |
77,335 |
|
2.5 |
% |
(6,926 |
) |
-6.1 |
% |
36,625 |
|
47.4 |
% | |||||
|
Administration of third party facilities |
|
10,297 |
|
0.2 |
% |
11,006 |
|
0.2 |
% |
10,743 |
|
0.3 |
% |
(709 |
) |
-6.4 |
% |
263 |
|
2.4 |
% | |||||
|
Elimination of administrative services |
|
(2,089 |
) |
0.0 |
% |
(2,147 |
) |
0.0 |
% |
(1,896 |
) |
-0.1 |
% |
58 |
|
-2.7 |
% |
(251 |
) |
13.3 |
% | |||||
|
Inpatient services, net |
|
4,039,813 |
|
84.7 |
% |
3,970,677 |
|
84.3 |
% |
2,553,609 |
|
83.0 |
% |
69,136 |
|
1.7 |
% |
1,417,068 |
|
55.5 |
% | |||||
|
|
|
|
|
|
|
|
|
|
|
|
|
|
|
|
|
|
|
|
|
|
| |||||
|
Rehabilitation therapy services: |
|
|
|
|
|
|
|
|
|
|
|
|
|
|
|
|
|
|
|
|
| |||||
|
Total therapy services |
|
990,081 |
|
20.8 |
% |
993,459 |
|
21.1 |
% |
732,805 |
|
23.8 |
% |
(3,378 |
) |
-0.3 |
% |
260,654 |
|
35.6 |
% | |||||
|
Elimination intersegment rehabilitation therapy services |
|
(385,721 |
) |
-8.1 |
% |
(375,175 |
) |
-8.0 |
% |
(248,918 |
) |
-8.1 |
% |
(10,546 |
) |
2.8 |
% |
(126,257 |
) |
50.7 |
% | |||||
|
Third party rehabilitation therapy services |
|
604,360 |
|
12.7 |
% |
618,284 |
|
13.1 |
% |
483,887 |
|
15.7 |
% |
(13,924 |
) |
-2.3 |
% |
134,397 |
|
27.8 |
% | |||||
|
|
|
|
|
|
|
|
|
|
|
|
|
|
|
|
|
|
|
|
|
|
| |||||
|
Other services: |
|
|
|
|
|
|
|
|
|
|
|
|
|
|
|
|
|
|
|
|
| |||||
|
Total other services |
|
154,011 |
|
3.2 |
% |
141,712 |
|
3.0 |
% |
53,713 |
|
1.7 |
% |
12,299 |
|
8.7 |
% |
87,999 |
|
163.8 |
% | |||||
|
Elimination intersegment other services |
|
(30,104 |
) |
-0.6 |
% |
(20,332 |
) |
-0.4 |
% |
(14,911 |
) |
-0.5 |
% |
(9,772 |
) |
48.1 |
% |
(5,421 |
) |
36.4 |
% | |||||
|
Third party other services |
|
123,907 |
|
2.6 |
% |
121,380 |
|
2.6 |
% |
38,802 |
|
1.3 |
% |
2,527 |
|
2.1 |
% |
82,578 |
|
212.8 |
% | |||||
|
Total revenue |
|
$ |
4,768,080 |
|
100.0 |
% |
$ |
4,710,341 |
|
100.0 |
% |
$ |
3,076,298 |
|
100.0 |
% |
$ |
57,740 |
|
1.2 |
% |
$ |
1,634,043 |
|
53.1 |
% |
|
|
|
For the year ended |
|
|
|
|
| |||||||||||||||||||
|
|
|
2014 |
|
2013 |
|
2012 |
|
2014 vs 2013 |
|
2013 vs 2012 |
| |||||||||||||||
|
|
|
|
|
Margin |
|
|
|
Margin |
|
|
|
Margin |
|
Increase / (Decrease) |
|
Increase / (Decrease) |
| |||||||||
|
|
|
Dollars |
|
Percentage |
|
Dollars |
|
Percentage |
|
Dollars |
|
Percentage |
|
Dollars |
|
Percentage |
|
Dollars |
|
Percentage |
| |||||
|
|
|
(in thousands, except percentatges) |
| |||||||||||||||||||||||
|
EBITDAR: |
|
|
|
|
|
|
|
|
|
|
|
|
|
|
|
|
|
|
|
|
| |||||
|
Inpatient services |
|
$ |
585,807 |
|
14.5 |
% |
$ |
656,227 |
|
16.5 |
% |
$ |
426,450 |
|
16.7 |
% |
$ |
(70,420 |
) |
-10.7 |
% |
$ |
229,777 |
|
53.9 |
% |
|
Rehabilitation therapy services |
|
94,405 |
|
9.5 |
% |
77,790 |
|
7.8 |
% |
29,353 |
|
4.0 |
% |
16,615 |
|
21.4 |
% |
48,437 |
|
165.0 |
% | |||||
|
Other services |
|
(467 |
) |
-0.3 |
% |
5,114 |
|
3.6 |
% |
2,359 |
|
4.4 |
% |
(5,581 |
) |
-109.1 |
% |
2,755 |
|
116.8 |
% | |||||
|
Corporate and eliminations |
|
(147,208 |
) |
— |
|
(154,594 |
) |
— |
|
(108,183 |
) |
— |
|
7,386 |
|
-4.8 |
% |
(46,411 |
) |
42.9 |
% | |||||
|
EBITDAR |
|
$ |
532,537 |
|
11.2 |
% |
$ |
584,537 |
|
12.4 |
% |
$ |
349,979 |
|
11.4 |
% |
$ |
(52,000 |
) |
-8.9 |
% |
$ |
234,558 |
|
67.0 |
% |
A summary of FC-GEN’s condensed consolidating statement of operations follows:
|
|
|
Year ended December 31, 2014 |
| ||||||||||||||||
|
|
|
Inpatient |
|
Rehabilitation |
|
Other Services |
|
Corporate |
|
Eliminations |
|
Consolidated |
| ||||||
|
|
|
(In thousands) |
| ||||||||||||||||
|
|
|
|
| ||||||||||||||||
|
Net revenues |
|
$ |
4,041,902 |
|
$ |
990,081 |
|
$ |
153,397 |
|
$ |
614 |
|
$ |
(417,914 |
) |
$ |
4,768,080 |
|
|
Salaries, wages and benefits |
|
1,987,550 |
|
817,144 |
|
99,400 |
|
102,820 |
|
— |
|
3,006,914 |
| ||||||
|
Other operating expenses |
|
1,472,321 |
|
78,532 |
|
54,464 |
|
44,210 |
|
(417,915 |
) |
1,231,612 |
| ||||||
|
Lease expense |
|
130,005 |
|
176 |
|
821 |
|
896 |
|
— |
|
131,898 |
| ||||||
|
Depreciation and amortization expense |
|
165,105 |
|
11,055 |
|
917 |
|
16,598 |
|
— |
|
193,675 |
| ||||||
|
Interest expense |
|
393,521 |
|
4 |
|
19 |
|
49,678 |
|
(498 |
) |
442,724 |
| ||||||
|
Loss on extinguishment of debt |
|
— |
|
— |
|
— |
|
1,133 |
|
— |
|
1,133 |
| ||||||
|
Investment income |
|
(2,492 |
) |
— |
|
— |
|
(1,405 |
) |
498 |
|
(3,399 |
) | ||||||
|
Other income |
|
(47 |
) |
— |
|
(91 |
) |
— |
|
— |
|
(138 |
) | ||||||
|
Transaction costs |
|
— |
|
— |
|
— |
|
13,353 |
|
— |
|
13,353 |
| ||||||
|
Long-lived asset impairment |
|
31,399 |
|
— |
|
— |
|
— |
|
— |
|
31,399 |
| ||||||
|
Equity in net (income) loss of unconsolidated affiliates |
|
(1,284 |
) |
— |
|
— |
|
— |
|
1,700 |
|
416 |
| ||||||
|
(Loss) income before income tax benefit |
|
(134,176 |
) |
83,170 |
|
(2,133 |
) |
(226,669 |
) |
(1,699 |
) |
(281,507 |
) | ||||||
|
Income tax benefit |
|
— |
|
— |
|
— |
|
(44,022 |
) |
— |
|
(44,022 |
) | ||||||
|
(Loss) income from continuing operations |
|
$ |
(134,176 |
) |
$ |
83,170 |
|
$ |
(2,133 |
) |
$ |
(182,647 |
) |
$ |
(1,699 |
) |
$ |
(237,485 |
) |
|
|
|
Year Ended December 31, 2013 |
| ||||||||||||||||
|
|
|
Inpatient |
|
Rehabilitation |
|
Other Services |
|
Corporate |
|
Eliminations |
|
Consolidated |
| ||||||
|
|
|
(In thousands) |
| ||||||||||||||||
|
|
|
|
|
|
|
|
|
|
|
|
|
|
| ||||||
|
Net revenues |
|
$ |
3,972,823 |
|
$ |
993,459 |
|
$ |
141,712 |
|
$ |
— |
|
$ |
(397,653 |
) |
$ |
4,710,341 |
|
|
Salaries, wages and benefits |
|
1,977,111 |
|
828,406 |
|
93,342 |
|
99,799 |
|
— |
|
2,998,658 |
| ||||||
|
Other operating expenses |
|
1,344,983 |
|
87,263 |
|
43,256 |
|
52,756 |
|
(397,653 |
) |
1,130,605 |
| ||||||
|
Lease expense |
|
129,296 |
|
198 |
|
843 |
|
894 |
|
— |
|
131,231 |
| ||||||
|
Depreciation and amortization expense |
|
160,954 |
|
10,607 |
|
1,027 |
|
16,138 |
|
— |
|
188,726 |
| ||||||
|
Interest expense |
|
378,461 |
|
10 |
|
525 |
|
48,515 |
|
(536 |
) |
426,975 |
| ||||||
|
Loss on extinguishment of debt |
|
63 |
|
— |
|
— |
|
— |
|
— |
|
63 |
| ||||||
|
Investment income |
|
(3,431 |
) |
— |
|
— |
|
(1,255 |
) |
536 |
|
(4,150 |
) | ||||||
|
Other loss |
|
— |
|
346 |
|
— |
|
104 |
|
— |
|
450 |
| ||||||
|
Transaction costs |
|
— |
|
— |
|
— |
|
5,878 |
|
— |
|
5,878 |
| ||||||
|
Long-lived asset impairment |
|
9,999 |
|
— |
|
— |
|
— |
|
— |
|
9,999 |
| ||||||
|
Equity in net (income) loss of unconsolidated affiliates |
|
(2,067 |
) |
— |
|
— |
|
1,066 |
|
1,692 |
|
691 |
| ||||||
|
(Loss) income before income tax benefit |
|
(22,546 |
) |
66,629 |
|
2,719 |
|
(223,895 |
) |
(1,692 |
) |
(178,785 |
) | ||||||
|
Income tax benefit |
|
— |
|
— |
|
— |
|
(9,179 |
) |
— |
|
(9,179 |
) | ||||||
|
(Loss) income from continuing operations |
|
$ |
(22,546 |
) |
$ |
66,629 |
|
$ |
2,719 |
|
$ |
(214,716 |
) |
$ |
(1,692 |
) |
$ |
(169,606 |
) |
|
|
|
Year Ended December 31, 2012 |
| ||||||||||||||||
|
|
|
Inpatient |
|
Rehabilitation |
|
Other Services |
|
Corporate |
|
Eliminations |
|
Consolidated |
| ||||||
|
|
|
(In thousands) |
| ||||||||||||||||
|
|
|
|
|
|
|
|
|
|
|
|
|
|
| ||||||
|
Net revenues |
|
$ |
2,555,505 |
|
$ |
732,805 |
|
$ |
53,713 |
|
$ |
— |
|
$ |
(265,725 |
) |
$ |
3,076,298 |
|
|
Salaries, wages and benefits |
|
1,316,333 |
|
600,293 |
|
29,759 |
|
70,174 |
|
— |
|
2,016,559 |
| ||||||
|
Other operating expenses |
|
817,205 |
|
103,159 |
|
21,595 |
|
37,823 |
|
(265,725 |
) |
714,057 |
| ||||||
|
Lease expense |
|
34,971 |
|
261 |
|
23 |
|
112 |
|
— |
|
35,367 |
| ||||||
|
Depreciation and amortization expense |
|
124,782 |
|
6,869 |
|
86 |
|
14,650 |
|
— |
|
146,387 |
| ||||||
|
Interest expense |
|
307,262 |
|
— |
|
12 |
|
16,370 |
|
(3 |
) |
323,641 |
| ||||||
|
Gain on extinguishment of debt |
|
(1,777 |
) |
— |
|
— |
|
— |
|
— |
|
(1,777 |
) | ||||||
|
Investment income |
|
(2,956 |
) |
— |
|
— |
|
(829 |
) |
3 |
|
(3,782 |
) | ||||||
|
Other income |
|
— |
|
— |
|
— |
|
(849 |
) |
— |
|
(849 |
) | ||||||
|
Transaction costs |
|
— |
|
— |
|
— |
|
29,755 |
|
— |
|
29,755 |
| ||||||
|
Equity in net (income) loss of unconsolidated affiliates |
|
(1,527 |
) |
— |
|
— |
|
(339 |
) |
1,351 |
|
(515 |
) | ||||||
|
(Loss) income before income tax benefit |
|
(38,788 |
) |
22,223 |
|
2,238 |
|
(166,867 |
) |
(1,351 |
) |
(182,545 |
) | ||||||
|
Income tax benefit |
|
— |
|
— |
|
— |
|
(11,633 |
) |
— |
|
(11,633 |
) | ||||||
|
(Loss) income from continuing operations |
|
$ |
(38,788 |
) |
$ |
22,223 |
|
$ |
2,238 |
|
$ |
(155,234 |
) |
$ |
(1,351 |
) |
$ |
(170,912 |
) |
Year Ended December 31, 2014 Compared to Year Ended December 31, 2013
Inpatient Services
Inpatient services revenue increased $69.1 million, or 1.7%, in the year ended December 31, 2014 as compared with the same period in 2013. Of this growth, $47.3 million is due to newly acquired or constructed centers. The remaining increase of $21.8 million, or 0.5%, is due to increased payment rates and partially offset by a decline in Skilled Mix.
Inpatient services EBITDAR declined in the year ended December 31, 2014 as compared with the same period in 2013, by $70.4 million, or 10.7%. Of this decline, approximately $55 million resulted from changes in estimates pertaining to our self-insurance programs for general and professional liability exposures and workman’s compensation, resulting in additional expense in the 2014 period. The remaining decline is principally attributable to Medicare reimbursement reductions which began on April 1, 2013 under the Budget Control Act of 2011 (as amended by the Taxpayer Relief Act), and increased operating costs associated with the acquired Sun portfolio.
Rehabilitation Therapy Services
The rehabilitation therapy services segment revenue was relatively flat comparing the year ended December 31, 2014 with the same period in 2013, with rate increases to existing customers and the net addition of new customer contracts, offset by the selective termination of underperforming contracts and Medicare reimbursement reductions which began on April 1, 2013 under the Budget Control Act of 2011 (as amended by the Taxpayer Relief Act). Total external sites served declined period-over-period by 50, or 3.6%.
EBITDAR of the rehabilitation therapy segment increased $16.6 million, or 21.4%. This increase is attributed to a number of initiatives designed to improve the profitability of this segment, including: a reengineered approach to managing therapist labor costs, a reduction in the use of expensive agent therapists, a reduction in the number of employees and the exit of underperforming contracts. Therapist Efficiency improved period over period by 1%, from 67% to 68%.
Other Services— Other services revenue increased $2.5 million, or 2.1% in the year ended December 31, 2014 as compared with the same period in 2013. This increase was principally centered in FC-GEN’s physician services business.
Corporate and Eliminations—Corporate overhead costs declined $7.4 million, or 4.8%, in the year ended December 31, 2014 as compared with the same period in 2013. This decline was largely due to incremental cost synergies realized in connection with the Sun Merger.
Lease expense—Lease expense represents the cash rents and non-cash adjustments required to account for operating leases. FC-GEN has operating leases in each of its reportable segments, other services and corporate overhead, but the inpatient services business incurs the greatest proportion of this expense for those skilled nursing and assisted living facilities accounted for as operating leases. Lease expense was flat in the year ended December 31, 2014 and as compared with the same period in the prior year.
Depreciation and amortization—Each of FC-GEN’s reportable segments, other services and corporate overhead has depreciating property, plant and equipment, including depreciation on leased properties accounted for as capital leases or as a financing obligation. its rehabilitation therapy services and other services have identifiable intangible assets which amortize over the estimated life of those identifiable assets. The $4.9 million increase in depreciation and amortization is primarily attributable to FC-GEN’s ongoing capital expenditure program and newly acquired or constructed facilities.
Interest expense—Interest expense includes the cash interest and non-cash adjustments required to account for FC-GEN’s revolving credit facilities, term loan facilities and mortgage instruments, as well as the expense associated with leases accounted for as capital leases or financing obligations. The $15.7 million increase in interest expense in the year ended December 31, 2014 and as compared to the prior year is primarily attributable to growth in interest pertaining to existing lease obligations and obligations incurred in connection with newly acquired or constructed facilities.
Transaction costs— In the normal course of business, FC-GEN evaluates strategic acquisition, disposition and business development opportunities. The costs to pursue these opportunities, when incurred, vary from period to period depending on the nature of the transaction pursued and if those transactions are ever completed. Transaction costs incurred for the years ended December 31, 2014 and 2013 were $13.4 million and $5.9 million, respectively.
Income tax benefit— For the year ended December 31, 2014, FC-GEN recorded income tax benefit of $44.0 million on pretax loss of $281.5 million. For the same period in 2013, it recorded income tax benefit of $9.2 million on pretax loss of $178.8 million. For the years ended December 31, 2014 and 2013, the overall effective tax rate was different than the statutory rate of 35% primarily due to the allocation to certain members of their respective share of taxable income or loss not subject to corporate income tax.
Year Ended December 31, 2013 Compared to Year Ended December 31, 2012
Sun Merger—Sun was acquired effective December 1, 2012. Consequently, the results of operations for the year ended December 31, 2013 and the month of December 2012 for the former Sun businesses are included in the Consolidated Statements of Operations for the years ended December 31, 2013 and December 31, 2012, respectively. To facilitate year-over-year analysis, such amounts are identified as resulting from the Sun Merger with remaining analysis referencing operational results exclusive of the Sun Merger.
Inpatient Services
Inpatient services revenue increased $1,417 million, or 56%, in the year ended December 31, 2013 as compared with the same period in 2012. The skilled nursing and assisted living facilities from the Sun Merger account for $1,376 million of the increase. In addition to the Sun Merger, other newly acquired or constructed businesses contributed another $18.3 million of incremental revenue period over period. The remaining net increase of $22.7 million, less than 1%, is attributed to net annual increases from payers, including the impact of the Medicare reimbursement reductions which began on April 1, 2013 under the Budget Control Act of 2011 (as amended by the Taxpayer Relief Act).
Inpatient services EBITDAR increased in the year ended December 31, 2013 as compared with the same period in 2012, by $229.8 million, or 53.9%. This increase is attributed to the skilled nursing and assisted living facilities from the Sun Merger offset by the impact of the Medicare reimbursement reductions which began April 1, 2013 under the Budget Control Act of 2011 (as amended by the Taxpayer Relief Act.)
Rehabilitation Therapy Services
The rehabilitation therapy services revenue, before intersegment eliminations, increased $260.7 million comparing the year ended December 31, 2013 with the same period in 2012, with the therapy business added through the Sun Merger contributing $207.0 million of that increase. The Sun therapy business contributed approximately 350 service locations, including Sun’s own inpatient facilities, to the combined rehabilitation therapy services business. The remaining revenue growth of $53.7 million is the result of net new contracts added in the period in addition to the Sun therapy contracts and pricing increases to existing customers.
EBITDAR of the rehabilitation therapy business grew in the year ended December 31, 2013 by $48.4 million, or 165%, as compared with the same period in 2012. The Sun therapy business is estimated to have contributed approximately $23 million to the increase in EBITDAR. The remaining increase is principally attributed to improved Therapist Efficiency following implementation of a reengineered approach to managing therapist labor costs. These efficiency gains were partially offset by Medicare reimbursement reductions which began on April 1, 2013 under the Budget Control Act of 2011 (as amended by the Taxpayer Relief Act.)
Other Services
Other services revenue increased $88.0 million, or 164%, in the year ended December 31, 2013 as compared with the same period in 2012. Of this increase, $80.4 million relates to incremental revenues of other businesses acquired in the Sun Merger, principally its staffing services business, with the remaining increase of $7.6 million principally generated by FC-GEN’s physician services business.
EBITDAR of the other services increased $2.8 million in the year ended December 31, 2013 as compared with the same period in 2012. The addition of other services business through the Sun Merger contributed $4.4 million of incremental EBITDAR period over period. The net remaining reduction in EBITDAR is attributed to an increase in the provision for losses on accounts receivable in FC-GEN’s physician services business.
Corporate and Eliminations—Corporate overhead costs increased $45.5 million, or 42.6%, in the year ended December, 2013 as compared with the same period in 2012. This increase was largely attributed to support function acquired or augmented in connection with the Sun Merger. Stated as a percentage of revenue corporate overhead cost is down period over period, from 3.5% to 3.2%, reflecting the benefit of synergies realized in the Sun Merger.
Lease expense—Lease expense represents the cash rents and non-cash adjustments required to account for operating leases. FC-GEN has operating leases in each of its reportable segments, other services and corporate overhead, but the inpatient services business incurs the greatest proportion of
this expense for those skilled nursing and assisted living facility leases accounted for as operating leases. Lease expense increased in the year ended December 31, 2013 as compared with the same period in 2012, by $95.9 million, or 271%. Of this amount, $99.3 million related to leases acquired through the Sun Merger, with the remaining decrease due to the reclassification of 13 leased inpatient facilities accounted for as operating leases through December 1, 2012, and thereafter accounted for as capital leases.
Depreciation and amortization—Each of FC-GEN’s reportable segments, other services and corporate overhead has depreciating property, plant and equipment, including depreciation on leased properties accounted for as capital leases or as financing obligations. Its rehabilitation therapy services and other services have identifiable intangible assets which amortize over the estimated life of those identifiable assets. Depreciation and amortization expense increased $42.3 million in the year ended December 31, 2013 as compared with the same period in 2012, as a result of the Sun Merger.
Interest expense—Interest expense includes the cash interest and non-cash adjustments required to account for FC-GEN’s revolving credit facilities, term loan facilities and mortgage instruments, as well as the expense associated with leases accounted for as capital leases or financing obligations. Comparability of cash interest paid period over period is influenced by the level of borrowings under its combined credit facilities, as well as the effective interest rates on variable rate debt. In FC-GEN’s business, a new or modified lease transaction in a given period can impact comparability with prior periods to a significant extent. Interest expense increased in the year ended December 31, 2013, as compared with the same period in 2012, by $103.3 million, or 31.9%. $71.2 million of this increase is principally attributed to capital and financing obligation leases in the inpatient services segment, with the Sun Merger contributing $61.2 million of that amount. The remaining increase in consolidated interest expense of $32.1 million is largely due to the increased borrowing levels resulting from financing of the Sun Merger.
Transaction costs—In the normal course of business, FC-GEN evaluates strategic acquisition, disposition and business development opportunities. The costs to pursue these opportunities, when incurred, vary from period to period depending on the nature of the transaction pursued and if those transactions are ever completed. Transaction costs incurred for the years ended December 31, 2013 and 2012 were $5.9 million and $29.8 million, respectively. The 2012 costs are principally related to closing of the Sun Merger and additional costs related to leasing transactions.
Income tax benefit— For the year ended December 31, 2013, FC-GEN recorded an income tax benefit of $9.2 million on a pretax loss of $178.8 million. For the same period in 2012, it recorded income tax benefit of $11.6 million on pretax loss of $182.5 million. For the year ended December 31, 2013 and 2012, the overall effective tax rate was different than the statutory rate of 35% primarily due to the allocation to certain members of their respective share of taxable income or loss not subject to corporate income tax.
Liquidity and Capital Resources
The following table presents selected data from FC-GEN’s consolidated statements of cash flows (in thousands):
|
|
|
Year ended December 31, |
| |||||||
|
|
|
2014 |
|
2013 |
|
2012 |
| |||
|
|
|
|
|
|
|
|
| |||
|
Net cash provided by operating activities |
|
107,652 |
|
82,149 |
|
9,972 |
| |||
|
Net cash used in investing activities |
|
(95,675 |
) |
(91,702 |
) |
(182,899 |
) | |||
|
Net cash provided by financing activities |
|
14,158 |
|
20,748 |
|
172,229 |
| |||
|
Net increase (decrease) in cash and equivalents |
|
26,135 |
|
11,195 |
|
(698 |
) | |||
|
Beginning of period |
|
61,413 |
|
50,218 |
|
50,916 |
| |||
|
End of period |
|
$ |
87,548 |
|
$ |
61,413 |
|
$ |
50,218 |
|
Years Ended December 31, 2014 and 2013
Net cash provided by operating activities in the year ended December 31, 2014 was $107.7 million, compared to $82.1 million in the same period in 2013. The increase in operating cash flow is attributable to an $83.2 million increase from timing of receipts and payments and a $9.7 million reduction cash outlays for transaction costs, offset by a decline in cash earnings period over period of $67.7 million.
Net cash used in investing activities in the year ended December 31, 2014 was $95.7 million, compared to $91.7 million in the year ended December 31, 2013. Routine capital expenditures for the year ended December 31, 2014 were $71.0 million compared to $77.4 million for same period in 2013. The purchase of inpatient assets resulted in a use of cash of $1.9 million for the year ended December 31, 2014 compared to $12.2 million for year ended December 31, 2013. Net purchases of marketable securities and changes in restricted cash and equivalents resulted in a use of cash of $24.7 million and $9.1 million for the year ended December 31, 2014 and 2013, respectively.
Net cash used in financing activities in the year ended December 31, 2014 was $14.2 million, compared to $20.7 million net cash provided by financing activities in the year ended December 31, 2013. The sources of cash from financing activities for the year ended December 31, 2014 were primarily $54.5 million of net borrowings under revolving credit facilities, $6.1 million of proceeds drawn on a lease financing facility, offset by $17.0 million of net debt repayments, $7.9 million of debt issuance costs and $21.5 million of distributions to the FC-GEN Members and non-controlling interests. The source of cash from financing activities for the year ended December 31, 2013 were $38.0 million of net borrowings under revolving credit facilities, $10.5 million drawn on a lease financing facility and $14.3 million of net debt proceeds, offset by $35.1 million of debt repayments and $7.0 million of distributions to the FC-GEN Members and non-controlling interests.
At December 31, 2014, FC-GEN had cash and cash equivalents of $87.5 million and available borrowings under its revolving credit facilities of $37.6 million after taking into account $101.1 million of letters of credit drawn against its revolving credit facilities. FC-GEN’s available cash is
held in accounts at third-party financial institutions. To date, it has experienced no loss or lack of access to its invested cash or cash equivalents; however, it can provide no assurances that access to its invested cash or cash equivalents will not be impacted by adverse conditions in the financial markets. During 2014, FC-GEN maintained liquidity sufficient to meet its working capital, capital expenditure and development activity needs.
Years Ended December 31, 2013 and 2012
Net cash provided by operating activities for the year ended December 31, 2013 was $82.1 million, compared to $10.0 million for the year ended December 31, 2012. The increase in net cash provided by operating activities was primarily the result of a $62.4 million improvement in cash earnings principally attributed to the Sun Merger, and a decrease in cash outlays for transaction-related costs of $25.3 million, offset by a net decrease of $15.6 million from the timing of receipts and payments.
Net cash used in investing activities for the year ended December 31, 2013 was $91.7 million, compared to $182.9 million for the year ended December 31, 2012. The decrease in cash used for investing activities is primarily due to the 2012 Sun acquisition which resulted in an outflow of $168.9 million offset by the proceeds of $75.3 million related to the hospice sale in 2012. Capital expenditures for the year ended December 31, 2013 were $77.4 million compared to $66.7 million for the year ended December 31, 2012. The purchase of inpatient assets resulted in a use of cash of $12.2 million for the year ended December 31, 2013 compared to $5.2 million for the year ended December 31, 2012.
Net cash provided by financing activities for the year ended December 31, 2013 was $20.7 million, compared to $172.2 million for the year ended December 31, 2012. The decrease was primarily due to the non-recurring nature of the financing for the Sun Merger and a decrease in net distributions to and contributions from members of $7.8 million.
Off Balance Sheet Arrangements
FC-GEN is not involved in any off-balance-sheet arrangements that have or are reasonably likely to have a material current or future impact on its financial condition, changes in financial condition, revenue or expense, results of operations, liquidity, capital expenditures, or capital resources.
Contractual Obligations
The following table sets forth FC-GEN’s contractual obligations, including principal and interest, but excluding non-cash amortization of discounts or premiums established on these instruments, as of December 31, 2014 (in thousands):
|
|
|
|
|
|
|
|
|
|
|
More than |
| |||||
|
|
|
Total |
|
1 Yr. |
|
2-3 Yrs. |
|
4-5 Yrs. |
|
5 Yrs. |
| |||||
|
Revolving credit facilities |
|
$ |
279,738 |
|
$ |
8,653 |
|
$ |
271,085 |
|
$ |
— |
|
$ |
— |
|
|
Term loan facility |
|
293,081 |
|
35,098 |
|
257,983 |
|
— |
|
— |
| |||||
|
Mortgages and other secured debt (recourse) |
|
13,703 |
|
781 |
|
1,562 |
|
11,360 |
|
— |
| |||||
|
Mortgages and other secured debt (non recourse) |
|
62,678 |
|
3,334 |
|
6,680 |
|
16,531 |
|
36,133 |
| |||||
|
Financing obligations |
|
9,691,788 |
|
259,763 |
|
544,417 |
|
576,223 |
|
8,311,385 |
| |||||
|
Capital lease obligations |
|
3,532,043 |
|
91,127 |
|
188,649 |
|
198,123 |
|
3,054,144 |
| |||||
|
Operating lease obligations |
|
894,234 |
|
120,931 |
|
236,209 |
|
231,826 |
|
305,268 |
| |||||
|
|
|
$ |
14,767,265 |
|
$ |
519,687 |
|
$ |
1,506,585 |
|
$ |
1,034,063 |
|
$ |
11,706,930 |
|
Transactions with Related Parties
FC-GEN is wholly owned by private investors sponsored by affiliates of Formation Capital, LLC.
FC-GEN made an investment of $1.0 million and received an approximate 6.8% interest in National Home Care Holdings, LLC, an unconsolidated joint venture affiliated with one of its sponsors.
On March 31, 2015, FC-GEN sold its investment in FC PAC Holdings, LLC (FC PAC), an unconsolidated joint venture in which it held an approximate 5.4% interest, for $26.4 million and will recognize a gain on sale of $8.4 million. FC PAC ownership includes affiliates of FC-GEN’s sponsor, and also represented by members of its board of directors.
FC-GEN provides rehabilitation services to certain facilities owned and operated by affiliates of the its sponsors. These services resulted in revenue of $161.2 million, $148.5 million and $92.9 million in the years ended December 31, 2014, 2013, and 2012, respectively. The services resulted in accounts receivable balances of $37.6 million and $61.2 million at December 31, 2014 and 2013, respectively.
FC-GEN is billed by an affiliate of its sponsors a monthly fee for the provision of administrative services. The fees billed were $2.5 million, $2.5 million and $2.6 million for the years ended December 31, 2014, 2013 and 2012, respectively. On February 2, 2015 in connection with the Combination, an affiliate of FC-GEN’s sponsors received a transaction advisory fee of $3.0 million and the administrative services monthly fee was discontinued.
Quantitative and Qualitative Disclosures About Market Risk
In the normal course of business, FC-GEN’s operations are exposed to risks associated with fluctuations in interest rates. To the extent these interest rates increase, FC-GEN’s interest expense will increase, which will make its interest payments and funding its other fixed costs more expensive, and its available cash flow may be adversely affected. FC-GEN routinely monitors its
risks associated with fluctuations in interest rates and considers the use of derivative financial instruments to hedge these exposures. It does not enter into derivative financial instruments for trading or speculative purposes nor does it enter into energy or commodity contracts.
Interest Rate Exposure—Interest Rate Risk Management
FC-GEN’s term loan facility and its revolving credit facilities expose it to variability in interest payments due to changes in interest rates. FC-GEN entered into an interest rate cap agreement in 2013 in order to manage fluctuations in cash flows resulting from interest rate risk. The interest rate cap agreement was for a notional amount of $250 million and limits its exposure to LIBOR interest rate fluctuations at 1.5%. The interest rate cap agreement expired on December 31, 2014.
The table below presents the principal amounts, weighted-average interest rates and fair values by year of expected maturity to evaluate FC-GEN’s expected cash flows and sensitivity to interest rate changes:
|
|
|
Twelve Months Ending December 31, |
| ||||||||||||||||||||||
|
|
|
2015 |
|
2016 |
|
2017 |
|
2018 |
|
2019 |
|
Thereafter |
|
Total |
|
Fair Value |
| ||||||||
|
Fixed-rate debt |
|
$ |
1,032 |
|
$ |
1,073 |
|
$ |
1,119 |
|
$ |
1,166 |
|
$ |
1,990 |
|
$ |
25,460 |
|
$ |
31,840 |
|
$ |
31,840 |
|
|
Average interest rate (1) |
|
4.1 |
% |
4.1 |
% |
4.2 |
% |
4.2 |
% |
4.3 |
% |
5.2 |
% |
|
|
|
| ||||||||
|
Variable-rate debt (2) |
|
$ |
13,360 |
|
$ |
13,388 |
|
$ |
461,090 |
|
$ |
21,814 |
|
$ |
— |
|
$ |
— |
|
$ |
509,652 |
|
$ |
520,031 |
|
|
Average interest rate (1) |
|
9.5 |
% |
9.5 |
% |
6.4 |
% |
3.0 |
% |
0.0 |
% |
0.0 |
% |
|
|
|
| ||||||||
(1) Based on one month LIBOR of 0.17% on December 31, 2014.
(2) Excludes unamortized original issue discounts and debt premiums which amortize through interest expense on a non-cash basis over the life of the instrument.
Borrowings under the revolving credit facility, as amended, bear interest at a rate equal to, at FC-GEN’s option, either a base rate plus an applicable margin or LIBOR plus an applicable margin. The base rate is determined by reference to the highest of (1) a lender-defined prime rate, (2) the federal funds rate plus 3.0%, and (3) the sum of LIBOR plus an applicable margin. The applicable margin with respect to base rate borrowings was 3.0% at December 31, 2014. The applicable margin with respect to LIBOR borrowings was 3.3% at December 31, 2014.
Borrowings under the Term Loan Facility bear interest at a rate per annum equal to the applicable margin plus, at FC-GEN’s option, either (1) LIBOR determined by reference to the costs of funds for Eurodollar deposits for the interest period relevant to such borrowings, or (2) a base rate determined by reference to the highest of (a) the lender defined prime rate, (b) the federal funds rate effective plus one half of one percent and (c) LIBOR described in sub clause (1) plus 1.0%. LIBOR based loans are subject to an interest rate floor of 1.5% and base rate loans are subject to a floor of 2.5%. The applicable margin with respect to LIBOR borrowings was 8.5% at December 31, 2014.
A 1% increase in the applicable interest rate on FC-GEN’s variable-rate debt would result in an approximately $5.0 million increase in its annual interest expense.