Attached files
| file | filename |
|---|---|
| 8-K - FORM 8-K - S&T BANCORP INC | d929779d8k.htm |
| EX-99.1 - EX-99.1 - S&T BANCORP INC | d929779dex991.htm |
| Exhibit 99.2
|
2015 Annual Meeting
|
|
Charles G. Urtin
Chairman of the Board
|
|

Todd D. Brice
President and Chief Executive Officer
|
|
Forward Looking Statement and Risk Factor
This presentation contains certain forward-looking statements within the meaning of Section 27A of the Securities Act of 1933 and Section 21E of the Securities Exchange Act of 1934. Forward-looking statements include, among others, statements regarding trends, strategies, plans, beliefs, intentions, expectations, goals and opportunities. Forward looking statements are typically identified by words or phrases such as believe, expect, anticipate, intend, estimate, assume, strategy, plan, outlook, outcome, continue, remain, trend and variations of such words and similar expressions, or future or conditional verbs such as will, would, should, could, may or similar expressions. Actual results and performance could differ materially from those anticipated by these forward-looking statements. Factors that could cause such a difference include, but are not limited to, general economic conditions, changes in interest rates, deposit flows, loan demand, asset quality, including real estate and other collateral values, and competition.
S&T cautions that these forward-looking statements are subject to numerous assumptions, risks and uncertainties, which change over time. These forward-looking statements speak only as of the date hereof, and S&T assumes no duty to update forward-looking statements. Subsequent written or oral statements attributable to S&T or persons acting on its behalf are expressly qualified in their entirety by the cautionary statements contained herein and those in S&T’s reports previously and subsequently filed with the Securities and Exchange Commission.
|
|
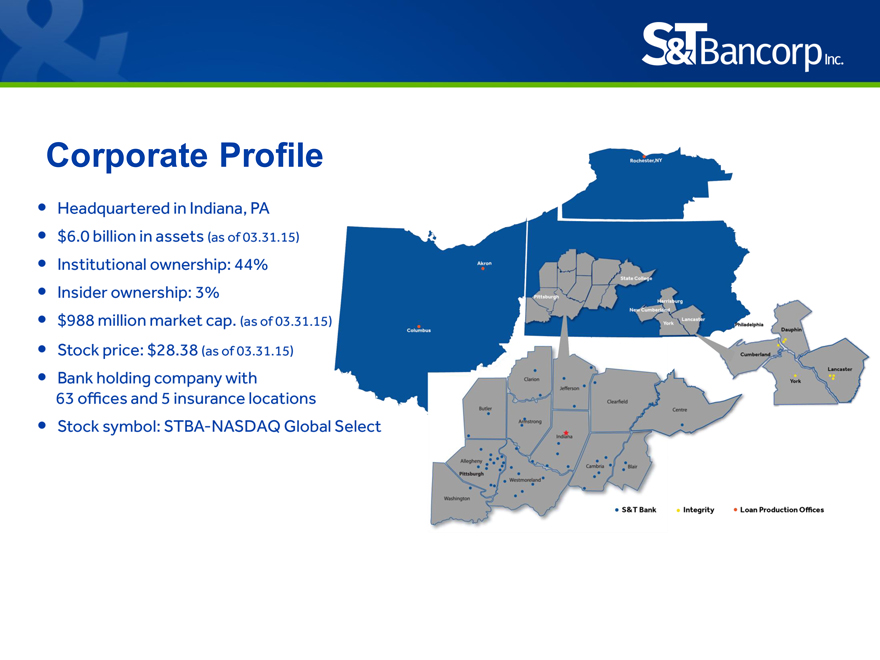
Corporate Profile
Headquartered in Indiana, PA $6.0 billion in assets (as of 03.31.15) Institutional ownership: 44%
Insider ownership: 3% $988 million market cap. (as of 03.31.15) Stock price: $28.38 (as of 03.31.15)
Bank holding company with 63 offices and 5 insurance locations Stock symbol: STBA-NASDAQ Global Select
|
|
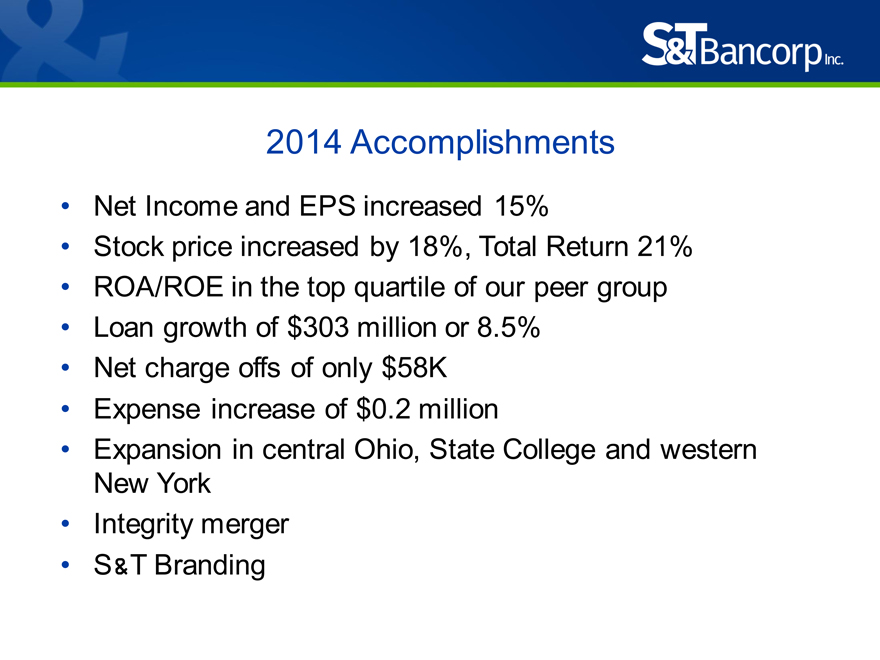
2014 Accomplishments
Net Income and EPS increased 15%
Stock price increased by 18%, Total Return 21%
ROA/ROE in the top quartile of our peer group
Loan growth of $303 million or 8.5%
Net charge offs of only $58K
Expense increase of $0.2 million
Expansion in central Ohio, State College and western New York
Integrity merger
S&T Branding
|
|
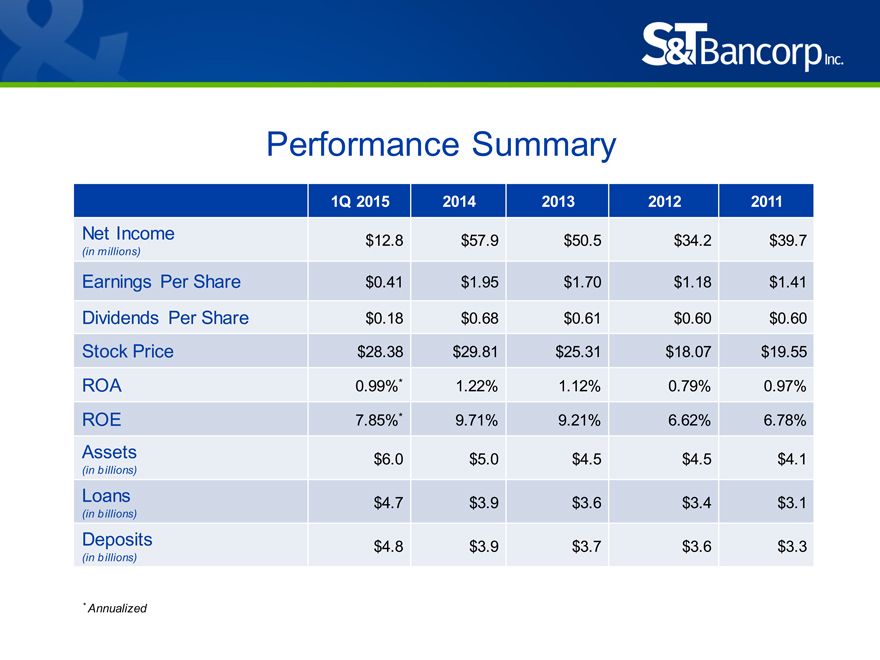
Performance Summary
1Q 2015 2014 2013 2012 2011
Net Income $12.8 $57.9 $50.5 $34.2 $39.7
(in millions)
Earnings Per Share $0.41 $1.95 $1.70 $1.18 $1.41 Dividends Per Share $0.18 $0.68 $0.61 $0.60 $0.60 Stock Price $28.38 $29.81 $25.31 $18.07 $19.55 ROA 0.99%* 1.22% 1.12% 0.79% 0.97% ROE 7.85%* 9.71% 9.21% 6.62% 6.78% Assets $6.0 $5.0 $4.5 $4.5 $4.1
(in billions)
Loans $4.7 $3.9 $3.6 $3.4 $3.1
(in billions)
Deposits $4.8 $3.9 $3.7 $3.6 $3.3
(in billions)
* Annualized
|
|
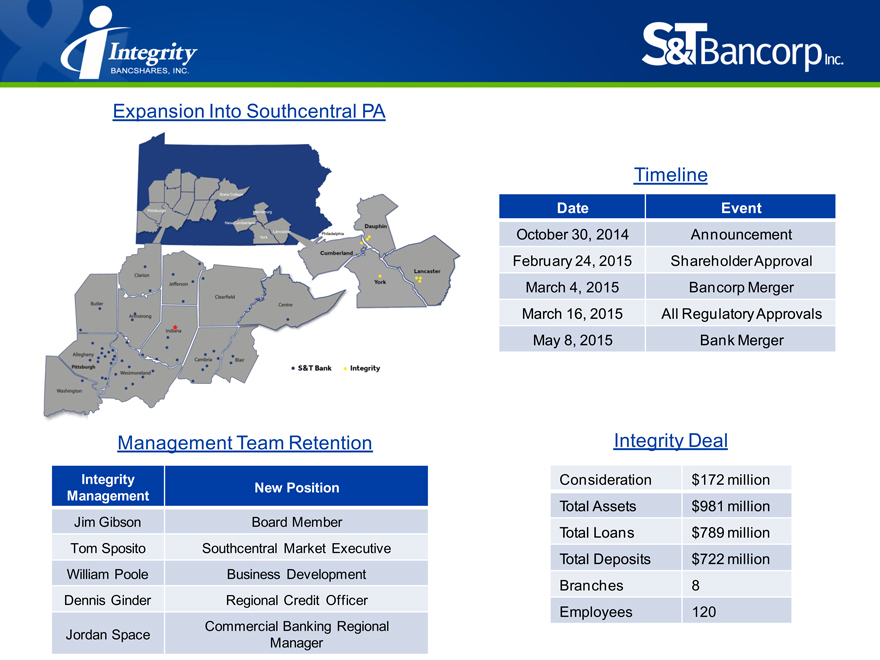
Expansion Into Southcentral PA
Timeline
Date Event
October 30, 2014 Announcement February 24, 2015 Shareholder Approval March 4, 2015 Bancorp Merger March 16, 2015 All Regulatory Approvals May 8, 2015 Bank Merger
Management Team Retention Integrity Deal
Integrity Consideration $172 million
New Position Management
Total Assets $981 million
Jim Gibson Board Member
Total Loans $789 million
Tom Sposito Southcentral Market Executive
Total Deposits $722 million
William Poole Business Development
Branches 8
Dennis Ginder Regional Credit Officer
Employees 120
Commercial Banking Regional Jordan Space Manager
|
|
People
Board Changes
– Joseph A. Kirk – retiring after 23 years
– James T. Gibson
– Jerry D. Hostetter
– Steven J. Weingarten
Senior Management
– Rebecca A. Stapleton – Chief Banking Officer
– George Basara – General Counsel and Human Resources
|
|
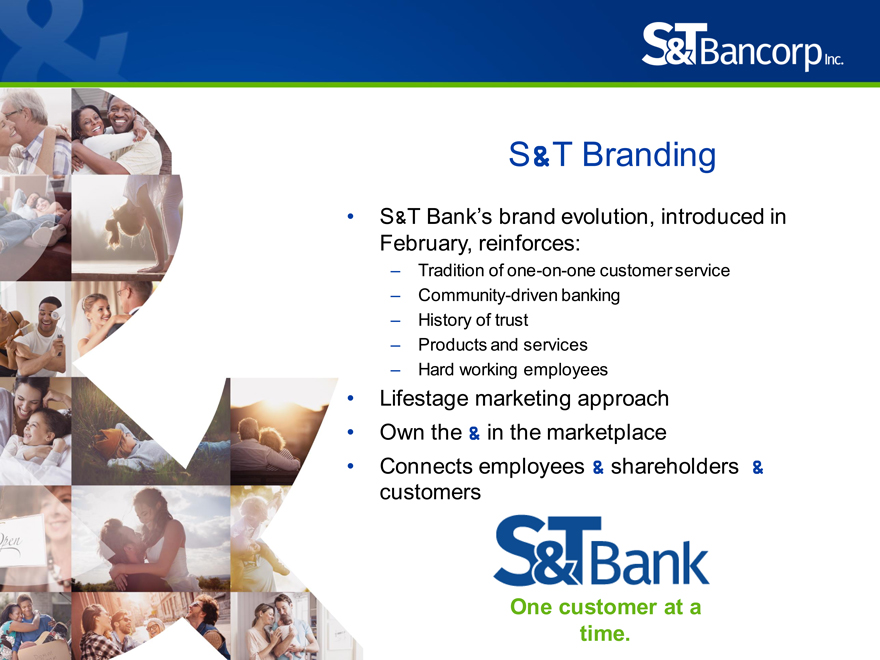
S&T Branding
S&T Bank’s brand evolution, introduced in February, reinforces:
– Tradition of one-on-one customer service
– Community-driven banking
– History of trust
– Products and services
– Hard working employees
Lifestage marketing approach
Own the & in the marketplace
Connects employees & shareholders & customers
One customer at a time.
|
|
Shareholder Value Creation
Multi-faceted growth
Profit improvement
Operational effectiveness
Culture
Customer experience
Risk management
|
|

Mark Kochvar
Chief Financial Officer
|
|
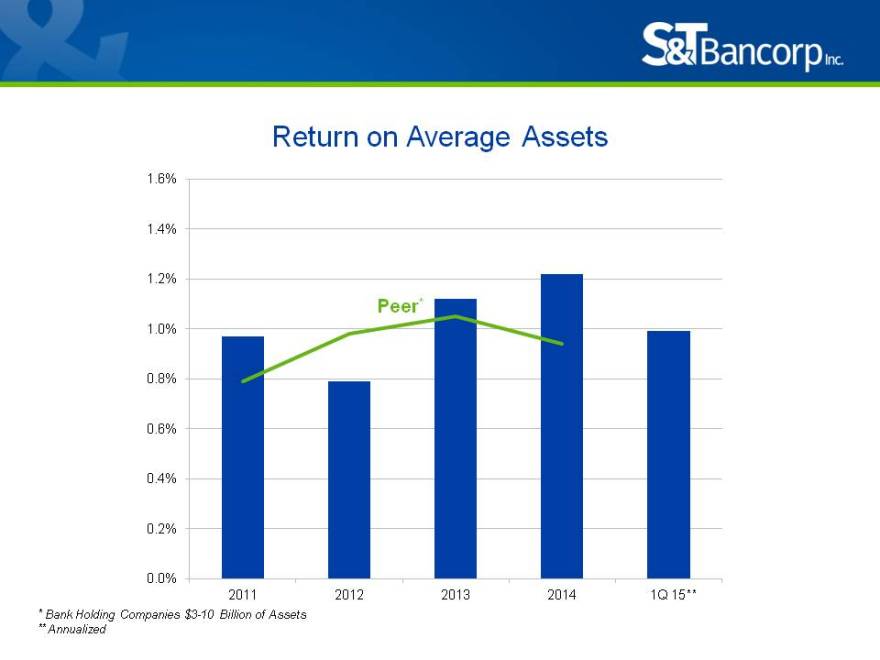
Return on Average Assets
1.6%
1.4%
1.2%
Peer*
1.0%
0.8%
0.6%
0.4%
0.2%
0.0%
2011 2012 2013 2014 1Q 15* *
* Bank Holding Companies $3-10 Billion of Assets
** Annualized
|
|
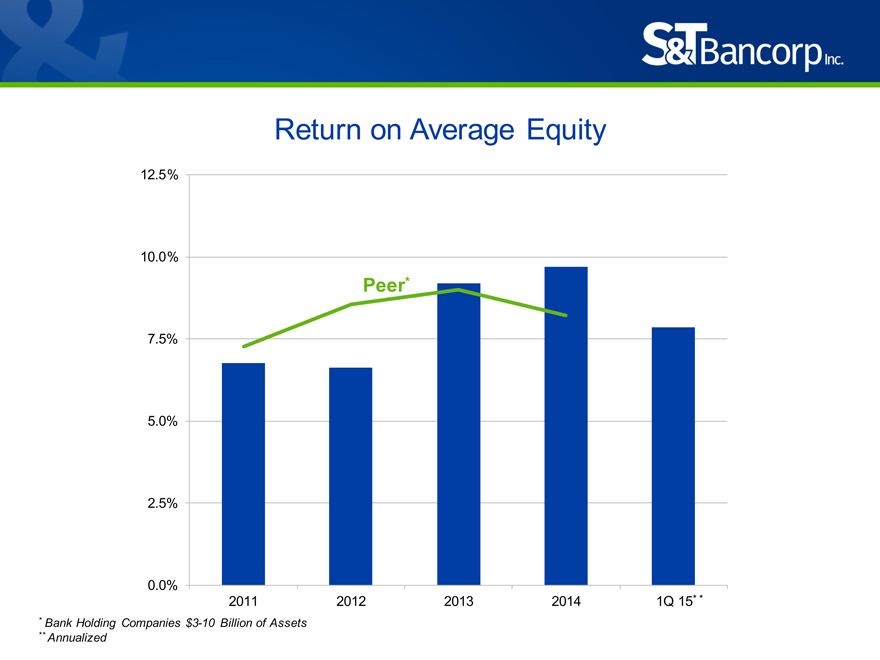
Return on Average Equity
12.5%
10.0%
Peer*
7.5%
5.0%
2.5%
0.0%
2011 2012 2013 2014 1Q 15* *
* Bank Holding Companies $3-10 Billion of Assets
** Annualized
|
|
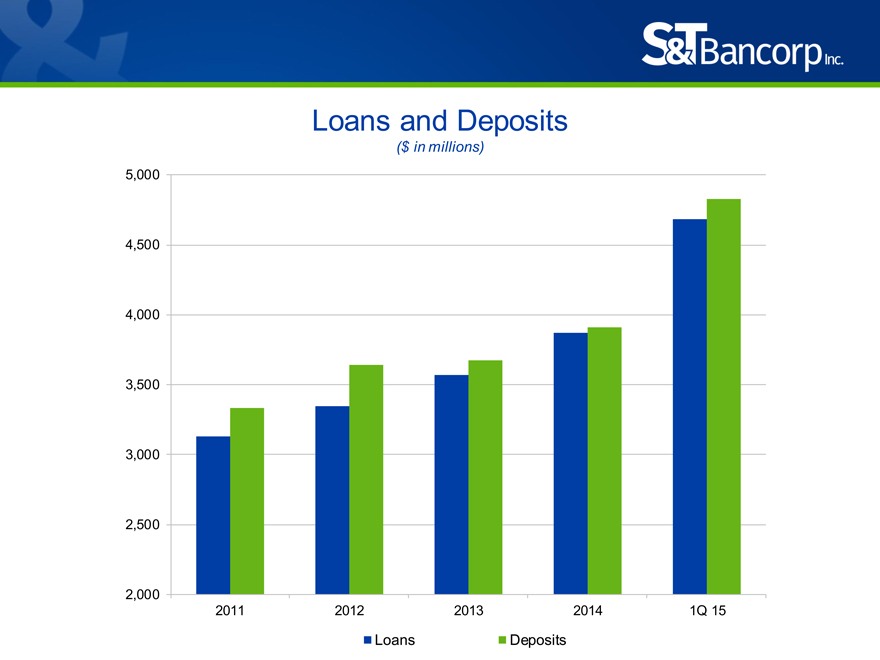
Loans and Deposits
($ in millions)
5,000 4,500 4,000 3,500 3,000 2,500
2,000
2011 2012 2013 2014 1Q 15
Loans Deposits
|
|
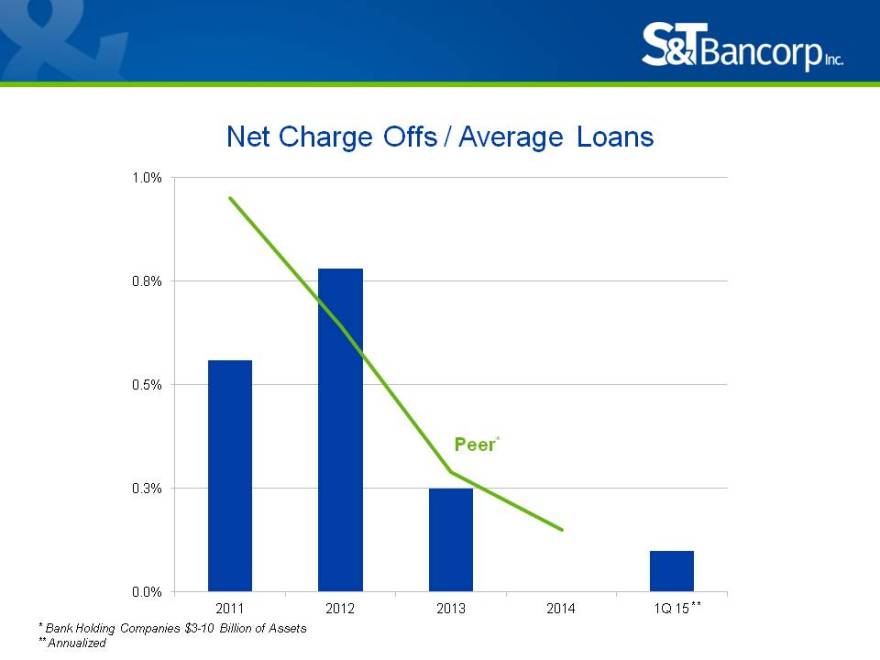
Net Charge Offs / Average Loans
1.0%
0.8%
0.5%
Peer*
0.3%
0.0%
2011 2012 2013 2014 1Q 15* *
* Bank Holding Companies $3-10 Billion of Assets
** Annualized
|
|
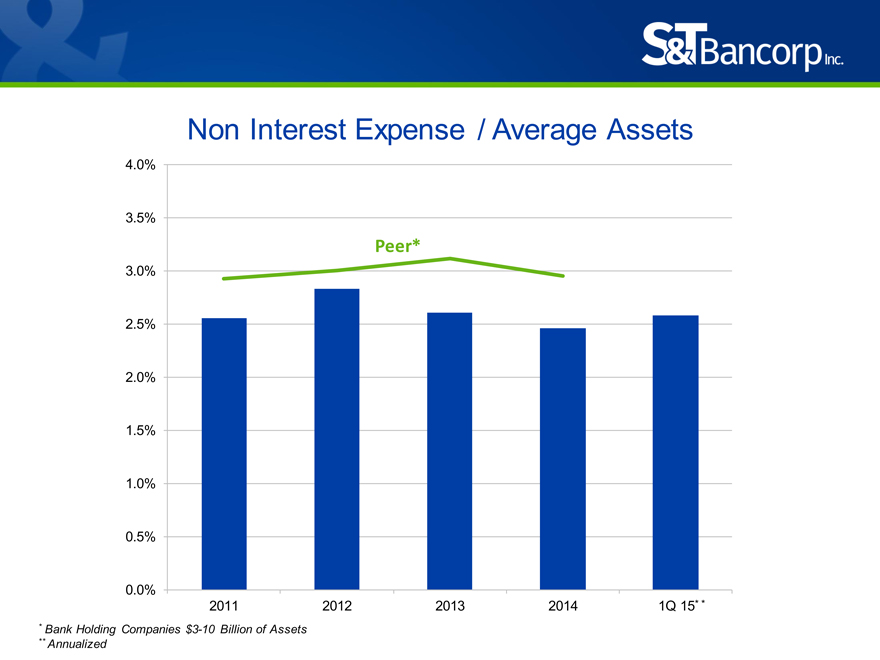
Non Interest Expense / Average Assets
4.0%
3.5%
Peer*
3.0%
2.5% 20% .
1.5%
1.0%
0.5%
0.0%
2011 2012 2013 2014 1Q 15* *
* Bank Holding Companies $3-10 Billion of Assets
** Annualized
|
|
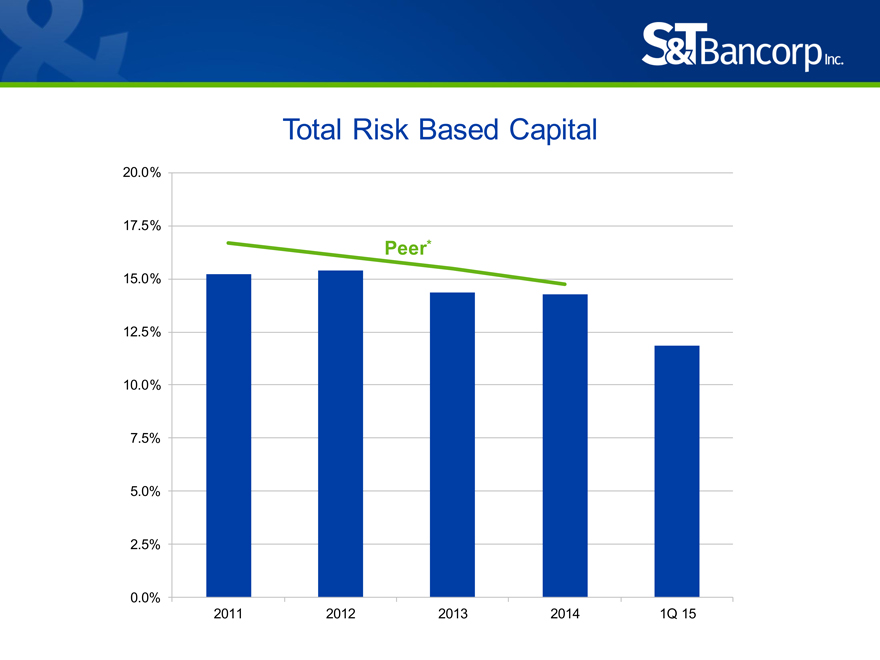
Total Risk Based Capital
20.0%
17.5%
Peer*
15.0%
12.5%
10.0%
7.5%
5.0%
2.5%
0.0%
2011 2012 2013 2014 1Q 15
|
|

2015 Annual Meeting