Attached files
UNITED STATES
SECURITIES AND EXCHANGE COMMISSION
Washington, D.C. 20549
Form 10-K
x Annual Report Pursuant to Section 13 or 15(d) of the Securities Exchange Act of 1934.
For the fiscal year ended December 31, 2009
Commission file number 1-12508
S&T BANCORP, INC.
(Exact name of registrant as specified in its charter)
| Pennsylvania | 25-1434426 | |
| (State or other jurisdiction of incorporation of organization) | (I.R.S. Employer Identification No.) | |
| 800 Philadelphia Street, Indiana, PA | 15701 | |
| (Address of principal executive offices) | (Zip Code) | |
Registrant’s telephone number, including area code (800) 325-2265
Securities registered pursuant to Section 12(b) of the Act:
| Title of each class | Name of each exchange on which registered | |
| Common Stock, par value $2.50 per share | The NASDAQ Stock Market LLC (NASDAQ Global Select Market) |
Securities registered pursuant to Section 12(g) of the Act: None
(Title of class)
Indicate by check mark if the registrant is a well-known seasoned issuer, as defined in Rule 405 of the Securities Act.
Yes ¨ No x
Indicate by check mark if the registrant is not required to file reports pursuant to Section 13 or Section 15(d) of the Act.
Yes ¨ No x
Indicate by check mark whether the registrant (1) has filed all reports required to be filed by Section 13 or 15(d) of the Securities Exchange Act of 1934 during the preceding 12 months (or for such shorter period that the registrant was required to file such reports) and (2) has been subject to such filing requirements for the past 90 days.
Yes x No ¨
Indicate by check mark if disclosure of delinquent filers pursuant to Item 405 of Regulation S-K (229.405 of this chapter) is not contained herein and will not be contained, to the best of registrant’s knowledge, in definitive proxy or information statements incorporated by reference in Part III of this form 10-K or any amendment to this form 10-K. ¨
Indicate by check mark whether the registrant has submitted electronically and posted on its corporate Web site, if any, every Interactive Data File required to be submitted and posted pursuant to Rule 405 of Regulation S-T (§ 232.405 of this chapter) during the preceding 12 months (or for such shorter period that the registrant was required to submit and post such files).
Yes ¨ No ¨
Indicate by check mark whether the registrant is a large accelerated filer, an accelerated filer, a non-accelerated filer, or smaller reporting company. See the definitions of “large accelerated filer,” “accelerated filer” and “smaller reporting company” in Rule 12b-2 of the Exchange Act.
| Large accelerated filer ¨ | Accelerated filer x | |
| Non-accelerated filer ¨ (Do not check if a smaller reporting company) | Smaller reporting company ¨ |
Indicate by check mark whether the registrant is a shell company (as defined in Rule 12b-2 of the Act).
Yes ¨ No x
The aggregate estimated fair value of the voting and non-voting common equity held by nonaffiliates of the registrant as of June 30, 2009:
Common Stock, $2.50 par value – $325,556,871
The number of shares outstanding of the issuer’s classes of common stock as of February 9, 2010:
Common Stock, $2.50 par value – 27,753,407 shares
DOCUMENTS INCORPORATED BY REFERENCE
Portions of the proxy statement for the annual shareholders meeting to be held April 19, 2010 are incorporated by reference into Part III.
PAGE 2
General
S&T Bancorp, Inc. (“S&T”; references to “we” or “us” refers to S&T, including on a consolidated basis with our subsidiaries where appropriate) was incorporated on March 17, 1983 under the laws of the Commonwealth of Pennsylvania as a bank holding company and has two wholly owned subsidiaries, S&T Bank and 9th Street Holdings, Inc. S&T also owns a one-half interest in Commonwealth Trust Credit Life Insurance Company (“CTCLIC”). S&T is registered as a financial holding company with the Board of Governors of the Federal Reserve System under the Bank Holding Company Act of 1956, as amended (“BHCA”).
As of December 31, 2009, S&T had approximately $4.2 billion in total assets, $553.3 million in total shareholder’s equity and $3.3 billion in total deposits. S&T Bank deposits are insured by the Federal Deposit Insurance Corporation (“FDIC”) to the maximum extent provided by law.
S&T Bank is a full service bank with its Main Office at 800 Philadelphia Street, Indiana, Pennsylvania, providing services to its customers through a branch network of 55 offices located in Allegheny, Armstrong, Blair, Butler, Cambria, Clarion, Clearfield, Indiana, Jefferson and Westmoreland counties of Pennsylvania.
S&T Bank’s services include accepting time and demand deposit accounts, originating commercial and consumer loans, providing letters of credit, offering discount brokerage services, personal financial planning, credit card services and insurance products. Management believes that S&T Bank has a relatively stable deposit base and no material amount of deposits is obtained from a single depositor or group of depositors (including federal, state and local governments). S&T Bank has not experienced significant fluctuations in deposits.
Total wealth management assets under management were approximately $1.3 billion at December 31, 2009. Wealth management services include services as executor and trustee under wills and deeds, guardian and custodian of employee benefits and other trust and brokerage services.
S&T Bank has four wholly owned subsidiaries, S&T Insurance Group, LLC; S&T Bancholdings, Inc.; S&T Professional Resources Group, LLC; and Stewart Capital Advisors, LLC. S&T Insurance Group, LLC, through its subsidiaries, offers a variety of insurance products. S&T Professional Resources Group, LLC markets software developed by S&T Bank; S&T Bancholdings, Inc. is an investment holding company; and Stewart Capital Advisors, LLC, is a registered investment advisor that manages private investment accounts for individuals and institutions and advises the Stewart Capital Mid Cap Fund.
Capital Purchase Program
On January 16, 2009, S&T completed a $108.7 million capital raise as a participant in the U.S. Treasury Capital Purchase Program (the “CPP”). In conjunction with S&T’s participation in the CPP, S&T issued to the U.S. Treasury 108,676 shares of S&T’s Series A Preferred Stock, having a liquidation amount per share equal to $1,000, for a total price of $108.7 million. The Series A Preferred Stock pays cumulative dividends at a rate of 5 percent per year for the first five years and thereafter at a rate of 9 percent per year. S&T calculated the estimated fair value of the preferred stock with a discounted cash flow model using a 10 percent discount rate determined by comparison to a group of similarly rated preferred securities in the banking sector. The level yield method is used to amortize the discount on the preferred stock over a period of five years. The Series A Preferred Stock is generally non-voting. Under changes made to the CPP by the American Recovery and Reinvestment Act of 2009 (“ARRA”), subject to approval by banking regulatory agencies, S&T can redeem the Series A Preferred Stock, plus any accrued and unpaid dividends, at any time. If S&T only redeems part of the CPP investment, then it must pay a minimum of 25 percent of the issuance price, or $27.2 million. The consent of the U.S. Treasury will be required for S&T to increase its common
PAGE 3
Item 1. BUSINESS — continued
stock dividend (above the dividend amount prior to the participation in the CPP) or repurchase its common stock or other equity or capital securities, other than in connection with benefit plans consistent with past practice and certain other circumstances through January 16, 2012. The consent of the U.S. Treasury will not be required if S&T has redeemed the Series A Preferred Stock or the U.S. Treasury has transferred the Series A Preferred Stock to a third party. In addition, the Series A Preferred Stock issuance includes certain restrictions on executive compensation that could limit the tax deductibility of compensation S&T pays to executive management.
As part of its purchase of the Series A Preferred Stock, the U.S. Treasury received a Warrant to purchase 517,012 shares of S&T’s common stock at an initial per share exercise price of $31.53. The Warrant provides for the adjustment of the exercise price and the number of shares of S&T’s common stock issuable upon exercise pursuant to customary anti-dilution provisions, such as upon stock splits or distributions of securities or other assets to holders of S&T’s common stock and upon certain issuances of S&T’s common stock at or below a specified price relative to the initial exercise price. The Warrant expires ten years from the issuance date. Management engaged an outside expert to calculate the estimated fair value of the common stock warrants issued by S&T on January 16, 2009. A binomial pricing model was used resulting in an estimated fair value of $4.0 million.
Employees
As of December 31, 2009, S&T and its subsidiaries had 937 full-time equivalent employees. S&T provides a variety of employment benefits and considers its relationship with its employees to be good.
Access to United States Securities and Exchange Commission Filings
All reports filed electronically by S&T with the United States Securities and Exchange Commission (“SEC”), including our annual report on Form 10-K, quarterly reports on Form 10-Q, current reports on Form 8-K and our annual proxy statements, as well as any amendments to those reports, are accessible at no cost on our website at www.stbancorp.com. These filings are also accessible on the SEC’s website at www.sec.gov. You may read and copy any material S&T files with the SEC at the SEC’s Public Reference Room at 100 F Street, NE, Washington, D.C. 20549. You may obtain information on the operation of the Public Reference Room by calling the SEC at 1-800-SEC-0330. S&T’s charters of the Audit Committee, the Compensation and Benefits Committee, the Nominating and Corporate Governance Committee, the Shareholder Communications Policy and the General Code of Conduct are also available on S&T’s website.
Supervision and Regulation
General
S&T and S&T Bank are each extensively regulated under federal and state law. The following describes certain aspects of that regulation and does not purport to be a complete description of all regulations that affect S&T and S&T Bank or all aspects of those regulations.
To the extent statutory or regulatory provisions are described, the description is qualified in its entirety by reference to the particular statutory or regulatory provisions. Proposals to change the laws and regulations governing the banking industry are frequently raised in Congress, in state legislatures and before the various bank regulatory agencies. The likelihood and timing of any changes and the impact such changes might have on S&T or S&T Bank is impossible to determine with any certainty.
Any change in applicable laws or regulations, or in the way such laws or regulations are interpreted by regulatory agencies or courts, may have a material impact on our business, operations and earnings.
PAGE 4
Item 1. BUSINESS — continued
S&T
S&T is a bank holding company subject to regulation under the BHCA and the examination and reporting requirements of the Board of Governors of the Federal Reserve System (the “Federal Reserve Board”). Under the BHCA, a bank holding company may not directly or indirectly acquire ownership or control of more than 5 percent of the voting shares or substantially all of the assets of any additional bank, or merge or consolidate with another bank holding company, without the prior approval of the Federal Reserve Board. S&T has received such approvals from the Federal Reserve Board for passive ownership positions in Allegheny Valley Bancorp, Inc. (currently 14.78 percent) and CBT Financial Corporation (currently 5.37 percent).
As a bank holding company, S&T is expected under Federal Reserve Board regulation to serve as a source of financial and managerial strength to its subsidiary bank. A bank holding company is also expected to commit resources, including capital and other funds, to support its subsidiary bank in circumstances where it might not do so absent such a policy.
S&T elected to become a financial holding company under the BHCA in 2001 and thereby engage in a broader range of financial and other activities than are permissible for traditional bank holding companies. In order to qualify and maintain its status as a financial holding company, the depository institutions controlled by S&T must remain “well capitalized” and “well managed” (as defined in federal law) and have at least a “satisfactory” Community Reinvestment Act (“CRA”) rating. Refer to Item 8, Note 20 Regulatory Matters, for information concerning the current capital ratios of S&T and S&T Bank. No prior regulatory approval is required for a financial holding company to acquire a company, other than a bank or savings association, engaged in activities that are financial in nature or incidental to activities that are financial in nature, as determined by the Federal Reserve Board. The BHCA identifies several activities as “financial in nature” including, among others, securities underwriting, dealing and market making; sponsoring mutual funds and investment companies; insurance underwriting and sales agency; investment advisory activities; merchant banking activities; and activities that the Federal Reserve Board has determined to be closely related to banking or a proper incident thereto. Banks may also engage, subject to limitations on investment, in activities that are financial in nature, other than insurance underwriting, insurance company portfolio investment, real estate development and real estate investment, through a financial subsidiary of the bank, if the bank is “well capitalized”, “well managed” and has at least a “satisfactory” CRA rating.
If S&T Bank ceases to be “well capitalized” or “well managed,” S&T will not be in compliance with the requirements of the BHCA regarding financial holding companies. If a financial holding company is notified by the Federal Reserve Bank of such a change in the ratings of any of its subsidiary banks, it must take certain corrective actions within specified time frames. Furthermore, if S&T Bank were to receive a CRA rating of less than “satisfactory,” then S&T would be prohibited from engaging in new activities or acquiring companies other than bank holding companies, banks or savings associations until the rating is raised to “satisfactory” or better.
S&T is presently engaged in nonbanking activities through the following six entities:
| • | 9th Street Holdings, Inc. was formed in June 1988 to hold and manage a group of investments previously owned by S&T Bank and to give S&T additional latitude to purchase other investments. |
| • | S&T Bancholdings, Inc. was formed in August 2002 to hold and manage a group of investments previously owned by S&T Bank and to give S&T additional latitude to purchase other investments. |
| • | CTCLIC is a joint venture with another financial institution, acting as a reinsurer of credit life, accident and health insurance policies sold by S&T Bank and the other institution. |
| • | S&T Insurance Group, LLC distributes high-quality life insurance and long-term disability income insurance products. During 2001, S&T Insurance Group, LLC and Attorneys Abstract Company, Inc. entered into an agreement to form S&T Settlement Services, LLC (“STSS”), with respective ownership interests of 55 percent and 45 percent. STSS is a title insurance agency servicing |
PAGE 5
Item 1. BUSINESS — continued
| commercial customers. During 2002, S&T Insurance Group, LLC expanded into the property and casualty insurance business with the acquisition of Evergreen Insurance Associates, LLC. |
| • | S&T Professional Resources Group, LLC markets software developed by S&T Bank. |
| • | Stewart Capital Advisors, LLC was formed in August 2005 and is a registered investment advisor that manages private investment accounts for individuals and institutions and advises the Stewart Capital Mid Cap Fund. |
S&T Bank
As a state-chartered, commercial bank, the deposits of which are insured by the FDIC, S&T Bank is subject to the supervision and regulation of the Pennsylvania Department of Banking (“PADB”) and the FDIC. S&T Bank is also subject to various requirements and restrictions under federal and state law, including requirements to maintain reserves against deposits, restrictions on the types, amount and terms and conditions of loans that may be granted and limits on the type of other activities in which S&T Bank may engage and the investments it may make.
S&T Bank is also subject to federal laws that limit the amount of transactions between itself and S&T or S&T’s nonbank subsidiaries. Under these provisions, transactions between a bank and its parent company or any single nonbank affiliate generally are limited to 10 percent of the bank subsidiary’s capital and surplus, and with respect to all transactions with affiliates, are limited to 20 percent of the bank subsidiary’s capital and surplus. Further, loans and extensions of credit from a bank to an affiliate generally are required to be secured by eligible collateral in specified amounts. Federal law also imposes similar restrictions on transactions between a bank and its financial subsidiaries. A bank, such as S&T Bank, also is prohibited from purchasing any “low-quality” asset from an affiliate. S&T Bank is in compliance with these provisions.
Insurance of Accounts; Depositor Preference
The deposits of S&T Bank are insured up to applicable limits per insured depositor by the FDIC. In October 2008, the FDIC increased FDIC deposit insurance coverage per separately insured depositor for all account types to $250,000. While initially stipulated to be in effect through December 31, 2009, this increase has been subsequently extended through December 31, 2013 (at which point it will revert to $100,000 thereafter for most accounts other than IRAs and certain other types of retirement accounts up to a maximum of $250,000, if not extended by Congress). Also, in October 2008, the FDIC introduced the Temporary Liquidity Guarantee Program (“TLGP”), which is designed to improve the functions of the credit markets and to strengthen confidence in the financial system. The TLGP has two components (both of which involve participation fees to be paid by the participating institution): (i) a transaction account guarantee program, providing a full guaranty through June 2010 of noninterest-bearing deposit transaction accounts, such as business payroll accounts, regardless of the amount on deposit and (ii) a debt guarantee program, providing a guarantee of certain newly issued senior unsecured debt of the Bank. S&T has elected to participate in the transaction account guarantee program.
As an FDIC-insured bank, S&T Bank is also subject to FDIC insurance assessments, which are imposed based upon the risk the institution poses to the Deposit Insurance Fund (“DIF”). Under this assessment system, risk is defined and measured using an institution’s supervisory ratings with certain other risk measures, including certain financial ratios. The annual rates for institutions in 2009 range from 12 basis points for “well managed,” “well capitalized” banks with the highest ratings, to 45 basis points for institutions posing the most risk to the DIF. The FDIC may raise or lower these assessment rates on a quarterly basis based on various factors to achieve a reserve ratio, which the FDIC currently has set at 1.25 percent of insured deposits. Due to recent bank failures and contingent loss reserves established by the FDIC against potential future bank failures, the reserve ratio is currently significantly below its target balance. Thus, in February 2009, the FDIC adopted a Final
PAGE 6
Item 1. BUSINESS — continued
Rule on Assessments under which the quarterly initial base assessment rates increased substantially beginning in the second quarter of 2009. The FDIC then adopted a Final Rule on Special Assessment in May 2009, which imposed a 5 basis point special assessment on each institution’s assets minus Tier 1 capital as reported on the report of condition as of June 30, 2009, but capped the special assessment at 10 basis points times the institution’s assessment base for the second quarter 2009 risk-based assessment. On November 12, 2009, the FDIC Board of Directors adopted a final rule that required insured depository institutions to prepay, on December 30, 2009, their estimated quarterly risk-based assessments for the fourth quarter of 2009 and for all of 2010, 2011, and 2012, along with their quarterly risk-based assessment for the third quarter of 2009. The continued decline in the DIF balance may convince the FDIC to impose additional special emergency assessments in the future that could have a significant impact on S&T Bank’s capital levels and earnings. During 2009, the increase in FDIC annual rates and the special assessment, at 10 basis points, impacted S&T’s pretax earnings by $6.0 million and $2.0 million, respectively. The prepayment for S&T’s quarterly assessments amounted to $21.1 million and will be recognized as expense over a 3 year period.
In October 2008, in order to restore its reserve ratio and ensure that the DIF will be able to adequately cover losses from future bank failures, the FDIC proposed amendments to its deposit insurance rules to alter the way the assessment system differentiates risk among insured institutions and to change assessments rates, including base assessment rates. A uniform assessment increase for the first quarter of 2009 was adopted as a final rule in December 2008. The FDIC also proposed further base rate assessment adjustments effective April 1, 2009.
In addition to DIF assessments, the FDIC assesses all insured deposits a special assessment to fund the repayment of debt obligations of the Financing Corporation (“FICO”). FICO is a government-sponsored entity that was formed to borrow the money necessary to carry out the closing and ultimate disposition of failed thrift institutions by the Resolution Trust Corporation in the 1990s. As of January 1, 2010, the annualized rate established by the FDIC for the FICO assessment was 1.06 basis points per $100 of insured deposits.
Under federal law, deposits and certain claims for administrative expenses and employee compensation against insured depository institutions are afforded a priority over other general unsecured claims against such an institution, including federal funds and letters of credit, in the liquidation or other resolution of such an institution by any receiver appointed by regulatory authorities. Such priority creditors would include the FDIC.
Capital
The Federal Reserve Board and the FDIC have issued substantially similar risk-based and leverage capital guidelines applicable to banking organizations they supervise. Under the risk-based capital requirements, both S&T and S&T Bank generally are required to maintain a minimum ratio of total capital to risk-weighted assets (including certain off-balance sheet activities, such as standby letters of credit) of 8.00 percent. At least half of the total capital must be comprised of common equity, retained earnings and qualifying perpetual preferred stock, less certain intangibles, (“Tier 1 capital”). The remainder may consist of certain subordinated debt, certain hybrid capital instruments and other qualifying preferred stock, and a limited amount of the loan loss allowance (“Tier 2 capital” and, together with Tier 1 capital, “Total capital”). At December 31, 2009, S&T’s Tier 1 capital and Total capital ratios were 12.10 percent and 15.43 percent, respectively, and the ratios of Tier 1 capital and Total capital for S&T Bank were 8.05 percent and 11.39 percent, respectively.
In addition, each of the federal bank regulatory agencies has established minimum leverage capital ratio requirements for banking organizations. These requirements provide for a minimum leverage ratio of Tier 1 capital to adjusted average quarterly assets equal to 3.00 percent for bank and bank holding companies that meet certain specified criteria, including that they have the highest regulatory rating and are not experiencing significant growth or expansion. All other banks and bank holding
PAGE 7
Item 1. BUSINESS — continued
companies generally are required to maintain a leverage ratio of at least 100 to 200 basis points above the stated minimum. At December 31, 2009, S&T’s leverage ratio was 10.26 percent and S&T Bank’s leverage ratio was 6.81 percent.
Both the Federal Reserve Board and the FDIC’s risk-based capital standards explicitly identify concentrations of credit risk and the risk arising from non-traditional activities, as well as an institution’s ability to manage these risks, as important factors to be taken into account by the agency in assessing an institution’s overall capital adequacy. The capital guidelines also provide that an institution’s exposure to a decline in the economic value of its capital due to changes in interest rates be considered by the agency as a factor in evaluating a bank’s capital adequacy. The Federal Reserve Board has also issued additional capital guidelines for certain bank holding companies that engage in trading activities. S&T does not believe that consideration of these additional factors will affect the regulators’ assessment of S&T or S&T Bank’s capital position.
Federal regulators periodically propose amendments to the risk-based capital guidelines and the related regulatory framework and consider changes to the capital standards that could significantly increase the amount of capital needed to meet applicable standards. The timing of adoption, ultimate form and effect of any such proposed amendments cannot be predicted.
Payment of Dividends
S&T is a legal entity separate and distinct from its banking and other subsidiaries. A substantial portion of S&T’s revenues consist of dividend payments it receives from S&T Bank. S&T Bank, in turn, is subject to state laws and regulations that limit the amount of dividends it can pay to S&T. In addition, both S&T and S&T Bank are subject to various general regulatory policies relating to the payment of dividends, including requirements to maintain adequate capital above regulatory minimums. The Federal Reserve Board has indicated that banking organizations should generally pay dividends only if (i) the organization’s net income available to common shareholders over the past year has been sufficient to fully fund the dividends and (ii) the prospective rate of earnings retention appears consistent with the organization’s capital needs, asset quality and overall financial condition. Thus, under certain circumstances based upon S&T’s financial condition, S&T’s ability to declare and pay quarterly dividends may require consultation with the Federal Reserve and may be prohibited by applicable Federal Reserve regulations. If S&T were to pay a dividend in contravention of Federal Reserve regulations, the Federal Reserve could raise supervisory concerns. In addition, prior to January 16, 2012, unless S&T has redeemed the Series A Preferred Stock or the U.S. Treasury has transferred the Series A Preferred Stock to a third party, the consent of the U.S. Treasury is required for S&T to increase its common stock dividend (above the dividend amount prior to the participation in the CPP) or repurchase its common stock or other equity or capital securities, other than in connection with benefit plans consistent with past practice and certain other circumstances. During the year ended December 31, 2009, S&T Bank paid $25.4 million in cash dividends to S&T for dividends paid to common shareholders.
Other Safety and Soundness Regulations
There are a number of obligations and restrictions imposed on bank holding companies such as S&T and its depository institution subsidiary by federal law and regulatory policy that are designed to reduce potential loss exposure to the depositors of such depository institutions and to the FDIC insurance funds in the event the depository institution becomes in danger of default or in default. Under current federal law for example, the federal banking agencies possess broad powers to take prompt corrective action to resolve problems of insured depository institutions. The extent of these powers depends upon whether the institution in question is “well capitalized,” “adequately capitalized,” “undercapitalized,” “significantly undercapitalized,” or “critically undercapitalized,” as defined by the law. Under regulations established by the federal banking agencies, a “well capitalized” institution must have a Tier 1 capital ratio of at least 6.00 percent, a Total capital ratio of at least
PAGE 8
Item 1. BUSINESS — continued
10.00 percent and a leverage ratio of at least 5.00 percent and must not be subject to a capital directive or order. An “adequately capitalized” institution must have a Tier 1 capital ratio of at least 4.00 percent, a Total capital ratio of at least 8.00 percent and a leverage ratio of at least 4.00 percent. The most highly-rated financial institutions minimum requirement for the leverage ratio is 3.00 percent. As of December 31, 2009, S&T and S&T Bank were classified as “well capitalized.” The classification of depository institutions is primarily for the purpose of applying the federal banking agencies’ prompt corrective action provisions and is not intended to be and should not be interpreted as a representation of overall financial condition or prospects of any financial institution.
The federal banking agencies’ prompt corrective action powers (which increase depending upon the degree to which an institution is undercapitalized) can include, inter alia, requiring an insured depository institution to adopt a capital restoration plan which cannot be approved unless guaranteed by the institution’s parent company; placing limits on asset growth and restrictions on activities, including restrictions on transactions with affiliates; restricting the interest rates the institution may pay on deposits; prohibiting the payment of principal or interest on subordinated debt; prohibiting the holding company from making capital distributions without prior regulatory approval; and, ultimately, appointing a receiver for the institution. For example, only a “well capitalized” depository institution may accept brokered deposits without prior regulatory approval.
The federal banking agencies have also adopted guidelines prescribing safety and soundness standards relating to internal controls and information systems, internal audit systems, loan documentation, credit underwriting, interest rate exposure, asset growth and compensation, fees and benefits. In general, the guidelines require appropriate systems and practices to identify and manage specified risks and exposures. The guidelines prohibit excessive compensation as an unsafe and unsound practice and characterize compensation as excessive when the amounts paid are unreasonable or disproportionate to the services performed by an executive officer, employee, director or principal shareholder. In addition, the agencies have adopted regulations that authorize, but do not require an agency to order an institution that has been given notice by an agency that it is not in compliance with any of such safety and soundness standards to submit a compliance plan. If, after being so notified, an institution fails to submit an acceptable compliance plan, the agency must issue an order directing action to correct the deficiency and may issue an order directing other actions of the types to which an “undercapitalized” institution is subject under the prompt corrective action provisions described above.
Regulatory Enforcement Authority
The enforcement powers available to federal banking agencies are substantial and include, among other things and in addition to other powers described herein, the ability to assess civil money penalties, to issue cease-and-desist or removal orders and to initiate injunctive actions against banks and bank holding companies and “institution affiliated parties,” as defined in the Federal Deposit Insurance Act (“FDIA”). In general, these enforcement actions may be initiated for violations of laws and regulations, as well as engagement in unsafe or unsound practices. Other actions or inactions may provide the basis for enforcement action, including misleading or untimely reports filed with regulatory authorities.
At the state level, the PADB also has broad enforcement powers over S&T Bank, including the power to impose fines and other civil and criminal penalties and to appoint a conservator or receiver.
Interstate Banking and Branching
The BHCA currently permits bank holding companies from any state to acquire banks and bank holding companies located in any other state, subject to certain conditions, including certain nationwide and state-imposed deposit concentration limits. S&T Bank has the ability, subject to certain restrictions, to acquire by acquisition or merger, branches of banks located outside of Pennsylvania, its home state. The establishment of de novo interstate branches is also possible in those states where expressly permitted. Once a bank has established branches in a state through an
PAGE 9
Item 1. BUSINESS — continued
interstate merger transaction, the bank may establish and acquire additional branches at any location in the state where a bank headquartered in that state could have established or acquired branches under applicable federal or state law.
Community Reinvestment and Consumer Protection Laws
In connection with its lending activities, S&T Bank is subject to a number of federal laws designed to protect borrowers and promote lending to various sectors of the economy and population. These include, among other laws, the Equal Credit Opportunity Act, the Truth-in-Lending Act, the Home Mortgage Disclosure Act, the Real Estate Settlement Procedures Act, the Fair Credit Reporting Act and the CRA. In addition, rules developed by the federal banking agencies pursuant to federal law require disclosure of privacy policies to consumers and in some circumstances, allow consumers to prevent the disclosure of certain personal information to nonaffiliated third parties.
The CRA requires the appropriate federal banking agency, in connection with its examination of a bank, to assess the bank’s record in meeting the credit needs of the communities served by the bank, including low and moderate-income neighborhoods. Furthermore, such assessment also is required of any bank that has applied, among other things, to merge or consolidate with or acquire the assets or assume the liabilities of an insured depository institution, or to open or relocate a branch office. In the case of a bank holding company (including a financial holding company) applying for approval to acquire a bank or bank holding company, the Federal Reserve Board will assess the record of each subsidiary bank of the applicant bank holding company in considering the application. Under the CRA, institutions are assigned a rating of “outstanding,” “satisfactory,” “needs to improve” or “unsatisfactory.” S&T Bank was rated “satisfactory” in its most recent CRA evaluation.
Anti-Money Laundering Rules
S&T Bank is subject to the Bank Secrecy Act, its implementing regulations and other anti-money laundering laws and regulations, including the USA PATRIOT Act of 2001. Among other things, these laws and regulations require S&T Bank to take steps to prevent the use of S&T Bank to facilitate the flow of illegal or illicit money, to report large currency transactions and to file suspicious activity reports. S&T Bank is also required to develop and implement a comprehensive anti-money laundering compliance program. Banks must also have in place appropriate “know your customer” policies and procedures. Violations of these requirements can result in substantial civil and criminal sanctions. In addition, provisions of the USA PATRIOT Act of 2001 require the federal financial institution regulatory agencies to consider the effectiveness of a financial institution’s anti-money laundering activities when reviewing bank mergers and bank holding company acquisitions.
Government Actions and Legislation
The Emergency Economic Stabilization Act of 2008 (the “EES Act”), effective October 2008, allocated up to $700 billion towards purchasing and insuring assets held by financial institutions for the purpose of stabilizing and providing liquidity to the U.S. financial markets. Pursuant to authority granted under the EES Act, the U.S. Treasury announced the CPP whereby the U.S. Treasury agreed to purchase senior preferred shares from qualifying U.S. financial institutions. Each participating institution may sell to the U.S. Treasury an amount of senior preferred shares ranging from 1.0 percent to 3.0 percent of its September 30, 2008 risk-weighted assets. The preferred shares are generally nonvoting and pay an initial dividend rate of 5.0 percent per year for the first five years, increasing to 9.0 percent per year after year five. As part of the consideration for the shares, the U.S. Treasury requires the receipt of Warrants to acquire common stock from the participating institution having an aggregate market price equal to 15.0 percent of the amount of capital invested by the U.S. Treasury in the senior preferred shares, at an exercise price equal to the average trailing 20-trading day market price of the institution’s common stock at the time of issuance. Participating institutions must agree to certain limitations on executive compensation, repurchases of junior preferred or
PAGE 10
Item 1. BUSINESS — continued
common stock and increases in common stock dividend payments. S&T applied to participate in the CPP and was approved to receive $108.7 million in exchange for the U.S. Treasury purchase of S&T senior preferred stock. The transaction closed on January 16, 2009.
Subsequently, the ARRA, signed into law in February 2009, allowed financial institutions such as S&T to redeem Series A Preferred Stock issued in the CPP, plus any accrued and unpaid dividends, at any time, without increasing common equity, subject to approval by banking regulatory agencies. If S&T only redeems a portion of the CPP investment, it must pay a minimum of 25 percent of the issuance price, or $27.2 million.
The government has also implemented the Homeowner Affordability and Stability Plan (“HASP”), a $75 billion federal program intended to support recovery in the housing market and ensure that eligible homeowners are able to continue to fulfill their mortgage obligations. HASP includes the following initiatives: (i) a refinance option for homeowners that are current in their mortgage payments and whose mortgages are owned by Fannie Mae or Freddie Mac; (ii) a homeowner stability initiative to prevent foreclosures and help eligible borrowers stay in their homes by offering loan modifications that reduce mortgage payments to more sustainable levels; and (iii) an increase in U.S. Treasury funding to Fannie Mae and Freddie Mac to allow them to lower mortgage rates. HASP also offers monetary incentives to mortgage servicers and mortgage holders for certain modifications of at-risk loans and would establish an insurance fund designed to reduce foreclosures.
Regulation of the financial services industry could undergo substantial changes in the near future. Legislation has been passed in the U.S. House of Representatives (“the House Bill”), and the U.S. Senate is expected to consider its version of the financial reform legislation (“the Senate Bill”) shortly. Such legislation would further increase regulation and oversight of the financial services industry and impose restrictions on the ability of firms within the industry to conduct business consistent with historical practices. For example, under the House Bill, a Consumer Financial Protection Agency would be established to regulate any person engaged in a “financial activity” in connection with a consumer financial product or service, including those that process financial services products and services. Although it is unclear at this time whether the Senate Bill would provide for such an agency, it is expected that the Senate Bill would include some consumer protection measures. Federal and state regulatory agencies also consistently propose and adopt changes to their regulations or change the manner in which existing regulations are applied. We cannot predict the substance or impact of pending or future legislation or regulation, or the application thereof, although enactment of the proposed legislation could affect how S&T and S&T Bank operate and could significantly increase costs, impede the efficiency of internal business processes, or limit our ability to pursue business opportunities in an efficient manner, any of which could materially and adversely affect our business, financial condition and results of operations.
Competition
S&T Bank competes with other local, regional and national financial service providers, such as other financial holding companies, commercial banks, savings associations, credit unions, finance companies and brokerage and insurance firms. Some of our competitors are not subject to the same level of regulation and oversight that is required of banks and bank holding companies, and are thus able to operate under lower cost structures. The financial service industry is likely to become more competitive as further technological advances enable more companies to provide financial services on a more efficient and convenient basis.
Investments in S&T common stock involve risk. The following discussion highlights the risks management believe are material for our company, but do not necessarily include all risks that S&T may face.
PAGE 11
Item 1A. RISK FACTORS — continued
The market price of S&T common stock may fluctuate significantly in response to a number of factors.
Our quarterly and annual operating results have varied significantly in the past and could vary significantly in the future, which makes it difficult for us to predict our future operating results. Our operating results may fluctuate due to a variety of factors, many of which are outside of our control, including the changing and recently volatile U.S. economic environment and changes in the residential and commercial real estate market, any of which may cause our stock price to fluctuate. If our operating results fall below the expectations of investors or securities analysts or below any guidance we may provide to the market, as has occurred in the past, the price of our common stock could decline substantially. Such a stock price decline could occur, and has occurred in the past, even when we have met our publicly stated earnings guidance. Stock price volatility may make it more difficult for an investor to resell our common stock when desired and at attractive prices. Our stock price can fluctuate significantly in response to a variety of factors including, among other things:
| • | changes in analysts’ estimates of financial performance |
| • | volatility of stock market prices and volumes |
| • | changes in market valuations of similar companies |
| • | changes in conditions in credit markets |
| • | new products or services offered in the banking and/or financial services industries |
| • | variations in quarterly or annual operating results |
| • | new litigation |
| • | changes in accounting policies or procedures as required by the Financial Accounting Standards Board (“FASB”) or other regulatory agencies |
| • | new legislation and/or regulatory changes |
Recent legislation enacted in response to market and economic conditions may significantly affect S&T’s operations, financial condition and earnings.
Disruptions in the financial system during 2009 have resulted in significantly reduced business activity throughout the global and U.S. economies, which have the potential to significantly affect financial institutions. The EES Act was enacted to respond to this financial crisis, giving the U.S. Treasury the authority to purchase up to $700 billion of financial instruments from financial institutions for the purpose of stabilizing and providing liquidity to the U.S. financial markets. Several programs have since been initiated by the U.S. Treasury, the Federal Reserve Board and the FDIC to stabilize the financial system. The U.S. Treasury’s Program was created to invest up to $250 billion (of the $700 billion) into banks and savings institutions of all sizes. The FDIC is also temporarily providing a 100 percent guarantee of the senior debt of all FDIC insured institutions, as well as deposits in noninterest-bearing transaction deposit accounts under its TLGP. The Federal Reserve is operating various asset-based secured loan programs to provide liquidity to various consumer and commercial credit markets. S&T and S&T Bank are participating in the U.S. Treasury’s CPP and the FDIC’s TLGP.
As noted previously, legislation recently passed in the U.S. House of Representatives and under consideration by the U.S. Senate would further increase regulation and oversight of the financial services industry, imposing restrictions on the ability of institutions within the industry to conduct business consistent with historical practices, including aspects such as compensation, consumer protection regulations and mortgage regulation, among others. While the House Bill differs from what is expected to be passed by the U.S. Senate, the House Bill, if enacted, would eliminate the federal savings association charter, merge the Office of Thrift Supervision (“OTS”) into the Office of the Comptroller of the Currency (“OCC”), create a Consumer Financial Protection Agency and result in other significant regulatory restructuring.
PAGE 12
Item 1A. RISK FACTORS — continued
It is not clear what impact the expected Congressional action will have on the financial markets or on the U.S. banking and financial services industries and the broader U.S. and global economies. These new laws, regulations and changes may increase our costs of regulatory compliance and of doing business and otherwise affect our operations. They may significantly affect the markets in which we do business, the markets for and value of our investments and our ongoing operations, costs and profitability.
Future governmental regulation and legislation could limit our growth.
S&T is subject to extensive state and federal regulation, supervision and legislation that govern nearly every aspect of our operations. The regulations are primarily intended to protect depositors, customers and the banking system as a whole, and not for the protection of shareholders. Failure to comply with applicable regulations could lead to penalties and damage to our reputation. Furthermore, the regulatory environment is constantly undergoing change and the impact of changes to laws and regulations, the interpretation of such laws or regulations or other actions by regulatory agencies could make regulatory compliance more difficult or expensive, and thus could affect S&T’s ability to deliver or expand services, or it could diminish the value of S&T’s business. The ramifications and uncertainties of the recent increase in government intervention in the U.S. financial system could also adversely affect S&T. See “Supervision and Regulation” within Item 1 for additional information.
Increases in FDIC insurance premiums may adversely affect our earnings.
During 2008 and continuing in 2009, higher levels of bank failures have dramatically increased resolution costs of the FDIC and depleted the DIF. In addition, the FDIC instituted two temporary programs to further insure customer deposits at FDIC insured banks: deposit accounts are now insured up to $250,000 per customer (up from $100,000) and noninterest-bearing transactional accounts are currently fully insured (unlimited coverage). These programs have placed additional stress on the DIF.
In order to maintain a strong funding position and restore reserve ratios of the DIF, the FDIC has increased assessment rates of insured institutions. In addition, on November 12, 2009, the FDIC adopted a rule requiring banks to prepay three years’ worth of premiums to replenish the depleted insurance fund.
We are generally unable to control the amount of premiums that we are required to pay for FDIC insurance. If there are additional bank or financial institution failures, we may be required to pay even higher FDIC premiums than the recently increased levels. These announced increases and any future increases or required prepayments of FDIC insurance premiums may adversely impact our earnings.
We may experience increased delinquencies and credit losses.
Like other lenders, we face the risk that our customers will not repay their loans. Rising losses or leading indicators of rising losses (such as higher delinquencies, non-performing loans, or bankruptcy rates; lower collateral values; rising unemployment rates) may require us to increase our allowance for loan losses, which may degrade our profitability if we are unable to raise revenue or reduce costs to compensate for higher losses. In particular, we face the following risks in this area:
| • | Missed payments. Our customers may miss payments. Loan charge-offs (including from bankruptcies) are generally preceded by missed payments or other indications of worsening financial condition. Our reported delinquency levels measure these trends. Customers are more likely to miss payments during an economic downturn. In addition, we face the risk that |
PAGE 13
Item 1A. RISK FACTORS — continued
| consumer and commercial customer behavior may change (i.e. an increased unwillingness or inability to repay debt), causing a long-term rise in delinquencies and charge-offs. |
| • | Estimates of inherent losses. The credit quality of our portfolio can have a significant impact on our earnings. We allow for and reserve against credit risks based on our assessment of credit losses inherent in our loan portfolios. This process, which is critical to our financial results and condition, requires complex judgments, including forecasts of economic conditions, which may no longer be capable of accurate estimation. We may underestimate our inherent losses and fail to hold a loan loss allowance sufficient to account for these losses. Incorrect assumptions could lead to material underestimates of inherent losses and inadequate allowance for loan losses. In addition, our estimate of inherent losses impacts the amount of allowances we build to account for those losses. The increase or release of allowances impacts our current financial results. |
| • | Underwriting. Our ability to assess the credit worthiness of our customers may diminish. If the models and approaches we use to select, manage and underwrite our consumer and commercial customers become less predictive of future charge-offs (due, for example, to rapid changes in the economy, including the unemployment rate), our credit losses and returns may deteriorate. |
| • | Business mix. Our business mix could change in ways that could adversely affect credit losses. We participate in a mix of businesses with a broad range of credit loss characteristics. Consequently, changes in our business mix may change our charge-off rate. |
| • | Charge-off recognition. The rules governing charge-off recognition could change. We record charge-offs according to accounting and regulatory guidelines and rules. These guidelines and rules, including the Federal Financial Institutions Examination Council (“FFIEC”) Account Management Guidance, could require changes in our account management or loss allowance practices and cause our charge-offs to increase for reasons unrelated to the underlying performance of our portfolio. Such changes could have an adverse impact on our financial condition or results of operation. |
| • | Industry practices. Our charge-off and delinquency rates may be negatively impacted by industry developments, including new regulations applicable to our industry. |
| • | Collateral. Collateral could be insufficient to compensate us for loan losses. When customers default on their loans and we have collateral, we attempt to seize it. However, the value of the collateral may not be sufficient to compensate us for the amount of the unpaid loan and we may be unsuccessful in recovering the remaining balance from our customers. Particularly with respect to our commercial lending and mortgage activities, decreases in real estate values could adversely affect the value of property used as collateral for our loans and investments. Thus, the recovery of such property could be insufficient to compensate us for the value of these loans. |
| • | Western Pennsylvania concentration. Although our lending is geographically diversified, in general, our commercial loan portfolio is concentrated in western Pennsylvania. The regional economic conditions in the western Pennsylvania area affect the demand for our commercial products and services as well as the ability of our customers to repay their commercial loans and the value of the collateral securing these loans. A prolonged decline in the general economic conditions of the region in which we operate could have a material adverse effect on the performance of our commercial loan portfolio and our results of operations. |
Current levels of market volatility are unprecedented.
Dramatic declines in the U.S. housing market over the past two years, with falling home prices and increasing foreclosures and unemployment, have resulted in significant write-downs of asset values by other financial institutions, including government-sponsored enterprises, as well as major commercial
PAGE 14
Item 1A. RISK FACTORS — continued
and investment banks. Many lenders and institutional investors have reduced, and in some cases, ceased providing funding to borrowers, including other financial institutions, reflecting concern about the stability of financial markets, generally, and the strength of counterparties, specifically. This market turmoil and tightening of credit has led to an increased level of commercial and consumer delinquencies for financial institutions, a lack of confidence in the financial sector and increased volatility in the financial markets. The resulting economic pressure on consumers and lack of confidence in the financial markets may adversely affect S&T’s business, financial condition and results of operations. Specifically, the difficult market conditions may result in, among other things, deterioration in credit quality and/or a reduced demand for credit, which may have a resultant effect on S&T’s loan portfolio and allowance for loan losses.
Downturn in the local economies may adversely affect our business.
S&T’s business is concentrated in the western Pennsylvania area. As a result, its financial condition, results of operations and cash flows are subject to changes if there are changes in the economic conditions in this geographic region. A prolonged period of economic recession or other adverse economic conditions in this area could have a negative impact on S&T. S&T can provide no assurance that conditions in its market area economies will not deteriorate further in the future and that such deterioration would not have a material adverse effect on S&T.
The securities purchase agreement between S&T and the U.S. Treasury limits our ability to pay dividends on and repurchase our common stock.
The securities purchase agreement between S&T and the U.S. Treasury provides that prior to the earlier of (i) January 16, 2012 or (ii) the date on which all of the shares of the Series A Preferred Stock have been redeemed by S&T or transferred by the U.S. Treasury to third parties, we may not, without the consent of the U.S. Treasury: (a) increase the cash dividend on our common stock (above the dividend amount prior to the participation in the CPP), or (b) subject to limited exceptions, redeem, repurchase or otherwise acquire shares of our common stock or preferred stock other than the Series A Preferred Stock. In addition, we may only pay dividends on our common stock if we are current in our dividend payments on the Series A Preferred Stock. These restrictions, together with the potentially dilutive impact of the Warrant as described in the risk factor below, could have a negative effect on the value of our common stock. Moreover, holders of our common stock are entitled to receive dividends only when, as, and if declared by our Board of Directors. Although we have historically paid cash dividends on our common stock, we are not required to do so and our Board of Directors could reduce or eliminate our common stock dividend in the future.
We may be required to raise capital in the future, but that capital may not be available or may not be on acceptable terms when it is needed.
We are required by federal regulatory authorities to maintain adequate capital levels to support operations. Our ability to raise additional capital is dependent on capital market conditions at that time and on our financial performance. Current market conditions have made it harder to access capital, due to both decreased stock prices and the general decrease in available credit. If we cannot raise additional capital when needed, our ability to further expand operations through internal growth, acquisitions and deposit gathering could be materially impaired.
The Series A Preferred Stock impacts net income available to our common shareholders and earnings per common share, and the Warrant we issued to the U.S. Treasury may be dilutive to holders of our common stock.
The dividends declared on the Series A Preferred Stock will reduce the net income available to common shareholders and our earnings per common share. The Series A Preferred Stock will also
PAGE 15
Item 1A. RISK FACTORS — continued
receive preferential treatment in the event of liquidation, dissolution or winding up of S&T. Additionally, the ownership interest of the existing holders of our common stock will be diluted to the extent the Warrant we issued to the U.S. Treasury in conjunction with the sale to the U.S. Treasury of the Series A Preferred Stock is exercised. The shares of common stock underlying the Warrant represent approximately 1.8 percent of the shares of our common stock outstanding as of February 9, 2010 (including the shares issuable upon exercise of the Warrant in total shares outstanding). Although the U.S. Treasury has agreed not to vote any of the shares of common stock it receives upon exercise of the Warrant, a transferee of any portion of the Warrant or of any shares of common stock acquired upon exercise of the Warrant is not bound by this restriction.
If S&T does not adjust to changes in the financial services industry, its financial performance may suffer.
S&T’s future financial performance will depend in part on its ability to adjust to the changes in the financial services industry that are expected as a result of the financial crisis. These adjustments may include expanding its scope of available financial services to its customers, and in adjusting products and services to meet current economic conditions, comply with new federal laws and regulations. In addition to other banks, competitors include security dealers, brokers, mortgage bankers, investment advisors, finance and insurance companies. The current environment is, in part, a result of the overall decline in economic activity, the absence of liquidity in the markets, changes in regulation, changes in technology and product delivery systems and continued consolidation among financial service providers.
Interest rate movements impact the earnings of S&T.
S&T is exposed to interest rate risk, through the operations of its banking subsidiary, since substantially all of S&T Bank’s assets and liabilities are monetary in nature. Interest rate risk arises from market driven fluctuations in interest rates that affect cash flows, income, expense and value of financial instruments. S&T Bank’s earnings, like that of most financial institutions, largely depend on net interest income, which is the difference between the interest income earned on interest-earning assets, such as loans and investments, and the interest expense paid on interest-bearing liabilities, such as deposits and borrowings. In an increasing interest rate environment, the cost of funds sometimes increases more rapidly than the interest earned on the loans and securities because the primary source of funds are deposits with generally shorter maturities than the maturities on loans and investment securities. This could cause the net interest rate spread to compress and negatively impact S&T Bank’s profitability.
S&T’s business strategy includes growth plans through internal growth and acquisitions. Our financial condition and results of operations could be negatively affected if we fail to grow or fail to manage our growth effectively.
S&T intends to continue pursuing a profitable growth strategy. Our prospects must be considered in light of the risks, expenses and difficulties frequently encountered by companies in growth stages of development. We cannot assure you that we will be able to expand our market presence in our existing markets or successfully enter new markets or that any such expansion will not adversely affect our results of operations. Failure to manage our growth effectively could have a material adverse effect on our business, future prospects, financial condition or results of operations and could adversely affect our ability to successfully implement our business strategy. Also, if we grow more slowly than anticipated, our operating results could be materially adversely affected.
Our ability to grow successfully will depend on a variety of factors, including the continued availability of desirable business opportunities, the competitive responses from other financial institutions in our market areas and our ability to manage our growth. There can be no assurance that growth opportunities will be available or that growth will be successfully managed.
PAGE 16
Item 1B. UNRESOLVED STAFF COMMENTS
There were no unresolved comments received from the SEC regarding S&T’s periodic or current reports within the last 180 days prior to December 31, 2009.
S&T operates 55 banking offices in Allegheny, Armstrong, Blair, Butler, Cambria, Clarion, Clearfield, Indiana, Jefferson and Westmoreland counties of Pennsylvania.
S&T owns land and banking offices at the following 39 locations:
| 133 Philadelphia Street Armagh, PA 15920 |
111 Resort Plaza Drive Blairsville, PA 15717 |
205 East Market Street Blairsville, PA 15717 |
456 Main Street Brockway, PA 15824 | |||
| 209 Allegheny Boulevard Brookville, PA 15825 |
256 Main Street Brookville, PA 15825 |
410 Main Street Clarion, PA 16214 |
650 Main Street Clarion, PA 16214 | |||
| 85 Greensburg Street Delmont, PA 15626 |
100 South Chestnut Street Derry, PA 15627 |
35 West Scribner Avenue DuBois, PA 15801 |
614 Liberty Boulevard DuBois, PA 15801 | |||
| 200 Patchway Road Duncansville, PA 16635 |
196 Industrial Park Ebensburg, PA 15931 |
420 Pleasantview Drive & Ford City, PA 16226 |
920 Fifth Avenue Ford City, PA 16226 | |||
| 701 East Pittsburgh Street Greensburg, PA 15601 |
34 North Main Street Homer City, PA 15748 |
354 North Ave Indiana, PA 15701 |
355 North Fifth Street Indiana, PA 15701 | |||
| 501 Philadelphia Street Indiana, PA 15701 |
800 Philadelphia Street Indiana, PA 15701 |
2175 Route 286 South Indiana, PA 15701 |
4021 Route 130 Irwin, PA 15642 | |||
| 9350 Lincoln Highway Irwin, PA 15642 |
30 Towne Center Drive Leechburg, PA 15656 |
225 Lucerne Road Lucernemines, PA 15754 |
4385 Old Wm. Penn Hwy Monroeville, PA 15146 | |||
| 4251 Old Wm. Penn Hwy Murrysville, PA 15668 |
628 Broad Street New Bethlehem, PA 16242 |
301 Unity Center Road Pittsburgh, PA 15239 |
7660 Saltsburg Road Pittsburgh, PA 15239 | |||
| 12262 Frankstown Road Pittsburgh, PA 15235 |
232 North Hampton Avenue Punxsutawney, PA 15767 |
539 West Mahoning Street Punxsutawney, PA 15767 |
418 Main Street Reynoldsville, PA 15851 | |||
| 602 Salt Street Saltsburg, PA 15681 |
2190 Hulton Road Verona, PA 15147 |
100 South Fourth Street Youngwood, PA 15697 |
||||
S&T leases land where S&T owns the banking offices and remote ATM buildings at the following 11 locations:
| 1100 Logan Boulevard Altoona, PA 16602 |
220 New Castle Road Butler, PA 16001 |
8th & Merle Street Clarion, PA 16214 |
229 Westmoreland Drive, Route 30 Greensburg, PA 15601 | |||
| 835 Hospital Road Indiana, PA 15701 |
1107 Wayne Avenue Indiana, PA 15701 |
4580 Broadway Boulevard Monroeville, PA 15146 |
1077 Freeport Road Pittsburgh, PA 15238 | |||
| 2320 Route 286 Pittsburgh, PA 15239 |
12550 Perry Highway Wexford, PA 15090 |
2003 Lincoln Way White Oak, PA 15131 |
||||
PAGE 17
Item 2. PROPERTIES — continued
S&T leases land and banking offices at the following 15 locations:
| Coral Reef & Crooked Island Roads DuBois, PA 15801 |
DuBois Mall 5522 Shaffer
Road, |
20 North Pennsylvania Greensburg, PA 15601 |
4589 Route 136 Greensburg, PA 15601 | |||
| 2388 Route 286 Holiday Park, PA 15239 |
324 North Fourth Street Indiana, PA 15701 |
3100 Oakland Avenue Indiana, PA 15701 |
309 Main Street Irwin, PA 15642 | |||
| 2000 Penny Lane Jeannette, PA 15644 |
12 Hilltop Plaza Kittanning, PA 16201 |
3884 Route 30 East Latrobe, PA 15650 |
Two Gateway Center 603 Stanwix Street, Suite 125 Pittsburgh, PA 15222 | |||
| Shadyside Village 820
South Aiken Avenue |
6306 Forbes Avenue Pittsburgh, PA 15217 |
2001 Lincoln Way White Oak, PA 15131 |
||||
The nature of our business generates a certain amount of litigation involving matters arising in the ordinary course of business. However, in management’s opinion, there are no proceedings pending to which S&T is a party or to which our property is subject, which, if determined adversely to S&T, would be material in relation to our shareholders’ equity or financial condition. In addition, no material proceedings are pending nor are known to be threatened or contemplated against us by governmental authorities or other parties.
Item 4. SUBMISSION OF MATTERS TO A VOTE OF SECURITY HOLDERS
There were no matters during the fourth quarter of the fiscal year covered by this report that were submitted to a vote of our shareholders through solicitation of proxies or otherwise.
PAGE 18
Item 5. MARKET FOR REGISTRANT’S COMMON EQUITY, RELATED SHAREHOLDER MATTERS AND ISSUER PURCHASES OF EQUITY SECURITIES
Stock Prices and Dividend Information
S&T’s common stock is listed on the NASDAQ Global Select Market System (“NASDAQ”) under the symbol STBA. The range of sale prices for the years 2009 and 2008 is set forth in the table below and is based upon information obtained from NASDAQ. As of the close of business on February 9, 2010, there were 3,177 shareholders of record of S&T. Dividends paid by S&T are primarily provided from S&T Bank’s dividends to S&T. The payment of dividends by S&T Bank to S&T is subject to the restrictions described in Item 8, Note 14 Dividend and Loan Restrictions. The cash dividends declared shown below represent the historical per share amounts for S&T common stock.
| Price Range of Common Stock |
Cash Dividends Declared |
|||||||||
| 2009 | Low | High | ||||||||
| Fourth quarter |
$ | 12.15 | $ | 17.82 | $ | 0.00 | (1) | |||
| Third quarter |
10.49 | 18.25 | 0.15 | |||||||
| Second quarter |
11.62 | 25.24 | 0.15 | |||||||
| First quarter |
17.55 | 35.54 | 0.31 | |||||||
| 2008 | ||||||||||
| Fourth quarter |
$ | 25.37 | $ | 38.22 | $ | 0.31 | ||||
| Third quarter |
25.00 | 47.09 | 0.31 | |||||||
| Second quarter |
29.04 | 35.58 | 0.31 | |||||||
| First quarter |
25.78 | 34.09 | 0.31 | |||||||
| (1) | S&T’s Board of Directors (the “Board”) approved a change in timing of the declaration and payment of dividends to provide better alignment with quarterly earnings beginning in the fourth quarter 2009. The Board declared a $0.15 per common share cash dividend at its meeting held January 18, 2010. The dividend is payable February 25, 2010 to common shareholders of record on February 1, 2010. |
PAGE 19
Item 5. MARKET FOR REGISTRANT’S COMMON EQUITY, RELATED SHAREHOLDER MATTERS AND ISSUER PURCHASES OF EQUITY SECURITIES — continued
Five-Year Cumulative Total Return
The following chart compares the cumulative total shareholder return on S&T common stock with the cumulative total shareholder return of the NASDAQ Composite Index and NASDAQ Bank Index(1) assuming a $100 investment in each on December 31, 2004.
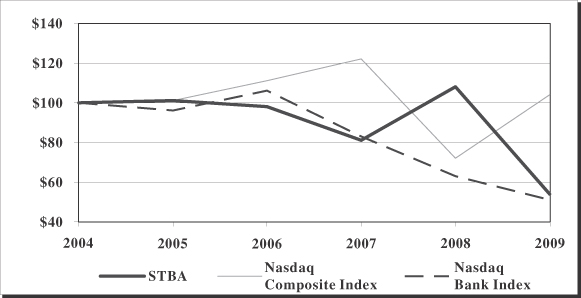
| 2004 | 2005 | 2006 | 2007 | 2008 | 2009 | |||||||||||||||
| STBA |
$ | 100 | $ | 101 | $ | 98 | $ | 81 | $ | 108 | $ | 54 | ||||||||
| Nasdaq Composite Index |
100 | 101 | 111 | 122 | 72 | 104 | ||||||||||||||
| Nasdaq Bank Index |
100 | 96 | 106 | 83 | 63 | 51 | ||||||||||||||
| (1) | The NASDAQ Bank Index contains securities of NASDAQ-listed companies classified according to the Industry Classification Benchmark as Banks. These companies include banks providing a broad range of financial services, including retail banking, loans and money transmissions. |
During 2009 and 2008, S&T’s Board did not authorize any additional buyback programs. On June 18, 2007, S&T’s Board authorized a buyback program of one million shares until June 30, 2008. During 2007, S&T repurchased 971,400 shares at an average cost of $32.74 per share. During 2009, S&T reissued 113,626 shares primarily through restricted stock awards and shares sold for the dividend reinvestment and thrift plans. During 2008, S&T reissued 2,751,749 shares to the former IBT shareholders and issued 330,092 shares through the exercise of employee stock options.
PAGE 20
Item 6. SELECTED FINANCIAL DATA
CONSOLIDATED STATEMENTS OF INCOME
| Years Ended December 31 | 2009 | 2008 | 2007 | 2006 | 2005 | |||||||||||
| (dollars in thousands, except per share data) | ||||||||||||||||
| Interest income |
$ | 195,087 | $ | 216,118 | $ | 215,605 | $ | 204,702 | $ | 172,122 | ||||||
| Interest expense |
49,105 | 72,171 | 99,167 | 91,584 | 59,514 | |||||||||||
| Provision for loan losses |
72,354 | 12,878 | 5,812 | 9,380 | 5,000 | |||||||||||
| Net Interest Income After Provision for Loan Losses |
73,628 | 131,069 | 110,626 | 103,738 | 107,608 | |||||||||||
| Noninterest income |
38,580 | 37,452 | 40,605 | 40,390 | 37,386 | |||||||||||
| Noninterest expense |
108,126 | 83,801 | 73,460 | 69,279 | 62,464 | |||||||||||
| Income Before Taxes |
4,082 | 84,720 | 77,771 | 74,849 | 82,530 | |||||||||||
| (Benefit) provision for income taxes |
(3,869 | ) | 24,517 | 21,627 | 21,513 | 24,287 | ||||||||||
| Net Income |
7,951 | 60,203 | 56,144 | 53,336 | 58,243 | |||||||||||
| Preferred stock dividends and amortization of discount |
5,913 | — | — | — | — | |||||||||||
| Net Income Available to Common Shareholders |
$ | 2,038 | $ | 60,203 | $ | 56,144 | $ | 53,336 | $ | 58,243 | ||||||
| Per Share Data |
||||||||||||||||
| Common earnings per share—basic |
$ | 0.07 | $ | 2.30 | $ | 2.27 | $ | 2.07 | $ | 2.21 | ||||||
| Common earnings per share—diluted |
0.07 | 2.28 | 2.26 | 2.06 | 2.18 | |||||||||||
| Dividends declared per common share |
0.61 | 1.24 | 1.21 | 1.17 | 1.13 | |||||||||||
| Common book value |
16.14 | 16.24 | 13.75 | 13.37 | 13.41 | |||||||||||
CONSOLIDATED BALANCE SHEETS
| December 31 | 2009 | 2008 | 2007 | 2006 | 2005 | ||||||||||
| (dollars in thousands) | |||||||||||||||
| Total assets |
$ | 4,170,475 | $ | 4,438,368 | $ | 3,407,621 | $ | 3,338,543 | $ | 3,194,979 | |||||
| Securities available-for-sale |
354,860 | 452,713 | 358,822 | 432,045 | 481,257 | ||||||||||
| Goodwill |
165,167 | 163,546 | 50,087 | 49,955 | 49,073 | ||||||||||
| Net loans |
3,344,827 | 3,526,027 | 2,762,594 | 2,633,071 | 2,454,934 | ||||||||||
| Total deposits |
3,304,541 | 3,228,416 | 2,621,825 | 2,565,306 | 2,418,884 | ||||||||||
| Securities sold under repurchase agreements and federal funds purchased |
44,935 | 113,419 | 100,258 | 133,021 | 137,829 | ||||||||||
| Short-term borrowings |
51,300 | 308,475 | 80,000 | 55,000 | 150,000 | ||||||||||
| Long-term borrowings |
85,894 | 180,331 | 201,021 | 171,941 | 83,776 | ||||||||||
| Junior subordinated debt securities |
90,619 | 90,619 | 25,000 | 25,000 | — | ||||||||||
| Total shareholders’ equity |
553,318 | 448,694 | 337,560 | 339,051 | 352,421 | ||||||||||
PAGE 21
Item 7. MANAGEMENT’S DISCUSSION AND ANALYSIS OF FINANCIAL CONDITION AND RESULTS OF OPERATIONS
Management’s Discussion and Analysis represents an overview of the consolidated results of operations and financial condition of S&T. This discussion and analysis should be read in conjunction with the Consolidated Financial Statements and Notes presented in Item 8 of this Report. Results of operations for the periods included in this review are not necessarily indicative of results to be obtained during any future periods.
IMPORTANT NOTE REGARDING FORWARD-LOOKING STATEMENTS
This Annual Report on Form 10-K contains or incorporates statements that S&T believes are “forward-looking statements” within the meaning of the Private Securities Litigation Reform Act of 1995. These statements generally relate to S&T’s financial condition, results of operations, plans, objectives, future performance or business. They usually can be identified by the use of forward-looking language such as “will likely result,” “may,” “are expected to,” “is anticipated,” “estimate,” “forecast,” “projected,” “intends to” or other similar words. You should not place undue reliance on these statements, as they are subject to risks and uncertainties, including but not limited to, those described in this Form 10-K or the documents incorporated by reference. When considering these forward-looking statements, you should keep in mind these risks and uncertainties, as well as any cautionary statements we may make. Moreover, you should treat these statements as speaking only as of the date they are made and based only on information then actually known to us. We undertake no obligation to update publicly any forward-looking statements, whether as a result of new information, future events or otherwise.
These forward-looking statements are based on current expectations, estimates and projections about S&T’s business, management’s beliefs and assumptions made by management. These statements are not guarantees of future performance and involve certain risks, uncertainties and assumptions (“Future Factors”), which are difficult to predict. Therefore, actual outcomes and results may differ materially from what is expressed or forecasted in these forward-looking statements.
Future Factors include:
| • | changes in interest rates, spreads on earning assets and interest-bearing liabilities, the shape of the yield curve and interest rate sensitivity; |
| • | credit losses; |
| • | sources of liquidity; |
| • | legislation affecting the financial services industry as a whole and/or S&T and its subsidiaries individually or collectively; |
| • | regulatory supervision and oversight, including required capital levels; |
| • | increasing price and product/service competition by competitors, including new entrants; |
| • | rapid technological developments and changes; |
| • | the ability to continue to introduce competitive new products and services on a timely, cost-effective basis; |
| • | the mix of products and services; |
| • | containing costs and expenses; |
| • | governmental and public policy changes, including environmental regulations; |
| • | reliance on large customers; |
| • | technological, implementation and cost and financial risks in large, multi-year contracts; |
| • | the outcome of pending and future litigation and governmental proceedings; |
| • | continued availability of financing; |
| • | financial resources in the amounts, at the times and on the terms required to support our future businesses; |
| • | changes in the local economy in the western Pennsylvania area; |
| • | managing our internal growth and acquisitions; |
PAGE 22
Item 7. MANAGEMENT’S DISCUSSION AND ANALYSIS OF FINANCIAL CONDITION AND RESULTS OF OPERATIONS — continued
| • | general economic or business conditions, either nationally or regionally, may be less favorable than expected, resulting in among other things, a reduced demand for credit and other services; |
| • | a decline in market capitalization to common book value which could warrant further analysis of the carrying value of goodwill and could result in an adjustment to its carrying value resulting in a charge to net income; and |
| • | a continuation of recent turbulence in significant portions of the global financial and real estate markets could impact our performance, both directly, by affecting our revenues and the value of our assets and liabilities and indirectly, by affecting the economy generally; |
These are representative of the Future Factors that could affect the outcome of the forward-looking statements. In addition, such statements could be affected by general industry and market conditions and growth rates, general economic conditions, including interest rate and currency exchange rate fluctuations and other Future Factors.
CRITICAL ACCOUNTING POLICIES AND JUDGMENTS
S&T’s Consolidated Financial Statements are prepared in accordance with U.S. generally accepted accounting principles (“GAAP”). Application of these principles requires management to make estimates, assumptions and judgments that affect the amounts reported in the Consolidated Financial Statements and accompanying notes. These estimates, assumptions and judgments are based on information available as of the date of the Consolidated Financial Statements; accordingly, as this information changes, the Consolidated Financial Statements could reflect different estimates, assumptions and judgments. Certain policies inherently are based to a greater extent on estimates, assumptions and judgments of management and, as such, have a greater possibility of producing results that could be materially different than originally reported.
The most significant accounting policies followed by S&T are presented in Note 1 Summary of Significant Accounting Policies in the Notes to Consolidated Financial Statements, which is included in Item 8 of the Report. These policies, along with the disclosures presented in the Notes to Consolidated Financial Statements, provide information on how significant assets and liabilities are valued in the Consolidated Financial Statements and how those values are determined.
Management views critical accounting policies to be those which are highly dependent on subjective or complex judgments, estimates and assumptions and where changes in those estimates and assumptions could have a significant impact on the Consolidated Financial Statements. Management currently views the determination of the securities valuation, allowance for loan losses, goodwill and other intangible assets and income taxes to be critical accounting policies.
Securities Valuation
Management determines the appropriate classification of securities at the time of purchase. All securities, including both debt and equity securities, are classified as available-for-sale securities. Such securities are carried at estimated fair value with net unrealized gains and losses deemed to be temporary reported separately as a component of other comprehensive income, net of tax. Realized gains and losses on the sale of available-for-sale securities and other-than-temporary impairment (“OTTI”) charges are recorded within noninterest income in the Consolidated Statements of Income. Realized gains and losses on the sale of securities are determined using the specific-identification method.
Management systematically evaluates securities for OTTI on a quarterly basis. S&T’s policy for OTTI within the marketable equity securities portfolio generally requires an impairment charge when the security is in a loss position for 12 consecutive months, unless facts and circumstances would suggest the need for an OTTI prior to that time. S&T’s policy for OTTI within the debt securities
PAGE 23
Item 7. MANAGEMENT’S DISCUSSION AND ANALYSIS OF FINANCIAL CONDITION AND RESULTS OF OPERATIONS — continued
portfolio is based upon a number of factors, including but not limited to, the length of time and extent to which the estimated fair value has been less than cost, the financial condition of the underlying issuer, the ability of the issuer to meet contractual obligations, the likelihood of the security’s ability to recover any decline in its estimated fair value, whether management intends to sell the security and it is more likely than not that management will be required to sell the investment security prior to the security recovery. If the financial markets continue to experience deterioration, additional charges to income could occur in future periods.
Allowance for Loan Losses
The allowance for loan losses addresses credit losses inherent in the existing loan portfolio and is presented as a reserve against loans on the Consolidated Balance Sheets. The liability for loss on loan commitments represents management’s estimate of probable losses associated with future advances against loan commitments. Determination of an adequate allowance for loan losses and liability for loss on loan commitments is inherently subjective, as it requires estimations of occurrence of future events, as well as timing of such events.
The allowance is increased by a provision charged to expense and reduced by charge-offs, net of recoveries. S&T’s periodic evaluation of the adequacy of the allowance for loan losses is determined by management through evaluation of the loss exposure on individual impaired, nonperforming, delinquent and high-dollar loans; review of risk conditions and business trends; historical loss experience and; growth and composition of the loan portfolio, as well as other relevant factors.
A quantitative analysis is utilized to support the adequacy of the allowance for loan losses. This analysis includes a review of the historical charge-offs that have occurred within segmented portfolios over the last five years. Management also assesses qualitative factors such as unemployment, non-accrual, loan growth, vacancy, classified loan, bank loss/recovery, delinquency and out of state risk trends. The allowance established for individual impaired loans reflects expected losses resulting from analyses developed through specific credit allocations for individual loans. The specific credit allocations are based on regular analysis of all loans over a fixed dollar amount, where the internal credit rating is at or below a predetermined classification. These analyses involve a high degree of judgment in estimating the amount of loss associated with specific impaired loans, including estimating the amount and timing of future cash flows, current estimated fair value of the loan and collateral values. The evaluation of these components of the allowance requires considerable judgment in order to estimate inherent loss exposures. Current risk factors, trends in risk ratings and historical charge-off experiences are considered in the determination of the allowance for loan losses.
The allowance for loan losses at December 31, 2009 includes $50.8 million or 85 percent of the allowance allocated to commercial and industrial and commercial real estate loans. These loans are generally larger in size and more vulnerable to an economic slowdown. The ability for customers to repay commercial loans is more dependent upon the success of their business, continuing income and general economic conditions. Accordingly, the risk of loss is higher on such loans than on residential real estate loans, which generally incur lower losses in the event of foreclosure as the collateral value typically exceeds the loan amounts.
There are many factors affecting the allowance for loan losses; some are quantitative, while others require qualitative judgment. Although management believes its process for determining the allowance adequately considers all of the factors that could potentially result in credit losses, the process includes subjective elements and may be susceptible to significant change. To the extent actual outcomes differ from management estimates, additional provisions for loan losses could be required and could adversely affect S&T’s earnings or financial position in future periods.
PAGE 24
Item 7. MANAGEMENT’S DISCUSSION AND ANALYSIS OF FINANCIAL CONDITION AND RESULTS OF OPERATIONS — continued
Goodwill and Other Intangible Assets
As of December 31, 2009, S&T had $9.4 million of core deposit and other intangible assets subject to amortization. S&T determined the amount of identifiable intangible assets at the time of acquisition based upon independent core deposit and insurance contract analyses. Intangible assets with finite useful lives are evaluated for impairment whenever events or changes in circumstances indicate that their carrying amount may not be recoverable. No triggering events occurred during the years ended December 31, 2009, 2008 and 2007, requiring an impairment analysis.
S&T’s goodwill relates to value inherent in the banking and insurance businesses and the value is dependent upon S&T’s ability to provide quality, cost-effective services in the face of free competition from other market participants on a regional basis. This ability relies upon continuing investments in processing systems, the development of value-added service features and the ease of use of S&T’s services. As such, goodwill value is supported ultimately by revenue that is driven by the volume of business transacted. A decline in earnings as a result of a lack of growth or the inability to deliver cost-effective services over sustained periods can lead to impairment of goodwill, which could adversely impact earnings in future periods.
The carrying value of goodwill is tested annually for impairment each October 1 or more frequently if indicators of impairment are present. The evaluation for impairment involves comparing the current estimated fair value of each reporting unit to its carrying value, including goodwill. S&T has three reporting units including: a Community Bank, Wealth Management and an Insurance Agency. At December 31, 2009, S&T had goodwill of $165.2 million, including $161.1 million at the Community Bank, representing 98 percent of total goodwill and $4.1 million at the Insurance Agency, representing 2 percent of total goodwill. If the current estimated fair value of a reporting unit exceeds its carrying value, no additional testing is required and an impairment loss is not recorded. If the estimated fair value of a reporting unit is less than the carrying value, further valuation procedures are performed and could result in an impairment of goodwill being recorded. Further valuation procedures would include allocating the estimated fair value to all assets and liabilities of the reporting unit to determine an implied goodwill value. If the implied goodwill value of a reporting unit is less than the carrying amount of that goodwill, an impairment loss is recognized in an amount equal to that excess. During the year, and on October 1, management’s analysis concluded that the estimated fair value exceeded the carrying value. As such, no goodwill impairment was recorded.
The current economic climate significantly impacted S&T’s business beginning in the first quarter of 2009. S&T reported an unprecedented net loss, primarily due to a significant deterioration in our loan portfolio. Concurrently, S&T experienced a significant decline in our market capitalization and our stock traded below common book value. Such events triggered a need to perform a step 1 valuation of goodwill impairment. Accordingly, S&T engaged a qualified third party valuation expert to perform a valuation of S&T’s Community Bank reporting unit as of April 30, 2009.
The third party expert utilized a valuation methodology consistent with current accounting literature to determine the estimated fair value of the reporting units. The valuation used both a market and income approach. The methodology consisted of techniques using comparable transactions, comparable peer analysis and a discounted future earnings analysis. The discounted future earnings analysis considered the costs of equity and weighted-average costs of capital to determine an appropriate discount rate. Further, the model assumed estimates of future growth rates that if not achieved could significantly impact the valuation. The valuation model is based upon estimates and is highly judgmental. The valuation resulted in the fair value of the Community Banking reporting unit exceeding carrying value by approximately 51 percent.
During the fourth quarter, management engaged the third party valuation expert to update the previous valuation model as our market capitalization was 3.5 percent above our carrying value. Further, certain assumptions used in the previous report may have changed, including the financial
PAGE 25
Item 7. MANAGEMENT’S DISCUSSION AND ANALYSIS OF FINANCIAL CONDITION AND RESULTS OF OPERATIONS — continued
forecast and the overall economic climate. The valuation techniques used were consistent with those described above and resulted in the estimated fair value of the Community Bank reporting unit exceeding its carrying value by approximately 10 percent. As such, no goodwill impairment was recorded.
The financial services industry and securities markets continue to be adversely affected by declining values of nearly all asset classes. If current economic conditions continue to result in a prolonged period of economic weakness, S&T’s business segments, including the Community Banking segment, may be adversely affected. This may result in impairment of goodwill and other intangible assets in the future. Any resulting impairment loss could have a material adverse impact on S&T’s financial condition and its results of operations.
Income Taxes
S&T estimates income tax expense based on amounts expected to be owed to the tax jurisdictions where S&T conducts business. On a quarterly basis, management assesses the reasonableness of its effective tax rate based upon its current estimate of the amount and components of net income, tax credits and the applicable statutory tax rates expected for the full year.
Deferred income tax assets and liabilities are determined using the asset and liability method and are reported in the Consolidated Balance Sheets. Under this method, the net deferred tax asset or liability is based on the tax effects of the differences between the book and tax basis of assets and liabilities and recognizes enacted changes in tax rate and laws. Deferred tax assets are recognized to the extent they exist and are subject to a valuation allowance based on management’s judgment that realization is more likely than not.
Accrued taxes represent the net estimated amount due to taxing jurisdictions and are reported in other liabilities in the Consolidated Balance Sheets. S&T evaluates and assesses the relative risks and appropriate tax treatment of transactions and filing positions after considering statutes, regulations, judicial precedent and other information and maintains tax accruals consistent with its evaluation of these relative risks and merits. Changes to the estimate of accrued taxes occur periodically due to changes in tax rates, interpretations of tax laws, the status of examinations being conducted by taxing authorities and changes to statutory, judicial and regulatory guidance. These changes, when they occur, can affect deferred taxes and accrued taxes, as well as the current period’s income tax expense and can be significant to the operating results of S&T.
Tax positions are recognized as a benefit only if it is “more likely than not” that the tax position would be sustained in a tax examination, with a tax examination being presumed to occur. The amount recognized is the largest amount of tax benefit that is greater than 50 percent likely of being realized on examination. For tax positions not meeting the “more likely than not” test, no tax benefit is recorded.
RECENT ACCOUNTING PRONOUNCEMENTS AND DEVELOPMENTS
Note 1 Summary of Significant Accounting Policies, Recently Issued Accounting Pronouncements in the Notes to the Consolidated Financial Statements, which is included in Item 8 of this Report, discusses new accounting pronouncements adopted by S&T and the expected impact of accounting pronouncements recently issued or proposed, but not yet required to be adopted.
EXECUTIVE OVERVIEW
S&T is a financial holding company with its headquarters located in Indiana, Pennsylvania with assets of approximately $4.2 billion at December 31, 2009. S&T provides a full range of financial services through a branch network of 55 offices located in Allegheny, Armstrong, Blair, Butler, Cambria, Clarion, Clearfield, Indiana, Jefferson and Westmoreland counties of Pennsylvania. S&T provides full
PAGE 26
Item 7. MANAGEMENT’S DISCUSSION AND ANALYSIS OF FINANCIAL CONDITION AND RESULTS OF OPERATIONS — continued
service retail and commercial banking products as well as cash management services; insurance; estate planning and administration; employee benefit investment management and administration; corporate services; and other fiduciary services. S&T earns revenue primarily from interest on loans, security investments and fees charged for financial services provided to our customers. Offsetting these revenues are the cost of deposits and other funding sources, provision for loan losses as well as other operating costs such as: salaries and employee benefits, occupancy, data processing expenses and tax expense. S&T’s strategic plan to deliver profitable growth to our shareholders includes: increasing loans and core deposits with sufficient interest rate spreads, controlling loan delinquency and loan losses, controlling operating expenses and expanding the business through new de novo branching, mergers and acquisitions, introduction of new products and services and expansion of our products and services provided to our existing customers. S&T’s common stock trades on the Nasdaq Global Select Market under the symbol “STBA.”
Recent turbulence in significant portions of the global financial and real estate markets has adversely impacted our performance, primarily due to higher provision for loan losses, which resulted from the significant increase in loan charge-offs and the general deterioration of the credit quality of the loan portfolio. The area of commercial loans has been and continues to be the subject of considerable management focus and review. During 2009, S&T implemented or enhanced various new policies and procedures including: monitoring, funding, risk ratings, stress testing and compliance for the area of commercial loans. Nonperforming assets totaled $95.4 million or 2.29 percent of total assets at December 31, 2009 as compared to $43.3 million or 0.98 percent at December 31, 2008.
Earnings assets have decreased $262.2 million over the past 12 months, driven by a $164.3 million decrease in loans and $97.9 million decrease in investment securities. The loan decrease is primarily due to reduced demand for commercial real estate financing and development in the market and less credit demand and utilization by businesses responding to the recessionary economic environment. A significant portion of maturing investment securities were not replaced in 2009 as the risk and reward for leveraging activities was significantly reduced in a volatile interest rate environment.
Investment security losses for 2009 were $5.1 million compared to $1.7 million of losses during 2008. Included in the 2009 results is $5.3 million of OTTI charges on 17 bank equity holdings. The equity securities portfolio currently has an estimated fair value of $12.2 million at December 31, 2009, as compared to $14.9 million at December 31, 2008. During the past two years, S&T has implemented a strategy to methodically sell holdings in this portfolio and only retain strategic positions in bank holding companies within our market area.
On January 16, 2009, S&T completed a $108.7 million capital raise as a participant in the U.S. Treasury Capital Purchase Program (the “CPP”). See Item 1. Business, Capital Purchase Program for additional information.
During 2009, S&T has reduced borrowings since participation in the CPP provided increased liquidity. The decrease in borrowings is also the result of decreased loan demand as consumers and businesses react to the economic slowdown, as well as maturing investment securities that were not replaced as an S&T Asset Liability Committee (“ALCO”) strategy to mitigate interest rate and liquidity risk. As a result, total assets at December 31, 2009 decreased from total assets at December 31, 2008 from $4.4 billion to $4.2 billion. S&T plans to obtain regulatory approval for repayment of these funds once a positive direction in the economy becomes clearer and S&T returns to more normalized earnings levels.
There are many uncertainties regarding the economy as S&T enters 2010. S&T continually strives to be well positioned for changes in both the economy and interest rates, regardless of the timing or direction of these changes. Management continually assesses our balance sheet, capital, liquidity and operation infrastructures in order to be positioned to take advantage of internal or acquisition growth
PAGE 27
Item 7. MANAGEMENT’S DISCUSSION AND ANALYSIS OF FINANCIAL CONDITION AND RESULTS OF OPERATIONS — continued
opportunities. During 2009 liquidity improved due to participation in the CPP, decreases in loan and security balances, stable deposit levels and a larger borrowing capacity at the FHLB which resulted from reduced borrowings. At December 31, 2009, S&T is in an asset sensitive position which will well position us for any potential increase in interest rates in the future.
There are many factors that could influence our results, both positively and negatively, in 2010. Because the majority of our revenue comes from net interest income, internally generated loan and deposit growth and the mix of that growth are major factors on our operations and financial condition. S&T has directed a fair amount of focus and resources in planning for 2010 to improve our generation and retention of low cost core deposits. On the other hand, a continuation of the economic slowdown, regionally or nationally, could cause deterioration in the asset quality measurements. S&T recognizes that our shift to a greater dependence on commercial loans in recent years exposes us to larger credit risks and greater swings in nonperforming loans and loan charge-offs when problems do occur.
RESULTS OF OPERATIONS
Year Ended December 31, 2009
Net Income
S&T had net income available to common shareholders of $2.0 million or $0.07 diluted earnings per share for 2009 as compared to net income available to common shareholders of $60.2 million or $2.28 diluted earnings per share for 2008. The decrease in net income for 2009 compared to 2008 was primarily the result of higher provision for loan losses, which was necessitated by the significant increase in loan charge-offs and the general deterioration of the credit quality in the loan portfolio, increased Federal Deposit Insurance Corporation (“FDIC”) premiums and surcharges and OTTI for equity investments.
Return on Equity and Assets
The table below presents consolidated operating and capital ratios of S&T for each of the last three years:
| Years Ended December 31 | |||||||||
| 2009 | 2008 | 2007 | |||||||
| Common return on average assets |
0.05 | % | 1.52 | % | 1.68 | % | |||
| Common return on average equity |
0.37 | % | 14.77 | % | 16.97 | % | |||
| Dividend payout ratio |
12.48 | % | 53.66 | % | 53.06 | % | |||
| Common equity to asset ratio |
10.74 | % | 10.11 | % | 9.91 | % | |||
Net Interest Income
| Years Ended December 31 | |||||||||
| 2009 | 2008 | 2007 | |||||||
| (dollars in thousands) | |||||||||
| Interest income per Consolidated Statements of Income |
$ | 195,087 | $ | 216,118 | $ | 215,605 | |||
| Adjustment to fully taxable-equivalent basis |
5,202 | 5,147 | 4,727 | ||||||
| Interest income adjusted to fully taxable-equivalent basis |
200,289 | 221,265 | 220,332 | ||||||
| Interest expense |
49,105 | 72,171 | 99,167 | ||||||
| Net Interest Income Adjusted to Fully Taxable-equivalent Basis |
$ | 151,184 | $ | 149,094 | $ | 121,165 | |||
PAGE 28
Item 7. MANAGEMENT’S DISCUSSION AND ANALYSIS OF FINANCIAL CONDITION AND RESULTS OF OPERATIONS — continued
Average Balance Sheet and Net Interest Income Analysis
The following table reconciles interest income per the Consolidated Statements of Income to net interest income adjusted to a fully taxable-equivalent basis:
| December 31 | ||||||||||||||||||||||||||||||
| 2009 | 2008 | 2007 | ||||||||||||||||||||||||||||
| Average Balance |
Interest | Yield/ Rate |
Average Balance |
Interest | Yield/ Rate |
Average Balance |
Interest | Yield/ Rate |
||||||||||||||||||||||
| (dollars in thousands) | ||||||||||||||||||||||||||||||
| ASSETS |
||||||||||||||||||||||||||||||
| Loans(1)(2) |
$ | 3,473,169 | $ | 182,767 | 5.26 | % | $ | 3,230,791 | $ | 201,547 | 6.24 | % | $ | 2,731,807 | $ | 202,032 | 7.40 | % | ||||||||||||
| Taxable investment securities |
286,295 | 11,897 | 4.16 | % | 303,442 | 13,651 | 4.50 | % | 301,115 | 13,576 | 4.51 | % | ||||||||||||||||||
| Tax-exempt investment securities(2) |
103,832 | 5,624 | 5.42 | % | 105,781 | 5,429 | 5.13 | % | 81,200 | 4,001 | 4.93 | % | ||||||||||||||||||
| Federal Home Loan Bank |
23,542 | — | — | % | 20,733 | 636 | 3.07 | % | 12,144 | 687 | 5.66 | % | ||||||||||||||||||
| Federal funds sold |
258 | 1 | 0.25 | % | 124 | 2 | 1.90 | % | 728 | 36 | 4.92 | % | ||||||||||||||||||
| Total Interest-earning Assets(3) |
3,887,096 | 200,289 | 5.15 | % | 3,660,871 | 221,265 | 6.04 | % | 3,126,994 | 220,332 | 7.05 | % | ||||||||||||||||||
| Noninterest-earning assets: |
||||||||||||||||||||||||||||||
| Cash and due from banks |
67,405 | 60,636 | 53,702 | |||||||||||||||||||||||||||
| Premises and equipment, net |
41,915 | 41,702 | 36,320 | |||||||||||||||||||||||||||
| Other assets |
320,857 | 246,895 | 154,158 | |||||||||||||||||||||||||||
| Less allowance for loan losses |
(57,985 | ) | (39,102 | ) | (35,072 | ) | ||||||||||||||||||||||||
| Total |
$ | 4,259,288 | $ | 3,971,002 | $ | 3,336,102 | ||||||||||||||||||||||||
| LIABILITIES AND SHAREHOLDERS’ EQUITY |
||||||||||||||||||||||||||||||
| Interest-bearing liabilities: |
||||||||||||||||||||||||||||||
| NOW/Money market accounts |
$ | 485,742 | $ | 1,616 | 0.33 | % | $ | 395,629 | $ | 3,022 | 0.76 | % | $ | 295,099 | $ | 3,524 | 1.19 | % | ||||||||||||
| Savings deposits |
758,216 | 3,465 | 0.46 | % | 865,839 | 11,692 | 1.35 | % | 922,333 | 33,956 | 3.68 | % | ||||||||||||||||||
| Certificates of deposit |
1,367,372 | 33,358 | 2.44 | % | 1,102,717 | 37,650 | 3.41 | % | 934,673 | 42,106 | 4.51 | % | ||||||||||||||||||
| Federal funds purchased |
115 | 1 | 0.79 | % | 4,886 | 122 | 2.52 | % | 14,485 | 786 | 5.42 | % | ||||||||||||||||||
| Securities sold under repurchase agreements |
86,616 | 140 | 0.16 | % | 124,005 | 1,627 | 1.31 | % | 81,686 | 3,446 | 4.22 | % | ||||||||||||||||||
| Short-term borrowings |
104,217 | 544 | 0.52 | % | 227,918 | 4,263 | 1.87 | % | 44,214 | 2,325 | 5.26 | % | ||||||||||||||||||
| Long-term borrowings |
127,045 | 5,568 | 4.38 | % | 196,901 | 9,416 | 4.78 | % | 211,347 | 11,329 | 5.36 | % | ||||||||||||||||||
| Subordinated debt |
90,619 | 4,413 | 4.87 | % | 69,872 | 4,379 | 6.27 | % | 25,000 | 1,695 | 6.78 | % | ||||||||||||||||||
| Total Interest-bearing Liabilities(3) |
3,019,942 | 49,105 | 1.63 | % | 2,987,767 | 72,171 | 2.42 | % | 2,528,837 | 99,167 | 3.92 | % | ||||||||||||||||||
| Noninterest-bearing liabilities: |
||||||||||||||||||||||||||||||
| Demand deposits |
637,434 | 533,096 | 441,647 | |||||||||||||||||||||||||||
| Other |
57,377 | 42,478 | 34,866 | |||||||||||||||||||||||||||
| Shareholders’ equity |
544,535 | 407,661 | 330,752 | |||||||||||||||||||||||||||
| Total |
$ | 4,259,288 | $ | 3,971,002 | $ | 3,336,102 | ||||||||||||||||||||||||
| Net interest income |
$ | 151,184 | $ | 149,094 | $ | 121,165 | ||||||||||||||||||||||||
| Net yield on interest-earning assets |
3.89 | % | 4.07 | % | 3.87 | % | ||||||||||||||||||||||||
| (1) | For the purpose of these computations, nonaccruing loans are included in the daily average loan amounts outstanding. |
| (2) | Tax-exempt income is on a fully taxable-equivalent basis, including the dividend-received deduction for equity securities, using the statutory federal corporate income tax rate of 35 percent for 2009, 2008 and 2007. |
| (3) | Yields are calculated using historical cost basis. |
PAGE 29
Item 7. MANAGEMENT’S DISCUSSION AND ANALYSIS OF FINANCIAL CONDITION AND RESULTS OF OPERATIONS — continued
The following tables present a summary of the changes in interest earned and interest paid resulting from changes in volume and changes in rates:
| 2009 Compared to 2008 Increase (Decrease) Due to(1) |
2008 Compared to 2007 Increase (Decrease) Due to(1) |
|||||||||||||||||||||||
| Volume | Rate | Net | Volume | Rate | Net | |||||||||||||||||||
| (dollars in thousands) | ||||||||||||||||||||||||
| Interest earned on: |
||||||||||||||||||||||||
| Loans(2) |
$ | 15,120 | $ | (33,900 | ) | $ | (18,780 | ) | $ | 36,903 | $ | (37,388 | ) | $ | (485 | ) | ||||||||
| Taxable investment securities |
(771 | ) | (983 | ) | (1,754 | ) | 105 | (30 | ) | 75 | ||||||||||||||
| Tax-exempt investment securities(2) |
(100 | ) | 295 | 195 | 1,211 | 217 | 1,428 | |||||||||||||||||
| Other investments |
86 | (722 | ) | (636 | ) | 486 | (537 | ) | (51 | ) | ||||||||||||||
| Federal funds sold |
3 | (4 | ) | (1 | ) | (30 | ) | (4 | ) | (34 | ) | |||||||||||||
| Total Interest-earning Assets |
14,338 | (35,314 | ) | (20,976 | ) | 38,675 | (37,742 | ) | 933 | |||||||||||||||
| Interest paid on: |
||||||||||||||||||||||||
| NOW/Money market accounts |
688 | (2,094 | ) | (1,406 | ) | 1,201 | (1,703 | ) | (502 | ) | ||||||||||||||
| Savings deposits |
(1,453 | ) | (6,774 | ) | (8,227 | ) | (2,080 | ) | (20,184 | ) | (22,264 | ) | ||||||||||||
| Certificates of deposit |
9,036 | (13,328 | ) | (4,292 | ) | 7,570 | (12,026 | ) | (4,456 | ) | ||||||||||||||
| Federal funds purchased |
(119 | ) | (2 | ) | (121 | ) | (521 | ) | (143 | ) | (664 | ) | ||||||||||||
| Securities sold under repurchase agreements |
(491 | ) | (996 | ) | (1,487 | ) | 1,785 | (3,604 | ) | (1,819 | ) | |||||||||||||
| Short-term borrowings |
(2,314 | ) | (1,405 | ) | (3,719 | ) | 9,660 | (7,722 | ) | 1,938 | ||||||||||||||
| Long-term borrowings |
(3,341 | ) | (507 | ) | (3,848 | ) | (774 | ) | (1,139 | ) | (1,913 | ) | ||||||||||||
| Subordinated debt |
1,300 | (1,266 | ) | 34 | 3,042 | (358 | ) | 2,684 | ||||||||||||||||
| Total Interest-bearing Liabilities |
3,306 | (26,372 | ) | (23,066 | ) | 19,883 | (46,879 | ) | (26,996 | ) | ||||||||||||||
| Change in Net Interest Income |
$ | 11,032 | $ | (8,942 | ) | $ | 2,090 | $ | 18,792 | $ | 9,137 | $ | 27,929 | |||||||||||
| (1) | The change in interest due to both volume and rate has been allocated to volume and rate changes in proportion to the relationship of the absolute dollar amounts of the change in each. |
| (2) | Tax-exempt income is on a fully taxable-equivalent basis using the statutory federal corporate income tax rate of 35 percent for 2009, 2008 and 2007. |
Net interest income represents the difference between the interest and fees earned on interest-earning assets and the interest paid on interest-bearing liabilities. Net interest income is affected by changes in the volume of interest-earning assets and interest-bearing liabilities and changes in interest yields and rates. Therefore, maintaining consistent spreads between earning assets and interest-bearing liabilities is very significant to our financial performance because net interest income comprised 78 percent and 79 percent of operating revenue (net interest income plus noninterest income, excluding security gains) in 2009 and 2008, respectively. The level and mix of earning assets and funds are continually monitored by ALCO in order to mitigate the interest-rate sensitivity and liquidity risks of the balance sheet. A variety of ALCO strategies were successfully implemented, within prescribed ALCO risk parameters, to maintain an acceptable net interest margin given the challenges of the current interest rate environment.
On a fully taxable-equivalent basis, net interest income increased $2.1 million or 1 percent in 2009 compared to 2008. Net interest income increases in 2009 are primarily the result of a $226.2 million increase in average interest-earning assets, primarily driven by $425.8 million average
PAGE 30
Item 7. MANAGEMENT’S DISCUSSION AND ANALYSIS OF FINANCIAL CONDITION AND RESULTS OF OPERATIONS — continued
interest-earning assets acquired through the IBT acquisition in the second quarter 2008. The net interest margin on a fully taxable-equivalent basis was 3.89 percent in 2009 as compared to 4.07 percent in 2008. The net interest margin was negatively affected in 2009 by higher delinquent interest, lower repricing spreads in 2009 on variable rate loans and the inability to reduce core deposit rates by the same level of reduction in other short-term rates. During 2009, S&T implemented an ALCO strategy to deleverage the balance sheet from a securities perspective. A decrease in loans and securities, along with funds received in the CPP, has provided a significant opportunity to pay down borrowings and reduce the need to aggressively solicit deposits. Average borrowings have decreased $215.0 million from December 31, 2008.
For 2009, average loans increased $242.4 million and average securities and federal funds sold decreased $16.2 million as compared to 2008. S&T acquired $278.5 million of average loans and $147.3 million of average securities with the IBT acquisition. As previously mentioned, our strategy has been to not replace maturing investment securities as the risk and reward for leveraging activities has been significantly reduced in a volatile interest rate environment. The yields on average loans decreased 98 basis points and the yield on average securities decreased 35 basis points from 2008. Overall yields on interest-earning assets were 5.15 percent and 6.04 percent for the years ended December 31, 2009 and 2008, respectively.
For 2009, balances of average interest-bearing deposits increased by $247.1 million as compared to 2008. S&T acquired $326.0 million of average deposits with the IBT acquisition. The cost of deposits totaled 1.18 percent, a decrease of 62 basis points from 2008 due to lower rates paid on both core and certificates of deposit. The cost of REPOs and other borrowed funds decreased 57 basis points to 2.61 percent as a result of lower short-term rates as compared to 2008. Overall funding costs decreased 79 basis points to 1.63 percent at December 31, 2009 as compared to December 31, 2008. Positively affecting net interest income was a $194.0 million increase in average net free funds during the year ended December 31, 2009 as compared to 2008. Average net free funds are the excess of demand deposits, other noninterest-bearing liabilities and shareholders’ equity over nonearning assets. The increase is primarily due to successful marketing of new demand accounts and corporate cash management services and increased equity due to the participation in the CPP.
Interest on loans to and obligations of state, municipalities and other public entities are not subject to federal income tax. As such, the stated (pre-tax) yield on these assets is lower than the yields on taxable assets of similar risk and maturity. In order to make the pre-tax income and resultant yields comparable to taxable loans and investments, a taxable-equivalent adjustment was added to interest income in the tables below. This adjustment is calculated using the U.S. federal statutory corporate income tax rate of 35 percent for 2009, 2008 and 2007.
Provision for Loan Losses
The provision for loan losses was $72.4 million and $12.9 million for 2009 and 2008, respectively. The $72.4 million provision for 2009 is primarily a result of net charge-offs of $55.5 million, a $9.9 million increase in specific reserves and a $7.0 million increase in general reserves.
The increase in specific reserves is primarily a result of the commercial credits that are discussed in detail below. The increase in general reserves is primarily the result of an increase in overall risk (both macroeconomic and specific portfolio risks) combined with enhancements in methodology. Specifically, the increased macroeconomic risks were unemployment and commercial real estate vacancy trends and the increased specific portfolio risks were nonaccrual loans, delinquent loans, classified loans, net charge-offs and delinquency trends and out-of-state loans. All of these increases were partially offset by a decrease in loan growth during 2009.
During 2009 S&T introduced three enhancements in its methodology. The first enhancement was the addition of an out-of-state risk factor, which increased the general reserves for commercial real
PAGE 31
Item 7. MANAGEMENT’S DISCUSSION AND ANALYSIS OF FINANCIAL CONDITION AND RESULTS OF OPERATIONS — continued
estate loans. The second enhancement was the expansion of the risk rating scale assigned for the qualitative factors in response to the current economic environment, which also had the effect of increasing general reserves. The third enhancement was a change in the baseline for loss history from a seven year absolute high to a five year average combined with the qualitative adjusted factors. Management believes that these enhancements are more indicative of the loan losses over the economic life cycle of the loan segments.
The provision is the result of management’s assessment of credit quality statistics and other factors that would have an impact on probable losses in the loan portfolio and the model used for determination of the adequacy of the allowance for loan losses. Enhancements within the allowance for loan loss model are directionally consistent with the increase in nonperforming loans and classified loan trends, loan charge-off levels and the impact of the troubled commercial loan relationships during 2009. Credit quality is the most important factor in determining the amount of the allowance for loan losses and the resulting provision.
During 2009, S&T had an increase in delinquencies, classified and nonperforming loan levels, primarily due to the commercial credits discussed below and an overall slowdown in the economy that is affecting all segments of the loan portfolio. Nonaccrual loans to total loans increased to 2.67 percent at December 31, 2009 as compared to 1.19 percent at December 31, 2008. Also affecting the amount of the allowance for loan losses and resulting provision, are increases in several qualitative risk factors within the loan loss reserve model based on observations regarding both economic conditions and changes in overall asset quality. For 2009, net loan charge-offs were $55.5 million compared to net loan charge-offs of $10.0 million for 2008. The most significant net charge-offs in 2009 were a $26.5 million charge-off for a $30.3 million commercial relationship with an energy exploration and drilling company with a remaining exposure of $2.7 million, $8.2 million for three Florida lot development projects with a remaining exposure in Florida of $3.3 million, $5.0 million for two commercial real estate projects in New York and Connecticut with a remaining exposure of $3.9 million, $7.7 million for a mixed use commercial property that lost a major tenant with a remaining exposure of $3.7 million, $2.5 million for a commercial and industrial loan secured by assignment of partnership interests which are uncertain due to legal issues among the partners, $1.1 million for a $2.4 million office building that was foreclosed and sold during the first quarter of 2009, $1.1 million for a regional restaurant that entered into bankruptcy, $0.6 million for a multi-family development project in western Pennsylvania, $0.6 million for a retail sales company which discontinued operations and $0.6 million for condominium construction loans in western Pennsylvania.
PAGE 32
Item 7. MANAGEMENT’S DISCUSSION AND ANALYSIS OF FINANCIAL CONDITION AND RESULTS OF OPERATIONS — continued
Noninterest Income
| Years Ended December 31 | 2009 | 2008 | $ Change | % Change | |||||||||||
| (dollars in thousands) | |||||||||||||||
| Security losses, net |
$ | (5,088 | ) | $ | (1,651 | ) | $ | (3,437 | ) | (208 | )% | ||||
| Service charges on deposit accounts |
12,942 | 12,322 | 620 | 5 | % | ||||||||||
| Wealth management fees |
7,500 | 7,967 | (467 | ) | (6 | )% | |||||||||
| Letter of credit fees |
1,721 | 1,761 | (40 | ) | (2 | )% | |||||||||
| Insurance fees |
7,751 | 8,096 | (345 | ) | (4 | )% | |||||||||
| Mortgage banking |
2,727 | (305 | ) | 3,032 | 994 | % | |||||||||
| Debit and credit card fees |
6,921 | 5,910 | 1,011 | 17 | % | ||||||||||
| Other income: |
|||||||||||||||
| Derivative fee income |
406 | 1,050 | (644 | ) | (61 | )% | |||||||||
| Commercial loan rate swap valuation |
(616 | ) | 98 | (714 | ) | (729 | )% | ||||||||
| Rabbi trust |
643 | (1,602 | ) | 2,245 | 140 | % | |||||||||
| Other |
3,673 | 3,806 | (133 | ) | (3 | )% | |||||||||
| Total Other Noninterest Income |
4,106 | 3,352 | 754 | 22 | % | ||||||||||
| Total Noninterest Income |
$ | 38,580 | $ | 37,452 | $ | 1,128 | 3 | % | |||||||
Noninterest income increased $1.1 million or 3 percent, to $38.6 million in 2009 as compared to 2008. Increases included $0.6 million or 5 percent in service charges on deposit accounts, $3.0 million in mortgage banking fees, $1.0 million in debit and credit card revenues and $0.8 million in other noninterest income, offset by decreases of $0.5 million or 6 percent in wealth management fees and $0.1 million or 2 percent in letter of credit fees and $0.3 million or 4 percent in insurance commissions. The increase of $0.6 million or 5 percent in service charges on deposit fees is primarily related to the increased customer base resulting from the IBT acquisition, as well as the organic expansion of demand deposit accounts. Decreases of $0.5 million in wealth management fees and are primarily attributable to current market conditions for these lines of business, $0.1 million in letter of credit fees is attributable to customer preferences for this type of product and $0.3 million in insurance commissions due to the current soft market. The increase of $3.0 million in mortgage banking fees is a result of record origination levels in mortgage banking activities during the year ended December 31, 2009 as consumers sought to refinance existing loans at lower interest rates. The increase of $1.0 million in debit and credit card revenues is a result of an increased customer base from the IBT acquisition. The increases of $0.8 million in other noninterest income are primarily related to the deferred compensation plan valuations, offset by a $0.6 million charge for the additional credit exposure on an exited commercial swap asset as well decreased derivative fee income during the year.
S&T recognized $5.1 million of net losses primarily on available-for-sale equity securities in the year ended December 31, 2009 as compared to $1.7 million of net losses in 2008. The investment security losses for the year ended December 31, 2009 are primarily OTTI charges on 17 bank equity holdings totaling $5.3 million. S&T has implemented a strategy to methodically sell equity holdings in the available-for-sale equity portfolio and only retain strategic positions in bank holding companies within our market area.
PAGE 33
Item 7. MANAGEMENT’S DISCUSSION AND ANALYSIS OF FINANCIAL CONDITION AND RESULTS OF OPERATIONS — continued
Noninterest Expense
| Years Ended December 31 | 2009 | % of Noninterest Expense |
2008 | % of Noninterest Expense |
$ Change | % Change | ||||||||||||||
| (dollars in thousands) | ||||||||||||||||||||
| Salaries and employee benefits |
$ | 48,848 | 45.2 | % | $ | 42,708 | 51.0 | % | $ | 6,140 | 14 | % | ||||||||
| Occupancy, net |
6,819 | 6.3 | % | 6,416 | 7.7 | % | 403 | 6 | % | |||||||||||
| Furniture and equipment |
5,067 | 4.7 | % | 4,479 | 5.3 | % | 588 | 13 | % | |||||||||||
| Other taxes |
3,733 | 3.4 | % | 3,017 | 3.6 | % | 716 | 24 | % | |||||||||||
| Data processing |
6,048 | 5.6 | % | 5,488 | 6.6 | % | 560 | 10 | % | |||||||||||
| Amortization of intangibles |
2,308 | 2.1 | % | 1,055 | 1.3 | % | 1,253 | 119 | % | |||||||||||
| FDIC assessment |
8,388 | 7.8 | % | 409 | 0.5 | % | 7,979 | 1951 | % | |||||||||||
| Other operating expenses: |
||||||||||||||||||||
| Unfunded loan commitments |
2,888 | 2.7 | % | 1,025 | 1.2 | % | 1,863 | 182 | % | |||||||||||
| Joint venture impairment and amortization |
4,393 | 4.1 | % | 2,795 | 3.3 | % | 1,598 | 57 | % | |||||||||||
| Loan collection fees |
1,325 | 1.2 | % | 261 | 0.3 | % | 1,064 | 407 | % | |||||||||||
| Professional consulting |
1,897 | 1.8 | % | 1,374 | 1.6 | % | 523 | 38 | % | |||||||||||
| Other real estate owned |
759 | 0.7 | % | (294 | ) | (0.3 | )% | 1,053 | 358 | % | ||||||||||
| Legal |
2,323 | 2.1 | % | 1,211 | 1.4 | % | 1,112 | 92 | % | |||||||||||
| Marketing |
2,751 | 2.5 | % | 3,180 | 3.8 | % | (429 | ) | (14 | )% | ||||||||||
| Other |
10,579 | 9.8 | % | 10,677 | 12.7 | % | (98 | ) | 1 | % | ||||||||||
| Total Other Operating Expenses |
26,915 | 20,229 | 6,686 | 33 | % | |||||||||||||||
| Total Noninterest Expense |
$ | 108,126 | 100.0 | % | $ | 83,801 | 100.0 | % | $ | 24,325 | 29 | % | ||||||||
Noninterest expense increased by $24.3 million or 29 percent during 2009 compared to 2008. Salaries and employee benefit expense increased $6.1 million or 14 percent primarily attributable to the addition of 56 full-time equivalent staff, due to the addition of IBT retained staff, normal year-end merit increases and increased pension expenses as a result of market declines in the portfolio and increased medical plans expenses. Salaries and employee benefits were positively affected by reduced accruals for incentives as a result of decreased earnings performance for 2009 as well as a reduction in employee stock appreciation rights valuation expense resulting from a decrease in S&T stock estimated fair value.
S&T’s net periodic defined benefit plan cost is based primarily on three assumptions: the discount rate for plan liabilities, the expected return on plan assets and the rate of compensation increase. Net periodic pension expense of $3.1 million and $0.1 million was recorded for S&T’s defined benefit plan for 2009 and 2008, respectively. Net periodic pension expense is expected to approximate $2.6 million for the year 2010, assuming no significant changes in plan assumptions or contributions.
Occupancy, furniture and equipment expense increased $1.0 million or 9 percent during 2009 as compared to 2008, as a result of the net acquisition of new branches with the IBT acquisition. Other tax expense increased $0.7 million or 24 percent primarily as a result of increased Pennsylvania shares tax due to the IBT acquisition. Data processing expense increased $0.6 million or 10 percent as compared to 2008 as a result of changes in data communication processes and an increased customer base as a result of the IBT acquisition. Amortization of intangibles increased $1.3 million due to the IBT acquisition. FDIC assessments increased by $8.0 million due to the special assessment
PAGE 34
Item 7. MANAGEMENT’S DISCUSSION AND ANALYSIS OF FINANCIAL CONDITION AND RESULTS OF OPERATIONS — continued
charged to all banks in the second quarter of 2009, an increased premium ratio and a higher deposit base during 2009. Other noninterest expense increased $6.7 million or 33 percent during 2009 and is primarily attributable to a $1.9 million increase in the provision for unfunded loan commitments, a $1.6 million increase in the amortization and impairment for affordable housing limited partnerships, $1.1 million in loan collection expenses primarily associated with troubled loans, a $0.5 million increase in consulting, a $1.1 million increase in other real estate owned expense and $1.1 million in legal fees due to troubled loans. Increases were offset by a decrease of $0.4 million in marketing due to special promotions related to the IBT acquisition in 2008 and $0.1 million of other expenses. S&T’s efficiency ratio, which measures noninterest expense as a percent of noninterest income plus net interest income on a fully taxable-equivalent basis, excluding security gains, was 55 percent for 2009 and 45 percent for 2008.
Federal Income Taxes
A federal income tax benefit of $3.9 million was recognized in 2009 attributable to the pretax income of $4.1 million for the year, compared to expense of $24.5 million on pretax income of $84.7 million for 2008. Included in the 2009 tax benefit is tax expense approximating $0.4 million attributable to interest and penalties on a settled IRS examination, an increase in unrecognized tax benefits and return to provision adjustments.
The effective tax rate for 2009 was negative 95 percent and 29 percent in 2008. S&T ordinarily generates an annual effective tax rate that is less than the statutory rate of 35 percent due to benefits resulting from tax-exempt interest, excludible dividend income, from tax-exempt interest, excludible dividend income and tax benefits associated with Low Income Housing Tax Credit (“LIHTC”) and Federal Historic Tax Credit Projects, which are relatively consistent regardless of the level of pretax income.
The consistent level of tax benefits that reduce S&T’s tax rate below the 35 percent statutory rate, coupled with relatively low level of annual pretax income, produced a negative annual effective tax rate.
RESULTS OF OPERATIONS
Year Ended December 31, 2008
Net Income
Net income was $60.2 million in 2008, a 7 percent increase from the $56.1 million in 2007. Earnings per share increased 1 percent from $2.26 diluted earnings per share in 2007 to $2.28 diluted earnings per share in 2008. The differences between percentage changes for net income and earnings per share is primarily due to the 2,751,749 shares issued to the former IBT shareholders as partial payment for the IBT acquisition in the second quarter 2008. The increase in net income was primarily the result of increases in net interest income and noninterest income, offset by a higher loan loss provision, lower security gains and an increase in noninterest expense. The return on average assets was 1.52 percent for 2008, as compared to 1.68 percent for 2007. The return on average equity was 14.77 percent for 2008 compared to 16.97 percent for 2007.
Net Interest Income
Net interest income represents the difference between the interest and fees earned on interest-earning assets and the interest paid on interest-bearing liabilities. Net interest income is affected by changes in the volume of interest-earning assets and interest-bearing liabilities and changes in interest yields and rates. Therefore, maintaining consistent spreads between earning assets and interest-bearing liabilities is very significant to our financial performance because net interest income comprised 79 percent and 76 percent of operating revenue (net interest income plus noninterest income, excluding security gains) in 2008 and 2007, respectively. The level and mix of earning assets
PAGE 35
Item 7. MANAGEMENT’S DISCUSSION AND ANALYSIS OF FINANCIAL CONDITION AND RESULTS OF OPERATIONS — continued
and funds are continually monitored by ALCO in order to mitigate the interest-rate sensitivity and liquidity risks of the balance sheet. A variety of ALCO strategies were successfully implemented, within prescribed ALCO risk parameters, to maintain an acceptable net interest margin given the challenges of the current interest rate environment.
On a fully taxable-equivalent basis, net interest income increased $27.9 million or 23 percent in 2008 compared to 2007. Net interest income increases in 2008 are primarily attributable to growth in earning assets, primarily loans, as well as the IBT acquisition. The net yield on interest earning assets increased to 4.07 percent in 2008 as compared to 3.87 percent in 2007.
This consistency in the net yields on earning assets is primarily the result of effective asset liability strategies in a sometimes volatile interest rate environment. S&T’s balance sheet at December 31, 2008 is slightly liability sensitive, with funding costs decreasing faster than asset yields in a declining interest rate environment.
In 2008, average loans increased $499.0 million and average securities, other investments and federal funds sold increased $34.9 million. S&T acquired $278.5 million of average loans and $147.3 million of average securities with the IBT acquisition. The yields on average loans decreased by 116 basis points and the yields on average securities slightly decreased by 5 basis point. Overall earning asset yields decreased 101 basis points.
Average interest-bearing deposits provided $212.1 million of the funds for the growth in average earning assets, at a cost of 2.21 percent in 2008 as compared to 3.70 percent in 2007. S&T acquired $326.0 million of average deposits with the IBT acquisition. The cost of repurchase agreements and other borrowed funds decreased 202 basis points to 3.18 percent. Overall funding costs decreased 150 basis points.
Positively affecting net interest income was a $74.9 million increase in average net free funds during 2008 compared to 2007. Average net free funds are the excess of demand deposits, other noninterest-bearing liabilities and shareholders’ equity over nonearning assets. The increase is primarily due to successful marketing of new demand accounts and corporate cash management services and increased retained earnings.
Provision for Loan Losses
The provision for loan losses is an amount added to the allowance against which loan losses are charged. The provision for loan losses was $12.9 million and $5.8 million for 2008 and 2007, respectively. The provision is the result of management’s assessment of credit quality statistics and other risk factors that would have an impact on probable losses in the loan portfolio and the model used to determine the adequacy of the allowance for loan losses. A model is used to assist in the determination of the adequacy of the allowance for loan losses. Changes in the risk factors within the allowance for loan loss model are consistent with a decline in asset quality, which includes a significant increase in net loan charge-offs and nonaccrual loans.
Current credit quality and historical charge-offs are the most important factors in determining the amount of the allowance and the resulting provision. Also affecting the amount of the allowance and resulting provision is loan growth and portfolio composition. Most of the loan growth in 2008 and 2007 is attributable to larger commercial loans. Net loan charge-offs totaled $10.0 million or 0.31 percent of average loans for 2008 and $4.7 million or 0.17 percent of average loans for 2007. The most significant charge-offs for 2008 were the sales and service company charge-off of $1.1 million in the second quarter of 2008, a $0.9 million charge-off on a construction company loan during the third quarter of 2008 and a $4.6 million charge-off in the fourth quarter of 2008 related to the commercial customer that was misappropriating construction funds. These charge-offs during 2008 were offset by a $0.8 million recovery on the aforementioned construction company loan. The most significant charge-offs for 2007 were $1.4 million for a construction servicing company, an additional charge-off
PAGE 36
Item 7. MANAGEMENT’S DISCUSSION AND ANALYSIS OF FINANCIAL CONDITION AND RESULTS OF OPERATIONS — continued
of $1.2 million related to a workers compensation letter of credit draw for a heavy construction company and a $0.8 million commercial loan relationship for a security distribution and installation company, all of which were previously considered in the analysis for the adequacy of the allowance for loan losses. Nonaccrual loans to total loans increased to 1.19 percent at December 31, 2008 as compared to 0.60 percent at December 31, 2007.
Noninterest Income
Noninterest income, excluding net security gains, increased $2.3 million, or 6 percent in 2008 compared to 2007. Increases included $2.2 million or 22 percent in service charges and fees on deposit accounts, $0.8 million or 11 percent in insurance activities and $0.5 million or 7 percent in wealth management fees. Offsetting these increases were decreases of $0.9 million or 148 percent in mortgage banking and $0.3 million or 13 percent in letter of credit fees.
The increase of $2.2 million or 22 percent in service charges and fees is primarily related to fees charged for insufficient funds and account analysis fees incurred during the year and were positively affected by an increased customer base resulting from the IBT acquisition. Insurance commissions increased $0.8 million or 11 percent primarily as a result of stronger overall sales volume. Wealth management fees increased $0.5 million or 7 percent primarily related to increased brokerage and annuity commissions. Offsetting these increases were decreases of $0.9 million in mortgage banking due to impairment in the portfolio as a result unprecedented prepayment speeds and current low interest rates and $0.3 million or 13 percent in letter of credit fees due to lower customer demand for this product.
S&T recognized $1.7 million of losses on the sale of available-for-sale securities in 2008. These losses included $4.3 million of realized losses taken for OTTI on seven bank equity investment holdings and $0.7 million of realized losses from restructuring the IBT available-for-sale securities portfolio during the second quarter of 2008. These losses were partially offset by $3.3 million of realized equity security gains for 2008. S&T has implemented a strategy to methodically sell equity holdings in the available-for-sale equity portfolio and only retain strategic positions in bank holding companies within our market area.
Noninterest Expense
Noninterest expense increased $10.3 million or 14 percent in 2008 compared to 2007. S&T’s efficiency ratio, which measures noninterest expense as a percent of noninterest income, excluding security gains plus net interest income on a fully taxable-equivalent basis, was 45 percent in 2008 and 47 percent in 2007.
Staff expense increased 6 percent or $2.3 million in 2008. This increase is primarily attributable to the addition of 93 average full-time equivalent staff, primarily due to the IBT acquisition and normal annual merit increases, offset by a $1.9 million decrease in incentive plan accruals based on 2008 award levels. The majority of S&T incentive plan awards are based upon growth in earnings per share.
Occupancy and furniture and equipment expense increased 14 percent or $1.3 million as compared to 2007 due to the net acquisition of nine new branches with the IBT acquisition and the addition of one de novo branch opening during the year. Data processing expense increased $0.6 million or 12 percent as compared to 2007 as a result of conversion expenses related to the IBT acquisition, partially offset by a favorable renegotiation of the current contract and a change in data communication processes. Marketing expenses increased $0.5 million or 17 percent as compared to 2007 as a result of additional promotions and new customer account packages associated with the IBT acquisition. Amortization of intangibles increased $0.8 million or 252 percent due to the IBT acquisition.
PAGE 37
Item 7. MANAGEMENT’S DISCUSSION AND ANALYSIS OF FINANCIAL CONDITION AND RESULTS OF OPERATIONS — continued
Other noninterest expense increased $4.6 million as compared to 2007 primarily due to a $1.4 million increase in the reserve for unfunded loan commitments, a $1.4 million impairment charge for affordable housing limited partnerships, $0.7 million in increased amortization for affordable housing projects and $1.1 million of nonrecurring merger expenses.
Federal Income Taxes
Federal income tax expense increased $2.9 million to $24.5 million in 2008 as compared to 2007. This increase is primarily attributable to an increase in pre-tax income. The effective tax rate of 29 percent in 2008 and 28 percent in 2007 was below the 35 percent statutory tax rate due to the tax benefits resulting from tax-exempt interest, excludable dividend income and the tax benefits associated with LIHTC and Federal Historic Tax Credit projects. S&T currently does not incur any alternative minimum tax.
FINANCIAL CONDITION
Average earning assets increased by $226.2 million in 2009 primarily driven by $425.8 million average earnings assets acquired through the IBT acquisition in the second quarter 2008. Average loan balances increased by $242.4 million and average securities and other investments decreased $16.2 million as compared to the 2008 full year average. Average deposits increased $351.5 million and average borrowings decreased $215.0 million as compared to the 2008 full year average. S&T acquired $452.3 million in average assets, $147.3 million in average securities, $278.5 million in average loans and $326.0 million in average deposits in the IBT acquisition consummated on June 6, 2008.
Securities Activity
S&T invests in various securities in order to provide a source of liquidity, increase net interest income and as a tool of the ALCO, to reposition the balance sheet for interest rate risk purposes. Securities are subject to interest rate risk similar to loans. In addition, securities are subject to market risks that could negatively affect the level of liquidity available to S&T.
Risks associated with various securities portfolios are managed and monitored by investment policies annually approved by the S&T Board of Directors and administered through ALCO and the Treasury function of S&T Bank.
Average securities, other investments and federal funds sold decreased by $16.2 million in 2009 compared to the 2008 full year average. In 2008, S&T acquired $147.3 million of average securities with the IBT acquisition, offset by an average decrease of $163.5 million in securities, which is attributable to an ALCO strategy to limit the replacement of matured investment securities with borrowings to mitigate interest rate risk.
The components of the decrease are attributable to the sale and maturity of $22.6 million in U.S. government agency securities, $2.0 million in corporate securities and $0.1 million of states and political subdivisions. Further, marketable equity securities decreased $16.1 million. These decreases were offset by increases in mortgage-backed securities of U.S. government corporations and agencies of $21.8 million and other investments of $2.8 million
Average other investments are recorded at historical cost and are comprised of FHLB stock which is a membership and borrowing requirement based upon S&T’s borrowing availability and level from the FHLB.
PAGE 38
Item 7. MANAGEMENT’S DISCUSSION AND ANALYSIS OF FINANCIAL CONDITION AND RESULTS OF OPERATIONS — continued
The following table sets forth the carrying value of securities at the dates indicated:
| December 31 | 2009 | 2008 | 2007 | ||||||
| (dollars in thousands) | |||||||||
| Available-for-Sale |
|||||||||
| Obligations of U.S. government corporations and agencies |
$ | 127,971 | $ | 169,251 | $ | 145,322 | |||
| Collateralized mortgage obligations of U.S. government corporations and agencies |
60,229 | 63,900 | 58,996 | ||||||
| Mortgage-backed securities of U.S. government corporations and agencies |
61,521 | 78,952 | 27,572 | ||||||
| Obligations of state and political subdivisions |
92,928 | 122,478 | 81,089 | ||||||
| Marketable equity securities |
12,211 | 14,918 | 41,311 | ||||||
| Other securities |
— | 3,214 | 4,532 | ||||||
| Total Available-for-Sale Securities |
354,860 | 452,713 | 358,822 | ||||||
| FHLB of Pittsburgh capital stock, at cost |
23,542 | 23,542 | 13,833 | ||||||
| Total |
$ | 378,402 | $ | 476,255 | $ | 372,655 | |||
S&T’s policy for security classification includes U.S. government corporations and agencies, collateralized mortgage obligations of U.S. government corporations and agencies, mortgage-backed securities of U.S. government corporations and agencies, obligations of state and political subdivisions, marketable equity securities and other securities as available-for-sale. The marketable equity securities portfolio is primarily comprised of stock of bank holding companies. On a quarterly basis, management evaluates the securities portfolios for OTTI according to the respective accounting literature requiring investments to be reported at estimated fair value. During 2009, S&T recorded $5.3 million of realized losses for OTTI relating to securities of 17 bank equity holdings. The performance of the equities and debt securities markets could generate further impairment in future periods requiring realized losses to be reported.
At December 31, 2009, net unrealized gains on securities classified as available-for-sale were approximately $7.6 million as compared to $3.3 million at December 31, 2008. Net unrealized gains related to S&T’s debt securities portfolio totaled $8.1 million at December 31, 2009 and $6.9 million unrealized gains at December 31, 2008. The marketable equity securities portfolio had net unrealized losses of $0.5 million at December 31, 2009 compared to net unrealized losses of $3.6 million at December 31, 2008. S&T does not intend to sell and it is not more likely than not that it will be required to sell any of the securities in an unrealized loss position before recovery of its amortized cost.
S&T was notified in December 2008 by the FHLB that they have suspended the payment of dividends and the repurchase of excess capital stock until further notice. FHLB stock is viewed as a long-tem investment, which is carried at cost. S&T management reviewed and evaluated the FHLB capital stock for OTTI at December 31, 2009, which is determined based on the ultimate recoverability of the par value rather than by temporary declines in value or dividend fluctuations. Management considered the suspension of dividends and the repurchase of excess capital stock by the FHLB Board of Directors in a letter to member banks dated December 23, 2008. Management reviewed the FHLB’s Form 10-Q for the period ended September 30, 2009 filed with the Commission on November 12, 2009.
PAGE 39
Item 7. MANAGEMENT’S DISCUSSION AND ANALYSIS OF FINANCIAL CONDITION AND RESULTS OF OPERATIONS — continued
Management considered the following matters when evaluating FHLB stock for OTTI:
| • | Significance and severity of the decline in the net assets of the FHLB (including its investment portfolio) as compared to the capital stock amount of the FHLB and the length of time this situation has persisted. |
| • | Ability of the FHLB to make payments required by law or regulation and the level of such payments in relation to the operating performance of the FHLB. FHLB is meeting their debt obligations. Although the responsibility to repay debt may be shared among FHLB’s in the event that one FHLB cannot pay, to date, a FHLB has never been required to pay the consolidated obligation of another FHLB. |
| • | Impact of legislative and regulatory changes on the institution and, accordingly, on the customer base of the FHLB. With the exception of the Housing Act, enacted July 20, 2008, there are no pending legislative or regulatory changes that would impact the customer base of the FHLB’s. |
| • | Liquidity position of the FHLB. |
Management considered the following items from the September 30, 2009 Form 10-Q of the FHLB:
| • | The total capital of the FHLB decreased to $3.6 billion at September 30, 2009 from $4.1 billion at December 31, 2008, due primarily to unrealized losses on investments. |
| • | The net income of the FHLB for the nine months ended September 30, 2009 decreased to a net loss of $31.9 million from $207.4 million in the comparable period in 2008, due primarily to an OTTI impairment charge. |
| • | The FHLB exceeded all required capital ratios as of September 30, 2009 and December 31, 2008. In addition, permanent capital of $4.4 billion and $4.2 billion at September 30, 2009 and December 31, 2008, respectively, exceeded its risk-based capital requirement by $1.2 billion and $233.8 million, respectively. |
| • | The gross unrealized losses on its private label mortgage-backed securities (“MBS”) decreased to $0.5 billion at September 30, 2009 from $2.1 billion at December 31, 2008. However, management also noted the following: |
| • | The FHLB concluded that these securities were not OTTI as of September 30, 2009. |
| • | The FHLB Management’s Discussion and Analysis disclosed that all MBS continue to pay principal and interest in accordance with their contractual terms. |
| • | 30 percent of these securities were rated AAA by external credit agencies. |
| • | The FHLB had minimal subprime exposure in its private label MBS portfolio. |
| • | The liquidity position of the FHLB (defined as cash and due from banks, interest-earning deposits and federal funds sold) decreased to $4.5 billion at September 30, 2009 as compared to $6.4 billion at December 31, 2008. |
S&T believes its holdings in the stock are ultimately recoverable at par value as of December 31, 2009 and, therefore, determined that FHLB stock was not OTTI. In addition, S&T has ample liquidity and does not require redemption of its FHLB stock in the foreseeable future.
PAGE 40
Item 7. MANAGEMENT’S DISCUSSION AND ANALYSIS OF FINANCIAL CONDITION AND RESULTS OF OPERATIONS — continued
The following table sets forth the maturities of securities at December 31, 2009 and the weighted average yields of such securities. Taxable-equivalent adjustments (using a 35 percent federal income tax rate) for 2009 have been made in calculating yields on obligations of state and political subdivisions.
| Maturing | |||||||||||||||||||||||||||
| Within One Year |
After One But Within Five Years |
After Five But Within Ten Years |
After Ten Years |
No Fixed Maturity | |||||||||||||||||||||||
| Amount | Yield | Amount | Yield | Amount | Yield | Amount | Yield | Amount | |||||||||||||||||||
| (dollars in thousands) | |||||||||||||||||||||||||||
| Available-for-Sale |
|||||||||||||||||||||||||||
| Marketable equity securities |
$ | — | — | $ | — | — | $ | — | — | $ | — | — | $ | 12,211 | |||||||||||||
| Obligations of U.S. government corporations and agencies |
40,703 | 4.26 | % | 87,268 | 2.30 | % | — | — | — | — | — | ||||||||||||||||
| Collateralized mortgage obligations of U.S. government corporations and agencies |
— | — | — | — | 23,372 | 4.72 | % | 36,857 | 4.83 | % | — | ||||||||||||||||
| Mortgage-backed securities of U.S. government corporations and agencies |
1,152 | 4.13 | % | 7,188 | 4.33 | % | 20,593 | 4.55 | % | 32,588 | 5.50 | % | — | ||||||||||||||
| Obligations of state and political subdivisions |
10,910 | 4.54 | % | 33,187 | 5.06 | % | 13,553 | 5.44 | % | 35,278 | 5.81 | % | — | ||||||||||||||
| Total | $ | 52,765 | $ | 127,643 | $ | 57,518 | $ | 104,723 | $ | 12,211 | |||||||||||||||||
| Weighted Average Rate |
4.32 | % | 3.13 | % | 4.83 | % | 5.37 | % | |||||||||||||||||||
Lending Activity
| 2009 | 2008 | 2007 | ||||||||||||||||
| Loans | Average Loan Balance |
Average Loan Balance Percentage |
Average Loan Balance |
Average Loan Balance Percentage |
Average Loan Balance |
Average Loan Balance Percentage |
||||||||||||
| (dollars in millions) | ||||||||||||||||||
| Commercial, mortgage and industrial |
$ | 2,541.6 | 73 | % | $ | 2,393.5 | 74 | % | $ | 2,064.6 | 75 | % | ||||||
| Residential real estate |
849.8 | 25 | % | 757.8 | 23 | % | 592.4 | 22 | % | |||||||||
| Consumer |
81.8 | 2 | % | 79.5 | 3 | % | 74.8 | 3 | % | |||||||||
| Total |
$ | 3,473.2 | 100 | % | $ | 3,230.8 | 100 | % | $ | 2,731.8 | 100 | % | ||||||
Average loans for the year ended December 31, 2009 were $3.5 billion, a $242.4 million or 8 percent increase from the year ended December 31, 2008. S&T acquired $278.5 million of average loans with the IBT acquisition. The composition of the acquired average loan portfolio included $125.8 million of
PAGE 41
Item 7. MANAGEMENT’S DISCUSSION AND ANALYSIS OF FINANCIAL CONDITION AND RESULTS OF OPERATIONS — continued
commercial real estate loans, $26.7 million of commercial and industrial loans, $119.2 million of residential mortgages and home equity loans and $6.8 million of consumer loans. Changes in the composition of the average loan portfolio during 2009 included increases of $148.0 million in commercial loans, $92.1 million in residential mortgage loans and $2.3 million in consumer loans. Total loans at December 31, 2009 decreased $164.3 million from December 31, 2008.
Average real estate construction and commercial loans, including commercial and industrial, comprised 73 and 74 percent of the loan portfolio in 2009 and 2008, respectively. Commercial loan activity decreased for 2009 as businesses are reacting to the current economic environment. The commercial portfolio has experienced stress in all categories during 2009. The commercial real estate portfolio had $384.5 million or 11 percent of total loans that involved projects outside of western Pennsylvania. Generally, these loans are with existing local customers. The decline in the economic environment has been significantly higher in various parts of the country as compared to western Pennsylvania. Accordingly, the out of state portfolio is experiencing higher credit stress and has been the subject of considerable management focus and review. Rates and terms from commercial real estate, equipment loans and lines of credit are normally negotiated, subject to such variables as the financial condition of the borrower, economic conditions, marketability of collateral, credit history of the borrower and projected future cash flows. The loan to value policy guidelines for commercial real estate loans is generally 65-85 percent. At December 31, 2009, variable rate commercial loans were 50 percent of the commercial loan portfolio as compared to 49 percent at December 31, 2008.
Average residential mortgage loans comprised 25 percent of the loan portfolio in 2009 and 23 percent in 2008. During 2009, S&T sold $133.5 million of 1–4 family mortgage loans to Fannie Mae. Residential mortgage lending reached record levels during 2009 as consumers took advantage of lower interest rates. S&T expects the 1-4 family mortgage loans sold to FNMA to return to more normalized levels in 2010. Residential mortgage lending continues to be a strategic focus through a centralized mortgage origination department, ongoing product redesign, secondary market activities and the utilization of commission compensated originators. The loan to value policy guideline is 80 percent for residential first lien mortgages. Higher loan to value loans may be approved with the appropriate private mortgage insurance coverage. Second lien positions are 30 percent of residential mortgages and are sometimes assumed with home equity loans, but normally only to the extent that the combined credit exposure for both the first and second liens does not exceed 100 percent of the estimated fair value of the mortgage property.
Management believes the downturn in the local residential real estate market and the impact of declining values on the real estate loan portfolio will be mitigated because of S&T’s conservative mortgage lending policies for portfolio loans, which generally require a maximum term of 20 years for fixed rate mortgages. Balloon payment mortgages are also offered in the portfolio. The maximum balloon term is 15 years with a maximum amortization term of 30 years. Balloon mortgages with terms of 10 years or less may have a maximum amortization term for up to 40 years. Private mortgage insurance is generally required for loans with less than a 20 percent down payment. Combo mortgage loans consisting of S&T residential first mortgage and home equity second mortgage are also available to credit worthy borrowers. Adjustable-rate mortgages are no longer offered, but comprised 10 percent of the residential mortgage portfolio in 2009 and 9 percent in 2008. Home equity loans increased $20.3 million during 2009 and $144.0 million in 2008 and totaled $458.7 million at December 31, 2009 and $438.4 million at December 31, 2008. The increase in home equity loans is primarily attributable to successful marketing programs during 2009 and 2008 and $116.8 million of home equity loans that were acquired in the IBT acquisition in 2008.
S&T periodically designates specific loan originations, generally longer-term, lower-yielding, 1–4 family mortgages as held for sale to sell to Fannie Mae. The rationale of these sales is to mitigate interest-rate risk associated with holding long-term residential mortgages in the loan portfolio,
PAGE 42
Item 7. MANAGEMENT’S DISCUSSION AND ANALYSIS OF FINANCIAL CONDITION AND RESULTS OF OPERATIONS — continued
generate fee revenue from servicing and maintain the primary customer relationship. During 2009, S&T sold $133.5 million of 1–4 family mortgage loans to Fannie Mae and currently services $255.9 million of secondary market mortgage loans. Fees and gains from mortgage servicing activities were $2.7 million in 2009 and fees and losses were $0.3 million in 2008. During 2009, S&T experienced record levels of mortgage banking activities, including but not limited to refinancing, as consumers took advantage of low interest rates. This increase in mortgage banking activities resulted in significantly higher sales of 1-4 family mortgages to Fannie Mae in 2009 as compared to 2008. Management intends to continue to sell longer-term loans to Fannie Mae in the future on a selective basis, especially during periods of lower interest rates.
Average consumer loans comprised 2 percent of the loan portfolio in 2009 and 3 percent in 2008. The balance of consumer loans at December 31, 2009 was $81.1 million compared to $84.1 million at December 31, 2008.
Loan underwriting standards for S&T are established by a formal policy and are subject to the periodic review and approval by the Board of Directors. During 2009, S&T implemented or enhanced various new policies and procedures including: monitoring, funding, risk ratings, stress testing and compliance for the area of commercial lending.
S&T offers a variety of unsecured and secured consumer loan and credit card products. Loan to value policy guidelines for direct loans are 90–100 percent of invoice for new automobiles and 80–90 percent of National Automobile Dealer Association (NADA) value for used automobiles.
The following table summarizes S&T’s loan distribution at the end of each of the last five years:
| December 31 | |||||||||||||||
| 2009 | 2008 | 2007 | 2006 | 2005 | |||||||||||
| (dollars in thousands) | |||||||||||||||
| Domestic Loans: |
|||||||||||||||
| Commercial, mortgage and industrial |
$ | 2,129,979 | $ | 2,262,743 | $ | 1,781,076 | $ | 1,677,173 | $ | 1,566,331 | |||||
| Real estate—construction |
371,178 | 374,925 | 329,875 | 352,482 | 339,179 | ||||||||||
| Residential real estate |
822,109 | 846,983 | 611,149 | 563,496 | 517,780 | ||||||||||
| Consumer |
81,141 | 84,065 | 74,839 | 73,140 | 68,216 | ||||||||||
| Total Loans |
$ | 3,404,407 | $ | 3,568,716 | $ | 2,796,939 | $ | 2,666,291 | $ | 2,491,506 | |||||
The following table presents the maturity of loans (excluding residential mortgages of 1-4 family residences and consumer loans) outstanding as of December 31, 2009. Also provided are the amounts due after one year classified according to the sensitivity to changes in interest rates.
| Maturing | ||||||||||||
| Within One Year |
After One But Within Five Years |
After Five Years |
Total | |||||||||
| (dollars in thousands) | ||||||||||||
| Commercial, mortgage and industrial |
$ | 555,121 | $ | 657,794 | $ | 917,064 | $ | 2,129,979 | ||||
| Real estate—construction |
126,303 | 142,842 | 102,033 | 371,178 | ||||||||
| Total |
$ | 681,424 | $ | 800,636 | $ | 1,019,097 | $ | 2,501,157 | ||||
| Fixed interest rates |
$ | 262,320 | $ | 153,721 | ||||||||
| Variable interest rates |
538,316 | 865,376 | ||||||||||
| Total |
$ | 800,636 | $ | 1,019,097 | ||||||||
PAGE 43
Item 7. MANAGEMENT’S DISCUSSION AND ANALYSIS OF FINANCIAL CONDITION AND RESULTS OF OPERATIONS — continued
Allowance for Loan Losses
The balance in the allowance for loan losses increased to $59.6 million or 1.75 percent of total loans at December 31, 2009 as compared to $42.7 million or 1.20 percent of total loans at December 31, 2008. During 2009, the increase in the allowance is primarily a result of an increase of $9.9 million of specific reserves and an increase of $7.0 million in general reserves. S&T’s allowance for lending-related commitments is computed using a methodology similar to that used to determine the allowance for loan losses. Amounts are added to the allowance for lending-related commitments through a charge to current earnings through noninterest expense. The balance in the allowance for lending-related commitments increased to $4.2 million at December 31, 2009 as compared to $1.3 million at December 31, 2008. The allowance for lending-related commitments is included in other liabilities.
The following table summarizes the allowance for loan losses for each of the last five years as indicated:
| December 31 | |||||||||||||||
| 2009 | 2008 | 2007 | 2006 | 2005 | |||||||||||
| (dollars in thousands) | |||||||||||||||
| General reserves |
$ | 42,577 | $ | 35,574 | $ | 31,426 | $ | 30,593 | $ | 26,635 | |||||
| Specific reserves |
17,003 | 7,115 | 2,919 | 2,627 | 9,937 | ||||||||||
| Total Allowance for Loan Losses |
$ | 59,580 | $ | 42,689 | $ | 34,345 | $ | 33,220 | $ | 36,572 | |||||
Problem loans are identified and continually monitored through detailed reviews of specific commercial loans and the analysis of delinquency and charge-off levels of consumer loan portfolios. Management evaluates the degree of loss exposure for loans on a continuous basis through a formal allowance for loan loss policy as administered by S&T Bank’s Loan Administration Department and various management and director committees. Updates are presented to the S&T Board of Directors as to the status of loan quality. Charged-off and recovered loan amounts are applied to the allowance for loan losses. The allowance for loan losses is increased through a charge to current earnings through the provision for loan losses, based upon management’s assessment of the adequacy of the allowance for loan losses. A quantitative analysis is utilized to support the adequacy of the allowance for loan losses. This analysis includes a review of the historical charge-off rates for all loan categories as well as fluctuations and trends in various risk factors that have occurred within the portfolios economic life cycle. The analysis includes assessment of qualitative factors such as credit trends, unemployment trends, vacancy trends, loan growth and the degree of variable interest rate risk. Should any of the factors considered by management in evaluating the adequacy of the allowance for loan losses change, S&T’s estimate of loan losses could also change.
Significant to this analysis and assessment is the loan portfolio composition of a higher mix of commercial loans. These loans are generally larger in size and many are not seasoned and may be more vulnerable to an economic slowdown. Management relies on its risk rating process to assess potential weaknesses within specific credits. Current risk factors, trends in risk ratings and historical charge-off experiences are considered in the determination of the allowance for loan losses.
During 2009, the risk rating profile of the portfolio was impacted by the following commercial loan relationships:
| • | The first relationship consists of $30.3 million of commercial and industrial loans with an exploration and drilling company comprised of five different facilities and three legal entities. Decreases in commodity prices created cash flow difficulties for this company and a $9.3 million specific reserve had been established for the loans in the first quarter of 2009. |
PAGE 44
Item 7. MANAGEMENT’S DISCUSSION AND ANALYSIS OF FINANCIAL CONDITION AND RESULTS OF OPERATIONS — continued
| Continued decreases in energy commodity prices created going concern issues for the company resulting in a collateral liquidation strategy. A charge-off of $26.5 million was taken on this relationship in the second quarter of 2009. This relationship was originated in September of 2002 and was placed into nonaccrual status in February of 2009. The underlying collateral for this relationship consists of assignments of partnership interests in energy production companies, assignments of brokerage accounts, personal residences and an aircraft. The brokerage accounts were liquidated in the second quarter of 2009 and the proceeds of $2.0 million were applied to loan balances. The balance of $0.6 million on the aircraft was transferred to other assets in the second quarter of 2009. The aircraft was sold in the third quarter of 2009 for $1.1 million and the proceeds were applied to satisfy the balance of the other asset owned and reduce other remaining loan balances. The residual exposure estimate is $2.7 million and is supported with a value completed in June of 2009. |
| • | The second relationship has an aggregate residual balance of $11.4 million and is comprised of three projects in the New York and Connecticut regions. The first project is a $7.5 million real estate development participation loan that has delayed construction pending better economic conditions, for which a $2.0 million specific reserve has been established. The relationship was originated in January of 2006 and was placed into nonaccrual status in January of 2009. The underlying collateral for this relationship is a mortgage on an undeveloped parcel of real estate. The last appraisal was completed in March of 2009. The second project is $3.9 million for new condominiums construction. A specific reserve of $2.1 million that had previously been established for this project was increased to $4.2 million during the second quarter of 2009 based on the current appraisal. The last appraisal was completed in June of 2009. The underlying collateral for this relationship is the commercial real estate. A charge-off of $5.0 million was taken on this relationship in the fourth quarter of 2009. The third project is a $0.8 million residual balance for a mixed-use commercial property previously charged down by $2.7 million in the first quarter of 2009. The last appraisal was completed in June of 2009. The underlying collateral for this relationship is the real estate. A charge-off of $0.8 million was taken on this relationship in the fourth quarter of 2009. |
| • | The third relationship is a $2.5 million commercial and industrial loan secured by assignment of partnership interests. Unresolved legal issues among the partners make the valuation of the assigned partnership interests very difficult to ascertain. During the second quarter of 2009, management negotiated additional collateral that may mitigate future potential losses. As a result, specific reserves of $2.5 million previously established were reduced to $2.1 million during the second quarter of 2009. The relationship originated in October of 2006 and was placed into nonaccrual status in March of 2009. A charge-off of $2.5 million was taken on this relationship in the fourth quarter of 2009. |
| • | The fourth relationship has an aggregate residual balance of $1.1 million and is comprised of real estate loans on three distinct projects, the largest of which is a $1.0 million condominium project that has experienced slow absorption due to a downturn in the housing market. Specific reserves of $0.5 million had been established for the loans. The relationship originated in February of 2005 and was placed into nonaccrual status in February of 2009. The primary collateral consists of a completed condominium development project. The last appraisal was completed in February 2009. During 2009, six condominium units have been sold and 4 units are remaining to be sold. A charge-off of $0.3 million was taken on this relationship in the fourth quarter of 2009. |
| • | The fifth relationship is a $3.7 million multi-unit residential property that has experienced slow absorption due to the downturn in the housing market. A specific reserve of $0.2 million was established based on appraisal value. The relationship originated in October of 2003 and was placed into nonaccrual status in January of 2009. The last appraisal was completed in |
PAGE 45
Item 7. MANAGEMENT’S DISCUSSION AND ANALYSIS OF FINANCIAL CONDITION AND RESULTS OF OPERATIONS — continued
| March of 2009. The underlying collateral for this relationship is the condominium development and the unimproved land. During the third quarter of 2009, the relationship was transferred to other real estate owned resulting in a charge of $0.6 million to adjust the balance to the appraisal value less costs to sell of $2.7 million. During the first quarter of 2010, S&T consummated the sale of this property at a price equal to the fair value recorded at December 31, 2009. |
| • | The sixth relationship is a $7.5 million commercial real estate project consisting primarily of a retail project in the western Pennsylvania region that did not fully stabilize or develop. Specific reserves of $0.6 million had been established for the loans and were increased to $2.7 million in the fourth quarter of 2009 as a result of updated valuations. The relationship originated in March of 1999 and was placed into nonaccrual status in September of 2008. The last appraisal was completed in June of 2009. The primary collateral for this relationship is the commercial real estate. The commercial real estate of $3.5 million is under contract and is expected to close in the first half of 2010. |
| • | The seventh relationship consists of several lot development projects in Pennsylvania and Florida. The exposure in Florida originally consisted of five projects totaling $12.5 million. Local real estate conditions in Florida resulted in slow lot sales and ultimately the developer’s global cash flow was unable to absorb the carrying costs associated with the Florida loans. In the second quarter of 2009, the Florida loans were split into an $8.8 million nonperforming tranche (3 loans) and a $3.7 million performing tranche (2 loans). S&T recognized a $5.3 million charge on the nonperforming loans during the second quarter of 2009 and developed a strategy to liquidate the nonperforming loans and complete the development associated with the performing loans. During the third quarter of 2009, it became evident that global cash flows were insufficient to execute on the original restructure plan. Accordingly, S&T recognized an additional charge of $2.9 million and liquidated a $0.6 million cash collateral account. The resulting Florida exposure is $3.7 million, $3.3 million of which is nonperforming as of December 31, 2009. The relationship originated in March of 2004 and was placed into nonaccrual status in May of 2009. The last appraisal was completed in March of 2009. The underlying collateral for this relationship is undeveloped and developed single family lots. The Florida properties are scheduled for auction in second quarter of 2010. |
| • | The eighth relationship is a $1.8 million regional restaurant that entered into bankruptcy and subsequently closed. A $1.1 million charge was taken in the second quarter of 2009. The loan originated in September of 2005 and was placed into nonaccrual status in January of 2008. The underlying collateral for this relationship is a leasehold mortgage on the building. The remaining balance $0.7 million is in other repossessed assets owned as of December 31, 2009. During the first quarter of 2010, S&T consummated the sale of this asset at a price equal to the fair value recorded at December 31, 2009. |
| • | The ninth relationship is a $10.8 million mixed-use redevelopment project in Pennsylvania which was placed into nonperforming status during the third quarter of 2009. The project is complete, but is not stabilized. The loan originated in August of 2007. The underlying collateral for this relationship includes real estate, a United States Department of Agriculture guaranty, a letter of credit from another financial institution and personal guarantees of the developer. A specific reserve of $1.5 million had been established for this relationship and was increased to $2.2 million in the fourth quarter of 2009 as a result of an updated appraisal. In addition, S&T terminated certain interest rate derivatives resulting in counterparty fees of $1.4 million. This claim was recorded as a receivable and a decrease in noninterest income of $0.6 million was recognized on the under secured portions of this receivable. In the fourth quarter of 2009, S&T drew on two letters of credit. Proceeds were applied to the remaining swap receivables and loan balances. |
PAGE 46
Item 7. MANAGEMENT’S DISCUSSION AND ANALYSIS OF FINANCIAL CONDITION AND RESULTS OF OPERATIONS — continued
| • | The tenth relationship is a $9.7 million resort in central Pennsylvania that has experienced a decline in bookings and cash flows. The loan originated in May of 2004 and was placed in to nonaccrual status in December of 2009. The underlying collateral for this relationship includes real estate and a partial United States Department of Agriculture guarantee. A current appraisal has been ordered and no specific reserve has been established as of December 31, 2009. |
| • | The eleventh relationship is a $5.2 million loan for an industrial warehouse property located in the southeast United States. Slowness in achieving target occupancy has created cash shortfalls that historically have been supplemented by the owners. The loan originated in February of 2000 and was placed into nonaccrual status in December of 2009. The underlying collateral is the warehouse property. Because continued owners’ support is uncertain, a specific reserve of $1.5 million was established based upon a fourth quarter appraisal. The property is scheduled for auction during the second quarter of 2010. |
Specific reserves increased to $17.0 million and are primarily the result of the commercial loans discussed above as well as expanding the scope of loans subject to analysis. Management believes these commercial loans have been adequately reserved as determined by the quarterly impairment analysis and risk-rating process performed by the Loan Administration Department.
The allowance for loan losses is established based on management’s assessment of the factors noted above along with the growth in the loan portfolio. The additions to the allowance for loan losses charged to operating expense has maintained the allowance as a percent of loans at the following levels at the end of each year presented below:
| Years Ended December 31 | ||||||||
| 2009 | 2008 | 2007 | 2006 | 2005 | ||||
| 1.75% |
1.20% | 1.23% | 1.25% | 1.47% | ||||
We have considered impaired loans in our determination of the allowance for loan losses. The specific reserves for impaired loans were $17.0 million and $7.1 million at December 31, 2009 and 2008, respectively.
S&T has a charge-off policy within its general lending policy. The charge-off policy is broken down into two components – retail and commercial.
The charge-off policy for retail loans is broken down into two types. The first type is unsecured or secured with non real estate. These loans are evaluated for a charge at 90 days past due. Unsecured loans are fully charged off. If the loan is secured with non real estate, it will be charged down to the value of the collateral less the estimated cost to sell. If the collateral is repossessed and remains unsold for 120 days the carrying value will be completely charged-off. The second type is loans secured by real estate. These loans will be evaluated for a charge at 90 days past due. The loan will be charged down to the value of the collateral less the estimated cost to sell.
The charge-off policy for commercial loans requires that loans and other obligations that are not collectible be promptly charged-off in the month the loss becomes probable, regardless of the delinquency status of the loan. The bank may elect to recognize a partial charge-off when management has determined that the value of collateral is less than the then remaining ledger balance. A loan or obligation does not need to be charged-off, regardless of delinquency status, if (i) management has determined there exists sufficient collateral to protect the remaining loan balance and (ii) there exists a strategy to liquidate the collateral. Management may also consider a number of other factors to determine when a charge-off is appropriate. These factors may include, but are not limited to:
| • | The status of a bankruptcy proceeding |
| • | The value of collateral and probability of successful liquidation |
| • | The status of adverse proceedings or litigation that may result in collection |
PAGE 47
Item 7. MANAGEMENT’S DISCUSSION AND ANALYSIS OF FINANCIAL CONDITION AND RESULTS OF OPERATIONS — continued
Net loan charge-offs totaled $55.5 million or 1.60 percent of average loans for 2009 as compared to $10.0 million or 0.31 percent of average loans for 2008. Net loan charge-offs for 2009 were primarily impacted by a $26.5 million charge-off for the aforementioned $30.3 million commercial relationship with an energy exploration and drilling company which had a specific reserve of $9.3 million, $8.2 million for three Florida lot development projects with a remaining exposure in Florida of $3.3 million, $4.2 million for two commercial real estate projects in New York and Connecticut with a remaining exposure of $3.9 million, $3.5 million for a mixed use commercial property that lost a major tenant with a remaining exposure of $3.7 million, $2.5 million for a commercial and industrial loan secured by assignment of partnership interests which are uncertain due to legal issues among the partners, $1.1 million for a $2.4 million office building that was foreclosed and sold during the first quarter of 2009, $1.1 million for a regional restaurant that entered into bankruptcy, $0.6 million for a multi-family development project in western Pennsylvania, $0.6 million for a retail sales company which discontinued operations, $0.6 million for condominium construction loans in western Pennsylvania. The most significant charge-offs for 2008 was a sales and service company charge-off of $1.1 million in the second quarter of 2008, a $0.9 million charge-off on a construction company loan during the third quarter of 2008 and a $4.6 million charge-off in the fourth quarter of 2008 related to the commercial customer that was misappropriating construction funds. These charge-offs during 2008 were offset by a $0.8 million recovery on the aforementioned construction company loan.
This table summarizes our loan loss experience for each of the five years presented below:
| Years Ended December 31 | ||||||||||||||||||||
| 2009 | 2008 | 2007 | 2006 | 2005 | ||||||||||||||||
| (dollars in thousands) | ||||||||||||||||||||
| Balance at January 1: |
$ | 42,689 | $ | 34,345 | $ | 33,220 | $ | 36,572 | $ | 34,262 | ||||||||||
| Charge-offs: |
||||||||||||||||||||
| Commercial, mortgage and industrial |
(38,553 | ) | (5,943 | ) | (5,648 | ) | (12,575 | ) | (2,260 | ) | ||||||||||
| Residential real estate |
(16,955 | ) | (5,086 | ) | (515 | ) | (394 | ) | (529 | ) | ||||||||||
| Consumer |
(1,354 | ) | (1,141 | ) | (917 | ) | (1,069 | ) | (1,140 | ) | ||||||||||
| Total |
(56,862 | ) | (12,170 | ) | (7,080 | ) | (14,038 | ) | (3,929 | ) | ||||||||||
| Recoveries: |
||||||||||||||||||||
| Commercial, mortgage and industrial |
878 | 1,774 | 1,640 | 640 | 1,699 | |||||||||||||||
| Residential real estate |
276 | 157 | 256 | 201 | 235 | |||||||||||||||
| Consumer |
245 | 285 | 497 | 465 | 274 | |||||||||||||||
| Total |
1,399 | 2,216 | 2,393 | 1,306 | 2,208 | |||||||||||||||
| Net Charge-offs |
(55,463 | ) | (9,954 | ) | (4,687 | ) | (12,732 | ) | (1,721 | ) | ||||||||||
| Provision for loan losses |
72,354 | 12,878 | 5,812 | 9,380 | 5,000 | |||||||||||||||
| Acquired loan loss reserve |
— | 5,420 | — | — | — | |||||||||||||||
| Allowance for lending-related commitments |
— | — | — | — | (969 | ) | ||||||||||||||
| Balance at December 31: |
$ | 59,580 | $ | 42,689 | $ | 34,345 | $ | 33,220 | $ | 36,572 | ||||||||||
| Ratio of net charge-offs to average loans outstanding |
1.60 | % | 0.31 | % | 0.17 | % | 0.49 | % | 0.07 | % | ||||||||||
PAGE 48
Item 7. MANAGEMENT’S DISCUSSION AND ANALYSIS OF FINANCIAL CONDITION AND RESULTS OF OPERATIONS — continued
The following table summarizes net charge-offs as a percentage of average loans:
| December 31 | |||||||||||||||
| 2009 | 2008 | 2007 | 2006 | 2005 | |||||||||||
| (dollars in thousands) | |||||||||||||||
| Net charge-offs as a percentage average loans |
|||||||||||||||
| Commercial, mortgage and industrial |
1.48 | % | 0.18 | % | 0.19 | % | 0.61 | % | 0.03 | % | |||||
| Residential real estate |
1.97 | % | 0.65 | % | 0.04 | % | 0.04 | % | 0.06 | % | |||||
| Consumer |
1.34 | % | 1.13 | % | 0.56 | % | 0.87 | % | 1.26 | % | |||||
| Total Loan Charge-offs |
1.60 | % | 0.31 | % | 0.17 | % | 0.49 | % | 0.07 | % | |||||
| Allowance for loan losses as a percentage of total loans |
1.75 | % | 1.20 | % | 1.23 | % | 1.25 | % | 1.47 | % | |||||
| Allowance for loan losses to total non-performing loans |
66 | % | 101 | % | 204 | % | 167 | % | 328 | % | |||||
| Provision for loan losses as a percentage of net loan charge-offs |
130 | % | 184 | % | 124 | % | 74 | % | 234 | % | |||||
This table shows allocation of the allowance for loan losses as of the end of each of the last five years:
| December 31 | ||||||||||||||||||||||||||||||
| 2009 | 2008 | 2007 | 2006 | 2005 | ||||||||||||||||||||||||||
| Amount | Percent of Loans in Each Category to Total Loans |
Amount | Percent of Loans in Each Category to Total Loans |
Amount | Percent of Loans in Each Category to Total Loans |
Amount | Percent of Loans in Each Category to Total Loans |
Amount | Percent of Loans in Each Category to Total Loans |
|||||||||||||||||||||
| (dollars in thousands) |
||||||||||||||||||||||||||||||
| Commercial, mortgage and industrial |
$ | 50,804 | 63 | % | $ | 38,951 | 64 | % | $ | 31,274 | 64 | % | $ | 28,540 | 63 | % | $ | 32,053 | 63 | % | ||||||||||
| Real estate-construction |
5,919 | 11 | % | 73 | 10 | % | 51 | 11 | % | 379 | 13 | % | 532 | 14 | % | |||||||||||||||
| Residential real estate |
501 | 24 | % | 660 | 24 | % | 543 | 22 | % | 536 | 21 | % | 613 | 21 | % | |||||||||||||||
| Consumer |
2,356 | 2 | % | 3,005 | 2 | % | 2,477 | 3 | % | 3,765 | 3 | % | 3,374 | 2 | % | |||||||||||||||
| Total |
$ | 59,580 | 100 | % | $ | 42,689 | 100 | % | $ | 34,345 | 100 | % | $ | 33,220 | 100 | % | $ | 36,572 | 100 | % | ||||||||||
The balance of nonperforming loans, which included loans past due 90 days or more, at December 31, 2009 was $90.8 million or 2.67 percent of total loans. This compares to nonperforming loans of $42.5 million or 1.19 percent of total loans at December 31, 2008. Nonperforming assets totaled $95.4 million or 2.29 percent of total assets at December 31, 2009 and $43.3 million or 0.98 percent of total assets at December 31, 2008. There are no loans 90 days past due and still accruing interest. The increase of $48.3 million in nonperforming loans in 2009 as compared to 2008 was considered within the assessment of qualitative factors in the determination of the allowance for loan losses.
PAGE 49
Item 7. MANAGEMENT’S DISCUSSION AND ANALYSIS OF FINANCIAL CONDITION AND RESULTS OF OPERATIONS — continued
The provision for loans losses was $72.4 million for 2009, as compared to $12.9 million for 2008. The provision was the result of management’s detailed analysis of the adequacy of the allowance for loan losses and is consistent with the increase in nonperforming loans and classified loan trends, loan charge-off levels and the impact of the troubled commercial loan relationships during 2009.
The following table summarizes our nonaccrual and past due loans:
| December 31 | |||||||||||||||
| 2009 | 2008 | 2007 | 2006 | 2005 | |||||||||||
| (dollars in thousands) | |||||||||||||||
| Nonaccrual loans |
$ | 90,807 | $ | 42,466 | $ | 16,798 | $ | 19,852 | $ | 11,166 | |||||
| Accruing loans past due 90 days or more |
— | — | — | — | — | ||||||||||
S&T’s policy is to place loans in all categories on nonaccrual status when collection of interest or principal is doubtful, or generally when interest or principal payments are 90 days or more past due. There are no loans 90 days or more past due and still accruing. For the years ended December 31, 2009 and 2008, interest that would have been recorded had the nonaccrual loans performed in accordance with the original loan terms was $6.1 million and $3.2 million, respectively. At December 31, 2009 and 2008, there was $74.1 million and $27.9 million, respectively, of impaired loans that were on nonaccrual. There is no foreign loan amounts required to be included in this table in the periods presented and one troubled debt restructuring in 2009 of $1.4 million.
Noninterest Earning Assets
Average noninterest earning assets increased $62.1 million in 2009 and $101.0 million in 2008. The 2009 increase was primarily attributable to goodwill recorded in the merger with IBT, bank owned life insurance acquired from the merger, as well as increases in cash and due from banks and higher accrued interest receivable on a higher earning asset balance.
Deposits
| December 31 | |||||||||||||
| 2009 | 2008 | $ Change | % Change | ||||||||||
| (dollars in thousands) | |||||||||||||
| Deposits |
|||||||||||||
| Noninterest-bearing deposits |
$ | 712,120 | $ | 600,282 | $ | 111,838 | 18.6 | % | |||||
| Interest-bearing deposits |
260,554 | 229,229 | 31,325 | 13.7 | % | ||||||||
| Money market |
289,367 | 283,290 | 6,077 | 2.1 | % | ||||||||
| Savings deposits |
752,130 | 821,805 | (69,675 | ) | (8.5 | )% | |||||||
| Certificates of deposit |
1,290,370 | 1,293,810 | (3,440 | ) | (0.3 | )% | |||||||
| Total Deposits |
$ | 3,304,541 | $ | 3,228,416 | $ | 76,125 | 2.4 | % | |||||
Average total deposits increased by $351.5 million, or 12 percent in 2009 as compared to 2008. Changes in the average deposit mix include increases of $264.7 million in certificates of deposit, $111.7 million in money market accounts, $48.1 million in NOW accounts and $34.6 million in demand deposits. Offsetting these increases is a decrease of $107.6 million in savings accounts. As a result of the IBT acquisition in June of 2008, average deposits increased $326.0 million. The composition of these IBT deposits included $159.4 million in certificates of deposit, $79.2 million in demand and NOW accounts, $46.2 million of money market accounts and $41.2 million of savings accounts. Average organic deposit growth, or average deposit increases not associated with the IBT
PAGE 50
Item 7. MANAGEMENT’S DISCUSSION AND ANALYSIS OF FINANCIAL CONDITION AND RESULTS OF OPERATIONS — continued
acquisition was $17.9 million. During 2009, the average increase in certificates of deposits of $264.7 million is primarily attributable to the $159.4 million acquired in the IBT acquisition as well as an increase $125.9 of brokered certificates of deposit. The average decrease of $107.6 million in savings accounts is primarily attributable to S&T being less aggressive with external competitive pricing strategies. Other important strategies include providing cash management services to commercial customers to increase transaction related deposits and enhanced delivery services such as electronic banking. Core deposit growth is an important strategic initiative for S&T, through the expansion of retail facilities, promotions and new products.
Management believes that the S&T deposit base is stable and that S&T has the ability to attract new deposits, mitigating a funding dependency on other more volatile sources. Certificates of deposit of $100,000 and over were 12 percent of total deposits at December 31, 2009 and 2008, respectively and primarily represent deposit relationships with local customers in our market area. S&T had $109.8 million and $59.0 million of brokered retail certificates of deposit outstanding at December 31, 2009 and 2008, respectively.
Maturities of certificates of deposit of $100,000 or more outstanding at December 31, are summarized as follows:
| 2009 | |||
| (dollars in thousands) | |||
| Three months or less |
$ | 128,767 | |
| Over three through six months |
55,790 | ||
| Over six through twelve months |
51,973 | ||
| Over twelve months |
175,371 | ||
| Total Certificates of Deposit |
$ | 411,901 | |
During the first quarter of 2009, S&T began participation in the Certificate of Deposit Account Registry Services (“CDARS”) program. The reciprocal program allows S&T customers to receive expanded FDIC coverage by placing multiple certificates of deposit at other CDARS member banks. S&T maintains deposits by accepting certificates of deposits from customers of CDARS member banks in the exact amount as S&T customers placed. S&T can also access the CDARS network to accept brokered certificates of deposit that are not part of the reciprocal CDARS program. As of December 31, 2009, S&T had $65.7 million of reciprocal deposits and $5.9 million of brokered CDARS certificates of deposit. Both programs are classified as part of brokered retail certificates of deposit. The issuance of brokered retail certificates of deposits and participation in the CDARS program is an ALCO strategy to increase and diversify funding sources.
The daily average amount of deposits and rates paid on such deposits is summarized for the periods indicated in the following table:
| Years Ended December 31 | ||||||||||||||||||
| 2009 | 2008 | 2007 | ||||||||||||||||
| Amount | Rate | Amount | Rate | Amount | Rate | |||||||||||||
| (dollars in thousands) | ||||||||||||||||||
| Noninterest-bearing demand deposits |
$ | 637,434 | $ | 533,096 | $ | 441,647 | ||||||||||||
| NOW/Money market accounts |
485,742 | 0.33 | % | 395,629 | 0.76 | % | 295,099 | 1.19 | % | |||||||||
| Savings deposits |
758,216 | 0.46 | % | 865,839 | 1.35 | % | 922,333 | 3.68 | % | |||||||||
| Certificates of deposit |
1,367,372 | 2.44 | % | 1,102,717 | 3.41 | % | 934,673 | 4.51 | % | |||||||||
| Total |
$ | 3,248,764 | $ | 2,897,281 | $ | 2,593,752 | ||||||||||||
PAGE 51
Item 7. MANAGEMENT’S DISCUSSION AND ANALYSIS OF FINANCIAL CONDITION AND RESULTS OF OPERATIONS — continued
Borrowings
The daily average amount of borrowings is summarized for the periods indicated in the following table:
| Years Ended December 31 | |||||||||||||
| 2009 | 2008 | $ Change | % Change |
||||||||||
| (dollars in thousands) | |||||||||||||
| FHLB borrowings |
$ | 223,704 | $ | 424,804 | $ | (201,100 | ) | -47.34 | % | ||||
| Other short-term borrowings |
114,908 | 145,580 | (30,672 | ) | -21.07 | % | |||||||
| Junior subordinated debt |
90,619 | 69,872 | 20,747 | 29.69 | % | ||||||||
| Total Borrowings | $ | 429,231 | $ | 640,256 | $ | (211,025 | ) | -32.96 | % | ||||
Average borrowings by S&T decreased $215.0 million in 2009 as compared to 2008. During 2009, S&T reduced borrowings since participation in the CPP provided increased liquidity. The decrease in borrowings is also the result of decreased loan demand as consumers and businesses react to the economic slowdown and an ALCO strategy to not replace maturing investment securities to mitigate interest rate risk. Borrowings are comprised of retail repurchase agreements (“REPOs”), wholesale REPOs, federal funds purchased, FHLB advances and long-term borrowings. S&T defines REPOs with our local retail customers as retail REPOs; wholesale REPOs are those transacted with other banks and brokerage firms.
The largest decreases in average borrowings in 2009 was a $131.0 million decrease in FHLB advances and $70.1 million in FHLB long term borrowings compared to 2008. The decrease in FHLB advances was a strategic initiative in order to develop a better diversified mix of wholesale funding sources. The average balance in retail REPOs decreased by $37.4 million in 2009. Wholesale REPOs, federal funds purchased and FHLB advances averaged $104.3 million in 2009, a decrease of $128.5 million from the 2008 average.
During 2009, average long-term borrowings decreased $49.1 million as compared to December 31, 2008. At December 31, 2009, S&T had long-term borrowings outstanding of $82.5 million at a fixed rate and $93.7 million at a variable rate.
During the third quarter of 2006, S&T Bank issued $25.0 million of junior subordinated debentures through a pooled transaction at an initial fixed rate of 6.78 percent. On September 15, 2011 and quarterly thereafter, S&T Bank has the option to redeem the subordinated debt, subject to a 30 day written notice and prior approval by the FDIC. If S&T chooses not to exercise the option for early redemption on September 15, 2011 or subsequent quarters, the subordinated debt will convert to a variable rate of 3-month LIBOR plus 160 basis points. The subordinated debt qualifies as Tier 2 capital under regulatory guidelines and will mature on December 15, 2036.
During the first quarter of 2008, S&T completed a private placement to a financial institution of $20.0 million of floating rate trust preferred securities. The trust preferred securities mature in March 2038 and are callable at S&T’s option, after five years and bear interest initially at a rate of 6.44 percent per annum and quarterly adjusts with the three-month LIBOR plus 350 basis points. S&T made interest payments to the trustee beginning on June 15, 2008 and quarterly thereafter. The proceeds from the sale of the trust preferred securities was used to partially finance the acquisition of IBT. The trust preferred securities qualifies as Tier 1 capital under regulatory guidelines.
During the second quarter of 2008, S&T Bank issued $20.0 million of junior subordinated debt through a private placement with three financial institutions at an initial rate of 6.40 percent and floats quarterly with 3-month LIBOR plus 350 basis points. If all or any portion of the subordinated debt ceases to be deemed to be Tier 2 Capital due to a change in applicable capital regulations, S&T
PAGE 52
Item 7. MANAGEMENT’S DISCUSSION AND ANALYSIS OF FINANCIAL CONDITION AND RESULTS OF OPERATIONS — continued
will have the right to redeem, on any interest payment date, subject to a 30 day written notice and prior approval by the FDIC, the subordinated debt at the applicable redemption rate which starts at a high of 102.82 percent at June 15, 2009 and decreases yearly to 100 percent on June 15, 2013 and thereafter and can be called after five years. The subordinated debt qualifies as Tier 2 capital under regulatory guidelines and will mature on June 15, 2018.
Also during the second quarter of 2008, S&T Bank issued $25.0 million of junior subordinated debt through a private placement with a financial institution at an initial rate of 5.15 percent and floats quarterly with 3-month LIBOR plus 250 basis points. At any time after May 30, 2013, S&T will have the right to redeem all or a portion of the subordinated debt, subject to a 30-day written notice and prior approval by the FDIC. The subordinated debt qualifies as Tier 2 capital under regulatory guidelines and will mature on May 30, 2018. The proceeds from the sale of these two subordinated debt issuances were also used to partially finance the acquisition of IBT.
The following table shows the distribution of our short-term borrowings and the weighted average interest rates thereon at the end of each of the last three years. Also provided are the maximum amount of borrowings and the average amounts of borrowings as well as weighted average interest rates for the last three years.
| Securities Sold Under Repurchase Agreements, Federal Funds Purchased and Term Auction Facility |
2009 | 2008 | 2007 | |||||||||
| (dollars in thousands) | ||||||||||||
| Balance at December 31 |
$ | 44,935 | $ | 113,419 | $ | 100,258 | ||||||
| Average balance during the year |
94,019 | 128,890 | 96,171 | |||||||||
| Average interest rate during the year |
0.17 | % | 1.36 | % | 4.40 | % | ||||||
| Maximum month-end balance during the year |
$ | 129,835 | $ | 197,045 | $ | 118,918 | ||||||
| Average interest rate at year-end |
0.13 | % | 0.39 | % | 3.58 | % | ||||||
| Short-term Federal Home Loan Bank Advances | 2009 | 2008 | 2007 | |||||||||
| (dollars in thousands) | ||||||||||||
| Balance at December 31 |
$ | 51,300 | $ | 308,475 | $ | 80,000 | ||||||
| Average balance during the year |
96,929 | 227,918 | 44,214 | |||||||||
| Average interest rate during the year |
0.54 | % | 1.87 | % | 5.26 | % | ||||||
| Maximum month-end balance during the year |
$ | 195,150 | $ | 377,850 | $ | 100,000 | ||||||
| Average interest rate at year-end |
0.27 | % | 0.59 | % | 4.46 | % | ||||||
WEALTH MANAGEMENT ASSETS
As of December 31, 2009, the estimated fair value of the S&T Bank wealth management assets under management, which are not accounted for as part of the assets of S&T, decreased 0.6 percent to $1.3 billion, with $911.7 million in wealth management services and $380.0 million in brokerage services. The decrease in 2009 is primarily attributable to decreased performance in the stock markets.
EXPLANATION OF USE OF NON-GAAP FINANCIAL MEASURES
In addition to the results of operations presented in accordance with GAAP, S&T management uses and this annual report contains or references, certain non-GAAP financial measures, such as net interest income on a fully taxable-equivalent basis, operating revenue and the efficiency ratio. S&T believes these non-GAAP financial measures provide information useful to investors in understanding our underlying operational performance and our business and performance trends as they facilitate comparisons with the performance of others in the financial services industry. Although S&T believes that these non-GAAP financial measures enhance investors’ understanding of S&T’s business and performance, these non-GAAP financial measures should not be considered an alternative to GAAP.
PAGE 53
Item 7. MANAGEMENT’S DISCUSSION AND ANALYSIS OF FINANCIAL CONDITION AND RESULTS OF OPERATIONS — continued
We believe the presentation of net interest income on a fully taxable-equivalent basis ensures comparability of net interest income arising from both taxable and tax-exempt sources and is consistent with industry practice. Interest income per the Consolidated Statements of Income is reconciled to net interest income adjusted to a fully taxable-equivalent basis on page 28.
Operating revenue is the sum of net interest income and noninterest income less security gains. In order to understand the significance of net interest income to S&T’s business and operating results, S&T management believes it is appropriate to evaluate the significance of net interest income as a component of operating revenue.
The efficiency ratio is recurring noninterest expense divided by recurring noninterest income plus net interest income, on a fully taxable-equivalent basis, which ensures comparability of net interest income arising from both taxable and tax-exempt sources and is consistent with industry practice.
CAPITAL RESOURCES
Shareholders’ equity increased $104.6 million at December 31, 2009 compared to December 31, 2008. The increase is primarily due to a $108.7 million capital raise as a participant in the CPP. Net income available to common shareholders was $2.0 million and dividends declared to shareholders were $16.9 million for 2009 or $0.61 per share. Also, affecting capital was an increase of $5.0 million in the funded status of pension and $2.8 million in unrealized gains on securities available-for-sale, net of tax, which is included in other comprehensive income.
S&T continues to maintain a strong capital position with a leverage ratio of 10.26 percent as compared to the 2009 minimum regulatory guideline of 4.00 percent. S&T’s risk-based capital Tier 1 and Total ratios were 12.10 percent and 15.43 percent, respectively, at December 31, 2009, which places S&T well above the Federal Reserve Board’s risk-based capital guidelines of 4.00 percent and 8.00 percent for Tier 1 and Total capital. Management believes that S&T has the ability to raise additional capital if necessary.
In August 2009, S&T filed a shelf registration statement on Form S-3 under the Securities Act of 1933 as amended, with the SEC for the issuance of up to $300.0 million of a variety of securities including, debt and capital securities, preferred and common stock and warrants. S&T may use the proceeds from the sale of any securities for general corporate purposes, which could include investments at the holding company level, investing in, or extending credit to, its subsidiaries, possible acquisitions and stock repurchases. As of December 31, 2009, S&T had not issued any securities pursuant to the shelf registration statement.
On January 16, 2009, S&T completed a $108.7 million capital raise as a participant in the CPP. S&T temporarily used the funds received from the issuance of the Series A Preferred Stock and warrants to reduce S&T’s overnight borrowings at the FHLB of Pittsburgh which had the effect of increasing S&T’s liquidity for lending activities. See Item 1. Business, Capital Purchase Program for additional information.
In April 1993, shareholders approved the S&T Incentive Stock Plan (“Stock Plan”) authorizing the issuance of a maximum of 1.2 million shares of S&T’s common stock to assist in attracting and retaining employees of outstanding ability and to align their interests with those of the shareholders of S&T. On October 17, 1994, the Stock Plan was amended to include outside directors. On April 21, 1997, shareholders approved an amendment to the Stock Plan increasing the number of authorized shares to 3.2 million. As of December 31, 2002, 3,180,822 nonstatutory stock options and 35,600 restricted stock awards had been granted to key employees and outside directors under the Stock Plan; 318,850 of these awards are currently exercisable. In April 2003, shareholders approved the 2003 S&T Incentive Stock Plan (“2003 Stock Plan”) authorizing the issuance of 1.5 million shares, subject to capital adjustments as provided in the 2003 Stock Plan. The purpose of the 2003 Stock Plan is to promote the long-term interests of S&T and its shareholders by attracting and retaining
PAGE 54
Item 7. MANAGEMENT’S DISCUSSION AND ANALYSIS OF FINANCIAL CONDITION AND RESULTS OF OPERATIONS — continued
directors, officers and key employees. S&T believes that directors, officers and employees who own shares of its common stock will have a closer identification with S&T and a greater motivation to work for S&T’s success, because, as shareholders, they will participate in S&T’s growth and earnings. As of December 31, 2006, 937,500 nonstatutory stock options had been granted under the 2003 Stock Plan to employees and directors; 730,075 of these awards are currently exercisable. On December 19, 2005, S&T also granted 206,900 cash appreciation rights under the 2005 Cash Appreciation Rights (“CARs”) Plan to employees, with 179,175 of these awards currently exercisable. No corporate-wide stock option grants were awarded in 2006. On April 21, 2008 and April 16, 2007, 7,787 and 7,761, respectively, restricted stock awards were granted to outside directors. On December 15, 2008 and December 17, 2007, 3,224 and 35,199, respectively, restricted stock awards were granted to senior management. The restricted stock awards to outside directors vest in one year. The awards to senior management were granted in accordance with 2008 and 2007 performance levels and primarily based on earnings per share growth. The restricted stock awards to senior management have a vesting schedule of 25 percent in each of the next four years.
S&T has various financial obligations, including contractual obligations and commitments that may require future cash payments. The following table presents as of December 31, 2009, significant fixed and determinable contractual obligations to third parties by payment date:
| Payments Due In | |||||||||||||||
| 2010 | 2011-2012 | 2013-2014 | Later Years | Total | |||||||||||
| (dollars in thousands) | |||||||||||||||
| Deposits without a stated maturity(1) |
$ | 2,014,171 | $ | — | $ | — | $ | — | $ | 2,014,171 | |||||
| Certificates of deposit(1) |
671,430 | 488,408 | 120,905 | 9,627 | 1,290,370 | ||||||||||
| Federal funds purchased and securities sold under repurchase agreements(1) |
44,935 | — | — | — | 44,935 | ||||||||||
| Short-term borrowings(1) |
51,300 | — | — | — | 51,300 | ||||||||||
| Long-term borrowings(1) |
65,787 | 1,161 | 11,223 | 7,723 | 85,894 | ||||||||||
| Junior subordinated debt securities(1) |
— | — | — | 90,619 | 90,619 | ||||||||||
| Operating and capital leases |
1,562 | 3,023 | 3,087 | 36,307 | 43,979 | ||||||||||
| Purchase obligations |
6,239 | 6,519 | 123 | — | 12,881 | ||||||||||
| Total |
$ | 2,855,424 | $ | 499,111 | $ | 135,338 | $ | 144,276 | $ | 3,634,149 | |||||
| (1) | Excludes interest |
Operating lease obligations represent short and long-term lease arrangements as described in Item 8, Note 9 Premises and Equipment, in the Consolidated Financial Statements. Purchase obligations represent obligations under agreement with Metavante, S&T’s third party data processing servicer, for operational services outsourced. The Metavante obligation has a buyout provision of 40 percent of the remaining payments under the original term of the contract.
In the normal course of business, S&T commits to extend credit and issue standby letters of credit. These obligations are not recorded in our financial statements. Loan commitments and standby letters of credit are subject to S&T’s normal credit underwriting policies and procedures and generally require collateral based upon management’s evaluation of each customer’s financial condition and ability to satisfy completely the terms of the agreement and are renewed on an annual basis. S&T’s exposure to credit loss in the event the customer does not satisfy the terms of the agreement equals the notional amount of the obligation less the value of any collateral. Unfunded commercial loan
PAGE 55
Item 7. MANAGEMENT’S DISCUSSION AND ANALYSIS OF FINANCIAL CONDITION AND RESULTS OF OPERATIONS — continued
commitments totaled $710.9 million and $765.6 million at December 31, 2009 and 2008, respectively. Unfunded other loan commitments totaled $256.0 million and $198.6 million at December 31, 2009 and 2008, respectively; and obligations under standby letters of credit totaled $156.3 million and $146.7 million at December 31, 2009 and 2008, respectively.
REGULATORY MATTERS
S&T and S&T Bank are subject to periodic examinations by the Pennsylvania Department of Banking (“PADB”), the FDIC and the Federal Reserve Bank of Cleveland (“Federal Reserve”). During 2009, the PADB conducted a Safety and Soundness examination that included, but was not limited to, a review of S&T Bank’s capital adequacy, asset quality, board of director and management oversight, earnings, liquidity, sensitivity to market risk and compliance with the Bank Secrecy Act. In addition, the PADB conducted stand alone Trust Department and Information Technology examinations. No comments were received from the PADB that would have a material effect on S&T’s liquidity, capital resources, operations or its overall compliance with laws and regulations.
LIQUIDITY
Liquidity refers to the ability to satisfy the financial needs of depositors who want to withdraw funds, or of borrowers needing to access funds to meet their credit needs. The ALCO is responsible for establishing and monitoring liquidity guidelines, policies and procedures.
The principal sources of asset liquidity are cash and due from banks, interest earning deposits with banks, federal funds sold, unpledged securities available-for-sale, maturing and amortizing loans and securities and earnings. Liability liquidity sources include a stable core deposit base, the ability to renew maturing certificates of deposits, borrowing availability at the FHLB, fed funds lines with other financial institutions, access to the brokered CD market including CDARS, and the ability to raise debt and equity. Customer deposits are an important source of liquidity which depends on the confidence of those customers in S&T supported by its capital position and the protection provided by FDIC insurance.
ALCO uses a variety of methods to monitor the liquidity position of S&T. These include a liquidity gap, which measures potential sources and uses of funds over future time periods out to one year. Policy guidelines require S&T to maintain a positive liquidity gap, meaning sources greater than uses, in the 30 day time period. In addition, ratios including net noncore funding dependence, net loans and standby letters of credit to assets, and net loans to deposits are reviewed and monitored. ALCO also performs contingency funding analyses to determine S&T’s ability to meet potential liquidity needs under stress scenarios that cover varying time horizons ranging from immediate to long term. Policy guidelines require coverage ratios of potential sources greater than uses depending on the scenario and time horizon.
During 2009 liquidity improved due to participation in the CPP, decreases in loan and security balances, stable deposit levels and a larger borrowing capacity at the FHLB which resulted from reduced borrowings.
INFLATION
Management is aware of the significant effect inflation has on interest rates and can have on financial performance. S&T’s ability to cope with this is best determined by analyzing its capability to respond to changing interest rates and its ability to manage noninterest income and expense. S&T monitors its mix of interest-rate sensitive assets and liabilities through ALCO in order to reduce the impact of
PAGE 56
Item 7. MANAGEMENT’S DISCUSSION AND ANALYSIS OF FINANCIAL CONDITION AND RESULTS OF OPERATIONS — continued
inflation on net interest income. Management also controls the effects of inflation by reviewing the prices of its products and services, by introducing new products and services and by controlling overhead expenses.
Item 7A. QUANTITATIVE AND QUALITATIVE DISCLOSURES ABOUT MARKET RISK
Because the assets and liabilities of S&T are primarily monetary in nature, the presentation and analysis of cash flows in formats prescribed by accounting principles generally accepted in the United States are less meaningful for managing bank liquidity than for non-financial companies. Funds are typically provided from current earnings, maturity and sales of securities available-for-sale, loan repayments, deposits and borrowings. The primary uses of funds include new loans, repayment of borrowings, the purchase of securities and dividends to shareholders. The level and mix of sources and uses of funds are constantly monitored and adjusted by ALCO in order to maintain credit, liquidity and interest-rate risks within prescribed policy guidelines while maximizing earnings.
ALCO monitors and manages interest-rate sensitivity through gap, rate shock and rate ramp analyses, economic value of equity (“EVE”) and simulations in order to avoid unacceptable earnings fluctuations due to interest rate changes. Interest rate sensitivity analyses are highly dependent on assumptions, which have been developed based upon past experience and the expected behavior of customers under various rate scenarios. The assumptions include principal prepayments for fixed rate loans, mortgage-backed securities of U.S. government corporations and agencies and collateralized mortgage obligations and classifying the demand, savings and money market balances by degree of interest-rate sensitivity.
The gap and cumulative gap represents the net position of assets and liabilities subject to repricing in specified time periods, as measured by a ratio of rate sensitive assets to rate sensitive liabilities. The table below shows the amount and timing of repricing assets and liabilities as of December 31, 2009.
Interest Rate Sensitivity
December 31, 2009
| GAP | 1-6 Months | 7-12 Months | 13-24 Months | >2 Years | |||||||||
| (dollars in thousands) | |||||||||||||
| Repricing Assets: |
|||||||||||||
| Cash/due from banks |
$ | — | $ | — | $ | — | $ | 69,152 | |||||
| Securities available-for-sale |
66,294 | 42,865 | 71,718 | 173,983 | |||||||||
| Other investments |
23,542 | — | — | — | |||||||||
| Net loans |
1,574,862 | 306,522 | 466,955 | 996,488 | |||||||||
| Other assets |
— | — | — | 378,094 | |||||||||
| Total |
1,664,698 | 349,387 | 538,673 | 1,617,717 | |||||||||
| Repricing Liabilities: |
|||||||||||||
| Demand |
— | — | — | 712,120 | |||||||||
| NOW |
32,569 | 32,569 | 65,138 | 130,278 | |||||||||
| Money market |
289,367 | — | — | — | |||||||||
| Savings |
544,230 | 29,700 | 59,400 | 118,800 | |||||||||
| Certificates/clubs |
398,434 | 273,063 | 203,450 | 415,423 | |||||||||
| Repos & short-term borrowings |
96,235 | — | — | — | |||||||||
| Long-term borrowings |
123,956 | 10,550 | 25,592 | 16,415 | |||||||||
| Other liabilities/equity |
— | — | — | 593,186 | |||||||||
| Total |
1,484,791 | 345,882 | 353,580 | 1,986,222 | |||||||||
| GAP |
$ | 179,907 | $ | 3,505 | $ | 185,093 | $ | (368,505 | ) | ||||
| Cumulative GAP |
$ | 179,907 | $ | 183,412 | $ | 368,505 | $ | — | |||||
PAGE 57
Item 7A. QUANTITATIVE AND QUALITATIVE DISCLOSURES ABOUT MARKET RISK — continued
| Rate Sensitive Assets/Rate Sensitive Liabilities | December 31, 2009 |
December 31, 2008 | ||
| Cumulative 6 months |
1.12 | 0.87 | ||
| Cumulative 12 months |
1.10 | 0.92 |
S&T’s one-year gap position at December 31, 2009 indicates an asset sensitive position. This means that more assets than liabilities will reprice during the measured time frames. The implications of an asset sensitive position will differ depending upon the change in market interest rates. For example, with an asset sensitive position in a declining interest rate environment, more assets than liabilities will decrease in rate. This situation could result in a decrease to our interest rate spreads, net interest income and operating spreads. Conversely, with an asset sensitive position in a rising interest rate environment more assets than liabilities will increase in rates. This situation could result in an increase to our interest rate spreads, net interest income and operating spreads.
In addition to the gap analysis, S&T performs rate shock and rate ramp analyses on a static balance sheet to estimate the effect that a +/- 100, +/-200 and +/-300 basis point instantaneous and gradual parallel shift in the yield curve would have on 12 months of pretax net interest income. The rate shocks incorporate assumptions regarding the level of interest rate changes on non-maturity deposit products (savings, money market, NOW and demand deposits) and changes in the prepayment behavior of fixed rate loans and securities with optionality. Inclusion of these assumptions makes rate shock and rate ramp analyses more useful than gap analysis alone. S&T’s policy is to limit the change in pretax net interest income over a one-year horizon to -20 percent given changes in rates using shocks or rate ramps up to +/- 300 basis points. Although +/-100 and +/-200 basis point changes for the rate shock and rate ramp analyses are not policy guidelines, these analyses are performed to ensure directional consistency of the +/-300 basis point analysis.
The table below shows the percent change to pretax net interest income with a rate shock of +/-300 basis points.
| +300 bps | -300 bps | |||||
| December 31, 2009 |
8.16 | % | (6.93 | )% | ||
| December 31, 2008 |
(.72 | )% | .73 | % |
When comparing December 2009 to December 2008, the impact on pretax net interest income in the –300 basis point rate shock scenario deteriorated and the impact on the pretax net interest income in the +300 basis point rate improved. The deterioration/improvement is a result of the balance sheet becoming asset sensitive. The balance sheet became asset sensitive as loan and security volume declined and participation in the CPP resulted in a significant reduction in short-term borrowings.
In order to monitor interest rate risk beyond the one-year time horizon of shocks and rate ramps, S&T also performs (“EVE”) an Economic Value of Equity analysis. EVE represents the present value of all asset cash flows minus the present value of all liability cash flows. As with rate shock analysis, EVE incorporates management assumptions regarding prepayment behavior of fixed rate loans and securities with optionality and core deposit behavior. S&T’s policy is to limit the change in EVE to –35 percent given changes in rates up to +/-300 basis points. The December 2009 results reflect a 20.41 percent decrease and 6.22 percent increase to EVE given a –300 and +300 basis point change in interest rates respectively.
PAGE 58
Item 8. FINANCIAL STATEMENTS AND SUPPLEMENTARY DATA
Consolidated Financial Statements
| 60 | ||
| 61 | ||
| 62 | ||
| 63 | ||
| 64 | ||
| 110 | ||
| 111 | ||
| 112 | ||
PAGE 59
S&T Bancorp, Inc. and Subsidiaries
| December 31 | 2009 | 2008 | ||||||
| (dollars in thousands, except share and per share data) | ||||||||
| ASSETS |
||||||||
| Cash and due from banks |
$ | 69,152 | $ | 69,780 | ||||
| Securities available-for-sale |
354,860 | 452,713 | ||||||
| Federal Home Loan Bank stock, at cost |
23,542 | 23,542 | ||||||
| Loans held for sale |
6,073 | 737 | ||||||
| Portfolio loans |
3,398,334 | 3,567,979 | ||||||
| Allowance for loan losses |
59,580 | 42,689 | ||||||
| Portfolio loans, net |
3,338,754 | 3,525,290 | ||||||
| Premises and equipment, net |
40,990 | 45,304 | ||||||
| Goodwill |
165,167 | 163,546 | ||||||
| Other intangibles, net |
9,408 | 11,713 | ||||||
| Bank owned life insurance |
52,863 | 51,254 | ||||||
| Other assets |
109,666 | 94,489 | ||||||
| Total Assets |
$ | 4,170,475 | $ | 4,438,368 | ||||
| LIABILITIES |
||||||||
| Deposits: |
||||||||
| Noninterest-bearing demand |
$ | 712,120 | $ | 600,282 | ||||
| Interest-bearing demand |
260,554 | 229,229 | ||||||
| Money market |
289,367 | 283,290 | ||||||
| Savings |
752,130 | 821,805 | ||||||
| Certificates of deposit |
1,290,370 | 1,293,810 | ||||||
| Total Deposits |
3,304,541 | 3,228,416 | ||||||
| Securities sold under repurchase agreements and federal funds purchased |
44,935 | 113,419 | ||||||
| Short-term borrowings |
51,300 | 308,475 | ||||||
| Long-term borrowings |
85,894 | 180,331 | ||||||
| Junior subordinated debt securities |
90,619 | 90,619 | ||||||
| Other liabilities |
39,868 | 68,414 | ||||||
| Total Liabilities |
3,617,157 | 3,989,674 | ||||||
| SHAREHOLDERS’ EQUITY |
||||||||
| Fixed rate cumulative perpetual preferred stock, series A, no par value, $1,000 per share liquidation preference Authorized—10,000,000 shares in 2009 and 2008 Issued and outstanding—108,676 in 2009 and none in 2008 |
105,370 | — | ||||||
| Common stock ($2.50 par value) Authorized—50,000,000 shares in 2009 and 2008 Issued—29,714,038 shares in 2009 and 2008 Outstanding—27,746,554 shares in 2009 and 27,632,928 shares in 2008 |
74,285 | 74,285 | ||||||
| Additional paid-in capital |
51,158 | 43,327 | ||||||
| Retained earnings |
383,118 | 402,608 | ||||||
| Accumulated other comprehensive loss |
(6,214 | ) | (13,986 | ) | ||||
| Treasury stock (1,967,484 shares in 2009 and 2,081,110 shares in 2008, at cost) |
(54,399 | ) | (57,540 | ) | ||||
| Total Shareholders’ Equity |
553,318 | 448,694 | ||||||
| Total Liabilities and Shareholders’ Equity |
$ | 4,170,475 | $ | 4,438,368 | ||||
See Notes to Consolidated Financial Statements
PAGE 60
CONSOLIDATED STATEMENTS OF INCOME
S&T Bancorp, Inc. and Subsidiaries
| Years Ended December 31 | 2009 | 2008 | 2007 | ||||||||
| (dollars in thousands, except per share data) | |||||||||||
| INTEREST INCOME |
|||||||||||
| Loans, including fees |
$ | 179,774 | $ | 198,754 | $ | 199,387 | |||||
| Investment Securities: |
|||||||||||
| Taxable |
11,020 | 12,630 | 11,807 | ||||||||
| Tax-exempt |
3,655 | 3,529 | 2,601 | ||||||||
| Dividends |
638 | 1,205 | 1,810 | ||||||||
| Total Interest Income |
195,087 | 216,118 | 215,605 | ||||||||
| INTEREST EXPENSE |
|||||||||||
| Deposits |
38,438 | 52,363 | 79,587 | ||||||||
| Securities sold under repurchase agreements and federal funds purchased |
142 | 1,750 | 4,231 | ||||||||
| Short-term borrowings |
544 | 4,263 | 2,325 | ||||||||
| Long-term borrowings and junior subordinated debt securities |
9,981 | 13,795 | 13,024 | ||||||||
| Total Interest Expense |
49,105 | 72,171 | 99,167 | ||||||||
| NET INTEREST INCOME |
145,982 | 143,947 | 116,438 | ||||||||
| Provision for loan losses |
72,354 | 12,878 | 5,812 | ||||||||
| Net Interest Income After Provision for Loan Losses |
73,628 | 131,069 | 110,626 | ||||||||
| NONINTEREST INCOME |
|||||||||||
| Security (losses) gains, net |
(5,088 | ) | (1,651 | ) | 3,844 | ||||||
| Service charges on deposit accounts |
12,942 | 12,322 | 10,124 | ||||||||
| Wealth management fees |
7,500 | 7,967 | 7,470 | ||||||||
| Letter of credit fees |
1,721 | 1,761 | 2,013 | ||||||||
| Insurance fees |
7,751 | 8,096 | 7,285 | ||||||||
| Mortgage banking |
2,727 | (305 | ) | 641 | |||||||
| Debit and credit card fees |
6,921 | 5,910 | 4,819 | ||||||||
| Other |
4,106 | 3,352 | 4,409 | ||||||||
| Total Noninterest Income |
38,580 | 37,452 | 40,605 | ||||||||
| NONINTEREST EXPENSE |
|||||||||||
| Salaries and employee benefits |
48,848 | 42,708 | 40,387 | ||||||||
| Occupancy, net |
6,819 | 6,416 | 5,846 | ||||||||
| Furniture and equipment |
5,067 | 4,479 | 3,737 | ||||||||
| Other taxes |
3,733 | 3,017 | 2,906 | ||||||||
| Data processing |
6,048 | 5,488 | 4,880 | ||||||||
| Amortization of intangibles |
2,308 | 1,055 | 300 | ||||||||
| FDIC assessment |
8,388 | 409 | 302 | ||||||||
| Other |
26,915 | 20,229 | 15,102 | ||||||||
| Total Noninterest Expense |
108,126 | 83,801 | 73,460 | ||||||||
| Income Before Taxes |
4,082 | 84,720 | 77,771 | ||||||||
| (Benefit) provision for income taxes |
(3,869 | ) | 24,517 | 21,627 | |||||||
| Net Income |
7,951 | 60,203 | 56,144 | ||||||||
| Preferred stock dividends and amortization of discount |
5,913 | — | — | ||||||||
| Net Income Available to Common Shareholders |
$ | 2,038 | $ | 60,203 | $ | 56,144 | |||||
| Common earnings per share—basic |
$ | 0.07 | $ | 2.30 | $ | 2.27 | |||||
| Common earnings per share—diluted |
0.07 | 2.28 | 2.26 | ||||||||
| Dividends declared per common share |
0.61 | 1.24 | 1.21 | ||||||||
| Average common shares outstanding—basic |
27,626 | 26,215 | 24,738 | ||||||||
| Average common shares outstanding—diluted |
27,659 | 26,384 | 24,889 | ||||||||
| See | Notes to Consolidated Financial Statements |
PAGE 61
CONSOLIDATED STATEMENTS OF CHANGES IN SHAREHOLDERS’ EQUITY
S&T Bancorp, Inc. and Subsidiaries
| Comprehensive Income |
Preferred Stock |
Common Stock |
Additional Paid-in Capital |
Retained Earnings |
Accumulated Other Comprehensive Income (Loss) |
Treasury Stock |
Total | |||||||||||||||||||||||
| (dollars in thousands, except per share data) | ||||||||||||||||||||||||||||||
| Balance at December 31, 2006 |
$ | — | $ | 74,285 | $ | 26,698 | $ | 349,447 | $ | 4,014 | $ | (115,393 | ) | $ | 339,051 | |||||||||||||||
| Net income for 2007 |
$ | 56,144 | 56,144 | 56,144 | ||||||||||||||||||||||||||
| Other Comprehensive Income, Net of Tax |
||||||||||||||||||||||||||||||
| Change in unrealized gains on securities of $2,457 net of reclassification adjustment for gains included in net income of ($3,844) and reclassification adjustment of ($1,606) related to Rabbi Trust and tax benefit of $1,413 |
(1,580 | ) | (1,580 | ) | (1,580 | ) | ||||||||||||||||||||||||
| Adjustment to funded status of pension, net of tax expense of ($251) |
466 | 466 | 466 | |||||||||||||||||||||||||||
| Comprehensive Income |
$ | 55,030 | ||||||||||||||||||||||||||||
| Cash dividends declared ($1.21 per share) |
(29,787 | ) | (29,787 | ) | ||||||||||||||||||||||||||
| Treasury stock acquired (971,400 shares) |
(31,802 | ) | (31,802 | ) | ||||||||||||||||||||||||||
| Treasury stock issued (161,213 shares) |
(894 | ) | 4,414 | 3,520 | ||||||||||||||||||||||||||
| Recognition of restricted stock compensation expense |
622 | 622 | ||||||||||||||||||||||||||||
| Tax benefit from nonstatutory stock options exercised |
621 | 621 | ||||||||||||||||||||||||||||
| Recognition of nonstatutory stock option compensation expense |
455 | 455 | ||||||||||||||||||||||||||||
| Adjustment to initially apply FIN 48 |
(150 | ) | (150 | ) | ||||||||||||||||||||||||||
| Balance at December 31, 2007 |
$ | — | $ | 74,285 | $ | 27,502 | $ | 375,654 | $ | 2,900 | $ | (142,781 | ) | $ | 337,560 | |||||||||||||||
| Net income for 2008 |
$ | 60,203 | 60,203 | 60,203 | ||||||||||||||||||||||||||
| Other Comprehensive Income, Net of Tax |
||||||||||||||||||||||||||||||
| Change in unrealized losses on securities of ($6,761) net of reclassification adjustment for losses included in net income of $1,651 and tax benefit of $1,789 |
(3,321 | ) | (3,321 | ) | (3,321 | ) | ||||||||||||||||||||||||
| Adjustment to funded status of pension, net of tax benefit of $7,304 |
(13,565 | ) | (13,565 | ) | (13,565 | ) | ||||||||||||||||||||||||
| Comprehensive Income |
$ | 43,317 | ||||||||||||||||||||||||||||
| Cash dividends declared ($1.24 per share) |
(33,249 | ) | (33,249 | ) | ||||||||||||||||||||||||||
| Treasury stock issued (330,092 shares) |
(1,648 | ) | 9,128 | 7,480 | ||||||||||||||||||||||||||
| Recognition of restricted stock compensation expense |
412 | 412 | ||||||||||||||||||||||||||||
| Tax benefit from nonstatutory stock options exercised |
1,004 | 1,004 | ||||||||||||||||||||||||||||
| Recognition of nonstatutory stock option compensation expense |
455 | 455 | ||||||||||||||||||||||||||||
| Treasury stock issued in acquisition (2,751,749 shares) |
15,602 | — | 76,113 | 91,715 | ||||||||||||||||||||||||||
| Balance at December 31, 2008 |
$ | — | $ | 74,285 | $ | 43,327 | $ | 402,608 | $ | (13,986 | ) | $ | (57,540 | ) | $ | 448,694 | ||||||||||||||
| Net income for 2009 |
$ | 7,951 | 7,951 | 7,951 | ||||||||||||||||||||||||||
| Other Comprehensive Income, Net of Tax |
||||||||||||||||||||||||||||||
| Change in unrealized losses on securities of ($765) net of reclassification adjustment for losses included in net income of $5,088 and tax expense of ($1,513) |
2,810 | 2,810 | 2,810 | |||||||||||||||||||||||||||
| Adjustment to funded status of pension, net of tax expense of ($2,672) |
4,962 | 4,962 | 4,962 | |||||||||||||||||||||||||||
| Comprehensive Income |
$ | 15,723 | ||||||||||||||||||||||||||||
| Preferred dividend and amortization of discount |
706 | (5,913 | ) | (5,207 | ) | |||||||||||||||||||||||||
| Cash dividends declared ($0.61 per share) |
(16,869 | ) | (16,869 | ) | ||||||||||||||||||||||||||
| Treasury stock issued (113,626 shares) |
2,867 | (4,659 | ) | 3,141 | 1,349 | |||||||||||||||||||||||||
| Recognition of restricted stock compensation expense |
465 | 465 | ||||||||||||||||||||||||||||
| Tax benefit from nonstatutory stock options exercised |
4 | 4 | ||||||||||||||||||||||||||||
| Recognition of nonstatutory stock option compensation expense |
483 | 483 | ||||||||||||||||||||||||||||
| Issuance of preferred stock(1) |
104,664 | 104,664 | ||||||||||||||||||||||||||||
| Warrant for common stock issuance(1) |
4,012 | 4,012 | ||||||||||||||||||||||||||||
| Balance at December 31, 2009 |
$ | 105,370 | $ | 74,285 | $ | 51,158 | $ | 383,118 | $ | (6,214 | ) | $ | (54,399 | ) | $ | 553,318 | ||||||||||||||
| (1) | The preferred stock issued to the U.S Treasury in the amount of $104,664 is presented net of a discount of $4,012. |
| See | Notes to Consolidated Financial Statements |
PAGE 62
CONSOLIDATED STATEMENTS OF CASH FLOWS
S&T Bancorp, Inc. and Subsidiaries
| Years Ended December 31 | 2009 | 2008 | 2007 | |||||||||
| (dollars in thousands) | ||||||||||||
| OPERATING ACTIVITIES |
||||||||||||
| Net Income |
$ | 7,951 | $ | 60,203 | $ | 56,144 | ||||||
| Adjustments to reconcile net income to net cash provided by operating activities: |
||||||||||||
| Provision for loan losses |
72,354 | 12,878 | 5,812 | |||||||||
| Provision for unfunded loan commitments |
2,888 | 447 | (359 | ) | ||||||||
| Depreciation and amortization |
7,044 | 5,021 | 3,762 | |||||||||
| Net amortization of investment security premiums |
948 | 1,136 | 822 | |||||||||
| Recognition of stock-based compensation expense |
321 | 1,315 | 887 | |||||||||
| Security losses (gains), net |
5,088 | 1,651 | (3,844 | ) | ||||||||
| Deferred income taxes |
(7,442 | ) | (6,023 | ) | (2,140 | ) | ||||||
| Tax benefits from stock-based compensation |
(4 | ) | (1,004 | ) | (361 | ) | ||||||
| Mortgage loans originated for sale |
(144,852 | ) | (17,316 | ) | (17,094 | ) | ||||||
| Proceeds from the sale of loans |
139,556 | 17,702 | 17,422 | |||||||||
| Gains on the sale of loans, net |
(510 | ) | (224 | ) | (401 | ) | ||||||
| Net decrease (increase) in interest receivable |
4,470 | (4,124 | ) | 938 | ||||||||
| Net (decrease) increase in interest payable |
(2,582 | ) | 314 | 112 | ||||||||
| Net (increase) decrease in other assets |
(17,917 | ) | 4,843 | (7,586 | ) | |||||||
| Net (decrease) increase in other liabilities |
(12,746 | ) | (814 | ) | 9,728 | |||||||
| Net Cash Provided by Operating Activities |
54,567 | 76,005 | 63,842 | |||||||||
| INVESTING ACTIVITIES |
||||||||||||
| Net (increase) decrease in interest-earning deposits with banks |
(1 | ) | 4 | — | ||||||||
| Proceeds from maturities of securities available-for-sale |
177,443 | 125,440 | 75,537 | |||||||||
| Proceeds from sales of securities available-for-sale |
4,833 | 146,600 | 6,588 | |||||||||
| Purchases of securities available-for-sale |
(86,135 | ) | (124,334 | ) | (10,538 | ) | ||||||
| Net decrease (increase) in loans |
113,064 | (291,830 | ) | (135,262 | ) | |||||||
| Purchases of premises and equipment |
(1,577 | ) | (3,939 | ) | (5,392 | ) | ||||||
| Proceeds from sale of premises and equipment |
1,314 | — | — | |||||||||
| Payment for purchase of IBT, net of cash acquired |
— | (67,739 | ) | — | ||||||||
| Net Cash Provided by (Used in) Investing Activities |
208,941 | (215,798 | ) | (69,067 | ) | |||||||
| FINANCING ACTIVITIES |
||||||||||||
| Net increase (decrease) in core deposits |
79,565 | (61,220 | ) | 61,354 | ||||||||
| Net (decrease) increase in certificates of deposit |
(3,694 | ) | 94,210 | (4,836 | ) | |||||||
| Net (decrease) increase in short-term borrowings |
(257,175 | ) | 228,475 | 25,000 | ||||||||
| Net decrease in securities sold under repurchase agreements and federal funds purchased |
(68,484 | ) | (90,176 | ) | (32,763 | ) | ||||||
| Proceeds from long-term borrowings |
— | 20,000 | 50,000 | |||||||||
| Repayments of long-term borrowings |
(94,437 | ) | (97,669 | ) | (20,920 | ) | ||||||
| Proceeds from junior subordinated debt securities |
— | 64,892 | — | |||||||||
| Proceeds from issuance of preferred stock and common stock warrants |
108,676 | — | — | |||||||||
| Acquisition of treasury stock |
— | — | (31,802 | ) | ||||||||
| Sale of treasury stock |
1,349 | 7,480 | 3,520 | |||||||||
| Preferred stock dividends and amortization of discount |
(4,513 | ) | — | — | ||||||||
| Cash dividends paid to shareholders |
(25,427 | ) | (32,302 | ) | (29,790 | ) | ||||||
| Tax benefits from stock-based compensation |
4 | 1,004 | 361 | |||||||||
| Net Cash (Used in) Provided by Financing Activities |
(264,136 | ) | 134,694 | 20,124 | ||||||||
| Net (decrease) increase in cash and cash equivalents |
(628 | ) | (5,099 | ) | 14,899 | |||||||
| Cash and cash equivalents at beginning of year |
69,780 | 74,879 | 59,980 | |||||||||
| Cash and Cash Equivalents at End of Year |
$ | 69,152 | $ | 69,780 | $ | 74,879 | ||||||
| Supplemental Disclosures |
||||||||||||
| Transfers to (from) other real estate owned and other repossessed assets |
$ | 3,756 | $ | 362 | $ | (34 | ) | |||||
| Net assets acquired in acquisition, excluding cash and cash equivalents |
— | 159,552 | — | |||||||||
| Interest paid |
41,082 | 61,566 | 88,876 | |||||||||
| Income taxes paid |
5,338 | 24,264 | 20,186 | |||||||||
See Notes to Consolidated Financial Statements
PAGE 63
NOTES TO CONSOLIDATED FINANCIAL STATEMENTS
S&T Bancorp, Inc. and Subsidiaries
NOTE 1. SUMMARY OF SIGNIFICANT ACCOUNTING POLICIES
NATURE OF OPERATIONS
S&T Bancorp, Inc. (“S&T”) was incorporated on March 17, 1983 under the laws of the Commonwealth of Pennsylvania as a bank holding company and has two wholly owned subsidiaries, S&T Bank and 9th Street Holdings, Inc. S&T owns a one-half interest in Commonwealth Trust Credit Life Insurance Company (“CTCLIC”).
S&T is presently engaged in nonbanking activities through the following six entities: 9th Street Holdings, Inc.; S&T Bancholdings, Inc.; CTCLIC; S&T Insurance Group, LLC; S&T Professional Resources Group, LLC and Stewart Capital Advisors, LLC. 9th Street Holdings, Inc. and S&T Bancholdings, Inc. are investment holding companies. CTCLIC, which is a joint venture with another financial institution, acting as a reinsurer of credit life, accident and health insurance policies sold by S&T Bank and the other institution. S&T Insurance Group, LLC, through its subsidiaries, offers a variety of insurance products. S&T Professional Resources Group, LLC markets software developed by S&T Bank. Stewart Capital Advisors, LLC is a registered investment advisor that manages private investment accounts for individuals and institutions and advises the Stewart Capital Mid Cap Fund.
ACCOUNTING POLICIES
The financial statements of S&T and subsidiaries have been prepared in accordance with accounting principles generally accepted in the United States of America. In preparing the financial statements, management is required to make estimates and assumptions that affect the reported amounts of assets and liabilities as of the dates of the balance sheets and revenues and expenses for the periods then ended. Actual results could differ from those estimates. S&T’s significant accounting policies are described below.
PRINCIPALS OF CONSOLIDATION
The Consolidated Financial Statements include the accounts of S&T and its wholly owned subsidiaries. All significant intercompany transactions have been eliminated in consolidation. Investments of 20 percent to 50 percent of the outstanding common stock of investees are accounted for using the equity method of accounting.
BUSINESS COMBINATIONS
Business combinations are accounted for under the purchase method of accounting. Under the purchase method of accounting, assets and liabilities are recorded at their estimated fair values as of the date of acquisition. Any excess of the cost of the acquisition over the estimated fair value of the net tangible and intangible assets acquired are recorded as goodwill. Results of operations of the acquired entities are included in the Consolidated Statements of Income from the date of acquisition.
FAIR VALUE MEASUREMENTS
S&T uses fair value measurements to record fair value adjustments to certain financial assets and liabilities and to determine fair value disclosures. Securities available-for-sale, trading assets, derivatives and loans held for sale are recorded at their estimated fair value on a recurring basis. Additionally, from time to time, S&T may be required to record at fair value other assets on a nonrecurring basis, such as certain impaired loans, other real estate owned (“OREO”), mortgage servicing rights (“MSRs”), and certain other assets.
Fair value is the price that would be received to sell an asset or paid to transfer a liability in the principal or most advantageous market in an orderly transaction between market participants at the measurement date. An orderly transaction is a transaction that assumes exposure to the market for a
PAGE 64
NOTES TO CONSOLIDATED FINANCIAL STATEMENTS — continued
period prior to the measurement date to allow for marketing activities that are usual and customary for transactions involving such assets or liabilities; it is not a forced transaction.
In determining fair value, S&T uses various valuation approaches, including market, income and cost approaches. The fair value standard establishes a hierarchy for inputs used in measuring fair value that maximizes the use of observable inputs and minimizes the use of unobservable inputs by requiring that observable inputs be used when available. Observable inputs are inputs that market participants would use in pricing the asset or liability, which is developed based on market data obtained from sources independent of S&T. Unobservable inputs reflect S&T’s estimate of assumptions that market participants would use in pricing an asset or liability, which are developed based on the best information available in the circumstances.
The fair value hierarchy gives the highest priority to unadjusted quoted market prices in active markets for identical assets or liabilities (Level 1 measurement) and the lowest priority to unobservable inputs (Level 3 measurement). The fair value hierarchy is broken down into three levels based on the reliability of inputs as follows:
Level 1: valuation is based upon unadjusted quoted market prices for identical instruments traded in active markets.
Level 2: valuation is based upon quoted market prices for similar instruments traded in active markets, quoted market prices for identical or similar instruments traded in markets that are not active and model-based valuation techniques for which all significant assumptions are observable in the market or can be corroborated by market data.
Level 3: valuation is derived from other valuation methodologies including discounted cash flow models and similar techniques that use significant assumptions not observable in the market. These unobservable assumptions reflect estimates of assumptions that market participants would use in determining fair value.
A financial instrument’s level within the fair value hierarchy is based on the lowest level of input that is significant to the fair value measurement.
The following is a description of the valuation methodologies that S&T uses for financial instruments recorded at estimated fair value on either a recurring or nonrecurring basis:
Recurring Basis
Securities Available-for-Sale
Securities available-for-sale include both debt and equity securities.
S&T obtains estimated fair values for debt securities from a third-party pricing service, which utilizes several sources for valuing fixed-income securities. The market evaluation sources for debt securities include observable inputs rather than significant unobservable inputs and are classified as Level 2.
S&T’s collateralized mortgage obligations and mortgage-backed securities of U.S. government corporations and agencies are valued based on market data. The service provider utilizes evaluated pricing models that vary by asset class and include available trade, bid and other market information. Generally, the methodologies include broker quotes, proprietary models, vast descriptive terms and conditions databases, as well as extensive quality control programs.
S&T’s obligations of state and political subdivisions portfolio is valued using proprietary valuation matrices from the service provider, which consider the recent unprecedented changes in the municipal market. The market evaluation model includes a separate curve structure for the bank-qualified versus general market municipals. For the bank-qualified municipals, the source is the service provider’s own trading desk. Securities are further broken down according to insurer, credit support, state of issuance and rating to incorporate additional spreads and municipal curves.
Marketable equity securities that have an active, quotable market are classified in Level 1. Marketable equity securities that are quotable, but are thinly traded or inactive, are classified as Level 2 and securities that are not readily traded and do not have a quotable market are classified as Level 3.
PAGE 65
NOTES TO CONSOLIDATED FINANCIAL STATEMENTS — continued
Trading Assets
When available, S&T uses quoted market prices to determine the estimated fair value of trading assets. S&T’s only trading asset is a Rabbi Trust for deferred compensation plans, which is invested in two readily quoted mutual funds. The Rabbi Trust is classified as Level 1.
Derivative Financial Instruments
S&T calculates the estimated fair value for derivatives using widely accepted valuation techniques including discounted cash flow analysis on the expected cash of each derivative. Each valuation considers the contractual terms of the derivative, including the period to maturity and uses observable market based inputs, such as interest rate curves and implied volatilities. As such, estimates of fair value are classified as Level 2.
S&T incorporates credit valuation adjustments into the valuation models to appropriately reflect both its own non-performance risk and the respective counterparty’s non-performance risk in the estimated fair value measurements. In adjusting the estimated fair value of its derivative contracts for the effect of non-performance risk, S&T has considered the impact of netting and any applicable credit enhancements and collateral postings.
Nonrecurring Basis
Loans Held for Sale
Loans held for sale consist of 1-4 family residential loans originated for sale in the secondary market and carried at the lower of cost or estimated fair value. Periodically it may be necessary to record fair value adjustments under lower of cost or estimated fair value. S&T determines estimated fair value based on reference to quoted market prices for similar assets and liabilities. As a result, such estimates of fair value are classified as Level 2.
Impaired Loans
A loan is considered impaired if management determines that it is probable that S&T will not be able to collect all amounts due according to the contractual terms of the loan agreement of a commercial and industrial and commercial real estate loan greater that $0.5 million. S&T calculates the estimated fair value of impaired loans based upon the present value of expected future cash flows available to pay the loan, or based upon the fair value of the collateral less estimated selling costs when the loan is collateral dependent.
When the estimated fair value is based on an observable market price or a current appraisal, impaired loans are classified as Level 2. When a current appraisal is not available, or if management determines the estimated fair value of the collateral is further impaired below the appraised value and there is no observable market price, the impaired loans are classified as Level 3.
OREO and Other Repossessed Assets
OREO and other repossessed assets are comprised of commercial and residential real estate properties obtained in partial or total satisfaction of loan obligations. OREO acquired in settlement of indebtedness is recorded at the lower of carrying amount of the loan or estimated fair value less cost to sell. Subsequent to foreclosure, these assets are carried at the lower of carrying value or estimated fair value less cost to sell. Accordingly, it may be necessary to record nonrecurring fair value adjustments. Fair value, when recorded, is generally based upon appraisals by licensed or certified appraisers. OREO is classified as level 2.
PAGE 66
NOTES TO CONSOLIDATED FINANCIAL STATEMENTS — continued
Mortgage Servicing Rights
The estimated fair value of the MSRs is estimated by calculating the present value of estimated future net servicing cash flows, considering actual and expected mortgage loan prepayment rates, discount rates, servicing costs and other economic factors, which are determined based on current market conditions. The expected and actual rates of mortgage loan prepayments are the most significant factors driving the value of MSRs. As the valuation model includes significant unobservable inputs, MSRs are classified as Level 3.
Other Assets
In accordance with generally accepted accounting principles (“GAAP”), S&T measures certain other assets at estimated fair value on a nonrecurring basis. These adjustments to fair value usually result from the application of lower of cost or fair value accounting or write downs of individual assets. Valuation methodologies used to measure these fair value adjustments are consistent with overall principles of fair value accounting and consistent with those described above.
Financial Instruments
In addition to financial instruments recorded at estimated fair value in S&T’s financial statements, the fair value accounting pronouncement requires disclosure of estimated fair value of all of an entity’s assets and liabilities considered to be financial instruments. The majority of S&T’s assets and liabilities are considered to be financial instruments as defined in the pronouncement. However, many of such instruments lack an available trading market as characterized by a willing buyer and willing seller engaged in an exchange transaction. Also, it is S&T’s general practice and intent to hold its financial instruments to maturity and to not engage in trading or sales activities. For estimated fair value disclosure purposes, S&T substantially utilized the estimated fair value measurement criteria as required and explained above. In cases where quoted estimated fair values are not available, S&T uses present value methods to determine the estimated fair value of its financial instruments.
These estimates of fair value are significantly affected by the assumptions made and, accordingly, do not necessarily indicate amounts that could be realized in a current market exchange.
Cash and Cash Equivalents and Other Short-Term Assets
The carrying amounts reported in the Consolidated Balance Sheets for cash and due from banks and federal funds purchased approximate those assets estimated fair values.
Loans
For variable rate loans that reprice frequently and with no significant change in credit risk, estimated fair values are based on carrying values. The estimated fair values for other loans are estimated using discounted cash flow analyses, utilizing interest rates currently being offered for loans with similar terms to borrowers as adjusted for net credit losses and the loss of interest income from nonaccrual loans. The carrying amount of accrued interest approximates its estimated fair value.
Bank Owned Life Insurance
S&T receives benefits that are payable upon the death of the insured. The estimated fair value represents the net cash surrender value.
PAGE 67
NOTES TO CONSOLIDATED FINANCIAL STATEMENTS — continued
Deposits
The estimated fair values disclosed for demand deposits (e.g., noninterest and interest-bearing demand, money market and savings accounts) are, by definition, equal to the amount payable on demand. The carrying amounts for variable-rate, fixed-term certificates of deposit approximate their estimated fair value at year-end. Estimated fair values for fixed rate certificates of deposit and other time deposits are based on the discounted value of contractual cash flows, using interest rates currently offered for deposits of similar remaining maturities. The carrying amount of accrued interest payable approximates its estimated fair value.
Short-Term Borrowings and Other Borrowed Funds
The carrying amounts of federal funds purchased, securities sold under repurchase agreements and other borrowings approximate their estimated fair values.
Long-Term Borrowings
The estimated fair values disclosed for long-term borrowings are estimated by discounting contractual cash flows using current interest rates for long-term borrowings of similar remaining maturities and adjusted for any related credit factors.
Junior Subordinated Debt Securities
For the variable-rate junior subordinated debt securities that reprice quarterly, estimated fair values are based on carrying values.
Loan Commitments and Standby Letters Of Credit
Off-balance sheet financial instruments consist of commitments to extend credit and letters of credit. Except for interest rate lock commitments, estimates of the fair value of these off-balance sheet items were not made because of the short-term nature of these arrangements and the credit standing of the counterparties.
Other
Estimates of fair value have not been made for items that are not defined as financial instruments, including such items as S&T’s core deposit intangibles and the value of its trust operation. S&T believes it is impractical to estimate a representational estimated fair value for these types of assets, which represent significant value to S&T.
CASH AND CASH EQUIVALENTS
S&T considers cash and due from banks and federal funds sold as cash and cash equivalents.
SECURITIES
Management determines the appropriate classification of securities at the time of purchase. All securities, including both debt and equity securities, are classified as available-for-sale securities. Such securities are carried at estimated fair value with net unrealized gains and losses deemed to be temporary reported separately as a component of other comprehensive income, net of tax. Realized gains and losses on the sale of available-for-sale securities and other-than-temporary impairment (“OTTI”) charges are recorded within noninterest income in the Consolidated Statements of Income. Realized gains and losses on the sale of securities are determined using the specific-identification method. Bond premiums are amortized to the call date and bond discounts are accreted to the maturity date, both on a consistent yield basis.
PAGE 68
NOTES TO CONSOLIDATED FINANCIAL STATEMENTS — continued
Management systematically evaluates securities for OTTI on a quarterly basis. S&T’s policy for OTTI within the marketable equity securities portfolio generally requires an impairment charge when the security is in a loss position for 12 consecutive months, unless facts and circumstances would suggest the need for an OTTI prior to that time. S&T’s policy for OTTI within the debt securities portfolio is based upon a number of factors, including but not limited to, the length of time and extent to which the estimated fair value has been less than cost, the financial condition of the underlying issuer, the ability of the issuer to meet contractual obligations, the likelihood of the security’s ability to recover any decline in its estimated fair value, whether management intends to sell the security and it is more likely than not that management will be required to sell the investment security prior to the security recovery. If the financial markets continue to experience deterioration, additional charges to income could occur in future periods.
RESTRICTED INVESTMENT IN BANK STOCK
S&T is a member of the Federal Home Loan Bank (“FHLB”) of Pittsburgh. The FHLB requires members to purchase and hold a specified level of FHLB stock based upon their level and availability of borrowings and participation in other programs offered by the FHLB. Stock in the FHLB is non-marketable and is redeemable at the discretion of the FHLB. Both cash and stock dividends are reported as income in taxable investment securities in the Consolidated Statements of Income. The FHLB has currently suspended the payment of dividends.
Members do not purchase stock in the FHLB for the same reasons that traditional equity investors acquire stock in an investor-owned enterprise. Rather, members purchase stock to obtain access to the low-cost products and services offered by the FHLB. Unlike equity securities of traditional for-profit enterprises, the stock of FHLB does not provide its holders with an opportunity for capital appreciation because, by regulation, FHLB stock can only be purchased, redeemed and transferred at par value.
At December 31, 2009 and 2008, S&T’s FHLB stock totaled $23.5 million. This investment is carried at cost and evaluated for impairment based on the ultimate recoverability of the par value.
S&T was notified in December 2008 by the FHLB that they have suspended the payment of dividends and the repurchase of excess capital stock until further notice. S&T management reviewed and evaluated the FHLB capital stock for OTTI at December 31, 2009, which is determined based on the ultimate recoverability of the par value rather than by temporary declines in value. Management considered the suspension of dividends and the repurchase of excess capital stock by the FHLB Board of Directors in a letter to member banks dated December 23, 2008. Management reviewed the FHLB’s Form 10-Q for the period ended September 30, 2009 filed with the Commission on November 12, 2009.
Management considered the following matters when evaluating FHLB stock for OTTI:
| • | Significance and severity of the decline in the net assets of the FHLB (including its investment portfolio) as compared to the capital stock amount of the FHLB and the length of time this situation has persisted. |
| • | Ability of the FHLB to make payments required by law or regulation and the level of such payments in relation to the operating performance of the FHLB. FHLB is meeting their debt obligations. Although the responsibility to repay debt may be shared among FHLB’s in the event that one FHLB cannot pay, to date, a FHLB has never been required to pay the consolidated obligation of another FHLB. |
| • | Impact of legislative and regulatory changes on the institution and, accordingly, on the customer base of the FHLB. With the exception of the Housing Act, enacted July 20, 2008, there are no pending legislative or regulatory changes that would impact the customer base of the FHLB. |
| • | Liquidity position of the FHLB. |
PAGE 69
NOTES TO CONSOLIDATED FINANCIAL STATEMENTS — continued
Management considered the following items from the September 30, 2009 Form 10-Q of the FHLB:
| • | The total capital of the FHLB decreased to $3.6 billion at September 30, 2009 from $4.1 billion at December 31, 2008, due primarily to unrealized losses on available-for-sale securities. |
| • | The net income of the FHLB for the nine months ended September 30, 2009 decreased to a net loss of $31.9 million from $207.4 million in the comparable period in 2008, due primarily to OTTI charges. |
| • | The FHLB exceeded all required capital ratios as of September 30, 2009 and December 31, 2008. In addition, permanent capital of $4.4 billion and $4.2 billion at September 30, 2009 and December 31, 2008, respectively, exceeded its risk-based capital requirement by $1.2 billion and $233.8 million, respectively. |
| • | The gross unrealized losses on its private label mortgage-backed securities (“MBS”) decreased to $0.5 billion at September 30, 2009 from $2.1 billion at December 31, 2008. However, management also noted the following: |
| • | The FHLB concluded that these unrealized losses were not OTTI as of September 30, 2009. |
| • | The FHLB Management’s Discussion and Analysis disclosed that all MBS continue to pay principal and interest in accordance with their contractual terms. |
| • | 30 percent of these securities were rated AAA by external credit agencies. |
| • | The FHLB had minimal subprime exposure in its private label MBS portfolio. |
| • | The liquidity position of the FHLB (defined as cash and due from banks, interest-earning deposits and federal funds sold) decreased to $4.5 billion at September 30, 2009 as compared to $6.4 billion at December 31, 2008. |
S&T believes its holdings in the stock are ultimately recoverable at par value as of December 31, 2009 and, therefore, determined that FHLB stock was not OTTI. In addition, S&T has ample liquidity and does not require redemption of its FHLB stock in the foreseeable future.
LOANS HELD FOR SALE
Loans held for sale consists of 1-4 family residential loans originated for sale in the secondary market and carried at lower of cost or estimated fair value, determined on an individual loan basis. Gains and losses on sales of loans held for sale are included in other noninterest income in the Consolidated Statements of Income.
LOANS
Interest on loans is accrued and credited to the Consolidated Statements of Income based on the principal amount outstanding. Accretion of discounts and amortization of premiums on loans are included in interest income in the Consolidated Statements of Income. Loan origination fees and direct loan origination costs are deferred and amortized as an adjustment of loan yield over the respective lives of the loans without consideration of anticipated prepayments. Loans are placed on nonaccrual and interest is discontinued generally when interest and principal are 90 days or more past due.
A loan is considered impaired if management determines that it is probable that S&T will not be able to collect all amounts due according to the contractual terms of the loan agreement. All impaired loans are classified as substandard for risk classification purposes. Impaired loans are reserved, to the estimated value of collateral and/or cash flow associated with the loan, when management believes principal and interest will not be collected under the contractual terms of the loan. When the interest accrual is discontinued, all unpaid accrued interest is reversed against interest income. Interest income is subsequently recognized only to the extent that cash payments are received.
PAGE 70
NOTES TO CONSOLIDATED FINANCIAL STATEMENTS — continued
ALLOWANCE FOR LOAN LOSSES
The allowance for loan losses addresses credit losses inherent in the existing loan portfolio and is presented as a reserve against loans on the Consolidated Balance Sheets. The liability for loss on loan commitments represents management’s estimate of probable losses associated with future advances against loan commitments. Determination of an adequate allowance for loan losses and liability for loss on loan commitments is inherently subjective, as it requires estimations of occurrence of future events, as well as timing of such events.
The allowance is increased by a provision charged to expense and reduced by charge-offs, net of recoveries. S&T’s periodic evaluation of the adequacy of the allowance for loan losses is determined by management through evaluation of the loss exposure on individual impaired, nonperforming, delinquent and high-dollar loans; review of risk conditions and business trends; historical loss experience and; growth and composition of the loan portfolio, as well as other relevant factors.
A quantitative analysis is utilized to support the adequacy of the allowance for loan losses. This analysis includes review of the historical charge-offs that have occurred within segmented portfolios over the last five years. Management also assesses qualitative factors such as unemployment, non-accrual, loan growth, vacancy, classified loan, bank loss/recovery, delinquency and out of state risk trends. The allowance established for individual impaired loans reflects expected losses resulting from analyses developed through specific credit allocations for individual loans. The specific credit allocations are based on regular analysis of all loans over a fixed dollar amount, where the internal credit rating is at or below a predetermined classification. These analyses involve a high degree of judgment in estimating the amount of loss associated with specific impaired loan, including estimating the amount and timing of future cash flows, current estimated fair value of the loan and collateral values. The evaluation of this component of the allowance requires considerable judgment in order to estimate inherent loss exposures.
Significant to this analysis is the shift in loan portfolio composition to an increased mix of commercial loans. These loans are generally larger in size and many are unseasoned or new loan relationships. Management relies on its risk-rating process to monitor trends that may be occurring relative to commercial loans to assess potential weaknesses within the credit. Current risk factors and trends in risk ratings are considered in the determination and allocation of the allowance for loan losses.
S&T believes its quantitative and qualitative analysis and risk-rating process, which serves as the primary basis for assessing the adequacy of the allowance for loan losses, is sufficient to allow it to conclude that the total allowance for loan losses is adequate to absorb inherent and probable loan losses.
PREMISES AND EQUIPMENT
Premises and equipment are stated at cost less accumulated depreciation. Maintenance and repairs are charged to expense as incurred, while improvements that extend an asset’s useful life are capitalized and depreciated over the estimated remaining life of the asset. Depreciation expense is computed generally by the straight-line method for financial reporting purposes and accelerated methods for income tax purposes. Leasehold improvements are amortized over the shorter of the asset’s useful life or the remaining lease term, including renewal periods when reasonably assured.
GOODWILL AND OTHER INTANGIBLE ASSETS
S&T has core deposit and other intangible assets subject to amortization. S&T determined the amount of identifiable intangible assets based upon independent core deposit and insurance contract analyses. Intangible assets with finite useful lives are evaluated for impairment whenever events or changes in circumstances indicate that their carrying amount may not be recoverable. No triggering events occurred during the years ended December 31, 2009, 2008 and 2007.
PAGE 71
NOTES TO CONSOLIDATED FINANCIAL STATEMENTS — continued
S&T has three reporting units including: a Community Bank, Wealth Management and an Insurance Agency. At December 31, 2009, S&T had goodwill of $165.2 million, including $161.1 million at the Community Bank, representing 98 percent of total goodwill and $4.1 million at the Insurance Agency, representing 2 percent of total goodwill. The carrying value of goodwill is tested annually for impairment each October 1 or more frequently if indicators of impairment are present. The evaluation for impairment involves comparing the current estimated fair value of each reporting unit to its carrying value, including goodwill. If the current estimated fair value of a reporting unit exceeds its carrying value, no additional testing is required and an impairment loss is not recorded. If the estimated fair value of a reporting unit is less than the carrying value, further valuation procedures are performed and could result in an impairment of goodwill being recorded. Further valuation procedures would include allocating the estimated fair value to all assets and liabilities of the reporting unit to determine an implied goodwill value. If the implied goodwill value of a reporting unit is less than the carrying amount of that goodwill, an impairment loss is recognized in an amount equal to that excess. During the year, and on October 1, management’s analysis indicated that estimated fair value exceeded carrying value. As such, no goodwill impairment was recorded.
JOINT VENTURES
S&T has 32 limited partnership investments in affordable housing and federal historic rehabilitation projects for which it provides funding as a limited partner and receives tax credits, tax deductions for losses incurred by the projects and proceeds from property disposition based on its partnership share prescribed by each partnership agreement. At December 31, 2009 and 2008, S&T had recorded investments in other assets on its Consolidated Balance Sheets of approximately $18.1 million and $16.3 million, respectively, associated with these investments. These investments are amortized over ten years and certain investments are reviewed annually for impairment. The impairment test considers estimated tax credits and tax benefits of future losses. Investments in partnerships for the purpose of rehabilitating historic structures are evaluated for impairment at the end of each reporting period and are recorded at their net realizable value expected from future tax credits. S&T determined that it is not the primary beneficiary of these partnerships and does not consolidate them.
OREO AND OTHER REPOSSESSED ASSETS
OREO and other repossessed assets are included in other assets in the Consolidated Balance Sheets and are comprised of properties acquired through foreclosure proceedings or acceptance of a deed in lieu of a foreclosure. These properties are carried at the lower of carrying value of the loan or estimated fair value less estimated cost to sell at acquisition. Loan losses arising from the acquisition of such property initially are charged against the allowance for loan losses. Subsequently, these assets are carried at the lower of carrying value or estimated fair value less cost to sell. Gains or losses realized subsequent to acquisition are recorded in other expenses in the Consolidated Statements of Income.
MORTGAGE SERVICING RIGHTS
Mortgage servicing assets are recognized as separate assets when commitments to fund a loan to be sold are made. Upon commitment, the MSR is established, which represents the then current estimated fair value of future net cash flows expected to be realized for performing the servicing activities. The estimated fair value of the MSRs are estimated by calculating the present value of estimated future net servicing cash flows, taking into consideration actual and expected mortgage loan prepayment rates, discount rates, servicing costs and other economic factors, which are determined based on current market conditions. The expected and actual rates of mortgage loan prepayments are the most significant factors driving the value of MSRs. Increases in mortgage loan
PAGE 72
NOTES TO CONSOLIDATED FINANCIAL STATEMENTS — continued
prepayments reduce estimated future net servicing cash flows because the life of the underlying loan is reduced. In determining the estimated fair value of the MSRs, mortgage interest rates, which are used to determine prepayment rates and discount rates, are held constant over the estimated life of the portfolio. MSRs are reported in other assets in the Consolidated Balance Sheets and are amortized into noninterest income in the Consolidated Statements of Income in proportion to, and over the period of, the estimated future net servicing income of the underlying mortgage loans.
MSRs are regularly evaluated for impairment based on the estimated fair value of those rights. The MSRs are stratified by certain risk characteristics, primarily loan term and note rate. If temporary impairment exists within a risk stratification tranche, a valuation allowance is established through a charge to income equal to the amount by which the carrying value exceeds the estimated fair value. If it is later determined all or a portion of the temporary impairment no longer exists for a particular tranche, the valuation allowance is reduced.
MSRs are also reviewed for OTTI. OTTI exists when the recoverability of a recorded valuation allowance is determined to be remote, taking into consideration historical and projected interest rates and loan pay-off activity. When this situation occurs, the unrecoverable portion of the valuation allowance is applied as a direct write-down to the carrying value of the MSRs.
Unlike a valuation allowance, a direct write-down permanently reduces the carrying value of the MSRs and the valuation allowance, precluding subsequent recoveries.
For the year ended December 31, 2009 and 2008, the 1-4 family mortgage loans that were sold to Fannie Mae amounted to $133.5 million and $17.7 million, respectively. At December 31, 2009 and 2008, S&T’s servicing portfolio totaled $255.9 million and $172.6 million, respectively.
The following table indicates mortgage servicing rights and the net carrying values:
| Servicing Rights |
Valuation Allowance |
Net Carrying Value |
||||||||||
| (dollars in thousands) | ||||||||||||
| Balance at December 31, 2007 |
$ | 2,017 | $ | 156 | $ | 1,861 | ||||||
| Additions/(reductions) |
201 | 884 | (683 | ) | ||||||||
| Amortization |
(346 | ) | — | (346 | ) | |||||||
| Balance at December 31, 2008 |
$ | 1,872 | $ | 1,040 | $ | 832 | ||||||
| Additions/(reductions) |
1,233 | (448 | ) | 1,681 | ||||||||
| Amortization |
(413 | ) | — | (413 | ) | |||||||
| Balance at December 31, 2009 |
$ | 2,692 | $ | 592 | $ | 2,100 | ||||||
DERIVATIVE FINANCIAL INSTRUMENTS
S&T has certain interest rate derivative positions that are not designated as hedging instruments. These derivative positions relate to transactions in which S&T enters into an interest rate swap with a customer while at the same time entering into an offsetting interest rate swap with another financial institution. In connection with each transaction, S&T agrees to pay interest to the customer on a notional amount at a variable interest rate and receive interest from the customer on a same notional amount at a fixed rate. At the same time, S&T agrees to pay another financial institution the same fixed interest rate on the same notional amount and receive the same variable interest rate on the same notional amount. The transaction allows S&T’s customer to effectively convert a variable rate loan to a fixed rate. S&T incorporates credit valuation adjustments into the valuation models to appropriately reflect both its own non-performance risk and the respective counterparty’s non-performance risk in the estimated fair value measurements. In adjusting the estimated fair value of its derivative contracts for the effect of non-performance risk, S&T has considered the impact of netting and any applicable credit enhancements and collateral postings. These positions do not qualify for hedge accounting, therefore, fair value adjustments are recorded in other noninterest income in the Consolidated Statements of Income.
PAGE 73
NOTES TO CONSOLIDATED FINANCIAL STATEMENTS — continued
S&T offers rate lock commitments to potential borrowers. The commitments are generally for 60 days and guarantee a specified interest rate for a loan if underwriting standards are met, but the commitment does not obligate the potential borrower to close on the loan. Accordingly, some commitments expire prior to becoming loans. In addition, S&T can encounter pricing risks if interest rates increase significantly before the loan can be closed and sold. S&T may utilize forward sales contracts in order to mitigate this pricing risk. Whenever a customer desires these products, a mortgage originator quotes a secondary market rate, guaranteed for that day by the investor. The rate lock is executed between the mortgagee and S&T and in turn a forward sales contract is executed between S&T and the investor. Both the rate lock commitment and the corresponding forward sales contract for each customer are considered derivatives, but are not accounted for using hedge accounting. As such, changes in the estimated fair value of the derivatives during the commitment period are recorded in current earnings and included in other income on the Consolidated Statements of Income.
BANK OWNED LIFE INSURANCE
S&T has purchased life insurance policies on certain executive officers and employees. S&T receives the cash surrender value of each policy upon its termination or benefits are payable upon the death of the insured. These polices are recorded in other assets in the Consolidated Balance Sheets at net cash surrender value. Changes in net cash surrender value are recognized as noninterest income or expense in the Consolidated Statements of Income.
WEALTH MANAGEMENT AND INCOME
Assets held in a fiduciary capacity by the subsidiary bank, S&T Bank, are not assets of S&T Bank and are therefore not included in the Consolidated Financial Statements. Wealth management fee income is reported on the Consolidated Statements of Income on the accrual basis. At December 31, 2009 and 2008, S&T’s wealth management fee income totaled $7.5 million and $8.0 million, respectively.
STOCK-BASED COMPENSATION
S&T has various stock-based employee compensation plans, which are described in Note 18 Incentive and Restricted Stock Plan and Dividend Reinvestment Plan. Awards granted are valued at estimated fair value and compensation cost is recorded on a straight-line basis over the requisite service period, net of estimated forfeitures.
PENSIONS
Pension expense for S&T Bank’s defined benefit pension plan is actuarially determined using the projected unit credit actuarial cost method. The funding policy for the plan is to contribute amounts to the plan sufficient to meet the minimum funding requirements of the Employee Retirement Income Security Act of 1974, plus such additional amounts as may be appropriate, subject to federal income tax limitation.
INCOME TAXES
S&T estimates income tax expense based on amounts expected to be owed to the tax jurisdictions where S&T conducts business. On a quarterly basis, management assesses the reasonableness of its effective tax rate based upon its current estimate of the amount and components of net income, tax credits and the applicable statutory tax rates expected for the full year.
PAGE 74
NOTES TO CONSOLIDATED FINANCIAL STATEMENTS — continued
Deferred income tax assets and liabilities are determined using the asset and liability method and are reported in the Consolidated Balance Sheets. Under this method, the net deferred tax asset or liability is based on the tax effects of the differences between the book and tax basis of assets and liabilities and recognizes enacted changes in tax rate and laws. Deferred tax assets are recognized to the extent they exist and are subject to a valuation allowance based on management’s judgment that realization is more likely than not.
Accrued taxes represent the net estimated amount due to taxing jurisdictions and are reported in other liabilities in the Consolidated Balance Sheets. S&T evaluates and assesses the relative risks and appropriate tax treatment of transactions and filing positions after considering statutes, regulations, judicial precedent and other information and maintains tax accruals consistent with its evaluation of these relative risks and merits. Changes to the estimate of accrued taxes occur periodically due to changes in tax rates, interpretations of tax laws, the status of examinations being conducted by taxing authorities and changes to statutory, judicial and regulatory guidance. These changes, when they occur, can affect deferred taxes and accrued taxes, as well as the current period’s income tax expense and can be significant to the operating results of S&T.
Tax positions are recognized as a benefit only if it is “more likely than not” that the tax position would be sustained in a tax examination, with a tax examination being presumed to occur. The amount recognized is the largest amount of tax benefit that is greater than 50 percent likely of being realized on examination. For tax positions not meeting the “more likely than not” test, no tax benefit is recorded.
TREASURY STOCK
The purchase of S&T common stock is recorded at cost. At the time of reissuance, the treasury stock account is reduced using the average cost method. Gains and losses on the reissuance of common stock are recorded in additional paid-in capital, to the extent additional paid-in capital from previous treasury share transactions exists. Any deficiency is charged to retained earnings.
EARNINGS PER COMMON SHARE
Basic earnings per share (“EPS”) is calculated by dividing net income attributable to common shareholders, by the weighted average number of common shares outstanding, during the period. Potentially dilutive securities are excluded from the basic calculation, but are included in diluted EPS. In computing diluted EPS, average shares outstanding have been increased by the dilutive common stock equivalents relating to S&T’s outstanding stock options, warrants and restricted stock. Excluded from the calculation were anti-dilutive stock options of 1,173,660 shares, 543,439 shares and 563,586 shares for the years ended December 31, 2009, 2008 and 2007, respectively. Further 517,012 common stock warrants were anti-dilutive at December 31, 2009.
A reconcilement of the weighted average shares outstanding used to calculate basic net income (loss) per share and diluted net income (loss) per share follows:
| 2009 | 2008 | 2007 | ||||
| Weighted average shares outstanding (basic) |
27,626,223 | 26,214,678 | 24,737,958 | |||
| Impact of common stock equivalents |
32,638 | 169,631 | 150,616 | |||
| Weighted average shares outstanding (diluted) |
27,658,861 | 26,384,309 | 24,888,574 |
RECENTLY ISSUED ACCOUNTING PRONOUNCEMENTS
ACCOUNTING STANDARDS CODIFICATION
In June 2009, the Financial Accounting Standards Board (“FASB”) issued an accounting pronouncement, which establishes the FASB Accounting Standards Codification (“the Codification” or “ASC”) as the source of accounting principles and the framework for selecting the principles used in the preparation of financial statements by nongovernmental entities. All guidance contained in the
PAGE 75
NOTES TO CONSOLIDATED FINANCIAL STATEMENTS — continued
Codification will carry an equal level of authority. However, in addition to the Codification rules, all interpretive releases of the SEC under federal securities laws are also sources of authoritative GAAP. Following the Codification, the FASB will not issue new standards in the form of Statements, FASB Staff Positions or Emerging Issues Task Force Abstracts. Instead, it will issue Accounting Standards Updates (“ASU”), which will serve to update the Codification, provide background information about the guidance and provide the basis for conclusions on the changes to the Codification. The Codification was effective for interim reporting periods ending after September 15, 2009. The adoption of this pronouncement did not have a material impact on S&T’s Consolidated Financial Statements.
SUBSEQUENT EVENTS
In May 2009, the FASB issued an accounting pronouncement, which establishes general standards of accounting for and disclosure of events that occur after the balance sheet date, but before financial statements are issued or are available to be issued. This pronouncement also requires entities to disclose the date through which subsequent events have been evaluated. It is effective for interim reporting periods ending after June 15, 2009. The adoption of this pronouncement did not have a material impact on S&T’s Consolidated Financial Statements.
FAIR VALUE MEASUREMENTS
In April 2009, the FASB issued an accounting pronouncement, which requires disclosures on the fair value of financial instruments in interim financial statements as well as in annual financial statements. The disclosures are effective for interim reporting periods ending after June 15, 2009 and did not have a material impact on S&T’s Consolidated Financial Statements.
In April 2009, the FASB issued an accounting pronouncement to provide additional guidance on estimating fair value when the volume and level of activity for an asset or liability have significantly decreased in relation to normal market activity for the asset or liability. The pronouncement also provides additional guidance on circumstances that may indicate that a transaction is not orderly. It is effective for interim and annual periods ending after June 15, 2009, and is being applied prospectively. The adoption of this pronouncement did not have a material impact on S&T’s Consolidated Financial Statements.
DETERMINING WHETHER IMPAIRMENT OF A DEBT SECURITY IS OTHER-THAN-TEMPORARY
In April 2009, the FASB issued an accounting pronouncement, which provides new guidance on the recognition and presentation of an OTTI of debt securities classified as available-for-sale and held-to-maturity, and provides some new disclosure requirements. To avoid considering an impairment to be other-than-temporary management must assert that it does not have the intent to sell the security and it is more likely than not that it will not have to sell the security before recovery of its cost. This pronouncement also changes the total amount recognized in earnings when OTTI exists to require the estimated credit loss to be recorded in earnings and the noncredit portion of the loss to be recorded in other comprehensive income. It is effective for interim and annual periods ending after June 15, 2009, and is being applied prospectively. The adoption of this pronouncement did not have any impact on S&T’s Consolidated Financial Statements.
DISCLOSURES ABOUT DERIVATIVE INSTRUMENTS AND HEDGING ACTIVITIES
In March 2008, the FASB issued an accounting standard, which amends and expands the disclosure requirements for derivative financial instruments and hedging activities. Expanded disclosures under this accounting standard include (a) how and why an entity uses derivative instruments, (b) how derivative instruments and related hedged items are accounted for under GAAP and (c) how
PAGE 76
NOTES TO CONSOLIDATED FINANCIAL STATEMENTS — continued
derivative instruments and related hedged items affect an entity’s financial position, financial performance and cash flows. The standard also requires qualitative disclosures about objectives and strategies for using derivatives, quantitative disclosures about the fair value of and gains and losses on derivative instruments and disclosures about credit-risk-related contingent features in derivative instruments. S&T adopted this accounting standard effective January 1, 2009. This accounting standard relates to disclosures only and its adoption did not have any effect on the financial condition, results of operations or liquidity of S&T.
EMPLOYER’S DISCLOSURES ABOUT POSTRETIREMENT BENEFIT PLAN ASSETS
In December 2008, the FASB issued an accounting standard to require more detailed disclosures about employers’ plan assets, including employers’ investment strategies, major categories of plan assets, concentrations of risk within plan assets and valuation techniques used to measure the fair value of plan assets. This accounting standard is effective for fiscal years ending after December 15, 2009. Adoption of this accounting standard did not have a material impact on S&T’s Consolidated Financial Statements and only required additional disclosures.
DETERMINING WHETHER INSTRUMENTS GRANTED IN SHARE-BASED PAYMENTS TRANSACTIONS ARE PARTICIPATING SECURITIES
In June 2008, FASB issued an accounting standard on determining whether instruments granted in share-based payment transactions are participating securities. This statement clarifies whether instruments, such as restricted stock, granted in share-based payments are participating securities prior to vesting. Such participating securities must be included in the computation of earnings per share under the two-class method. This standard also requires companies to treat unvested share-based payment awards that have non-forfeitable rights to dividend or dividend equivalents as a separate class of securities in calculating earnings per share. This pronouncement is effective for financial statements issued for fiscal years and interim periods beginning after December 15, 2008, and requires a company to retrospectively adjust its earning per share data. The adoption did not have a significant impact on S&T’s Consolidated Results of Operations or earnings per share.
BUSINESS COMBINATIONS
In December 2007, the FASB issued an accounting standard, which establishes principles and requirements for how an acquirer recognizes and measures in its financial statements the identifiable assets acquired, the liabilities assumed, any non-controlling interest in the acquiree and the goodwill acquired. The standard also establishes disclosure requirements which will enable users to evaluate the nature and financial effects of the business combination. This accounting standard is effective for periods beginning on or after December 15, 2008 and earlier adoption is prohibited. The adoption of this pronouncement did not have any impact on S&T’s Consolidated Financial Statements.
FUTURE APPLICATION OF ACCOUNTING PRONOUNCEMENTS
ACCOUNTING FOR TRANSFERS OF FINANCIAL ASSETS
In June 2009, the FASB issued an accounting pronouncement regarding accounting for transfers of financial assets, which eliminates the qualifying special-purpose entities (“QSPEs”) concept and associated guidance that had been a significant source of complexity, creates more stringent conditions for reporting a transfer of a portion of financial asset as a sale, clarifies other sale accounting criteria and changes the initial measurement of a transferor’s interest in transferred financial assets. The accounting pronouncement is effective as of the beginning of the first annual and interim reporting period that begins after November 15, 2009. S&T is currently evaluating the impact of adopting this pronouncement on its Consolidated Financial Statements.
PAGE 77
NOTES TO CONSOLIDATED FINANCIAL STATEMENTS — continued
AMENDMENTS TO CONSOLIDATION OF VARIABLE INTEREST ENTITIES’
In June 2009, the FASB issued a pronouncement regarding consolidation accounting, which requires former QSPEs to be evaluated for consolidation and also changes the approach to determining a variable interest entity’s (“VIE”) primary beneficiary. The pronouncement also requires more frequent reassessment as to whether they must consolidate VIEs. The application of this pronouncement to investment companies was deferred indefinitely. This pronouncement must be applied as of the beginning of the first interim and annual period that begins after November 15, 2009. S&T is currently evaluating the impact of adopting this pronouncement on its Consolidated Financial Statements.
RECLASSIFICATION
Certain amounts in prior years’ financial statements have been reclassed to conform to the current year’s presentation. The reclassifications had no significant effect on S&T’s financial condition or results of operations.
SUBSEQUENT EVENTS
S&T completed a subsequent event review through the issue date of February 26, 2010 of this report. As part of that review, estimated fair values of the securities portfolio were reviewed to evaluate if there were any material declines in estimated fair value. There were no subsequent events determined or material declines in estimated fair value of the securities portfolio since the balance sheet date of December 31, 2009 as concluded in the review.
NOTE 2. CAPITAL PURCHASE PROGRAM
On January 16, 2009, S&T completed a $108.7 million capital raise as a participant in the U.S. Treasury Capital Purchase Program (the “CPP”). In conjunction with S&T’s participation in the CPP, S&T issued to the U.S. Treasury 108,676 shares of S&T’s Series A Preferred Stock, having a liquidation amount per share equal to $1,000 per share, for a total price of $108.7 million. The Series A Preferred Stock pays cumulative dividends at a rate of 5 percent per year for the first five years and thereafter at a rate of 9 percent per year. S&T calculated the estimated fair value of the preferred stock with a discounted cash flow model using a 10 percent discount rate determined by a group of similarly rated preferred securities in the banking sector. The level yield method is used to amortize the discount on the preferred stock over a period of five years. The Series A Preferred Stock is generally non-voting. Under changes made to the CPP by the American Recovery and Reinvestment Act of 2009 (“ARRA”), subject to approval by banking regulatory agencies, S&T can redeem the Series A Preferred Stock, plus any accrued and unpaid dividends, at any time. If S&T only redeems part of the CPP investment, then it must pay a minimum of 25 percent of the issuance price, or $27.2 million. The consent of the U.S. Treasury will be required for S&T to increase its common stock dividend (above the dividend amount prior to the participation in the CPP) or repurchase its common stock or other equity or capital securities, other than in connection with benefit plans consistent with past practice and certain other circumstances through January 16, 2012. The consent of the U.S Treasury will not be required if S&T has redeemed the Series A Preferred Stock or the U.S. Treasury has transferred the Series A Preferred Stock to a third party. In addition, the Series A Preferred Stock issuance includes certain restrictions on executive compensation that could limit the tax deductibility of compensation S&T pays to executive management.
As part of its purchase of the Series A Preferred Stock, the U.S. Treasury received a Warrant to purchase 517,012 shares of S&T’s common stock at an initial per share exercise price of $31.53. The Warrant provides for the adjustment of the exercise price and the number of shares of S&T’s common stock issuable upon exercise pursuant to customary anti-dilution provisions, such as upon stock splits
PAGE 78
NOTES TO CONSOLIDATED FINANCIAL STATEMENTS — continued
or distributions of securities or other assets to holders of S&T’s common stock and upon certain issuances of S&T’s common stock at or below a specified price relative to the initial exercise price. Management engaged an outside expert to calculate the estimated fair value of the common stock warrants issued by S&T on January 16, 2009. A binomial pricing model was used resulting in an estimated fair value of $4.0 million.
The assumptions used to calculate the estimated fair value of the warrants are summarized below:
| Assumption | Value | |||
| Contractual term |
10 years | |||
| Exercise price |
$ | 31.53 | ||
| Estimated fair value of company stock |
$ | 29.14 | ||
| Expected life |
10 years | |||
| Risk-free rate over expected life of the warrant |
2.36 | % | ||
| Expected volatility |
28.4 | % | ||
| Expected dividend yield |
3.85 | % | ||
S&T utilized the average of daily and monthly historical volatility for purposes of this valuation. S&T calculated the fair value of the preferred stock with a discounted cash flow model using a 10 percent discount rate determined by comparison to a group of similarly rated preferred securities in the banking sector. The level yield method is used to amortize the discount on the preferred stock over a period of five years. The Warrant expires ten years from the issuance date. If, on or prior to December 31, 2009, S&T receives aggregate gross cash proceeds of not less than $108.7 million from qualified equity offerings announced after October 13, 2008, the number of shares of common stock issuable pursuant to the U.S. Treasury’s exercise of the Warrant will be reduced by one-half of the original number of shares. In addition, the U.S. Treasury has agreed not to exercise voting power with respect to any shares of common stock issued upon exercise of the Warrant.
NOTE 3. ACQUISITION
On June 6, 2008, S&T completed the acquisition of 100 percent of the voting shares of IBT Bancorp, Inc. located in Irwin, Pennsylvania, (“IBT”) which was the sole shareholder of Irwin Bank, in a stock and cash transaction valued at approximately $176.6 million. Pursuant to the terms of the merger agreement, shareholders of IBT were entitled to elect to receive for each share of IBT common stock that they owned, either $31.00 in cash or 0.93 of a share of S&T common stock. S&T issued 2,751,749 shares of common stock out of its treasury shares at a recorded estimated fair value of $91.7 million based on $33.33 per share, which was the closing price on May 12, 2008, the day before the IBT shareholders approved the merger and paid a total of $75.1 million in cash to the former IBT shareholders. The acquisition significantly expanded S&T’s market share in the growing Allegheny and Westmoreland County markets in western Pennsylvania. The acquisition was accounted for under the purchase method and all transactions of IBT since the acquisition date are included in S&T’s Consolidated Financial Statements.
PAGE 79
NOTES TO CONSOLIDATED FINANCIAL STATEMENTS — continued
The following table summarizes the estimated fair values of the assets acquired and liabilities assumed at the date of acquisition of IBT.
| June 6, 2008 Unaudited | |||
| (dollars in thousands) | |||
| ASSETS |
|||
| Cash and cash equivalents |
$ | 17,066 | |
| Securities |
253,347 | ||
| Other investments |
5,856 | ||
| Loans, net of allowance of $5,420 |
484,643 | ||
| Premises and other equipment |
7,310 | ||
| Goodwill and other intangibles |
125,080 | ||
| Other assets |
23,102 | ||
| Total Assets Acquired |
$ | 916,404 | |
| LIABILITIES |
|||
| Deposits |
$ | 573,601 | |
| Borrowings |
160,316 | ||
| Other liabilities |
5,869 | ||
| Total Liabilities Assumed |
739,786 | ||
| Net Assets Acquired |
$ | 176,618 | |
Presented below is certain unaudited pro forma information for the year ended December 31, 2008 and 2007, as if IBT had been acquired on January 1, 2008 and 2007, respectively. These results combine the historical results of IBT for the period from January 1, 2008 to June 6, 2008 and the year ended December 31, 2007 with the results of S&T. The results of IBT exclude certain nonrecurring merger related expenses (including contract buy-outs, $5.2 million; change-in-control payments, $1.0 million; and legal and consulting expense, $2.2 million). These pro forma results, which include certain adjustments for the estimated impact of purchase accounting adjustments, are not necessarily indicative of what results would have been had the acquisition taken place on the indicated dates. Revenue is the sum of net interest income (total interest income less total interest expense) plus noninterest income, excluding security losses.
| Year Ended December 31, 2008 |
Year Ended December 31, 2007 | |||||
| (dollars in thousands, except per share data) | ||||||
| Revenue |
$ | 194,029 | $ | 177,046 | ||
| Net income |
64,932 | 59,248 | ||||
| Net income available to common shareholders |
64,932 | 59,248 | ||||
| Common earnings per share—basic |
$ | 2.37 | $ | 2.16 | ||
| Common earnings per share—diluted |
2.36 | 2.14 | ||||
PAGE 80
NOTES TO CONSOLIDATED FINANCIAL STATEMENTS — continued
NOTE 4. FAIR VALUE MEASUREMENTS
S&T uses fair value measurements to record fair value adjustments to certain financial assets and liabilities and to expand disclosures on these measurements. Refer to Note 1, Fair Value Measurements, for S&T’s accounting policy including details of the valuation methods used to determine the estimated fair values of S&T’s assets and liabilities. The following tables present S&T’s assets and liabilities that are measured at estimated fair value on a recurring basis by fair value hierarchy level at December 31, 2009 and 2008.
| December 31, 2009 | ||||||||||||
| Level 1 | Level 2 | Level 3 | Total | |||||||||
| (dollars in thousands) | ||||||||||||
| ASSETS |
||||||||||||
| Obligations of U.S. government corporations and agencies |
$ | — | $ | 127,971 | $ | — | $ | 127,971 | ||||
| Collateralized mortgage obligations of U.S. government corporations and agencies |
— | 60,229 | — | 60,229 | ||||||||
| Mortgage-backed securities of U.S. government corporations and agencies |
— | 61,521 | — | 61,521 | ||||||||
| Obligations of state and political subdivisions |
— | 92,928 | — | 92,928 | ||||||||
| Marketable equity securities |
3,607 | 7,466 | 1,138 | 12,211 | ||||||||
| Trading account assets |
3,090 | — | — | 3,090 | ||||||||
| Interest rate swaps |
— | 11,661 | — | 11,661 | ||||||||
| Interest rate lock commitments |
— | 126 | — | 126 | ||||||||
| Forward sale contracts |
— | 192 | — | 192 | ||||||||
| Total Assets |
$ | 6,697 | $ | 362,094 | $ | 1,138 | $ | 369,929 | ||||
| LIABILITIES |
||||||||||||
| Interest rate swaps |
$ | — | $ | 11,594 | $ | — | $ | 11,594 | ||||
| Total Liabilities |
$ | — | $ | 11,594 | $ | — | $ | 11,594 | ||||
| December 31, 2008 | ||||||||||||
| Level 1 | Level 2 | Level 3 | Total | |||||||||
| (dollars in thousands) | ||||||||||||
| ASSETS |
||||||||||||
| Obligations of U.S. government corporations and agencies |
$ | — | $ | 169,251 | $ | — | $ | 169,251 | ||||
| Collateralized mortgage obligations of U.S. government corporations and agencies |
— | 63,900 | — | 63,900 | ||||||||
| Mortgage-backed securities of U.S. government corporations and agencies |
— | 78,952 | — | 78,952 | ||||||||
| Obligations of state and political subdivisions |
— | 122,478 | — | 122,478 | ||||||||
| Other debt securities |
— | 25 | — | 25 | ||||||||
| Marketable equity securities |
5,175 | 8,693 | 1,050 | 14,918 | ||||||||
| Other equity securities |
3,189 | — | — | 3,189 | ||||||||
| Trading account assets |
2,268 | — | — | 2,268 | ||||||||
| Interest rate swaps |
— | 25,077 | — | 25,077 | ||||||||
| Interest rate lock commitments |
— | 120 | — | 120 | ||||||||
| Total Assets |
$ | 10,632 | $ | 468,496 | $ | 1,050 | $ | 480,178 | ||||
| LIABILITIES |
||||||||||||
| Interest rate swaps |
$ | — | $ | 24,979 | $ | — | $ | 24,979 | ||||
| Forward sale contracts |
— | 49 | — | 49 | ||||||||
| Total Liabilities |
$ | — | $ | 25,028 | $ | — | $ | 25,028 | ||||
PAGE 81
NOTES TO CONSOLIDATED FINANCIAL STATEMENTS — continued
S&T classifies financial instruments in Level 3 when valuation models are used because significant inputs are not observable in the market. The following tables present the changes in assets measured at estimated fair value on a recurring basis and for which S&T has utilized Level 3 inputs to determine the estimated fair value:
| December 31, 2009 | |||||||||||||||
| Beginning Balance at January 1, 2009 |
Principal Transactions |
Gains Realized and Unrealized |
Transfers in or (out of) Level 3 |
Ending Balance at | |||||||||||
| (dollars in thousands) | |||||||||||||||
| Assets |
|||||||||||||||
| Securities available-for-sale (1) |
$ | 1,050 | $ | — | $ | 88 | $ | — | $ | 1,138 | |||||
| (1) | Changes in estimated fair value for available-for-sale investments are recorded in accumulated other comprehensive income, while gains and losses from sales are recorded in net security (losses) gains in the Consolidated Statements of Income. |
| December 31, 2008 | |||||||||||||||
| Beginning Balance at January 1, 2008 |
Principal Transactions |
Gains Realized and Unrealized |
Transfers in or (out of) Level 3 |
Ending Balance at | |||||||||||
| (dollars in thousands) | |||||||||||||||
| Assets |
|||||||||||||||
| Securities available-for-sale (1) |
$ | 750 | $ | 300 | $ | — | $ | — | $ | 1,050 | |||||
| (1) | Changes in estimated fair value for available-for-sale investments are recorded in accumulated other comprehensive income, while gains and losses from sales are recorded in net security (losses) gains in the Consolidated Statements of Income. |
S&T may be required to measure certain assets and liabilities on a nonrecurring basis. The following table presents S&T’s assets that are measured at estimated fair value on a nonrecurring basis by the fair value hierarchy level at December 31, 2009 and 2008. There were no liabilities measured at estimated fair value on a nonrecurring basis during these years.
| December 31, 2009 | ||||||||||||
| Level 1 | Level 2 | Level 3 | Total | |||||||||
| (dollars in thousands) | ||||||||||||
| Assets |
||||||||||||
| Loans held for sale |
$ | — | $ | 6,073 | $ | — | $ | 6,073 | ||||
| Impaired loans |
— | 79,258 | 12,285 | 91,543 | ||||||||
| Other real estate owned and other repossessed assets |
— | 4,607 | — | 4,607 | ||||||||
| Mortgage servicing rights |
— | — | 2,100 | 2,100 | ||||||||
| December 31, 2008 | ||||||||||||
| Level 1 | Level 2 | Level 3 | Total | |||||||||
| (dollars in thousands) | ||||||||||||
| Assets |
||||||||||||
| Loans held for sale |
$ | — | $ | 737 | $ | — | $ | 737 | ||||
| Impaired loans |
— | 39,798 | 7,531 | 47,329 | ||||||||
| Other real estate owned and other repossessed assets |
— | 851 | — | 851 | ||||||||
| Mortgage servicing rights |
— | — | 832 | 832 | ||||||||
PAGE 82
NOTES TO CONSOLIDATED FINANCIAL STATEMENTS — continued
In addition to financial instruments recorded at estimated fair value in S&T’s financial statements, the fair value accounting pronouncement requires disclosure of estimated fair value of all an entity’s assets and liabilities considered to be financial instruments. For estimated fair value disclosure purposes, S&T substantially utilized the estimated fair value measurement criteria as required and discussed under Fair Value Measurements in Note 1. These estimates of fair value are significantly affected by the assumptions made and, accordingly, do not necessarily indicate amounts that could be realized in a current market exchange.
The following table indicates the estimated fair value of S&T’s financial instruments as of:
| December 31, 2009 | December 31, 2008 | |||||||||||
| Fair Value | Carrying Value (1) |
Fair Value | Carrying Value (1) | |||||||||
| (dollars in thousands) | ||||||||||||
| ASSETS |
||||||||||||
| Cash and due from banks |
$ | 69,152 | $ | 69,152 | $ | 69,780 | $ | 69,780 | ||||
| Securities available-for-sale |
354,860 | 354,860 | 452,713 | 452,713 | ||||||||
| Federal Home Loan Bank stock, at cost |
23,542 | 23,542 | 23,542 | 23,542 | ||||||||
| Gross loans |
3,380,070 | 3,404,407 | 3,603,545 | 3,568,716 | ||||||||
| Bank owned life insurance |
52,863 | 52,863 | 51,254 | 51,254 | ||||||||
| Trading account assets |
3,090 | 3,090 | 2,268 | 2,268 | ||||||||
| Mortgage servicing rights |
2,100 | 2,100 | 832 | 832 | ||||||||
| Interest rate swaps |
11,661 | 11,661 | 25,077 | 25,077 | ||||||||
| Interest rate lock commitments |
126 | 126 | 120 | 120 | ||||||||
| Forward sales contracts |
192 | 192 | — | — | ||||||||
| LIABILITIES |
||||||||||||
| Deposits |
$ | 3,324,377 | $ | 3,304,541 | $ | 3,249,219 | $ | 3,228,416 | ||||
| Securities sold under repurchase agreements & federal funds purchased |
44,935 | 44,935 | 113,419 | 113,419 | ||||||||
| Short-term borrowings |
51,300 | 51,300 | 308,475 | 308,475 | ||||||||
| Long-term borrowings |
87,817 | 85,894 | 186,152 | 180,331 | ||||||||
| Junior subordinated debt securities |
92,296 | 90,619 | 92,925 | 90,619 | ||||||||
| Interest rate swaps |
11,594 | 11,594 | 24,979 | 24,979 | ||||||||
| Forward sale contracts |
— | — | 49 | 49 | ||||||||
| (1) | As reported in the Consolidated Balance Sheets |
NOTE 5. DERIVATIVE INSTRUMENTS AND HEDGING ACTIVITIES
Interest Rate Swaps
S&T periodically utilizes interest rate swap contracts for asset and liability management. These transactions involve both credit and market risk. The notional amounts are amounts on which calculations and payments are based. The notional amounts do not represent direct credit exposures. Direct credit exposure is limited to the net difference between the calculated amounts to be received and paid, if any. Interest rate swaps are contracts in which a series of interest rate flows (fixed and floating) are exchanged over a prescribed period. The notional amounts on which the interest payments are based are not exchanged. S&T utilizes interest rate swaps for commercial loans. These derivative positions relate to transactions in which S&T enters into an interest rate swap with a customer while at the same time entering into an offsetting interest rate swap with another financial institution. In connection with each transaction, S&T agrees to pay interest to the customer on a notional amount at a variable interest rate and receive interest from the customer on a same notional
PAGE 83
NOTES TO CONSOLIDATED FINANCIAL STATEMENTS — continued
amount at a fixed rate. At the same time, S&T agrees to pay another financial institution the same fixed interest rate on the same notional amount and receive the same variable interest rate on the same notional amount. The transaction allows S&T’s customer to effectively convert a variable rate loan to a fixed rate with S&T receiving a variable yield. These agreements could have floors or caps on the contracted interest rates.
Pursuant to S&T’s agreements with various financial institutions, S&T receives collateral and may be required to post collateral based upon mark-to- market positions. Beyond unsecured threshold levels, collateral in the form of cash or securities may also be made available to counterparties of swap transactions. Based upon S&T’s current positions and related future collateral requirements relating to them, S&T believes any affect on its cash flow or liquidity position to be immaterial. Derivatives contain an element of credit risk, the possibility that S&T will incur a loss because a counterparty, which may be a financial institution or a customer, fails to meet its contractual obligations. All derivative contracts with financial institutions may be executed only with counterparties approved by S&T’s Asset and Liability Committee (“ALCO”) and derivatives with customers may only be executed with customers within S&T’s Board of Directors Credit Committee approved credit exposure limits.
INTEREST RATE LOCK COMMITMENTS AND FORWARD SALE CONTRACTS
In the normal course of business, S&T sells originated mortgage loans into the secondary mortgage loan market. S&T offers interest rate lock commitments to potential borrowers. The commitments are generally for 60 days and guarantee a specified interest rate for a loan if underwriting standards are met, but the commitment does not obligate the potential borrower to close on the loan. Accordingly, some commitments expire prior to becoming loans. In addition, S&T can encounter pricing risks if interest rates increase significantly before the loan can be closed and sold. S&T may utilize forward sales contracts in order to mitigate this pricing risk. Whenever a customer desires these products, a mortgage originator quotes a secondary market rate guaranteed for that day by the investor. The rate lock is executed between the mortgagee and S&T and in turn a forward sales contract may be executed between S&T and the investor. Both the rate lock commitment and the corresponding forward sales contract for each customer are considered derivatives, but are not accounted for using hedge accounting. As such, changes in the estimated fair value of the derivatives during the commitment period are recorded in current earnings and included in other income on the Consolidated Statements of Income.
| Asset Derivatives (included in Other Assets) |
Liability Derivatives (included in Other Liabilities) | |||||||||||
| December 31, 2009 |
December 31, 2008 |
December 31, 2009 |
December 31, 2008 | |||||||||
| (dollars in thousands) | ||||||||||||
| Derivatives not Designated as Hedging Instruments |
||||||||||||
| Interest Rate Swap Contracts— |
||||||||||||
| Estimated fair value |
$ | 11,661 | $ | 25,077 | $ | 11,594 | $ | 24,979 | ||||
| Notional amount |
227,203 | 205,769 | 227,203 | 205,769 | ||||||||
| Collateral posted |
— | — | 10,935 | 18,975 | ||||||||
| Interest Rate Lock Commitments—Mortgage Loans |
||||||||||||
| Estimated fair value |
126 | 120 | — | — | ||||||||
| Notional amount |
10,672 | 5,457 | — | — | ||||||||
| Forward Sale Contracts—Mortgage Loans |
||||||||||||
| Estimated fair value |
192 | — | — | 49 | ||||||||
| Notional amount |
15,012 | — | — | 3,453 | ||||||||
PAGE 84
NOTES TO CONSOLIDATED FINANCIAL STATEMENTS — continued
| Amount of Gain (Loss) Recognized in Income on Derivatives (included in Other Noninterest Income) |
||||||||
| December 31, 2009 | December 31, 2008 | |||||||
| (dollars in thousands) | ||||||||
| Derivatives not Designated as Hedging Instruments |
||||||||
| Interest rate swap contracts—commercial loans |
$ | (616 | ) | $ | 98 | |||
| Interest rate lock commitments—mortgage loans |
6 | 107 | ||||||
| Forward sale contracts—mortgage loans |
242 | (44 | ) | |||||
NOTE 6. RESTRICTIONS ON CASH AND DUE FROM BANK ACCOUNTS
The Board of Governors of the Federal Reserve System (the “Federal Reserve Board”) imposes certain reserve requirements on all depository institutions. These reserves are maintained in the form of vault cash or as a noninterest-bearing balance with the Federal Reserve Board. Required reserves averaged $27.2 million during 2009.
NOTE 7. SECURITIES AVAILABLE-FOR-SALE
The following table indicates the composition of the securities portfolio at December 31:
| Available-for-Sale | |||||||||||||
| 2009 | Amortized Cost |
Gross Unrealized Gains |
Gross Unrealized Losses |
Estimated Fair Value | |||||||||
| (dollars in thousands) | |||||||||||||
| Obligations of U.S. government corporations and agencies |
$ | 126,588 | $ | 1,461 | $ | (78 | ) | $ | 127,971 | ||||
| Collateralized mortgage obligations of U.S. government corporations and agencies |
58,010 | 2,219 | — | 60,229 | |||||||||
| Mortgage-backed securities of U.S. government corporations and agencies |
58,834 | 2,687 | — | 61,521 | |||||||||
| Obligations of state and political subdivisions |
91,146 | 2,013 | (231 | ) | 92,928 | ||||||||
| Debt Securities Available-for-Sale |
334,578 | 8,380 | (309 | ) | 342,649 | ||||||||
| Marketable equity securities |
12,652 | 741 | (1,182 | ) | 12,211 | ||||||||
| Total |
$ | 347,230 | $ | 9,121 | $ | (1,491 | ) | $ | 354,860 | ||||
| Available-for-Sale | |||||||||||||
| 2008 | Amortized Cost |
Gross Unrealized Gains |
Gross Unrealized Losses |
Estimated Fair Value | |||||||||
| (dollars in thousands) | |||||||||||||
| Obligations of U.S. government corporations and agencies |
$ | 165,529 | $ | 3,722 | $ | — | $ | 169,251 | |||||
| Collateralized mortgage obligations of U.S. government corporations and agencies |
62,524 | 1,376 | — | 63,900 | |||||||||
| Mortgage-backed securities of U.S. government corporations and agencies |
76,398 | 2,585 | (31 | ) | 78,952 | ||||||||
| Obligations of state and political subdivisions |
123,252 | 510 | (1,284 | ) | 122,478 | ||||||||
| Other securities |
25 | — | — | 25 | |||||||||
| Debt Securities Available-for-Sale |
427,728 | 8,193 | (1,315 | ) | 434,606 | ||||||||
| Marketable equity securities |
18,491 | 703 | (4,276 | ) | 14,918 | ||||||||
| Other securities |
3,189 | — | — | 3,189 | |||||||||
| Total |
$ | 449,408 | $ | 8,896 | $ | (5,591 | ) | $ | 452,713 | ||||
PAGE 85
NOTES TO CONSOLIDATED FINANCIAL STATEMENTS — continued
There were $0.2 million, $3.4 million and $4.0 million in gross realized gains and $5.3 million, $5.1 million and $0.1 million in gross realized losses in 2009, 2008 and 2007, in each case respectively, relative to securities available-for-sale.
The following tables present the age of gross unrealized losses and estimated fair value by investment category:
| Less Than 12 Months | 12 Months or More | Total | |||||||||||||||||||
| 2009 | Estimated Fair Value |
Unrealized Losses |
Estimated Fair Value |
Unrealized Losses |
Estimated Fair Value |
Unrealized Losses |
|||||||||||||||
| (dollars in thousands) | |||||||||||||||||||||
| Obligations of U.S. government corporations and agencies |
$ | 20,912 | $ | (78 | ) | $ | — | $ | — | $ | 20,912 | $ | (78 | ) | |||||||
| Collateralized mortgage obligations of U.S. government corporations and agencies |
— | — | — | — | — | — | |||||||||||||||
| Mortgage-backed securities of U.S. government corporations and agencies |
— | — | — | — | — | — | |||||||||||||||
| Obligations of state and political subdivisions |
5,969 | (84 | ) | 3,881 | (147 | ) | 9,850 | (231 | ) | ||||||||||||
| Debt Securities Available-for-Sale |
26,881 | (162 | ) | 3,881 | (147 | ) | 30,762 | (309 | ) | ||||||||||||
| Marketable equity securities |
8,385 | (1,182 | ) | — | — | 8,385 | (1,182 | ) | |||||||||||||
| Total Temporarily Impaired Securities |
$ | 35,266 | $ | (1,344 | ) | $ | 3,881 | $ | (147 | ) | $ | 39,147 | $ | (1,491 | ) | ||||||
| Less Than 12 Months | 12 Months or More | Total | |||||||||||||||||||
| 2008 | Estimated Fair Value |
Unrealized Losses |
Estimated Fair Value |
Unrealized Losses |
Estimated Fair Value |
Unrealized Losses |
|||||||||||||||
| (dollars in thousands) | |||||||||||||||||||||
| Collateralized mortgage obligations of U.S. government corporations and agencies |
$ | 27 | $ | — | $ | — | $ | — | $ | 27 | $ | — | |||||||||
| Mortgage-backed securities of U.S. government corporations and agencies |
5,065 | (31 | ) | — | — | 5,065 | (31 | ) | |||||||||||||
| Obligations of state and political subdivisions |
40,760 | (1,282 | ) | 1,286 | (2 | ) | 42,046 | (1,284 | ) | ||||||||||||
| Other securities |
25 | — | — | — | 25 | — | |||||||||||||||
| Debt Securities Available-for-Sale |
45,877 | (1,313 | ) | 1,286 | (2 | ) | 47,163 | (1,315 | ) | ||||||||||||
| Marketable equity securities |
10,671 | (4,276 | ) | — | — | 10,671 | (4,276 | ) | |||||||||||||
| Total Temporarily Impaired Securities |
$ | 56,548 | $ | (5,589 | ) | $ | 1,286 | $ | (2 | ) | $ | 57,834 | $ | (5,591 | ) | ||||||
During 2009, S&T recognized OTTI totaling $5.3 million on 17 equity investment securities compared to $4.3 million on seven equity securities during 2008. S&T does not believe any individual unrealized loss as of December 31, 2009 represents an OTTI. S&T performs a review on the entire securities portfolio on a quarterly basis to identify securities that may indicate an OTTI. S&T’s policy
PAGE 86
NOTES TO CONSOLIDATED FINANCIAL STATEMENTS — continued
for OTTI declines within the marketable equity securities portfolio requires an impairment charge when the security is in a loss position for 12 consecutive months, unless facts and circumstances would suggest the need for OTTI impairment prior to that time. S&T’s policy for OTTI within the debt securities portfolio is based upon a number of factors, including but not limited to, the length of time and extent to which the estimated fair value has been less than cost, the financial condition of the underlying issuer, the ability of the issuer to meet contractual obligations, the likelihood of the security’s ability to recover any decline in its estimated fair value whether management intends to sell the security and is more likely than not that management will be required to sell the investment security prior to the security recovery. As of December 31, 2009, the unrealized losses on 27 debt securities are primarily attributable to changes in interest rates. The unrealized losses on 17 marketable equity securities as of December 31, 2009 are attributable to temporary declines in estimated fair value. S&T does not intend to sell and it is not more likely than not that it will be required to sell any of the securities, referenced in the table above, in an unrealized loss position before recovery of its amortized cost.
The amortized cost and estimated fair value of debt securities at December 31, 2009, by expected maturity, is included in the table below. Expected maturities will differ from contractual maturities because borrowers may have the right to call or prepay obligations with or without call or prepayment penalties.
The collateralized mortgage obligations of U.S. government corporations and agencies, mortgage-backed securities of U.S. government corporations and agencies and may mature earlier or later than their estimated maturities because of principal prepayment optionality.
| Available-for-Sale | Amortized Cost |
Estimated Fair Value | ||||
| (dollars in thousands) | ||||||
| Due in one year or less |
$ | 52,019 | $ | 52,765 | ||
| Due after one year through five years |
125,814 | 127,643 | ||||
| Due after five years through ten years |
55,476 | 57,518 | ||||
| Due after ten years |
101,269 | 104,723 | ||||
| Total Debt Securities Available-for-Sale |
$ | 334,578 | $ | 342,649 | ||
At December 31, 2009 and 2008, securities with principal amounts of $251.4 million and $379.5 million, respectively, were pledged to secure repurchase agreements, public funds and trust fund deposits.
NOTE 8. LOANS AND LOANS HELD FOR SALE
The following table presents the composition of the loan portfolio at December 31:
| 2009 | 2008 | |||||||
| (dollars in thousands) | ||||||||
| Real estate—construction |
$ | 371,178 | $ | 374,925 | ||||
| Real estate—mortgages: |
||||||||
| Residential |
816,036 | 846,246 | ||||||
| Commercial |
1,428,329 | 1,440,200 | ||||||
| Commercial and industrial |
701,650 | 822,543 | ||||||
| Consumer |
81,141 | 84,065 | ||||||
| Gross Portfolio Loans |
3,398,334 | 3,567,979 | ||||||
| Allowance for loan losses |
(59,580 | ) | (42,689 | ) | ||||
| Total Portfolio Loans |
3,338,754 | 3,525,290 | ||||||
| Loans held for sale |
6,073 | 737 | ||||||
| Total Loans |
$ | 3,344,827 | $ | 3,526,027 | ||||
S&T had one troubled debt restructured loan in the amount of $1.4 million at December 31, 2009.
PAGE 87
NOTES TO CONSOLIDATED FINANCIAL STATEMENTS — continued
The following table presents changes in the allowance for loan losses for the year ended December 31:
| 2009 | 2008 | 2007 | ||||||||||
| (dollars in thousands) | ||||||||||||
| Balance at beginning of year |
$ | 42,689 | $ | 34,345 | $ | 33,220 | ||||||
| Charge-offs |
(56,862 | ) | (12,170 | ) | (7,080 | ) | ||||||
| Recoveries |
1,399 | 2,216 | 2,393 | |||||||||
| Net Charge-offs |
(55,463 | ) | (9,954 | ) | (4,687 | ) | ||||||
| Provision for loan losses |
72,354 | 12,878 | 5,812 | |||||||||
| Acquired loan loss reserve |
— | 5,420 | — | |||||||||
| Balance at End of Year |
$ | 59,580 | $ | 42,689 | $ | 34,345 | ||||||
The principal balances of loans on nonaccrual status were $90.8 million and $42.5 million at December 31, 2009 and 2008, respectively. OREO and other repossessed assets, which are included in other assets in the Consolidated Balance Sheets, were $4.6 million at December 31, 2009 and $0.9 million at December 31, 2008. OREO at December 31, 2009 consists of 22 properties with one property comprising $2.7 million or 59 percent of the balance. S&T sold this property during the first quarter of 2010 at a price equal to the fair value recorded at December 31, 2009. S&T attempts to limit its exposure to concentrations of credit risk by diversifying its loan portfolio. S&T monitors concentrations of credit risk. At December 31, 2009 and 2008, S&T had no concentrations of credit risk by industry or group. The commercial real estate portfolio comprises $1.8 billion or 53 percent and $1.8 billion or 50 percent of total loans at December 31, 2009 and 2008, respectively. However, the segmentation of the commercial real estate portfolio has no concentration in excess of 8 percent of total loans. In addition, the commercial real estate portfolio had $384.5 million or 11 percent of total loans to customers outside of western Pennsylvania. Geographic concentrations exist because S&T provides a full range of banking services, including commercial, consumer and mortgage loans to individuals and corporate customers in its ten-county market areas in western Pennsylvania. Management believes underwriting guidelines and ongoing review by loan administration mitigates these risks.
The following table represents S&T’s investment in loans considered to be impaired and related information on those impaired loans as of December 31:
| 2009 | 2008 | 2007 | |||||||
| (dollars in thousands) | |||||||||
| Recorded balance of impaired loans with a related allowance for loan loss |
$ | 51,602 | $ | 28,489 | $ | 25,297 | |||
| Recorded balance of impaired loans without a related allowance for loan loss |
39,941 | 18,840 | 10,332 | ||||||
| Total recorded balance of loans considered to be impaired |
$ | 91,543 | $ | 47,329 | $ | 35,629 | |||
| Allowance for loan losses allocated to loans considered to be impaired |
$ | 17,003 | $ | 7,115 | $ | 2,919 | |||
| Average recorded balance of impaired loans |
85,606 | 34,817 | 21,110 | ||||||
| Loans considered to be impaired that were on a nonaccrual basis |
74,082 | 27,851 | 6,356 | ||||||
| Total interest income per contractual terms on impaired loans |
6,140 | 3,192 | 1,710 | ||||||
| Interest income on impaired loans recognized on a cash basis |
2,777 | 1,915 | 1,323 | ||||||
S&T Bank has granted loans to certain officers and directors of S&T as well as to certain affiliates of the officers and directors in the ordinary course of business. These loans were made on substantially the same terms, including interest rates and collateral, as those prevailing at the time for
PAGE 88
NOTES TO CONSOLIDATED FINANCIAL STATEMENTS — continued
comparable transactions with unrelated persons and did not involve more than normal risk of collectability. The aggregate dollar amount of these loans was $34.1 million and $36.6 million at December 31, 2009 and 2008, respectively. During 2009, $14.8 million of new loans were funded and repayments of loans totaled $17.3 million.
NOTE 9. PREMISES AND EQUIPMENT
The following table is a summary of premises and equipment at December 31:
| Estimated Useful Life | 2009 | 2008 | ||||||||
| (dollars in thousands) | ||||||||||
| Land |
Indefinite | $ | 6,129 | $ | 6,892 | |||||
| Premises |
10-50 years | 41,036 | 41,899 | |||||||
| Furniture and equipment |
3-25 years | 28,351 | 27,348 | |||||||
| Leasehold improvements |
2-37 years | 5,031 | 4,872 | |||||||
| 80,547 | 81,011 | |||||||||
| Accumulated depreciation |
(39,557 | ) | (35,707 | ) | ||||||
| TOTAL |
$ | 40,990 | $ | 45,304 | ||||||
Depreciation related to premises and equipment was $4.3 million, $4.0 million and $3.5 million in 2009, 2008 and 2007, respectively.
Certain banking facilities are leased under lease arrangements expiring at various dates until the year 2054. Those which contain escalation clauses, where the rent increases over the term of the lease, are accounted for on a straight-line basis. All leases are accounted for as operating leases, except for one capital lease entered into in the fourth quarter of 2008. Rental expense for premises amounted to $1.9 million, $1.7 million and $1.5 million in 2009, 2008 and 2007, respectively. Included in the rental expense for premises are leases entered into with two directors, which totaled $0.2 million, $0.3 million and $0.3 million in 2009, 2008 and 2007, respectively.
Minimum annual rental and renewal option payments for each of the following five years and thereafter are approximately:
| Operating | Capital | Total | |||||||
| (dollars in thousands) | |||||||||
| 2010 |
$ | 1,486 | $ | 76 | $ | 1,562 | |||
| 2011 |
1,436 | 76 | 1,512 | ||||||
| 2012 |
1,435 | 76 | 1,511 | ||||||
| 2013 |
1,459 | 76 | 1,535 | ||||||
| 2014 |
1,476 | 76 | 1,552 | ||||||
| Thereafter |
35,239 | 1,068 | 36,307 | ||||||
PAGE 89
NOTES TO CONSOLIDATED FINANCIAL STATEMENTS — continued
NOTE 10. GOODWILL AND OTHER INTANGIBLE ASSETS
The following table represents a rollforward of goodwill and intangible assets:
| Goodwill | Core Deposit and Other Intangibles |
||||||
| (dollars in thousands) | |||||||
| Balance at December 31, 2007 |
$ | 50,087 | $ | 2,461 | |||
| Additions |
113,459 | 10,843 | |||||
| Amortization |
— | (1,591 | ) | ||||
| Balance at December 31, 2008 |
$ | 163,546 | $ | 11,713 | |||
| Additions |
1,621 | — | |||||
| Amortization |
— | (2,305 | ) | ||||
| Balance at December 31, 2009 |
$ | 165,167 | $ | 9,408 | |||
Goodwill represents the excess of the purchase price over the estimated fair value of net assets purchased. During 2009 an adjustment of $1.6 million to goodwill was recorded primarily relating to a tax adjustment for purchase accounting. During 2008, S&T recorded goodwill associated with the IBT acquisition of $112.7 million and $0.8 million associated with the insurance relationships.
Intangible assets as of December 31, 2009 consisted of $8.3 million for the acquisition of core savings deposits, $0.4 million for the acquisition of wealth management relationships and $0.7 million for the acquisition of insurance contract relationships. S&T determined the amount of identifiable intangible assets based upon independent core deposit and insurance contract analyses. During 2009, S&T did not record any intangible assets. During 2008, S&T recorded intangible assets of $10.2 million associated with the acquired IBT core savings deposits and $0.5 million for the wealth management relationships. These intangible assets are amortized over their estimated weighted average lives of nine years.
The following table represents the amortization expense for each of the next five years:
| Amount | |||
| (dollars in thousands) | |||
| 2010 |
$ | 1,932 | |
| 2011 |
1,737 | ||
| 2012 |
1,542 | ||
| 2013 |
1,337 | ||
| 2014 |
911 | ||
Intangible assets with finite useful lives are evaluated for impairment whenever events or changes in circumstances indicate that their carrying amount may not be recoverable. No triggering events occurred during the years ended December 31, 2009, 2008 and 2007, requiring an impairment analysis.
S&T has three reporting units including: a Community Bank, Wealth Management and an Insurance Agency. At December 31, 2009, S&T had goodwill of $165.2 million, including $161.1 million at the Community Bank, representing 98 percent of total goodwill and $4.1 million at the Insurance Agency, representing 2 percent of total goodwill. During the year, and on October 1, management’s analysis concluded that the estimated fair value exceeded the carrying value. As such, goodwill impairment was not recorded.
PAGE 90
NOTES TO CONSOLIDATED FINANCIAL STATEMENTS — continued
The current economic climate significantly impacted S&T’s business beginning in the first quarter of 2009. S&T reported an unprecedented net loss, primarily due to a significant deterioration in its loan portfolio. Concurrently, S&T saw a significant decline in our market capitalization and our stock traded below common book value. Such events triggered a need to perform a step 1 valuation of goodwill impairment. Accordingly, S&T engaged a qualified third party valuation expert to perform a valuation of S&T’s Community Bank reporting unit as of April 30, 2009.
The third party expert utilized a valuation methodology consistent with current accounting literature to determine the estimated fair value of the reporting unit. The valuation used both a market and income approach. The methodology consisted of techniques using comparable transactions, comparable peer analysis and a discounted future earnings analysis. The discounted future earnings analysis considered the costs of equity and weighted-average costs of capital to determine an appropriate discount rate. Further, the model assumed estimates of future growth rates that if not achieved could significantly impact the valuation. The valuation model is based upon estimates and is highly judgmental. The valuation resulted in the fair value of the Community Bank reporting unit exceeding carrying value by approximately 51 percent.
At December 31, 2009, management engaged the third party valuation expert to update the previous valuation model as our market capitalization was 3.5 percent above our carrying value. Further, certain assumptions used in the previous report may have changed, including the financial forecast and the overall economic climate. The valuation techniques used were consistent with those described above and resulted in the estimated fair value of the Community Bank reporting unit exceeding its carrying value at December 31, 2009. The valuation resulted in the fair value of the Community Bank reporting unit exceeding its carrying value at December 31, 2009 by $42.6 million and 10 percent.
NOTE 11. DEPOSITS
The following table presents the composition of deposits at December 31:
| 2009 | 2008 | 2007 | ||||||||||||||||
| Balance | Interest Expense |
Balance | Interest Expense |
Balance | Interest Expense | |||||||||||||
| (dollars in thousands) | ||||||||||||||||||
| Noninterest-bearing demand |
$ | 712,120 | $ | — | $ | 600,282 | $ | — | $ | 462,387 | $ | — | ||||||
| Interest-bearing demand |
260,554 | 59 | 229,229 | 55 | 151,686 | 42 | ||||||||||||
| Money market |
289,367 | 1,557 | 283,290 | 2,967 | 144,408 | 3,483 | ||||||||||||
| Savings |
752,130 | 3,464 | 821,805 | 11,691 | 946,967 | 33,924 | ||||||||||||
| Certificates of deposit |
1,290,370 | 33,358 | 1,293,810 | 37,650 | 916,377 | 42,138 | ||||||||||||
| Total |
$ | 3,304,541 | $ | 38,438 | $ | 3,228,416 | $ | 52,363 | $ | 2,621,825 | $ | 79,587 | ||||||
The aggregate of all certificates of deposit over $100,000 amounted to $411.9 million and $377.7 million at December 31, 2009 and 2008, respectively.
The following table indicates the scheduled maturities of certificates of deposit at December 31, 2009:
| Amount | |||
| (dollars in thousands) | |||
| 2010 |
$ | 671,294 | |
| 2011 |
203,406 | ||
| 2012 |
284,789 | ||
| 2013 |
72,484 | ||
| 2014 |
48,306 | ||
| Thereafter |
10,091 | ||
| Total |
$ | 1,290,370 | |
PAGE 91
NOTES TO CONSOLIDATED FINANCIAL STATEMENTS — continued
NOTE 12. SHORT-TERM BORROWINGS
Short-term borrowings are for terms under one year and were comprised of retail repurchase agreements (“REPOs”), wholesale REPOs, federal funds purchased, term auction facility (“TAF”) advances and FHLB advances. S&T defines repurchase agreements with its local retail customers as retail REPOs; short-term wholesale REPOs are those transacted with other banks and brokerage firms. Securities pledged as collateral under these REPO financing arrangements cannot be sold or repledged by the secured party and are therefore accounted for as a secured borrowing. The estimated fair value of collateral provided to a third party is continually monitored and additional collateral is obtained or requested to be returned as appropriate. Federal funds purchased are unsecured overnight borrowings with other financial institutions. TAF advances are collateral backed short-term loans with the Federal Reserve. FHLB advances are for various terms secured by a blanket lien on residential mortgages, other real estate secured loans and FHLB stock with the FHLB of Pittsburgh.
The following table represents the composition of short-term borrowings at December 31:
| 2009 | 2008 | 2007 | ||||||||||||||||
| Balance | Interest Expense |
Balance | Interest Expense |
Balance | Interest Expense | |||||||||||||
| (dollars in thousands) | ||||||||||||||||||
| Securities sold under repurchase agreements, retail |
$ | 44,935 | $ | 141 | $ | 113,419 | $ | 1,627 | $ | 84,458 | $ | 2,917 | ||||||
| Securities sold under repurchase agreements, wholesale |
— | — | — | — | — | 529 | ||||||||||||
| Federal funds purchased |
— | 1 | — | 123 | 15,800 | 785 | ||||||||||||
| Term auction facility |
— | 18 | — | — | — | — | ||||||||||||
| Federal Home Loan Bank advances |
51,300 | 526 | 308,475 | 4,263 | 80,000 | 2,325 | ||||||||||||
| Total |
$ | 96,235 | $ | 686 | $ | 421,894 | $ | 6,013 | $ | 180,258 | $ | 6,556 | ||||||
Information pertaining to REPOs, federal funds purchased and TAF advances are summarized in the table below:
| 2009 | 2008 | 2007 | ||||||||||
| (dollars in thousands) | ||||||||||||
| Balance at December 31: |
$ | 44,935 | $ | 113,419 | $ | 100,258 | ||||||
| Average balance during the year |
94,019 | 128,890 | 96,171 | |||||||||
| Average interest rate during the year |
0.17 | % | 1.36 | % | 4.40 | % | ||||||
| Maximum month-end balance during the year |
$ | 129,835 | $ | 197,045 | $ | 118,918 | ||||||
| Average interest rate at year-end |
0.13 | % | 0.39 | % | 3.58 | % | ||||||
Information pertaining to FHLB advances is summarized in the table below:
| 2009 | 2008 | 2007 | ||||||||||
| (dollars in thousands) | ||||||||||||
| Balance at December 31: |
$ | 51,300 | $ | 308,475 | $ | 80,000 | ||||||
| Average balance during the year |
96,929 | 227,918 | 44,214 | |||||||||
| Average interest rate during the year |
0.54 | % | 1.87 | % | 5.26 | % | ||||||
| Maximum month-end balance during the year |
$ | 195,150 | $ | 377,850 | $ | 100,000 | ||||||
| Average interest rate at year-end |
0.62 | % | 0.59 | % | 4.46 | % | ||||||
PAGE 92
NOTES TO CONSOLIDATED FINANCIAL STATEMENTS — continued
NOTE 13. LONG-TERM BORROWINGS
Scheduled annual maturities for all of the long-term debt for each of the five years and thereafter subsequent to December 31, 2009 are as follows:
| Balance | Average Rate | |||||
| (dollars in thousands) | ||||||
| 2010 |
$ | 65,787 | 4.61 | % | ||
| 2011 |
592 | 5.73 | % | |||
| 2012 |
569 | 5.80 | % | |||
| 2013 |
10,597 | 3.62 | % | |||
| 2014 |
626 | 5.73 | % | |||
| Thereafter |
7,723 | 3.57 | % | |||
| Total |
$ | 85,894 | 4.42 | % | ||
The purpose of these borrowings is to match-fund selected new loan originations, to mitigate interest-rate sensitivity risks and to take advantage of discounted borrowing rates through the FHLB for community investment projects.
S&T had total borrowings as of December 31, 2009 and 2008 at the Pittsburgh FHLB of $136.9 million and $438.5 million, respectively. Total borrowings consisted of short-term and long-term borrowings, respectively, of $51.3 million and $85.6 million and $308.5 million and $130.0 million for 2009 and 2008, respectively. Borrowings are collateralized by a blanket lien on residential mortgages, other real estate secured loans and FHLB stock with the FHLB of Pittsburgh. At December 31, 2009, S&T could have borrowed an additional $783.5 million based on qualifying collateral and $310.4 million more could be borrowed provided that additional collateral would have to be pledged.
Interest expense of $5.6 million, $9.4 million and $11.3 million was recognized on long-term borrowings for 2009, 2008 and 2007, respectively.
JUNIOR SUBORDINATED DEBT SECURITIES
During the third quarter of 2006, S&T Bank issued $25.0 million of junior subordinated debentures through a pooled transaction at an initial fixed rate of 6.78 percent. On September 15, 2011 and quarterly thereafter, S&T Bank has the option to redeem the subordinated debt, subject to a 30 day written notice and prior approval by the FDIC. If S&T Bank chooses not to exercise the option for early redemption on September 15, 2011 or subsequent quarters, the subordinated debt will convert to a variable rate of 3-month LIBOR plus 160 basis points. The subordinated debt qualifies as Tier 2 capital under regulatory guidelines and will mature on December 15, 2036.
During the first quarter of 2008, S&T completed a private placement to a financial institution of $20.0 million of floating rate trust preferred securities. The trust preferred securities mature in March 2038, and are callable at S&T’s option, after five years, and bear interest initially at a rate of 6.44 percent per annum and quarterly adjusts with the three-month LIBOR plus 350 basis points. S&T began making interest payments to the trustee on June 15, 2008 and quarterly thereafter. The trust preferred securities qualify as Tier 1 capital under regulatory guidelines.
During the second quarter of 2008, S&T Bank issued $20.0 million of junior subordinated debt through a private placement with three financial institutions at an initial rate of 6.40 percent and floats quarterly with 3-month LIBOR plus 350 basis points. If all or any portion of the subordinated debt ceases to be deemed to be Tier 2 Capital due to a change in applicable capital regulations, S&T will have the right to redeem, on any interest payment date, subject to a 30 day written notice and prior approval by the FDIC, the subordinated debt at the applicable redemption rate which starts at a
PAGE 93
NOTES TO CONSOLIDATED FINANCIAL STATEMENTS — continued
high of 102.82 percent at June 15, 2009 and decreases yearly to 100 percent on June 15, 2013 and thereafter and can be called after five years. The subordinated debt qualifies as Tier 2 capital under regulatory guidelines and will mature on June 15, 2018.
Also during the second quarter of 2008, S&T Bank issued $25.0 million of junior subordinated debt through a private placement with a financial institution at an initial rate of 5.15 percent and floats quarterly with 3-month LIBOR plus 250 basis points. At any time after May 30, 2013, S&T will have the right to redeem all or a portion of the subordinated debt, subject to a 30-day written notice and prior approval by the FDIC. The subordinated debt qualifies as Tier 2 capital under regulatory guidelines and will mature on May 30, 2018.
The amount of interest expense for 2009, 2008, and 2007 on junior subordinated debt was $4.4 million, $4.4 million and $1.7 million, respectively.
NOTE 14. DIVIDEND AND LOAN RESTRICTIONS
Certain restrictions exist regarding the ability of S&T Bank to transfer funds to S&T in the form of dividends and loans. The amount of dividends that may be paid to S&T is restricted by regulatory guidelines concerning minimum capital requirements. In addition, prior to January 16, 2012, unless S&T has redeemed the Series A Preferred Stock or the U.S. Treasury has transferred the Series A Preferred Stock to a third party, the consent of the U.S. Treasury is required for S&T to increase its common stock dividend or repurchase its common stock or other equity or capital securities, other than in connection with benefit plans consistent with past practice and certain other circumstances. S&T Bank could pay dividends of approximately $46.6 million without affecting its well-capitalized position at December 31, 2009.
Federal law prohibits S&T from borrowing from S&T Bank unless such loans are collateralized by specific obligations. Further, such loans are limited to 10 percent of S&T Bank’s capital and additional paid-in capital, as defined.
NOTE 15. COMMITMENTS AND CONTINGENCIES
Commitments
S&T, in the normal course of business, offers off-balance sheet credit arrangements to enable its customers to meet their financing objectives. These instruments involve, to varying degrees, elements of credit and interest rate risk in excess of the amount recognized in the financial statements. S&T’s exposure to credit loss, in the event the customer does not satisfy the terms of the agreement, equals the contractual amount of the obligation less the value of any collateral. S&T uses the same credit policies in making commitments and conditional obligations as for all other lending. Commitments generally have fixed expiration dates, annual renewals or other termination clauses and may require payment of an annual fee. Since many of the commitments are expected to expire without being drawn upon, the total commitment amounts do not necessarily represent future cash requirements. S&T’s allowance for lending-related commitments including unfunded commercial real estate, commercial and industrial term loan commitments and letters of credit totaled $4.2 million at December 31, 2009 and $1.3 million at December 31, 2008. The allowance for lending-related commitments is included in other liabilities in the Consolidated Balance Sheets.
Estimates of the fair value of these off-balance sheet items were not made because of the short-term nature of these arrangements and the credit standing of the counter-parties.
PAGE 94
NOTES TO CONSOLIDATED FINANCIAL STATEMENTS — continued
Total commitments and letters of credit outstanding as of December 31:
| 2009 | 2008 | |||||
| (dollars in thousands) | ||||||
| Commitments to extend credit |
$ | 255,994 | $ | 198,600 | ||
| Standby letters of credit |
156,293 | 146,738 | ||||
| Commercial letters of credit |
710,909 | 765,583 | ||||
S&T has future commitments with third party vendors for data processing and communication charges. Data processing and communication charges related to these commitments resulted in expense of $6.5 million, $5.8 million and $4.6 million in 2009, 2008 and 2007, respectively. S&T has future payments related to data processing and communication charges for the years 2010, 2011, 2012 and 2013 for approximately $6.2 million, $5.8 million, $0.8 million and $0.1 million, respectively.
LITIGATION
S&T, in the normal course of business, is subject to various legal and administrative proceedings and claims. While any type of litigation contains a level of uncertainty, S&T believes that the outcome of such proceedings or claims pending will not have a material adverse effect on the consolidated financial position.
NOTE 16. INCOME TAXES
Income tax (benefits) expense for the years ended December 31 are comprised of:
| 2009 | 2008 | 2007 | ||||||||||
| (dollars in thousands) | ||||||||||||
| Current |
$ | 3,573 | $ | 30,540 | $ | 23,767 | ||||||
| Deferred |
(7,442 | ) | (6,023 | ) | (2,140 | ) | ||||||
| Total |
$ | (3,869 | ) | $ | 24,517 | $ | 21,627 | |||||
The statutory to effective tax rate reconciliation for the years ended December 31 is as follows:
| 2009 | 2008 | 2007 | |||||||
| Statutory tax rate |
35.0 | % | 35.0 | % | 35.0 | % | |||
| Tax-exempt interest |
(74.2 | )% | (3.3 | )% | (2.9 | )% | |||
| Dividend exclusion |
(14.4 | )% | (0.4 | )% | (0.6 | )% | |||
| Interest on BOLI |
(15.6 | )% | (0.7 | )% | (0.6 | )% | |||
| Low income housing and federal historic tax credits |
(36.5 | )% | (1.3 | )% | (2.5 | )% | |||
| Adjustment of deferred balances |
6.3 | % | — | — | |||||
| Other |
4.7 | % | (0.4 | )% | (0.6 | )% | |||
| Effective Tax Rate |
(94.7 | )% | 28.9 | % | 27.8 | % |
PAGE 95
NOTES TO CONSOLIDATED FINANCIAL STATEMENTS — continued
The provision for income taxes differs from the amount computed by applying the statutory federal income tax rate to income before income taxes. S&T ordinarily generates an annual effective tax rate that is less that the statutory rate of 35 percent due to benefits resulting from tax-exempt interest, excludible dividend income, from tax-exempt interest and tax benefits associated with low income housing tax income. The consistent level of tax benefits that reduce S&T’s tax rate below the 35 percent statutory rate, coupled with relatively low level of annual pretax income, produced the negative annual effective tax rate.
Income taxes applicable to security (losses) gains were ($1.8) million in 2009, ($0.6) million in 2008 and $1.3 million in 2007.
Significant components of S&T’s temporary differences were as follows at December 31:
| 2009 | 2008 | |||||||
| (dollars in thousands) | ||||||||
| Deferred Tax Liabilities: |
||||||||
| Net unrealized holding gains on securities available-for-sale |
$ | (2,670 | ) | $ | (1,157 | ) | ||
| Prepaid pension in other employee benefits |
(4,702 | ) | (5,761 | ) | ||||
| Deferred loan income |
(228 | ) | — | |||||
| Purchase accounting |
(5,654 | ) | (5,707 | ) | ||||
| Fixed assets |
(1,900 | ) | (1,391 | ) | ||||
| Other |
(943 | ) | (1,495 | ) | ||||
| Total Deferred Tax liabilities |
(16,097 | ) | (15,511 | ) | ||||
| Deferred Tax Assets: |
||||||||
| Allowance for loan losses |
16,376 | 12,813 | ||||||
| Loan fees |
737 | 775 | ||||||
| Deferred loan income |
— | 1,141 | ||||||
| Net adjustment to pension |
6,016 | 8,688 | ||||||
| Impairment of securities |
2,688 | 1,514 | ||||||
| Delinquent interest on nonaccrual loans |
2,156 | — | ||||||
| State NOL carryforwards |
784 | 722 | ||||||
| Other |
5,155 | 4,354 | ||||||
| Gross Deferred Tax Assets |
33,912 | 30,007 | ||||||
| Less: Valuation allowance for state NOL carryforwards |
(784 | ) | (722 | ) | ||||
| Total Deferred Tax Assets |
33,128 | 29,285 | ||||||
| Net Deferred Tax Asset |
$ | 17,031 | $ | 13,774 | ||||
S&T establishes a valuation allowance when it is more likely than not that S&T will not be able to realize the benefit of the deferred tax assets. Except for the State net operating loss (“NOL”) carryforwards as mentioned above, S&T has determined that no valuation allowance is necessary for the deferred tax assets because it is more likely than not that these assets will be realized through carryback to taxable income in prior years, future reversals of existing temporary differences and through future taxable income. Periodically, the valuation allowance is reviewed and adjusted based on management’s assessments of realizable deferred tax assets. Gross deferred tax assets as of December 31, 2009 and 2008 were reduced by a valuation allowance of $0.8 million and $0.7 million, respectively, related to state income tax net operating losses generated by the bank holding company, as utilization of these losses is not likely. These operating loss carryforwards total $7.9 million and will expire in the years 2019-2029.
PAGE 96
NOTES TO CONSOLIDATED FINANCIAL STATEMENTS — continued
The period change in deferred taxes can be summarized as follows for the years ended December 31:
| 2009 | 2008 | |||||||
| (dollars in thousands) | ||||||||
| Deferred tax changes reflected in other comprehensive income |
$ | 4,185 | $ | (9,093 | ) | |||
| Deferred tax changes reflected in federal income tax (benefit) |
(7,442 | ) | (6,023 | ) | ||||
| Deferred tax changes reflected in goodwill |
— | 4,653 | ||||||
UNRECOGNIZED TAX BENEFITS
A reconciliation of the change in unrecognized tax benefits for the year ended December 31:
| 2009 Gross UTB’s |
2008 Gross UTB’s |
2007 Gross UTB’s |
||||||||||
| (dollars in thousands) | ||||||||||||
| Unrecognized Tax Benefits (“UTB”) Gross at January 1 |
$ | 195 | $ | 246 | $ | 495 | ||||||
| Prior period tax positions |
||||||||||||
| Increase |
— | — | — | |||||||||
| Decrease |
(79 | ) | (275 | ) | (153 | ) | ||||||
| Current period tax positions |
170 | 339 | 18 | |||||||||
| Reductions for statute of limitations expirations |
— | (115 | ) | (114 | ) | |||||||
| Balance at December 31 |
$ | 286 | $ | 195 | $ | 246 | ||||||
| Amount That Would Affect the Effective Tax Rate if Recognized |
$ | 249 | $ | 106 | $ | 71 | ||||||
S&T classifies interest and penalties as an element of tax expense. The amount of tax-related interest and penalties recognized in the Consolidated Statements of Income for years 2009, 2008 and 2007 and the total of such amounts accrued in the Consolidated Balance Sheets at December 31, 2009 and 2008 were not material.
S&T monitors changes in tax statutes and regulations to determine if significant changes will occur over the next 12 months. As of December 31, 2009 no significant changes to unrecognized tax benefits are projected, however, changes related to the expiration of statutes of limitations and tax audit examinations are possible.
Changes to unrecognized tax benefits of acquired companies associated with permanent differences after the measurement period (12 months) resulted in an adjustment to income tax expense. S&T does not expect any significant adjustments to tax expense associated with its 2008 acquisition of IBT.
NOTE 17. EMPLOYEE BENEFITS
S&T Bank maintains a defined benefit pension plan (the “Plan”) covering substantially all employees hired prior to January 1, 2008. The benefits are based on years of service and the employee’s compensation for the highest five consecutive years in the last ten years. Contributions are intended to provide for benefits attributed to employee service to date and for those benefits expected to be earned in the future.
PAGE 97
NOTES TO CONSOLIDATED FINANCIAL STATEMENTS — continued
The following table summarizes the components of net periodic pension expense for the Plan for the years ended December 31:
| 2009 | 2008 | 2007 | ||||||||||
| (dollars in thousands) | ||||||||||||
| Service cost—benefits earned during the period |
$ | 2,311 | $ | 2,069 | $ | 1,976 | ||||||
| Interest cost on projected benefit obligation |
3,797 | 3,429 | 2,999 | |||||||||
| Expected return on plan assets |
(4,288 | ) | (5,396 | ) | (4,929 | ) | ||||||
| Net amortization and deferral |
(7 | ) | (7 | ) | 16 | |||||||
| Recognized net actuarial loss |
1,297 | — | — | |||||||||
| Net Periodic Pension Expense |
$ | 3,110 | $ | 95 | $ | 62 | ||||||
The following tables summarize the activity in the benefit obligation and Plan assets:
| 2009 | 2008 | |||||||
| (dollars in thousands) | ||||||||
| CHANGE IN PROJECTED BENEFIT OBLIGATION |
||||||||
| Projected benefit obligation at beginning of year |
$ | 62,011 | $ | 52,954 | ||||
| Service cost |
2,311 | 2,069 | ||||||
| Interest cost |
3,797 | 3,429 | ||||||
| Plan participants’ contributions |
342 | 1,021 | ||||||
| Acquisitions |
— | 4,624 | ||||||
| Actuarial loss |
52 | 976 | ||||||
| Benefits paid |
(3,330 | ) | (3,062 | ) | ||||
| Projected Benefit Obligation at End of Year |
$ | 65,183 | $ | 62,011 | ||||
| CHANGE IN PLAN ASSETS |
||||||||
| Estimated fair value of plan assets at beginning of year |
$ | 54,918 | $ | 65,846 | ||||
| Actual return on plan assets |
10,550 | (13,587 | ) | |||||
| Employer contribution |
— | — | ||||||
| Plan participants’ contributions |
342 | 1,021 | ||||||
| Acquisitions |
— | 4,700 | ||||||
| Benefits paid |
(3,330 | ) | (3,062 | ) | ||||
| Estimated Fair Value of Plan Assets at End of Year |
$ | 62,480 | $ | 54,918 | ||||
The following table sets forth the Plan’s funded status and the prepaid pension cost in the Consolidated Balance Sheets at December 31:
| 2009 | 2008 | |||||||
| (dollars in thousands) | ||||||||
| Projected benefit obligation at end of year |
$ | (65,183 | ) | $ | (62,011 | ) | ||
| Estimated fair value of plan assets at end of year |
62,480 | 54,918 | ||||||
| Funded Status |
$ | (2,703 | ) | $ | (7,093 | ) | ||
| 2009 | 2008 | |||||||
| (dollars in thousands) | ||||||||
| Amounts recognized in accumulated other comprehensive income consist of: |
||||||||
| Prior service cost |
$ | (80 | ) | $ | (87 | ) | ||
| Net actuarial loss |
16,208 | 23,716 | ||||||
| Total (Before Tax Effects) |
$ | 16,128 | $ | 23,629 | ||||
PAGE 98
NOTES TO CONSOLIDATED FINANCIAL STATEMENTS — continued
The prior service cost and actuarial loss included in accumulated other comprehensive income expected to be recognized in net periodic pension cost during the year ended December 31, 2009 is $1.3 million, $0.8 million, net of tax.
The accumulated benefit obligation for the Plan was $57.4 million at December 31, 2009 and $54.8 million at December 31, 2008.
Below are actuarial assumptions used in accounting for the Plan as of and for the year ended December 31:
| 2009 | 2008 | 2007 | |||||||
| Weighted-average discount rate—as of January 1 |
6.25 | % | 6.25 | % | 6.00 | % | |||
| Weighted-average discount rate—as of December 31 |
6.25 | % | 6.25 | % | 6.25 | % | |||
| Rate of increase in future compensation levels |
4.00 | % | 4.00 | % | 4.00 | % | |||
| Expected long-term rate of return on plan assets |
8.00 | % | 8.00 | % | 8.00 | % |
S&T considers many factors when setting the assumed rate of return on Plan assets. As a general guideline the assumed rate of return is equal to the weighted average of the expected returns for each asset category and is estimated based on historical returns as well as expected future returns. The weighted average discount rate is derived from Corporate yield curves.
S&T Bank’s Retirement Plan Committee determines the investment policy for the Plan. In general, the targeted asset allocation is 50 percent to 70 percent equities and 30 percent to 50 percent fixed-income. A strategic allocation within each asset class is employed based on the Plan’s time horizon, risk tolerances, performance expectations and asset class preferences. Investment managers have discretion to invest in any equity or fixed-income asset class, subject to the securities guidelines of the Plan’s Investment Policy Statement.
S&T Bank contributed $6.0 million to the Plan in 2006 for 2007 and contributed zero in 2008 and 2009. Benefit payments, which reflect expected future service, as appropriate, are expected to be paid from the Plan for each of the years 2010-2014 and are $2.9 million, $3.1 million, $3.3 million, $3.5 million, $3.7 million, respectively, and $22.5 million for the five years thereafter.
S&T also has supplemental executive retirement plans (“SERP”) for certain key employees. The SERP plans are unfunded. The balances of the actuarial present values of projected benefit obligations and accrued pension cost related to the SERP were $2.3 million and $2.1 million at December 31, 2009 and 2008, respectively. Net periodic pension cost related to the SERP was $0.3 million, $0.4 million and $0.3 million for the years ended December 31, 2009, 2008 and 2007, respectively. In accordance with accounting pronouncements, $1.1 million and $1.3 million before tax was reflected in accumulated other comprehensive income at December 31, 2009 and 2008 in relation to the SERP. The actuarial assumptions used for the SERP are the same as those used for the Plan. In addition, S&T pays the post-retirement health care for a limited number of retirees. The amounts related to post-retirement health care are not material.
S&T maintains a Thrift Plan, a qualified defined contribution plan, in which substantially all employees are eligible to participate. S&T makes matching contributions to the Thrift Plan up to 3.5 percent of participants’ eligible compensation and may make additional profit-sharing contributions as provided by the Thrift Plan. Expense related to these contributions amounted to $1.4 million, $2.0 million and $2.4 million in 2009, 2008 and 2007, respectively.
PAGE 99
NOTES TO CONSOLIDATED FINANCIAL STATEMENTS — continued
ESTIMATED FAIR VALUE MEASUREMENTS
The following table presents S&T’s pension plan assets measured and recorded at estimated fair value on S&T’s Consolidated Balance Sheets on a recurring basis and their level within the estimated fair value hierarchy as of December 31, 2009:
| Asset Category(a) | Quoted Prices in Active Markets for Identical Assets |
Significant Observable Inputs |
Significant Unobservable Inputs |
|||||||||
| Level 1 | Level 2 | Level 3 | Total | |||||||||
| (dollars in thousands) | ||||||||||||
| Cash and cash equivalents |
$ | 128 | $ | — | $ | — | $ | 128 | ||||
| Money market funds(1) |
— | 5,088 | — | 5,088 | ||||||||
| Fixed Income(2): |
26,218 | 26,217 | ||||||||||
| Equities: |
||||||||||||
| Equity index mutual funds—domestic(3) |
18,472 | 18,472 | ||||||||||
| Equity index mutual funds—international(4) |
4,284 | 4,284 | ||||||||||
| Domestic Individual Equities(5) |
7,720 | 7,721 | ||||||||||
| International Individual Equities (ADRs)(6) |
570 | 570 | ||||||||||
| Total Assets at Estimated Fair Value |
$ | 57,392 | $ | 5,088 | $ | — | $ | 62,480 | ||||
| (a) | See Note 3. Estimated Fair Value Measurements and Estimated Fair Value of Financial Instruments for a description of levels within the estimated fair value hierarchy. |
| (1) | This category includes FDIC insured money market instruments. |
| (2) | This category includes a variety of fixed income mutual funds which primarily invest in investment grade rated securities. Manager(s) have discretion to invest in fixed income related securities including future, options, and other derivatives. Investments be made in currencies other than the US dollar. |
| (3) | This category includes S&P 500, S&P 400, and S&P 600 index iShares. |
| (4) | This category includes MSCI EAFE Index ishares. |
| (5) | This category includes individual domestic equities invested in an active All-Cap strategy. It may also include convertible bonds. |
| (6) | This category includes American Depository Receipts (ADRs). |
NOTE 18. INCENTIVE AND RESTRICTED STOCK PLAN AND DIVIDEND REINVESTMENT PLAN
S&T adopted an Incentive Stock Plan in 1992 (“1992 Stock Plan”) that provides for granting incentive stock options, nonstatutory stock options, restricted stock and appreciation rights. On October 17, 1994, the 1992 Stock Plan was amended to include outside directors. The 1992 Stock Plan covers a maximum of 3.2 million shares of S&T common stock and expires ten years from the date of board approval. At December 31, 2002, 3,180,822 nonstatutory stock options had been granted under the 1992 Stock Plan. No further awards will be made under the 1992 Stock Plan.
S&T adopted the 2003 Stock Plan in 2003 that provides for granting incentive stock options, nonstatutory stock options, restricted stock and appreciation rights. The 2003 Stock Plan covers a maximum of 1.5 million shares of S&T common stock and expires ten years from the date of board approval. The 2003 Stock Plan is similar to the 1992 Stock Plan, which the 2003 Stock Plan replaced. As of December 31, 2009, 937,500 nonstatutory stock options and 71,171 restricted awards have been granted under the 2003 Stock Plan and 730,075 are currently exercisable.
Nonstatutory stock options granted in 2006 and 2005 have a four-year vesting period and a ten-year life, with 25 percent vesting each year on January 1 of the succeeding year. S&T’s policy is to issue shares from treasury upon exercise of stock options. S&T recognized compensation expense of $0.5 million for the years ending December 31, 2009, 2008 and 2007 and $0.3 million net of tax, for the years ending December 31, 2009, 2008 and 2007.
PAGE 100
NOTES TO CONSOLIDATED FINANCIAL STATEMENTS — continued
The estimated fair value of option awards under the nonstatutory stock option plan is estimated on the date of grant using the Black-Scholes valuation methodology, which is dependent upon certain assumptions, as summarized in the following table. S&T uses the simplified method in developing the estimated life of the option, whereby the expected life is presumed to be the mid point between the vesting date and the end of the contractual term. There were no nonstatutory stock options granted in 2009, 2008 or 2007.
S&T also sponsors a Cash Appreciation Rights (“CARs”) plan which is accounted for as a liability instrument and required to be marked to market each reporting period. The CARs are settled in cash. There were no CARs granted for the years 2009, 2008 and 2007. 206,900 CARs were granted in 2005 at an exercise price of $37.86 and have a four-year vesting period and a ten-year life, with 25 percent vesting each year on January 1 of the succeeding year. During 2009, 4,475 CARs were forfeited. During 2009, 2008 and 2007, S&T recognized compensation expense of ($0.6) million, $0.4 million and ($0.1) million pretax and ($0.4) million, $0.3 million and ($0.1) million net of tax, respectively. The Black-Scholes option valuation model is used to determine the estimated fair value of the CARs as of each reporting date. The CARs expired on December 31, 2009 with no value. The assumptions used to value the CARs for the years ended December 31 were as follows:
| 2009 | 2008 | 2007 | |||||||
| Risk-free interest rate |
2.12 | % | 1.40 | % | 3.54 | % | |||
| Volatility of stock |
31 | % | 29 | % | 26 | % | |||
| Expected dividend yield |
3.40 | % | 3.88 | % | 3.77 | % | |||
| Expected life of options |
3.73 years | 4.36 years | 5.10 years |
S&T periodically issues restricted stock to employees and directors, pursuant to the 2003 Stock Plan. On April 20, 2009, 17,200 restricted stock awards were granted to outside directors, which will vest on April 20, 2010. On April 21, 2008, 7,787 restricted stock awards were granted to outside directors. These shares vested on April 21, 2009. On December 15, 2008, 3,224 restricted stock awards were granted to senior management. The awards to senior management were granted in accordance with 2008 performance levels and primarily based on earnings per share growth. These shares will vest 25 percent per year with the first vesting to occur on January 1, 2010. On April 16, 2007, 7,761 restricted stock awards were granted to outside directors and these shares vested on April 16, 2008. On December 17, 2007, 35,199 restricted stock awards were granted to senior management. The awards to senior management were granted in accordance with 2007 performance levels set by the Compensation Committee and primarily based on S&T’s earnings per share growth. These shares will vest 25 percent per year; the first vesting occurred on January 1, 2009.
During the restricted period, the recipient receives dividends and has the right to vote. Generally, if the recipient leaves S&T before the end of the restricted period, the shares will be forfeited. Compensation expense for the restricted stock is ratably recognized over the period of service, generally the restricted period, based on the fair value of the stock on the date of grant.
During 2009, 2008 and 2007, S&T recognized compensation expense of $0.5 million, $0.4 million and $0.6 million and realized a tax benefit of $0.2 million, $0.1 million and zero, respectively.
PAGE 101
NOTES TO CONSOLIDATED FINANCIAL STATEMENTS — continued
The following table summarizes activity for nonstatutory stock options for the years ending December 31:
| 2009 | 2008 | 2007 | ||||||||||||||||||||||
| Number of Shares |
Weighted Average Exercise Price |
Weighted Average Remaining Contractual Term |
Number of Shares |
Weighted Average Exercise Price |
Weighted Average Remaining Contractual Term |
Number of Shares |
Weighted Average Exercise Price |
Weighted Average Remaining Contractual Term | ||||||||||||||||
| Outstanding at Beginning of Year |
1,199,650 | $ | 31.14 | 1,489,900 | $ | 30.17 | 1,650,362 | $ | 29.52 | |||||||||||||||
| Granted |
— | — | — | — | — | — | ||||||||||||||||||
| Exercised |
(1,150 | ) | 23.80 | (287,050 | ) | 26.06 | (153,412 | ) | 22.94 | |||||||||||||||
| Forfeited |
(97,950 | ) | 23.28 | (3,200 | ) | 35.47 | (7,050 | ) | 35.83 | |||||||||||||||
| Outstanding at End of Year |
1,100,550 | 31.85 | 4.1 years | 1,199,650 | 31.14 | 4.8 years | 1,489,900 | 30.17 | 5.2 years | |||||||||||||||
| Exercisable at End of Year |
1,048,925 | $ | 31.55 | 3.8 years | 1,096,400 | $ | 30.51 | 4.4 years | 1,335,025 | $ | 29.78 | 4.7 years | ||||||||||||
The aggregate intrinsic value of options outstanding and exercisable as of December 31, 2009, 2008 and 2007 were zero, $6,259 and $2,309, respectively. The aggregate intrinsic value represents the total pretax intrinsic value (the difference between S&T’s closing stock price on the last trading day of the fourth quarter of fiscal 2009 and the exercise price, multiplied by the number of in-the-money options) that would have been received by the option holders had all option holders exercised their options on December 31, 2009.
The following table provides information about nonvested options and restricted stock for the year ended December 31:
| Nonvested Options |
Weighted Average Grant Date Estimated Fair Value |
Restricted Stock |
Weighted Average Grant Date Fair Value | |||||||
| Nonvested at December 31, 2006 |
206,500 | $ | 9.48 | — | $ | — | ||||
| Granted |
— | — | 42,960 | 29.38 | ||||||
| Vested |
51,625 | 9.48 | — | — | ||||||
| Forfeited |
— | — | — | — | ||||||
| Nonvested at December 31, 2007 |
154,875 | 9.48 | 42,960 | 29.38 | ||||||
| Granted |
— | — | 11,011 | 33.11 | ||||||
| Vested |
51,625 | 9.48 | 15,080 | 30.82 | ||||||
| Forfeited |
— | — | — | — | ||||||
| Nonvested at December 31, 2008 |
103,250 | 9.48 | 38,891 | 29.88 | ||||||
| Granted |
— | — | 17,200 | 18.61 | ||||||
| Vested |
51,625 | 9.48 | 14,749 | 31.13 | ||||||
| Forfeited |
— | — | — | — | ||||||
| Nonvested at December 31, 2009 |
51,625 | $ | 9.48 | 41,342 | $ | 24.75 | ||||
As of December 31, 2009, compensation cost related to nonvested, nonstatutory stock options was fully recognized as compensation expense. The remaining unvested options will vest on January 1, 2010. As of December 31, 2009, there was $0.5 million of total unrecognized compensation cost related to restricted stock that will be recognized as compensation expense over a weighted average period of 2.5 years.
PAGE 102
NOTES TO CONSOLIDATED FINANCIAL STATEMENTS — continued
The following table presents information about stock options exercised for the year ended December 31:
| 2009 | 2008 | 2007 | |||||||
| (dollars in thousands) | |||||||||
| Number of options exercised |
1,150 | 287,050 | 153,412 | ||||||
| Total intrinsic value of options exercised |
$ | 13 | $ | 2,787 | $ | 1,773 | |||
| Cash received from options exercised |
40 | 10,267 | 5,293 | ||||||
| Tax deduction realized from options exercised |
4 | 1,004 | 361 | ||||||
S&T also sponsors a dividend reinvestment plan (“Dividend Plan”) whereby shareholders may purchase shares of S&T common stock at estimated fair value with reinvested dividends and voluntary cash contributions. American Stock Transfer and Trust Company, the plan administrator and transfer agent, purchases the shares on the open market to fulfill the Dividend Plan’s needs.
NOTE 19. PARENT COMPANY CONDENSED FINANCIAL INFORMATION
The following condensed financial statements summarize the financial position of S&T Bancorp, Inc. as of December 31, 2009 and 2008 and the results of its operations and cash flows for each of the three years ended December 31, 2009, 2008 and 2007.
BALANCE SHEETS
| December 31 | ||||||
| 2009 | 2008 | |||||
| (dollars in thousands) | ||||||
| ASSETS |
||||||
| Cash |
$ | 108,554 | $ | 46 | ||
| Investments in: |
||||||
| Bank subsidiary |
434,413 | 443,933 | ||||
| Nonbank subsidiaries |
17,284 | 21,197 | ||||
| Other assets |
15,012 | 15,406 | ||||
| Total Assets |
$ | 575,263 | $ | 480,582 | ||
| LIABILITIES |
||||||
| Long-term debt |
$ | 20,619 | $ | 20,619 | ||
| Dividends payable |
694 | 8,558 | ||||
| Other liabilities |
632 | 2,711 | ||||
| Total Liabilities |
21,945 | 31,888 | ||||
| Total Shareholders’ Equity |
553,318 | 448,694 | ||||
| Total Liabilities and Shareholders’ Equity |
$ | 575,263 | $ | 480,582 | ||
PAGE 103
NOTES TO CONSOLIDATED FINANCIAL STATEMENTS — continued
| STATEMENTS OF INCOME |
||||||||||||
| Years Ended December 31 | ||||||||||||
| 2009 | 2008 | 2007 | ||||||||||
| (dollars in thousands) | ||||||||||||
| Dividends from subsidiaries |
$ | 29,477 | $ | 87,252 | $ | 61,091 | ||||||
| Investment income |
520 | 72 | 47 | |||||||||
| Interest expense on long-term debt |
912 | 1,038 | — | |||||||||
| Other expenses |
1,630 | 1,249 | 1,517 | |||||||||
| Income before Equity in Undistributed Net Income of Subsidiaries |
27,455 | 85,037 | 59,621 | |||||||||
| (Distribution in excess of net income) equity in undistributed net income of: Bank subsidiary |
(15,206 | ) | (21,156 | ) | 11,015 | |||||||
| Nonbank subsidiaries |
(4,298 | ) | (3,678 | ) | (14,492 | ) | ||||||
| Net Income |
$ | 7,951 | $ | 60,203 | $ | 56,144 | ||||||
| STATEMENTS OF CASH FLOWS |
||||||||||||
| Years Ended December 31 | ||||||||||||
| 2009 | 2008 | 2007 | ||||||||||
| (dollars in thousands) | ||||||||||||
| OPERATING ACTIVITIES |
||||||||||||
| Net Income |
$ | 7,951 | $ | 60,203 | $ | 56,144 | ||||||
| Equity in undistributed net income of subsidiaries |
19,504 | 24,834 | 3,476 | |||||||||
| Tax benefits from stock-based compensation |
(4 | ) | (1,004 | ) | (361 | ) | ||||||
| Other |
968 | 1,728 | 64 | |||||||||
| Net Cash Provided by Operating Activities |
28,419 | 85,761 | 59,323 | |||||||||
| INVESTING ACTIVITIES |
||||||||||||
| Net investments in subsidiaries |
— | 4,972 | 1,650 | |||||||||
| Acquisitions |
— | 76,970 | — | |||||||||
| Net Cash Used In Financing Activities |
— | (81,942 | ) | (1,650 | ) | |||||||
| FINANCING ACTIVITIES |
||||||||||||
| Preferred stock dividends and amortization of discount |
(4,513 | ) | — | — | ||||||||
| Cash dividends paid to shareholders |
(25,427 | ) | (32,302 | ) | (29,790 | ) | ||||||
| Acquisition of treasury stock |
— | — | (31,802 | ) | ||||||||
| Sale of treasury stock |
1,349 | 7,480 | 3,520 | |||||||||
| Proceeds from issuance of long-term debt |
— | 20,000 | — | |||||||||
| Proceeds from issuance of preferred stock and common stock |
108,676 | — | — | |||||||||
| Tax benefits from stock-based compensation |
4 | 1,004 | 361 | |||||||||
| Net Cash Provided by (Used in) Financing Activities |
80,089 | (3,818 | ) | (57,711 | ) | |||||||
| Net increase (decrease) in cash |
108,508 | 1 | (38 | ) | ||||||||
| Cash at beginning of year |
46 | 45 | 83 | |||||||||
| Cash at End of Year |
$ | 108,554 | $ | 46 | $ | 45 | ||||||
PAGE 104
NOTES TO CONSOLIDATED FINANCIAL STATEMENTS — continued
NOTE 20. REGULATORY MATTERS
S&T is subject to various regulatory capital requirements administered by the federal banking agencies. Failure to meet the minimum capital requirements can initiate certain mandatory and possibly additional discretionary actions by regulators that, if undertaken, could have a direct material effect on S&T’s financial statements. Under capital guidelines and the regulatory framework for prompt corrective action, S&T must meet specific capital guidelines that involve quantitative measures of S&T’s assets, liabilities and certain off-balance sheet items as calculated under regulatory accounting practices. S&T’s capital amounts and classification are also subject to qualitative judgments by the regulators about components, risk weightings and other factors.
The most recent notifications from the Federal Reserve Bank and the FDIC categorized S&T and S&T Bank, respectively, as well-capitalized under the regulatory framework for corrective action. There have been no conditions or events that management believes have changed S&T or S&T Bank’s ranking during 2009 and 2008.
All bank holding companies and banking subsidiaries are required to have core capital (“Tier 1”) of at least 4.00 percent of risk-weighted assets, total capital of at least 8.00 percent of risk-weighted assets and for banking subsidiaries a minimum Tier 1 leverage ratio of 4.00 percent of adjusted quarterly average assets. Tier 1 capital consists principally of shareholders’ equity; excluding items recorded in accumulated other comprehensive income, less goodwill and other intangibles. Total capital consists of Tier 1 capital plus the allowance for loan losses subject to limitation. The regulations also define well-capitalized levels of Tier 1, total capital and Tier 1 leverage as 6.00 percent, 10.00 percent and 5.00 percent, respectively.
Quantitative measures established by regulation to ensure capital adequacy require S&T to maintain minimum amounts and ratios of Tier 1 and total capital to risk-weighted assets and Tier 1 capital to average assets. As of December 31, 2009 and 2008, S&T meets all capital adequacy requirements to which it is subject.
S&T currently has $70.0 million in junior subordinated debt in its Consolidated Balance Sheets and is included in Tier 2 capital in accordance with current regulatory reporting requirements. For regulatory purposes, trust preferred securities totaling $20.6 million, issued by unconsolidated trust subsidiaries of S&T underlying such junior subordinated debt, is included in Tier 1 capital in accordance with current regulatory reporting requirements.
S&T has $108.7 million of Series A Preferred Stock in its Consolidated Balance Sheet presented as a separate line item in equity. For regulatory purposes, the Series A Preferred Stock issued to the U.S. Treasury, net of the unamortized discount of $3.3 million, is included in Tier 1 capital in accordance with terms of the CPP.
PAGE 105
NOTES TO CONSOLIDATED FINANCIAL STATEMENTS — continued
The following tables summarize risk-based capital amounts and ratios for S&T and S&T Bank.
| Actual | For Capital Adequacy Purposes |
To be Well-Capitalized Under Prompt Corrective Action Provisions |
||||||||||||||||
| S&T Bancorp, Inc. | Amount | Ratio | Amount | Ratio | Amount | Ratio | ||||||||||||
| (dollars in thousands) | ||||||||||||||||||
| As of December 31, 2009 |
||||||||||||||||||
| Total Capital |
$ | 521,657 | 15.43 | % | $ | 270,486 | 8.00 | % | $ | 338,108 | 10.00 | % | ||||||
| Tier 1 Capital |
409,128 | 12.10 | % | 135,243 | 4.00 | % | 202,865 | 6.00 | % | |||||||||
| Tier 1 Capital |
409,128 | 10.26 | % | 159,502 | 4.00 | % | 199,378 | 5.00 | % | |||||||||
| As of December 31, 2008 |
||||||||||||||||||
| Total Capital |
$ | 424,478 | 11.82 | % | $ | 287,302 | 8.00 | % | $ | 359,128 | 10.00 | % | ||||||
| Tier 1 Capital |
310,466 | 8.65 | % | 143,651 | 4.00 | % | 215,477 | 6.00 | % | |||||||||
| Tier 1 Capital |
310,466 | 7.31 | % | 127,447 | 3.00 | % | 212,412 | 5.00 | % | |||||||||
| (1) | Minimum requirement is 3.00 percent for the most highly-rated financial institutions. |
| Actual | For Capital Adequacy Purposes |
To be Well-Capitalized Under Prompt Corrective Action Provisions |
||||||||||||||||
| S&T Bank | Amount | Ratio | Amount | Ratio | Amount | Ratio | ||||||||||||
| (dollars in thousands) | ||||||||||||||||||
| As of December 31, 2009 |
||||||||||||||||||
| Total Capital |
$ | 382,475 | 11.39 | % | $ | 268,685 | 8.00 | % | $ | 335,857 | 10.00 | % | ||||||
| Tier 1 Capital |
270,224 | 8.05 | % | 134,343 | 4.00 | % | 201,514 | 6.00 | % | |||||||||
| Tier 1 Capital |
270,224 | 6.81 | % | 158,665 | 4.00 | % | 198,331 | 5.00 | % | |||||||||
| As of December 31, 2008 |
||||||||||||||||||
| Total Capital |
$ | 397,917 | 11.16 | % | $ | 285,138 | 8.00 | % | $ | 356,423 | 10.00 | % | ||||||
| Tier 1 Capital |
283,905 | 7.97 | % | 142,569 | 4.00 | % | 213,854 | 6.00 | % | |||||||||
| Tier 1 Capital |
283,905 | 6.70 | % | 127,030 | 3.00 | % | 211,717 | 5.00 | % | |||||||||
| (1) | Minimum requirement is 3.00 percent for the most highly-rated financial institutions. |
PAGE 106
NOTES TO CONSOLIDATED FINANCIAL STATEMENTS — continued
NOTE 21. SELECTED FINANCIAL DATA
The following table presents selected financial data for the most recent eight quarters:
(unaudited)
| 2009 | 2008 | ||||||||||||||||||||||||||||||
| Fourth Quarter |
Third Quarter |
Second Quarter |
First Quarter |
Fourth Quarter |
Third Quarter |
Second Quarter |
First Quarter | ||||||||||||||||||||||||
| (dollars in thousands, except per share data) | |||||||||||||||||||||||||||||||
| SUMMARY OF OPERATIONS |
|
||||||||||||||||||||||||||||||
| Interest income |
$ | 47,126 | $ | 48,310 | $ | 49,226 | $ | 50,424 | $ | 57,811 | $ | 57,416 | $ | 50,433 | $ | 50,458 | |||||||||||||||
| Interest expense |
10,671 | 11,477 | 12,677 | 14,279 | 17,226 | 18,245 | 16,791 | 19,909 | |||||||||||||||||||||||
| Provision for loan losses |
10,399 | 8,382 | 32,184 | 21,389 | 5,561 | 6,156 | (118 | ) | 1,279 | ||||||||||||||||||||||
| Net interest income after provision for loan losses |
26,056 | 28,451 | 4,365 | 14,756 | 35,024 | 33,015 | 33,760 | 29,270 | |||||||||||||||||||||||
| Security (losses) gains, net |
(487 | ) | (2,059 | ) | (1,296 | ) | (1,246 | ) | (92 | ) | (341 | ) | (1,829 | ) | 611 | ||||||||||||||||
| Noninterest income |
11,370 | 10,283 | 11,753 | 10,262 | 9,800 | 10,601 | 9,803 | 8,899 | |||||||||||||||||||||||
| Noninterest expense |
25,088 | 24,839 | 32,762 | 25,438 | 21,123 | 22,340 | 22,384 | 17,955 | |||||||||||||||||||||||
| Income (loss) before taxes |
11,851 | 11,836 | (17,940 | ) | (1,666 | ) | 23,609 | 20,935 | 19,350 | 20,825 | |||||||||||||||||||||
| Provision (benefit) for income taxes |
2,660 | 2,578 | (9,284 | ) | 176 | 7,809 | 5,249 | 5,489 | 5,969 | ||||||||||||||||||||||
| Net income (loss) |
9,191 | 9,258 | (8,656 | ) | (1,842 | ) | 15,800 | 15,686 | 13,861 | 14,856 | |||||||||||||||||||||
| Preferred dividends and amortization of discount |
1,545 | 1,543 | 1,541 | 1,283 | — | — | — | — | |||||||||||||||||||||||
| Net Income (Loss) Available to Common Shareholders |
$ | 7,646 | $ | 7,715 | $ | (10,197 | ) | $ | (3,125 | ) | $ | 15,800 | $ | 15,686 | $ | 13,861 | $ | 14,856 | |||||||||||||
| Per Share Data |
|||||||||||||||||||||||||||||||
| Common earnings per share - diluted |
$ | 0.28 | $ | 0.28 | $ | (0.37 | ) | $ | (0.11 | ) | $ | 0.57 | $ | 0.57 | $ | 0.54 | $ | 0.60 | |||||||||||||
| Dividends declared |
0.00 | 0.15 | 0.15 | 0.31 | 0.31 | 0.31 | 0.31 | 0.31 | |||||||||||||||||||||||
| Common book value |
16.14 | 15.77 | 15.48 | 16.01 | 16.24 | 16.34 | 16.00 | 14.18 | |||||||||||||||||||||||
NOTE 22. SEGMENTS
S&T operates in three reportable operating segments: Community Banking, Wealth Management and an Insurance Agency.
| • | The Community Banking segment offers services which include accepting time and demand deposit accounts, originating commercial and consumer loans, providing letters of credit and credit card services. |
| • | The Wealth Management segment offers discount brokerage services, services as executor and trustee under wills and deeds, guardian and custodian of employee benefits and other trust and brokerage services, as well as a registered investment advisor that manages private investment accounts for individuals and institutions. |
PAGE 107
NOTES TO CONSOLIDATED FINANCIAL STATEMENTS — continued
| • | The Insurance segment includes a full-service insurance agency offering commercial property and casualty insurance, group life and health coverage, employee benefit solutions and personal insurance lines. |
The following represents total assets by reportable segment as of December 31:
| 2009 | 2008 | |||||
| (dollars in millions) | ||||||
| Community Banking |
$ | 4,159.6 | $ | 4,427.3 | ||
| Insurance |
8.7 | 9.1 | ||||
| Wealth Management |
2.2 | 1.6 | ||||
The following tables provide financial information for these segments of S&T. The information provided under the caption “Eliminations” represents operations not considered to be reportable segments and/or general operating expenses and eliminations and adjustments which are necessary for purposes of reconciling to the consolidated statements.
| For the Year Ended December 31, 2009 | |||||||||||||||||||
| Community Banking |
Wealth Management |
Insurance | Eliminations | Consolidated | |||||||||||||||
| (dollars in thousands) | |||||||||||||||||||
| Interest income |
$ | 194,978 | $ | 530 | $ | 1 | $ | (422 | ) | $ | 195,087 | ||||||||
| Interest expense |
49,283 | — | 291 | (469 | ) | 49,105 | |||||||||||||
| Net interest income |
145,695 | 530 | (290 | ) | 47 | 145,982 | |||||||||||||
| Provision for loan losses |
72,354 | — | — | — | 72,354 | ||||||||||||||
| Noninterest income |
25,905 | 7,557 | 4,580 | 538 | 38,580 | ||||||||||||||
| Noninterest expense |
86,697 | 6,378 | 4,700 | 3,806 | 101,581 | ||||||||||||||
| Depreciation expense |
4,140 | 37 | 60 | — | 4,237 | ||||||||||||||
| Intangible amortization |
2,162 | 84 | 62 | — | 2,308 | ||||||||||||||
| Income tax (benefit) expense |
(1,076 | ) | 615 | (187 | ) | (3,221 | ) | (3,869 | ) | ||||||||||
| Net Income (Loss) |
$ | 7,323 | $ | 973 | $ | (345 | ) | $ | — | $ | 7,951 | ||||||||
| For the Year Ended December 31, 2008 | |||||||||||||||||
| Community Banking |
Wealth Management |
Insurance | Eliminations | Consolidated | |||||||||||||
| (dollars in thousands) | |||||||||||||||||
| Interest income |
$ | 216,026 | $ | 413 | $ | 2 | $ | (323 | ) | $ | 216,118 | ||||||
| Interest expense |
72,299 | — | 283 | (411 | ) | 72,171 | |||||||||||
| Net interest income |
143,727 | 413 | (281 | ) | 88 | 143,947 | |||||||||||
| Provision for loan losses |
12,878 | — | — | — | 12,878 | ||||||||||||
| Noninterest income |
25,056 | 8,003 | 5,065 | (672 | ) | 37,452 | |||||||||||
| Noninterest expense |
66,755 | 5,416 | 4,872 | 1,746 | 78,789 | ||||||||||||
| Depreciation expense |
3,865 | 28 | 64 | — | 3,957 | ||||||||||||
| Intangible amortization |
979 | 34 | 42 | — | 1,055 | ||||||||||||
| Income tax expense (benefit) |
25,829 | 1,086 | (68 | ) | (2,330 | ) | 24,517 | ||||||||||
| Net Income (Loss) |
$ | 58,477 | $ | 1,852 | $ | (126 | ) | $ | — | $ | 60,203 | ||||||
PAGE 108
NOTES TO CONSOLIDATED FINANCIAL STATEMENTS — continued
| For the Year Ended December 31, 2007 | |||||||||||||||||
| Community Banking |
Wealth Management |
Insurance | Eliminations | Consolidated | |||||||||||||
| (dollars in thousands) | |||||||||||||||||
| Interest income |
$ | 215,518 | $ | 239 | $ | 6 | $ | (158 | ) | $ | 215,605 | ||||||
| Interest expense |
99,153 | — | 255 | (241 | ) | 99,167 | |||||||||||
| Net interest income |
116,365 | 239 | (249 | ) | 83 | 116,438 | |||||||||||
| Provision for loan losses |
5,812 | — | — | — | 5,812 | ||||||||||||
| Noninterest income |
28,142 | 7,531 | 4,662 | 270 | 40,605 | ||||||||||||
| Noninterest expense |
56,431 | 4,777 | 4,612 | 3,878 | 69,698 | ||||||||||||
| Depreciation expense |
3,390 | 18 | 54 | — | 3,462 | ||||||||||||
| Intangible amortization |
224 | — | 76 | — | 300 | ||||||||||||
| Income tax expense (benefit) |
24,150 | 1,117 | (115 | ) | (3,525 | ) | 21,627 | ||||||||||
| Net Income (Loss) |
$ | 54,500 | $ | 1,858 | $ | (214 | ) | $ | — | $ | 56,144 | ||||||
NOTE 23. NONINTEREST EXPENSE
Noninterest expenses are presented in the table below:
| Years Ended December 31 | |||||||||||
| 2009 | 2008 | 2007 | |||||||||
| (dollars in thousands) | |||||||||||
| Other operating expenses: |
|||||||||||
| Unfunded loan commitments |
$ | 2,888 | $ | 1,025 | $ | (359 | ) | ||||
| Joint venture impairment and amortization |
4,393 | 2,795 | 737 | ||||||||
| Loan collection fees |
1,325 | 261 | 165 | ||||||||
| Professional consulting |
1,897 | 1,374 | 1,352 | ||||||||
| Other real estate owned |
759 | (294 | ) | 365 | |||||||
| Legal |
2,323 | 1,211 | 986 | ||||||||
| Marketing |
2,751 | 3,180 | 2,709 | ||||||||
| Other |
10,579 | 10,677 | 9,147 | ||||||||
| Total Other Operating Expenses |
$ | 26,915 | $ | 20,229 | $ | 15,102 | |||||
PAGE 109
S&T Bancorp, Inc. and Subsidiaries
S&T Bancorp, Inc. is responsible for the preparation, integrity, and fair presentation of the consolidated financial statements included in this annual report. The consolidated financial statements and notes included in this annual report have been prepared in conformity with United States generally accepted accounting principles and necessarily include some amounts that are based on management’s best estimates and judgments.
We, as management of S&T Bancorp, Inc., are responsible for establishing and maintaining effective adequate control over financial reporting that is designed to produce reliable financial statements in conformity with United States generally accepted accounting principles. The system of internal control over financial reporting as it relates to the financial statements is evaluated for effectiveness by management and tested for reliability through a program of internal audits. Actions are taken to correct potential deficiencies as they are identified. Any system of internal control, no matter how well designed, has inherent limitations, including the possibility that a control can be circumvented or overridden and misstatements due to error or fraud may occur and not be detected. Also, because of changes in conditions, internal control effectiveness may vary over time. Accordingly, even an effective system of internal control will provide only reasonable assurance with respect to financial statement preparation.
The Audit Committee, consisting entirely of independent directors, meets regularly with management, internal auditors and the independent registered public accounting firm, and reviews audit plans and results, as well as management’s actions taken in discharging responsibilities for accounting, financial reporting and internal control. KPMG LLP, independent registered public accounting firm, and the internal auditors have direct and confidential access to the Audit Committee at all times to discuss the results of their examinations.
REPORT ON MANAGEMENT’S ASSESSMENT OF INTERNAL CONTROL OVER FINANCIAL REPORTING
Management assessed the corporation’s system of internal control over financial reporting as of December 31, 2009, in relation to criteria for effective internal control over financial reporting as described in “Internal Control—Integrated Framework,” issued by the Committee of Sponsoring Organizations of the Treadway Commission. Based on this assessment, management concludes that, as of December 31, 2009, its system of internal control over financial reporting is effective based on the criteria of the “Internal Control—Integrated Framework.” KPMG LLP, independent registered public accounting firm, has issued an attestation report on effectiveness of the Corporation’s internal control over financial reporting.
| /s/ Todd D. Brice |
/s/ Wendy S. Bell | |||
| Todd D. Brice | Wendy S. Bell | |||
| President and Chief Executive Officer | Senior Vice President, Controller and Chief Accounting Officer | |||
Indiana, Pennsylvania
February 26, 2010
PAGE 110
REPORT OF INDEPENDENT REGISTERED PUBLIC ACCOUNTING FIRM
The Board of Directors and Shareholders
S&T Bancorp, Inc. and subsidiaries:
We have audited S&T Bancorp, Inc.’s and subsidiaries (the Company) internal control over financial reporting as of December 31, 2009, based on the criteria established in Internal Control - Integrated Framework issued by the Committee of Sponsoring Organizations of the Treadway Commission (COSO). The Company’s management is responsible for maintaining effective internal control over financial reporting and for its assessment of the effectiveness of internal control over financial reporting, included in the accompanying Report on Management’s Assessment of Internal Control Over Financial Reporting. Our responsibility is to express an opinion on the Company’s internal control over financial reporting based on our audit.
We conducted our audit in accordance with the standards of the Public Company Accounting Oversight Board (United States). Those standards require that we plan and perform the audit to obtain reasonable assurance about whether effective internal control over financial reporting was maintained in all material respects. Our audit included obtaining an understanding of internal control over financial reporting, assessing the risk that a material weakness exists, and testing and evaluating the design and operating effectiveness of internal control based on the assessed risk. Our audit also included performing such other procedures as we considered necessary in the circumstances. We believe that our audit provides a reasonable basis for our opinion.
A company’s internal control over financial reporting is a process designed to provide reasonable assurance regarding the reliability of financial reporting and the preparation of financial statements for external purposes in accordance with generally accepted accounting principles. A company’s internal control over financial reporting includes those policies and procedures that (1) pertain to the maintenance of records that, in reasonable detail, accurately and fairly reflect the transactions and dispositions of the assets of the company; (2) provide reasonable assurance that transactions are recorded as necessary to permit preparation of financial statements in accordance with generally accepted accounting principles, and that receipts and expenditures of the company are being made only in accordance with authorizations of management and directors of the company; and (3) provide reasonable assurance regarding prevention or timely detection of unauthorized acquisition, use, or disposition of the company’s assets that could have a material effect on the financial statements.
Because of its inherent limitations, internal control over financial reporting may not prevent or detect misstatements. Also, projections of any evaluation of effectiveness to future periods are subject to the risk that controls may become inadequate because of changes in conditions, or that the degree of compliance with the policies or procedures may deteriorate.
In our opinion, S&T Bancorp, Inc. and subsidiaries maintained, in all material respects, effective internal control over financial reporting as of December 31, 2009, based on criteria established in Internal Control—Integrated Framework issued by the Committee of Sponsoring Organizations of the Treadway Commission.
We also have audited, in accordance with the standards of the Public Company Accounting Oversight Board (United States), the consolidated balance sheets of S&T Bancorp, Inc. and subsidiaries as of December 31, 2009 and 2008, and the related consolidated statements of income, shareholders’ equity, and cash flows for each of the years in the three-year period ended December 31, 2009, and our report dated February 26, 2010 expressed an unqualified opinion on those consolidated financial statements.
/s/ KPMG LLP
Pittsburgh, PA
February 26, 2010
PAGE 111
REPORT OF INDEPENDENT REGISTERED PUBLIC ACCOUNTING FIRM
The Board of Directors and Shareholders
S&T Bancorp, Inc. and subsidiaries:
We have audited the accompanying consolidated balance sheets of S&T Bancorp, Inc. and subsidiaries (the Company) as of December 31, 2009 and 2008, and the related consolidated statements of income, changes in shareholders’ equity, and cash flows for each of the years in the three-year period ended December 31, 2009. These consolidated financial statements are the responsibility of the Company’s management. Our responsibility is to express an opinion on these consolidated financial statements based on our audits.
We conducted our audits in accordance with the standards of the Public Company Accounting Oversight Board (United States). Those standards require that we plan and perform the audit to obtain reasonable assurance about whether the financial statements are free of material misstatement. An audit includes examining, on a test basis, evidence supporting the amounts and disclosures in the financial statements. An audit also includes assessing the accounting principles used and significant estimates made by management, as well as evaluating the overall financial statement presentation. We believe that our audits provide a reasonable basis for our opinion.
In our opinion, the consolidated financial statements referred to above present fairly, in all material respects, the financial position of S&T Bancorp, Inc. and subsidiaries as of December 31, 2009 and 2008, and the results of their operations and their cash flows for each of the years in the three-year period ended December 31, 2009 in conformity with U.S. generally accepted accounting principles.
We also have audited, in accordance with the standards of the Public Company Accounting Oversight Board (United States), S&T Bancorp, Inc.’s internal control over financial reporting as of December 31, 2009, based on criteria established in Internal Control—Integrated Framework issued by the Committee of Sponsoring Organizations of the Treadway Commission (COSO), and our report dated February 26, 2010 expressed an unqualified opinion on the effectiveness of the Company’s internal control over financial reporting.
/s/ KPMG LLP
Pittsburgh, PA
February 26, 2010
PAGE 112
Item 9. CHANGES IN AND DISAGREEMENTS WITH ACCOUNTANTS ON ACCOUNTING AND FINANCIAL DISCLOSURES
None
Item 9A. CONTROLS AND PROCEDURES
Disclosure Controls and Procedures
Under the supervision and with the participation of S&T’s Chief Executive Officer (CEO) and Chief Accounting Officer (CAO) (its principal executive officer and principal accounting and financial officer, respectively), management has evaluated the effectiveness of the design and operation of S&T’s disclosure controls and procedures. In designing and evaluating the disclosure controls and procedures, management recognizes that any controls and procedures, no matter how well designed and operated, can provide only reasonable assurance of achieving the desired control objectives. In addition, the design of disclosure controls and procedures must reflect the fact that there are resource constraints and that management is required to apply its judgment in evaluating the benefits of possible controls and procedures relative to their costs.
Based on management’s evaluation, our CEO and CAO concluded that, as of December 31, 2009, our disclosure controls and procedures are designed at a reasonable assurance level and are effective to provide reasonable assurance that information we are required to disclose in reports that we file or submit under the Exchange Act is recorded, processed, summarized, and reported within the time periods specified in SEC rules and forms, and that such information is accumulated and communicated to our management, including our chief executive officer and chief financial officer, as appropriate, to allow timely decisions regarding required disclosure.
Internal Control over Financial Reporting
Management’s Report on Internal Control over Financial Reporting
Our management is responsible for establishing and maintaining adequate internal control over financial reporting, as such term is defined in Exchange Act Rule 13a-15(f). Management assessed the corporation’s system of internal control over financial reporting as of December 31, 2009, in relation to criteria for effective internal control over financial reporting as described in “Internal Control—Integrated Framework,” issued by the Committee of Sponsoring Organizations of the Treadway Commission. Based on this assessment, management concludes that, as of December 31, 2009, its system of internal control over financial reporting is effective and meets the criteria of the “Internal Control—Integrated Framework”.
KPMG LLP, independent registered public accounting firm, has issued a report on the effectiveness of S&T’s internal control over financial reporting as of December 31, 2009, which is included herein.
Changes in Internal Control Over Financial Reporting
We regularly review our system of internal control over financial reporting and make changes to our processes and systems to improve controls and increase efficiency, while ensuring that we maintain an effective internal control environment. Changes may include such activities as implementing new, more efficient systems, consolidating activities, and migrating processes.
As of the end of the period covered by this report, there have been no changes in our internal control over financial reporting that have materially affected, or are reasonably likely to materially affect, our internal control over financial reporting.
None
PAGE 113
Item 10. DIRECTORS, EXECUTIVE OFFICERS AND CORPORATE GOVERNANCE
The information required by Item 10 of Form 10-K is incorporated herein from the sections entitled “Section 16(a) Beneficial Ownership Reporting Compliance”, “Election of Directors”, “Executive Officers of the Registrant” and “Corporate Governance and Board and Committee Meetings” in our proxy statement relating to our April 19, 2010, annual meeting of shareholders.
Item 11. EXECUTIVE COMPENSATION
This information required by Item 11 of Form 10-K is incorporated herein from the sections entitled “Compensation Discussion and Analysis;” “Executive Compensation;” “Director Compensation;” “Compensation Committee Interlocks and Insider Participation”; and “Compensation Committee Report” in our proxy statement relating to our April 19, 2010, annual meeting of shareholders.
Item 12. SECURITY OWNERSHIP OF CERTAIN BENEFICIAL OWNERS AND MANAGEMENT AND RELATED STOCKHOLDER MATTERS
Except as set forth below, the information required by Item 12 of Form 10-K is incorporated from the sections entitled “Principal Beneficial Owners of S&T Common Stock” and “Beneficial Ownership of S&T Common Stock by Directors and Officers” in our proxy statement relating to our April 19, 2010, annual meeting of shareholders.
EQUITY COMPENSATION PLAN INFORMATION
The following table provides information as of December 31, 2009 related to the equity compensation plans in effect at that time.
| (a) | (b) | (c) | |||||
| Plan category | Number of securities to be issued upon exercise of outstanding options, warrants and rights |
Weighted-average exercise price of outstanding options, warrants and rights |
Number of securities reflected in column (a)) | ||||
| Equity compensation plan approved by shareholders1 |
1,100,550 | $ | 31.55 | 491,329 | |||
| Equity compensation plans not approved by shareholders |
— | — | — | ||||
| Total |
1,100,550 | $ | 31.55 | 491,329 | |||
| (1) | Awards granted under the S&T Bancorp, Inc. Amended and Restated 1992 Incentive Stock Plan (the “1992 Plan”) and the 2003 Incentive Stock Plan. The 1992 Plan expired in 2002 and no further awards may be granted thereunder. |
Item 13. CERTAIN RELATIONSHIPS AND RELATED TRANSACTIONS, AND DIRECTOR INDEPENDENCE
The information required by Item 13 of Form 10-K is incorporated herein from the sections entitled “Related Person Transactions” and “Director Independence” in our proxy statement relating to our April 19, 2010, annual meeting of shareholders.
Item 14. PRINCIPAL ACCOUNTING FEES AND SERVICES
The information required by Item 14 of Form 10-K is incorporated herein from the section entitled “Independent Registered Public Accounting Firm” in our proxy statement relating to our April 19, 2010, annual meeting of shareholders.
PAGE 114
Item 15. EXHIBITS, FINANCIAL STATEMENT SCHEDULES
| (a) | The following documents are filed as part of this report. |
Consolidated Financial Statements: The following consolidated financial statements are included in Part II, Item 8 of this report. No financial statement schedules are being filed since the required information is inapplicable or is presented in the consolidated financial statements or related notes.
PAGE 115
| (b) Exhibits |
||
| 3.1 | Articles of Incorporation of S&T Bancorp, Inc. Filed as Exhibit B to Registration Statement (No. 2-83565) on Form S-4 of S&T Bancorp, Inc., dated May 5, 1983, and incorporated herein by reference. | |
| 3.2 | Amendment to Articles of Incorporation of S&T Bancorp, Inc. Filed as Exhibit 3.2 to Form S-4 Registration Statement (No. 33-02600) dated January 15, 1986, and incorporated herein by reference. | |
| 3.3 | Amendment to Articles of Incorporation of S&T Bancorp, Inc. effective May 8, 1989, incorporated herein by reference. Filed as exhibit 3.3 to S&T Bancorp, Inc. Annual Report on Form 10-K for year ending December 31, 1998 and incorporated herein by reference. | |
| 3.4 | Amendment to Articles of Incorporation of S&T Bancorp, Inc. effective July 21, 1995. Filed as exhibit 3.4 to S&T Bancorp, Inc. Annual Report on Form 10-K for year ending December 31, 1998 and incorporated here by reference. | |
| 3.5 | Amendment to Articles of Incorporation of S&T Bancorp, Inc. effective June 18, 1998. Filed as exhibit 3.5 to S&T Bancorp, Inc. Annual Report on Form 10-K for year ending December 31, 1998 and incorporated herein by reference. | |
| 3.6 | Amendment to Articles of Incorporation of S&T Bancorp, Inc. effective April 21, 2008. Filed as Exhibit 3.1 to S&T Bancorp, Inc. Quarterly Report on Form 10-Q filed on August 7, 2008 and incorporated herein by reference. | |
| 3.7 | Certificate of Designations for the Series A Preferred Stock. Filed as Exhibit 3.1 to S&T Bancorp, Inc. Current Report on Form 8-K filed on January 15, 2009 and incorporated herein by reference. | |
| 3.8 | By-laws of S&T Bancorp, Inc., as amended, April 21, 2008. Filed as Exhibit 3.2 to S&T Bancorp, Inc. Quarterly Report on Form 10-Q filed on August 7, 2008 and incorporated herein by reference. | |
| 10.1 | S&T Bancorp, Inc. Amended and Restated 1992 Incentive Stock Plan. Filed as Exhibit 4.2 to Form S-8 Registration Statement (No. 333-48549) dated March 24, 1998 and incorporated herein by reference.* | |
| 10.2 | S&T Bancorp, Inc. 2003 Incentive Stock Plan. Filed as Exhibit 4.2 to Form S-8 Registration Statement (No. 333-111557) dated December 24, 2003 and incorporated herein by reference.* | |
PAGE 116
| (b) Exhibits |
||
| 10.3 | Agreement and Plan of Merger, dated as of December 16, 2007, between S&T Bancorp, Inc. and IBT Bancorp, Inc. Filed as exhibit 2.1 to S&T Bancorp, Inc. Current Report on Form 8-K filed on December 17, 2007 and incorporated herein by reference. | |
| 10.4 | S&T Bancorp, Inc. Thrift Plan for Employees of S&T Bank, as amended and restated. Filed as Exhibit 4.2 to Form S-8 Registration Statement (No. 333-156541) dated December 31, 2008 and incorporated herein by reference.* | |
| 10.5 | Dividend Reinvestment and Stock Purchase Plan of S&T Bancorp, Inc. Filed as Exhibit 4.2 to Form S-3 Registration Statement (No. 333-156555) dated January 2, 2009 and incorporated herein by reference. Filed as Exhibit 4.2 to S&T Bancorp, Inc. on Form S-8 filed on January 2, 2009 and incorporated herein by reference.* | |
| 10.6 | Severance Agreement, by and between Todd D. Brice and S&T Bancorp, Inc., dated December 31, 2008. Filed as Exhibit 10.1 to S&T Bancorp, Inc. Current Report on Form 8-K filed on January 2, 2009 and incorporated herein by reference.* | |
| 10.7 | Severance Agreement, by and between Robert E. Rout and S&T Bancorp, Inc., dated December 31, 2008. Filed as Exhibit 10.2 to S&T Bancorp, Inc. Current Report on Form 8-K filed on January 2, 2009 and incorporated herein by reference.* | |
| 10.8 | Severance Agreement, by and between Edward C. Hauck and S&T Bancorp, Inc., dated December 31, 2008. Filed as Exhibit 10.3 to S&T Bancorp, Inc. Current Report on Form 8-K filed on January 2, 2009 and incorporated herein by reference.* | |
| 10.9 | Severance Agreement, by and between David G. Antolik and S&T Bancorp, Inc. dated December 31, 2008. Filed as Exhibit 10.4 to S&T Bancorp, Inc. Current Report on Form 8-K filed on January 2, 2009 and incorporated herein by reference.* | |
| 10.10 | Severance Agreement, by and between Gregor T. Young IV and S&T Bancorp, Inc. dated December 31, 2008. Filed as Exhibit 10.5 to S&T Bancorp, Inc. Current Report on Form 8-K filed on January 2, 2009 and incorporated herein by reference.* | |
| 21 | Subsidiaries of the Registrant. | |
| 23 | Consent of KPMG LLP, Independent Registered Public Accounting Firm. | |
| 24 | Power of Attorney. | |
| 31.1 | Rule 13a-14(a) Certification of the Chief Executive Officer. | |
| 31.2 | Rule 13a-14(a) Certification of the Principal Financial Officer. | |
| 32 | Rule 13a-14(b) Certification of the Chief Executive Officer and Principal Financial Officer. | |
| 99.1 | Certification of Chief Executive Officer Pursuant to 31 C.F.R 30.15. | |
| 99.2 | Certification of Principal Financial Officer Pursuant to 31 C.F.R 30.15. | |
| * | Management Contract or Compensatory Plan or Arrangement |
PAGE 117
Pursuant to the requirements of Section 13 or 15(d) of the Securities Exchange Act of 1934, the registrant has duly caused this report to be signed on its behalf by the undersigned, thereunto duly authorized.
| S&T BANCORP, INC. (Registrant) | ||
| /s/ Todd D. Brice | 02/26/10 | |
| Todd D. Brice President and Chief Executive Officer (Principal Executive Officer) |
Date | |
| /s/ Wendy S. Bell |
02/26/10 | |
| Wendy S. Bell Senior Vice President, Controller and Chief Accounting Officer (Principal Financial Officer) |
Date | |
Pursuant to the requirements of the Securities Exchange Act of 1934, this report has been signed below by the following persons on behalf of the registrant and in the capacities and on the dates indicated.
| SIGNATURE | TITLE | DATE | ||
| /s/ Todd D. Brice Todd D. Brice |
President and Chief Executive Officer (Principal Executive Officer) | 02/26/10 | ||
| /s/ Wendy S. Bell Wendy S. Bell |
Senior Vice President, Controller and Chief Accounting Officer (Principal Financial Officer) | 02/26/10 | ||
| * John N. Brenzia |
Director | 02/26/10 | ||
|
Thomas A. Brice |
Director | 02/26/10 | ||
| * Todd D. Brice |
Chief Executive Officer and Director (Principal Executive Officer) | 02/26/10 | ||
|
John J. Delaney |
Director | 02/26/10 | ||
| * Michael J. Donnelly |
Director | 02/26/10 | ||
|
William J. Gatti |
Director | 02/26/10 | ||
| * Jeffrey D. Grube |
Director | 02/26/10 | ||
| * Frank W. Jones |
Director | 02/26/10 | ||
PAGE 118
| SIGNATURE | TITLE | DATE | ||
| * David L. Krieger |
Director | 02/26/10 | ||
| * James V. Milano |
Director | 02/26/10 | ||
| * James C. Miller |
Chairman of the Board and Director | 02/26/10 | ||
|
Alan Papernick |
Director | 02/26/10 | ||
|
Robert Rebich, Jr. |
Director | 02/26/10 | ||
|
Charles A. Spadafora |
Director | 02/26/10 | ||
|
Christine J. Toretti |
Director | 02/26/10 | ||
|
Charles G. Urtin |
Director | 02/26/10 | ||
| *By: /s/ Joseph A. Kirk Joseph A. Kirk Attorney-in-fact |
Director | 02/26/10 | ||
PAGE 119