Attached files
| file | filename |
|---|---|
| 8-K - FORM 8-K - S&T BANCORP INC | d929779d8k.htm |
| EX-99.2 - EX-99.2 - S&T BANCORP INC | d929779dex992.htm |
Exhibit 99.1
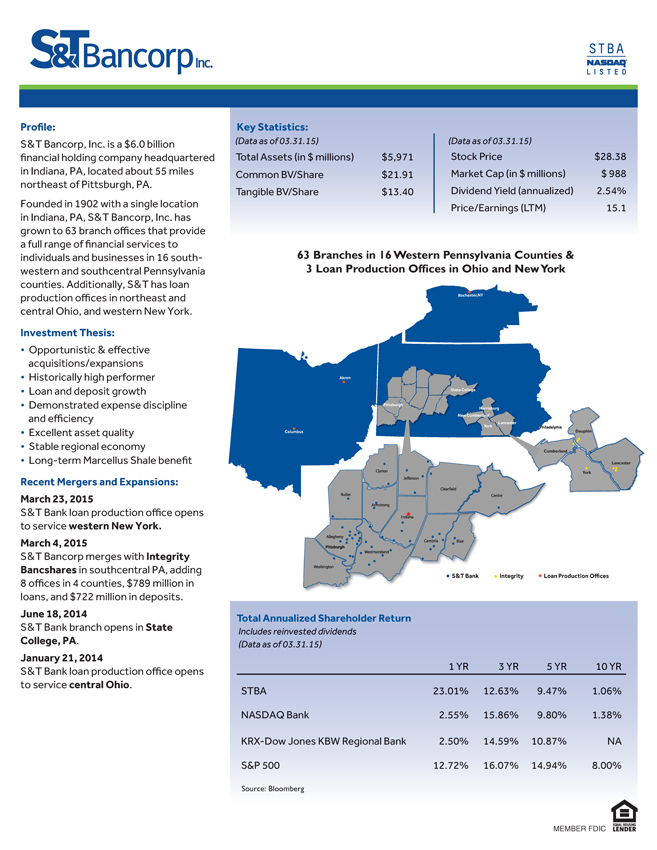
Profile:pS&T Bancorp, Inc. is a $6.0 billionpfinancial holding company headquarteredpin Indiana, PA, located about 55 milespnortheast of Pittsburgh, PA.pFounded in 1902 with a single locationpin Indiana, PA, S&T Bancorp, Inc. haspgrown to 63 branch offices that providepa full range of financial services topindividuals and businesses in 16 southwesternpand southcentral Pennsylvaniapcounties. Additionally, S&T has loanpproduction offices in northeast andpcentral Ohio, and western New York.pInvestment Thesis:p• Opportunistic & effectivepacquisitions/expansionsp• Historically high performerp• Loan and deposit growthp• Demonstrated expense disciplinepand efficiencyp• Excellent asset qualityp• Stable regional economyp• Long-term Marcellus Shale benefitpRecent Mergers and Expansions:pMarch 23, 2015pS&T Bank loan production office openspto service western New York.pMarch 4, 2015pS&T Bancorp merges with IntegritypBancshares in southcentral PA, addingp8 offices in 4 counties, $789 million inploans, and $722 million in deposits.pJune 18, 2014pS&T Bank branch opens in StatepCollege, PA.pJanuary 21, 2014pS&T Bank loan production office openspto service central Ohio.pLancasterpYorkpDauphinpCumberlandpColumbuspAkronpS&T Bank Integrity Loan Production OfficespRochester,NYpNew CumberlandpYorkpLancasterpPhiladelphiapHarrisburgpState CollegepPittsburghpTotal Annualized Shareholder ReturnpIncludes reinvested dividendsp(Data as of 03.31.15)p1 YR 3 YR 5 YR 10 YRpSTBA 23.01% 12.63% 9.47% 1.06%pNASDAQ Bank 2.55% 15.86% 9.80% 1.38%pKRX-Dow Jones KBW Regional Bank 2.50% 14.59% 10.87% NApS&P 500 12.72% 16.07% 14.94% 8.00%pKey Statistics:p(Data as of 03.31.15)pTotal Assets (in $ millions) $5,971pCommon BV/Share $21.91pTangible BV/Share $13.40p(Data as of 03.31.15)pStock Price $28.38pMarket Cap (in $ millions) $ 988pDividend Yield (annualized) 2.54%pPrice/Earnings (LTM) 15.1p63 Branches in 16 Western Pennsylvania Counties &p3 Loan Production Offices in Ohio and New YorkpMEMBER FDICpSource: Bloombergp
Senior Management:pTodd D. BricepPresident and Chief Executive OfficerpMark KochvarpSenior Executive Vice President,pChief Financial OfficerpDavid G. AntolikpSenior Executive Vice President,pChief Lending OfficerpDavid P. RuddockpSenior Executive Vice President,pChief Operating OfficerpInvestor Relations Contact:pMark KochvarpS&T Bancorp, Inc.p800 Philadelphia StreetpIndiana, PA 15701p724.465.4826pmark.kochvar@stbank.netpFor more information visit stbancorp.compor stbank.com.pCommon stock traded on the NASDAQpunder the symbol STBApAnalyst Coverage:pThe following analysts published researchpabout S&T Bancorp, Inc. in 2015.pBoenning & ScattergoodpMatthew Schultheis 610.832.5290pmschultheis@boenninginc.compKeefe, Bruyette & WoodspCollyn Gilbert 973.549.4092pcollyn.gilbert@kbw.compRaymond JamespWilliam Wallace 301.657.1548pwilliam.wallace@raymondjames.compRBC Capital MarketspJake Civiello 617.725.2152pjake.civiello@rbccm.compFinancial Highlights:pThis document may contain “forward-looking statements” within the meaning of the Private Securities Litigation Reform Act of 1995. Such statements involve risks and uncertaintiespthat could cause actual results to differ materially from the results discussed in these statements. These risks are detailed in the company’s latest form 10-Q and 10-K led with thepSecurities and Exchange Commission.pThis document also contains or references, certain non-GAAP nancial measures, such as net interest margin (FTE). Although S&T believes that these measures enhance investors’punderstanding of S&T’s business and performance, these non-GAAP nancial measures should not be considered an alternative to GAAP, and should be read in conjunction withpthe audited nancial statements and analysis as presented in the Annual Report on Form 10-K as well as the unaudited nancial statements and analyses as presented in theprespective Quarterly Reports on Forms 10-Q for S&T Bancorp, Inc. and subsidiaries.p2015pFirst Quarterp2014pFull Yearp2013pFull YearpNet Income (in $ thousands) $12,835 $57,910 $50,539pDiluted Earnings per Share $0.41 $1.95 $1.70pDividends Declared per Share $0.18 $0.68 $0.61pTotal Assets (in $ millions) $5,971 $4,965 $4,533pTotal Loans (in $ millions) $4,690 $3,872 $3,568pTotal Deposits (in $ millions) $4,829 $3,909 $3,672pReturn on Average Assets (annualized) 0.99% 1.22% 1.12%pReturn on Average Equity (annualized) 7.85% 9.71% 9.21%pNet Interest Margin (FTE) (annualized) 3.48% 3.50% 3.50%pNonperforming Assets/Loans + OREO 0.41% 0.33% 0.64%pAllowance for Loan Losses/Total Loans 1.03% 1.24% 1.30%pNet Loan Charge-offs (annualized) / Average Loans 0.10% 0.00% 0.25%pRisk-based Capital - Total 11.86% 14.27% 14.36%pTangible Common Equity/Tangible Assets 8.22% 9.00% 9.03%p• Named to the prestigous Sandler O’Neill Sm-All Stars Class of 2013 and 2014.p• Superior Customer ServicepConsistently ranked high in customer satisfaction.p• American Heart AssociationpS&T recognized as a Gold Level Fit-Friendly Worksite in 2014.pOur Reputation Speaks for Itself...pOne customer at a time.