Attached files
| file | filename |
|---|---|
| EXCEL - IDEA: XBRL DOCUMENT - INTERNATIONAL SHIPHOLDING CORP | Financial_Report.xls |
| EX-32.2 - EX-32.2 - INTERNATIONAL SHIPHOLDING CORP | c041-20150331xex322.htm |
| EX-31.1 - EX-31.1 - INTERNATIONAL SHIPHOLDING CORP | c041-20150331xex311.htm |
| EX-31.2 - EX-31.2 - INTERNATIONAL SHIPHOLDING CORP | c041-20150331xex312.htm |
| EX-32.1 - EX-32.1 - INTERNATIONAL SHIPHOLDING CORP | c041-20150331xex321.htm |
| EX-10.7 - EX-10.7 - INTERNATIONAL SHIPHOLDING CORP | c041-20150331ex107b56eb4.htm |
| EX-10.2 - EX-10.2 - INTERNATIONAL SHIPHOLDING CORP | c041-20150331ex102b781a3.htm |
| EX-10.1 - EX-10.1 - INTERNATIONAL SHIPHOLDING CORP | c041-20150331ex10141431b.htm |
| EX-10.6 - EX-10.6 - INTERNATIONAL SHIPHOLDING CORP | c041-20150331ex10614a3c6.htm |
| EX-10.4 - EX-10.4 - INTERNATIONAL SHIPHOLDING CORP | c041-20150331ex10432160a.htm |
| EX-10.3 - EX-10.3 - INTERNATIONAL SHIPHOLDING CORP | c041-20150331ex103aeb3ff.htm |
| EX-10.5 - EX-10.5 - INTERNATIONAL SHIPHOLDING CORP | c041-20150331ex1054b4841.htm |
UNITED STATES SECURITIES AND EXCHANGE COMMISSION
WASHINGTON, D.C. 20549

FORM 10-Q
(Mark One)
|
[X] QUARTERLY REPORT PURSUANT TO SECTION 13 OR 15(d) OF THE SECURITIES EXCHANGE ACT OF 1934 |
|
|
[ ] TRANSITION REPORT PURSUANT TO SECTION 13 OR 15(d) OF THE SECURITIES EXCHANGE ACT OF 1934 |
|
|
|
For the transition period from . . . . . . . . . . . . to . . . . . . . . . . . . . . |
|
|
Commission File No. 001-10852 |
|
|
International Shipholding Corporation |
|
|
(Exact name of registrant as specified in its charter) |
|
Delaware |
36-2989662 |
|
(State or other jurisdiction of incorporation or organization) |
(I.R.S. Employer Identification No.) |
|
|
|
|
11 North Water Street, Suite 18290, Mobile, Alabama |
36602 |
|
(Address of principal executive offices) |
(Zip Code) |
|
|
Registrant's telephone number, including area code: (251) 243-9100 |
Former name, former address and former fiscal year, if changed since last report:
Indicate by check mark whether the registrant (1) has filed all reports required to be filed by Section 13 or 15(d) of the Securities Exchange Act of 1934 during the preceding 12 months (or for such shorter period that the registrant was required to file such reports), and (2) has been subject to such filing requirements for the past 90 days.
Yes ☑ No ☐
Indicate by check mark whether the registrant has submitted electronically and posted on its corporate Web site, if any, every Interactive Data File required to be submitted and posted pursuant to Rule 405 of Regulation S-T during the preceding 12 months (or for such shorter period that the registrant was required to submit and post such files).
Yes ☑ No ☐
Indicate by check mark whether the registrant is a large accelerated filer, an accelerated filer, a non-accelerated filer, or a smaller reporting company. See definition of “large accelerated filer”, “accelerated filer” and “smaller reporting company” in Rule 12b-2 of the Exchange Act.
Large accelerated filer ☐ Accelerated filer ☑
Non-accelerated filer ☐ Smaller Reporting Company ☐
Indicate by check mark whether the registrant is a shell company (as defined in Rule 12b-2 of the Exchange Act).
Yes ☐ No ☑
Indicate the number of shares outstanding of each of the issuer’s classes of common stock, as of the latest practicable date.
Common stock, $1 par value. . . . . . . . 7,309,757 shares outstanding as of May 1, 2015
1
INTERNATIONAL SHIPHOLDING CORPORATION
Quarterly Report on Form 10-Q for the
Three Months Ended March 31, 2015
TABLE OF CONTENTS
|
PART I – FINANCIAL INFORMATION |
|
|
ITEM 1 – FINANCIAL STATEMENTS |
|
|
3 |
|
|
4 |
|
|
5 |
|
|
7 |
|
|
8 |
|
|
ITEM 2 – MANAGEMENT’S DISCUSSION AND ANALYSIS OF FINANCIAL CONDITION AND RESULTS OF OPERATIONS |
21 |
|
ITEM 3 – QUANTITATIVE AND QUALITATIVE INFORMATION ABOUT MARKET RISK |
38 |
|
38 |
|
|
PART II – OTHER INFORMATION |
|
|
39 39 |
|
|
ITEM 2 – UNREGISTERED SALES OF EQUITY SECURITIES AND USE OF PROCEEDS |
39 |
|
39 |
In this report, the terms “we,” “us,” “our” and the “Company” refer to International Shipholding Corporation and its subsidiaries. In addition, the term “Notes” means the Notes to our Condensed Consolidated Financial Statements contained elsewhere in this report, the term “PCTC” means a Pure Car Truck Carrier vessel, the term “FSI” refers to Frascati Shops, Inc., which we acquired in August 2012, the term “UOS” refers to United Ocean Services, LLC, which we acquired in November 2012, and the term “SEC” means the U.S. Securities and Exchange Commission.
2
PART I – FINANCIAL INFORMATION
Item 1 - Financial Statements
INTERNATIONAL SHIPHOLDING CORPORATION
CONDENSED CONSOLIDATED STATEMENTS OF OPERATIONS
(All Amounts in Thousands Except Share Data)
(Unaudited)
|
Three Months Ended March 31, |
||||||||||
|
2015 |
2014 |
|||||||||
|
Revenues |
|
|
|
|
|
$ |
68,026 |
|
$ |
72,694 |
|
Operating Expenses |
||||||||||
|
Voyage Expenses |
52,211 | 57,433 | ||||||||
|
Amortization Expense |
5,187 | 5,163 | ||||||||
|
Vessel Depreciation |
5,543 | 6,721 | ||||||||
|
Other Depreciation |
184 | 184 | ||||||||
|
Administrative and General Expenses |
5,022 | 5,449 | ||||||||
|
Loss on Sale of Other Assets |
68 |
- |
||||||||
|
Total Operating Expenses |
68,215 | 74,950 | ||||||||
|
Operating Loss |
(189) | (2,256) | ||||||||
|
Interest and Other |
||||||||||
|
Interest Expense |
2,668 | 2,145 | ||||||||
|
Derivative Loss |
2,810 | 14 | ||||||||
|
Loss on Extinguishment of Debt |
95 |
- |
||||||||
|
Other Income from Vessel Financing |
(445) | (489) | ||||||||
|
Investment Income |
(7) | (19) | ||||||||
|
Foreign Exchange Loss |
45 | 84 | ||||||||
| 5,166 | 1,735 | |||||||||
|
Loss Before Provision (Benefit) for Income Taxes and Equity in Net Income (Loss) of Unconsolidated Entities |
|
|
|
|
|
|
(5,355) |
|
|
(3,991) |
|
Provision (Benefit) for Income Taxes |
39 | (882) | ||||||||
|
Equity in Net Income (Loss) of Unconsolidated Entities (Net of Applicable Taxes) |
|
|
|
|
|
|
893 |
|
|
(108) |
|
Net Loss |
$ |
(4,501) |
$ |
(3,217) | ||||||
|
Preferred Stock Dividends |
1,305 | 1,305 | ||||||||
|
Net Loss Attributable to Common Stockholders |
$ |
(5,806) |
$ |
(4,522) | ||||||
|
Loss Per Common Share: |
||||||||||
|
Basic |
$ |
(0.79) |
$ |
(0.62) | ||||||
|
Diluted |
$ |
(0.79) |
$ |
(0.62) | ||||||
|
Weighted Average Shares of Common Stock Outstanding: |
||||||||||
|
Basic |
7,308,482 | 7,252,075 | ||||||||
|
Diluted |
7,308,482 | 7,252,075 | ||||||||
|
Common Stock Dividends Per Share |
$ |
0.25 |
$ |
0.25 | ||||||
The accompanying notes are an integral part of these statements.
3
INTERNATIONAL SHIPHOLDING CORPORATION
CONDENSED CONSOLIDATED STATEMENTS OF COMPREHENSIVE LOSS
(All Amounts in Thousands)
(Unaudited)
|
Three Months Ended March 31, |
||||||||||
|
2015 |
2014 |
|||||||||
|
Net Loss |
$ |
(4,501) |
$ |
(3,217) | ||||||
|
Other Comprehensive (Loss)/Income: |
||||||||||
|
Unrealized Foreign Currency Translation Loss |
(61) | (25) | ||||||||
|
Change in Fair Value of Derivatives |
240 | 9 | ||||||||
|
De-Designation of Interest Rate Swap |
2,859 |
- |
||||||||
|
Change in Funded Status of Defined Benefit Plan |
304 | 175 | ||||||||
|
Comprehensive Loss |
$ |
(1,159) |
$ |
(3,058) | ||||||
The accompanying notes are an integral part of these statements.
4
INTERNATIONAL SHIPHOLDING CORPORATION
CONDENSED CONSOLIDATED BALANCE SHEETS
(All Amounts in Thousands Except Share Data)
(Unaudited)
|
March 31, 2015 |
December 31, 2014 |
||||
|
ASSETS |
|||||
|
Cash and Cash Equivalents |
$ |
21,783 |
$ |
21,133 | |
|
Restricted Cash |
391 | 1,394 | |||
|
Accounts Receivable, Net of Allowance for Doubtful Accounts |
28,653 | 31,322 | |||
|
Prepaid Expenses |
8,639 | 10,927 | |||
|
Deferred Tax Asset |
235 | 408 | |||
|
Other Current Assets |
328 | 370 | |||
|
Notes Receivable |
1,628 | 3,204 | |||
|
Material and Supplies Inventory |
8,134 | 9,760 | |||
|
Assets Held for Sale |
6,778 | 6,976 | |||
|
Total Current Assets |
76,569 | 85,494 | |||
|
Investment in Unconsolidated Entities |
22,697 | 21,837 | |||
|
Vessels, Property, and Other Equipment, at Cost: |
|||||
|
Vessels |
519,953 | 520,026 | |||
|
Building |
1,780 | 1,354 | |||
|
Land |
623 | 623 | |||
|
Leasehold Improvements |
26,348 | 26,348 | |||
|
Construction in Progress |
4,495 | 2,371 | |||
|
Furniture and Equipment |
10,574 | 10,461 | |||
| 563,773 | 561,183 | ||||
|
Less - Accumulated Depreciation |
(192,618) | (186,450) | |||
| 371,155 | 374,733 | ||||
|
Other Assets: |
|||||
|
Deferred Charges, Net of Accumulated Amortization |
28,960 | 28,657 | |||
|
Intangible Assets, Net of Accumulated Amortization |
24,416 | 25,042 | |||
|
Due from Related Parties |
1,567 | 1,660 | |||
|
Notes Receivable |
25,361 | 24,455 | |||
|
Goodwill |
2,735 | 2,735 | |||
|
Assets Held for Sale |
32,486 | 48,701 | |||
|
Other |
4,614 | 4,843 | |||
| 120,139 | 136,093 | ||||
|
TOTAL ASSETS |
$ |
590,560 |
$ |
618,157 | |
The accompanying notes are an integral part of these statements.
5
INTERNATIONAL SHIPHOLDING CORPORATION
CONDENSED CONSOLIDATED BALANCE SHEETS
(All Amounts in Thousands Except Share Data)
|
March 31, 2015 |
December 31, 2014 |
||||
|
LIABILITIES AND STOCKHOLDERS' EQUITY |
|||||
|
Current Liabilities: |
|||||
|
Current Maturities of Long-Term Debt |
$ |
22,412 |
$ |
23,367 | |
|
Accounts Payable and Other Accrued Expenses |
47,805 | 52,731 | |||
|
Total Current Liabilities |
70,217 | 76,098 | |||
|
Long-Term Debt, Less Current Maturities |
203,631 | 219,521 | |||
|
Other Long-Term Liabilities: |
|||||
|
Incentive Obligation |
4,456 | 4,644 | |||
|
Other |
48,970 | 50,284 | |||
|
TOTAL LIABILITIES |
327,274 | 350,547 | |||
|
Stockholders' Equity: |
|||||
|
Preferred Stock, $1.00 Par Value, 9.50% Series A Cumulative Perpetual Preferred Stock, 650,000 Shares Authorized, 250,000 Shares Issued and Outstanding at March 31, 2015 and December 31, 2014, Respectively |
|
250 |
|
|
250 |
|
Preferred Stock, $1.00 Par Value, 9.00% Series B Cumulative Perpetual Preferred Stock, 350,000 Shares Authorized, 316,250 Shares Issued and Outstanding at March 31, 2015 and December 31, 2014, Respectively |
|
316 |
|
|
316 |
|
Common Stock, $1.00 Par Value, 20,000,000 Shares Authorized, 7,309,757 and 7,301,657 Shares Outstanding at March 31, 2015 and December 31, 2014, Respectively |
|
8,753 |
|
|
8,743 |
|
Additional Paid-In Capital |
140,952 | 140,960 | |||
|
Retained Earnings |
151,466 | 159,134 | |||
|
Treasury Stock 1,388,078 Shares at March 31, 2015 and December 31, 2014 |
|
(25,403) |
|
|
(25,403) |
|
Accumulated Other Comprehensive Loss |
(13,048) | (16,390) | |||
|
TOTAL STOCKHOLDERS' EQUITY |
263,286 | 267,610 | |||
|
TOTAL LIABILITIES AND STOCKHOLDERS' EQUITY |
$ |
590,560 |
$ |
618,157 | |
The accompanying notes are in an integral part of these statements.
6
INTERNATIONAL SHIPHOLDING CORPORATION
CONDENSED CONSOLIDATED STATEMENTS OF CASH FLOWS
(All Amounts in Thousands Except Share Data)
(Unaudited)
|
Three Months Ended March 31, |
|||||
|
2015 |
2014 |
||||
|
Cash Flows from Operating Activities: |
|
|
|
|
|
|
Net Loss |
$ |
(4,501) |
|
$ |
(3,217) |
|
Adjustments to Reconcile Net Loss to Net Cash Provided by Operating Activities: |
|
|
|
|
|
|
Depreciation |
|
5,727 |
|
|
6,905 |
|
Amortization of Deferred Charges |
|
4,840 |
|
|
4,286 |
|
Amortization of Intangible Assets |
|
626 |
|
|
1,029 |
|
Deferred Tax |
|
- |
|
|
(905) |
|
Non-Cash Share Based Compensation |
|
2 |
|
|
447 |
|
Equity in Net (Income) Loss of Unconsolidated Entities |
|
(893) |
|
|
108 |
|
Loss on Sale of Assets |
|
68 |
|
|
- |
|
Loss on Extinguishment of Debt |
|
95 |
|
|
- |
|
Loss on Foreign Currency Exchange |
|
45 |
|
|
84 |
|
Loss on Derivatives |
|
2,810 |
|
|
14 |
|
Other Reconciling Items, net |
|
(838) |
|
|
(1,387) |
|
Changes in operating assets and liabilities, net of acquisitions: |
|
|
|
|
|
|
Deferred Drydocking Charges |
|
(5,515) |
|
|
(1,775) |
|
Accounts Receivable |
|
(878) |
|
|
3,620 |
|
Inventory and Other Current Assets |
|
3,906 |
|
|
2,006 |
|
Other Assets |
|
- |
|
|
(500) |
|
Accounts Payable and Accrued Liabilities |
|
(3,839) |
|
|
(2,020) |
|
Other Long-Term Liabilities |
|
250 |
|
|
(1,197) |
|
Net Cash Provided by Operating Activities |
|
1,905 |
|
|
7,498 |
|
|
|
|
|
|
|
|
Cash Flows from Investing Activities: |
|
|
|
|
|
|
Purchases of and Capital Improvements to Property and Equipment |
|
(3,250) |
|
|
(5,884) |
|
Investment in Unconsolidated Entities |
|
- |
|
|
(5,814) |
|
Net Change in Restricted Cash Account |
|
1,003 |
|
|
2,499 |
|
Cash Proceeds from the State of Louisiana |
|
122 |
|
|
- |
|
Cash Proceeds from Sale of Assets |
|
16,355 |
|
|
- |
|
Cash Proceeds from Receivable Settlement |
|
3,890 |
|
|
- |
|
Proceeds from Payments on Note Receivables |
|
670 |
|
|
1,062 |
|
Net Cash Provided by (Used In) Investing Activities |
|
18,790 |
|
|
(8,137) |
|
|
|
|
|
|
|
|
Cash Flows from Financing Activities: |
|
|
|
|
|
|
Proceeds from Line of Credit |
|
5,000 |
|
|
8,000 |
|
Payments on Line of Credit |
|
(2,500) |
|
|
(8,000) |
|
Principal Payments on Long Term Debt |
|
(19,384) |
|
|
(4,755) |
|
Additions to Deferred Financing Charges |
|
(28) |
|
|
(62) |
|
Dividends Paid |
|
(3,133) |
|
|
(3,119) |
|
Net Cash Used In Financing Activities |
|
(20,045) |
|
|
(7,936) |
|
|
|
|
|
|
|
|
Net Increase (Decrease) in Cash and Cash Equivalents |
|
650 |
|
|
(8,575) |
|
Cash and Cash Equivalents at Beginning of Period |
|
21,133 |
|
|
20,010 |
|
|
|
|
|
|
|
|
Cash and Cash Equivalents at End of Period |
$ |
21,783 |
|
$ |
11,435 |
|
|
|
|
|
|
|
|
Supplemental disclosure of non-cash investing activities: |
|
|
|
|
|
|
Additions to vessels, property, plant and equipment included in accounts payable and other accrued expenses |
$ |
823 |
|
$ |
- |
The accompanying notes are an integral part of these statements.
7
NOTES TO UNAUDITED CONDENSED CONSOLIDATED FINANCIAL STATEMENTS
Three Months Ended March 31, 2015
NOTE 1 - BASIS OF PRESENTATION
We operate a diversified fleet of U.S. and International flag vessels that provide international and domestic maritime transportation services. For additional information on our business, see Item 2 of Part I of this report.
We have prepared the accompanying unaudited interim financial statements pursuant to the rules and regulations of the Securities and Exchange Commission, and as permitted hereunder, we have omitted certain information and footnote disclosures required by U.S. Generally Accepted Accounting Principles (GAAP) for complete financial statements. We recommend you read these interim statements in conjunction with the financial statements and notes thereto included in our Annual Report on Form 10-K for the year ended December 31, 2014. The condensed consolidated balance sheet as of December 31, 2014 included in this report has been derived from the audited financial statements at that date.
The foregoing 2015 interim results are not necessarily indicative of the results of operations for the full year 2015. Management believes that it has made all adjustments necessary, consisting only of normal recurring adjustments, for a fair statement of the information presented.
The accompanying financial statements include the accounts of International Shipholding Corporation and its majority owned subsidiaries. Intercompany accounts and transactions have been eliminated in consolidation. Our policy is to consolidate all subsidiaries in which we hold a greater than 50% voting interest or otherwise control its operating and financial activities. We use the equity method to account for investments in entities in which we hold a 20% to 50% voting interest and have the ability to exercise significant influence over their operating and financial activities.
Revenues and expenses relating to our Rail-Ferry, Jones Act, and Specialty segments’ voyages are recorded over the duration of the voyage. Our voyage expenses are estimated at the beginning of the voyages based on historical actual costs or from industry sources familiar with those types of charges. As the voyage progresses, these estimated costs are revised with actual charges and timely adjustments are made. Based on our prior experience, we believe there is not a material difference between recording estimated expenses ratably over the voyage versus recording expenses as incurred. Revenues and expenses relating to our other vessels’ voyages, which require limited estimates or assumptions, are recorded when earned or incurred during the reporting period.
We have eliminated all significant intercompany balances, accounts, and transactions in consolidation.
Certain previously reported amounts have been reclassified to conform to the 2015 presentation. Specifically, drydock amortization, which was previously included in voyage expense, is now included in amortization expense, and miscellaneous depreciation expense, which was previously included in voyage expense and administrative and general expense, is now included in other depreciation expense in the Condensed Consolidated Statements of Operations and other tables herein (see Note 6 – Goodwill, Other Intangible Assets, and Deferred Charges).
NOTE 2 – OPERATING SEGMENTS
Our six operating segments, Jones Act, Pure Car Truck Carriers, Dry Bulk Carriers, Rail-Ferry, Specialty Contracts, and Other are distinguished primarily by the market in which the segment assets are deployed, the physical characteristics of those assets, and the type of services provided to our customers. We report in the Other category the results of several of our subsidiaries that provide ship and cargo charter brokerage, ship management services and agency services to our operating subsidiaries as well as third party customers. Also included in the Other category are corporate related items, results of insignificant operations, and income and expense items not allocated to the other reportable segments. We manage each reportable segment separately, as each requires different resources depending on the nature of the contract or terms under which the vessels within the segment operate.
We allocate interest expense to the segments in proportion to the fixed assets (defined as the carrying value of vessels, property, and other equipment) within each segment. Additionally, we include the results of two of our unconsolidated entities, Oslo Bulk, AS and Oslo Bulk Holding Pte. Ltd, in our Dry Bulk Carriers segment, and the results of another unconsolidated entity, Terminales Transgolfo, S.A. de C.V., to our Rail-Ferry segment. The results of our remaining unconsolidated entities, Saltholmen Shipping Ltd (a company owning two Chemical Tankers) and Brattholmen Shipping Ltd (a company owning two Asphalt Tankers), are included in our Specialty Contracts segment. We do not allocate to our segments; (i) administrative and general expenses, (ii) (loss) gain on sale of other assets, (iii) derivative (income) loss, (iv) income taxes, (v) loss (gain) on sale of investment, (vi) loss of extinguishment of debt, (vii) other income from vessel financing, (viii) investment income, and (ix) foreign exchange loss (gain). Intersegment revenues are based on market prices and include revenues earned by our subsidiaries that provide specialized services to our operating companies. Finally, we use “gross voyage profit” as the primary measure for our segments’ profitability to assist in monitoring and managing our business.
8
The following table presents information about segment profit and loss for the three months ended March 31, 2015 and 2014:
three MONTHS ENDED MARCH 31, 2015
COMPARED TO THE three MONTHS ENDED MARCH 31, 2014
|
(All Amounts in Thousands) |
Pure Car |
||||||||||||||||||||
|
Jones |
Truck |
Dry Bulk |
Rail |
Specialty |
|||||||||||||||||
|
Act |
Carriers |
Carriers |
Ferry |
Contracts |
Other |
Total |
|||||||||||||||
|
2015 |
|||||||||||||||||||||
|
Fixed Revenue |
$ |
24,595 |
$ |
14,247 |
$ |
1,868 |
$ |
- |
$ |
10,571 |
$ |
- |
$ |
51,281 | |||||||
|
Variable Revenue |
- |
7,533 | 1,255 | 7,785 | 185 | (13) | 16,745 | ||||||||||||||
|
Total Revenue from External Customers |
24,595 | 21,780 | 3,123 | 7,785 | 10,756 | (13) | 68,026 | ||||||||||||||
|
Voyage Expenses |
18,590 | 17,020 | 2,580 | 6,886 | 7,557 | (422) | 52,211 | ||||||||||||||
|
Amortization Expense |
3,828 | 715 | 61 | 285 | 298 |
- |
5,187 | ||||||||||||||
|
Loss (Income) of Unconsolidated Entities |
- |
- |
(635) | 74 | (332) |
- |
(893) | ||||||||||||||
|
Gross Voyage Profit |
$ |
2,177 |
$ |
4,045 |
$ |
1,117 |
$ |
540 |
$ |
3,233 |
$ |
409 |
$ |
11,521 | |||||||
|
Gross Voyage Profit Margin |
9 |
% |
19 |
% |
36 |
% |
7 |
% |
30 |
% |
- |
17 |
% |
||||||||
|
2014 |
|||||||||||||||||||||
|
Fixed Revenue |
$ |
29,100 |
$ |
15,615 |
$ |
1,526 |
$ |
- |
$ |
8,702 |
$ |
- |
$ |
54,943 | |||||||
|
Variable Revenue |
- |
3,941 | 3,590 | 7,926 | 2,248 | 46 | 17,751 | ||||||||||||||
|
Total Revenue from External Customers |
29,100 | 19,556 | 5,116 | 7,926 | 10,950 | 46 | 72,694 | ||||||||||||||
|
Voyage Expenses |
21,209 | 16,663 | 3,566 | 6,846 | 9,476 | (327) | 57,433 | ||||||||||||||
|
Amortization Expense |
3,667 | 535 | 77 | 160 | 724 |
- |
5,163 | ||||||||||||||
|
Loss of Unconsolidated Entities |
- |
- |
80 | 28 |
- |
- |
108 | ||||||||||||||
|
Gross Voyage Profit |
$ |
4,224 |
$ |
2,358 |
$ |
1,393 |
$ |
892 |
$ |
750 |
$ |
373 |
$ |
9,990 | |||||||
|
Gross Voyage Profit Margin |
15 |
% |
12 |
% |
27 |
% |
11 |
% |
7 |
% |
- |
14 |
% |
||||||||
9
The following table is a reconciliation of the totals reported for the operating segments to the applicable line items in the consolidated financial statements:
|
(All Amounts in Thousands) |
Three Months Ended March 31, |
||||
|
2015 |
2014 |
||||
|
Revenues |
$ |
68,026 |
$ |
72,694 | |
|
Voyage Expenses |
52,211 | 57,433 | |||
|
Amortization Expense |
5,187 | 5,163 | |||
|
Net (Income) Loss of Unconsolidated Entities |
(893) | 108 | |||
|
Gross Voyage Profit |
11,521 | 9,990 | |||
|
Vessel Depreciation |
5,543 | 6,721 | |||
|
Other Depreciation |
184 | 184 | |||
|
Gross Profit |
5,794 | 3,085 | |||
|
Other Operating Expenses: |
|||||
|
Administrative and General Expenses |
5,022 | 5,449 | |||
|
Loss on Sale of Other Assets |
68 |
- |
|||
|
Less: Net Income (Loss) of Unconsolidated Entities |
893 | (108) | |||
|
Total Other Operating Expenses |
5,983 | 5,341 | |||
|
Operating Loss |
$ |
(189) |
$ |
(2,256) | |
NOTE 3 – LOSS ON SALE OF ASSETS
During the first quarter of 2015, we sold a 36,000 dead weight ton Handysize vessel and its related equipment. We received $16.4 million, net of commissions and other costs to sell, and recorded a loss on sale of asset of approximately $68,000 during the quarter. This vessel was included in Assets Held for Sale at December 31, 2014. Additionally, we paid off related debt of approximately $13.5 million and recorded a loss on extinguishment of debt of approximately $95,000.
NOTE 4 - INVENTORY
Our inventory consists of three major classes: spare parts, fuel, and warehouse inventory. Spare parts and warehouse inventories are stated at the lower of cost or market based on the first-in, first-out method of accounting. Our fuel inventory is based on the average cost method of accounting. We have broken down the inventory balances as of March 31, 2015 and December 31, 2014 by major class in the following table:
|
(All Amounts in Thousands) |
March 31, |
December 31, |
|||
|
Inventory Classes |
2015 |
2014 |
|||
|
Spare Parts Inventory |
$ |
3,296 |
$ |
3,253 | |
|
Fuel Inventory |
2,320 | 3,967 | |||
|
Warehouse Inventory |
2,518 | 2,540 | |||
|
Total |
$ |
8,134 |
$ |
9,760 |
10
NOTE 5 – UNCONSOLIDATED ENTITIES
The following table summarizes our equity in net income (loss) of unconsolidated entities for the three months ended March 31, 2015 and 2014, respectively:
|
(All Amounts in Thousands) |
Three Months Ended March 31, |
|||||
|
2015 |
2014 |
|||||
|
Oslo Bulk, AS |
$ |
515 |
$ |
(62) | ||
|
Oslo Bulk Holding Pte. Ltd (formerly Tony Bulkers) |
120 | (18) | ||||
|
Terminales Transgolfo, S.A. de C.V. |
(74) | (28) | ||||
|
Saltholmen Shipping Ltd |
251 |
- |
||||
|
Brattholmen Shipping Ltd |
81 |
- |
||||
|
Total Equity in Net Income (Loss) of Unconsolidated Entities |
$ |
893 |
$ |
(108) | ||
These investments have been accounted for under the equity method and our portion of their earnings or losses is presented net of any applicable taxes on our condensed consolidated statements of operations under the caption: "Equity in Net Income (Loss) of Unconsolidated Entities (Net of Applicable Taxes).”
During 2014, we invested approximately $5.8 million cash and $2.1 million cash to acquire a 30% interest in Saltholmen Shipping Ltd and Brattholmen Shipping Ltd, respectively. Brattholmen Shipping Ltd was organized to purchase and operate two Asphalt Tankers. Saltholmen Shipping Ltd was organized to purchase and operate two newbuilding Chemical Tankers. All four vessels were immediately employed on long-term bareboat charters.
For additional information on our investment in these and other unconsolidated entities, see Note E – Unconsolidated Entities to the consolidated financial statements included in our Annual Report on Form 10-K for the year ended December 31, 2014.
NOTE 6 – GOODWILL, OTHER INTANGIBLE ASSETS, AND DEFERRED CHARGES
Amortization expense for intangible assets was approximately $0.6 million and $1.0 million for the three months ended March 31, 2015 and 2014, respectively. Amortization expense for deferred charges was approximately $4.8 million and $4.3 million for the three months ended March 31, 2015 and 2014, respectively. The following table presents the rollforward of goodwill, other intangible assets, and deferred charges for the three months ended March 31, 2015:
|
(All Amounts in Thousands) |
Balance at |
Balance at |
|||||||||||||||||
|
Amortization |
December 31, |
Cash |
Non-Cash |
March 31, |
|||||||||||||||
|
Period |
2014 |
Additions |
Disposals |
Amortization |
Reclassifications |
2015 |
|||||||||||||
|
Indefinite Life Intangibles |
|||||||||||||||||||
|
Goodwill |
$ |
2,735 |
$ |
- |
$ |
- |
$ |
- |
$ |
- |
$ |
2,735 | |||||||
|
Total Indefinite Life Intangibles |
$ |
2,735 |
$ |
- |
$ |
- |
$ |
- |
$ |
- |
$ |
2,735 | |||||||
|
Definite Life Intangibles |
|||||||||||||||||||
|
Trade names - FSI |
240 months |
$ |
57 |
$ |
- |
$ |
- |
$ |
(1) |
$ |
- |
$ |
56 | ||||||
|
Trade names - UOS |
144 months |
1,357 |
- |
- |
(34) |
- |
1,323 | ||||||||||||
|
Customer Relationships - FSI |
240 months |
375 |
- |
- |
(5) |
- |
370 | ||||||||||||
|
Customer Relationships - UOS |
144 months |
23,253 |
- |
- |
(586) |
- |
22,667 | ||||||||||||
|
Total Definite Life Intangibles |
$ |
25,042 |
$ |
- |
$ |
- |
$ |
(626) |
$ |
- |
$ |
24,416 | |||||||
|
Deferred Charges |
|||||||||||||||||||
|
Drydocking Costs |
various |
$ |
25,238 |
$ |
5,515 |
$ |
- |
$ |
(4,560) |
$ |
(831) |
$ |
25,362 | ||||||
|
Financing Charges and Other |
various |
3,419 | 28 | (95) | (280) | 526 | 3,598 | ||||||||||||
|
Total Deferred Charges |
$ |
28,657 |
$ |
5,543 |
$ |
(95) |
$ |
(4,840) |
$ |
(305) |
$ |
28,960 | |||||||
11
NOTE 7 – ASSETS HELD FOR SALE
As a result of continued evaluation of our strategic alternatives, during the fourth quarter of 2014, we committed to a plan to sell three Handysize vessels and one Jones Act Tug-Barge unit that was inactive. Upon approval of this plan, we classified the Handysize vessels and their related equipment as Long Term Assets Held for Sale, valued at approximately $48.7 million at December 31, 2014. During the first quarter of 2015, we sold one of the Handysize vessels and its equipment and paid off related debt. At March 31, 2015, the remaining two Handysize vessels held for sale were valued at approximately $32.5 million. At such date, we owed approximately $27.0 million under debt incurred to purchase these two vessels, which we plan to pay off if and when we sell such vessels. The Tug-Barge unit and inventory related to the Handysize vessels are classified as Short Term Assets Held for Sale, and were valued at approximately $6.8 million at March 31, 2015 and $7.0 million at December 31, 2014. As a result of these classifications, there was no depreciation expense related to these assets during the first quarter of 2015. If weak dry bulk markets continue to put downward pressure on charter rates or we elect to market other vessels for sale, we might incur additional impairment charges in the future.
During 2014, the Company adopted ASU 2014-8 which changed the definition of discontinued operations. In accordance with this guidance, we determined that the assets held for sale did not represent a strategic shift that would have a major effect on our operations and financial results. As such, we did not report the financial results related to these assets as discontinued operations.
NOTE 8 – INCOME TAXES
We recorded a tax provision of $39,000 on our $5.4 million loss before taxes and equity in net income of unconsolidated entities for the three months ended March 31, 2015. For the first three months of 2014 we recorded an income tax benefit of $882,000 on our $4.0 million of loss before equity in net income of unconsolidated entities. These provision amounts represent our qualifying U.S. flag operations, which continue to be taxed under the “tonnage tax” provisions rather than the normal U.S. corporate income tax provisions, state income taxes paid, and foreign income tax withholdings or refunds. We established a valuation allowance against deferred income tax assets in 2014 because, based on available information, we could not conclude that it was more likely than not that the full amount of deferred income tax assets generated primarily by NOL carryforwards and AMT credits would be realized through the generation of taxable income in the near future. We have and will continue to evaluate the need for a valuation allowance on a quarterly basis. We recorded an increase in our valuation allowance of $730,000 for the three months ending March 31, 2015.
For further information on certain tax laws and elections, see our Annual Report on Form 10-K filed for the year ended December 31, 2014, including Note J - Income Taxes to the consolidated financial statements included therein.
NOTE 9 – COMMITMENTS AND CONTINGENCIES
Commitments
Investment in newbuilding Handysize Dry Bulk Carrier
During the third quarter of 2014, we were notified of the bankruptcy of a ship builder that had agreed to build a new Handysize Dry Bulk Carrier. As a result of this bankruptcy, we collected $4.2 million on January 6, 2015, $3.9 million of which represented a return of our deposit and $0.3 million of which we recognized as interest income.
Contingencies
On June 26, 2014, U.S. Customs and Border Protection (CBP) issued pre-penalty notifications to us and two of our affiliates alleging failure to properly report the importation of spare parts incorporated into our vessels covering the period April 2008 through September 2012. CBP’s proposed duty is approximately $2.1 million along with a proposed penalty on the assessment of approximately $8.4 million. The basis of CBP’s assessment is that the U. S. Government experienced a loss of revenue consisting of the difference between the government’s ad valorem duty and the consumption entry duty actually paid by us. On September 24, 2014, we submitted our formal response to CBP’s claim and denied violating the applicable U.S. statute or regulations. We have not accrued a liability for this matter because we believe it is premature (i) to determine whether an accrual is warranted and (ii) if so, to determine a reasonable estimate of probable liability.
For further information on our commitments and contingencies, see Note K – Commitment and Contingencies to our consolidated financial statements included in our Annual Report on Form 10-K for the year ended December 31, 2014.
12
NOTE 10 – EMPLOYEE BENEFIT PLANS
The following table provides the components of net periodic benefit cost for our pension plan and postretirement benefits plan for the three months ended March 31, 2015 and 2014:
|
(All Amounts in Thousands) |
Pension Plan |
Postretirement Benefits |
||||||||||
|
Three Months Ended March 31, |
Three Months Ended March 31, |
|||||||||||
|
Components of net periodic benefit cost: |
2015 |
2014 |
2015 |
2014 |
||||||||
|
Service cost |
$ |
171 |
$ |
154 |
$ |
8 |
$ |
3 | ||||
|
Interest cost |
359 | 381 | 118 | 145 | ||||||||
|
Expected return on plan assets |
(638) | (655) |
- |
- |
||||||||
|
Amortization of prior service cost |
(1) | (1) | 26 | 25 | ||||||||
|
Amortization of Net Loss |
111 | 63 | 37 | 88 | ||||||||
|
Net periodic benefit cost (benefit) |
$ |
2 |
$ |
(58) |
$ |
189 |
$ |
261 | ||||
We contributed $150,000 to our pension plan for the three months ended March 31, 2015. We expect to contribute an additional $450,000 before December 31, 2015.
NOTE 11 – DERIVATIVE INSTRUMENTS
We use derivative instruments from time to time to manage certain foreign currency and interest rate risk exposures. We do not use derivative instruments for speculative trading purposes. All derivative instruments are recorded on the balance sheet at fair value. For derivatives designated as cash flow hedges, the effective portion of changes in the fair value of the derivative is recorded through other comprehensive income and reclassified to earnings when the derivative instrument is settled. Any ineffective portion of changes in the fair value of the derivative is reported in earnings. None of our derivative contracts contain credit-risk related contingent features that would require us to settle the contract upon the occurrence of such contingency. However, all of our contracts contain clauses specifying events of default under specified circumstances, including failure to pay, breach of agreement, default under the specific agreement to which the hedge relates, bankruptcy, misrepresentation and the occurrence of certain transactions. The remedy for default is settlement in entirety or payment of the fair value of the contracts, which was a liability of $7.1 million in the aggregate for all of our contracts as of March 31, 2015 (see table below). As of March 31, 2015, we were expecting to refinance our Yen-based credit facility with a U.S. dollar facility. Interest payable under the Yen-based loan was fixed after we entered into a variable-to-fixed interest rate swap in 2009. Due to our determination at March 31, 2015 that it was more likely than not that the Yen-based loan would be refinanced, the interest rate swap became totally ineffective at March 31, 2015. As a result, we recorded a $2.8 million charge to derivative loss on our condensed consolidated statement of operations with the offset to other comprehensive loss. For more information on the refinancing of the Yen-based facility, see Note 20 – Subsequent Event. The unrealized loss related to our derivative instruments included in accumulated other comprehensive loss, net of taxes, was $0.6 million and $3.7 million as of March 31, 2015 and December 31, 2014, respectively.
The notional and fair value amounts of our derivative instruments as of March 31, 2015 were as follows:
|
(All Amounts in Thousands) |
Liability Derivatives |
||||
|
Current Notional |
Balance Sheet |
Fair |
|||
|
Amount |
Location |
Value |
|||
|
Interest Rate Swaps - L/T |
$ |
36,594 |
Other Liabilities |
$ |
(2,757) |
|
Foreign Exchange Contracts |
1,800 |
Current Liabilities |
(182) | ||
|
Foreign Exchange Contracts |
28,219 |
Other Liabilities |
(4,154) | ||
|
Total Derivatives designated as hedging instruments |
$ |
66,613 |
$ |
(7,093) | |
13
The effect of derivative instruments designated as cash flow hedges on our condensed consolidated statement of operations for the three months ended March 31, 2015 were as follows:
|
(All Amounts in Thousands) |
Location of |
Amount of |
Gain (Loss) |
||||||
|
Gain (Loss) |
Gain (Loss) |
Gain (Loss) |
Recognized in |
||||||
|
Recognized |
Reclassified from |
Reclassified from |
Income from |
||||||
|
in OCI* |
AOCI** to Income |
AOCI to Income |
Ineffective Portion |
||||||
|
Interest Rate Swaps |
$ |
243 |
Interest Expense |
$ |
484 |
$ |
49 | ||
|
De-Designation of Interest Rate Swaps |
2,859 |
- |
(2,859) | ||||||
|
Foreign Exchange Contracts |
(3) |
Other Revenues |
99 |
- |
|||||
|
Total |
$ |
3,099 |
$ |
583 |
$ |
(2,810) | |||
*Other Comprehensive (Loss) Income
**Accumulated Other Comprehensive Income
Foreign Currency Contracts
From time to time, we enter into foreign exchange contracts to hedge certain firm foreign currency purchase commitments. During 2014, we entered into three forward purchase contracts for Mexican Pesos, which expire in December 2015, two for $900,000 U.S. Dollar equivalents at an average exchange rate of 13.6007 and 13.7503, respectively, and another for $600,000 U.S. Dollar equivalents at an exchange rate of 14.1934. Our Mexican Peso foreign exchange contracts cover approximately 85% of our projected Peso exposure.
Over the past couple of years, we have entered into and extended several forward foreign exchange contracts in order to limit our exposure to fluctuations in the Yen and to provide us with the option to fully pay off our current Yen Facility at an approximate exchange rate of 102.25 to $1.00. The contracts that remain in effect and related agreements with the lender provided us with the option to convert the Yen Facility into a USD-based Facility with the lender at this fixed exchange rate, but otherwise on the same terms and with the same collateral. These particular forward foreign exchange contracts do not qualify for hedge accounting treatment and have thus been accounted for as economic hedges. Please refer to Note 20 – Subsequent Event for information related to the settlement of these hedging contracts.
The following table summarizes the remaining notional values as of March 31, 2015, of these contracts:
|
(All Amounts in Thousands) |
|||||||||
|
Amount Available |
|||||||||
|
Transaction Date |
Type of Currency |
in Dollars |
Effective Date |
Expiration Date |
|||||
|
May-14 |
Yen |
$ |
28,219 |
Jan-15 |
Dec-15 |
||||
|
Sep-14 |
Peso |
675 |
Jan-15 |
Dec-15 |
|||||
|
Oct-14 |
Peso |
675 |
Jan-15 |
Dec-15 |
|||||
|
Dec-14 |
Peso |
450 |
Jan-15 |
Dec-15 |
|||||
|
$ |
30,019 | ||||||||
NOTE 12 – LONG TERM DEBT
We have up to a $95.0 million senior secured credit facility (“Credit Facility”) which is comprised of a term loan facility in the principal amount of $45.0 million and a revolving credit facility (“LOC”) in the principal amount of up to $50.0 million. The LOC includes a $20.0 million sublimit for the issuance of standby letters of credit and a $5.0 million sublimit for swingline loans. The Credit Facility carries an accordion feature, whereby an additional term loan of up to $50.0 million may be advanced subject to certain financial requirements. As of March 31, 2015, we had $41.0 million of borrowings and $7.6 million of letters of credit outstanding under our LOC, leaving approximately $1.4 million of additional borrowing capacity.
Under the Credit Facility, each of our domestic subsidiaries is a joint and several co-borrower. The obligations of all the borrowers under the Credit Facility are secured by all personal property of the borrowers, including the U.S. flagged vessels owned by the Company’s domestic subsidiaries and collateral related to such vessels. Several of our International flagged vessels are pledged as collateral securing several of our other secured debt facilities.
14
The Credit Facility, as amended, includes usual and customary covenants and events of default for credit facilities of its type. Our ability to borrow under the Credit Facility is conditioned upon continued compliance with such covenants, including, among others, (i) covenants that restrict our ability to engage in certain asset sales, mergers or other fundamental changes, to incur liens or to engage in various other transactions or activities and (ii) various financial covenants, including those stipulating as of March 31, 2015 that we maintain a consolidated leverage ratio of 5.0 to 1.0, an EBITDAR to fixed charges ratio of at least 1.05 to 1.0, liquidity of not less than $20.0 million, and a consolidated net worth of not less than the sum of $228.0 million, minus impairment losses, plus 50% of our consolidated net income earned after December 31, 2011, excluding impairment loss, plus 100% of the proceeds of all issuances of equity interests received after December 31, 2011 (with all such terms or amounts as defined in or determined under the Credit Facility).
During the first quarter of 2015, we paid off approximately $13.5 million in debt in connection with the sale of one of our Handysize vessels. Additionally, we wrote off approximately $95,000 of unamortized loan costs associated with the debt instrument which is reflected in loss on extinguishment of debt on our condensed consolidated statement of operations.
We guarantee two separate loan facilities of two separate shipping companies in which one of our wholly-owned subsidiaries has indirect ownership interests. With respect to one of the two loan facilities of these shipping companies, in which our wholly-owned subsidiary indirectly owns a 25% interest, we guarantee 5% of the amount owed under the loan facility. As of March 31, 2015 and December 31, 2014, this guarantee obligation equated to approximately $3.6 million, respectively. The amount of this guarantee reduces semi-annually by approximately $165,000 through December 2018. Under the second facility, in which our wholly-owned subsidiary indirectly owns approximately 23.7% of the borrower, we guarantee only $1.0 million of the approximately $11.0 million loan facility. This second guarantee is non-amortizing and is scheduled to expire in December 2018. In December 2017, we anticipate that this guarantee will be reduced from $1.0 million to $510,000 as a result of a scheduled payment of a portion of the facility.
As of the dates indicated below, long-term debt consisted of the following:
|
(All Amount in Thousands) |
Interest Rate |
Total Principal Due |
|||||||||||
|
March 31, |
December 31, |
Maturity |
March 31, |
December 31, |
|||||||||
|
Description of Secured Debt |
2015 |
2014 |
Date |
2015 |
2014 |
||||||||
|
Notes Payable – Variable Rate 1 |
2.7703 |
% |
2.7471 |
% |
2018 |
$ |
11,166 |
$ |
12,025 | ||||
|
Notes Payable – Variable Rate |
2.675-2.714 |
% |
2.7312-2.7324 |
% |
2018 |
26,986 | 41,400 | ||||||
|
Notes Payable – Variable Rate |
2.5219 |
% |
2.5050 |
% |
2017 |
8,584 | 9,144 | ||||||
|
Notes Payable – Variable Rate 1 |
2.7561 |
% |
2.7350 |
% |
2018 |
15,080 | 15,394 | ||||||
|
Notes Payable – Variable Rate 2 |
3.6100 |
% |
3.6100 |
% |
2020 |
24,020 | 24,812 | ||||||
|
Notes Payable – Variable Rate 3 |
4.0100 |
% |
3.9900 |
% |
2018 |
41,063 | 41,906 | ||||||
|
Notes Payable – Fixed Rate 4 |
4.3500 |
% |
4.3500 |
% |
2020 |
37,019 | 37,759 | ||||||
|
Notes Payable – Variable Rate 5 |
2.9220 |
% |
2.9195 |
% |
2021 |
21,120 | 21,943 | ||||||
|
Note Payable - Mortgage 6 |
5 | 5 | |||||||||||
|
Line of Credit 3 |
3.9700 |
% |
3.9100 |
% |
2018 |
41,000 | 38,500 | ||||||
| 226,043 | 242,888 | ||||||||||||
|
Less: Current Maturities |
(22,412) | (23,367) | |||||||||||
|
$ |
203,631 |
$ |
219,521 | ||||||||||
|
1. |
We entered into a variable rate financing agreement with ING Bank N.V., London branch in June 2011 for a seven year facility to finance the acquisition of a Capesize vessel and a Supramax Bulk Carrier newbuilding, both of which we acquired a 100% interest in as a result of our acquisition of Dry Bulk. Pursuant to the terms of the facility, the lender agreed to provide a secured term loan facility divided into two tranches: Tranche A, fully drawn in June 2011 in the amount of $24.1 million, and Tranche B, providing up to $23.3 million of additional credit. Under Tranche B, we drew $6.1 million in November 2011 and $12.7 million in January 2012. |
|
2. |
We have an interest rate swap agreement in place to fix the interest rate on our variable rate note payable expiring in 2020 at 2.065%. After applicable margin adjustments, the effective interest rate on this note payable is fixed at 5.565%. The swap agreement is for the same term as the associated note payable. |
|
3. |
As described in greater detail above, our senior secured Credit Facility matures on September 24, 2018 and includes a term loan facility in the principal amount of $45 million and a LOC in the principal amount up to $50 million. The LOC facility includes a $20 million sublimit for the issuance of standby letters of credit and a $5 million sublimit for swingline loans. |
|
4. |
We entered into a fixed rate financing agreement with DVB Bank SE, on August 26, 2014 in the amount of $38.5 million, collateralized by our 2007 PCTC at a rate of 4.35% with 24 quarterly payments with a final balloon payment of $20.7 million
15
|
in August 2020. This loan requires us to pre-fund a one-third portion of the upcoming quarterly scheduled debt payment, which, at March 31, 2015, constituted $0.4 million and is included as restricted cash on the balance sheet. |
|
5. |
During August 2014, we paid off our $11.4 million loan with DnB ASA and obtained a new loan with RBS Asset Finance in the amount of $23.0 million collateralized by one of our 1999 PCTCs at a variable rate of 30 day Libor rate plus 2.75% payable in 84 monthly installments with the final payment due August 2021. |
|
6. |
Represents consideration given in connection with the proposed construction financing relating to the building we plan to renovate as our new New Orleans headquarters building. |
All of our principal credit agreements and operating leases require us to comply with various loan covenants, including financial covenants that require minimum levels of net worth, working capital, liquidity, and interest expense or fixed charges coverage and a maximum amount of debt leverage.
Effective September 30, 2014, certain of our lenders and lessors agreed at our request to adjust our covenants to less stringent levels to provide relief from the accounting impact of approximately $11.3 million in deferred gains resulting from the September 2014 vessel purchase and refinancing transactions. Two of our lenders have elected to adjust our definition of EBITDA to disregard the impact of these transactions, while the remainder of our lenders and lessors agreed to amend the consolidated leverage and fixed charge coverage ratios to require us to maintain (i) a consolidated leverage ratio of 5.00 to 1.0 through the fiscal quarter ending December 31, 2015, then 4.75 to 1.0 through the fiscal quarter ending March 31, 2016, then 4.50 to 1.0 beginning the quarter ending June 30, 2016 through the quarter ending September 30, 2016, and 4.25 to 1.0 thereafter and (ii) a minimum fixed charge coverage ratio of 1.10 to 1.0 beginning with the quarter ending September 30, 2014 through the quarter ending December 31, 2014, 1.15 to 1.0 beginning with the quarter ending March 31, 2015 through the quarter ending December 31, 2015, 1.20 to 1.0 beginning with the quarter ending March 31, 2016 through the quarter ending June 30, 2016, and 1.25 to 1.0 thereafter (in each case as calculated under our amended debt agreements).
During the first quarter of 2015, there was concern that we would be unable to meet all of our required debt covenants. As such, we received waivers from our lenders and lessors for certain covenants contained in our financing and lease agreements. We received permission from certain lenders and lessors to incur up to $15 million in additional indebtedness for general corporate purposes. We also received from certain lenders and lessors permission to incur additional indebtedness in connection with the refinancing of a foreign currency loan facility and our payoff of a related foreign currency interest rate swap. We received from certain lenders and lessors a restatement of the fixed charge coverage ratio to a minimum 1.05 to 1.0 for the fiscal year 2015, 1.15 to 1.0 beginning with the quarter ending March 31, 2016, and 1.20 to 1.0 beginning with the quarter ending June 30, 2016 and for all periods thereafter. The manner in which this fixed charge coverage ratio is determined and calculated differs under our various loan or lease agreements. Two other lenders provided short-term relief by agreeing to amend, for 2015 only, the manner in which the leverage ratio will be calculated under the relevant agreement. As a result of these waivers and concessions granted early this year, we were in compliance with all of our debt covenants as of March 31, 2015.
Based on current conditions and our expectations that our performance will stabilize or improve marginally in the near term, we currently believe that we will be able to attain all of our financial covenants for the next twelve months, but we cannot assure you of this.
In addition to the restrictions under our Credit Facility, certain of our loan agreements restrict the ability of our subsidiaries to dispose of collateralized assets or any other asset which is substantial in relation to our assets taken as a whole without the approval from the lender. We believe that we have consistently remained in compliance with this provision of these loan agreements.
During the second quarter of 2015, the Company refinanced its Yen-based credit facility and settled the related interest rate swap and foreign exchange contracts. For more information on the refinance, see Note 20 – Subsequent Event.
Liquidity and Covenant Compliance
Beginning in the fourth quarter of fiscal year 2014, we commenced a plan to evaluate our liquidity and capital resource needs for fiscal year 2015. Our plan included the reduction of our quarterly cash dividend on common stock and the identification of five non-performing assets that were approved for sale by our Board of Directors during the fourth quarter of 2014 and classified as Assets Held for Sale on our December 31, 2014 balance sheet. Additionally, in the fourth quarter of 2014, we completed the renewal of our contract with TEC. As a result of this contract renewal and the impairment recorded on one of our assets held for sale, we evaluated the recoverability of our deferred tax assets and concluded that it is more likely than not that we will not recognize the benefits of our federal tax attributes and therefore, recorded a valuation allowance on our deferred tax assets during the fourth quarter of 2014. We recorded an increase in this valuation allowance of $730,000 for the three months ended March 31, 2015.
One of our held for sale assets was sold prior to December 31, 2014 and on March 5, 2015, we finalized the sale of one of the four remaining held for sale assets. We are actively marketing the remaining three assets. The estimated proceeds from the remaining three assets held for sale are an integral part to our compliance with our minimum liquidity requirements. Additionally, to generate
16
additional liquidity, we could sell unencumbered vessels in our fleet and defer capital expenditures and dry docking costs that are not required until 2016.
We are also currently in discussions with our creditors to refinance certain unencumbered assets for approximately $12.0 million, and we believe this will be executed by the end of the second quarter of 2015. In addition to this amendment, we are also in the process of obtaining bank financing for approximately $6.9 million which will go towards the construction and renovation of our future corporate office in New Orleans. We anticipate closing this financing by the end of the second quarter of 2015. In addition to the $6.9 million in bank financing, we have received approximately $4.6 million in incentives from the State of Louisiana and expect to receive another $0.6 million of incentives during 2015 which will offset part of the cost of constructing the new corporate office. The remaining cost of approximately $6.9 million to complete the construction of the building will be funded by cash on hand. If we are unsuccessful in refinancing certain unencumbered assets, we could re-market our requests with other interested parties, seek loan refinancing to further monetize asset values on other vessels, or attempt to access the equity markets under our current open shelf registration. The timing and success of our financing activities cannot be assured.
Failure to execute our plan could impact our ability to be in compliance with our quarterly debt covenants in 2015 and could cause us to suffer an event of default, which could, among other things, accelerate our obligations under any such agreement or preclude us from making future borrowings. Moreover, because our debt obligations are represented by separate agreements with different lenders, in some cases any breach of these covenants or any other default under one agreement may create an event of default under other agreements, resulting in the acceleration of our obligation to pay principal, interest and potential penalties under such other agreements (even though we may otherwise be in compliance with all of our obligations under those agreements). An event of default under a single agreement , including one that is technical in nature or otherwise not material, could result in the acceleration of our debt obligations under multiple lending agreements. The acceleration of any or all amounts due under our debt agreements or the loss of the ability to borrow under our revolving credit facility or other debt agreements could have a material adverse effect on our business, financial condition, results of operations and cash flows. In the event of non-compliance with our debt covenants, we would seek to amend the covenants, obtain waivers from each of our lenders in order to cure any instances of non-compliance, or sell vessels that are currently unencumbered by debt or that serve as collateral against our outstanding debt obligations. The disposition of one or more of these vessels would provide us with additional liquidity and capital resources that could be used to pay down the balances owed under our current debt obligations.
NOTE 13 – OTHER LONG TERM LIABILITIES
Other Long Term Liabilities as of March 31, 2015 and December 31, 2014 were $49.0 million and $50.3 million, respectively.
|
(All Amounts in Thousands) |
March 31, |
December 31, |
|||
|
2015 |
2014 |
||||
|
Deferred Gains, net of Amortization |
$ |
16,970 |
$ |
17,917 | |
|
Pension and Post Retirement |
12,221 | 12,497 | |||
|
Alabama Lease Incentive |
5,452 | 5,739 | |||
|
Insurance Reserves |
5,319 | 4,941 | |||
|
Derivatives |
6,911 | 7,050 | |||
|
Deferred Tax Liability |
235 | 408 | |||
|
Other |
1,862 | 1,732 | |||
|
$ |
48,970 |
$ |
50,284 | ||
NOTE 14 – STOCK BASED COMPENSATION
We grant stock-based compensation in the form of (1) unrestricted stock awards to our outside directors and (2) restricted stock units (“RSUs”) to key executive personnel. RSUs are granted in a combination of time based and performance based units. These awards are granted under the International Shipholding Corporation 2011 Stock Incentive Plan (the “Plan”), which was approved by our stockholders in 2011. In the first quarter of 2015, we granted 8,100 unrestricted shares to its outside directors and 42,650 RSUs to key executive personnel. Additionally, during the first quarter of 2015, our key executive personnel forfeited 37,700 shares from certain performance based RSUs granted in 2012 and 2014 and modified awards originally granted in 2013. Our total compensation expense related to these plans was approximately $2,000 and $447,000 for the three months ended March 31, 2015 and 2014, respectively, which is reflected in administrative and general expenses.
17
NOTE 15 – STOCKHOLDERS’ EQUITY
A summary of the changes in Stockholders’ equity for the three months ended March 31, 2015, is as follows:
|
(All Amounts in Thousands) |
Stockholders' |
||||
|
Equity |
|||||
|
Balance at December 31, 2014 |
$ |
267,610 | |||
|
Net Loss |
(4,501) | ||||
|
Common Stock Dividends* |
(1,862) | ||||
|
Preferred Stock Dividends |
(1,305) | ||||
|
Unrealized Foreign Currency Translation Gain |
(61) | ||||
|
Net Change in Fair Value of Derivatives |
240 | ||||
|
De-Designation of Interest Rate Swap |
2,859 | ||||
|
Net Change in Funding Status of Defined Benefit Plan |
304 | ||||
|
Issuance of stock-based compensation |
2 | ||||
|
Balance at March 31, 2015 |
$ |
263,286 | |||
*Includes approximately $34,000 of dividends accrued but not paid during the period with respect to unvested equity incentive awards.
Stock Repurchase Program
On January 25, 2008, our Board of Directors approved a share repurchase program for up to a total of 1,000,000 shares of our common stock. We expect that any share repurchases under this program will be made from time to time for cash in open market transactions at prevailing market prices. The timing and amount of any purchases under the program will be determined by management based upon market conditions and other factors. In 2008, we repurchased 491,572 shares of our common stock for $11.5 million. Thereafter, we suspended repurchases until the second quarter of 2010, when we repurchased 223,051 shares of our common stock for $5.2 million. Unless and until our Board of Directors otherwise provides, this authorization will remain open indefinitely, or until we reach the approved 1,000,000 share limit. As of March 31, 2015, the maximum number of shares that may yet be purchased under the Plan was 285,377 shares.
Dividend Payments
The payment of dividends to common stockholders and preferred stockholders is at the discretion and subject to the approval of our Board of Directors. On October 29, 2008, our Board of Directors authorized the reinstitution of a quarterly cash common stock dividend program beginning in the fourth quarter of 2008. Since then, the Board of Directors has declared a cash common stock dividend each quarter.
During the three months ended March 31, 2015, we paid cash dividends on our common stock as follows:
|
(All Amounts in Thousands Except per Share Data) |
||||||||||
|
Declaration Date |
Record Date |
Payment Date |
Per Share Amount |
Total Dividend Paid |
||||||
|
7-Jan-15 |
19-Feb-15 |
4-Mar-15 |
$ |
0.25 |
$ |
1,828 | ||||
During the three months ended March 31, 2015, we paid cash dividends on our Series A and Series B Cumulative Perpetual Preferred Stock as follows:
|
(All Amounts in Thousands Except per Share Data) |
||||||||||||
|
Declaration Date |
Record Date |
Series |
Payment Date |
Per Share Amount |
Total Dividend Paid |
|||||||
|
7-Jan-15 |
29-Jan-15 |
A |
30-Jan-15 |
$ |
2.375 |
$ |
594 | |||||
|
7-Jan-15 |
29-Jan-15 |
B |
30-Jan-15 |
$ |
2.250 |
$ |
711 | |||||
|
$ |
1,305 | |||||||||||
18
NOTE 16 – LOSS PER SHARE
Basic earnings per share is computed by dividing net income available to common stockholders by the weighted average number of common shares outstanding during the period. Diluted earnings per share is computed in the same manner as basic earnings per share except that the denominator is increased to include the number of additional common shares that could have been outstanding assuming the exercise of the conversion of restricted stock units. We had net losses attributable to common stockholders for the three months ending March 31, 2015 and 2014; therefore, the impact of any incremental shares issuable under our outstanding restricted stock units because the net loss with respect to such shares would have been anti-dilutive.
NOTE 17 – FAIR VALUE MEASUREMENTS
ASC 820 defines fair value as the price that would be received to sell an asset or paid to transfer a liability in an orderly transaction between market participants. A fair value measurement assumes the transaction to sell the asset or transfer the liability occurs in the principal market for the asset or liability or, in the absence of a principal market, the most advantageous market for the asset or liability. Under ASC 820, the price in the principal (or most advantageous) market used to measure the fair value of the asset or liability is not adjusted for transaction costs. An orderly transaction is a transaction that assumes exposure to the market for a period prior to the measurement date to allow for marketing activities that are usual and customary for transactions involving such assets and liabilities; it is not a forced transaction. Market participants are buyers and sellers in the principal market that are (i) independent, (ii) knowledgeable, and (iii) able and willing to complete a transaction.
Fair value measurements require the use of valuation techniques that are consistent with one or more of the following: the market approach, the income approach or the cost approach. The market approach uses prices and other relevant information generated by market transactions involving identical or comparable assets and liabilities. The income approach uses valuation techniques to convert future amounts, such as cash flows or earnings, to a single present value on a discounted basis. The cost approach is based on the amount that currently would be required to replace the service capacity of an asset (replacement cost). Valuation techniques should be consistently applied. The fair value of our interest rate swap agreements is based upon the approximate amounts required to settle the contracts. Inputs to valuation techniques refer to the assumptions that market participants would use in pricing the asset or liability. Inputs may be observable, meaning those that reflect the assumptions market participants would use in pricing the asset or liability developed based on market data obtained from independent sources, or unobservable, meaning those that reflect the reporting entity's own assumptions about the assumptions market participants would use in pricing the asset or liability developed based on the best information available under the circumstances. In that regard, ASC 820 establishes a fair value hierarchy for valuation inputs that gives the highest priority to quoted prices in active markets for identical assets or liabilities and the lowest priority to unobservable inputs. The fair value hierarchy is as follows:
|
· |
Level 1 Inputs - Unadjusted quoted prices in active markets for identical assets or liabilities that the reporting entity has the ability to access at the measurement date. |
|
· |
Level 2 Inputs - Inputs other than quoted prices included in Level 1 that are observable for the asset or liability, either directly or indirectly. These might include quoted prices for similar assets or liabilities in active markets, quoted prices for identical or similar assets or liabilities in markets that are not active, inputs other than quoted prices that are observable for the asset or liability (including interest rates, volatilities, prepayment speeds, credit risks) or inputs that are derived principally from or corroborated by market data by correlation or other means. |
|
· |
Level 3 Inputs - Unobservable inputs for determining the fair values of assets or liabilities that reflect an entity's own assumptions about the assumptions that market participants would use in pricing the assets or liabilities. |
The following table summarizes our financial assets and financial liabilities measured at fair value on a recurring and non-recurring basis as of March 31, 2015 and December 31, 2014, segregated by the above-described levels of valuation inputs:
|
(All Amounts in Thousands) |
March 31, 2015 |
|||||||||||
|
Level 1 Inputs |
Level 2 Inputs |
Level 3 Inputs |
Total Fair Value |
|||||||||
|
Derivative Liabilities |
$ |
- |
$ |
(7,093) |
$ |
- |
$ |
(7,093) | ||||
|
(All Amounts in Thousands) |
December 31, 2014 |
|||||||||||
|
Level 1 Inputs |
Level 2 Inputs |
Level 3 Inputs |
Total Fair Value |
|||||||||
|
Derivative Liabilities |
$ |
- |
$ |
(7,348) |
$ |
- |
$ |
(7,348) | ||||
The carrying amounts of our accounts receivable, accounts payable and accrued liabilities approximated their fair value at March 31, 2015 and December 31, 2014. We estimated the fair value of our variable rate long-term debt at March 31, 2015, including current
19
maturities, to equal approximately $227.9 million due to the variable rate nature of the debt as well as to the underlying value of the collateral. We have determined that credit risk is not a material factor.
NOTE 18 – NEW ACCOUNTING PRONOUNCEMENTS
In February 2015, the FASB issued ASU 2015-02 “Amendments to the Consolidation Analysis”. The amendments in ASU 2015-02 affect reporting entities that are required to evaluate whether they should consolidate certain legal entities. ASU 2015-02 will be effective for fiscal years and interim periods within those fiscal years, beginning after December 15, 2015, with early adoption permitted. The adoption of ASU 2015-02 is not expected to have material impact on our consolidated financial statements.
In April 2015, the FASB issued ASU 2015-03 “Simplifying the Presentation of Debt Issuance Costs”. The amendments in this Update require that debt issuance costs related to a recognized debt liability be presented in the balance sheet as a direct deduction from the carrying amount of that debt liability, consistent with debt discounts. The recognition and measurement guidance for debt issuance costs are not affected by the amendments in this Update. ASU 2015-03 will be effective for financial statements issued for fiscal years beginning after December 15, 2015, and interim periods within those fiscal years, with early adoption permitted. Management is currently in the process of evaluating the impact of this amendment.
Management reviewed all other significant newly issued accounting pronouncements and concluded that they are either not applicable to our business or that we do not expect their future adoption to have a material effect is expected on our condensed consolidated financial statements.
NOTE 19 – CHANGE IN ACCOUNTING ESTIMATE
Based on company policy, we review the reasonableness of our salvage values every three years based on the most recent three year average price of scrap steel per metric ton. In the first quarter of 2015, we reviewed and adjusted the salvage values based on changes in the market value of scrap steel. This adjustment resulted in a decrease in salvage values of approximately $0.6 million. The impact of this adjustment on depreciation expense for the first quarter of 2015, as well as for future periods, was immaterial.
NOTE 20 – SUBSEQUENT EVENT
On April 24, 2015, we entered into a new loan agreement with DVB Bank SE in the amount of $32.0 million by refinancing our 2010 built PCTC. We received the loan proceeds on April 24, 2015 and applied them as follows: (i) $28.1 million to pay off an outstanding Yen facility in the amount of 2.9 billion Yen and the related Yen forward contract and (ii) $2.9 million to settle a Yen denominated interest rate swap. Under the new DVB loan agreement, interest will be payable at a fixed rate of 4.16% with the principal being paid quarterly over a five-year term based on an amortization of ten years with a final quarterly balloon payment of $16.8 million due on April 22, 2020. As part of the settlement of the interest rate swap, we recorded a derivative loss of $2.8 million in the first quarter of 2015, which was previously classified as an unrecognized loss in Other Accumulated Comprehensive Income. We anticipate additional losses in the second quarter of 2015 of approximately $0.5 million as a result of the early debt payoff and related derivative settlement.
20
Item 2 – Management’s Discussion and Analysis of Financial Condition and Results of Operations
Forward-Looking Statements
This report and other documents filed or furnished by us under the federal securities laws include, and future oral or written statements or press releases by us and our management may include, forward-looking statements within the meaning of the safe harbor provisions of the Private Securities Litigation Reform Act of 1995, and as such may involve known and unknown risks, uncertainties, and other factors that may cause our actual results to be materially different from the anticipated future results expressed or implied by such forward-looking statements. Forward-looking statements may include the words “may,” “will,” “estimate,” “intend,” “continue,” “believe,” “expect,” “plan,” “anticipate,” “project,” “seek,” “hope,” “should,” or “could” and similar words.
Such forward-looking statements include, without limitation, statements regarding (1) anticipated future operating and financial performance, financial position and liquidity, growth opportunities and growth rates, acquisition and divestiture opportunities, business prospects, regulatory and competitive outlook, investment plans or results, strategic alternatives, business strategies, and other similar statements of expectations or objectives; (2) our plans for operating the business and using cash, including our pricing, investment, expenditure and cash deployment plans; (3) our projected ability to deploy vessels in the spot market, under medium to long-term contracts, or otherwise; (4) our outlook on prevailing vessel time charter and voyage rates, including estimates of the impact of dry cargo fleet supply or demand on time charter and voyage rates; (5) estimated fair values of capital assets, the recoverability of the cost of those assets, the estimated future cash flows attributable to those assets, and the appropriate discounts to be applied in determining the net present values of those estimated cash flows; (6) estimated scrap values of assets; (7) estimated proceeds from selling assets and the anticipated cost of constructing or purchasing new or existing vessels; (8) estimated fair values of financial instruments, such as interest rate and currency swap agreements; (9) estimated losses under self-insurance arrangements; (10) estimated gains or losses on certain contracts, trade routes, lines of business or asset dispositions; (11) estimated outcomes of, or losses attributable to litigation; (12) estimated obligations, and the timing thereof, relating to vessel repair or maintenance work; (13) the adequacy of our capital resources and the availability of additional capital resources on commercially acceptable terms; (14) our ability to remain in compliance with applicable regulations; (15) anticipated trends in supplemental cargoes; (16) anticipated trends in government spending, funding, or appropriations; (17) our ability to effectively service our debt or meet the financial covenants contained in our debt and lease agreements; (18) financing opportunities and sources (including the impact of financings on our financial position, financial performance or credit ratings); (19) changes in laws, regulations or tax rates, or the outcome of pending legislative or regulatory initiatives; and (20) assumptions underlying any of the foregoing.
Our forward-looking statements are based on our judgment and assumptions as of the date such statements are made concerning future developments and events, many of which are beyond our control. These forward-looking statements, and the assumptions upon which they are based, are inherently speculative and are subject to a number of risks and uncertainties.
Factors that could cause our actual results to differ materially from our expectations include our ability to:
|
· |
maximize the usage of our vessels and other assets on favorable economic terms, including our ability to (i) renew our time charters and other contracts when they expire, (ii) maximize our carriage of supplemental cargoes and (iii) improve the return on our international flag dry bulk fleet if and when market conditions improve; |
|
· |
timely and successfully respond to competitive or technological changes affecting our markets; |
|
· |
effectively handle our leverage by servicing and complying with each of our debt instruments, thereby avoiding any defaults under those instruments and avoiding cross defaults under others; |
|
· |
secure financing on satisfactory terms to repay existing debt or support operations, including to acquire, modify, or construct vessels if such financing is necessary to service the potential needs of current or future customers; |
|
· |
successfully retain and hire key personnel, and successfully negotiate collective bargaining agreements with our maritime labor unions on reasonable terms without work stoppages; |
|
· |
pay preferred or common stock dividends declared by our Board of Directors, the payments or declaration of which may be affected by changes in, among other things, our cash requirements, spending plans, business strategies, cash flows or financial position; |
|
· |
procure adequate insurance coverage on acceptable terms; and |
|
· |
manage the amount and rate of growth of our operating, capital, administrative and general expenses. |
21
Other factors that could cause our actual results to differ materially from our expectations include, without limitation:
|
· |
changes in domestic or international transportation markets that reduce the demand for shipping generally or our vessels in particular; |
|
· |
industry-wide changes in cargo freight rates, charter rates, vessel design, vessel utilization or vessel valuations, or in charter hire, fuel or other operating expenses; |
|
· |
unexpected out-of-service days on our vessels whether due to drydocking delays, unplanned maintenance, accidents, equipment failures, adverse weather, natural disasters, piracy or other causes; |
|
· |
the rate at which competitors add or scrap vessels, as well as demolition scrap prices and the availability of scrap facilities in the areas in which we operate; |
|
· |
the possibility that the anticipated benefits from corporate or vessel acquisitions cannot be fully realized or may take longer to realize than expected. |
|
· |
political events in the United States and abroad, including terrorism, piracy and trade restrictions, and the response of the U.S. and other nations to those events; |
|
· |
election results and the appropriation of funds by the U.S. Congress, including the impact of any further cuts to federal spending similar to the “sequestration” cuts; |
|
· |
changes in foreign currency exchange rates or interest rates; |
|
· |
changes in laws and regulations, including those related to government assistance programs, inspection programs, trade controls, quarantines and protection of the environment; |
|
· |
our continued access to credit on favorable terms; |
|
· |
the ability of customers to fulfill their obligations with us, including the timely receipt of payments by the U.S. government; |
|
· |
the performance of our unconsolidated subsidiaries, revenue sharing agreements, and joint ventures; |
|
· |
the impact on our financial statements of nonrecurring accounting charges that may result from, among other things, our ongoing evaluation of business strategies, asset valuations, and organizational structures; |
|
· |
the frequency and severity of claims against us, and unanticipated outcomes of current or possible future legal proceedings; and |
|
· |
the effects of more general factors such as changes in tax laws or rates, in accounting policies or practices, in medical or pension costs, or in general market, labor or economic conditions. |
These and other uncertainties related to our business are described in greater detail in Item 1A of our Annual Report on Form 10-K for the year ended December 31, 2014.
Due to these uncertainties, we cannot assure that we will attain our anticipated results, that our judgments or assumptions will prove correct, or that unforeseen developments will not occur. Accordingly, you are cautioned not to place undue reliance upon any of our forward-looking statements, which speak only as of the date made. Additional risks that we currently deem immaterial or that are not presently known to us could also cause our actual results to differ materially from those expected in our forward-looking statements. We undertake no obligation to update or revise for any reason any forward-looking statements made by us or on our behalf, whether as a result of new information, future events or developments, changed circumstances or otherwise. Furthermore, any information about our intentions contained in any of our forward-looking statements reflects our intentions as of the date of such forward-looking statement, and is based upon, among other things, the existing industry and competitive conditions, regulatory environment and economic and market conditions, and our assumptions as of such date. We may change our intentions, strategies or plans (including our dividend plans) at any time and without notice, based upon any changes in such factors, in our assumptions or otherwise.
22
Executive Summary
Overview of First Quarter 2015
Overall Strategy
The company operates a diversified fleet of U.S. and foreign flag vessels that provide international and domestic maritime transportation services to commercial and governmental customers primarily under medium to long-term contracts. Our business strategy consists of identifying growth opportunities as market needs change, utilizing our extensive experience to meet those needs, maintaining a diverse portfolio of medium to long-term contracts, and maintaining strong relations with our long-standing customer base by providing quality transportation services.
Overview
In spite of the weak dry bulk rates and unexpected off-hire days in our UOS Gulf of Mexico service, gross voyage profit increased from $10.0 million in the first quarter of 2014 to $11.5 million for the same period in 2015. Stronger than expected supplemental cargoes, improved results from our equity investments and settlement of a prior year claim more than offset the weaker market conditions. Our total fixed revenues decreased from $54.9 million in the first quarter of 2014 to $51.3 for the first three months of 2015, primarily due to an increase in off-hire days in our UOS Gulf of Mexico service. Our variable revenues decreased by $1.0 million year over year, principally due to lower dry bulk rates from our Handysize and Supramax vessels, partially offset by our supplemental cargoes.
As previously disclosed in our 2014 Form 10-K, we have marketed for sale our three Handysize vessels and one laid up tug-barge unit and incurred certain impairment charges in connection therewith. In the first quarter of 2015, we sold one of the Handysize vessels and generated approximately $2.9 million in cash after the settlement of the related debt. We plan to continue to market the remaining vessels for sale. If weak dry bulk markets continue to put downward pressure on vessel values or we elect to market other vessels for sale, we might incur additional impairment charges in the future.
In the first quarter of 2015, we received approximately $4.2 million from the cancellation of a shipbuilding contract due to failure of the shipyard to comply with the contract terms. Also during the first quarter of 2015, we received from the U.S. Military Sealift Command (“MSC”) approximately $0.9 million in settlement of MSC’s early termination in 2012 of its time charter of our ice-strengthened multi-purpose vessel, which we have successfully redeployed under a long-term bareboat charter.
Because of the overall condition of the global economy in general, and the marine transportation industry specifically, we continue to test our long-lived assets quarterly to determine whether or not the aggregate fair value of the vessels in each of our segments (based upon projected segment undiscounted cash flows) exceed each of our segment vessels’ aggregate carrying amounts. Based on our most recent assessment, we determined that no impairments existed as of March 31, 2015. As of this date, the total aggregated fair value of the vessels that we own, based on the appraisal of each vessel, was $456.9 million, as compared to the total aggregated net book value of $389.5 million.
Consolidated Financial Performance – First Quarter 2015 vs. First Quarter 2014
Overall, our net loss increased from $3.2 million in the first quarter of 2014 to a net loss of $4.5 million in the first quarter of 2015. Excluding the impact of a $2.8 million derivative loss in the first quarter of 2015 due to the early settlement of an interest rate swap in connection with the refinancing of our Yen-based facility to a USD-based facility and a $1.4 million gain from the settlement of MSC’s contract termination, our net loss for the first quarter of 2015 would have been $3.1 million. Operating income improved from a loss of $2.3 million in 2014 to approximately breakeven in 2015. Our tax expense increased year over year by approximately $0.9 million due to recognition of a valuation allowance on our deferred tax assets beginning at December 31, 2014. Our investment in unconsolidated entities improved by $1.0 million and was due to improved results from our interest in mini-bulkers and results from the Chemical and Asphalt Tankers that began service in the middle of 2014. Other items of note include:
|
§ |
Increase in consolidated gross voyage profit of $1.5 million primarily due to increases in our Specialty segment results. |
|
§ |
Decrease in administrative and general expenses due to lower stock incentive expenses. |
|
§ |
Improved results from our existing equity investments as well as additional income from investments that began service in the second half of 2014. |
|
§ |
Increase of $0.5 million in interest cost due to financing of a 2007 PCTC purchased in the third quarter of 2014. |
|
§ |
Total cash available of $21.8 million. |
|
§ |
Decrease in total debt of $16.8 million from December 31, 2014 to March 31, 2015 primarily due to the payoff of debt related to the Handysize vessel that was sold in the first quarter of 2015. |
23
Segment Performance – First Quarter 2015 vs. First Quarter 2014
Jones Act
|
§ |
Decrease in gross voyage profit of $2.0 million primarily due to increased off-hire days and lower voyage freight rates in our UOS Gulf of Mexico service. |
Pure Car Truck Carriers
|
§ |
Increase in gross voyage profits of $1.7 million primarily due to stronger supplemental cargoes. |
Dry Bulk Carriers
|
§ |
Decrease in gross voyage profits of $0.3 million. |
|
§ |
Results driven by lower dry bulk rates partially offset by the performance from our Capesize vessel’s medium term time charter contract and unconsolidated entities. |
Rail-Ferry
|
§ |
Decrease in gross voyage profits of $0.4 million was driven by lower northbound cargo volume. |
Specialty Contracts
|
§ |
Increase in gross voyage profits of $2.5 million primarily due to the above-described MSC claim settlement and our recent investment in two unconsolidated entities owning two Asphalt and two Chemical Tankers. |
Financial Discipline & Balance Sheet
|
§ |
Total cash of $21.8 million at March 31, 2015. |
|
§ |
Cash generated by operating activities of $1.9 million for the three months ended March 31, 2015. |
|
§ |
Working capital of $6.4 million at March 31, 2015. |
|
§ |
Approximately $1.4 million of borrowing capacity available on our line of credit at March 31, 2015. |
24
The following table lists the 54 vessels in our operating fleet as of March 31, 2015, 20 of which are owned by our wholly-owned subsidiaries:
|
Bareboat |
Deadweight |
|||||||||
|
Year |
Business |
Charter/ |
Operating |
Partially |
Carrying |
|||||
|
Vessels |
Built |
Segment (1) |
Owned |
Leased |
Contracts |
Owned |
Capacity (MT) |
|||
| 1 |
ENERGY ENTERPRISE |
BELT SELF-UNLOADING BULK CARRIER |
1983 |
Jones Act |
X |
38,847 |
||||
| 2 |
SULPHUR ENTERPRISE |
MOLTEN SULPHUR CARRIER |
1994 |
Jones Act |
X |
27,678 |
||||
| 3 |
|
COASTAL 303/ALABAMA ENTERPRISE |
ATB TUG/BARGE UNIT |
1973/1981 |
Jones Act |
X |
|
|
|
23,314 |
| 4 |
NAIDA RAMIL/PEGGY PALMER |
ATB TUG/BARGE UNIT (2) |
1994/1981 |
Jones Act |
X |
34,367 |
||||
| 5 |
|
COASTAL 101/LOUISIANA ENTERPRISE |
ATB TUG/BARGE UNIT |
1973/1984 |
Jones Act |
X |
|
|
|
33,529 |
| 6 |
|
COASTAL 202/FLORIDA ENTERPRISE |
ITB TUG/BARGE UNIT |
1977 |
Jones Act |
X |
|
|
|
33,220 |
| 7 |
TEXAS ENTERPRISE |
BULK CARRIER |
1981 |
Jones Act |
X |
37,061 |
||||
| 8 |
MISSISSIPPI ENTERPRISE |
BULK CARRIER |
1980 |
Jones Act |
X |
37,244 |
||||
| 9 |
ROSIE PARIS |
HARBOR TUG |
1974 |
Jones Act |
X |
N/A |
||||
| 10 |
GREEN BAY |
PURE CAR/TRUCK CARRIER |
2007 |
PCTC |
X |
18,090 |
||||
| 11 |
GREEN COVE |
PURE CAR/TRUCK CARRIER |
1999 |
PCTC |
X |
22,747 |
||||
| 12 |
GREEN DALE |
PURE CAR/TRUCK CARRIER |
1999 |
PCTC |
X |
16,157 |
||||
| 13 |
GREEN LAKE |
PURE CAR/TRUCK CARRIER |
1998 |
PCTC |
X |
22,799 |
||||
| 14 |
GREEN POINT |
PURE CAR/TRUCK CARRIER |
1994 |
PCTC |
X |
14,930 |
||||
| 15 |
GREEN RIDGE |
PURE CAR/TRUCK CARRIER |
1998 |
PCTC |
X |
21,523 |
||||
| 16 |
GLOVIS COUNTESS |
PURE CAR/TRUCK CARRIER |
2010 |
PCTC |
X |
18,701 |
||||
| 17 |
BALI SEA |
ROLL-ON/ROLL-OFF SPV |
1995 |
RF |
X |
20,737 |
||||
| 18 |
BANDA SEA |
ROLL-ON/ROLL-OFF SPV |
1995 |
RF |
X |
20,664 |
||||
| 19 |
EGS CREST |
HANDYSIZE BULK CARRIER |
2011 |
Dry Bulk |
X |
35,914 |
||||
| 20 |
EGS WAVE |
HANDYSIZE BULK CARRIER |
2011 |
Dry Bulk |
X |
35,916 |
||||
| 21 |
BULK AUSTRALIA |
CAPESIZE BULK CARRIER |
2003 |
Dry Bulk |
X |
170,578 |
||||
| 22 |
BULK AMERICAS |
SUPRAMAX BULK CARRIER |
2012 |
Dry Bulk |
X |
57,959 |
||||
| 23 |
OSLO BULK 1 |
MINI BULK CARRIER |
2010 |
Dry Bulk |
X |
8,040 |
||||
| 24 |
OSLO BULK 2 |
MINI BULK CARRIER |
2010 |
Dry Bulk |
X |
8,028 |
||||
| 25 |
OSLO BULK 3 |
MINI BULK CARRIER |
2010 |
Dry Bulk |
X |
8,029 |
||||
| 26 |
OSLO BULK 4 |
MINI BULK CARRIER |
2010 |
Dry Bulk |
X |
8,040 |
||||
| 27 |
OSLO BULK 5 |
MINI BULK CARRIER |
2010 |
Dry Bulk |
X |
8,040 |
||||
| 28 |
OSLO BULK 6 |
MINI BULK CARRIER |
2011 |
Dry Bulk |
X |
8,040 |
||||
| 29 |
OSLO BULK 7 |
MINI BULK CARRIER |
2011 |
Dry Bulk |
X |
8,040 |
||||
| 30 |
OSLO BULK 8 |
MINI BULK CARRIER |
2011 |
Dry Bulk |
X |
8,040 |
||||
| 31 |
OSLO BULK 9 |
MINI BULK CARRIER |
2011 |
Dry Bulk |
X |
8,040 |
||||
| 32 |
OSLO BULK 10 |
MINI BULK CARRIER |
2011 |
Dry Bulk |
X |
8,040 |
||||
| 33 |
OSLO BULK 11 |
MINI BULK CARRIER |
2008 |
Dry Bulk |
X |
8,000 |
||||
| 34 |
SEA CARRIER |
MINI BULK CARRIER |
2010 |
Dry Bulk |
X |
9,300 |
||||
| 35 |
OSLO CARRIER 2 |
MINI BULK CARRIER |
2010 |
Dry Bulk |
X |
9,300 |
||||
| 36 |
OSLO CARRIER 3 |
MINI BULK CARRIER |
2011 |
Dry Bulk |
X |
9,300 |
||||
| 37 |
SEA STEAMER |
MINI BULK CARRIER |
2011 |
Dry Bulk |
X |
9,300 |
||||
| 38 |
OSLO MERCHANT |
MINI BULK CARRIER |
2004 |
Dry Bulk |
X |
16,300 |
||||
| 39 |
BOW TRAJECTORY |
CHEMICAL TANKER |
2014 |
SP |
X |
50,510 |
||||
| 40 |
BOW TRIBUTE |
CHEMICAL TANKER |
2014 |
SP |
X |
50,510 |
||||
| 41 |
ASPHALT SPRING |
ASPHALT TANKER |
2007 |
SP |
X |
6,726 |
||||
| 42 |
ASPHALT SUMMER |
ASPHALT TANKER |
2007 |
SP |
X |
6,654 |
||||
| 43 |
MAERSK ALABAMA |
CONTAINER VESSEL |
1998 |
SP |
X |
17,525 |
||||
| 44 |
MAERSK CALIFORNIA |
CONTAINER VESSEL |
1992 |
SP |
X |
25,375 |
||||
| 45 |
MARINA STAR 2 |
CONTAINER VESSEL |
1982 |
SP |
X |
13,193 |
||||
| 46 |
MARINA STAR 3 |
CONTAINER VESSEL |
1983 |
SP |
X |
13,193 |
||||
| 47 |
TERRITORY TRADER |
CONTAINER VESSEL |
1991 |
SP |
X |
3,183 |
||||
| 48 |
FLORES SEA |
MULTI-PURPOSE VESSEL |
2008 |
SP |
X |
11,151 |
||||
| 49 |
SAWU SEA |
MULTI-PURPOSE VESSEL |
2008 |
SP |
X |
11,184 |
||||
| 50 |
OCEAN HERO |
TANKER |
2011 |
SP |
X |
13,543 |
||||
| 51 |
OCEAN PREMIER |
TANKER |
2011 |
SP |
X |
19,382 |
||||
| 52 |
OCEAN GIANT |
MULTI-PURPOSE HEAVY LIFT DRY CARGO VESSEL |
2012 |
SP |
X |
19,382 |
||||
| 53 |
OCEAN GLOBE |
MULTI-PURPOSE HEAVY LIFT DRY CARGO VESSEL |
2011 |
SP |
X |
19,382 |
||||
| 54 |
OSLO WAVE |
ICE STRENGTHENED MULTI-PURPOSE VESSEL |
2000 |
SP |
X |
17,381 |
||||
|
20 |
8 |
6 |
20 |
1,182,126 |
||||||
|
(1) |
Business Segments: |
|||||||||
|
Jones Act |
Jones Act |
|||||||||
|
PCTC |
Pure Car Truck Carriers |
|||||||||
|
RF |
Rail-Ferry |
|||||||||
|
Dry Bulk |
Dry Bulk Carriers |
|||||||||
|
SP |
Specialty Contracts |
|||||||||
|
(2) |
Currently Inactive |
25
Management Gross Voyage Profit Financial Measures
In connection with discussing the results of our various operating segments in this report, we refer to “gross voyage profit,” a metric that management reviews to assist in monitoring and managing our business. The following table provides a reconciliation of consolidated gross voyage profit to our operating loss.
|
(All Amounts in Thousands) |
Three Months Ended March 31, |
||||
|
2015 |
2014 |
||||
|
Revenues |
$ |
68,026 |
$ |
72,694 | |
|
Voyage Expenses |
52,211 | 57,433 | |||
|
Amortization Expense |
5,187 | 5,163 | |||
|
Net (Income) Loss of Unconsolidated Entities |
(893) | 108 | |||
|
Gross Voyage Profit |
11,521 | 9,990 | |||
|
Vessel Depreciation |
5,543 | 6,721 | |||
|
Other Depreciation |
184 | 184 | |||
|
Gross Profit |
5,794 | 3,085 | |||
|
Other Operating Expenses: |
|||||
|
Administrative and General Expenses |
5,022 | 5,449 | |||
|
Loss on Sale of Other Assets |
68 |
- |
|||
|
Less: Net Income (Loss) of Unconsolidated Entities |
893 | (108) | |||
|
Total Other Operating Expenses |
5,983 | 5,341 | |||
|
Operating Loss |
$ |
(189) |
$ |
(2,256) | |
26
RESULTS OF OPERATIONS
three MONTHS ENDED MARCH 31, 2015
COMPARED TO THE three MONTHS ENDED MARCH 31, 2014
|
(All Amounts in Thousands) |
Pure Car |
||||||||||||||||||||
|
Jones |
Truck |
Dry Bulk |
Rail |
Specialty |
|||||||||||||||||
|
Act |
Carriers |
Carriers |
Ferry |
Contracts |
Other |
Total |
|||||||||||||||
|
2015 |
|||||||||||||||||||||
|
Fixed Revenue |
$ |
24,595 |
$ |
14,247 |
$ |
1,868 |
$ |
- |
$ |
10,571 |
$ |
- |
$ |
51,281 | |||||||
|
Variable Revenue |
- |
7,533 | 1,255 | 7,785 | 185 | (13) | 16,745 | ||||||||||||||
|
Total Revenue from External Customers |
24,595 | 21,780 | 3,123 | 7,785 | 10,756 | (13) | 68,026 | ||||||||||||||
|
Voyage Expenses |
18,590 | 17,020 | 2,580 | 6,886 | 7,557 | (422) | 52,211 | ||||||||||||||
|
Amortization Expense |
3,828 | 715 | 61 | 285 | 298 |
- |
5,187 | ||||||||||||||
|
Loss (Income) of Unconsolidated Entities |
- |
- |
(635) | 74 | (332) |
- |
(893) | ||||||||||||||
|
Gross Voyage Profit |
$ |
2,177 |
$ |
4,045 |
$ |
1,117 |
$ |
540 |
$ |
3,233 |
$ |
409 |
$ |
11,521 | |||||||
|
Gross Voyage Profit Margin |
9 |
% |
19 |
% |
36 |
% |
7 |
% |
30 |
% |
- |
17 |
% |
||||||||
|
2014 |
|||||||||||||||||||||
|
Fixed Revenue |
$ |
29,100 |
$ |
15,615 |
$ |
1,526 |
$ |
- |
$ |
8,702 |
$ |
- |
$ |
54,943 | |||||||
|
Variable Revenue |
- |
3,941 | 3,590 | 7,926 | 2,248 | 46 | 17,751 | ||||||||||||||
|
Total Revenue from External Customers |
29,100 | 19,556 | 5,116 | 7,926 | 10,950 | 46 | 72,694 | ||||||||||||||
|
Voyage Expenses |
21,209 | 16,663 | 3,566 | 6,846 | 9,476 | (327) | 57,433 | ||||||||||||||
|
Amortization Expense |
3,667 | 535 | 77 | 160 | 724 |
- |
5,163 | ||||||||||||||
|
Loss of Unconsolidated Entities |
- |
- |
80 | 28 |
- |
- |
108 | ||||||||||||||
|
Gross Voyage Profit |
$ |
4,224 |
$ |
2,358 |
$ |
1,393 |
$ |
892 |
$ |
750 |
$ |
373 |
$ |
9,990 | |||||||
|
Gross Voyage Profit Margin |
15 |
% |
12 |
% |
27 |
% |
11 |
% |
7 |
% |
- |
14 |
% |
||||||||
For the purposes of this report, (i) “operating days” are defined as days that our vessels/units are generating revenues or positioning to generate revenues, (ii) “non-operating days” are defined as all other days, and (iii) “working capital” is defined as the difference between our total current assets and total current liabilities.
27
Revenues and Gross Voyage Profits
The following table shows the breakout of revenues by segment between fixed and variable for the three months ended March 31, 2015 and 2014:
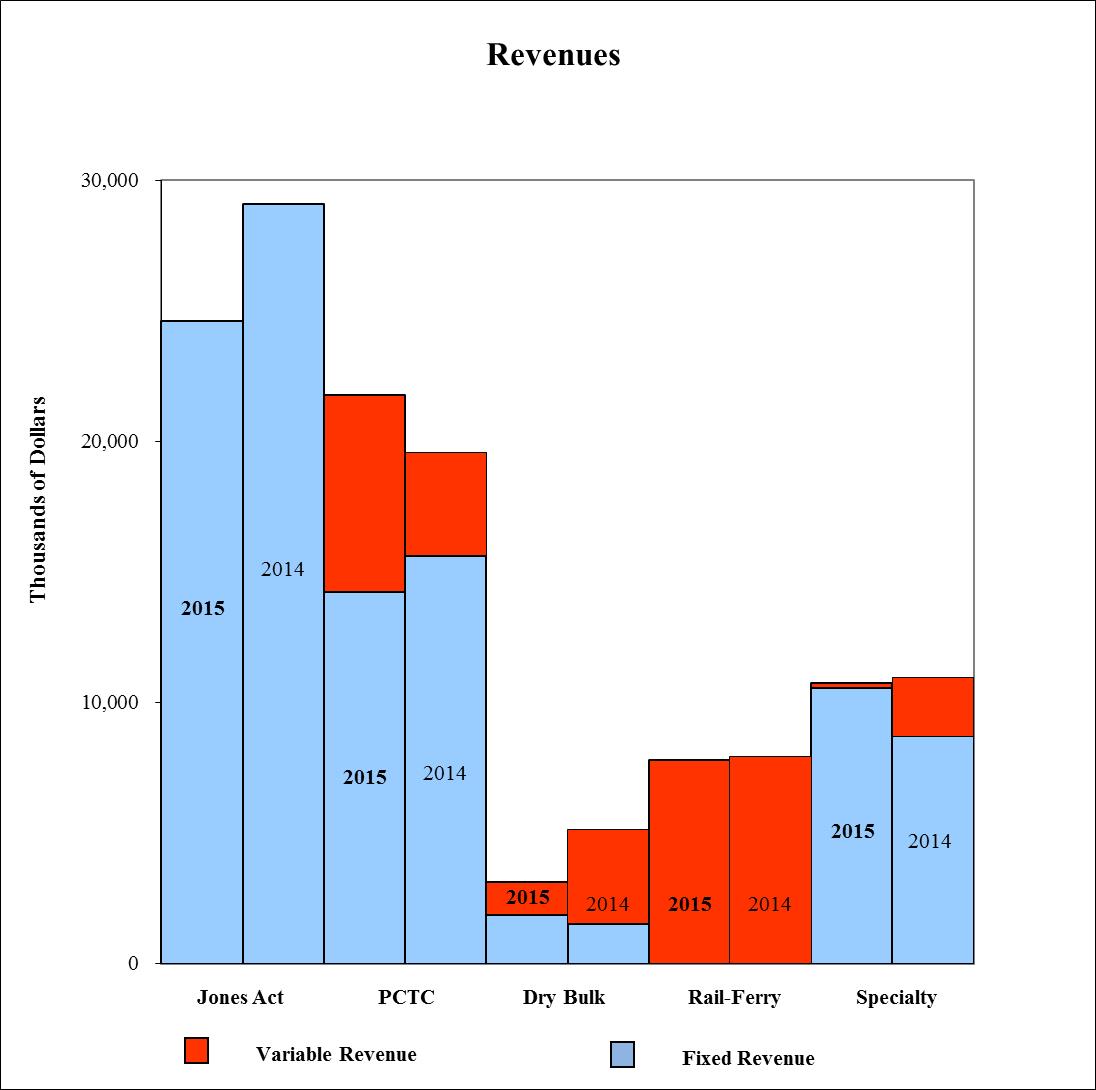
28
Segment Revenue and Expense
The changes in revenues and expenses associated with each of our segments are discussed within the gross voyage profit analysis below:
Jones Act
Revenue and gross voyage profit decreased by $4.5 million and $2.0 million, respectively, when comparing the first quarter of 2015 to the first quarter of 2014. These reductions were primarily due to (i) an increase in non-operating days subject to offset by a claim relating to an improperly maintained ship channel and (ii) a reduction in voyage freight rates from our new agreement with Tampa Electric Company, which took effect in mid-November 2014 and resulted in a reduction of revenue of $3.9 million. Voyage expense as a percentage of revenue was comparable year over year.
Pure Car Truck Carriers
Revenue increased by $2.2 million when comparing the first quarter of 2015 to the first quarter of 2014. The increase in revenue and related increase in gross voyage profit was attributable to higher supplemental cargo in 2015 basis volume levels for specialized niche requirements returning to historical levels in recent months.
Dry Bulk Carriers
Revenue decreased by $2.0 million and gross voyage profit decreased by $0.3 million in the first quarter of 2015 from the first quarter of 2014. This decrease is due to lower Handysize and Supramax results as a result of lower dry bulk rates. The decrease was partially offset by the results of our Capesize vessel, which is on a fixed time charter through the end of 2015, and improvements in the results of our investment in mini-bulker vessels.
Rail-Ferry
Revenue and voyage expense remained relatively unchanged for the first quarter of 2015 compared to the first quarter of 2014. An increase in drydock amortization expense and loss of unconsolidated entities resulted in a reduction of gross voyage profit of $0.4 million.
Specialty Contracts
Revenue decreased by $0.2 million while gross voyage profit increased by $2.5 million when comparing the first quarter of 2015 to the first quarter of 2014. The improved gross voyage results were due to the settlement of a prior year MSC claim that reduced segment expenses and improved results from our equity investments in two Chemical and two Asphalt Tankers that began service in the second half of 2014.
Depreciation Expense
Depreciation Expense was $5.7 million and $6.9 million for the three months ended March 31, 2015 and 2014, respectively. The $1.2 million decrease was primarily related to classifying certain assets as Assets Held for Sale and selling one vessel in the fourth quarter of 2014, slightly offset by an increase in depreciation expense related to the purchase of the PCTC vessel in the third quarter of 2014.
29
Administrative and General Expense
Administrative and General Expense was $5.0 million and $5.4 million for the three months ended March 31, 2015 and 2014, respectively. The following table shows the significant components of administrative and general expenses for the first quarter of 2015 and 2014:
|
(All Amounts in Thousands) |
Three Months Ended March 31, |
|||||
|
2015 |
2014 |
|||||
|
Wages and Benefits |
$ |
2,924 |
$ |
2,905 | ||
|
Executive Stock Compensation(1) |
2 | 447 | ||||
|
Professional Services |
805 | 645 | ||||
|
Office Building Expense |
410 | 362 | ||||
|
System Hardware and Software |
72 | 125 | ||||
|
Other |
809 | 965 | ||||
|
TOTAL |
$ |
5,022 |
$ |
5,449 | ||
(1) The expenses we incurred in connection with grants of annual incentive stock awards to senior management during the first quarter of 2015 were almost completely offset by the impact of forfeitures of incentive awards granted in earlier periods. See Note 14 – Stock Based Compensation.
Loss on Sale of Other Assets
During the first quarter of 2015, we sold a 36,000 dead weight ton Handysize vessel and its related equipment. We received $16.4 million, net of commissions and other costs to sell, and recorded a loss on sale of asset of approximately $68,000 during the quarter.
Other Income and Expense
Interest Expense was $2.7 million and $2.1 million for the three months ended March 31, 2015 and 2014, respectively. This increase was primarily attributable to the financing of a 2007 PCTC purchased back from our Lessor in the third quarter of 2014.
Derivative Loss was $2.8 million for the three months ended March 31, 2015 compared to $14,000 for the same period 2014. This increase in loss is primarily due to the early settlement of an interest rate swap in connection with the refinancing of our Yen-based facility to a USD-based facility. For more information, see Note 11 – Derivative Instruments.
Loss on Extinguishment of Debt was $0.1 million in the first quarter of 2015 as a result of writing off unamortized loan costs associated with the debt on the sale of one of our Handysize vessels.
Other Income from Vessel Financing was $445,000 and $489,000 in the first quarter of 2015 and 2014, respectively. The decrease was driven by a lower principal balance upon which interest is earned on a note receivable issued to us in connection with our sale of two vessels to an Indonesian company in the third quarter of 2009.
Foreign Exchange Loss of $45,000 in the first quarter of 2015 is associated with our normal recurring period-end currency revaluations, including the impact of revaluing our obligations relating to the Yen-denominated financing of one of our PCTC vessels. The exchange loss was principally attributable to a change in the exchange rate of 119.72 Yen to 1 USD at December 31, 2014 compared to 120.13 Yen to 1 USD at March 31, 2015, net of the impact of our foreign forward exchange contracts that we have entered into to limit our exposure to fluctuations in the value of the Yen. For more information on these arrangements, see Note 11 – Derivative Instruments.
Income Taxes
We recorded a tax provision of $39,000 on our $5.4 million loss before taxes and equity in net income of unconsolidated entities for the three months ended March 31, 2015. For the first three months of 2014 we recorded an income tax benefit of $882,000 on our $4.0 million of loss before equity in net income of unconsolidated entities. These provision amounts represent our qualifying U.S. flag operations, which continue to be taxed under the “tonnage tax” provisions rather than the normal U.S. corporate income tax provisions, state income taxes paid, and foreign income tax withholdings or refunds. We established a valuation allowance against deferred income tax assets in 2014 because, based on available information, we could not conclude that it was more likely than not that the full amount of deferred income tax assets generated primarily by NOL carryforwards and AMT credits would be realized through the generation of taxable income in the near future. We have and will continue to evaluate the need for a valuation allowance on a quarterly basis. We recorded an increase in our valuation allowance of $730,000 for the three months ending March 31, 2015.
30
For further information on certain tax laws and elections, see our Annual Report on Form 10-K filed for the year ended December 31, 2014, including Note J - Income Taxes to the consolidated financial statements included therein.
Equity in Net Income of Unconsolidated Entities
Equity in net income from unconsolidated entities, net of taxes, was $0.9 million for the three months ended March 31, 2015 compared to a net loss of $0.1 million for the same period 2014. The increase is primarily due to our 30% investment in entities owning two Asphalt and two Chemical Tankers, which began service in the second half of 2014, coupled with improved results from our interest in mini-bulkers.
31
LIQUIDITY AND CAPITAL RESOURCES
The following discussion should be read in conjunction with the more detailed Condensed Consolidated Balance Sheets and Condensed Consolidated Statements of Cash Flows included in Item 1 of Part I of this report.
Working Capital
Our working capital was $6.4 million and $9.4 million at March 31, 2015 and December 31, 2014, respectively. The $3.0 million decrease in working capital was primarily driven by a decrease in accounts receivable and other current assets that was partially offset by a decrease in current liabilities. Total current liabilities of $70.2 million as of March 31, 2015 included $22.4 million of current maturities of long-term debt.
Restricted Cash
As of March 31, 2015, we had approximately $0.4 million of cash classified as restricted cash, which represents pre-funding of the upcoming quarterly scheduled debt payment on the PCTC bank debt we incurred in the third quarter of 2014.
As of December 31, 2014, we had $1.4 million of cash classified as restricted cash of which $1.0 million related to certain UOS performance guarantees and $0.4 million was required escrow of upcoming debt payments.
Net Cash Provided by Operating Activities
Net cash provided by operating activities for the three months ended March 31, 2015 was $1.9 million after adjusting our net loss of $4.5 million for non-cash items such as depreciation, deferred charges, amortization, and non-cash stock based compensation, which was partially offset by increases in deferred drydock charges and a decrease in accounts payable and accrued expenses of $5.5 million and $3.8 million, respectively, a decrease in inventory and other current assets of $3.9 million, and various other items specified in our condensed consolidated statements of cash flows.
Net Cash Provided by Investing Activities
Net cash provided by investing activities of $18.8 million for the three months ended March 31, 2015 primarily consisted of $16.4 million in cash proceeds received from the sale of our Handysize vessel and $3.9 million in cash proceeds from the collection of a receivable which had previously been classified as a cash outflow from investing activities as it was related to capital expenditures, slightly offset by $3.3 million of capital outlays.
Net Cash Used in Financing Activities
Net cash used in financing activities of $20.0 million for the three months ended March 31, 2015 was primarily due to dividends paid of $3.1 million and principal payments on long term debt of $19.4 million slightly offset by net proceeds of $2.5 million of borrowings from our line of credit. The principal payment of $19.4 million includes the early prepayment of $13.5 million for the debt associated with the sale of our Handysize vessel.
32
Capital Expenditures
Our capital expenditures relate primarily to the purchase of vessels and capital improvements that enhance the value or safety of our vessels.
In addition to our periodic vessel purchases, we regularly incur drydocking and other capital expenditures on an ongoing basis in order to extend the useful life of our vessels, to improve and modernize our fleet, to comply with various requirements or standards imposed by insurers or governmental or quasi-governmental authorities, and to upgrade our on-shore infrastructure. We are also currently incurring capital expenditures to construct an office building which, upon completion, will serve as our new headquarters office. The amount of our capital expenditures is influenced by, among other things, changes in regulatory, quasi-regulatory or insurance requirements or standards, drydocking schedules for our various vessels, demand for our services, cash flow generated by our operations, and cash required for other purposes. For the three months ended March 31, 2015, our total cash paid for capital expenditures was $8.8 million, of which $5.5 million related to drydock, $2.4 million related to construction of our new corporate office in New Orleans, and $0.9 million related to other corporate investments.
Based on our current plans and strategies, we estimate expected capital improvements to vessels and drydock expenditures to be within the $35.0 million and $40.0 million range for the year, excluding approximately $11.6 million to complete the corporate office in New Orleans, LA.
Debt and Lease Obligations
Debt Obligations
We have up to a $95.0 million senior secured credit facility (“Credit Facility”) which is comprised of a term loan facility in the principal amount of $45.0 million and a revolving credit facility (“LOC”) in the principal amount of up to $50.0 million. The LOC includes a $20.0 million sublimit for the issuance of standby letters of credit and a $5.0 million sublimit for swingline loans. The Credit Facility carries an accordion feature, whereby an additional term loan up to $50.0 million may be advanced subject to certain financial requirements. As of March 31, 2015, we had $41.0 million of borrowings and $7.6 million of letters of credit outstanding under our LOC, leaving approximately $1.4 million of additional borrowing capacity.
Under the Credit Facility, each of our domestic subsidiaries is a joint and several co-borrower. The obligations of all the borrowers under the Credit Facility are secured by all personal property of the borrowers, including the U.S. flagged vessels owned by ISH’s domestic subsidiaries and collateral related to such vessels. Several of our International flagged vessels are pledged as collateral securing several of our other secured debt facilities.
The Credit Facility, as amended, includes usual and customary covenants and events of default for credit facilities of its type. Our ability to borrow under the Credit Facility is conditioned upon continued compliance with such covenants, including, among others, (i) covenants that restrict our ability to engage in certain asset sales, mergers or other fundamental changes, to incur liens or to engage in various other transactions or activities and (ii) various financial covenants, including those stipulating as of March 31, 2015 that we maintain a consolidated leverage ratio of 5.0 to 1.0, an EBITDAR to fixed charges ratio of at least 1.05 to 1.0, liquidity of not less than $20.0 million, and a consolidated net worth of not less than the sum of $228.0 million, minus impairment losses, plus 50% of our consolidated net income earned after December 31, 2011, excluding impairment loss, plus 100% of the proceeds of all issuances of equity interests received after December 31, 2011 (with all such terms or amounts as defined in or determined under the Credit Facility). For information on the prior and future terms of these covenants, amendments to our covenants, and our compliance with these covenants, see “– Debt Covenants” below.
On September 30, 2014 and March 31, 2015, we amended the Credit Facility and our other loan agreements in the manner discussed below under the heading “– Debt Covenants.”
During the first quarter of 2015, we paid off approximately $13.5 million in debt in connection with the sale of one of our Handysize vessels. Additionally, we wrote off approximately $95,000 of unamortized loan costs associated with the debt instrument which is reflected in loss on extinguishment of debt on our condensed consolidated statement of operations.
We guarantee two separate loan facilities of two separate shipping companies in which one of our wholly-owned subsidiaries has indirect ownership interests. With respect to one of the two loan facilities of these shipping companies, in which our wholly-owned subsidiary indirectly owns a 25% interest, we guarantee 5% of the amount owed under the loan facility. As of March 31, 2015 and December 31, 2014, this guarantee obligation equated to approximately $3.6 million, respectively. The amount of this guarantee reduces semi-annually by approximately $165,000 through December 2018. Under the second facility, in which our wholly-owned subsidiary indirectly owns approximately 23.7% of the borrower, we guarantee only $1.0 million of the approximately $11.0 million loan facility. This second guarantee is non-amortizing and is scheduled to expire in December 2018. In December 2017, we anticipate that this guarantee will be reduced from $1.0 million to $510,000 as a result of a scheduled payment of a portion of the facility.
33
We owe various sums under several other credit agreements. For information on these other credit agreements, see Note 12 – Long Term Debt.
Lease Obligations
As of March 31, 2015, we held six vessels under operating contracts and eight vessels under bareboat charter or lease agreements. The types of vessels held under these agreements include (i) a Molten-Sulphur Carrier in our Jones Act segment, (ii) two Pure Car Truck Carriers that operate under our PCTC segment, (iii) two Multi-Purpose vessels, two Tankers, five Container vessels, and two Heavy Lift vessels, all of which operate in our Specialty Contracts segment.
Our vessel operating lease agreements have early buy-out options and fair value purchase options that enable us to purchase the vessels under certain specified circumstances. The lease agreements impose certain financial covenants, including defined minimum working capital and net worth requirements, and prohibit us from incurring, without the lessor’s prior written consent, additional debt or lease obligations, subject to certain specified exceptions. These financial covenants are generally similar, but not identical, to the above-described financial covenants set forth in the Credit Facility. See “- Debt Covenants” below.
We also conduct certain of our operations from leased office facilities. In 2013, we executed a five year lease agreement for office space in Tampa, Florida housing our UOS employees. The lease calls for graduated payments in equal amounts over the 60-month term of the lease. In addition to the Tampa office, we signed a two year lease agreement for our Shanghai, China office space. This lease is effective October 1, 2013 through September 30, 2015.
We plan to relocate our corporate headquarters from Mobile, Alabama to New Orleans, Louisiana in the first quarter of 2016 after we complete renovations of a new facility in downtown New Orleans. Our renovation and relocation costs will be partially offset by approximately $10.3 million in incentives offered by the State of Louisiana. We are planning to sublease our Mobile office lease in later part of 2015. If a lessee cannot be secured we may incur a potential cash outlay of approximately $3.1 million. In late 2014, we signed an eighteen month lease agreement for temporary office space in New Orleans which will hold our employees until the completion of the corporate office building.
For additional information on our fixed commitments, see the table quantifying our aggregate debt and lease obligations included in our Annual Report on Form 10-K for the year ended December 31, 2014 under the heading, “Management’s Discussion and Analysis of Financial Condition and Results of Operations – Liquidity and Capital Resources – Contractual Obligations and Other Commitments.”
Debt Covenants
All of our principal credit agreements and operating leases require us to comply with various loan covenants, including financial covenants that require minimum levels of net worth, working capital, liquidity, and interest expense or fixed charges coverage and a maximum amount of debt leverage.
Effective September 30, 2014, certain of our lenders and lessors agreed at our request to adjust our covenants to less stringent levels to provide relief from the accounting impact of approximately $11.3 million in deferred gains resulting from the September 2014 vessel purchase and refinancing transactions. Two of our lenders have elected to adjust our definition of EBITDA to disregard the impact of these transactions, while the remainder of our lenders and lessors agreed to amend the consolidated leverage and fixed charge coverage ratios to require us to maintain (i) a consolidated leverage ratio of 5.00 to 1.0 through the fiscal quarter ending December 31, 2015, then 4.75 to 1.0 through the fiscal quarter ending March 31, 2016, then 4.50 to 1.0 beginning the quarter ending June 30, 2016 through the quarter ending September 30, 2016, and 4.25 to 1.0 thereafter and (ii) a minimum fixed charge coverage ratio of 1.10 to 1.0 beginning with the quarter ending September 30, 2014 through the quarter ending December 31, 2014, 1.15 to 1.0 beginning with the quarter ending March 31, 2015 through the quarter ending December 31, 2015, 1.20 to 1.0 beginning with the quarter ending March 31, 2016 through the quarter ending June 30, 2016, and 1.25 to 1.0 thereafter (in each case as calculated under our amended debt agreements).
During the first quarter of 2015, there was concern that we would be unable to meet all of our required debt covenants. As such, we received waivers from our lenders and lessors for certain covenants contained in our financing and lease agreements. We received permission from certain lenders and lessors to incur up to $15 million in additional indebtedness for general corporate purposes. We also received from certain lenders and lessors permission to incur additional indebtedness in connection with the refinancing of a foreign currency loan facility and our payoff of a related foreign currency interest rate swap. We received from certain lenders and lessors a restatement of the fixed charge coverage ratio to a minimum 1.05 to 1.0 for the fiscal year 2015, 1.15 to 1.0 beginning with the quarter ending March 31, 2016, and 1.20 to 1.0 beginning with the quarter ending June 30, 2016 and for all periods thereafter. The manner in which this fixed charge coverage ratio is determined and calculated differs under our various loan or lease agreements. Two other lenders provided short-term relief by agreeing to amend, for 2015 only, the manner in which the leverage ratio will be calculated under the relevant agreement. Additionally, we received from one of our lenders in 2015, relief under our loan to value ratio test. As a result of these waivers and concessions granted early this year, we were in compliance with all of our debt covenants as of March 31, 2015.
34
Liquidity and Covenant Compliance
Beginning in the fourth quarter of fiscal year 2014, we commenced a plan to evaluate our liquidity and capital resource needs for fiscal year 2015. Our plan included the reduction of our quarterly cash dividend on common stock and the identification of five non-performing assets that were approved for sale by our Board of Directors during the fourth quarter of 2014 and classified as Assets Held for Sale on our December 31, 2014 balance sheet. Additionally, in the fourth quarter of 2014, we completed the renewal of our contract with TEC. As a result of this contract renewal and the impairment recorded on one of our assets held for sale, we evaluated the recoverability of our deferred tax assets and concluded that it is more likely than not that we will not recognize the benefits of our federal tax attributes and therefore, recorded a valuation allowance on our deferred tax assets during the fourth quarter of 2014. We recorded an increase in this valuation allowance of $730,000 for the three months ended March 31, 2015.
One of our held for sale assets was sold prior to December 31, 2014 and on March 5, 2015, we finalized the sale of one of the four remaining held for sale assets. We are actively marketing the remaining three assets. The estimated proceeds from the remaining three assets held for sale are an integral part to our compliance with our minimum liquidity requirements. Additionally, to generate additional liquidity, we could sell unencumbered vessels in our fleet and defer capital expenditures and dry docking costs that are not required until 2016.
We are also currently in discussions with our creditors to refinance certain unencumbered assets for approximately $12.0 million, and we believe this will be executed by the end of the second quarter of 2015. In addition to this amendment, we are also in the process of obtaining bank financing for approximately $6.9 million which will go towards the construction and renovation of our future corporate office in New Orleans. We anticipate closing this financing by the end of the second quarter of 2015. In addition to the $6.9 million in bank financing, we have received approximately $4.6 million in incentives from the State of Louisiana and expect to receive another $0.6 million of incentives during 2015 which will offset part of the cost of constructing the new corporate office. The remaining cost of approximately $6.9 million to complete the construction of the building will be funded by cash on hand. If we are unsuccessful in refinancing certain unencumbered assets, we could re-market our requests with other interested parties, seek loan refinancing to further monetize asset values on other vessels, or attempt to access the equity markets under our current open shelf registration. The timing and success of our financing activities cannot be assured.
Failure to execute our plan could impact our ability to be in compliance with our quarterly debt covenants in 2015 and could cause us to suffer an event of default, which could, among other things, accelerate our obligations under any such agreement or preclude us from making future borrowings. Moreover, because our debt obligations are represented by separate agreements with different lenders, in some cases any breach of these covenants or any other default under one agreement may create an event of default under other agreements, resulting in the acceleration of our obligation to pay principal, interest and potential penalties under such other agreements (even though we may otherwise be in compliance with all of our obligations under those agreements). An event of default under a single agreement , including one that is technical in nature or otherwise not material, could result in the acceleration of our debt obligations under multiple lending agreements. The acceleration of any or all amounts due under our debt agreements or the loss of the ability to borrow under our revolving credit facility or other debt agreements could have a material adverse effect on our business, financial condition, results of operations and cash flows. In the event of non-compliance with our debt covenants, we would seek to amend the covenants, obtain waivers from each of our lenders in order to cure any instances of non-compliance, or sell vessels that are currently unencumbered by debt or that serve as collateral against our outstanding debt obligations. The disposition of one or more of these vessels would provide us with additional liquidity and capital resources that could be used to pay down the balances owed under our current debt obligations
Based on current conditions and our expectations that our performance will stabilize or improve marginally in the near term, we currently believe that we will be able to attain all of our financial covenants for the next twelve months, but we cannot assure you of this.
35
The following table represents the actual and required covenant amounts required under our principal credit agreements and operating leases (after giving effect to the new terms described above) for the three months ended March 31, 2015:
|
Required at |
||||||
|
Actual |
March 31, 2015 |
|||||
|
Net Worth (thousands of dollars) (1) |
$ |
260,551 |
$ |
255,000 | ||
|
Working Capital (thousands of dollars) (2) |
$ |
6,352 |
$ |
1 | ||
|
Interest Expense Coverage Ratio (minimum) (3) |
4.29 | 2.50 | ||||
|
EBITDAR to Fixed Charges Ratio (minimum) (4) |
1.08 | 1.08 | ||||
|
EBITDAR to Fixed Charges Ratio (minimum) (4) Foreign |
1.27 | 1.15 | ||||
|
Total Indebtedness to EBITDAR Ratio (maximum) (5) |
4.53 | 5.00 | ||||
|
Total Indebtedness to EBITDAR Ratio (maximum) (5) Foreign |
3.92 | 4.50 | ||||
|
Minimum Liquidity (6) |
$ |
22,793 |
$ |
20,000 |
|
1. |
Defined as total stockholders’ equity less goodwill. |
|
2. |
Defined as total current assets minus total current liabilities. |
|
3. |
Defined as the ratio between consolidated earnings before interest, taxes, depreciation, and amortization (“EBITDA”) to interest expense. |
|
4. |
Defined as the ratio between fixed charges to consolidated earnings before interest, taxes, depreciation, amortization and rent (“EBITDAR”). |
|
5. |
Defined as the ratio between adjusted unconsolidated indebtedness to consolidated EBITDAR. |
|
6. |
Defined as available borrowing capacity under our line of credit plus available cash. |
Our failure to produce improved results could jeopardize our ability to attain one or more of our financial covenants in the future. We currently believe that we will be able to attain all of our financial covenants through the end of the next twelve months based upon (i) current conditions, (ii) the assumption that we will generate cash through vessel sales or alternative transactions and (iii) our expectations that our financial performance will stabilize or improve marginally in the near term. Because we cannot necessarily control future conditions or asset sales, we cannot assure you that we are able to attain all of our financial covenants in future periods, but cannot assure you of this. Our ability to attain our financial covenants after December 31, 2015 will be dependent upon a wide range of factors, several of which are outside of our control. For additional information, see “Risk Factors – We cannot assure you that we will be able to comply with all of our loan covenants” in Item 1A of Part I of our Form 10-K for the year ended December 31, 2014.
In the unanticipated event that our cash flow and capital resources are not sufficient to fund our debt service obligations, we could be forced to reduce or delay capital expenditures, sell assets, reduce or eliminate dividend payments, obtain additional capital, enter into financings of our unencumbered vessels or restructure debt. Based on current circumstances, we believe we can continue to fund our working capital and routine capital, investment liquidity needs through cash flow from operations. To the extent we are required to seek additional capital, our efforts could be hampered by continuing uncertainties in the credit markets. See “Risk Factors” in Item 1A of Part I of our Form 10-K for the year ended December 31, 2014.
Pension Obligations
We contributed $150,000 to our pension plan during the three months ended March 31, 2015. We expect to contribute an additional $450,000 before December 31, 2015.
Cash Dividend Payments
The payment of dividends to common stockholders and preferred stockholders are at the discretion and subject to the approval of our Board of Directors. On October 29, 2008, our Board of Directors authorized the reinstitution of a quarterly cash common stock dividend program beginning in the fourth quarter of 2008. Since then, the Board of Directors has declared a cash common stock dividend each quarter.
36
On January 7, 2015, the Board of Directors declared a dividend of $2.375 and $2.25 per share on our 9.5% Series A Cumulative Perpetual Preferred Stock and 9.0% Series B Cumulative Perpetual Preferred Stock, respectively, to preferred stockholders of record on January 29, 2015, which was paid on January 30, 2015. Additionally, the Board of Directors declared a dividend of $0.25 per share of common stock to common stockholders of record as of February 19, 2015, which was paid on March 4, 2015.
On April 2, 2015, the Board of Directors declared a dividend of $2.375 and $2.25 per share on our 9.5% Series A Cumulative Perpetual Preferred Stock and 9.0% Series B Cumulative Perpetual Preferred Stock, respectively, to preferred stockholders of record on April 29, 2015, which was paid on April 30, 2015. Additionally, on April 29, 2015, the Board of Directors declared a dividend of $0.05 per share of common stock to common stockholders of record as of May 15, 2015, payable on June 3, 2015.
If we do not pay our preferred stock dividends for two periods (whether consecutive or not), the per annum rate will increase by an additional 2.00% per $100.00 stated liquidation preference, or $2.00 per annum on and after the day following such second dividend payment date.
Holders of our equity securities have no contractual or other legal right to receive dividends. See Item 1A “Risk Factors” of our Annual Report on Form 10-K for the year ended December 31, 2014.
Environmental Issues
Our environmental risks primarily relate to oil pollution from the operation of our vessels. We have pollution liability insurance coverage with a limit of $1 billion per occurrence, with deductible amounts not exceeding $250,000 for each incident. Certain international maritime organizations have proposed various regulations relating to marine fuel emissions and ballast water treatment that could in the aggregate increase our operating costs.
Other Matters
We routinely evaluate the acquisition of additional vessels or businesses and from time to time evaluate possible vessel divestitures. At any given time, we may be engaged in discussions or negotiations regarding acquisitions or dispositions. We generally do not announce our acquisitions or dispositions until we have entered into a definitive agreement. We may require additional financing in connection with any such acquisitions, refinancing transactions or to increase working capital. Our consummation of any such financing transactions could have a material impact on our financial condition or operations.
New Accounting Pronouncements
See Part I, Item 1, Financial Statements – Note 18 – New Accounting Pronouncements.
37
Item 3 – Quantitative and Qualitative Information About Market Risk
In the ordinary course of our business, we are exposed to foreign currency, interest rate, and commodity price risks. We utilize derivative financial instruments including interest rate swap agreements and forward exchange contracts, and in the past we have also utilized commodity swap agreements, to manage certain of these exposures. We hedge firm commitments or anticipated transactions and do not enter into derivatives for speculative purposes. We neither hold nor issue financial instruments for trading purposes.
Interest Rate Risk
The fair value of our cash and short-term investment portfolio at March 31, 2015 approximated its carrying value due to the short-term duration of the underlying securities. The potential decrease in fair value resulting from a hypothetical 10% change in interest rates at quarter-end for our investment portfolio is not material.
The fair value of long-term debt, which is calculated based on the current rates offered to us versus current rates on our outstanding obligations, was approximately $227.9 million as of March 31, 2015. We pay variable interest on all of our long-term debt, except with respect to the debt we incurred in 2014 to finance the repurchase of our 2007 PCTC and our variable-to-fixed interest rate swap described below. Accordingly, a hypothetical 10% increase in interest rates for the three months ending March 31, 2015 would have increased our interest expense by approximately $111,000 although it would not materially impact the fair value of our long-term debt.
From time to time, we enter into interest rate swap agreements to manage well-defined interest rate risks and we record the fair value of the interest rate swaps as an asset or liability on our balance sheet. At March 31, 2015, we had one interest rate swap applicable to 11% of our long-term debt, which has a variable-to-fixed interest rate swap with respect to a Yen-based facility for the financing of a PCTC delivered in March 2010. In the second quarter of 2015, we refinanced the Yen-based credit facility and settled the related interest rate swap. See Note 11 – Derivative Instruments and Note 20 – Subsequent Event.
Commodity Price Risk
As of March 31, 2015, we did not have commodity swap agreements in place to manage our exposure to the risk of increases in the price of fuel necessary to operate both our Rail-Ferry and Jones Act segments. We have fuel surcharges and escalation adjustments in place for both of these segments, which we believe mitigates the price risk for those services during 2015. We estimate that a 20% increase in the average price of fuel for the period January 1, 2015 through March 31, 2015 would have resulted in an increase of approximately $208,000 in our fuel costs for the same period, and in a corresponding decrease of approximately $0.03 in our basic and diluted earnings per share based on the shares of our common stock outstanding for the three months ended March 31, 2015. The additional fuel costs assume revenue from escalation adjustments but that no additional revenue would be generated from fuel surcharges, even though we believe that we could have passed on to our customers some or all of the fuel price increases through the aforementioned fuel surcharges during the same period, subject to the need to maintain competitive freight rates. Our time charterers in our PCTCs, Dry Bulk Carriers and Specialty Contracts segments are responsible for purchasing vessel fuel requirements under governing time charters; thus, our fuel price risk in these segments is currently limited to the redelivery of fuel under time charters and any voyage charters concluded within our Dry Bulk Carriers segment. Since the voyage charters in our Dry Bulk Carriers segment currently are generally short term transactions, the applicable voyage freight rates are based on current fuel costs.
Foreign Exchange Rate Risk
We entered into foreign exchange contracts to hedge certain firm purchase commitments during 2014. These contracts mature in December 2015. The fair value of these contracts at March 31, 2015 is a liability of approximately $4.3 million. A hypothetical 10% adverse change in exchange rates at March 31, 2015 would have increased this liability to an aggregate liability of approximately $4.8 million. Included in this liability is a foreign contract related to the Yen-based credit facility of $4.2 million. In the second quarter of 2015, we refinanced the Yen-based credit facility and settled the related foreign currency contracts. See Note 11 – Derivative Instruments and Note 20 – Subsequent Event.
Item 4 – Controls and Procedures
As of the end of the period covered by this report, we conducted an evaluation of the effectiveness of our “disclosure controls and procedures,” as that phrase is defined in Rule 13a-15(e) under the Securities Exchange Act of 1934. The evaluation was carried out under the supervision and with the participation of our management, including our Chief Executive Officer (“CEO”) and Chief Financial Officer (“CFO”).
Based on that evaluation, our CEO and CFO have concluded that our disclosure controls and procedures were effective as of March 31, 2015 in providing reasonable assurance that they have been timely alerted of material information required to be disclosed in this report. During the first quarter of 2015, we did not make any changes to our internal control over financial reporting that materially affected, or that we believe are reasonably likely to materially affect, our internal control over financial reporting.
38
The design of any system of controls is based in part upon certain assumptions about the likelihood of future events and contingencies, and there can be no assurance that any design will succeed in achieving its stated goals. Because of inherent limitations in any control system, misstatements due to error or fraud could occur and not be detected.
PART II – OTHER INFORMATION
For a discussion of our pending dispute with the U.S. Customs agency, see Note 9 – Commitments and Contingencies. For a discussion of our other legal proceedings, see Item 3 of our annual report on Form 10-K for the year ended December 31, 2014.
For information regarding certain risks relating to our operations, any of which could negatively affect our business, financial condition, operating results or prospects, see Item 1A “Risk Factors” of our Annual Report on Form 10-K for the year ended December 31, 2014.
Item 2 – Unregistered Sales of Equity Securities and Use of Proceeds
On January 25, 2008, the Company’s Board of Directors approved a share repurchase program for up to a total of 1,000,000 shares of the Company’s common stock. We expect that any share repurchases under this program will be made from time to time for cash in open market transactions at prevailing market prices. The timing and amount of any purchases under the program will be determined by management based upon market conditions and other factors. In 2008, we repurchased 491,572 shares of our common stock for $11.5 million. Thereafter, we suspended repurchases until the second quarter of 2010, when we repurchased 223,051 shares of our common stock for $5.2 million. Unless and until the Board otherwise provides, this authorization will remain open indefinitely, or until we reach the 1,000,000 share limit.
We did not purchase any shares in the first quarter of 2015. As of March 31, 2015, we had 285,377 shares available to be purchased under our 2008 repurchase plan.
Item 6 – Exhibits
|
|
|
|
3.1 |
Restated Certificate of Incorporation of the Registrant, as amended through May 19, 2010 (filed with the Securities and Exchange Commission as Exhibit 3.1 to the Registrant’s Form 10-Q dated July 28, 2010 and incorporated herein by reference). |
|
3.2 |
By-Laws of the Registrant as amended through October 28, 2009 (filed with the Securities and Exchange Commission as Exhibit 3.2 to the Registrant’s Form Current Report on Form 8-K dated November 2, 2009 and incorporated herein by reference). |
|
10.1* |
Ninth Amendment to the Credit Agreement, dated March 30, 2015, to the Credit Agreement, dated as of January 23, 2008, by and among East Gulf Shipholding, Inc., as borrower, the Registrant, as guarantor, the banks and financial institutions party thereto, as lenders, DNB Bank ASA, as facility agent and as security trustee. |
|
10.2* |
Third Amendment to the Credit Agreement, dated April 7, 2015, to the Credit Agreement, dated as of August 25, 2014, by and among LCI Shipholdings, Inc., a non-resident corporation organized under the laws of the Republic of the Marshall Islands, as Borrower, International Shipholding Corporation, as Guarantor, and RBS Asset Finance, Inc., a New York corporation, as Lender. |
|
10.3* |
Fourth Amendment to Credit Agreement and Consent Agreement, dated as of April 14, 2015, to the Credit Agreement, dated as of September 24, 2013, by and among International Shipholding Corporation and thirteen of its subsidiaries as borrowers and Regions Bank as Administrative Agent and Collateral Agent and Regions Capital Markets, a division of Regions Bank, as Lead Arranger and Sole Book Manager as the lenders. |
|
10.4* |
Fourth Amendment to the Credit Agreement, dated April 20, 2015, to the Credit Agreement, dated as of June 20, 2011, by and among Dry Bulk Australia Ltd. and Dry Bulk Americas Ltd., as joint and several borrowers, the Registrant, as guarantor, and ING Bank N.V. London branch, as lender, facility agent and security trustee. |
|
10.5* |
Fourth Amendment to the Credit Agreement, dated April 20, 2015, to the Credit Agreement, dated as of August 2, 2010, by and among East Gulf Shipholding, Inc., as borrower, the Registrant, as guarantor, the banks and financial institutions listed therein, as lenders, and ING Bank N.V., London Branch, as facility agent and security trustee. |
39
|
10.6* |
Third Amendment to the Credit Agreement, dated March 30, 2015, to the Credit Agreement, dated as of August 26, 2014, by and among LCI Shipholdings, Inc. (assigned to Waterman Steamship Corporation), as Borrower, DVB Bank SE, as Facility Agent and Security Trustee, and the Banks and Financial Institutions from time to time party thereto. |
|
10.7* |
Fourth Amendment to the Credit Agreement, dated April 20, 2015, to the Credit Agreement, dated as of August 26, 2014, by and among LCI Shipholdings, Inc. (assigned to Waterman Steamship Corporation), as Borrower, DVB Bank SE, as Facility Agent and Security Trustee, and the Banks and Financial Institutions from time to time party thereto. |
|
10.8 |
International Shipholding Corporation 2015 Stock Incentive Plan (filed with the SEC on March 12, 2015 as Appendix B to the Company’s Definitive Proxy Statement on Schedule 14A and incorporated by reference herein). |
|
31.1* |
Officer’s certification pursuant to Section 302 of the Sarbanes-Oxley Act of 2002. |
|
31.2* |
Officer’s certification pursuant to Section 302 of the Sarbanes-Oxley Act of 2002. |
|
32.1* |
Officer’s certification pursuant to Section 906 of the Sarbanes-Oxley Act of 2002. |
|
32.2* |
Officer’s certification pursuant to Section 906 of the Sarbanes-Oxley Act of 2002. |
|
101.INS* |
XBRL Instance Document |
|
101.SCH* |
XBRL Taxonomy Extension Schema Document |
|
101.CAL* |
XBRL Taxonomy Extension Calculation Linkbase Document |
|
101.LAB* |
XBRL Taxonomy Extension Label Linkbase Document |
|
101.PRE* |
XBRL Taxonomy Extension Presentation Linkbase Document |
|
101.DEF* |
XBRL Taxonomy Extension Definition Linkbase Document |
|
*filed with this report |
|
SIGNATURE
Pursuant to the requirements of the Securities and Exchange Act of 1934, the registrant has duly caused this report to be signed on its behalf by the undersigned thereunto duly authorized.
INTERNATIONAL SHIPHOLDING CORPORATION
/s/ Manuel G. Estrada
Manuel G. Estrada
Vice President and Chief Financial Officer
(Principal Financial and Accounting Officer)
40