Attached files
| file | filename |
|---|---|
| EX-32.2 - EXHIBIT 32.2 - CFO CERTIFICATION - INTERNATIONAL SHIPHOLDING CORP | exhibit32293011.htm |
| EX-31.1 - EXHIBIT 31.1 - CEO CERTIFICATION - INTERNATIONAL SHIPHOLDING CORP | exhibit31193011.htm |
| EX-32.1 - EXHIBIT 32.1 - CEO CERTIFICATION - INTERNATIONAL SHIPHOLDING CORP | exhibit32193011.htm |
| EX-31.2 - EXHIBIT 31.2 - CFO CERTIFICATION - INTERNATIONAL SHIPHOLDING CORP | exhibit31293011.htm |
| EXCEL - IDEA: XBRL DOCUMENT - INTERNATIONAL SHIPHOLDING CORP | Financial_Report.xls |
UNITED STATES SECURITIES AND EXCHANGE COMMISSION
WASHINGTON, D.C. 20549
FORM 10-Q
(Mark One)
|
|
[X] QUARTERLY REPORT PURSUANT TO SECTION 13 OR 15(d) OF THE SECURITIES EXCHANGE ACT OF 1934
|
For the quarterly period ended September 30, 2011
|
|
OR
|
|
[ ]
|
TRANSITION REPORT PURSUANT TO SECTION 13 OR 15(d) OF THE SECURITIES EXCHANGE ACT OF 1934
|
|
|
For the transition period from . . . . . . . . . . . . to . . . . . . . . . . . . . .
|
|
|
Commission File No. 001-10852
|
|
|
International Shipholding Corporation
|
|
|
(Exact name of registrant as specified in its charter)
|
|
Delaware
|
36-2989662
|
|
(State or other jurisdiction of
|
(I.R.S. Employer
|
|
incorporation or organization)
|
Identification No.)
|
11 North Water Street, Suite 18290, Mobile, Alabama 36602
(Address of principal executive offices) (Zip Code)
|
|
Registrant's telephone number, including area code: (251) 243-9100
|
Former name, former address and former fiscal year, if changed since last report:
Indicate by check mark whether the registrant (1) has filed all reports required to be filed by Section 13 or 15(d) of the Securities Exchange Act of 1934 during the preceding 12 months (or for such shorter period that the registrant was required to file such reports), and (2) has been subject to such filing requirements for the past 90 days.
Yes þ No ☐
Indicate by check mark whether the registrant has submitted electronically and posted on its corporate Web site, if any, every Interactive Data File required to be submitted and posted pursuant to Rule 405 of Regulation S-T during the preceding 12 months (or for such shorter period that the registrant was required to submit and post such files).
Yes þ No ☐
Indicate by check mark whether the registrant is a large accelerated filer, an accelerated filer, a non-accelerated filer, or a smaller reporting company. See definition of “large accelerated filer”, “accelerated filer” and “smaller reporting company” in Rule 12b-2 of the Exchange Act.
Large accelerated filer ¨ Accelerated filer þ
Non-accelerated filer ¨ Smaller Reporting Company ¨
Indicate by check mark whether the registrant is a shell company (as defined in Rule 12b-2 of the Exchange Act).
Yes ☐ No þ
Indicate the number of shares outstanding of each of the issuer’s classes of common stock, as of the latest practicable date.
Common stock, $1 par value. . . . . . . . 7,228,252 shares outstanding as of September 30, 2011
INTERNATIONAL SHIPHOLDING CORPORATION
In this report, the terms “we,” “us,” “our,” and the “Company” refer to International Shipholding Corporation and its subsidiaries. In addition, the term “GAAP” means U.S. generally accepted accounting principles, the term “Newbuilding” means a vessel that is under construction, the term “Notes” means the Notes to our Consolidated Financial Statements contained elsewhere in this report, the term “PCTC” means a Pure Car/Truck Carrier vessel, the term “SEC” means the U.S. Securities and Exchange Commission, and the term “USD” means U.S. Dollars.
PART I – FINANCIAL INFORMATION
ITEM 1 – FINANCIAL STATEMENTS
|
INTERNATIONAL SHIPHOLDING CORPORATION
|
||||||||||||||||
|
CONSOLIDATED STATEMENTS OF OPERATIONS
|
||||||||||||||||
|
(All Amounts in Thousands Except Share Data)
|
||||||||||||||||
|
(Unaudited)
|
||||||||||||||||
|
Three Months Ended September 30,
|
Nine Months ended September 30,
|
|||||||||||||||
|
2011
|
2010
|
2011
|
2010
|
|||||||||||||
|
Revenues
|
$ | 67,087 | $ | 74,400 | $ | 201,382 | $ | 232,398 | ||||||||
|
Operating Expenses:
|
||||||||||||||||
|
Voyage Expenses
|
46,911 | 49,925 | 147,715 | 166,381 | ||||||||||||
|
Vessel Depreciation
|
6,775 | 4,923 | 18,244 | 13,671 | ||||||||||||
|
Impairment Loss
|
- | 25,430 | - | 25,430 | ||||||||||||
|
Administrative and General Expenses
|
4,769 | 4,844 | 16,053 | 16,278 | ||||||||||||
|
Gain on Dry Bulk Transaction
|
- | - | (18,844 | ) | - | |||||||||||
|
Loss (Gain) on Sale of Other Assets
|
- | 29 | - | (46 | ) | |||||||||||
|
Total Operating Expenses
|
58,455 | 85,151 | 163,168 | 221,714 | ||||||||||||
|
Operating Income (Loss)
|
8,632 | (10,751 | ) | 38,214 | 10,684 | |||||||||||
|
Interest and Other:
|
||||||||||||||||
|
Interest Expense
|
2,850 | 1,745 | 7,470 | 5,549 | ||||||||||||
|
Derivative Loss
|
124 | 172 | 109 | 400 | ||||||||||||
|
Gain on Sale of Investment
|
(67 | ) | - | (181 | ) | (16 | ) | |||||||||
|
Other Income from Vessel Financing
|
(654 | ) | (577 | ) | (2,014 | ) | (1,771 | ) | ||||||||
|
Investment Income
|
(137 | ) | (303 | ) | (522 | ) | (1,469 | ) | ||||||||
|
Foreign Exchange Loss
|
2,664 | 3,396 | 3,075 | 6,544 | ||||||||||||
| 4,780 | 4,433 | 7,937 | 9,237 | |||||||||||||
|
Income Before Provision (Benefit) for Income Taxes and
|
||||||||||||||||
|
Equity in Net (Loss) Income of Unconsolidated Entities
|
3,852 | (15,184 | ) | 30,277 | 1,447 | |||||||||||
|
Provision (Benefit) for Income Taxes:
|
||||||||||||||||
|
Current
|
150 | 173 | 518 | 496 | ||||||||||||
|
Deferred
|
- | (224 | ) | - | (1,189 | ) | ||||||||||
|
State
|
- | - | 13 | - | ||||||||||||
| 150 | (51 | ) | 531 | (693 | ) | |||||||||||
|
Equity in Net (Loss) Income of Unconsolidated
|
||||||||||||||||
|
Entities (Net of Applicable Taxes)
|
(852 | ) | 1,310 | 22 | 4,221 | |||||||||||
|
Net Income (Loss)
|
$ | 2,850 | $ | (13,823 | ) | $ | 29,768 | $ | 6,361 | |||||||
|
Basic and Diluted Earnings Per Common Share:
|
||||||||||||||||
|
Basic Earnings Per Common Share:
|
$ | 0.40 | $ | (1.95 | ) | $ | 4.18 | $ | 0.89 | |||||||
|
Diluted Earnings Per Common Share:
|
$ | 0.40 | $ | (1.95 | ) | $ | 4.15 | $ | 0.88 | |||||||
|
Weighted Average Shares of Common Stock Outstanding:
|
||||||||||||||||
|
Basic
|
7,140,752 | 7,075,659 | 7,128,810 | 7,186,335 | ||||||||||||
|
Diluted
|
7,190,082 | 7,075,659 | 7,165,298 | 7,252,888 | ||||||||||||
|
Dividends Per Share
|
$ | 0.375 | $ | 0.375 | $ | 1.125 | $ | 1.250 | ||||||||
The accompanying notes are an integral part of these statements.
|
CONSOLIDATED BALANCE SHEETS
|
||||||||
|
(All Amounts in Thousands)
|
||||||||
|
(Unaudited)
|
||||||||
|
September 30,
|
December 31,
|
|||||||
|
ASSETS
|
2011
|
2010
|
||||||
|
Current Assets:
|
||||||||
|
Cash and Cash Equivalents
|
$ | 16,646 | $ | 24,158 | ||||
|
Restricted Cash
|
6,175 | - | ||||||
|
Marketable Securities
|
8,525 | 11,527 | ||||||
|
Accounts Receivable, Net of Allowance for Doubtful Accounts
|
||||||||
|
of $342 and $311 in 2011 and 2010, Respectively:
|
19,044 | 16,474 | ||||||
|
Federal Income Taxes Receivable
|
22 | 242 | ||||||
|
Net Investment in Direct Financing Leases
|
6,104 | 5,596 | ||||||
|
Other Current Assets
|
3,893 | 2,513 | ||||||
|
Notes Receivable
|
4,248 | 4,248 | ||||||
|
Material and Supplies Inventory, at Lower of Cost or Market
|
4,945 | 3,774 | ||||||
|
Total Current Assets
|
69,602 | 68,532 | ||||||
|
Investment in Unconsolidated Entities
|
14,452 | 27,261 | ||||||
|
Net Investment in Direct Financing Leases
|
45,462 | 50,102 | ||||||
|
Vessels, Property, and Other Equipment, at Cost:
|
||||||||
|
Vessels
|
561,219 | 365,797 | ||||||
|
Leasehold Improvements
|
26,128 | 26,128 | ||||||
|
Construction in Progress
|
13,812 | 78,355 | ||||||
|
Furniture and Equipment
|
9,367 | 7,863 | ||||||
| 610,526 | 478,143 | |||||||
|
Less - Accumulated Depreciation
|
(163,976 | ) | (143,667 | ) | ||||
| 446,550 | 334,476 | |||||||
|
Other Assets:
|
||||||||
|
Deferred Charges, Net of Accumulated Amortization
|
||||||||
|
of $15,628 and $14,525 in 2011 and 2010, Respectively:
|
16,013 | 14,482 | ||||||
|
Intangible Assets, Net
|
3,863 | - | ||||||
|
Due from Related Parties
|
3,837 | 4,124 | ||||||
|
Notes Receivable
|
36,956 | 40,142 | ||||||
|
Other
|
4,980 | 5,004 | ||||||
| 65,649 | 63,752 | |||||||
|
TOTAL ASSETS
|
$ | 641,715 | $ | 544,123 | ||||
The accompanying notes are an integral part of these statements.
|
INTERNATIONAL SHIPHOLDING CORPORATION
|
||||||||
|
CONSOLIDATED BALANCE SHEETS
|
||||||||
|
(All Amounts in Thousands)
|
||||||||
|
(Unaudited)
|
||||||||
|
September 30,
|
December 31,
|
|||||||
|
|
2011
|
2010
|
||||||
|
LIABILITIES AND STOCKHOLDERS' EQUITY
|
|
|
||||||
|
Current Liabilities:
|
||||||||
|
Current Maturities of Long-Term Debt
|
$ | 35,111 | $ | 21,324 | ||||
|
Accounts Payable and Accrued Liabilities
|
22,628 | 32,114 | ||||||
|
Total Current Liabilities
|
57,739 | 53,438 | ||||||
|
Long-Term Debt, Less Current Maturities
|
264,314 | 200,241 | ||||||
|
Other Long-Term Liabilities:
|
||||||||
|
Deferred Income Taxes
|
135 | - | ||||||
|
Lease Incentive Obligation
|
6,675 | 7,022 | ||||||
|
Other
|
57,544 | 49,672 | ||||||
|
TOTAL LIABILITIES
|
386,407 | 310,373 | ||||||
|
Stockholders' Equity:
|
||||||||
|
Common Stock
|
8,590 | 8,564 | ||||||
|
Additional Paid-In Capital
|
85,449 | 84,846 | ||||||
|
Retained Earnings
|
205,006 | 183,541 | ||||||
|
Treasury Stock
|
(25,403 | ) | (25,403 | ) | ||||
|
Accumulated Other Comprehensive Loss
|
(18,334 | ) | (17,798 | ) | ||||
|
TOTAL STOCKHOLDERS' EQUITY
|
255,308 | 233,750 | ||||||
|
TOTAL LIABILITIES AND STOCKHOLDERS' EQUITY
|
$ | 641,715 | $ | 544,123 | ||||
The accompanying notes are an integral part of these statements.
|
CONSOLIDATED STATEMENTS OF CASH FLOWS
|
||||||||
|
(All Amounts in Thousands)
|
||||||||
|
|
Nine Months Ended September 30,
|
|||||||
|
2011
|
2010
|
|||||||
|
Cash Flows from Operating Activities:
|
||||||||
|
Net Income
|
$ | 29,768 | $ | 6,361 | ||||
|
Adjustments to Reconcile Net Income to Net Cash Provided by
|
||||||||
|
Operating Activities:
|
||||||||
|
Depreciation
|
18,988 | 14,400 | ||||||
|
Amortization of Deferred Charges and Other Assets
|
6,438 | 7,095 | ||||||
|
Deferred Benefit for Income Taxes
|
- | (1,189 | ) | |||||
|
Gain on Acquisition
|
(18,844 | ) | - | |||||
|
Impairment Loss
|
- | 25,430 | ||||||
|
Non-Cash Stock Based Compensation
|
1,404 | 1,926 | ||||||
|
Equity in Net Income of Unconsolidated Entities
|
(22 | ) | (4,221 | ) | ||||
|
Distributions from Unconsolidated Entities
|
750 | 2,250 | ||||||
|
Gain on Sale of Assets
|
- | (46 | ) | |||||
|
Gain on Sale of Investments
|
(181 | ) | (16 | ) | ||||
|
Loss on Foreign Currency Exchange
|
3,075 | 6,544 | ||||||
|
Changes in:
|
||||||||
|
Deferred Drydocking Charges
|
(5,370 | ) | (765 | ) | ||||
|
Accounts Receivable
|
(2,570 | ) | (2,474 | ) | ||||
|
Inventories and Other Current Assets
|
(1,129 | ) | (12 | ) | ||||
|
Other Assets
|
25 | 640 | ||||||
|
Accounts Payable and Accrued Liabilities
|
(2,190 | ) | (5,074 | ) | ||||
|
Other Long-Term Liabilities
|
(174 | ) | (314 | ) | ||||
|
Net Cash Provided by Operating Activities
|
29,968 | 50,535 | ||||||
|
Cash Flows from Investing Activities:
|
||||||||
|
Principal payments received under Direct Financing Leases
|
4,132 | 4,213 | ||||||
|
Capital Improvements to Vessels, Leasehold Improvements, and Other Assets
|
(82,199 | ) | (80,065 | ) | ||||
|
Proceeds from Sale of Assets
|
- | 3,853 | ||||||
|
Purchase of Marketable Securities
|
(79 | ) | (8,806 | ) | ||||
|
Proceeds from Sale of Marketable Securities
|
2,523 | 598 | ||||||
|
Investment in Unconsolidated Entities
|
(2,046 | ) | (3,334 | ) | ||||
|
Acquisition of Unconsolidated Entity
|
7,092 | - | ||||||
|
Net Increase in Restricted Cash Account
|
(6,175 | ) | - | |||||
|
Proceeds from Note Receivables
|
3,101 | 4,422 | ||||||
|
Net Cash Used In Investing Activities
|
(73,651 | ) | (79,119 | ) | ||||
|
Cash Flows from Financing Activities:
|
||||||||
|
Common Stock Repurchase
|
- | (5,231 | ) | |||||
|
Proceeds from Issuance of Debt
|
103,979 | 132,185 | ||||||
|
Repayment of Debt
|
(57,748 | ) | (103,094 | ) | ||||
|
Payments for Deferred Financing Charges
|
(1,757 | ) | (1,103 | ) | ||||
|
Common Stock Dividends Paid
|
(8,303 | ) | (9,228 | ) | ||||
|
Net Cash Provided by Financing Activities
|
36,171 | 13,529 | ||||||
|
Net Decrease in Cash and Cash Equivalents
|
(7,512 | ) | (15,055 | ) | ||||
|
Cash and Cash Equivalents at Beginning of Period
|
24,158 | 47,468 | ||||||
|
Cash and Cash Equivalents at End of Period
|
$ | 16,646 | $ | 32,413 | ||||
The accompanying notes are an integral part of these statements.
NOTES TO CONDENSED CONSOLIDATED FINANCIAL STATEMENTS
September 30, 2011
(Unaudited)
Note 1. Basis of Preparation
We have prepared the accompanying unaudited interim financial statements pursuant to the rules and regulations of the Securities and Exchange Commission, and as permitted thereunder we have omitted certain information and footnote disclosures required by U.S. Generally Accepted Accounting Principles (GAAP) for complete financial statements. We suggest that you read these interim statements in conjunction with the financial statements and notes thereto included in our Annual Report on Form 10-K for the year ended December 31, 2010. The condensed consolidated balance sheet as of December 31, 2010 included in this report has been derived from the audited financial statements at that date.
The foregoing 2011 interim results are not necessarily indicative of the results of operations for the full year 2011. Management believes that it has made all adjustments necessary, consisting only of normal recurring adjustments, for a fair statement of the information shown.
Our policy is to consolidate each subsidiary in which we hold a greater than 50% voting interest or otherwise control its operating and financial activities. We use the equity method to account for investments in entities in which we hold a 20% to 50% voting or economic interest and have the ability to exercise significant influence over their operating and financial activities. We use the cost method to account for investments in entities in which we hold a less than 20% voting interest and in which we cannot exercise significant influence over operating and financial activities.
Revenues and expenses relating to our Rail-Ferry Service and Contracts of Affreightment segment’s voyages are recorded over the duration of the voyage. Our voyage expenses are estimated at the beginning of the voyages based on historical actual costs or from industry sources familiar with those types of charges. As the voyage progresses, these estimated costs are revised with actual charges and timely adjustments are made. The expenses are ratably expensed over the voyage based on the number of days in progress at the end of the period. Based on our prior experience, we believe there is no material difference between recording estimated expenses ratably over the voyage versus recording expenses as incurred. Revenues and expenses relating to our other segments' voyages, which require no estimates or assumptions, are recorded when earned or incurred during the reporting period.
We have eliminated all significant intercompany balances, accounts and transactions.
Note 2. Employee Benefit Plans
The following table provides the components of net periodic benefit cost for our pension plan and postretirement benefits plan for the three months ended September 30, 2011 and 2010:
|
Pension Plan
|
Postretirement Benefits
|
|||||||||||||||
|
(All Amounts in Thousands)
|
Three Months Ended September 30,
|
Three Months Ended September 30,
|
||||||||||||||
|
Components of net periodic benefit cost:
|
2011
|
2010
|
2011
|
2010
|
||||||||||||
|
Service cost
|
$ | 135 | $ | 99 | $ | (2 | ) * | $ | 5 | |||||||
|
Interest cost
|
380 | 304 | 140 | 99 | ||||||||||||
|
Expected return on plan assets
|
(479 | ) | (353 | ) | - | - | ||||||||||
|
Amortization of prior service cost
|
(1 | ) | (1 | ) | (3 | ) | (3 | ) | ||||||||
|
Amortization of Net Loss
|
107 | 71 | 52 | - | ||||||||||||
|
Net periodic benefit cost
|
$ | 142 | $ | 120 | $ | 187 | $ | 101 | ||||||||
*The estimated service cost during the first and second quarters was reduced down for the full year 2011, the quarter amount of ($2) reflects this adjustment.
The following table provides the components of net periodic benefit cost for our pension plan and postretirement benefits plan for the nine months ended September 30, 2011 and 2010:
|
(All Amounts in Thousands)
|
Pension Plan
|
Postretirement Benefits
|
||||||||||||||
|
Nine Months Ended September 30,
|
Nine Months Ended September 30,
|
|||||||||||||||
|
Components of net periodic benefit cost:
|
2011
|
2010
|
2011
|
2010
|
||||||||||||
|
Service cost
|
$ | 407 | $ | 379 | $ | 42 | $ | 15 | ||||||||
|
Interest cost
|
1,116 | 1,048 | 426 | 297 | ||||||||||||
|
Expected return on plan assets
|
(1,429 | ) | (1,207 | ) | - | - | ||||||||||
|
Amortization of prior service cost
|
(3 | ) | (3 | ) | (9 | ) | (9 | ) | ||||||||
|
Amortization of Net Loss
|
274 | 243 | 162 | - | ||||||||||||
|
Net periodic benefit cost
|
$ | 365 | $ | 460 | $ | 621 | $ | 303 | ||||||||
We contributed $1.2 million to our pension plan this year through October 2011 and will continue to evaluate if any further contributions are needed.
Note 3. Operating Segments
Our four operating segments, Time Charter Contracts – U.S. Flag, Time Charter Contracts – International Flag, Contracts of Affreightment (“COA”), and Rail-Ferry Service, are identified primarily by the characteristics of the contracts and terms under which our vessels are operated. Beginning with the second quarter 2010 Form 10-Q report, we split Time Charter Contracts into two different operating segments, Time Charter Contracts – U.S. Flag and Time Charter Contracts – International Flag. As a result of this change, we recast all prior period data for the previous Time Charter Contracts Segment based on the new operating segments. We report in the Other category the results of several of our subsidiaries that provide ship and cargo charter brokerage and agency services. We manage each reportable segment separately, as each requires different resources depending on the nature of the contract or terms under which each vessel within the segment operates.
We allocate interest expense to the segments in proportion to the book values of the vessels owned within each segment. We do not allocate to our segments administrative and general expenses, investment income, gain on sale of investment, equity in net income of unconsolidated entities, foreign exchange loss, gain on Dry Bulk transaction, derivative loss or income taxes. Intersegment revenues are based on market prices and include revenues earned by our subsidiaries that provide specialized services to our operating companies.
The following table presents information about segment profit and loss for the three months ended September 30, 2011 and 2010:
|
|
|
|
||||||||||||||||||||||
|
(All Amounts in Thousands)
|
Time Charter Contracts-
U.S. Flag
|
Time Charter Contracts- International Flag
|
COA
|
Rail-Ferry Service
|
Other
|
Total
|
||||||||||||||||||
|
2011
|
||||||||||||||||||||||||
|
Revenues from External Customers
|
$ | 38,069 | $ | 14,609 | $ | 4,766 | $ | 9,121 | $ | 522 | $ | 67,087 | ||||||||||||
|
Intersegment Revenues (Eliminated)
|
- | - | - | - | (4,664 | ) | (4,664 | ) | ||||||||||||||||
|
Intersegment Expenses (Eliminated)
|
- | - | - | - | 4,664 | 4,664 | ||||||||||||||||||
|
Voyage Expenses
|
27,233 | 7,173 | 4,685 | 7,685 | 135 | 46,911 | ||||||||||||||||||
|
Vessel Depreciation
|
2,707 | 3,151 | - | 915 | 2 | 6,775 | ||||||||||||||||||
|
Gross Voyage Profit
|
8,129 | 4,285 | 81 | 521 | 385 | 13,401 | ||||||||||||||||||
|
Interest Expense
|
913 | 1,688 | - | 155 | 94 | 2,850 | ||||||||||||||||||
|
Segment Profit
|
7,216 | 2,597 | 81 | 366 | 291 | 10,551 | ||||||||||||||||||
|
2010
|
||||||||||||||||||||||||
|
Revenues from External Customers
|
$ | 49,250 | $ | 10,716 | $ | 4,200 | $ | 9,668 | $ | 566 | $ | 74,400 | ||||||||||||
|
Intersegment Revenues (Eliminated)
|
- | - | - | - | (6,458 | ) | (6,458 | ) | ||||||||||||||||
|
Intersegment Expenses (Eliminated)
|
- | - | - | - | 6,458 | 6,458 | ||||||||||||||||||
|
Voyage Expenses
|
32,835 | 6,704 | 4,127 | 6,035 | 224 | 49,925 | ||||||||||||||||||
|
Vessel Depreciation
|
2,458 | 990 | - | 1,472 | 3 | 4,923 | ||||||||||||||||||
|
Impairment Loss
|
- | - | - | 25,430 | - | 25,430 | ||||||||||||||||||
|
Gross Voyage Profit (Loss)
|
13,957 | 3,022 | 73 | (23,269 | ) | 339 | (5,878 | ) | ||||||||||||||||
|
Interest Expense
|
700 | 602 | - | 328 | 115 | 1,745 | ||||||||||||||||||
|
Segment Profit (Loss)
|
13,257 | 2,420 | 73 | (23,597 | ) | 224 | (7,623 | ) | ||||||||||||||||
The following table presents information about segment profit and loss for the nine months ended September 30, 2011 and 2010:
|
|
|
|||||||||||||||||||||||
|
(All Amounts in Thousands)
|
Time Charter Contracts-
U.S. Flag
|
Time Charter Contracts-International Flag
|
COA
|
Rail-Ferry Service
|
Other
|
Total
|
||||||||||||||||||
|
2011
|
||||||||||||||||||||||||
|
Revenues from External Customers
|
$ | 116,381 | $ | 41,777 | $ | 13,497 | $ | 27,894 | $ | 1,833 | $ | 201,382 | ||||||||||||
|
Intersegment Revenues (Eliminated)
|
- | - | - | - | (13,995 | ) | (13,995 | ) | ||||||||||||||||
|
Intersegment Expenses (Eliminated)
|
- | - | - | - | 13,995 | 13,995 | ||||||||||||||||||
|
Voyage Expenses
|
87,190 | 22,516 | 13,597 | 23,973 | 439 | 147,715 | ||||||||||||||||||
|
Vessel Depreciation
|
7,712 | 7,837 | - | 2,687 | 8 | 18,244 | ||||||||||||||||||
|
Gross Voyage Profit (Loss)
|
21,479 | 11,424 | (100 | ) | 1,234 | 1,386 | 35,423 | |||||||||||||||||
|
Interest Expense
|
2,267 | 4,326 | - | 541 | 336 | 7,470 | ||||||||||||||||||
|
Segment Profit (Loss)
|
19,212 | 7,098 | (100 | ) | 693 | 1,050 | 27,953 | |||||||||||||||||
|
2010
|
||||||||||||||||||||||||
|
Revenues from External Customers
|
$ | 159,093 | $ | 37,744 | $ | 12,672 | $ | 21,017 | $ | 1,872 | $ | 232,398 | ||||||||||||
|
Intersegment Revenues (Eliminated)
|
- | - | - | - | (13,899 | ) | (13,899 | ) | ||||||||||||||||
|
Intersegment Expenses (Eliminated)
|
- | - | - | - | 13,899 | 13,899 | ||||||||||||||||||
|
Voyage Expenses
|
111,003 | 24,245 | 12,495 | 17,801 | 837 | 166,381 | ||||||||||||||||||
|
Vessel Depreciation
|
7,369 | 1,984 | - | 4,310 | 8 | 13,671 | ||||||||||||||||||
|
Impairment Loss
|
- | - | - | 25,430 | - | 25,430 | ||||||||||||||||||
|
Gross Voyage Profit (Loss)
|
40,721 | 11,515 | 177 | (26,524 | ) | 1,027 | 26,916 | |||||||||||||||||
|
Interest Expense
|
2,241 | 1,895 | - | 1,036 | 378 | 5,549 | ||||||||||||||||||
|
Segment Profit (Loss)
|
38,480 | 9,620 | 177 | (27,560 | ) | 649 | 21,367 | |||||||||||||||||
The following table is a reconciliation of the totals reported for the operating segments to the applicable line items in the consolidated financial statements:
|
(All Amounts in Thousands)
|
Nine Months Ended September 30,
|
Three Months Ended September 30,
|
||||||||||||||
|
Profit or Loss:
|
2011
|
2010
|
2011
|
2010
|
||||||||||||
|
Total Profit (Loss) for Reportable Segments
|
$ | 27,953 | $ | 21,367 | $ | 10,551 | $ | (7,623 | ) | |||||||
|
Unallocated Amounts:
|
||||||||||||||||
|
Administrative and General Expenses
|
(16,053 | ) | (16,278 | ) | (4,769 | ) | (4,844 | ) | ||||||||
|
Gain (Loss) on Sale of Other Assets
|
- | 46 | - | (29 | ) | |||||||||||
|
Derivative Loss
|
(109 | ) | (400 | ) | (124 | ) | (172 | ) | ||||||||
|
Gain on Sale of Investment
|
181 | 16 | 67 | - | ||||||||||||
|
Other Income from Vessel Financing
|
2,014 | 1,771 | 654 | 577 | ||||||||||||
|
Investment Income
|
522 | 1,469 | 137 | 303 | ||||||||||||
|
Foreign Exchange Loss
|
(3,075 | ) | (6,544 | ) | (2,664 | ) | (3,396 | ) | ||||||||
|
Gain on Dry Bulk Acquisition
|
18,844 | - | - | - | ||||||||||||
|
Income Before Provision (Benefit) for Net Income (Loss)
|
||||||||||||||||
|
Taxes and Equity in Net Income of Unconsolidated Entities
|
$ | 30,277 | $ | 1,447 | $ | 3,852 | $ | (15,184 | ) | |||||||
Note 4. Unconsolidated Entities
In 2003, we acquired for $3,479,000 a 50% investment in Dry Bulk Cape Holding Inc. (“Dry Bulk”), which as of December 31, 2010, owned 100% of subsidiary companies owning two Capesize Bulk Carriers and two Handymax Bulk Carrier Newbuildings on order for delivery in 2012. Historically, we have accounted for this investment under the equity method and our share of earnings or losses has been reported in our consolidated statements of operations, net of taxes. On March 25, 2011, we acquired 100% ownership of Dry Bulk. Following the acquisition, Dry Bulk’s results are no longer accounted for under the equity method. For further information on this acquisition, see Note 5 below.
Our portion of earnings of Dry Bulk for the first three months of 2011, recorded under the equity method, was $1.3 million, net of taxes of $0. For the nine months ended September 30, 2010, our portions of earnings of Dry Bulk was $5.0 million, net of taxes of $4.0 million. Historically, we did not provide for income taxes related to our earnings from Dry Bulk as a result of the U. S. tax law in effect prior to 2010. This tax law expired effective January 1, 2010, resulting in income taxes being applicable to our earnings from Dry Bulk during the first three quarters of 2010. After Congress eliminated the need for a tax provision on these amounts in late 2010, we reversed our 2010 provision for taxes in the fourth quarter of 2010.
During the first quarter of 2011 we received a $750,000 cash dividend distribution from Dry Bulk prior to acquiring full ownership of it on March 25, 2011 and a $2.3 million cash dividend distribution in the first nine months of 2010.
The unaudited condensed results of operations of Dry Bulk through March 25, 2011, when we acquired 100% of its stock included operating revenues of $4.8 million, operating income of $2.9 million, and net income of $2.6 million. Summarized below are the unaudited condensed results of operations of Dry Bulk for the three months ended September 30, 2010 and nine months ended September 30, 2010:
|
Three Months Ended September 30,
|
Nine Months Ended September 30,
|
||||||
|
(Amounts in Thousands)
|
2010
|
2010
|
|||||
|
Operating Revenues
|
$6,407
|
$22,320
|
|||||
|
Operating Income
|
$4,432
|
$16,031
|
|||||
|
Net Income
|
$4,225
|
$17,602
|
|||||
In December 2009, we acquired for $6.25 million a 25% investment in Oslo Bulk AS (“Oslo Bulk”) which in 2008, contracted to build eight new Mini Bulkers. All of the Mini-Bulkers have been delivered and deployed as of July 2011. During 2010, we invested an additional $3.9 million in Tony Bulkers Pte Ltd. (“Tony Bulkers”), an affiliate of Oslo Bulk AS, for our 25% share of the installment payments for two additional new Mini-Bulkers, both of which have been delivered and deployed as of July 2011. We paid approximately $1.7 million in January 2011 for our remaining share of installment payments associated with these two Mini-Bulkers. These investments are accounted for under the equity method and our share of earnings or losses is reported in our consolidated statements of operations, net of taxes. All ten of these Mini-Bulkers are managed by an affiliate of Oslo Bulk. Our portion of the aggregate earnings of Oslo Bulk, which included final 2010 income adjustments of $143,000, was a loss of $1.3 million for the nine months ended September 30, 2011, largely due to initial positioning voyages on the newly delivered vessels and lower than expected average charter rates. Also included in the Oslo Bulk results was a negative mark-to-market adjustment of $603,000 on an ineffective interest rate swap contract. Our portion of the earnings of our remaining investments in unconsolidated entities was a loss of $159,000.
Note 5. Dry Bulk Cape Holding, Inc. Step Acquisition
On March 25, 2011, Cape Holding, Ltd. (one of our indirect wholly-owned subsidiaries) and DryLog Ltd. completed a transaction that restructured their respective 50% interests in Dry Bulk.
Prior to this transaction, Dry Bulk controlled through various subsidiaries two Cape Size vessels and two Handymax Newbuildings. In connection with this transaction, (i) Cape Holding, Ltd. increased its ownership in Dry Bulk from 50% to 100% and (ii) in consideration, DryLog Ltd. received ownership of two former Dry Bulk subsidiaries holding one Cape Size vessel and one shipbuilding contract relating to a Handymax vessel scheduled to be delivered in the second quarter of 2012. Following the transfer of these subsidiaries, Dry Bulk continues to control through two subsidiaries, one Cape Size vessel and one shipbuilding contract relating to a Handymax vessel scheduled to be delivered in the first quarter of 2012. As a result of completing this transaction, we now own 100% of Dry Bulk and have complete control of the two remaining vessels.
During the first quarter of 2011, we retained an independent, third party firm with shipping industry experience to assist us in determining the fair value of Dry Bulk and the fair value of our previous 50% interest in Dry Bulk.
At the time of the acquisition, the assets of Dry Bulk consisted of cash, trade receivables, prepayments, inventory, two capesize vessels, two handysize vessels under construction and time charter agreements on the two capesize vessels which expire in early 2013 and are currently fixed at attractive time charter rates. Current liabilities consisted primarily of accrued interest on debt and the non-current liabilities consisting primarily of floating rate bank borrowings. With the exception of the capesize vessels and the intangible value assigned to the above-market time charter contracts, the fair value of all assets and liabilities were equal to the carrying values.
As of March 31, 2011, the combined appraised value for both capesize vessels was $84.0 million as compared to the book value of approximately $53.6 million. In determining the appraised fair value of the capesize vessels, the cost and comparable sales approaches were used with equal weight applied to each approach. In addition to the fair value adjustment on the capesize vessels, an intangible asset was established reflecting the difference between the existing value of the time charter contracts in place as compared to current market rates for similar vessels under short-term contracts, discounted back to present value. Based on the income approach, the fair value of the intangible asset was calculated to be $10.4 million and will be amortized over the remaining life of both contracts, each of which is set to expire on January 7, 2013. As a result of the combined fair value adjustments noted above, we concluded that the total fair value of the net assets of Dry Bulk acquired was $69.0 million.
In order to arrive at the fair value of our existing interest in Dry Bulk, 50% of the total fair value of $69.0 million was discounted by 5.1%, reflecting our lack of control of Dry Bulk as a 50% owner. The discount rate of 5.1% was derived from a sample of recent industry data. As a result, we concluded that the fair value of our existing 50% interest was $32.7 million.
Under Accounting Standards Codification 805, a step up to fair value is required when an equity interest changes from a non-controlling interest to a controlling interest (step acquisition). Based on the step up from a 50% interest to a 100% interest in Dry Bulk, a gain of approximately $18.3 million was generated by taking the difference between the fair value of our previously held 50% interest less the book value of the previously held interest. This calculation is shown below:
Fair Value of Previously Held 50% Interest $32.7M
Less: Book Value of Previously Held Interest (14.4)M
Gain on Previously Held 50% Interest $18.3M
We also recognized a bargain purchase gain of $0.5 million with respect to the step up to fair value of the 50% interest we acquired, calculated as follows:
Fair Value of Net Assets Acquired $69.0M
Less: Fair Value of Purchase Consideration (35.8)M
Less: Fair Value of Previously Held 50% Interest (32.7)M
Bargain Purchase Gain $ 0.5M
Previously, we accounted for our non-controlling interest in Dry Bulk under the equity method. We now include the financial results of Dry Bulk in our consolidated financial results, which include revenues and net income for Dry Bulk for the third quarter of 2011 of $2.4 million and $366,000, respectively. The year to date results since the acquisition of Dry Bulk in our consolidated financial results included revenue and net income of $4.7 million and $1.2 million, respectively. Assuming we recorded this transaction on January 1, 2010, our consolidated financial results for the three month periods ending September 30, 2010 and September 30, 2011 and the nine months ending September 30, 2010 and September 30, 2011 would not have been materially different from what we actually reported. As such, we have not disclosed in this report any proforma financial information for either of these periods.
Note 6. Earnings Per Share
We compute basic earnings per share based on the weighted average number of common shares issued and outstanding during the relevant periods. Diluted earnings per share also reflects dilutive potential common shares, including shares issuable under restricted stock grants using the treasury stock method.
The calculation of basic and diluted earnings per share is as follows (in thousands except share amounts):
|
Three Months Ended September 30,
|
Nine Months Ended September 30,
|
|||||||||||||||
|
2011
|
2010
|
2011
|
2010
|
|||||||||||||
|
Numerator
|
||||||||||||||||
|
Net Income (Loss) – Basic:
|
||||||||||||||||
| $ | 2,850 | $ | (13,823 | ) | $ | 29,768 | $ | 6,361 | ||||||||
|
Net Income (Loss) – Diluted:
|
||||||||||||||||
| $ | 2,850 | $ | (13,823 | ) | $ | 29,768 | $ | 6,361 | ||||||||
|
Denominator
|
||||||||||||||||
|
Weighted Avg Shares of Common Stock Outstanding:
|
||||||||||||||||
|
Basic
|
7,140,752 | 7,075,659 | 7,128,810 | 7,186,335 | ||||||||||||
|
Plus:
|
||||||||||||||||
|
Effect of dilutive restrictive stock
|
49,330 | - | 36,488 | 66,553 | ||||||||||||
|
Diluted
|
7,190,082 | 7,075,659 | 7,165,298 | 7,252,888 | ||||||||||||
|
Basic and Diluted Earnings Per Common Share:
|
||||||||||||||||
|
Basic Earnings per Common Share
|
$ | 0.40 | $ | (1.95 | ) | $ | 4.18 | $ | 0.89 | |||||||
|
Diluted Earnings per Common Share
|
$ | 0.40 | $ | (1.95 | ) | $ | 4.15 | $ | 0.88 | |||||||
Note 7. Comprehensive Income (Loss)
The following table summarizes components of comprehensive income (loss) for the three months ended September 30, 2011 and 2010:
|
Three Months Ended September 30,
|
||||||||
|
(Amounts in Thousands)
|
2011
|
2010
|
||||||
|
Net Income (Loss)
|
$ | 2,850 | $ | (13,823 | ) | |||
|
Other Comprehensive Income (Loss):
|
||||||||
|
Unrealized Foreign Currency Translation Loss
|
(150 | ) | (31 | ) | ||||
|
Unrealized Holding (Loss) Gain on Marketable Securities, Net of
Deferred Taxes of ($36) and $85, respectively
|
(103 | ) | 158 | |||||
|
Net Change in Fair Value of Derivatives, Net of Deferred Taxes
of $112 and ($127), respectively
|
(843 | ) | (1,355 | ) | ||||
|
Total Comprehensive Income (Loss)
|
$ | 1,754 | $ | (15,051 | ) | |||
The following table summarizes components of comprehensive income for the nine months ended September 30, 2011 and 2010:
|
Nine Months Ended September 30,
|
||||||||
|
(Amounts in Thousands)
|
2011
|
2010
|
||||||
|
Net Income
|
$ | 29,768 | $ | 6,361 | ||||
|
Other Comprehensive Income (Loss):
|
||||||||
|
Unrealized Foreign Currency Translation Loss
|
(76 | ) | (7 | ) | ||||
|
Unrealized Holding (Loss) Gain on Marketable Securities, Net of
Deferred Taxes of ($7) and $213, respectively
|
(20 | ) | 396 | |||||
|
Net Change in Fair Value of Derivatives, Net of Deferred Taxes
of $196 and ($148), respectively
|
(440 | ) | (3,296 | ) | ||||
|
Total Comprehensive Income
|
$ | 29,232 | $ | 3,454 | ||||
Note 8. Income Taxes
We recorded a provision for income taxes of $531,000 on our $30.3 million of income before equity in net income of unconsolidated entities in the first nine months of 2011. For the first nine months of 2010 our benefit for income taxes was $693,000 on our $1.4 million of income before equity in net income of unconsolidated entities. The decrease in our benefit for income taxes was based on improvements in our operations taxed at the U.S. corporate statutory rate and the need to record a valuation allowance on certain deferred tax assets. Our qualifying U.S. flag operations continue to be taxed under a “tonnage tax” regime rather than under the normal U.S. corporate income tax regime. For further information on certain tax laws and elections, see our Annual Report on Form 10-K filed for the year ended December 31, 2010, including Note F to the consolidated financial statements included therein.
Note 9. Fair Value Measurements
ASC Topic 820 defines fair value as the price that would be received to sell an asset or paid to transfer a liability in an orderly transaction between market participants. A fair value measurement assumes the transaction to sell the asset or transfer the liability occurs in the principal market for the asset or liability or, in the absence of a principal market, the most advantageous market for the asset or liability. Under ASC Topic 820, the price in the principal (or most advantageous) market used to measure the fair value of the asset or liability is not adjusted for transaction costs. An orderly transaction is a transaction that assumes exposure to the market for a period prior to the measurement date to allow for marketing activities that are usual and customary for transactions involving such assets and liabilities; it is not a forced transaction. Market participants are buyers and sellers in the principal market that are (i) independent, (ii) knowledgeable, and (iii) able and willing to complete a transaction.
Fair value measurements require the use of valuation techniques that are consistent with one or more of the following: the market approach, the income approach or the cost approach. The market approach uses prices and other relevant information generated by market transactions involving identical or comparable assets and liabilities. The income approach uses valuation techniques to convert future amounts, such as cash flows or earnings, to a single present value on a discounted basis. The cost approach is based on the amount that currently would be required to replace the service capacity of an asset (replacement cost). Valuation techniques should be consistently applied. The fair value of our interest rate swap agreements is based upon the approximate amounts required to settle the contracts. Inputs to valuation techniques refer to the assumptions that market participants would use in pricing the asset or liability. Inputs may be observable, meaning those that reflect the assumptions market participants would use in pricing the asset or liability developed based on market data obtained from independent sources, or unobservable, meaning those that reflect the reporting entity's own assumptions about the assumptions market participants would use in pricing the asset or liability developed based on the best information available under the circumstances. In that regard, ASC Topic 820 establishes a fair value hierarchy for valuation inputs that gives the highest priority to quoted prices in active markets for identical assets or liabilities and the lowest priority to unobservable inputs. The fair value hierarchy is as follows:
w Level 1 Inputs - Unadjusted quoted prices in active markets for identical assets or liabilities that the reporting entity has the ability to access at the measurement date.
w Level 2 Inputs - Inputs other than quoted prices included in Level 1 that are observable for the asset or liability, either directly or indirectly. These might include quoted prices for similar assets or liabilities in active markets, quoted prices for identical or similar assets or liabilities in markets that are not active, inputs other than quoted prices that are observable for the asset or liability (including interest rates, volatilities, prepayment speeds, credit risks) or inputs that are derived principally from or corroborated by market data by correlation or other means.
w Level 3 Inputs - Unobservable inputs for determining the fair values of assets or liabilities that reflect an entity's own assumptions about the assumptions that market participants would use in pricing the assets or liabilities.
The following table summarizes certain of our financial assets and financial liabilities measured at fair value on a recurring and non-recurring basis as of September 30, 2011, segregated by the above-described levels of valuation inputs:
|
(Amounts in thousands)
|
Level 1 Inputs
|
Level 2 Inputs
|
Level 3 Inputs
|
Total Fair Value
|
||||||||||||
|
Marketable securities
|
$ | 8,525 | $ | - | $ | - | $ | 8,525 | ||||||||
|
Derivative assets
|
$ | - | $ | 304 | $ | - | $ | 304 | ||||||||
|
Derivative liabilities
|
$ | - | $ | (10,119 | ) | $ | - | $ | (10,119 | ) | ||||||
|
Vessels (1)
|
$ | - | $ | 37,070 | $ | - | $ | 37,070 | ||||||||
(1) Represents the appraised fair value of the Rail-Ferry vessels after the impairment charge taken in the third quarter of 2010. The valuation technique used was a weighted average of the cost, comparable sales and income approach.
Note 10. Marketable Securities
We have categorized all marketable securities as available-for-sale securities. Management performs a quarterly evaluation of marketable securities for any other-than-temporary impairment. We determined that none of our securities were impaired as of September 30, 2011.
The following table includes cost and valuation information on our investment securities at September 30, 2011:
|
(Amounts In Thousands)
|
AOCI**
|
|||||||
|
Unrealized
|
||||||||
|
Securities Available for Sale
|
Cost Basis
|
Holding Loss
|
Fair Value
|
|||||
|
Corporate Bonds*/Mutual Funds
|
$ 8,545
|
$ 20
|
$ 8,525
|
|||||
|
Total
|
$ 8,545
|
$ 20
|
$ 8,525
|
|||||
|
* Various maturity dates from February 2014 – October 2016.
|
||||||||
** Accumulated Other Comprehensive Income
Note 11. New Accounting Pronouncements
In May 2011, the Financial Accounting Standard Board (“FASB”) issued ASU 2011-04, Fair Value Measurement (Topic 820): Amendments to Achieve Common Fair Value Measurement and Disclosure Requirements in U.S. GAAP and IFRSs. ASU 2011-04 clarifies some existing concepts, eliminates wording differences between U.S. GAAP and International Financial Reporting Standards (“IFRS”), and in some limited cases, changes some principles to achieve convergence between U.S. GAAP and IFRS. ASU 2011-04 results in a consistent definition of fair value and common requirements for measurement of and disclosure about fair value between U.S. GAAP and IFRS. ASU 2011-04 also expands the disclosures for fair value measurements that are estimated using significant unobservable (Level 3) inputs. ASU 2011-04 will be effective for International Shipholding Corporation beginning after December 15, 2011. We do not expect the adoption of ASU 2011-04 to have a material effect on our operating results or financial position.
In June 2011, the FASB issued ASU 2011-05, Presentation of Comprehensive Income , which requires an entity to present the total of comprehensive income, the components of net income, and the components of other comprehensive income either in a single continuous statement of comprehensive income, or in two separate but consecutive statements. ASU 2011-05 eliminates the option to present components of other comprehensive income as part of the statement of equity. ASU 2011-05 will be effective for International Shipholding Corporation beginning after December 15, 2011. We do not expect the adoption of ASU 2011-05 to have a material effect on our operating results or financial position, and will apply these new requirements starting in the first quarter of 2012.
Note 12. Stock Based Compensation
A summary of the activity for restricted stock awards during the nine months ended September 30, 2011 is as follows:
|
Shares
|
Weighted Average Fair Value Per Share
|
|
|
Non-vested –December 31, 2010
|
132,500
|
$22.38
|
|
Shares Granted
|
51,934
|
$26.27
|
|
Shares Vested
|
(96,934)
|
$23.98
|
|
Non-vested – September 30, 2011
|
87,500
|
$22.91
|
The following table, relating to the Company’s restricted stock grants as of September 30, 2011, summarizes the future amortization of unrecognized compensation cost, which we will include in future administrative and general expenses.
|
Grant Date
|
2011
|
2012
|
Total
|
|||||||||
|
April 30, 2008
|
$ | 101,000 | $ | 55,000 | $ | 156,000 | ||||||
|
January 14, 2011
|
$ | 30,000 | $ | - | $ | 30,000 | ||||||
|
January 27, 2011
|
$ | 266,000 | $ | 267,000 | $ | 533,000 | ||||||
|
Total
|
$ | 397,000 | $ | 322,000 | $ | 719,000 | ||||||
For the nine months ended September 30, 2011, our income before taxes and net income included $1,404,000 and $913,000, respectively, of stock-based compensation expense charges, which reduced both basic and diluted earnings per share by $0.12 per share. For the nine months ended September 30, 2010, our income before taxes and net income included $1,926,000 and $1,252,000, respectively, of stock-based compensation expense charges, which reduced both basic and diluted earnings per share by $0.17 per share.
For the three months ended September 30, 2011, our income before taxes and net income included $398,000 and $259,000, respectively, of stock-based compensation expense charges, which reduced both basic and diluted earnings per share by $0.03 per share. For the three months ended September 30, 2010, our income before taxes and net income included $527,000 and $343,000, respectively, of stock-based compensation expense charges, which reduced both basic and diluted earnings per share by $0.05 per share.
On January 14, 2011, our Independent Directors received an unrestricted grant of a total of 4,434 shares of common stock from the 2009 Stock Incentive Plan.
On January 27, 2011, our Compensation Committee granted a total of 47,500 shares of restricted stock to certain executive officers. The shares vest on the day in 2012 when we file our Form 10-K annual report for the fiscal year 2011, contingent upon the Company achieving certain performance measures for fiscal year 2011 and the executive officer remaining employed by us on such date. The fair value of the Company’s restricted stock, which is determined using the average stock price as of the date of the grant, is applied to the total shares that are expected to fully vest and is amortized to compensation expense on a straight-line basis over the vesting period.
Note 13. Derivative Instruments
We use derivative instruments to manage certain foreign currency and interest rate risk exposures. We do not use derivative instruments for speculative trading purposes. All derivative instruments are recorded on the balance sheet at fair value. For derivatives designated as cash flow hedges, the effective portion of changes in the fair value of the derivative is recorded to other comprehensive income, and is reclassified to earnings when the derivative instrument is settled. Any ineffective portion of changes in the fair value of the derivative is reported in earnings. None of our derivative contracts contain credit-risk related contingent features that would require us to settle the contract upon the occurrence of such contingency. However, all of our contracts contain clauses specifying events of default under specified circumstances, including failure to pay or deliver, breach of agreement, default under the specific agreement to which the hedge relates, bankruptcy, misrepresentation and the occurrence of certain transactions. The remedy for default is settlement in entirety or payment of the fair value of the contracts, which is $9.8 million in the aggregate for all of our contracts, less posted collateral of $193,500 as of September 30, 2011. The unrealized loss related to our derivative instruments included in accumulated other comprehensive loss was $9.1 million as of September 30, 2011 and $8.7 million as of December 31, 2010.
The notional and fair value amounts of our derivative instruments as of September 30, 2011 were as follows:
|
(Amounts in thousands)
|
Asset Derivatives
|
Liability Derivatives
|
||||||||||||||||||
|
Current Notional
|
Balance Sheet
|
Fair Value
|
Balance Sheet
|
Fair Value
|
||||||||||||||||
|
Amount
|
Location
|
Location
|
||||||||||||||||||
|
Interest Rate Swaps - L/T*
|
$ | 158,229 | N/A | N/A |
Other Liabilities
|
$ | (10,119 | ) | ||||||||||||
|
Foreign Exchange Contracts
|
$ | 1,125 |
Other Current Assets
|
$ | 123 | N/A | N/A | |||||||||||||
|
Foreign Exchange Contracts
|
$ | 2,325 |
Other Asset
|
$ | 181 | |||||||||||||||
|
Total Derivatives Designated as Hedging Instruments
|
$ | 161,679 | - | $ | 304 | - | $ | (10,119 | ) | |||||||||||
|
*We have outstanding a variable-to-fixed interest rate swap with respect to a Yen-based facility for the financing of a PCTC delivered in March 2010. The notional amount under this contract is $76,081,689 (based on a Yen to USD exchange rate of 77.04 as of September 30, 2011). With the bank exercising its option to reduce the underlying Yen loan from 80% to 65% funding of the vessel’s delivery cost, the 15% reduction represents the ineffective portion of this swap, which consists of the portion of the derivative instrument that is no longer supported by underlying borrowings. The change in fair value related to the ineffective portion of this swap was a $124,000 loss for the quarter ended September 30, 2011 and this amount was included in earnings.
|
||||||||||||||||||||
The effect of derivative instruments designated as cash flow hedges on our condensed consolidated statement of operations for the nine months ended September 30, 2011 was as follows:
|
(Amounts in thousands)
|
Net Gain / (Loss)
Recognized in Other Comprehensive Income
|
Location of Gain (Loss) Reclassified from AOCI to Income
|
Amount of (Loss) Gain Reclassified from AOCI to Income
|
Loss
Recognized in Income from Ineffective portion
|
|
2011
|
2011
|
2011
|
||
|
Interest Rate Swaps
|
($535)
|
Interest Expense
|
($1,050)
|
($109)
|
|
Foreign Exchange contracts
|
$95
|
Voyage Expenses
|
$49
|
-
|
|
Total
|
($440)
|
-
|
($1,001)
|
($109)
|
Note 14. Long-Term Debt
Long-term debt consisted of the following:
|
( in thousands)
|
Interest Rate
|
Total Principal Due
|
||||||||
|
September 30,
|
December 31,
|
Maturity
|
September 30,
|
December 31,
|
||||||
|
Description
|
2011
|
2010
|
Date
|
2011
|
2010
|
|||||
|
Secured:
|
||||||||||
|
Notes Payable – Variable Rate
|
1.3652%
|
1.2894%
|
2015
|
$ 16,000
|
$ 18,000
|
|||||
|
Notes Payable – Variable Rate
|
0.0000%
|
0.0000%
|
2012
|
13,195
|
13,300
|
|||||
|
Notes Payable – Variable Rate
|
1.2458%
|
1.2894%
|
2013
|
31,257
|
36,857
|
|||||
|
Notes Payable – Variable Rate
|
3.2215%
|
3.2575%
|
2014
|
13,924
|
15,739
|
|||||
|
Notes Payable – Variable Rate
|
1.1000%
|
1.0829%
|
2020
|
61,816
|
61,776
|
|||||
|
Notes Payable – Variable Rate
|
3.0209%
|
3.0563%
|
2017
|
42,422
|
44,722
|
|||||
|
Notes Payable – Variable Rate
|
(1)
|
2.7500%
|
2.77-2.79%
|
2018
|
53,360
|
21,171
|
||||
|
Notes Payable – Variable Rate
|
(2)
|
2.8500%
|
N/A
|
2018
|
23,191
|
-
|
||||
|
Notes Payable – Variable Rate
|
(3)
|
3.0400%
|
N/A
|
2018
|
25,090
|
-
|
||||
|
Notes Payable – Variable Rate
|
(3)
|
3.0400%
|
N/A
|
2018
|
19,170
|
-
|
||||
|
Line of Credit
|
(4)
|
N/A
|
4.7575%
|
2013
|
-
|
10,000
|
||||
|
299,425
|
221,565
|
|||||||||
|
Less Current Maturities
|
(35,111)
|
(21,324)
|
||||||||
|
$ 264,314
|
$ 200,241
|
|||||||||
(1) We entered into a variable rate credit facility with ING Bank on August 2, 2010 to finance 65% of the construction price of each of three Korean built vessels delivered in early 2011 with a maximum amount of $55.2 million. As of December 31, 2010 a total of $21.2 million had been drawn on this facility, with the remaining $34.0 million drawn in January 2011 upon completion and delivery of the vessels.
(2) We entered into a variable rate financing agreement with ING Bank N.V., London branch on June 20, 2011 for a seven year facility to finance the acquisition of a Cape-Size vessel and a Handymax Bulk Carrier, currently under construction, both of which were assumed in the acquisition of Dry Bulk. Pursuant to the terms of the facility agreement, the Lender agreed to provide us with a secured term loan facility up to an aggregate amount of $47.5 million, divided into two tranches: Tranche A, fully drawn on June 20, 2011 in the amount of $24.2 million, and Tranche B, providing up to $23.3 million of additional credit. We expect to draw under Tranche B $6.0 million in November 2011 and $17.3 million in January 2012.
(3) We entered into a variable rate financing agreement with DnB Nor Bank ASA on June 29, 2011 for a seven year facility to finance a portion of the acquisition price of two previously leased vessels (see page 33). We drew $26.0 million on July 5, 2011 and $19.8 million on July 18, 2011, the acquisition dates of the two vessels, respectively. Additionally we have an interest rate swap agreement in place for approximately 50% of this agreement to fix the interest rate on that portion at 1.80%. After the applicable margin adjustments, the effective interest rate on the swapped portion of the notes payable is 4.47%.
(4) In the fourth quarter of 2010 $10 million was drawn for working capital purposes and repaid in January 2011. As of September 30, 2011, the full amount of our $30 million unsecured revolving line of credit, which expires April 6, 2013, is available for future draws as needed. Associated with this credit facility is a commitment fee of .125% per year on the undrawn portion of this facility.
Note 15. Subsequent Events
On October 28, 2011, we were notified by the United States Navy’s Military Sealift Command (“MSC”) that our current operating agreements on three U.S. Flag Roll-on/Roll-Off vessels have been extended through December 31, 2011. All three agreements had been set to expire on October 31, 2011. For further information about these agreements with the MSC, please see Item 2 – Management’s Discussion and Analysis of Financial Condition and Results of Operations.
ITEM 2 – MANAGEMENT’S DISCUSSION AND ANALYSIS OF FINANCIAL CONDITION AND RESULTS OF OPERATIONS
Forward-Looking Statements
Certain statements made by us or on our behalf in this report or elsewhere that are not based on historical facts are intended to be “forward-looking statements” within the meaning of the safe harbor provisions of the Private Securities Litigation Reform Act of 1995. Forward-looking statements are based on beliefs and assumptions about future events that are inherently unpredictable and are therefore subject to significant known and unknown risks, uncertainties and other factors that may cause our actual results to be materially different from the anticipated results expressed or implied by such forward-looking statements.
Such statements include, without limitation, statements regarding (1) anticipated future operating and financial performance, financial position and liquidity, growth opportunities and growth rates, acquisition and divestiture opportunities, business prospects, regulatory and competitive outlook, investment and expenditure plans, investment results, pricing plans, strategic alternatives, business strategies, and other similar statements of expectations or objectives; (2) estimated fair values of capital assets, the recoverability of the cost of those assets, the estimated future cash flows attributable to those assets, and the appropriate discounts to be applied in determining the net present values of those estimated cash flows; (3) estimated scrap values of assets; (4) estimated proceeds from selling assets and the anticipated cost of constructing or purchasing new or existing vessels; (5) estimated fair values of financial instruments, such as interest rate, commodity and currency swap agreements; (6) estimated losses under self-insurance arrangements, as well as estimated gains or losses on certain contracts, trade routes, lines of business or asset dispositions; (7) estimated losses attributable to asbestos claims or other litigation; (8) estimated obligations, and the timing thereof, relating to vessel repair or maintenance work; (9) the adequacy of our capital resources and the availability of additional capital resources on commercially acceptable terms; (10) our ability to remain in compliance with our debt covenants; (11) anticipated trends in government sponsored cargoes; (12) our ability to effectively service our debt; (13) financing opportunities and sources (including the impact of financings on our financial position, financial performance or credit ratings); (14) changes in laws, regulations or tax rates, or the outcome of pending legislative or regulatory initiatives; and (15) assumptions underlying any of the foregoing.
Important factors that could cause our actual results to differ materially from our expectations include our ability to:
|
·
|
identify customers who require marine transportation services or vessels offered by us,
|
|
·
|
secure financing on satisfactory terms to repay existing debt or support operations, including to acquire, modify, or construct vessels if such financing is necessary to service the potential needs of current or future customers,
|
|
·
|
maximize the usage of our vessels and other assets on favorable economic terms,
|
|
·
|
manage the amount and rate of growth of our administrative and general expenses and costs associated with operating our vessels,
|
|
·
|
manage our growth in terms of implementing internal controls and information systems and hiring or retaining key personnel, among other things, and
|
|
·
|
effectively handle our substantial leverage by meeting the payment and covenant requirements in each of our debt instruments, thereby avoiding any defaults under those instruments and avoiding cross defaults under others.
|
Other factors that could cause our actual results to differ materially from our expectations include, without limitation:
|
·
|
unanticipated changes in domestic or international transportation markets that reduce the demand for shipping generally or our vessels in particular,
|
|
·
|
unanticipated changes in cargo rates, charter hire, cost of fuel we are not able to pass on to customers, or other operating expenses,
|
|
·
|
the rate at which competitors add or scrap vessels, as well as demolition scrap prices and the availability of scrap facilities in the areas in which we operate,
|
|
·
|
changes in interest rates, which could increase or decrease the amount of interest we incur on our variable rate debt and the availability and cost of capital to us,
|
|
·
|
the impact on our financial statements of nonrecurring accounting charges that may result from our ongoing evaluation of business strategies, asset valuations, and organizational structures,
|
|
·
|
changes in accounting policies and practices adopted voluntarily or as required by GAAP,
|
|
·
|
changes in laws and regulations such as those related to government assistance programs and tax rates,
|
|
·
|
the frequency and severity of claims against us, including the possibility of unanticipated adverse outcomes of current or future legal proceedings,
|
|
·
|
unexpected out-of-service days on our vessels whether due to unplanned maintenance or other causes,
|
|
·
|
the ability of customers to fulfill their obligations with us,
|
|
·
|
the performance of unconsolidated subsidiaries,
|
|
·
|
political events in the United States and abroad, including terrorism and piracy, and the U.S. military's response to those events,
|
|
·
|
election results, regulatory activities and the appropriation of funds by the U.S. Congress,
|
|
·
|
changes in foreign currency exchange rates, and
|
|
·
|
other economic, competitive, governmental, and technological factors which may affect our operations.
|
Due to these uncertainties, we cannot assure that we will attain our anticipated results, that our judgments or assumptions will prove correct, or that unforeseen developments will not occur. Accordingly, you are cautioned not to place undue reliance upon any of our forward-looking statements, which speak only as of the date made. Additional risks that we currently deem immaterial or that are not presently known to us could also cause our actual results to differ materially from those expected in our forward-looking statements. Except for meeting our ongoing obligations under the federal securities laws, we undertake no obligation to update or revise for any reason any forward-looking statements made by us or on our behalf, whether as a result of new information, future events or developments, changed circumstances or otherwise. For additional information on our forward-looking statements and risks, see Items 1, 1A and 7 of our Annual Report on Form 10-K for the year ended December 31, 2010, and Part II, Item 1A, of this report.
Executive Summary
Overall Strategy
The company operates a diversified fleet of U.S. and International flag vessels that provide international and domestic maritime transportation services to commercial and governmental customers primarily under medium to long-term contracts. Our core business strategy consists of identifying growth opportunities in niche markets as market needs change, utilizing our extensive experience to meet those needs, and continuing to maintain a diverse portfolio of medium to long-term contracts, as well as protect our long-standing customer base by providing quality transportation services. From time to time, we augment our core business strategy with opportunistic transactions involving short term spot market contracts.
Overview of Third Quarter 2011
In spite of the current market volatility, the Company continues to remain profitable and generate positive operating cash flow. Our fixed contract revenues for the third quarter of 2011 represented about 62% of our total revenues or approximately $42 million as compared to $45.5 million for the third quarter of 2010. Our Time Charter vessels operated normally with minimal off-hire from unplanned events. Total off-hire days for the third quarter of 2011 were 14.6 days as compared to 27.6 days for the same period last year. Of these amounts, 9.6 and 21.9 days, respectively, were scheduled offhire days for drydocking and routine repairs/surveys. We also continued to effectively manage our Hull and Machinery loss claims resulting in lower operating costs. Freight movements in and out of Japan, which were impacted by the devastating earthquake, continue to slowly improve and the current severe flooding in Thailand have had no financial impact on us to date. Our Contract of Affreightment segment results for the third quarter of 2011 were consistent with the prior year. The total variable revenues for the period were approximately $25.1 million as compared to $28.9 million for the same period last year. The decrease in our variable revenues is a direct reflection of lower supplemental cargoes which have continued to return to more historical levels.
The Company operates two multi-purpose vessels that transport supplies to terminals that service an Indonesian mining site that have been impacted by a recent labor strike in that region. While there has been no financial impact to date on our results of operations, we will continue to monitor the situation closely.
Results
Consolidated Financial Performance – Third Quarter 2011 vs. Third Quarter 2010
For the third quarter of 2011, net income was $2.9 million, an increase of $16.7 million as compared to the same period in 2010. Excluding the impairment charge of $25.4 million taken in the third quarter of 2010, net income and operating income decreased by $8.8 million and $6.1 million, respectively, for the comparable periods. Total revenues decreased from $74.4 million to $67.1 million. The decrease in our revenues and operating income was the result of lower supplemental cargo volumes and a decrease in the results of our Coal Carrier and Indonesian Service, which were partially offset by the inclusion of our Capesize Dry Bulk vessel results, previously reported as net income from unconsolidated entities, and the results from our three new Handysize Vessels which began service at the beginning of 2011. Administrative and General expenses for the quarter were slightly lower as compared to the prior year. Interest expense increased from $1.7 million in the third quarter of 2010 to $2.9 million in the third quarter of 2011, reflecting higher debt balances from the financing on our three new Handysize vessels as well as the recent purchases and financing of two PCTC vessels which were previously chartered through operating leases. We recorded a non-cash foreign exchange loss of $2.7 million reflecting the further weakening of the US dollar against the Japanese Yen during the third quarter of 2011. The non-cash foreign exchange loss for the same period of the previous year was $3.4 million. Net income from unconsolidated entities decreased from a profit of $1.3 million for the three months ended September 30, 2010, to a loss of $852,000 for the same period 2011. This decrease was the result of earnings from Dry Bulk reflected in our revenues and expenses as opposed to being recorded on one line item in Net Income from Unconsolidated Entities. In addition, we recorded a loss of $943,000 from results of our 25% interest in Oslo Bulk, primarily driven by a negative $603,000 mark-to-market adjustment on an ineffective interest rate swap and lower operating results.
Financial Discipline & Strong Balance Sheet
|
§
|
Total cash and marketable securities of $25.2 million at September 30, 2011
|
|
§
|
Working capital of $11.9 million at September 30, 2011
|
|
§
|
Debt payments of $8.4 million during the third quarter of 2011
|
Overview of Fleet
Our Time Charter segments, which are primarily serviced by our Pure Car Truck Carrier vessels generally operating under medium to long-term contracts, provide us with a fixed income stream and consistent cash flow and revenues are only impacted by the amount of our off-hire time. The average firm contract charterhire period for our International Flag PCTC fleet and U.S. Flag PCTC fleet is approximately five years and three years respectively. In addition to this contractually fixed income, we also earn from time to time supplemental income as a result of chartering our U.S. Flag PCTC vessels back for the carriage of supplemental cargo when available.
Recent downturns in our revenues and market capitalization, threats to our Military Sealift Command (“MSC”) revenues and other adverse trends suggest that impairment indicators may be present. The following facts, however, support our position that no impairment analysis was required for the third quarter for vessels servicing our Time Charter segments:
|
·
|
Based on the earnings capacity from our existing firm contracts as well as the anticipated future earning capacity beyond these firm periods, we believe (i) the aggregate market value of our wholly owned vessels is greater than their aggregate book value and (ii) basing the market value of these vessels on our market capitalization, which is influenced by a number of factors unrelated to the actual value of our owned vessels, would be understating the value of the assets.
|
|
·
|
Revenues decreased by 10% in the third quarter of 2011 compared to the same period in 2010, driven primarily by our decreases in supplemental cargoes. Even though our revenues decreased, the vessels continued to generate revenues from their fixed time charter contracts and positive cash flows to support the current asset values.
|
|
·
|
Our contract with MSC is an operating agreement with no assets owned by us that are subject to impairment if the contracts are terminated.
|
|
·
|
Our leverage ratios have been negatively impacted by the downward trend in net income (mainly due to a decrease in supplemental cargo revenues) but our fixed time charter revenue streams continue to support the underlying asset values.
|
|
·
|
We have maintained long-standing relationships with our customers for this segment by providing quality service and vessels that are in good working order, which we believe minimizes our risk with respect to the potential loss of a contract.
|
|
·
|
Other than the Maritime Prepositioning Ship (“MPS”) contracts, as administered by the MSC, none of our customers have advised us of their intent to terminate their relationships with us.
|
We test our long-lived assets on an individual vessel basis for recoverability whenever events or changes in circumstances indicate that the vessel’s carrying amount may not be recoverable. However, based on the facts listed above, we believe there were no triggering events during the third quarter to support an impairment analysis with respect to the vessels in our time charter segments.
Our Rail-Ferry segment, which is supported by two special purpose vessels, carries rail cars between the U.S. Gulf Coast and Mexico. Since there are no fixed time charter contracts to support this service, this segment is exposed to changes in market conditions. Due to a history of losses, the recent economic downturn, and the inability to replace one of our former major northbound customers, we took an impairment charge of $25.4 million in the third quarter of 2010, to reduce the carrying value of these assets to their estimated fair values. No additional indicators of further impairment of these assets were deemed to be present as of September 30, 2011.
In August of 2011 we were awarded a time charter contract with the MSC. The contract is for a firm one year period after which the MSC will have three one-year options and one 11-month option to extend the contract. The time charter, which is scheduled to commence in mid-December, is expected to generate gross revenues of approximately $10 million for the firm initial one-year period and approximately $50 million if all the options are exercised. We entered into an agreement to purchase a 2000-built multi-purpose ice strengthened vessel which will be used to service the contract. We plan to fund the purchase of this vessel with available cash and by arranging permanent financing.
As of September 30, 2011, our fleet consisted of 39 vessels, of which 19 we owned 100% directly through our wholly owned subsidiaries. Of the 19 vessels, 15 are under individual fixed time charters varying from short, medium and long term in length and all 15 operated within our Time Charter Contracts - International Flag and Time Charter Contracts – U.S. Flag segments. Two vessels operate on a voyage basis with no fixed contracts in our Rail-Ferry segment. We currently have one Handy max vessel under construction, scheduled for delivery in early 2012 and one 2000-built multi-purpose ice strengthened vessel under a purchase contract which will be delivered during November, 2011. There is no fixed contract currently in place for the one Handy max vessel.
For additional information on our vessels, please see the chart below:
|
The following table lists the vessels in our fleet as of September 30, 2011:
|
||||||||
|
INTERNATIONAL SHIPHOLDING CORPORATION
|
||||||||
|
FLEET STATISTICS
|
||||||||
|
September 30, 2011
|
||||||||
|
Build Date
|
Business Segment (1)
|
Wholly Owned (6)
|
Other (2)
|
Total Dead-Weight Carrying Capacity (LT)
|
Market Value less than Carrying Value "Y"
|
|||
|
GREEN BAY
|
PURE CAR/TRUCK CARRIER
|
2007
|
TC-US
|
X
|
18,381
|
|||
|
GREEN COVE
|
PURE CAR/TRUCK CARRIER
|
1994
|
TC-US
|
X
|
16,178
|
|||
|
GREEN LAKE
|
PURE CAR/TRUCK CARRIER
|
1998
|
TC-US
|
X
|
22,799
|
|||
|
GREEN POINT
|
PURE CAR/TRUCK CARRIER
|
1994
|
TC-US
|
X
|
14,930
|
|||
|
GREEN RIDGE
|
PURE CAR/TRUCK CARRIER
|
1998
|
TC-US
|
X
|
21,523
|
|||
|
GREEN DALE (5)
|
PURE CAR/TRUCK CARRIER
|
1999
|
TC-US
|
X
|
16,157
|
|||
|
USNS SGT. MATEJ KOCAK
|
ROLL-ON/ROLL-OFF
|
1981
|
TC-US
|
OC
|
25,073
|
|||
|
USNS PFC. EUGENE A. OBREGON
|
ROLL-ON/ROLL-OFF
|
1983
|
TC-US
|
OC
|
25,073
|
|||
|
USNS MAJOR STEPHEN W. PLESS
|
ROLL-ON/ROLL-OFF
|
1983
|
TC-US
|
OC
|
25,073
|
|||
|
ENERGY ENTERPRISE
|
BELT SELF-UNLOADING BULK CARRIER
|
1983
|
TC-US
|
X
|
38,234
|
|||
|
MAERSK ALABAMA
|
CONTAINER SHIP
|
1998
|
TC-US
|
BC
|
17,524
|
|||
|
MAERSK CALIFORNIA
|
CONTAINER SHIP
|
1992
|
TC-US
|
BC
|
25,375
|
|||
|
MARINA STAR 2
|
CONTAINER SHIP
|
1982
|
TC-I
|
TC
|
5,020
|
|||
|
TERRITORY TRADER
|
CONTAINER SHIP
|
1991
|
TC-I
|
TC
|
4,915
|
|||
|
ASIAN EMPEROR
|
PURE CAR/TRUCK CARRIER
|
1999
|
TC-I
|
X
|
21,479
|
|||
|
ASIAN KING (5)
|
PURE CAR/TRUCK CARRIER
|
1998
|
TC-I
|
X
|
21,511
|
|||
|
RIO GEIKE
|
PURE CAR/TRUCK CARRIER
|
2010
|
TC-I
|
X
|
18,400
|
|||
|
FLORES SEA
|
MULTI-PURPOSE VESSEL
|
2008
|
TC-I
|
OC
|
11,151
|
|||
|
SAWU SEA
|
MULTI-PURPOSE VESSEL
|
2008
|
TC-I
|
OC
|
11,184
|
|||
|
OCEAN PORPOISE
|
TANKER
|
1996
|
TC-I
|
X
|
13,193
|
|||
|
EGS CREST
|
HANDY-SIZE BULK CARRIER
|
2011
|
TC-I
|
X
|
36,000
|
|||
|
EGS TIDE
|
HANDY-SIZE BULK CARRIER
|
2011
|
TC-I
|
X
|
36,000
|
|||
|
EGS WAVE
|
HANDY-SIZE BULK CARRIER
|
2011
|
TC-I
|
X
|
36,000
|
|||
|
SULPHUR ENTERPRISE
|
MOLTEN SULPHUR CARRIER
|
1994
|
COA
|
BC
|
27,241
|
|||
|
BALI SEA (3)
|
ROLL-ON/ROLL-OFF SPV
|
1995
|
RF
|
X
|
22,220
|
|||
|
BANDA SEA (3)
|
ROLL-ON/ROLL-OFF SPV
|
1995
|
RF
|
X
|
22,239
|
|||
|
BULK AUSTRALIA
|
CAPE-SIZE BULK CARRIER
|
2003
|
UE
|
X
|
170,578
|
|||
|
TSUNEISHI NEWBUILDING (4)
|
HANDYMAX-SIZE BULK CARRIER
|
2012
|
UE
|
X
|
58,000
|
|||
|
FEDERAL PATROLLER tbrn GREEN WAVE
|
MULTI-PURPOSE ICE STRENGHTENED VESSEL
|
2011
|
TC-US
|
X
|
17,451
|
|||
|
OSLO BULK 1
|
MINI BULKER CARRIERS
|
2010
|
UE
|
PO
|
8,000
|
|||
|
OSLO BULK 2
|
MINI BULKER CARRIERS
|
2010
|
UE
|
PO
|
8,000
|
|||
|
OSLO BULK 3
|
MINI BULKER CARRIERS
|
2010
|
UE
|
PO
|
8,000
|
|||
|
OSLO BULK 4
|
MINI BULKER CARRIERS
|
2010
|
UE
|
PO
|
8,000
|
|||
|
OSLO BULK 5
|
MINI BULKER CARRIERS
|
2010
|
UE
|
PO
|
8,000
|
|||
|
OSLO BULK 6
|
MINI BULKER CARRIERS
|
2011
|
UE
|
PO
|
8,000
|
|||
|
OSLO BULK 7
|
MINI BULKER CARRIERS
|
2011
|
UE
|
PO
|
8,000
|
|||
|
OSLO BULK 8
|
MINI BULKER CARRIERS
|
2011
|
UE
|
PO
|
8,000
|
|||
|
OSLO BULK 9
|
MINI BULKER CARRIERS
|
2011
|
UE
|
PO
|
8,000
|
|||
|
OSLO BULK 10
|
MINI BULKER CARRIERS
|
2011
|
UE
|
PO
|
8,000
|
|||
|
19
|
20
|
878,902
|
||||||
|
(1)
|
Business Segments:
|
|||||||
|
TC-US
|
Time Charter Contracts-U.S. Flag
|
|||||||
|
TC-I
|
Time Charter Contracts-International Flag
|
|||||||
|
COA
|
Contracts of Affreightment
|
|||||||
|
RF
|
Rail-Ferry
|
|||||||
|
UE
|
Unconsolidated Entity
|
|||||||
|
(2)
|
With respect to vessels not wholly-owned but operated by us:
|
|||||||
|
"BC" means that we bareboat charter the vessel (3 total).
|
||||||||
|
"OC" means that we operate the vessel under an operating contract (5 total).
|
||||||||
|
"PO" means that we partially own the vessel (10 total).
|
||||||||
|
"TC" means that we Time Charter the vessel (2 total).
|
||||||||
|
(3)
|
Originally built in 1982 - Converted 1995
|
|||||||
|
(4)
|
Vessel currently under contract to be constructed, delivering in 1st Quarter of 2012
|
|||||||
|
(5)
|
Purchased in July 2011
|
|||||||
|
(6)
|
Includes one Newbuilding; see Note 4.
|
|||||||
Management Gross Voyage Profit Financial Measures
In connection with discussing the results of our various operating segments in this report, we refer to “gross voyage profit,” a metric that management reviews to assist in monitoring and managing our business. The following table provides a reconciliation of consolidated gross voyage profit to operating income.
|
(All Amounts in Thousands)
|
Three Months Ended September 30,
|
Nine Months Ended September 30,
|
||||||||||||||
|
2011
|
2010
|
2011
|
2010
|
|||||||||||||
|
Revenues
|
$ | 67,087 | $ | 74,400 | $ | 201,382 | $ | 232,398 | ||||||||
|
Voyage Expenses
|
$ | 46,911 | $ | 49,925 | $ | 147,715 | $ | 166,381 | ||||||||
|
Vessel Depreciation
|
$ | 6,775 | $ | 4,923 | $ | 18,244 | $ | 13,671 | ||||||||
|
Impairment Loss
|
$ | - | $ | 25,430 | $ | - | $ | 25,430 | ||||||||
|
Gross Voyage Profit (Loss)
|
$ | 13,401 | $ | (5,878 | ) | $ | 35,423 | $ | 26,916 | |||||||
|
Other Operating Expenses:
|
||||||||||||||||
|
Administrative and General Expenses
|
$ | 4,769 | $ | 4,844 | $ | 16,053 | $ | 16,278 | ||||||||
|
Gain on Dry Bulk Transaction
|
$ | - | $ | - | $ | (18,844 | ) | $ | - | |||||||
|
Loss (Gain) on Sale of Other Assets
|
$ | - | $ | 29 | $ | - | $ | (46 | ) | |||||||
|
Total Other Operating Expenses
|
$ | 4,769 | $ | 4,873 | $ | (2,791 | ) | $ | 16,232 | |||||||
|
Operating Income (Loss)
|
$ | 8,632 | $ | (10,751 | ) | $ | 38,214 | $ | 10,684 | |||||||
Non-GAAP Financial Measures
In Management’s Discussion and Analysis of Financial Condition and Results of Operations, we refer to adjusted gross voyage profit, adjusted operating income and adjusted net income, each of which exclude a non-cash impairment charge on fixed assets in 2010. We believe this is useful information to investors because it provides comparable information with respect to the financial condition and results of operations of the Company excluding such non-cash charges. The following table provides a reconciliation of gross voyage profit to adjusted gross voyage profit, operating income to adjusted operating income and net income to adjusted net income.
|
(All Amounts in Thousands)
|
Three Months Ended September 30,
|
Nine Months Ended September 30,
|
||||||||||||||
|
2011
|
2010
|
2011
|
2010
|
|||||||||||||
|
Gross Voyage Profit (Loss)
|
$ | 13,401 | $ | (5,878 | ) | $ | 35,423 | $ | 26,916 | |||||||
|
Impairment Charge
|
- | 25,430 | - | 25,430 | ||||||||||||
|
Adjusted Gross Voyage Profit
|
$ | 13,401 | $ | 19,552 | $ | 35,423 | $ | 52,346 | ||||||||
|
Operating Income (Loss)
|
$ | 8,632 | $ | (10,751 | ) | $ | 38,214 | $ | 10,684 | |||||||
|
Impairment Charge
|
- | 25,430 | - | 25,430 | ||||||||||||
|
Adjusted Operating Income
|
$ | 8,632 | $ | 14,679 | $ | 38,214 | $ | 36,114 | ||||||||
|
Net Income (Loss)
|
$ | 2,850 | $ | (13,823 | ) | $ | 29,768 | $ | 6,361 | |||||||
|
Impairment Charge
|
- | 25,430 | - | 25,430 | ||||||||||||
|
Adjusted Net Income
|
$ | 2,850 | $ | 11,607 | $ | 29,768 | $ | 31,791 | ||||||||
RESULTS OF OPERATIONS
THREE MONTHS ENDED SEPTEMBER 30, 2011
COMPARED TO THE THREE MONTHS ENDED SEPTEMBER 30, 2010
|
(All Amounts in Thousands)
|
Time Charter Contracts-
U.S. Flag
|
Time Charter Contracts-International Flag
|
COA
|
Rail-Ferry Service
|
Other
|
Total
|
||||||||||||||||||
|
2011
|
||||||||||||||||||||||||
|
Revenues from External Customers
|
$ | 38,069 | $ | 14,609 | $ | 4,766 | $ | 9,121 | $ | 522 | $ | 67,087 | ||||||||||||
|
Voyage Expenses
|
$ | 27,233 | $ | 7,173 | $ | 4,685 | $ | 7,685 | $ | 135 | $ | 46,911 | ||||||||||||
|
Vessel Depreciation
|
$ | 2,707 | $ | 3,151 | $ | - | $ | 915 | $ | 2 | $ | 6,775 | ||||||||||||
|
Gross Voyage Profit
|
$ | 8,129 | $ | 4,285 | $ | 81 | $ | 521 | $ | 385 | $ | 13,401 | ||||||||||||
|
Adjusted Gross Profit
|
$ | 8,129 | $ | 4,285 | $ | 81 | $ | 521 | $ | 385 | $ | 13,401 | ||||||||||||
|
2010
|
||||||||||||||||||||||||
|
Revenues from External Customers
|
$ | 49,250 | $ | 10,716 | $ | 4,200 | $ | 9,668 | $ | 566 | $ | 74,400 | ||||||||||||
|
Voyage Expenses
|
$ | 32,835 | $ | 6,704 | $ | 4,127 | $ | 6,035 | $ | 224 | $ | 49,925 | ||||||||||||
|
Vessel Depreciation
|
$ | 2,458 | $ | 990 | $ | - | $ | 1,472 | $ | 3 | $ | 4,923 | ||||||||||||
|
Impairment Loss
|
- | - | - | $ | 25,430 | - | $ | 25,430 | ||||||||||||||||
|
Gross Voyage Profit (Loss)
|
$ | 13,957 | $ | 3,022 | $ | 73 | $ | (23,269 | ) | $ | 339 | $ | (5,878 | ) | ||||||||||
|
Adjusted Gross Profit
|
$ | 13,957 | $ | 3,022 | $ | 73 | $ | 2,161 | $ | 339 | $ | 19,552 | ||||||||||||
The following table shows the breakout of revenues by segment between fixed and variable for the three months ended September 30, 2011 and 2010, respectively:
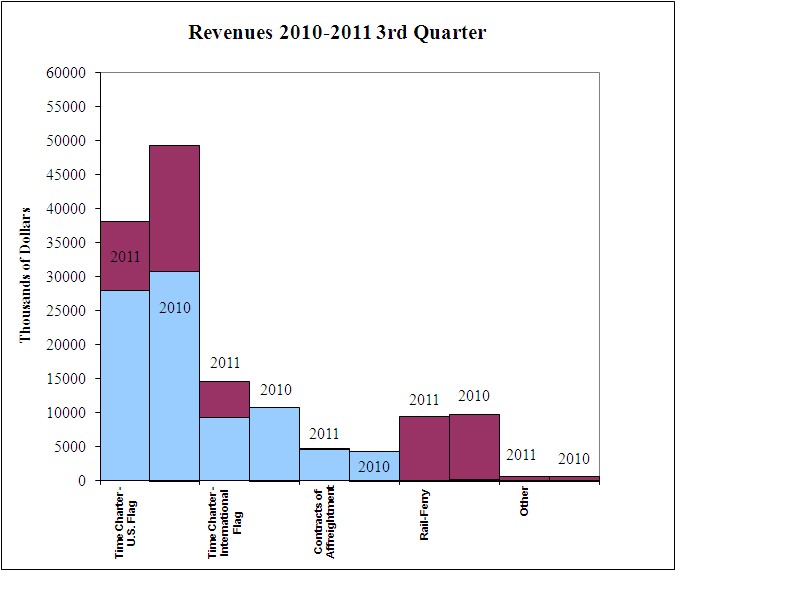
o Variable Revenue o Fixed Revenue
The changes in revenues and expenses associated with each of our segments are discussed within the gross voyage analysis below.
Time Charter Contracts-U.S. Flag: Overall revenues decreased by 23% or $11.2 million when comparing the third quarter of 2011 to the third quarter of 2010. The decrease was driven primarily by a drop in the carriage of supplemental cargoes on our U.S. Flag Pure Car Truck Carriers, as volumes return to more historic levels. The segment’s gross voyage profit decreased from $14.0 million in the third quarter of 2010 to $8.1 million in the third quarter of 2011 primarily as a result of the decrease in supplemental cargoes and an additional commercial voyage in 2010, along with lower timecharter rates in 2011 on our U.S. Flag Coal Carrier. Partially offsetting these decreases was a reduction in lease expense from exercising the early buy out option of a previously leased vessel. Our fixed contract revenues of $27.9 million and $30.6 million in the third quarter of 2011 and 2010, respectively, represent revenues derived from our fixed time charter contracts, and our variable revenues of $10.2 million and $18.7 million for the same periods in 2011 and 2010, respectively, represent revenues derived from our supplemental cargoes.
Our U.S. Flag Time Charter Contracts segment includes operating three Roll-on/Roll-off vessels for the MSC. In early 2009, we received notification from MSC that we have been excluded from further consideration for extending the current operating agreements on three U.S. Flag Roll-on/Roll-Off vessels. Subsequently, MSC has exercised options to extend the agreements several times with the most recent extension set to expire on December 31, 2011 for all three vessels. These three contracts represented 10% of our total revenue in the third quarter of 2011. The MSC has reopened the bidding process, bids were submitted, and even if we successfully retain any one or more of these MSC contracts, we anticipate materially reduced revenues in future periods.
Time Charter Contracts-International Flag: Revenues increased from $10.7 million in the third quarter of 2010 to $14.6 million in the third quarter of 2011 and gross voyage profit for this segment increased from $3.0 million in the third quarter of 2010 to $4.3 million in the third quarter of 2011. The increase in revenues and gross profit is primarily attributable to contributions made by our three new Handy-Size Bulk Carriers placed in service in the first quarter of 2011, a Capesize Bulk Carrier acquired from Dry Bulk at the end of the first quarter of 2011, and a reduction in lease expense from exercising the early buy out option of a previously leased vessel. Our fixed revenues of $9.2 million in the third quarter of 2011 represent our revenues from fixed Time Charter contracts. Our variable revenues of $5.4 million in the third quarter of 2011 represent revenues earned by our three new Handy-Size Bulk Carriers pursuant to a revenue sharing agreement which commenced in January 2011. All revenues in the third quarter of 2010 were derived under fixed revenue time charter contracts.
Contracts of Affreightment: Revenues increased from $4.2 million in the third quarter of 2010 to $4.8 million in the third quarter of 2011, Our gross voyage profit remained fairly constant from $73,000 in the third quarter of 2010 to $81,000 in the third quarter of 2011 with higher fuel costs offsetting the increase in revenues.
Rail-Ferry Service: Adjusted gross voyage profit decreased from $2.2 million in the third quarter of 2010, excluding a $25.4 million impairment loss taken on the segment’s two Roll-on/Roll-off Special Purpose double deck vessels in the third quarter of 2010, to $521,000 in the third quarter of 2011. Gross voyage loss including the impairment was $23.2 million in the third quarter of 2010. Revenues for this segment decreased from $9.7 million in the third quarter of 2010 to $9.1 million in the third quarter of 2011 due to a reduction in cargo carried and the beneficial effects in the third quarter of 2010 of our Northbound service being used as an alternative source of transportation resulting from outages on Mexico’s cross border rail service.
We based the aforementioned non-cash impairment charge taken in the third quarter of 2010 on the challenge to replace the major customer lost due to a facility relocation in 2009, and a lack of improved cargo volumes in the service throughout 2010 with no short term improvement expected in the segment’s operating results. We determined that the cash flows expected to be generated by the long-lived assets of the Rail-Ferry segment were less than the carrying amount of these assets, and believe the current projected cash flows support the adjusted asset values.
Other: For this segment, gross voyage profit improved slightly from $339,000 during the third quarter of 2010 to $385,000 during the third quarter of 2011.
Administrative and General Expense
Administrative and general expenses remained constant at $4.8 million in the third quarters of 2010 and 2011, respectively. The following table shows the significant components of administrative and general expenses for the third quarter of 2011 and 2010, respectively.
|
(Amounts in Thousands)
|
Three Months Ended
September 30,
|
|||||||||||||||
|
A&G Account
|
2011
|
2010
|
Variance
|
|||||||||||||
|
Wages and Benefits
|
$ | 2,743 | $ | 2,183 | $ | 560 | * | |||||||||
|
Amortization of Executive Stock Compensation
|
398 | 527 | (129 | ) | ||||||||||||
|
Office Building Expenses
|
304 | 364 | (60 | ) | ||||||||||||
|
Professional Services
|
481 | 753 | (272 | ) | ||||||||||||
|
Other
|
843 | 1,017 | (174 | ) | ||||||||||||
|
TOTAL:
|
$ | 4,769 | $ | 4,844 | $ | (75 | ) | |||||||||
* Increases to wages and benefits was due to an adjustment to pension cost in the third quarter of 2010.
Other Income and Expense
Interest Expense increased from $1.7 million in the third quarter of 2010 to $2.9 million in the third quarter of 2011 due to higher debt balances associated with the financing of our two recently purchased PCTCs and three new Handy-Size Bulk Carriers.
Derivative Loss of $124,000 in the third quarter of 2011 represents the ineffectiveness of a portion of a derivative contract and the related mark-to-market adjustment associated with this portion of the derivative (See Note 13).
Other income from vessel financing of $654,000 in the third quarter of 2011 is due to interest earned on a note receivable on vessels sold to an Indonesian company in the third quarter of 2009.
Foreign Exchange Loss of $2.7 million in the third quarter of 2011 is due to the revaluation of our Yen-denominated loan associated with the financing of one of our International Flag PCTC’s due to a strengthening of the value of the Yen since the end of the second quarter of 2011. The exchange loss was based on a change in the exchange rate of 80.57 Yen to 1 USD at June 30, 2011 compared to 77.04 Yen to 1 USD at September 30, 2011 (See Item 1A Risk Factors).
Income Taxes
We recorded a provision for income taxes of $150,000 on our $3.9 million of income before equity in net income of unconsolidated entities for the three months ended September 30, 2011. For the three months ended September 30, 2010 our income tax benefit was $51,000 on our $15.2 million loss before equity in net income of unconsolidated entities. This unfavorable change was based on improvements in our operations taxed at the U.S. corporate statutory rate, and our establishment of a valuation allowance on certain deferred tax assets. Our qualifying U.S. flag operations continue to be taxed under a “tonnage tax” regime rather than under the normal U.S. corporate income tax regime. For further information on certain tax laws and elections, see our Annual Report on Form 10-K filed for the year ended December 31, 2010, including “Note F-Income Taxes” to the consolidated financial statements included therein.
Equity in Net (Loss) Income of Unconsolidated Entities
Equity in net (loss) income of unconsolidated entities, net of taxes, decreased from a profit of $1.3 million in the third quarter of 2010 to a loss of $852,000 in the third quarter of 2011.
The third quarter of 2011 results were primarily driven by our 25% investment in Oslo Bulk, which reported a loss of $943,000. Included in the results is a negative mark-to-market adjustment of $603,000 on an ineffective interest rate swap contract. The 2010 third quarter results contain Dry Bulk’s earnings of $1.4 million, net of taxes of $753,000. Prior to us acquiring 100% of Dry Bulk on March 25, 2011, we reported our proportionate interest in Dry Bulk using the equity method. As a result of the acquisition, Dry Bulk results are now consolidated in our Time Charter Contracts-International Flag segment.
RESULTS OF OPERATIONS
NINE MONTHS ENDED SEPTEMBER 30, 2011
COMPARED TO THE NINE MONTHS ENDED SEPTEMBER 30, 2010
|
(All Amounts in Thousands)
|
Time Charter Contracts-
US Flag
|
Time Charter Contracts-International Flag
|
COA
|
Rail-Ferry Service
|
Other
|
Total
|
||||||||||||||||||
|
2011
|
||||||||||||||||||||||||
|
Revenues from External Customers
|
$ | 116,381 | $ | 41,777 | $ | 13,497 | $ | 27,894 | $ | 1,833 | $ | 201,382 | ||||||||||||
|
Voyage Expenses
|
$ | 87,190 | $ | 22,519 | $ | 13,597 | $ | 23,973 | $ | 439 | $ | 147,715 | ||||||||||||
|
Vessel Depreciation
|
$ | 7,712 | $ | 7,837 | $ | - | $ | 2,687 | $ | 8 | $ | 18,244 | ||||||||||||
|
Gross Voyage Profit (Loss)
|
$ | 21,479 | $ | 11,424 | $ | (100 | ) | $ | 1,234 | $ | 1,386 | $ | 35,423 | |||||||||||
|
Adjusted Gross Voyage Profit (Loss)
|
$ | 21,479 | $ | 11,424 | $ | (100 | ) | $ | 1,234 | $ | 1,386 | $ | 35,423 | |||||||||||
|
2010
|
||||||||||||||||||||||||
|
Revenues from External Customers
|
$ | 159,093 | $ | 37,744 | $ | 12,672 | $ | 21,017 | $ | 1,872 | $ | 232,398 | ||||||||||||
|
Voyage Expenses
|
$ | 111,003 | $ | 24,245 | $ | 12,495 | $ | 17,801 | $ | 837 | $ | 166,381 | ||||||||||||
|
Vessel Depreciation
|
$ | 7,369 | $ | 1,984 | $ | - | $ | 4,310 | $ | 8 | $ | 13,671 | ||||||||||||
|
Impairment Loss
|
- | - | - | $ | 25,430 | - | $ | 25,430 | ||||||||||||||||
|
Gross Voyage Profit (Loss)
|
$ | 40,721 | $ | 11,515 | $ | 177 | $ | (26,524 | ) | $ | 1,027 | $ | 26,916 | |||||||||||
|
Adjusted Gross Voyage Profit (Loss)
|
$ | 40,721 | $ | 11,515 | $ | 177 | $ | (1,094 | ) | $ | 1,027 | $ | 52,346 | |||||||||||
The following table shows the breakout of revenues by segment between fixed and variable for the first nine months of 2011 and 2010, respectively:
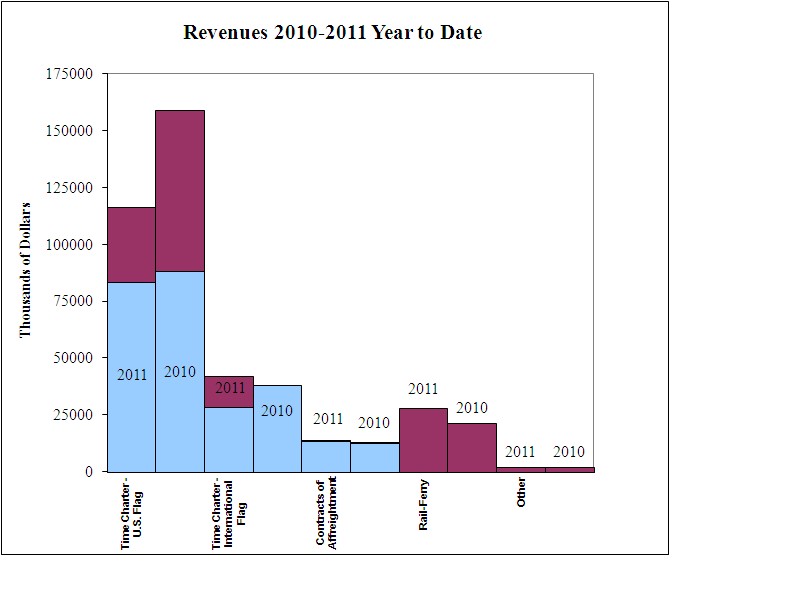
o Variable Revenue o Fixed Revenue
The changes of revenue and expenses associated with each of our segments are discussed within the gross voyage analysis below.
Time Charter Contracts-U.S. Flag: Overall revenues decreased by 27% or $42.7 million when comparing the first nine months of 2011 to the first nine months of 2010. The decrease was driven primarily by a drop in the carriage of supplemental cargoes on our U.S. Flag Pure Car Truck Carriers, as volumes return to more historic levels. The segment’s gross voyage profit decreased from $40.7 million in the first nine months of 2010 to $21.5 million in the first nine months of 2011 primarily as a result of the aforementioned drop in supplemental cargoes and partially offset by a reduction in our lease expense. Our fixed revenues of $83.4 million and $88.0 million in the third quarter of 2011 and 2010, respectively, represent revenues derived from our fixed time charter contracts, and our variable revenues of $33.0 million and $71.1 million for the same periods in 2011 and 2010, respectively, represent revenues derived from our supplemental cargoes.
Our U.S. Flag Time Charter Contracts segment includes operating three Roll-on/Roll-off vessels for the MSC. In early 2009, we received notification from MSC that we had been excluded from further consideration for extending the current operating agreements on three U.S. Flag Roll-on/Roll-off vessels. Subsequently, the MSC has exercised options to extend the agreements several times with the most recent extension set to expire on December 31, 2011 for all three vessels. These three contracts represented 10% of our total revenue in the first nine months of 2011. Even if we successfully retain any one or more of these MSC contracts, we anticipate materially reduced revenues in future periods.
Time Charter Contracts-International Flag: Revenues increased from $37.7 million in the first nine months of 2010 to $41.8 million in the first nine months of 2011, while gross voyage profit decreased from $11.5 million in the first nine months of 2010 to $11.4 million in the first nine months of 2011. Contributions made from our three new Handy-Size Bulk Carriers placed in service in the first quarter of 2011 and our Capesize Bulk Carrier acquired from Dry Bulk at the end of the first quarter of 2011 were partially offset by lower results from our Indonesian operation, and the sale of our International Flag Container vessel. Our fixed revenues of $28.2 million and $37.7 million in the first nine months of 2011 and 2010, respectively, represents revenues derived from our fixed time charter contracts. Our variable revenues of $13.6 million in the first nine months of 2011 represent revenues earned by our three new Handy-Size Bulk Carriers pursuant to a revenue sharing agreement which commenced in January 2011. The increase of variable to fixed revenues in 2011 is due to the loss of our container vessels, which were under fixed time charters, and the addition of our three new Handy-Size Bulk Carriers in early 2011, currently not under fixed time charter agreements.
Contracts of Affreightment: For this segment, gross voyage profit decreased from a profit of $177,000 in the first nine months of 2010 to a loss of $100,000 for the same period in 2011 due to lower cargo volumes being carried in the first nine months of 2011, partially offset by rate increases for fuel adjustments.
Rail-Ferry Service: Adjusted gross voyage profit increased from a loss of $1.1 million in the first nine months of 2010, excluding a $25.4 million impairment loss taken on the segment’s two Roll-on/Roll-off Special Purpose double deck vessels in the third quarter of 2010, to a profit of $1.2 million in the first nine months of 2011. Gross voyage loss including the impairment for the first nine months of 2010 was $26.5 million. Revenues for this segment increased from $21.0 million to $27.9 million, comparatively, in the first nine months of 2010 and 2011, respectively, reflecting an increase in northbound cargo volumes due to higher volumes.
We based the aforementioned non-cash impairment charge taken in the third quarter of 2010 on the challenge to replace the major customer lost due to a facility relocation in 2009 and a lack of improved cargo volumes in the service throughout 2010 with no short term improvement expected in the segment’s operating results. We determined that the cash flows expected to be generated by the long-lived assets of the Rail-Ferry segment were less than the carrying amount of these assets, and believe the current results and cash flows support the adjusted asset values.
Other: Revenues remained constant and gross voyage profit increased slightly from $1.0 million in the first nine months of 2010 to $1.4 million in the first nine months of 2011, primarily due to an increase in brokerage income.
Administrative and General Expense
Administrative and general expenses decreased slightly from $16.3 million in the first nine months of 2010 to $16.1 million in the first nine months of 2011.
The following table shows the significant A&G components for the first nine months of 2011 and 2010 respectively.
|
(Amounts in Thousands)
|
Nine Months Ended
September 30,
|
|||||||||||||||
|
A&G Account
|
2011
|
2010
|
Variance
|
|||||||||||||
|
Wages and Benefits
|
$ | 8,440 | $ | 7,627 | $ | 813 | * | |||||||||
|
Amortization of Executive Stock Compensation
|
1,402 | 1,925 | (523 | ) | ||||||||||||
|
Office Building Expenses
|
1,041 | 1,102 | (61 | ) | ||||||||||||
|
Professional Services
|
1,935 | 1,873 | 62 | |||||||||||||
|
Insurance and Worker’s Comp
|
408 | 871 | (463 | ) | ||||||||||||
|
Other
|
2,827 | 2,880 | (53 | ) | ||||||||||||
|
TOTAL:
|
$ | 16,053 | $ | 16,278 | $ | (225 | ) | |||||||||
* Increases to wages and benefits was due to an adjustment to pension cost in the third quarter of 2010.
Other Income and Expense
Interest Expense increased from $5.5 million in the first nine months of 2010 to $7.5 million in the first nine months of 2011 due to higher debt balances associated with the financing of our three new Handy-Size Bulk Carriers and the financing on our two PCTCs, purchased in July 2011.
Derivative Loss of $109,000 in 2011 represents the ineffectiveness of a portion of a derivative contract and the related mark-to-market adjustment associated with this portion of the derivative (See Note 13).
Other income from vessel financing of $2.0 million in 2011 is due to interest earned on a note receivable on vessels sold to an Indonesian company in the third quarter of 2009.
Foreign Exchange Loss of $3.1 million in 2011 is due to the revaluation of our Yen-denominated loan associated with the financing of one of our International flag PCTC’s due to a strengthening of the value of the Yen. The exchange loss was based on a change in the exchange rate of 81.22 Yen to 1 USD at December 31, 2010 compared to 77.04 Yen to 1 USD at September 30, 2011 (See Item 1A Risk Factors).
Income Taxes
We recorded a provision for income taxes of $531,000 on $30.3 million of income before income from unconsolidated entities and a benefit of $693,000 on $1.4 million of income before income from unconsolidated entities for the nine months ended September 30, 2011 and 2010, respectively. The increase in our provision for income taxes was based on improvements in our operations taxed at the U.S. corporate statutory rate, and our establishment of a valuation allowance on certain deferred tax assets. Our qualifying U.S. flag operations continue to be taxed under a “tonnage tax” regime rather than under the normal U.S. corporate income tax regime. For further information on certain tax laws and elections, see our Annual Report on Form 10-K filed for the year ended December 31, 2010, including “Note F-Income Taxes” to the consolidated financial statements included therein.
Equity in Net Income of Unconsolidated Entities
Equity in net income of unconsolidated entities, net of taxes, decreased from $4.2 million in the first nine months of 2010 to $22,000 in the same period of 2011. The results were impacted by our results in our 25% investment in Oslo Bulk. Our portion of the earnings of Oslo Bulk were losses of $1.3 million and $972,000 for the nine months ended September 30, 2011 and 2010, respectively, primarily driven by negative mark-to-market adjustments of $603,000 and $1.4 million, respectively, on an ineffective interest rate swap contract. The decrease in the results were also due to results from Dry Bulk being included in our consolidated results following our March 25, 2011 acquisition of full control of Dry Bulk.
LIQUIDITY AND CAPITAL RESOURCES
The following discussion should be read in conjunction with the more detailed Condensed Consolidated Balance Sheets and Condensed Consolidated Statements of Cash Flows included elsewhere herein as part of our Consolidated Financial Statements.
Our working capital (which we define as the difference between our total current assets and total current liabilities) decreased from $15.1 million at December 31, 2010, to $11.9 million at September 30, 2011. Cash and cash equivalents decreased during the first nine months of 2011 by $7.5 million to a total of $16.6 million at September 30, 2011. The decrease in cash and cash equivalents was a result of cash used in investing activities of $73.7 million, partially offset by cash provided by operating activities of $30.0 million and by cash provided by financing activities of $36.2 million. Total current liabilities of $57.7 million as of September 30, 2011 included current maturities of long-term debt of $35.1 million.
Net cash provided by operating activities for the first nine months of 2011 was $30.0 million after adjusting net income of $29.8 million upward for non-cash items such as depreciation and amortization, non-cash stock based compensation, a foreign exchange loss of $3.1 million on a Yen-denominated loan, partially offset by, among other things, an $18.8 million non-cash gain on our acquisition of full control of Dry Bulk (See Note 5). In addition, we received cash dividends of $750,000 from Dry Bulk, prior to the acquisition.
Net cash used in investing activities of $73.7 million included capital expenditures of $82.2 million, classifying $6.2 million as restricted cash as required by a loan to value covenant under one of our loan agreements in connection with our Yen denominated facility, and investments in unconsolidated entities of $2.0 million, offset by principal payments received under direct financing leases of $4.1 million, $7.1 million related to the acquisition of Dry Bulk, $2.5 million from proceeds from sales of marketable securities and $3.1 million from cash received on note receivables.
Included in the $82.2 million of capital expenditures are $11.9 million for the final installment payment related to the three Handy-size Bulk Carriers delivered in January 2011, $64.5 million for the purchase pursuant to early buy outs of two previously leased PCTC vessels, $3.9 million of installment payments on the Handymax Bulk Carrier Newbuilding assumed in the purchase of Dry Bulk and $1.9 million for the down payment on a 2000-built multi-purpose ice strengthened vessel.
Net cash provided by financing activities of $36.2 million included outflows of regularly scheduled debt payments of $19.1 million, a line of credit payment of $10 million, a payment of $28.6 million to discharge debt assumed in connection with acquiring full control of Dry Bulk and cash dividends paid of $8.3 million. These cash outflows were offset by proceeds of $58.1 million from the final bank draw on the facility agreement to finance the construction and delivery of three Handy-Size dry bulk carriers delivered in January 2011 and the refinancing of the loan on the Capesize vessel acquired in the Dry Bulk transaction, and $45.9 million received under a secured term loan facility agreement related to the purchase of two previously leased PCTC vessels, both of which are more fully described below.
As of September 30, 2011, the full amount of our $30 million unsecured revolving line of credit, which expires April 6, 2013, is available for future draws as needed. Associated with this credit facility is a commitment fee of .125% per year on the undrawn portion of this facility.
We have filed with the Securities and Exchange Commission a universal shelf registration statement which we believe may provide us with flexibility to access the public equity and debt markets.
Debt and Lease Obligations – As of September 30, 2011, we held five vessels under operating contracts, two vessels under time charter agreements and three vessels under bareboat charter or lease agreements. The types of vessels held under these agreements include two Breakbulk/Multi Purpose vessels, four container vessels and three Roll-On/Roll-Off vessels, all of which operate in our Time Charter Contracts – U.S. Flag and International Flag segments, and a Molten Sulphur Carrier operating in our Contracts of Affreightment segment.
Our operating lease agreements have fair value renewal options, early buy-out options and fair value purchase options. Most of the agreements impose defined minimum working capital and net worth requirements, impose restrictions on the payment of dividends, and prohibit us from incurring, without prior written consent, additional debt or lease obligations, subject to certain specified exceptions. In July 2011, we purchased two previously leased vessels for an aggregate purchase price of $64.5 million pursuant to early buy-out options. On June 29, 2011, we entered into a secured term loan facility agreement that permitted us to borrow of up to $45.9 million, for these purposes. In July, 2011, we drew the full amount of borrowings available under this facility agreement to finance a substantial portion of the aggregate purchase price for the two vessels, and paid the remainder of the purchase price with cash on hand. All loans under this facility agreement are scheduled to mature on June 29, 2018. For further information, please see our Current Report on Form 8-K dated June 29, 2011.
We also conduct certain of our operations from leased office facilities. Please refer to our 2010 annual report on Form 10-K for a schedule of our contractual obligations.
Substantially all of our credit agreements require us to comply with various loan covenants, including financial covenants that require minimum levels of net worth, working capital and interest expense coverage and a maximum amount of debt leverage.
As of September 30, 2011, the Company was in compliance with all financial covenants related to its debt obligations and we believe, based on current circumstances, that it is likely that we will continue to meet such covenants in the near future. The following table represents the actual and required covenant amounts for the nine months ending September 30, 2011:
|
Actual
|
Required
|
||||||||||
| (1 | ) |
Net Worth (thousands of dollars)
|
$ | 255,308 | $ | 241,730 | |||||
| (2 | ) |
Working Capital (thousands of dollars)
|
$ | 11,852 | $ | 1 | |||||
| (3 | ) |
Interest Expense Coverage Ratio (minimum)
|
9.86 | 2.50 | |||||||
| (4 | ) |
Leverage Ratio (maximum)
|
3.77 | 4.25 | |||||||
|
1.
|
Total assets minus total liabilities.
|
|
2.
|
Total current assets minus total current liabilities.
|
|
3.
|
Defined as the ratio between consolidated earnings before interest, taxes, depreciation, and amortization (“EBITDA”) to interest expense.
|
|
4.
|
Defined as the ratio between consolidated indebtedness to consolidated EBITDA.
|
In the unanticipated event that our cash flow and capital resources are not sufficient to fund our debt service obligations, we could be forced to reduce or delay capital expenditures, sell assets, obtain additional capital, enter into financings of our unencumbered vessels or restructure debt. Based on current circumstances we believe we can continue to fund our working capital and routine capital investment liquidity needs through cash flow from operations and/or accessing available lines of credit. To the extent we are required to seek additional capital, our efforts could be hampered by the on-going uncertainty in the credit markets. We presently have variable to fixed interest rate swaps on 48% of our long-term debt. We have debt of $9.0 million due in the fourth quarter of 2011, $46.6 million due in 2012, $48.2 million due in 2013 and $32.3 million due in 2014.
Bulk Carriers - In November 2009, we contracted with a Korean shipyard to construct three double hull Handy-Size Bulk Carrier Newbuildings. We made contract payments of $17.0 million in the fourth quarter 2009, $60.0 million in 2010, and $12.0 million in January 2011 on these vessels. All three vessels were delivered in January 2011. With our equity position on these Newbuildings being fully funded, on August 2, 2010, we entered into a $55.2 million Senior Secured Term Loan Facility Agreement to finance the construction and delivery installment payments under separate shipbuilding contracts for these three Newbuildings. The Facility matures in seven years and annual principal payments prior to then are based on a 15-year amortization schedule.
As a result of increasing our ownership in Dry Bulk from 50% to 100% on March 25, 2011, we presently own a 100% interest in a Handymax Bulk Carrier Newbuilding, scheduled to be delivered in the first quarter of 2012. Total investment in this newbuilding is anticipated to be approximately $39.9 million. During the period of construction up to delivery, we expect to contribute 35% of the purchase price, of which $11.7 million has been contributed through September 30, 2011. On June 20, 2011, we entered into a secured loan facility agreement in the amount of $47.5 million, divided into two tranches: Tranche A which provided $24.2 million used to refinance and repay existing indebtedness of $22.0 million related to a Cape Size vessel assumed in connection with the Dry Bulk acquisition, and Tranche B providing up to $23.3 million to finance the remaining installment payments on the Handymax Bulk Carrier Newbuilding. Under Tranche B, we expect to draw $6.0 million in November 2011 and $17.3 million in January 2012 and estimate additional equity contributions of $2.0 million and $2.6 million will be required to fund the launching and final delivery of the vessel. For further information on this agreement, see our Current Report on Form 8-K, dated June 20, 2011.
In December 2009, we acquired for $6.25 million a 25% investment in Oslo Bulk AS (“Oslo Bulk”) which in 2008 contracted to build eight new Mini-Bulkers. All of the Mini-Bulkers have been delivered and deployed as of July 2011. During 2010, we invested an additional $3.9 million in Tony Bulkers Pte Ltd, (“Tony Bulkers”), an affiliate of Oslo Bulk AS, for our 25% share of the installment payments for two additional new Mini-Bulkers, both of which have been delivered and deployed as of July 2011. We paid our remaining share of installment payments associated with these two Mini-Bulkers of approximately $1.7 million in January 2011. These investments are accounted for under the equity method and our share of earnings or losses is reported in our consolidated statements of operations, net of taxes.
Cash Dividend Payments – The payment of dividends to common stockholders is at the discretion of our board of directors. On October 29, 2008, our Board of Directors authorized the reinstitution of a quarterly cash dividend program beginning in the fourth quarter of 2008. Since then, the Board has declared a cash dividend each quarter.
Environmental Issues – Our environmental risks primarily relate to oil pollution from the operation of our vessels. We have pollution liability insurance coverage with a limit of $1 billion per occurrence, with deductible amounts not exceeding $250,000 for each incident.
New Accounting Pronouncements - In May 2011, the Financial Accounting Standard Board (“FASB”) issued ASU 2011-04, Fair Value Measurement (Topic 820): Amendments to Achieve Common Fair Value Measurement and Disclosure Requirements in U.S. GAAP and IFRSs. ASU 2011-04 clarifies some existing concepts, eliminates wording differences between U.S. GAAP and International Financial Reporting Standards (“IFRS”), and in some limited cases, changes some principles to achieve convergence between U.S. GAAP and IFRS. ASU 2011-04 results in a consistent definition of fair value and common requirements for measurement of and disclosure about fair value between U.S. GAAP and IFRS. ASU 2011-04 also expands the disclosures for fair value measurements that are estimated using significant unobservable (Level 3) inputs. ASU 2011-04 will be effective for International Shipholding Corporation beginning after December 15, 2011. We do not expect the adoption of ASU 2011-04 to have a material effect on our operating results or financial position.
In June 2011, the FASB issued ASU 2011-05, Presentation of Comprehensive Income , which requires an entity to present the total of comprehensive income, the components of net income, and the components of other comprehensive income either in a single continuous statement of comprehensive income, or in two separate but consecutive statements. ASU 2011-05 eliminates the option to present components of other comprehensive income as part of the statement of equity. ASU 2011-05 will be effective for International Shipholding Corporation beginning after December 15, 2011. We do not expect the adoption of ASU 2011-05 to have a material effect on our operating results or financial position, and will apply these new requirements starting in the first quarter of 2012.
ITEM 3 – QUANTITATIVE AND QUALITATIVE INFORMATION ABOUT MARKET RISK
In the ordinary course of our business, we are exposed to foreign currency, interest rate, and commodity price risk. We utilize derivative financial instruments including interest rate swap agreements and forward exchange contracts, and in the past we have also utilized commodity swap agreements to manage certain of these exposures. We hedge firm commitments or anticipated transactions and do not enter into derivatives for speculative purposes. We neither hold nor issue financial instruments for trading purposes.
Interest Rate Risk. The fair value of our cash and short-term investment portfolio at September 30, 2011 approximated its carrying value due to the short-term duration of the underlying securities. The potential decrease in fair value resulting from a hypothetical 10% change in interest rates at quarter-end for our investment portfolio is not material.
The fair value of variable rate long-term debt at September 30, 2011, including current maturities, was estimated to equal the carrying value of $299.4 million.
We enter into interest rate swap agreements to manage well-defined interest rate risks. The Company records the fair value of the interest rate swaps as an asset or liability on its balance sheet. Currently, each of the Company’s USD-denominated interest rate swaps is accounted for as an effective cash flow hedge. Accordingly, the effective portion of the change in fair value of the swap is recorded in Other Comprehensive Income (Loss). A portion of the Yen interest rate swap we entered into in 2009 is deemed ineffective, and because it is no longer supported by underlying borrowings due to the bank exercising a one time option to reduce available funding, changes in fair value of this portion are thereby recorded to earnings. On June 13, 2011 we entered into an interest rate swap covering 50% of our interest expense exposure related to the new credit facility executed on June 29, 2011. The swap agreement is effective June 29, 2011 and fixed our rate at 4.47% per annum. The notional amount of the swap agreement is $21.7 million, or approximately 50% of the amount of the credit facility. As of September 30, 2011, the Company has the following interest rate swap contracts outstanding:
|
Effective
Date
|
Termination
Date
|
Current Notional Amount
|
Swap Rate
|
Type
|
|
11/30/05
|
11/30/12
|
$13,195,000
|
5.17%
|
Fixed
|
|
3/31/08
|
9/30/13
|
$10,418,667
|
3.46%
|
Fixed
|
|
9/30/10
|
9/30/13
|
$10,418,667
|
2.69%
|
Fixed
|
|
9/30/10
|
9/30/13
|
$10,418,667
|
2.45%
|
Fixed
|
|
9/26/05
|
9/28/15
|
$8,000,000
|
4.41%
|
Fixed
|
|
9/26/05
|
9/28/15
|
$8,000,000
|
4.41%
|
Fixed
|
|
3/15/09
|
9/15/20
|
¥ 5,861,333,336
|
2.065%
|
Fixed
|
|
6/29/11
|
6/29/18
|
$21,696,430
|
1.80%
|
Fixed
|
The fair value of these agreements at September 30, 2011, estimated based on the amount that the banks would receive or pay to terminate the swap agreements at the reporting date, taking into account current market conditions and interest rates, is a liability of $10.1 million. A hypothetical 10% decrease in interest rates as of September 30, 2011, would have resulted in a liability of $10.5 million.
Commodity Price Risk. As of September 30, 2011, we did not have commodity swap agreements in place to manage our exposure to the risk of increases in the price of fuel necessary to operate both our Rail-Ferry Service and Contract of Affreightment segments. We have fuel surcharges and escalation adjustments in place for both segments, which we believe manages the price risk for those services during 2011. We estimate that a 20% increase in the price of fuel for the period January 1, 2011 through September 30, 2011 would have resulted in an increase of approximately $1.3 million in our fuel costs for the same period, and in a corresponding decrease of approximately $0.18 in our basic earnings per share based on the shares of our common stock outstanding as of September 30, 2011. The additional fuel costs assume no additional revenue would be generated from fuel surcharges, even though we believe that we could have passed on to our customers some or all of the fuel price increases through the aforementioned fuel surcharges during the same period, subject to the need to maintain competitive freight rates. Our charterers in the Time Charter Contracts – U.S. Flag and the Time Charter Contracts – International Flag segments are responsible for purchasing vessel fuel requirements; thus, we have no direct fuel price risk in these segments.
Foreign Exchange Rate Risk. We have entered into foreign exchange contracts to hedge certain firm foreign currency purchase commitments. In 2010, we entered into a forward purchase contract which expires in December 2011. The contract was for Indonesian Rupiah for $1,800,000 U.S. Dollar equivalents at an exchange rate of 9670. In 2011, we entered into four forward purchase contracts which expire in 2012. The first was for Mexican Pesos for $750,000 U.S. Dollar equivalents at an exchange rate of 12.1818, the second was for Mexican Pesos for $1,200,000 U.S. Dollar equivalents at an exchange rate of 12.4717, the third was for Mexican Pesos for $450,000 U.S. Dollar equivalents at an exchange rate of 13.036 and the fourth was for Mexican Pesos for $750,000 U.S. Dollar equivalents at an exchange rate of 14.0292. Our foreign exchange contracts represent approximately 100% of our projected Mexican Peso exposure and 50%_of our projected Indian Rupiah exposure.
The following table summarizes the current value of these contracts:
|
(Amounts in Thousands)
|
||||||||
|
Transaction Date
|
Type of Currency
|
Transaction Amount in Dollars
|
Effective Date
|
Expiration Date
|
||||
|
June 2010
|
Rupiah
|
$ 450,000
|
January 2011
|
December 2011
|
||||
|
August 2011
|
Peso
|
$ 675,000
|
September 2011
|
June 2012
|
||||
|
August 2011
|
Peso
|
$ 1,125,000
|
September 2011
|
December 2011
|
||||
|
September 2011
|
Peso
|
$ 450,000
|
July 2012
|
December 2012
|
||||
|
September 2011
|
Peso
|
$ 750,000
|
October 2011
|
December 2012
|
||||
The fair value of these contracts at September 30, 2011, is an asset of $304,000. The potential fair value of these contracts that would have resulted from a hypothetical 10% adverse change in the exchange rates would be an asset of $274,000.
On January 23, 2008, one of our wholly-owned subsidiaries entered into a 10 year Senior Secured Term Loan Facility denominated in Japanese Yen, commencing in March 2010, for the purchase of a PCTC Newbuilding, which was completed and delivered in March 2010. The decision to enter into this Yen loan was driven by the lower Yen interest rates versus the USD interest rates at that time. Subsequently, we entered into a Yen interest rate swap designed to cap the interest at 2.065%. In June 2009, we received notification that the lender exercised its option to reduce the Yen financing on this vessel from 80% to 65% of the delivered vessel cost. The loan was fully drawn in March 2010 to the full amount available of Yen 5,102,500,000. Under current accounting guidelines, since this Facility is not denominated in our functional currency, the outstanding balance of the Facility as of the end of each reporting period is to be revalued, with any adjustments recorded to earnings. Due to the amount of the Facility, we may sustain fluctuations that may cause material swings in our reported results. As an example, a hypothetical 1 to 5 Yen increase or decrease on the exchange rate between the U.S. Dollar and Yen, which was $1 to Yen 77.04 at September 30, 2011, would impact our earnings by approximately $600,000 to $3.0 million for the reporting period (See Item 1A-Risk Factors). While we believe that these fluctuations may smooth out over time, any particular reporting period could be materially impacted by these adjustments. There was a 4% appreciation in the Yen to USD exchange rate at September 30, 2011 compared to June 30, 2011, resulting in a $2.7 million foreign exchange loss for the three months ended September 30, 2011, reported under Interest and Other on our consolidated Statement of Operations. We plan to continue to monitor the movements in the foreign currency markets in order to take advantage of potential opportunities. From time to time over the past year, the Japanese Government has intervened in the foreign currency market in an attempt to weaken the value of the Yen. We bought forward contracts to purchase Yen to cover our installments due under the Facility for the periods December 15, 2010 and March 15, 2011. The rate of exchange for these transactions was approximately Yen 85.4 to 1 USD, with total USD equivalents of $3,005,000. On January 27, 2011 we purchased another 128 million Yen to cover the June 15, 2011 installment for 82.80 to 1 USD, or a USD equivalent of $1,546,000. On April 1, 2011, we purchased another 126 million Yen to cover the September 15, 2011 installment for 84.03 to 1 USD, or a USD equivalent of $1,500,000. Due to the strengthening of the Yen throughout the third quarter of 2011, we have not purchased any further contracts, but will continue to monitor the markets.
ITEM 4 – CONTROLS AND PROCEDURES
As of the end of the period covered by this report, we conducted an evaluation of the effectiveness of our “disclosure controls and procedures,” as that phrase is defined in Rule 13a-15(e) under the Securities Exchange Act of 1934. The evaluation was carried out under the supervision and with the participation of our management, including our Chief Executive Officer (“CEO”) and Chief Financial Officer (“CFO”).
Based on that evaluation, our CEO and CFO have concluded that our disclosure controls and procedures were effective as of September 30, 2011 in providing reasonable assurance that they have been timely alerted of material information required to be disclosed in this quarterly report. During the first nine months of 2011, we did not make any changes to our internal control over financial reporting that materially affected, or that we believe are reasonably likely to materially affect, our internal control over financial reporting.
The design of any system of controls is based in part upon certain assumptions about the likelihood of future events and contingencies, and there can be no assurance that any design will succeed in achieving its stated goals. Because of inherent limitations in any control system, misstatements due to error or fraud could occur and not be detected.
PART II – OTHER INFORMATION
ITEM 1A. RISK FACTORS
We described in Item 1A of our annual report on Form 10-K for the year ended December 31, 2010 material risks known to us as of the date of such report. Set forth below are material developments since the date of such report.
We have a Yen-denominated loan and volatility in the USD/Yen exchange rate could cause material adjustments to the earnings we report each quarter.
We have a Yen-denominated loan of Yen 5,102,500,000 which at September 30, 2011, the remaining outstanding balance equated to a USD $61.8 million liability at a USD/Yen exchange rate of 77.04. As described further in Part I, Item 3, of this report, current accounting guidelines require us to record adjustments to our earnings each quarter based on the impact that changes in exchange rates have on our liability under this loan. Volatility in USD/Yen exchange ratios could cause material adjustments to the earnings we report each quarter.
The demand for our transportation services may be adversely affected by a prolonged economic downturn or economic uncertainty.
The demand for our transportation services has been and will continue to be affected by domestic and global economic conditions. Worldwide economic growth has been sluggish since 2008, and many experts believe that a confluence of factors in the United States, Europe and developing economies will result in a prolonged period of economic downturn, slow growth or economic uncertainty. If these conditions persist, our customers and potential customers may experience a deterioration in their business, which may result in a lower demand for our transportation services or impair the ability of our customers or other third parties to pay amounts owed to us.
If we plan to access the public debt markets, we cannot assure you that these markets will remain free of disruptions.
We have a significant amount of indebtedness that we intend to refinance over the next couple of years. Our ability to arrange additional financing will depend on, among other factors, our financial position and performance, as well as prevailing market conditions and other factors beyond our control. Prevailing market conditions could be adversely affected by the ongoing sovereign debt crises in Europe, the failure of the United States to reduce its deficit in amounts deemed to be sufficient, downgrades in the credit ratings of the U.S. debt, contractions or limited growth in the economy or other similar adverse economic developments in the U.S. or abroad. As a result, we cannot assure you that we will be able to obtain additional financing on terms acceptable to us or at all. Any such failure to obtain additional financing could jeopardize our ability to repay, refinance or reduce our debt obligations.
ITEM 2 – UNREGISTERED SALES OF EQUITY SECURITIES AND USE OF PROCEEDS
On January 25, 2008, the Company’s Board of Directors approved a share repurchase program for up to a total of 1,000,000 shares of the Company’s common stock. We expect that any share repurchases under this program will be made from time to time for cash in open market transactions at prevailing market prices. The timing and amount of any purchases under the program will be determined by management based upon market conditions and other factors. In 2008, we repurchased 491,572 shares of our common stock for $11.5 million. Thereafter, we suspended repurchases until the second quarter of 2010, when we repurchased 223,051 shares of our common stock for $5.2 million. We have not made any further repurchases since that date. Unless and until the Board otherwise provides, this authorization will remain open indefinitely, or until we reach the 1,000,000 share limit.
This table provides certain information with respect to the Company’s purchase of shares of its common stock during the first nine months of 2011:
|
ISSUER PURCHASES OF EQUITY SECURITIES
|
||||
|
Period
|
(a) Total Number of Shares Purchased
|
(b) Average Price Paid per Share
|
(c) Total Number of Shares Purchased as Part of Publicly Announced Plan
|
(d) Maximum Number of Shares that May Yet Be Purchased Under the Plan
|
|
July 1, 2011 – July 31, 2011
|
-
|
-
|
-
|
285,377
|
|
August 1, 2011 – August 31, 2011
|
-
|
-
|
-
|
285,377
|
|
September 1, 2011 – September 30, 2011
|
-
|
-
|
-
|
285,377
|
On February 1, 2011 and March 14, 2011, 15,107 and 16,734 shares of Common Stock, respectively, were retired in order to meet tax liabilities associated with the vesting of Restricted Stock Grants by our executive officers.
ITEM 6 – EXHIBITS
(a) EXHIBIT INDEX
Part II Exhibits:
(3.1) Exhibits
|
(3.1)
|
Restated Certificate of Incorporation of the Registrant, as amended through May 19, 2010 (filed with the Securities and Exchange Commission as Exhibit 3.1 to the Registrant's Form 10-Q dated July 28, 2010 and incorporated herein by reference)
|
|
(3.2)
|
By-Laws of the Registrant as amended through October 28, 2009 (filed with the Securities and Exchange Commission as Exhibit 3.2 to the Registrant's Form Current Report on Form 8-K dated November 2, 2009 and incorporated herein by reference)
|
|
(4.1)
|
Specimen of Common Stock Certificate (filed as an exhibit to the Registrant's Form 8-A filed with the Securities and Exchange Commission on April 25, 1980 and incorporated herein by reference)
|
|
(10.1)
|
Credit Agreement, dated as of September 30, 2003, by and among LCI Shipholdings, Inc. and Central Gulf Lines, Inc., as Joint and Several Borrowers, the banks and financial institutions listed therein, as Lenders, Deutsche Schiffsbank Aktiengesellschaft as Facility Agent and Security Trustee, DnB NOR Bank ASA, as Documentation Agent, and the Registrant, as Guarantor (filed with the Securities and Exchange Commission as Exhibit 10.2 to Pre-Effective Amendment No. 2, dated December 10, 2004 and filed with the Securities and Exchange Commission on December 10, 2004, to the Registrant's Registration Statement on Form S-1 (Registration No. 333-120161) and incorporated herein by reference)
|
|
(10.2)
|
Credit Agreement, dated September 26, 2005, by and among Central Gulf Lines, Inc., as Borrower, the banks and financial institutions listed therein, as Lenders, DnB NOR Bank ASA, as Facility Agent and Arranger, and Deutsche Schiffsbank Aktiengesellschaft, as Security Trustee and Arranger, and the Registrant, as Guarantor (filed with the Securities and Exchange Commission as Exhibit 10.1 to the Registrant's Current Report on Form 8-K dated September 30, 2005 and incorporated herein by reference)
|
|
(10.3)
|
Credit Agreement, dated December 13, 2005, by and among CG Railway, Inc., as Borrower, the investment company, Liberty Community Ventures III, L.L.C., as Lender, and the Registrant, as Guarantor (filed with the Securities and Exchange Commission as Exhibit 10.4 to the Registrant's Form 10-K for the annual period ended December 31, 2005 and incorporated herein by reference)
|
|
(10.4)
|
Credit Agreement, dated as of June 29, 2010, by and among Waterman Steamship Corporation, as borrower, the Registrant, as guarantor, and Regions as lender, relating to a $46.0 million term loan (filed with the Securities and Exchange Commission as Exhibit 10.11 to the Registrant's Form 10-Q dated July 28, 2010 and incorporated herein by reference)
|
|
(10.5)
|
Credit Agreement, dated as of August 2, 2010, by and among East Gulf Shipholding, Inc., as borrower, the Registrant, as guarantor, the banks and financial institutions listed therein, as lenders, and ING Bank N.V., London Branch, as facility agent and security trustee. (filed with the Securities and Exchange Commission as Exhibit 10.12 to the Registrant’s Form 10-Q/A dated December 23, 2010 and incorporated herein by reference) (On December 28, 2010, the Securities and Exchange Commission granted confidential treatment with respect to certain portions of this exhibit.)
|
|
(10.6)
|
$30,000,000 Revolving Loan to the Registrant and seven of its subsidiaries by Regions Bank dated March 7, 2008, as amended by instruments dated March 3, 2009, August 13, 2009, March 31, 2010, March 31, 2011 and July 18, 2011. (filed with the Securities and Exchange Commission as Exhibit 10.6 to the Registrant’s Form 10-Q dated May 5, 2011 and incorporated herein by reference)
|
|
(10.7)
|
Credit Agreement, dated as of January 23, 2008, by and among East Gulf Shipholding, Inc., as borrower, the Registrant, as guarantor, the banks and financial institutions party thereto, as lenders, DnB NOR Bank ASA, as facility agent, and Deutsche Schiffsbank Aktiengesellschaft, as security trustee. (filed with the Securities and Exchange Commission as Exhibit 10.13 to the Registrant’s Form 10-K for the annual period ended December 31, 2007 and incorporated herein by reference)
|
|
(10.8)
|
Credit Agreement, dated as of June 20, 2011, by and among Dry Bulk Australia Ltd. and Dry Bulk Americas Ltd., as joint and several borrowers, the Registrant, as guarantor, and ING Bank N.V. London branch, as lender, facility agent and security trustee (filed with the Securities and Exchange Commission as Exhibit 10.8 to the Registrant’s Form 10-Q for the quarterly period ended June 30, 2011 and incorporated herein by reference)
|
|
(10.9)
|
Credit Agreement, dated as of June 29, 2011, by and among LCI Shipholdings, Inc. and Waterman Steamship Corporation, as joint and several borrowers, the Registrant, as guarantor, DnB NOR Bank ASA and HSH Nordbank AG, New York Branch, as lenders, DnB NOR Bank ASA, as bookrunner, facility agent and security trustee and DnB NOR Bank ASA and HSH Nordbank AG, New York Branch, as mandated lead arrangers (filed with the Securities and Exchange Commission as Exhibit 10.9 to the Registrant’s Form 10-Q for the quarterly period ended June 30, 2011 and incorporated herein by reference)
|
|
(10.10)
|
Consulting Agreement, dated December 15, 2010, between the Registrant and Erik F. Johnsen (filed with the Securities and Exchange Commission as Exhibit 10.8 to the Registrant’s Form 10-K for the annual period ended December 31, 2010 and incorporated herein by reference)
|
|
(10.11)
|
International Shipholding Corporation 2011 Stock Incentive Plan (filed with the Securities and Exchange Commission as Exhibit 99.2 to the Registrant's Current Report dated April 27, 2011 on Form 8-K filed on April 29, 2011 and incorporated herein by reference)
|
|
(10.12)
|
Form of Restricted Stock Agreement dated April 30, 2008 under the International Shipholding Corporation 2009 Stock Incentive Plan (filed with the Securities and Exchange Commission as Exhibit 10.1 to the Registrant’s Form 8-K dated May 6, 2008 and incorporated herein by reference)
|
|
(10.13)
|
Form of Restricted Stock Agreement dated January 26, 2011 under the International Shipholding Corporation 2009 Stock Incentive Plan (filed with the Securities and Exchange Commission as Exhibit 10.13 to the Registrant’s Form 10-K for the annual period ended December 31, 2010 and incorporated herein by reference)
|
|
(10.14)
|
Form of Restricted Stock Agreement dated January 26, 2011 under the International Shipholding Corporation 2009 Stock Incentive Plan (filed with the Securities and Exchange Commission as Exhibit 10.14 to the Registrant’s Form 10-K for the annual period ended December 31, 2010 and incorporated herein by reference)
|
|
(10.15)
|
Description of Life Insurance Benefits Provided by the Registrant to Niels W. Johnsen and Erik F. Johnsen Plan (filed with the Securities and Exchange Commission as Exhibit 10.8 to the Registrant's Form 10-K for the annual period ended December 31, 2004 and incorporated herein by reference)
|
|
(10.16)
|
Change of Control Agreement, by and between the Registrant and Niels M. Johnsen, effective as of August 6, 2008 (filed with the Securities and Exchange Commission as Exhibit 10.14 to the Registrant’s Form 10-Q for quarterly period ended June 30, 2008 and incorporated herein by reference)
|
|
(10.17)
|
Change of Control Agreement, by and between the Registrant and Erik L. Johnsen, effective as of August 6, 2008 (filed with the Securities and Exchange Commission as Exhibit 10.15 to the Registrant’s Form 10-Q for quarterly period ended June 30, 2008 and incorporated herein by reference)
|
|
(10.18)
|
Change of Control Agreement, by and between the Registrant and Manuel G. Estrada, effective as of August 6, 2008 (filed with the Securities and Exchange Commission as Exhibit 10.16 to the Registrant’s Form 10-Q for quarterly period ended June 30, 2008 and incorporated herein by reference)
|
|
(10.19)
|
Form of Indemnification Agreement, by and between the Registrant and members of the Board of Directors, effective as of November 11, 2009 (filed with the Securities and Exchange Commission as Exhibit 10.20 to the Registrant’s Form 10-K for the annual period ended December 31, 2009 and incorporated herein by reference)
|
(31.1)Certification of Chief Executive Officer Pursuant to Section 302 of the Sarbanes-Oxley Act of 2002 *
|
|
(31.2)
|
Certification of Chief Financial Officer Pursuant to Section 302 of the Sarbanes-Oxley Act of 2002 *
|
|
|
(32.1)
|
Certification of Chief Executive Officer Pursuant to 18 U.S.C. Section 1350 as Adopted Pursuant to Section 906 of the Sarbanes-Oxley Act of 2002 *
|
|
|
(32.2)
|
Certification of Chief Financial Officer Pursuant to 18 U.S.C. Section 1350 as Adopted Pursuant to Section 906 of the Sarbanes-Oxley Act of 2002 *
|
*filed with this report
SIGNATURES
Pursuant to the requirements of the Securities and Exchange Act of 1934, the registrant has duly caused this report to be signed on its behalf by the undersigned thereunto duly authorized.
INTERNATIONAL SHIPHOLDING CORPORATION
/s/ Manuel G. Estrada
_____________________________________________
Manuel G. Estrada
Vice President and Chief Financial Officer
(Principal Financial and Accounting Officer)
Date: November 3, 2011
22