Attached files
| file | filename |
|---|---|
| 8-K - 8-K - OMNOVA SOLUTIONS INC | a4_30x15xinvestor8k.htm |

Global Innovator of Performance Chemicals and Engineered Surfaces Creating Sustainable Long-Term Value Kevin M. McMullen Chairman & CEO April 30, 2015 Investor Presentation Exhibit 99.1

Forward-Looking Statements • This presentation and the accompanying oral remarks include descriptions of our current business, operations, assets and other matters affecting the Company as well as “forward- looking statements,” as defined by federal securities laws. All forward-looking statements by the Company, including verbal statement, in connection with this presentation, are intended to qualify for the protections afforded forward-looking statements under the Private Securities Litigation Reform Act of 1995. Forward-looking statements reflect management’s current expectation, judgment, belief, assumption, estimate or forecast about future events, circumstances or results and may address business conditions and prospects, strategy, capital structure, debt and cash levels, sales, profits, earnings, markets, products, technology, operations, customers, raw materials, claims and litigation, financial condition and accounting policies, among other matters. Words such as, but not limited to, “will,” “may,” “should,” “projects,” “forecasts,” “seeks,” “believes,” “expects,” “anticipates,” “estimates,” “intends,” “plans,” “targets,” “optimistic,” “likely,” “would,” “could”, “committed” and similar expressions or phrases identify forward-looking statements. • All descriptions of our business, operations and assets, as well as all forward-looking statements involve risks and uncertainties. Many risks and uncertainties are inherent in business generally and the markets in which the Company operates or proposes to operate. Other risks and uncertainties are more specific to the Company’s businesses including businesses the Company acquires. There may be risks and uncertainties not currently known to us. The occurrence of risks and uncertainties and the impact of such occurrences is often not predictable or within the Company’s control. Such impacts could adversely affect the Company’s business, operations or assets as well as the Company’s results and, in some cases, such effect could be material. • All written and verbal descriptions of our business, operations and assets and all forward-looking statements attributable to the Company or any person acting on the Company’s behalf are expressly qualified in their entirety by the risks, uncertainties and cautionary statements contained herein. • All such descriptions and forward-looking statements speak only as of the date on which such description or statement is made, and the Company undertakes no obligation, and specifically declines any obligation other than that imposed by law, to publicly update, including chemical exposure, releases and explosions; revise any such descriptions or forward- looking statements whether as a result of additional information, future events or otherwise. • Risks and uncertainties that may adversely affect our current business, operations, assets or other matters affecting the Company and may cause actual results to materially differ from expectations include, but are not limited to: (1) our exposure to general economic, business, and industry conditions; (2) changes in raw material prices and availability; (3) the highly competitive markets we serve and continued consolidations among our customer base; (4) our ability to develop new products that appeal to customers; (5) the creditworthiness of our customers; (6) the concentration of our Performance Chemicals business among several large customers; (7) increased foreign competition for our customers and suppliers; (8) the inherent risks of international operations; (9) risks associate with the use of chemicals; (10) the failure of a joint venture partner to meet its commitments; (11) our ability to identify and complete strategic transactions; (12) our ability to successfully integrate acquired companies; (13) extraordinary events such as natural disasters, political disruptions, terrorist attacks and acts of war; (14) unanticipated capital expenditures; (15) increases in healthcare costs; (16) our ability to retain or recruit key employees; (17) our ability to renew collective bargaining agreements with employees on acceptable terms and the risk of work stoppages; (18) our contribution obligations under our U.S. pension plan; (19) our failure to protect our intellectual property; (20) adverse litigation outcomes or settlements; (21) our reliance on foreign financial institutions to hold some of our funds; (22) information systems failures and cyberattacks; (23) potential goodwill impairment charges; (24) the actions of activist shareholders; (25) our substantial debt and any decision in the future to incur additional debt; (26) the operational and financial restrictions contained in our indenture; (27) a default under our term loan or revolving credit facility; and (28) our ability to generate sufficient cash to service our outstanding debt. • We provide greater detail regarding these risks and uncertainties in our 2014 Form 10-K and subsequent filings, which are available online at www.omnova.com and www.sec.gov. Non-GAAP Financial Measures This presentation includes certain non-GAAP financial measures as defined by the Securities and Exchange Commission, such as Adjusted Segment Operating Profit, Adjusted Segment EBITDA, Adjusted Income from Continuing Operations Before Income Taxes and Consolidated Adjusted EBITDA. For a reconciliation to the most directly comparable GAAP financial measures, refer to the presentation Appendix. Cautionary 2
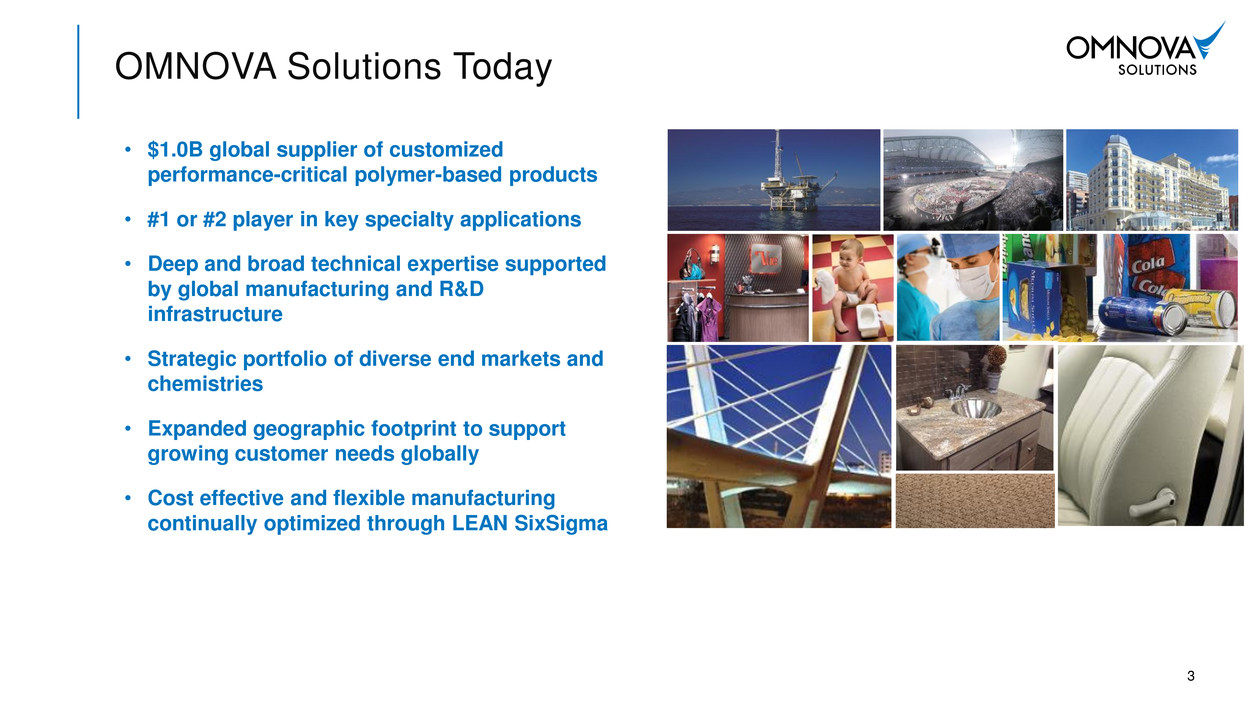
OMNOVA Solutions Today • $1.0B global supplier of customized performance-critical polymer-based products • #1 or #2 player in key specialty applications • Deep and broad technical expertise supported by global manufacturing and R&D infrastructure • Strategic portfolio of diverse end markets and chemistries • Expanded geographic footprint to support growing customer needs globally • Cost effective and flexible manufacturing continually optimized through LEAN SixSigma 3

Performance Chemicals Value-added emulsion polymers and specialty chemicals • High performance, globally specified products • Multiple high margin, growing specialty applications and some mature markets • High customer switching costs due to customized solutions A focused specialty polymer company leveraging technology and customer insight for growth Global Supplier of Performance-Critical Products Engineered Surfaces Extensive portfolio of performance oriented surfacing materials • Superior durability and cleanability lowers cost-in-use • Broad array of end market applications • Attractive, customizable designs Company-wide Value Drivers • Critical ingredients for finished product performance but small part of cost • Cost effective substitute for other materials • Broad technology portfolio to provide value-added customized products • Environmentally preferred solutions *OMNOVA consolidated sales for LTM as of February 28, 2015 $1.0B* SALES 25% $240mm 75% $728mm 4
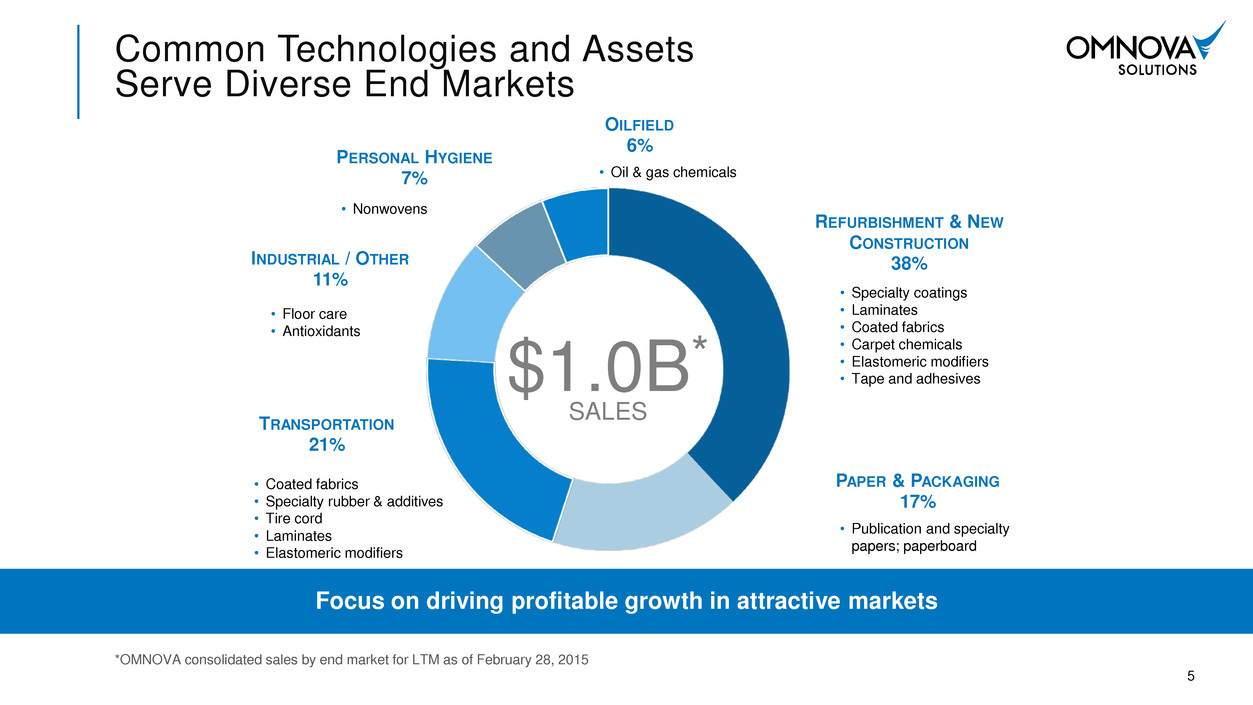
REFURBISHMENT & NEW CONSTRUCTION 38% PAPER & PACKAGING 17% TRANSPORTATION 21% INDUSTRIAL / OTHER 11% PERSONAL HYGIENE 7% OILFIELD 6% Common Technologies and Assets Serve Diverse End Markets Focus on driving profitable growth in attractive markets *OMNOVA consolidated sales by end market for LTM as of February 28, 2015 • Oil & gas chemicals • Specialty coatings • Laminates • Coated fabrics • Carpet chemicals • Elastomeric modifiers • Tape and adhesives • Nonwovens • Floor care • Antioxidants • Publication and specialty papers; paperboard $1.0B* SALES • Coated fabrics • Specialty rubber & additives • Tire cord • Laminates • Elastomeric modifiers 5

6 Market Challenges in Traditional Core Temporarily Overshadow Specialty Growth OMNOVA is stabilizing core businesses and accelerating growth in specialty businesses *FYE November 30, 2014, See Appendix 3 – OMNOVA Consolidated **Paper, Carpet and Tire Cord $94 $68

Recent market dynamic Market outlook Publication paper market declines with recession and electronic media growth • Structural decline in publication paper ~(2-5)%/yr • Modest growth in packaging and specialty paper Carpet experienced 7 consecutive years of decline following housing bubble • Recovery starting from a deep cyclical decline • As existing home sales & new home construction rebound, market expected to grow ~2%/yr Spikes in SB latex raw material costs led to temporary product substitution • SB molecule is now cost advantaged • SB performance features contribute to greater customer cost-in-use advantage 7 Traditional Core Businesses Decline Driven by N.A. Styrene Butadiene (SB) Markets OMNOVA is taking aggressive actions to address overcapacity while maintaining strong leadership positions
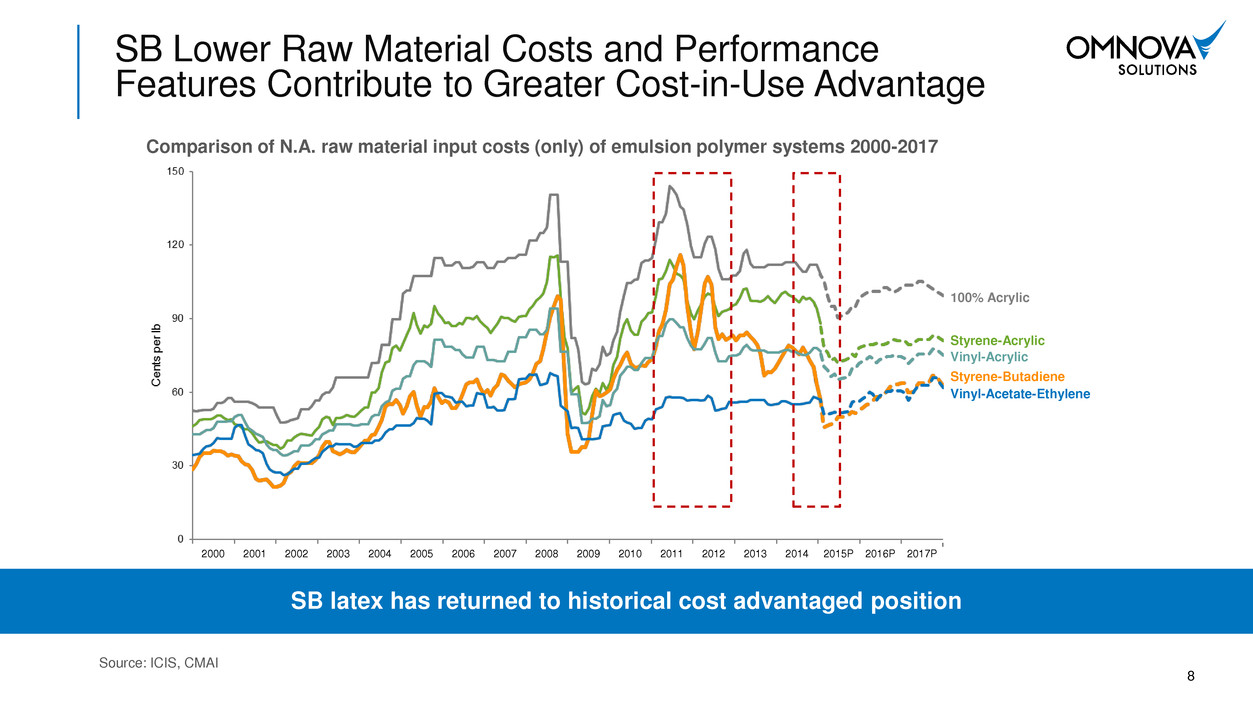
SB Lower Raw Material Costs and Performance Features Contribute to Greater Cost-in-Use Advantage SB latex has returned to historical cost advantaged position Comparison of N.A. raw material input costs (only) of emulsion polymer systems 2000-2017 Source: ICIS, CMAI Vinyl-Acetate-Ethylene Vinyl-Acrylic Styrene-Butadiene Styrene-Acrylic 100% Acrylic 2000 2001 2002 2003 2004 2005 2006 2007 2008 2009 2010 2011 2012 2013 2014 2015P 2016P 2017P 8

OMNOVA’s Action Plan OMNOVA’s actions will drive sustainable profitable growth and shareholder value Stabilize traditional core businesses; drive margin expansion and improved cash generation Accelerate profitable growth in specialty businesses Drive improved return on investment Deploy a balanced capital allocation policy 1 2 3 4 9

10 OMNOVA’s Action Plan Actions to drive margin expansion and cash generation in the core business Stabilize traditional core businesses; drive margin expansion and cash generation Adjusting chemicals manufacturing capacity to improve utilization and support the needs of traditional core businesses at lower cost while driving growth in specialty businesses • Repurpose Mogadore, OH from SB to acrylics and other chemistries (15% of N.A. SB capacity taken out) • Close Akron, OH - $4M/year savings beginning mid-2015 • Repurpose Le Havre, France to increase capacity for new coatings • Expand Caojing, China to serve fast growing Asian markets • Further evaluation of footprint optimization in progress Key Actions Refocusing resources on specialty growth opportunities Driving improvements in SG&A effectiveness and efficiency Targeted technology offerings to increase customer productivity and profitability Leveraging customer relationships to capture growth in non-carpet flooring LEAN SixSigma process improvements / cost reductions Strengthened paper and carpet management 1

11 OMNOVA’s Action Plan Focused actions to maximize contributions from each specialty business Accelerate profitable growth in specialty businesses Key Actions Diversify chemistries to drive growth and margins Expand globally to support customers worldwide Technology and new product development to create sustainable value Commercial excellence to create sustainable value Focus on high growth key specialty lines of business • e.g. Oil & gas, Specialty coatings, Laminates, Nonwovens and Elastomeric modifiers 2
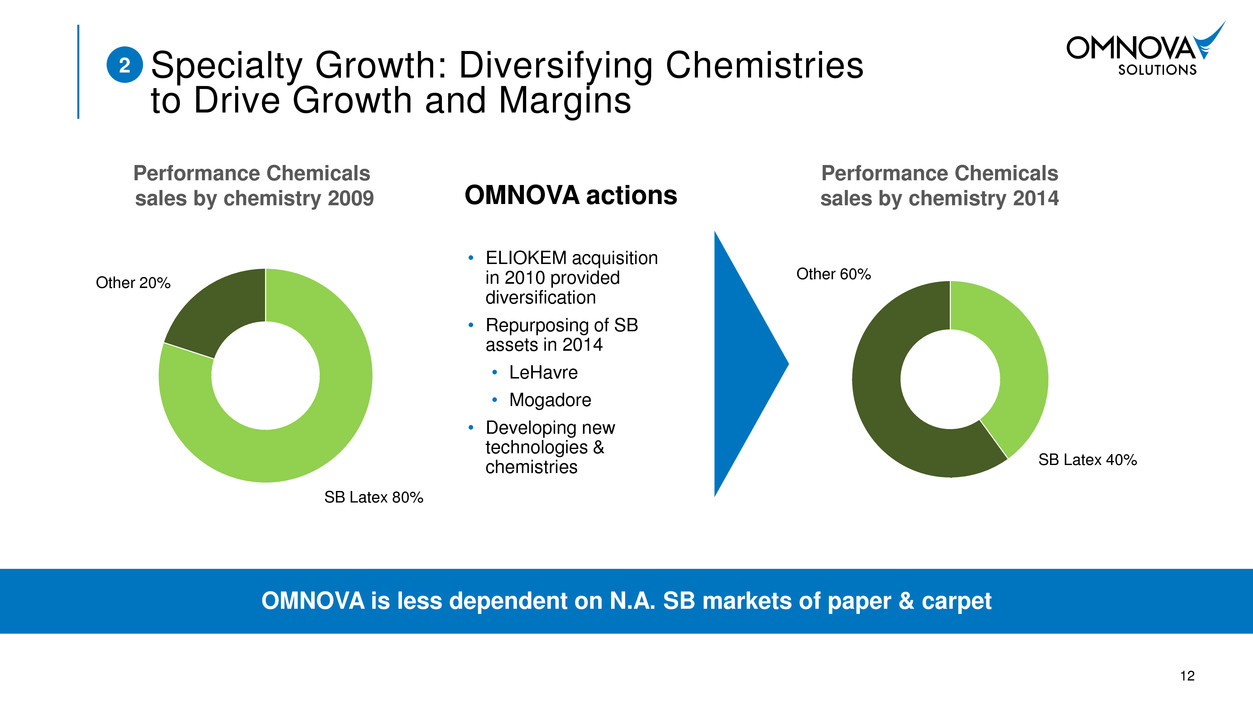
12 Specialty Growth: Diversifying Chemistries to Drive Growth and Margins OMNOVA is less dependent on N.A. SB markets of paper & carpet SB Latex 40% Other 60% Performance Chemicals sales by chemistry 2014 SB Latex 80% Other 20% Performance Chemicals sales by chemistry 2009 OMNOVA actions • ELIOKEM acquisition in 2010 provided diversification • Repurposing of SB assets in 2014 • LeHavre • Mogadore • Developing new technologies & chemistries 2
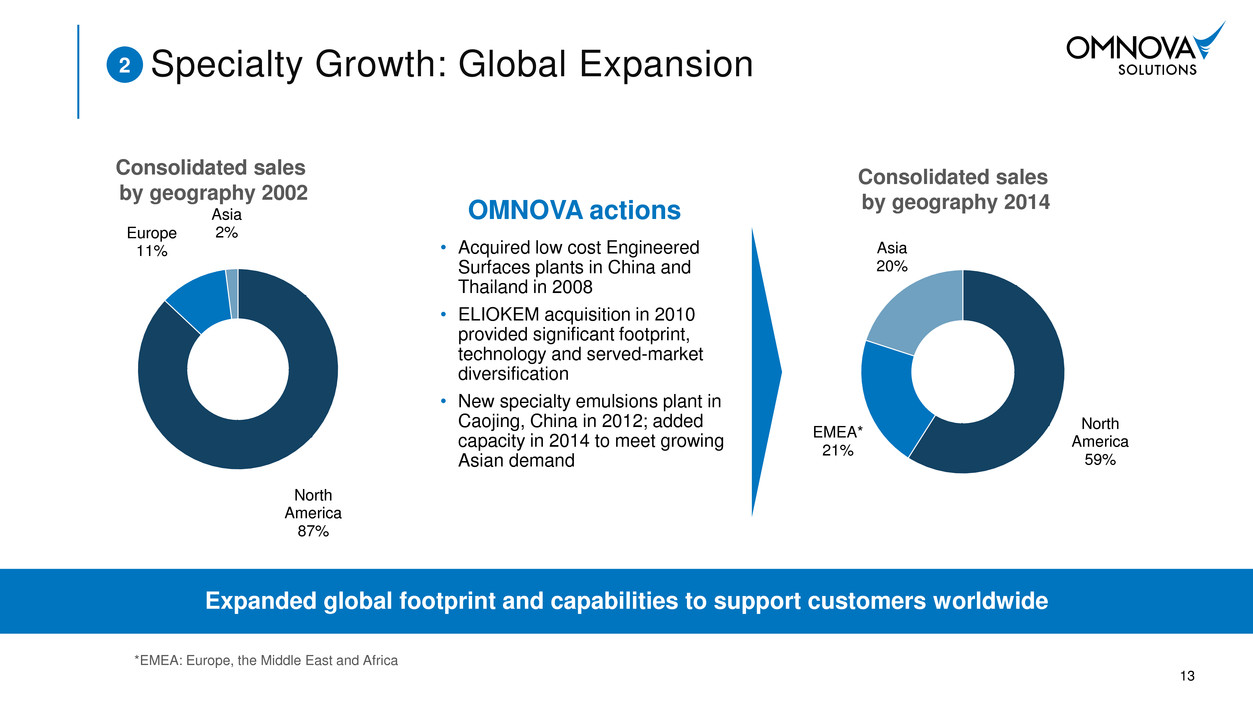
North America 87% Europe 11% Asia 2% North America 59% EMEA* 21% Asia 20% 13 Specialty Growth: Global Expansion Expanded global footprint and capabilities to support customers worldwide Consolidated sales by geography 2014 Consolidated sales by geography 2002 • Acquired low cost Engineered Surfaces plants in China and Thailand in 2008 • ELIOKEM acquisition in 2010 provided significant footprint, technology and served-market diversification • New specialty emulsions plant in Caojing, China in 2012; added capacity in 2014 to meet growing Asian demand *EMEA: Europe, the Middle East and Africa OMNOVA actions 2

Technology centers on three continents • Supporting both Performance Chemicals and Engineered Surfaces • Basic research and application development • World-class analytical capabilities; expertise in material science • Customized solutions State of the art pilot plant • Small batch capacity; rapid production scale-up Support multiple chemistries and surfacing materials • Offer the best solution for the application • Chemistries: styrene butadiene, acrylics, styrene acrylic, vinyl acrylic, biopolymers, and others • Surfacing materials: vinyl, polyurethane, acrylic, paper Robust new product development process/pipeline • More rigorous stage gate process to enhance vitality with expanded margins 14 Specialty Growth: Technology and New Product Development Create Sustainable Value OMNOVA leverages innovative technology to provide a superior value proposition to our customers globally 2

• Upgraded marketing capability / talent focused on key growth opportunities • Implemented proprietary MAAP™ process to develop a deeper understanding of growth opportunities in existing and adjacent markets • More compelling Value Propositions that provide a focal point for technology, sales and marketing collaboration to deliver higher growth and stronger margins 15 Specialty Growth: Commercial Excellence Creates Sustainable Value Commercial excellence is a foundation of OMNOVA’s profitable growth strategy 2 • Enhanced end user specification development / pull-through selling model • Greater leverage of cross-selling opportunities • Implemented tools to enhance efficiency and effectiveness • Profit Specialist®; CRM; Voice of the Customer • Leverage key account management to drive share gains Marketing Excellence Sales Excellence
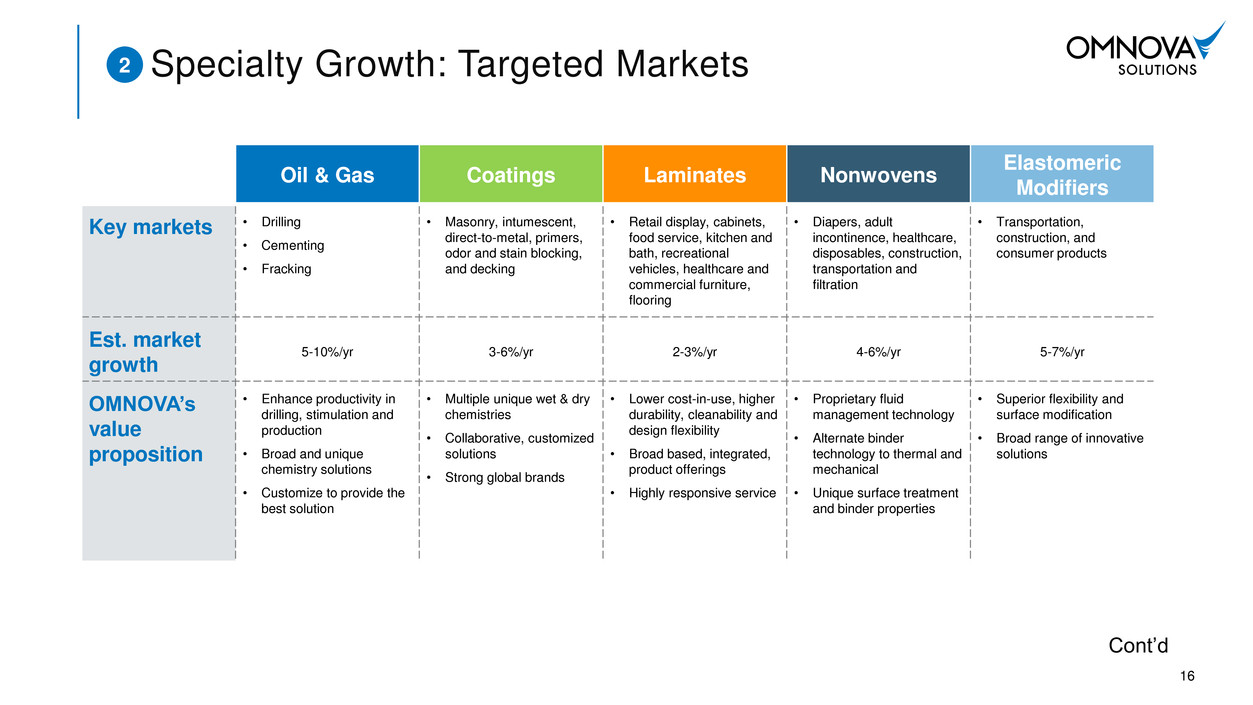
16 Specialty Growth: Targeted Markets Oil & Gas Coatings Laminates Nonwovens Elastomeric Modifiers Key markets • Drilling • Cementing • Fracking • Masonry, intumescent, direct-to-metal, primers, odor and stain blocking, and decking • Retail display, cabinets, food service, kitchen and bath, recreational vehicles, healthcare and commercial furniture, flooring • Diapers, adult incontinence, healthcare, disposables, construction, transportation and filtration • Transportation, construction, and consumer products Est. market growth 5-10%/yr 3-6%/yr 2-3%/yr 4-6%/yr 5-7%/yr OMNOVA’s value proposition • Enhance productivity in drilling, stimulation and production • Broad and unique chemistry solutions • Customize to provide the best solution • Multiple unique wet & dry chemistries • Collaborative, customized solutions • Strong global brands • Lower cost-in-use, higher durability, cleanability and design flexibility • Broad based, integrated, product offerings • Highly responsive service • Proprietary fluid management technology • Alternate binder technology to thermal and mechanical • Unique surface treatment and binder properties • Superior flexibility and surface modification • Broad range of innovative solutions Cont’d 2
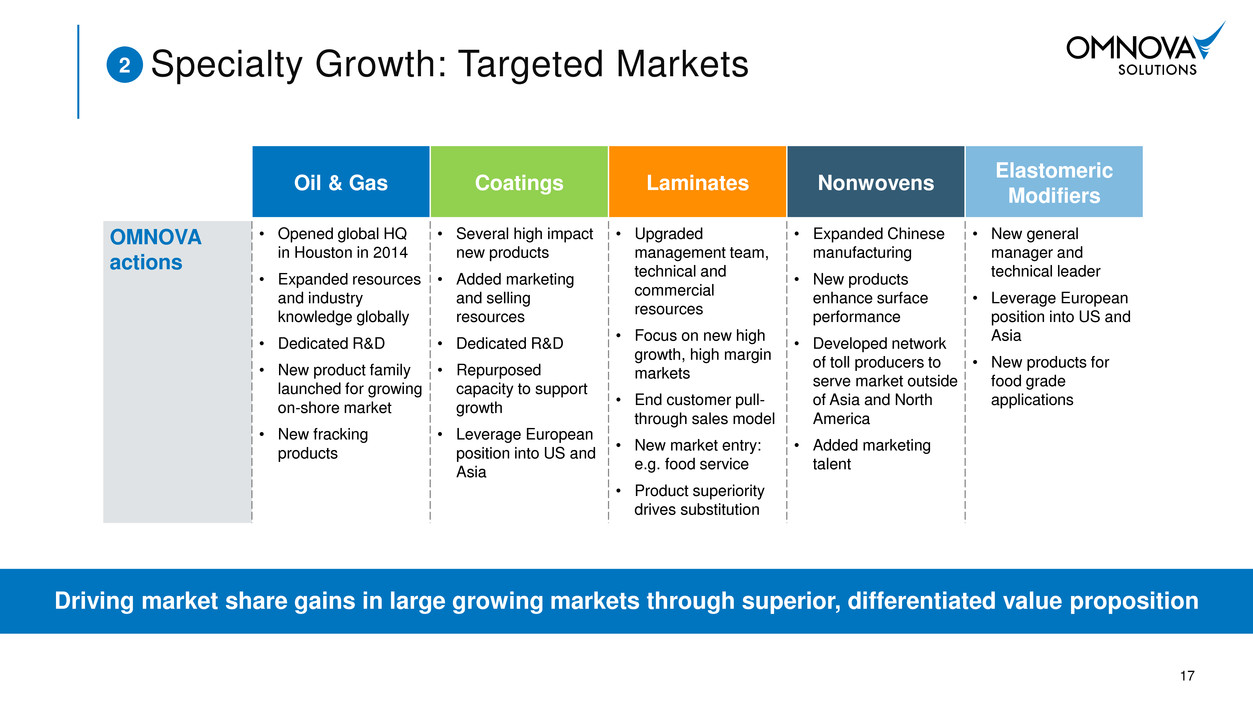
17 Specialty Growth: Targeted Markets Driving market share gains in large growing markets through superior, differentiated value proposition Oil & Gas Coatings Laminates Nonwovens Elastomeric Modifiers OMNOVA actions • Opened global HQ in Houston in 2014 • Expanded resources and industry knowledge globally • Dedicated R&D • New product family launched for growing on-shore market • New fracking products • Several high impact new products • Added marketing and selling resources • Dedicated R&D • Repurposed capacity to support growth • Leverage European position into US and Asia • Upgraded management team, technical and commercial resources • Focus on new high growth, high margin markets • End customer pull- through sales model • New market entry: e.g. food service • Product superiority drives substitution • Expanded Chinese manufacturing • New products enhance surface performance • Developed network of toll producers to serve market outside of Asia and North America • Added marketing talent • New general manager and technical leader • Leverage European position into US and Asia • New products for food grade applications 2
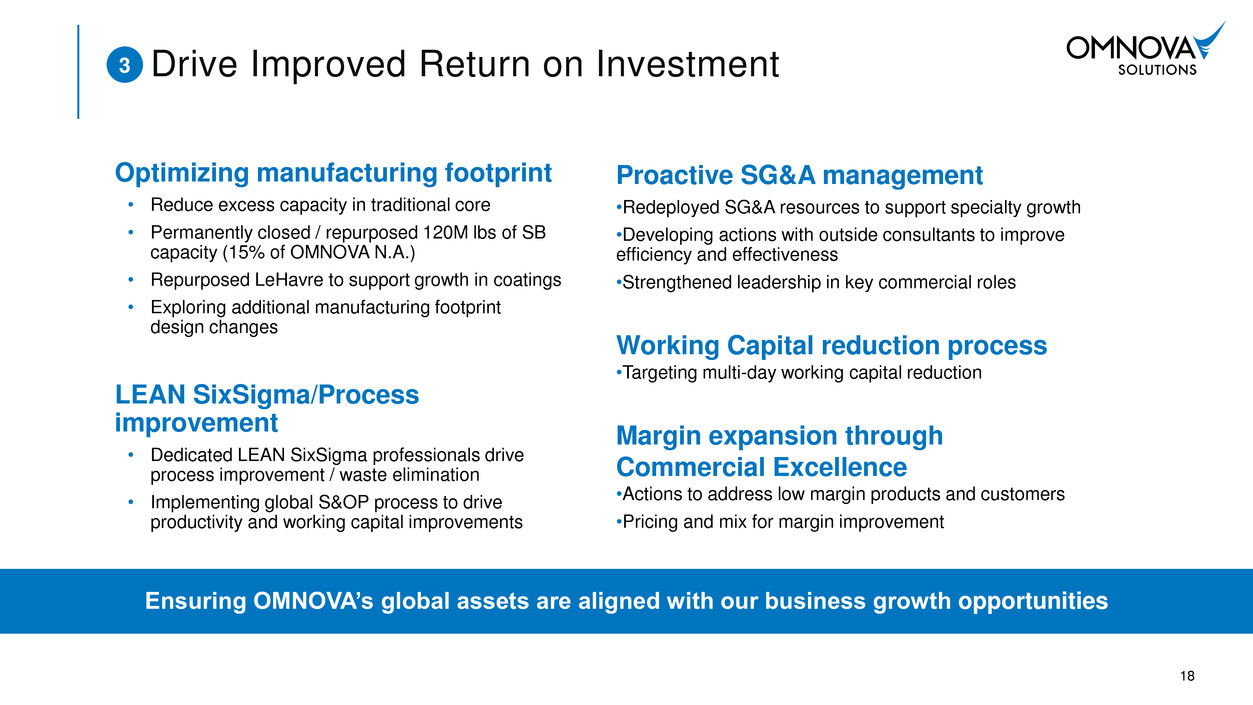
18 Drive Improved Return on Investment Ensuring OMNOVA’s global assets are aligned with our business growth opportunities Optimizing manufacturing footprint • Reduce excess capacity in traditional core • Permanently closed / repurposed 120M lbs of SB capacity (15% of OMNOVA N.A.) • Repurposed LeHavre to support growth in coatings • Exploring additional manufacturing footprint design changes LEAN SixSigma/Process improvement • Dedicated LEAN SixSigma professionals drive process improvement / waste elimination • Implementing global S&OP process to drive productivity and working capital improvements Proactive SG&A management •Redeployed SG&A resources to support specialty growth •Developing actions with outside consultants to improve efficiency and effectiveness •Strengthened leadership in key commercial roles Working Capital reduction process •Targeting multi-day working capital reduction Margin expansion through Commercial Excellence •Actions to address low margin products and customers •Pricing and mix for margin improvement 3

Prudent use of debt and cash to maintain financial flexibility • Maintain strong liquidity position to support growth and margin improvement initiatives • Maintain ability to pursue targeted bolt-on acquisitions to grow specialty businesses • Prepaid $50 million of 7.875% senior notes November 2014 Targeting long term net leverage of approximately 2x through the cycle, balanced with strategic growth investments • Continue to delever by growing EBITDA and cash flow Board authorized up to $20 million share repurchase program • Program started November 1, 2014 Maintain a disciplined and returns-oriented approach to capital spending decisions • Invest in key markets and enhance capabilities • Prudent capital expenditure policy Continue to actively evaluate FX exposures and appropriate risk management Deploy a Balanced Capital Allocation Policy Cash flow generation provides resources for organic growth and bolt-on acquisitions 4 19

Strategic portfolio actions to drive shareholder value History of Taking Decisive Action • Access to fast- growing Asian markets • Upgrade capabilities • Low-cost manufacturing • Expand global manufacturing and technology footprint • Accelerate market growth • Broaden capabilities in growth applications • Exit structurally impaired market • Close Columbus, MS facility • Specialty latex for fast growing Asian applications • Manufacturing on three continents to serve global and regional customers • Non-strategic Business • Stabilize traditional core businesses • Accelerate growth in specialty businesses • Drive improved return on investment • Deploy a balanced capital allocation policy • Repurpose footprint in a capital efficient manner • Announce closing of Akron, OH emulsion facility • Reduce N.A. SB by 120M lbs (15% of OMN N.A.) Spinoff from GenCorp Sold Commercial Roofing Division 100% Ownership Engineered Surfaces China/Thailand Acquired ELIOKEM Specialty Chemicals Sold Global Wallcovering Opened Chemical Plant in Caojing, China 1999 2006 2008 2010 2011 2012 2015+ Path to Profitable Growth and Margin Expansion 2014 Footprint Re-alignment 20

Key actions • Sold commercial wallcovering • Closed Columbus, MS plant • Consolidated coated fabrics production • Rationalized low margin customers/products • Changed leadership and upgraded commercial team • Enhanced new product development capabilities and entered new adjacent markets Future opportunities • Growth with modest capex required • Superior value proposition in laminates drives market share gains • Leverage Asian manufacturing capability for growth in laminates • Continued growth in coated fabrics • Continuing to streamline costs Engineered Surfaces Adjusted Segment Operating Profit 2011 – 2014* ($M) 21 Engineered Surfaces transformation provides model for Performance Chemicals Transformed Engineered Surfaces into Strong Cash and Profitability Contributor 2014 record profitability *FYE November 30, 2014 See Appendix 2 – Engineered Surfaces
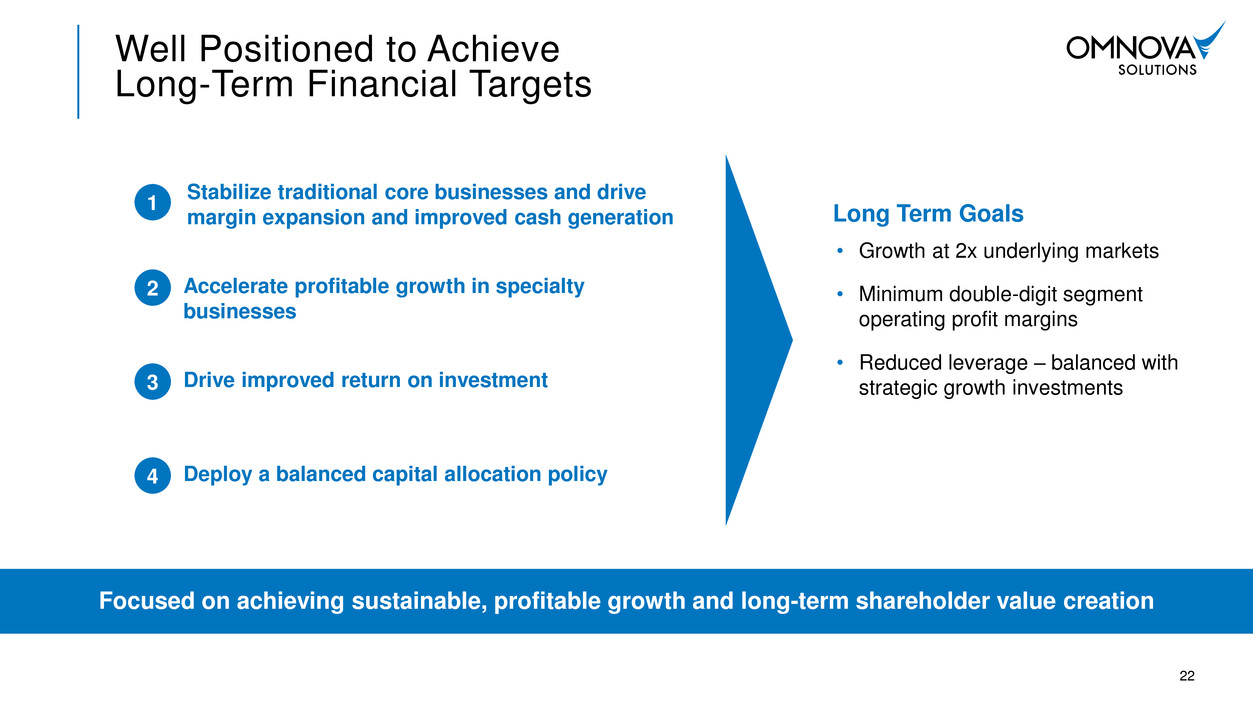
Focused on achieving sustainable, profitable growth and long-term shareholder value creation Well Positioned to Achieve Long-Term Financial Targets Long Term Goals • Growth at 2x underlying markets • Minimum double-digit segment operating profit margins • Reduced leverage – balanced with strategic growth investments Stabilize traditional core businesses and drive margin expansion and improved cash generation Accelerate profitable growth in specialty businesses Drive improved return on investment Deploy a balanced capital allocation policy 1 2 3 4 22

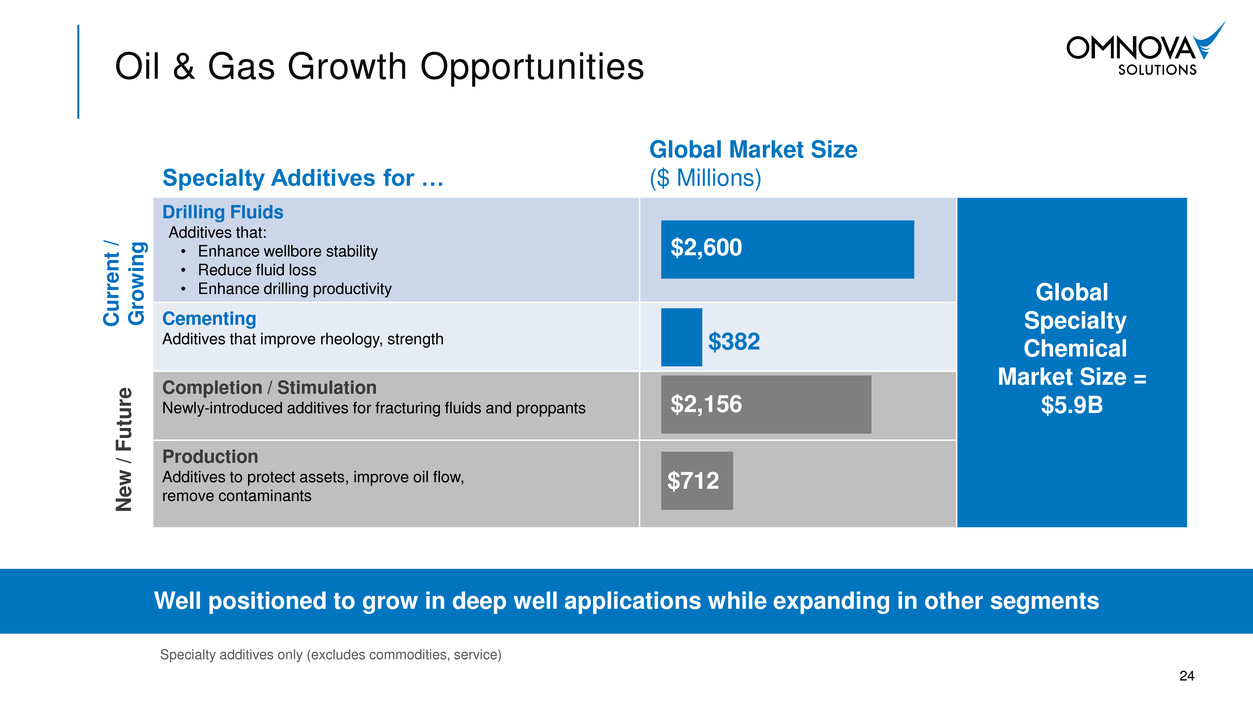
Well positioned to grow in deep well applications while expanding in other segments Oil & Gas Growth Opportunities Specialty additives only (excludes commodities, service) Specialty Additives for … Global Market Size ($ Millions) Current / G ro w in g Drilling Fluids Additives that: • Enhance wellbore stability • Reduce fluid loss • Enhance drilling productivity Global Specialty Chemical Market Size = $5.9B Cementing Additives that improve rheology, strength Ne w / F u tu re Completion / Stimulation Newly-introduced additives for fracturing fluids and proppants Production Additives to protect assets, improve oil flow, remove contaminants $2,600 $2,156 $712 $382 24

Liquidity 2/28/15 Revolver $73 • Balance Drawn • Letters of Credit $0 $2 Remaining Capacity $71 Cash $83 Total Liquidity $154M Capital Structure First quarter debt cost ~ 6.0% / significant liquidity and covenant cushion Net Sr. Secured Leverage Ratio 2/28/15 Covenant < 2.50 Actual 1.6 EBITDA Cushion $29 DEBT = $413M $21 $192 $200 Foreign Debt & Other • Capital lease • Letters of credit Term Loan B • 2018 maturity • L+300; floor 1.25% • Net Sr. Secured Leverage Ratio Covenant Senior Notes 7.875% • 2018 maturity • No financial covenants • Callable Nov. 1, 2014 25

This presentation includes Adjusted Segment Operating Profit and Adjusted EBITDA per Bank Covenant which are Non-GAAP financial measures as defined by the Securities and Exchange Commission. OMNOVA’s Adjusted Segment Operating Profit is calculated as Segment Operating Profit (Loss) less restructuring and severance expenses, asset impairments and other items. Adjusted Segment EBITDA for Bank Covenant is calculated as Adjusted Segment Operating Profit less depreciation and amortization expense, non-cash stock compensation and other items. OMNOVA’s Adjusted Income from Continuing Operations Before Income Taxes is calculated as Income from Continuing Operations Before Income Taxes less restructuring and severance, asset impairments and other items. OMNOVA’s Adjusted EBITDA per Bank Covenant is calculated as Adjusted Income from Continuing Operations Before Income Taxes less interest expense, amortization of deferred financing costs, depreciation and amortization expense, non-cash stock compensation and other items. Adjusted Segment Operating Profit and Adjusted Segment and/or Consolidated EBITDA per Bank Covenant are not measures of financial performance under GAAP. Adjusted Segment Operating Profit and Adjusted Segment and/or Consolidated EBITDA per Bank Covenant are not calculated in the same manner by all companies and, accordingly, are not necessarily comparable to similarly titled measures of other companies and may not be appropriate measures for comparing performance relative to other companies. Adjusted Segment Operating Profit and Adjusted Segment and/or Consolidated EBITDA per Bank Covenant should not be construed as indicators of the Company’s operating performance or liquidity and should not be considered in isolation from or as a substitute for net income (loss), cash flows from operations or cash flow data, which are all prepared in accordance with GAAP. Adjusted Segment Operating Profit and Adjusted Segment and/or Consolidated EBITDA per Bank Covenant are not intended to represent, and should not be considered more meaningful than or as an alternative to, measures of operating performance as determined in accordance with GAAP. Management believes that presenting this information is useful to investors because these measures are commonly used as analytical indicators to evaluate performance and by management to allocate resources. Set forth below are the reconciliations of these Non-GAAP financial measures to their most directly comparable GAAP financial measure. All appendix results are pro forma reflecting continuing business (including the acquisition of ELIOKEM and excluding the sale of global wallcovering businesses). Appendix – Non-GAAP Financial Measures 26

Appendix 1 – Performance Chemicals 27 Year ended November 30, ($ Millions) 2011 2012 2013 2014 LTM* Segment Operating Profit $ 86.5 $ 89.6 $ 64.1 $ 46.2 $ 40.7 Management Adjustments to SOP Restructuring, Severance and Benefit Plan Curtailment 1.1 - 2.1 0.5 0.5 (Gain) on Asset Sales - - (0.3) - - Accelerated Depreciation - - 1.0 2.2 1.6 Intangible Asset Impairment - - 0.2 - - Environmental Remediation Costs - - - 1.0 1.0 Customer Trade Receivable Write-off 0.9 - - - - Fair Value Write-up of Eliokem Inventory Acquired 2.7 - - - - Operational Improvement Costs - - - - 1.0 Total Segment Operating Profit Adjustments 4.7 - 3.0 3.7 4.1 Adjusted Segment Operating Profit $ 91.2 $ 89.6 $ 67.1 $ 49.9 $ 44.8 Adjustments for Bank Covenant Adjusted EBITDA Depreciation / Amortization 24.6 24.1 24.2 25.8 24.7 Non-cash Stock Compensation 1.3 1.5 0.4 0.5 0.5 (Gain) Loss on Asset Sales - (0.2) 0.7 0.4 0.4 Restructuring Costs - not allowed - (0.9) - - Customer Trade Receivable Write-off - not allowed (0.9) - - - - Fair Value Write-up of Eliokem Inventory Acquired - not allowed (2.7) - - - - Bank Covenant EBITDA Adjustments 22.3 25.4 24.4 26.7 25.6 Adjusted Segment EBITDA For Bank Covenant Calculation $ 113.5 $ 115.0 $ 91.5 $ 76.6 $ 70.4 Performance Chemicals' Segment Sales $ 951.9 $ 864.5 $ 773.0 $ 746.5 $ 728.1 Performance Chemicals' Adjusted EBITDA as a Percent of Sales 11.9% 13.3% 11.8% 10.3% 9.7% *LTM: As of February 2015

Appendix 2 – Engineered Surfaces 28 Year ended November 30, ($ Millions) 2011 2012 2013 2014 LTM* Segment Operating (Loss) Profit $ (1.3) $ 3.8 $ 15.6 $ 19.2 $ 19.9 Management Adjustments to SOP Restructuring, Severance and Benefit Plan Curtailment 0.5 1.5 3.0 0.4 0.2 (Gain) on Asset Sales - - (5.1) - - Coated Fabrics Manufacturing Transition Costs - 3.0 0.7 - - Asset Impairment and Facility Closure Costs 3.7 1.0 2.6 - - Loss (Gain) on Note Receivable - - 0.9 (1.1) (1.1) Tax Indemnification Lapse, Legal Settlements and Other 0.2 - - - - Environmental Costs - - - - 0.2 Total Segment Operating Profit Adjustments 4.4 5.5 2.1 (0.7) (0.7) Adjusted Segment Operating Profit $ 3.1 $ 9.3 $ 17.7 $ 18.5 $ 19.2 Additional Adjustments for Bank Covenant Adjusted EBITDA Depreciation / Amortization 8.5 7.6 7.0 6.2 6.1 Non-cash Stock Compensation 0.5 0.9 0.2 0.2 0.3 Loss on Asset Sale 0.2 0.1 - - - Restructuring Costs - not allowed - (0.4) (0.5) - - Coated Fabrics Manufacturing Transition Costs - not allowed - (3.0) (0.7) - - Asset Impairment and Facility Closure Costs - not allowed - - (1.4) - - Note Impairment - not allowed - - (0.9) - - Bank Covenant EBITDA Adjustments 9.2 5.2 3.7 6.4 6.4 Adjusted Segment EBITDA Per Bank Covenant Calculation $ 12.3 $ 14.5 $ 21.4 $ 24.9 $ 25.6 Engineered Surfaces' Segment Sales $ 249.2 $ 261.0 $ 245.1 $ 241.1 $ 240.4 Engineered Surfaces' Adjusted EBITDA as a Percent of Sales 4.9% 5.6% 8.7% 10.3% 10.6% *LTM: As of February 2015

Appendix 3 – OMNOVA Consolidated 29 Year ended November 30, ($ Millions) 2011 2012 2013 2014 LTM* PC Adjusted Segment Operating Profit $ 91.2 $ 89.6 $ 67.1 $ 49.9 $ 44.8 ES Adjusted Segment Operating Profit 3.1 9.3 17.7 18.5 19.2 Total Adjusted Segment Operating Profit 94.3 98.9 84.8 68.4 64.0 Corporate Expense (13.8) (20.0) (19.8) (20.0) (22.9) Interest Expense (38.0) (36.5) (31.9) (32.9) (32.0) Acquisition and Integration Related Expenses (2.3) - - - - Deferred Financing Fees Written-off (1.0) - (1.5) (0.8) (0.8) Management Adjustments Corporate Restructuring 0.2 - - - - Acquisition and Integration Related Expenses 2.3 - - - - Deferred Financing Fees Written-off 1.0 - 1.5 0.8 0.8 Corporate Headquarter Relocation Costs - - 0.1 0.6 0.6 Other Refinancing Costs - - - 2.4 2.4 Shareholder Activist Costs - - - - 1.9 Operational Improvement Costs - - - - 0.4 Total Corporate Operating Expense Adjustments 3.5 - 1.6 3.8 6.1 Adjusted Income From Continuing Operations before Income Taxes $ 42.7 $ 42.4 $ 33.2 $ 18.5 $ 14.4 Additional Adjustments for Bank Covenant Adjusted EBITDA Interest Expense / Deferred Financing Fee Amortization 38.0 36.5 31.9 30.9 30.0 Depreciation / Amortization 33.3 32.0 32.6 32.6 31.6 Non-cash Stock Compensation 3.6 4.5 2.2 2.7 2.7 Loss (Gain) on Asset Sale 0.2 (0.1) 0.7 0.5 0.5 Restructuring Costs - not allowed - (0.4) (1.4) - - Coated Fabrics Manufacturing Transition Costs - not allowed - (3.0) (0.7) - - Asset Impairment and Facility Closure Costs - not allowed - - (1.5) - - Customer Trade Receivable Write-off - not allowed (0.9) - - - - Fair Value Write-up of Eliokem Inventory Acquired - not allowed (2.7) - - - - Bank Covenant EBITDA Adjustments 71.5 69.5 63.8 66.7 64.8 Adjusted EBITDA Per Bank Covenant Calculation $ 114.2 $ 111.9 $ 97.0 $ 85.2 $ 79.2 Consolidated Net Sales 1,201.1 1,125.5 1,018.1 987.4 968.4 Consolidated Adjusted EBITDA as a Percent of Sales 9.5% 9.9% 9.5% 8.6% 8.2% *LTM: As of February 2015

