Attached files
| file | filename |
|---|---|
| EX-32.1 - EXHIBIT 32.1 - OMNOVA SOLUTIONS INC | omn-11302017ex321.htm |
| EX-31.2 - EXHIBIT 31.2 - OMNOVA SOLUTIONS INC | omn-11302017ex312.htm |
| EX-31.1 - EXHIBIT 31.1 - OMNOVA SOLUTIONS INC | omn-11302017ex311.htm |
| EX-24.1 - EXHIBIT 24.1 - OMNOVA SOLUTIONS INC | omn-11302017ex241.htm |
| EX-23.1 - EXHIBIT 23.1 - OMNOVA SOLUTIONS INC | omn-11302017ex231.htm |
| EX-21.1 - EXHIBIT 21.1 - OMNOVA SOLUTIONS INC | omn-11302017ex211.htm |
| EX-12.1 - EXHIBIT 12.1 - OMNOVA SOLUTIONS INC | omn-11302017ex121.htm |
| EX-10.12 - EXHIBIT 10.12 - OMNOVA SOLUTIONS INC | omn-11302017ex1012.htm |
| EX-10.11 - EXHIBIT 10.11 - OMNOVA SOLUTIONS INC | omn-11302017ex1011.htm |
| EX-10.10 - EXHIBIT 10.10 - OMNOVA SOLUTIONS INC | omn-11302017ex1010.htm |
SECURITIES AND EXCHANGE COMMISSION
Washington, D.C. 20549
FORM 10-K
ANNUAL REPORT PURSUANT TO SECTION 13 OR 15(d)
OF THE SECURITIES EXCHANGE ACT OF 1934
For the year ended November 30, 2017 | Commission File Number 1-15147 | |
OMNOVA Solutions Inc.
(Exact name of registrant as specified in its charter)

Ohio | 34-1897652 | |
(State of Incorporation) | (I.R.S. Employer Identification No.) | |
25435 Harvard Road, Beachwood, Ohio | 44122-6201 | |
(Address of principal executive offices) | (Zip Code) | |
Registrant’s telephone number, including area code (216) 682-7000
Securities registered pursuant to Section 12(b) of the Act:
Title of each class | Name of each exchange on which registered | |
Common Stock, par value 10¢ per share | The New York Stock Exchange | |
Securities registered pursuant to Section 12(g) of the Act: None
Indicate by check mark if the registrant is a well-known seasoned issuer, as defined in Rule 405 of the Securities Act. Yes ¨ No þ
Indicate by check mark if the registrant is not required to file reports pursuant to Section 13 or Section 15(d) of the Act. Yes ¨ No þ
Indicate by check mark whether the registrant (1) has filed all reports required to be filed by Section 13 or 15(d) of the Securities Exchange Act of 1934 during the preceding 12 months (or for such shorter period that the registrant was required to file such reports), and (2) has been subject to such filing requirements for the past 90 days. Yes þ No ¨
Indicate by check mark if disclosure of delinquent filers pursuant to Item 405 of Regulation S-K is not contained herein, and will not be contained, to the best of registrant’s knowledge, in definitive proxy or information statements incorporated by reference in Part III of this Form 10-K or any amendment to this Form 10-K. þ
Indicate by check mark whether the registrant has submitted electronically and posted on its corporate website, if any, interactive data file required to be submitted and posted pursuant to Rule 405 of Regulation S-T (232.405 of this chapter) during the preceding 12 months (or for such shorter period that the registrant was required to submit and post such files.) Yes þ No ¨
Indicate by check mark whether the Registrant is a large accelerated filer, an accelerated filer, or a non-accelerated filer. See definition of “accelerated filer and large accelerated filer” in Rule 12b-2 of the Exchange Act (check one):
Large accelerated filer ¨ | Accelerated filer þ | Non-accelerated filer ¨ | Smaller reporting company ¨ | Emerging growth company ¨ | ||||
(do not check if a smaller reporting company) | ||||||||
If an emerging growth company, indicate by check mark if the registrant has elected not to use the extended transition period for complying with any new or revised financial accounting standards provided pursuant to Section 13(a) of the Exchange Act. Yes ¨ No þ
Indicate by check mark whether the registrant is a shell company (as defined in Rule 12-b of the Exchange Act) Yes ¨ No þ
The aggregate market value of the voting stock held by nonaffiliates of the registrant was $297,575,104 based on the closing price per share of $8.65 on May 31, 2017, the last business day of the registrant’s most recently completed second quarter.
As of January 22, 2018, there were 44,809,851 outstanding Common Shares of the Company’s $0.10 par value.
DOCUMENTS INCORPORATED BY REFERENCE
Portions of the 2018 Proxy Statement of OMNOVA Solutions Inc. are incorporated into Part III of this Report.
OMNOVA SOLUTIONS INC.
Annual Report on Form 10-K
For the Year Ended November 30, 2017
Table of Contents
Item Number | |||
PART I | |||
1 | |||
1A | |||
1B | |||
2 | |||
3 | |||
4 | |||
PART II | |||
5 | |||
6 | |||
7 | |||
7A | |||
8 | |||
9 | |||
9A | |||
9B | |||
PART III | |||
10 | |||
11 | |||
12 | Security Ownership of Certain Beneficial Owners and Management and Related Shareholder Matters | ||
13 | |||
14 | |||
PART IV | |||
15 | |||
PART I
Item 1. | Business | |
Introduction
OMNOVA Solutions Inc. (referred to in this report as OMNOVA Solutions, OMNOVA, the Company, we or our) became an independent, publicly-traded company on October 1, 1999, when it was spun off by GenCorp Inc., its former parent company. OMNOVA Solutions is incorporated under the laws of the State of Ohio, and its headquarters is located at 25435 Harvard Road, Beachwood, Ohio 44122-6201.
OMNOVA Solutions is an innovator of emulsion polymers, specialty chemicals and engineered surfaces for a variety of commercial, industrial and residential end uses. Our products provide a variety of important functional and aesthetic benefits to hundreds of products that people use daily. We hold leading positions in key market categories, which have been built through innovative products, customized product solutions, strong technical expertise, well-established distribution channels, recognized brands, and long-standing customer relationships. We have strategically located manufacturing, technical and other facilities in the U.S., Europe, China, and Thailand to service our broad customer base.
During fiscal 2017, OMNOVA operated two business segments: Specialty Solutions and Performance Materials. Of our 2017 net sales, 56% were derived from the Specialty Solutions segment and 44% were derived from the Performance Materials segment. Financial information relating to the Company’s business segments is set forth in Note P to the Consolidated Financial Statements of this report.
Specialty Solutions
Markets and Products
The Specialty Solutions segment consists of three business lines: specialty coatings & ingredients, oil & gas, and laminates & films. The Specialty Solutions segment develops, designs, produces, and markets a broad line of specialty polymers for use in coatings, adhesives, sealants, elastomers, laminates, films, nonwovens, and oil & gas products. These products are used in numerous applications, including architectural and industrial coatings; nonwovens used in hygiene products, filtration and construction; drilling additives for oil and gas drilling, cementing and fracking; elastomeric modification of plastic casings and hoses used in household and industrial products and automobiles; tapes and adhesives; sports surfaces; textile finishes; commercial building refurbishment; new construction; residential cabinets; flooring; ceiling tile; furnishings; manufactured housing; health care patient; and common area furniture; and a variety of industrial films applications. The segment's products are functional ingredients or compounds that improve the performance of customers’ products, including stain, rust and aging resistance; surface modification; gloss; softness or hardness; dimensional stability; high heat and pressure tolerance; and binding and barrier (e.g. moisture, oil) properties.
1
The following table shows major Specialty Solutions products, end-use applications, and brand names:
Product Line | % of Specialty Solutions Fiscal 2017 Net Sales | Primary Products | End-use Applications | Brand Names | ||||
Specialty Coatings & Ingredients | 52% | SB, SBA, acrylic, vinyl acrylic, styrene acrylic and polyvinyl acetate emulsion polymers, glyoxal resins, elastomeric modifiers, silicone emulsions, polyethylene resins, fluorosurfactants and opacifiers | Nonwovens, Textiles, Graphic Arts, Automotive Thermoplastics, Specialty Coatings, Buildings & Construction, Home & Personal Care | PERMALOFT, OMNABOND, SUNSIZE, GENFLO, GENCRYL, OMNAPEL, SEQUABOND, SUNCRYL, ACRYGEN, SUNBOND, SEDGERES, PRYM, SEDGELEV, SEQUAWET, SEQUACLEAN, SEQUASOFT, SEDGELCLEAN, SEDGEDYE, SEDGEFIX, SEDGEGARD, SEDGEKIL, SEDGELUB, SEDGEMUL, SEQUALINK, SEDGESCOUR, SEDGESOFT, SUNKOTE, MYKON, PERMAFRESH, SEQUAPEL, X-CAPE, MYKOSOFT, MYKOSIL, NORANE, IMPREGNOLE, MYKOWICK, NOVACRYL, SECOAT, SECRYL, SEQUABOND, CDP, GENGLAZE, STYLECOAT, OMNAGLO, MORGLO, RWL, ML, MORFLO, MORSHINE, CONREZ, NM, NH, CONLEX, GENCEAL, HYDROPLIOLITE, PLIOLITE, PLIOTONE, PLIOWAY, PLIOTEC, GENCEAL, POLYFOX, SUNIGUM, CHEMIGUM, LYTRON | ||||
Oil & Gas | 13% | Drilling fluid additives & systems, stimulation additives, and cement additives | Fluid loss control and sealing, emulsifiers, lubricants, and rheological modifiers for drilling fluids | PEXOSTART, PEXOSEAL, PEXOTROL, PEXOPLUG, PEXOMUL, PEXOVIS, PEXOTHIN, PEXOGUARD, PEXOLUBE | ||||
Laminates & Films | 35% | Vinyl, paper, and specialty laminates; performance films | Decorative and protective surfacing for retail display and food service fixtures, kitchen and bath cabinets, manufactured housing and recreational vehicle interiors, flooring, commercial and residential furniture, home furnishings and consumer appliances, wall panel systems, decorative wall surfacing; industrial films for banners, tents, ceiling tiles, decking, health care furniture, and bath and spa surrounds | RADIANCE, SURF(X), DESIGN4, EFX, DURAMAX, HARMONY, VIEWNIQUE | ||||
Specialty Coatings & Ingredients. OMNOVA Specialty Coatings & Ingredients is a leading global supplier of polymers, waterborne and solvent borne dispersions, elastomers, and other specialty chemicals for a variety of product categories. Applications for our specialty polymers and chemicals include: specialty coatings; nonwovens (such as disposable hygiene products, engine filters, roofing mat, scrub pads); construction; adhesives; tape; floor care; textiles; graphic arts; home & personal care; and various other specialty applications. Our focus is on developing unique products for custom applications that address specific customer needs, including enhanced functionality, improved durability, high temperature, chemical and UV resistance, corrosion resistance, improved environmental performance, and improved processibility. Sales of our Specialty Coatings & Ingredients products represented 29.5% of our consolidated net sales for 2017, 28.8% for 2016, and 33.1% for 2015.
Oil & Gas. OMNOVA's Oil & Gas is a leading supplier of specialty wellbore chemicals used in demanding applications all over the world. We offer a wide range of solutions including fluid loss control and sealing, emulsifiers, lubricants, and rheological modifiers for drilling fluids. The business also offers flow control and properties enhancement in cementing operations, gel additives for hydraulic fracturing fluids, and strengthening agents. We design unique polymers that meet conventional and unconventional drilling and completion requirements. Sales of our Oil & Gas products represented 7.0% of our consolidated net sales for 2017, and 6.0% for 2016, the first year of operation.
Laminates & Films. OMNOVA's Laminates & Films business line is a leading supplier of vinyl, paper, and specialty laminates, and performance films. Our laminates are used as alternatives to wood, paint, stone, stainless steel, high pressure laminates, and thermally fused laminates in markets where durability, design, and cost are key requirements. We offer our customers a broad range of designs and textures, as well as proprietary coating technology that provides enhanced durability and scratch and stain resistance. Applications for our laminates include:
2
kitchen and bath cabinets; manufactured housing and recreational vehicle interiors; flooring; commercial and residential furniture; retail display fixtures; home furnishings; consumer appliances; bath and spa surrounds; food service tables; wall protection; and architectural accents. Films applications include: luxury vinyl tile (LVT); awnings; tents; flooring; promotional graphics; medical products; movie screens; decking; ceiling tile; and shower pan liners. Sales of our Laminates and Films products represented 19.9% of our consolidated net sales for 2017, 18.4% for 2016, and 17.0% for 2015.
A key strength of our laminates business is our coating technology, including ultraviolet, melamine, urethane, and thermally cured coatings, which provide greater durability for high-wear applications. In addition, our laminates business has differentiated itself in the market as a single-source supplier through its harmony programTM of integrated vinyl and paper laminate designs for the furniture and cabinet industries by building a unique library of matched vinyl and paper laminate designs, with a variety of patterns and textures, and developing rapid make-to-order production capabilities. We also offer SURF(X)® 3D Laminates for multi-dimensional applications for the office and health care furniture and retail display fixture and food service markets. These laminates offer a cost effective alternative to high pressure laminates, thermally fused melamine and real wood veneers. They provide furniture makers with design flexibility in rounded surfaces, eliminating the need for unsightly and expensive edge-banding, and providing enhanced cleanability/disinfection and durability with increased chip and crack resistance.
Markets and Customers
The Specialty Solutions segment includes many product categories that are performance driven where product innovation, technical service, application support and key account focus are key competitive differentiators. Each business markets its products under numerous brand names to different industries.
Marketing and Distribution
Our Specialty Solutions segment primarily sells its products directly to manufacturers through dedicated internal marketing, sales, and technical service teams focused on providing highly responsive customized solutions. Distributors are used to help expand sales coverage geographically and with newer customers.
Competition
OMNOVA’s Specialty Coatings & Ingredients business line retains strong, industry recognized brands in antioxidants, specialty coatings, and elastomeric modifiers. OMNOVA's Laminates & Films business lines compete with numerous companies, including international companies. Many of these companies focus on only one product line and/or market and are smaller and privately-owned. Competitors include:
• | Specialty Coatings & Ingredients: Pulcra Chemicals, Schill + Seilacher, Goulston, DowDupont, BASF, Engineered Polymer Solutions, Evonik, Arkema, Arlanxeo, Paratech, Nitriflex |
• | Laminates & Films: Wilsonart, Toppan Printing, Renolit Corporation, LG Chemical America, PolyOne Corporation, and I2M |
• | Oil & Gas: Merican Gilsonite, BASF, Ashland, Drilling Specialties Company |
Performance Materials
Markets and Products
The Performance Materials segment serves mature markets including plastics, paper, carpet and coated fabrics with a broad range of emulsion polymers based primarily on styrene butadiene (SB), styrene butadiene acrylonitrile (SBA), styrene butadiene vinyl pyridine, high styrene pigments, polyvinyl acetate, acrylic, styrene acrylic, calcium stearate, glyoxal, and bio-based chemistries. Performance Materials' custom-formulated products are tailored latexes, resins, binders, antioxidants, hollow plastic pigment, coated fabrics, and rubber reinforcing which are used in tire cord, polymer stabilization, industrial rubbers, carpet, paper, and various other applications. Its products provide a variety of functional properties to enhance the Company’s customers’ products, including greater strength, adhesion, dimensional stability, ultraviolet resistance, improved processibility, and enhanced appearance.
3
The following table shows our Performance Materials products, end-use applications and brand names:
Product Line | % of Performance Materials Fiscal 2017 Net Sales | Primary Products | End-use Applications | Brand Names | ||||
Paper and Carpet | 54% | SB SBA styrene acrylic and vinyl acetate latex binders crosslinkers, lubricants hollow plastic pigments, and bio-based polymers | Paper, Paperboard, Packaging, Carpet | SUNREZ, OMNAREZ, SUNKOTE, SEQUALFLOW, SUNKEM, GENCRYL, SUNSIZE, ECOKOTE, ACCUKOTE, LYTRON, REACTOPAQUE, GENFLO, GENCRYL PT, OMNAGLIDE, SEQUAREZ, OMNATUF, OMNABLOC, GENCAL, NOVAGREEN, UNIQPRINT | ||||
Performance Additives | 30% | Styrene butadiene vinyl pyridine, antioxidants, reinforcing resins, phenolic antioxidants | Tire Cord, Plastics, Synthetic Latex Gloves, and Rubber Products | GENTAC, WINGSTAY, PLIOLITE. PLIOCORD, | ||||
Coated Fabrics | 16% | Vinyl and urethane coated fabrics | Upholstery and surfacing for transportation, marine, offices, hotels, hospitals and health care facilities, stores, schools, restaurants, public buildings, residences, and industrial applications | BOLTAFLEX, BOLTASOFT, QUANTUM, NAUTOLEX, PREFIXX, PREVAILL | ||||
Paper and Carpet. OMNOVA Solutions is an innovative supplier of custom-formulated SB and SBA latex and hollow plastic pigments for carpet, paper and paperboard coatings. Applications for our products include paper and paperboard coatings used in magazines, catalogs, direct mail advertising, brochures, specialty papers, food cartons, and household and other consumer and industrial packaging. Our products for the carpet industry secure carpet fibers to the carpet backing and adhere the primary backing to the secondary backing, while meeting the stringent manufacturing, environmental, odor, flammability, and flexible installation requirements of our customers. Our strong historical position in residential carpeting has been enhanced by new products to serve that market, as well as innovations in commercial carpet backing binders that provide moisture barrier and other properties, enabling the replacement of higher cost polyurethane binders. Sales of our Paper and Carpet products represented 23.6% of our consolidated net sales for 2017, 23.3% for 2016, and 25.0% for 2015.
Performance Additives. OMNOVA is also a leading global supplier of vinyl pyridine latex which is used in bonding fabric to rubber for tire and belting applications. In addition, the Company is a leading global supplier of antioxidants used in polymer stabilization and synthetic latex gloves. Sales of our Performance Additives products represented 12.9% of our consolidated net sales for 2017, 14.1% for 2016, and 14.5% for 2015.
Coated Fabrics. OMNOVA Solutions is a leading North American and Asian supplier of vinyl and urethane coated fabrics for transportation, marine, commercial, residential, and health care applications. Our durable coated fabrics are well-suited for demanding, high-use environments and offer a cost effective alternative to other surfacing materials, such as leather and textile fabrics. Applications for our coated fabrics include: transportation seating (automotive OEM, bus and other mass transit, marine, and motorcycle); automotive aftermarket applications; contract and health care furniture; residential applications; stadium and arena seating; and healthcare equipment. A key differentiator for our coated fabrics products is our PreFixx® protective coating, long recognized for delivering the industry's best-in-class performance. Sales of our Coated Fabrics products represented 7.1% of our consolidated net sales for 2017, 9.4% for 2016, and 10.5% for 2015.
Markets and Customers
We believe that our Performance Materials segment is a leader in its targeted product categories, which are highly competitive based on quality, customer service, product performance, supply chain, field technical support, and product innovations.
Marketing and Distribution
Our Paper and Carpet, Performance Additives, and Coated Fabrics business lines primarily sell their products directly to manufacturers through dedicated internal marketing, sales, and technical service teams focused on providing highly responsive customized solutions. Distributors are used to help expand sales coverage geographically and with newer customers.
Our Performance Materials segment distributes its products primarily through a direct sales force and agents to manufacturers of retail store fixtures, cabinets, furniture, seating, and health care components, and other products. Many of our Coated Fabrics products have strong, well-recognized brand names that are promoted through trade shows, industry periodicals, our website (www.omnova.com), and other media.
Competition
OMNOVA’s Paper and Carpet, Performance Additives and Coated Fabrics business lines compete with numerous companies, including international companies. Many of these companies focus on only one product line and/or market and are smaller and privately-owned. Competitors include:
4
• | Paper and Carpet: BASF, Trinseo, Mallard Creek, Eco Synthetix |
• | Performance Additives: Feiya, Addivant, Raschig, Synthomer, Jubilant, Croslene |
• | Coated Fabrics: Morbern, Beneke, Uniroyal, Spradling International, and CGT |
International Operations
Net sales from our foreign operations were $301.4 million in 2017, $305.9 million in 2016, and $298.2 million in 2015. These net sales represented 38.5% of our total net sales in 2017, 40.3% in 2016, and 35.6% in 2015. Long-lived assets primarily consist of net property, plant, and equipment. Long-lived assets of our foreign operations totaled $84.2 million at November 30, 2017, $77.4 million at November 30, 2016, and $89.7 million at November 30, 2015. Our consolidated long-lived assets totaled $208.9 million at November 30, 2017, $202.7 million at November 30, 2016, and $215.6 million at November 30, 2015.
Intellectual Property
We regard patents, trademarks, copyrights, and other intellectual property as important to our success, and we rely on them globally to protect our investments in products and technology. Our patents expire at various times, but we believe that the loss or expiration of any individual patent would not materially affect our business. We, like other companies in the industries in which we operate, may be subject to claims of alleged infringement of the patents, trademarks, and other intellectual property rights of third parties from time to time.
Seasonal Factors
We historically experience stronger sales and income in our second, third, and fourth quarters, comprised of the three-month periods ending May 31, August 31, and November 30. Our performance in the first quarter (December through February) has historically been affected by generally lower levels of customer manufacturing, construction, and refurbishment activities during the holidays and cold weather months.
Environmental Matters
Our business operations are subject to numerous federal, state, local, and foreign environmental laws and regulations. These laws and regulations not only affect our current operations, but also could impose liability on us for past operations that were conducted in compliance with then applicable laws and regulations. For further discussion of capital and noncapital expenditures for environmental compliance, please refer to “Management’s Discussion and Analysis of Financial Condition and Results of Operations—Environmental Matters” of this report, which is incorporated herein by reference.
Employees
As of November 30, 2017, the Company employed approximately 1,800 employees globally. Approximately 11% of the Company’s U.S. employees are covered by collective bargaining agreements in the U.S. of which approximately 60 employees are covered by agreements that expire within the next 12 months. In addition, certain of our foreign employees are also covered by collective bargaining agreements.
Raw Materials
We utilize a variety of raw materials, primarily monomers, in the manufacture of our products. Most of these raw materials have been, and we expect will continue to be, generally available from multiple suppliers. Monomer costs, which are a major component of the emulsion polymers-based products, include butadiene, styrene, acrylates, acrylonitrile, vinyl acetate and vinyl pyridine, polyvinyl chloride (PVC) resins, textiles, plasticizers, paper, and titanium dioxide.
The cost of raw materials has a significant impact on our profitability. We generally attempt to respond to raw material cost increases through productivity programs and price increases to our customers. The success of attempted price increases depends on a variety of factors including the specific market application and competitive environment. Under certain circumstances, we are not able to pass along some or all of the increase. In addition, if accepted by customers, price increases generally lag the increase in raw material costs. Index pricing applies to approximately 21% of our total net sales.
Research and Development
OMNOVA Solutions' technology and design centers support research and development efforts across our businesses and complement the resources focused on innovation in both of our segments. Our efforts are focused on developing new applications with our base technologies and enhancing the functionality of our products in existing applications, as well as developing new product and technology platforms.
Our research and development expenses were $7.5 million in 2017, $8.2 million in 2016, and $8.3 million in 2015. Research and development expenses include the costs of technical activities that are useful in developing new products, services, processes or techniques, as well as those expenses for technical activities that may improve existing products or processes. Information relating to research and development expense is set forth in Note A to the Consolidated Financial Statements of this report.
Available Information
Our website is located at www.omnova.com. We make available on our website all materials that we file electronically with the U.S. Securities and Exchange Commission ("SEC"), including our Annual Reports on Form 10-K, Quarterly Reports on Form 10-Q, Current Reports on Form 8-K, and amendments to those reports, as soon as reasonably practicable after we electronically file or furnish such materials to the SEC. OMNOVA Solutions' Business Conduct Policies and Corporate Governance Guidelines and charters for the Committees of the OMNOVA
5
Solutions Board of Directors are also available on our website and in print to any shareholder who requests a copy. All requests must be made in writing and addressed to OMNOVA Solutions Inc., Attn: Corporate Secretary, 25435 Harvard Road, Beachwood, Ohio 44122-6201.
Item 1A. | Risk Factors | |
This Annual Report includes descriptions of our current business, operations, assets and other matters affecting the Company, as well as “forward-looking statements” as defined by federal securities laws. All forward-looking statements by the Company, including verbal statements, are intended to qualify for the protections afforded forward-looking statements under the Private Securities Litigation Reform Act of 1995. Forward-looking statements reflect Management’s current expectation, judgment, belief, assumption, estimate or forecast about future events, circumstances or results and may address business conditions and prospects, strategy, capital structure, debt and cash levels, sales, profits, earnings, markets, products, technology, operations, customers, raw materials, claims and litigation, financial condition, and accounting policies among other matters. Words such as, but not limited to, “will,” “may,” “should,” “projects,” “forecasts,” “seeks,” “believes,” “expects,” “anticipates,” “estimates,” “intends,” “plans,” “targets,” “optimistic,” “likely,” “would,” “could,” "committed," and similar expressions or phrases identify forward-looking statements.
All descriptions of our current business, operations and assets, as well as all forward-looking statements, involve risks and uncertainties. Many risks and uncertainties are inherent in business generally. Other risks and uncertainties are more specific to the Company’s businesses and strategy, or to any new businesses which the Company may enter into or acquire. There also may be risks and uncertainties not currently known to us. The occurrence of any of such risks and uncertainties and the impact of such occurrences is often not predictable or within the Company’s control. Such impacts could adversely affect the Company’s business, operations or assets as well as the Company's actual results and the value of an investment in the Company. In some cases, such effect could be material. Certain risks and uncertainties facing the Company are described below or elsewhere in this Annual Report.
All written and verbal descriptions of our business, operations and assets and all forward-looking statements attributable to the Company or any person acting on the Company’s behalf are expressly qualified in their entirety by the risks, uncertainties, and cautionary statements contained and referenced herein. All such descriptions and any forward-looking statement speak only as of the date on which such description or statement is made, and the Company undertakes no obligation, and specifically declines any obligation, other than that imposed by law, to publicly update or revise any such description or forward-looking statements whether as a result of new information, future events or otherwise.
Market and Economic Risks
Our business is sensitive to general economic, business, and industry conditions.
We are exposed to general economic, business and industry conditions, both in the United States and internationally. Adverse global economic and financial conditions are difficult to predict and mitigate against, and therefore the potential impact is difficult to estimate. The end markets that we serve can be sensitive to changes in general economic conditions and can be volatile, with significant, rapid, and unpredictable reductions in demand. Adverse general economic conditions may cause, among other things, significant reductions in available capital and liquidity from banks and other credit providers, substantial volatility in equity and currency values worldwide, and/or a prolonged recessionary or slow growth period, each of which may adversely affect our customers’ access to capital or ability or desire to acquire or pay for our products. In addition, downturns in our customers’ particular industries, even when overall economic conditions are favorable, could adversely affect our sales, profitability, operating results, and cash flows.
Our suppliers may be similarly affected by general economic conditions which may affect their access to capital and liquidity, and which may in turn cause them to raise prices or reduce or eliminate production.
We are subject to the risks of doing business in foreign countries and markets.
We conduct a significant portion of our business in countries outside of the United States. Accordingly, our business is subject to risks related to the differing legal, political, social, regulatory, and economic requirements and conditions. Risks associated with international operations, include, but are not limited to:
• | fluctuations in currency exchange rates; |
• | region to region fluctuations in key raw material costs; |
• | transportation delays and interruptions; |
• | political and economic instability and disruptions; |
• | failure to have or obtain, delays in obtaining, or the revocation of governmental licenses and permits; |
• | the imposition of duties and tariffs; |
• | import and export controls; |
• | government control of capital transactions, including the borrowing of funds for operations or the expatriation of cash; |
• | difficulties in staffing and managing operations; |
• | limitations on our ability to enforce legal rights and remedies; |
• | more stringent environmental, health and safety laws and regulations; |
• | potentially adverse tax consequences; and |
• | government expropriation of a business or assets. |
6
Raw material prices and availability have a significant impact on results.
The cost of raw materials has a significant impact on results. The principal raw materials that we use in our business are derived from petrochemicals and chemical feedstocks. The prices of many of these raw materials are cyclical and volatile and are affected by supply and demand factors beyond our control. While we generally attempt to pass along higher raw material costs to our customers in the form of price increases, there historically has been a delay between an increase in raw material costs and our ability to increase the prices of our products. Additionally, we may not be able to increase the prices of our products due to competitive pricing pressure and other factors.
We generally have multiple global sources of supply for our raw materials. However, in some cases there are a limited number of suppliers that are capable of delivering raw materials that meet our standards and these suppliers generally have greater pricing and supply leverage. Various factors, including feedstock shortages, production disruptions, natural disasters, the financial stability of our suppliers, supplier commitments to others, and internal raw material use by suppliers have reduced and eliminated, and in the future may reduce or eliminate, the availability of certain raw materials. Additionally, disruptions in transportation could delay receipt of raw materials. As a result, higher prices and shortages could occur in the future. Furthermore, increases in raw material prices or supply uncertainty may result in customers switching to substitutes for our products.
Our industry is highly competitive.
Many of the markets in which we operate are highly competitive. The bases of competition may include product performance and quality, price, product availability, and security of supply and customer service. Some of our competitors are larger and have more financial resources than us. We may also experience increased competition from companies that offer alternative products based on technologies and processes that have superior performance or better pricing, which could cause a decline in the market acceptance of our products. The increasing pressure from our competitors to keep pace and develop new technologies and products requires us to incur substantial expense.
Mergers and acquisitions in various industries continue to create individual customers with greater purchasing power and competitors with greater financial and other resources. Customers in established markets like the United States and Europe face their own competitive pressures, particularly from businesses in regions with lower overhead costs. These competitive pressures may require us to reduce prices and attempt to offset such price reductions with improved operating efficiencies and reduced expenditures, which options may be limited or unavailable. Additionally, larger competitors may be better positioned to weather prolonged periods of reduced prices, which may incentivize them to reduce prices even when not dictated by market and competitive conditions.
The occurrence or threat of extraordinary events, including natural disasters, political disruptions, terrorist attacks, public health issues, and acts of war, could significantly disrupt production, and decrease market demand for our products.
Extraordinary events, including natural disasters, political disruptions, terrorist attacks, public health issues, and acts of war could adversely affect the economy generally, and disrupt our business and operations resulting in a loss of sales and customers. In addition, in many cases we do not have redundant manufacturing or transportation capability and thus, any disruption of production or transportation may result in loss of sales and customers.
Legal, Regulatory, and Compliance Risks
We are subject to extensive and increasing governmental regulation.
Our business is subject to numerous foreign, federal, state and local regulations which govern and restrict numerous aspects of our business and involve significant compliance cost. These regulations may change rapidly, and new regulations or interpretations of regulations may be applied to us, due to circumstances beyond our control. We expect regulations, and the costs associated with compliance, to continue to increase.
Among these regulations are increasingly stringent environmental and health and safety regulations. The cost of compliance with these regulations is significant and increasing, and violating these regulations can result in substantial costs, including fines, damages, criminal or civil sanctions, remediation costs, and interruptions in our operations. These regulations may also restrict or prohibit our ability to use certain raw materials key to our products or prohibit the sale of our products altogether.
Certain environmental requirements provide for strict, and under certain circumstances joint and several, liability for investigation and remediation of releases of regulated materials into the environment at or from properties owned or operated by us or our predecessors or at or from properties where substances were sent for off-site treatment or disposal.
We may be unable to effectively protect our intellectual property or may be subject to intellectual property claims.
For certain products we rely on trademark, trade secret, patent, and copyright laws to protect our intellectual property. We cannot be sure that these intellectual property rights will be successfully asserted in the future or that they will not be invalidated or circumvented. In addition, the laws of some foreign countries in which our products are or may be sold do not protect our intellectual property rights to the same extent as the laws of the United States. The failure or inability of us to protect our proprietary information could make us less competitive.
From time to time, we may be subject to claims or allegations that we infringe upon or have misappropriated the intellectual property of third parties. Defending against such claims is costly and intellectual property litigation often involves complex questions of fact and law, with unpredictable results. We may be forced to acquire rights to such third-party intellectual property on unfavorable terms (if rights are made available at all), pay damages, modify accused products to be non-infringing, or stop selling the applicable product altogether. Any of the foregoing could have a negative effect on our competitiveness.
7
We are subject to claims and litigation.
From time to time, we are subject to various claims, proceedings, and lawsuits related to products, services, contracts, employment, environmental, safety, intellectual property, and other matters arising out of our business operations or the business operations of our predecessors. Whether founded or unfounded, if any such claims, proceedings, or lawsuits are not resolved in our favor, they may result in significant financial liability, place significant restrictions on or require significant changes to our business operations, and harm the reputation of the Company and our products. The costs of investigating and defending against claims can be substantial. We may not have applicable insurance coverage, and any such insurance coverage that we do have may be inadequate to cover the full cost of a particular claim.
Resolutions of claims, proceedings, and lawsuits can be unpredictable and can often take years. As a result, any estimates of liability that we may have made could be materially over or understated.
Changes in accounting policies, standards, and interpretations could materially affect how we report our financial condition, results of operations, and cash flows.
The Financial Accounting Standard Board ("FASB"), regulatory agencies, and other bodies that establish accounting standards periodically change the financial accounting and reporting standards governing the preparation of the Company’s consolidated financial statements. Additionally, those bodies that establish and interpret the accounting standards (such as the FASB and the SEC) may change prior interpretations or positions on how these standards should be applied. These changes can be difficult to predict and can materially affect how the Company records and reports its financial condition, results of operations, and cash flows. In unusual circumstances, the Company could be required to retroactively apply a new or revised standard, resulting in changes to previously reported financial results.
We may be subject to the actions of activist shareholders.
We have been the subject of activity by activist shareholders, and shareholder activism generally is increasing. Responding to shareholder activism can be costly and time-consuming, disrupt our operations, and divert the attention of Management and our employees from our strategic initiatives. Activist campaigns can create perceived uncertainties as to our future direction, strategy, or leadership and may result in the loss of potential business opportunities, harm our ability to attract new employees, investors, customers, and joint venture partners, and cause our stock price to experience periods of volatility or stagnation.
Business and Strategic Risks
We may be unable to achieve, or may be delayed in achieving, the objectives and benefits of our cost reduction initiatives.
We continuously utilize operational excellence program improvements such as LEAN SixSigma, manufacturing footprint optimization, global supply chain management, Enterprise Resource Planning (ERP) and other initiatives in an effort to improve efficiencies and lower our cost structure. There may be unanticipated difficulties in implementing one or more of these initiatives, and we may not ultimately realize the full benefits of, or be able to sustain the benefits anticipated by, these initiatives. Additionally, even if we achieve these goals, the cost of implementing these initiatives could ultimately exceed their benefits. In addition, certain of these initiatives have resulted in us streamlining and consolidating our manufacturing capacity, increasing the risk of business interruption if a consolidated manufacturing site experiences operational or other difficulties.
Our sales and profitability depend on our ability to develop and commercialize new products at competitive prices.
The highly competitive nature of many of our markets requires that we develop, introduce, sell, and support cost effective new products and technologies on a timely basis and that we make significant investments in research and development to do so. We may be unsuccessful in developing or introducing new products, modifying our existing products, achieving market acceptance of new products, or offering new products at competitive prices.
We generally do not have long-term contracts with our customers.
With some exceptions, most of our business is conducted on a purchase order basis rather than through long-term contracts. Accordingly, customers may elect to discontinue business with us with limited or no notice and with limited recourse by OMNOVA.
Certain product lines contribute disproportionately to the Company’s profitability.
Certain of the Company’s product lines and certain of its customers contribute disproportionately to the Company’s operating profit. A downturn in the markets those product lines serve, or the loss of customers within those product lines, could have an adverse affect on our financial results.
We are exposed to credit risk from our customers.
We extend credit on most of our sales, which exposes us to the risk of customer nonpayment. In deciding whether to extend credit or enter into other transactions, we may rely on information furnished by or on behalf of customers, including financial statements, credit reports, and other information. We may also rely on representations of these customers or third-parties as to the accuracy and completeness of credit risk related information. The inaccuracy of that information or those representations would affect our ability to accurately evaluate the default risk of a customer. Even with accurate information, negative changes in economic, business, or industry conditions may increase the credit risk of customers who are initially determined to have acceptable credit risk.
8
We may not be able to identify or complete transactions with attractive acquisition candidates.
As part of our business strategy, we have pursued, and may continue to pursue, targeted acquisition opportunities. Implementing this business strategy requires Management to identify and evaluate acquisition candidates (including potential synergies, business opportunities, and growth prospects), and to successfully negotiate the acquisition with the target company and its stakeholders. There are a limited number of attractive acquisition candidates. Even if we identify attractive acquisition candidates we may not be able to pay the required acquisition price. If we complete an acquisition, we may not achieve the anticipated benefits, such as reduced costs or increased sales.
We may not be able to successfully integrate acquisitions into our operations.
The integration of acquisitions into our operations involves a number of risks, including:
• | difficulty integrating operations and personnel at different locations; |
• | diversion of Management attention; |
• | potential disruption of ongoing business because of the unknown reactions to the combination of OMNOVA and the acquisition by customers, suppliers, and other key constituencies; |
• | difficulties in assimilating the technologies and products of the acquisition; |
• | inability to retain key personnel; |
• | inability to successfully incorporate acquired business components with our existing operational and accounting infrastructure; |
• | difficulty in expanding product manufacturing to new sites; and |
• | inability to maintain uniform standards, controls, procedures, and policies. |
If we are unable to effectively integrate operations and personnel in a timely and efficient manner after an acquisition is completed, we may not realize the projected benefits expected from the acquisition.
We could have unanticipated capital expenditures.
Unanticipated maintenance issues, changes in government regulations, environmental compliance, or significant technology shifts could result in higher than anticipated capital expenditures.
Our business is subject to the risks associated with the use, production, storage, and transportation of chemicals.
Our manufacturing operations are subject to the potential hazards and risks associated with chemical production and the related storage and transportation of products, inventories and wastes, including explosions, fires, inclement weather, natural disasters, mechanical failure, unscheduled downtime, transportation interruptions, releases of hazardous substances and other risks. These hazards can cause personal injury and loss of life, severe damage to, or destruction of, property and equipment, and environmental contamination. In addition, the occurrence of material operating problems at our facilities due to any of these hazards may diminish or eliminate our ability to produce product.
Our information systems may experience an interruption or a breach in security.
We rely heavily on electronic communications, information systems (both internal and provided by third parties) and the internet to operate our factories, sell our products, fulfill orders, manage inventory, and bill, collect, and make payments. Our systems are vulnerable to damage or interruption from natural disasters, power loss, telecommunication failures, computer viruses, computer denial-of-service attacks, unauthorized intrusion, and other events, any of which could interrupt our business operations. Our business may also be subject to break-ins, sabotage, and intentional acts of vandalism.
Cybersecurity attacks can originate from a wide variety of sources, including persons who are linked to terrorist organizations or hostile foreign governments. Those same parties may also attempt to fraudulently induce employees, customers, or other users of our systems to disclose sensitive information in order to gain access to our systems, our data or the data of our customers.
Our security systems may not be able to protect our systems from attacks or other disruptions due to the rapid evolution and sophistication of cyberattack methods. Any significant disruption or slowdown of our current or future information systems as a result of a system security failure could disrupt the flow of operational information, cause orders to be lost or delayed, damage our reputation with our customers, or cause our customers to cancel orders. Additionally, the theft of sensitive data and our inability to protect our trade secrets or information concerns our employees, customers, or suppliers could have an adverse effect on our business, customers, suppliers, and employees. These risks may increase in the future as we increase our usage of mobile platforms and expand our internal usage of third-party, web-based products and applications.
Employee healthcare costs continue to increase.
We maintain a self-insured healthcare plan under which we generally share the cost of health care with certain of our employees and retirees. Employee healthcare is a significant operating cost for us, and these costs have been escalating well in excess of other inflationary trends over the past several years. If healthcare costs continue to increase, we may not be willing or able to pass these costs along to our employees.
We may be unable to retain or attract key employees.
Many parts of our business are highly technical and specialized. Global competition for skilled employees meeting our specialized needs is intense and our business success is dependent on our ability to retain our key employees and to attract highly-qualified new employees. The
9
unanticipated departure of any key member of Management or any key employee, or our inability to attract necessary talent, could adversely affect our ability to implement strategic initiatives and effectively operate our business.
We are subject to collective bargaining agreements with certain employees.
Approximately 11% of our employees located in the United States are covered by collective bargaining agreements. In addition, certain employees of our foreign operations are also covered by collective bargaining agreements. We may not be able to renew our collective bargaining agreements on terms similar to current terms, or renegotiate collective bargaining agreements on terms acceptable to us. The prolonged failure to renew or renegotiate a collective bargaining agreement could result in work stoppages. Additionally, in foreign jurisdictions where we operate, national unions and foreign governments may be unable to reach agreements, which could result in work stoppages that are out of the Company’s control. In addition, if a collective bargaining agreement is negotiated at higher-than-anticipated cost, absorbing those costs or passing them through to customers may make us less competitive.
Our U.S. pension plan is underfunded, requiring the Company to make significant cash contributions to the plan.
The Company’s U.S. pension plan is underfunded, and we are required to make significant cash contributions to it to comply with minimum funding requirements imposed by benefit and tax laws. Contribution amounts are based on plan performance, interest rates, and pension funding legislation, among other factors. We currently anticipate that we will make a contribution of $6.4 million to our U.S. pension plan during 2018, in part to satisfy our requirements under the Pension Protection Act of 2006. We cannot predict whether changing conditions including interest rates, pension assets performance, discount rates, government regulation, or other factors will require us to make future contributions in excess of current expectations, or whether we will have the funds necessary to make minimum pension contributions at the times that they may be required.
We maintain cash balances in foreign financial institutions.
We maintain cash balances in foreign financial institutions. While we monitor the financial institutions that we maintain accounts with, we may not be able to recover our funds in the event that the financial institution would fail. In addition, we may be limited by foreign governments in the amount and timing of funds to be repatriated from foreign financial institutions.
We carry a significant amount of goodwill on our balance sheet.
As of November 30, 2017, we had goodwill of $66.3 million. The future occurrence of a potential indicator of impairment, such as a significant adverse change in legal factors or business climate, an adverse action or assessment by a regulator, unanticipated competition, a material negative change in relationships with significant customers, strategic decisions made in response to economic or competitive conditions, loss of key personnel, or a more-likely-than-not expectation that a reporting unit or a significant portion of a reporting unit will be sold or disposed of, could result in goodwill impairment charges. We have recorded goodwill impairment charges in the past, and such charges materially affected our historical results of operations. For additional information, see Note A, Goodwill and Intangible Assets, to the accompanying consolidated financial statements.
The market price for our common shares is particularly volatile.
The market for our common shares is characterized by significant price volatility, and we expect that our share price will continue to be volatile. The trading of relatively small quantities of our common shares by our shareholders may cause disproportionate movements upwards and downwards in our share price due to our small market capitalization and low trading volume, and the cyclical nature of our business may create prolonged periods of higher or lower share prices not correlated to Company performance or to general economic or market conditions.
Debt Risks
Our substantial debt could adversely affect our financial health and prevent us from fulfilling our obligations.
We have substantial debt and, as a result, significant debt service obligations. Our substantial debt could:
• | make it more difficult for us to satisfy our obligations with respect to our term loan and our revolving credit facility; |
• | increase our vulnerability to general adverse economic and industry conditions, including interest rate fluctuations, because a portion of our borrowings, including those under our term loan and our revolving credit facility, are at variable rates of interest; |
• | require us to dedicate a substantial portion of our cash flow from operations to payments on our debt, thereby reducing the availability of our cash flow to fund working capital, capital expenditures, acquisitions, joint ventures, pension contributions and investments, and other general corporate purposes; |
• | limit our flexibility in planning for, or reacting to, changes in our business and the product categories in which we participate; |
• | limit our ability to obtain additional debt or equity financing due to applicable financial and restrictive covenants in our debt agreements, and; |
• | place us at a competitive disadvantage compared to our competitors that have less debt. |
Our ability to make scheduled payments on or to refinance our debt obligations and to fund planned capital expenditures and expansion efforts and any acquisitions we may make in the future depends on our ability to generate cash in the future and our financial condition and operating performance, which are subject to prevailing economic and competitive conditions and to certain financial, business and other factors beyond our control. We could be required to obtain the consent of the lenders under our term loan and our revolving credit facility to refinance material portions of our debt. We may not be able to maintain a level of cash flows from operating activities sufficient to permit us to pay the principal, premium, if any, and interest on our debt.
10
If our cash flows and capital resources are insufficient to fund our debt service obligations, we may be forced to reduce or delay investments and capital expenditures, sell assets, seek additional capital, or restructure or refinance our debt. These alternative measures may not be successful and may not permit us to meet our scheduled debt service obligations. If our operating results and available cash are insufficient to meet our debt service obligations, we could face substantial liquidity problems and might be required to dispose of material assets or operations to meet our debt service and other obligations. We may not be able to consummate those dispositions or to obtain the proceeds that we could realize from them, and these proceeds may not be adequate to meet any debt service obligations then due. Additionally, the agreements governing our term loan and our revolving credit facility will limit the use of the proceeds from any disposition; as a result, we may not be allowed, under these documents, to use proceeds from such dispositions to satisfy all current debt service obligations. Further, we may need to refinance all or a portion of our debt on or before maturity, and we cannot assure that we will be able to refinance any of our debt on commercially reasonable terms or at all.
Despite ongoing actions to reduce our debt, we may still be required to incur significant additional debt.
We may be able to incur substantial additional debt, including additional secured debt, in the future. The terms of the agreements governing our term loan and revolving credit facility restrict but do not completely prohibit us from incurring substantial additional debt. If new debt or other liabilities are added to our current debt levels, the related risks that we and our subsidiaries now face could intensify.
The agreements governing our term loan and our revolving credit facility impose significant operating and financial restrictions on us, which may prevent us from capitalizing on business opportunities.
The agreements governing our term loan and our revolving credit facility impose significant operating and financial restrictions on us. These restrictions limit our ability, among other things, to:
• | incur additional debt or issue certain disqualified stock and preferred stock; |
• | pay dividends or certain other distributions on our capital stock or repurchase our capital stock; |
• | make certain investments or other restricted payments; |
• | place restrictions on the ability of our restricted subsidiaries to pay dividends or make other payments to us; |
• | engage in transactions with affiliates; |
• | sell certain assets or merge with or into other companies; |
• | enter into sale and leaseback transactions; |
• | guarantee debt; |
• | create liens; and |
• | enter into unrelated businesses. |
Our term loan and revolving credit facility require us to meet certain financial covenants, including covenants relating to senior net debt leverage, minimum excess availability and a springing minimum fixed charge coverage ratio if average excess availability falls below a certain level.
As a result of these covenants and restrictions, we may be limited in how we conduct our business and may be unable to raise additional debt or equity financing to compete effectively or to take advantage of new business opportunities. The terms of any future debt we may incur could include more restrictive covenants. We may not be able maintain compliance with these covenants in the future and, if we fail to do so, we may be unable to obtain waivers from the lenders and/or amend the covenants.
Moreover, our revolving credit facility provides the lenders considerable discretion to impose reserves, which could materially impair the amount of borrowings that would otherwise be available to us. There can be no assurance that the lenders under our revolving credit facility will not impose such actions during the term of our revolving credit facility and further, were they to do so, the resulting impact of this action could materially and adversely impair our ability to make interest payments on our debt.
If we default under our term loan or our revolving credit facility, we may not be able to service our debt obligations.
In the event of a default under our term loan or our revolving credit facility, the lenders under each of these facilities could elect to declare all amounts borrowed, together with accrued and unpaid interest and other fees, to be due and payable. If such acceleration occurs, we may not be able to repay the amounts due under our term loan, or our revolving credit facility. This could have serious consequences to our financial condition, results of operations, cash flows and could cause us to become bankrupt or insolvent.
We may not be able to generate sufficient cash to service all of our debt and may be forced to take other actions to satisfy our obligations under our debt, which may not be successful.
Our ability to make scheduled payments on or to refinance our debt obligations and to fund planned capital expenditures and expansion efforts and any strategic alliances or acquisitions we may make in the future depends on our ability to generate cash in the future and our financial condition and operating performance, which are subject to prevailing economic and competitive conditions and to certain financial, business and other factors beyond our control. We will also be required to obtain the consent of the lenders under our term loan and our revolving credit facility to refinance material portions of our debt. We cannot assure that we will maintain a level of cash flows from operating activities sufficient to permit us to pay the principal, premium, if any, and interest on our debt.
If our cash flows and capital resources are insufficient to fund our debt service obligations, we may be forced to reduce or delay investments and capital expenditures, or to sell assets, seek additional capital or restructure or refinance our debt. These alternative measures may not be successful and may not permit us to meet our scheduled debt service obligations. If our operating results and available cash are insufficient to
11
meet our debt service obligations, we could face substantial liquidity problems and might be required to dispose of material assets or operations to meet our debt service and other obligations. We may not be able to consummate those dispositions or to obtain the proceeds that we could realize from them, and these proceeds may not be adequate to meet any debt service obligations then due. Additionally, the agreements governing our term loan and our revolving credit facility will limit the use of the proceeds from any disposition; as a result, we may not be allowed, under these documents, to use proceeds from such dispositions to satisfy all current debt service obligations. Further, we may need to refinance all or a portion of our debt on or before maturity, and may not be able to refinance any of the debt on commercially reasonable terms or at all.
Our subsidiaries may incur obligations that will constrain the ability of our subsidiaries to provide us with cash, which may affect our ability to make payments on our debt.
Our cash flows and our ability to service our debt, including our ability to make interest and principal payments when due, will be dependent upon cash dividends and other distributions or other transfers from our subsidiaries. Dividends, loans, and advances to us from our subsidiaries may be restricted by covenants in certain debt agreements. If our subsidiaries incur obligations with these restrictive covenants, it will constrain the ability of our subsidiaries to provide us with cash, which may affect our ability to make payments on our debt.
Item 1B. | Unresolved Staff Comments | |
None.
Item 2. | Properties | |
The Company’s significant operating, manufacturing, distribution, research, design and/or sales, and marketing facilities are set forth below:
Corporate Headquarters OMNOVA Solutions Inc. 25435 Harvard Road Beachwood, OH |
Global Technology Center OMNOVA Solutions Global Technology Center 2990 Gilchrist Road Akron, OH |
Manufacturing/Technical/Distribution Facilities: Akron, OH Auburn, PA Calhoun, GA Caojing, China Chester, SC Columbus, MS* Fitchburg, MA Green Bay, WI Jeannette, PA Le Havre, France Mogadore, OH Monroe, NC Ningbo, China Rayong, Thailand* Stafford, TX Villejust, France* |
Sales/Marketing: Akron, OH Bangkok, Thailand* Beachwood, OH* Mumbai, India* Rayong, Thailand* Shanghai, China* Singapore* Villejust, France* |
* | Leased property. | |
For further discussion of our leased properties, please refer to Note N to the Consolidated Financial Statements of this report.
Item 3. | Legal Proceedings | |
From time to time, the Company is subject to various claims, proceedings and lawsuits related to products, services, contracts, employment, environmental, safety, intellectual property, and other matters. The ultimate resolution of such claims, proceedings, and lawsuits is inherently unpredictable and, as a result, the Company’s estimates of liability, if any, are subject to change. Actual results may materially differ from the Company’s estimates and an unfavorable resolution of any matter could have a material adverse effect on the financial condition, results of operations, and/or cash flows of the Company. However, subject to the above and taking into account such amounts, if any, as are accrued from time to time on the Company’s balance sheet, the Company does not believe, based on the information currently available to it,
12
that the ultimate resolution of these matters will have a material effect on the consolidated financial condition, results of operations, or cash flows of the Company.
13
Item 4. | Mine Safety Disclosures | |
None.
PART II
Item 5. | Market for Registrant’s Common Equity, Related Shareholder Matters and Issuer Purchases of Equity Securities | |
The Company’s common shares are listed on the New York Stock Exchange and trade under the symbol OMN. At November 30, 2017, there were 5,454 holders of record of the Company’s common shares. Information regarding the high and low quarterly sales prices of the Company’s common share is contained in the Selected Quarterly Financial Data (Unaudited) and is incorporated herein by reference. The Company has not declared a dividend on its common shares since 2001.
The following table summarizes the Company’s repurchases of its common shares for the three months ended November 30, 2017.
Month | Total Number of shares repurchased (a) | Average price paid per share | Total number of shares purchased as part of publicly announced plans or programs | Maximum dollar value of shares that may yet be purchased under the plans or programs | |||||||
September 1 - 30 | 21,940 | 8.36 | — | — | |||||||
October 1 - 31 | 4,900 | 7.37 | — | — | |||||||
November 1 - 30 | — | — | — | — | |||||||
Total | 26,840 | 8.18 | |||||||||
(a) Share repurchases resulted from common shares deemed surrendered by employees in connection with the Company’s stock compensation and benefit plans to satisfy the employee's income tax obligations.
Information concerning long-term debt appears in Note L to the Consolidated Financial Statements and is incorporated herein by reference. Information concerning securities authorized for issuance under the Company’s equity compensation plans is set forth in Equity Compensation Plan Information of Item 12 in this Annual Report is incorporated herein by reference.
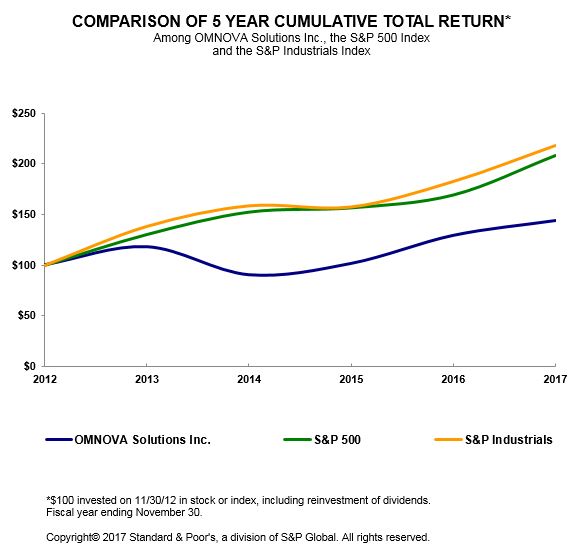
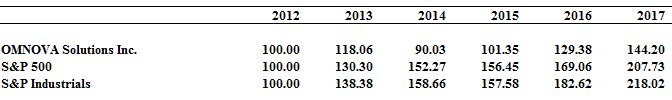
The graph below matches OMNOVA Solutions Inc.'s cumulative 5-Year total shareholder return on common stock with the cumulative total returns of the S&P 500 index and the S&P Industrials index. The graph tracks the performance of a $100 investment in our common share and in each index (with the reinvestment of all dividends) from 11/30/2012 to 11/30/2017.
14
Item 6. | Selected Financial Data | |
The following table sets forth the Company’s selected financial data for all periods presented. The selected financial data as of November 30, 2017, 2016, 2015, 2014, and 2013, and for each of the five years in the period ended November 30, 2017 are derived from the Company’s audited consolidated financial statements.
2017 | 2016 | 2015 | 2014 | 2013 | |||||||||||||||
(Dollars in millions, except per share data) | |||||||||||||||||||
Statement of operations data: | |||||||||||||||||||
Net Sales | $ | 783.1 | $ | 759.9 | $ | 838.0 | $ | 987.4 | $ | 1,018.1 | |||||||||
Cost of goods sold (exclusive of depreciation) | 582.3 | 556.0 | 644.1 | 788.0 | 805.4 | ||||||||||||||
Gross profit | 200.8 | 203.9 | 193.9 | 199.4 | 212.7 | ||||||||||||||
Selling, general, and administrative | 117.1 | 118.5 | 119.3 | 120.2 | 118.1 | ||||||||||||||
Depreciation and amortization | 27.9 | 30.6 | 34.0 | 34.8 | 33.6 | ||||||||||||||
Asset impairments | 32.9 | 5.7 | 19.4 | — | .2 | ||||||||||||||
Loss (gain) on asset sales | .4 | .3 | .2 | .5 | (4.9 | ) | |||||||||||||
Restructuring and severance | 5.7 | 11.1 | 5.9 | .9 | 7.1 | ||||||||||||||
Interest expense | 21.5 | 24.7 | 28.3 | 32.9 | 31.9 | ||||||||||||||
Debt issuance costs write-off | — | 2.9 | .6 | .8 | 1.5 | ||||||||||||||
Acquisition and integration related expense | .3 | .9 | .4 | — | — | ||||||||||||||
Other (income) expense, net | (.9 | ) | (.7 | ) | 6.9 | (2.4 | ) | (1.3 | ) | ||||||||||
204.9 | 194.0 | 215.0 | 187.7 | 186.2 | |||||||||||||||
Income (loss) from continuing operations before income taxes | (4.1 | ) | 9.9 | (21.1 | ) | 11.7 | 26.5 | ||||||||||||
Income tax (expense) benefit | (83.7 | ) | (10.3 | ) | 2.4 | .4 | (6.0 | ) | |||||||||||
Income (loss) from continuing operations | (87.8 | ) | (.4 | ) | (18.7 | ) | 12.1 | 20.5 | |||||||||||
Discontinued Operations, net of tax: | |||||||||||||||||||
Gain (loss) from discontinued operations | — | — | .9 | (.6 | ) | (.9 | ) | ||||||||||||
Income (loss) from discontinued operations | — | — | — | (.6 | ) | (.9 | ) | ||||||||||||
Net income (loss) | $ | (87.8 | ) | $ | (.4 | ) | $ | (17.8 | ) | $ | 11.5 | $ | 19.6 | ||||||
Basic and Diluted income (loss) per share: | |||||||||||||||||||
Income (loss) from continuing operations | $ | (1.98 | ) | $ | (.01 | ) | $ | (.41 | ) | $ | .26 | $ | .44 | ||||||
Income (loss) from discontinued operations | — | — | .02 | (.01 | ) | (.02 | ) | ||||||||||||
Basic and diluted net income (loss) per share | $ | (1.98 | ) | $ | (.01 | ) | $ | (.39 | ) | $ | .25 | $ | .42 | ||||||
General: | |||||||||||||||||||
Capital expenditures | $ | 25.1 | $ | 25.6 | $ | 24.0 | $ | 29.8 | $ | 28.9 | |||||||||
Total assets | $ | 612.8 | $ | 687.3 | $ | 687.2 | $ | 829.2 | $ | 854.7 | |||||||||
Long-term debt | $ | 361.8 | $ | 366.0 | $ | 357.2 | $ | 409.6 | $ | 447.0 | |||||||||
Cash | $ | 88.0 | $ | 72.0 | $ | 44.9 | $ | 99.5 | $ | 164.9 | |||||||||
See Management's Discussion and Analysis of Financial Condition and Results of Operations and Notes to Consolidated Financial Statements.
Item 7. | Management’s Discussion and Analysis of Financial Condition and Results of Operations | |
Overview
OMNOVA Solutions is an innovator of emulsion polymers, specialty chemicals and engineered surfaces for a variety of commercial, industrial and residential end uses. Our products provide a variety of important functional and aesthetic benefits to hundreds of products that people use daily. We hold leading positions in key market categories, which have been built through innovative products, customized product solutions, strong technical expertise, well-established distribution channels, recognized brands, and long-standing customer relationships. We have strategically located manufacturing, technical and other facilities in the U.S., Europe, China, and Thailand to service our broad customer
15
base. Please refer to Item 1. Business, of this Annual Report on Form 10-K for further description of and background on the Company and its operating segments.
The Company’s Chief Operating Decision Maker ("CODM"), its Chief Executive Officer ("CEO"), makes decisions, assesses performance and allocates resources prospectively by reporting segment. Segment information has been prepared in accordance with guidance promulgated by the FASB.
On January 20, 2017, the Company announced that it was evaluating how it expects to make decisions, assess performance and allocate resources prospectively. Effective May 31, 2017, the Company began reporting its financial results under two new reporting segments: "Specialty Solutions", a segment focused on the Company's higher growth, specialty business lines, and "Performance Materials," a segment comprised of the Company's mature business lines. Accordingly, prior year segment results have been modified to conform to the revised segment presentation. These reporting segments were determined based on products and services provided. Accounting policies of the segments are the same as those described in Note A—Description of Business and Significant Accounting Policies of the Company’s Consolidated Financial Statements. For a reconciliation of the Company’s segment operating performance information, refer to Note P of the Company’s Consolidated Financial Statements.
A majority of the Company’s raw materials are derived from petrochemicals and chemical feedstocks, where prices can be cyclical and volatile. Styrene, a key raw material component, is generally available worldwide, and OMNOVA has supply contracts with several producers. OMNOVA believes there is adequate global capacity to serve demand. OMNOVA’s styrene purchases for 2013 through 2017 and the range of market prices were as follows:
Pounds Purchased (in millions) | Market Price Range Per Pound | ||
2017 | 129 | $0.48 - $0.72 | |
2016 | 144 | $0.39 - $0.54 | |
2015 | 166 | $0.41 - $0.68 | |
2014 | 177 | $0.69 - $0.84 | |
2013 | 172 | $0.71 - $0.93 | |
Butadiene, a key raw material component, is generally available worldwide, but its price is volatile. OMNOVA has supply contracts with several producers. At times, when the demand for butadiene exceeds supply, it is sold on an allocated basis. OMNOVA’s butadiene purchases for 2013 through 2017 and the range of market prices were as follows:
Pounds Purchased (in millions) | Market Price Range Per Pound | ||
2017 | 103 | $0.39 - $1.42 | |
2016 | 111 | $0.24 - $0.71 | |
2015 | 132 | $0.29 - $0.65 | |
2014 | 142 | $0.55 - $0.82 | |
2013 | 139 | $0.44 - $1.01 | |
Other key raw materials utilized by the Company include polyvinyl chloride (PVC) resins, textiles, and plasticizers. These raw materials are generally available worldwide from multiple suppliers.
OMNOVA had indexed sales price contracts covering approximately 31% of its sales in 2017. These contract indexes are generally comprised of several components: a negotiated fixed amount per pound, and the market price of key raw materials (i.e., styrene and butadiene). The indexed contracts provide that OMNOVA will pass through the increases or decreases of key raw materials, generally within a 30 to 60 day period. Indexed contracts vary in length, generally from 12 to 36 months.
The majority of OMNOVA’s customers do not maintain indexed contracts. Instead, the Company negotiates pricing with each customer based on the cost of the raw materials components of the products being purchased and the value-added performance attributes of those products. The Company’s pricing objective, which may or may not be met, is to recover raw material price increases for these non-indexed contracts within three months.
Key Indicators
Key economic measures relevant to the Company include global economic growth rates, discretionary spending for durable goods, oil and gas consumption and drilling levels, U.S. commercial real estate occupancy rates, U.S. office furniture sales, manufactured housing shipments, housing starts and sales of existing homes, and forecasts of raw material pricing for certain petrochemical feed stocks. Key Original Equipment Manufacturer ("OEM") industries, which provide a general indication of demand drivers to the Company, include commercial and residential construction and refurbishment, automotive and tire production, furniture, flooring, and ABS manufacturing. These measures provide general information on trends relevant to the demand for the Company’s products, but the trend information does not necessarily directly correlate with demand levels in the markets which ultimately use the Company’s products in part because the Company's market share is relatively small in a number of specialty markets.
Key operating measures utilized by the business segments include: orders; sales and pricing; working capital days; inventory; productivity; plant utilization; new product vitality; cost of quality; order fill-rates, which provide key indicators of business trends; and safety and other internal metrics. These measures are reported on various cycles including daily, weekly and monthly, depending on the needs established by operating management.
16
Key financial measures utilized by Management to evaluate the results of its businesses and to understand the key variables impacting the current and future results of the Company include sales and pricing; gross profit; selling, general, and administrative expenses; adjusted operating profit; adjusted net income; consolidated earnings before interest, taxes, depreciation, and amortization (“EBITDA”) as set forth in the Net Leverage Ratio in the Company’s $350,000,000 Term Loan Credit Agreement; Adjusted EBITDA, working capital; operating cash flows; capital expenditures; cash interest expense; adjusted earnings per share; and applicable ratios, such as inventory turnover; working capital turnover; return on sales and assets; and leverage ratios. These measures, as well as objectives established by the Company's Board of Directors, are reviewed at monthly, quarterly, and annual intervals and compared with historical periods.
Results of Operations of 2017 Compared to 2016
The Company's net sales in 2017 were $783.1 million, compared to $759.9 million in 2016. Our China-based coated fabric manufacturing operation, China Coated Fabrics ("CCF"), which was sold in July of 2017, accounted for $10.4 million in sales in 2017 and $26.2 million in sales in 2016. Our India-based chemicals manufacturing operation, which was sold in February 2016, accounted for $3.4 million in sales in 2016. Excluding the effect of CCF and India, sales increased $42.4 million or 5.8%. The Specialty Solutions business segment revenue increased 9.2% and the Performance Materials business segment revenue decreased by 3.9%. Contributing to the net sales increase of $42.4 million in 2017 were improved customer pricing of $61.5 million, which was partially offset by unfavorable volume of $18.7 million and currency exchange of $0.4 million. The favorable pricing increase was primarily due to higher raw material costs and their related impact on pricing index formulas in certain markets of Performance Materials. The lower volume was driven primarily by market weakness in paper and antioxidants, which were only partially offset by improved volumes in laminates, nonwovens, and oil and gas.
Gross profit and gross profit margin in 2017 were $200.8 million and 25.6%, compared to $203.9 million and 26.8% in 2016. The slightly lower gross profit margin was primarily due to unfavorable raw material costs, lower volumes and slightly higher manufacturing costs as a result of manufacturing footprint initiatives, which were partially offset by favorable price and mix.
Selling, general, and administrative expense in 2017 decreased $1.4 million to $117.1 million, compared to $118.5 million in 2016. The decrease in 2017 reflects savings from cost reduction programs implemented during the prior year along with reductions in outside services related to one-time project implementations, partially offset by a bad debt provision of $2.1 million.
During the fourth quarter of 2017, one of the Company’s largest carpet customers, was acquired by a competing carpet manufacturer. This customer had previously filed for bankruptcy reorganization, and due to the Company’s preferred supplier status, the Company continued to sell product to this customer and concluded that all past due amounts from the customer were likely to be collected. As a result of the eventual sale of the customer's business, in the fourth quarter of 2017, the Company was informed that its supply contract with the customer would not be renewed and therefore the Company was no longer considered a preferred supplier. Accordingly, the Company recorded a bad debt provision of $2.1 million, in the fourth quarter on 2017, as it now believes that a significant portion of the outstanding balance owed by this customer is unlikely to be collected.
Income tax expense was $83.7 million in 2017, compared to an income tax expense of $10.3 million for 2016. The 2017 income tax expense was higher than the statutory income tax rate of 35% primarily as a result of a $79.9 million income tax expense related to valuation allowances on deferred tax assets. Of that amount, $75.7 million income tax expense was recorded in the U.S. during the fourth quarter of 2017. These valuation allowances are discussed in more detail under the heading "Significant Accounting Estimates and Management Judgments - F) Income Taxes". Additionally, a $19.6 million goodwill impairment was recorded in the fourth quarter of 2017 for which no tax benefit was realized as the goodwill impairment is permanently non-deductible for tax purposes. The tax impact of the goodwill impairment is $6.9 million. These expenses were partially offset by a $3.4 million income tax benefit from French legislative changes during the year. The 2016 effective tax rate was higher than the statutory income tax rate of 35% primarily as a result of a $2.2 million tax expense related to the payment of an intercompany dividend and a $1.6 million tax expense related to a newly enacted French deemed distribution tax. The French deemed distribution tax, enacted in 2016, was reversed in the first quarter of 2017 as the law was repealed in late December of 2016. A $1.8 million tax expense was also recorded for foreign valuation allowances on deferred tax assets in which no benefit is expected to be realized. In addition, the Company realized a $1.0 million tax benefit related to foreign taxes in jurisdictions in which the tax rate is lower than the US federal statutory rate.
At November 30, 2017, the Company has $91.1 million of U.S. federal net operating loss carryforwards (NOLCs), $8.6 million of U.S. federal capital loss carryforwards, $0.1 million of foreign tax credit carryforwards, $0.9 million of AMT credit carryforwards, and $86.8 million of state net operating loss carryforwards. As a result, cash tax payments in the U.S. are expected to be minimal for the foreseeable future. The Company utilized approximately $7.8 million, $15.6 million and $7.8 million of federal net operating loss carryforward for the years ended November 2017, 2016 and 2015, respectively. The U.S. federal net operating loss carryforward was increased in 2017 by $7.0 million due to the recognition of windfall tax benefits as required under ASU 2016-09 which was adopted effective December 1, 2016. During 2017, the Company generated an $8.6 million U.S. federal capital loss as result of a stock sale of a foreign subsidiary. The majority of the federal, state and local NOLCs will expire in tax years 2023 through 2034 while the foreign tax credit carryforwards will expire in the tax years 2020 through 2022, and the capital loss will expire in tax year 2022.
The Company has not provided for U.S. income taxes on certain of its non-U.S. subsidiaries' undistributed earnings as such amounts are considered permanently reinvested outside the U.S. To the extent that foreign earnings previously treated as permanently reinvested are repatriated, the related U.S. tax liability may be reduced by any foreign income taxes paid on these earnings. However, based on the Company's policy of permanent reinvestment, it is not practicable to determine the U.S. federal income tax liability, if any, which would be payable if such earnings were not permanently reinvested. As of November 30, 2017, the non-U.S. subsidiaries have cumulative foreign retained earnings of $59.4 million.
Changes in tax laws and rates may affect recorded deferred tax assets and liabilities and our effective tax rate in the future. As of November 30, 2017, the Company had approximately $30.8 million in U.S. gross deferred indefinite lived tax liabilities. A meaningful change to the U.S. corporate income tax rate effective December 22, 2017 will lead to a contemporaneous tax benefit upon enactment related to the rate differential between the current Federal tax and the future enacted tax rate. The Company estimates the re-measurement of its deferred tax liabilities to be an income tax benefit of $3.0 million to $5.0 million in the first quarter of 2018. See subsequent event Note T for additional information related to future legislative changes related to income tax.
17
Segment Discussion
The following Segment Discussion presents information used by the Company in assessing the results of operations by business segment. The Company believes that this presentation is useful for providing the investor with an understanding of the Company’s business and operating performance because these measures are used by the CODM, its CEO, in making decisions, assessing performance and allocating resources.
Year Ended November 30, | |||||||
2017 | 2016 | ||||||
(Dollars in millions) | |||||||
Net Sales | |||||||
Specialty Solutions | $ | 441.4 | $ | 404.3 | |||
Performance Materials | 341.7 | 355.6 | |||||
Total Net Sales | $ | 783.1 | $ | 759.9 | |||
Segment Operating Profit | |||||||
Specialty Solutions | $ | 59.9 | $ | 59.8 | |||
Performance Materials | (12.6 | ) | 8.5 | ||||
Total segment operating profit | 47.3 | 68.3 | |||||
Interest expense | (21.5 | ) | (24.7 | ) | |||
Corporate expenses | (24.5 | ) | (25.8 | ) | |||
Corporate severance | (2.9 | ) | (4.9 | ) | |||
Operational improvement costs | — | .8 | |||||
Asset impairment | (1.8 | ) | — | ||||
Acquisition and integration related expense | (.3 | ) | (.9 | ) | |||
Debt issuance costs write-off | — | (2.9 | ) | ||||
Pension settlement | (.4 | ) | — | ||||
Income (Loss) From Continuing Operations Before Income Taxes | $ | (4.1 | ) | $ | 9.9 | ||
Specialty Solutions
Specialty Solutions' net sales increased $37.1 million to $441.4 million in 2017, compared to $404.3 million in 2016. The increased sales were primarily driven by improved customer pricing of $23.3 million, and favorable volume of $14.1 million, which were slightly offset by unfavorable currency translation effects of $0.3 million. Improved pricing was driven by higher contract-based index prices as a result of higher raw material costs. Volume was up in Laminates & Films, Oil & Gas, Nonwovens and EMOD but were partially offset by declines in coatings, home & personal care, and construction. Net sales for the Specialty Coatings & Ingredients line increased $12.6 million to $231.3 million in 2017 compared to $218.7 million in 2016. Net sales for the Oil & Gas line increased $8.7 million to $54.6 million compared to $45.9 million in 2016. Net sales for the Laminates & Films line increased $15.9 million to $155.5 million in 2017 compared to $139.6 million in 2016.
This segment generated an operating profit of $59.9 million in 2017, compared to $59.8 million in 2016. The slight increase in segment operating profit was due in part to effective cost reduction initiatives and favorable pricing, which offset higher raw material costs. In 2016, the segment's operating profit was impacted primarily by the segment wide restructuring initiative and the asset impairment charges. Management excludes these and other items when evaluating segment performance. Those items for 2017 were $0.9 million and included $0.6 million of restructuring and severance charges and $0.3 million of operational improvement costs. Those items for 2016 were $0.4 million and included facility closure costs of $1.5 million and $0.2 million of severance charges, partially offset by favorable adjustments of $1.3 million related to operational and other improvement items. The segment operating profit was also impacted by higher manufacturing costs, which were offset by margin expansion and and favorable mix.
Performance Materials
Performance Materials' net sales decreased $13.9 million to $341.7 million in 2017, compared to $355.6 million in 2016. During May 2017, the Company sold CCF which accounted for $10.4 million of net sales in 2017 and $26.2 million in 2016. In the first quarter of 2016 the Company sold its India operation which accounted for $3.4 million of net sales in 2016. Excluding these sold operations, net sales increased $5.2 million. The increase of $5.2 million was driven primarily by higher pricing of $38.2 million, which was primarily offset by lower volumes of $32.8 million, and unfavorable foreign currency translation effects of $0.1 million. Coated Fabrics' net sales decreased $16.3 million $55.2 million in 2017 compared to $71.5 million in 2016, primarily due to the sale of CCF. Net sales for the Performance Additives decreased $6.0 million to $101.2 million in 2017 compared to $107.2 million in 2016, primarily due to decreased volumes. Paper and Carpet net sales increased $12.4 million to $166.5 million in 2017 compared to $154.1 million in 2016, primarily due to improved pricing for carpet.
18
Segment operating loss was $12.6 million for 2017, compared to operating profit of $8.5 million for 2016. The decrease in segment operating profit was primarily due to a goodwill impairment charge of $19.6 million related to lower volumes within the paper market. Segment operating profit includes items which management excludes when evaluating the results of the Company's segments. Those items for 2017 were $13.7 million and include asset impairment charges and facility closure costs of $14.2 million, restructuring and severance costs of $1.7 million and a reversal of an environmental charge of $2.2 million. Those items for 2016 were $11.5 million and include acquisition and integration related expense, asset impairment charges of $5.7 million related to the sale of CCF, workforce reduction actions of $3.3 million, $3.0 million of accelerated depreciation expense, environmental costs of $0.3 million, and favorable adjustments of $1.9 million related to operational and other improvement items.
Interest and Corporate
Interest expense was $21.5 million and $24.7 million for 2017 and 2016, respectively. The decrease was attributable to a lower interest rate in connection with the Company's refinanced term loan credit facility, and full redemption of its outstanding $150 million Senior Notes, which was finalized in November of 2016. The Company incurred $1.9 million of additional interest expense between August and November 2016, the amount of additional interest expense was less than the cost of the early redemption premium that the Company would have incurred by redeeming the Senior Notes in August 2016.
Corporate expenses were $24.5 million in 2017 compared to $25.8 million in 2016. The decrease is due to cost reduction programs implemented during the prior year along with reductions in outside services related to one-time project implementations.
Results of Operations of 2016 Compared to 2015
The Company's net sales in 2016 were $759.9 million, compared to $838.0 million in 2015. Excluding year-over-year non-comparable sales of $24.3 million from the divested India manufacturing operation business in the first quarter of 2016, sales decreased $53.8 million or 6.4%. The Specialty Solutions business segment revenue decreased by 3.7% and the Performance Materials business segment revenue decreased by 14.9%. Contributing to the net sales decrease in 2016 were sales volumes that were lower by $30.0 million, or 3.6%, a reduction in customer pricing of $15.4 million, and unfavorable currency exchange translation effects of $8.4 million. The pricing decline was primarily due to lower raw material costs and their related impact on pricing index formulas in certain markets of Performance Materials. The lower volume was driven primarily by market weakness in paper, carpet, coated fabrics, nonwovens and industrial rubber, which were only partially offset by improved volumes in specialty coatings, oil and gas, industrial rubber, laminates, food service and tire cord.
Gross profit and gross profit margin in 2016 were $203.9 million and 26.8%, compared to $193.9 million and 23.1% in 2015. The higher gross profit margin was primarily due to favorable product mix, and lower manufacturing costs as a result of manufacturing footprint initiatives, which were partially offset by unfavorable volumes and unfavorable currency effects.
Selling, general, and administrative expense in 2016 decreased $0.8 million to $118.5 million, compared to $119.3 million in 2015. The decrease in 2016 reflects savings from cost reduction programs implemented during the year, partially offset by higher employee incentive compensation expense.
Interest expense was $24.7 million and $28.3 million for 2016 and 2015, respectively. Included in 2015 is $1.0 million of premiums paid on the early redemption of $50.0 million of the $250.0 million Senior Notes in each of 2015.
Income tax expense was $10.3 million in 2016, or a 104.0% effective tax rate, compared to an income tax benefit of $2.4 million, or an 11.4% effective income tax rate, for 2015. The 2016 effective tax rate was higher than the U.S. federal statutory income tax rate of 35% primarily as a result of a $2.2 million income tax expense related to the payment of an intercompany dividend and a $1.6 million income tax expense related to a newly enacted French deemed distribution tax. The intercompany dividend and the enactment of the French deemed distribution tax were both fourth quarter events. Neither item had a current year cash tax impact. The French deemed distribution tax expense of $1.6 million was reversed in the first quarter of 2017 as the law was repealed in late December of 2016. An $1.8 million income tax expense was also recorded for foreign valuation allowances on deferred tax assets in which no benefit can be realized. In addition, the Company realized a $1.0 million income tax benefit related to foreign taxes in jurisdictions in which the income tax rate is lower than the U.S. federal statutory income tax rate. The 2015 effective tax rate was lower than the U.S. federal statutory income tax rate of 35% primarily related to an income tax expense of $6.2 million related to an impairment which is permanently non-deductible for tax purposes. This was partially offset by a $3.1 million income tax benefit related to foreign taxes in jurisdictions in which the income tax rate is lower than the U.S. federal statutory income rate of 35%.
Cash tax payments in the U.S. are expected to be minimal for the foreseeable future as the Company has $92.0 million of U.S. federal net operating loss carryforwards ("NOCL's"), $108.7 million of state and local NOLC's, $0.1 million of foreign tax carryforwards, and $0.7 million of AMT credit carryforwards. The $108.7 million of state and local NOLC's have a realizable deferred tax asset value of $3.8 million. The Company utilized approximately $15.6 million and $7.8 million of federal net operating loss carryforwards for the years ended November 30, 2016 and 2015, respectively. The majority of the federal, state and local net operating loss carryforwards have expirations between tax years 2021 and 2034.
The Company has not provided for U.S. income taxes on certain of its non-U.S. subsidiaries' undistributed earnings as such amounts are considered permanently reinvested outside the U.S. To the extent that foreign earnings previously treated as permanently reinvested are repatriated, the related U.S. tax liability may be reduced by any foreign income taxes paid on these earnings. However, based on the Company's policy of permanent reinvestment, it is not practicable to determine the U.S. federal income tax liability, if any, which would be payable if such earnings were not permanently reinvested. As of November 30, 2016, the non-U.S. subsidiaries have cumulative foreign retained earnings of $46.1 million.
The Company incurred a loss from continuing operations of $0.4 million, or $0.01 per diluted share, in 2016, compared to a loss from continuing operations of $18.7 million, or $0.41 per diluted share, in 2015. Included in 2016 are restructuring and severance charges of $8.4 million, asset impairment charges of $5.7 million related to CCF, debt issuance cost write-off of $4.9 million, accelerated depreciation expense of $3.0 million and facility closure costs of $2.7 million, which were partially offset by favorable adjustments of $2.9 million related to operational and other improvement items. Included in 2015 are restructuring and severance charges of $5.9 million, accelerated depreciation expense of
19
$5.8 million, asset impairments of $19.4 million, operational improvement and shareholder activist costs of $7.3 million, environmental reserve costs of $3.0 million, premium fees and debt issuance cost write-off of $1.6 million and acquisition expense and other items of $1.6 million.
Segment Discussion
The following Segment Discussion presents information used by the Company in assessing the results of operations by business segment. The Company believes that this presentation is useful for providing the investor with an understanding of the Company’s business and operating performance because these measures are used by the CODM, its CEO, in making decisions, assessing performance and allocating resources.
Year Ended November 30, | |||||||
2016 | 2015 | ||||||
(Dollars in millions) | |||||||
Net Sales | |||||||
Specialty Solutions | $ | 404.3 | $ | 419.9 | |||
Performance Materials | 355.6 | 418.1 | |||||
Total Net Sales | $ | 759.9 | $ | 838.0 | |||
Segment Operating Profit | |||||||
Specialty Solutions | $ | 59.8 | $ | 54.1 | |||
Performance Materials | 8.5 | (19.3 | ) | ||||
Total segment operating profit | 68.3 | 34.8 | |||||
Interest expense | (24.7 | ) | (28.3 | ) | |||
Corporate expenses | (25.8 | ) | (23.7 | ) | |||
Corporate severance | (4.9 | ) | — | ||||
Shareholder activist costs | — | (1.9 | ) | ||||
Operational improvement costs | .8 | (.4 | ) | ||||
Asset impairment | — | (.6 | ) | ||||
Acquisition and integration related expense | (.9 | ) | (.4 | ) | |||
Debt issuance costs write-off | (2.9 | ) | (.6 | ) | |||
Income (Loss) From Continuing Operations Before Income Taxes | $ | 9.9 | $ | (21.1 | ) | ||
Specialty Solutions
Specialty Solutions’ net sales decreased $15.6 million, to $404.3 million in 2016, compared to $419.9 million in 2015. Contributing to the decrease were reduced customer pricing of $8.4 million, lower volumes that were unfavorable by $9.0 million, and unfavorable foreign currency translation effects of $4.9 million. Lower volumes were driven primarily by market weakness in nonwovens, laminates and films that were partially offset by improved volumes in oil & gas, specialty coatings and construction.
This segment generated an operating profit of $59.8 million in 2016, compared to $54.1 million in 2015. The increase in segment operating profit was due in part to effective cost reductions and lower raw material costs, which offset volume declines. Segment operating profit includes items which management excludes when evaluating the results of the Company's segments. Those items for 2016 were $0.4 million and included facility closure costs of $1.5 million and $0.2 million of severance charges, partially offset by favorable adjustments of $1.3 million related to operational and other improvement items. Those items for 2015 included $3.1 million of operational improvement costs related to manufacturing footprint improvements, $2.6 million of severance charges and environmental remediation charges of $0.2 million.
Performance Materials
Performance Materials' net sales decreased $62.5 million, to $355.6 million in 2016, compared to $418.1 million in 2015. The divestiture of the India operations in February 2016 resulted in a reduction of net sales of $24.3 million. The decrease was due primarily to lower volumes of $21.0 million, unfavorable foreign currency translation effects of $3.6 million, and unfavorable pricing of $7.0 million driven by lower contract-based index prices as a result of lower raw material costs. The lower volumes were driven primarily by market weakness in paper, carpet and coated fabrics, that were partially offset by improved volumes in antioxidants, industrial rubber and tire cord.
Segment operating profit was $8.5 million for 2016, compared to a loss of $19.3 million for 2015. The increase in part was due to effective cost reductions and lower raw materials costs, which offset the lower volumes. In 2015, the segment's operating profit was impacted by the segment-wide restructuring initiative and the asset impairment charge recorded for the segment's India operation. Segment operating profit includes items which management excludes when evaluating the results of the Company's segments. Those items for 2016 include asset impairment charges of $5.7 million related to CCF, workforce reduction actions of $3.3 million, $3.0 million of accelerated depreciation expense, environmental costs of $0.3 million, and favorable adjustments of $1.9 million related to operational and other improvement items. Those items for 2015 include asset impairment charges of $20.0 million related to the India business, $5.8 million of accelerated depreciation expense, severance charges of $3.2 million, environmental remediation charges of $2.8 million and $1.9 million of operational improvement costs related to manufacturing footprint improvements.
20
Interest and Corporate
Interest expense was $24.7 million and $28.3 million for 2016 and 2015, respectively. In connection with the Company's refinancing of its term loan credit facility in August of 2016, the Company placed $156.0 million of the proceeds of the term loan into trust, with the funds irrevocably committed to the redemption of all of the Company's outstanding Senior Notes on November 1, 2016. The funds placed into trust reflected the $150.0 million of outstanding principal of the Senior Notes, and the accrued but unpaid interest for the Senior Notes through November 1, 2016. Although the Company incurred $1.9 million of additional interest expense between August and November 2016, the amount of additional interest expense was less than the cost of the early redemption premium that the Company would have incurred by redeeming the Senior Notes in August 2016. Included in 2015 was $1.0 million of premiums paid on the early redemption of $50.0 million of the $250.0 million outstanding Senior Notes.
Corporate expenses were $25.8 million in 2016 compared to $23.7 million in 2015. The increase is due primarily to higher employee incentive compensation costs.
Restructuring Plans
2017 Restructuring Plans
Restructuring and severance activities initiated in 2017 include the One OMNOVA initiative announced during the first quarter of 2017. The One OMNOVA initiative is focused on improving functional excellence in marketing, sales, operations, supply chain and technology, as well as various corporate functions. The plan is designed to reduce complexity and drive consistency across the global enterprise through a standardized, integrated business system. The Company expects the One OMNOVA initiative to continue through 2018. Total estimated costs for this initiative are expected to be between $5.0 million and 7.0 million. For this initiative, in 2017 the Company incurred restructuring and severance costs of $3.5 million, all of which was recognized as a component of restructuring and severance expense within the consolidated statement of operations. The remaining expected costs for this initiative will be incurred in 2018. As of November 30, 2017, $3.0 million was paid and the remainder is expected to be paid during 2018. Annual savings for this initiative are estimated at approximately $3.0 million per year, which the Company has begun to realize in 2017, and is confident the total annual savings will ultimately be achieved.
2016 Restructuring Plans
Restructuring and severance activities initiated in 2016 included continued cost reduction and efficiency improvement actions, as well as a change in the Company’s CEO. For these activities, the Company incurred severance and restructuring costs of $8.7 million, of which $5.5 million was recognized in 2016 and $2.1 million was recognized in 2017. As of November 30, 2017, $7.5 million was paid and the remaining $1.2 million is expected to be paid by the end of 2018. For these actions, the Company expects annual savings of approximately $3.0 million, which the Company has substantially achieved by the end of 2017.
2015 Restructuring Plans
Restructuring and severance activities initiated in 2015 relate to the transfer of production from one U.S. manufacturing location to another U.S. manufacturing location, and other efficiency improvement actions focused on the Company’s cost reduction and specialization strategy. For the transfer of production plan, the Company incurred severance costs of $1.5 million, of which $0.8 million was recognized in 2015 and $0.7 million was recognized in 2016. All payments related to this plan were completed by the end of 2016. For this plan, the Company announced expected annual savings of approximately $4.0 million, which the Company has substantially achieved by the end of 2017. For the other efficiency improvement action plans, the Company incurred severance and facility closure costs of $9.8 million, of which $5.0 million was recognized in 2015, $4.7 million in 2016, and $0.1 million in 2017. All payments were substantially completed by the end of 2016. For these plans, the Company achieved annual savings of approximately $7.0 million.
Financial Resources and Capital Spending
The following table reflects key cash flow measures from continuing operations:
2017 | 2016 | 2015 | |||||||||
(Dollars in millions) | |||||||||||
Cash provided by (used in) operating activities | $ | 47.8 | $ | 50.9 | $ | 43.7 | |||||
Cash provided by (used in) investing activities | $ | (28.6 | ) | $ | (20.3 | ) | $ | (29.0 | ) | ||
Cash provided by (used in) financing activities | $ | (6.6 | ) | $ | 0.6 | $ | (72.7 | ) | |||
Increase (decrease) in cash and cash equivalents | $ | 16.0 | $ | 33.1 | $ | (54.6 | ) | ||||
Cash provided by operating activities was $47.8 million in 2017, compared to $50.9 million in 2016 and $43.7 million in 2015. The decrease in 2017 was due to an increase in accounts receivable, which was driven by higher sales occurring later in the fourth quarter of 2017 compared to 2016. The increase in 2016 was due to improved working capital and profitability. Cash provided by operating activities increased in 2015 due to improved working capital. Days sales outstanding was 47.8 days in 2017 compared to 42.0 days in 2016. The increase in 2017 was due to a higher mix of receivables in foreign countries where terms are longer.
Cash used in investing activities was $28.6 million in 2017, compared to $20.3 million in 2016 and $29.0 million in 2015. Included in 2017 are capital expenditures of $25.1 million, primarily related to manufacturing equipment, and acquisition and disposal of businesses of $7.3 million, partially offset by the collection of a $3.8 million note receivable. Included in 2016 are capital expenditures of $25.6 million, primarily related to manufacturing equipment, partially offset by proceeds from the sale of the India operation. Included in 2015 were capital expenditures
21
of $24.0 million and $5.0 million for the acquisition of New Fluid Solutions. The Company expects capital expenditures of approximately $30.0 million to $35.0 million during 2018.
Cash used in financing activities was $6.6 million in 2017, and was due primarily to $4.2 million of payments on the Company's debt, and $2.2 million of common stock redeemed in the repayment of employees withholding taxes. Cash provided by financing activities was $0.6 million in 2016, and was due primarily to payments for fees on the Company's debt refinancing of $4.3 million, and $0.7 million of common stock redeemed in the repayment of employees withholding taxes, offset by additional borrowings as a result of refinancing our Term Loan. Cash used in financing activities in 2015 of $72.7 million was due primarily to a $50.0 million debt prepayment on the Company's Senior Notes and $18.6 million used in the buyback of the Company's common shares. Long-term debt was $361.8 million as of November 30, 2017, which includes $345.6 million for the term loan and capital lease obligations of $16.2 million, compared to $366.0 million as of November 30, 2016. OMNOVA’s cash balance of $88.0 million at November 30, 2017 consists of $58.3 million in the U.S., $9.9 million in Europe, and $19.8 million in Asia. As of November 30, 2017, the Company is not aware of any restrictions regarding the repatriation of its non-U.S. cash.
During December 2017, the Company prepaid $40.0 million of its outstanding Term Loan B principle balance. As a result the Company expects to reduce future interest expense by approximately $2.1 million annually. As required under applicable U.S. accounting guidance, the Company determined that this prepayment constituted a partial extinguishment of debt and as such, expects to write-off approximately $0.6 million to $0.9 million of deferred financing fees in the first quarter of 2018.
The Company believes that its cash flows from operations, together with existing credit facilities and cash on hand will be adequate to fund its cash requirements for at least the next twelve months.
Debt
Information regarding the Company's debt is disclosed in Note L to the Company's consolidated financial statements.
Contractual Obligations
The following table summarizes the Company's contractual obligations for the periods indicated:
Payments Due By Period | |||||||||||||||||||
Total | Less Than 1 Year | 2 – 3 Years | 4 – 5 Years | More Than 5 Years | |||||||||||||||
(Dollars in millions) | |||||||||||||||||||
Long-term debt and amounts due banks | $ | 345.6 | $ | 3.5 | $ | 7.0 | $ | 7.0 | $ | 328.1 | |||||||||
Capital lease obligations(1) | 28.4 | 1.5 | 3.6 | 3.4 | 19.9 | ||||||||||||||
Interest payments on long-term debt(2) | 98.4 | 18.3 | 36.1 | 35.3 | 8.7 | ||||||||||||||
Operating and financing leases | 11.7 | 3.2 | 5.0 | 2.6 | .9 | ||||||||||||||
Purchase obligations | 33.4 | 33.4 | — | — | — | ||||||||||||||
Pension and post-retirement funding obligations(3) | 62.0 | 7.1 | 15.8 | 23.7 | 15.4 | ||||||||||||||
Total | $ | 579.5 | $ | 67.0 | $ | 67.5 | $ | 72.0 | $ | 373.0 | |||||||||
(1) | Includes principal and effective interest payments. |
(2) | Based on outstanding debt balances as of November 30, 2017 and estimated interest rates. As those are based on estimates, actual future payments may be different. |
(3) | Payments are based on Company estimates and current funding laws. As those are based on estimates, actual future payments may be different. |
Significant Accounting Estimates and Management Judgments
The Company’s discussion and analysis of its results of operations, financial condition, and liquidity are based upon the Company’s consolidated financial statements as of November 30, 2017, which have been prepared in accordance with U.S. generally accepted accounting principles. The preparation of these consolidated financial statements requires the Company to make estimates and judgments that affect the reported amounts of assets and liabilities, revenues and expenses, and related disclosure of contingent assets and liabilities as of the date of the consolidated financial statements. Periodically, the Company reviews its estimates and judgments including those related to product returns, accounts receivable, inventories, litigation, environmental reserves, pensions, and income taxes. The Company bases its estimates and judgments on historical experience and on various assumptions that it believes to be reasonable under the circumstances. Actual results may materially differ from these estimates under different assumptions or conditions.
Management believes the following critical accounting policies affect its more significant estimates and assumptions used in the preparation of its consolidated financial statements:
A) Revenue Recognition
The Company recognizes revenue when the following criteria are met: 1) persuasive evidence of an arrangement exists; 2) delivery has occurred; 3) an established sales price has been set with the customer; 4) collection of the sale revenue from the customer is reasonably assured; and 5) no contingencies exist. Delivery is considered to have occurred when the customer assumes the risk and rewards of ownership. The Company estimates and records provisions for customer quantity rebates and sales returns and allowances as reduction in revenue in the same period the related revenue is recognized, based upon its historical experience.
22
B) Allowance For Doubtful Accounts
The Company’s policy is to identify customers that are considered doubtful of collection based upon the customer’s financial condition, payment history, credit rating and other relevant factors; and reserves the portion of such accounts receivable for which collection does not appear likely. The allowance for doubtful accounts was $2.9 million and $0.8 million at November 30, 2017 and 2016, respectively.
C) Allowance For Inventory Obsolescence
The Company’s policy is to maintain an inventory obsolescence reserve based upon specifically identified, discontinued, or obsolete items and a percentage of quantities on hand compared with historical and forecasted usage and sales levels. A sudden and unexpected change in design trends and/or material preferences could impact the carrying value of the Company’s inventory and require the Company to increase its reserve for obsolescence. The reserve for inventory obsolescence,was $6.4 million at November 30, 2017 and $6.6 million at November 30, 2016.
D) Litigation and Environmental Reserves
From time to time, the Company is subject to claims, lawsuits, and proceedings related to product liability, product warranty, contract, employment, environmental, and other matters. The Company provides a reserve for such matters when it concludes a material loss is probable and the amount can be estimated. Costs related to environmental compliance are also accrued when it is probable a loss has been incurred and the amount of loss can be estimated.
E) Pensions and Other Post-retirement Plans
The Company accounts for its pension and other post-retirement plans by recognizing in its balance sheet the overfunded or underfunded status of defined benefit post-retirement plans, measured as the difference between the fair value of plan assets and the benefit obligation (the projected benefit obligation for pension plans and the accumulated post-retirement benefit obligation for other post-retirement plans). The Company recognizes the change in the funded status of the plan in the year in which the change occurs through Accumulated Other Comprehensive (Loss) Income. As of May 2007, the Company's U.S. defined benefit pension plan have been closed to all new hires and since December 1, 2011, future service benefits were frozen and fully vested for all participants. Therefore, there is no future service benefit accrual for the Company’s U.S. defined benefit plans.
The most significant elements in determining the Company’s pension expense are the expected return on plan assets and the discount rate. The assumed long-term rate of return on assets is applied to a calculated value of plan assets, which recognizes changes in the fair value of plan assets in a systematic manner over five years. This produces the expected return on plan assets that is included in pension (expense) income. For our U.S. plan, the difference between this expected return and the actual return on plan assets is deferred and amortized over the estimated remaining life expectancy of plan participants. The net deferral of past asset gains (losses) affects the calculated value of plan assets and, ultimately, future pension (expense) income.
The Company recorded pension expense of $2.1 million in 2017 and $0.6 million 2016. Pension expense is calculated using the discount rate to discount plan liabilities at the prior year measurement date. Discount rates of 4.12% and 4.29% were used to calculate the pension expense in 2017 and 2016, respectively. The Company anticipates 2018 expense to be approximately $1.3 million based on a discount rate range of 3.47% - 3.67% discussed further below. An increase or decrease of 25 basis points in the discount rate would decrease or increase expense on an annual basis by approximately $0.1 million. Cash contributions to the pension plans were $7.6 million in 2017 and $6.2 million in 2016.
The Company, in consultation with its actuary, determined the discount rate used to discount the U.S. plan liabilities at the plan’s measurement date, which was November 30, 2017. The discount rate reflects the current rate at which the pension liabilities could be effectively settled at the end of the year. In determining the discount rate, we used spot rates on a yield curve matching benefit payments to determine the weighted average discount rate that would be applied in determining the benefit obligation at November 30, 2017. Changes in discount rates, as well as the net effect of other changes in actuarial assumptions and experience, have been recognized in Accumulated Other Comprehensive Income (Loss). The Company, in consultation with its actuary, determined the discount rate used to measure defined benefit pension plan obligations as of November 30, 2017 should be 3.66%, compared to 4.12% in 2016. A 25 basis point change in the discount rate would increase or decrease the projected benefit obligation by approximately $8.0 million.
The Company utilizes an approach that discounts the individual expected cash flows underlying interest and service costs using the applicable spot rates derived from the yield curve used to determine the benefit obligation to the relevant projected cash flows. The spot rates used to determine service and interest costs for 2017 ranged from 1.35% to 4.08%. The ultimate spot rate used to discount cash flows beyond 30 years was 5.07% for 2018. The spot rates used to determine service and interest costs for 2016 expense ranged from 1.14% to 5.07%.
The spot rates used to determine service and interest costs for 2017 expense ranged from 1.35% to 4.08%. The ultimate spot rate used to discount cash flows beyond 30 years was 5.07% for 2017. The spot rates used to determine service and interest costs for 2018 expense ranged from 1.92% to 4.08%. The ultimate spot rate used to discount cash flows beyond 30 years was 4.08% for 2018.
The use of disaggregated discount rates results in a different amount of Interest Cost compared to the traditional single weighted-average discount rate approach because of different weightings given to each subset of payments. The use of disaggregated discount rates affects the amount of Service Cost because the benefit payments associated with new service credits for active employees tend to be of longer duration than the overall benefit payments associated with the plan’s benefit obligation. As a result, the payments would be associated with longer-term spot rates on the yield curve, resulting in lower present values than the calculations using the traditional single weighted-average discount rate.
The Company uses the Mercer modified version (MRP - 2007) of the Society of Actuaries’ (SOA) RP-2014 mortality table for the pre-retirement mortality base table. The Company also uses the Mercer Industry Longevity Experience Study (MILES) table for the Chemical, Oil & Gas and Utilities industry and the Consumer Goods and Food & Drink industry for the post-retirement morality base table. In 2016, the Company chose to update the projection scale (used for both pre and post retirement) with an updated modified generational projection scale of
23
MMP-2016. The MMP-2016 scale takes into account the historical grade-down of mortality improvements and relies on the Social Security Administration improvement data through 2013 (published in 2016) and reflects long-term rate of improvement based on historical experience and the Company’s view of those trends.
To develop the expected long-term rate of return on assets assumption, the Company, in consultation with its actuary, considered the historical returns and the future expectations for returns for each asset class, as well as the target allocation of the pension portfolio. This resulted in the selection of a long-term rate of return on assets assumption of 7.68% for 2017 and 7.70% for 2016. The measurement dates of November 30, 2017 and 2016 were used to determine these rates. A 25 basis point change in the assumed rate of return for assets would increase or decrease pension expense by approximately $0.5 million. Pension plan assets are measured at fair value or at Net Asset Value ("NAV") for certain collective trusts on the measurement date.
Based on current estimates of pension asset performance, interest and discount rate assumptions, the Company anticipates it will be required to make a cash contributions to its pension plans of $6.4 million in 2018.
Factors that could impact future cash requirements and timing of any such cash equivalents are:
• | Investment returns which differ materially from the Company’s 7.7% return assumption for 2018; |
• | Significant changes in interest rates, affecting the discount rate; and |
• | Opportunities to reduce future cash requirements by accelerating contributions ahead of the minimum required schedule. Voluntary contributions in excess of minimally required amounts may prevent the need for larger contributions in the future. |
F) Income Taxes
The Company follows the liability method of accounting for income taxes. Under this method, deferred tax assets and liabilities are determined based on the difference between the financial reporting and tax bases of assets and liabilities using the enacted tax rates that will be in effect in the period the differences are expected to reverse. The Company records a valuation allowance to offset deferred tax assets, if based on the weight of all available positive and negative evidence, it is more-likely-than-not that some portion, or all, of the deferred tax assets will not be realized. Changes in tax laws and rates may affect recorded deferred tax assets and liabilities along with our effective tax rate in the future.
A high degree of judgment is required to determine the extent a valuation allowance should be provided against deferred tax assets. On a quarterly basis, the Company assesses the likelihood of realization of its deferred tax assets considering all available evidence, both positive and negative. In determining whether a valuation allowance is warranted, the Company evaluates factors such as prior earnings history, expected future earnings, carry-back and carry-forward periods and tax strategies that could potentially enhance the likelihood of the realization of a deferred tax asset. The weight given to the positive and negative evidence is commensurate with the extent to which the evidence may be objectively verified. It is generally difficult to outweigh objectively verifiable negative evidence of cumulative financial reporting losses.
As a result of historical restructuring charges and impairments over the last few years, including a significant goodwill impairment recorded in the fourth quarter of 2017, the Company entered into a worldwide three-year cumulative loss position. In addition, the U.S. jurisdiction is in a three-year cumulative loss position as a result of these charges and impairments. The Company considered sources of positive evidence, including the Company’s year over year growth in its core earnings, expected future earnings, which if realized would enable the Company to utilize its net operating loss carryforwards, and a recent history of net operating loss utilization. A cumulative loss position is considered significant negative evidence in assessing the realizability of a deferred tax asset that is difficult to overcome when determining whether a valuation allowance is required. Based on the weight of all available positive and negative evidence, the Company established a valuation allowance of $73.1 million in the fourth quarter of 2017 on its U.S. deferred tax assets. In addition, a $3.3 million valuation allowance was established on a capital loss incurred in the U.S. on the stock sale of a foreign subsidiary during the third quarter of 2017. As a valuation allowance had already been maintained on certain U.S. federal tax credit carryforwards and certain state net operating losses, the total U.S. valuation allowance as of November 30, 2017 is $77.0 million.
The Company has not provided deferred tax liabilities on certain of its non-U.S. subsidiaries’ undistributed earnings as these undistributed earnings are treated by the Company as being permanently reinvested. To the extent that foreign earnings previously treated as permanently reinvested were to be repatriated, the related U.S. income tax liability may be reduced by any foreign income taxes paid on these earnings. However, based on the Company’s policy of permanent reinvestment, it is not practicable to determine the U.S. federal income tax liability, if any, which would be payable if such earnings were not permanently reinvested. Determination of the amount of unrecognized deferred tax liabilities and related foreign withholding taxes are not practicable due to the complexities associated with this hypothetical calculation and the Company’s permanent reinvestment policy. As of November 30, 2017, the non-U.S. subsidiaries have cumulative foreign retained earnings of $59.4 million, for which no deferred tax liability has been provided.
The Company utilizes a recognition threshold and measurement attribute for the financial statement recognition and measurement of an income tax position taken or expected to be taken in an income tax return. For those benefits to be recognized, an income tax position must be more-likely-than-not to be sustained upon examination by taxing authorities. The amount recognized is measured as the largest amount of benefit that is more-likely-than-not of being realized upon ultimate settlement.
The Company’s accounting policy for interest and/or penalties related to underpayments of income taxes is to include interest and penalties in income tax expense. For 2017, the Company recognized minimal income tax expense related to interest and penalties.
On December 22, 2017, H.R.1 (the “Act”) formally known as the “Tax Cuts and Job Act” was enacted into law. The law includes significant changes to the U.S. corporate income tax system, including a Federal corporate rate reduction from 35% to 21%. The change in the corporate income tax rate will lead to a contemporaneous re-measurement of deferred tax positions, which we expect will result in a tax benefit upon enactment related to the favorable rate differential between the current Federal tax rate and the future enacted tax rate. The Company estimates the re-measurement of its deferred tax liabilities to be an income tax benefit of $3.0 million to $5.0 million that will be recorded as a component of income tax expense in the first quarter of fiscal year 2018.
24
G) Share-Based Compensation
The Company uses the fair value method of accounting to record share-based compensation based on the grant date fair value. While the Company regularly evaluates the use of share-based compensation, its practice has been to issue restricted shares or restricted share units, which are required to be expensed using the fair value method. The fair value of Restricted Share Awards ("RSA's") and Restricted Share Units ("RSU's") is determined based on the closing market price of the Company’s common shares at the date of grant. Refer to Note O to the Company’s Consolidated Financial Statements for further discussion of share-based compensation.
H) Long-Lived Assets
Long-lived assets, such as property, plant, and equipment, and finite-lived intangibles are stated at historical cost less accumulated depreciation and amortization.
Construction in process ("CIP") is not depreciated until the asset is placed in service. Refurbishment costs that extend the useful life of the asset are capitalized, whereas ordinary maintenance and repair costs are expensed as incurred. Interest expense incurred during the construction phase is capitalized as part of construction in process until the relevant projects are completed and placed into service.
Long-lived assets are reviewed for impairment whenever events or changes in circumstances indicate that the carrying amount of an asset may not be recoverable. Recoverability of assets to be held and used is measured by comparing the carrying amount of an asset to the estimated undiscounted future cash flows expected to be generated by the asset. If the carrying amount of an asset exceeds its estimated future cash flows, an impairment charge is recognized in the amount by which the carrying amount of the asset exceeds the estimated fair value of the asset. Assets to be disposed of are reported at the lower of the carrying amount or the estimated disposal price less costs to sell. Depreciation ceases for assets meeting the held-for-sale criteria.
During the fourth quarter of 2017, due to anticipated lower volumes in the paper market, the Company performed an impairment analysis of the related asset group. Based on this analysis, it was determined that the fair value of the asset group was in excess of the book value, and accordingly, the Company concluded no impairment was necessary.
During the fourth quarter of 2016, due to changes in markets and expected lower capacity utilization at the CCF facility, the Company performed an impairment analysis of this asset group. Based on this analysis, it was determined that the fair value of the asset group was less than book value, and accordingly, the Company recognized an impairment charge of $5.4 million and reduced Property, Plant, and Equipment by $5.2 million and intangible assets by $0.2 million. The CCF facility also recognized $0.3 million of impairment charges during the first quarter of 2016 related to equipment. Additionally, during the second quarter of 2017, in connect with the pending sale of the CCF operations, the Company further recognized an additional impairment charge of $12.8 million to write down the asset group to the contract sale price which approximated fair value.
During 2015, the Company recognized impairment charges of $19.4 million, of which $18.3 million was related to the Company's India business due to an approved plan to sell this non-core business. Due to the plan to sell the assets of this business, the Company recognized an impairment charge to write-down the disposal group to to its expected sales price after considering costs to sell. Additionally, the assets and liabilities of this business were considered as held for sale with these assets and liabilities included in Other Current Assets and Other Current Liabilities, respectively. The Company also recognized additional impairment charges on land at its former corporate headquarters and for other assets that were idled.
I) Goodwill and Intangible Assets
Goodwill represents the excess of the purchase price over the fair value of assets acquired and liabilities assumed in a business combination. Goodwill and other indefinite lived intangible assets are tested for impairment at least annually as of September 1, and whenever events or circumstances indicate that the carrying amount may not be recoverable. The Company performs the impairment analysis at the reporting unit level using a two-step impairment test. The first step identifies potential impairments by comparing the estimated fair value of a reporting unit with its carrying value. Fair value is typically estimated using a market approach method or a discounted cash flow analysis based on level 3 inputs in the fair value hierarchy, which requires the Company to estimate future cash flows anticipated to be generated by the reporting unit, as well as a discount rate to measure the present value of the anticipated cash flows. If the estimated fair value of a reporting unit exceeds its carrying value, goodwill is not considered impaired and the second step is not necessary. If the carrying value of a reporting unit exceeds the estimated fair value, the second step calculates the possible impairment by comparing the implied fair value of goodwill with the carrying value. If the implied fair value of goodwill is less than the carrying value, an impairment charge is recognized.
As part of its 2017 segment realignment, the Company allocated existing goodwill between two of its four reporting units based on their relative fair values. As a result, $60.6 million of goodwill was allocated to the Specialty Solutions segment and $19.6 million of goodwill was allocated to the Performance Materials segment. Prior to the segment realignment, all goodwill had been allocated to the prior Performance Chemicals segment. During the second quarter of 2017, the Company performed a goodwill impairment assessment before and after the segment realignment and determined that no impairment was indicated as a result of these assessments. During the fourth quarter of 2017, the Company performed its annual impairment test for goodwill and determined that there was no impairment as of September 1, 2017. Subsequently, the Company updated its goodwill impairment analysis as of November 30, 2017, based upon continued deterioration in certain portions of the coated paper market, the likelihood of the Company losing a significant portion of its paper business during 2018, and the bankruptcy of a large carpet customer. As a result, all of the goodwill associated with the Performance Materials segment was impaired and the Company recorded a goodwill impairment charge of $19.6 million. As of November 30, 2017, there was $66.3 million of goodwill allocated to the Specialty Solutions segment.
The impairment test for indefinite lived intangible assets consists of comparing the fair value of the asset with its carrying value. The Company estimates the fair value of its indefinite lived intangible assets using a fair value model based on a market approach method or discounted future cash flows. If the carrying amounts exceed the estimated fair value, an impairment loss would be recognized in the amount of the excess. Key inputs used in determining the fair value of the trademarks/tradenames were expected future revenues and royalty rates, and accordingly, their fair value is impacted by selling prices, which for the Company is based in part on raw material costs. As of September 1, 2017,
25
the Company performed its annual impairment test for indefinite lived intangible assets and determined that there were no impairments of its indefinite lived intangible assets. If the carrying value of these assets exceeds the estimated fair value, the asset would be considered impaired and this could result in a charge to earnings. The estimated fair value of our trademarks/tradenames decreased by approximately $8.8 million, or 19.6%, during 2017. The estimated fair value of one of the Company's tradenames was within 10% of the carrying value of $9.3 million as of November 30, 2017. A sensitivity analysis was performed by the Company on this tradename and a hypothetical 100 basis point increase in the discount rate would result in an estimated fair value for this tradename slightly below it's carrying value. Trademarks and tradenames continue to be important to the Company, and we continue to focus on long-term growth, however, if recent trends continue, the long-term assumptions relative to growth rates and profitability of the trademarks and tradenames may not be attained, which could result in an impairment to one or more of the Company's trademarks and tradenames.
Estimating future cash flows requires significant judgments and assumptions by Management including sales, operating margins, royalty rates, discount rates, and future economic conditions. To the extent that the reporting unit is unable to achieve these assumptions, impairment losses may occur.
Finite lived intangible assets, such as customer lists, patents, certain trademarks/tradenames, and licenses, are recorded at cost or estimated fair value when acquired as part of a business combination. Intangible assets with finite lived are amortized over their estimated useful lives with periods ranging from 3 to 53 years. Accumulated amortization of finite-lived intangible assets at November 30, 2017 and 2016 was $51.9 million and $47.7 million, respectively.
J) Foreign Currency Translation
The financial position and results of operations of the Company’s foreign subsidiaries are measured using the local currency as the functional currency. Assets and liabilities of operations denominated in foreign currencies are translated into U.S. dollars at exchange rates in effect at the balance sheet date, while revenues and expenses are translated at the weighted average exchange rates each month during the year. The resulting translation gains and losses on assets and liabilities are recorded in Accumulated Other Comprehensive Income (Loss), and are excluded from net income until realized through a sale or liquidation of the investment.
K) Leasing Arrangements
Operating lease expenses are recorded on a straight-line basis over the non-cancelable lease term, including any optional renewal terms that are reasonably expected to be exercised. Leasehold improvements related to these operating leases are amortized over the estimated useful life or the non-cancelable lease term, whichever is shorter.
Capital leases are recorded at the lower of fair market value or the present value of future minimum lease payments with a corresponding amount recorded in property, plant, and equipment. Current portions of capital lease payments are included in Amounts due banks and non-current capital lease obligations are included in Long-term debt in our Consolidated Balance Sheets.
Environmental Matters
The Company’s policy is to conduct its businesses with due regard for the preservation and protection of the environment. The Company devotes significant resources and Management attention to comply with environmental laws and regulations. The Company’s Consolidated Balance Sheets as of November 30, 2017 and 2016 reflects reserves for environmental remediation efforts of $1.6 million and $3.9 million, respectively.
Capital expenditures for projects related to environmental matters were $1.0 million in 2017, $1.1 million in 2016, and $0.6 million in 2015. During 2017, non-capital expenditures for environmental compliance and protection totaled $8.8 million, all of which were for recurring costs associated with managing hazardous substances and pollution abatement in ongoing operations. Similar non-capital expenditures were $6.5 million and $5.2 million in years 2016 and 2015, respectively. The Company anticipates that non-capital environmental expenditures for the next several years will be consistent with 2017 expenditure levels.
New Accounting Pronouncements
New accounting pronouncements impacting the Company are disclosed in Note A to the Company’s consolidated financial statements.
Forward Looking Statements
This Annual Report includes forward looking statements as defined by federal securities laws. Please refer to Item 1A. Risk Factors of this Report, which is incorporated herein by reference.
Item 7A. | Quantitative and Qualitative Disclosures About Market Risk | |
The Company is exposed to market risk from changes in interest rates on its long-term debt obligations. As described in Note L to the Consolidated Financial Statements, the Company’s Term Loan Facility and non-U.S. borrowings bear interest at various rates. Borrowings under the Term Loan and the Facility were $345.6 million as of November 30, 2017. There were no non-U.S. borrowings with banks as of November 30, 2017. The weighted average effective interest rate of the Company’s outstanding debt was 5.32% as of November 30, 2017. A hypothetical increase or decrease of 100 basis points would impact the Company’s interest expense on its variable rate debt by approximately $3.6 million annually.
The Company is subject to foreign currency exchange rate risk. The Company has accumulated currency translation losses of $23.1 million as of November 30, 2017, which is included in accumulated other comprehensive income (loss).
The Company does not enter into derivatives or other financial instruments for trading or speculative purposes.
26
Management’s Assessment of Internal Control Over Financial Reporting
Management of OMNOVA Solutions Inc. is responsible for establishing and maintaining adequate internal control over financial reporting, as such term is defined in Exchange Act Rules 13a-15(f). In evaluating the Company’s internal control over financial reporting, management has adopted the framework in Internal Control—Integrated Framework issued by the Committee of Sponsoring Organizations of the Treadway Commission (2013 framework).
Under the supervision and with the participation of the Company’s Management, including the Chief Executive Officer and Chief Financial Officer, the Company conducted an assessment of the effectiveness of the Company’s internal control over financial reporting. Management has determined that the Company’s internal control over financial reporting is effective as of November 30, 2017.
The effectiveness of the Company’s internal control over financial reporting as of November 30, 2017 has been audited by Ernst & Young LLP, an independent registered public accounting firm, as stated in its report, which is included herein.
27
REPORT OF INDEPENDENT REGISTERED PUBLIC ACCOUNTING FIRM
The Board of Directors and Shareholders of OMNOVA Solutions Inc.:
We have audited OMNOVA Solutions Inc.’s internal control over financial reporting as of November 30, 2017, based on criteria established in Internal Control—Integrated Framework issued by the Committee of Sponsoring Organizations of the Treadway Commission (2013 framework) (the COSO criteria). OMNOVA Solutions Inc.’s management is responsible for maintaining effective internal control over financial reporting, and for its assessment of the effectiveness of internal control over financial reporting included in the accompanying report titled “Management’s Assessment of Internal Control Over Financial Reporting.” Our responsibility is to express an opinion on the company’s internal control over financial reporting based on our audit.
We conducted our audit in accordance with the standards of the Public Company Accounting Oversight Board (United States). Those standards require that we plan and perform the audit to obtain reasonable assurance about whether effective internal control over financial reporting was maintained in all material respects. Our audit included obtaining an understanding of internal control over financial reporting, assessing the risk that a material weakness exists, testing and evaluating the design and operating effectiveness of internal control based on the assessed risk, and performing such other procedures as we considered necessary in the circumstances. We believe that our audit provides a reasonable basis for our opinion.
A company’s internal control over financial reporting is a process designed to provide reasonable assurance regarding the reliability of financial reporting and the preparation of financial statements for external purposes in accordance with generally accepted accounting principles. A company’s internal control over financial reporting includes those policies and procedures that (1) pertain to the maintenance of records that, in reasonable detail, accurately and fairly reflect the transactions and dispositions of the assets of the company; (2) provide reasonable assurance that transactions are recorded as necessary to permit preparation of financial statements in accordance with generally accepted accounting principles, and that receipts and expenditures of the company are being made only in accordance with authorizations of management and directors of the company; and (3) provide reasonable assurance regarding prevention or timely detection of unauthorized acquisition, use, or disposition of the company’s assets that could have a material effect on the financial statements.
Because of its inherent limitations, internal control over financial reporting may not prevent or detect misstatements. Also, projections of any evaluation of effectiveness to future periods are subject to the risk that controls may become inadequate because of changes in conditions, or that the degree of compliance with the policies or procedures may deteriorate.
In our opinion, OMNOVA Solutions Inc. maintained, in all material respects, effective internal control over financial reporting as of November 30, 2017, based on the COSO criteria.
We also have audited, in accordance with the standards of the Public Company Accounting Oversight Board (United States), the consolidated balance sheets of OMNOVA Solutions Inc. as of November 30, 2017 and 2016, and the related consolidated statements of operations, comprehensive income (loss), shareholders’ equity and cash flows for each of the three years in the period ended November 30, 2017 and our report dated February 2, 2018 expressed an unqualified opinion thereon.
/s/ Ernst & Young LLP | |
Akron, Ohio | |
February 2, 2018 | |
28
Item 8. | Consolidated Financial Statements and Supplementary Data | |
INDEX TO FINANCIAL STATEMENTS
Page Number | |
Consolidated Statements of Comprehensive Income (Loss) for the years ended November 30, 2017, 2016, and 2015 | |
29
REPORT OF MANAGEMENT
To the Shareholders of OMNOVA Solutions Inc.:
Management of OMNOVA Solutions Inc. is responsible for preparing the accompanying consolidated financial statements and for assuring their integrity and objectivity. These financial statements were prepared in accordance with U.S. generally accepted accounting principles and fairly represent the transactions and financial condition of the Company in all material respects. The financial statements include amounts that are based on management’s best estimates and judgments. The Company’s financial statements have been audited by Ernst & Young LLP, an independent registered public accounting firm that has been selected and approved by the Audit Committee of the Board of Directors and ratified by the shareholders. Management has made available to Ernst & Young LLP all of the Company’s financial records and related data, internal audit reports, as well as the minutes of shareholders’ and directors’ meetings.
Management of the Company has established and maintains a system of internal controls over financial reporting that is designed to provide reasonable assurance that assets are safeguarded, transactions are properly recorded and executed in accordance with management’s authorization and the books and records accurately reflect the disposition of assets. The system of internal controls includes appropriate division of responsibility. The Company maintains an internal audit function that independently assesses the effectiveness of the internal controls through a program of internal audits.
The Audit Committee is composed of directors who are not officers or employees of the Company. It meets regularly with members of management, the internal auditors and representatives of the independent registered public accounting firm to discuss the adequacy of the Company’s internal control over financial reporting, financial statements and the nature, extent and results of the audit effort. Management reviews with the Audit Committee all of the Company’s significant accounting policies and assumptions affecting the results of operations. Both the independent registered public accounting firm and internal auditors have access to the Audit Committee without the presence of management.
/s/ Anne P. Noonan |
Anne P. Noonan |
President and Chief Executive Officer |
/s/ Paul F. DeSantis |
Paul F. DeSantis |
Senior Vice President and Chief Financial Officer; Treasurer |
February 2, 2018 |
30
REPORT OF INDEPENDENT REGISTERED PUBLIC ACCOUNTING FIRM
The Board of Directors and Shareholders of OMNOVA Solutions Inc.:
We have audited the accompanying consolidated balance sheets of OMNOVA Solutions Inc. as of November 30, 2017 and 2016, and the related consolidated statements of operations, comprehensive income (loss), shareholders’ equity and cash flows for each of the three years in the period ended November 30, 2017. These financial statements are the responsibility of the Company’s management. Our responsibility is to express an opinion on these financial statements based on our audits.
We conducted our audits in accordance with the standards of the Public Company Accounting Oversight Board (United States). Those standards require that we plan and perform the audit to obtain reasonable assurance about whether the financial statements are free of material misstatement. An audit includes examining, on a test basis, evidence supporting the amounts and disclosures in the financial statements. An audit also includes assessing the accounting principles used and significant estimates made by management, as well as evaluating the overall financial statement presentation. We believe that our audits provide a reasonable basis for our opinion.
In our opinion, the financial statements referred to above present fairly, in all material respects, the consolidated financial position of OMNOVA Solutions Inc. at November 30, 2017 and 2016, and the consolidated results of its operations and its cash flows for each of the three years in the period ended November 30, 2017, in conformity with U.S. generally accepted accounting principles.
We also have audited, in accordance with the standards of the Public Company Accounting Oversight Board (United States), OMNOVA Solutions Inc.’s internal control over financial reporting as of November 30, 2017, based on criteria established in Internal Control—Integrated Framework issued by the Committee of Sponsoring Organizations of the Treadway Commission (2013 framework) and our report dated February 2, 2018 expressed an unqualified opinion thereon.
/s/ Ernst & Young LLP | |
Akron, Ohio | |
February 2, 2018 | |
31
OMNOVA SOLUTIONS INC.
Consolidated Statements of Operations
Years Ended November 30, | |||||||||||
2017 | 2016 | 2015 | |||||||||
(Dollars in millions, except per share data) | |||||||||||
Net Sales | $ | 783.1 | $ | 759.9 | $ | 838.0 | |||||
Cost of goods sold (exclusive of depreciation) | 582.3 | 556.0 | 644.1 | ||||||||
Gross profit | 200.8 | 203.9 | 193.9 | ||||||||
Other Costs and Expenses: | |||||||||||
Selling, general, and administrative | 117.1 | 118.5 | 119.3 | ||||||||
Depreciation and amortization | 27.9 | 30.6 | 34.0 | ||||||||
Asset impairments | 32.9 | 5.7 | 19.4 | ||||||||
Loss (gain) on asset sales | .4 | .3 | .2 | ||||||||
Restructuring and severance | 5.7 | 11.1 | 5.9 | ||||||||
Interest expense | 21.5 | 24.7 | 28.3 | ||||||||
Debt issuance costs write-off | — | 2.9 | .6 | ||||||||
Acquisition and integration related expense | .3 | .9 | .4 | ||||||||
Other (income) expense, net | (.9 | ) | (.7 | ) | 6.9 | ||||||
Total Other Costs and Expenses | 204.9 | 194.0 | 215.0 | ||||||||
Income (loss) from continuing operations before income taxes | (4.1 | ) | 9.9 | (21.1 | ) | ||||||
Income tax (expense) benefit | (83.7 | ) | (10.3 | ) | 2.4 | ||||||
Income (loss) from continuing operations | (87.8 | ) | (.4 | ) | (18.7 | ) | |||||
Discontinued Operations: | |||||||||||
Gain (loss) from discontinued operations (net of tax expense of $0.6 million in 2015) | — | — | .9 | ||||||||
Net income (loss) | $ | (87.8 | ) | $ | (.4 | ) | $ | (17.8 | ) | ||
Income (Loss) Per Share—Basic and Diluted | |||||||||||
Income (loss) per share—continuing operations | $ | (1.98 | ) | $ | (.01 | ) | $ | (.41 | ) | ||
Income (loss) per share—discontinued operations | — | — | .02 | ||||||||
Basic and diluted income (loss) per share | $ | (1.98 | ) | $ | (.01 | ) | $ | (.39 | ) | ||
Weighted average shares outstanding - Basic | 44.4 | 44.0 | 45.3 | ||||||||
Weighted average shares outstanding - Diluted | 44.4 | 44.0 | 45.7 | ||||||||
See notes to consolidated financial statements.
32
OMNOVA SOLUTIONS INC.
Consolidated Statements of Comprehensive Income (Loss)
Years Ended November 30, | |||||||||||
2017 | 2016 | 2015 | |||||||||
(Dollars in millions) | |||||||||||
Net (Loss) Income | $ | (87.8 | ) | $ | (.4 | ) | $ | (17.8 | ) | ||
Components of other comprehensive income (loss): | |||||||||||
Foreign currency translations: | |||||||||||
Realized net change during the period | (6.3 | ) | 5.9 | — | |||||||
Unrealized net change during the period | 8.9 | (5.5 | ) | (11.2 | ) | ||||||
Unrealized net change on intercompany foreign debt during the period | 6.2 | .4 | (12.2 | ) | |||||||
Tax effect | (2.3 | ) | (.2 | ) | 3.5 | ||||||
Foreign currency translations, net of tax | 6.5 | .6 | (19.9 | ) | |||||||
Post-retirement benefit plans: | |||||||||||
Actuarial net gain (loss): | |||||||||||
Net gain (loss) arising during period | 2.6 | (8.9 | ) | 16.5 | |||||||
Amortization of net loss included in net periodic benefit cost | 3.9 | 3.6 | 4.4 | ||||||||
Settlement charge | .4 | — | — | ||||||||
Prior service credit: | |||||||||||
Prior service credit arising during period | (.1 | ) | — | .1 | |||||||
Amortization of prior service credits included in net periodic benefit cost | — | — | (.1 | ) | |||||||
Tax effect | (.1 | ) | 2.1 | (8.1 | ) | ||||||
Post-retirement benefit plans, net of tax | 6.7 | (3.2 | ) | 12.8 | |||||||
Other comprehensive income (loss), net of tax | 13.2 | (2.6 | ) | (7.1 | ) | ||||||
Comprehensive income (loss) | $ | (74.6 | ) | $ | (3.0 | ) | $ | (24.9 | ) | ||
See notes to consolidated financial statements.
33
OMNOVA SOLUTIONS INC.
Consolidated Balance Sheets
November 30, | |||||||
2017 | 2016 | ||||||
(Dollars in millions, except per share amounts) | |||||||
ASSETS: | |||||||
Current Assets | |||||||
Cash and cash equivalents | $ | 88.0 | $ | 72.0 | |||
Accounts receivable, net | 99.0 | 87.2 | |||||
Inventories | 76.5 | 74.0 | |||||
Prepaid expenses and other | 12.5 | 18.1 | |||||
Assets held for sale - current | — | 25.7 | |||||
Total Current Assets | 276.0 | 277.0 | |||||
Property, plant, and equipment, net | 208.9 | 202.7 | |||||
Intangible assets, net | 56.0 | 56.7 | |||||
Goodwill | 66.3 | 80.2 | |||||
Deferred income taxes | .1 | 66.7 | |||||
Other non-current assets | 5.5 | 4.0 | |||||
Total Assets | $ | 612.8 | $ | 687.3 | |||
LIABILITIES AND SHAREHOLDERS’ EQUITY: | |||||||
Current Liabilities | |||||||
Amounts due banks | $ | 4.2 | $ | 4.2 | |||
Accounts payable | 78.3 | 68.7 | |||||
Accrued payroll and personal property taxes | 26.1 | 23.4 | |||||
Employee benefits | 2.9 | 4.5 | |||||
Other current liabilities | 5.1 | 7.4 | |||||
Liabilities held for sale - current | — | 5.2 | |||||
Total Current Liabilities | 116.6 | 113.4 | |||||
Long-term debt | 349.8 | 352.5 | |||||
Post-retirement benefits other than pensions | 6.3 | 6.3 | |||||
Pension liabilities | 70.5 | 82.3 | |||||
Deferred income taxes | 23.4 | 11.4 | |||||
Other non-current liabilities | 8.0 | 11.6 | |||||
Total Liabilities | 574.6 | 577.5 | |||||
Shareholders’ Equity | |||||||
Preference stock - $1.00 par value; 15 million shares authorized; none outstanding | — | — | |||||
Common stock - $0.10 par value; 135 million shares authorized, 48.3 million shares issued as of November 30, 2017 and 2016 | 4.8 | 4.8 | |||||
Additional contributed capital | 343.4 | 341.0 | |||||
Retained deficit | (159.2 | ) | (74.3 | ) | |||
Treasury stock at cost - 3.5 million and 3.2 million shares at November 30, 2017 and 2016, respectively | (25.5 | ) | (23.2 | ) | |||
Accumulated other comprehensive loss | (125.3 | ) | (138.5 | ) | |||
Total Shareholders’ Equity | 38.2 | 109.8 | |||||
Total Liabilities and Shareholders’ Equity | $ | 612.8 | $ | 687.3 | |||
See notes to consolidated financial statements.
34
OMNOVA SOLUTIONS INC.
Consolidated Statements of Shareholders’ Equity
for the Years Ended November 30, 2017, 2016, and 2015
Number of Common Shares Outstanding | Common Stock | Additional Contributed Capital | Retained Deficit | Treasury Stock | Accumulated Other Comprehensive Income (Loss) | Total Shareholders’ Equity | ||||||||||||||||||||
(Dollars and shares in millions) | ||||||||||||||||||||||||||
Balance November 30, 2014 | 47.3 | $ | 4.8 | $ | 338.5 | $ | (56.1 | ) | $ | (7.9 | ) | $ | (128.8 | ) | $ | 150.5 | ||||||||||
Net income (loss) | (17.8 | ) | (17.8 | ) | ||||||||||||||||||||||
Cumulative foreign currency translation adjustment (net of tax of $3.5 million) | (19.8 | ) | (19.8 | ) | ||||||||||||||||||||||
Defined benefit plans: | ||||||||||||||||||||||||||
Prior service credits | (.1 | ) | (.1 | ) | ||||||||||||||||||||||
Net actuarial loss (net of tax of $8.1 million) | 12.8 | 12.8 | ||||||||||||||||||||||||
Common share issuance | .1 | 1.2 | .9 | 2.1 | ||||||||||||||||||||||
Repurchase of treasury shares | (2.6 | ) | (18.6 | ) | (18.6 | ) | ||||||||||||||||||||
Balance November 30, 2015 | 44.8 | $ | 4.8 | $ | 339.7 | $ | (73.9 | ) | $ | (25.6 | ) | $ | (135.9 | ) | $ | 109.1 | ||||||||||
Net income (loss) | (.4 | ) | (.4 | ) | ||||||||||||||||||||||
Cumulative foreign currency translation adjustment (net of tax of $0.2 million) | .6 | .6 | ||||||||||||||||||||||||
Defined benefit plans: | ||||||||||||||||||||||||||
Net actuarial loss (net of tax of $2.1 million) | (3.2 | ) | (3.2 | ) | ||||||||||||||||||||||
Common share issuance | .3 | 1.3 | 2.4 | 3.7 | ||||||||||||||||||||||
Balance November 30, 2016 | 45.1 | $ | 4.8 | $ | 341.0 | $ | (74.3 | ) | $ | (23.2 | ) | $ | (138.5 | ) | $ | 109.8 | ||||||||||
Net income (loss) | (87.8 | ) | (87.8 | ) | ||||||||||||||||||||||
Cumulative foreign currency translation adjustment (net of tax of $2.3 million) | 6.5 | 6.5 | ||||||||||||||||||||||||
Adjustment for accounting change | 2.9 | 2.9 | ||||||||||||||||||||||||
Defined benefit plans: | ||||||||||||||||||||||||||
Net actuarial loss (net of tax of $0.1 million) | 6.7 | 6.7 | ||||||||||||||||||||||||
Share-based compensation | 2.5 | 2.5 | ||||||||||||||||||||||||
Common shares withheld on employee taxes | (.3 | ) | (.1 | ) | (2.3 | ) | (2.4 | ) | ||||||||||||||||||
Balance November 30, 2017 | 44.8 | $ | 4.8 | $ | 343.4 | $ | (159.2 | ) | $ | (25.5 | ) | $ | (125.3 | ) | $ | 38.2 | ||||||||||
See notes to consolidated financial statements.
35
OMNOVA SOLUTIONS INC.
Consolidated Statements of Cash Flows
Years Ended November 30, | |||||||||||
2017 | 2016 | 2015 | |||||||||
(Dollars in millions) | |||||||||||
Operating Activities: | |||||||||||
Net income (loss) | $ | (87.8 | ) | $ | (.4 | ) | $ | (17.8 | ) | ||
Adjustments to reconcile net income (loss) to net cash provided by operating activities: | |||||||||||
Loss on disposal of fixed assets | .4 | .3 | .2 | ||||||||
Depreciation and amortization | 27.9 | 30.6 | 34.0 | ||||||||
Amortization & write-off of debt issuance costs | 1.5 | 4.7 | 2.8 | ||||||||
Impairment of long-lived assets | 32.9 | 5.7 | 19.4 | ||||||||
Non-cash stock compensation expense | 1.9 | 3.5 | 2.4 | ||||||||
Provision for uncollectible accounts | 2.1 | .3 | .2 | ||||||||
Provision for obsolete inventories | .3 | — | — | ||||||||
Deferred income taxes | 77.1 | 5.2 | (5.9 | ) | |||||||
Other | — | (.8 | ) | — | |||||||
Changes in operating assets and liabilities, net of effect from acquisitions and divestitures of businesses: | |||||||||||
Accounts receivable | (13.9 | ) | 4.1 | 11.6 | |||||||
Inventories | (.1 | ) | 4.4 | 2.5 | |||||||
Other current assets | 8.0 | (10.3 | ) | 9.4 | |||||||
Current liabilities | 2.1 | 11.6 | (3.6 | ) | |||||||
Other non-current assets | (8.3 | ) | (12.9 | ) | 11.6 | ||||||
Other non-current liabilities | 11.3 | 11.1 | (18.4 | ) | |||||||
Contribution to defined benefit plan | (7.6 | ) | (6.2 | ) | (4.7 | ) | |||||
Net Cash Provided By (Used In) Operating Activities | 47.8 | 50.9 | 43.7 | ||||||||
Investing Activities: | |||||||||||
Capital expenditures | (25.1 | ) | (25.6 | ) | (24.0 | ) | |||||
Proceeds from note receivable | 3.8 | — | — | ||||||||
Acquisition and disposals of business | (7.3 | ) | 5.2 | (5.0 | ) | ||||||
Proceeds from insurance settlements | — | .1 | — | ||||||||
Net Cash Provided By (Used In) Investing Activities | (28.6 | ) | (20.3 | ) | (29.0 | ) | |||||
Financing Activities: | |||||||||||
Proceeds from borrowings | — | 346.5 | — | ||||||||
Repayment of debt obligations | (4.2 | ) | (340.9 | ) | (52.5 | ) | |||||
Short-term debt borrowings | — | — | 25.2 | ||||||||
Short-term debt payments | — | — | (26.8 | ) | |||||||
Payments for debt refinancing | — | (4.3 | ) | — | |||||||
Other equity transactions | (.2 | ) | — | — | |||||||
Purchase of treasury shares | — | — | (18.6 | ) | |||||||
Employee tax withholdings related to redemption of common shares | (2.2 | ) | (.7 | ) | — | ||||||
Net Cash Provided By (Used In) Financing Activities | (6.6 | ) | .6 | (72.7 | ) | ||||||
Effect of exchange rate changes on cash | 3.4 | 1.9 | 3.4 | ||||||||
Net Increase (Decrease) in Cash and Cash Equivalents | 16.0 | 33.1 | (54.6 | ) | |||||||
Cash and cash equivalents at beginning of period | 72.0 | 38.9 | 93.5 | ||||||||
Cash and Cash Equivalents at End of Period | $ | 88.0 | $ | 72.0 | $ | 38.9 | |||||
Supplemental Cash Flow Information: | |||||||||||
Cash paid for: | |||||||||||
Interest | $ | 19.2 | $ | 23.2 | $ | 24.9 | |||||
Income taxes | $ | 4.5 | $ | 4.2 | $ | 3.8 | |||||
See notes to consolidated financial statements.
36
NOTES TO CONSOLIDATED FINANCIAL STATEMENTS
Note A—Description of Business and Significant Accounting Policies
Description of Business – The Company is an innovator of emulsion polymers, specialty chemicals and engineered surfaces for a variety of commercial, industrial and residential end uses. The Company's products provide a variety of important functional and aesthetic benefits to hundreds of products that people use daily. The Company holds leading positions in key market categories, which have been built through innovative products, customized product solutions, strong technical expertise, well-established distribution channels, recognized brands, and long-standing customer relationships. The Company utilizes strategically-located manufacturing, technical and other facilities in North America, Europe, China, and Thailand to service the broad customer base. The Company has two business segments: Specialty Solutions, which is focused on the Company's higher growth specialty businesses, and Performance Materials, which is focused on the Company’s more mature businesses.
Specialty Solutions – The Specialty Solutions segment develops, designs, produces, and markets a broad line of specialty polymers for use in coatings, adhesives, sealants, elastomers, laminates, films, nonwovens, and oil & gas products. These products are used in numerous applications, including architectural and industrial coatings; nonwovens used in hygiene products, filtration and construction; drilling additives for oil and gas exploration and production; elastomeric modification of plastic casings and hoses used in household and industrial products and automobiles; tapes and adhesives; sports surfaces; textile finishes; commercial building refurbishment; new construction; residential cabinets; flooring; ceiling tile; furnishings; manufactured housing; health care patient and common area furniture; and a variety of industrial films applications. The segment's products enhance our customers’ products performance, including stain, rust and aging resistance; surface modification; gloss; softness or hardness; dimensional stability; high heat and pressure tolerance; and binding and barrier (e.g. moisture, oil) properties.
The Specialty Solutions segment consists of Specialty Coatings & Ingredients, Oil & Gas, and Laminates & Films. The Specialty Coatings & Ingredients business line encompasses products that have applications for specialty coatings, nonwovens (such as disposable hygiene products, engine filters, roofing mat, and scrub pads), construction, adhesives, sealants, tape, floor care, textiles, graphic arts, and various other specialty applications. Oil & Gas applications include drilling fluid additives, which provide fluid loss control and sealing to enhance wellbore integrity, as well as cement additives for gas migration and fluid loss. The Laminates & Films product line applications include kitchen and bath cabinets, wall surfacing, manufactured housing and recreational vehicle interiors, flooring, commercial and residential furniture, retail display fixtures, home furnishings, commercial appliances, and a variety of industrial film applications.
Performance Materials – The Performance Materials segment serves mature markets with a broad range of emulsion polymers based primarily on styrene butadiene (SB), styrene butadiene acrylonitrile (SBA), styrene butadiene vinyl pyridine, high styrene pigments, polyvinyl acetate, acrylic, styrene acrylic, calcium stearate, glyoxal, and bio-based chemistries. Performance Materials' custom-formulated products are tailored latexes, resins, binders, antioxidants, hollow plastic pigment, coated fabrics, and rubber reinforcing which are used in tire cord, polymer stabilization, industrial rubbers, carpet, paper, and various other applications. Its products provide a variety of functional properties to enhance the Company’s customers’ products, including greater strength, adhesion, dimensional stability, ultraviolet resistance, improved processibility, and enhanced appearance.
The Performance Materials segment encompasses performance additives, paper, carpet, and coated fabrics. This segment encompasses products that have applications in the paper, paperboard, carpet, polymer stabilization, industrial rubbers, and tire cord industries. Paper and paperboard coatings are used in magazines, catalogs, direct mail advertising, brochures, printed reports, food cartons, household, and other consumer and industrial packaging. Carpet binders are used to secure carpet fibers to carpet backing and meet stringent manufacturing, environmental, odor, flammability, and flexible installation requirements. Tire cord is used in automotive tires. The Coated Fabrics product line applications include upholstery used in refurbishment and new construction for the commercial office, hospitality, health care, retail, education and restaurant markets, marine and transportation seating, commercial and residential furniture, automotive soft tops, and automotive after-market applications.
Basis of Presentation—The consolidated financial statements have been prepared in accordance with U.S. generally accepted accounting principles and include the accounts of the Company and its wholly owned subsidiaries. All intercompany balances have been eliminated.
Use of Estimates—The preparation of the consolidated financial statements in conformity with U.S. generally accepted accounting principles requires Management to make estimates and assumptions that affect the amounts reported in the consolidated financial statements and accompanying notes. Actual results could differ from those estimates.
Revenue Recognition—The Company recognizes revenue when the following criteria are met: 1) persuasive evidence of an arrangement exists; 2) delivery has occurred; 3) an established sales price has been set with the customer; 4) collection of the sale revenue from the customer is reasonably assured; and 5) no contingencies exist. Delivery is considered to have occurred when the customer assumes the risk and rewards of ownership. The Company estimates and records provisions for customer quantity rebates and sales returns and allowances as a reduction in revenue in the same period the related revenue is recognized, based upon its historical experience.
Environmental Costs—The Company recognizes costs associated with managing hazardous substances and pollution in ongoing operations as incurred. The Company accrues for costs associated with environmental remediation when it becomes probable that a liability has been incurred and the amount is estimable.
Research and Development Expense—Research and development costs, which were $7.5 million in 2017, $8.2 million in 2016, and $8.3 million in 2015, are charged to expense as incurred.
Cash and Cash Equivalents—The Company considers all highly liquid instruments with original maturities of 90 days or less as cash equivalents.
Financial Instruments and Fair Value Measurements—Financial assets and financial liabilities carried on the balance sheet include cash and deposits at financial institutions, trade receivables and payables, capital lease obligations, other receivables and payables, borrowings, and derivative instruments. The accounting policies on recognition and measurement of these items are disclosed elsewhere in these consolidated
37
NOTES TO CONSOLIDATED FINANCIAL STATEMENTS—CONTINUED
financial statements. Fair value is the price that would be received to sell an asset or the price paid to transfer a liability in an orderly transaction between market participants at the measurement date.
The hierarchy prioritizes the inputs into three broad levels:
Level 1 inputs—Quoted market prices in active markets for identical assets or liabilities.
Level 2 inputs—Observable market based inputs or unobservable inputs that are corroborated by market data.
Level 3 inputs—Unobservable inputs that are not corroborated by market data.
Financial Risk—The Company is mainly exposed to credit, interest rate, and currency exchange rate risks which arise in the normal course of business. See Note Q for further discussion on these risks.
Derivative Instruments—The Company uses, from time to time, certain derivative instruments to mitigate its exposure to volatility in interest rates and foreign currency exchange rates. The Company recognizes derivative instruments as either an asset or a liability at their respective fair value. On the date a derivative contract is entered into, the Company may elect to designate the derivative as a fair value hedge, a cash flow hedge, or a hedge of a net investment in a foreign operation. The Company does not use fair value or net investment hedges. For a cash flow hedge, the fair value of the effective portion of the derivative is recognized as an asset or liability with a corresponding amount in Accumulated Other Comprehensive Income (Loss). Amounts in Accumulated Other Comprehensive Income (Loss) are recognized in earnings when the underlying hedged transaction affects earnings. Ineffectiveness is measured by comparing the present value of the cumulative change in the expected future cash flows of the derivative and the present value of the cumulative change in the expected future cash flows of the related instrument. Any ineffective portion of a cash flow hedge is recognized in earnings immediately. For derivative instruments not designated as hedges, the change in fair value of the derivative is recognized in earnings each reporting period.
The Company discontinues hedge accounting prospectively when it is determined that the derivative is no longer effective in offsetting changes in the cash flows of the hedged item or Management determines that designation of the derivative as a hedging instrument is no longer appropriate. Any prospective gains or losses in this scenario on the derivative would be recognized in earnings.
Foreign currency exchange contracts are used by the Company to manage risks from the change in exchange rates on cash payments between the Company's foreign subsidiaries. These forward contracts are used on a continuing basis for periods of less than one year, however these are not designated as cash flow hedges, consistent with the underlying hedged transactions. The hedging limits the impact of foreign exchange rate movements on the Company’s operating results. As of November 30, 2017, the notional amount of outstanding forward contracts was $9.8 million with a fair value of less than $0.1 million. As of November 30, 2016, the notional amount of outstanding forward contracts was $7.6 million with a fair value of less than $0.1 million.
The Company does not enter into derivative instruments for trading or speculative purposes.
Accounts Receivable Allowance—The Company’s policy is to identify customers that are considered doubtful of collection based upon the customer’s financial condition, payment history, credit rating and other relevant factors; and reserves the portion of such accounts receivable for which collection does not appear likely. The allowance for doubtful accounts was $2.9 million and $0.8 million at November 30, 2017 and 2016, respectively. The Company does not charge interest to its customers on past due accounts receivable.
Inventories—Inventories are stated at the lower of cost or market on a consistent basis. All U.S. produced inventory, which represents 52.1% of total inventory, is valued using the last-in, first-out (“LIFO”) method. The remaining portions of inventories, which are located outside of the U.S., are valued using the first-in, first-out (“FIFO”) or an average cost method. Inventory costs include direct overhead, freight, and duty.
The Company’s policy is to maintain an inventory obsolescence reserve based upon specifically identified, discontinued, or obsolete items and a percentage of quantities on hand compared with historical and forecasted usage and sales levels. A sudden and unexpected change in design trends and/or material preferences could impact the carrying value of the Company’s inventory and require the Company to increase its reserve for obsolescence. The reserve for inventory obsolescence was $6.4 million and $6.6 million at November 30, 2017 and 2016, respectively.
Notes Receivable—Notes receivable accepted by the Company are initially recognized at fair value. The Company does not subsequently adjust the fair value of these notes receivable unless it is determined that the note receivable is impaired. As with its accounts receivable allowance, the Company considers the issuer's financial condition, payment history, credit rating, and other relevant factors when assessing the collectability of the note and to reserve the portion of such note for which collection does not appear likely. Interest income is recognized as earned.
Litigation—From time to time, the Company is subject to claims, lawsuits, and proceedings related to product liability, product warranty, contract, employment, environmental, and other matters. The Company provides a reserve for such matters when it concludes a material loss is probable and the amount can be estimated. Costs related to environmental compliance are also accrued, on an undiscounted basis, when it is probable a loss has been incurred and the amount of loss can be estimated.
Deferred Financing Fees—Debt issuance costs are capitalized as a reduction to the carrying value of the liability and amortized over the life of the related debt. Deferred financing fee amortization is included in interest expense in the consolidated statements of operations.
Property, Plant, and Equipment—Property, plant, and equipment are recorded at cost. Construction in process is not depreciated until the asset is ready for its intended use and is placed into service. Refurbishment costs that extend the useful life of the asset are capitalized, whereas ordinary maintenance and repair costs are expensed as incurred. Interest expense incurred during the construction phase is capitalized as part of construction in process until the relevant projects are completed and placed into service.
Depreciation is computed principally using the straight-line method using depreciable lives as follows:
38
NOTES TO CONSOLIDATED FINANCIAL STATEMENTS—CONTINUED
Years | |
Buildings and improvements | 25 – 40 |
Machinery and equipment | 5 – 15 |
Furniture and fixtures | 3 – 10 |
Software | 3 – 5 |
Leasehold improvements are depreciated over the shorter of the lease term, including any expected renewal periods that are probable to occur, or the estimated useful life of the improvement.
All of the Company’s long-lived assets are reviewed for impairment whenever events or circumstances indicate that the carrying amount may not be recoverable. If the sum of undiscounted expected future cash flows is less than the carrying amount of the asset or asset group, an impairment loss is recognized based on the difference between the estimated fair value of the asset or asset group and its carrying value.
When specific actions to dispose of an asset or group of assets meet certain criteria, the underlying assets and liabilities are adjusted to the lesser of carrying value or fair value and, if material, they are reclassified into a “held for sale” category in the consolidated balance sheet or they are condensed and reported in other assets and liabilities.
Goodwill and Intangible Assets—Goodwill represents the excess of the purchase price over the fair value of assets acquired and liabilities assumed in a business combination. Goodwill and other indefinite lived intangible assets are tested for impairment at least annually as of September 1, and whenever events or circumstances indicate that the carrying amount may not be recoverable. The Company performs the impairment analyses at the reporting unit level. The Company identifies potential impairments by comparing the estimated fair value of a reporting unit with its carrying value. Fair value is typically estimated using a market approach method or a discounted cash flow analysis based on level 3 inputs in the fair value hierarchy, which requires the Company to estimate future cash flows anticipated to be generated by the reporting unit, as well as a discount rate to measure the present value of the anticipated cash flows. If the estimated fair value of a reporting unit exceeds its carrying value, goodwill is not considered impaired. If the carrying value of a reporting unit exceeds the estimated fair value, an impairment charge is recognized as the difference between the estimated fair value and the carrying value.
As part of its 2017 segment realignment, the Company allocated existing goodwill between two of its four reporting units based on their relative fair values. As a result, $60.6 million of goodwill was allocated to the Specialty Solutions segment and $19.6 million of goodwill was allocated to the Performance Materials segment. Prior to the segment realignment, all goodwill had been allocated to the prior Performance Chemicals segment. During the second quarter of 2017, the Company performed goodwill impairment assessments before and after the segment realignment and determined that no impairment was indicated as a result of these assessments. During the fourth quarter of 2017, the Company performed its annual impairment test for goodwill and determined that there was no impairment as of September 1, 2017. Subsequently, the Company updated its goodwill impairment analysis as of November 30, 2017, based upon continued deterioration in certain portions of the coated paper market, the likelihood of the Company losing a significant portion of its paper business during 2018, and the bankruptcy of a large carpet customer. As a result, all of the goodwill associated with the Performance Materials segment was impaired and the Company recorded a goodwill impairment charge of $19.6 million. As of November 30, 2017, there was $66.3 million of goodwill allocated to the Specialty Solutions segment.
The impairment test for indefinite lived intangible assets consists of comparing the fair value of the asset with its carrying value. The Company estimates the fair value of its indefinite lived intangible assets using a fair value model based on a market approach method or discounted future cash flows. If the carrying amounts exceed the estimated fair value, an impairment loss would be recognized in the amount of the excess. Key inputs used in determining the fair value of the trademarks/tradenames were expected future revenues and royalty rates, and accordingly, their fair value is impacted by selling prices, which for the Company is based in part on raw material costs. As of September 1, 2017, the Company performed its annual impairment test for indefinite lived intangible assets and determined that there were no impairments of its indefinite lived intangible assets. If the carrying value of these assets exceeds the estimated fair value, the asset would be considered impaired and this could result in a charge to earnings. The estimated fair value of our trademarks/tradenames decreased by approximately $8.8 million, or 19.6%, during 2017. The estimated fair value of one of the Company's tradenames was within 10% of the carrying value of $9.3 million as of November 30, 2017. A sensitivity analysis was performed by the Company on this tradename and a hypothetical 100 basis point increase in the discount rate would result in an estimated fair value for this tradename slightly below it's carrying value. Trademarks and tradenames continue to be important to the Company, and we continue to focus on long-term growth, however, if recent trends continue, the long-term assumptions relative to growth rates and profitability of the trademarks and tradenames may not be attained, which could result in an impairment to one or more of the Company's trademarks and tradenames.
Estimating future cash flows requires significant judgments and assumptions by Management including sales, operating margins, royalty rates, discount rates, and future economic conditions. To the extent that we are not able to achieve these assumptions, impairment losses may occur.
Finite lived intangible assets, such as customer lists, patents, certain trademarks/tradenames, and licenses, are recorded at cost or estimated fair value when acquired as part of a business combination. Intangible assets with finite lives are amortized over their estimated useful lives with periods ranging from 3 to 53 years. Intangible assets are evaluated for impairment whenever events or circumstances indicate that the undiscounted net cash flows to be generated by their use over their expected useful lives and eventual disposition may be less than their net carrying value. No such events or circumstances occurred in 2017, 2016 or 2015. The Company's annual impairment tests performed in 2017, 2016 and 2015 resulted in no impairment loss being recognized for these intangible assets.
Pension and Other Post-retirement Plans—The Company accounts for its pensions and other post-retirement benefits by (1) recognizing the funded status of the benefit plans in our consolidated balance sheets, (2) recognizing, as a component of other comprehensive income or net periodic benefit cost, the gains or losses and prior service costs or credits that arise during the period, (3) measuring defined benefit plan assets and obligations as of the date of the Company's fiscal year end consolidated balance sheets and (4) disclosing additional information in the notes to the consolidated financial statements about certain effects on net periodic benefit costs for the next fiscal year that arise from delayed recognition of prior service costs or credits and transition assets or obligations.
39
NOTES TO CONSOLIDATED FINANCIAL STATEMENTS—CONTINUED
Asset Retirement Obligations—The fair value of an asset retirement obligation is recorded when the Company has an unconditional legal obligation to perform an asset retirement activity and the amount of the obligation can be reasonably estimated. In assessing asset retirement obligations, the Company reviews the expected settlement dates or a range of estimated settlement dates, the expected method of settlement of the obligation, and other factors pertinent to the obligations. Asset retirement obligations are not material as of November 30, 2017 and 2016.
Foreign Currency Translation—The financial position and results of operations of the Company’s foreign subsidiaries are measured using the local currency as the functional currency. Assets and liabilities denominated in foreign currencies are translated into U.S. dollars at exchange rates in effect at the balance sheet date, while sales and expenses are translated at the average exchange rates each month during the year. The resulting translation gains and losses on assets and liabilities are recorded in Accumulated Other Comprehensive Income (Loss), and are excluded from net income until realized through sale or liquidation of foreign subsidiaries.
Income Taxes - The Company follows the liability method of accounting for income taxes. Under this method, deferred tax assets and liabilities are determined based on the difference between the financial reporting and tax bases of assets and liabilities using the enacted tax rates that will be in effect in the period in which the differences are expected to reverse. The Company records a valuation allowance to offset deferred tax assets, if based on the weight of all available positive and negative evidence, it is more-likely-than-not that some portion, or all, of the deferred tax assets will not be realized. Changes in tax laws and rates may affect recorded deferred tax assets and liabilities along with our effective tax rate in the future.
A high degree of judgment is required to determine the extent a valuation allowance should be provided against deferred tax assets. On a quarterly basis, the Company assesses the likelihood of realization of its deferred tax assets considering all available evidence, both positive and negative. In determining whether a valuation allowance is warranted, the Company evaluates factors such as prior earnings history, expected future earnings, carry-back and carry-forward periods and tax strategies that could potentially enhance the likelihood of the realization of a deferred tax asset. The weight given to the positive and negative evidence is commensurate with the extent to which the evidence may be objectively verified. It is generally difficult to outweigh objectively verifiable negative evidence of cumulative financial reporting losses.
As a result of historical restructuring charges and impairments over the last few years, including a significant goodwill impairment recorded in the fourth quarter of 2017, the Company entered into a worldwide three-year cumulative loss position. In addition, the U.S. jurisdiction is in a three-year cumulative loss position as a result of these charges and impairments. The Company considered sources of positive evidence, including the Company’s year over year growth in its core earnings, expected future earnings, which if realized would enable the Company to utilize its net operating loss carryforwards, and a recent history of net operating loss utilization. A cumulative loss position is considered significant negative evidence in assessing the realizability of a deferred tax asset that is difficult to overcome when determining whether a valuation allowance is required. Based on the weight of all available positive and negative evidence, the Company established a valuation allowance of $73.1 million in the fourth quarter of 2017 on its U.S. deferred tax assets. In addition, a $3.3 million valuation allowance was established on a capital loss incurred in the U.S. on the stock sale of a foreign subsidiary during the third quarter of 2017. As a valuation allowance had already been maintained on certain U.S. federal tax credit carryforwards and certain state net operating losses, the total U.S. valuation allowance as of November 30, 2017 is $77.0 million.
The Company has not provided deferred tax liabilities on certain of its non-U.S. subsidiaries’ undistributed earnings as these undistributed earnings are treated by the Company as being permanently reinvested. To the extent that foreign earnings previously treated as permanently reinvested were to be repatriated, the related U.S. income tax liability may be reduced by any foreign income taxes paid on these earnings. However, based on the Company’s policy of permanent reinvestment, it is not practicable to determine the U.S. federal income tax liability, if any, which would be payable if such earnings were not permanently reinvested. Determination of the amount of unrecognized deferred tax liabilities and related foreign withholding taxes are not practicable due to the complexities associated with this hypothetical calculation and the Company’s permanent reinvestment policy. As of November 30, 2017, the non-U.S. subsidiaries have cumulative foreign retained earnings of $59.4 million, for which no deferred tax liability has been provided. See subsequent event Note T for additional information related to future legislative changes related to income tax.
The Company utilizes a recognition threshold and measurement attribute for the financial statement recognition and measurement of a tax position taken or expected to be taken in a tax return. For those benefits to be recognized, a tax position must be more-likely-than-not to be sustained upon examination by taxing authorities. The amount recognized is measured as the largest amount of benefit that is more-likely-than-not of being realized upon ultimate settlement.
The Company’s accounting policy for interest and/or penalties related to underpayments of income taxes is to include interest and penalties in tax expenses.
Operating Leases—Lease expense is recognized on a straight-line basis over the non-cancelable lease term, including any optional renewal terms that are reasonably expected to be exercised. Leasehold improvements related to these operating leases are amortized over the estimated useful life, or the non-cancelable lease term, whichever is shorter.
Capital Leases—Capital leases are recorded at the lower of fair market value or the present value of future minimum lease payments with a corresponding amount recognized in property, plant, and equipment. Depreciation on assets under capital leases is included in depreciation expense. Current portions of capital lease payments are included in Amounts due banks and non-current capital lease obligations are included in Long-term debt in our Consolidated Balance Sheets. The Company has two leased assets, land and the building for its corporate headquarters, which are classified as capital leases with a present value of minimum lease payments of $16.2 million as of November 30, 2017. The lease for the land commenced in November 2013 and expires in 19 years at which time the Company can acquire the land for a nominal amount. The lease for the building commenced in November 2014 and expires in 21 years at which time the Company will receive the building at no cost.
Share-Based Compensation—Share-based compensation is measured at the grant date, based on the calculated fair value of the award, and is recognized as an expense over the requisite service period (generally the vesting period). Share-based compensation expense includes expense related to restricted stock and options issued, as well as share units deferred into the Company’s Deferred Compensation Plan for Non-Employee Directors and performance shares awarded under the Company’s Long-Term Incentive Plan. The Company did not capitalize any expense related to share-based compensation payments and recognizes share-based compensation expense within Selling, General, and Administrative expense.
40
NOTES TO CONSOLIDATED FINANCIAL STATEMENTS—CONTINUED
Reclassifications and immaterial error correction - Certain amounts in the prior years have been reclassified to conform to current year presentation. During the quarter ended August 31, 2017, we identified and corrected an immaterial presentation error in the Consolidated Statements of Comprehensive Income and related Note F - Comprehensive Income (Loss) footnote disclosure relating to the prior year. The Company previously presented a $5.9 million favorable realized net change during the prior year as an unfavorable realized net change within the Consolidated Statements of Comprehensive Income. In order to correct this prior period presentation error, the Company has presented the $5.9 million as a favorable realized net change within the Consolidated Statements of Comprehensive Income with an offsetting adjustment to the amount reported as unrealized net change. which now totals to a $5.5 million unfavorable net change. The total of foreign currency translation, net of tax, was not impacted and no other line items within any of the other consolidated financial statements and footnotes were impacted.
In late May 2017, Management approved a plan for the Company to sell its China coated fabrics manufacturing operations. As a result, asset and liabilities of this disposal group were classified as held-for-sale on our Consolidated Balance Sheets as of November 30, 2016.
Accounting Standards Adopted in 2017
In January 2017, the FASB issued ASU 2017-04, Simplifying the Test for Goodwill Impairment, which is intended to simplify the current test for goodwill impairment by eliminating the second step in which the implied value of a reporting unit is calculated when the carrying value of the reporting unit exceeds its fair value. Under ASU 2017-04, goodwill impairment should be recognized for the amount by which a reporting unit’s carrying value exceeds its fair value, not to exceed the carrying amount of goodwill. ASU 2017-04 must be applied prospectively and is effective for any annual or interim goodwill impairment test in fiscal years beginning after December 15, 2019. The Company concluded that ASU 2017-04 is preferable to the current guidance due to efficiency, since ASU 2017-04 eliminates the requirement to determine the fair value of individual assets and liabilities of a reporting unit to measure goodwill impairment. Early adoption is permitted and during the fourth quarter of 2017, the Company adopted ASU 2017-04. Refer to the Goodwill and Other Intangibles footnote for additional details.
In March 2016, the Financial Accounting Standards Board ("FASB") issued Accounting Standards Update ("ASU") 2016-09, Improvements to Employee Share-Based Payment Accounting, which amends existing guidance related to accounting for employee share-based payments affecting the income tax consequences of awards, classification of awards as equity or liabilities, and classification on the statement of cash flows. This guidance is effective for fiscal years, and interim periods within those years, beginning after December 15, 2016, and early adoption was permitted. ASU 2016-09 was adopted by the Company effective December 1, 2016.
This guidance requires all excess tax benefits and tax deficiencies to be recognized as income tax expense or benefit in the income statement and also requires a policy election to either estimate the number of awards that are expected to vest or account for forfeitures when they occur. The Company changed its policy to recognize the impact of forfeitures when they actually occur, and recognized a cumulative effect adjustment to retained earnings on a modified retrospective basis as of December 1, 2016. Also, this guidance requires cash paid by an employer when directly withholding shares for tax withholding purposes to be classified in the Consolidated Statement of Cash Flows as a financing activity, which differs from the Company's previous method of classification of such cash payments as an operating activity. The Company applied this provision retrospectively, and beginning in the first quarter of 2016, reclassified amounts from operating activities to financing activities. This guidance also requires the tax effects of exercised or vested awards to be treated as discrete items in the reporting period in which they occur, which was applied prospectively by the Company, beginning December 1, 2016. Lastly, the guidance requires that excess tax benefits should be classified along with other income tax cash flows as an operating activity on the statement of cash flows, which differs from the Company’s historical classification of excess tax benefits as cash inflows from financing activities. The Company elected to apply this provision using the prospective transition method.
In April 2015, the FASB issued ASU 2015-03, Simplifying the Presentation of Debt Issuance Costs, which expands upon the guidance on the presentation of debt issuance costs. The guidance requires that debt issuance costs related to a recognized debt liability be presented in the balance sheet as a direct deduction from the carrying amount of the debt liability, consistent with debt discounts. This guidance requires retrospective application and is effective for fiscal years beginning after December 15, 2015 and for interim periods within those fiscal years, with early adoption permitted. ASU 2015-03 was adopted by the Company effective December 1, 2016 resulting in debt issuance costs, which were previously presented as debt issuance costs, being presented as a direct deduction to the Company's long-term debt, less current portion in the Consolidated Balance Sheet. Refer to the Debt footnote for additional details.
Accounting Standards Not Yet Adopted
In March 2017, the FASB issued ASU 2017-07, Improving the Presentation of Net Periodic Pension Cost and Net Periodic Postretirement Benefit Cost, which require that an employer report the service cost component in the same line item or items as other compensation costs arising from services rendered by the pertinent employees during the period. The amendments in this Update also allow only the service cost component to be eligible for capitalization when applicable. ASU 2017-07 must be applied retrospectively for the presentation of the service cost component and the other components of net periodic pension cost and net periodic postretirement benefit cost in the income statement and prospectively, on and after the effective date, for the capitalization of the service cost component of net periodic pension cost and net periodic post-retirement benefit in assets. This guidance is effective for annual periods, including interim periods within those annual periods, beginning after December 15, 2017 with early adoption permitted as of the beginning of the annual reporting period in which the ASU was issued. The Company is currently evaluating the potential impact on its consolidated financial statements and related disclosures.
In January 2017, the FASB issued ASU No. 2017-01, Clarifying the Definition of a Business, which clarified existing guidance on the definition of a business with the objective of adding guidance to assist entities with evaluating whether transactions should be accounted for as acquisitions (or disposals) of assets or businesses. The guidance is effective for annual periods, including interim periods within those annual periods, beginning after December 15, 2017 with early adoption permitted as of the beginning of the annual reporting period in which the ASU was issued. The Company does not expect the adoption of this guidance to have a material impact on its consolidated results of operations, financial position, or cash flows.
In October 2016, the FASB issued ASU No. 2016-16, Intra-Entity Transfers of Assets Other Than Inventory, which amends existing guidance related to the recognition of current and deferred income taxes for intra-entity asset transfers. Under the new guidance, current and deferred income tax consequences of an intra-entity asset transfer, other than an intra-entity asset transfer of inventory, are now recognized when the transfer occurs. The guidance is effective for annual periods, including interim periods within those annual periods, beginning after
41
NOTES TO CONSOLIDATED FINANCIAL STATEMENTS—CONTINUED
December 15, 2017 with early adoption permitted as of the beginning of the annual reporting period in which the ASU was issued. The Company is currently evaluating the potential impact on its consolidated financial statements and related disclosures.
In August 2016, the FASB issued ASU 2016-15, Statement of Cash Flows - Classification of Certain Cash Receipts and Cash Payments, which clarifies existing guidance related to accounting for cash receipts and cash payments and classification on the statement of cash flows. This guidance is effective for fiscal years, and interim periods within those years, beginning after December 15, 2017, and early adoption is permitted. The adoption of this ASU will not have an impact on the Company's financial position, results of operations, or cash flows.
In June 2016, the FASB issued ASU 2016-13, Measurement of Credit Losses on Financial Instruments, which requires financial assets measured at amortized cost basis to be presented at the net amount expected to be collected. The income statement reflects the measurement of credit losses for newly recognized financial assets, as well as the expected increases or decrease of expected credit losses that have taken place during the period. This ASU changes the impairment model for most financial assets and certain other instruments, which will result in earlier recognition of allowances for losses. The guidance requires a modified-retrospective approach, through a cumulative-effect adjustment to retained earnings as of the beginning of the first reporting period in which the guidance is effective. ASU 2016-13 is effective for fiscal years beginning after December 15, 2019 including interim periods within those fiscal years. Early adoption is permitted for fiscal years beginning after December 15, 2018, including interim periods within those fiscal years. The Company does not expect the adoption of this guidance to have a material impact on its consolidated results of operations, financial position or cash flows.
In February 2016, the FASB issued ASU 2016-02, Leases (Topic 842), which requires a lessee to recognize on the balance sheet the assets and liabilities for the rights and obligations created by those leases with a lease term of more than twelve months. Leases will continue to be classified as either financing or operating, with classification affecting the recognition, measurement and presentation of expenses and cash flows arising from a lease. The new guidance is effective for the Company’s fiscal year that begins on December 1, 2019 and requires a modified retrospective approach to the adoption for lessees related to capital and operating leases existing at, or entered into after, the earliest comparative period presented in the financial statements, with certain practical expedients available. Early adoption is permitted. The Company is currently evaluating the potential impact on its consolidated financial statements and related disclosures.
In January 2016, the FASB issued ASU 2016-01, Financial Instruments – Overall (Subtopic 825-10: Recognition and Measurement of Financial Assets and Financial Liabilities), which revised entities’ accounting related to: (i) the classification and measurement of investments in equity securities; and (ii) the presentation of certain fair value changes for financial liabilities measured at fair value. The ASU also amends certain disclosure requirements associated with the fair value of financial instruments. The new guidance is effective for the Company’s fiscal year that begins on December 1, 2018 and requires a modified retrospective approach to adoption. Early adoption is only permitted for the provision related to instrument-specific credit risk. The Company is currently evaluating the potential impact on its consolidated financial statements and related disclosures.
In May 2014, the FASB issued ASU 2014-09, Revenue from Contracts with Customers, which clarifies existing accounting literature relating to how and when a company recognizes revenue. Under ASU 2014-09, a company will recognize revenue when it transfers promised goods or services to customers in an amount that reflects the consideration to which the company expects to be entitled in exchange for those goods and services. This guidance is effective for annual reporting periods beginning after December 15, 2017, including interim reporting periods within that reporting period. The Company continues to assess the potential impact of the standard and has evaluated a sampling of significant contracts. The Company has not yet reached a conclusion as to how the adoption of the standard will impact the Company's financial position, results of operations or cash flows.
Note B—Restructuring and Severance
The following table is a summary of restructuring and severance charges for the years ended 2017, 2016, and 2015:
November 30, | |||||||||||
2017 | 2016 | 2015 | |||||||||
(Dollars in Millions) | |||||||||||
Severance Expense: | |||||||||||
Specialty Solutions | $ | .6 | $ | .2 | $ | 2.6 | |||||
Performance Materials | 1.7 | 3.3 | 3.2 | ||||||||
Corporate | 2.9 | 4.9 | .1 | ||||||||
Total Severance | $ | 5.2 | $ | 8.4 | $ | 5.9 | |||||
Facility Closure Costs: | |||||||||||
Specialty Solutions | $ | — | $ | .1 | $ | — | |||||
Performance Materials | .5 | 2.6 | — | ||||||||
Total Facility Closure Costs | $ | .5 | $ | 2.7 | $ | — | |||||
Total Restructuring and Severance | $ | 5.7 | $ | 11.1 | $ | 5.9 | |||||
2017 Restructuring Plans
Restructuring and severance activities initiated in 2017 include the One OMNOVA initiative announced during the first quarter of 2017. The One OMNOVA initiative is focused on improving functional excellence in marketing, sales, operations, supply chain and technology, as well as various corporate functions. The plan is designed to reduce complexity and drive consistency across the global enterprise through a standardized, integrated business system. The Company expects the One OMNOVA initiative to continue through 2018. Total estimated costs for this initiative are expected to be between $5.0 million and 7.0 million. For this initiative, in 2017 the Company incurred restructuring and severance costs of $3.5 million, all of which was recognized as a component of restructuring and severance expense within the consolidated statement of operations. The remaining expected costs for this initiative will be incurred in 2018. As of November 30, 2017, $3.0 million was paid and the remainder is expected to be paid during 2018.
42
NOTES TO CONSOLIDATED FINANCIAL STATEMENTS—CONTINUED
2016 Restructuring Plans
Restructuring and severance activities initiated in 2016 included continued cost reduction and efficiency improvement actions, as well as a change in the Company’s CEO. For these activities, the Company incurred restructuring and severance costs of $8.7 million, of which $5.5 million was recognized in 2016 and $2.1 million was recognized in 2017. As of November 30, 2017, $7.5 million was paid and the remaining $1.2 million is expected to be paid by the end of 2018.
2015 Restructuring Plans
Restructuring and severance activities initiated in 2015 relate to the transfer of production from one U.S. manufacturing location to another U.S. manufacturing location, and other efficiency improvement actions focused on the Company’s cost reduction and specialization strategy. For the transfer of production plan, the Company incurred severance costs of $1.5 million, of which $0.8 million was recognized in 2015 and $0.7 million was recognized in 2016. All payments related to this plan were completed by the end of 2016. For the other efficiency improvement action plans, the Company incurred severance and facility closure costs of $9.8 million, of which $5.0 million was recognized in 2015, $4.7 million in 2016, and $0.1 million in 2017. All payments were substantially completed by the end of 2016.
The following table summarizes the Company’s liabilities related to restructuring and severance activities:
Beginning Balance | Provision | Payments | Ending Balance November 30, | ||||||||||||
(Dollars in millions) | |||||||||||||||
2015 | $ | — | $ | 5.9 | $ | 3.6 | $ | 2.3 | |||||||
2016 | $ | 2.3 | $ | 11.1 | $ | 9.2 | $ | 4.2 | |||||||
2017 | $ | 4.2 | $ | 5.7 | $ | 7.7 | $ | 2.2 | |||||||
Note C — Asset Impairments and Sales
China Coated Fabrics
During 2016, due to changes in markets and expected lower capacity utilization at the China Coated Fabrics manufacturing facility ("CCF"), the Company performed an impairment analysis of this asset group. Based on this analysis, it was determined that the fair value of the asset group was less than book value, and accordingly, the Company recognized an impairment charge of $5.4 million within the Performance Materials segment and reduced Property, Plant, and Equipment by $5.2 million and intangible assets by $0.2 million. Fair value was determined based on valuation techniques and third party appraisals, which represent level 3 inputs in the fair value hierarchy. The CCF manufacturing facility also recognized $0.3 million of impairment charges during 2016 related to idled equipment.
During 2017, Management approved a plan for the Company to sell its CCF manufacturing operations. As a result, during the second quarter of 2017, the Company determined that the disposal group was impaired and recognized an additional impairment charge of $12.9 million, of which $11.8 million was included in the results of the Performance Materials segment and $1.1 million was included in Corporate expenses. Included in the calculation of the impairment charge were deferred foreign currency translation gains of $6.3 million, which were previously recorded in accumulated other comprehensive income ("AOCI"). Accordingly the assets and liabilities of the CCF manufacturing facility were reclassified to held for sale in the consolidated balance sheet as of November 30, 2016. The Company completed the planned sale in July 2017, and recognized an additional loss on the sale of $0.4 million, for a total loss of $13.3 million. The Company continues to manufacture and sell coated fabric products in the Asian region. Management considered other qualitative and quantitative factors and concluded this sale did not represent a strategic shift in business.
India Manufacturing Operations
During 2015, the Company recognized $19.4 million of asset impairments within the Performance Materials segment, which included an impairment on the Company's non-core India operations of $18.3 million in connection with its pending sale in February 2016, an impairment on land at the Company's former headquarters location of $0.6 million, and other asset impairments of $0.5 million on assets that were idled during 2015. In November 2015, the Company's management committed to a plan to sell the assets of its India operations. The Company recognized an impairment charge to write-down the net assets of this disposal group to its expected sales price after considering costs to sell. The Company utilized unobservable inputs in determining the magnitude of the non-recurring impairment representing level 3 inputs in the fair value hierarchy.
During 2016, the Company completed the sale of its India operations (through the sale of 100% of the equity outstanding of the Company's OMNOVA Solutions India Private Limited Subsidiary) to Apcotex Inc., a private industrial products manufacturer headquartered in India. The sale included all assets and liabilities, contracts and other assets associated with the Company’s production of rubber related products. Under terms of the sale, the Company received $5.2 million in cash. The sale price was equal to the net book value of these assets and liabilities and therefore, there was no gain or loss recognized on this transaction. The Company continues to sell certain of its products within India through its other subsidiaries in the ordinary course of business.
Note D—Other (Income) Expense
Included in other (income) expense in 2017 were bank fees of $0.8 million and miscellaneous non-income taxes of $0.7 million, which were offset by a reduction to the environmental remediation liabilities of $2.0 million and sales of scrap material of $0.4 million.
43
NOTES TO CONSOLIDATED FINANCIAL STATEMENTS—CONTINUED
Included in other (income) expense in 2016 were environmental remediation costs of $0.3 million, and other expenses of $0.4 million which were offset by sales of scrap material of $1.0 million and a reversal of operational development charges of $0.4 million.
Included in other (income) expense in 2015 were operational development costs of $5.4 million, environmental remediation costs of $3.0 million and shareholder activist costs of $1.9 million, which were partially offset by gains on foreign currency transactions of $1.5 million, sales of scrap material of $1.1 million, and net other income of $0.8 million.
Note E—Income Taxes
The components of income (loss) from continuing operations before income taxes are as follows:
Years Ended November 30, | |||||||||||
2017 | 2016 | 2015 | |||||||||
(Dollars in millions) | |||||||||||
Income (Loss) from Continuing Operations Before Income Taxes: | |||||||||||
U.S. | $ | (9.1 | ) | $ | 1.5 | $ | (11.2 | ) | |||
Foreign | 5.0 | 8.4 | (9.9 | ) | |||||||
$ | (4.1 | ) | $ | 9.9 | $ | (21.1 | ) | ||||
Years Ended November 30, | |||||||||||
2017 | 2016 | 2015 | |||||||||
(Dollars in millions) | |||||||||||
Income Tax (Expense) Benefit: | |||||||||||
Current: | |||||||||||
U.S. Federal | $ | (.6 | ) | $ | (.6 | ) | $ | (.6 | ) | ||
U.S. State and Local | (.1 | ) | (.2 | ) | (.2 | ) | |||||
Foreign | (5.9 | ) | (4.3 | ) | (2.7 | ) | |||||
(6.6 | ) | (5.1 | ) | (3.5 | ) | ||||||
Deferred: | |||||||||||
U.S. Federal | (72.6 | ) | (2.4 | ) | 4.0 | ||||||
U.S. State and Local | (7.8 | ) | (.5 | ) | (.2 | ) | |||||
Foreign | 3.3 | (2.3 | ) | 2.1 | |||||||
(77.1 | ) | (5.2 | ) | 5.9 | |||||||
Income Tax (Expense) Benefit | $ | (83.7 | ) | $ | (10.3 | ) | $ | 2.4 | |||
44
NOTES TO CONSOLIDATED FINANCIAL STATEMENTS—CONTINUED
Years Ended November 30, | |||||||||||
2017 | 2016 | 2015 | |||||||||
(Dollars in millions) | |||||||||||
Effective Income Tax Rate: | |||||||||||
Tax at federal statutory rate | $ | 1.4 | $ | (3.5 | ) | $ | 7.4 | ||||
Valuation allowance | (79.9 | ) | (1.8 | ) | (.6 | ) | |||||
Foreign taxes at different rates | 1.3 | 1.0 | 3.1 | ||||||||
U.S. tax on foreign dividends | (.4 | ) | (2.2 | ) | — | ||||||
Non-deductible impairment | (6.9 | ) | — | (6.2 | ) | ||||||
Executive stock compensation | .3 | — | (.2 | ) | |||||||
Other permanent items | (.1 | ) | .1 | — | |||||||
Uncertain tax positions | — | (.1 | ) | .9 | |||||||
State and local taxes | (.7 | ) | (.7 | ) | (.4 | ) | |||||
Foreign withholding tax | (1.0 | ) | (.6 | ) | ` | (.7 | ) | ||||
Foreign non-deductible interest | (.7 | ) | (.7 | ) | (.9 | ) | |||||
French business tax | (.5 | ) | (.5 | ) | (.4 | ) | |||||
French legislation change | 3.4 | (1.6 | ) | — | |||||||
Non-taxable research and development | .2 | .2 | .2 | ||||||||
Tax audit settlements | (.1 | ) | — | — | |||||||
Other, net | — | .1 | .2 | ||||||||
Effective Income Tax Rate | $ | (83.7 | ) | $ | (10.3 | ) | $ | 2.4 | |||
As of November 30, 2017, the Company’s income tax expense was $83.7 million on global pretax loss of $4.1 million. The 2017 income tax expense was higher than the statutory income tax rate of 35% primarily as a result of a $79.9 million income tax expense recorded for valuation allowances on deferred tax assets. Of that amount, $75.7 million income tax expense was recorded in the U.S. during the fourth quarter of 2017, and $3.3 million income tax expense related to capital loss was recorded in the U.S. during the third quarter of 2017. These valuation allowances are discussed in more detail in Note A - Description of Business and Significant Accounting Policies under the heading "Income Taxes". Additionally, a $19.6 million goodwill impairment was recorded in the fourth quarter of 2017 for which no tax benefit was realized as the goodwill impairment is permanently non-deductible for tax purposes. The tax impact of the goodwill impairment is $6.9 million. These expenses were partially offset by a 3.4 million income tax benefit from French legislative changes during the year.
Deferred Income Taxes
November 30, | |||||||||||||||
2017 | 2016 | ||||||||||||||
(Dollars in millions) | |||||||||||||||
Assets | Liabilities | Assets | Liabilities | ||||||||||||
Accrued estimated costs | $ | 9.7 | $ | — | $ | 10.6 | $ | — | |||||||
Goodwill and intangible assets | — | 17.0 | — | 21.6 | |||||||||||
Depreciation | — | 16.6 | — | 12.0 | |||||||||||
Pension | 24.9 | — | 30.2 | — | |||||||||||
NOLC’s and other carryforwards | 51.5 | — | 51.7 | — | |||||||||||
Post-retirement employee benefits | 3.9 | — | 4.3 | — | |||||||||||
Other | 9.1 | — | 6.2 | — | |||||||||||
Valuation allowance | (88.8 | ) | — | (14.1 | ) | — | |||||||||
Deferred Income Taxes | $ | 10.3 | $ | 33.6 | $ | 88.9 | $ | 33.6 | |||||||
A reconciliation of the beginning and ending deferred tax valuation allowance is as follows:
45
NOTES TO CONSOLIDATED FINANCIAL STATEMENTS—CONTINUED
Years Ended November 30, | |||||||||||
2017 | 2016 | 2015 | |||||||||
(Dollars in millions) | |||||||||||
Beginning balance December 1……………………………………………………… | $ | 14.1 | $ | 10.2 | $ | 11.1 | |||||
Additions (Reductions) Charged to Expense……………………………………. | 79.9 | 4.0 | 2.1 | ||||||||
Additions (Reductions) Charged to Other Accounts…………………………… | (2.6 | ) | — | — | |||||||
Reduction due to Entity Disposition…………………………………………….. | (3.9 | ) | — | (1.8 | ) | ||||||
Foreign Currency Effects | 1.3 | (0.1 | ) | (1.2 | ) | ||||||
Ending balance November 30………………………………………………………………… | $ | 88.8 | $ | 14.1 | $ | 10.2 | |||||
At November 30, 2017, the Company has $91.1 million of U.S. federal net operating loss carryforwards (NOLCs), $8.6 million of U.S. federal capital loss carryforwards, $0.1 million of foreign tax credit carryforwards, $0.9 million of AMT credit carryforwards, and $86.8 million of state net operating loss carryforwards. As a result, cash tax payments in the U.S. are expected to be minimal for the foreseeable future. The Company utilized approximately $7.8 million, $15.6 million and $7.8 million of federal net operating loss carryforward for the years ended November 2017, 2016 and 2015, respectively. The U.S. federal net operating loss carryforward increased in 2017 by $7.0 million due to the recognition of windfall tax benefits as required under ASU 2016-09 which was adopted effective December 1, 2016. During 2017, the Company generated an $8.6 million U.S. federal capital loss as result of a stock sale of a foreign subsidiary. The majority of the federal, state and local NOLCs will expire in tax years 2023 through 2034 while the foreign tax credit carryforwards will expire in the tax years 2020 through 2022, and the capital loss will expire in tax year 2022.
As of November 30, 2017, the Company had approximately $45.0 million of foreign NOLC's of which $34.1 million have an indefinite carryforward period. The Company has recognized a valuation allowance against the $34.1 million foreign NOLC's which have an indefinite carryforward period as the Company does not anticipate utilizing these carryforwards. Cash paid for income taxes in 2017, 2016, and 2015 was $4.5 million, $4.2 million, and $3.8 million, respectively, and related primarily to foreign income taxes.
The total unrecognized tax benefits are $0.3 million at November 30, 2017 and 2016. There were minimal interest and penalties recognized in the consolidated balance sheets as of November 30, 2017 and 2016, respectively. Of the total $0.3 million of unrecognized tax benefits at November 30, 2017, $0.2 million would, if recognized, impact the Company's effective tax rate. The amount of unrecognized tax benefits which impacted the Company's effective tax rate were $0.1 million and $0.3 million in 2016 and 2015. There was no impact to the effective tax rate in 2017.
A reconciliation of the beginning and ending amounts of unrecognized tax benefits, excluding interest and penalties is as follows:
Years Ended November 30, | |||||||||||
2017 | 2016 | 2015 | |||||||||
(Dollars in millions) | |||||||||||
Beginning balance December 1 | $ | .3 | $ | — | $ | .6 | |||||
Increase based on tax positions related to current year | — | .3 | — | ||||||||
Reduction due to lapse of statute of limitations | — | — | (.6 | ) | |||||||
Ending balance November 30 | $ | .3 | $ | .3 | $ | — | |||||
Interest and penalties related to unrecognized tax benefits are recognized as a component of income tax expense. The Company recognized minimal income tax expense related to interest and penalties in 2017 and 2016. The Company recognized a $0.4 million income tax benefit related to interest and penalties in 2015.
With limited exceptions, the Company is no longer open to audit under the statutes of limitation by the Internal Revenue Service and various states and foreign taxing jurisdictions for years prior to 2012.
Note F—Accumulated Other Comprehensive Income (Loss)
The components of Accumulated Other Comprehensive Income (Loss) are as follows:
November 30, | |||||||
2017 | 2016 | ||||||
(Dollars in millions) | |||||||
Foreign currency translation adjustments | $ | (23.1 | ) | $ | (29.6 | ) | |
Employee benefit plans | (102.2 | ) | (108.9 | ) | |||
Accumulated other comprehensive income (loss) | $ | (125.3 | ) | $ | (138.5 | ) | |
The following table provides additional details of the amounts recognized into net earnings from accumulated other comprehensive income (loss):
46
NOTES TO CONSOLIDATED FINANCIAL STATEMENTS—CONTINUED
Foreign Currency Items | Defined Benefit Plans | Accumulated Other Comprehensive Income (Loss) | |||||||||
(Dollars in millions) | |||||||||||
Balance December 1, 2014 | $ | (10.3 | ) | $ | (118.5 | ) | $ | (128.8 | ) | ||
Other comprehensive income (loss) before reclassifications | (19.9 | ) | 10.1 | (9.8 | ) | ||||||
Amounts reclassified from accumulated other comprehensive income (loss) | — | 2.7 | 2.7 | ||||||||
Balance November 30, 2015 | $ | (30.2 | ) | $ | (105.7 | ) | $ | (135.9 | ) | ||
Other comprehensive income (loss) before reclassifications | (5.3 | ) | (5.3 | ) | (10.6 | ) | |||||
Amounts reclassified from accumulated other comprehensive income (loss) | 5.9 | 2.1 | 8.0 | ||||||||
Balance November 30, 2016 | $ | (29.6 | ) | $ | (108.9 | ) | $ | (138.5 | ) | ||
Other comprehensive income (loss) before reclassifications | 12.8 | 2.7 | 15.5 | ||||||||
Amounts reclassified from accumulated other comprehensive income (loss) | (6.3 | ) | 4.0 | (2.3 | ) | ||||||
Balance November 30, 2017 | $ | (23.1 | ) | $ | (102.2 | ) | $ | (125.3 | ) | ||
Note G—Earnings Per Share
The following table sets forth the computation of earnings per common share and earnings per common share, assuming dilution:
Years Ended November 30, | |||||||||||
2017 | 2016 | 2015 | |||||||||
(Dollars in millions except for per share amounts) | |||||||||||
Numerator: | |||||||||||
Income (loss) from continuing operations | $ | (87.8 | ) | $ | (.4 | ) | $ | (18.7 | ) | ||
Income (loss) from discontinued operations, net of tax | — | — | .9 | ||||||||
Net income (loss) | $ | (87.8 | ) | $ | (.4 | ) | $ | (17.8 | ) | ||
Denominator (shares in millions): | |||||||||||
Denominator for basic earnings per share - weighted average shares outstanding | 44.4 | 44.0 | 45.3 | ||||||||
Effect of dilutive securities | — | — | 0.4 | ||||||||
Denominator for dilutive earnings per share - adjusted weighted average shares and assumed conversions | 44.4 | 44.0 | 45.7 | ||||||||
Basic and Diluted income (loss) per share: | |||||||||||
Income (loss) from continuing operations | $ | (1.98 | ) | $ | (.01 | ) | $ | (.41 | ) | ||
Income (loss) from discontinued operations, net of tax | — | — | .02 | ||||||||
Net income (loss) per share | $ | (1.98 | ) | $ | (.01 | ) | $ | (.39 | ) | ||
Anti-dilutive share equivalents related to share-based incentive compensation are excluded from the computation of dilutive weighted-average shares. Anti-dilutive options to purchase common shares or unearned restricted shares of the Company consisted of 0.6 million, 1.0 million and 0.9 million shares during 2017, 2016 and 2015, respectively.
47
NOTES TO CONSOLIDATED FINANCIAL STATEMENTS—CONTINUED
Note H—Accounts Receivable
The Company’s net accounts receivable of $99.0 million are generally unsecured. There was no customer who represented more than 10% of the Company’s net trade receivables at November 30, 2017 or 2016. The allowance for doubtful accounts was $2.9 million and $0.8 million at November 30, 2017 and 2016, respectively. Write-offs of uncollectible accounts receivable totaled $0.1 million, $0.2 million, and $0.3 million in 2017, 2016, and 2015, respectively. The provision for bad debts was $2.1 million, $0.3 million, and $0.2 million in 2017, 2016, and 2015, respectively.
During the fourth quarter of 2017, one of the Company’s largest carpet customers was acquired by a competing carpet manufacturer. This customer had previously filed for bankruptcy reorganization, and due to the Company’s preferred supplier status, the Company continued to sell product to this customer and concluded that all past due amounts from the customer were likely to be collected. As a result of the eventual sale of the customer's business, in the fourth quarter of 2017, the Company was informed that its supply contract with the customer would not be renewed and therefore the Company was no longer considered a preferred supplier. Accordingly, the Company recorded a bad debt provision of $2.1 million in the fourth quarter of 2017, as it now believes that a significant portion of the outstanding balance owed by by this customer is unlikely to be collected.
Note I—Inventories
November 30, | |||||||
2017 | 2016 | ||||||
(Dollars in millions) | |||||||
Raw materials and supplies | $ | 30.6 | $ | 30.6 | |||
Work-in-process | 4.5 | 4.7 | |||||
Finished goods | 62.1 | 58.2 | |||||
Inventories, gross | 97.2 | 93.5 | |||||
LIFO reserve | (14.3 | ) | (12.9 | ) | |||
Obsolescence reserve | (6.4 | ) | (6.6 | ) | |||
Inventories, net | $ | 76.5 | $ | 74.0 | |||
Inventories valued using the LIFO method represented $50.7 million, or 52.1%, and $46.4 million, or 49.7%, of inventories at November 30, 2017 and 2016, respectively.
In 2017, inventory quantities increased in both LIFO pools. This resulted in an increment in the LIFO inventories of $2.9 million in 2017. In 2016, inventory quantities declined, resulting in a partial liquidation of LIFO inventory layers. The partial liquidation resulted in a decrement in the LIFO inventories of $1.6 million in 2016.
Note J—Property, Plant and Equipment, Net
November 30, | |||||||
2017 | 2016 | ||||||
(Dollars in millions) | |||||||
Land | $ | 18.5 | $ | 16.8 | |||
Building and improvements | 145.9 | 141.6 | |||||
Machinery and equipment | 402.8 | 413.6 | |||||
Construction in progress | 15.1 | 13.9 | |||||
582.3 | 585.9 | ||||||
Accumulated depreciation | (373.4 | ) | (383.2 | ) | |||
Property, Plant, and Equipment, Net | $ | 208.9 | $ | 202.7 | |||
As of November 30, 2017, included in land and buildings and improvements are $3.0 million and $11.9 million (net of accumulated depreciation of $1.8 million), respectively, of assets under capital leases.
Depreciation expense was $24.4 million, $26.8 million, and $30.3 million in 2017, 2016, and 2015, respectively. Included in depreciation expense is $19.2 million, $22.3 million, and $26.0 million in 2017, 2016, and 2015, respectively, related to depreciation of manufacturing facilities and equipment.
As of November 30, 2017 and 2016, the Company had $6.0 million and $4.5 million, respectively, of unamortized software costs included in machinery and equipment, primarily related to an Enterprise Resource Planning (ERP) system. Depreciation expense of software costs was $2.0 million, $1.6 million, and $1.0 million in 2017, 2016, and 2015, respectively. The Company is depreciating these costs over five years.
There was no accelerated depreciation expense included in depreciation expense for 2017, $3.0 million in 2016, and $5.8 million in 2015, which related to the conversion of the plant in Calhoun, Georgia to a distribution center.
48
NOTES TO CONSOLIDATED FINANCIAL STATEMENTS—CONTINUED
Note K—Goodwill and Other Intangible Assets
Goodwill
The following table summarizes changes in the carrying value of goodwill:
Total | Specialty Solutions | Performance Materials | |||||||||
(Dollars in millions) | |||||||||||
Balance - November 30, 2015 | $ | 80.8 | $ | 61.2 | $ | 19.6 | |||||
Currency translation adjustment | (0.6 | ) | (0.6 | ) | — | ||||||
Balance - November 30, 2016 | 80.2 | 60.6 | 19.6 | ||||||||
Acquisitions | 1.6 | 1.6 | — | ||||||||
Impairments | (19.6 | ) | — | (19.6 | ) | ||||||
Currency translation adjustment | 4.1 | 4.1 | — | ||||||||
Balance - November 30, 2017 | $ | 66.3 | $ | 66.3 | $ | — | |||||
Intangible Assets
The following table summarizes the Company’s intangible assets as of November 30, 2017 and 2016:
November 30, 2017 | November 30, 2016 | November 30, 2017 | |||||||||||||||
Gross Carrying Amount | Accumulated Amortization | Gross Carrying Amount | Accumulated Amortization | Weighted Average Remaining Life | |||||||||||||
(Dollars in millions) | |||||||||||||||||
Finite-lived intangible assets | |||||||||||||||||
Patents | $ | 20.7 | $ | 19.0 | $ | 19.6 | $ | 17.5 | 3.4 | ||||||||
Trademarks | 7.9 | 7.2 | 7.9 | 7.1 | 6.6 | ||||||||||||
Technical know-how | 6.0 | 4.6 | 5.6 | 4.5 | 10.2 | ||||||||||||
Customer lists | 34.4 | 18.5 | 32.9 | 16.2 | 4.2 | ||||||||||||
Land use rights | 6.1 | .7 | 5.9 | .6 | 53.8 | ||||||||||||
Other | 2.1 | 1.9 | 1.8 | 1.8 | 0.1 | ||||||||||||
Sub-total | $ | 77.2 | $ | 51.9 | $ | 73.7 | $ | 47.7 | 12.0 | ||||||||
Indefinite lived intangible assets | |||||||||||||||||
Trademarks | 30.7 | — | 30.7 | — | N/A | ||||||||||||
Total | $ | 107.9 | $ | 51.9 | $ | 104.4 | $ | 47.7 | |||||||||
Amortization expense for finite-lived intangible assets was $3.5 million, $3.8 million, and $3.7 million for the years ended November 30, 2017, 2016, and 2015, respectively.
The following table summarizes expected future annual amortization expense for the Company’s finite-lived intangible assets:
(Dollars in millions) | |||
2018 | $ | 4.7 | |
2019 | 4.7 | ||
2020 | 4.8 | ||
2021 | 4.2 | ||
2022 | 1.1 | ||
Thereafter | 5.8 | ||
Total | $ | 25.3 | |
49
NOTES TO CONSOLIDATED FINANCIAL STATEMENTS—CONTINUED
Note L—Debt and Credit Lines
Amounts Due Banks
Amounts due banks consist of the following debt obligations that are due within the next twelve months:
November 30, | |||||||
2017 | 2016 | ||||||
(Dollars in millions) | |||||||
$350 million Term Loan B – current portion (interest at 5.49% and 5.25%, respectively) | $ | 3.5 | $ | 3.5 | |||
Capital lease obligations | .7 | .7 | |||||
Total | $ | 4.2 | $ | 4.2 | |||
The Company maintains borrowing facilities at certain foreign subsidiaries, which consist of working capital credit lines and facilities for the issuance of letters of credit. As of November 30, 2017, total borrowing capacity for foreign working capital credit lines and letters of credit facilities were $7.0 million, all of which was available for utilization. As of November 30, 2016, total borrowing capacity for foreign working capital credit lines and letters of credit facilities was $6.6 million, of which $6.5 million was available for utilization. These letters of credit support commitments made in the ordinary course of business.
The Company’s long-term debt consists of the following:
November 30, | |||||||
2017 | 2016 | ||||||
(Dollars in millions) | |||||||
$350 million Term Loan B (interest at 5.49% and 5.25%, respectively) | $ | 345.6 | $ | 349.2 | |||
Capital lease obligations | 16.2 | 16.8 | |||||
Total debt | 361.8 | 366.0 | |||||
Less: current portion | (4.2 | ) | (4.2 | ) | |||
Unamortized original issue discount | (2.8 | ) | (3.4 | ) | |||
Debt issuance costs | (5.0 | ) | (5.9 | ) | |||
Total long-term debt, net of current portion | $ | 349.8 | $ | 352.5 | |||
The following table summarizes payments on long-term debt (excluding capital lease obligations) through maturity:
(Dollars in millions) | |||
2018 | $ | 3.5 | |
2019 | $ | 3.5 | |
2020 | $ | 3.5 | |
2021 | $ | 3.5 | |
2022 | $ | 3.5 | |
Thereafter | $ | 328.1 | |
During 2016, the Company refinanced its U.S. debt facilities, issuing a $350.0 million Term Loan B ("Term Loan B") and amending and restating its Senior Revolving Credit Facility (“Facility”). A portion of the Term Loan B was used to redeem the outstanding principal and interest on the prior $200.0 million Term Loan B ("Prior Term Loan B"). In addition, $155.9 million of the Term Loan B proceeds were used to redeem the remaining balance outstanding and accrued interest on the Company's 7.875% Senior Unsecured Notes ("Senior Notes") on November 1, 2016.
The Term Loan B was issued at a discount of $3.5 million which is reflected as unamortized original issue discount. The Company also incurred debt issuance costs of $5.1 million, which are capitalized as a reduction of long-term debt on the consolidated balance sheets. These amounts will be amortized over the respective term of the debt as a non-cash component of interest expense. In addition, the Company wrote-off $1.7 million of existing debt issuance costs and the original issue discount related to the Prior Term Loan B and the Facility and $1.2 million of debt issuance costs related to the Senior Notes.
The weighted-average interest rate on the Company’s debt was 5.32% and 5.78% during 2017 and 2016, respectively.
Term Loan
The Company's $350.0 million Term Loan B matures on August 26, 2023 and is primarily secured by all real property, plant, and equipment of the Company's U.S. facilities and fully and unconditionally and jointly and severally guaranteed by the material U.S. subsidiaries of the Company. The Term Loan B carries a variable interest rate based on, at the Company’s option, either a eurodollar rate or a base rate, in each case plus an applicable margin. The eurodollar rate is a periodic fixed rate equal to the ICE InterBank Offered Rate (“LIBOR”) subject to a floor of 1.00%. The applicable margin for the eurodollar rate is 4.25%. The base interest rate is a fluctuating rate equal to the higher of (i) the Prime Rate, (ii) the sum of the Federal Funds Effective Rate plus 0.50%, or (iii) the one-month eurodollar rate plus 1.00%. The applicable margin for the base rate is 3.25%. Annual principal payments consist of $3.5 million due in quarterly installments beginning November 30, 2016, and potential annual excess free cash flow payments as defined in the Term Loan B agreement, with any remaining balance to be paid on August 26, 2023 . The Company was not required to make any annual excess free cash flow payments during 2017 or 2016. The Company can prepay any
50
NOTES TO CONSOLIDATED FINANCIAL STATEMENTS—CONTINUED
amount at any time without penalty upon proper notice and subject to a minimum dollar requirement, except for prepayments arising from a repricing transaction occurring prior to February 26, 2017, to which there were none, which bear a premium of 1% of the loan amount being repaid. Prepayments will be applied towards any required annual excess free cash flow payment.
Additionally, the Term Loan B provides for additional borrowings of the greater of $85.0 million or an amount based on a senior secured leverage ratio, as defined in the Term Loan B, provided that certain requirements are met. The Term Loan B contains affirmative and negative covenants, including limitations on additional debt, certain investments and acquisitions outside of the Company’s line of business. The Term Loan B requires the Company to maintain a total net leverage ratio of less than 5.0 to 1.0. The Company is in compliance with this covenant with a total net leverage ratio of 3.1 to 1.0 at November 30, 2017.
Senior Revolving Credit Facility
The Company also has a Senior Secured Revolving Credit Facility (the "Facility") with a potential availability of $90.0 million, which can be further increased up to $140.0 million subject to additional borrowing base assets and lender approval. The Facility was amended in August and November 2016, resulting in a new maturity date, a reduction of potential availability from $100.0 million to $90.0 million and a reduction of applicable margins. The Facility now matures on August 26, 2021. The Facility is secured by U.S. accounts receivable, inventory (collectively the “Eligible Borrowing Base”) and intangible assets. Availability under the Facility will fluctuate depending on the Eligible Borrowing Base and is determined by applying customary advance rates to the Eligible Borrowing Base. The Facility includes a $5.0 million sub-limit for the issuance of commercial and standby letters of credit and a $10.0 million sub-limit for swingline loans. Outstanding letters of credit on November 30, 2017 were $0.4 million. The Facility contains affirmative and negative covenants, similar to the Term Loan B, including limitations on additional debt, certain investments and acquisitions outside of the Company’s line of business. If the average excess availability of the Facility falls below $25.0 million during any fiscal quarter, the Company must then maintain a fixed charge coverage ratio greater than 1.1 to 1.0 as defined in the agreement. Average excess availability is defined as the average daily amount available for borrowing under the Facility during the Company’s fiscal quarter. The Company was in compliance with this requirement as the average excess availability did not fall below $25.0 million during the fourth quarter of 2017.
Advances under the Facility bear interest, at the Company’s option, at either an alternate base rate or a eurodollar rate, in each case plus an applicable margin. The alternate base interest rate is a fluctuating rate equal to the higher of the prime rate or the sum of the federal funds effective rate plus 0.50%. The eurodollar rate is a periodic fixed rate equal to LIBOR. Applicable margins are based on the Company’s average daily excess availability during the previous fiscal quarter. If average excess availability is greater than $50.0 million, the applicable margin will be 1.50% on eurodollar loans and 0.50% on base rate borrowings. If average excess availability is greater than or equal to $25.0 million but less than or equal to $50.0 million, the applicable margin will be 1.75% on eurodollar loans and 0.75% on base rate borrowings. If average excess availability is less than $25.0 million, the applicable margin will be 2.00% on eurodollar loans and 1.00% on base rate borrowings. The commitment fee for unused credit lines will be 0.25% if outstanding borrowings on the Facility are greater than or equal to 50% of the maximum revolver amount and 0.375% if outstanding borrowings are less than 50% of the maximum revolver amount.
At November 30, 2017, there were no amounts borrowed under the Facility and the amount available for borrowing under the Facility was $72.0 million.
Capital Lease Obligations
At November 30, 2017, the Company had assets under capital leases totaling $16.2 million, which are included in property, plant, and equipment in the accompanying Consolidated Balance Sheets.
The following is a schedule by year of future minimum lease payments for this capital lease together with the present value of the net minimum lease payments as of November 30, 2017.
Year Ending November 30: | (Dollars in millions) | ||
2018 | $ | 1.5 | |
2019 | 1.5 | ||
2020 | 1.5 | ||
2021 | 1.4 | ||
2022 | 1.4 | ||
Thereafter | 16.6 | ||
Total minimum lease payments | 23.9 | ||
Less: Amount representing estimated executory costs | (.6 | ) | |
Net minimum lease payments | 23.3 | ||
Less: Amount representing interest | (7.1 | ) | |
Present value of minimum lease payments | $ | 16.2 | |
Debt Issuance Costs and Original Issue Discounts
Debt issuance costs and original issue discounts incurred in connection with the issuance of the Company's debt are being amortized over the respective terms of the underlying debt, including any amendments. Total amortization expense of debt issuance costs and original issue discounts is included as a component of interest expense and was $1.5 million, $1.8 million, and $2.0 million for 2017, 2016, and 2015, respectively. As a result of redeeming debt in 2016, and 2015, the Company wrote-off $2.9 million and $0.8 million, respectively, of existing deferred financing fees.
Cash paid for interest was $19.2 million, $23.2 million, and $24.9 million for 2017, 2016, and 2015, respectively. Included in 2015 is the premium paid on the partial redemption of the Senior Notes as described previously.
51
NOTES TO CONSOLIDATED FINANCIAL STATEMENTS—CONTINUED
Note M—Employee Benefit Plans
The Company maintains a number of defined benefit and defined contribution plans to provide retirement benefits for employees. These plans are maintained and contributions are made in accordance with the Employee Retirement Income Security Act of 1974 (“ERISA”), local statutory law, or as determined by the Board of Directors. The plans generally provide benefits based upon years of service and compensation. Pension plans are funded except for a U.S. non-qualified pension plan for certain key employees and certain foreign plans. The Company uses a November 30 measurement date for its plans.
Prior to 2016, the Company used a single weighted-average discount rate approach to develop the interest and service cost components of the net periodic benefit costs for its U.S. benefit plans. This method represented the constant annual rate that would be required to discount all future benefit payments related to past service from the date of expected future payment to the measurement date such that the aggregate present value equals the obligation. Effective in 2016, the Company adopted certain amendments to modify the method previously used. The new method was used for determining the benefit expense for its U.S. plans. The Company utilizes an approach that discounts the individual expected cash flows underlying interest and service costs using the applicable spot rates derived from the yield curve used to determine the benefit obligation to the relevant projected cash flows. The Company treated this change as a change in accounting estimate on a prospective basis beginning December 1, 2015. The change in method resulted in a decrease in the service and interest components for benefit cost in 2017 and 2016. The spot rates used to determine service and interest costs for 2017 expense ranged from 1.35% to 4.08%. The ultimate spot rate used to discount cash flows beyond 30 years was 5.07% for 2017. The spot rates used to determine service and interest costs for 2018 expense ranged from 1.92% to 4.08%. The ultimate spot rate used to discount cash flows beyond 30 years was 4.08% for 2018.
The use of disaggregated discount rates results in a different amount of Interest Cost compared to the traditional single weighted-average discount rate approach because of different weightings given to each subset of payments. The use of disaggregated discount rates affects the amount of Service Cost because the benefit payments associated with new service credits for active employees tend to be of longer duration than the overall benefit payments associated with the plan’s benefit obligation. As a result, the payments would be associated with longer-term spot rates on the yield curve, resulting in lower present values than the calculations using the traditional single weighted-average discount rate.
Defined Benefit Plans
The Company’s defined benefits plans generally provide benefits based on years of service and compensation for salaried employees and under negotiated non-wage based formulas for union-represented employees.
Changes in benefit obligations and plan assets are as follows:
2017 | 2016 | ||||||
(Dollars in millions) | |||||||
Change in Benefit Obligation | |||||||
Benefit obligation at beginning of year | $ | 280.8 | $ | 282.5 | |||
Service cost | 2.8 | 1.8 | |||||
Interest cost | 9.3 | 9.6 | |||||
Actuarial loss (gain) | 14.0 | 7.7 | |||||
Settlement | (.4 | ) | (.6 | ) | |||
Benefits and expenses paid net of retiree contributions | (19.6 | ) | (20.3 | ) | |||
Exchange rate changes | 1.2 | .1 | |||||
Benefit Obligation at End of Year | 288.1 | 280.8 | |||||
Change in Plan Assets | |||||||
Fair value of plan assets at beginning of year | 197.1 | 197.1 | |||||
Actual return on assets | 32.3 | 13.6 | |||||
Employer contributions | 7.6 | 6.9 | |||||
Exchange rate changes | .1 | — | |||||
Benefits and expenses paid | (19.9 | ) | (20.5 | ) | |||
Fair Value of Plan Assets at End of Year | 217.2 | 197.1 | |||||
Funded Status at November 30 | $ | (70.9 | ) | $ | (83.7 | ) | |
Amounts Recognized in the Consolidated Balance Sheets | |||||||
Current liability | $ | (.4 | ) | $ | (1.4 | ) | |
Non-current liability | (70.5 | ) | (82.3 | ) | |||
Net Amount Recognized | $ | (70.9 | ) | $ | (83.7 | ) | |
As of November 30, 2017 and 2016, the amounts included in Accumulated Other Comprehensive Income (Loss) that have not yet been recognized in net periodic benefit cost consist of:
52
NOTES TO CONSOLIDATED FINANCIAL STATEMENTS—CONTINUED
2017 | 2016 | ||||||
(Dollars in millions) | |||||||
Net actuarial loss | $ | (133.2 | ) | $ | (141.5 | ) | |
Prior service credits | $ | — | $ | .1 | |||
The after-tax amount of unrecognized net actuarial loss at November 30, 2017 was $118.5 million. The estimated net loss for defined benefit plans that will be amortized from Accumulated Other Comprehensive Loss during 2018 is $5.4 million.
Net Periodic Benefit Cost
Net periodic benefit cost (income) consisted of the following for the years ended, November 30:
2017 | 2016 | 2015 | |||||||||
(Dollars in millions) | |||||||||||
Net Periodic Benefit Cost: | |||||||||||
Service costs for benefits earned | $ | 2.8 | $ | 1.8 | $ | 1.4 | |||||
Interest costs on benefit obligation | 9.3 | 9.6 | 12.9 | ||||||||
Assumed return on plan assets | (15.3 | ) | (15.3 | ) | (15.7 | ) | |||||
Amortization of net loss | 4.9 | 4.6 | 5.4 | ||||||||
Curtailment and settlement (gain) loss | .4 | (.1 | ) | (.4 | ) | ||||||
Total | $ | 2.1 | $ | .6 | $ | 3.6 | |||||
The Company made $7.6 million and $6.2 million in contributions to its plans during 2017 and 2016, respectively. The Company anticipates that it will be required to make a contribution to its pension plans of $6.4 million in 2018. The Company anticipates pension expense to be approximately $1.3 million in 2018.
Future service benefits are frozen for all participants under the Company's U.S. defined benefit plan. All benefits earned by affected employees through the effective dates of the freezes have become fully vested with the affected employees eligible to receive benefits upon retirement, as described in the Plan document.
Estimated future benefit payments to retirees from the Company's pension plans are as follows: 2018 - $17.4 million, 2019 - $17.6 million, 2020 - $17.8 million, 2021 - $17.7 million, 2022 - $18.4 million, and thereafter $90.5 million.
Information regarding pension plans with accumulated benefit obligations in excess of plan assets is as follows:
2017 | 2016 | ||||||
(Dollars in millions) | |||||||
U.S. Pension Plans: | |||||||
Projected benefit obligation | $ | 275.9 | $ | 270.0 | |||
Accumulated benefit obligation | $ | 275.9 | $ | 270.0 | |||
Fair value of plan assets | $ | 216.5 | $ | 196.4 | |||
Non-U.S. Pension Plans: | |||||||
Projected benefit obligation | $ | 12.2 | $ | 10.8 | |||
Accumulated benefit obligation | $ | 8.5 | $ | 7.5 | |||
Fair value of plan assets | $ | .7 | $ | .7 | |||
Assumptions
Weighted average assumptions used to measure the benefit obligation for the Company’s defined benefit plans as of November 30, 2017 and 2016 were as follows:
Pension Plans | |||||
2017 | 2016 | ||||
Weighted Average Assumptions: | |||||
Discount rate used for liability determination | 3.66 | % | 4.12 | % | |
Annual rates of salary increase (non-U.S. plans) | 3.47 | % | 3.44 | % | |
Weighted average assumptions used to measure the net periodic benefit cost for the Company’s defined benefit plans as of November 30, 2017, 2016, and 2015 were as follows:
53
NOTES TO CONSOLIDATED FINANCIAL STATEMENTS—CONTINUED
Pension Plans | ||||||||
2017 | 2016 | 2015 | ||||||
Weighted Average Assumptions: | ||||||||
Discount rate used for expense determination | 4.12 | % | 4.29 | % | 4.01 | % | ||
Assumed long-term rate of return on plan assets | 7.68 | % | 7.70 | % | 7.75 | % | ||
Annual rates of salary increase (non-U.S. plans) | 3.44 | % | 3.77 | % | 3.67 | % | ||
The discount rate used for the liability measurement reflects the current rate at which the pension liabilities could be effectively settled at the end of the year. The discount rate used spot rates on a yield curve matching benefit payments to determine the weighted average discount rate that would be applied in determining the benefit obligation at November 30, 2017. The decrease in the discount rate used in 2017 is due to a change in investment mix used in establishing the yield curve as compared to the prior year. The assumed long-term rate of return on plan assets assumption is based on the weighted average expected return of the various asset classes in the plans’ portfolios. The asset class return is developed using historical asset return performance, as well as current market conditions, such as inflation, interest rates, and equity market performance. The rate of compensation increase is based on management's estimates using historical experience and expected increases in rates.
During 2017, the Company continued to use the Mercer modified version (MRP - 2007) of the Society of Actuaries’ (SOA) RP-2014 mortality table for the pre-retirement mortality base table. The Company also continued to use the Mercer Industry Longevity Experience Study (MILES) table for the Chemical, Oil & Gas and Utilities industry for the former Performance Chemicals plan participants and the Consumer Goods and Food & Drink industry for the former Engineered Surfaces plan participants for the post-retirement morality base table. The Company chose to update the projection scale (used for both pre and post retirement) with an updated modified generational projection scale of MMP-2016. The MMP-2016 scale takes into account the historical grade-down of mortality improvements and relies on the Social Security Administration improvement data through 2013 (published in 2016) and reflects long-term rate of improvement based on historical experience and the Company’s view of those trends.
Pension Plans Assets
The Company’s defined benefit plans are funded primarily through asset trusts or through general assets of the Company. The Company employs a total return on investments approach for its U.S. defined benefit pension plan assets. A mix of equity securities, fixed income securities, and collective trusts are used to maximize the long-term rate of return on assets for the level of acceptable risk. Asset allocation at November 30, 2017, target allocation for 2017, and expected long-term rate of return by asset category are as follows:
Asset Category | Target Allocation | Percentage of Plan Assets At November 30, | Weighted-Average Expected Long-Term Rate Of Return | ||||||||
2017 | 2017 | 2016 | |||||||||
Equity securities | 58 | % | 54 | % | 54 | % | 5.16 | % | |||
Fixed income securities | 18 | % | 16 | % | 15 | % | .83 | % | |||
Collective trusts and other | 24 | % | 30 | % | 31 | % | 1.69 | % | |||
Total | 100 | % | 100 | % | 100 | % | 7.68 | % | |||
54
NOTES TO CONSOLIDATED FINANCIAL STATEMENTS—CONTINUED
The following tables set forth, by level within the fair value hierarchy, the U.S. defined benefit plans’ assets at November 30, 2017 and November 30, 2016:
Total | Level 1 | Level 2 | Level 3 | |||||||||||||
2017 | (Dollars in millions) | |||||||||||||||
Money market funds | $ | .1 | $ | .1 | $ | — | $ | — | ||||||||
Registered investment companies: | ||||||||||||||||
Equity mutual funds | 117.6 | 117.6 | — | — | ||||||||||||
Fixed income mutual funds | 31.9 | 31.9 | — | — | ||||||||||||
Total registered investment companies | 149.5 | 149.5 | — | — | ||||||||||||
Real estate partnerships | .3 | — | — | .3 | ||||||||||||
$ | 149.9 | $ | 149.6 | $ | — | $ | .3 | |||||||||
Collective trust funds: | ||||||||||||||||
Core property collective | 23.7 | |||||||||||||||
Structured credit collective | 30.6 | |||||||||||||||
Energy debt collective | 12.3 | |||||||||||||||
Total collective trust funds measured at NAV | 66.6 | |||||||||||||||
$ | 216.5 | |||||||||||||||
2016 | ||||||||||||||||
Money market funds | $ | .1 | $ | .1 | $ | — | $ | — | ||||||||
Registered investment companies: | ||||||||||||||||
Equity mutual funds | 105.0 | 105.0 | — | — | ||||||||||||
Fixed income mutual funds | 30.9 | 30.9 | — | — | ||||||||||||
Total registered investment companies | 135.9 | 135.9 | — | — | ||||||||||||
Real estate partnerships | .3 | — | — | .3 | ||||||||||||
$ | 136.3 | $ | 136.0 | $ | — | $ | .3 | |||||||||
Collective trust funds: | ||||||||||||||||
Core property collective | 21.8 | |||||||||||||||
Structured credit collective | 26.9 | |||||||||||||||
Energy debt collective | 11.4 | |||||||||||||||
Total collective trust funds measured at NAV | 60.1 | |||||||||||||||
$ | 196.4 | |||||||||||||||
Money market funds are valued at a net asset value (NAV) of $1.00 per share held by the plan at year end, which approximates fair value.
Registered investment companies are valued at quoted market prices.
The fair value of the participation units owned by the Plan in the collective trust funds are based on the NAV of participating units held by the Plan.
Investments in real estate partnerships are valued at the fair value of the underlying assets based on comparable sales value for similar assets, discounted cash flow models, appraisals, and other valuation techniques.
The preceding methods described may produce a fair value calculation that may not be indicative of net realizable value or reflective of future fair values. Furthermore, although the Company believes its valuation methods are appropriate and consistent with other market participants, the use of different methodologies or assumptions to determine the fair value of certain financial instruments could result in a different fair value measurement at the reporting date.
A reconciliation of the beginning and ending Level 3 measurements is as follows:
Real Estate Partnerships | ||||
(Dollars in millions) | ||||
Beginning balance, December 1, 2015 | $ | 1.5 | ||
Redemptions | (1.0 | ) | ||
Unrealized net gains or losses included in funded status | (.2 | ) | ||
Ending balance, November 30, 2016 | .3 | |||
Redemptions | — | |||
Unrealized net gains or losses included in funded status | — | |||
Ending balance, November 30, 2017 | $ | .3 | ||
55
NOTES TO CONSOLIDATED FINANCIAL STATEMENTS—CONTINUED
For Level 3 investments in the Company's U.S. defined benefit plan, the Benefits Management Committee, which is comprised of certain executives of the Company, uses third party services as the primary basis for valuation of these investments. The third party services do not provide access to valuation models, inputs, and assumptions. Accordingly, the Benefits Management Committee conducts a review of a variety of factors including internal controls reports and financial statements of the investment, economic conditions, industry and market developments, and overall credit ratings, as well as utilizing a vendor review of the fund in assessing the propriety of the estimated fair value.
The following table summarizes the Plan’s investments with a reported NAV, which is a practical expedient to estimating fair value, as of November 30, 2017 and 2016:
November 30, | |||||||
2017 | 2016 | ||||||
(Dollars in millions) | |||||||
SEI Structured Credit Collective Fund(a) | $ | 30.6 | $ | 26.9 | |||
Energy Debt Collective Investment Trust(b) | $ | 12.3 | $ | 11.4 | |||
Core Property Collective Investment Trust(c) | $ | 23.7 | $ | 21.8 | |||
(a) | The SEI Structured Credit Collective Fund seeks to provide high general returns by investing in collateralized debt obligations (“CDO’s”) and other structured credit instruments. The SEI Structured Credit Collective Fund requires a two-year non-redemption period after which investments can be redeemed at any time; however, a 90 day redemption notification period is required. The Plan has satisfied all funding obligations related to this investment and has surpassed the two-year non-redemption period. |
(b) | The SEI Energy Debt Collective Funds seeks to generate high total returns by primarily investing in debt securities of U.S. and international energy companies denominated in U.S. dollars. The Fund will invest in investment grade bonds, below investment grade bonds, loans, rights issues, or equities of U.S. companies. Equity investments will be limited. In most cases, equity investments will be attached to a debt investment for extending credit or if received in a restructuring, though the Sub-Adviser is permitted to add-on to an existing equity position through a secondary market transaction. |
(c) | The SEI Core Property Fund, (the "Fund") seeks both current income and long-term capital appreciation through investing in underlying funds that acquire, manage, and dispose of commercial real estate properties. The Fund expects to invest at least 85% of its assets in open-end core underlying funds focused on properties in the U.S. with "core" meaning high-quality, low-leveraged, income-generating office, industrial, retail, and multi-family properties, generally fully-leased to credit-worthy companies and governmental entities. Up to 5% of the Fund's net assets may be invested in liquid real estate strategies (publicly-traded REITs) for cash management purposes and the fund may have up to a 15% allocation to non-core sectors and strategies. |
Defined Contribution Plans
The Company also sponsors a defined contribution 401(k) plan. Participation in this plan is available to substantially all U.S. salaried employees and to certain groups of U.S. hourly employees. Company contributions to this plan are based on either a percentage of employee contributions or on a specified amount per hour based on the provisions of the applicable collective bargaining agreement. Contribution expense to this plan was approximately $2.6 million in 2017, $2.5 million in 2016, and $2.4 million in 2015. The defined contribution 401(k) plan contained approximately 0.8 million shares at November 30, 2017 and 0.9 million shares at November 30, 2016 of the Company’s common shares.
Health Care Plans
The Company provides retiree medical plans for certain retired U.S. employees of which there were 68 retired participants as of November 30, 2017. The plan is frozen to new participants. The plans generally provide for cost sharing in the form of retiree contributions, deductibles, and coinsurance between the Company and its retirees, and a fixed cost cap on the amount the Company pays annually to provide future retiree medical coverage. These post-retirement benefits are unfunded and are accrued by the date the employee becomes eligible for benefits. Retirees in certain other countries are provided similar benefits by plans sponsored by local governments.
Because the Company’s retiree health care benefits are capped, assumed health care cost trend rates have a minimal effect on the amounts reported for the retiree health care plans. A one-percentage point increase/decrease in assumed health care cost trend rates would not significantly increase or decrease the benefit obligation at November 30, 2017 and would have no effect on the aggregate of the service and interest components of the net periodic cost.
56
NOTES TO CONSOLIDATED FINANCIAL STATEMENTS—CONTINUED
Changes in benefit obligations are as follows:
2017 | 2016 | ||||||
(Dollars in millions) | |||||||
Change in Benefit Obligation: | |||||||
Benefit obligation at beginning of year | $ | 6.9 | $ | 7.6 | |||
Interest cost | .2 | .2 | |||||
Actuarial (gain) loss | .4 | (.3 | ) | ||||
Benefits paid net of retiree contributions | (.6 | ) | (.6 | ) | |||
Benefit Obligation at End of Year | 6.9 | 6.9 | |||||
Change in Plan Assets: | |||||||
Fair value of plan assets at beginning of year | — | — | |||||
Employer contributions | .6 | .6 | |||||
Benefits and expenses paid, net of retiree contributions | (.6 | ) | (.6 | ) | |||
Fair Value of Plan Assets at End of Year | — | — | |||||
Funded Status at November 30 | $ | (6.9 | ) | $ | (6.9 | ) | |
Amounts Recognized in the Consolidated Balance Sheets: | |||||||
Current liability | $ | (.6 | ) | $ | (.6 | ) | |
Non-current liability | (6.3 | ) | (6.3 | ) | |||
Net Amount Recognized | $ | (6.9 | ) | $ | (6.9 | ) | |
As of November 30, 2017 and 2016, the amounts included in Accumulated Other Comprehensive Income (Loss) that have not been recognized in net periodic benefit cost consist of:
2017 | 2016 | ||||||
(Dollars in millions) | |||||||
Net actuarial gain | $ | 11.1 | $ | 12.5 | |||
Prior service credit | $ | — | $ | — | |||
The after-tax amount of unrecognized net actuarial gain at November 30, 2017 was $16.3 million. The estimated net gain for post retirement health care plans that will be amortized from Accumulated Other Comprehensive Loss during 2018 is $1.0 million.
Net periodic benefit cost (income) consisted of the following for the years ended, November 30:
Net Periodic Benefit Cost | 2017 | 2016 | 2015 | ||||||||
(Dollars in millions) | |||||||||||
Net Periodic Benefit Cost (Income) | |||||||||||
Interest costs on benefit obligation | $ | .2 | $ | .2 | $ | .3 | |||||
Amortization of prior service credits | — | — | (.1 | ) | |||||||
Amortization of net gain | (1.0 | ) | (1.0 | ) | (1.2 | ) | |||||
Total | $ | (0.8 | ) | $ | (0.8 | ) | $ | (1.0 | ) | ||
Estimated future benefit payments and Medicare Part D subsidies for the retiree health care plans are as follows:
Benefit Payments | |||
(Dollars in millions) | |||
2018 | $ | .6 | |
2019 | .6 | ||
2020 | .6 | ||
2021 | .6 | ||
2022 | .5 | ||
2023-2027 | 2.3 | ||
57
NOTES TO CONSOLIDATED FINANCIAL STATEMENTS—CONTINUED
The Company expects to record non-cash retiree medical health care reduction of expenses of approximately $0.7 million in 2018.
The estimated net actuarial gain for retiree medical plans that will be amortized from Accumulated Other Comprehensive Loss during 2018 is $1.0 million.
Assumptions
2017 | 2016 | 2015 | ||||||
Weighted Average Assumptions | ||||||||
Discount rate used for liability determination | 3.62 | % | 4.00 | % | 4.15 | % | ||
Discount rate used for expense determination | 4.00 | % | 4.15 | % | 3.85 | % | ||
Current trend rate for health care costs | 7.60 | % | 8.00 | % | 8.50 | % | ||
Ultimate trend rate for health care costs | 4.50 | % | 4.50 | % | 4.50 | % | ||
Year reached | 2037 | 2037 | 2037 | |||||
The discount rate reflects the current rate at which the retiree medical liabilities could be effectively settled at the end of the year. The discount rate used spot rates on a yield curve matching benefit payments to determine the weighted average discount rate that would be applied in determining the benefit obligation at November 30, 2017.
Note N—Contingencies and Commitments
Litigation
From time to time, the Company is subject to various claims, proceedings, and lawsuits related to products, services, contracts, employment, environmental, safety, intellectual property, and other matters. The ultimate resolution of such claims, proceedings, and lawsuits is inherently unpredictable and, as a result, the Company’s estimates of liability, if any, are subject to change. Actual results may materially differ from the Company’s estimates and an unfavorable resolution of any matter could have a material adverse effect on the financial condition, results of operations and/or cash flows of the Company. However, subject to the above and taking into account such amounts, if any, as are accrued from time to time on the Company’s balance sheet, the Company does not believe, based on the information currently available to it, that the ultimate resolution of these matters will have a material effect on the consolidated financial condition, results of operations, or cash flows of the Company.
Leases
The Company leases certain facilities, machinery and equipment, and office buildings under long-term, non-cancelable operating leases. The leases generally provide for renewal options ranging from 5 to 20 years and require the Company to pay for utilities, insurance, taxes, and maintenance. Lease expense on operating leases was $6.2 million in 2017, $6.3 million in 2016, and $5.9 million in 2015. Future minimum commitments at November 30, 2017 for non-cancelable operating leases were $12.5 million with annual amounts of $3.5 million in 2018, $3.1 million in 2019, $2.3 million in 2020, $1.5 million in 2021, $1.1 million in 2022, and $1.0 million for leases thereafter.
Environmental Matters
The Company’s policy is to conduct its businesses with due regard for the preservation and protection of the environment. The Company devotes significant resources and management attention to comply with environmental laws and regulations. The Company’s Consolidated Balance Sheets as of November 30, 2017 and 2016 reflects reserves for environmental remediation of $1.6 million and $3.9 million, respectively. The Company’s estimates are subject to change and actual results may materially differ from the Company’s estimates. Management believes, on the basis of presently available information, that resolution of known environmental matters will not materially affect liquidity, capital resources, or the financial condition of the Company.
Collective Bargaining Agreements
At November 30, 2017, the Company employed approximately 1,800 employees at offices, plants, and other facilities located principally throughout the United States, France, China and Thailand. Approximately 11% of the Company’s U.S. employees are covered by collective bargaining agreements of which approximately 60 employees are covered by agreements that expire within the next 12 months. In addition, certain of our foreign employees are also covered by collective bargaining agreements.
Note O—Share-Based Compensation Plans
The Company provides compensation benefits to employees under the OMNOVA Solutions 2017 Equity Incentive Plan (the “Plan”), which was approved by shareholders on March 22, 2017. The Plan permits the Company to grant to officers, key employees and non-employee directors of the Company, incentives directly linked to the price of OMNOVA Solutions’ common shares. The Plan authorizes the issuance of Company common shares in the aggregate for (a) awards of options rights to purchase Company common shares, (b) performance shares and performance units, (c) restricted shares, (d) restricted share units, or (e) appreciation rights. Shares granted under the Plan may be either newly issued shares or treasury shares or both. As of November 30, 2017, approximately 2.6 million Company common shares remained available for grants under the Plan. All options granted under the Plan are granted at exercise prices equal to the market value of the Company’s common shares on the date of grant. Additionally, the Plan provides that the term of any option granted under the Plan may not exceed 10 years. Prior to March 22, 2017, the Company granted equity compensation under the OMNOVA Solutions Third Amended and Restated 1999 Equity and Performance Incentive Plan, which had substantially similar features.
Share-based compensation is measured at the grant date, based on the calculated fair value of the award, and is recognized as an expense over the requisite service period (generally the vesting period). The fair value of Restricted Share Awards ("RSA's") and Restricted Share Units ("RSU's") is determined based on the closing market price of the Company’s ordinary shares at the date of grant. RSU's entitle the
58
NOTES TO CONSOLIDATED FINANCIAL STATEMENTS—CONTINUED
holder to receive one ordinary share for each RSU at vesting, generally over a three year period from the date of grant. Estimates of fair value are not intended to predict actual future events or the value ultimately realized by employees who receive equity awards, and subsequent events are not indicative of the reasonableness of the original estimates of fair value made by the Company.
In accordance with the adoption of ASU 2016-09, the Company recognized a cumulative effect adjustment to retained earnings of $2.9 million in the Consolidated Financial Statements as of December 1, 2016 related to the recognition of deferred tax assets attributable to unrecognized windfall tax benefits.
For options, the fair value calculation is estimated using a Black-Scholes based option valuation model. For restricted share grants and restricted share units grants, which consist of the Company’s common shares, the fair value is equal to the market price of the Company’s shares on the date of grant. Estimates of fair value are not intended to predict actual future events or the value ultimately realized by employees who receive equity awards, and subsequent events are not indicative of the reasonableness of the original estimates of fair value made by the Company.
A summary of the Company’s restricted share and restricted share units activity and related information for the years ended November 30, 2017, 2016, and 2015 are as follows:
2017 | 2016 | 2015 | ||||||||||||||||||
Shares | Weighted Average Grant Date Fair Value | Shares | Weighted Average Grant Date Fair Value | Shares | Weighted Average Grant Date Fair Value | |||||||||||||||
Non-vested at beginning of year | 1,008,150 | $ | 7.23 | 872,200 | $ | 8.13 | 919,950 | $ | 7.63 | |||||||||||
Granted | 209,650 | $ | 8.31 | 416,500 | $ | 5.44 | 329,350 | $ | 7.26 | |||||||||||
Vested | (615,450 | ) | $ | 7.46 | (258,900 | ) | $ | 7.91 | (333,350 | ) | $ | 5.88 | ||||||||
Forfeited | (34,750 | ) | $ | 7.25 | (21,650 | ) | $ | 8.26 | (43,750 | ) | $ | 8.32 | ||||||||
Non-vested at end of year | 567,600 | $ | 7.08 | 1,008,150 | $ | 7.23 | 872,200 | $ | 8.13 | |||||||||||
Compensation expense for all share-based payments included in general and administrative expense was $1.9 million, $2.5 million, and $2.4 million during 2017, 2016, and 2015, respectively.
As of November 30, 2017, there was $1.9 million of total unrecognized compensation expense related to non-vested share-based compensation arrangements to be amortized over the next 1.8 years.
The Company also provides employees the opportunity to purchase Company common shares through payroll deductions under the OMNOVA Solutions Employee Share Purchase Plan (the "ESPP"). Under the ESPP, eligible employees receive a 15% discount from the trading value of common shares purchased. The purchase price for common shares purchased from the Company will be 85% of the closing price of the common shares on the New York Stock Exchange ("NYSE") on the investment date. Participants may contribute funds to the ESPP, not to exceed twenty-five thousand dollars in any calendar year. If a participant terminates his or her employment with the Company or its subsidiaries, the participant's participation will immediately terminate and the participant's account will be converted to a regular brokerage account. As of November 30, 2017 the amount of shares held by eligible participants through the ESPP was not material.
Note P—Business Segment Information
Based on changes to the management of the business, during the second quarter of 2017, the Company began reporting its financial results under two new reporting segments: "Specialty Solutions", a segment focused on the Company's higher growth, specialty business lines, and "Performance Materials," a segment comprised of the Company's mature business lines. Accordingly, prior year segment results have been modified to conform to the revised segment presentation.
The Company’s two operating segments were determined based on products and services provided as defined under Financial Accounting Standards Board ("FASB") Accounting Standards Codification ("ASC") 280, Segment Reporting. Accounting policies of the segments are the same as the Company’s accounting policies. The Company’s operating segments are strategic business units that offer different products and services. They are managed separately based on certain differences in their operations, technology, and marketing strategies.
Segment operating profit represents net sales less applicable costs, expenses and provisions for restructuring and severance costs, asset write-offs and work stoppage costs relating to operations. However, Management excludes restructuring and severance costs, asset write-offs and work stoppage costs when evaluating the results and allocating resources to the segments.
Segment operating profit excludes unallocated corporate headquarters expenses, provisions for corporate headquarters restructuring and severance, interest expense and income taxes. Corporate headquarters expense includes the cost of providing and maintaining the corporate headquarters functions, including salaries, rent, travel and entertainment expenses, depreciation, utility costs, outside services and amortization of deferred financing costs.
In 2017, segment operating profit for Specialty Solutions includes restructuring and severance charges of $0.6 million and asset impairment and facility closure costs $0.3 million, while the Performance Materials operating profit includes restructuring and severance charges of $1.7 million, asset impairment and facility closure costs of $33.6 million, and a reduction in environmental costs of $2.0 million.
In 2016, segment operating profit for Specialty Solutions includes restructuring and severance charges of $0.2 million, asset impairment and facility closure costs and other of $0.2 million, while the Performance Materials operating profit includes restructuring and severance charges of $3.3 million, asset impairment and facility closure costs of $4.2 million, acquisition and integration expenses of $1.1 million, environmental costs of $0.3 million, operational improvement gains of $0.4 million, and accelerated depreciation charges of $3.0 million.
59
NOTES TO CONSOLIDATED FINANCIAL STATEMENTS—CONTINUED
In 2015, segment operating profit for Specialty Solutions includes restructuring and severance cost of $2.6 million, operational improvement costs of $3.1 million and environmental remediation charges of $0.2 million while the Performance Materials operating profit includes asset impairment and facility closure costs of $20.0 million, accelerated depreciation costs of $5.8 million, operational improvement costs of $1.9 million, restructuring and severance charges of $3.2 million and environmental remediation charges of $2.8 million.
The following table sets forth a summary of operations by segment and a reconciliation of segment sales to consolidated sales and segment operating profit to consolidated income from continuing operations before income taxes.
2017 | 2016 | 2015 | |||||||||
(Dollars in millions) | |||||||||||
Net Sales | |||||||||||
Specialty Solutions | $ | 441.4 | $ | 404.3 | $ | 419.9 | |||||
Performance Materials | 341.7 | 355.6 | 418.1 | ||||||||
Total Net Sales | $ | 783.1 | $ | 759.9 | $ | 838.0 | |||||
Segment Operating Profit | |||||||||||
Specialty Solutions | 59.9 | 59.8 | 54.1 | ||||||||
Performance Materials | $ | (12.6 | ) | $ | 8.5 | $ | (19.3 | ) | |||
Total segment operating profit | 47.3 | 68.3 | 34.8 | ||||||||
Interest expense | (21.5 | ) | (24.7 | ) | (28.3 | ) | |||||
Corporate expenses | (24.5 | ) | (25.8 | ) | (23.7 | ) | |||||
Corporate severance | (2.9 | ) | (4.9 | ) | — | ||||||
Shareholder activist costs | — | — | (1.9 | ) | |||||||
Operational improvement costs | — | .8 | (.4 | ) | |||||||
Asset impairment | (1.8 | ) | — | (.6 | ) | ||||||
Acquisition and integration related expense | (.3 | ) | (.9 | ) | (.4 | ) | |||||
Debt issuance costs write-off | — | (2.9 | ) | (.6 | ) | ||||||
Pension settlement | $ | (.4 | ) | $ | — | $ | — | ||||
Income (Loss) From Continuing Operations Before Income Taxes | $ | (4.1 | ) | $ | 9.9 | $ | (21.1 | ) | |||
2017 | 2016 | 2015 | |||||||||
(Dollars in millions) | |||||||||||
Capital Expenditures | |||||||||||
Specialty Solutions | $ | 13.4 | $ | 11.9 | $ | 10.6 | |||||
Performance Materials | 10.9 | 11.9 | 10.5 | ||||||||
Corporate | .8 | 1.8 | 2.9 | ||||||||
$ | 25.1 | $ | 25.6 | $ | 24.0 | ||||||
Depreciation and Amortization | |||||||||||
Specialty Solutions | $ | 14.5 | $ | 13.3 | $ | 6.0 | |||||
Performance Materials | 11.4 | 16.2 | 26.9 | ||||||||
Corporate | 2.0 | 1.1 | 1.1 | ||||||||
$ | 27.9 | $ | 30.6 | $ | 34.0 | ||||||
The Company does not disclose assets by business segment as the Chief Operating Decision Maker ("CODM"), its Chief Executive Officer ("CEO"), does not use this information to make decisions, assess performance or allocate resources by business segment.
60
NOTES TO CONSOLIDATED FINANCIAL STATEMENTS—CONTINUED
GEOGRAPHIC INFORMATION
2017 | 2016 | 2015 | |||||||||
(Dollars in millions) | |||||||||||
Net Sales | |||||||||||
United States | $ | 481.7 | $ | 454.0 | $ | 490.4 | |||||
Europe | 141.4 | 129.9 | 167.6 | ||||||||
Asia | 160.0 | 176.0 | 180.0 | ||||||||
$ | 783.1 | $ | 759.9 | $ | 838.0 | ||||||
Segment Operating Profit | |||||||||||
United States | $ | 38.4 | $ | 56.7 | $ | 31.5 | |||||
Europe | 17.4 | 10.9 | (5.3 | ) | |||||||
Asia | (8.5 | ) | 0.7 | 8.6 | |||||||
$ | 47.3 | $ | 68.3 | $ | 34.8 | ||||||
Total Assets | |||||||||||
United States | $ | 313.5 | $ | 362.4 | $ | 311.1 | |||||
Europe | 205.9 | 197.9 | 199.2 | ||||||||
Asia | 93.4 | 127.0 | 176.9 | ||||||||
$ | 612.8 | $ | 687.3 | $ | 687.2 | ||||||
Long-Lived Assets | |||||||||||
United States | $ | 124.7 | $ | 125.3 | $ | 125.9 | |||||
Europe | 49.8 | 45.3 | 45.9 | ||||||||
Asia | 34.4 | 32.1 | 43.8 | ||||||||
$ | 208.9 | $ | 202.7 | $ | 215.6 | ||||||
Note Q—Financial Instruments and Fair Value Measurements
Financial Risk Management Objectives and Policies
The Company is exposed primarily to credit, interest rate, and foreign currency rate risks, which arise in the normal course of business.
Credit Risk
Credit risk is the potential financial loss resulting from the failure of a customer or counterparty to settle its financial and contractual obligations with the Company as and when they fall due. The primary credit risk for the Company is its accounts receivable and notes receivable, which are generally unsecured. The Company has established credit limits for customers and monitors their balances to mitigate its risk of loss. Concentrations of credit risk with respect to accounts receivable are generally limited due to the wide variety of customers and markets using the Company's products. There was one Performance Materials' customer that represented approximately 10% of the Company’s consolidated net sales during the years ended November 30, 2017 and 2016. There was no customer who represented more than 10% of the Company’s net trade receivables at November 30, 2017 or 2016.
Interest Rate Risk
The Company’s exposure to the risk of changes in market interest rates relates primarily to the Company’s $350.0 million Term Loan B (balance of $345.6 million at November 30, 2017) and various foreign subsidiary borrowings, which bear interest at variable rates, approximating market interest rates. The Term Loan B has a LIBOR floor of 1.00%, which eliminates the variability in interest rate changes on Eurodollar loans as long as LIBOR is under 1.00%. As of November 30, 2017, LIBOR was slightly above 1.00%, which had a slight impact on the Company's interest expense.
Foreign Currency Rate Risk
The Company incurs foreign currency risk on sales and purchases denominated in other than the functional currency. The currencies giving rise to this risk are primarily the Euro, Great Britain Pound Sterling, Renminbi, and Thai Baht.
Foreign currency exchange contracts are used by the Company to manage risks from the change in market exchange rates on cash payments by the Company's foreign subsidiaries and U.S. Dollar cash holdings in foreign locations. These forward contracts are used on a continuing basis for periods of approximately thirty days, consistent with the underlying hedged transactions. Hedging limits the impact of foreign exchange rate movements on the Company’s operating results. The counterparties to these instruments are investment grade financial institutions and the Company does not anticipate any non-performance. The Company maintains control over the size of positions entered into with any one counterparty and regularly monitors the credit rating of these institutions. Such instruments are not purchased or sold for trading purposes. These contracts are not designated as hedging instruments and changes in fair value of these instruments are recognized in earnings immediately. Net gains on foreign currency contracts that were recorded in the Consolidated Statement of Operations, as a component of other income, for the year ended were $0.7 million November 30, 2017. Net gains (losses) on foreign currency contracts for November 30, 2016 were not material.
61
NOTES TO CONSOLIDATED FINANCIAL STATEMENTS—CONTINUED
Derivative Instruments
The Company recognizes the fair value of qualifying derivative instruments as either an asset or a liability within its statement of financial position. For derivative instruments not designated as hedges, the change in fair value of the derivative is recognized in earnings each reporting period. The Company defines fair value as the price that would be received to transfer an asset or that would be paid to transfer a liability in an orderly transaction between market participants at the measurement date. The Company uses a hierarchy of valuation inputs to measure fair value.
The hierarchy prioritizes the inputs into three broad levels:
Level 1 inputs—Quoted market prices in active markets for identical assets or liabilities.
Level 2 inputs—Observable market based inputs or unobservable inputs that are corroborated by market data.
Level 3 inputs—Unobservable inputs that are not corroborated by market data.
The fair value of derivative financial instruments recognized in the Consolidated Statements of Financial Position are as follows:
Notional Amount | Other Current Assets | Other Current Liabilities | Type of Hedge | Term | |||||||||||
(Dollars in millions) | |||||||||||||||
Derivatives - November 30, 2017 | |||||||||||||||
Currency Forward Contracts | $ | 9.8 | $ | .1 | $ | — | Cash Flow | 30 days | |||||||
Total | $ | 9.8 | $ | .1 | $ | — | |||||||||
Derivatives - November 30, 2016 | |||||||||||||||
Foreign currency exchange contracts | $ | 7.6 | $ | — | $ | — | Cash Flow | 30 days | |||||||
Total | $ | 7.6 | $ | — | $ | — | |||||||||
Fair Value Measurements
The Company uses the market approach and the income approach to value assets and liabilities as appropriate. The following financial assets and liabilities are measured and presented at fair value on a recurring basis as of November 30, 2017 and November 30, 2016:
(Dollars in millions) | Fair Value | Level 1 | Level 2 | Level 3 | |||||||||||
(Dollars in millions) | |||||||||||||||
Fair Value Measurements - November 30, 2017 | |||||||||||||||
Financial Assets | |||||||||||||||
Foreign currency exchange contracts | $ | .1 | $ | .1 | $ | — | $ | — | |||||||
Total Assets | $ | .1 | $ | .1 | $ | — | $ | — | |||||||
Financial Liabilities | |||||||||||||||
Contingent consideration | $ | 1.0 | $ | — | $ | — | $ | 1.0 | |||||||
Total Liabilities | $ | 1.0 | $ | — | $ | — | $ | 1.0 | |||||||
Fair Value Measurements - November 30, 2016 | |||||||||||||||
Financial Assets | |||||||||||||||
Foreign currency exchange contracts | $ | — | $ | — | $ | — | $ | — | |||||||
Total Assets | $ | — | $ | — | $ | — | $ | — | |||||||
Financial Liabilities | |||||||||||||||
Contingent Consideration | $ | — | $ | — | $ | — | $ | — | |||||||
Total Liabilities | $ | — | $ | — | $ | — | $ | — | |||||||
During fiscal year 2017 and 2016, we did not record any material other-than-temporary impairments on financial assets required to be measured at fair value on a nonrecurring basis.
In connection with the Creole acquisition, the Company recorded a contingent consideration liability with a fair value of $1.0 million as of November 30, 2017. Under the contingent consideration agreement, the amounts to be paid are based upon actual financial results of the acquired product sales over a two-year period. The fair value of the contingent consideration is a Level 3 valuation and fair valued using a probability weighted discounted cash flow analysis. There were no transfers into or out of Level 3 during the 2017 or 2016.
The fair value of the Company’s Term Loan at November 30, 2017 approximated $349.9 million, which is more than the book value of $345.6 million as a result of prevailing market rates on the Company’s debt. The carrying value of amounts due banks approximates fair value due to their short-term nature. The fair value of the Term Loan is based on market price information and is measured using the last available trade of the instrument on a secondary market in each respective period and therefore is considered a Level 2 measurement. The fair value is not indicative of the amount that the Company would have to pay to redeem these instruments since they are infrequently traded and are not
62
NOTES TO CONSOLIDATED FINANCIAL STATEMENTS—CONTINUED
callable at this value. The fair value of the Company's capital lease obligation approximates its carrying amount based on estimated borrowing rates to discount the cash flows to their present value.
Note R - Treasury Stock Purchases
The Company did not repurchase any shares during 2017 or 2016 under an approved plan. Shares acquired during 2017 and 2016 resulted from common shares deemed surrendered by employees in connection with the Company’s equity compensation and benefit plans to satisfy employee income tax obligations upon vesting.
Note S - Acquisitions
On March 13, 2017, the Company acquired the assets of Creole Chemicals, Inc., a producer of specialty oilfield additives based in Houston, Texas. This acquisition allows the Company to accelerate growth, round out its existing offerings and broaden its solutions portfolio in the oil and gas product line. Assets acquired included inventory and intellectual property. The Company paid $2.5 million cash, as well as contingent consideration that will be based on future profitability of acquired product sales over a two-year period. The acquisition date fair value of the contingent consideration was $0.7 million.
Note T - Subsequent Event
During December 2017, the Company prepaid $40.0 million of its outstanding Term Loan B principal balance. As a result the Company expects to reduce future interest expense by approximately $2.1 million annually. The Company determined that this prepayment constituted a partial extinguishment of debt and as such, expects to write-off approximately $0.6 million to $0.9 million of deferred financing fees in the first quarter of 2018.
On December 22, 2017, H.R.1 (the “Act”) formally known as the “Tax Cuts and Job Act” was enacted into law. The law includes significant changes to the U.S. corporate income tax system, including a Federal corporate rate reduction from 35% to 21%. The law also includes provisions that may partially offset the benefit of such rate reduction, including limitation on the deductibility of interest expense and executive compensation. The law will also transition the system of U.S. international taxation from a worldwide tax system to a territorial tax system. As a result of the transition from a worldwide tax system to a territorial tax system, the law also includes a one-time transition tax to be levied on accumulated earnings and profits of foreign jurisdictions. The Company would be subject to this tax liability however, the Company may be able to utilize federal net operating losses or foreign tax credits to pay for the liability. This change in tax law and rates will affect the book value of deferred tax assets and liabilities and our future effective tax rate beginning in the first quarter of 2018, the period of enactment. The change in the corporate income tax rate will lead to a contemporaneous re-measurement of deferred tax positions, which we expect will result in a tax benefit upon enactment related to the favorable rate differential between the current Federal tax rate and the future enacted tax rate. The Company estimates the re-measurement of its deferred tax liabilities to be an income tax benefit of $3.0 million to $5.0 million. The Company is continuing to analyze the impacts of the Act and will initially recognize its provisions in the first quarter of 2018.
OMNOVA SOLUTIONS INC.
Selected Quarterly Financial Data (Unaudited)
Three Months Ended | |||||||||||||||
2017 | February 28 | May 31 | August 31 | November 30 | |||||||||||
(Dollars in millions, except per share amounts) | |||||||||||||||
Net sales | $ | 174.6 | $ | 221.3 | $ | 200.9 | $ | 186.3 | |||||||
Gross profit(1)(2) | $ | 43.9 | $ | 53.2 | $ | 57.8 | $ | 45.9 | |||||||
Restructuring and severance | $ | 1.0 | $ | 3.6 | $ | 0.4 | $ | .6 | |||||||
Loss on asset sales | $ | — | $ | — | $ | — | $ | .4 | |||||||
Asset impairments and write-offs | $ | — | $ | 12.9 | $ | .4 | $ | 19.6 | |||||||
Net income (loss)(3) (4) | $ | 3.6 | $ | (6.3 | ) | $ | 7.9 | $ | (92.9 | ) | |||||
Net income (loss) per share(4) | |||||||||||||||
Basic and Diluted | $ | .08 | $ | (.14 | ) | $ | .18 | $ | (2.10 | ) | |||||
Common stock price range per share—high | $ | 10.05 | $ | 9.90 | $ | 10.15 | $ | 11.45 | |||||||
—low | $ | 8.60 | $ | 8.55 | $ | 8.40 | $ | 8.70 | |||||||
63
NOTES TO CONSOLIDATED FINANCIAL STATEMENTS—CONTINUED
Three Months Ended | |||||||||||||||
2016 | February 28 | May 31 | August 31 | November 30 | |||||||||||
(Dollars in millions, except per share amounts) | |||||||||||||||
Net sales | $ | 175.3 | $ | 202.0 | $ | 195.6 | $ | 187.0 | |||||||
Gross profit(1)(2) | $ | 44.3 | $ | 58.4 | $ | 52.1 | $ | 49.1 | |||||||
Restructuring and severance | $ | 1.8 | $ | 2.2 | $ | 1.3 | $ | 5.8 | |||||||
Asset sales | $ | — | $ | .1 | $ | — | $ | .2 | |||||||
Asset impairments and write-offs | $ | .4 | $ | — | $ | — | $ | 5.3 | |||||||
Debt issuance costs write-offs | $ | — | $ | — | $ | 1.7 | $ | 1.2 | |||||||
Net income (loss)(3) | $ | (1.1 | ) | $ | 7.2 | $ | 4.7 | $ | (11.2 | ) | |||||
Net income (loss) per share(4) | |||||||||||||||
Basic | $ | (.03 | ) | $ | .16 | $ | .11 | $ | (.25 | ) | |||||
Diluted | $ | (.03 | ) | $ | .16 | $ | .10 | $ | (.25 | ) | |||||
Common stock price range per share—high | $ | 7.43 | $ | 7.37 | $ | 10.21 | $ | 10.35 | |||||||
—low | $ | 4.69 | $ | 5.22 | $ | 5.95 | $ | 7.15 | |||||||
(1) | Gross profit excludes depreciation and amortization expense. Depreciation and amortization expense related to manufacturing facilities and equipment was $4.7 million, $4.8 million, $4.8 million, and $5.0 million for the three months ended February 28, 2017, May 31, 2017, August 31, 2017, and November 30, 2017 and $7.7 million, $4.9 million, $4.7 million, and $5.0 million for the three months ended February 29, 2016, May 31, 2016, August 31, 2016, and November 30, 2016, respectively. |
(2) | Gross profit includes net LIFO inventory reserve adjustments of $1.3 million of expense, $0.3 million of expense, $1.2 million of income, and $1.0 million of expense for the three months ended February 29, 2017, May 31, 2017, August 31, 2017 and November 30, 2017, respectively, and $0.5 million of income, $0.3 million of expense, $0.6 million of expense and $1.4 million of expense for the three months ended February 28, 2016, May 31, 2016, August 31, 2016, and November 30, 2016, respectively. |
(3) | The Company’s income tax expense was $83.7 million and $10.3 million for November 30, 2017 and 2016, respectively. The 2017 income tax expense significantly higher primarily as a result of a $79.9 million income tax expense related to valuation allowances on deferred tax assets. Of that amount, $75.7 million income tax expense was recorded in the U.S. during the fourth quarter of 2017. These valuation allowances are discussed in more detail under the heading "Item 7. Management Discussion & Analysis - Significant Accounting Estimates and Management Judgments - F) Income Taxes." |
(4) | The sum of the quarterly earnings per share amounts may not equal the annual amount due to changes in the number of shares outstanding during the year. |
Item 9. | Changes in and Disagreements with Accountants on Accounting and Financial Disclosure | |
There have been no changes in accountants or disagreements with the Company’s independent registered public accounting firm regarding accounting and financial disclosure matters during the two most recent years of the Company or during any period subsequent to the date of the Company’s most recent consolidated financial statements.
Item 9A. | Controls and Procedures | |
Management of the Company, including the Chief Executive Officer and the Chief Financial Officer, has evaluated the effectiveness of the Company’s disclosure controls and procedures as of November 30, 2017, using criteria set forth by the Committee of Sponsoring Organizations of the Treadway Commission (COSO) in Internal Control - Integrated Framework (2013). Based on its evaluation, management has determined that the Company’s disclosure controls and procedures are effective. Further, during the quarter ended November 30, 2017, there were no changes in the Company’s internal control over financial reporting that have materially affected, or are reasonably likely to materially affect, the Company’s internal control over financial reporting. Management’s annual report on the Company’s internal control over financial reporting and the attestation report of the Company’s independent registered public accounting firm are set forth in this report, respectively, and are incorporated herein by reference.
Item 9B. | Other Information | |
Not applicable.
PART III
64
Item 10. | Directors and Executive Officers of the Registrant | |
The below biographical information for OMNOVA's executive officers is given as of January 31, 2018. Except as otherwise indicated, each individual has held the same office during the preceding five-year period.
Anne P. Noonan, age 54, President and Chief Executive Officer of the Company as of December 1, 2016. Ms Noonan served as President of the Performance Chemicals business from September 2014 to December 2016. Ms. Noonan joined OMNOVA from Chemtura Corporation, a global manufacturer of specialty chemicals that was formed from the 2005 merger of Great Lakes Chemical Corp. and Crompton Corp. She most recently served as Senior Vice President and President of Chemtura’s Industrial Engineered Products business from October 2013 until September 2014. Prior roles at Chemtura include Vice President, Strategic Business Development and President, Great Lakes Solutions from 2012 until 2013; President, Great Lakes Solutions from 2009 until 2012; Group President, Polymer Additives from 2007 until 2009; and Vice President & General Manager, Flame Retardants & Brominated Performance Products from 2005 until 2007. Ms. Noonan held several senior management positions at Great Lakes Chemical Corp. from 1987 until 2005, and began her career as an Analytical Research Chemist with McNeil Specialty Chemical Company and Squibb-Linson, Co. from 1985 until 1987.
Paul F. DeSantis, age 53, Senior Vice President and Chief Financial Officer; Treasurer since July 2014. Mr. DeSantis joined the Company from Bob Evans Farms, Inc., a restaurants owner/operator and packaged foods business, where he served as Chief Financial Officer from March 2011 until June 2014. Prior to Bob Evans Farms, he was Chief Financial Officer for A. Schulman, Inc., a leading global plastic compounding company, from 2006 until 2011. Previously, he served in senior finance roles for The Scotts-Miracle-Gro Co., a leading supplier of branded consumer products for lawn and garden care, from 1997 until 2006; and for the Kellogg Company, a manufacturer and marketer of ready-to-eat cereal and convenience foods, from 1993 until 1997.
James C. LeMay, age 61, Senior Vice President, Corporate Development; General Counsel of OMNOVA Solutions Inc. since December 1, 2000. Previously, Mr. LeMay was Senior Vice President, Law and General Counsel of OMNOVA Solutions Inc. since its formation. Prior to the spin-off of OMNOVA Solutions in October 1999, Mr. LeMay served as Assistant General Counsel of GenCorp Inc.
Marshall D. Moore, age 53, Chief Technology Officer and Senior Vice President of Operations as of January 11, 2018. Mr. Moore served as Senior Vice President and Chief Technology Officer from January 2017 to January 2018 and served as Vice President, Technology and Innovation Excellence for Performance Chemicals from March 2015 to January 2017. Prior to joining OMNOVA, Mr. Moore served in a range of leadership roles at Chemtura Corporation including Director of Research & Development, Advocacy and Marketing from September 2008 to December of 2014, and Vice President of Quality and Process Excellence from July 2003 to August 2008. Prior roles included Global Technology Director and Six Sigma Master Black Belt at GE Specialty Chemicals from February 2000 to July 2003, and Global Product Design Leader at GE Plastics from to 1996 to 2000.
Michael A. Quinn, age 54, Senior Vice President and Chief Human Resources Officer since October 2013. Prior to joining OMNOVA, Mr. Quinn spent 28 years in human resources positions with high technology, manufacturing, and service companies. Most recently, Mr. Quinn had served since January 2009 as Vice President, Human Resources for the Specialty Diagnostics Group of Thermo Fisher Scientific (the world leader in serving science through products and services that help customers solve complex analytical challenges, improve patient diagnostics, and increase laboratory productivity). Previously, Mr. Quinn had served as Vice President, Talent Management and Development for Thermo Fisher Scientific since June 2007. Before joining Thermo Fisher Scientific, Mr. Quinn spent four years as Director, Talent Acquisition and Development for the Integrated Defense Systems business of Raytheon Company (a leading defense and aerospace company).
The Company’s executive officers generally hold terms of office of one year and/or until their successors are elected.
The information required by this item is set forth in the following sections of OMNOVA’s Definitive Proxy Statement for the 2018 Annual Meeting of Shareholders to be held March 22, 2018 (the “2018 Proxy Statement”) and these sections are incorporated herein by reference:
• | “Nominees for election at this Annual Meeting” |
• | “Continuing directors not up for election” |
• | “Ownership of OMNOVA Equity Securities - Section 16(a) beneficial ownership reporting compliance” |
• | “Corporate Governance Documents - Business Conduct Policies (Code of Ethics)” |
• | “Audit Matters - Audit committee independence and financial experts” |
OMNOVA expects to file the 2018 Proxy Statement with the SEC on or before February 9, 2018. Any amendment to, or waiver from a provision of, the Code of Ethics that applies to its Chief Executive Officer, Chief Financial Officer, or any other executive officer or director, will be promptly disclosed on its website (www.omnova.com) as required by laws, rules and regulations of the SEC.
Item 11. | Executive Compensation | |
The information required by this item is set forth in the following sections of the 2018 Proxy Statement and these sections are incorporated herein by reference:
• | “Compensation Discussion & Analysis” |
• | “Compensation of Executive Officers” |
• | “Compensation & Organization Committee Report” |
• | “Corporate Governance and the Board - Risk management - Oversight of compensation practices and risks” |
65
Item 12. | Security Ownership of Certain Beneficial Owners and Management and Related Shareholder Matters | |
The information required by this item is set forth in the section captioned “Ownership of OMNOVA Equity Securities” of the 2018 Proxy Statement and is incorporated herein by reference.
Equity Compensation Plan Information
OMNOVA is currently authorized to issue is common shares under OMNOVA’s 2017 Equity Incentive Plan (approved by the Company's Shareholders in 2017), Third Amended and Restated 1999 Equity and Performance Incentive Plan (approved by the Company’s shareholders in 2012), and OMNOVA’s Employee Share Purchase Plan (approved by the Company’s shareholders in 2016).
The following table sets forth certain information as of November 30, 2017 concerning those plans.
Plan Category | Number of securities to be issued upon exercise of outstanding options, warrants and rights | Weighted average exercise price of outstanding options, warrants and rights | Number of securities remaining available for issuance under equity compensation plans | ||
Equity compensation plans approved by security holders | 567,600 | $7.23 | 2,565,582 | ||
Equity compensation plans not approved by security holders | N/A | N/A | N/A | ||
Total | 567,600 | $7.23 | 2,565,582 | ||
Item 13. | Certain Relationships and Related Transactions, Director Independence | |
The information required by this item is set forth in the following sections of the 2018 Proxy Statement and these sections are incorporated herein by reference:
• | “Corporate Governance and the Board - Director independence” |
• | “Corporate Governance and the Board - Related-party transactions” |
Item 14. | Principal Accountant Fees and Services | |
The information required by this item is set forth in the section captioned “Audit Matters” of the 2018 Proxy Statement and is incorporated herein by reference.
PART IV
Item 15. | Exhibits and Financial Statement Schedules | |
(a)(1) Consolidated Financial Statements:
The following consolidated financial statements of OMNOVA Solutions Inc. are included in Item 8:
Consolidated Statements of Operations for the years ended November 30, 2017, 2016, and 2015
Consolidated Statements of Comprehensive Income (Loss) for the years ended November 30, 2017, 2016, and 2015
Consolidated Balance Sheets at November 30, 2017 and 2016
Consolidated Statements of Shareholders’ Equity for the years ended November 30, 2017, 2016, and 2015
Consolidated Statements of Cash Flows for the years ended November 30, 2017, 2016, and 2015
Notes to Consolidated Financial Statements
(a)(2) Schedules
All schedules for which provision is made in the applicable accounting regulation of the Securities and Exchange Commission are either presented in the Company's consolidated financial statements or are not required under the related instructions or are inapplicable and therefore have been omitted.
EXHIBIT INDEX
(a)(3) Exhibits
Exhibit | Description | |
CHARTER DOCUMENTS | ||
Amended and Restated Articles of Incorporation of OMNOVA Solutions Inc. (incorporated by reference to the same numbered exhibit to the Company’s Annual Report on Form 10-Q for the fiscal quarter ended May 31, 2016 (File No. 1-15147)). | ||
Amended and Restated Code of Regulations of OMNOVA Solutions Inc. (incorporated by reference to the same numbered exhibit to the Company's Annual Report on Form 10-Q for the fiscal quarter ended May 31, 2016 (File No. 1-15147)) | ||
66
MATERIAL CONTRACTS | ||
Form of Amended and Restated Severance Agreement granted to certain executive officers of OMNOVA Solutions (incorporated by reference to Exhibit 10.6 to the Company’s Annual Report on Form 10-K for the year ended November 30, 2008 (File No. 1-15147)). | ||
OMNOVA Solutions 2017 Equity Incentive Plan (incorporated by reference to Annex C to the Company's 2017 Proxy Statement filed with the Securities and Exchange Commission on February 3, 2017 (File No. 1-15147). | ||
OMNOVA Solutions Third Amended and Restated 1999 Equity and Performance Incentive Plan (incorporated by reference to Appendix C to the Company's 2012 Proxy Statement filed with the Securities and Exchange Commission on February 3, 2012 (File No. 1-15147). | ||
OMNOVA Solutions Deferred Compensation Plan for Nonemployee Directors, as amended and restated effective January 1, 2009 (incorporated by reference to Exhibit 10.8 to the Company’s Annual Report on Form 10-K for the year ended November 30, 2008 (File No. 1-15147)). | ||
Retirement Plan for Nonemployee Directors of OMNOVA Solutions, as amended and restated effective January 1, 2009 (incorporated by reference to Exhibit 10.9 to the Company’s Annual Report on Form 10-K for the year ended November 30, 2008 (File No. 1-15147)). | ||
Savings Benefits Restoration Plan for Salaried Employees of OMNOVA Solutions (incorporated by reference to Exhibit 10.11 to the Company’s Annual Report on Form 10-K for the year ended November 30, 2008 (File No. 1-15147)). | ||
Pension Benefits Restoration Plan for Salaried Employees of OMNOVA Solutions (incorporated by reference Exhibit 10.12 to the Company’s Annual Report on Form 10-K for the year ended November 30, 2008 (File No. 1-15147)). | ||
OMNOVA Solutions Corporate Officers Severance Plan, effective January 1, 2009 (incorporated by reference to Exhibit 10.13 to the Company’s Annual Report on Form 10-K for the year ended November 30, 2008 (File No. 1-15147)). | ||
OMNOVA Solutions Long-Term Incentive Program, as amended and restated effective January 19, 2012 (incorporated by reference to Appendix B to the Company’s 2012 Proxy Statement filed with the Securities and Exchange Commission on February 3, 2012 (File No. 1-15147)). | ||
Form of Restricted Share Units Agreement (for restricted share units grants issued to executive officers after January 1, 2018) (filed herewith). | ||
Form of Performance Shares Agreement (for performance share grants issued to executive officers after January 1, 2018) (filed herewith). | ||
Form of Restricted Share Units Agreement (for restricted share units grants issued to non-executive directors after January 1, 2018) (filed herewith) | ||
Form of Deferred Share Agreement (incorporated by reference to Exhibit 10.22 to the Company’s Annual Report on Form 10-K for the year ended November 30, 2009 (File No. 1-15147)). | ||
Form of Performance Share Agreement (incorporated by reference to Exhibit 10.23 to the Company’s Annual Report on Form 10-K for the year ended November 30, 2012 (File No. 1-15147)). | ||
Form of Restricted Stock Agreement (incorporated by reference to Exhibit 10.24 to the Company’s Annual Report on Form 10-K for the year ended November 30, 2011 (File No. 1-15147)). | ||
Form of Restricted Share Units Agreement (incorporated by reference to Exhibit 10.12 to the Company’s Annual Report on Form 10-K for the year ended November 30, 2016 (File No. 1-15147)). | ||
Form of Indemnification Agreement by and among OMNOVA Solutions Inc. and the directors and officers of the Company (incorporated by reference to Exhibit 10.39 to the Company’s Annual Report on Form 10-K for the year ended November 30, 2015). | ||
OMNOVA Solutions (incorporated by reference to Appendix A to the Company’s 2017 Proxy Statement filed with the Securities and Exchange Commission on February 3, 2017 (File No. 1-15147)). | ||
Separation Agreement dated November 6, 2016 by and between OMNOVA Solutions Inc. and Kevin M. McMullen (incorporated by reference as Exhibit 10.14 to the Company's Annual Report on Form 10-K for the year ended November 30, 2016) | ||
Chief Executive Officer Employment Agreement dated December 1, 2016 by and between OMNOVA Solutions Inc. and Anne P. Noonan (incorporated by reference as Exhibit 10.15 to the Company's Annual Report on Form 10-K for the year ended November 30, 2016) | ||
Second Amended and Restated Term Loan Credit Agreement dated as of December 9, 2010 by and among OMNOVA Solutions Inc., as Borrower, the financial institutions party thereto as Lenders, and Deutsche Bank Trust Company Americas, as agent for the Lenders (incorporated by reference to Exhibit 10.30 to the Company’s Annual Report on Form 10-K for the year ended November 30, 2010 (File No. 1-15147)). | ||
Amendment dated March 7, 2013, to Second Amended and Restated Term Loan Credit Agreement dated as of December 9, 2010, by and among OMNOVA Solutions Inc., as Borrower, the financial institutions party thereto, as Lenders, and Deutsche Bank Trust Company Americas, as agent for the Lenders (incorporated by reference to Exhibit 10.33 to the Company’s Annual Report on Form 10-K for the year ended November 30, 2013 (File No. 1-15147)). | ||
Amendment No. 2, dated March 28, 2014, to Second Amended and Restated Term Loan Credit Agreement dated as of December 9, 2010, by and among OMNOVA Solutions Inc., as Borrower, the financial institutions party thereto, as Lenders, and Deutsche Bank Trust Company Americas, as agent for the Lenders (incorporated by reference Exhibit 10.35 to the Company’s Annual Report on Form 10-K for the year ended November 30, 2014 (File No. 1-15147)). | ||
Amendment No. 3, dated August 26, 2016, to Second Amended and Restated Credit Agreement dated as of December 9, 2010, by and among OMNOVA Solutions Inc., as Borrower, the financial institutions party thereto, as Lenders, and Deutsche Bank Trust Company Americas, as agent for the Lenders (incorporated by reference to the Exhibit 10.1 to the Company’s Quarterly Report on Form 10-Q for the quarter ended August 31, 2016 (File No. 1-15147)). | ||
67
Consent to Limited Release of Collateral, dated November 21, 2014, to Second Amended and Restated Term Loan Credit Agreement dated as of December 9, 2010, by and among OMNOVA Solutions Inc., as Borrower, the financial institutions party thereto, as Lenders, and Deutsche Bank Trust Company Americas, as agent for the Lenders (incorporated by reference to Exhibit 10.36 to the Company’s Annual Report on Form 10-K for the year ended November 30, 2014 (File No. 1-15147)). | ||
Third Amended and Restated Senior Secured Credit Facility dated as of November 30, 2016 by and among OMNOVA Solutions Inc. as borrower, the financial institutions party thereto as lenders, and JPMorgan Chase Bank N.A., as agent for the lenders (incorporated by reference to the Exhibit 10.20 to the Company's Annual Report on Form 10-K for the year ended November 30, 2016 (File No. 1-15147) | ||
Computation of Ratio of earnings to fixed charges. | ||
SUBSIDIARIES OF THE REGISTRANT | ||
Listing of Subsidiaries. | ||
CONSENT OF INDEPENDENT REGISTERED PUBLIC ACCOUNTING FIRM | ||
Consent of Ernst & Young LLP, Independent Registered Public Accounting Firm. | ||
POWER OF ATTORNEY | ||
Powers of Attorney. | ||
CERTIFICATIONS | ||
Principal Executive Officer’s Certifications pursuant to Section 302 of the Sarbanes-Oxley Act of 2002. | ||
Principal Financial Officer’s Certifications pursuant to Section 302 of the Sarbanes-Oxley Act of 2002. | ||
Certification pursuant to 18 U.S.C. Section 1350, as adopted pursuant to Section 906 of the Sarbanes-Oxley Act of 2002. | ||
101 | The following financial information from our Annual Report on Form 10-K for 2016, filed with the SEC on February 2, 2018, formatted in XBRL: (i) the Consolidated Statements of Operations for the years ended November 30, 2017, 2016, and 2015; (ii) the Consolidated Statements of Comprehensive Income (Loss) for the years ended November 30, 2017, 2016, and 2015; (iii) the Consolidated Balance Sheets at November 30, 2017 and 2016; (iv) the Consolidated Statements of Shareholders’ Equity for the years ended November 30, 2017, 2016, and 2015; (v) the Consolidated Statements of Cash Flows for the years ended November 30, 2017, 2016, and 2015; and (vi) the Notes to the Consolidated Financial Statements. | |
The Company will supply copies of any of the foregoing exhibits to any shareholder upon receipt of a written request addressed to OMNOVA Solutions Inc., 25435 Harvard Road, Beachwood, Ohio 44122-6201, Attention: Corporate Secretary, and payment of $1 per page to help defray the costs of handling, copying, and return postage. | ||
† | Management contract or compensatory arrangement. | |
68
SIGNATURES
Pursuant to the requirements of Section 13 or 15(d) of the Securities Exchange Act of 1934, the registrant has duly caused this Report to be signed on its behalf by the undersigned, thereunto duly authorized.
OMNOVA Solutions Inc. | ||||
Date: | February 2, 2018 | |||
By | /s/ Anne P. Noonan | |||
Anne P. Noonan President and Chief Executive Officer and Director(Principal Executive Officer) | ||||
By | /s/ Paul F. DeSantis | |||
Paul F. DeSantis Senior Vice President and Chief Financial Officer; Treasurer (Principal Financial Officer) | ||||
By | /s/ Donald B. McMillan | |||
Donald B. McMillan Chief Accounting Officer (Principal Accounting Officer) | ||||
Pursuant to the requirements of the Securities Exchange Act of 1934, this Report has been signed below by the following persons on behalf of the registrant and in the capacities and on the dates indicated.
69
Signature | Title | Date | ||
* | Chairman and Director | February 2, 2018 | ||
William R. Seelbach | ||||
* | Director | February 2, 2018 | ||
D. J. D’Antoni | ||||
* | Director | February 2, 2018 | ||
Janet Plaut Giesselman | ||||
* | Director | February 2, 2018 | ||
Joseph M. Gingo | ||||
* | Director | February 2, 2018 | ||
Michael J. Merriman | ||||
* | Director | February 2, 2018 | ||
James A. Mitarotonda | ||||
* | Director | February 2, 2018 | ||
Steven W. Percy | ||||
* | Director | February 2, 2018 | ||
Larry B. Porcellato | ||||
* | Director | February 2, 2018 | ||
Allan R. Rothwell | ||||
* | Director | February 2, 2018 | ||
Robert A. Stefanko | ||||
*Signed by the undersigned as attorney-in-fact and agent for the Directors indicated. | ||||
/s/ James. C. LeMay | February 2, 2018 | |||
James C. LeMay | ||||
70