Attached files
Table of Contents
SECURITIES AND EXCHANGE COMMISSION
Washington, D.C. 20549
FORM 10-K
ANNUAL REPORT PURSUANT TO SECTION 13 OR 15(d)
OF THE SECURITIES EXCHANGE ACT OF 1934
| For the year ended November 30, 2010 | Commission File Number 1-15147 |
OMNOVA Solutions Inc.
(Exact name of registrant as specified in its charter)
| Ohio | 34-1897652 | |
| (State of Incorporation) | (I.R.S. Employer Identification No.) | |
| 175 Ghent Road, Fairlawn, Ohio | 44333-3300 | |
| (Address of principal executive offices) | (Zip Code) | |
Registrant’s telephone number, including area code (330) 869-4200
Securities registered pursuant to Section 12(b) of the Act:
| Title of each class |
Name of each exchange on which registered | |
| Common Stock, par value 10¢ per share |
The New York Stock Exchange |
Securities registered pursuant to Section 12(g) of the Act: None
Indicate by check mark if the registrant is a well-known seasoned issuer, as defined in Rule 405 of the Securities Act. Yes ¨ No þ
Indicate by check mark if the registrant is not required to file reports pursuant to Section 13 or Section 15(d) of the Act. Yes ¨ No þ
Indicate by check mark whether the registrant (1) has filed all reports required to be filed by Section 13 or 15(d) of the Securities Exchange Act of 1934 during the preceding 12 months (or for such shorter period that the registrant was required to file such reports), and (2) has been subject to such filing requirements for the past 90 days. Yes þ No ¨
Indicate by check mark if disclosure of delinquent filers pursuant to Item 405 of Regulation S-K is not contained herein, and will not be contained, to the best of registrant’s knowledge, in definitive proxy or information statements incorporated by reference in Part III of this Form 10-K or any amendment to this Form 10-K. Yes þ No ¨
Indicate by check mark whether the registrant has submitted electronically and posted on its corporate website, if any, interactive data file required to be submitted and posted pursuant to Rule 405 of Regulation S-T (232.405 of this chapter) during the preceding 12 months (or for such shorter period that the registrant was required to submit and post such files.) Yes ¨ No ¨
Indicate by check mark whether the Registrant is a large accelerated filer, an accelerated filer, or a non-accelerated filer. See definition of “accelerated filer and large accelerated filer” in Rule 12b-2 of the Exchange Act (check one):
| Large accelerated filer ¨ |
Accelerated filer þ | Non-accelerated filer ¨ | Smaller reporting company ¨ | |||
| (do not check if a smaller reporting company) |
Indicate by check mark whether the registrant is a shell company (as defined in Rule 12-b of the Exchange Act) Yes ¨ No þ
The aggregate market value of the voting stock held by nonaffiliates of the registrant was $348,991,721 based on the closing price per share of $8.03 on May 28, 2010, the last business day of the registrant’s most recently completed second quarter.
As of January 18, 2011, there were 45,001,085 outstanding shares of the Company’s Common Stock, 10¢ par value.
DOCUMENTS INCORPORATED BY REFERENCE
Portions of the 2011 Proxy Statement of OMNOVA Solutions Inc. are incorporated into Part III of this Report.
Table of Contents
OMNOVA Solutions Inc.
Annual Report on Form 10-K
For the Year Ended November 30, 2010
Table of Contents
PART I
| Item 1. | Business |
Introduction
OMNOVA Solutions Inc. (referred to in this report as OMNOVA Solutions, OMNOVA, the Company, we or our) became an independent publicly-traded company on October 1, 1999, when it was spun-off by GenCorp Inc., the former parent company. OMNOVA Solutions is incorporated under the laws of the State of Ohio, and its headquarters is located at 175 Ghent Road, Fairlawn, Ohio 44333.
OMNOVA Solutions is an innovator of emulsion polymers, specialty chemicals and decorative and functional surfaces for a variety of commercial, industrial and residential end uses. Our products provide a variety of important functional and aesthetic benefits to hundreds of products that people use daily. We hold leading positions in key market categories, which have been built through innovative products, customized product solutions, strong technical expertise, well-established distribution channels, recognized brands and long-standing customer relationships. We utilize 16 strategically located manufacturing, technical and other facilities in North America, Europe and Asia to service our broad customer base.
OMNOVA operates two business segments: Performance Chemicals and Decorative Products. Of our 2010 net sales, 62% were derived from the Performance Chemicals segment and 38% were derived from the Decorative Products segment. Financial information relating to the Company’s business segments is set forth in Note O to the Consolidated Financial Statements of this report.
Performance Chemicals
Background
Our Performance Chemicals segment began in 1952 as part of GenCorp (then known as The General Tire & Rubber Company). Initially, the business focused on the manufacture of styrene butadiene latex for the paper industry and styrene butadiene vinyl pyridine latex for tire cord adhesives in a single facility in Mogadore, Ohio. Since that time, the business has grown through internal development and acquisitions to include global manufacturing capabilities and numerous chemistries and product applications.
Products
OMNOVA Solutions’ Performance Chemicals segment produces a broad range of emulsion polymers and specialty chemicals based primarily on styrene butadiene (SB), styrene butadiene acrylonitrile (SBA), styrene butadiene vinyl pyridine, polyvinyl acetate, acrylic, styrene acrylic, vinyl acrylic, glyoxal, fluorochemical and hollow plastic pigment chemistries. We are North America’s second largest producer of SB latex and a leading supplier of SB latex to the paper and specialty markets. We operate well maintained, strategically located, cost competitive production facilities. Our custom-formulated products are tailored for coatings, binders and adhesives, which are used in paper, carpet, nonwovens, construction, oil/gas drilling services, adhesives, tape, tire cord, floor polish, textiles, graphic arts, plastic parts, bio-based polymers and various other specialty applications. Our products provide a variety of functional properties to enhance our customers’ products, including greater strength, adhesion, dimensional stability, water resistance, flow and leveling, improved processibility and enhanced appearance. Our Performance Chemicals segment is recognized for its core capabilities in emulsion polymerization and emulsion polymer technology and for its ability to rapidly develop and deliver highly customized products that provide innovative and value-added solutions to customers.
1
Table of Contents
The following table shows major Performance Chemicals products, end-use applications and brand names:
| Product Category |
% of Performance Chemicals Fiscal 2010 Net Sales |
Primary Products |
End-use Applications |
Brand Names | ||||
| Paper and Carpet Chemicals | 62.5% | SB and SBA latex coating binders, carpet backing binders and paper chemicals including crosslinkers, lubricants, other coating additives and hollow plastic pigments | Magazines, catalogs, direct mail advertising, brochures and printed reports, specialty papers, food cartons, household and other consumer and industrial packaging, and residential and commercial carpet | GENCAL, GENFLO, GENCRYL, GENCRYL PT, NOVAGREEN, REACTOPAQUE, SUNKOTE, SUNBOND, SUNKEM, UNIQ-PRINT, SEQUABOND, SUNREZ, SEQUAREZ, OMNABLOC, OMNAGLIDE, OMNATUF | ||||
| Specialty Chemicals |
37.5% | SB, SBA, styrene butadiene vinyl pyridine, acrylic, vinyl acrylic, styrene acrylic, and polyvinyl acetate emulsion polymers, glyoxal resins, silicone emulsions, polyethylene resins, fluorochemicals and fluorosurfactants | Nonwovens (such as hygiene products, engine filters, roofing mat and scrub pads), construction, adhesives, masking tapes, tire cord, floor polish, textiles, graphic arts, oil/gas drilling services and plastic part coatings | GENFLO, GENCRYL, GENTAC, OMNAGLO, OMNAPEL, SEQUABOND, SUNCRYL, SECOAT, SECRYL, MOR-GLO, MOR-SHINE, MOR-FLO, NOVACRYL, ACRYGEN, MYKON, PERMAFRESH, SEQUAPEL, POLYFOX, X-CAPE, GENGLAZE, MYKOSOFT, MYKOSIL, NOVANE, GENCEAL | ||||
Paper and Carpet Chemicals. OMNOVA is a leading North American supplier of custom-formulated SB and SBA latex and hollow plastic pigments for paper and paperboard coatings. In addition, we produce a broad variety of specialty chemical additives for coating applications in the paper industry. Our commitment to product innovation has enhanced our market position by creating products for the paper industry that improve the printability, strength, gloss, opacity, and moisture resistance of coated papers and paperboard. Applications for our products include paper and paperboard coatings used in magazines, catalogs, direct mail advertising, brochures and printed reports, specialty papers, food cartons and household and other consumer and industrial packaging.
OMNOVA is also a leading North American supplier of custom-formulated SB latex used as carpet backing binders. Our products for the carpet industry secure carpet fibers to the carpet backing and adhere the primary backing to the secondary backing and meet the stringent manufacturing, environmental, odor, flammability and flexible installation requirements of our customers. Our strong historic position in residential carpeting has been enhanced by new products to serve that market as well as innovations in commercial carpet backing binders that provide moisture barrier properties, enabling the replacement of higher-cost polyurethane binders. Sales of our Paper and Carpet Chemicals products represented 39.0% of our consolidated net sales for 2010, 35.8% of our consolidated net sales for 2009 and 38.8% of our consolidated net sales for 2008.
Specialty Chemicals. OMNOVA is a leading North American supplier of specialty polymers and chemicals for a variety of product categories. Applications for our specialty polymers and chemicals include nonwovens (such as hygiene products,
2
Table of Contents
engine filters, roofing mat, scrub pads), floor polish, tape, adhesives, tire cord, textiles, construction, oil/gas drilling services, plastic part coatings and ink coating additives. Our focus is on developing unique products and custom applications that address specific customer needs, including enhanced functionality, improved environmental performance and lower cost through improved processibility and product substitution for higher-cost materials. Sales of our Specialty Chemicals products represented 23.4% of our consolidated net sales for 2010, and 21.2% for 2009 and 2008.
Markets and Customers
The paper coating and carpet backing product lines are highly competitive based on quality, customer service, product performance, price, field technical support and product innovations. Major paper and carpet customers include NewPage, Verso, Shaw Industries, Sappi and Beaulieu. The specialties product line includes many product categories such as tire cord adhesives, components for hygiene products and roofing mat that are performance driven where product innovation, technical service and application support are key competitive differentiators. Major specialty chemical customers include Sherwin Williams, PGI, Freudenburg, Hyosung, Shurtape, Xerox and Fiberweb.
Marketing and Distribution
Our Performance Chemicals segment primarily sells its products directly to manufacturers through dedicated internal marketing, sales and technical service teams focused on providing highly responsive customized solutions to targeted markets and industries.
Competition
Performance Chemicals competes with several large chemical companies including Styron and BASF. Performance Chemicals also competes with a variety of other suppliers of specialty chemicals including Lubrizol, Wacker, Celanese, Dow, and Arkema. Depending on the products involved and markets served, the basis of competition varies and may include price, quality, customer and technical service, product performance and innovation and industry reputation. Overall, our Performance Chemicals segment regards its products to be competitive in its major categories and we believe that we are a leader in several North American categories, including SB and SBA latex paper coatings and carpet backing binders, nonwoven SB binders, SB vinyl pyridine, tire cord adhesives, floor care polymers and polymers used in the manufacturing of masking and other tapes.
Decorative Products
Background
Our Decorative Products segment began in 1945 when GenCorp (then known as The General Tire & Rubber Company) purchased a coated fabrics manufacturing facility located in Jeannette, Pennsylvania from the Pennsylvania Rubber Company. Since that time, the business has grown through internal development and acquisitions to include four domestic and five international manufacturing sites and a wide range of decorative and functional surfacing products.
In 1999 and 2000, the business established manufacturing joint ventures in Thailand and China with an affiliate of Thailand-based Charoen Pokphand Group to expand its coated fabrics and performance film capabilities into the Asia Pacific region and provide expanded product lines to North America and Europe. The Company held a 50.1% interest in each joint venture. During the first quarter of 2008, OMNOVA acquired the remaining equity interests in these joint ventures, which are now wholly-owned subsidiaries of the Company.
Products
Our Decorative Products segment develops, designs, produces and markets a broad line of functional and decorative surfacing products, including coated fabrics, commercial wallcoverings, vinyl, paper and specialty laminates and performance films. These products are used in numerous applications, including commercial building refurbishment, remodeling and new construction; residential cabinets, flooring and furnishings; retail display; transportation markets
3
Table of Contents
including busses and mass transit, marine, motorcycle and automotive; recreational vehicles; manufactured housing; medical devices and products; and a variety of industrial film applications. Our core competencies in design, coating, compounding, calendering, casting, printing and embossing enable us to develop unique, aesthetically pleasing decorative surfaces that have functional properties, such as cleanability, durability and scratch and stain resistance, that address specific customer needs. We have strong color and design capabilities, an extensive design library covering a broad range of patterns, textures and colors, and strong product formulation and coating and processing capabilities. Together these capabilities provide our products with the functionality and aesthetics that add value for our customers. In addition, our broad range of products, global presence and end-use applications gives us economies of scale in sourcing, manufacturing, design, sales and marketing, product and process development.
The following table shows the products that our Decorative Products segment develops, designs, produces and markets.
| Product Category |
% of Decorative Products Fiscal 2010 Net Sales |
Primary Products |
End-use Applications |
Brand Names | ||||
| Commercial Wallcovering, Coated Fabrics | 69.1% | Vinyl and non-vinyl nanofiber based wallcoverings, recyclable and 30% recycled content wallcovering, customized wall murals; vinyl and urethane coated fabrics | Decorative and protective wall and seating surfacing for offices, hotels, hospital and health care facilities, stores, schools, restaurants and public buildings; decorative and protective surfacing for transportation and marine seating, automotive soft top covers, commercial and residential furniture, performance fabrics for numerous applications including medical products | BOLTA, ESSEX, GENON, TOWER, MURASPEC, MUREK, VIEWNIQUE, DIVERSIWALL, ECORE, RECORE, BOLTAFLEX, BOLTASOFT, NAUTOLEX, PREFIXX, PREVAILL | ||||
| Laminates and Performance Films | 30.9% | Vinyl, paper and specialty laminates; performance films | Decorative and protective surfacing for kitchen and bath cabinets, manufactured housing recreational vehicle interiors, flooring, commercial and residential furniture, retail display fixtures, home furnishings and consumer electronics, performance films for pool liners, banners, tents, ceiling tiles and medical products | PREEMPT, RADIANCE, SURF(X) 3D, DESIGN4, EFX, DURAMAX | ||||
4
Table of Contents
Commercial Wallcovering, Coated Fabrics. OMNOVA Solutions is a leading North American, European and Asian supplier of wallcoverings and coated fabrics used in commercial applications. Our commercial wallcoverings are recognized for their leading color and designs as well as their strength, durability and cleanability. Our wallcoverings, in addition to their aesthetic appeal, reduce repair and maintenance costs for building owners by protecting wall surfaces and having longer useful lives as compared to paint and paper wallcoverings. Applications for our commercial wallcoverings include refurbishment and new construction for the commercial office, hospitality, health care, retail, education and restaurant markets.
OMNOVA’s commercial wallcovering product lines include a broad range of fabric-backed vinyl, paper-backed vinyl and nanofiber based wallcoverings. Our extensive styling and design library covers a broad range of styles, patterns, textures and colors, both traditional and contemporary. In addition to strong internal and external resources in design capabilities, strengths include a reputation for product durability and quality, a global distribution network, an extensive emboss and print roll library, strong brands, custom design and manufacturing capability and long-term customer relationships.
OMNOVA Solutions is a leading North American and Asian supplier of vinyl and urethane coated fabrics and performance fabrics for commercial, residential, transportation and medical applications. Our durable coated fabrics are well-suited for demanding, high-use environments and offer a cost effective alternative to other surfacing materials, such as leather and textile fabrics. Applications for our coated fabrics include transportation seating (automotive OEM, bus and other mass transit, marine and motorcycle), automotive soft tops, automotive aftermarket applications, contract and medical furniture and product fabric applications. Sales of our commercial wallcovering and coated fabrics products represented 26.0% of our consolidated net sales for 2010, 31.3% for 2009 and 29.0% for 2008.
In late 2008, OMNOVA Solutions introduced RECORE® Recycled Wall Technology—the “best in class” recycled commercial wallcovering platform for wallcoverings that look, perform and hang like traditional vinyl wallcoverings and feature a guaranteed minimum 30% recycled content. All new designs introduced in the leading OMNOVA brands—Bolta®, Essex™, Genon® and Tower®—feature RECORE® Recycled Wall Technology. OMNOVA also offers wallcoverings featuring ECORE® Advanced Wall Technology, a non-PVC construction for architects and designers seeking alternatives to vinyl. In addition, both RECORE® and ECORE® qualify for critical points in building projects seeking LEED (Leadership in Energy and Environmental Design) certification as a part of the U.S. Green Building Council’s sustainable building initiative. These innovations further enhance OMNOVA’s leadership position for both branded and private label offerings while meeting the growing demand for sustainable products.
Laminates and Performance Films. OMNOVA Solutions is a leading North American supplier of vinyl and paper laminates and performance films. Our laminates are used as alternatives to wood, paint, stone, stainless steel and high-pressure laminates in markets where durability, design and cost are key requirements. We provide our customers with a broad range of designs and textures as well as proprietary coating technology that provides enhanced durability and scratch and stain resistance. Applications for our laminates include kitchen and bath cabinets, manufactured housing and recreational vehicle interiors, flooring, commercial and residential furniture, retail display fixtures, home furnishings, and consumer electronics. Performance film applications include banners, tents, medical products, pool liners, movie screens and shower pan liners.
A key strength of our laminates business is our coating technology, including ultraviolet, melamine, urethane, thermal cured and others, which provides durable finishes for high-wear applications. In addition, our laminates business has differentiated itself in the market as a single-source supplier of integrated vinyl and paper laminate designs for the furniture and cabinet industries by building a unique library of matched vinyl and paper laminate designs with a variety of patterns and textures, and developing rapid make-to-order production capabilities. We also offer SURF(X)® 3D Laminates for multi-dimensional applications for the office and health care furniture and retail display fixture markets. These laminates offer a cost effective alternative to high pressure laminates and provide furniture makers with design flexibility in rounded surfaces, eliminating the need for unsightly and expensive edge-banding and providing enhanced cleanability/disinfection. Sales of our Laminates and Performance Films products represented 11.6% of our consolidated net sales for 2010, 11.7% for 2009 and 11.0% for 2008.
5
Table of Contents
Markets and Customers
We believe that our Decorative Products segment is a leader in its targeted product categories. The coated fabrics, commercial wallcovering, laminates and performance films businesses are highly competitive based on decorative content, functional performance, price, quality, customer service, global capability, brand name recognition, distribution networks and reputation. Decorative Products markets its products under numerous brand names to different industries. Certain of our better-known customers in this segment include Steelcase, Armstrong, CGT, BYD, Ashley Furniture, Patrick Industries, Herculite and Masco.
Marketing and Distribution
Our Decorative Products segment distributes its products through a variety of channels. Commercial wallcovering products are marketed primarily through independent distributors to building owners, contractors, architects, interior designers and other specifiers. Several of our distributors are national in scope, providing us with the capability to cost-effectively market products to both regional and national commercial customers. Coated fabrics, laminates and performance films are sold directly and through agents to manufacturers of cabinets, furniture, seating, health care and medical components, and other products. Many of our Decorative Products segment’s products have strong, well-recognized brand names that are promoted through trade shows, industry periodicals, our website (www.omnova.com) and other media.
Competition
OMNOVA’s Decorative Products segment competes with numerous companies, many of which focus on only one product line and/or market and are smaller and privately-owned. Competitors include:
| • | Commercial Wallcovering and Coated Fabrics—RJF International, US Vinyl, J. Josephson, Vescom, Laminating Surfaces, Morbern, China General, Uniroyal and Spradling International |
| • | Laminates and Performance Films—Chiyoda Gravure, Dai Nippon Printing, Toppan Printing, Renolit Corporation, LG ChemAmerica, Riken USA Corporation and Spartech Industries |
International Operations
Net sales from our foreign operations were $180.5 million in 2010, $166.5 million in 2009 and $170.4 million in 2008. These net sales represented 21.3% of our total net sales in 2010, 23.9% of our total net sales in 2009 and 19.6% of our total net sales in 2008. Long-lived assets primarily consist of net property, plant and equipment and net intangibles. Long-lived assets of our foreign operations totaled $39.3 million at November 30, 2010 and $41.4 million at November 30, 2009. Our consolidated long-lived assets totaled $137.3 million at November 30, 2010 and $146.3 million at November 30, 2009.
In a subsequent event which will be reflected in fiscal 2011 results, on December 9, 2010, the Company completed the acquisition of all the outstanding shares of Eliokem International SAS (“Eliokem”) from AXA Investment Managers Private Equity Europe and the other holders of equity securities of Eliokem. Eliokem is a worldwide manufacturer of specialty chemicals used in a diverse range of niche applications including coating resins, elastomeric modifiers, antioxidants, oilfield chemicals and latices for specialty applications. Eliokem is headquartered in Villejust, France and has manufacturing facilities located in France, China, India and the United States. Eliokem’s 2010 sales were $288.0 million.
In January 2008, the Company completed the acquisition of the minority interests in its joint venture businesses, Decorative Products (Singapore) Pte. Ltd. (“DPS”), a Singapore limited company and CPPC—Decorative Products Co., Ltd. (“CPD”), a Thailand limited company. DPS is a holding company which owns 100% of both CG-OMNOVA Decorative Products (Shanghai) Co., Ltd. (“CGO”) and OMNOVA Decorative Products (Taicang) Co., Ltd. (“Taicang”). Both CGO and Taicang are registered and incorporated in the Peoples Republic of China. The minority interests of both DPS and CPD, representing approximately 49.9% of their respective registered equity, was acquired from CPPC Public Company Limited. The acquisition was effective December 31, 2007.
6
Table of Contents
Intellectual Property
We regard patents, trademarks, copyrights and other intellectual property as important to our success, and we rely on them in the United States and foreign countries to protect our investments in products and technology. Our patents expire at various times, but we believe that the loss or expiration of any individual patent would not materially affect our business. We, like any other company, may be subject to claims of alleged infringement of the patents, trademarks and other intellectual property rights of third parties from time to time in the ordinary course of business.
Seasonal Factors
We historically experience stronger sales and income in our second, third and fourth quarters, comprised of the three-month periods ending May 31, August 31 and November 30. Our performance in the first quarter (December through February) has historically been weaker due to generally lower levels of customer manufacturing, construction and refurbishment activities during the holidays and cold weather months.
Environmental Matters
Our business operations, like those of other companies in the industries in which we operate, are subject to numerous federal, state, local and foreign environmental laws and regulations. These laws and regulations not only affect our current operations, but also could impose liability on us for past operations that were conducted in compliance with then applicable laws and regulations. For further discussion of capital and noncapital expenditures for environmental compliance, please refer to “Management’s Discussion and Analysis of Financial Condition and Results of Operations—Environmental Matters” on page 36 of this report, which is incorporated herein by reference.
Employees
At November 30, 2010, the Company employed approximately 2,430 employees at offices, plants and other facilities located principally throughout the United States, United Kingdom, China and Thailand. Approximately 14% or 350 of the Company’s employees are covered by collective bargaining agreements in the United States. In March 2010, the Company and its Calhoun, Georgia employees represented by Local 1876, Southern Region of Workers United, SEIU, agreed to a new three year contract. On May 20, 2010, the approximately 180 Columbus, Mississippi employees represented by United Steelworkers Local #748-L voted against ratification of a new contract proposal and subsequently went on strike on May 21, 2010. Initially, the Company’s salaried workforce and contract labor operated the plant, meeting customers’ requirements. During the fourth quarter of 2010, the Company began transitioning from contract labor to locally hired replacement employees. The Company incurred strike-related costs of $5.5 million in 2010, of which $3.3 million was included in cost of goods sold and $2.2 million included in other expense (income). Strike-related costs peaked in July 2010 and have declined significantly since then. In the fourth quarter of 2010, strike-related costs were $1.2 million, compared to $3.9 million in the third quarter of 2010. The Company generally would describe its relationship with employees as good even though its union-represented Columbus, Mississippi employees chose to go on strike.
Raw Materials
Our Performance Chemicals segment utilizes a variety of raw materials, primarily monomers, in the manufacture of our products, all of which are generally available from multiple suppliers. Monomer costs are a major component of the emulsion polymers produced by this segment. Key monomers include styrene, butadiene, acrylates, acrylonitrile, vinyl acetate and vinyl pyridine. These monomers represented approximately 76% of Performance Chemicals’ total raw materials purchased on a dollar basis in 2010 for this segment.
Our Decorative Products segment utilizes a variety of raw materials that are generally available from multiple suppliers. Key raw materials include polyvinyl chloride (PVC) resins, textiles, plasticizers, paper and titanium dioxide. PVC resins, plasticizers and textiles represented approximately 73% of Decorative Products’ total raw materials purchased on a dollar basis in 2010 for this segment.
The cost of these raw materials has a significant impact on our profitability. We generally attempt to respond to raw material cost increases through productivity programs and, as needed, price increases to our customers. The success of
7
Table of Contents
attempted price increases depends on a variety of factors including the specific market application and competitive environment. Under certain circumstances, we are not able to pass along the increase. In addition, if accepted by customers, price increases generally lag the increase in raw material costs. During the second half of 2008, the Company’s Performance Chemicals segment was successful in enhancing its index pricing through which styrene and butadiene raw materials cost increases are passed on to customers. Index pricing applies to approximately 65% of Performance Chemicals sales.
Research and Development
The OMNOVA Solutions technology centers in Akron, Ohio, Chester, South Carolina, Shanghai, China and Rayong, Thailand support research and development efforts across our businesses and complement the resources focused on innovation in each of our segments. Our efforts are focused on developing new applications with our base technologies, enhancing the functionality of our products in existing applications as well as developing new product and technology platforms.
Our research and development expenses were $8.8 million in 2010, $8.2 million in 2009 and $10.3 million in 2008. Research and development expenses include the costs of technical activities that are useful in developing new products, services, processes or techniques, as well as those expenses for technical activities that may significantly improve existing products or processes. Information relating to research and development expense is set forth in Note A to the Consolidated Financial Statements of this report.
Available Information
Our website is located at www.omnova.com. We make available free of charge on our website all materials that we file electronically with the Securities and Exchange Commission, including our Annual Reports on Form 10-K, Quarterly Reports on Form 10-Q, Current Reports on Form 8-K and amendments to those reports, as soon as reasonably practicable after we electronically file or furnish such materials to the SEC. The OMNOVA Solutions Business Conduct Policies and Corporate Governance Guidelines and charters for the Audit Committee and Compensation and Corporate Governance Committee of the OMNOVA Solutions Board of Directors are also available on our website and in print to any shareholder who requests a copy. All requests must be made in writing, addressed to OMNOVA Solutions Inc., Attn: Secretary, 175 Ghent Road, Fairlawn, Ohio 44333-3300.
| Item 1A. | Risk Factors |
This Annual Report includes “forward-looking statements” as defined by federal securities laws. These statements, as well as any verbal statements by the Company related to this Annual Report are intended to qualify for the protections afforded forward-looking statements under the Private Securities Litigation Reform Act of 1995. Forward-looking statements reflect management’s current expectation, judgment, belief, assumption, estimate or forecast about future events, circumstances or results and may address business conditions and prospects, strategy, capital structure, sales, profits, earnings, markets, products, technology, operations, customers, raw materials, financial condition, and accounting policies among other matters. Words such as, but not limited to, “will,” “may,” “should,” “projects,” “forecasts,” “seeks,” “believes,” “expects,” “anticipates,” “estimates,” “intends,” “plans,” “targets,” “optimistic,” “likely,” “would,” “could,” and similar expressions or phrases identify forward-looking statements.
All forward-looking statements involve risks and uncertainties. Many risks and uncertainties are inherent in business generally and the markets in which the Company operates or proposes to operate. Other risks and uncertainties are more specific to the Company’s businesses including businesses the Company acquires. The occurrence of risks and uncertainties, and the impact of such occurrences, is often not predictable or within the Company’s control. Such impacts may adversely affect the Company’s results and, in some cases, such effect could be material. Certain risks and uncertainties facing the Company are described below or elsewhere in this Annual Report.
All written and verbal forward-looking statements attributable to the Company or any person acting on the Company’s behalf are expressly qualified in their entirety by the risks, uncertainties and cautionary statements contained herein. Any forward-looking statement speaks only as of the date on which such statement is made, and the Company undertakes no
8
Table of Contents
obligation, and specifically declines any obligation, other than that imposed by law, to publicly update or revise any forward-looking statements whether as a result of new information, future events or otherwise.
Risks and uncertainties that may cause actual results to differ materially from expected results include, among others:
We are exposed to general economic, business and industry conditions. A significant or prolonged downturn could adversely affect demand for our products.
We are exposed to general economic, business and industry conditions, both in the United States and in global markets. A significant or prolonged economic downturn could have the potential to adversely affect the demand for our products and our results.
Raw material prices and availability have a significant impact on our profitability. If raw material prices increase, and we cannot pass those price increases on to our customers, or we cannot obtain sufficient raw materials in a timely manner, our results could be adversely affected.
The principal raw materials that we use in our business are derived from petrochemicals and chemical feedstocks. Specifically, Performance Chemicals uses monomers such as styrene, butadiene, and acrylates extensively in its products, and Decorative Products uses PVC, plasticizer and Ti02 extensively in its products. If we are unable to pass along increased raw material prices to our customers, our results could be adversely affected. The cost of these raw materials has a significant impact on our profitability. The prices of many of these raw materials are cyclical and volatile. Supply and demand factors, which are beyond our control, generally affect the price of our raw materials. While we generally attempt to pass along increased raw material prices on to our customers in the form of price increases, historically there has been a time delay between increased raw material prices and our ability to increase the prices of our products. Additionally, we may not be able to increase the prices of our products due to competitive pricing pressure and other factors.
We generally have multiple global sources of supply for our raw materials. However, in some cases there are a limited number of suppliers that are capable of delivering raw materials that meet our standards. Further industry consolidation may limit the number of these suppliers. Various factors, including feed stock shortages, production disruptions, the financial stability of our suppliers, and supplier commitments to others have reduced and eliminated, and in the future may reduce or eliminate, the availability of certain raw materials. Shortages could occur in the future. Additionally, disruptions in transportation could delay receipt of raw materials. If our supply of raw materials is reduced, disrupted or delayed, our results could be adversely affected.
Consolidation of our customers and competitors has created increased pricing pressure. If we are required to reduce our prices to remain competitive, this could adversely affect our results.
We face continued pricing pressure from our customers and competitors. Customers frequently seek price reductions and customer consolidation in certain markets has created customers with greater purchasing power. Additionally, consolidation among our competitors has created competitors with greater financial and other resources. If we are required to reduce prices to compete and we cannot improve operating efficiencies and reduce expenditures to offset such price decreases, our results could be adversely affected.
Our sales and profitability depend on our ability to continue to develop new products that appeal to customers. If we are unable to develop new products, our results could be adversely affected.
It is important for our business to have the ability to develop, introduce, sell and support cost effective new products and technologies on a timely basis. If we fail to develop and deploy new cost effective products and technologies on a timely basis, our products may no longer be competitive and our results could be adversely affected.
We are exposed to credit risk from our customers.
If our customers, and in particular, large customers, are unable to timely pay amounts due to us, it may adversely affect our results and cash flows and our ability to remain in compliance with our credit facilities.
9
Table of Contents
A significant portion of Performance Chemicals sales is concentrated among several large customers.
Our Performance Chemicals segment has several large customers who account for a significant portion of Performance Chemicals’ total sales. The loss of, or a significant reduction in purchases by, any one of these large customers could adversely affect our results.
Our customers and suppliers may not be able to compete against increased foreign competition which could adversely affect the demand for our products, the cost of our raw materials and our results.
Our United States and European customers and suppliers are subject to increasing foreign competition. If the demand for products manufactured in those regions declines then the demand for our products manufactured in those regions could decline, adversely affecting our results.
Our business could be adversely affected by risks typically encountered by international operations.
We conduct our business in many countries outside of the United States and are subject to risks associated with international operations, including the following:
| • | fluctuations in currency exchange rates; |
| • | transportation delays and interruptions; |
| • | political and economic instability and disruptions; |
| • | the imposition of duties and tariffs; |
| • | import and export controls; |
| • | government control of capital transactions, including the borrowing of funds for operations or the expatriation of cash; |
| • | the risks of divergent business expectations or cultural incompatibility; |
| • | difficulties in staffing and managing multi-national operations; |
| • | limitations on our ability to enforce legal rights and remedies; |
| • | more stringent environmental, health and safety laws and regulations; and |
| • | potentially adverse tax consequences. |
Any of these events could adversely affect our international operations and our results. These risks may intensify given Eliokem’s substantial international operations.
Our business is subject to the risks associated with the use of chemicals.
We are subject to risks associated with chemical use including explosions, fires, leaks, discharges, inclement weather, natural disasters, mechanical failure, unscheduled downtime, transportation interruption and acts of God. The occurrence of these risks may result in operating disruptions at our facilities and could adversely affect our results.
We may be unable to achieve, or may be delayed in achieving, our goals under certain cost reduction measures, which could adversely affect our results.
We have and are undertaking operational excellence processes using LEAN SixSigma, global supply chain management, Enterprise Resource Planning (ERP) and other initiatives in an effort to improve efficiencies and lower our cost structure. If we are unable to achieve, or if we meet unexpected delays in achieving our goals, our results could be adversely affected. Additionally, even if we achieve these goals, we may not receive the expected financial benefits of these goals, or the costs of implementing these initiatives could exceed the benefits of these initiatives.
10
Table of Contents
From time to time, we participate in joint ventures whose success depends on performance of a joint venture partner. The failure of a partner to fulfill its obligations could adversely affect our results and require us to dedicate additional resources to these joint ventures.
From time to time, we participate in joint ventures. The nature of a joint venture requires us to share control with unaffiliated third parties. If our joint venture partners do not fulfill their obligations, the affected joint venture may not be able to operate according to its business plan. In that case, our results could be adversely affected or we may be required to increase our level of commitment to the joint venture. Also, differences in views among joint venture participants could result in delayed decisions or failures to agree on major issues. If these differences cause the joint ventures to deviate from their business plans, our results could be adversely affected.
We may not be able to identify or complete transactions with attractive acquisition candidates, which could adversely affect our business strategy.
As part of our business strategy, we have pursued, and may continue to pursue, targeted acquisition opportunities that we believe would complement our business. We may not be successful in consummating any acquisition, which could adversely affect our business strategy.
We may not be able to successfully integrate acquisitions, including Eliokem, into our operations, which could adversely affect our business.
The integration of acquisitions into our operations involves a number of risks, including:
| • | difficulty integrating operations and personnel at different locations; |
| • | diversion of management attention; |
| • | potential disruption of ongoing business because of the unknown reactions to the combination of OMNOVA and the acquisition by customers, suppliers and other key constituencies; |
| • | difficulties in assimilating the technologies and products of the acquisition; |
| • | inability to retain key personnel; |
| • | inability to successfully incorporate acquired business components with our existing operational and accounting infrastructure; |
| • | difficulty in expanding product manufacturing to new sites; and |
| • | inability to maintain uniform standards, controls, procedures and policies. |
If we are unable to effectively integrate operations and personnel in a timely and efficient manner after an acquisition is completed, we may not realize the financial or other benefits expected from the acquisition. Failure to overcome these risks or any other problems encountered in connection with the acquisition could slow our growth or lower the quality of our products, which could reduce customer demand and adversely affect our results.
The occurrence or threat of extraordinary events, including natural disasters, political disruptions, domestic and international terrorist attacks and acts of war, could significantly decrease demand for our products.
Extraordinary events, including natural disasters, political disruptions, domestic and international terrorist attacks and acts of war could adversely affect the economy generally, our business and operations specifically, and the demand for our products. The occurrence of extraordinary events cannot be predicted and their occurrence could adversely affect our results.
Extensive governmental regulations impact our operations and assets, and compliance with these regulations could adversely affect our results.
Our business operations are subject to numerous foreign, federal, state and local regulations which may have a significant effect on the costs of operations including extensive environmental, health and safety regulations.
11
Table of Contents
We are and expect to continue to be subject to increasingly stringent environmental and health and safety laws and regulations. Non-compliance with these requirements may result in significant fines or penalties, or limitations on our operations. Such regulation could also restrict or prohibit the use of key raw materials or the sale of our products. Significant restrictions on or the prohibition of the use of key raw materials or the sale of our products could adversely affect our results. Certain environmental requirements provide for strict and, under certain circumstances, joint and several liability for investigation and remediation of releases of regulated materials into the environment at or from properties owned or operated by us or our predecessors (including Eliokem) or at or from properties where substances were sent for off-site treatment or disposal. It is difficult to predict the future interpretation and development of environmental and health and safety laws and regulations or their impact on our future results. Continued compliance could result in significant increases in capital expenditures and operating costs. Any increase in these costs, or unanticipated liabilities arising out of a release of regulated materials by us or our predecessors (including Eliokem) or out of a discovery of previously unknown conditions, more aggressive enforcement actions or new requirements, could adversely affect our results. Additionally, any such increase in costs or unanticipated liabilities may exceed our reserves, which could adversely affect our results.
Capital expenditures could be higher than expected.
Unanticipated maintenance issues, changes in government regulations, or significant technology shifts could result in higher than anticipated capital expenditures, which could impact our debt and cash flows.
Because we maintain a self-insured health care plan for our employees, increases in health care costs could adversely affect our results.
We maintain a self-insured health care plan for certain of our employees and certain retirees under which we generally share the cost of health care with our employees and retirees. Health care costs have been escalating over the past decade. Accordingly, as general health care costs increase, our health care expenses may also increase. Such increase in costs could adversely affect our results.
Some of our employees are covered by collective bargaining agreements. The failure to renew any of those agreements on terms acceptable to us could increase cost or result in a prolonged work stoppage, which could adversely affect our results.
Approximately 350 or about 14% of our United States employees are covered by collective bargaining agreements of which approximately 100 employees are covered by agreements that expire within the next 12 months. On May 20, 2010, approximately 180 Columbus, Mississippi employees represented by United Steelworkers Local #748-L voted against ratification of a new contract proposal and subsequently went on strike on May 21, 2010. There can be no assurance that any of our collective bargaining agreements, including the agreement covering our employees in Columbus, Mississippi, will be renewed on similar terms or renegotiated on terms acceptable to us. Any prolonged work stoppages in one or more of our facilities could adversely affect our results. The Company has continued operating the Columbus, Mississippi facility using salaried employees and locally hired replacement employees with no disruption of service to our customers.
Our pension plan is underfunded, requiring company contributions.
The amount of these contributions depends on plan performance, interest rates, pension funding legislation and other factors. We currently anticipate that we will be required under the Pension Protection Act of 2006 to make a contribution to our pension plan in 2011 of approximately $2.8 million. In addition, we cannot predict whether changing conditions including interest rates, pension assets performance, discount rates, government regulation or other factors will require us to make contributions in excess of our current expectations. Additionally, we may not have the funds necessary to meet future minimum pension funding requirements.
Failure to protect intellectual property could adversely affect our results.
For certain products we rely on trademark, trade secret, patent and copyright laws to protect our intellectual property. We cannot be sure that these intellectual property rights will be successfully asserted in the future or that they will not be
12
Table of Contents
invalidated or circumvented. In addition, laws of some foreign countries in which our products are or may be sold do not protect our intellectual property rights to the same extent as the laws of the United States. The failure or inability of us to protect our proprietary information could make us less competitive and could adversely affect our results.
From time to time, we may be subject to claims or allegations that we infringe or misappropriate the intellectual property of third parties. Defending against such claims is costly and intellectual property litigation often involves complex questions of law, and facts and results are unpredictable. We may be forced to acquire rights to such third-party intellectual property on unfavorable terms (if rights are made available at all), pay damages, modify accused products to be non-infringing and/or stop selling the applicable product. Regardless of the outcome, defending against allegations of intellectual property infringement or misappropriation can divert the time and attention of management. Any of the foregoing could have a negative effect on our competitiveness and our results.
We could be subject to an adverse litigation judgment or settlement which could adversely affect our results.
From time to time, we are subject to various claims, proceedings and lawsuits related to products, services, contracts, employment, environmental, safety, intellectual property and other matters arising out of our business or that of our predecessors (including Eliokem). The ultimate resolution of such claims, proceedings, and lawsuits is inherently unpredictable and, as a result, our estimates of liability, if any, are subject to change and actual results may materially differ from our estimates. In addition, if there is an unfavorable resolution of a matter, there could be a material adverse effect on our financial condition, results of operations or cash flows depending on the amount of such resolution in comparison to our financial condition, results of operations and cash flows in the period in which such resolution occurs. Moreover, there can be no assurance that we will have any or adequate insurance coverage to protect us from any adverse resolution.
We maintain cash balances in foreign financial institutions.
While we monitor the financial institutions that we maintain accounts with, we cannot be assured that we would be able to recover our funds in the event that the financial institution would fail. In addition, we may be limited by foreign governments in the amount and timing of funds to be repatriated from foreign financial institutions. As a result, this could adversely affect our ability to fund normal operations, capital expenditures, or service debt.
Our substantial debt could adversely affect our financial health and prevent us from fulfilling our obligations.
We have substantial debt and, as a result, significant debt service obligations. Our substantial debt could:
| • | make it more difficult for us to satisfy our obligations with respect to the notes, the term loan and the revolving credit facility; |
| • | increase our vulnerability to general adverse economic and industry conditions, including interest rate fluctuations, because a portion of our borrowings, including those under the term loan and the revolving credit facility, are at variable rates of interest; |
| • | require us to dedicate a substantial portion of our cash flow from operations to payments on our debt, thereby reducing the availability of our cash flow to fund working capital, capital expenditures, acquisitions, joint ventures, pension contributions and investments and other general corporate purposes; |
| • | limit our flexibility in planning for, or reacting to, changes in our business and the product categories in which we participate; |
| • | limit our ability to obtain additional debt or equity financing due to applicable financial and restrictive covenants in our debt agreements; |
| • | place us at a competitive disadvantage compared to our competitors that have less debt. |
Our ability to make scheduled payments on or to refinance our debt obligations and to fund planned capital expenditures and expansion efforts and any acquisitions we may make in the future depends on our ability to generate cash
13
Table of Contents
in the future and our financial condition and operating performance, which are subject to prevailing economic and competitive conditions and to certain financial, business and other factors beyond our control. We could be required to obtain the consent of the lenders under our new term loan and our new revolving credit facility to refinance material portions of our debt, including the notes. We may not be able to maintain a level of cash flows from operating activities sufficient to permit us to pay the principal, premium, if any, and interest on our debt.
If our cash flows and capital resources are insufficient to fund our debt service obligations, we may be forced to reduce or delay investments and capital expenditures, or to sell assets, seek additional capital or restructure or refinance our debt. These alternative measures may not be successful and may not permit us to meet our scheduled debt service obligations. If our operating results and available cash are insufficient to meet our debt service obligations, we could face substantial liquidity problems and might be required to dispose of material assets or operations to meet our debt service and other obligations. We may not be able to consummate those dispositions or to obtain the proceeds that we could realize from them, and these proceeds may not be adequate to meet any debt service obligations then due. Additionally, the agreements governing our term loan and our revolving credit facility and the indenture governing the notes will limit the use of the proceeds from any disposition; as a result, we may not be allowed, under these documents, to use proceeds from such dispositions to satisfy all current debt service obligations. Further, we may need to refinance all or a portion of our debt on or before maturity, and we cannot assure that we will be able to refinance any of our debt on commercially reasonable terms or at all.
Despite our current debt levels, we and our subsidiaries may still incur significant additional debt. Incurring more debt could increase the risks associated with our substantial debt.
We and our subsidiaries may be able to incur substantial additional debt, including additional secured debt, in the future. The terms of the note indenture restrict, and the agreements governing our new term loan and our new revolving credit facility restrict, but will not completely prohibit, us from incurring substantial additional debt. In addition, the note indenture will allow us to issue additional notes under certain circumstances, which will also be guaranteed by our domestic subsidiaries. The note indenture will also allow us to incur certain other additional secured debt. Non-guarantor subsidiaries, which includes our foreign subsidiaries may incur additional debt under the note indenture, which debt (as well as other liabilities at any such subsidiary) would be structurally senior to the notes. In addition, the note indenture will not prevent us from incurring certain other liabilities that do not constitute indebtedness (as defined in the note indenture). If new debt or other liabilities are added to our current debt levels, the related risks that we and our subsidiaries now face could intensify.
The indenture governing the notes and the agreements governing our term loan and our revolving credit facility will impose significant operating and financial restrictions on us and our subsidiaries, which may prevent us from capitalizing on business opportunities.
The agreements governing our term loan and our revolving credit facility and the indenture governing the notes impose significant operating and financial restrictions on us. These restrictions limit our ability, among other things, to:
| • | incur additional debt or issue certain disqualified stock and preferred stock; |
| • | pay dividends or certain other distributions on our capital stock or repurchase our capital stock; |
| • | make certain investments or other restricted payments; |
| • | place restrictions on the ability of our restricted subsidiaries to pay dividends or make other payments to us; |
| • | engage in transactions with affiliates; |
| • | sell certain assets or merge with or into other companies; |
| • | enter into sale and leaseback transactions; |
| • | guarantee debt; |
| • | create liens; and |
| • | enter into unrelated businesses. |
14
Table of Contents
Our term loan and revolving credit facility will require us to meet certain financial covenants, including covenants relating to senior net debt leverage, minimum excess availability and a springing minimum fixed charge coverage ratio if average excess availability falls below a certain level.
As a result of these covenants and restrictions, we could be limited in how we conduct our business and we may be unable to raise additional debt or equity financing to compete effectively or to take advantage of new business opportunities. The terms of any future debt we may incur could include more restrictive covenants. We cannot assure you that we will be able to maintain compliance with these covenants in the future and, if we fail to do so, that we will be able to obtain waivers from the lenders and/or amend the covenants.
There will be limitations on our ability to incur the full $100.0 million of commitments under our revolving credit facility. Borrowings under our new revolving credit facility will be limited by a specified borrowing base consisting of a percentage of eligible accounts receivable and inventory, less customary reserves. In addition, under our new revolving credit facility, a quarterly fixed charge maintenance covenant would become applicable if average excess availability under our credit facility is less than $25.0 million during any fiscal quarter. If the covenant trigger were to occur, the Company would be required to satisfy and maintain on the last day of each fiscal quarter a fixed charge coverage ratio of at least 1.1x for the last twelve-month period. Our ability to meet the required fixed charge coverage ratio can be affected by events beyond our control, and we cannot assure that we will meet this ratio. A breach of any of these covenants could result in a default under our new revolving credit facility.
Moreover, our new revolving credit facility provides the lenders considerable discretion to impose reserves, which could materially impair the amount of borrowings that would otherwise be available to us. There can be no assurance that the lenders under our new revolving credit facility will not impose such actions during the term of our new revolving credit facility and further, were they to do so, the resulting impact of this action could materially and adversely impair our ability to make interest payments on the notes.
| Item 1B. | Unresolved Staff Comments |
Not Applicable
15
Table of Contents
| Item 2. | Properties |
The Company’s significant operating, manufacturing, distribution, research, design and/or sales and marketing facilities are set forth below:
| Corporate Headquarters: |
||||
| OMNOVA Solutions Inc. *175 Ghent Road Fairlawn, OH |
OMNOVA Solutions Technology Center 2990 Gilchrist Road Akron, OH | |||
| Performance Chemicals: |
||||
| Headquarters: *175 Ghent Road Fairlawn, OH |
Sales/Manufacturing/Technical/Distribution: Akron, OH Calhoun, GA Chester, SC Fitchburg, MA Green Bay, WI *Hertfordshire, England Mogadore, OH *Shanghai, China | |||
| Decorative Products: |
||||
| Headquarters: *175 Ghent Rd Fairlawn, OH |
Manufacturing Facilities: Auburn, PA Columbus, MS Jeannette, PA Kent, England Monroe, NC *Rayong, Thailand Shanghai, China Taicang, China |
Sales/Marketing/Design/Distribution: Akron, OH *Asnieres, France *Bangkok, Thailand *Dubai, UAE *Hertfordshire, England *Rayong, Thailand *Shanghai, China *Warsaw, Poland | ||
| * | An asterisk next to a facility listed above indicates that it is a leased property. |
For a further discussion of our leased properties, please refer to Note M to the Consolidated Financial Statements of this report.
During 2010, we generally made effective use of our productive capacity. We believe that the quality and productive capacity of our properties are sufficient to maintain our competitive position for the foreseeable future.
Additionally, as a result of the Eliokem acquisition in December 2010, the Company acquired Eliokem manufacturing facilities located in LeHavre, France; Akron, Ohio, USA; Ningbo, China; Caojing, China, and Valia, India, as well as the leased headquarters of Eliokem located in Villejust, France.
| Item 3. | Legal Proceedings |
From time to time, the Company is subject to various claims, proceedings and lawsuits related to products, services, contracts, employment, environmental, safety, intellectual property and other matters. The ultimate resolution of such claims, proceedings, and lawsuits is inherently unpredictable and, as a result, the Company’s estimates of liability, if any, are subject to change. Actual results may materially differ from the Company’s estimates and an unfavorable resolution of any matter could have a material adverse effect on the financial condition, results of operations and/or cash flows of the Company. However, subject to the above and taking into account such amounts, if any, as are accrued from time to time on the Company’s balance sheet, the Company does not believe, based on the information currently available to it, that the
16
Table of Contents
ultimate resolution of these matters will have a material effect on the consolidated financial condition, results of operations or cash flows of the Company.
| Item 4. | Submission of Matters to a Vote of Security Holders |
No matters were submitted to a vote of OMNOVA Solutions’ security holders, through the solicitation of proxies or otherwise, during the quarter ended November 30, 2010.
| Item 4A. | Executive Officers of the Registrant |
The following information is given as of January 18, 2010, and except as otherwise indicated, each individual has held the same office during the preceding five-year period.
Kevin M. McMullen, age 50, Chairman of the Board, Chief Executive Officer and President of the Company since February 2001. Prior to that, Mr. McMullen served as Chief Executive Officer and President of the Company from December 2000 and as a Director from March 2000. From January 2000 until December 2000, Mr. McMullen served as President and Chief Operating Officer of the Company, and from September 1999 to January 2000, Mr. McMullen served as Vice President of the Company and President, Decorative & Building Products. Previously, Mr. McMullen was Vice President of GenCorp Inc. and President of GenCorp’s Decorative & Building Products business unit from September 1996 until the spin-off of OMNOVA Solutions in October 1999. Prior to that, Mr. McMullen was General Manager of General Electric Corporation’s Commercial & Industrial Lighting business from 1993 to 1996 and General Manager of General Electric Lighting’s Business Development and Strategic Planning activities from 1991 to 1993. Mr. McMullen was a management consultant with McKinsey & Co. from 1985 to 1991.
Michael E. Hicks, age 52, Senior Vice President and Chief Financial Officer of OMNOVA Solutions Inc. since its formation. Prior to the spin-off of OMNOVA Solutions in October 1999, Mr. Hicks served as Senior Vice President, Chief Financial Officer and Treasurer of GenCorp Inc. from February 1999 and as Treasurer of GenCorp from September 1994 to February 1999.
James C. LeMay, age 54, Senior Vice President, Business Development; General Counsel of OMNOVA Solutions Inc. since December 1, 2000; previously Senior Vice President, Law and General Counsel of OMNOVA Solutions Inc. since its formation. Prior to the spin-off of OMNOVA Solutions in October 1999, Mr. LeMay served as Assistant General Counsel of GenCorp Inc. from May 1997, and as Senior Counsel of GenCorp from May 1990 to May 1997.
Douglas E. Wenger, age 54, Senior Vice President and Chief Information Officer of the Company since November 2001. Prior to joining OMNOVA in October 2001, Mr. Wenger served as Director, Global I/T Strategy and Architecture from 2000 until 2001; as Global Program Director, Enterprise Business Applications from 1996 until 2000; Director, Business Information Development, Worldwide Research & Development from 1993 until 1996; and as Director, North American Information Systems and Database Development from 1991 until 1993, in each case for Kellogg Company, a manufacturer and marketer of ready-to-eat cereal and convenience foods.
James J. Hohman, age 62, Vice President of the Company since November 2001 and President, Performance Chemicals since February 2005; President, Paper & Carpet Chemicals from December 2000 until February 2005; Vice President, Specialty Chemicals from March 2000 until November 2000; and Vice President, Paper Chemicals from the spin-off of the Company from GenCorp Inc. in October 1999 until March 2000. Prior to the spin-off, Mr. Hohman served for GenCorp Inc. as Vice President, Paper Chemicals from November 1998 until October 1999 and as Director, Strategic Business Development, Performance Chemicals business unit from March 1996 until October 1998. Previously, Mr. Hohman held several key business and marketing management positions at BP Chemicals from 1982 until 1996, most recently serving as General Manager, Barex Resins.
Robert H. Coleman, age 56, President, Decorative Products since July 2003. Prior to joining OMNOVA, Mr. Coleman served as Vice President and General Manager, Graphics North America from 2000 until 2002; as Vice President and General
17
Table of Contents
Manager, Fasson Roll, Europe from 1997 until 2000; as Vice President and General Manager, Packaging and Product Identification Sector in 1997; and as Vice President and General Manager, Fasson Films Division from 1993 until 1997, in each case for Avery Dennison Corporation, Pasadena, California (a manufacturer of pressure-sensitive adhesives and materials and consumer and converted products).
Jay T. Austin, age 54, Vice President, Global Sourcing and Logistics, of the Company since December 2010. Prior to that he had served as Vice President, Strategic Sourcing for OMNOVA Solutions since August 2008. Prior to joining the Company, Mr. Austin had served as Vice President of Global Procurement for ICI Paints (a leading international paint business) since March 2006 and, prior to that, as Director of Purchasing, North America for The Glidden Company, a division of ICI Paints, since July 2002.
The Company’s executive officers generally hold terms of office of one year and/or until their successors are elected.
18
Table of Contents
PART II
| Item 5. | Market for Registrant’s Common Equity, Related Stockholder Matters and Issuer Purchases of Equity Securities |
The Company’s common stock is listed on the New York Stock Exchange and trades under the symbol OMN. At November 30, 2010, there were 8,084 holders of record of the Company’s common stock. Information regarding the high and low quarterly sales prices of the Company’s common stock is contained in the Quarterly Financial Data (Unaudited) which appears on page 84 of this report and is incorporated herein by reference. The Company has not declared a dividend since 2001.
Information concerning long-term debt appears in Note K to the Consolidated Financial Statements and is incorporated herein by reference.
Information concerning securities authorized for issuance under the Company’s equity compensation plans is set forth in Equity Compensation Plan Information of Item 12 in this Annual Report on page 86 and is incorporated herein by reference.
The following graph compares the cumulative five year total return provided shareholders on OMNOVA Solutions Inc.’s common stock relative to the cumulative total returns of the S&P 500 index and the S&P Industrials index. An investment of $100 (with reinvestment of all dividends) is assumed to have been made in our common stock and in each of the indexes on 11/30/2005 and its relative performance is tracked through 11/30/2010.
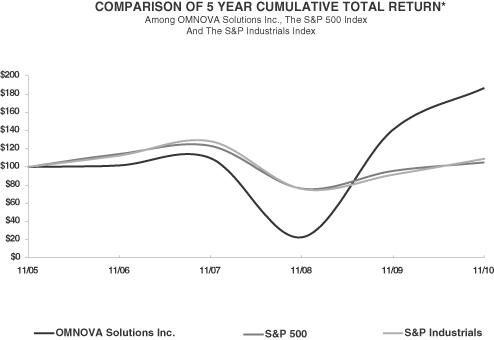
*The stock price performance included in this graph is not necessarily indicative of future stock price performance.
19
Table of Contents
| Item 6. | Selected Financial Data |
The following table sets forth the Company’s selected historical financial data. The selected historical financial data as of November 30, 2010, 2009, 2008, 2007, 2006 and for each of the five years in the period ended November 30, 2010 are derived from the Company’s audited consolidated financial statements.
| 2010 | 2009 | 2008 | 2007 | 2006 | ||||||||||||||||
| (Dollars in millions, except per share data) | ||||||||||||||||||||
| Statement of operations data: |
||||||||||||||||||||
| Net Sales |
$ | 846.2 | $ | 696.4 | $ | 869.4 | $ | 745.5 | $ | 699.1 | ||||||||||
| Cost of goods sold(1) |
684.8 | 536.7 | 731.4 | 605.2 | 549.2 | |||||||||||||||
| Gross profit |
161.4 | 159.7 | 138.0 | 140.3 | 149.9 | |||||||||||||||
| Selling, general and administrative |
99.6 | 99.9 | 104.8 | 99.1 | 105.6 | |||||||||||||||
| Depreciation and amortization |
20.6 | 22.9 | 23.9 | 20.1 | 20.2 | |||||||||||||||
| Indefinite lived trademark impairments(2) |
— | — | — | — | 1.0 | |||||||||||||||
| Fixed asset impairment(3) |
6.2 | 1.1 | — | — | .1 | |||||||||||||||
| Restructuring and severance(4) |
.6 | 2.1 | .6 | 1.0 | 1.3 | |||||||||||||||
| Interest expense |
8.7 | 8.1 | 13.0 | 16.5 | 21.3 | |||||||||||||||
| Equity (earnings) loss in affiliates |
— | — | (.2 | ) | (1.2 | ) | (2.3 | ) | ||||||||||||
| Debt offering and redemption expense(5) |
— | — | — | 12.4 | — | |||||||||||||||
| Acquisition and integration related expense(6) |
5.5 | — | — | — | — | |||||||||||||||
| Other (income) expense, net(1)(8) |
1.7 | (2.3 | ) | (2.1 | ) | (.7 | ) | (.6 | ) | |||||||||||
| 142.9 | 131.8 | 140.0 | 147.2 | 146.6 | ||||||||||||||||
| Income (loss) from continuing operations before income taxes |
18.5 | 27.9 | (2.0 | ) | (6.9 | ) | 3.3 | |||||||||||||
| Income tax expense (benefit)(9) |
(89.4 | ) | 1.7 | .2 | .1 | .1 | ||||||||||||||
| Income (loss) from continuing operations |
107.9 | 26.2 | (2.2 | ) | (7.0 | ) | 3.2 | |||||||||||||
| Discontinued Operations, net of tax: |
||||||||||||||||||||
| Income (loss) from operations |
— | — | — | .3 | (.1 | ) | ||||||||||||||
| Gain on sale |
— | — | — | — | 18.2 | |||||||||||||||
| Income from discontinued operations |
— | — | — | .3 | 18.1 | |||||||||||||||
| Net income (loss) |
$ | 107.9 | $ | 26.2 | $ | (2.2 | ) | $ | (6.7 | ) | $ | 21.3 | ||||||||
| Basic income (loss) per share: |
||||||||||||||||||||
| Income (loss) from continuing operations |
$ | 2.42 | $ | .59 | $ | (.05 | ) | $ | (.17 | ) | $ | .08 | ||||||||
| Income from discontinued operations |
— | — | — | .01 | .44 | |||||||||||||||
| Net income (loss) per share |
$ | 2.42 | $ | .59 | $ | (.05 | ) | $ | (.16 | ) | $ | .52 | ||||||||
| Diluted income (loss) per share: |
||||||||||||||||||||
| Income (loss) from continuing operations |
$ | 2.40 | $ | .59 | $ | (.05 | ) | $ | (.17 | ) | $ | .08 | ||||||||
| Income from discontinued operations |
— | — | — | .01 | .43 | |||||||||||||||
| Net income (loss) per share |
$ | 2.40 | $ | .59 | $ | (.05 | ) | $ | (.16 | ) | $ | .51 | ||||||||
| General: |
||||||||||||||||||||
| Capital expenditures |
$ | 14.8 | $ | 10.4 | $ | 14.8 | $ | 16.2 | $ | 13.0 | ||||||||||
| Total assets |
$ | 726.0 | $ | 338.0 | $ | 351.6 | $ | 326.4 | $ | 338.9 | ||||||||||
| Long-term debt(7) |
$ | 389.4 | $ | 140.8 | $ | 182.1 | $ | 144.6 | $ | 165.0 | ||||||||||
| Cash(7) |
$ | 328.7 | $ | 41.5 | $ | 17.4 | $ | 12.6 | $ | 26.4 | ||||||||||
| (1) | During 2010, the Company recognized strike-related costs of $5.5 million of which $3.3 million is recorded in cost of products sold and $2.2 million is recorded in other (income) expense. |
| (2) | During 2006, the Company recorded indefinite-lived intangible asset impairment charges of $1.0 million. |
| (3) | During 2010, the Company recorded asset impairment charges of $6.2 million to write-down machinery and equipment at its Columbus, Mississippi plant to fair value. During 2009, the Company recorded asset impairment charges of $1.1 million related to assets that would no longer be utilized due to moving certain production to other facilities. |
20
Table of Contents
| (4) | Restructuring and severance consisted primarily of severance costs of $0.6 million in 2010, $2.1 million in 2009, costs for the closure of an extrusion facility and severance costs in 2008, severance costs in 2007, severance costs and asset write-downs and costs for the closure of a European sales office in 2006. |
| (5) | On May 22, 2007, the Company entered into a $150 million Term Loan Credit Agreement (“Term Loan”). Proceeds of the Term Loan, along with cash and other resources of the Company were used to redeem the Company’s $165 Million 11 1/4% Senior Secured Notes. Additionally, the Company paid $9.8 million in premium and tender fees and wrote off $2.6 million of deferred financing costs. |
| (6) | During 2010, the Company recognized acquisition and integration costs of $5.5 million related to the pending purchase of Eliokem International SAS, which was acquired on December 9, 2010. |
| (7) | During 2010, in connection with the pending acquisition of Eliokem International SAS, the Company issued $250 million of Senior Notes, the proceeds of which were held in escrow as of November 30, 2010, and subsequently used on December 9, 2010 to fund the acquisition. |
| (8) | During 2010, the Company recorded a charge of $9.2 million for a fair value adjustment on a foreign currency collar and recorded a gain of $9.7 million from the dissolution of a joint venture marketing alliance |
| (9) | During 2010, the Company reversed a significant portion of its deferred tax valuation allowance of $98.2 million. |
| Item 7. | Management’s Discussion and Analysis of Financial Condition and Results of Operations |
Overview
The Company is an innovator of emulsion polymers, specialty chemicals, and decorative and functional surfaces for a variety of commercial, industrial and residential end uses. As discussed in Item 1, Business, the Company operates two reportable business segments: Performance Chemicals and Decorative Products. The Performance Chemicals segment produces a broad range of emulsion polymers and specialty chemicals based primarily on styrene butadiene, styrene butadiene acrylonitrile, vinyl pyridine, polyvinyl acetate, acrylic, styrene acrylic, vinyl acrylic, glyoxal and fluorochemical chemistries. Performance Chemicals’ custom-formulated products are tailored for coatings, binders and adhesives, which are used in paper, carpet, nonwovens, construction, oil/gas drilling services, adhesives, tape, tire cord, floor polish, textiles, graphic arts, plastic parts, bio-based polymers and various other specialty applications. The Decorative Products segment develops, designs, produces and markets a broad line of functional and decorative surfacing products, including commercial wallcoverings, coated fabrics, performance fabrics, printed and solid color surface laminates and performance films. These products are used in numerous applications, including commercial building refurbishment, remodeling and new construction; kitchen and bath cabinets; transportation including automotive, bus and other mass transit, marine and motorcycle; recreational vehicles and manufactured housing; flooring; commercial and residential furniture; retail display fixtures; home furnishings and consumer electronics; and performance films for pool liners, banners, tents, ceiling tiles and medical devices. Please refer to Item 1, Business, of this Annual Report on Form 10-K for further description of and background on the Company’s operating segments.
The Company’s products are sold to manufacturers, independent distributors and end users directly and through agents.
The Company has strategically located manufacturing facilities in the United States, United Kingdom, China and Thailand.
The Company has historically experienced stronger sales and income in its second, third and fourth quarters, comprised of the three-month periods ending May 31, August 31 and November 30. The Company’s performance in the first quarter (December through February) has historically been weaker and unprofitable due to generally lower levels of customer manufacturing, construction and refurbishment activities during the holidays and cold weather months.
The Company’s chief operating decision maker evaluates performance and allocates resources by operating segment. Segment information has been prepared in accordance with authoritative guidance promulgated by the Financial Accounting Standards Board (“FASB”). The Company’s two operating segments were determined based on products and services provided. Accounting policies of the segments are the same as those described in Note A—Significant Accounting Policies, of the Company’s Consolidated Financial Statements. For a reconciliation of the Company’s segment operating performance information, please refer to Note O of the Company’s Consolidated Financial Statements.
Key Indicators
Key economic measures relevant to the Company include coated paper production, print advertising spending, U.S. commercial real estate and hotel occupancy rates, U.S. office furniture sales, manufactured housing shipments, housing starts and sales of existing homes and forecasts of raw material pricing for certain petrochemical feed stocks. Key OEM
21
Table of Contents
industries which provide a general indication of demand drivers to the Company include paper, commercial and residential construction and refurbishment, automotive, furniture manufacturing and flooring manufacturing. These measures provide general information on trends relevant to the demand for the Company’s products but the trend information does not necessarily directly correlate with demand levels in the markets which ultimately use the Company’s products.
Key operating measures utilized by the business segments include orders, sales, working capital turnover, inventory, productivity, new product vitality, cost of quality and order fill-rates which provide key indicators of business trends. These measures are reported on various cycles including daily, weekly and monthly depending on the needs established by operating management.
Key financial measures utilized by management to evaluate the results of its businesses and to understand the key variables impacting the current and future results of the Company include: sales, gross profit, selling, general and administrative expenses, adjusted operating profit, adjusted net income, consolidated earnings before interest, taxes, depreciation and amortization (“EBITDA”) as set forth in the Net Leverage Ratio in the Company’s $150,000,000 Term Loan Credit Agreement, working capital, operating cash flows, capital expenditures and adjusted earnings per share, including applicable ratios such as inventory turnover, working capital turnover, return on sales and assets and leverage ratios. These measures, as well as objectives established by the Board of Directors of the Company, are reviewed at monthly, quarterly and annual intervals and compared with historical periods.
Results of Operations of 2010 Compared to 2009
The Company’s net sales in 2010 were $846.2 million compared to $696.4 million in 2009. The Company’s Performance Chemicals business segment revenue increased by 33.0% and the Decorative Products business segment revenue increased 6.2%. Contributing to the sales increase in 2010 were higher volumes of $56.2 million, increased pricing of $89.6 million and favorable foreign exchange translation of $4.0 million.
Gross profit in 2010 was $161.4 million with a gross profit margin of 19.1% compared to gross profit of $159.7 million and a gross profit margin of 22.9% in 2009. Gross profit margins declined due to the impact of Performance Chemicals index pricing, in which raw material costs are passed on to the customer without margin benefit, raw material costs exceeding new pricing in Decorative Products and changes in product mix. Also included in gross profit for 2010 were $6.5 million of strike-related and net retirement benefit plan curtailment charges.
Selling, general and administrative expenses in 2010 were $99.6 million, or 11.8% of sales, compared to $99.9 million, or 14.3% of net sales in 2009. Despite rising volumes, selling, general and administrative expense decreased due to the Company’s focused cost controlling efforts.
Interest expense was $8.7 million for 2010 compared to $8.1 million in 2009. Included in 2010 is $1.6 million of additional interest expense relating to the Company’s $250 Million Senior Notes which were issued on November 3, 2010 in connection with the Company’s pending acquisition of Eliokem International SAS (“Eliokem”) (see Debt and Purchase Transaction). The effective interest rate on the Company’s debt was 4.9% and 4.5% for 2010 and 2009, respectively. Total debt at November 30, 2010 was $394.2 million compared to $144.1 million at November 30, 2009. Total cash, which included proceeds from the Senior Notes which were held in escrow until the completion of the acquisition, was $328.7 million at November 30, 2010 and $41.5 million at November 30, 2009.
Other expense was $1.7 million in 2010 compared to income of $2.3 million in 2009. Expense items included in 2010 were a fair value adjustment expense of $9.2 million related to a Euro currency option collar which the Company put in place to hedge currency risk for the pending Eliokem acquisition, strike-related costs of $2.2 million, losses on foreign currency transactions of $0.8 million and a customs duty settlement of $0.3 million. These expense items were partially offset by a gain of $9.7 million related to the dissolution of the Company’s joint venture marketing alliance with Rohm and Haas Company and a net gain of $0.7 million on the reversal of indemnification obligations.
Other income in 2009 included flood-related costs of $0.6 million, foreign currency transaction gains of $0.5 million, licensing revenue of $0.4 million and a gain of $0.3 million on the reversal of an indemnification obligation.
22
Table of Contents
There was an income tax benefit of $89.4 million in 2010 and income tax expense was $1.7 million in 2009. The benefit in 2010 was primarily related to the reversal of $98.2 million of the Company’s U.S. deferred tax valuation allowance partially offset by tax expense of $8.8 million related to U.S. and foreign related income taxes. Prior to 2010, valuation allowances had been provided for deferred tax assets in the U.S. as a result of the Company’s prior losses, uncertainty of predicting future taxable earnings due to market demand, and price and raw material cost volatility. The Company has determined in 2010 that it is more likely than not that it will realize the future benefits of its net operating loss carryforwards and accordingly, has reversed a significant portion of its tax valuation allowance. The Company’s effective rate was (483.2)% in 2010. Excluding the reversal of the U.S. valuation allowance, the effective rate was 47.6% compared to the U.S. statutory rate of 35%. The higher rate in 2010 is primarily due to acquisition costs of $3.1 million which are non-deductible for tax purposes, utilization of state net operating loss carryforwards (“NOLC”) of $1.5 million and a change in the state tax rate applied to deferred tax assets. At present, the Company has $118.9 million of domestic federal net operating loss carryforwards that expire from 2021 through 2028, which could be used to offset future cash taxes.
The Company generated net income of $107.9 million or $2.40 per diluted share in 2010 compared to net income of $26.2 million or $0.59 per diluted share in 2009.
Segment Discussion
The following Segment Discussion presents information used by the Company in assessing the results of operations by business segment. The Company believes that this presentation is useful for providing the investor with an understanding of the Company’s business and operating performance because these measures are used by the chief operating decision maker in evaluating performance and allocating resources.
The following table reconciles segment sales to consolidated net sales and segment operating profit (loss) to consolidated income before income taxes:
| Year Ended November 30, |
||||||||
| 2010 | 2009 | |||||||
| (Dollars in millions) | ||||||||
| Segment Sales: |
||||||||
| Performance Chemicals |
||||||||
| Paper and Carpet Chemicals |
$ | 330.1 | $ | 249.2 | ||||
| Specialty Chemicals |
197.8 | 147.6 | ||||||
| Total Performance Chemicals |
$ | 527.9 | $ | 396.8 | ||||
| Decorative Products |
||||||||
| Commercial Wallcovering and Coated Fabrics |
$ | 219.9 | $ | 217.7 | ||||
| Laminates and Performance Films |
98.4 | 81.9 | ||||||
| Total Decorative Products |
318.3 | 299.6 | ||||||
| Consolidated net sales |
$ | 846.2 | $ | 696.4 | ||||
| Segment Gross Profit: |
||||||||
| Performance Chemicals |
$ | 104.4 | $ | 90.8 | ||||
| Decorative Products |
57.0 | 68.9 | ||||||
| Consolidated Gross Profit |
$ | 161.4 | $ | 159.7 | ||||
| Segment Operating Profit (Loss): |
||||||||
| Performance Chemicals |
$ | 73.3 | $ | 48.0 | ||||
| Decorative Products |
(18.0 | ) | 1.6 | |||||
| Interest expense |
(8.7 | ) | (8.1 | ) | ||||
| Corporate expense |
(28.1 | ) | (13.6 | ) | ||||
| Consolidated income before income tax |
$ | 18.5 | $ | 27.9 | ||||
23
Table of Contents
Performance Chemicals
Performance Chemicals’ net sales increased $131.1 million, or 33.0%, to $527.9 million during 2010 compared to $396.8 million during 2009. The higher sales were driven by stronger volume of $45.8 million and higher selling prices of $85.3 million. Paper and Specialty Chemicals volumes were up year over year but Carpet Chemicals volumes were down. Net sales for the Paper and Carpet Chemicals product line increased $80.9 million to $330.1 million during 2010 compared to $249.2 million during 2009. Net sales for the Specialty Chemicals product line increased $50.2 million to $197.8 million during 2010 compared to $147.6 million during 2009.
Performance Chemicals’ gross profit in 2010 was $104.4 million with a gross profit margin of 19.8% compared to $90.8 million and a gross profit margin of 22.9% in 2009. While gross profit dollars improved by 15.0%, the decline in gross profit margin was primarily due to the effect of index pricing, in which higher raw material costs of $83.5 million were passed through without any gross margin benefit.
This segment generated an operating profit of $73.3 million in 2010. Included in the operating profit is the gain of $9.7 million for the dissolution of the RohmNova joint venture in the second quarter of 2010. Excluding this gain, operating profit would have been $63.6 million for 2010 compared to $48.0 million in 2009, an improvement of 32.5%. The increase in segment operating profit was primarily due to higher volumes of $14.6 million, and $6.3 million of lower manufacturing cost, SG&A and other expense. Higher pricing of $85.3 million was mostly offset by higher raw material costs of $83.5 million. Additionally, this segment recorded LIFO expense of $2.8 million in 2010 compared to LIFO income of $5.3 million in 2009. Segment operating profit also includes other items which management excludes when evaluating the results of the Company’s segments. Those items for 2010 include workforce reduction costs of $0.4 million and a defined benefit pension plan curtailment charge of $0.1 million and for 2009, asset write-offs of $0.6 million, workforce reduction costs of $0.2 million and a defined benefit pension plan curtailment charge of $0.2 million.
During May 2010, the Company acquired certain intangible assets of The Dow Chemical Company’s hollow plastic pigment product line for $2.5 million. Those intangible assets included patents, trademarks and customer lists. The purchase of these intangible assets will allow the Company to enhance its leading product offering to the coated paper and paperboard industry and provide an opportunity for growth in other applications. In accordance with the applicable accounting guidance, the Company determined the fair value of these assets to be $2.5 million on the acquisition date.
Decorative Products
Decorative Products net sales increased $18.7 million, or 6.2%, to $318.3 million in 2010 from $299.6 million in 2009 primarily due to improved volumes of $10.4 million, higher pricing of $4.3 million and currency translation effects of $4.0 million. Commercial Wallcovering and Coated Fabrics net sales were $219.9 million in 2010 compared to $217.7 million in 2009. Net sales for the Laminates and Performance Films product line increased to $98.4 million during 2010 compared to $81.9 million during 2009.
Decorative Products’ gross profit was $57.0 million with a gross profit margin of 17.9% during 2010 compared to $68.9 million and a gross profit margin of 23.0% in 2009. The decrease in gross profit margin is primarily due to higher raw material costs of $13.3 million, strike-related costs of $3.3 million at the Company’s Columbus, Mississippi plant, product mix and higher manufacturing costs of $1.7 million.
This segment had an operating loss of $18.0 million for 2010. Included in the operating loss are several charges related to the Columbus, Mississippi facility including a non-cash asset impairment charge of $6.2 million for the write-down of machinery and equipment to fair value, strike-related costs of $5.5 million and a non-cash pension plan curtailment charge of $3.2 million. The impairment was caused by the loss of business from weaker market conditions for commercial wallcovering which is not expected to recover to historical levels and transfer of certain products to other Company facilities to better meet customer demand. The assets were written down to their estimated fair value using a cost approach. Excluding the above items, segment operating loss would have been $3.1 million compared to an operating profit of $1.6 million in 2009. The decrease in segment operating profit was primarily due to higher raw material costs of $13.3 million, higher
24
Table of Contents
manufacturing, overhead and other costs of $1.7 million and foreign exchange transaction losses of $1.3 million, partially offset by higher volumes of $7.8 million and higher pricing of $4.3 million. Additionally, this segment recorded a LIFO inventory charge of $0.8 million in 2010 compared to LIFO income of $0.7 million in 2009. Segment operating profit also includes other items which management excludes when evaluating the results of the Company’s segments. Those items for 2010 included a foreign import duty claim of $0.3 million, a reversal of an indemnification receivable of $0.3 million, legal settlement expense of $0.3 million and workforce reduction costs of $0.2 million and for 2009, a pension curtailment gain of $0.7 million, flood-damage costs of $0.6 million, workforce reduction costs of $1.8 million, asset impairment charges of $0.5 million and a reversal of an indemnification receivable of $0.3 million.
Interest and Corporate
Interest expense was $8.7 million in 2010 compared to $8.1 million for 2009. The increase was primarily due to $1.6 million of interest expense on the 7 7/8% Senior Notes which were issued on November 3, 2010 in connection with the Company’s pending acquisition of Eliokem International SAS (see Debt and Purchase Transaction) and held in escrow until the acquisition was completed on December 9, 2010.
Corporate expenses were $28.1 million in 2010 compared to $13.6 million in 2009. The increase is primarily due to a $9.2 million charge for a fair value adjustment for a Euro currency option collar which was related to the Eliokem acquisition and was settled with the counter-party on December 1, 2010 and acquisition and integration related costs for the acquisition of Eliokem of $5.5 million.
Results of Operations of 2009 Compared to 2008
The Company’s net sales in 2009 were $696.4 million as compared to $869.4 million in 2008. The Company’s Performance Chemicals business segment revenue decreased by 23.9% and the Decorative Products business segment revenue decreased 13.9%. Contributing to the sales decrease in 2009 were volume declines of $108.6 million or 12.5% as a result of weak market conditions, lower pricing of $68.7 million as a result of lower raw material costs and unfavorable foreign exchange translation of $16.1 million, which were partially offset by additional sales of $20.4 million from the Decorative Products Asian operations. The Decorative Products Asian operations were acquired on December 31, 2007. Net sales in 2009 included thirteen months from the Decorative Products Asian operations as compared to 2008, which includes ten months. The thirteenth month in 2009 resulted in additional net sales and net income of $8.0 million and $0.2 million, respectively.
Gross profit in 2009 was $159.7 million with a gross profit margin of 22.9% compared to gross profit of $138.0 million and a gross profit margin of 15.9% in 2008. The improved margin was primarily due to lower costs for raw materials of $106.8 million and a reduction in manufacturing costs as a result of significant restructurings, cost reduction initiatives, lower transportation costs and lower costs for resale merchandise.
Selling, general and administrative expenses of $99.9 million in 2009 were $4.9 million, or 4.7% lower than 2008. The decrease in 2009 was primarily due to a reduction in the number of employees and cost saving initiatives.
Interest expense of $8.1 million in 2009 compared to $13.0 million in 2008. The lower interest expense in 2009 is primarily due to significantly lower debt levels and lower average interest rates. Total debt at November 30, 2009 was $144.1 million, down $44.2 million from November 30, 2008.
Other (income)/expense, net was $(2.3) million in 2009 and $(2.1) million in 2008. Included in 2009 are flood related costs of $0.6 million net of insurance proceeds.
Income tax expense was $1.7 million in 2009 compared to a tax expense of $0.2 million in 2008. The tax expense in 2009 was primarily related to foreign income taxes as a result of improved earnings, a provision for Alternative Minimum Tax (“AMT”) expense of $0.2 million and state and local income taxes of $0.2 million. The effective rates of 6.4% in 2009 and 6.4% in 2008 were below the U.S. statutory rate of 35% primarily due to the utilization of tax loss carryforwards. Valuation
25
Table of Contents
allowances have been provided for deferred tax assets in the U.S. as a result of the Company’s prior losses and the uncertainty of predicting future taxable earnings due to price and raw material cost volatility. At present, the Company has $131.8 million of domestic federal net operating loss carryforwards that expire by 2030.
The Company had net income of $26.2 million, or $0.59 per diluted share, in 2009 compared to a net loss of $2.2 million, or $0.05 per diluted share, in 2008. The increase in net income was primarily due to margin improvement, cost reductions, lower interest expense and improved Asian business performance.
Segment Discussion
The following Segment Discussion presents information used by the Company in assessing the results of operations by business segment. The Company believes that this presentation is useful for providing the investor with an understanding of the Company’s business and operating performance because these measures are used by the chief operating decision maker in evaluating performance and allocating resources.
The following table reconciles segment sales to consolidated net sales and segment operating profit to consolidated income (loss) before income taxes:
| Year Ended November 30, |
||||||||
| 2009 | 2008 | |||||||
| (Dollars in millions) | ||||||||
| Segment Net Sales: |
||||||||
| Performance Chemicals |
||||||||
| Paper and Carpet Chemicals |
$ | 249.2 | $ | 337.0 | ||||
| Specialty Chemicals |
147.6 | 184.6 | ||||||
| Total Performance Chemicals |
$ | 396.8 | $ | 521.6 | ||||
| Decorative Products |
||||||||
| Commercial Wallcovering and Coated Fabrics |
$ | 217.7 | $ | 252.2 | ||||
| Laminates and Performance Films |
81.9 | 95.6 | ||||||
| Total Decorative Products |
299.6 | 347.8 | ||||||
| Consolidated net sales |
$ | 696.4 | $ | 869.4 | ||||
| Segment Gross Profit: |
||||||||
| Performance Chemicals |
$ | 90.8 | $ | 68.3 | ||||
| Decorative Products |
68.9 | 69.7 | ||||||
| Consolidated Gross Profit |
$ | 159.7 | $ | 138.0 | ||||
| Segment Operating Profit (Loss): |
||||||||
| Performance Chemicals |
$ | 48.0 | $ | 25.2 | ||||
| Decorative Products |
1.6 | (6.5 | ) | |||||
| Interest expense |
(8.1 | ) | (13.0 | ) | ||||
| Corporate expense |
(13.6 | ) | (7.7 | ) | ||||
| Consolidated profit (loss) from continuing operations before income tax |
$ | 27.9 | $ | (2.0 | ) | |||
Performance Chemicals
Performance Chemicals’ net sales decreased 23.9% to $396.8 million during 2009 compared to $521.6 million during 2008, driven by lower selling prices of $72.0 million as a result of lower raw material costs, volume decreases of $47.2 million and $5.6 million of unfavorable foreign exchange translation. Net sales for the Paper and Carpet Chemicals product line decreased to $249.2 million during 2009 compared to $337.0 million during 2008. Net sales for the Specialty Chemicals product line decreased to $147.6 million during 2009 compared to $184.6 million during 2008.
26
Table of Contents
Performance Chemicals’ gross profit was $90.8 million in 2009 with a gross profit margin of 22.9% compared to $68.3 million and a gross profit margin of 13.1% in 2008.
Performance Chemicals generated an operating profit of $48.0 million and an operating profit margin of 12.1% for 2009 compared to $25.2 million and an operating profit margin of 4.8% for 2008. The increase in segment operating profit was due to lower raw material costs of $98.8 million, lower transportation and manufacturing costs and other cost reductions of $3.3 million, partially offset by lower pricing of $72.0 million, lower volumes of $12.0 million and asset write-offs of $0.7 million. Included in 2009 is a decrease in the LIFO reserve, which increased income by $5.4 million.
Decorative Products
Decorative Products’ net sales decreased by 13.9% to $299.6 million in 2009 from $347.8 million in 2008, primarily due to decreased volumes of $61.4 million and $10.5 million of unfavorable foreign exchange rates, partially offset by improved pricing of $3.3 million and additional sales at the Decorative Products Asian businesses of $20.4 million. Commercial Wallcovering and Coated Fabrics net sales were $217.7 million during 2009 compared to $252.2 million in 2008. Net sales for the Laminates and Performance Films product line were $81.9 million during 2009 compared to $95.6 million in 2008.
Decorative Products’ gross profit was $68.9 million with a gross profit margin of 23.0% for 2009 compared to $69.7 million and a gross profit margin of 20.1% for 2008.
Decorative Products generated operating income of $1.6 million with an operating profit margin of 1.0% for 2009 compared to an operating loss of $6.5 million and an operating profit margin of (1.9)% in 2008. The improvement in 2009 was primarily due to improved profit at the Asian businesses of $9.8 million, lower raw material costs of $8.0 million, improved pricing of $3.3 million and lower health care, utilities, transportation and cost reductions of $5.6 million, partially offset by lower volume of $16.7 million, flood related costs, net of insurance proceeds, of $0.5 million and higher restructuring and severance charges of $2.1 million. Included in 2009 is a decrease in the LIFO reserve, which increased income by $0.7 million.
Interest and Corporate
Interest expense decreased to $8.1 million in 2009 from $13.0 million in 2008. The lower interest expense in 2009 is primarily due to significantly lower debt levels and lower average interest rates.
Corporate expense increased to $13.6 million in 2009 from $7.7 million in 2008, primarily due to higher compensation expenses as a result of the increase in the Company’s stock price and the achievement of certain operating result metrics. Included in 2009 is a pension plan curtailment gain of $0.4 million and included in 2008 is a gain of $0.4 million related to a settlement with an insurer.
Subsequent Event—Purchase Transaction
On December 9, 2010, the Company completed the acquisition of all the outstanding shares of Eliokem International SAS (“Eliokem”) from AXA Investment Managers Private Equity Europe and the other holders of equity securities of Eliokem for an aggregate purchase price of $299.7 million in cash, subject to working capital and capital expenditure adjustments. The Company used cash on hand, the net proceeds from the issuance of its 7.875% Senior Notes due 2018 (“Senior Notes”) and proceeds from a new $200 million Term Loan to fund the acquisition, including the repayment of Eliokem debt. The balance of the proceeds were used for repayment of the Company’s existing term loan (see Debt section) and related costs. Costs associated with the Senior Note issuance and the Eliokem acquisition included in the Company’s results for 2010 include $5.5 million of acquisition and integration expenses and an additional $1.6 million of interest expense on the Senior Notes. Additionally, in the first quarter of 2011, the Company expects to write off $1.1 million of deferred financing fees related to the $150 million Term Loan B.
Eliokem is a worldwide manufacturer of specialty chemicals used in a diverse range of niche applications including coating resins, elastomeric modifiers, antioxidants, oilfield chemicals and latices for specialty applications. Eliokem is headquartered in Villejust, France and has facilities located in France, the United States, China and India.
27
Table of Contents
The transaction will be accounted for under acquisition accounting using the fair value concepts defined in ASC Subtopic 820-10, “Fair Value Measurements and Disclosures.” ASC Subtopic 805-10, ”Business Combinations” requires, among other things, that assets acquired and liabilities assumed be recognized at their fair values as of the acquisition date.
The preliminary estimate of the fair values of assets acquired and liabilities to be assumed as of the closing of the Acquisition were allocated to each of Eliokem’s assets, liabilities and identifiable intangible assets. The excess of purchase price over the estimated fair values of assets acquired and liabilities assumed is allocated to goodwill.
The preliminary estimate of the fair values of assets acquired and liabilities assumed (in millions) is as follows:
| Fair Value | ||||
| Current assets |
$ | 117.5 | ||
| Property, plant and equipment |
118.8 | |||
| Identifiable intangible assets |
80.7 | |||
| Deferred tax assets |
3.3 | |||
| Other assets |
.6 | |||
| Goodwill |
81.2 | |||
| Total assets acquired |
402.1 | |||
| Current liabilities |
(50.3 | ) | ||
| Deferred tax liabilities |
(44.2 | ) | ||
| Other liabilities |
(7.9 | ) | ||
| Net assets acquired |
$ | 299.7 | ||
The preliminary allocation of the purchase price is based on preliminary estimates of the fair value of assets acquired and liabilities assumed, and the related income tax impact of the acquisition accounting adjustments. The Company is in the process of determining the final working capital adjustment, the fair value of tangible and intangible assets acquired as well as evaluating the impact of historical tax attributes and the related impact on the preliminary purchase price allocation. The final fair valuations may be different from the preliminary valuations. The final allocation of the purchase price will be determined after completion of a final analysis to determine the fair values of the tangible assets, identifiable intangible assets, and liabilities as of the date the acquisition is complete. Increases or decreases in the fair value of the net assets may change the amount of the purchase price allocated to goodwill and other assets and liabilities. Goodwill arising from the acquisition is primarily attributable to many factors including synergies expected from combining the operations of Eliokem with our existing Performance Chemicals operations as well as benefits derived from expansion of Performance Chemicals’ manufacturing capabilities.
The preliminary estimated fair value of the identifiable intangible assets and their weighted-average useful lives have been estimated as follows (dollars in millions):
| Estimated Fair Value |
Estimated Useful Life |
|||||||
| Definite lived assets: |
||||||||
| Trademarks |
$ | 1.2 | 13 years | |||||
| Customer relationships |
36.2 | 10 –14 years | ||||||
| Other intangibles |
12.4 | 4 – 14 years | ||||||
| Total definite lived assets |
49.8 | |||||||
| Indefinite lived assets: |
||||||||
| Trademarks |
30.9 | N/A | ||||||
| Total identifiable intangible assets |
$ | 80.7 | ||||||
Definite lived intangible assets will be amortized over their estimated useful lives. Intangible assets with indefinite useful lives and goodwill will not be amortized but will be tested for impairment at least annually.
28
Table of Contents
The unaudited pro forma effect of the acquisition of Eliokem on the Company’s net sales, net income and net income per share, had the acquisition occurred on December 1, 2008 and 2009, respectively, is as follows:
| Year Ended November 30, | ||||||||
| 2010 | 2009 | |||||||
| (Dollars in millions, except per share amounts) |
||||||||
| Net sales |
$ | 1,134.6 | $ | 920.1 | ||||
| Net income |
$ | 102.9 | $ | 24.6 | ||||
| Net income per share, basic |
$ | 2.31 | $ | .56 | ||||
| Net income per share, diluted |
$ | 2.29 | $ | .56 | ||||
Financial Resources and Capital Spending
The following table reflects key cash flow measures from continuing operations:
| 2010 | 2009 | 2008 | ||||||||||
| (Dollars in millions) | ||||||||||||
| Cash provided by operating activities |
$ | 45.0 | $ | 74.2 | $ | 17.6 | ||||||
| Cash used in investing activities |
$ | (259.8 | ) | $ | (9.0 | ) | $ | (40.0 | ) | |||
| Cash provided by (used) in financing activities |
$ | 250.0 | $ | (44.2 | ) | $ | 35.0 | |||||
| Increase in cash and cash equivalents |
$ | 34.1 | $ | 24.1 | $ | 4.8 | ||||||
Cash provided by operating activities was $45.0 million in 2010, $74.2 million in 2009, and $17.6 million in 2008. Cash provided by operations decreased in 2010 primarily due to lower pre-tax profitability (partially as a result of strike-related and acquisition related costs) and a reduction in funds provided from working capital compared to 2009 primarily to an increase in inventory due to higher prices. Cash provided by operations increased in 2009 primarily due to improved profitability and a decrease in working capital. Days Sales Outstanding (“DSO”) was 50.1 days in 2010 compared to 49.9 days during 2009 and 48.1 days during 2008. The increase from 2008 is primarily due to an increase in foreign sales which have a longer collection period and extended terms.
Cash used in investing activities was $259.8 million in 2010, compared to $9.0 million in 2009 and $40.0 million in 2008. Included in 2010 was restricted cash of $253.1 million. Restricted cash consisted of $250.0 million in proceeds from the issuance of the Senior Notes and certain debt issuance fees, which were placed in an escrow account until the completion of the acquisition of Eliokem and refinancing of the Company’s existing debt on December 9, 2010. During the first quarter of 2008, the Company purchased the minority interests in its joint venture businesses for $28.0 million which was funded through borrowings under its revolving credit facility. Additionally, the Company incurred $14.8 million of capital expenditures in 2010, $10.4 million in 2009 and $14.8 million in 2008. Capital expenditures were made and are planned principally for asset replacement, new product capability, cost reduction, safety and productivity improvements and environmental protection.
Cash provided by financing activities in 2010 was due to the issuance of $250 million principal amount of Senior Notes. The proceeds of the Senior Notes were held in escrow as of November 30, 2010. On December 9, 2010, the Company used the proceeds, along with existing cash and a refinancing and upsizing of the Company’s Term Loan B (as described under Debt and Purchase Transaction) from $150 million to $200 million, to complete the acquisition of Eliokem. Cash used in financing activities was $44.2 million in 2009 primarily due to debt repayments. Cash provided by financing activities in 2008 was $35.0 million. Total debt was $394.2 million as of November 30, 2010, which includes the Senior Notes, compared to $144.1 million as of November 30, 2009 and $188.3 million as of November 30, 2008. Included in 2008 are borrowings of $29.0 million used to fund the purchase of the Decorative Products Asian businesses.
29
Table of Contents
Debt
Amounts due banks consist of the following debt obligations that are due within the next twelve months:
| November 30, | ||||||||
| 2010 | 2009 | |||||||
| (Dollars in millions) | ||||||||
| Term Loan B – current portion |
$ | 1.5 | $ | 1.5 | ||||
| Foreign subsidiaries borrowings (interest at 5.1% – 5.3%) |
3.3 | 1.8 | ||||||
| Total |
$ | 4.8 | $ | 3.3 | ||||
Total foreign availability at November 30, 2010 was $7.1 million, of which $3.3 million was outstanding. Foreign subsidiaries’ borrowings are secured by equipment, buildings and land use rights of the foreign subsidiaries. In addition, the Company has additional foreign credit facilities for the issuance of letters of credit of $5.7 million. Outstanding letters of credit on this facility were $0.1 million at November 30, 2010.
The Company’s long-term debt consists of the following:
| November 30, | ||||||||
| 2010 | 2009 | |||||||
| (Dollars in millions) | ||||||||
| Term Loan B (interest at 2.8%) |
$ | 140.9 | $ | 142.3 | ||||
| Senior Unsecured Notes (interest at 7.875%) |
250.0 | — | ||||||
| Senior Revolving Credit Facility (interest at 1.5%) |
— | — | ||||||
| 390.9 | 142.3 | |||||||
| Less: current portion |
1.5 | 1.5 | ||||||
| Total long-term debt |
$ | 389.4 | $ | 140.8 | ||||
On May 22, 2007, the Company entered into a $150 Million Term Loan Credit Agreement due May 2014. The Term Loan carries a variable interest rate based on, at the Company’s option, either an alternate base rate or a Eurodollar rate, in each case plus an applicable margin. The alternate base interest rate is a fluctuating rate equal to the higher of the Prime Rate or the sum of the Federal Funds Effective Rate plus 0.50%. The applicable margin for the alternate base rate is 1.50%. The Eurodollar rate is a periodic fixed rate equal to the London Inter Bank Offered Rate (“LIBOR”). The applicable margin for the Eurodollar rate is 2.50%. Annual principal payments consist of $1.5 million, due in quarterly installments, and annual excess free cash flow payments as defined in the Term Loan agreement, with any remaining balance to be paid May 2014. Required principal payments of $1.5 million were paid in both 2009 and 2008 and the 2007 excess cash flow payment of $3.9 million was paid during 2008. The Company was not required to pay an excess cash flow payment for 2009 or 2008. The Company can prepay any amount at any time without penalty upon proper notice and subject to a minimum dollar requirement. Prepayments will be applied towards any required annual excess free cash flow payment. The Term Loan is secured by all real property and equipment of the Company’s domestic facilities and stock and equity investments of the Company’s non-domestic subsidiaries. The Term Loan requires the Company to maintain an interest rate swap with a notional amount of at least $50 million. Additionally, the Term Loan provides for additional borrowings of the greater of $75 million or an amount based on a senior secured leverage ratio, as defined in the Term Loan, $75 million, provided that certain requirements are met including an interest coverage ratio. The Company has not utilized these additional borrowings as of November 30, 2010. The Term Loan contains affirmative and negative covenants, including limitations on additional debt, certain investments and acquisitions outside of the Company’s line of business. The Term Loan requires the Company to maintain a net leverage ratio of less than 5.5 to 1. At November 30, 2010, the Company was in compliance with this requirement with a ratio of 1.3 to 1.
On May 31, 2007, as required under the Term Loan, the Company entered into a five year fixed rate interest rate swap agreement with a notional amount of $50 million to convert a portion of the outstanding Term Loan from variable to fixed
30
Table of Contents
rates. Under this agreement, the Company paid to the counterparty a fixed rate of 5.23% and received from the counterparty a variable rate based on three month LIBOR. This effectively converted $50 million of the Term Loan to a fixed rate of 7.73% when including the applicable margin of the Term Loan of 2.50%. The variable rates on the interest rate swap and $50 million of the Term Loan were reset every three months on the same LIBOR base rate and same date, at which time the interest was settled and recognized as adjustments to interest expense. As of November 30, 2009, the unrealized loss of the swap of $4.6 million was recognized as a non-current liability with a corresponding amount recognized in Accumulated Other Comprehensive Income (loss). In November 2010, the Company terminated and settled the interest rate swap with the counterparty at a cost of $4.3 million. As required under applicable accounting guidance, this amount is recognized in Accumulated Other Comprehensive Income (loss) and will be amortized into interest expense over the remaining original term of the interest rate swap agreement.
In connection with the Term Loan, on May 22, 2007 the Company amended its Senior Secured Revolving Credit Facility (“Facility”). The Facility was increased to $80 million from $72 million and extended until May 2012. In January 2008, the Facility was increased to $90 million. The Facility is secured by domestic accounts receivable, inventory (collectively the “Eligible Borrowing Base”) and intangible assets. Availability under the Facility will fluctuate depending on the Eligible Borrowing Base and is determined by applying customary advance rates to the Eligible Borrowing Base including a reserve, as calculated by the Lenders, for the Company’s interest rate swap (“interest rate swap reserve”). The Facility includes a $15 million sublimit for the issuance of commercial and standby letters of credit and a $10 million sublimit for swingline loans. Outstanding letters of credit on November 30, 2010 were $2.8 million. The Facility contains affirmative and negative covenants, similar to the Term Loan, including limitations on additional debt, certain investments and acquisitions outside of the Company’s line of business. If the average excess availability of the Facility falls below $20 million during any fiscal quarter, the Company must then maintain a fixed charge coverage ratio greater than 1.1 to 1 as defined in the agreement. Average excess availability is defined as the average daily amount available for borrowing under the Facility during the Company’s fiscal quarter. The Company was in compliance with this requirement as the average excess availability did not fall below $20 million during 2010 and averaged $58 million during the fourth quarter of 2010.
Advances under the Facility bear interest, at the Company’s option, at either an alternate base rate or a Eurodollar rate, in each case plus an applicable margin. The alternate base interest rate is a fluctuating rate equal to the higher of the Prime Rate or the sum of the Federal Funds Effective Rate plus 0.50%. The applicable margin for the alternate base rate will vary from 0.0% to 0.25% depending on the Company’s fixed charge coverage ratio and the margin was 0.0% at November 30, 2010. The Eurodollar rate is a periodic fixed rate equal to LIBOR. The applicable margin for the Eurodollar rate will vary from 1.25% to 2.00% depending on the Company’s fixed charge coverage ratio and the margin was 1.25% at November 30, 2010.
The Facility requires a commitment fee based on the unused portion of the Facility. The commitment fee will vary from 0.125% to 0.25% based on the Company’s fixed charge coverage ratio and was 0.125% at November 30, 2010.
At November 30, 2010, the Company had $68.0 million of eligible inventory and receivables to support the eligible borrowing base which is capped at $90.0 million under the Facility. At November 30, 2010, outstanding letters of credit under the Facility were $2.8 million, there were no amounts borrowed under the Facility and the amount available for borrowing under the Facility was $65.2 million.
The fair value of the Company’s long-term debt at November 30, 2010 approximated $370.7 million, which is lower than the carrying value as a result of prevailing market rates on the Company’s debt.
The effective interest rate on the Company’s U.S. debt was 4.9% and 4.5% for 2010 and 2009, respectively.
Cash paid for interest was $6.8 million, $6.9 million and $12.2 million for 2010, 2009 and 2008, respectively.
In connection with the acquisition of Eliokem International SAS (“Eliokem”) as described below and in Note R, on November 3, 2010, the Company issued a private placement of $250 million aggregate principal amount of Senior Notes with a 7.875% interest rate, payable semi-annually. The Senior Notes mature on November 1, 2018 and are unsecured. As of
31
Table of Contents
November 30, 2010, the proceeds of the Senior Notes were held in escrow subject to the completion of the Eliokem acquisition. If this acquisition had not occurred, the Company would have been required to redeem the Senior Notes at a premium. The Company may redeem a portion of the outstanding Senior Notes any time after October 2014 at a premium above par, subject to certain restrictions. The Senior Notes are jointly, severally and unconditionally guaranteed on a senior, unsecured basis by all of OMNOVA Solutions Inc.’s existing and future domestic subsidiaries that from time to time guarantee obligations under the Company’s Senior Notes, with certain exceptions (the “Guarantors”). In connection with the issuance of the Senior Notes, the Company entered into a Registration Rights Agreement among the Company, the Guarantors and the initial purchasers of the Senior Notes. Under the Registration Rights Agreement, the Company and the Guarantors agreed, among other things, to use reasonable best efforts to file an exchange offer registration statement with the SEC with respect to the Senior Notes and the guarantees thereof within 150 days after the consummation of the Acquisition.
Subsequent Event—Debt Transactions
Additionally, on December 9, 2010, the Company refinanced its existing $150 million Term Loan that had a balance of $140.9 million as of November 30, 2010 with a new $200 million Term Loan (“New Term Loan”). The New Term Loan is secured by the property, plant and equipment and intangible assets of the combined companies. The New Term Loan carries a variable interest rate based on, at the Company’s option, either a Eurodollar rate or a base rate, in each case plus an applicable margin. The Eurodollar rate is a periodic fixed rate equal to the London Inter Bank Offered Rate (“LIBOR”), provided that the Eurodollar rate shall not be less than 1.75%. The applicable margin for the Eurodollar rate is initially 4.0%. However, if the Company’s net leverage ratio falls below 2.75, the applicable margin will decrease to 3.75%. The base interest rate is a fluctuating rate equal to the higher of (i) the Prime Rate, (ii) the sum of the Federal Funds Effective Rate plus 0.50% or (iii) the one month Eurodollar rate plus 1.0%. The applicable margin for the base rate is 3.0%. However, if the Company’s net leverage ratio falls below 2.75, the applicable margin will decrease to 2.75%. Annual principal payments consist of $2.0 million, due in quarterly installments, and annual excess free cash flow payments as defined in the New Term Loan agreement, with any remaining balance to be paid May 31, 2017. The Company can prepay any amount at any time without penalty upon proper notice and subject to a minimum dollar requirement. Prepayments will be applied towards any required annual excess free cash flow payment. The New Term Loan is secured by all real property and equipment of the Company’s domestic facilities and guaranteed by the domestic subsidiaries of the Company. Additionally, the New Term Loan provides for additional borrowings of the greater of $75 million or an amount based on a senior secured leverage ratio, as defined in the New Term Loan, provided that certain requirements are met including an interest coverage ratio of 2.0. The New Term Loan contains affirmative and negative covenants, including limitations on additional debt, certain investments and acquisitions outside of the Company’s line of business. The New Term Loan requires the Company to maintain an initial senior secured net leverage ratio of less than 3.25 to 1, which decreases annually by 25 basis points through December 1, 2014, and then remains at 2.5 to 1 thereafter.
The Company issued the New Term Loan at a discount of $2.0 million receiving cash of $198 million. This discount will be reflected as a reduction of outstanding debt and amortized over the respective term of the debt.
Also in connection with the acquisition of Eliokem, in December 2010, the Company amended and restated the Asset Based Facility (“Amended Facility”), increasing potential availability to $100 million, which can be further increased up to $150 million, subject to additional borrowing base assets and lender approval. Total availability is dependent on domestic accounts receivable and inventory. The Amended Facility increases the average excess availability requirement to $25 million during any fiscal quarter but retains the fixed charge coverage ratio of 1.1 to 1 if average excess availability falls below the $25 million. Applicable margins are based on the Company’s average daily excess availability during the previous fiscal quarter. If average excess availability is greater than $50 million, the applicable margin will be 2.25% on Eurodollar loans, 1.25% on base rate borrowings and .625% on commitments for unused credit lines. If average excess availability is greater than $25 million but less than $50 million, the applicable margin will be 2.5% on Eurodollar loans, 1.5% on base rate borrowings and 0.5% on commitments for unused credit lines. If average excess availability is less than $25 million, the applicable margin will be 2.75% on Eurodollar loans, 1.75% on base rate borrowings and 0.375% on commitments for unused credit lines.
Net proceeds from the notes and the New Term Loan were used for the acquisition of Eliokem (including the repayment of Eliokem’s debt), the repayment of amounts outstanding under our existing term loan, related fees and expenses and for general working capital purposes. The acquisition was completed on December 9, 2010. The Amended Facility was not used to fund the acquisition.
32
Table of Contents
The Company expects to incur approximately $15.7 million of deferred financing costs in connection with the issuance of the Senior Notes and the new $200 million Term Loan. These new deferred financing costs will be amortized over the respective terms of the underlying debt. Related amortization expense in 2011 is expected to be $2.2 million. The Company’s prior deferred financing fees of $1.1 million as of November 30, 2010 related to the existing $150.0 million Term Loan B will be written off in the first quarter of 2011.
Contractual Obligations
| Payments Due By Period | ||||||||||||||||||||
| Total | Less Than 1 Year |
2 — 3 Years |
4 — 5 Years |
More Than 5 Years |
||||||||||||||||
| (Dollars in millions) | ||||||||||||||||||||
| Long-term debt and amounts due banks(1) |
$ | 453.3 | $ | 5.3 | $ | 4.0 | $ | 4.0 | $ | 440.0 | ||||||||||
| Interest payments on long-term debt(2) |
232.4 | 31.2 | 60.9 | 60.5 | 79.8 | |||||||||||||||
| Operating leases |
19.3 | 4.4 | 6.4 | 3.1 | 5.4 | |||||||||||||||
| Purchase obligations |
4.0 | 4.0 | — | — | — | |||||||||||||||
| Pension funding obligations(3) |
78.9 | 2.8 | 23.0 | 25.3 | 27.8 | |||||||||||||||
| Other long-term liabilities |
23.8 | .4 | 6.9 | 2.8 | 13.7 | |||||||||||||||
| Total |
$ | 811.7 | $ | 48.1 | $ | 101.2 | $ | 95.7 | $ | 566.7 | ||||||||||
| (1) | Comprised of the Company’s outstanding debt at December 9, 2010 including $250.0 million Senior Notes, $200.0 Term Loan and foreign debt of $3.3 million. See Debt. |
| (2) | Based on outstanding debt balances as of December 9, 2010 and estimated interest rates. As those are based on estimates, actual future payments may differ substantially. |
| (3) | Payments are based on Company estimates and current funding laws. Actual results may differ substantially. |
Significant Accounting Policies and Management Judgments
The Company’s discussion and analysis of its results of operations, financial condition and liquidity are based upon the Company’s consolidated financial statements as of November 30, 2010, which have been prepared in accordance with U.S. generally accepted accounting principles. The preparation of these financial statements requires the Company to make estimates and judgments that affect the reported amounts of assets and liabilities, revenues and expenses and related disclosure of contingent assets and liabilities as of the date of the financial statements. Periodically, the Company reviews its estimates and judgments including those related to product returns, accounts receivable, inventories, litigation, environmental reserves, pensions and income taxes. The Company bases its estimates and judgments on historical experience and on various assumptions that it believes to be reasonable under the circumstances. Actual results may materially differ from these estimates under different assumptions or conditions.
Management believes the following critical accounting policies affect its more significant estimates and assumptions used in the preparation of its consolidated financial statements:
A) Revenue Recognition
Sales must meet the following criteria in order to be recognized as revenue: 1) persuasive evidence of an arrangement exists; 2) product must be shipped to the customer, whereby shipment results in the transfer of ownership risk to the customer; 3) an established sales price has been set with the customer; 4) collection of the sale revenue from the customer is reasonably assured; and 5) no contingencies exist. The Company estimates and records provisions for quantity rebates, sales returns and allowances in the period the revenue is recognized, based upon its experience. These items are included as a reduction in net sales.
33
Table of Contents
B) Allowance For Doubtful Accounts
The Company’s policy is to identify all customers that are considered doubtful of collection based upon the customer’s financial condition, payment history, credit rating and other relevant factors and to reserve the portion of such accounts receivable for which collection does not appear likely. If the financial condition of our customers were to deteriorate, resulting in an inability to make payments, additional allowances may be required. The allowance for doubtful accounts was approximately $2.0 and $2.3 million at November 30, 2010 and 2009, respectively.
C) Allowance For Inventory Obsolescence
The Company’s policy is to maintain an inventory obsolescence reserve based upon specifically identified, discontinued or obsolete items and a percentage of quantities on hand compared with usage and sales levels over the last year to two years. The policy has been applied on a consistent basis for all years presented. A sudden and unexpected change in design trends and/or preferences for patterns, colors and/or material could reduce the rate of inventory turnover and require the Company to increase its reserve for obsolescence. The reserve for inventory obsolescence, which applies primarily to our Decorative Products segment, was approximately $7.2 million at both November 30, 2010 and 2009.
D) Litigation and Environmental Reserves
From time to time, the Company is subject to claims, lawsuits and proceedings related to product liability, product warranty, contract, employment, environmental and other matters. The Company provides a reserve for such matters when it concludes a loss is probable and the amount can be estimated. Costs related to environmental compliance are also accrued when it is probable a loss has been incurred and the amount of loss can be estimated.
E) Pensions and Other Post-retirement Plans
The Company accounts for its pension and other post-retirement plans by recognizing in its balance sheets the overfunded or underfunded status of defined benefit post-retirement plans, measured as the difference between the fair value of plan assets and the benefit obligation (the projected benefit obligation for pension plans and the accumulated post-retirement benefit obligation for other post-retirement plans). The Company recognizes the change in the funded status of the plan in the year in which the change occurs through Accumulated Other Comprehensive Loss. Effective November 30, 2009, the Company adopted measurement date provisions which require that plan assets and obligation be measured as of the balance sheet date. Prior to 2009, the Company measured plan assets and obligations at August 31.
The most significant elements in determining the Company’s pension expense are the expected return on plan assets and the discount rate. The assumed long-term rate of return on assets is applied to a calculated value of plan assets, which recognizes changes in the fair value of plan assets in a systematic manner over five years. This produces the expected return on plan assets that is included in pension (expense) income. The difference between this expected return and the actual return on plan assets is deferred and amortized over the estimated remaining service life of employees remaining in the plan. The net deferral of past asset gains (losses) affects the calculated value of plan assets and, ultimately, future pension (expense) income.
The Company recorded pension expense of $8.2 million in 2010 and $2.8 million in 2009. Included in 2010 is a non-cash curtailment expense of $4.2 million. Pension expense is calculated using the discount rate, as determined below, to discount plan liabilities at the prior year measurement date. The rates of 6.05% and 7.27% were used to calculate the pension expense in 2010 and 2009, respectively. The Company anticipates 2011 non-cash expense to be approximately $2.6 million using a discount rate of 5.83%. An increase or decrease of 25 basis points in the discount rate would decrease or increase expense on an annual basis by approximately $0.1 million. Cash contributions to the pension plan were $5.1 million in 2010 and no contributions were made in 2009.
The Company determined the discount rate used to discount the plan liabilities at the plan’s measurement date, which was November 30, 2010. The discount rate reflects the current rate at which the pension liabilities could be effectively
34
Table of Contents
settled at the measurement date. In estimating this rate, the Company considered rates of return on high quality, fixed-income investments that receive one of the two highest ratings given by a recognized investment ratings agency. Changes in discount rates, as well as the net effect of other changes in actuarial assumptions and experience, have been recognized in Accumulated Other Comprehensive Loss. The Company determined the discount rate used to measure the defined benefit pension plan obligations as of November 30, 2010 should be 5.83% compared to 6.05% in 2009.
To develop the expected long-term rate of return on assets assumption, the Company considered the historical returns and the future expectations for returns for each asset class, as well as the target allocation of the pension portfolio. This resulted in the selection of a long-term rate of return on assets assumption of 8.0% for plan years 2010 and 2009. The measurement dates of November 30, 2010 and 2009 were used to determine these rates. A 25 basis point change in the assumed rate of return for assets would increase or decrease the assets by approximately $0.5 million and would increase or decrease pension expense by approximately $0.5 million. Pension plan assets are measured at fair value on the measurement date.
Based on current estimates of pension asset performance, interest rate discount rate assumptions and credit balance, the Company anticipates it will be required under the Pension Protection Act of 2006 (“PPA-2006”), to make a cash contribution to its pension plan of approximately $2.8 million in 2011. The Company, under rules of the PPA-2006, has elected the fifteen year amortization schedule for the period beginning with the 2009 plan year.
Factors that could alter future cash requirements and timing of any such cash equivalents are:
| • | Investment returns which differ materially from the Company’s 8.0% return assumption. |
| • | Significant changes in interest rates, affecting the discount rate. |
| • | Opportunities to reduce future cash requirements by accelerating contributions ahead of the minimum required schedule. Voluntary contributions in excess of minimally required amounts may prevent the need for larger contributions in the future. |
F) Income Taxes
The Company follows the liability method of accounting for income taxes. Under this method, deferred tax assets and liabilities are determined based on the difference between the financial reporting and tax bases of assets and liabilities using the enacted tax rates that will be in effect in the period in which the differences are expected to reverse. The Company records a valuation allowance to offset deferred tax assets if, based on the weight of available evidence, it is more likely than not that some portion, or all, of the deferred tax assets will not be realized. The effect on deferred taxes of a change in tax rates is recognized in income in the period that includes the enactment date.
As of November 30, 2010, the Company had approximately $93 million of net federal, state and local deferred tax assets primarily related to federal domestic loss carryforwards, goodwill and indefinite lived intangible asset impairment losses, changes in pension liabilities, and other temporary differences for which a domestic valuation allowance of $1.2 million has been provided. In addition, as of November 30, 2010 the Company had $1.3 million of net deferred tax liabilities related to the Decorative Products Asian businesses.
The Company, after considering the guidance in ASC 740, “Income Taxes,” reversed a significant portion of its valuation reserve for the U.S. deferred tax asset. This resulted in a tax benefit of $98.2 million. For the year ended November 30, 2010, the Company again considered the positive and negative evidence as required by ASC 740 and concluded that it is more likely than not that the Company will realize the benefit from the U.S. deferred tax assets due to a preponderance of positive evidence, which includes a three year U.S. cumulative income position, increased predictability over future taxable income and future taxable income from the reversal of deferred tax assets and liabilities in future years. This may result in the Company recognizing higher income tax expense going forward. However, because of NOLC’s, the Company does not expect to incur significant cash payments for U.S. taxes over the next several years.
The Company has not provided U.S. income taxes on certain of its non-U.S. subsidiaries undistributed earnings as such amounts are permanently reinvested outside the U.S. To the extent that foreign earnings previously treated as permanently
35
Table of Contents
reinvested are repatriated, the related U.S. tax liability may be reduced by any foreign income taxes paid on these earnings. However, based on the Company’s policy of permanent reinvestment, it is not practicable to determine the U.S. federal income tax liability, if any, which would be payable if such earnings were not permanently reinvested. As of November 30, 2010, the non-U.S. subsidiaries have a cumulative unremitted foreign loss position of $21.8 million for which U.S. income taxes have not been provided.
The Company utilizes a recognition threshold and measurement attribute for the financial statement recognition and measurement of a tax position taken or expected to be taken in a tax return. For those benefits to be recognized, a tax position must be more-likely-than-not to be sustained upon examination by taxing authorities. The amount recognized is measured as the largest amount of benefit that is more likely than not of being realized upon ultimate settlement.
The Company’s accounting policy for interest and/or penalties related to underpayments of income taxes is to include interest and penalties in tax expenses. Accrued interest and penalties were $0.3 million as of November 30, 2010.
G) Share-Based Employee Compensation
The Company uses the fair value method of recording share-based payments, based on the grant date fair value.
While the Company regularly evaluates the use of share-based payments, its practice has been to issue fewer stock options than have been issued in the past, utilizing other forms of incentives such as restricted stock, which are required to be expensed using the fair value method. See Note N to the Company’s Consolidated Financial Statements for a further discussion of share-based payments.
H) Long-Lived Assets
Long-lived assets, such as property, plant and equipment, and definite-lived intangibles are reviewed for impairment whenever events or changes in circumstances indicate that the carrying amount of an asset may not be recoverable. Recoverability of assets to be held and used is measured by comparing the carrying amount of an asset to the estimated undiscounted future cash flows expected to be generated by the asset. If the carrying amount of an asset exceeds its estimated future cash flows, an impairment charge is recognized in the amount by which the carrying amount of the asset exceeds the fair value of the asset. Assets to be disposed of are reported at the lower of the carrying amount or fair value less costs to sell, and depreciation ceases.
Environmental Matters
The Company’s policy is to conduct its businesses with due regard for the preservation and protection of the environment. The Company devotes significant resources and management attention to comply with environmental laws and regulations. The Company’s Consolidated Balance Sheet as of November 30, 2010 reflects reserves for environmental remediation efforts of $0.4 million.
Capital expenditures for projects related to environmental matters were $0.3 million in 2010, $0.2 million in 2009 and $1.1 million in 2008. During 2010, non-capital expenditures for environmental compliance and protection totaled $5.7 million, all of which were for recurring costs associated with managing hazardous substances and pollution abatement in ongoing operations. Similar non-capital expenditures were $4.8 million and $5.0 million in years 2009 and 2008, respectively. The Company anticipates that non-capital environmental expenditures for the next several years will be consistent with historical expenditure levels.
Employee Matters
At November 30, 2010, the Company employed approximately 2,430 employees at offices, plants and other facilities located principally throughout the United States, United Kingdom, China and Thailand. Approximately 14% or 350 of the Company’s employees are covered by collective bargaining agreements in the United States. In March 2010, the Company and its Calhoun, Georgia employees represented by Local 1876, Southern Region of Workers United, SEIU, agreed to a new three year contract. On May 20, 2010, approximately 180 Columbus, Mississippi employees represented by United
36
Table of Contents
Steelworkers Local #748-L voted against ratification of a new contract proposal and subsequently went on strike on May 21, 2010. Initially, the Company’s salaried workforce and contract labor operated the plant, meeting customers’ requirements. During the fourth quarter of 2010, the Company began transitioning from contract labor to locally hired replacement employees. The Company incurred strike-related costs of $5.5 million in 2010, of which $3.3 million was included in cost of goods sold and $2.2 million included in other expense (income). Strike-related costs peaked in July 2010 and have declined significantly since then. In the fourth quarter of 2010, strike-related costs were $1.2 million, compared to $3.9 million in the third quarter of 2010. The Company generally would describe its relationship with employees as good even though its union-represented Columbus, Mississippi employees chose to go on strike.
New Accounting Pronouncements
Effective December 1, 2009, the Company adopted authoritative guidance issued by the financial Accounting Standards Board (“FASB”) on business combinations. This guidance modifies the accounting for business combinations by requiring that assets acquired, liabilities assumed and contingent consideration arrangements be recorded at fair value on the date of acquisition. Pre-acquisition contingencies will generally be accounted for at fair value using purchase accounting. The guidance also requires that transaction costs be expensed as incurred, acquired research and development costs be capitalized as indefinite-lived intangible assets, and that requirements for exit and disposal activities be met at the acquisition date in order to be recognized as part of a restructuring plan in purchase accounting. The adoption of this guidance resulted in the Company recognizing acquisition related expenses in 2010, which under prior guidance would have been recognized as part of the purchase price.
Effective December 1, 2009, the Company adopted authoritative guidance issued by FASB that changes the accounting and reporting for noncontrolling interest. This guidance requires noncontrolling interest to be classified as equity in the balance sheet. The income and comprehensive income attributable to noncontrolling interests, if any, is to be included in income and comprehensive income of the consolidating entity. The adoption of this guidance did not have a material impact on the financial statements of the Company.
In January 2010, the Financial Accounting Standards Board (“FASB”) issued Accounting Standards Update (“ASU”) 2010-06, “Fair Value Measurements and Disclosures,” which amends the disclosure requirements related to recurring and nonrecurring fair value measurements. This guidance requires disclosure of transfers of assets and liabilities between Level 1 and Level 2 of the fair value measurement hierarchy, including the reasons and the timing of the transfers and information on purchases, sales, issuances, and settlements on a gross basis in the reconciliation of the assets and liabilities measured under Level 3 of the fair value measurement hierarchy. The guidance is effective for annual and interim reporting periods beginning after December 15, 2009, except for Level 3 reconciliation disclosures which are effective for annual and interim periods beginning after December 15, 2010. As of November 30, 2010, there have been no transfers between Levels 1 and 2.
Forward Looking Statements
This Annual Report includes forward looking statements as defined by federal securities laws. Please refer to Item 1A. Risk Factors, beginning on page 8 of this Report which is incorporated herein by reference.
| Item 7A. | Quantitative and Qualitative Disclosures About Market Risk |
The Company is exposed to market risk from changes in interest rates on its long-term debt obligations. As described in Note K of the Company’s Consolidated Financial Statements, the Company’s $150 Million Term Loan Credit Agreement (“Term Loan”), which matures in 2014, and Senior Secured Revolving Credit Facility (“Facility”), which matures in 2012, both have variable interest rates. Borrowings under the Term Loan were $140.9 million and there were no borrowings under the Facility as of November 30, 2010. The weighted average effective interest rate of the Company’s outstanding variable rate debt was 4.5% as of November 30, 2010. A hypothetical increase or decrease of 100 basis points on the Company’s variable rate debt would impact the Company’s interest expense by approximately $1.4 million.
37
Table of Contents
The Company is subject to foreign currency exchange risk primarily due to the European wallcovering business and the Asian businesses. The Company enters into foreign currency forward exchange contracts or other derivative financial instruments to hedge the effects of adverse fluctuations in foreign currency exchange rates. For further discussion of risk associated with foreign currencies, refer to Note P of the Consolidated Financial Statements.
The Company does not enter into derivatives or other financial instruments for trading or speculative purposes.
Management’s Assessment of Internal Control Over Financial Reporting
Management of OMNOVA Solutions Inc. is responsible for establishing and maintaining adequate internal control over financial reporting, as such term is defined in Exchange Act Rules 13a-15(f). In evaluating the Company’s internal control over financial reporting, management has adopted the framework in Internal Control—Integrated Framework issued by the Committee of Sponsoring Organizations of the Treadway Commission (“COSO”).
Under the supervision and with the participation of the Company’s management, including the chief executive officer and chief financial officer, the Company conducted an assessment of the effectiveness of the Company’s internal control over financial reporting. Management has determined that the Company’s internal control over financial reporting is effective as of November 30, 2010.
The effectiveness of the Company’s internal control over financial reporting as of November 30, 2010 has been audited by Ernst & Young LLP, an independent registered public accounting firm, as stated in their report, which is included herein.
38
Table of Contents
REPORT OF INDEPENDENT REGISTERED PUBLIC ACCOUNTING FIRM
To the Board of Directors and Shareholders of OMNOVA Solutions Inc.:
We have audited OMNOVA Solutions Inc.’s internal control over financial reporting as of November 30, 2010, based on criteria established in Internal Control—Integrated Framework issued by the Committee of Sponsoring Organizations of the Treadway Commission (the COSO criteria). OMNOVA Solutions Inc.’s management is responsible for maintaining effective internal control over financial reporting, and for its assessment of the effectiveness of internal control over financial reporting included in the accompanying report titled “Management’s Assessment of Internal Control Over Financial Reporting.” Our responsibility is to express an opinion on the company’s internal control over financial reporting based on our audit.
We conducted our audit in accordance with the standards of the Public Company Accounting Oversight Board (United States). Those standards require that we plan and perform the audit to obtain reasonable assurance about whether effective internal control over financial reporting was maintained in all material respects. Our audit included obtaining an understanding of internal control over financial reporting, assessing the risk that a material weakness exists, testing and evaluating the design and operating effectiveness of internal control based on the assessed risk, and performing such other procedures as we considered necessary in the circumstances. We believe that our audit provides a reasonable basis for our opinion.
A company’s internal control over financial reporting is a process designed to provide reasonable assurance regarding the reliability of financial reporting and the preparation of financial statements for external purposes in accordance with generally accepted accounting principles. A company’s internal control over financial reporting includes those policies and procedures that (1) pertain to the maintenance of records that, in reasonable detail, accurately and fairly reflect the transactions and dispositions of the assets of the company; (2) provide reasonable assurance that transactions are recorded as necessary to permit preparation of financial statements in accordance with generally accepted accounting principles, and that receipts and expenditures of the company are being made only in accordance with authorizations of management and directors of the company; and (3) provide reasonable assurance regarding prevention or timely detection of unauthorized acquisition, use, or disposition of the company’s assets that could have a material effect on the financial statements.
Because of its inherent limitations, internal control over financial reporting may not prevent or detect misstatements. Also, projections of any evaluation of effectiveness to future periods are subject to the risk that controls may become inadequate because of changes in conditions, or that the degree of compliance with the policies or procedures may deteriorate.
In our opinion, OMNOVA Solutions Inc. maintained, in all material respects, effective internal control over financial reporting as of November 30, 2010, based on the COSO criteria.
We also have audited, in accordance with the standards of the Public Company Accounting Oversight Board (United States), the consolidated balance sheets of OMNOVA Solutions Inc. as of November 30, 2010 and 2009 and the related consolidated statements of operations, shareholders’ equity and cash flows for each of the three years in the period ended November 30, 2010 and our report dated January 24, 2011 expressed an unqualified opinion thereon.
Akron, Ohio
January 24, 2011
39
Table of Contents
| Item 8. | Consolidated Financial Statements and Supplementary Data |
40
Table of Contents
To the Shareholders of OMNOVA Solutions Inc.:
Management of OMNOVA Solutions Inc. is responsible for preparing the accompanying consolidated financial statements and for assuring their integrity and objectivity. These financial statements were prepared in accordance with U.S. generally accepted accounting principles and fairly represent the transactions and financial condition of the Company in all material respects. The financial statements include amounts that are based on management’s best estimates and judgments. The Company’s financial statements have been audited by Ernst & Young LLP, an independent registered public accounting firm, who has been selected by the Audit Committee of the Board of Directors and approved by the shareholders. Management has made available to Ernst & Young LLP all of the Company’s financial records and related data, internal audit reports, as well as the minutes of shareholders’ and directors’ meetings.
Management of the Company has established and maintains a system of internal accounting controls that is designed to provide reasonable assurance that assets are safeguarded, transactions are properly recorded and executed in accordance with management’s authorization and the books and records accurately reflect the disposition of assets. The system of internal controls includes appropriate division of responsibility. The Company maintains an internal audit department that independently assesses the effectiveness of the internal controls through a program of internal audits.
The Audit Committee is composed of directors who are not officers or employees of the Company. It meets regularly with members of management, the internal auditors and representatives of the independent registered public accounting firm to discuss the adequacy of the Company’s internal control over financial reporting, financial statements and the nature, extent and results of the audit effort. Management reviews with the Audit Committee all of the Company’s significant accounting policies and assumptions affecting the results of operations. Both the independent registered public accounting firm and internal auditors have access to the Audit Committee without the presence of management.

Kevin M. McMullen
Chairman, Chief Executive Officer and President

Michael E. Hicks
Senior Vice President and Chief Financial Officer
January 24, 2011
41
Table of Contents
REPORT OF INDEPENDENT REGISTERED PUBLIC ACCOUNTING FIRM
To the Board of Directors and Shareholders of OMNOVA Solutions Inc.:
We have audited the accompanying consolidated balance sheets of OMNOVA Solutions Inc. as of November 30, 2010 and 2009, and the related consolidated statements of operations, shareholders’ equity and cash flows for each of the three years in the period ended November 30, 2010. These financial statements are the responsibility of the Company’s management. Our responsibility is to express an opinion on these financial statements based on our audits.
We conducted our audits in accordance with the standards of the Public Company Accounting Oversight Board (United States). Those standards require that we plan and perform the audit to obtain reasonable assurance about whether the financial statements are free of material misstatement. An audit includes examining, on a test basis, evidence supporting the amounts and disclosures in the financial statements. An audit also includes assessing the accounting principles used and significant estimates made by management, as well as evaluating the overall financial statement presentation. We believe that our audits provide a reasonable basis for our opinion.
In our opinion, the financial statements referred to above present fairly, in all material respects, the consolidated financial position of OMNOVA Solutions Inc. at November 30, 2010 and 2009, and the consolidated results of its operations and its cash flows for each of the three years in the period ended November 30, 2010, in conformity with U.S. generally accepted accounting principles.
As discussed in Note A to the consolidated financial statements, the Company changed its method of accounting for business combinations effective December 1, 2009; as discussed in Note A, for the year ended November 30, 2009, the Company eliminated the lag in reporting the results of certain of its consolidated subsidiaries; and as discussed in Note L, as of November 30, 2009, the Company changed its measurement date for its employee benefit plans.
We also have audited, in accordance with the standards of the Public Company Accounting Oversight Board (United States), OMNOVA Solutions Inc.’s internal control over financial reporting as of November 30, 2010, based on criteria established in Internal Control—Integrated Framework issued by the Committee of Sponsoring Organizations of the Treadway Commission and our report dated January 24, 2011 expressed an unqualified opinion thereon.
Akron, Ohio
January 24, 2011
42
Table of Contents
Consolidated Statements of Operations
| Years Ended November 30, | ||||||||||||
| 2010 | 2009 | 2008 | ||||||||||
| (Dollars in millions, except per share data) | ||||||||||||
| Net Sales |
$ | 846.2 | $ | 696.4 | $ | 869.4 | ||||||
| Cost of products sold |
684.8 | 536.7 | 731.4 | |||||||||
| Gross profit |
161.4 | 159.7 | 138.0 | |||||||||
| Selling, general and administrative |
99.6 | 99.9 | 104.8 | |||||||||
| Depreciation and amortization |
20.6 | 22.9 | 23.9 | |||||||||
| Fixed asset impairment |
6.2 | 1.1 | — | |||||||||
| Restructuring and severance |
.6 | 2.1 | .6 | |||||||||
| Interest expense |
8.7 | 8.1 | 13.0 | |||||||||
| Equity earnings in affiliates, net |
— | — | (.2 | ) | ||||||||
| Acquisition and integration related expenses |
5.5 | — | — | |||||||||
| Other expense (income), net |
1.7 | (2.3 | ) | (2.1 | ) | |||||||
| 142.9 | 131.8 | 140.0 | ||||||||||
| Income (loss) from continuing operations before income taxes |
18.5 | 27.9 | (2.0 | ) | ||||||||
| Income tax (benefit) expense |
(89.4 | ) | 1.7 | .2 | ||||||||
| Net Income (Loss) |
$ | 107.9 | $ | 26.2 | $ | (2.2 | ) | |||||
| Income (Loss) Per Share: |
||||||||||||
| Net income (loss) per share—basic |
$ | 2.42 | $ | .59 | $ | (.05 | ) | |||||
| Net income (loss) per share—diluted |
$ | 2.40 | $ | .59 | $ | (.05 | ) | |||||
See notes to consolidated financial statements.
43
Table of Contents
Consolidated Balance Sheets
| November 30, | ||||||||
| 2010 | 2009 | |||||||
| (Dollars in millions, except per share amounts) |
||||||||
| ASSETS: |
||||||||
| Current Assets |
||||||||
| Cash and cash equivalents |
$ | 75.6 | $ | 41.5 | ||||
| Restricted cash |
253.1 | — | ||||||
| Accounts receivable, net |
106.8 | 105.9 | ||||||
| Inventories |
45.8 | 37.5 | ||||||
| Prepaid expenses and other |
3.5 | 2.4 | ||||||
| Deferred income taxes |
6.0 | — | ||||||
| Total Current Assets |
490.8 | 187.3 | ||||||
| Property, plant and equipment, net |
131.5 | 141.9 | ||||||
| Trademarks and other intangible assets, net |
5.8 | 4.4 | ||||||
| Deferred income taxes |
86.2 | 1.2 | ||||||
| Deferred financing fees |
10.5 | 1.9 | ||||||
| Other assets |
1.2 | 1.3 | ||||||
| Total Assets |
$ | 726.0 | $ | 338.0 | ||||
| LIABILITIES AND SHAREHOLDERS’ EQUITY: |
||||||||
| Current Liabilities |
||||||||
| Amounts due banks |
$ | 4.8 | $ | 3.3 | ||||
| Accounts payable |
88.6 | 64.4 | ||||||
| Accrued payroll and personal property taxes |
17.3 | 16.4 | ||||||
| Employee benefit obligations |
2.4 | 2.6 | ||||||
| Deferred income taxes |
— | .9 | ||||||
| Other current liabilities |
9.8 | 4.0 | ||||||
| Total Current Liabilities |
122.9 | 91.6 | ||||||
| Senior notes |
250.0 | — | ||||||
| Long-term debt |
139.4 | 140.8 | ||||||
| Postretirement benefits other than pensions |
7.6 | 8.4 | ||||||
| Pension liabilities |
73.3 | 65.4 | ||||||
| Deferred income taxes |
1.7 | .9 | ||||||
| Other liabilities |
7.7 | 15.8 | ||||||
| Total liabilities |
602.6 | 322.9 | ||||||
| Shareholders’ Equity |
||||||||
| Preference stock—$1.00 par value; 15 million shares authorized; none outstanding |
— | — | ||||||
| Common stock—$0.10 par value; 135 million shares authorized; 45.2 million and 44.5 million shares issued as of November 30, 2010 and 2009, respectively |
4.5 | 4.4 | ||||||
| Additional contributed capital |
318.0 | 314.1 | ||||||
| Retained deficit |
(112.0 | ) | (219.9 | ) | ||||
| Treasury stock at cost; 0.2 million shares and 0.1 million shares at November 30, 2010 and 2009, respectively |
(1.3 | ) | (.4 | ) | ||||
| Accumulated other comprehensive loss |
(85.8 | ) | (83.1 | ) | ||||
| Total Shareholders’ Equity |
123.4 | 15.1 | ||||||
| Total Liabilities and Shareholders’ Equity |
$ | 726.0 | $ | 338.0 | ||||
See notes to consolidated financial statements.
44
Table of Contents
Consolidated Statements of Shareholders’ Equity
for the Years Ended November 30, 2010, 2009 and 2008
| (Dollars in millions) | Common Stock |
Additional Contributed Capital |
Retained Deficit |
Treasury Stock |
Accumulated Other Comprehensive Income (Loss) |
Total Shareholders’ Equity (Deficit) |
Total Comprehensive Income (Loss) |
|||||||||||||||||||||||||
| 2008 |
||||||||||||||||||||||||||||||||
| Balance November 30, 2007 |
$ | 4.3 | $ | 312.7 | $ | (243.3 | ) | $ | (4.5 | ) | $ | (3.9 | ) | $ | 65.3 | |||||||||||||||||
| Net loss |
(2.2 | ) | (2.2 | ) | $ | (2.2 | ) | |||||||||||||||||||||||||
| Cumulative translation adjustment |
(13.0 | ) | (13.0 | ) | (13.0 | ) | ||||||||||||||||||||||||||
| Unrecognized loss on interest rate swap |
(1.2 | ) | (1.2 | ) | (1.2 | ) | ||||||||||||||||||||||||||
| Defined benefit pension plans: |
||||||||||||||||||||||||||||||||
| Prior service credits |
.4 | .4 | .4 | |||||||||||||||||||||||||||||
| Net actuarial loss |
(15.9 | ) | (15.9 | ) | (15.9 | ) | ||||||||||||||||||||||||||
| Total comprehensive loss |
$ | (31.9 | ) | |||||||||||||||||||||||||||||
| Exercise of stock options and other |
(.9 | ) | (.9 | ) | ||||||||||||||||||||||||||||
| Common stock issuance |
.1 | .1 | 3.9 | 4.1 | ||||||||||||||||||||||||||||
| Balance November 30, 2008 |
$ | 4.4 | $ | 311.8 | $ | (245.4 | ) | $ | (.6 | ) | $ | (33.6 | ) | $ | 36.6 | |||||||||||||||||
| 2009 |
||||||||||||||||||||||||||||||||
| Effects of accounting change regarding pension plan measurement date change September 1 – November 30, 2008 |
(.6 | ) | (.2 | ) | (.8 | ) | $ | (.2 | ) | |||||||||||||||||||||||
| Net income |
26.2 | 26.2 | 26.2 | |||||||||||||||||||||||||||||
| Cumulative translation adjustment |
3.4 | 3.4 | 3.4 | |||||||||||||||||||||||||||||
| Unrecognized loss on interest rate swap |
(.9 | ) | (.9 | ) | (.9 | ) | ||||||||||||||||||||||||||
| Defined benefit pension plans: |
||||||||||||||||||||||||||||||||
| Prior service costs |
(.4 | ) | (.4 | ) | (.4 | ) | ||||||||||||||||||||||||||
| Net actuarial loss |
(51.4 | ) | (51.4 | ) | (51.4 | ) | ||||||||||||||||||||||||||
| Total comprehensive loss |
$ | (23.3 | ) | |||||||||||||||||||||||||||||
| Common stock issuance |
2.3 | (.1 | ) | .2 | 2.4 | |||||||||||||||||||||||||||
| Balance November 30, 2009 |
$ | 4.4 | $ | 314.1 | $ | (219.9 | ) | $ | (.4 | ) | $ | (83.1 | ) | $ | 15.1 | |||||||||||||||||
| 2010 |
||||||||||||||||||||||||||||||||
| Net income |
107.9 | 107.9 | $ | 107.9 | ||||||||||||||||||||||||||||
| Cumulative translation adjustment |
1.4 | 1.4 | 1.4 | |||||||||||||||||||||||||||||
| Unrecognized gain on interest rate swap (net of tax of $0.3 million) |
.4 | .4 | .4 | |||||||||||||||||||||||||||||
| Defined benefit pension plans: |
||||||||||||||||||||||||||||||||
| Prior service credits (net of tax of $0.6 million) |
1.0 | 1.0 | 1.0 | |||||||||||||||||||||||||||||
| Net actuarial loss (net of tax of $(3.4) million) |
(5.5 | ) | (5.5 | ) | (5.5 | ) | ||||||||||||||||||||||||||
| Total comprehensive income |
$ | 105.2 | ||||||||||||||||||||||||||||||
| Common stock issuance |
.1 | 3.9 | (.9 | ) | 3.1 | |||||||||||||||||||||||||||
| Balance November 30, 2010 |
$ | 4.5 | $ | 318.0 | $ | (112.0 | ) | $ | (1.3 | ) | $ | (85.8 | ) | $ | 123.4 | |||||||||||||||||
See notes to consolidated financial statements.
45
Table of Contents
Consolidated Statements of Cash Flows
| Years Ended November 30, | ||||||||||||
| 2010 | 2009 | 2008 | ||||||||||
| (Dollars in millions) | ||||||||||||
| Operating Activities |
||||||||||||
| Net income (loss) |
$ | 107.9 | $ | 26.2 | $ | (2.2 | ) | |||||
| Adjustments to reconcile net income (loss) to net cash provided by operating activities: |
||||||||||||
| Equity earnings in affiliates |
— | — | (.2 | ) | ||||||||
| Loss (gain) on disposal of fixed assets |
(.2 | ) | 1.0 | .1 | ||||||||
| Depreciation and amortization |
20.6 | 22.9 | 23.9 | |||||||||
| Gain from dissolution of joint marketing alliance |
(9.7 | ) | — | — | ||||||||
| Impairment of fixed assets |
6.2 | — | — | |||||||||
| Fair value adjustment on currency collar |
9.2 | — | — | |||||||||
| Non-cash stock compensation expense |
3.5 | 2.3 | 2.4 | |||||||||
| Provision for uncollectible accounts |
(.3 | ) | .7 | 1.0 | ||||||||
| Provision for obsolete inventories |
(.2 | ) | .8 | .4 | ||||||||
| Deferred income taxes |
(92.3 | ) | (.2 | ) | (.4 | ) | ||||||
| Other |
1.0 | — | .2 | |||||||||
| Changes in operating assets and liabilities: |
||||||||||||
| Accounts receivable |
(.6 | ) | 12.0 | (1.7 | ) | |||||||
| Inventories |
(7.6 | ) | 8.5 | (3.8 | ) | |||||||
| Other current assets |
(1.2 | ) | 2.2 | 1.7 | ||||||||
| Current liabilities |
6.7 | (.7 | ) | (11.5 | ) | |||||||
| Other non-current assets |
.4 | .1 | .6 | |||||||||
| Contribution to defined benefit plan |
(5.1 | ) | — | — | ||||||||
| Settlement of interest rate swap |
4.3 | — | — | |||||||||
| Other non-current liabilities |
2.4 | (1.6 | ) | 7.1 | ||||||||
| Net Cash Provided By Operating Activities |
45.0 | 74.2 | 17.6 | |||||||||
| Investing Activities |
||||||||||||
| Capital expenditures |
(14.8 | ) | (10.4 | ) | (14.8 | ) | ||||||
| Acquisitions of business, less cash acquired |
— | — | (25.2 | ) | ||||||||
| Acquisition of intangible assets |
(2.5 | ) | — | — | ||||||||
| Proceeds from dissolution of joint marketing alliance |
9.7 | — | — | |||||||||
| Proceeds from insurance settlements |
.4 | .8 | — | |||||||||
| Proceeds from asset dispositions |
.5 | .6 | — | |||||||||
| Restricted cash |
(253.1 | ) | — | — | ||||||||
| Net Cash Used By Investing Activities |
(259.8 | ) | (9.0 | ) | (40.0 | ) | ||||||
| Financing Activities |
||||||||||||
| Proceeds from borrowings |
662.1 | 514.2 | 728.6 | |||||||||
| Repayment of debt obligations |
(413.6 | ) | (555.5 | ) | (691.1 | ) | ||||||
| Short-term debt proceeds (payments), net |
1.5 | (2.9 | ) | (2.8 | ) | |||||||
| Other financing activities |
— | — | .3 | |||||||||
| Net Cash Provided (Used) By Financing Activities |
250.0 | (44.2 | ) | 35.0 | ||||||||
| Effect of exchange rate changes on cash |
(1.1 | ) | 3.1 | (7.8 | ) | |||||||
| Net Increase in Cash and Cash Equivalents |
34.1 | 24.1 | 4.8 | |||||||||
| Cash and cash equivalents at beginning of period |
41.5 | 17.4 | 12.6 | |||||||||
| Cash and Cash Equivalents at End of Period |
$ | 75.6 | $ | 41.5 | $ | 17.4 | ||||||
See notes to consolidated financial statements.
46
Table of Contents
NOTES TO THE CONSOLIDATED FINANCIAL STATEMENTS
Note A—Significant Accounting Policies
Basis of Consolidation—The consolidated financial statements include the accounts of the Company and its wholly owned subsidiaries.
Effective December 31, 2007, the Company purchased the minority interests in its joint venture businesses. The 2008 consolidated results of operations include the results of operations for these subsidiaries on the equity method for two months (November and December 2007 prior to the purchase transaction) and full consolidation for ten months (January through October 2008).
Prior to August 1, 2009, the Company’s Decorative Products Asian subsidiaries’ results of operations were included in the Company’s consolidated financial statements on a one-month delay in order to facilitate timely reporting and consolidation. As a result of process improvements during the third quarter of 2009, this one-month delay was eliminated as it was no longer required in order to achieve timely consolidation. The Company believes that this change is preferable as it includes the results of the Asian businesses on a current basis. While a change to eliminate the previously existing reporting lag is considered a change in accounting principle, the Company did not retrospectively apply this change in accounting principle to prior periods since its impact to the consolidated balance sheets and related statements of operations and cash flows was immaterial for all periods. As a result of this change, the Company recognized additional net sales and net income of $8.0 million and $0.2 million, respectively, in the third quarter of 2009.
Use of Estimates—The preparation of the consolidated financial statements in conformity with U.S. generally accepted accounting principles requires management to make estimates and assumptions that affect the amounts reported in the consolidated financial statements and accompanying notes. Actual results could differ from those estimates.
Revenue Recognition—Sales must meet the following criteria in order to be recognized as revenue: 1) persuasive evidence of an arrangement exists; 2) product must be shipped to the customer, whereby shipment results in the transfer of ownership risk to the customer; 3) an established sales price has been set with the customer; 4) collection of the sale revenue from the customer is reasonably assured; and 5) no contingencies exist. The Company estimates and records provisions for quantity rebates, sales returns and allowances in the period the revenue is recognized, based upon its experience. These items are included as a reduction in net sales.
Freight Costs—The Company reflects the cost of shipping its products to customers as cost of products sold. Customer reimbursements for freight are not significant.
Environmental Costs—The Company charges to cost of products sold costs associated with managing hazardous substances and pollution in ongoing operations as incurred. The Company accrues for costs associated with environmental remediation when it becomes probable that a liability has been incurred.
Research and Development Expense—Research and development costs, which were $8.8 million in 2010, $8.2 million in 2009 and $10.3 million in 2008, are charged to expense as incurred.
Advertising Costs—Advertising costs are expensed when incurred. Advertising expense was $1.0 million, $1.2 million and $2.1 million in 2010, 2009 and 2008, respectively.
Cash and Cash Equivalents—The Company considers all highly liquid instruments with maturities of 90 days or less as cash equivalents.
Restricted Cash—Cash which is restricted as to withdrawal or usage, is recognized as restricted cash. At November 30, 2010, restricted cash consisted of proceeds from the issuance of $250 million Senior Notes, along with interest and certain debt issuance fees. These amounts were held in an escrow account, as required by the terms of the Senior Notes, until December 9, 2010 at which time the restricted cash, along with existing cash and a refinancing of the Company’s $150 million Term Loan B was used to complete the acquisition of Eliokem International SAS (“Eliokem”), as discussed in Note R.
47
Table of Contents
NOTES TO THE CONSOLIDATED FINANCIAL STATEMENTS—Continued
Note A—Significant Accounting Policies (Continued)
Financial Instruments and Fair Value Measurements—Financial assets and financial liabilities carried on the balance sheet include cash and deposits at financial institutions, trade receivables and payables, other receivables and payables, borrowings and derivative instruments. The accounting policies on recognition and measurement of these items are disclosed elsewhere in these financial statements. The Company is mainly exposed to credit, interest rate and currency exchange rate risks which arise in the normal course of business.
The Company measures financial assets and liabilities at fair value in three levels of inputs as follows:
| • | Level 1—Quoted prices in active markets for identical assets or liabilities. |
| • | Level 2—Observable inputs other than quoted prices included in Level 1, such as quoted prices for similar assets or liabilities in an active market, quoted prices in markets that are not active, and model-derived valuations in which all significant inputs are observable or can be corroborated by observable market data. |
| • | Level 3—Unobservable inputs that are supported by little or no market activity and that are significant to the fair value of the assets or liabilities. This includes certain pricing models, discounted cash flow methodologies and similar techniques that use significant unobservable inputs. |
Derivative Instruments—The Company recognizes derivative instruments as either an asset or a liability at fair value. For a cash flow hedge, the fair value of the effective portion of the derivative is recognized as an asset or liability with a corresponding amount in Accumulated Other Comprehensive Income (loss). Amounts in Accumulated Other Comprehensive Income (loss) are recognized in earnings when the underlying hedged transaction occurs. Ineffectiveness is measured by comparing the present value of the cumulative change in the expected future cash flows of the derivative and the present value of the cumulative change in the expected future cash flows of the related instrument. Any ineffective portion of a cash flow hedge is recognized in earnings immediately. For derivative instruments not designated as hedges, the change in fair value of the derivative is recognized in earnings each reporting period.
The Company does not enter into derivative instruments for trading or speculative purposes.
Accounts Receivable Allowance—The Company’s policy is to identify all customers that are considered doubtful of collection based upon the customer’s financial condition, payment history, credit rating and other relevant factors and to reserve the portion of such accounts receivable for which collection does not appear likely. Accounts are written-off when all collection efforts are exhausted. If the financial condition of the Company’s customers were to deteriorate, resulting in an inability to make payments, additional allowances may be required.
Inventories—Inventories are stated at the lower of cost or market on a consistent basis. All U.S. based inventory, which is 59.5% of the total, is valued using the last-in, first-out (“LIFO”) method. The Company believes the LIFO method results in a better matching of costs and revenues. The remaining portion of inventories, which are located outside of the U.S., are valued using the first-in, first-out (“FIFO”) method. Inventory costs include direct overhead, freight and duty for purchased products.
The Company’s policy is to maintain an inventory obsolescence reserve based upon specifically identified, discontinued or obsolete items and a percentage of quantities on hand compared with historical and forecasted usage and sales levels. The policy has been applied on a consistent basis for all years presented. A sudden and unexpected change in design trends and/or preferences for patterns, colors and/or material could impact the carrying value of the Company’s inventory and require the Company to increase its reserve for obsolescence. The reserve for inventory obsolescence, which applies primarily to our Decorative Products segment, was $7.2 million at both November 30, 2010 and November 30, 2009.
48
Table of Contents
NOTES TO THE CONSOLIDATED FINANCIAL STATEMENTS—Continued
Note A—Significant Accounting Policies (Continued)
Long-Lived Assets—Property, plant and equipment are recorded at cost. Refurbishment costs are capitalized in the property accounts, whereas ordinary maintenance and repair costs are expensed as incurred. Depreciation is computed principally using the straight-line method using depreciable lives as follows:
| Years | ||||
| Buildings |
25 – 40 | |||
| Machinery and equipment |
5 – 15 | |||
| Furniture and fixtures |
3 – 10 | |||
| Software |
3 – 5 | |||
Leasehold improvements are depreciated over the shorter of the lease term, including any expected renewal periods, or the estimated useful life of the improvement.
Intangible assets, such as customer lists, patents, trademarks and licenses, are recorded at cost or when acquired as part of a business combination at estimated fair value. Intangible assets with finite lives are amortized over their estimated useful lives with periods ranging from 3 to 30 years. Accumulated amortization of finite-lived intangible assets at November 30, 2010 and 2009 was $18.2 million and $17.1 million, respectively.
Impairment of long-lived assets is recognized when events or changes in circumstances indicate that the carrying amount of the asset or related group of assets may not be recoverable. If the expected future undiscounted cash flows are less than the carrying amount of the asset, an impairment loss is recognized at that time to reduce the asset to the lower of its fair value or its net realizable value.
Asset Retirement Obligations—The fair value of an asset retirement obligation is recorded when the Company has an unconditional legal obligation to perform an asset retirement activity and the amount of the obligation can be reasonably estimated. In assessing asset retirement obligations, the Company reviews the expected settlement dates or a range of estimated settlement dates, the expected method of settlement of the obligation and other factors pertinent to the obligations.
Foreign Currency Translation—The financial position and results of operations of the Company’s foreign subsidiaries are measured using the local currency as the functional currency. Assets and liabilities of operations denominated in foreign currencies are translated into U.S. dollars at exchange rates in effect at year-end, while revenues and expenses are translated at the weighted average exchange rates for the year. The resulting translation gains and losses on assets and liabilities are recorded in Accumulated Other Comprehensive Income (loss), and are not included in operations until realized through sale or liquidation of the investment.
Income Taxes—The Company follows the liability method of accounting for income taxes. Under this method, deferred tax assets and liabilities are determined based on the difference between the financial reporting and tax bases of assets and liabilities using the enacted tax rates that will be in effect in the period in which the differences are expected to reverse. The Company records a valuation allowance to offset deferred tax assets if based on the weight of available evidence, it is more-likely-than-not that some portion, or all, of the deferred tax assets will not be realized. The effect on deferred taxes of a change in tax rates is recognized in income in the period that includes the enactment date.
The Company has not provided U.S. income taxes on certain of its non-U.S. subsidiaries undistributed earnings as such amounts are permanently reinvested outside the U.S. To the extent that foreign earnings previously treated as permanently reinvested are repatriated, the related U.S. tax liability may be reduced by any foreign income taxes paid on these earnings. However, based on the Company’s policy of permanent reinvestment, it is not practicable to determine the U.S. federal income tax liability, if any, which would be payable if such earnings were not permanently reinvested. As of November 30, 2010, the non-U.S. subsidiaries have a cumulative unremitted foreign loss position of $21.8 million for which U.S. income taxes have not been provided.
49
Table of Contents
NOTES TO THE CONSOLIDATED FINANCIAL STATEMENTS—Continued
Note A—Significant Accounting Policies (Continued)
The Company utilizes a recognition threshold and measurement attribute for the financial statement recognition and measurement of a tax position taken or expected to be taken in a tax return. For those benefits to be recognized, a tax position must be more-likely-than-not to be sustained upon examination by taxing authorities. The amount recognized is measured as the largest amount of benefit that is more likely than not of being realized upon ultimate settlement.
The Company’s accounting policy for interest and/or penalties related to underpayments of income taxes is to include interest and penalties in tax expenses.
Accounting For Leases—Lease expense is recorded on a straight-line basis over the non-cancelable lease term, including any optional renewal terms that are reasonably expected to be exercised. Leasehold improvements related to these operating leases are amortized over the estimated useful life, or the non-cancelable lease term, whichever is shorter.
Share-Based Compensation—Share-based compensation is measured at the grant date, based on the calculated fair value of the award, and is recognized as an expense over the requisite service period (generally the vesting period).
Subsequent Events—The Company has evaluated all subsequent events from the date on the balance sheet through the date these financial statements are being filed with the Securities and Exchange Commission. Except for the acquisition of Eliokem and certain debt refinancing on December 9, 2010, as disclosed in Note R, there were no other material events or transactions occurring during this subsequent event period which requires recognition or disclosure in the financial statements.
New Accounting Pronouncements—Effective December 1, 2009, the Company adopted authoritative guidance issued by the Financial Accounting Standards Board (“FASB”) on business combinations. This guidance modifies the accounting for business combinations by requiring that assets acquired, liabilities assumed and contingent consideration arrangements be recorded at fair value on the date of acquisition. Pre-acquisition contingencies will generally be accounted for at fair value using purchase accounting. The guidance also requires that transaction costs be expensed as incurred, acquired research and development costs be capitalized as indefinite-lived intangible assets, and that requirements for exit and disposal activities be met at the acquisition date in order to be recognized as part of a restructuring plan in purchase accounting. The adoption of this guidance resulted in the Company recognizing acquisition related expenses in 2010 which under prior guidance would have been recognized as part of the purchase price.
Effective December 1, 2009, the Company adopted authoritative guidance issued by FASB that changes the accounting and reporting for noncontrolling interest. This guidance requires noncontrolling interest to be classified as equity in the balance sheet. The income and comprehensive income attributable to noncontrolling interests, if any, is to be included in income and comprehensive income of the consolidating entity. The adoption of this guidance did not have a material impact on the financial statements of the Company.
In January 2010, the Financial Accounting Standards Board (“FASB”) issued Accounting Standards Update (“ASU”) 2010-06, “Fair Value Measurements and Disclosures,” which amends the disclosure requirements related to recurring and nonrecurring fair value measurements. This guidance requires disclosure of transfers of assets and liabilities between Level 1 and Level 2 of the fair value measurement hierarchy, including the reasons and the timing of the transfers and information on purchases, sales, issuances, and settlements on a gross basis in the reconciliation of the assets and liabilities measured under Level 3 of the fair value measurement hierarchy. The guidance is effective for annual and interim reporting periods beginning after December 15, 2009, except for Level 3 reconciliation disclosures which are effective for annual and interim periods beginning after December 15, 2010. As of November 30, 2010, there have been no transfers between Levels 1 and 2.
50
Table of Contents
NOTES TO THE CONSOLIDATED FINANCIAL STATEMENTS—Continued
Note B—Restructuring and Severance
The following table is a summary of restructuring and severance charges for 2010, 2009 and 2008:
| 2010 | 2009 | 2008 | ||||||||||
| (Dollars in millions) | ||||||||||||
| Severance expense |
$ | .6 | $ | 2.1 | $ | .5 | ||||||
| Other exit costs |
— | — | .1 | |||||||||
| $ | .6 | $ | 2.1 | $ | .6 | |||||||
During 2010, the Company recognized restructuring and severance costs of $0.4 million in Performance Chemicals and $0.2 million in Decorative Products, related to workforce reductions.
During 2009, the Company recognized restructuring and severance costs of $1.8 million in Decorative Products, $0.2 million in Performance Chemicals and $0.1 million at Corporate, related to workforce reduction actions. Employee headcount was reduced by 49 employees related to these actions.
In November 2008, the Company announced the closure of its Dupo, Illinois extrusion facility. As a result, the Company recorded $0.1 million of facility closure costs. During January 2009, the assets of this facility were sold with no related gain or loss.
Also in 2008, the Company recorded $0.5 million of severance charges related to workforce reductions, of which $0.4 million was recorded by Decorative Products and $0.1 million was recorded by Performance Chemicals. The Company terminated approximately 17 employees in connection with these workforce reductions.
The following table summarizes the Company’s liabilities related to restructuring and severance activities:
| November 2009 |
2010 | November 2010 |
||||||||||||||
| Provision | Payments | |||||||||||||||
| (Dollars in millions) | ||||||||||||||||
| Performance Chemicals |
$ | — | $ | .4 | $ | .3 | $ | .1 | ||||||||
| Decorative Products |
— | .2 | .2 | — | ||||||||||||
| Corporate |
— | — | — | — | ||||||||||||
| Total |
$ | — | $ | .6 | $ | .5 | $ | .1 | ||||||||
Note C—Other Expense (Income)
The following table sets forth the major components of other expense (income):
| Years Ended November 30, | ||||||||||||
| 2010 | 2009 | 2008 | ||||||||||
| (Dollars in millions) | ||||||||||||
| Gain on RohmNova dissolution |
$ | (9.7 | ) | $ | — | $ | — | |||||
| Fair value adjustment to Euro Currency Collar (see Note P) |
9.2 | — | — | |||||||||
| Strike-related expenses |
2.2 | — | — | |||||||||
| Loss (gain) on foreign currency transactions |
.8 | (.5 | ) | (.6 | ) | |||||||
| Foreign import/export duty claim |
.3 | (.3 | ) | — | ||||||||
| Licensing revenue |
(.1 | ) | (.4 | ) | (.4 | ) | ||||||
| Flood related costs |
— | .6 | — | |||||||||
| Interest income |
(.1 | ) | (.2 | ) | (.3 | ) | ||||||
| Indemnification reserve reversal |
(.7 | ) | (.3 | ) | — | |||||||
| Other |
(.2 | ) | (1.2 | ) | (.8 | ) | ||||||
| $ | 1.7 | $ | (2.3 | ) | $ | (2.1 | ) | |||||
51
Table of Contents
NOTES TO THE CONSOLIDATED FINANCIAL STATEMENTS—Continued
Note C—Other Expense (Income) (Continued)
During May 2010, the Company’s Performance Chemicals segment received cash and assets totaling $9.7 million related to the termination of the RohmNova joint marketing alliance. RohmNova was a sales, marketing and technical service alliance between the Company and the Rohm and Haas Company that served the coated paper and paperboard market since 2002. The termination was required by The Dow Chemical Company’s acquisition of Rohm and Haas Company.
In connection with the Company’s acquisition of Eliokem International SAS, which was consummated on December 9, 2010, the Company entered into a zero cost forward Currency Collar in October 2010 to hedge changes in exchange rate movements of the Euro to the U.S. dollar. Due to changes in the exchange rate for the Euro, the fair value of the Currency Collar as of November 30, 2010 was a liability of $9.2 million. The Company recognized the fair value of this Currency Collar as a current liability with an offsetting expense in other expense (income). The Company settled this Currency Collar with the counter-party on December 1, 2010.
On May 20, 2010, the approximately 180 Columbus, Mississippi employees represented by United Steelworkers Local #748-L voted against ratification of a new contract proposal and subsequently went on strike on May 21, 2010. The Company’s salaried workforce and contract labor were operating the plant and meeting customers’ requirements through the third quarter of 2010. During the fourth quarter of 2010, the Company transitioned to locally hired replacement employees. The Company incurred strike-related costs of $5.5 million in 2010 of which $3.3 million is included in cost of goods sold and $2.2 million is included in other expense (income). The Company does not anticipate incurring any significant strike-related costs in 2011.
The indemnification reserve reversal relates to indemnifications the Company had with its former parent, GenCorp, Inc. relating to certain tax matters prior to 1999. The Company has determined it is unlikely that these obligations will be required due to the passage of time and other factors, and accordingly, the Company reversed these indemnifications.
Note D—Income Taxes
| Years Ended November 30, | ||||||||||||
| 2010 | 2009 | 2008 | ||||||||||
| (Dollars in millions) | ||||||||||||
| Income Tax (Benefit) Expense |
||||||||||||
| Current |
||||||||||||
| U.S. federal |
$ | .2 | $ | .3 | $ | — | ||||||
| State and local |
.7 | .2 | — | |||||||||
| Foreign |
(1.5 | ) | 1.7 | — | ||||||||
| (.6 | ) | 2.2 | — | |||||||||
| Deferred |
||||||||||||
| U.S. federal |
(82.0 | ) | — | — | ||||||||
| State and local |
(7.5 | ) | — | .2 | ||||||||
| Foreign |
.7 | (.5 | ) | — | ||||||||
| (88.8 | ) | (.5 | ) | .2 | ||||||||
| Income Tax (Benefit) Expense |
$ | (89.4 | ) | $ | 1.7 | $ | .2 | |||||
52
Table of Contents
NOTES TO THE CONSOLIDATED FINANCIAL STATEMENTS—Continued
Note D—Income Taxes (Continued)
| Years Ended November 30, | ||||||||||||
| 2010 | 2009 | 2008 | ||||||||||
| Effective Income Tax Rate |
||||||||||||
| Tax at Federal Statutory Rate |
35.0 | % | 35.0 | % | (35.0 | )% | ||||||
| (Recognized) Unrecognized net operating loss |
(.4 | ) | (27.9 | ) | 25.8 | |||||||
| Release of U.S. valuation allowance |
(530.3 | ) | — | — | ||||||||
| Permanent items |
9.5 | — | — | |||||||||
| Foreign taxes at different rates |
(3.0 | ) | .3 | 4.9 | ||||||||
| Uncertain tax positions |
(7.0 | ) | (2.7 | ) | 2.8 | |||||||
| State taxes |
16.4 | .7 | 7.2 | |||||||||
| Other, net |
(3.4 | ) | 1.0 | .7 | ||||||||
| Effective Income Tax Rate |
(483.2 | )% | 6.4 | % | 6.4 | % | ||||||
Deferred Taxes
| November 30, | ||||||||||||||||
| 2010 | 2009 | |||||||||||||||
| Assets | Liabilities | Assets | Liabilities | |||||||||||||
| (Dollars in millions) | ||||||||||||||||
| Accrued estimated costs |
$ | 9.5 | $ | — | $ | 15.1 | $ | — | ||||||||
| Goodwill and intangible assets |
14.9 | — | 20.3 | — | ||||||||||||
| Depreciation |
— | 11.5 | — | 13.3 | ||||||||||||
| Pension |
25.9 | — | 24.8 | — | ||||||||||||
| NOLC’s and other carryforwards |
51.0 | — | 52.0 | — | ||||||||||||
| Post-retirement employee benefits |
4.9 | — | 3.4 | — | ||||||||||||
| Other |
2.0 | — | — | 1.8 | ||||||||||||
| Valuation allowance |
(6.3 | ) | — | (101.1 | ) | — | ||||||||||
| Deferred Taxes |
$ | 101.9 | $ | 11.5 | $ | 14.5 | $ | 15.1 | ||||||||
As of November 30, 2010, the Company had approximately $118.9 million of domestic federal net operating losses carryforwards (NOLC’s) and $109.2 million of state and local NOLC’s and $0.7 million of foreign tax credit carryforwards and $0.5 million of AMT credit carryforwards. The majority of the federal, state and local NOLC’s expire in the years 2021 through 2031 while the foreign tax credit carryforwards expire between 2010 and 2017. The U.S. domestic pretax income was $15.3 million, $20.3 million, and $0.2 million in 2010, 2009 and 2008, respectively. As of November 30, 2010, the Company had approximately $19.3 million of foreign NOLC’s of which $16.4 million with an indefinite carryforward period. Pretax income (loss) of foreign subsidiaries was $3.5 million, $7.6 million, and $(2.2) million in 2010, 2009 and 2008, respectively. Cash paid for income taxes in 2010 and 2009 was $1.6 million and $1.0 million, respectively, and related primarily to federal AMT, state and foreign income taxes.
The valuation allowance decreased by $94.8 million, for the year ended November 30, 2010, and increased by $13.0 million and $2.8 million for the years ended November 30, 2009 and 2008, respectively. The decrease of $94.8 million in 2010 includes an increase of $3.5 million of adjustments to the opening balance sheet valuation allowance due to changes in circumstances that caused a change in judgment about the realizability of the related deferred tax asset in future years. The net increase in the valuation allowance was $13.0 million in 2009, primarily due to increases in deferred tax assets relating to changes in the pension liability. The valuation had a net increase of $2.8 million in 2008. At November 30, 2009,
53
Table of Contents
NOTES TO THE CONSOLIDATED FINANCIAL STATEMENTS—Continued
Note D—Income Taxes (Continued)
the Company, considered the guidance in ASC 740, Income Taxes, and decided to maintain its valuation allowance until it established further consistency in producing taxable income. Despite generating income in 2009, several factors including market demand and volatile raw material costs had in recent years resulted in losses and difficulty in predicting future taxable income. For the year ended November 30, 2010, the Company again considered the positive and negative evidence as required by ASC 740 and concluded, that it is more likely than not that the Company will realize the benefit from the U.S. deferred tax assets due to a preponderance of positive evidence, which includes a three year U.S. cumulative income position, increased predictability over future taxable income, and future taxable income from the reversal of deferred tax assets and liabilities in future years. During the fourth quarter of 2010, the Company released the related U.S. valuation allowance resulting in a credit to income tax (benefit) expense. Of the total 2010 decrease of $98.3 million, $98.2 million relates to a U.S. valuation allowance release against the U.S. federal, and certain state and local deferred tax assets which include a federal valuation allowance release of $88 million and a state and local valuation allowance release of $10.2 million.
At November 30, 2010, the total unrecognized tax benefits were $3.8 million, excluding $0.3 million of penalties and interest. Of the total, $1.3 million would, if recognized, impact the Company’s effective tax rate.
A reconciliation of the beginning and ending amount of unrecognized tax benefits excluding interest and penalties is as follows:
| November 30, | ||||||||
| 2010 | 2009 | |||||||
| (Dollars in millions) | ||||||||
| Opening balance December 1 |
$ | 7.5 | $ | 7.1 | ||||
| Increase based on tax positions related to current year |
— | 1.1 | ||||||
| Decrease based on tax positions in the prior year |
(1.1 | ) | (.5 | ) | ||||
| Reduction due to lapse of statue of limitations |
(2.7 | ) | (.5 | ) | ||||
| Currency translation effects |
0.1 | .3 | ||||||
| Ending balance November 30 |
$ | 3.8 | $ | 7.5 | ||||
Interest and penalties related to unrecognized tax benefits are recorded as a component of income tax expense. For the year 2010, the Company recognized an income tax benefit related to interest and penalties due of $0.7 million. The Company recognized in income tax expense interest and penalties due to tax authorities of $0.1 million and $0.1 million in years 2009 and 2008, respectively.
During the next twelve months, the Company expects its unrecognized tax benefit, including penalties and interest, to decrease by $0.6 million due to expiration of statutes. However, additional unrecognized tax benefits could arise that would change such estimate.
With limited exceptions, the Company is no longer open to audit under the statutes of limitation by the Internal Revenue Service and various states and foreign taxing jurisdictions for years prior to 2005.
54
Table of Contents
NOTES TO THE CONSOLIDATED FINANCIAL STATEMENTS—Continued
Note E—Accumulated Other Comprehensive Income (Loss)
The components of Accumulated Other Comprehensive Income (Loss) are as follows:
| Years Ended November 30, | ||||||||||||
| 2010 | 2009 | 2008 | ||||||||||
| (Dollars in millions) | ||||||||||||
| Foreign currency translation adjustments |
$ | — | $ | (1.4 | ) | $ | (4.8 | ) | ||||
| Unrecognized loss on interest rate swap |
(4.2 | ) | (4.6 | ) | (3.7 | ) | ||||||
| Employee benefit plans |
(81.6 | ) | (77.1 | ) | (25.1 | ) | ||||||
| Accumulated other comprehensive loss |
$ | (85.8 | ) | $ | (83.1 | ) | $ | (33.6 | ) | |||
The amounts included in Accumulated Other Comprehensive Loss during 2010 and 2009 relating to the Company’s employee benefit plans were as follows:
| Pension | ||||||||||||||||
| Domestic | Foreign | Health Care |
Total | |||||||||||||
| (Dollars in millions) | ||||||||||||||||
| 2010 |
||||||||||||||||
| Net Actuarial (Loss) Gain |
||||||||||||||||
| Net actuarial (loss) gain incurred during the period |
$ | (10.3 | ) | $ | (.1 | ) | $ | (.4 | ) | $ | (10.8 | ) | ||||
| Amortization included in net periodic expense (income) |
4.1 | .1 | (2.3 | ) | 1.9 | |||||||||||
| Net change in net actuarial gain |
$ | (6.2 | ) | $ | — | $ | (2.7 | ) | $ | (8.9 | ) | |||||
| Prior Service Cost |
||||||||||||||||
| Amortization included in net periodic expense (income) |
$ | .6 | $ | — | $ | (.3 | ) | $ | .3 | |||||||
| Curtailment loss |
1.3 | — | — | 1.3 | ||||||||||||
| Net change in prior service costs |
$ | 1.9 | $ | — | $ | (.3 | ) | $ | 1.6 | |||||||
| 2009 |
||||||||||||||||
| Net Actuarial (Loss) Gain |
||||||||||||||||
| Net actuarial (loss) gain incurred during the period |
$ | (50.9 | ) | $ | (.1 | ) | $ | .5 | $ | (50.5 | ) | |||||
| Amortization included in net periodic expense (income) |
1.6 | (.1 | ) | (2.4 | ) | (.9 | ) | |||||||||
| Change in measurement date |
.3 | — | (.6 | ) | (.3 | ) | ||||||||||
| Net change in net actuarial gain |
$ | (49.0 | ) | $ | (.2 | ) | $ | (2.5 | ) | $ | (51.7 | ) | ||||
| Prior Service Cost |
||||||||||||||||
| Amortization included in net periodic expense (income) |
$ | (.1 | ) | $ | — | $ | (.3 | ) | $ | (.4 | ) | |||||
| Change in measurement date |
.1 | — | — | .1 | ||||||||||||
| Net change in prior service costs |
$ | — | $ | — | $ | (.3 | ) | $ | (.3 | ) | ||||||
Note F—Earnings Per Share
Certain of the Company’s unvested restricted shares contain rights to receive nonforfeitable dividends and are considered participating securities, requiring the two-class method of computing earnings per share. The prior period earnings per share data has been adjusted to retrospectively reflect the application of the two-class method. There was no impact on the computation of the Company’s net income per common share for 2008 and 2007, however, the impact on 2009 was a change from $0.61 per basic and diluted share to $0.59 per basic and diluted share.
55
Table of Contents
NOTES TO THE CONSOLIDATED FINANCIAL STATEMENTS—Continued
Note F—Earnings Per Share (Continued)
The following table sets forth the computation of earnings per common share and fully diluted earnings per common share:
| Year Ended November 30, | ||||||||||||
| 2010 | 2009 | 2008 | ||||||||||
| (Dollars in millions, except per share data) |
||||||||||||
| Basic Earnings (Loss) Per Share: |
||||||||||||
| Net income (loss) |
$ | 107.9 | $ | 26.2 | $ | (2.2 | ) | |||||
| Less: Net income (loss) allocated to participating securities |
2.8 | .7 | — | |||||||||
| Net income (loss) allocated to common stockholders |
$ | 105.1 | $ | 25.5 | $ | (2.2 | ) | |||||
| Total weighted-average shares outstanding — basic |
44.6 | 44.1 | 43.1 | |||||||||
| Less: Weighted-average participating shares outstanding |
1.2 | 1.2 | .8 | |||||||||
| Weighted-average common shares outstanding — basic |
43.4 | 42.9 | 42.3 | |||||||||
| Net income (loss) per common share — basic |
$ | 2.42 | $ | .59 | $ | (.05 | ) | |||||
| Diluted Earnings (Loss) Per Share: |
||||||||||||
| Net income (loss) |
$ | 107.9 | $ | 26.2 | $ | (2.2 | ) | |||||
| Less: Net income (loss) allocated to participating securities |
2.8 | .7 | — | |||||||||
| Net income (loss) allocated to common stockholders |
$ | 105.1 | $ | 25.5 | $ | (2.2 | ) | |||||
| Weighted-average common shares outstanding — basic |
43.4 | 42.9 | 42.3 | |||||||||
| Plus: Dilutive effect of stock options and restricted stock |
.4 | .5 | — | |||||||||
| Weighted-average common shares outstanding — assuming dilution |
43.8 | 43.4 | 42.3 | |||||||||
| Net income (loss) per common share — assuming dilution |
$ | 2.40 | $ | .59 | $ | (.05 | ) | |||||
Certain options to purchase common stock and unearned restricted stock of the Company were anti-dilutive and consisted of .6 million, 3.2 million and 4.4 million shares during 2010, 2009 and 2008, respectively. These potential shares were not included in the computation of net income per common share—assuming dilution.
Note G—Accounts Receivable
The Company’s accounts receivable are generally unsecured. There is no customer who represented more than 10% of the Company’s net trade receivables at November 30, 2010 and one customer who represented approximately 10.5% of net trade receivables at November 30, 2009. The allowance for doubtful accounts was $2.0 million and $2.3 million at November 30, 2010 and 2009, respectively. Write-offs of uncollectible accounts receivable totaled $0.5 million, $0.8 million and $0.6 million in 2010, 2009 and 2008, respectively. The provision for bad debts totaled $0.2 million, $0.8 million and $1.1 million in 2010, 2009 and 2008, respectively.
56
Table of Contents
NOTES TO THE CONSOLIDATED FINANCIAL STATEMENTS—Continued
Note H—Inventories
| November 30, | ||||||||
| 2010 | 2009 | |||||||
| (Dollars in millions) | ||||||||
| Raw materials and supplies |
$ | 32.4 | $ | 25.9 | ||||
| Work-in-process |
5.2 | 3.9 | ||||||
| Finished products |
45.5 | 41.7 | ||||||
| Acquired cost of inventories |
83.1 | 71.5 | ||||||
| Excess of acquired cost over LIFO cost |
(30.1 | ) | (26.8 | ) | ||||
| Obsolesence reserves |
(7.2 | ) | (7.2 | ) | ||||
| Inventories |
$ | 45.8 | $ | 37.5 | ||||
Inventories valued using the LIFO method represented $49.4 million or 59.5% and $44.9 million or 62.8% of inventories at November 30, 2010 and 2009, respectively. During 2010, inventory quantities declined in the Decorative Products segment resulting in a partial liquidation of LIFO inventory layers carried at lower costs prevailing in prior years compared to the costs of current year purchases. The effect of this partial liquidation decreased cost of products sold by $0.5 million. During 2009, inventory quantities declined in the Performance Chemicals and Decorative Products segments resulting in a partial liquidation of LIFO inventory layers which decreased cost of products sold by $0.5 million and $1.2 million for Performance Chemicals and Decorative Products, respectively.
Note I—Property, Plant and Equipment, Net
| November 30, | ||||||||
| 2010 | 2009 | |||||||
| (Dollars in millions) | ||||||||
| Land |
$ | 7.8 | $ | 8.0 | ||||
| Building and improvements |
106.7 | 103.8 | ||||||
| Machinery and equipment |
391.8 | 402.7 | ||||||
| Construction in progress |
6.4 | 6.8 | ||||||
| 512.7 | 521.3 | |||||||
| Accumulated depreciation |
(381.2 | ) | (379.4 | ) | ||||
| Property, Plant and Equipment, Net |
$ | 131.5 | $ | 141.9 | ||||
Depreciation expense was $19.5 million, $21.8 million and $22.0 million in 2010, 2009 and 2008, respectively. Included in depreciation and amortization expense is $15.8 million, $17.6 million and $17.7 million in 2010, 2009 and 2008, respectively, related to depreciation of manufacturing facilities and equipment.
As of November 30, 2010 and 2009, the Company had $2.4 million and $3.0 million, respectively, of unamortized software costs included in machinery and equipment, primarily related to an Enterprise Resource Program (ERP) system, which the Company began implementing during 2005. Depreciation expense of software costs was $1.2 million, $1.7 million and $1.5 million in 2010, 2009 and 2008, respectively. The Company is depreciating these costs over five years.
During the second quarter of 2010, the Company’s Decorative Products segment recognized an impairment charge of $6.2 million to write-down machinery and equipment at its Columbus, Mississippi facility to fair value. The impairment was caused by the loss of business attributed to weak market conditions for commercial wallcovering that are not expected to recover to historical levels, and the transfer of certain production activities to other Company facilities to align with customer
57
Table of Contents
NOTES TO THE CONSOLIDATED FINANCIAL STATEMENTS—Continued
Note I—Property, Plant and Equipment, Net (Continued)
demand. The assets were written down to their estimated fair value using a cost approach based on estimated prices the Company would receive for the underlying assets. The Company utilized Level 3 inputs in calculating the fair value of these assets including the estimated cost to a buyer to acquire substitute assets of comparable utility, adjusted for obsolescence.
During 2009, the Company recorded asset impairment charges of $1.1 million related to assets no longer in service.
Note J—Other Intangible Assets
On May 14, 2010, the Company acquired certain intangible assets of The Dow Chemical Company’s hollow plastic pigment product line for $2.5 million. Those intangible assets included patents, trademarks and customer lists. The purchase of these intangible assets will allow the Company to enhance its leading product offering to the coated paper and paperboard industry and provide an opportunity for growth in other applications.
The fair value of these assets totaled $2.5 million on the acquisition date and were determined by utilizing a discounted cash flow model using a risk adjusted rate developed under the weighted-average cost of capital methodology.
As of November 30, 2010 and 2009, the Company had no indefinite lived intangible assets or goodwill.
The following table summarizes finite lived intangible assets as of November 30, 2010 and 2009:
| November 30, 2010 | November 30, 2009 | |||||||||||||||
| Gross Carrying Amount |
Net Carrying Amount |
Gross Carrying Amount |
Net Carrying Amount |
|||||||||||||
| (Dollars in millions) | ||||||||||||||||
| Finite lived intangible assets |
||||||||||||||||
| Patents |
$ | 9.6 | $ | 1.4 | $ | 7.9 | $ | .3 | ||||||||
| Trademarks |
6.3 | .4 | 5.8 | .1 | ||||||||||||
| Technical know-how |
2.6 | 1.3 | 2.6 | 1.4 | ||||||||||||
| Customer lists |
1.7 | 1.2 | 1.4 | 1.1 | ||||||||||||
| Other |
3.8 | 1.5 | 3.8 | 1.5 | ||||||||||||
| $ | 24.0 | $ | 5.8 | $ | 21.5 | $ | 4.4 | |||||||||
Amortization expense for finite lived intangible assets was $1.1 million, $1.1 million and $1.9 million for the years ended November 30, 2010, 2009 and 2008, respectively, and is estimated to be approximately $1.2 million in 2011 progressively decreasing to $0.3 million in 2015.
Note K—Debt and Credit Lines
Amounts due banks consist of the following debt obligations that are due within the next twelve months:
| November 30, | ||||||||
| 2010 | 2009 | |||||||
| (Dollars in millions) | ||||||||
| Term Loan B–current portion |
$ | 1.5 | $ | 1.5 | ||||
| Foreign subsidiaries borrowings (interest at 5.1% - 5.3%) |
3.3 | 1.8 | ||||||
| Total |
$ | 4.8 | $ | 3.3 | ||||
58
Table of Contents
NOTES TO THE CONSOLIDATED FINANCIAL STATEMENTS—Continued
Note K—Debt and Credit Lines (Continued)
Total foreign availability at November 30, 2010 was $7.1 million, of which $3.3 million was outstanding. Foreign subsidiaries’ borrowings are secured by equipment, buildings and land use rights of the foreign subsidiaries. In addition, the Company has additional foreign credit facilities for the issuance of letters of credit of $5.7 million. Outstanding letters of credit on this facility were $0.1 million at November 30, 2010.
The Company’s long-term debt consists of the following:
| November 30, | ||||||||
| 2010 | 2009 | |||||||
| (Dollars in millions) | ||||||||
| Term Loan B (interest at 2.8%) |
$ | 140.9 | $ | 142.3 | ||||
| Senior Unsecured Notes (interest at 7.875%) |
250.0 | — | ||||||
| Senior Revolving Credit Facility (interest at 1.5%) |
— | — | ||||||
| 390.9 | 142.3 | |||||||
| Less: current portion |
1.5 | 1.5 | ||||||
| Total long-term debt |
$ | 389.4 | $ | 140.8 | ||||
On May 22, 2007, the Company entered into a $150 Million Term Loan Credit Agreement due May 2014. The Term Loan carries a variable interest rate based on, at the Company’s option, either an alternate base rate or a Eurodollar rate, in each case plus an applicable margin. The alternate base interest rate is a fluctuating rate equal to the higher of the Prime Rate or the sum of the Federal Funds Effective Rate plus 0.50%. The applicable margin for the alternate base rate is 1.50%. The Eurodollar rate is a periodic fixed rate equal to the London Inter Bank Offered Rate (“LIBOR”). The applicable margin for the Eurodollar rate is 2.50%. Annual principal payments consist of $1.5 million, due in quarterly installments, and annual excess free cash flow payments as defined in the Term Loan agreement, with any remaining balance to be paid May 2014. Required principal payments of $1.5 million were paid in both 2009 and 2008 and the 2007 excess cash flow payment of $3.9 million was paid during 2008. The Company was not required to pay an excess cash flow payment for 2009 or 2008. The Company can prepay any amount at any time without penalty upon proper notice and subject to a minimum dollar requirement. Prepayments will be applied towards any required annual excess free cash flow payment. The Term Loan is secured by all real property and equipment of the Company’s domestic facilities and stock and equity investments of the Company’s non-domestic subsidiaries. The Term Loan requires the Company to maintain an interest rate swap with a notional amount of at least $50 million. Additionally, the Term Loan provides for additional borrowings of the greater of $75 million or an amount based on a senior secured leverage ratio, as defined in the Term Loan, $75 million, provided that certain requirements are met including an interest coverage ratio. The Company has not utilized these additional borrowings as of November 30, 2010. The Term Loan contains affirmative and negative covenants, including limitations on additional debt, certain investments and acquisitions outside of the Company’s line of business. The Term Loan requires the Company to maintain a net leverage ratio of less than 5.5 to 1. At November 30, 2010, the Company was in compliance with this requirement with a ratio of 1.3 to 1.
On May 31, 2007, as required under the Term Loan, the Company entered into a 5 -year fixed rate interest rate swap agreement with a notional amount of $50 million to convert a portion of the outstanding Term Loan from variable to fixed rates. Under this agreement, the Company paid to the counterparty a fixed rate of 5.23% and received from the counterparty a variable rate based on three month LIBOR. This effectively converted $50 million of the Term Loan to a fixed rate of 7.73% when including the applicable margin of the Term Loan of 2.50%. The variable rates on the interest rate swap and $50 million of the Term Loan were reset every three months on the same LIBOR base rate and same date, at which time the interest was settled and recognized as adjustments to interest expense. As of November 30, 2009, the unrealized loss of the swap of $4.6 million was recognized as a non-current liability with a corresponding amount recognized in Accumulated Other Comprehensive Income (loss). In November 2010, the Company terminated and settled the interest rate swap with the
59
Table of Contents
NOTES TO THE CONSOLIDATED FINANCIAL STATEMENTS—Continued
Note K—Debt and Credit Lines (Continued)
counter-party at a cost of $4.3 million. As required under applicable accounting guidance, this amount is recognized in Accumulated Other Comprehensive Income (loss) and will be amortized into interest expense over the remaining original term of the interest rate swap agreement.
In connection with the Term Loan, on May 22, 2007 the Company amended its Senior Secured Revolving Credit Facility (“Facility”). The Facility was increased to $80 million from $72 million and extended until May 2012. In January 2008, the Facility was increased to $90 million. The Facility is secured by domestic accounts receivable, inventory (collectively the “Eligible Borrowing Base”) and intangible assets. Availability under the Facility will fluctuate depending on the Eligible Borrowing Base and is determined by applying customary advance rates to the Eligible Borrowing Base including a reserve, as calculated by the Lenders, for the Company’s interest rate swap (“interest rate swap reserve”). The Facility includes a $15 million sublimit for the issuance of commercial and standby letters of credit and a $10 million sublimit for swingline loans. Outstanding letters of credit on November 30, 2010 were $2.8 million. The Facility contains affirmative and negative covenants, similar to the Term Loan, including limitations on additional debt, certain investments and acquisitions outside of the Company’s line of business. If the average excess availability of the Facility falls below $20 million during any fiscal quarter, the Company must then maintain a fixed charge coverage ratio greater than 1.1 to 1 as defined in the agreement. Average excess availability is defined as the average daily amount available for borrowing under the Facility during the Company’s fiscal quarter. The Company was in compliance with this requirement as the average excess availability did not fall below $20 million during 2010 and averaged $58 million during the fourth quarter of 2010.
Advances under the Facility bear interest, at the Company’s option, at either an alternate base rate or a Eurodollar rate, in each case plus an applicable margin. The alternate base interest rate is a fluctuating rate equal to the higher of the Prime Rate or the sum of the Federal Funds Effective Rate plus 0.50%. The applicable margin for the alternate base rate will vary from 0.0% to 0.25% depending on the Company’s fixed charge coverage ratio and the margin was 0.0% at November 30, 2010. The Eurodollar rate is a periodic fixed rate equal to LIBOR. The applicable margin for the Eurodollar rate will vary from 1.25% to 2.00% depending on the Company’s fixed charge coverage ratio and the margin was 1.25% at November 30, 2010.
The Facility requires a commitment fee based on the unused portion of the Facility. The commitment fee will vary from 0.125% to 0.25% based on the Company’s fixed charge coverage ratio and was 0.125% at November 30, 2010.
At November 30, 2010, the Company had $68.0 million of eligible inventory and receivables to support the eligible borrowing base which is capped at $90.0 million under the Facility. At November 30, 2010, outstanding letters of credit under the Facility were $2.8 million, there were no amounts borrowed under the Facility and the amount available for borrowing under the Facility was $65.2 million.
The fair value of the Company’s long-term debt at November 30, 2010 approximated $370.7 million, which is lower than the carrying value as a result of prevailing market rates on the Company’s debt.
The effective interest rate on the Company’s U.S. debt was 4.9% and 4.5% for 2010 and 2009, respectively.
Cash paid for interest was $6.8 million, $6.9 million and $12.2 million for 2010, 2009 and 2008, respectively.
In connection with the acquisition of Eliokem International SAS (“Eliokem”) as described below and in Note R, on November 3, 2010, the Company issued a private placement of $250 million aggregate principal amount of Senior Notes with a 7.875% interest rate, payable semi-annually. The Senior Notes mature on November 1, 2018 and are unsecured. As of November 30, 2010, the proceeds of the Senior Notes were held in escrow subject to completion of the Eliokem acquisition. If the transaction had not occurred, the Company would have been required to redeem the Senior Notes. The Company may redeem a portion of the outstanding Senior Notes any time after October 2014 at a premium above par, subject to
60
Table of Contents
NOTES TO THE CONSOLIDATED FINANCIAL STATEMENTS—Continued
Note K—Debt and Credit Lines (Continued)
certain restrictions. The Senior Notes are jointly, severally and unconditionally guaranteed on a senior, unsecured basis by all of OMNOVA Solutions Inc.’s existing and future domestic subsidiaries that from time to time guarantee obligations under the Company’s Senior Notes, with certain exceptions (the “Guarantors”). In connection with the issuance of the Senior Notes, the Company entered into a Registration Rights Agreement among the Company, the Guarantors and the initial purchasers of the Senior Notes. Under the Registration Rights Agreement, the Company and the Guarantors agreed, among other things, to use reasonable best efforts to file an exchange offer registration statement with the SEC with respect to the Senior Notes and the guarantees thereof within 150 days after the consummation of the Acquisition.
Debt Transactions Related to Eliokem Transaction
Additionally, on December 9, 2010, the Company refinanced its existing $150 million Term Loan that had a balance of $140.9 million as of November 30, 2010 with a new $200 million Term Loan (“New Term Loan”). The New Term Loan is secured by the property, plant and equipment and intangible assets of the combined companies. The New Term Loan carries a variable interest rate based on, at the Company’s option, either a Eurodollar rate or a base rate, in each case plus an applicable margin. The Eurodollar rate is a periodic fixed rate equal to the London Inter Bank Offered Rate (“LIBOR”), provided that the Eurodollar rate shall not be less than 1.75%. The applicable margin for the Eurodollar rate is initially 4.0%. However, if the Company’s net leverage ratio falls below 2.75, the applicable margin will decrease to 3.75%. The base interest rate is a fluctuating rate equal to the higher of (i) the Prime Rate, (ii) the sum of the Federal Funds Effective Rate plus 0.50% or (iii) the one month Eurodollar Rate plus 1.0%. The applicable margin for the base rate is 3.0%. However, if the Company’s net leverage ratio falls below 2.75, the applicable margin will decrease to 2.75%. Annual principal payments consist of $2.0 million, due in quarterly installments, and annual excess free cash flow payments as defined in the New Term Loan agreement, with any remaining balance to be paid May 31, 2017. The Company can prepay any amount at any time without penalty upon proper notice and subject to a minimum dollar requirement. Prepayments will be applied towards any required annual excess free cash flow payment. The New Term Loan is secured by all real property and equipment of the Company’s domestic facilities and guaranteed by the domestic subsidiaries of the Company. Additionally, the New Term Loan provides for additional borrowings of the greater of $75 million or an amount based on a senior secured leverage ratio, as defined in the New Term Loan, provided that certain requirements are met including an interest coverage ratio of 2.0. The New Term Loan contains affirmative and negative covenants, including limitations on additional debt, certain investments and acquisitions outside of the Company’s line of business. The New Term Loan requires the Company to maintain an initial senior secured net leverage ratio of less than 3.25 to 1, which decreases annually by 25 basis points through December 1, 2014 and then remains at 2.5 to 1 thereafter.
The Company issued the New Term Loan at a discount of $2.0 million receiving cash of $198 million. This discount will be reflected as a reduction of outstanding debt and amortized over the respective term of the debt.
Also in connection with the acquisition of Eliokem, in December 2010, the Company amended and restated the Asset Based Facility (“Amended Facility”), increasing potential availability to $100 million, which can be further increased up to $150 million subject to additional borrowing base assets and lender approval. Total availability is dependent on domestic accounts receivable and inventory. The Amended Facility increases the average excess availability requirement to $25 million during any fiscal quarter but retains the fixed charge coverage ratio of 1.1 to 1 if average excess availability falls below the $25 million. Applicable margins are based on the Company’s average daily excess availability during the previous fiscal quarter. If average excess availability is greater than $50 million, the applicable margin will be 2.25% on Eurodollar loans, 1.25% on base rate borrowings and .625% on commitments for unused credit lines. If average excess availability is greater than $25 million but less than $50 million, the applicable margin will be 2.5% on Eurodollar loans, 1.5% on base rate borrowings and 0.5% on commitments for unused credit lines. If average excess availability is less than $25 million, the applicable margin will be 2.75% on Eurodollar loans, 1.75% on base rate borrowings and 0.375% on commitments for unused credit lines.
Net proceeds from the notes and the New Term Loan were used for the acquisition of Eliokem (including the repayment of Eliokem’s debt), the repayment of amounts outstanding under our existing term loan, related fees and
61
Table of Contents
NOTES TO THE CONSOLIDATED FINANCIAL STATEMENTS—Continued
Note K—Debt and Credit Lines (Continued)
expenses and for general working capital purposes. The acquisition was completed on December 9, 2010. The Amended Facility was not used to fund the acquisition.
The Company expects to incur approximately $15.7 million of deferred financing costs in connection with the issuance of the Senior Notes and the new $200 million Term Loan. These new deferred financing costs will be amortized over the respective terms of the underlying debt. Expense in 2011 is expected to be $2.2 million. The Company’s prior deferred financing fees of $1.1 million as of November 30, 2010 related to the existing $150.0 million Term Loan B will be written-off in the first quarter of 2011.
Note L—Employee Benefit Plans
Change in Pension Plan Measurement Date
Effective November 30, 2009, the Company adopted authoritative guidance issued by the Financial Accounting Standards Board (“FASB”) related to measurement of pension and other post-retirement benefit plans, which requires the Company to measure the assets and obligations of its pension and other post-retirement benefit plans as of the balance sheet date. Accordingly, during 2009 the Company changed the measurement date of its pension and other post-retirement benefit plans from August 31 to November 30 using the alternative method as prescribed in the guidance. The alternative method requires the Company to allocate net periodic pension cost for the 15 month period of September 1, 2008 – November 30, 2009 proportionately between 2008 and 2009. The amount allocated to 2008 was recognized in 2009 as an adjustment to retained earnings as a change in accounting principle. The impact of this change on the Company’s financial statements was as follows:
| Prior to Change in Measurement Date |
Effect of Change in Measurement Date |
As Reported at November 30, 2009 |
||||||||||
| (Dollars in millions) | ||||||||||||
| Non-Current Liabilities: |
||||||||||||
| Pension liability |
$ | 64.8 | $ | .6 | $ | 65.4 | ||||||
| Shareholders’ Equity: |
||||||||||||
| Post-retirement benefit other than pension |
$ | 8.2 | $ | .2 | $ | 8.4 | ||||||
| Retained deficit |
$ | (219.3 | ) | $ | (.6 | ) | $ | (219.9 | ) | |||
| Accumulated other comprehensive loss |
$ | (82.9 | ) | $ | (.2 | ) | $ | (83.1 | ) | |||
The change in measurement date had no impact on the Company’s statements of operations or cash flows for 2009 or any other period presented and did not affect any financial covenants.
Post-Retirement Benefits
Pension Plans—The Company has a defined benefit pension plan which covers substantially all U.S. based salaried and hourly employees hired prior to December 1, 2004. Normal retirement age is generally 65, but certain plan provisions allow for earlier retirement. The Company’s funding policy is consistent with the funding requirements of federal law. The plan provides for pension benefits, the amounts of which are calculated under formulas principally based on average earnings and length of service for salaried employees and under negotiated non-wage based formulas for union-represented employees.
62
Table of Contents
NOTES TO THE CONSOLIDATED FINANCIAL STATEMENTS—Continued
Note L—Employee Benefit Plans (Continued)
The Company made $5.1 million in contributions to this plan during 2010. Contributions were neither required nor made in 2009 and 2008 because the Company’s plan was adequately funded, using assumed returns. The Company anticipates that it will be required, under the “Pension Protection Act of 2006” and the “Preservation of Access to Care for Medicare Beneficiaries and Pension Relief Act of 2010” to make a contribution to its pension plan of approximately $2.8 million in 2011. The Company anticipates pension expense to be approximately $2.6 million in 2011. Estimated future benefit payments to retirees from the pension trust are as follows: 2011—$14.6 million, 2012—$14.8 million, 2013—$15.1 million, 2014—$15.3 million, 2015—$15.6 million, 2016 through 2021—$81.8 million.
The Company’s non-qualified, unfunded pension plan had an accumulated benefit obligation and projected benefit obligation of $3.7 million each as of November 30, 2010 and $3.4 million and $2.4 million, respectively, as of November 30, 2009.
As of November 30, 2010, the Company recognized a non-current liability of $69.3 million for the unfunded status of its defined benefit pension plan and a liability of $3.7 million for its unfunded non-qualified pension plan, of which $3.6 million was non-current. As of November 30, 2009, the Company recognized $62.1 million for the unfunded status of its defined benefit pension plan and a liability for the unfunded status of its non-qualified pension plan of $3.4 million. The increase in unfunded status was due to the decrease in the discount rate to 5.83% from 6.05%. The Company also recognizes in Accumulated Other Comprehensive Loss the prior service cost and net actuarial loss of these plans. Future changes to the funded status of these plans are recognized in the year in which the change occurs through other comprehensive income.
Health Care Plans—The Company provides retiree medical plans for certain active and retired employees of which there were 183 participants as of November 30, 2010. The plans generally provide for cost sharing in the form of retiree contributions, deductibles and coinsurance between the Company and its retirees, and a fixed cost cap on the amount the Company pays annually to provide future retiree medical coverage. These post-retirement benefits are unfunded and are accrued by the date the employee becomes eligible for the benefits. Retirees in certain other countries are provided similar benefits by plans sponsored by their governments.
Because the Company’s retiree health care benefits are capped, assumed health care cost trend rates have a minimal effect on the amounts reported for the retiree health care plans. A one-percentage point increase/decrease in assumed health care cost trend rates would not significantly increase or decrease the benefit obligation at November 30, 2010 and would have no effect on the aggregate of the service and interest components of the net periodic cost.
Estimated future benefit payments for the retiree health care plans are as follows: 2011—$1.2 million, 2012—$1.1 million, 2013—$1.1 million, 2014—$1.0 million, 2015—$1.0 million, 2016 through 2020—$4.5 million. Additionally, the Company expects to receive Medicare Part D subsidies to partially offset the estimated future benefit payments of approximately $0.2 million in each of 2011 2012, 2013, 2014 and 2015 and a cumulative total of $1.0 million for 2016 through 2021.
The Company recognized a liability of $8.7 million and $9.6 million as of November 30, 2010 and 2009, respectively, for the unfunded status of its retiree medical plans of which $7.7 million and $8.4 million, respectively, are reported as non-current. The current portion of the retiree health care plan was $1.0 million and $1.2 million as of November 30, 2010 and 2009, respectively. Additionally, the Company recognized in Accumulated Other Comprehensive Loss the prior service cost and net actuarial gain of these plans. Future changes to the unfunded status of these plans are recognized in the year in which the change occurs through other comprehensive income (loss).
The Company expects to record non-cash retiree medical health care income of approximately $1.7 million in 2011.
63
Table of Contents
NOTES TO THE CONSOLIDATED FINANCIAL STATEMENTS—Continued
Note L—Employee Benefit Plans (Continued)
Changes in benefit obligations and plan assets are as follows:
| Pension Plans | Health Care Plans | |||||||||||||||
| 2010 | 2009 | 2010 | 2009 | |||||||||||||
| (Dollars in millions) | ||||||||||||||||
| Change in Benefit Obligation |
||||||||||||||||
| Benefit obligation at beginning of year |
$ | 229.2 | $ | 202.2 | $ | 9.6 | $ | 11.1 | ||||||||
| Change in measurement date |
— | 1.5 | — | .2 | ||||||||||||
| Service cost |
1.6 | 2.8 | .1 | .1 | ||||||||||||
| Interest cost |
13.4 | 14.2 | .5 | .7 | ||||||||||||
| Curtailment |
2.9 | (8.4 | ) | (.8 | ) | — | ||||||||||
| Actuarial loss (gain) |
11.1 | 30.3 | .4 | (.5 | ) | |||||||||||
| Benefits paid net of retiree contributions |
(14.1 | ) | (13.4 | ) | (1.1 | ) | (2.0 | ) | ||||||||
| Benefit Obligation at End of Year |
$ | 244.1 | $ | 229.2 | $ | 8.7 | $ | 9.6 | ||||||||
| Change in Plan Assets |
||||||||||||||||
| Fair value of plan assets at beginning of year |
$ | 163.7 | $ | 189.4 | $ | — | $ | — | ||||||||
| Change in measurement date |
— | (3.1 | ) | — | — | |||||||||||
| Actual return on assets |
16.4 | (9.3 | ) | — | — | |||||||||||
| Employer contributions |
5.1 | .1 | 1.1 | 2.0 | ||||||||||||
| Benefits and expenses paid net of retiree contributions |
(14.1 | ) | (13.4 | ) | (1.1 | ) | (2.0 | ) | ||||||||
| Fair Value of Plan Assets at End of Year |
$ | 171.1 | $ | 163.7 | $ | — | $ | — | ||||||||
| Funded Status at November 30 |
$ | (73.0 | ) | $ | (65.5 | ) | $ | (8.7 | ) | $ | (9.6 | ) | ||||
| Amounts Recognized in the Consolidated Balance Sheets |
||||||||||||||||
| Current liability |
$ | (.1 | ) | $ | (.1 | ) | $ | (1.0 | ) | $ | (1.2 | ) | ||||
| Non-current liability |
(72.9 | ) | (65.4 | ) | (7.7 | ) | (8.4 | ) | ||||||||
| Net Amount Recognized |
$ | (73.0 | ) | $ | (65.5 | ) | $ | (8.7 | ) | $ | (9.6 | ) | ||||
As of November 30, 2010 and 2009, the amounts included in Accumulated Other Comprehensive Loss that have not yet been recognized in net periodic benefit cost consist of:
| Pension Plans | Health Care Plans | |||||||||||||||
| 2010 | 2009 | 2010 | 2009 | |||||||||||||
| (Dollars in millions) | ||||||||||||||||
| Net actuarial (loss) gain |
$ | (107.8 | ) | $ | (101.6 | ) | $ | 21.6 | $ | 24.3 | ||||||
| Prior service (costs) credit |
$ | (.2 | ) | $ | (2.1 | ) | $ | 1.2 | $ | 1.5 | ||||||
64
Table of Contents
NOTES TO THE CONSOLIDATED FINANCIAL STATEMENTS—Continued
Note L—Employee Benefit Plans (Continued)
Net Periodic Benefit Cost
| Pension Plans | Health Care Plans | |||||||||||||||||||||||
| 2010 | 2009 | 2008 | 2010 | 2009 | 2008 | |||||||||||||||||||
| (Dollars in millions) | ||||||||||||||||||||||||
| Net Periodic Benefit Cost |
||||||||||||||||||||||||
| Service costs for benefits earned |
$ | 1.6 | $ | 2.8 | $ | 4.2 | $ | .1 | $ | .1 | $ | .1 | ||||||||||||
| Interest costs on benefit obligation |
13.4 | 14.2 | 13.4 | .5 | .7 | .8 | ||||||||||||||||||
| Amortization of prior service costs |
.6 | .7 | .7 | (.3 | ) | (.3 | ) | (.3 | ) | |||||||||||||||
| Assumed return on plan assets |
(15.6 | ) | (15.7 | ) | (15.9 | ) | — | — | — | |||||||||||||||
| Amortization of net loss (gain) |
4.0 | 1.6 | 2.6 | (2.3 | ) | (2.4 | ) | (2.5 | ) | |||||||||||||||
| Curtailment loss (gain) |
4.2 | (.8 | ) | — | (.8 | ) | — | — | ||||||||||||||||
| Total |
$ | 8.2 | $ | 2.8 | $ | 5.0 | $ | (2.8 | ) | $ | (1.9 | ) | $ | (1.9 | ) | |||||||||
| Pension Plans | Health Care Plans | |||||||||||||||||||||||
| 2010 | 2009 | 2008 | 2010 | 2009 | 2008 | |||||||||||||||||||
| (Dollars in millions) | ||||||||||||||||||||||||
| Other Changes in Plan Assets and Benefit Obligations Recognized in Other Comprehensive (Loss) Income |
$ | (10.3 | ) | $ | (50.9 | ) | $ | (18.5 | ) | $ | (.4 | ) | $ | .5 | $ | 1.4 | ||||||||
| Prior service credit |
— | (.8 | ) | — | — | — | — | |||||||||||||||||
| Total recognized in other comprehensive (loss) income |
(10.3 | ) | (51.7 | ) | (18.5 | ) | (.4 | ) | .5 | 1.4 | ||||||||||||||
| Change in measurement date |
— | .4 | — | — | (.6 | ) | — | |||||||||||||||||
| Amortization of net loss |
4.1 | 1.6 | 2.7 | (2.3 | ) | (2.4 | ) | (2.5 | ) | |||||||||||||||
| Amortization prior service cost |
1.9 | .7 | .6 | (.3 | ) | (.3 | ) | (.2 | ) | |||||||||||||||
| Total recognized in net periodic benefit cost and other comprehensive (loss) income |
$ | (4.3 | ) | $ | (49.0 | ) | $ | (15.2 | ) | $ | (3.0 | ) | $ | (2.8 | ) | $ | (1.3 | ) | ||||||
The estimated net loss and prior service cost for defined benefit pension plans that will be amortized from Accumulated Other Comprehensive Loss during 2011 are $2.4 million and $0.1 million, respectively. The estimated net gain and prior service cost for retiree medical plans that will be amortized from Accumulated Other Comprehensive Loss during 2011 are $1.9 million and $0.3 million, respectively.
During the second quarter of 2010, with an effective date of May 1, 2010 for its Calhoun, Georgia union-represented employees, the Company suspended the accrual of future service benefits under its Consolidated Pension Plan. As a result, during 2010, the Company recognized a curtailment loss of $0.1 million. During the second quarter of 2009, with an effective date of June 1, 2009 for salaried employees and August 1, 2009 for its Mogadore, Ohio union-represented employees, the Company suspended the accrual of future service benefits under its Consolidated Pension Plan.
In addition, due to the ongoing strike of its Decorative Products’ Columbus, Mississippi union-represented employees, the Company recognized a curtailment loss of $4.1 million in the fourth quarter of 2010 as future service benefits for affected employees were suspended per the terms of the expired labor contract. The Company also recognized a curtailment benefit of $0.8 million in its health care plan related to the Columbus, Mississippi union-represented employees.
All benefits earned by affected employees through the effective dates have become fully vested with the affected employees eligible to receive benefits upon retirement, as described in the Plan document. In 2009 the Company recognized a net curtailment gain of $0.8 million.
65
Table of Contents
NOTES TO THE CONSOLIDATED FINANCIAL STATEMENTS—Continued
Note L—Employee Benefit Plans (Continued)
The accumulated benefit obligation for the Company’s defined benefit pension plan was $240.4 million and $225.8 million at November 30, 2010 and 2009, respectively.
| Pension Plans | Health Care Plans | |||||||||||||||||||||||
| 2010 | 2009 | 2008 | 2010 | 2009 | 2008 | |||||||||||||||||||
| Weighted Average Assumptions |
||||||||||||||||||||||||
| Discount rate used for liability determination |
5.83 | % | 6.05 | % | 7.36 | % | 4.90 | % | 6.05 | % | 7.36 | % | ||||||||||||
| Discount rate used for expense determination |
6.05 | % | 7.27 | % | 6.55 | % | 6.05 | % | 7.36 | % | 6.55 | % | ||||||||||||
| Current trend rate for health care costs |
N/A | N/A | N/A | 8.2 | % | 8.4 | % | 10.0 | % | |||||||||||||||
| Ultimate trend rate for health care costs |
N/A | N/A | N/A | 4.5 | % | 4.5 | % | 5.0 | % | |||||||||||||||
| Year reached |
N/A | N/A | N/A | 2028 | 2028 | 2018 | ||||||||||||||||||
| Measurement date |
11/30 | 11/30 | 8/31 | 11/30 | 11/30 | 8/31 | ||||||||||||||||||
| Assumed long-term rate of return on plan assets |
8.0 | % | 8.0 | % | 8.0 | % | N/A | N/A | N/A | |||||||||||||||
| Annual rates of salary increase |
N/A | 4.0 | % | 4.0 | % | N/A | N/A | N/A | ||||||||||||||||
The discount rate reflects the current rate at which the pension liabilities could be effectively settled at the end of the year. The discount rate used considers rates of return on high-quality, fixed-income investments that receive one of the two highest ratings given by a recognized investment ratings agency. The decrease in the discount rate in 2010 and 2009 is due to lower yields for these types of investments.
The assumed long-term rate of return on plan assets assumption is based on the weighted average expected return of the various asset classes in the plans’ portfolio. The asset class return is developed using historical asset return performance as well as current market conditions such as inflation, interest rates and equity market performance.
The Company employs a total return on investments approach for its defined benefit pension plan assets. A mix of equity securities, fixed income securities and alternative investments are used to maximize the long-term rate of return on assets for the level of risk. Asset allocation at November 30, 2010, target allocation for 2010 and expected long-term rate of return by asset category are as follows:
| Asset Category |
Target Allocation 2010 |
Percentage of Plan Assets At November 30, |
Weighted- Average Expected Long-Term Rate Of Return |
|||||||||||||
| 2010 | 2009 | |||||||||||||||
| Equity securities |
50 | % | 51 | % | 48 | % | 4.7 | % | ||||||||
| Fixed income securities |
23 | % | 22 | % | 23 | % | 1.0 | % | ||||||||
| Real estate partnerships |
5 | % | 4 | % | 6 | % | .3 | % | ||||||||
| Other |
22 | % | 23 | % | 23 | % | 2.0 | % | ||||||||
| Total |
100 | % | 100 | % | 100 | % | 8.0 | % | ||||||||
Included in Other are short-term money funds and hedge funds.
66
Table of Contents
NOTES TO THE CONSOLIDATED FINANCIAL STATEMENTS—Continued
Note L—Employee Benefit Plans (Continued)
The following financial assets were measured at fair value on a recurring basis during 2010:
| Total | Level 1 | Level 2 | Level 3 | |||||||||||||
| (Dollars in millions) | ||||||||||||||||
| Money market funds |
$ | .2 | $ | .2 | $ | — | $ | — | ||||||||
| Registered investment companies: |
||||||||||||||||
| Equity mutual funds |
87.0 | 87.0 | — | — | ||||||||||||
| Fixed income mutual funds |
38.4 | 38.4 | — | — | ||||||||||||
| Registered Investment companies |
125.4 | 125.4 | — | — | ||||||||||||
| Collective trust funds: |
||||||||||||||||
| Private investment funds |
18.3 | — | — | 18.3 | ||||||||||||
| Collateralized loan obligations |
20.1 | — | — | 20.1 | ||||||||||||
| Collective trust funds |
38.4 | — | — | 38.4 | ||||||||||||
| Real estate partnerships |
7.3 | — | — | 7.3 | ||||||||||||
| $ | 171.3 | $ | 125.6 | $ | — | $ | 45.7 | |||||||||
Money market funds are valued at a net asset value (NAV) of $1.00 per share held by the Plan at year end, which approximates fair value.
Registered investment companies are valued at quoted market prices representing the NAV of shares held by the Plan at year end.
The fair value of the participation units owned by the Plan in the collective trust funds are based on the NAV of participating units held by the Plan at year end.
Investments in real estate partnerships are valued at the fair value of the underlying assets based on comparable sales value for similar assets, discounted cash flow models, appraisals and other valuation techniques.
The preceding methods described may produce a fair value calculation that may not be indicative of net realizable value or reflective of future fair values. Furthermore, although the Plan believes its valuation methods are appropriate and consistent with other market participants, the use of different methodologies or assumptions to determine the fair value of certain financial instruments could result in a different fair value measurement at the reporting date.
A reconciliation of beginning and ending Level 3 measurements is as follows:
| Total | Collective Trusts |
Real Estate Partnerships |
||||||||||
| (Dollars in millions) | ||||||||||||
| Beginning balance, December 1, 2009 |
$ | 48.6 | $ | 39.3 | $ | 9.3 | ||||||
| Purchases (settlements) |
(6.3 | ) | (6.3 | ) | — | |||||||
| Total gains or losses included in funded status |
3.4 | 5.4 | (2.0 | ) | ||||||||
| Ending balance, November 30, 2010 |
$ | 45.7 | $ | 38.4 | $ | 7.3 | ||||||
The following table sets forth a summary of the Plan’s investments with a reported NAV as of November 30, 2010.
| Fair Value | ||||
| SEI Structured Credit Collective Fund(a) |
$ | 20.1 | ||
| SEI Opportunity Collective Fund(b) |
$ | 18.3 | ||
67
Table of Contents
NOTES TO THE CONSOLIDATED FINANCIAL STATEMENTS—Continued
Note L—Employee Benefit Plans (Continued)
| (a) | The SEI Structured Credit Collective Fund seeks to provide high general returns by investing in collateralized debt obligations (“CDO’s”) and other structured credit instruments. The SEI Structured Credit Collective Fund requires a two-year non-redemption period after which investments can be redeemed at any time, however a 90 day redemption notification period is required. The Plan has satisfied all funding obligations related to this investment. |
| (b) | The SEI Opportunity Collective Fund seeks to provide returns that are less correlated with investments in traditional asset classes and that provide a return that falls somewhere between stocks and bonds while incurring bond-like risk. Investment in the SEI Opportunity Collective Fund can be redeemed at any time, however a 90 day redemption notification period is required. The Plan has satisfied all funding obligations related to this investment. |
Defined Contribution Plans—The Company also sponsors a defined contribution 401(k) plan. Participation in this plan is available to substantially all salaried employees and to certain groups of hourly employees. Contributions to this plan are based on either a percentage of employee contributions or on a specified amount per hour based on the provisions of the applicable collective bargaining agreement. All Company contributions are made with Company stock. The Company suspended the Company match provisions of this plan for all salaried employees between November 7, 2008 and August 14, 2009. The non-cash cost of this plan for the Company was approximately $1.9 million in 2010 and $1.2 million in both 2009 and 2008. The defined contribution 401(k) plan contained approximately 1.9 million shares of the Company’s common stock at both November 30, 2010 and 2009.
The Company also contributes to a defined contribution plan for its U.K. employees. The Company contributes 4% to 8% of the employees’ wages depending upon the age of the employee. The cost of the plan for the Company was approximately $0.6 million in 2010, $0.6 million in 2009, and $0.8 million in 2008.
Statutory Severance Payment Obligation—The Company is required by Thailand labor law to pay statutory severance to employees who leave employment at their retirement age or are terminated by the Company without cause. Severance payments range from one month to ten months of the employee’s salary, based on service levels. Funding of this plan is not required. Payments are made when the employee is entitled to receive payment. The Company recognizes a liability for the benefit obligation based on actuarial assumptions in effect at the end of each year. The liability at November 30, 2010 and 2009 and amounts paid under this obligation during 2010 and 2009 were not significant. However, due to a reduction in workforce during 2009, the Company recognized a curtailment gain of $0.1 million during 2009.
Note M—Contingencies and Commitments
From time to time, the Company is subject to various claims, proceedings and lawsuits related to products, services, contracts, employment, environmental, safety, intellectual property and other matters arising. The ultimate resolution of such claims, proceedings, and lawsuits is inherently unpredictable and, as a result, the Company’s estimates of liability, if any, are subject to change. Actual results may materially differ from the Company’s estimates and an unfavorable resolution of any matter could have a material adverse effect on the financial condition, results of operations and/or cash flows of the Company. However, subject to the above and taking into account such amounts, if any, as are accrued from time to time on the Company’s balance sheet, the Company does not believe, based on the information currently available to it, that the ultimate resolution of these matters will have a material effect on the consolidated financial condition, results of operations or cash flows of the Company.
The Company leases certain facilities, machinery and equipment and office buildings under long-term, non-cancelable operating leases. The leases generally provide for renewal options ranging from 5 to 20 years and require the Company to pay for utilities, insurance, taxes and maintenance. Rent expense was $4.0 million in 2010, $4.0 million in 2009 and $4.7 million in 2008. Future minimum commitments at November 30, 2010 for non-cancelable operating leases were $19.3 million with annual amounts of $4.4 million in 2011, $3.7 million in 2012, $2.7 million in 2013, $2.2 million in 2014, $0.9 million in 2015 and $5.4 million for leases after 2015.
68
Table of Contents
NOTES TO THE CONSOLIDATED FINANCIAL STATEMENTS—Continued
Note N—Share-Based Compensation Plans
The OMNOVA Solutions Second Amended and Restated 1999 Equity and Performance Incentive Plan (the “Plan”) permits the Company to grant to officers, key employees and non-employee directors of the Company, incentives directly linked to the price of OMNOVA Solutions’ common stock. The Plan authorizes up to 6.6 million shares of Company stock for awards of options to purchase shares of OMNOVA Solutions’ common stock, performance stock and performance units, restricted stock, deferred stock or appreciation rights. Shares used may be either newly issued shares or treasury shares or both. All options granted under the Plan have been granted at exercise prices equal to the market value of the Company’s common stock on the date of grant. Additionally, the Plan provides that the term of any stock option granted under the Plan may not exceed 10 years. The second amendment to the Plan, which was approved by shareholders on March 22, 2007, also added a fungible share design, changed share counting provisions and dividend rights, added additional metrics to management objectives and other administrative changes. As of November 30, 2010, approximately .7 million shares of Company common stock remained available for grants under the Plan.
Share-based compensation is measured at the grant date, based on the calculated fair value of the award, and is recognized as an expense over the requisite service period (generally the vesting period).
For stock options, the fair value calculation is estimated using a Black-Scholes based option valuation model. For restricted stock grants, which consist of the Company’s common stock, the fair value is equal to the market price of the Company’s stock on the date of grant. Estimates of fair value are not intended to predict actual future events or the value ultimately realized by employees who receive equity awards, and subsequent events are not indicative of the reasonableness of the original estimates of fair value made by the Company.
A summary of the Company’s stock option activity and related information for the years ended 2010, 2009 and 2008 is as follows:
| 2010 | 2009 | 2008 | ||||||||||||||||||||||
| Shares | Weighted Average Exercise Price |
Shares | Weighted Average Exercise Price |
Shares | Weighted Average Exercise Price |
|||||||||||||||||||
| Outstanding at beginning of year |
2,614,461 | $ | 6.32 | 3,339,611 | $ | 6.72 | 3,825,332 | $ | 7.57 | |||||||||||||||
| Granted |
— | $ | — | 1,000 | $ | 1.25 | — | $ | — | |||||||||||||||
| Forfeited or expired |
(598,160 | ) | $ | 7.40 | (683,975 | ) | $ | 8.30 | (485,721 | ) | $ | 13.42 | ||||||||||||
| Exercised |
(47,409 | ) | $ | 6.02 | (42,175 | ) | $ | 5.67 | — | $ | — | |||||||||||||
| Outstanding at end of year |
1,968,892 | $ | 6.00 | 2,614,461 | $ | 6.32 | 3,339,611 | $ | 6.72 | |||||||||||||||
The weighted average grant date fair value of options granted was $0.76 during 2009.
69
Table of Contents
NOTES TO THE CONSOLIDATED FINANCIAL STATEMENTS—Continued
Note N—Share-Based Compensation Plans (Continued)
The following table summarizes the range of exercise prices and weighted average exercise prices for options outstanding and exercisable at November 30, 2010 under the Company’s stock option plans:
| Outstanding Options | Exercisable Options | |||||||||||||||||||
| Number | Weighted Average Exercise Price |
Weighted Average Remaining Contractual Life (yrs) |
Number | Weighted Average Exercise Price |
||||||||||||||||
| $0.00 — $4.99 |
636,125 | $ | 4.14 | 2.1 | 635,625 | $ | 4.14 | |||||||||||||
| $5.00 — $5.99 |
428,425 | $ | 5.18 | .6 | 428,425 | $ | 5.18 | |||||||||||||
| $6.00 — $6.99 |
270,791 | $ | 6.51 | .3 | 270,791 | $ | 6.51 | |||||||||||||
| $7.00 — $8.99 |
633,551 | $ | 8.20 | 1.3 | 633,551 | $ | 8.20 | |||||||||||||
| Total |
1,968,892 | $ | 6.00 | 1.3 | 1,968,392 | $ | 6.00 | |||||||||||||
There were 2,613,461 and 3,337,861 stock options exercisable with weighted average prices of $6.32 and $6.72 at November 30, 2009 and 2008, respectively.
A summary of the Company’s restricted stock activity and related information for the years ended November 30, 2010, 2009 and 2008 is as follows:
| 2010 | 2009 | 2008 | ||||||||||||||||||||||
| Shares | Weighted Average Grant Date Fair Value |
Shares | Weighted Average Grant Date Fair Value |
Shares | Weighted Average Grant Date Fair Value |
|||||||||||||||||||
| Non-vested |
1,394,570 | $ | 3.45 | 1,079,524 | $ | 4.43 | 576,024 | $ | 5.84 | |||||||||||||||
| Granted |
232,900 | $ | 7.55 | 610,550 | $ | 2.68 | 559,250 | $ | 3.02 | |||||||||||||||
| Vested |
(262,270 | ) | $ | 6.14 | (264,904 | ) | $ | 5.55 | (6,000 | ) | $ | 5.74 | ||||||||||||
| Forfeited |
(31,550 | ) | $ | 2.96 | (30,600 | ) | $ | 4.28 | (49,750 | ) | $ | 4.87 | ||||||||||||
| Non-vested at end of year |
1,333,650 | $ | 3.65 | 1,394,570 | $ | 3.45 | 1,079,524 | $ | 4.43 | |||||||||||||||
Compensation expense for all share-based payments, included in general and administrative expense, was $1.6 million, $1.6 million and $1.2 million during 2010, 2009 and 2008, respectively.
As of November 30, 2010, there was $2.6 million of total unrecognized compensation expense related to non-vested share-based compensation arrangements to be amortized over the next 2 years.
The intrinsic value of stock options exercised during 2010 and 2009 was $0.3 million and $0.1 million, respectively. No stock options were exercised during 2008. The intrinsic value of stock options that were outstanding as of November 30, 2010 and 2009 was $5.5 million and $2.3 million, respectively.
Cash received from options exercised was $0.3 million in 2010 and $0.1 million during 2009.
Note O—Business Segment Information
The Company’s two operating segments were determined based on products and services provided. Accounting policies of the segments are the same as those described in the significant accounting policies.
70
Table of Contents
NOTES TO THE CONSOLIDATED FINANCIAL STATEMENTS—Continued
Note O—Business Segment Information (Continued)
The Company’s two operating segments are: Performance Chemicals and Decorative Products. The Company’s operating segments are strategic business units that offer different products and services. They are managed separately based on fundamental differences in their operations.
Effective March 2009, the Company realigned product lines in its Decorative Products segment to integrate cross-functional business team structures. The Contract Interiors and Coated Fabric lines were combined into the Commercial Wallcovering and Coated Fabrics product line and Performance Film products were moved from Coated Fabrics and combined with Laminates into the Laminates and Performance Films product line. All prior period amounts have been reclassified to conform to current year presentation.
The Performance Chemicals segment produces a broad range of emulsion polymers and specialty chemicals based primarily on styrene butadiene, styrene butadiene acrylonitrile, styrene butadiene vinyl pyridine, polyvinyl acetate, acrylic, styrene acrylic, vinyl acrylic, glyoxal, fluorochemical and hollow plastic pigment chemistries. Performance Chemicals’ custom-formulated products are tailored for coatings, binders and adhesives, which are used in paper, carpet, nonwovens, construction, oil/gas drilling services, adhesives, tape, tire cord, floor polish, textiles, graphic arts, plastic parts, bio-based polymers and various other applications. Its products provide a variety of functional properties to enhance the Company’s customers’ products, including greater strength, adhesion, dimensional stability, water resistance, flow and leveling, improved processibility and enhanced appearance.
The Performance Chemicals segment consists of two product lines. The Paper and Carpet Chemicals product line encompasses products that have applications in the paper and carpet industries. Paper coatings are used in magazines, catalogs, direct mail advertising, brochures, printed reports, food cartons, household and other consumer and industrial packaging. Carpet binders are used to secure carpet fibers to carpet backing and meet the stringent manufacturing, environmental, odor, flammability and flexible installation requirements. The Specialty Chemicals product line encompasses products that have applications for nonwovens (such as hygiene products, engine filters, roofing mat, scrub pads, towels and wipes), floor polish, tape, adhesives, tire cord, textiles, construction, oil/gas drilling services, plastic part coatings and ink coating additives.
The Decorative Products segment develops, designs, produces and markets a broad line of decorative and functional surfacing products, including commercial wallcoverings, coated fabrics, vinyl, paper and specialty laminates and industrial films. These products are used in numerous applications, including commercial building refurbishment, remodeling and new construction, residential cabinets, flooring and furnishings, transportation markets including school busses, marine and automotive, health care, manufactured housing and a variety of performance films applications.
The Decorative Products segment consists of two product lines. The Commercial Wallcovering and Coated Fabrics product line includes wallcovering and upholstery used in refurbishment and new construction applications for the commercial office, hospitality, health care, retail, education and restaurant markets, marine and transportation seating, commercial and residential furniture and automotive soft top. The Laminates and Performance Films product line applications include kitchen and bath cabinets, manufactured housing and recreational vehicle interiors, flooring, commercial and residential furniture, retail display fixtures, home furnishings, consumer electronics and a variety of industrial film applications.
The Company’s operations are located primarily in the United States, United Kingdom, China and Thailand. There was one customer that accounted for approximately 12% of the Company’s consolidated net sales.
Segment operating profit represents net sales less applicable costs, expenses and provisions for restructuring and severance costs, asset write-offs and work stoppage costs relating to operations. However, management excludes
71
Table of Contents
NOTES TO THE CONSOLIDATED FINANCIAL STATEMENTS—Continued
Note O—Business Segment Information (Continued)
restructuring and severance costs, asset write-offs and work stoppage costs when evaluating the results and allocating resources to the segments.
Segment operating profit excludes unallocated corporate headquarters expenses, provisions for corporate headquarters restructuring and severance, interest expense and income taxes. Corporate headquarters expense includes the cost of providing and maintaining the corporate headquarters functions, including salaries, rent, travel and entertainment expenses, depreciation, utility costs, outside services and amortization of deferred financing costs.
In 2010, segment operating profit for the Performance Chemicals segment includes a $9.7 million gain on the termination of the RohmNova joint marketing alliance, restructuring and severance charges of $0.4 million and a net retirement benefit plan curtailment charge of $0.1 million. The Decorative Products segment operating loss includes asset impairment charges of $6.2 million, strike-related costs of $5.5 million, net retirement benefit plan curtailment charges of $3.2 million, a legal settlement of $0.3 million, a customs duty settlement of $0.3 million, a reversal of an indemnification receivable of $0.3 million and restructuring and severance charges of $0.2 million. Performance Chemicals’ 2009 operating profit includes asset write-offs of $0.6 million, a net retirement benefit plan charge of $0.2 million and restructuring and severance charges of $0.2 million. Decorative Products’ 2009 operating profit includes restructuring and severance charges of $1.8 million, $0.6 million of clean-up and repair costs related to a flood, asset write-offs of $0.5 million, a reversal of an indemnification receivable of $0.3 million and a net retirement benefit plan curtailment gain of $0.7 million.
The following table sets forth a summary of operations by segment and a reconciliation of segment sales to consolidated sales and segment operating profit (loss) to consolidated income (loss) from continuing operations before income taxes.
| 2010 | 2009 | 2008 | ||||||||||
| (Dollars in millions) | ||||||||||||
| Net Sales |
||||||||||||
| Performance Chemicals |
||||||||||||
| Paper and Carpet Chemicals |
$ | 330.1 | $ | 249.2 | $ | 337.0 | ||||||
| Specialty Chemicals |
197.8 | 147.6 | 184.6 | |||||||||
| Total Performance Chemicals |
$ | 527.9 | $ | 396.8 | $ | 521.6 | ||||||
| Decorative Products |
||||||||||||
| Commercial Wallcovering and Coated Fabrics |
$ | 219.9 | $ | 217.7 | $ | 252.2 | ||||||
| Laminates and Performance Films |
98.4 | 81.9 | 95.6 | |||||||||
| Total Decorative Products |
$ | 318.3 | $ | 299.6 | $ | 347.8 | ||||||
| Total Net Sales |
$ | 846.2 | $ | 696.4 | $ | 869.4 | ||||||
| Segment Operating Profit (Loss) |
||||||||||||
| Performance Chemicals |
$ | 73.3 | $ | 48.0 | $ | 25.2 | ||||||
| Decorative Products |
(18.0 | ) | 1.6 | (6.5 | ) | |||||||
| Total segment operating profit |
55.3 | 49.6 | 18.7 | |||||||||
| Interest expense |
(8.7 | ) | (8.1 | ) | (13.0 | ) | ||||||
| Corporate expenses(a) |
(28.1 | ) | (13.6 | ) | (7.7 | ) | ||||||
| Income (Loss) Before Income Taxes |
$ | 18.5 | $ | 27.9 | $ | (2.0 | ) | |||||
| (a) | Included in corporate expenses for 2010 are a fair value adjustment of $9.2 million related to a Euro currency option collar which the Company put in place to hedge currency risk for the Eliokem acquisition and $5.5 million of acquisition and integration costs. |
72
Table of Contents
NOTES TO THE CONSOLIDATED FINANCIAL STATEMENTS—Continued
Note O—Business Segment Information (Continued)
| 2010 | 2009 | 2008 | ||||||||||
| (Dollars in millions) | ||||||||||||
| Total Assets |
||||||||||||
| Performance Chemicals |
$ | 138.1 | $ | 136.9 | $ | 148.3 | ||||||
| Decorative Products |
175.7 | 179.8 | 191.2 | |||||||||
| Corporate |
412.2 | 21.3 | 12.1 | |||||||||
| $ | 726.0 | $ | 338.0 | $ | 351.6 | |||||||
| Capital Expenditures |
||||||||||||
| Performance Chemicals |
$ | 8.2 | $ | 5.3 | $ | 7.5 | ||||||
| Decorative Products |
5.1 | 4.7 | 5.9 | |||||||||
| Corporate |
1.5 | .4 | 1.4 | |||||||||
| $ | 14.8 | $ | 10.4 | $ | 14.8 | |||||||
| Depreciation and Amortization |
||||||||||||
| Performance Chemicals |
$ | 9.3 | $ | 9.9 | $ | 11.0 | ||||||
| Decorative Products |
11.0 | 12.7 | 12.5 | |||||||||
| Corporate |
.3 | .3 | .4 | |||||||||
| $ | 20.6 | $ | 22.9 | $ | 23.9 | |||||||
GEOGRAPHIC INFORMATION
| 2010 | 2009 | 2008 | ||||||||||
| (Dollars in millions) | ||||||||||||
| Net Sales |
||||||||||||
| United States |
$ | 626.3 | $ | 495.5 | $ | 661.6 | ||||||
| United States export sales |
26.2 | 26.7 | 26.3 | |||||||||
| Europe |
71.9 | 64.2 | 79.9 | |||||||||
| Asia |
121.8 | 110.0 | 101.6 | |||||||||
| $ | 846.2 | $ | 696.4 | $ | 869.4 | |||||||
| Segment Operating Profit |
||||||||||||
| United States |
$ | 50.3 | $ | 39.2 | $ | 18.1 | ||||||
| Europe |
1.5 | 4.7 | 4.4 | |||||||||
| Asia |
3.5 | 5.7 | (3.8 | ) | ||||||||
| $ | 55.3 | $ | 49.6 | $ | 18.7 | |||||||
| Total Assets |
||||||||||||
| United States |
$ | 597.3 | $ | 207.5 | $ | 230.8 | ||||||
| Europe |
39.3 | 50.6 | 44.0 | |||||||||
| Asia |
89.4 | 79.9 | 76.8 | |||||||||
| $ | 726.0 | $ | 338.0 | $ | 351.6 | |||||||
| Long-Lived Assets |
||||||||||||
| United States |
$ | 98.0 | $ | 104.9 | $ | 116.3 | ||||||
| Europe |
11.5 | 12.8 | 12.5 | |||||||||
| Asia |
27.8 | 28.6 | 30.4 | |||||||||
| $ | 137.3 | $ | 146.3 | $ | 159.2 | |||||||
73
Table of Contents
NOTES TO THE CONSOLIDATED FINANCIAL STATEMENTS—Continued
Note P—Financial Instruments and Fair Value Measurements
Financial Risk Management Objectives and Policies
The Company is exposed primarily to credit, interest rate and currency exchange rate risks which arise in the normal course of business.
Credit Risk
Credit risk is the potential financial loss resulting from the failure of a customer or counterparty to settle its financial and contractual obligations to the Company, as and when they fall due. The primary credit risk for the Company is its receivable accounts. The Company has established credit limits for customers and monitors their balances to mitigate its risk of loss. At November 30, 2010 and 2009, there were no significant concentrations of credit risk. There was one customer who represented approximately 10.5% of the Company’s net trade receivables at November 30, 2009. The maximum exposure to credit risk is primarily represented by the carrying amount of the Company’s accounts receivable.
Foreign Currency Risk
The Company incurs foreign currency risk on sales and purchases denominated in other currencies than the functional currency. The currencies giving rise to this risk are primarily the GB Pound Sterling, the Euro, Thai Baht and Chinese Yuan. Foreign currency exchange contracts are used by the Company’s Thailand subsidiary to manage risks from the change in exchange rate of the Thai Baht on sales made in U.S. dollars. These forward contracts are used on a continuing basis for periods of less than one year, consistent with the underlying hedged transactions. The hedging minimizes the impact of foreign exchange rate movements on the Company’s operating results. The notional amount of outstanding foreign exchange contracts, translated at current rates, was $4.1 million as of November 30, 2010. As of November 30, 2010, the fair value of forward contracts was $0.1 million and was recorded as other current assets.
In connection with the Company’s acquisition of Eliokem International SAS, which was consummated on December 9, 2010, the Company entered into a zero cost forward currency collar (“Currency Collar”) in October 2010 to hedge changes in exchange rate movements of the Euro to the U.S. dollar. Due to changes in the exchange rate for the Euro, the fair value of the Currency Collar as of November 30, 2010 was a liability of $9.2 million. The Company recognized the fair value of this Currency Collar as a current liability with an offsetting expense included in other expense (income). The Company settled this Currency Collar with the counter-party on December 1, 2010 for $9.2 million.
Fair Value Measurements
The following financial assets and liabilities were measured at fair value on a recurring basis during 2010:
| Fair Value | Level 1 | Level 2 | Level 3 | |||||||||||||
| (Dollars in millions) | ||||||||||||||||
| Financial Assets |
||||||||||||||||
| Foreign currency exchange contracts |
$ | .1 | $ | — | $ | .1 | $ | — | ||||||||
| Total assets |
$ | .1 | $ | — | $ | .1 | $ | — | ||||||||
| Financial Liabilities |
||||||||||||||||
| Foreign Currency Collar |
$ | 9.2 | $ | 9.2 | $ | — | $ | — | ||||||||
| Total liabilities |
$ | 9.2 | $ | 9.2 | $ | — | $ | — | ||||||||
Assets and liabilities that are within the provisions of Accounting Standards Codification 820 are recorded at fair value using market and income valuation approaches and considering the Company’s and counterparty’s credit risk. The
74
Table of Contents
NOTES TO THE CONSOLIDATED FINANCIAL STATEMENTS—Continued
Note P—Financial Instruments and Fair Value Measurements (Continued)
Company uses the market approach and the income approach to value assets and liabilities as appropriate. The Company’s foreign currency exchange contracts are not exchange traded instruments, however, they are valued based on observable inputs for similar assets or liabilities and accordingly are classified as level 2 inputs.
Note Q—Separate Financial Information of Subsidiary Guarantors of Indebtedness
The $250 million Senior Notes are jointly, severally and unconditionally guaranteed on a senior unsecured basis by all of OMNOVA Solution Inc.’s existing and future domestic subsidiaries that from time to time guarantee obligations under the Company’s Senior Notes with certain exceptions (the “Guarantors”). Presented below are the condensed financial statements of OMNOVA Solutions (Parent) as borrower, its combined Guarantor subsidiaries and its combined Non-Guarantor subsidiaries.
Condensed Consolidating Statements of Operations For the Year Ended November 30, 2010
| OMNOVA Solutions (Parent) |
Guarantor Subsidiaries |
Non- Guarantor Subsidiaries |
Eliminations | Total | ||||||||||||||||
| (Dollars in millions) | ||||||||||||||||||||
| Net Sales |
$ | 670.1 | $ | — | $ | 193.7 | $ | (17.6 | ) | $ | 846.2 | |||||||||
| Cost of products sold |
546.2 | — | 155.8 | (17.2 | ) | 684.8 | ||||||||||||||
| Gross profit |
123.9 | — | 37.9 | (.4 | ) | 161.4 | ||||||||||||||
| Selling, general and administrative |
71.6 | .8 | 27.2 | — | 99.6 | |||||||||||||||
| Depreciation and amortization |
16.1 | — | 4.5 | — | 20.6 | |||||||||||||||
| Restructuring and severance |
.6 | — | — | — | .6 | |||||||||||||||
| Asset impairment |
6.2 | — | — | — | 6.2 | |||||||||||||||
| Interest expense |
8.5 | — | .2 | — | 8.7 | |||||||||||||||
| Acquisition and integration costs |
5.5 | — | — | — | 5.5 | |||||||||||||||
| Other (income) expense, net |
.7 | (1.7 | ) | 3.0 | (.3 | ) | 1.7 | |||||||||||||
| 109.2 | (.9 | ) | 34.9 | (.3 | ) | 142.9 | ||||||||||||||
| Income (loss) from continuing operations before income taxes |
14.7 | .9 | 3.0 | (.1 | ) | 18.5 | ||||||||||||||
| Income tax (benefit) expense |
(88.6 | ) | — | (.8 | ) | — | (89.4 | ) | ||||||||||||
| Net Income (Loss) |
$ | 103.3 | $ | .9 | $ | 3.8 | $ | (.1 | ) | $ | 107.9 | |||||||||
75
Table of Contents
NOTES TO THE CONSOLIDATED FINANCIAL STATEMENTS—Continued
Note Q—Separate Financial Information of Subsidiary Guarantors of Indebtedness (Continued)
Condensed Consolidating Statements of Operations For the Year Ended November 30, 2009
| OMNOVA Solutions (Parent) |
Guarantor Subsidiaries |
Non- Guarantor Subsidiaries |
Eliminations | Total | ||||||||||||||||
| (Dollars in millions) | ||||||||||||||||||||
| Net Sales |
$ | 534.0 | $ | — | $ | 174.1 | $ | (11.7 | ) | $ | 696.4 | |||||||||
| Cost of products sold |
415.5 | — | 133.1 | (11.9 | ) | 536.7 | ||||||||||||||
| Gross profit |
118.5 | — | 41.0 | .2 | 159.7 | |||||||||||||||
| Selling, general and administrative |
72.7 | 1.1 | 26.1 | — | 99.9 | |||||||||||||||
| Depreciation and amortization |
17.8 | — | 5.1 | — | 22.9 | |||||||||||||||
| Fixed asset impairment |
1.1 | — | — | — | 1.1 | |||||||||||||||
| Restructuring and severance |
1.0 | — | 1.1 | — | 2.1 | |||||||||||||||
| Interest expense |
7.8 | — | .3 | — | 8.1 | |||||||||||||||
| Other (income) expense, net |
(1.1 | ) | (2.1 | ) | 1.0 | (.1 | ) | (2.3 | ) | |||||||||||
| 99.3 | (1.0 | ) | 33.6 | (.1 | ) | 131.8 | ||||||||||||||
| Income from continuing operations before income taxes |
19.2 | 1.0 | 7.4 | .3 | 27.9 | |||||||||||||||
| Income tax expense |
.5 | — | 1.2 | — | 1.7 | |||||||||||||||
| Net Income |
$ | 18.7 | $ | 1.0 | $ | 6.2 | $ | .3 | $ | 26.2 | ||||||||||
Condensed Consolidating Statements of Operations For the Year Ended November 30, 2008
| OMNOVA Solutions (Parent) |
Guarantor Subsidiaries |
Non- Guarantor Subsidiaries |
Eliminations | Total | ||||||||||||||||
| (Dollars in millions) | ||||||||||||||||||||
| Net Sales |
$ | 704.8 | $ | — | $ | 181.5 | $ | (16.9 | ) | $ | 869.4 | |||||||||
| Cost of products sold |
602.7 | — | 145.4 | (16.7 | ) | 731.4 | ||||||||||||||
| Gross profit |
102.1 | — | 36.1 | (.2 | ) | 138.0 | ||||||||||||||
| Selling, general and administrative |
73.2 | .8 | 30.8 | — | 104.8 | |||||||||||||||
| Depreciation and amortization |
19.1 | — | 4.8 | — | 23.9 | |||||||||||||||
| Fixed asset impairment |
— | — | — | — | — | |||||||||||||||
| Restructuring and severance |
.5 | — | .1 | — | .6 | |||||||||||||||
| Equity earnings in affiliates |
— | — | (.2 | ) | — | (.2 | ) | |||||||||||||
| Interest expense |
12.7 | — | .3 | — | 13.0 | |||||||||||||||
| Other (income) expense, net |
(1.6 | ) | (3.0 | ) | 2.8 | (.3 | ) | (2.1 | ) | |||||||||||
| 103.9 | (2.2 | ) | 38.6 | (.3 | ) | 140.0 | ||||||||||||||
| Income (loss) from continuing operations before income taxes |
(1.8 | ) | 2.2 | (2.5 | ) | .1 | (2.0 | ) | ||||||||||||
| Income tax expense |
.2 | — | — | — | .2 | |||||||||||||||
| Net Income (Loss) |
$ | (2.0 | ) | $ | 2.2 | $ | (2.5 | ) | $ | .1 | $ | (2.2 | ) | |||||||
76
Table of Contents
NOTES TO THE CONSOLIDATED FINANCIAL STATEMENTS—Continued
Note Q—Separate Financial Information of Subsidiary Guarantors of Indebtedness (Continued)
Condensed Consolidating Statements of Financial Position November 30, 2010
| OMNOVA Solutions (Parent) |
Guarantor Subsidiaries |
Non- Guarantor Subsidiaries |
Eliminations | Total | ||||||||||||||||
| (Dollars in millions) | ||||||||||||||||||||
| ASSETS: |
||||||||||||||||||||
| Current Assets |
||||||||||||||||||||
| Cash and cash equivalents |
$ | 49.6 | $ | — | $ | 26.0 | $ | — | $ | 75.6 | ||||||||||
| Restricted cash |
253.1 | — | — | — | 253.1 | |||||||||||||||
| Accounts receivable, net |
66.0 | — | 40.9 | (.1 | ) | 106.8 | ||||||||||||||
| Inventories |
26.4 | — | 19.9 | (.5 | ) | 45.8 | ||||||||||||||
| Deferred income taxes |
6.0 | — | — | — | 6.0 | |||||||||||||||
| Prepaid expenses and other |
1.3 | — | 2.2 | — | 3.5 | |||||||||||||||
| Total Current Assets |
402.4 | — | 89.0 | (.6 | ) | 490.8 | ||||||||||||||
| Property, plant and equipment, net |
94.7 | — | 36.8 | — | 131.5 | |||||||||||||||
| Trademarks and other intangible assets, net |
3.3 | — | 2.5 | — | 5.8 | |||||||||||||||
| Deferred income taxes |
85.9 | — | .6 | (.3 | ) | 86.2 | ||||||||||||||
| Investments in subsidiaries |
— | 64.9 | — | (64.9 | ) | — | ||||||||||||||
| Other assets |
148.2 | — | 1.2 | (137.7 | ) | 11.7 | ||||||||||||||
| Total Assets |
$ | 734.5 | $ | 64.9 | $ | 130.1 | $ | (203.5 | ) | $ | 726.0 | |||||||||
| LIABILITIES AND SHAREHOLDERS’ EQUITY: |
||||||||||||||||||||
| Current Liabilities |
||||||||||||||||||||
| Amounts due to banks |
$ | 1.5 | $ | — | $ | 3.3 | $ | — | $ | 4.8 | ||||||||||
| Accounts payable |
59.1 | — | 29.6 | (.1 | ) | 88.6 | ||||||||||||||
| Accrued payroll and personal property taxes |
14.7 | — | 2.6 | — | 17.3 | |||||||||||||||
| Employee benefit obligations |
2.4 | — | — | — | 2.4 | |||||||||||||||
| Deferred income taxes |
— | — | — | — | — | |||||||||||||||
| Other current liabilities |
9.6 | .6 | .2 | (.6 | ) | 9.8 | ||||||||||||||
| Total Current Liabilities |
87.3 | .6 | 35.7 | (.7 | ) | 122.9 | ||||||||||||||
| Long-term debt |
389.4 | — | — | — | 389.4 | |||||||||||||||
| Postretirement benefits other than pensions |
7.6 | — | — | — | 7.6 | |||||||||||||||
| Pension liabilities |
72.8 | — | .5 | — | 73.3 | |||||||||||||||
| Deferred income taxes |
— | — | 2.0 | (.3 | ) | 1.7 | ||||||||||||||
| Other liabilities |
7.1 | 97.1 | 39.1 | (135.6 | ) | 7.7 | ||||||||||||||
| Total Liabilities |
564.2 | 97.7 | 77.3 | (136.6 | ) | 602.6 | ||||||||||||||
| Shareholders’ Equity |
||||||||||||||||||||
| Common stock |
4.5 | — | — | — | 4.5 | |||||||||||||||
| Additional contributed capital |
9.7 | — | 75.9 | 232.4 | 318.0 | |||||||||||||||
| Retained earnings (deficit) |
244.2 | (34.7 | ) | (23.9 | ) | (297.6 | ) | (112.0 | ) | |||||||||||
| Treasury stock |
(1.3 | ) | — | — | — | (1.3 | ) | |||||||||||||
| Accumulated other comprehensive loss |
(86.8 | ) | 1.9 | .8 | (1.7 | ) | (85.8 | ) | ||||||||||||
| Total Shareholders’ Equity |
170.3 | (32.8 | ) | 52.8 | (66.9 | ) | 123.4 | |||||||||||||
| Total Liabilities and Shareholders’ Equity |
$ | 734.5 | $ | 64.9 | $ | 130.1 | $ | (203.5 | ) | $ | 726.0 | |||||||||
77
Table of Contents
NOTES TO THE CONSOLIDATED FINANCIAL STATEMENTS—Continued
Note Q—Separate Financial Information of Subsidiary Guarantors of Indebtedness (Continued)
Condensed Consolidating Statements of Financial Position November 30, 2009
| OMNOVA Solutions |
Guarantor Subsidiaries |
Non- Guarantor Subsidiaries |
Eliminations | Total | ||||||||||||||||
| (Dollars in Millions) | ||||||||||||||||||||
| ASSETS: |
||||||||||||||||||||
| Current Assets |
||||||||||||||||||||
| Cash and cash equivalents |
$ | 11.7 | $ | — | $ | 29.8 | $ | — | $ | 41.5 | ||||||||||
| Accounts receivable, net |
65.4 | — | 40.5 | — | 105.9 | |||||||||||||||
| Inventories |
21.1 | — | 16.3 | .1 | 37.5 | |||||||||||||||
| Deferred income taxes |
— | — | — | — | — | |||||||||||||||
| Prepaid expenses and other |
1.2 | — | 1.2 | — | 2.4 | |||||||||||||||
| Total Current Assets |
99.4 | — | 87.8 | .1 | 187.3 | |||||||||||||||
| Property, plant and equipment, net |
103.2 | — | 38.7 | — | 141.9 | |||||||||||||||
| Trademarks and other intangible assets, net |
1.8 | — | 2.6 | — | 4.4 | |||||||||||||||
| Deferred income taxes |
8.1 | — | 1.5 | (8.4 | ) | 1.2 | ||||||||||||||
| Investments in subsidiaries |
— | 64.8 | — | (64.8 | ) | — | ||||||||||||||
| Other assets |
149.5 | — | 1.6 | (147.9 | ) | 3.2 | ||||||||||||||
| Total Assets |
$ | 362.0 | $ | 64.8 | $ | 132.2 | $ | (221.0 | ) | $ | 338.0 | |||||||||
| LIABILITIES AND SHAREHOLDERS’ EQUITY: |
||||||||||||||||||||
| Current Liabilities |
||||||||||||||||||||
| Amounts due to banks |
$ | 1.5 | $ | — | $ | 1.8 | $ | — | $ | 3.3 | ||||||||||
| Accounts payable |
37.7 | — | 26.7 | — | 64.4 | |||||||||||||||
| Accrued payroll and personal property taxes |
13.7 | — | 2.7 | — | 16.4 | |||||||||||||||
| Employee benefit obligations |
2.6 | — | — | — | 2.6 | |||||||||||||||
| Deferred income taxes |
.9 | — | — | — | .9 | |||||||||||||||
| Other current liabilities |
2.9 | .6 | 1.1 | (.6 | ) | 4.0 | ||||||||||||||
| Total Current Liabilities |
59.3 | .6 | 32.3 | (.6 | ) | 91.6 | ||||||||||||||
| Long-term debt |
140.8 | — | — | — | 140.8 | |||||||||||||||
| Postretirement benefits other than pensions |
8.4 | — | — | — | 8.4 | |||||||||||||||
| Pension liabilities |
65.4 | — | — | — | 65.4 | |||||||||||||||
| Deferred income taxes |
7.2 | — | 2.1 | (8.4 | ) | .9 | ||||||||||||||
| Other liabilities |
13.0 | 97.9 | 50.7 | (145.8 | ) | 15.8 | ||||||||||||||
| Total Liabilities |
294.1 | 98.5 | 85.1 | (154.8 | ) | 322.9 | ||||||||||||||
| Shareholders’ Equity |
||||||||||||||||||||
| Common stock |
4.4 | — | — | — | 4.4 | |||||||||||||||
| Additional contributed capital |
5.7 | — | 75.9 | 232.5 | 314.1 | |||||||||||||||
| Retained earnings (deficit) |
141.0 | (35.6 | ) | (27.7 | ) | (297.6 | ) | (219.9 | ) | |||||||||||
| Treasury stock |
(.4 | ) | — | — | — | (.4 | ) | |||||||||||||
| Accumulated other comprehensive loss |
(82.8 | ) | 1.9 | (1.1 | ) | (1.1 | ) | (83.1 | ) | |||||||||||
| Total Shareholders’ Equity |
67.9 | (33.7 | ) | 47.1 | (66.2 | ) | 15.1 | |||||||||||||
| Total Liabilities and Shareholders’ Equity |
$ | 362.0 | $ | 64.8 | $ | 132.2 | $ | (221.0 | ) | $ | 338.0 | |||||||||
78
Table of Contents
NOTES TO THE CONSOLIDATED FINANCIAL STATEMENTS—Continued
Note Q—Separate Financial Information of Subsidiary Guarantors of Indebtedness (Continued)
Condensed Consolidating Statements of Cash Flows Year Ended November 30, 2010
| OMNOVA Solutions (Parent) |
Guarantor Subsidiaries |
Non- Guarantor Subsidiaries |
Eliminations | Total | ||||||||||||||||
| (Dollars in Millions) | ||||||||||||||||||||
| Operating Activities |
||||||||||||||||||||
| Net income (loss) |
$ | 103.3 | $ | .9 | $ | 3.8 | $ | (.1 | ) | $ | 107.9 | |||||||||
| Adjustments to reconcile net income (loss) to net cash provided by (used in) operating activities: |
||||||||||||||||||||
| Fixed asset write-downs |
6.2 | — | — | — | 6.2 | |||||||||||||||
| Gain from dissolution of joint marketing alliance |
(9.7 | ) | — | — | — | (9.7 | ) | |||||||||||||
| Depreciation and amortization |
16.1 | — | 4.5 | — | 20.6 | |||||||||||||||
| Loss on disposal of fixed assets |
— | — | (.1 | ) | (.1 | ) | (.2 | ) | ||||||||||||
| Fair value adjustment for currency collar |
9.2 | — | — | — | 9.2 | |||||||||||||||
| Settlement of interest rate swap |
4.3 | — | — | — | 4.3 | |||||||||||||||
| Non-cash stock compensation expense |
3.5 | — | — | — | 3.5 | |||||||||||||||
| Provision for uncollectible accounts |
(.2 | ) | — | (.1 | ) | — | (.3 | ) | ||||||||||||
| Provision for obsolete inventory |
(.3 | ) | — | .1 | — | (.2 | ) | |||||||||||||
| Deferred income taxes |
(91.9 | ) | — | .7 | (1.1 | ) | (92.3 | ) | ||||||||||||
| Other |
.2 | — | .8 | — | 1.0 | |||||||||||||||
| Changes in operating assets and liabilities: |
||||||||||||||||||||
| Current assets |
(5.7 | ) | — | (4.2 | ) | .5 | (9.4 | ) | ||||||||||||
| Current liabilities |
6.2 | — | .6 | (.1 | ) | 6.7 | ||||||||||||||
| Other non-current assets |
(.1 | ) | — | .4 | .1 | .4 | ||||||||||||||
| Contribution to defined benefit plan |
(5.1 | ) | — | — | — | (5.1 | ) | |||||||||||||
| Other non-current liabilities |
16.0 | (.9 | ) | (8.0 | ) | (4.7 | ) | 2.4 | ||||||||||||
| Net Cash Provided By (Used In) Operating Activities |
52.0 | — | (1.5 | ) | (5.5 | ) | 45.0 | |||||||||||||
| Investing Activities |
||||||||||||||||||||
| Capital expenditures |
(13.0 | ) | — | (1.8 | ) | — | (14.8 | ) | ||||||||||||
| Acquisitions of intangible assets |
(2.5 | ) | — | — | — | (2.5 | ) | |||||||||||||
| Proceeds from dissolution of joint marketing alliance |
9.7 | — | — | — | 9.7 | |||||||||||||||
| Proceeds from insurance settlements |
.4 | — | — | — | .4 | |||||||||||||||
| Proceeds from asset disposals |
— | — | .5 | — | .5 | |||||||||||||||
| Restricted cash |
(253.1 | ) | — | — | — | (253.1 | ) | |||||||||||||
| Net Cash Used in Investing Activities |
(258.5 | ) | — | (1.3 | ) | — | (259.8 | ) | ||||||||||||
| Financing Activities |
||||||||||||||||||||
| Proceeds from borrowings |
662.1 | — | — | — | 662.1 | |||||||||||||||
| Repayment of debt obligations |
(413.6 | ) | — | — | — | (413.6 | ) | |||||||||||||
| Short-term debt (payments), net |
— | — | 1.5 | — | 1.5 | |||||||||||||||
| Other |
(.1 | ) | — | .1 | — | — | ||||||||||||||
| Net Cash Provided by Financing Activities |
248.4 | — | 1.6 | — | 250.0 | |||||||||||||||
| Effect of exchange rate changes on cash |
(4.0 | ) | — | (2.6 | ) | 5.5 | (1.1 | ) | ||||||||||||
| Net Increase (Decrease) in Cash and Cash Equivalents |
37.9 | — | (3.8 | ) | — | 34.1 | ||||||||||||||
| Cash and cash equivalents at beginning of period |
11.7 | — | 29.8 | — | 41.5 | |||||||||||||||
| Cash and Cash Equivalents at End of Period |
$ | 49.6 | $ | — | $ | 26.0 | $ | — | $ | 75.6 | ||||||||||
79
Table of Contents
NOTES TO THE CONSOLIDATED FINANCIAL STATEMENTS—Continued
Note Q—Separate Financial Information of Subsidiary Guarantors of Indebtedness (Continued)
Condensed Consolidating Statements of Cash Flows Year Ended November 30, 2009
| OMNOVA Solutions (Parent) |
Guarantor Subsidiaries |
Non- Guarantor Subsidiaries |
Eliminations | Total | ||||||||||||||||
| (Dollars in Millions) | ||||||||||||||||||||
| Operating Activities |
||||||||||||||||||||
| Net income (loss) |
$ | 18.7 | $ | 1.0 | $ | 6.2 | $ | .3 | $ | 26.2 | ||||||||||
| Adjustments to reconcile net income (loss) to net cash provided by (used in) operating activities: |
||||||||||||||||||||
| Depreciation and amortization |
17.8 | — | 5.1 | — | 22.9 | |||||||||||||||
| Loss (Gain) on disposal of fixed assets |
1.3 | — | — | (.3 | ) | 1.0 | ||||||||||||||
| Non-cash stock compensation expense |
2.3 | — | — | — | 2.3 | |||||||||||||||
| Provision for uncollectible accounts |
.7 | — | — | — | .7 | |||||||||||||||
| Provision for obsolete inventories |
(.3 | ) | — | 1.1 | — | .8 | ||||||||||||||
| Deferred income taxes |
— | — | (1.5 | ) | 1.3 | (.2 | ) | |||||||||||||
| Other |
.6 | — | (.6 | ) | — | — | ||||||||||||||
| Changes in operating assets and liabilities: |
||||||||||||||||||||
| Current assets |
20.5 | — | 3.0 | (.8 | ) | 22.7 | ||||||||||||||
| Current liabilities |
(1.0 | ) | (.2 | ) | .1 | .4 | (.7 | ) | ||||||||||||
| Other non-current assets |
.5 | — | 2.2 | (2.6 | ) | .1 | ||||||||||||||
| Other non-current liabilities |
(.9 | ) | (.8 | ) | 1.2 | (1.1 | ) | (1.6 | ) | |||||||||||
| Net Cash Provided By (Used In) Operating Activities |
60.2 | — | 16.8 | (2.8 | ) | 74.2 | ||||||||||||||
| Investing Activities |
||||||||||||||||||||
| Capital expenditures |
(8.5 | ) | — | (1.9 | ) | — | (10.4 | ) | ||||||||||||
| Proceeds from insurance settlements |
.8 | — | — | — | .8 | |||||||||||||||
| Proceeds from asset disposals |
.6 | — | — | — | .6 | |||||||||||||||
| Net Cash Used in Investing Activities |
(7.1 | ) | — | (1.9 | ) | — | (9.0 | ) | ||||||||||||
| Financing Activities |
||||||||||||||||||||
| Proceeds from borrowings |
514.2 | — | — | — | 514.2 | |||||||||||||||
| Repayment of debt obligations |
(555.5 | ) | — | — | — | (555.5 | ) | |||||||||||||
| Short-term debt (payments), net |
— | — | (2.9 | ) | — | (2.9 | ) | |||||||||||||
| Other |
.1 | — | (.2 | ) | .1 | — | ||||||||||||||
| Net Cash (Used In) Provided By Financing Activities |
(41.2 | ) | — | (3.1 | ) | .1 | (44.2 | ) | ||||||||||||
| Effect of exchange rate changes on cash |
(.3 | ) | — | .7 | 2.7 | 3.1 | ||||||||||||||
| Net Increase in Cash and Cash Equivalents |
11.6 | — | 12.5 | — | 24.1 | |||||||||||||||
| Cash and cash equivalents at beginning of period |
.1 | — | 17.3 | — | 17.4 | |||||||||||||||
| Cash and Cash Equivalents at End of Period |
$ | 11.7 | $ | — | $ | 29.8 | $ | — | $ | 41.5 | ||||||||||
80
Table of Contents
NOTES TO THE CONSOLIDATED FINANCIAL STATEMENTS—Continued
Note Q—Separate Financial Information of Subsidiary Guarantors of Indebtedness (Continued)
Condensed Consolidating Statements of Cash Flows Year Ended November 30, 2008
| OMNOVA Solutions (Parent) |
Guarantor Subsidiaries |
Non- Guarantor Subsidiaries |
Eliminations | Total | ||||||||||||||||
| (Dollars in Millions) | ||||||||||||||||||||
| Operating Activities |
||||||||||||||||||||
| Net income (loss) |
$ | (2.0 | ) | $ | 2.2 | $ | (2.5 | ) | $ | .1 | $ | (2.2 | ) | |||||||
| Adjustments to reconcile net income (loss) to net cash provided by (used in) operating activities: |
||||||||||||||||||||
| Equity earnings in affiliates |
— | — | (.2 | ) | — | (.2 | ) | |||||||||||||
| Depreciation and amortization |
19.1 | — | 4.8 | — | 23.9 | |||||||||||||||
| Loss on disposal of fixed assets |
.1 | — | — | — | .1 | |||||||||||||||
| Non-cash stock compensation expense |
2.4 | — | — | — | 2.4 | |||||||||||||||
| Provision for uncollectible accounts |
(.2 | ) | — | 1.2 | — | 1.0 | ||||||||||||||
| Provision for obsolete inventories |
(.6 | ) | — | 1.0 | — | .4 | ||||||||||||||
| Deferred income taxes |
— | — | .9 | (1.3 | ) | (.4 | ) | |||||||||||||
| Other |
.7 | — | (.7 | ) | .2 | .2 | ||||||||||||||
| Changes in operating assets and liabilities: |
||||||||||||||||||||
| Current assets |
(1.4 | ) | .3 | (3.4 | ) | .7 | (3.8 | ) | ||||||||||||
| Current liabilities |
(14.0 | ) | — | 3.0 | (.5 | ) | (11.5 | ) | ||||||||||||
| Other non-current assets |
9.9 | (19.0 | ) | 11.7 | (2.0 | ) | .6 | |||||||||||||
| Other non-current liabilities |
(35.4 | ) | 14.4 | 14.8 | 13.3 | 7.1 | ||||||||||||||
| Net Cash (Used In) Provided by Operating Activities |
(21.4 | ) | (2.1 | ) | 30.6 | 10.5 | 17.6 | |||||||||||||
| Investing Activities |
||||||||||||||||||||
| Capital expenditures |
(12.9 | ) | — | (1.9 | ) | — | (14.8 | ) | ||||||||||||
| Acquisitions of businesses, less cash acquired |
— | — | (42.2 | ) | 17.0 | (25.2 | ) | |||||||||||||
| Proceeds from insurance settlements |
— | — | — | — | — | |||||||||||||||
| Proceeds from asset disposals |
— | — | — | — | — | |||||||||||||||
| Net Cash Provided by (Used In) Investing Activities |
(12.9 | ) | — | (44.1 | ) | 17.0 | (40.0 | ) | ||||||||||||
| Financing Activities |
||||||||||||||||||||
| Proceeds from borrowings |
728.6 | — | — | — | 728.6 | |||||||||||||||
| Repayment of debt obligations |
(691.1 | ) | — | — | — | (691.1 | ) | |||||||||||||
| Short-term debt (payments), net |
(3.8 | ) | — | 1.0 | — | (2.8 | ) | |||||||||||||
| Other |
.8 | — | 23.5 | (24.0 | ) | .3 | ||||||||||||||
| Net Cash Provided by (Used In) Financing Activities |
34.5 | — | 24.5 | (24.0 | ) | 35.0 | ||||||||||||||
| Effect of exchange rate changes on cash |
(.4 | ) | 2.1 | (6.0 | ) | (3.5 | ) | (7.8 | ) | |||||||||||
| Net (Decrease) Increase in Cash and Cash Equivalents |
(.2 | ) | — | 5.0 | — | 4.8 | ||||||||||||||
| Cash and cash equivalents at beginning of period |
.3 | — | 12.3 | — | 12.6 | |||||||||||||||
| Cash and Cash Equivalents at End of Period |
$ | .1 | $ | — | $ | 17.3 | $ | — | $ | 17.4 | ||||||||||
81
Table of Contents
NOTES TO THE CONSOLIDATED FINANCIAL STATEMENTS—Continued
Note R—Subsequent Events – Purchase Transaction (Unaudited)
On December 9, 2010, the Company completed the acquisition of all the outstanding shares of Eliokem International SAS (“Eliokem”) from AXA Investment Managers Private Equity Europe and the other holders of equity securities of Eliokem for an aggregate purchase price of $299.7 million in cash, subject to working capital and capital expenditure adjustments. The Company used cash on hand, the net proceeds from the issuance of its 7.875% Senior Notes due 2018 (“Senior Notes”) and proceeds from a new $200 million Term Loan to fund the acquisition, including the repayment of Eliokem debt. The balance of the proceeds were used for repayment of the Company’s existing term loan and related costs. Costs associated with the Senior Note issuance and the Eliokem acquisition included in the Company’s results for 2010 include $5.5 million of acquisition and integration expense and an additional $1.6 million of interest expense on the Senior Notes.
Eliokem is a worldwide manufacturer of specialty chemicals used in a diverse range of niche applications including coating resins, elastomeric modifiers, antioxidants, oilfield chemicals and latices for specialty applications. Eliokem is headquartered in Villejust, France and has facilities located in France, the United States, China and India. The Company expects to include Eliokem’s operations in its Performance Chemicals segment.
The transaction will be accounted for under acquisition accounting using the fair value concepts defined in ASC Subtopic 820-10, “Fair Value Measurements and Disclosures.” ASC Subtopic 805-10, “Business Combinations” requires, among other things, that assets acquired and liabilities assumed be recognized at their fair values as of the acquisition date.
The preliminary estimate of the fair values of assets acquired and liabilities assumed as of the closing of the Acquisition were allocated to each of Eliokem’s assets, liabilities and identifiable intangible assets. The excess of purchase price over the estimated fair values of assets acquired and liabilities assumed is allocated to goodwill.
The preliminary estimate of the fair values of assets acquired and liabilities assumed (in millions) is as follows:
| Fair Value | ||||
| Current assets |
$ | 117.5 | ||
| Property, plant and equipment |
118.8 | |||
| Identifiable intangible assets |
80.7 | |||
| Deferred tax assets |
3.3 | |||
| Other assets |
.6 | |||
| Goodwill |
81.2 | |||
| Total assets acquired |
402.1 | |||
| Current liabilities |
(50.3 | ) | ||
| Deferred tax liabilities |
(44.2 | ) | ||
| Other liabilities |
(7.9 | ) | ||
| Net assets acquired |
$ | 299.7 | ||
The preliminary allocation of the purchase price is based on preliminary estimates of the fair value of assets acquired and liabilities assumed, and the related income tax impact of the acquisition accounting adjustments. The Company is in the process of determining the final working capital adjustment, the fair value of tangible and intangible assets acquired as well as reviewing the impact of historical tax attributes and the related impact on the preliminary purchase price allocation. The final fair valuations may be different from the preliminary valuations. The final allocation of the purchase price will be determined after completion of a final analysis to determine the fair values of the tangible assets, identifiable intangible assets, and liabilities as of the date the acquisition is complete. Increases or decreases in the fair value of the net assets may change the amount of the purchase price allocated to goodwill and other assets and liabilities. Goodwill arising from this acquisition is primarily attributable to many factors including synergies expected from combining the operations of Eliokem with our existing Performance Chemicals operations, as well as benefits derived from expansion of Performance Chemicals’ manufacturing capabilities.
82
Table of Contents
NOTES TO THE CONSOLIDATED FINANCIAL STATEMENTS—Continued
Note R—Subsequent Events – Purchase Transaction (Unaudited) (Continued)
The preliminary estimated fair value of the identifiable intangible assets and their weighted-average useful lives have been estimated as follows (dollars in millions):
| Estimated Fair Value |
Estimated Useful Life |
|||||||
| Definite lived assets: |
||||||||
| Trademarks |
$ | 1.2 | 13 years | |||||
| Customer relationships |
36.2 | 10 – 14 years | ||||||
| Other intangibles |
12.4 | 4 – 14 years | ||||||
| Total definite lived assets |
49.8 | |||||||
| Indefinite lived assets: |
||||||||
| Trademarks |
30.9 | N/A | ||||||
| Total identifiable intangible assets |
$ | 80.7 | ||||||
Definite lived intangible assets will be amortized over their estimated useful lives. Intangible assets with indefinite useful lives and goodwill will not be amortized but will be tested for impairment at least annually.
The unaudited pro forma effect of the acquisition of Eliokem on the Company’s net sales, net income and net income per share, had the acquisition occurred on December 1, 2008 and 2009, respectively, is as follows:
| Year Ended November 30, | ||||||||
| 2010 | 2009 | |||||||
| (Dollars in millions, except per share amounts) |
||||||||
| Net sales |
$ | 1,134.6 | $ | 920.1 | ||||
| Net income |
$ | 102.9 | $ | 24.6 | ||||
| Net income per share, basic |
$ | 2.31 | $ | .56 | ||||
| Net income per share, diluted |
$ | 2.29 | $ | .56 | ||||
83
Table of Contents
NOTES TO THE CONSOLIDATED FINANCIAL STATEMENTS—Continued
OMNOVA SOLUTIONS INC.
Quarterly Financial Data (Unaudited)
| Three Months Ended | ||||||||||||||||
| 2010 |
February 28, | May 31, | August 31, | November 30, | ||||||||||||
| (Dollars in millions, except per share amounts) | ||||||||||||||||
| Net sales |
$ | 183.9 | $ | 226.4 | $ | 227.9 | $ | 208.0 | ||||||||
| Gross profit(1)(2) |
$ | 40.0 | $ | 47.2 | $ | 39.1 | $ | 34.8 | ||||||||
| Restructuring and severance |
$ | (.3 | ) | $ | — | $ | (.2 | ) | $ | (.1 | ) | |||||
| Acquisition and integration related expenses(3) |
$ | — | $ | (.7 | ) | $ | (1.9 | ) | $ | (2.9 | ) | |||||
| Gain on dissolution of joint marketing alliance |
$ | — | $ | 9.7 | $ | — | $ | — | ||||||||
| Fair value adjustment on a foreign currency collar |
$ | — | $ | — | $ | — | $ | (9.2 | ) | |||||||
| Reversal of deferred tax valuation allowance |
$ | — | $ | — | $ | — | $ | 98.2 | ||||||||
| Asset impairments and write-offs |
$ | — | $ | (6.2 | ) | $ | — | $ | — | |||||||
| Net (Loss) Income |
$ | 7.8 | $ | 15.1 | $ | 3.5 | $ | 81.5 | ||||||||
| Net (loss) income per share(5) |
||||||||||||||||
| Basic |
$ | .18 | $ | .34 | $ | .08 | $ | 1.82 | ||||||||
| Diluted |
$ | .17 | $ | .33 | $ | .08 | $ | 1.80 | ||||||||
| Common stock price range per share — high |
$ | 6.94 | $ | 8.58 | $ | 8.69 | $ | 8.89 | ||||||||
|
— low |
$ | 5.09 | $ | 5.99 | $ | 6.00 | $ | 6.15 | ||||||||
| Three Months Ended | ||||||||||||||||
| 2009 |
February 28, | May 31, | August 31, | November 30, | ||||||||||||
| (Dollars in millions, except per share amounts) | ||||||||||||||||
| Net sales |
$ | 160.2 | $ | 161.3 | $ | 186.1 | $ | 188.8 | ||||||||
| Gross profit(1)(2) |
$ | 31.7 | $ | 40.0 | $ | 44.0 | $ | 44.0 | ||||||||
| Restructuring and severance |
$ | (.9 | ) | $ | (.8 | ) | $ | (.3 | ) | $ | (.1 | ) | ||||
| Flood related expenses(4) |
$ | — | $ | — | $ | (.5 | ) | $ | (.1 | ) | ||||||
| Asset impairments and write-offs |
$ | — | $ | (.6 | ) | $ | — | $ | (.5 | ) | ||||||
| Net (Loss) Income |
$ | (.1 | ) | $ | 5.1 | $ | 10.1 | $ | 11.1 | |||||||
| Net (loss) income per share(5) |
||||||||||||||||
| Basic |
$ | — | $ | .12 | $ | .23 | $ | .26 | ||||||||
| Diluted |
$ | — | $ | .12 | $ | .23 | $ | .25 | ||||||||
| Common stock price range per share — high |
$ | 1.84 | $ | 2.83 | $ | 6.50 | $ | 8.08 | ||||||||
|
— low |
$ | .60 | $ | .75 | $ | 2.50 | $ | 4.24 | ||||||||
| (1) | Gross profit excludes depreciation expense. Depreciation expense related to manufacturing facilities and equipment was $4.2 million, $4.2 million, $3.6 million and $3.7 million for the three months ended February 28, May 31, August 31 and November 30, 2010 and $4.3 million, $4.4 million, $4.6 million and $4.4 million for the three months ended February 28, May 31, August 31 and November 30, 2009, respectively. |
| (2) | Gross profit includes net LIFO inventory reserve adjustments of $0.6 million, $1.4 million, $0.9 million and $0.5 million for the three months ended February 28, May 31, August 31 and November 30, 2010, respectively, and $2.7 million, $2.2 million, $(0.4) million and $1.5 million for the three months ended February 28, May 31, August 31 and November 30, 2009. Gross profit in 2010 also includes strike-related costs of $0.3 million, $2.6 million and $0.4 million for the three months ended May 31, 2010, August 31, 2010 and November 30, respectively, and net retirement benefit plan curtailment charges of $3.3 million for the three months ended November 30, 2010. |
| (3) | Acquisition and integration expense are related to the Company’s December 9, 2010 acquisition of Eliokem International SAS. |
| (4) | During the third quarter of 2009, the Company’s Jeannette, Pennsylvania facility experienced a flood for which the Company incurred cleanup and restoration costs of $0.6 million, net of insurance proceeds. |
| (5) | The sum of the quarterly earnings per share amounts may not equal the annual amount due to changes in the number of shares outstanding during the year. |
84
Table of Contents
| Item 9. | Changes in and Disagreements with Accountants on Accounting and Financial Disclosure |
There have been no change in accountants or disagreements with the Company’s independent registered public accounting firm regarding accounting and financial disclosure matters during the two most recent years of the Company or during any period subsequent to the date of the Company’s most recent consolidated financial statements.
| Item 9A. | Controls and Procedures |
Management of the Company, including the Chief Executive Officer and the Chief Financial Officer, has evaluated the effectiveness of the Company’s disclosure controls and procedures as of November 30, 2010. Based on its evaluation, management has determined that the Company’s disclosure controls and procedures are effective. Further, during the quarter ended November 30, 2010, there were no changes in the Company’s internal control over financial reporting that have materially affected, or are reasonably likely to materially affect, the Company’s internal control over financial reporting. Management’s annual report on the Company’s internal control over financial reporting and the attestation report of the Company’s independent registered public accounting firm are set forth on pages 38 and 39 of this report, respectively, and are incorporated herein by reference.
| Item 9B. | Other Information |
Not applicable.
PART III
| Item 10. | Directors and Executive Officers of the Registrant |
Information with respect to nominees who will stand for election as directors of the Company at the 2011 Annual Meeting of Shareholders is set forth on pages 6 and 7 of the Company’s 2011 Proxy Statement and is incorporated herein by reference. Information with respect to directors of the Company whose terms extend beyond the 2011 Annual Meeting of Shareholders is set forth on pages 8 through 11 of the Company’s 2011 Proxy Statement and is incorporated herein by reference. Information regarding the Company’s Audit Committee and its Audit Committee Financial Expert is set forth on pages 19 and 20 of the Company’s 2011 Proxy Statement and is incorporated herein by reference.
Information with respect to procedures by which shareholders may recommend nominees for election to the Company’s Board of Directors is set forth on page 21 of the Company’s 2011 Proxy Statement and is incorporated herein by reference. Also see Executive Officers of the Registrant on page 17 of this Report.
Information with respect to compliance with Section 16(a) of the Exchange Act of 1934, as amended, is set forth on page 63 of the Company’s 2011 Proxy Statement and is incorporated herein by reference.
The Company has adopted a code of ethics that applies to all of its employees, including its principal executive officer, principal financial officer and principal accounting officer, as well as its directors. The Company’s code of ethics, the OMNOVA Solutions Business Conduct Policies, is available on its website at www.omnova.com.
| Item 11. | Executive Compensation |
Information regarding executive compensation is set forth on pages 26 through 61 of the Company’s 2011 Proxy Statement and is incorporated herein by reference.
| Item 12. | Security Ownership of Certain Beneficial Owners and Management and Related Stockholder Matters |
Information regarding the security ownership of certain beneficial owners and management is set forth on pages 62 and 63 of the Company’s 2011 Proxy Statement and is incorporated herein by reference.
85
Table of Contents
Equity Compensation Plan Information
The following table sets forth certain information as of November 30, 2010, regarding the Company’s only existing compensation plan, the Second Amended and Restated 1999 Equity and Performance Incentive Plan. This plan has been approved by the Company’s shareholders. See Note N to the Consolidated Financial Statements for further information regarding the Company’s share-based compensation plans.
Equity Compensation Plan Information
as of November 30, 2010
| Plan Category |
Number of securities to be issued upon exercise of outstanding options, warrants and rights |
Weighted-average exercise price of outstanding options, warrants and rights |
Number of securities remaining available for future issuance under equity compensation plans |
|||||||||
| Equity compensation plans approved by security holders |
1,968,862 | $ | 6.00 | 679,056 | ||||||||
| Equity compensation plans not approved by security holders |
N/A | N/A | N/A | |||||||||
| Total |
1,968,892 | $ | 6.00 | 679,056 | ||||||||
| Item 13. | Certain Relationships and Related Transactions, Director Independence |
Information regarding certain relationships and related transactions and director independence is set forth on page 24 of the Company’s 2011 Proxy Statement and is incorporated herein by reference.
| Item 14. | Principal Accountant Fees and Services |
Information regarding fees paid to and services provided by the Company’s independent registered public accounting firm during the years ended November 30, 2010 and 2009, the pre-approval policies and procedures of the Audit Committee of the Company’s Board of Directors and related information is set forth on pages 12 and 13 of the Company’s 2011 Proxy Statement and is incorporated herein by reference.
PART IV
| Item 15. | Exhibits and Financial Statement Schedules |
(a)(1) Consolidated Financial Statements:
The following consolidated financial statements of OMNOVA Solutions Inc. are included in Item 8:
| Consolidated Statements of Operations for the years ended November 30, 2010, 2009 and 2008 |
| Consolidated Balance Sheets at November 30, 2010 and 2009 |
| Consolidated Statements of Shareholders’ Equity for the years ended November 30, 2010, 2009 and 2008 |
| Consolidated Statements of Cash Flows for the years ended November 30, 2010, 2009 and 2008 |
| Notes to the Consolidated Financial Statements |
86
Table of Contents
(a)(2) Schedules
All schedules for which provision is made in the applicable accounting regulation of the Securities and Exchange Commission are not required under the related instructions or are inapplicable and therefore have been omitted.
EXHIBIT INDEX
(a)(3) Exhibits
| Exhibit |
Description | |||
| ACQUISITION AGREEMENTS | ||||
| 2.1 | Sale and Purchase Agreement among OMNOVA Solutions Inc., AXA LBO Fund III-A, AXA LBO Fund III-B and the other holders of equity securities of Eliokem International SAS (incorporated by reference to the same numbered exhibit to the Company’s Current Report on Form 8-K filed November 24, 2010 (File No. 1-15147)). | |||
| CHARTER DOCUMENTS | ||||
| 3.2** | Form of Amended and Restated Articles of Incorporation of OMNOVA Solutions Inc. | |||
| 3.4** | Amended and Restated Code of Regulations of OMNOVA Solutions. Inc. | |||
| INSTRUMENTS DEFINING THE RIGHTS OF SECURITY HOLDERS | ||||
| 4.1 | Indenture dated as of November 3, 2010 by and among OMNOVA Solutions Inc., the Guarantors (as defined therein) and Wells Fargo Bank, National Association, as trustee (incorporated by reference to the same numbered exhibit to the Company’s Current Report on Form 8-K filed November 4, 2010 (File No. 1-15147)). | |||
| 4.2 | Registration Rights Agreement, dated as of November 3, 2010, by and among OMNOVA Solutions Inc., the Guarantors (as defined therein) and the initial purchasers party thereto (incorporated by reference to exhibit 10.1 of the Company’s Current Report on Form 8-K filed November 4, 2010 (File No. 1-15147)). | |||
| MATERIAL CONTRACTS | ||||
| 10.3† | Amended and Restated Employment Agreement dated December 31, 2009 between OMNOVA Solutions and Kevin M. McMullen (incorporated by reference to the same numbered exhibit to the Company’s Annual Report on Form 10-K for the year ended November 30, 2008 (File No. 1-15147)). | |||
| 10.5† | Amended and Restated Severance Agreement dated December 31, 2009 between OMNOVA Solutions and Kevin M. McMullen (incorporated by reference to the same numbered exhibit to the Company’s Annual Report on Form 10-K for the year ended November 30, 2008 (File No. 1-15147)). | |||
| 10.6† | Form of Amended and Restated Severance Agreement granted to certain executive officers of OMNOVA Solutions (other than the officer identified above) (incorporated by reference to the same numbered exhibit to the Company’s Annual Report on Form 10-K for the year ended November 30, 2008 (File No. 1-15147)). | |||
| 10.7† | OMNOVA Solutions Second Amended and Restated 1999 Equity and Performance Incentive Plan, as amended and restated effective January 1, 2009 (incorporated by reference to the same numbered exhibit to the Company’s Annual Report on Form 10-K for the year ended November 30, 2008 (File No. 1-15147)). | |||
| 10.8† | OMNOVA Solutions Deferred Compensation Plan for Nonemployee Directors, as amended and restated effective January 1, 2009 (incorporated by reference to the same numbered exhibit to the Company’s Annual Report on Form 10-K for the year ended November 30, 2008 (File No. 1-15147)). | |||
| 10.9† | Retirement Plan for Nonemployee Directors of OMNOVA Solutions, as amended and restated effective January 1, 2009 (incorporated by reference to the same numbered exhibit to the Company’s Annual Report on Form 10-K for the year ended November 30, 2008 (File No. 1-15147)). | |||
| 10.11† | Savings Benefits Restoration Plan for Salaried Employees of OMNOVA Solutions (incorporated by reference to the same numbered exhibit to the Company’s Annual Report on Form 10-K for the year ended November 30, 2008 (File No. 1-15147)). | |||
| 10.12† | Pension Benefits Restoration Plan for Salaried Employees of OMNOVA Solutions (incorporated by reference to the same numbered exhibit to the Company’s Annual Report on Form 10-K for the year ended November 30, 2008 (File No. 1-15147)). | |||
87
Table of Contents
| Exhibit |
Description | |
| 10.13 | OMNOVA Solutions Corporate Officers Severance Plan, effective January 1, 2009 (incorporated by reference to the same numbered exhibit to the Company’s Annual Report on Form 10-K for the year ended November 30, 2008 (File No. 1-15147)). | |
| 10.14† | OMNOVA Solutions Long-Term Incentive Program, as amended and restated effective January 1, 2009 (incorporated by reference to the same numbered exhibit to the Company’s Annual Report on Form 10-K for the year ended November 30, 2008 (File No. 1-15147)). | |
| 10.22† | Form of Deferred Share Agreement (incorporated by reference to the same numbered exhibit to the Company’s Annual Report on Form 10-K for the year ended November 30, 2009 (File No. 1-15147)). | |
| 10.23† | Form of Performance Share Agreement (incorporated by reference to the same numbered exhibit to the Company’s Annual Report on Form 10-K for the year ended November 30, 2009 (File No. 1-15147)). | |
| 10.24† | Form of Restricted Stock Agreement (incorporated by reference to the same numbered exhibit to the Company’s Annual Report on Form 10-K for the year ended November 30, 2006 (File No. 1-15147)). | |
| 10.26† | OMNOVA Solutions Executive Incentive Compensation, as amended and restated effective January 1, 2009 (incorporated by reference to the same numbered exhibit to the Company’s Annual Report on Form 10-K for the year ended November 30, 2008 (File No. 1-15147)). | |
| 10.30 | Second Amended and Restated Term Loan Credit Agreement dated as of December 9, 2010 by and among OMNOVA Solutions Inc., as Borrower, the financial institutions party thereto as Lenders, and Deutsche Bank Trust Company Americas, as agent for the Lenders. | |
| 10.32 | Second Amended and Restated Credit Agreement dated as of December 9, 2010 by and among OMNOVA Solutions Inc. and Eliokem Inc., as borrowers, the financial institutions party thereto, as Lenders, and J.P. Morgan Chase Bank N.A., as agent for the Lenders. | |
| SUBSIDIARIES OF THE REGISTRANT | ||
| 21.1 | Listing of Subsidiaries. | |
| CONSENT OF EXPERTS | ||
| 23.1 | Consent of Ernst & Young LLP, Independent Registered Public Accounting Firm. | |
| POWER OF ATTORNEY | ||
| 24.1 | Powers of Attorney executed by D. J. D’Antoni, M. J. Merriman, S. W. Percy, A. R. Rothwell, L. B. Porcellato, W. R. Seelbach and R. A. Stefanko, Directors of the Company. | |
| CERTIFICATIONS | ||
| 31.1 | Principal Executive Officer’s Certifications pursuant to Section 302 of the Sarbanes-Oxley Act of 2002. | |
| 31.2 | Principal Executive Officer’s Certifications pursuant to Section 302 of the Sarbanes-Oxley Act of 2002. | |
| 32.1 | Certification pursuant to 18 U.S.C. Section 1350, as adopted pursuant to Section 906 of the Sarbanes-Oxley Act of 2002. | |
The Company will supply copies of any of the foregoing exhibits to any shareholder upon receipt of a written request addressed to OMNOVA Solutions Inc., 175 Ghent Road, Fairlawn, Ohio 44333-3300, Attention: Secretary, and payment of $1 per page to help defray the costs of handling, copying and return postage.
| ** | Incorporated by reference to the same-numbered exhibit to the Company’s Registration Statement on Form 10 (File No. 1-15147). |
| † | Management contract or compensatory arrangement. |
88
Table of Contents
Pursuant to the requirements of Section 13 or 15(d) of the Securities Exchange Act of 1934, the registrant has duly caused this Report to be signed on its behalf by the undersigned, thereunto duly authorized.
| OMNOVA SOLUTIONS INC. | ||||
| Date: January 24, 2011 | ||||
| By |
/s/ J. C. LEMAY | |||
| J. C. LeMay Senior Vice President, Business Development; General Counsel | ||||
Pursuant to the requirements of the Securities Exchange Act of 1934, this Report has been signed below by the following persons on behalf of the registrant and in the capacities and on the dates indicated.
| Signature |
Title |
Date | ||
| /s/ K. M. MCMULLEN |
Chairman, Chief Executive Officer and President |
January 24, 2011 | ||
| K. M. McMullen | ||||
| /s/ M. E. HICKS |
Senior Vice President and Chief Financial Officer |
January 24, 2011 | ||
| M. E. Hicks | ||||
| * |
Director |
January 24, 2011 | ||
| D. J. D’Antoni | ||||
| * |
Director |
January 24, 2011 | ||
| M. J. Merriman | ||||
| * |
Director |
January 24, 2011 | ||
| S. W. Percy | ||||
| * |
Director |
January 24, 2011 | ||
| L. B. Porcellato |
||||
| * |
Director |
January 24, 2011 | ||
| A. R. Rothwell | ||||
| * |
Director |
January 24, 2011 | ||
| W. R. Seelbach | ||||
| * |
Director |
January 24, 2011 | ||
| R. A. Stefanko | ||||
| *Signed by the undersigned as attorney-in-fact and agent for the Directors indicated. |
||||
| /s/ K. C. SYRVALIN |
January 24, 2011 | |||
| K. C. Syrvalin | ||||
89