Attached files
| file | filename |
|---|---|
| 8-K - CURRENT REPORT - AVAYA INC | form8-kwithlenderslides_fi.htm |

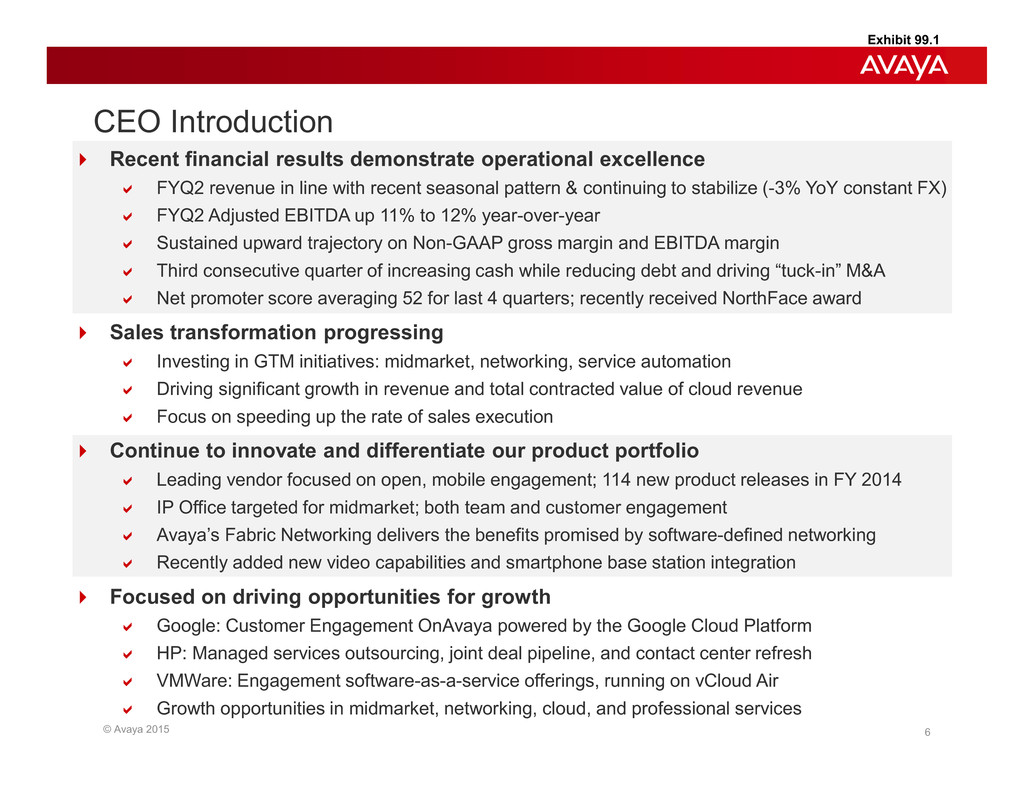
© Avaya 2015 6 UIforward Recent financial results demonstrate operational excellence UIcheck FYQ2 revenue in line with recent seasonal pattern & continuing to stabilize (-3% YoY constant FX) UIcheck FYQ2 Adjusted EBITDA up 11% to 12% year-over-year UIcheck Sustained upward trajectory on Non-GAAP gross margin and EBITDA margin UIcheck Third consecutive quarter of increasing cash while reducing debt and driving “tuck-in” M&A UIcheck Net promoter score averaging 52 for last 4 quarters; recently received NorthFace award UIforward Sales transformation progressing UIcheck Investing in GTM initiatives: midmarket, networking, service automation UIcheck Driving significant growth in revenue and total contracted value of cloud revenue UIcheck Focus on speeding up the rate of sales execution UIforward Continue to innovate and differentiate our product portfolio UIcheck Leading vendor focused on open, mobile engagement; 114 new product releases in FY 2014 UIcheck IP Office targeted for midmarket; both team and customer engagement UIcheck Avaya’s Fabric Networking delivers the benefits promised by software-defined networking UIcheck Recently added new video capabilities and smartphone base station integration UIforward Focused on driving opportunities for growth UIcheck Google: Customer Engagement OnAvaya powered by the Google Cloud Platform UIcheck HP: Managed services outsourcing, joint deal pipeline, and contact center refresh UIcheck VMWare: Engagement software-as-a-service offerings, running on vCloud Air UIcheck Growth opportunities in midmarket, networking, cloud, and professional services CEO Introduction Exhibit 99.1

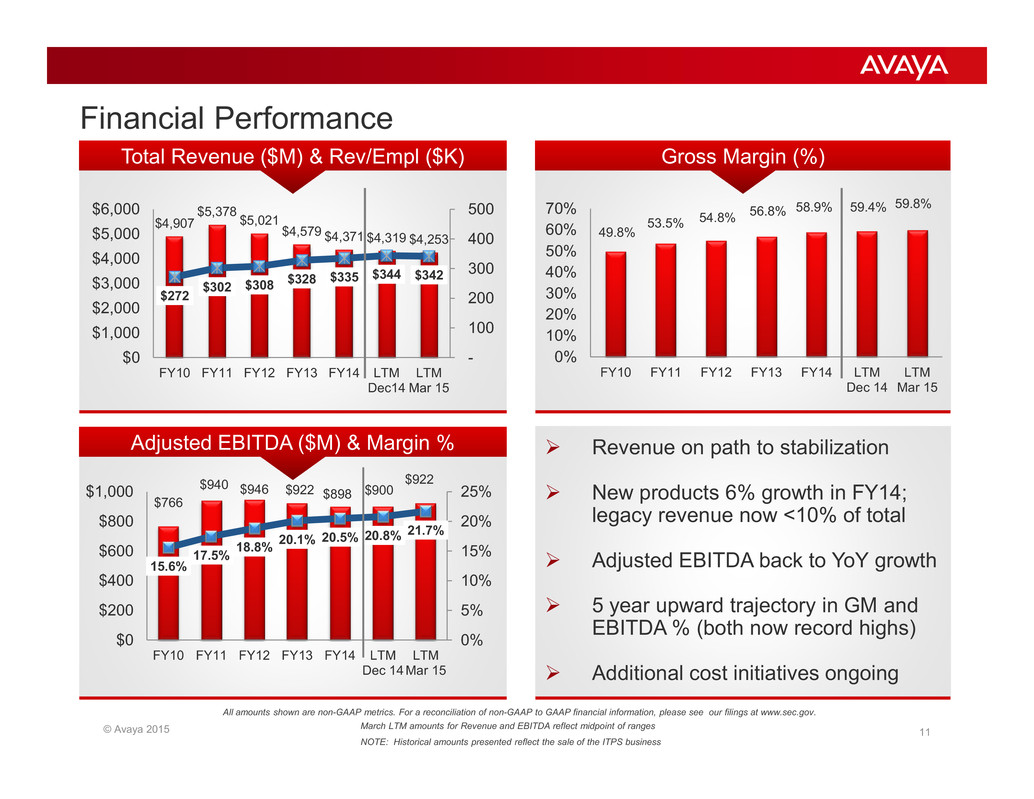
© Avaya 2015 11 Gross Margin (%) head2right Revenue on path to stabilization head2right New products 6% growth in FY14; legacy revenue now <10% of total head2right Adjusted EBITDA back to YoY growth head2right 5 year upward trajectory in GM and EBITDA % (both now record highs) head2right Additional cost initiatives ongoing Total Revenue ($M) & Rev/Empl ($K) Adjusted EBITDA ($M) & Margin % $4,907 $5,378 $5,021 $4,579 $4,371 $4,319 $4,253 $272 $302 $308 $328 $335 $344 $342 - 100 200 300 400 500 $0 $1,000 $2,000 $3,000 $4,000 $5,000 $6,000 FY10 FY11 FY12 FY13 FY14 LTM Dec14 LTM Mar 15 49.8% 53.5% 54.8% 56.8% 58.9% 59.4% 59.8% 0% 10% 20% 30% 40% 50% 60% 70% FY10 FY11 FY12 FY13 FY14 LTM Dec 14 LTM Mar 15 $766 $940 $946 $922 $898 $900 $922 15.6% 17.5% 18.8% 20.1% 20.5% 20.8% 21.7% 0% 5% 10% 15% 20% 25% $0 $200 $400 $600 $800 $1,000 FY10 FY11 FY12 FY13 FY14 LTM Dec 14 LTM Mar 15 Financial Performance All amounts shown are non-GAAP metrics. For a reconciliation of non-GAAP to GAAP financial information, please see our filings at www.sec.gov. NOTE: Historical amounts presented reflect the sale of the ITPS business March LTM amounts for Revenue and EBITDA reflect midpoint of ranges

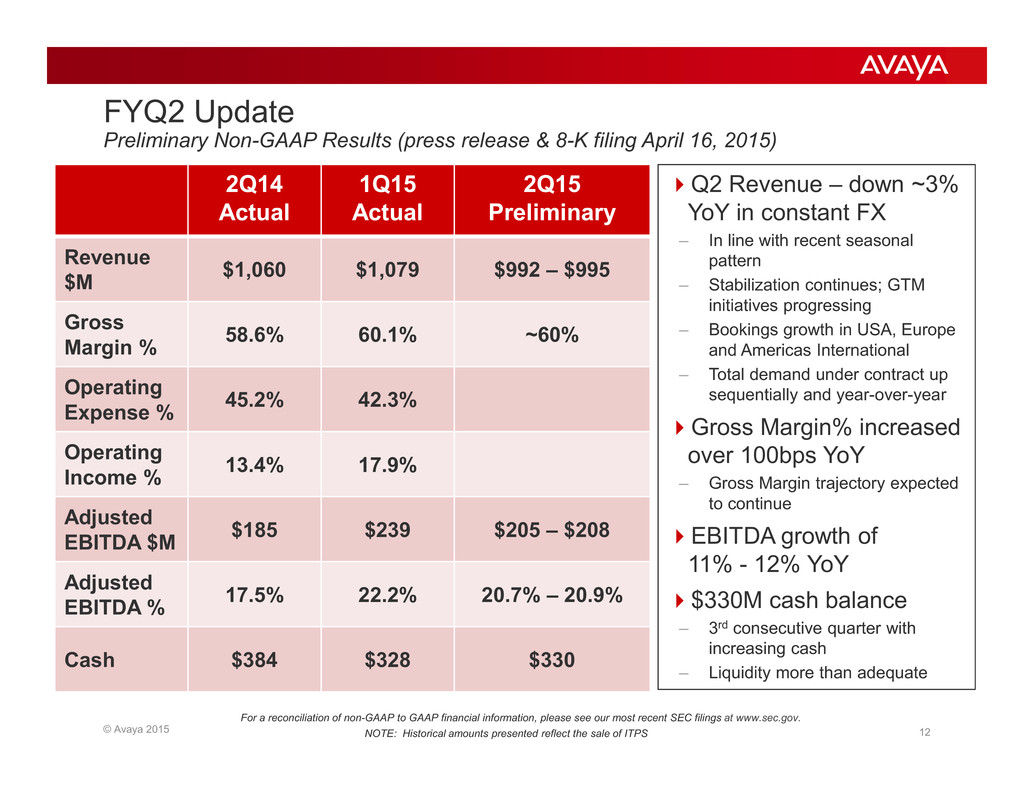
© Avaya 2015 12 FYQ2 Update Preliminary Non-GAAP Results (press release & 8-K filing April 16, 2015) 2Q14 Actual 1Q15 Actual 2Q15 Preliminary Revenue $M $1,060 $1,079 $992 – $995 Gross Margin % 58.6% 60.1% ~60% Operating Expense % 45.2% 42.3% Operating Income % 13.4% 17.9% Adjusted EBITDA $M $185 $239 $205 – $208 Adjusted EBITDA % 17.5% 22.2% 20.7% – 20.9% Cash $384 $328 $330 UIforwardQ2 Revenue – down ~3% YoY in constant FX – In line with recent seasonal pattern – Stabilization continues; GTM initiatives progressing – Bookings growth in USA, Europe and Americas International – Total demand under contract up sequentially and year-over-year UIforwardGross Margin% increased over 100bps YoY – Gross Margin trajectory expected to continue UIforwardEBITDA growth of 11% - 12% YoY UIforward$330M cash balance – 3rd consecutive quarter with increasing cash – Liquidity more than adequate For a reconciliation of non-GAAP to GAAP financial information, please see our most recent SEC filings at www.sec.gov. NOTE: Historical amounts presented reflect the sale of ITPS

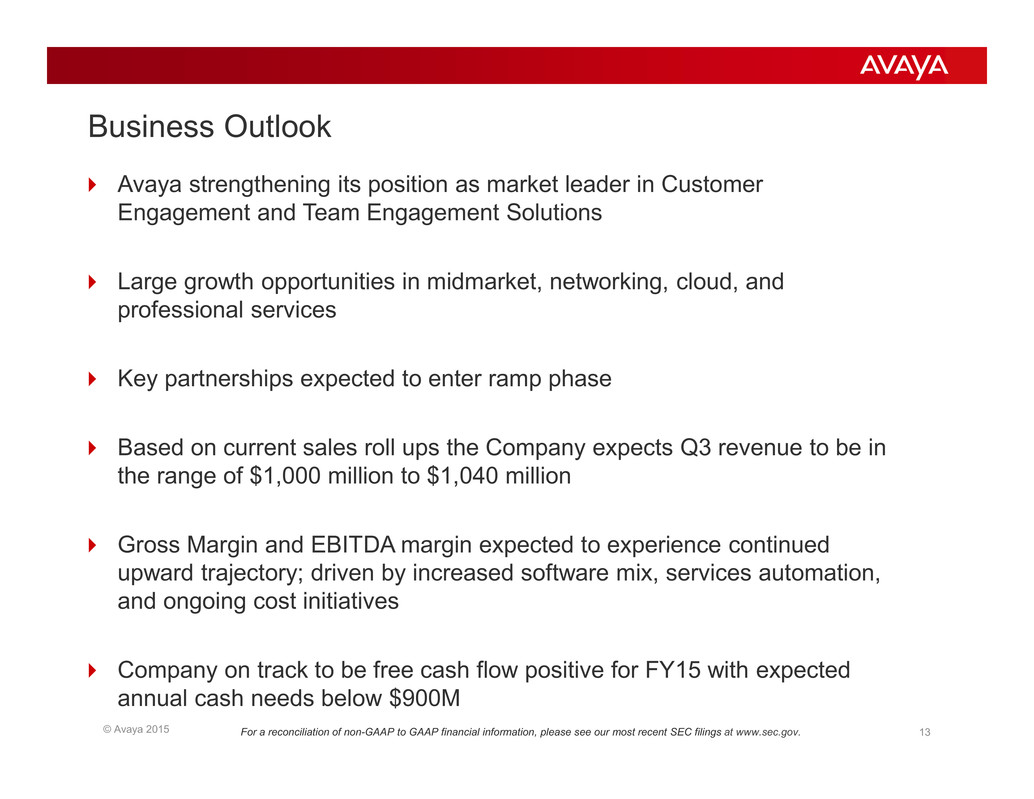
© Avaya 2015 13 Business Outlook UIforward Avaya strengthening its position as market leader in Customer Engagement and Team Engagement Solutions UIforward Large growth opportunities in midmarket, networking, cloud, and professional services UIforward Key partnerships expected to enter ramp phase UIforward Based on current sales roll ups the Company expects Q3 revenue to be in the range of $1,000 million to $1,040 million UIforward Gross Margin and EBITDA margin expected to experience continued upward trajectory; driven by increased software mix, services automation, and ongoing cost initiatives UIforward Company on track to be free cash flow positive for FY15 with expected annual cash needs below $900M For a reconciliation of non-GAAP to GAAP financial information, please see our most recent SEC filings at www.sec.gov.
