Attached files
| file | filename |
|---|---|
| EX-21.1 - EX-21.1 - PEOPLES FINANCIAL SERVICES CORP. | d831491dex211.htm |
| EX-31.1 - EX-31.1 - PEOPLES FINANCIAL SERVICES CORP. | d831491dex311.htm |
| EX-32.1 - EX-32.1 - PEOPLES FINANCIAL SERVICES CORP. | d831491dex321.htm |
| EX-31.2 - EX-31.2 - PEOPLES FINANCIAL SERVICES CORP. | d831491dex312.htm |
| EX-10.32 - EX-10.32 - PEOPLES FINANCIAL SERVICES CORP. | d831491dex1032.htm |
| EXCEL - IDEA: XBRL DOCUMENT - PEOPLES FINANCIAL SERVICES CORP. | Financial_Report.xls |
Table of Contents
UNITED STATES
SECURITIES AND EXCHANGE COMMISSION
Washington, D.C. 20549
FORM 10-K
(Mark One)
| x | ANNUAL REPORT PURSUANT TO SECTION 13 OR 15(d) OF THE SECURITIES EXCHANGE ACT OF 1934 |
For the fiscal year ended December 31, 2014
| ¨ | TRANSITION REPORT PURSUANT TO SECTION 13 OR 15(d) OF THE SECURITIES EXCHANGE ACT OF 1934 |
For the transition period from to
Commission file number: 001-36388
Peoples Financial Services Corp.
(Exact name of registrant as specified in its charter)
| Pennsylvania | 23-2391852 | |
| State or other jurisdiction of incorporation or organization |
(I.R.S. Employer Identification No.) |
150 North Washington Avenue,
Scranton, PA 18503
(Address of principal executive offices) (Zip Code)
(570) 346-7741
Registrant’s telephone number, including area code
Securities registered pursuant to Section 12(b) of the Act:
| Title of each class |
Name of each exchange on which registered | |
| Common stock, $2.00 par value | The Nasdaq Stock Market |
Securities registered pursuant to Section 12(g) of the Act:
None
Indicate by check mark if the registrant is a well-known seasoned issuer, as defined in Rule 405 of the Securities Act. Yes ¨ No x
Indicate by check mark if the registrant is not required to file reports pursuant to Section 13 or Section 15(d) of the Act. Yes ¨ No x
Indicate by check mark whether the registrant (1) has filed all reports required to be filed by Section 13 or 15(d) of the Securities Exchange Act of 1934 during the preceding 12 months (or for such shorter period that the registrant was required to file such reports), and (2) has been subject to such filing requirements for the past 90 days. Yes x No ¨
Indicate by check mark whether the registrant has submitted electronically and posted on its corporate Web site, if any, every Interactive Data File required to be submitted and posted pursuant to Rule 405 of Regulation S-T (§ 232.405 of this chapter) during the preceding 12 months (or for such shorter period that the registrant was required to submit and post such files). Yes x No ¨
Indicate by check mark if disclosure of delinquent filers pursuant to Item 405 of Regulation S-K (§ 229.405 of this chapter) is not contained herein, and will not be contained, to the best of registrant’s knowledge, in definitive proxy or information statements incorporated by reference in Part III of this Form 10-K or any amendment to this Form 10-K. ¨
Indicate by check mark whether the registrant is a large accelerated filer, an accelerated filer, a non-accelerated filer, or a smaller reporting company. See the definitions of “large accelerated filer,” “accelerated filer” and “smaller reporting company” in Rule 12b-2 of the Exchange Act.
| Large accelerated filer | ¨ | Accelerated filer | x | |||
| Non-accelerated filer | ¨ (Do not check if a smaller reporting company) | Smaller reporting company | ¨ | |||
Indicate by check mark whether the registrant is a shell company (as defined in Rule 12b-2 of the Act). Yes ¨ No x
The aggregate market value of the registrant’s common stock held by non-affiliates of the registrant on June 30, 2014 was approximately $355,228,133 (based on the closing sales price of the registrant’s common stock on that date).
The number of shares of the registrant’s common stock outstanding as of February 27, 2015 was 7,548,358
DOCUMENTS INCORPORATED BY REFERENCE
Portions of the registrant’s definitive proxy statement to be filed in connection with solicitation of proxies for its 2015 annual meeting of shareholders, within 120 days of the end of registrant’s fiscal year, is incorporated by reference into Part III of this Annual Report on Form 10-K.
Table of Contents
Peoples Financial Services Corp.
Form 10K
For the Year Ended December 31, 2014
-i-
Table of Contents
Cautionary Note Regarding Forward-Looking Statements.
This Annual Report on Form 10-K contains forward-looking statements within the meaning of Section 27A of the Securities Act, as amended, and Section 21E of the Securities Exchange Act of 1934, as amended, which are subject to risks and uncertainties. These statements are based on assumptions and may describe future plans, strategies and expectations of Peoples Financial Services Corp. and its direct and indirect subsidiaries. These forward-looking statements are generally identified by use of the words “believe,” “expect,” “intend,” “anticipate,” “estimate,” “project” or similar expressions. All statements in this report, other than statements of historical facts, are forward-looking statements.
The ability of Peoples Financial Services Corp. to predict results or the actual effect of future plans or strategies is inherently uncertain. Important factors that could cause actual results of Peoples Financial Services Corp. to differ materially from those in the forward-looking statements include, but are not limited to: the ability to achieve the intended benefits of the merger with Penseco Financial Services Corporation; changes in interest rates; economic conditions, particularly in the Peoples Financial Services Corp. market area; legislative and regulatory changes and the ability to comply with the significant laws and regulations governing the banking and financial services business; monetary and fiscal policies of the U.S. government, including policies of the U.S. Department of Treasury and the Federal Reserve System; credit risk associated with lending activities and changes in the quality and composition of our loan and investment portfolios; demand for loan and other products; deposit flows; competition; changes in the values of real estate and other collateral securing the loan portfolio, particularly in the Peoples Financial Services Corp. market area; changes in relevant accounting principles and guidelines; and inability of third party service providers to perform. Additional factors that may affect our results are discussed in Item 1A to this Annual Report on Form 10-K titled “Risk Factors”.
These risks and uncertainties should be considered in evaluating forward-looking statements and undue reliance should not be placed on such statements. Except as required by applicable law or regulation, Peoples Financial Services Corp. does not undertake, and specifically disclaims any obligation, to release publicly the result of any revisions that may be made to any forward-looking statements to reflect events or circumstances after the date of the statements or to reflect the occurrence of anticipated or unanticipated events.
-ii-
Table of Contents
| Item 1. | Business. |
General
Peoples Financial Services Corp., a bank holding company incorporated under the laws of Pennsylvania, provides a full range of financial services through its wholly-owned subsidiary, Peoples Security Bank and Trust Company, including its subsidiaries, Peoples Advisors, LLC and Penseco Realty, Inc. On November 30, 2013, Penseco Financial Services Corporation, a financial holding company incorporated under the laws of Pennsylvania, referred to as “Penseco,” merged with and into Peoples Financial Services Corp., with Peoples Financial Services Corp. being the surviving corporation, pursuant to an Agreement and Plan of Merger dated June 28, 2013. Such transaction is sometimes referred to in this annual report as the “Penseco merger” and such agreement as the “Penseco merger agreement.” In connection with the Penseco merger, on December 1, 2013, Penseco’s former banking subsidiary, Penn Security Bank and Trust Company, merged with and into Peoples Neighborhood Bank, and the resulting institution adopted the name, “Peoples Security Bank and Trust Company.”
Unless the context indicates otherwise, all references in this annual report to the “Peoples,” “we,” “us” and “our” refer to Peoples Financial Services Corp., its direct and indirect subsidiaries and its and their respective predecessors. Peoples Security Bank and Trust Company is sometimes referred to as “Peoples Bank.”
Peoples Bank is a state-chartered bank and trust company under the jurisdiction of the Pennsylvania Department of Banking and Securities and the Federal Deposit Insurance Corporation, or “FDIC.” Peoples Bank’s twenty-six community banking offices, all similar with respect to economic characteristics, share a majority of the following aggregation criteria: products and services; operating processes; customer bases; delivery systems; and regulatory oversight. Accordingly, they are aggregated into a single operating segment.
Peoples Advisors, LLC, provides investment advisory services through a third party to individuals and small businesses. Penseco Realty, Inc. holds and manages real estate assets on behalf of Peoples Bank. Neither Peoples Advisors, LLC nor Penseco Realty, Inc. met the quantitative thresholds for required segment disclosure.
Market Areas
Our principal market area consists of Lackawanna, Lehigh, Luzerne, Monroe, Susquehanna, Wayne and Wyoming Counties in Pennsylvania and Broome County in New York. In addition, parts of Bradford County in Pennsylvania that borders Susquehanna and Wyoming Counties are also considered part of the market area.
Specifically, our market area is situated between:
| • | Binghamton, Broome County, New York, located to the north; and |
| • | Bethlehem, Lehigh County, Pennsylvania, to the south. |
Susquehanna County could best be described as a bedroom county with a high percentage of its residents commuting to work in Broome County, New York, or Lackawanna County, Pennsylvania. The southern part of Susquehanna County tends to gravitate south for both employment and shopping, while the northern part of the county goes north to Broome County, New York. The western part of Susquehanna County gravitates south and west to and through Wyoming County. Approximately half of our offices are located in and around Scranton, the largest city in Lackawanna County with the remaining offices located in counties that would be considered sparsely populated, as they are made up of many small towns and villages. Peoples entered into the Lehigh County market during the fourth quarter of 2014. This market has a greater population than the other counties served with Bethlehem being the second largest city within Lehigh County.
-1-
Table of Contents
Most recently, the production of natural gas from the Marcellus Shale formation located in the heart of our market area has begun to provide economic benefits to the communities served and as a result to us. Natural gas producers have already invested billions of dollars in Pennsylvania in lease and land acquisition, new well drilling, infrastructure development and community partnerships, with an even greater investment expected in the future. The growth of our deposits, and to a lesser extent, loan portfolio, has been influenced by natural gas drilling activities.
Products and Services
Our primary products are loans to small- and medium-sized businesses. Other lending products include one-to-four family residential mortgages and consumer loans. We fund our loans, primarily, by offering open time deposits to commercial enterprises and individuals. Other deposit products include certificates of deposits and various demand deposit accounts.
Lending Activities
We provide a full range of retail and commercial lending products designed to meet the borrowing needs of consumers and small- and medium-sized businesses in our market areas. A significant amount of our loans are to customers located within our market area. We have no foreign loans or highly leveraged transaction loans, as defined by the Federal Reserve Board. Although we participate in loans originated by other banks, we have originated the majority of loans in our portfolio.
Our retail lending products include the following types of loans, among others: residential real estate; automobiles; manufactured housing; personal; student; home equity, and credit card. Our commercial lending products include the following types of loans, among others: commercial real estate; working capital; equipment and other commercial needs; construction; Small Business Administration, and agricultural and mineral rights. The terms offered on a loan vary depending primarily on the type of loan and credit-worthiness of the borrower.
Payment risk is a function of the economic climate in which our lending activities are conducted. Economic downturns in the economy generally or in a particular sector could cause cash flow problems for customers and make loan payments more difficult. We attempt to minimize this risk by not being exposed to loan concentrations of a single customer or a group of customers, the loss of any one or more of whom would have a materially adverse effect on its financial condition. One element of interest rate risk arises from our fixed rate loans in an environment of changing interest rates. We attempt to mitigate this risk by making adjustable rate commercial loans and by limiting repricing terms to five years or less for customers requiring fixed rate loans. Our lending activity also exposes us to risks that any collateral we take as security is not adequate. We attempt to manage collateral risk by avoiding loan concentrations to particular borrowers, by perfecting liens on collateral and by obtaining appraisals on property prior to extending loans. We attempt to mitigate our exposure to these and other types of risks by stratifying authorization requirements by loan size and complexity.
We generate interest income from our loan and securities portfolios. Other income is generated primarily from merchant transaction fees, trust fees and service charges on deposit accounts. Our primary costs are interest paid on deposits and borrowings and general operating expenses. We provide a variety of commercial and retail banking services to business, non-profits, governmental, municipal agencies and professional customers, as well as retail customers, on a personalized basis. Our primary lending products are real estate, commercial and consumer loans. We also offer ATM access, credit cards, active investment accounts, trust department services and other various lending, depository and related financial services. Our primary deposit products are savings and demand deposit accounts and certificates of deposit.
We are not dependent upon a single customer, or a few customers, the loss of one or more of which would have a material adverse effect on our operations. In the ordinary course of our business, our operations and earnings are not materially affected by seasonal changes or by Federal, state or local environmental laws or regulations.
-2-
Table of Contents
We offer a variety of loans including commercial, residential and consumer loans as described above. The consumer portfolio includes automobile loans, educational loans and lines of credit.
We intend to continue to evaluate commercial real estate, commercial business and governmental lending opportunities, including small business lending. We continue to proactively monitor and manage existing credit relationships.
We have not engaged in sub-prime residential mortgage lending, which is defined as mortgage loans advanced to borrowers who do not qualify for market interest rates because of problems with their credit history. We focus our lending efforts within our market area.
One-to-Four Family Residential Loans. We offer two types of residential mortgage loans: fixed-rate loans, with terms of up to 30 years, and adjustable-rate loans, with interest rates and payments that adjust annually after an initial fixed period of one, three or five years. Interest rates and payments on our adjustable-rate loans generally are adjusted to a rate equal to a percentage above the appropriate U.S. Treasury Security Index. Our adjustable-rate single-family residential real estate loans generally have caps on increases or decreases in the interest rate at any adjustment date, and a maximum adjustment limit over the life of the loan. Although we offer adjustable-rate loans with initial rates below the fully indexed rate, loans tied to the one-year constant maturity treasury are underwritten using methods approved by the Federal Home Loan Mortgage Corporation, which require borrowers to be qualified at a rate equal to 200 basis points above the discounted loan rate under certain conditions.
Borrower demand for adjustable-rate loans compared to fixed-rate loans is a function of the level of interest rates, the expectations of changes in the level of interest rates, and the difference between the interest rates and loan fees offered for fixed-rate mortgage loans as compared to the interest rates and loan fees for adjustable-rate loans, among other factors. The loan fees, interest rates and other provisions of mortgage loans are determined by us on the basis of our own pricing criteria and competitive market conditions.
Most of our residential loans are underwritten to standards established by the secondary market. We also offer VA and FHA loans via a third party lending source.
While one-to-four family residential real estate loans are normally originated with up to 30-year terms, such loans typically remain outstanding for substantially shorter periods because borrowers often prepay their loans in full either upon sale of the property pledged as security or upon refinancing the original loan. Therefore, average loan maturity is a function of, among other factors, the level of purchase and sale activity in the real estate market, prevailing interest rates and the interest rates payable on outstanding loans. We do not offer loans with negative amortization or interest only loans.
We offer home equity loans and lines of credit, typically with a maximum combined loan-to-value ratio of 80%. Home equity loans generally have fixed-rates of interest and are originated with terms of up to 15 years. Home equity lines of credit generally have variable rates and are indexed to the prime rate. Home equity lines of credit generally have draw periods with 20 year repayment periods.
We generally do not make high loan-to-value loans (defined as loans with a loan-to-value ratio in excess of 80%) without private mortgage insurance. The maximum loan-to-value ratio we generally permit is 95% with private mortgage insurance. We require all properties securing mortgage loans to be appraised by a board-approved independent appraiser. We generally require title insurance on all first mortgage loans. Borrowers must obtain hazard insurance, and flood insurance is required for loans on properties located in a flood zone.
Commercial Real Estate Loans. We offer commercial real estate loans secured by real estate primarily with adjustable rates. We originate a variety of commercial real estate loans generally for terms up to 25 years and payments based on an amortization schedule of up to 25 years. These loans are typically based on either the
-3-
Table of Contents
Federal Home Loan Bank borrowing rate or our own pricing criteria and adjust every three to five years. Commercial real estate loans also are originated for the acquisition and development of land, including development for residential use. Conditions of acquisition and development loans originated generally limit the number of model homes and homes built on speculation, and draws are scheduled against executed agreements of sale. Commercial real estate loans for the acquisition and development of land are typically based upon the prime rate. Commercial real estate loans for developed real estate and for real estate acquisition and development are originated generally with loan-to-value ratios up to 75%, while loans for the acquisition of land are originated with a maximum loan to value ratio of 65%.
Commercial Loans. We offer commercial business loans to professionals, sole proprietorships and small businesses in our market area. We offer installment loans for capital improvements, equipment acquisition and long-term working capital. These loans are typically priced at short term fixed rates or variable rates based on the prime rate. These loans are secured by business assets other than real estate, such as business equipment and inventory, and, generally, are backed by personal guarantees of the owner or owners of the business. We originate lines of credit to finance the working capital needs of businesses to be repaid by seasonal cash flows or to provide a period of time during which the business can borrow funds for planned equipment purchases.
When making commercial business loans, we consider the consolidated financial statements of the borrower and any guarantors, the borrower’s payment history of both corporate and personal debt, the debt service capabilities of the borrower, the projected cash flows of the business and guarantor, the viability of the industry in which the customer operates and the value of the collateral.
Consumer Loans. We offer a variety of consumer loans, including lines of credit, automobile loans and loans secured by savings accounts and certificates of deposit. We also offer unsecured loans.
We offer loans secured by new and used automobiles, primarily indirectly through dealerships. These loans have fixed interest rates and generally have terms up to six years. We offer automobile loans with loan-to-value ratios of up to 100% of the purchase price of the vehicle depending upon the credit history of the borrower and other factors.
We offer consumer loans secured by savings accounts and certificates of deposit held by us based upon the deposit rates plus a margin with terms up to five years. We offer such loans up to 100% of the principal balance of the certificate of deposit or balance in the savings account. We also offer unsecured loans and lines of credit with terms up to five years. Our unsecured loans and lines of credit bear a substantially higher interest rate than our secured loans and lines of credit.
The procedures for underwriting consumer loans include an assessment of the applicant’s payment history on other debts and ability to meet existing obligations and payments on the proposed loan. Although the applicant’s creditworthiness is a primary consideration, the underwriting process also includes a comparison of the value of the collateral, if any, to the proposed loan amount.
We have adhered and continue to adhere to credit policies, both prior to and during the recent economic downturn, which management believes are sound. Our loan policies require verification of information provided by loan applicants as well as an assessment of their ability to repay for all loans. At no time have we made loans similar to those commonly referred to as “no doc” or “stated income” loans.
While the vast majority of the loans in our loan portfolio are secured by collateral, we have made and will continue to make loans on an unsecured basis. Unsecured commercial loans are only granted to those borrowers exhibiting historically strong cash flow and capacity with seasoned management. Unsecured consumer loans are made for relatively short terms and to borrowers with strong credit histories.
We consider requests to modify, restructure or otherwise change the terms of loans on an individual basis as circumstances and/or reasons for such changes may vary. All such changes in terms must be authorized by the
-4-
Table of Contents
appropriate approval body. Also, our credit policy prohibits the modification of loans or the extension of additional credit to borrowers who are not current on their payments. Exceptions are approved only where our position in the credit relationship is expected to be enhanced by such action.
Adjustable-Rate Loans. While we anticipate that adjustable-rate loans will better offset the adverse effects of an increase in interest rates as compared to fixed-rate mortgages, an increased monthly mortgage payment required of adjustable-rate loan borrowers in a rising interest rate environment could cause an increase in delinquencies and defaults. The marketability of collateral also may be adversely affected in a high interest rate environment. In addition, although adjustable-rate mortgage loans make our asset base more responsive to changes in interest rates, the extent of this interest sensitivity is limited by the annual and lifetime interest rate adjustment limits on residential mortgage loans. We attempt to negotiate floors on most adjustable rate commercial loans. The commercial adjustable rate loans generally provide a fixed rate re-negotiation at the end of the initial fixed rate period. If we and the borrower are unable to agree on a new fixed rate then the rate converts to a floating rate obligation. In addition, some commercial loans adjust to a predetermined index plus a spread at the end of the initial fixed rate period, for a like period of time. To a lesser degree, we have entered into transactions with collars generally for periods of five years or less.
Commercial Real Estate Loans. Loans secured by commercial real estate generally have larger balances and involve a greater degree of risk than one-to-four family residential mortgage loans. Of primary concern in commercial real estate lending is the borrower’s and any guarantor’s creditworthiness and the feasibility and cash flow potential of the financed project. Additional considerations include: location, market and geographic concentrations, loan to value, strength of guarantors and quality of tenants. Payments on loans secured by income properties often depend on successful operation and management of the properties. As a result, repayment of such loans may be subject to a greater extent than residential real estate loans, to adverse conditions in the real estate market or the economy. To monitor cash flows on income properties, we require borrowers and loan guarantors, if any, to provide annual consolidated financial statements on commercial real estate loans and rent rolls where applicable. In reaching a decision on whether to make a commercial real estate loan, we consider and review a cash flow analysis of the borrower and guarantor, when applicable, and considers the net operating income of the property, the borrower’s expertise, credit history and profitability and the value of the underlying property. We have generally required that the properties securing these real estate loans have debt service coverage ratios (the ratio of earnings before debt service to debt service) of at least 1.2 times. An environmental report is obtained when the possibility exists that hazardous materials may have existed on the site, or the site may have been impacted by adjoining properties that handled hazardous materials.
Commercial Business Loans. Unlike residential mortgage loans, which generally are made on the basis of the borrower’s ability to make repayment from his or her employment or other income, and which are secured by real property, the value of which tends to be more easily ascertainable, commercial business loans are of higher risk and typically are made on the basis of the borrower’s ability to make repayment from the cash flow of the borrower’s business. As a result, the availability of funds for the repayment of commercial business loans may depend substantially on the success of the business itself. Further, any collateral securing such loans may depreciate over time, may be difficult to appraise and may fluctuate in value.
Consumer Loans. Consumer loans may entail greater risk than do residential mortgage loans, particularly in the case of consumer loans that are unsecured or secured by assets that depreciate rapidly, such as motor vehicles. In the latter case, repossessed collateral for a defaulted consumer loan may not provide an adequate source of repayment for the outstanding loan and a small remaining deficiency often does not warrant further substantial collection efforts against the borrower. Consumer loan collections depend on the borrower’s continuing financial stability, and therefore are likely to be adversely affected by various factors, including job loss, divorce, illness or personal bankruptcy. Furthermore, the application of various federal and state laws, including federal and state insolvency laws, may limit the amount that can be recovered on such loans.
-5-
Table of Contents
Loan Originations. Loan originations come from a number of sources. The primary sources of loan originations are existing customers, walk-in traffic, advertising and referrals from customers. We also purchase participations in loans from local financial institutions to supplement our lending portfolio. Loan participations are subject to the same credit analysis and loan approvals as the loans we originate. We are permitted to review all of the documentation relating to any loan in which we participate. However, in a purchased participation loan, we do not service the loan and are subject to the policies and practices of the lead lender with regard to monitoring delinquencies, pursuing collections and instituting foreclosure proceedings.
Loan Approval Procedures and Authority. Our lending activities follow written, non-discriminatory, underwriting standards and loan origination procedures established by our board of directors and management. The board of directors has granted loan approval authority to certain officers or groups of officers up to prescribed limits, based on the officer’s experience.
Loans to One Borrower. The maximum amount that we may lend to one borrower and the borrower’s related entities generally is limited, by regulation, to 15% of the capital accounts of Peoples Bank. Capital accounts include the aggregate of capital, surplus, undivided profits, capital securities and reserve for loan losses. At December 31, 2014, our regulatory limit on loans to one borrower was $27.4 million.
Deposit Activities
Our primary source of funds is the cash flow provided by our financing activities, mainly deposit gathering. Other sources of funds are provided by investing activities, including principal and interest payments on loans and investment securities, and operating activities, primarily net income. We offer a variety of deposit accounts with a range of interest rates and terms, including, among others: money market accounts; NOW accounts; savings accounts; certificates of deposit; individual retirement accounts, and demand deposit accounts. These deposits are primarily obtained from areas surrounding our branch offices. We rely primarily on marketing, product innovation, technology, service and long-standing relationships with customers to attract and retain these deposits. Other deposit related services include: remote deposit capture; automatic clearing house transactions; cash management services; automated teller machines; point of sale transactions; safe deposit boxes; night depository services; direct deposit, and official check services.
Trust, Wealth Management and Brokerage and Services
Through our trust department, we offer a broad range of fiduciary and investment services. Our trust and investment services include:
| • | investment management |
| • | IRA trustee services |
| • | estate administration |
| • | living trusts |
| • | trustee under will |
| • | guardianships |
| • | life insurance trusts |
| • | custodial services / IRA custodial services |
| • | corporate trusts, and |
| • | pension and profit sharing plans. |
-6-
Table of Contents
We provide a comprehensive array of wealth management products and services through Peoples Advisors, LLC to individuals, small businesses and nonprofit entities. These products and services include the following, among others: investment portfolio management; estate planning; annuities; business succession planning; insurances; education funding strategies, and tax planning.
We have a third party marketing agreement with a broker-dealer that allows us to offer a full range of securities, brokerage services and annuity sales to our customers. Our investor services division is located in our headquarters building and the services are offered throughout the entire branch system. Through this relationship, our clients have access to a wide array of financial and wealth management strategies, including services such as professional money management, retirement and education planning, and investment products including stocks, bonds, mutual funds, annuities and insurance products.
Merchant Services
We offer credit card processing and a variety of other products and services to our merchant customers, including:
| • | small business checking accounts |
| • | merchant money market account |
| • | online banking |
| • | telephone banking |
| • | business credit cards |
| • | merchant line of credit |
| • | business profitability and peer analysis, and |
| • | financial checkup. |
Competition
We compete primarily with commercial banks, thrift institutions and credit unions, many of which are substantially larger in terms of assets and available resources. Certain of these institutions have significantly higher lending limits than we do, and may provide various services for their customers that we presently do not. In addition, we experience competition for deposits from mutual funds and security brokers, while consumer discount, mortgage and insurance companies compete for various types of loans. Credit unions, finance companies and mortgage companies enjoy certain competitive advantages over us, as they are not subject to the same regulatory restrictions and taxations as commercial banks. Principal methods of competing for bank products, permitted nonbanking services and financial activities include price, nature of product, quality of service and convenience of location.
In our market area, interest rates on deposits, especially time deposits, and interest rates and fees charged to customers on loans are very competitive. In the current economic environment there is increased competition in view of weaker loan demand.
We believe that our most significant competitive advantage originates from our business philosophy which includes offering direct access to senior management and other officers and providing friendly, informed and courteous service, local and timely decision making, flexible and reasonable operating procedures and consistently applied credit policies. In addition, our success has been, and will continue to be, a result of our emphasis on community involvement and customer relationships. With consolidation continuing in the financial industry, and particularly in our market area, smaller community banks like us are gaining opportunities and market share as larger institutions reduce their emphasis on or exit the markets.
-7-
Table of Contents
Seasonality
Generally, our operations are not seasonal in nature. Our business activities, however, have been somewhat influenced by the recent increase in activities related to natural gas drilling in our market area, which are to some extent seasonal in nature.
Supervision and Regulation
We are extensively regulated under federal and state laws. Generally, these laws and regulations are intended to protect consumers, not shareholders. The following is a summary description of certain provisions of law that affect the regulation of bank holding companies and banks. This discussion is qualified in its entirety by reference to applicable laws and regulations. Changes in law and regulation may have a material effect on our business and prospects.
Peoples is a bank holding company within the meaning of the Bank Holding Company Act of 1956, as amended, and is subject to regulation, supervision, and examination by the Board of Governors of the Federal Reserve System, referred to as the “Federal Reserve Board” or the “FRB.” We are required to file annual and quarterly reports with the FRB and to provide the FRB with such additional information as the FRB may require. The FRB also conducts examinations of Peoples.
With certain limited exceptions, we are required to obtain prior approval from the FRB before acquiring direct or indirect ownership or control of more than 5% of any voting securities or substantially all of the assets of a bank or bank holding company, or before merging or consolidating with another bank holding company. Additionally, with certain exceptions, any person or entity proposing to acquire control through direct or indirect ownership of 25% or more of our voting securities is required to give 60 days’ written notice of the acquisition to the FRB, which may prohibit the transaction, and to publish notice to the public.
Peoples Bank is regulated by the Pennsylvania Department of Banking and Securities (the “Department of Banking”) and the FDIC. The Department of Banking may prohibit an institution over which it has supervisory authority from engaging in activities or investments that the agency believes constitute unsafe or unsound banking practices. Federal banking regulators have extensive enforcement authority over the institutions they regulate to prohibit or correct activities that violate law, regulation or a regulatory agreement or which are deemed to constitute unsafe or unsound practices.
Enforcement actions may include:
| • | the appointment of a conservator or receiver; |
| • | the issuance of a cease and desist order; |
| • | the termination of deposit insurance, the imposition of civil money penalties on the institution, its directors, officers, employees and institution affiliated parties; |
| • | the issuance of directives to increase capital; |
| • | the issuance of formal and informal agreements and orders; |
| • | the removal of or restrictions on directors, officers, employees and institution-affiliated parties; and |
| • | the enforcement of any such mechanisms through restraining orders or any other court actions. |
We are subject to certain restrictions on extensions of credit to executive officers, directors, principal shareholders or any related interests of such persons which generally require that such credit extensions be made on substantially the same terms as are available to third persons dealing with us, and not involving more than the normal risk of repayment. Other laws tie the maximum amount that may be loaned to any one customer and its related interests to our capital levels.
-8-
Table of Contents
Limitations on Dividends and Other Payments
Our ability to pay dividends is largely dependent upon the receipt of dividends from Peoples Bank. Both federal and state laws impose restrictions on our ability and the ability of Peoples Bank to pay dividends. Under such restrictions, Peoples Bank may only declare and pay dividends out of accumulated net earnings, including accumulated net earnings acquired as a result of a merger within seven years. Further, Peoples Bank may not declare or pay any dividends unless Peoples Bank’s surplus would not be reduced by the payment of the dividend. Pennsylvania law requires that each year Peoples Bank set aside as surplus, a sum equal to not less than 10 percent of its net earnings to maintain the surplus funds equal 100 percent of our capital stock. In addition to these specific restrictions, bank regulatory agencies, in general, also have the ability to prohibit proposed dividends by a financial institution that would otherwise be permitted under applicable regulations if the regulatory body determines that such distribution would constitute an unsafe or unsound practice.
Permitted Non-Banking Activities
Generally, a bank holding company may not engage in any activities other than banking, managing, or controlling its bank and other authorized subsidiaries, and providing service to those subsidiaries. With prior approval of the FRB, we may acquire more than 5% of the assets or outstanding shares of a company engaging in non-bank activities determined by the FRB to be closely related to the business of banking or of managing or controlling banks. The FRB provides expedited procedures for expansion into approved categories of non-bank activities.
Subsidiary banks of a bank holding company are subject to certain quantitative and qualitative restrictions on extensions of credit to the bank holding company or its subsidiaries, and on the use of their securities as collateral for loans to any borrower. These regulations and restrictions may limit our ability to obtain funds from Peoples Bank for our cash needs, including funds for the payment of dividends, interest and operating expenses. Further, subject to certain exceptions, a bank holding company and its subsidiaries are prohibited from engaging in certain tie-in arrangements in connection with any extension of credit, lease or sale of property or furnishing of services.
Under FRB policy, a bank holding company is expected to act as a source of financial strength to its subsidiary banks and to make capital injections into a troubled subsidiary bank, and the FRB may charge the bank holding company with engaging in unsafe and unsound practices for failure to commit resources to a subsidiary bank when required. A required capital injection may be called for at a time when the holding company does not have the resources to provide it. In addition, depository institutions insured by the FDIC can be held liable for any losses incurred by, or reasonably anticipated to be incurred by, the FDIC in connection with the default of or assistance provided to, a commonly controlled FDIC-insured depository institution. Accordingly, in the event that any insured subsidiary of a bank holding company causes a loss to the FDIC, other insured subsidiaries of a bank holding company could be required to compensate the FDIC by reimbursing it for the estimated amount of such loss. Such cross guarantee liabilities generally are superior in priority to the obligation of the depository institutions to its shareholders due solely to their status as shareholders and obligations to other affiliates.
Pennsylvania Law
As a Pennsylvania incorporated bank holding company, Peoples is subject to various restrictions on its activities as set forth in Pennsylvania law. This is in addition to those restrictions set forth in federal law. Under Pennsylvania law, a bank holding company that desires to acquire a bank or bank holding company that has its principal place of business in Pennsylvania must obtain permission from the Department of Banking.
Financial Institution Reform, Recovery, and Enforcement Act (“FIRREA”)
FIRREA was enacted into law in order to address the financial condition of the Federal Savings and Loan Insurance Corporation, to restructure the regulation of the thrift industry, and to enhance the supervisory and
-9-
Table of Contents
enforcement powers of the federal bank and thrift regulatory agencies. As the primary federal regulator of Peoples Bank, the FDIC, in conjunction with the Department of Banking, is responsible for its supervision. When dealing with capital requirements, those regulatory bodies have the flexibility to impose supervisory agreements on institutions that fail to comply with regulatory requirements. The imposition of a capital plan, termination of deposit insurance, and removal or temporary suspension of an officer, director or other institution-affiliated person may cause enforcement actions.
There are three levels of civil penalties under FIRREA.
| • | The first tier provides for civil penalties of up to $5,000 per day for any violation of law or regulation. |
| • | The second tier provides for civil penalties of up to $25,000 per day if more than a minimal loss or a pattern is involved. |
| • | Finally, civil penalties of up to $1 million per day may be assessed for knowingly or recklessly causing a substantial loss to an institution or taking action that results in a substantial pecuniary gain or other benefit. |
Criminal penalties are increased to $1 million per violation and may be up to $5 million for continuing violations or for the actual amount of gain or loss. These penalties may be combined with prison sentences of up to five years. These penalties are subject to adjustment in accordance with inflation adjustment procedures prescribed under applicable law.
Federal Deposit Insurance Corporation Improvement Act of 1991 (“FDICIA”)
FDICIA provides for, among other things:
| • | publicly available annual financial condition and management reports for financial institutions, including audits by independent accountants; |
| • | the establishment of uniform accounting standards by federal banking agencies; |
| • | the establishment of a “prompt corrective action” system of regulatory supervision and intervention, based on capitalization levels, with more scrutiny and restrictions placed on depository institutions with lower levels of capital; |
| • | additional grounds for the appointment of a conservator or receiver; and |
| • | restrictions or prohibitions on accepting brokered deposits, except for institutions which significantly exceed minimum capital requirements. |
A central feature of FDICIA is the requirement that the federal banking agencies take “prompt corrective action” with respect to depository institutions that do not meet minimum capital requirements. Pursuant to FDICIA, the federal bank regulatory authorities have adopted regulations setting forth a five-tiered system for measuring the capital adequacy of the depository institutions that they supervise. Under these regulations, a depository institution is classified in one of the following capital categories:
| • | “well capitalized”; |
| • | “adequately capitalized”; |
| • | “under capitalized”; |
| • | “significantly undercapitalized”; and |
| • | “critically undercapitalized”. |
Peoples Bank was categorized as “well capitalized” under the regulatory framework for prompt corrective action at December 31, 2014, based on the most recent notification from the FDIC. An institution may be deemed by
-10-
Table of Contents
the regulators to be in a capitalization category that is lower than is indicated by its actual capital position if, among other things, it receives an unsatisfactory examination rating with respect to asset quality, management, earnings or liquidity.
Beginning January 1, 2015, all insured depository institutions must incorporate the revised regulatory capital requirements (see Supervision and Regulatory — Regulatory Capital Changes) into the prompt corrective action framework, including the new common equity tier 1 capital asset ratio and a higher tier 1 risk-based capital ratio.
FDICIA generally prohibits a depository institution from making any capital distributions including payment of a cash dividend or paying any management fees to its holding company, if the depository institution would thereafter be undercapitalized. Undercapitalized depository institutions are subject to growth limitations and are required to submit capital restoration plans. If a depository fails to submit an acceptable plan, it is treated as if it is “significantly undercapitalized”. Significantly undercapitalized depository institutions may be subject to a number of other requirements and restrictions, including orders to sell sufficient voting stock to become adequately capitalized, requirements to reduce total assets and stop accepting deposits from correspondent banks. Critically undercapitalized institutions are subject to the appointment of a receiver or conservator; generally within 90 days of the date such institution is determined to be critically undercapitalized.
FDICIA provides the federal banking agencies with significantly expanded powers to take enforcement action against institutions that fail to comply with capital or other standards. Such actions may include the termination of deposit insurance by the FDIC or the appointment of a receiver or conservator for the institution. FDICIA also limits the circumstances under which the FDIC is permitted to provide financial assistance to an insured institution before appointment of a conservator or receiver.
Under FDICIA, each federal banking agency is required to prescribe, by regulation, non-capital safety and soundness standards for institutions under its authority. The federal banking agencies, including the FDIC, have adopted standards covering:
| • | internal controls; |
| • | information systems and internal audit systems; |
| • | loan documentation; |
| • | credit underwriting; |
| • | interest rate exposure; |
| • | asset growth; and |
| • | compensation fees and benefits. |
Any institution that fails to meet these standards may be required to develop an acceptable plan, specifying the steps that the institutions will take to meet the standards. Failure to submit or implement such a plan may subject the institution to regulatory sanctions. Peoples believes that it meets substantially all the standards that have been adopted. FDICIA also imposed new capital standards on insured depository institutions. Before establishing new branch offices, Peoples Bank must meet certain minimum capital stock and surplus requirements and must obtain State approval.
Risk-Based Capital Requirements
The federal banking regulators have adopted certain risk-based capital guidelines to assist in the assessing capital adequacy of a banking organization’s operations for both transactions reported on the balance sheet as assets and transactions, such as letters of credit, and recourse agreements, which are recorded as off-balance sheet items. Under these guidelines, nominal dollar amounts of assets and credit-equivalent amounts of off-balance sheet
-11-
Table of Contents
items are multiplied by one of several risk adjustment percentages, which range from 0% for assets with low credit risk, such as certain US Treasury securities, to 100% for assets with relatively high credit risk, such as business loans.
A banking organization’s risk-based capital ratios are obtained by dividing its qualifying capital by its total risk adjusted assets. The regulators measure risk-adjusted assets, which include off-balance-sheet items, against both total qualifying capital, the sum of Tier 1 capital and limited amounts of Tier 2 capital, and Tier 1 capital.
| • | “Tier 1”, or core capital, includes common equity, perpetual preferred stock and minority interest in equity accounts of consolidated subsidiaries, less goodwill and other intangibles, subject to certain exceptions. |
| • | “Tier 2”, or supplementary capital, includes, among other things, limited life preferred stock, hybrid capital instruments, mandatory convertible securities, qualifying subordinated debt, and the allowance for loan and lease losses, subject to certain limitations and less restricted deductions. The inclusion of elements of Tier 2 capital is subject to certain other requirements and limitations of the federal banking agencies. |
Banks and bank holding companies subject to the risk-based capital guidelines are required to maintain a ratio of Tier 1 capital to risk-weighted assets of at least 4.00% and a ratio of total capital to risk-weighted assets of at least 8%. The appropriate regulatory authority may set higher capital requirements when particular circumstances warrant. At December 31, 2014, Peoples met both requirements with Tier 1 and Total capital ratios of 14.75% and 15.61%. In addition to risk-based capital, banks and bank holding companies are required to maintain a minimum amount of Tier 1 capital to total assets, referred to as the Leverage capital ratio, of at least 4.00%. At December 31, 2014, Peoples’ Leverage ratio was 10.76%.
Failure to meet applicable capital guidelines could subject a banking organization to a variety of enforcement actions including:
| • | limitations on its ability to pay dividends; |
| • | the issuance by the applicable regulatory authority of a capital directive to increase capital, and in the case of depository institutions, the termination of deposit insurance by the FDIC, as well as to the measures described under FDICIA as applicable to undercapitalized institutions. |
In addition, future changes in regulations or practices could further reduce the amount of capital recognized for purposes of capital adequacy. Such a change could affect the ability of Peoples Bank to grow and could restrict the amount of profits, if any, available for the payment of dividends to Peoples.
Regulatory Capital Changes
In July 2013, the federal banking agencies issued final rules to implement the Basel III regulatory capital reforms and changes required by the Dodd-Frank Act. The phase-in period for community banking organizations begins January 1, 2015, while larger institutions (generally those with assets of $250 billion or more) began compliance on January 1, 2014. The final rules call for the following capital requirements:
| • | A minimum ratio of common equity tier 1 capital to risk-weighted assets of 4.5%. |
| • | A minimum ratio of tier 1 capital to risk-weighted assets of 6%. |
| • | A minimum ratio of total capital to risk-weighted assets of 8% (no change from the current rule). |
| • | A minimum Leverage ratio of 4%. |
In addition, the final rules establish a common equity tier 1 capital conservation buffer of 2.5% of risk-weighted assets applicable to all banking organizations. If a banking organization fails to hold capital above the minimum
-12-
Table of Contents
capital ratios and the capital conservation buffer, it will be subject to certain restrictions on capital distributions and discretionary bonus payments. The phase-in period for the capital conservation and countercyclical capital buffers for all banking organizations will begin on January 1, 2016.
Under the proposed rules, accumulated other comprehensive income (AOCI) would have been included in a banking organization’s common equity tier 1 capital. The final rules allow community banks to make a one-time election not to include these additional components of AOCI in regulatory capital and instead use the existing treatment under the general risk-based capital rules that excludes most AOCI components from regulatory capital. The opt-out election must be made in the first call report or FR Y-9 series report that is filed after the financial institution becomes subject to the final rule. On January 30, 2015, Peoples Board of Directors adopted a resolution to “opt-out” of the inclusion of the components of AOCI in regulatory capital.
The final rules permanently grandfather non-qualifying capital instruments (such as trust preferred securities and cumulative perpetual preferred stock) issued before May 19, 2010 for inclusion in the tier 1 capital of banking organizations with total consolidated assets less than $15 billion as of December 31, 2009 and banking organizations that were mutual holding companies as of May 19, 2010.
Consistent with the Dodd-Frank Act, the new rules replace the ratings-based approach to securitization exposures, which is based on external credit ratings, with the simplified supervisory formula approach in order to determine the appropriate risk weights for these exposures. Alternatively, banking organizations may use the existing gross-up approach to assign securitization exposures to a risk weight category or choose to assign such exposures a 1,250 percent risk weight.
Under the new rules, mortgage servicing assets (MSAs) and certain deferred tax assets (DTAs) are subject to stricter limitations than those applicable under the current general risk-based capital rule. The new rules also increase the risk weights for past-due loans, certain commercial real estate loans, and some equity exposures, and makes selected other changes in risk weights and credit conversion factors.
If Peoples was subject to the final rules in 2014, its ratio of common equity tier 1 capital to risk-weighted assets would be 14.75%; its ratio of tier 1 capital to risk-weighted assets would be 14.75%; its ratio of total capital to risk-weighted assets would be 15.61%; and its Leverage ratio would be 10.76%.
Peoples is in the process of assessing the impact of these changes on the regulatory ratios of Peoples and Peoples Bank on the capital, operations, liquidity and earnings of Peoples and Peoples Bank.
Interest Rate Risk
Regulatory agencies include, in their evaluations of a bank’s capital adequacy, an assessment of the bank’s interest rate risk exposure. The standards for measuring the adequacy and effectiveness of a banking organization’s interest rate risk management includes a measurement of board of directors and senior management oversight, and a determination of whether a banking organization’s procedures for comprehensive risk management are appropriate to the circumstances of the specific banking organization. We utilize internal interest rate risk models to measure and monitor interest rate risk. In addition, we employ an independent consultant to provide a quarterly assessment of our interest rate risk. Finally, regulatory agencies, as part of the scope of their periodic examinations, evaluate our interest rate risk.
Community Reinvestment Act (“CRA”)
The Community Reinvestment Act of 1977 is designed to create a system for bank regulatory agencies to evaluate a depository institution’s record in meeting the credit needs of its community. The CRA regulations were completely revised as of July 1, 1995, to establish performance-based standards for use in examining for compliance. Peoples Bank had its last CRA compliance examination in 2013 and received a “satisfactory” rating.
-13-
Table of Contents
USA Patriot Act of 2001
The Patriot Act contains anti-money laundering and financial transparency laws and imposes various regulations, including standards for verifying client identification at account opening, and rules to promote cooperation among financial institutions, regulators and law enforcement entities in identifying parties that may be involved in terrorism or money laundering.
Dodd-Frank Wall Street Reform and Consumer Protection Act (Dodd-Frank)
In 2010, the Dodd-Frank Wall Street Reform and Consumer Protection Act was signed into law. Dodd-Frank is intended to effect a fundamental restructuring of federal banking regulation. Among other things, Dodd-Frank created the Financial Stability Oversight Council to identify systemic risks in the financial system and gives federal regulators authority to take control of and liquidate financial firms. Dodd-Frank additionally created an independent federal regulator to administer federal consumer protection laws. Dodd-Frank has and is expected to continue to have a significant impact on our business operations as its provisions take effect. It is expected that, as various implementing rules and regulations continue to be released, they will increase our operating and compliance costs and could increase our interest expense. Among the provisions that affect us or are likely to affect us are the following:
Holding Company Capital Requirements
Dodd-Frank requires the FRB to apply consolidated capital requirements to bank holding companies that are no less stringent than those currently applied to depository institutions. Under these standards, trust preferred securities will be excluded from Tier 1 capital unless such securities were issued prior to May 19, 2010, by a bank holding company with less than $15 billion in assets. Dodd-Frank additionally requires that bank regulators issue countercyclical capital requirements so that the required amount of capital increases in times of economic expansion, consistent with safety and soundness.
Deposit Insurance
Dodd-Frank permanently increases the maximum deposit insurance amount for banks, savings institutions and credit unions to $250,000 per depositor. Dodd-Frank also broadens the base for FDIC insurance assessments. Assessments are now based on the average consolidated total assets less tangible equity capital of a financial institution. Dodd-Frank requires the FDIC to increase the reserve ratio of the Deposit Insurance Fund from 1.15% to 1.35% of insured deposits by 2020 and eliminates the requirement that the FDIC pay dividends to insured depository institutions when the reserve ratio reaches 1.50% of insured deposits. In lieu of the dividend payments, the FDIC has adopted progressively lower assessment rate schedules that become effective when the reserve ratio exceeds 2.0% and 2.5%. exceeds certain thresholds. Further, Dodd-Frank eliminated the federal statutory prohibition against the payment of interest on business checking accounts.
Corporate Governance
Dodd-Frank requires publicly-traded companies to give stockholders a non-binding vote on executive compensation at least every three years, a non-binding vote regarding the frequency of the vote on executive compensation at least every six years, and a non-binding vote on “golden parachute” payments in connection with approvals of mergers and acquisitions unless previously voted on by stockholders. Additionally, Dodd-Frank directs the federal banking regulators to promulgate rules prohibiting excessive compensation paid to executives of depository institutions and their holding companies with assets in excess of $1.0 billion, regardless of whether the company is publicly traded. Dodd-Frank also gives the SEC authority to prohibit broker discretionary voting on elections of directors and executive compensation matters.
-14-
Table of Contents
Prohibition Against Charter Conversions of Troubled Institutions
Dodd-Frank prohibits a depository institution from converting from a state to a federal charter, or vice versa, while it is the subject of a cease and desist order or other formal enforcement action or a memorandum of understanding with respect to a significant supervisory matter unless the appropriate federal banking agency gives notice of the conversion to the federal or state authority that issued the enforcement action and that agency does not object within 30 days. The notice must include a plan to address the significant supervisory matter. The converting institution must also file a copy of the conversion application with its current federal regulator, which must notify the resulting federal regulator of any ongoing supervisory or investigative proceedings that are likely to result in an enforcement action and provide access to all supervisory and investigative information relating thereto.
Interstate Branching
Dodd-Frank authorizes national and state banks to establish branches in other states to the same extent as a bank chartered by that state would be permitted. Previously, banks could only establish branches in other states if the host state expressly permitted out-of-state banks to establish branches in that state. Accordingly, banks are able to enter new markets more freely.
Limits on Interstate Acquisitions and Mergers
Dodd-Frank precludes a bank holding company from engaging in an interstate acquisition–the acquisition of a bank outside its home state–unless the bank holding company is both well capitalized and well managed. Furthermore, a bank may not engage in an interstate merger with another bank headquartered in another state unless the surviving institution will be well capitalized and well managed. The previous standard in both cases was adequately capitalized and adequately managed.
Limits on Interchange Fees
Dodd-Frank amended the Electronic Fund Transfer Act to, among other things, give the Federal Reserve the authority to establish rules regarding interchange fees charged for electronic debit transactions by payment card issuers having assets over $10 billion and to enforce a statutory requirement that such fees be reasonable and proportional to the actual cost of a transaction to the issuer. The Federal Reserve issued its final rule, Regulation II, effective October 1, 2011. Consistent with Dodd-Frank, issuers with less than $10 billion in assets, like us, are exempt from debit card interchange fee standards.
Consumer Financial Protection Bureau
Dodd-Frank created the Consumer Financial Protection Bureau (CFPB), which is granted broad rulemaking, supervisory and enforcement powers under various federal consumer financial protection laws, including the Equal Credit Opportunity Act, Truth in Lending Act, Real Estate Settlement Procedures Act, Fair Credit Reporting Act, Fair Debt Collection Act, Consumer Financial Privacy provisions of the Gramm-Leach-Bliley Act, and certain other statutes. The CFPB has examination and primary enforcement authority with respect to depository institutions with $10 billion or more in assets. Smaller institutions are subject to rules promulgated by the CFPB, but continue to be examined and supervised by federal banking regulators for consumer compliance purposes. The CFPB has authority to prevent unfair, deceptive or abusive practices in connection with the offering of consumer financial products. Dodd-Frank authorizes the CFPB to establish certain minimum standards for the origination of residential mortgages including a determination of the borrower’s ability to repay. In addition, Dodd-Frank allows borrowers to raise certain defenses to foreclosure if they receive any loan other than a “qualified mortgage” as defined by the CFPB. Dodd-Frank permits states to adopt consumer protection laws and standards that are more stringent than those adopted at the federal level and, in certain circumstances, permits state attorneys general to enforce compliance with both the state and federal laws and regulations.
-15-
Table of Contents
Ability to Repay and Qualified Mortgage Rule
Pursuant to the Dodd Frank Act, the Consumer Financial Protection Bureau issued a final rule on January 10, 2013, which became effective January 10, 2014, amending Regulation Z as implemented by the Truth in Lending Act, requiring mortgage lenders to make a reasonable and good faith determination based on verified and documented information that a consumer applying for a mortgage loan has a reasonable ability to repay the loan according to its terms. Mortgage lenders are required to determine consumers’ ability to repay in one of two ways. The first alternative requires the mortgage lender to consider the following eight underwriting factors when making the credit decision:
| • | current or reasonably expected income or assets; |
| • | current employment status; |
| • | the monthly payment on the covered transaction; |
| • | the monthly payment on any simultaneous loan; |
| • | the monthly payment for mortgage-related obligations; |
| • | current debt obligations, alimony, and child support; |
| • | the monthly debt-to-income ratio or residual income; and |
| • | credit history. |
Alternatively, the mortgage lender can originate “qualified mortgages,” which are entitled to a presumption that the creditor making the loan satisfied the ability-to-repay requirements. In general, a “qualified mortgage” is a mortgage loan without negative amortization, interest-only payments, balloon payments, or terms exceeding 30 years. In addition, to be a qualified mortgage, the points and fees paid by a consumer cannot exceed 3% of the total loan amount. Loans which meet these criteria will be considered qualified mortgages, and as a result generally protect lenders from fines or litigation in the event of foreclosure. Qualified mortgages that are “higher-priced” (e.g. subprime loans) garner a rebuttable presumption of compliance with the ability-to-repay rules, while qualified mortgages that are not “higher-priced” (e.g. prime loans) are given a safe harbor of compliance. The final rule, as issued, is not expected to have a material impact on our lending activities or our results of operations or financial condition.
Future Legislation
Proposed legislation is introduced in almost every legislative session that would dramatically affect the regulation of the banking industry. We cannot predict if any such legislation will be adopted nor if adopted how it would affect our business. Past history has demonstrated that new legislation or changes to existing laws or regulations usually results in greater compliance burden and therefore generally increases the cost of doing business.
Employees
As of December 31, 2014, we had 354 full-time-equivalent employees. We are not parties to any collective bargaining agreements and we consider our employee relations to be good.
Availability of Securities Filings
We file annual, quarterly, and current reports, proxy statements, and other documents with the SEC under the Exchange Act. The public may read and copy any materials that we file with the SEC at the SEC’s Public Reference Room at Station Place, 100 F Street, N.E., Washington, DC 20549. The public may obtain information on the operation of the Public Reference Room by calling the SEC at 1-800-SEC-0330. Also, the SEC maintains
-16-
Table of Contents
an Internet website that contains reports, proxy and information statements, and other information regarding issuers, including us, that file electronically with the SEC. The public can obtain any documents that we file with the SEC at http://www.sec.gov.
In addition, we maintain an Internet website at www.peoplesnatbank.com. We make available free of charge through the “Investor Relations” link on our Internet website, our annual report on Form 10-K, quarterly reports on Form 10-Q, current reports on Form 8-K, and amendments to those reports filed or furnished pursuant to Section 13(a) or 15(d) of the Exchange Act as soon as reasonably practicable after we electronically file such material with, or furnish it to, the SEC.
| Item 1A. | Risk Factors. |
In addition to the other information set forth in this report, one should carefully consider the factors discussed below, which could materially affect our business, financial condition or future results. The risks described below are not the only risks that we face. Additional risks and uncertainties not currently known to us or that we currently deem to be insignificant also may materially adversely affect our business, financial condition and/or operating results.
Risks Relating to Peoples and Its Business
We are subject to credit risk in connection with our lending activities, and our financial condition and results of operations may be negatively impacted by economic conditions and other factors that adversely affect our borrowers.
Lending money is a significant part of the banking business and interest income on our loan portfolio is the principle component of our revenue. Our financial condition and results of operations are affected by the ability of our borrowers to repay their loans, and in a timely manner. Borrowers, however, do not always repay their loans. The risk of non-payment is assessed through our underwriting and loan review procedures based on several factors including credit risks of a particular borrower, changes in economic conditions, the duration of the loan and in the case of a collateralized loan, uncertainties as to the future value of the collateral and other factors. Despite our efforts, we do and will experience loan and lease losses, and our financial condition and results of operations will be adversely affected. Our loans which were between 30 and 89 days delinquent totaled $9.5 million on December 31, 2014. Our non-performing assets were approximately $10.9 million on December 31, 2014, including $2.8 million of loans acquired as part of the merger net of the remaining credit adjustment of $2.6 million. Our allowance for loan and lease losses was approximately $10.3 million on December 31, 2014.
Our emphasis on the Northeastern Pennsylvania and Southern New York market area exposes us to a risk of loss associated with the region.
At December 31, 2014, $310.7 million or 25.7%, of our loan portfolio consisted of residential mortgage loans and $493.5 million or 40.8%, of our loan portfolio consisted of commercial real estate loans. A significant majority of these loans are made to borrowers or secured by properties located in Northeastern Pennsylvania and Broome County, New York. As a result of this concentration, a sustained downturn in the regional economy could significantly increase non-performing loans, which would hurt our net income. Future declines in real estate values in the region could also cause some of our mortgage and commercial real estate loans to be inadequately collateralized, which would expose us to a greater risk of loss if we seek to recover on defaulted loans by selling the real estate collateral.
We make commercial and industrial, construction, and commercial real estate loans, which present greater risks than other types of loans.
As of December 31, 2014, approximately 67.2% of our loan portfolio consisted of commercial and industrial, construction, and commercial real estate loans. These types of loans are generally viewed as having more risk of
-17-
Table of Contents
default than residential real estate loans or consumer loans. These types of loans are also typically larger than residential real estate loans and consumer loans. Because our loan portfolio contains a significant number of commercial and industrial, construction, and commercial real estate loans some of which have large balances, the deterioration of one or a few of these loans could cause a significant increase in non-performing loans. An increase in non-performing loans could result in a net loss of earnings from these loans, an increase in the provision for loan losses, and an increase in loan charge-offs, all of which could have a material adverse effect on our financial condition and results of operations.
The commercial real estate market is cyclical and poses risks of loss to us because of the concentration of commercial real estate loans in our loan portfolio, and the lack of diversity in risk associated with such a concentration. Banking regulators have been giving and continue to give commercial real estate lending greater scrutiny, and banks with larger commercial real estate loan portfolios are expected by their regulators to implement improved underwriting, internal controls, risk management policies and portfolio stress-testing practices to manage risks associated with commercial real estate lending. In addition, commercial real estate lenders have made greater provisions for loan and lease losses as a result of commercial real estate lending exposures. Additional losses or regulatory requirements related to our commercial real estate loan concentration could materially adversely affect our business, financial condition and results of operations.
Our allowance for loan and lease losses may not be adequate to absorb actual loan and lease losses, and we may be required to make further provisions for loan and lease losses and charge off additional loans in the future, which could materially and adversely affect our business.
We attempt to maintain an allowance for loan and lease losses, established through a provision for loan and lease losses accounted for as an expense, which is adequate to absorb losses inherent in our loan portfolio. If our allowance for loan and lease losses is inadequate, it may have a material adverse effect on our financial condition and results of operations.
The determination of the allowance for loan and lease losses involves a high degree of subjectivity and judgment and requires us to make significant estimates of current credit risks and future trends, all of which may undergo material changes. Changes in economic conditions affecting borrowers, new information regarding existing loans, identification of additional problem loans and other factors, both within and outside of our control, may require us to increase our allowance for loan and lease losses. Increases in non-performing loans have a significant impact on our allowance for loan and lease losses. Our allowance for loan and lease losses may not be adequate to absorb actual loan and lease losses. If conditions in our regional real estate markets continue, we could continue to experience increased delinquencies and credit losses, particularly with respect to real estate construction and land acquisition and development loans and one-to-four family residential mortgage loans. Moreover, we expect that the current economy will negatively impact our market areas and that we could experience higher delinquencies and credit losses. As a result, we will continue to make provisions for loan and lease losses and to charge off additional loans in the future, which could materially adversely affect our financial conditions and results of operations.
In addition to our internal processes for determining loss allowances, bank regulatory agencies periodically review our allowance for loan and lease losses and may require us to increase the provision for loan and lease losses, to recognize further loan charge-offs, or to take other actions, based on judgments that differ from those of our management. If loan charge-offs in future periods exceed the allowance for loan and lease losses, we will need to increase our allowance for loan lease losses. Furthermore, growth in our loan portfolio would generally lead to an increase in the provision for loan and lease losses. Any increases in our allowance for loan and lease losses will result in a decrease in net income and capital, and may have a material adverse effect on our financial condition, results of operations and cash flows.
-18-
Table of Contents
Changes in interest rates could adversely impact our financial condition and results of operations.
Our ability to generate net income substantially depends upon our net interest income, which is the difference between the interest income earned on interest-earning assets, such as loans and investment securities, and the interest expense paid on interest-bearing liabilities, such as deposits and borrowings. Certain assets and liabilities react differently to changes in market interest rates. Further, interest rates on some types of assets and liabilities may fluctuate prior to changes in broader market interest rates, while rates on other types of assets may lag behind. Additionally, some assets such as adjustable-rate mortgages have features, and rate caps, which restrict changes in their interest rates.
Factors such as inflation, recession, unemployment, money supply, global disorder, terrorist activity, instability in domestic and foreign financial markets, and other factors beyond our control, may affect interest rates. Changes in market interest rates will also affect the level of voluntary prepayments on loans and the receipt of payments on mortgage-backed securities, resulting in the receipt of proceeds that may have to be reinvested at a lower rate than the loan or mortgage-backed security being prepaid. Although we pursue an asset-liability management strategy designed to manage our risk from changes in market interest rates, changes in interest rates can still have a material adverse effect on our profitability.
Changes in interest rates could affect our investment values and impact comprehensive income and stockholders’ equity.
At December 31, 2014, we had approximately $339.6 million of securities available-for-sale. These securities are carried at fair value on our consolidated balance sheets. Unrealized gains or losses on these securities, that is, the difference between the fair value and the amortized cost of these securities, are reflected in stockholders’ equity, net of deferred taxes. As of December 31, 2014, our available-for-sale securities had an unrealized gain, net of taxes, of $4.1 million. The fair value of our available-for-sale securities is subject to interest rate change, which would not affect recorded earnings, but would increase or decrease comprehensive income and stockholders’ equity.
Our results of operations may be materially and adversely affected by other-than-temporary impairment charges relating to our investment portfolio.
Numerous factors, including the lack of liquidity for re-sales of certain investment securities, the absence of reliable pricing information for investment securities, adverse changes in the business climate, adverse regulatory actions or unanticipated changes in the competitive environment, could have a negative effect on our investment portfolio in future periods. Investments are evaluated periodically to determine whether a decline in their value is other than temporary. Management utilizes criteria such as the magnitude and duration of the decline, in addition to the reasons underlying the decline, to determine whether the loss in value is other than temporary. The term “other than temporary” indicates that the prospects for a near term recovery of value are not necessarily favorable, or that there is a lack of evidence to support fair values equal to, or greater than, the carrying value of the investment.
Once a decline in value is determined to be other than temporary, the value of the security is reduced and a corresponding charge to earnings is recognized. If an impairment charge is significant enough, it could affect our ability to pay dividends, which could materially adversely affect us and our ability to pay dividends to shareholders. Significant impairment charges could also negatively impact our regulatory capital ratios and result in us not being classified as “well-capitalized” for regulatory purposes.
The requirement to record certain assets and liabilities at fair value may adversely affect our financial results.
We report certain assets, including available-for-sale investment securities, at fair value. Generally, for assets that are reported at fair value we use quoted market prices or valuation models that utilize market data inputs to estimate fair value. Because we record these assets at their estimated fair value, we may incur losses even if the
-19-
Table of Contents
asset in question presents minimal credit risk. The level of interest rates can impact the estimated fair value of investment securities. Disruptions in the capital markets may require us to recognize other-than-temporary impairments in future periods with respect to investment securities in our portfolio. The amount and timing of any impairment recognized will depend on the severity and duration of the decline in fair value of our investment securities and our estimation of the anticipated recovery period.
Changes in the value of goodwill and intangible assets could reduce our earnings.
We account for goodwill and other intangible assets in accordance with GAAP, which, in general, requires that goodwill not be amortized, but rather that it be tested for impairment at least annually at the reporting unit level using the two step approach. Testing for impairment of goodwill and intangible assets is performed annually and involves the identification of reporting units and the estimation of fair values. The estimation of fair values involves a high degree of judgment and subjectivity in the assumptions used. As of December 31, 2014, the market value of our shares exceeded the recorded book value. Changes in the local and national economy, the federal and state legislative and regulatory environments for financial institutions, the stock market, interest rates and other external factors (such as natural disasters or significant world events) may occur from time to time, often with great unpredictability, and may materially impact the fair value of publicly traded financial institutions and could result in an impairment charge at a future date.
Our results of operations, financial condition or liquidity may be adversely impacted by issues arising from certain industry deficiencies in foreclosure practices, including delays and challenges in the foreclosure process.
Over the past few years, foreclosure time lines have increased due to, among other reasons, delays associated with the significant increase in the number of foreclosure cases as a result of the economic downturn, federal and state legal and regulatory actions, including additional consumer protection initiatives related to the foreclosure process and voluntary and, in some cases, mandatory programs intended to permit or require lenders to consider loan modifications or other alternatives to foreclosure. Further increases in the foreclosure time-line may have an adverse effect on collateral values and our ability to minimize our losses.
Difficult market conditions have adversely affected our industry.
We are operating in a challenging economic environment, including generally uncertain national and local conditions. Additional concerns from some of the countries in the European Union and elsewhere have also strained the financial markets both abroad and domestically. Although there has been some improvement in the overall global macroeconomic conditions in 2014, financial institutions continue to be affected by conditions in the real estate market and the constrained financial markets. In recent years, declines in the housing market, increases in unemployment and under-employment have negatively impacted the credit performance of loans and resulted in significant write-downs of asset values by financial institutions. Reflecting concern over economic conditions, many lenders and institutional investors have reduced or ceased providing funding to borrowers. A worsening of economic conditions may impact our results of operations and financial condition. In particular, we may face the following risks in connection with these events:
| • | Loan delinquencies could increase further; |
| • | Problem assets and foreclosures could increase further; |
| • | Demand for our products and services could decline; |
| • | Collateral for loans made by us, especially real estate, could decline further in value, in turn reducing a customer’s borrowing power, and reducing the value of assets and collateral associated with our loans; and |
| • | Investments in mortgage-backed securities could decline in value as a result of performance of the underlying loans or the diminution of the value of the underlying real estate collateral pressing the government sponsored agencies to honor its guarantees to principal and interest. |
-20-
Table of Contents
Our operations are concentrated in northeastern Pennsylvania and southern New York. As a result of this geographic concentration, our financial results may correlate to the economic conditions in these areas. Deterioration in economic conditions in this market area, particularly in the industries on which this geographic area depend, or a general decline in economic conditions may adversely affect the quality of our loan portfolio (including the level of non-performing assets, charge offs and provision expense) and demand for our products and services, and, accordingly, our results of operations.
Strong competition within our market area may limit our growth and profitability.
Competition in the banking and financial services industry is intense. We compete actively with other northeastern Pennsylvania and southern New York financial institutions, many larger than us, as well as with financial and non-financial institutions headquartered elsewhere. Commercial banks, savings banks, savings and loan associations, credit unions, and money market funds actively compete for deposits and loans. Such institutions, as well as consumer finance, insurance companies and brokerage firms, may be considered competitors with respect to one or more services they render. Many of the institutions with which we compete have substantially greater resources and lending limits and may offer certain services that we do not or cannot provide. Our profitability depends upon our ability to successfully compete in our market area.
A major portion of our net income comes from our interest rate spread, which is the difference between the interest rates paid by us on amounts used to fund assets and the interest rates and fees we receive on our interest-earning assets. Our interest-earning assets include outstanding loans extended to our customers and securities held in our investment portfolio. We fund assets using deposits and other borrowings. Our goal has been to maintain noninterest-bearing deposits in the range of 15.0% to 30.0% of total deposits and, as of December 31, 2014, approximately 22.0% of our deposits were noninterest bearing.
Increased needs for disbursement of funds on loans and deposits can affect our liquidity.
We manage our liquidity with an objective of maintaining a balance between sources and uses of funds in such a way that the cash requirements of customers for loans and deposit withdrawals are met in the most economical manner. If we do not properly manage our liquidity, our business, financial condition, results of operations and cash flows may be materially and adversely affected.
Our future pension plan costs and contributions could be unfavorably impacted by the factors that are used in the actuarial calculations.
As part of the Penseco merger, we assumed Penseco’s legacy non-contributory defined benefit pension plan, which was frozen by Penseco in 2008. The costs for this legacy pension plan are dependent upon a number of factors, such as the rates of return on plan assets, discount rates, the level of interest rates used to measure the required minimum funding levels of the plans, future government regulation and required or voluntary contributions made to the plans. Without sustained growth in the pension investments over time to increase the value of our plan assets and depending upon the other factors impacting our costs as listed above, we could be required to fund the plan with higher amounts of cash than are anticipated by our actuaries. Such increased funding obligations could have a material impact on our liquidity by reducing our cash flows.
Our holding company is dependent for liquidity on payments from Peoples Bank, which payments are subject to restrictions.
We depend on dividends, distributions and other payments from Peoples Bank to fund dividend payments to our shareholders, if any, and to fund all payments on obligations of our holding company. Peoples Bank is subject to laws that restrict dividend payments or authorize regulatory bodies to block or reduce the flow of funds from Peoples Bank to us. Restrictions or regulatory actions of that kind could impede our access to funds that we may need to make payments on our obligations or dividend payments, if any. In addition, our right to participate in a
-21-
Table of Contents
distribution of assets upon a subsidiary’s liquidation or reorganization is subject to the prior claims of the subsidiary’s creditors. Holders of our common stock are entitled to receive dividends if and when declared from time to time by our board of directors in its sole discretion out of funds legally available for that purpose.
We need to continually attract and retain qualified personnel for our operations.
Our ability to provide high-quality customer service and to operate efficiently and profitably is dependent on our ability to attract and retain qualified individuals for key positions within the organization. We rely heavily on our executive officers and employees. The loss of certain executive officers or employees could have an adverse effect on us because, as a community bank, the executive officers and employees typically have more responsibility than would be typical at a larger financial institution with more employees. In addition, due to our size as a community bank, we have fewer management-level and other personnel who are in position to succeed to and assume the responsibilities of certain existing executive officers and employees. If we expand geographically or expand to provide non-banking services, current management may not have the necessary experience for successful operation in these new areas. There is no guarantee that management would be able to meet these new challenges or that we would be able to retain new directors or personnel with the appropriate background and expertise.
Our financial performance may suffer if our information technology is unable to keep pace with growth or industry developments.
Effective and competitive delivery of our products and services is increasingly dependent upon information technology resources and processes, both those provided internally as well as those provided through third party vendors. In addition to better serving customers, the effective use of technology increases efficiency and enables us to reduce costs. Our future success will depend, in part, upon our ability to address the needs of our customers by using technology to provide products and services to enhance customer convenience, as well as to create additional efficiencies in our operations. Many of our competitors have greater resources to invest in technological improvements. Additionally, as technology in the financial services industry changes and evolves, keeping pace becomes increasingly complex and expensive for us. There can be no assurance that we will be able to effectively implement new technology-driven products and services, which could reduce our ability to compete effectively.
A failure in or a breach of our information systems or infrastructure, including as a result of cyber-attacks, could disrupt our business, damage our reputation, and could have a material adverse effect on our business, financial condition and results of operations.
In the ordinary course of our business activities, including the ongoing maintenance of deposits, loan and other account relationships for our customers, receiving instructions and effecting transactions for those customers and other users of our products and services, we regularly collect, process, transmit and store significant amounts of confidential information regarding our customers, employees and others. In addition to confidential information regarding our customers, employees and others, we, and in some cases a third party, compile, process, transmit and store proprietary, non-public information concerning our business, operations, plans and strategies.
Information security risks have significantly increased in recent years in part because of the proliferation of new technologies, the use of the Internet and telecommunications technologies to conduct financial transactions, and the increased sophistication and activities of organized crime, hackers, terrorists and other external parties. We rely on digital technologies, computer and email systems, software, and networks to conduct secure processing, transmission and storage of confidential information. In addition, to access our products and services, our customers may use personal smart phones, tablet PCs and other mobile devices that are beyond our control systems. Our technologies, systems, networks and our customers’ devices have been subject to, and are likely to continue to be the target of, cyber-attacks, computer viruses, malicious code, phishing attacks or information security breaches that could result in the unauthorized use, loss or destruction of our or our customers’
-22-
Table of Contents
confidential information, or otherwise disrupt our or our customers’ or other third parties’ business operations. We believe that it is more likely than not that such attempted attacks may continue.
Although we use a variety of physical, procedural and technological safeguards to protect confidential information from mishandling, misuse or loss, these safeguards cannot provide assurance that mishandling, misuse or loss of the information will not occur, and that if mishandling, misuse or loss of the information did occur, those events will be promptly detected and addressed. A failure in or breach of our operational or information security system, or those of a third-party service provider, as a result of cyber-attacks or information security breaches could have a material adverse effect on our business, damage our reputation, increase our costs and/or cause significant losses. As information security risks and cyber threats continue to evolve, we may be required to expend substantial resources to further enhance our information security measures and/or to investigate and remediate any information security vulnerabilities.
If information security is breached, despite the controls we and our third-party vendors have instituted, information can be lost or misappropriated, resulting in financial loss or costs to us or damages to others. These costs or losses could materially exceed the amount of insurance coverage, if any, which would adversely affect our earnings. In addition, our reputation could be damaged which could result in loss of customers, greater difficulty in attracting new customers, or an adverse effect on the value of our common stock.
Our disclosure controls and procedures and our internal control over financial reporting may not achieve their intended objectives.
We maintain disclosure controls and procedures designed to ensure that we timely report information as specified in the rules and forms of the Securities and Exchange Commission. We also maintain a system of internal control over financial reporting. These controls may not achieve their intended objectives. Control processes that involve human diligence and compliance, such as our disclosure controls and procedures and internal control over financial reporting, are subject to lapses in judgment and breakdowns resulting from human failures. Controls can also be circumvented by collusion or improper management override. Because of such limitations, there are risks that material misstatements due to error or fraud may not be prevented or detected and that information may not be reported on a timely basis. If our controls are not effective, it could have a material adverse effect on our financial condition, results of operations, and market for our common stock, and could subject us to regulatory scrutiny.
We are exposed to environmental liabilities with respect to real estate.
We currently operate 26 branch offices, and own additional real estate. In addition, a significant portion of our loan portfolio is secured by real property. In the course of our business, we may foreclose, accept deeds in lieu of foreclosure, or otherwise acquire real estate, and in doing so could become subject to environmental liabilities with respect to these properties. We may become responsible to a governmental agency or third parties for property damage, personal injury, investigation and clean-up costs incurred by those parties in connection with environmental contamination, or may be required to investigate or clean-up hazardous or toxic substances, or chemical releases at a property. The costs associated with environmental investigation or remediation activities could be substantial. In addition, as the owner or former owner of a contaminated site, we may be subject to common law claims by third parties based on damages and costs resulting from environmental contamination emanating from the property. Although we have policies and procedures to perform an environmental review before acquiring title to any real property, these may not be sufficient to detect all potential environmental hazards. If we were to become subject to significant environmental liabilities, it could materially and adversely affect us.
The soundness of other financial services institutions may adversely affect our credit risk.
We rely on other financial services institutions through trading, clearing, counterparty, and other relationships. We maintain limits and monitor concentration levels of our counterparties as specified in our internal policies.
-23-
Table of Contents
Our reliance on other financial services institutions exposes us to credit risk in the event of default by these institutions or counterparties. These losses could adversely affect our results of operations and financial condition.
Risks Related to Our Common Stock
Our ability to pay dividends or repurchase shares is subject to limitations.
The Penseco merger agreement contemplates that, unless 80 percent of our board of directors determines otherwise, we will pay a quarterly cash dividend in an amount no less than $0.31 per share through 2018, provided that sufficient funds are legally available, and that Peoples and Peoples Bank remain “well-capitalized” in accordance with applicable regulatory guidelines.
Our ability to pay dividends on our stock depends upon our receipt of dividends from Peoples Bank and its subsidiaries. As a state-chartered bank, Peoples Bank is subject to regulatory restrictions on the payment and amounts of dividends under the Pennsylvania Banking Code.
Further, Peoples Bank’s ability to pay dividends is also subject to its profitability, financial condition, capital expenditures and other cash flow requirements. There is no assurance that Peoples Bank will be able to pay the dividends contemplated by the Penseco merger agreement or other dividends. Our failure to pay dividends could have a material adverse effect on the market price of our common stock.
A significant percentage of our common stock is held by our directors and executive officers, which could enable insiders to prevent a merger or other transaction that may provide stockholders a premium for their shares.
At February 27, 2015, our directors and executive officers beneficially owned approximately 8.0% of our common stock. If these individuals were to act together, they could have a significant influence over the outcome of any shareholder vote.
Risks Related to Potential Future Transactions
Future acquisitions by us could dilute existing shareholders’ ownership of Peoples and may cause us to become more susceptible to adverse economic events.
We may issue shares of our common stock in connection with future acquisitions and other investments, which would dilute existing shareholders’ ownership interests in Peoples. While there is no assurance that these transactions will occur, or that they will occur on terms favorable to us, future business acquisitions could be material to us, and the degree of success achieved in acquiring and integrating these businesses could have a material effect on the value of our common stock. In addition, these acquisitions could require us to expend substantial cash or other liquid assets or to incur debt, which could cause us to become more susceptible to economic downturns and competitive pressures.
Our governing documents, Pennsylvania law, and current policies of our board of directors contain provisions which may reduce the likelihood of a change in control transaction that may otherwise be available and attractive to shareholders.
Our articles of incorporation and bylaws contain certain anti-takeover provisions that may make it more difficult or expensive or may discourage a tender offer, change in control or takeover attempt that is opposed by our board of directors. In particular, the articles of incorporation and bylaws: classify our board of directors into three groups, so that shareholders elect only approximately one-third of the board each year; require our shareholders to give us advance notice to nominate candidates for election to the board of directors or to make shareholder proposals at a shareholders’ meeting; and require the affirmative vote of the holders of at least 75% of our
-24-
Table of Contents
common stock to approve certain business combinations that have not received the support of two-thirds of our board of directors. These provisions of our articles of incorporation and bylaws could discourage potential acquisition proposals and could delay or prevent a change in control, even though a majority of our shareholders may consider such proposals desirable. Such provisions could also make it more difficult for third parties to remove and replace the members of our board of directors. Moreover, these provisions could diminish the opportunities for shareholders to participate in certain tender offers, including tender offers at prices above the then-current market value of our common stock, and may also inhibit increases in the trading price of our common stock that could result from takeover attempts or speculation.
In addition, anti-takeover provisions in Pennsylvania law could make it more difficult for a third party to acquire control of us. These provisions could adversely affect the market price of our common stock and could reduce the amount that shareholders might receive if we are sold. For example, Pennsylvania law may restrict a third party’s ability to obtain control of Peoples and may prevent shareholders from receiving a premium for their shares of our common stock. Pennsylvania law also provides that our shareholders are not entitled by statute to propose amendments to our articles of incorporation.
Our ability to make opportunistic acquisitions is subject to significant risks, including the risk that regulators will not provide the requisite approvals.
We may make opportunistic whole or partial acquisitions of other banks, branches, financial institutions, or related businesses from time to time that we expect may further our business strategy. Any possible acquisition will be subject to regulatory approval, and there can be no assurance that we will be able to obtain such approval in a timely manner or at all. Even if we obtain regulatory approval, these acquisitions could involve numerous risks, including lower than expected performance or higher than expected costs, difficulties related to integration, diversion of management’s attention from other business activities, changes in relationships with customers, and the potential loss of key employees. In addition, we may not be successful in identifying acquisition candidates, integrating acquired institutions, or preventing deposit erosion or loan quality deterioration at acquired institutions. Competition for acquisitions can be highly competitive, and we may not be able to acquire other institutions on attractive terms. There can be no assurance that we will be successful in completing or will even pursue future acquisitions, or if such transactions are completed, that we will be successful in integrating acquired businesses into operations. Our ability to grow may be limited if we choose not to pursue or are unable to successfully make acquisitions in the future.
Risks Related to Government Regulation
We operate in a highly regulated environment and may be adversely affected by changes in laws and regulations.
We are subject to extensive regulation, supervision and examination by certain state and federal agencies including the Federal Deposit Insurance Corporation, the Board of Governors of the Federal Reserve System and the Pennsylvania Department of Banking and Securities. Such regulation and supervision govern the activities in which we may engage and are intended primarily to ensure the safety and soundness of financial institutions. Regulatory authorities have extensive discretion in their supervisory and enforcement activities, including the imposition of restrictions on operations, the classification of assets and determination of the level of the allowance for loan losses. Any change in such regulation and oversight, whether in the form of regulatory policy, regulations, legislation or supervisory action, may have a material impact on us and our operations. There also are several federal and state statutes which regulate the obligation and liabilities of financial institutions pertaining to environmental issues. In addition to the potential for attachment of liability resulting from our own actions, we may be held liable under certain circumstances for the actions of our borrowers, or third parties, when such actions result in environmental problems on properties that collateralize loans held by us. Further, the liability has the potential to far exceed the original amount of a loan.
-25-
Table of Contents
We will be subject to more stringent capital and liquidity requirements in the future, which may adversely affect our net income and future growth.
In July 2013, the federal banking agencies issued final rules to implement the Basel III regulatory capital reforms and changes required by the Dodd-Frank Act. U.S. implementation of Basel III will lead to significantly higher capital requirements and more restrictive leverage and liquidity ratios than those currently in place.
Future increases in minimum capital requirements could adversely affect our net income. Furthermore, our failure to comply with the minimum capital requirements could result in our regulators taking formal or informal actions against us which could restrict our future growth or operations.
The Dodd-Frank Act, among other things, created the Consumer Financial Protection Bureau and has resulted and will result in new regulations that are expected to increase our costs of operations.
On July 21, 2010, the Dodd-Frank Act became law. This law continues to have a significant impact on the bank regulatory structure and the lending, deposit, investment, trading and operating activities of financial institutions and their holding companies. The Dodd-Frank Act requires various federal agencies to adopt a broad range of new implementing rules and regulations, and to prepare numerous studies and reports for Congress. The federal agencies are given significant discretion in drafting the implementing rules and regulations, and consequently, many of the details and much of the impact of the Dodd-Frank Act may not be known for many years.
The Dodd-Frank Act created a new Consumer Financial Protection Bureau with broad powers to supervise and enforce consumer protection laws. The Consumer Financial Protection Bureau has broad rule-making authority for a wide range of consumer protection laws that apply to all banks and savings institutions, including the authority to prohibit “unfair, deceptive or abusive” acts and practices. The Consumer Financial Protection Bureau has examination and enforcement authority over all banks and savings institutions with more than $10 billion in assets. Banks with $10 billion or less in assets, like us, will continue to be examined for compliance with the consumer laws by their primary bank regulators. Dodd-Frank permits states to adopt consumer protection laws and standards that are more stringent than those adopted at the federal level and, in certain circumstances, permits state attorneys general to enforce compliance with both the state and federal laws and regulations.
Increases in FDIC insurance premiums may adversely affect our earnings.
Our deposits are insured by the FDIC up to legal limits and, accordingly, we are subject to FDIC deposit insurance assessments. In order to maintain a strong funding position and restore reserve ratios of the deposit insurance fund depleted during the financial crisis, the FDIC has increased assessment rates of insured institutions. Under the Dodd-Frank Act, the FDIC must undertake several initiatives that will result in higher deposit insurance fees being paid to the FDIC. For example, an FDIC final rule issued on February 7, 2011 revises the assessment system applicable to large banks and implements the use of assets as the base for deposit insurance assessments instead of domestic deposits. We are generally unable to control the amount of premiums that we are required to pay for FDIC insurance. These announced increases and any future increases or required prepayments of FDIC insurance premiums or special assessments may adversely impact our earnings.
| Item 1B. | Unresolved Staff Comments. |
None.
-26-
Table of Contents
| Item 2. | Properties. |
Our corporate headquarters is located at 150 N. Washington Avenue, Scranton, Pennsylvania, which houses our finance and planning, trust, merchant services, commercial lending, marketing, human resources and investor services divisions, as well as our executive offices. Our operations division is located at 82 Franklin Avenue, Hallstead, Pennsylvania.
We operate 26 full-service community banking offices located within the Lackawanna, Lehigh, Luzerne, Monroe, Susquehanna, Wayne and Wyoming Counties of Northeastern Pennsylvania and Broome County of New York. Two offices are leased and the balance are owned by Peoples Bank or its subsidiary, Penseco Realty, Inc., with the exception of the Mount Pocono Office, which is owned by Peoples Bank but is located on land occupied under a long-term lease. We have received regulatory approval for a new office in Kingston, Pennsylvania, which is expected to be operational during 2015.
We lease several remote ATM locations throughout Northeastern Pennsylvania and Southern New York. All branches and ATM locations are equipped with closed circuit television monitoring.
We consider our properties to be suitable and adequate for our current and immediate future purposes.
| Item 3. | Legal Proceedings. |
There are no material pending legal proceedings, other than ordinary routine litigation incidental to our business, as to which we are a party or of which any of our property is subject.
| Item 4. | Mine Safety Disclosures. |
Not applicable.
| Item 5. | Market for Registrant’s Common Equity, Related Stockholder Matters and Issuer Purchases of Equity Securities. |
As of February 27, 2015, there were approximately 3,242 holders of our common stock, $2.00 par value, including individual participants in security position listings. Our common stock trades on The Nasdaq Stock Market under the symbol “PFIS.”
Peoples has paid cash dividends since its incorporation in 1986. The Penseco merger agreement states that, unless 80% of our board of directors determines otherwise, we will pay a quarterly cash dividend in an amount no less than $0.31 per share through 2018, provided that sufficient funds are legally available, and that Peoples and Peoples Bank remain “well-capitalized” in accordance with applicable regulatory guidelines. The payment of future dividends must necessarily depend upon earnings, financial position, appropriate restrictions under applicable laws and other factors relevant at the time our board of directors considers any declaration of dividends. For information on dividend restrictions on the Company and Peoples Bank, refer to the consolidated financial statements and notes to these statements filed at Item 8 to this report and incorporated in their entirety by reference under this Item 5.
-27-
Table of Contents
The high and low closing sale prices and dividends per share of the Company’s common stock for the four quarters of 2014 and 2013 are summarized in the following table:
| 2014 | 2013 | |||||||||||||||||||||||
| Low | High | Dividends Declared |
Low | High | Dividends Declared |
|||||||||||||||||||
| First Quarter |
$ | 37.85 | $ | 42.26 | $ | 0.31 | $ | 30.05 | $ | 34.00 | $ | 0.23 | ||||||||||||
| Second Quarter |
42.50 | 53.05 | 0.31 | 33.00 | 39.90 | 0.23 | ||||||||||||||||||
| Third Quarter |
45.99 | 52.52 | 0.31 | 33.50 | 35.50 | 0.23 | ||||||||||||||||||
| Fourth Quarter |
$ | 44.17 | $ | 52.52 | $ | 0.31 | $ | 33.50 | $ | 39.50 | $ | 0.23 | ||||||||||||
The following table presents information with respect to purchases made by or on behalf of the Company or any “affiliated purchaser,” as defined in the Exchange Act Rule 10b-18(a)(3), of the Company’s common stock during each of the three months ended December 31, 2014:
| Month Ending |
Total Number of Shares Purchased |
Average Price Paid Per Share |
Total Number of Shares Purchased as Part of Publicly Announced Programs(1) |
Maximum Number of Shares that may yet be Purchased Under the Programs(1) | ||||
| October 31, 2014 |
||||||||
| November 30, 2014 |
||||||||
| December 31, 2014 |
||||||||
|
|
|
|||||||
| Total |
||||||||
|
|
|
| (1) | On January 31, 2014, the Board of Directors authorized the purchase of up to 370,000 shares of the Company’s common stock and on January 30, 2015, the Board of Directors reauthorized such puchase. |
-28-
Table of Contents
The following line graph compares the cumulative total stockholder return on the Company’s common stock, based on the market price change and assumes reinvestment of dividends, with the cumulative total return of the index for The NASDAQ Bank Stocks and the index for the Russell 2000 Stocks during the five-year period ended December 31, 2014. The stockholder return shown on the graph and table below is not necessarily indicative of future performance.
Comparison of Five-Year Cumulative Total Returns
Performance Graph of
PEOPLES FINANCIAL SERVICES CORP
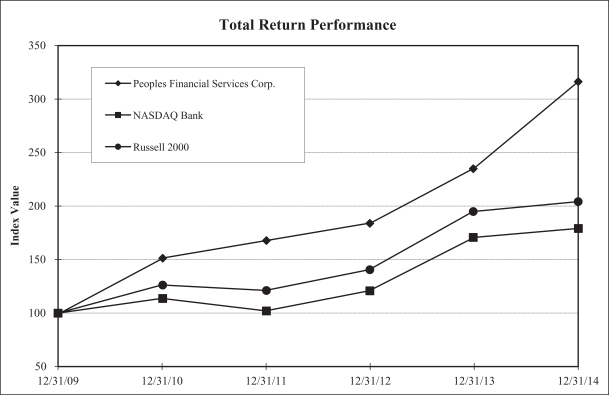
| Period Ending | ||||||||||||||||||||||||
| Index |
12/31/09 | 12/31/10 | 12/31/11 | 12/31/12 | 12/31/13 | 12/31/14 | ||||||||||||||||||
| Peoples Financial Services Corp. |
100.00 | 152.24 | 166.55 | 185.27 | 237.22 | 318.56 | ||||||||||||||||||
| NASDAQ Bank |
100.00 | 114.16 | 102.17 | 121.26 | 171.86 | 180.31 | ||||||||||||||||||
| Russell 2000 |
100.00 | 126.86 | 121.56 | 141.43 | 196.34 | 205.95 | ||||||||||||||||||
Source : SNL Financial LC,
Charlottesville, VA
©2015
-29-
Table of Contents
| Item 6. | Selected Financial Data. |
Consolidated Selected Financial Data
(Dollars in thousands, except per share data)
| Year Ended December 31 |
2014 | 2013 | 2012 | 2011 | 2010 | |||||||||||||||
| Condensed statements of financial performance: |
||||||||||||||||||||
| Interest income |
$ | 63,956 | $ | 37,370 | $ | 37,591 | $ | 39,707 | $ | 41,745 | ||||||||||
| Interest expense |
6,642 | 4,169 | 5,362 | 7,339 | 8,356 | |||||||||||||||
|
|
|
|
|
|
|
|
|
|
|
|||||||||||
| Net interest income |
57,314 | 33,201 | 32,229 | 32,368 | 33,389 | |||||||||||||||
| Provision for loan losses |
3,524 | 2,361 | 924 | 2,381 | 1,999 | |||||||||||||||
|
|
|
|
|
|
|
|
|
|
|
|||||||||||
| Net interest income after provision for loan losses |
53,790 | 30,840 | 31,305 | 29,987 | 31,390 | |||||||||||||||
| Noninterest income |
15,251 | 11,762 | 11,441 | 12,619 | 12,152 | |||||||||||||||
| Noninterest expense |
45,933 | 36,396 | 29,099 | 29,041 | 28,689 | |||||||||||||||
|
|
|
|
|
|
|
|
|
|
|
|||||||||||
| Income before income taxes |
23,108 | 6,206 | 13,647 | 13,565 | 14,853 | |||||||||||||||
| Provision for income tax expense |
5,459 | 485 | 3,058 | 3,034 | 3,287 | |||||||||||||||
|
|
|
|
|
|
|
|
|
|
|
|||||||||||
| Net income |
$ | 17,649 | $ | 5,721 | $ | 10,589 | $ | 10,531 | $ | 11,566 | ||||||||||
|
|
|
|
|
|
|
|
|
|
|
|||||||||||
| Condensed statements of financial position: |
||||||||||||||||||||
| Investment securities |
$ | 354,251 | $ | 317,010 | $ | 177,293 | $ | 191,208 | $ | 217,044 | ||||||||||
| Net loans |
1,199,556 | 1,167,966 | 616,580 | 624,811 | 608,605 | |||||||||||||||
| Other assets |
187,862 | 203,245 | 124,169 | 109,513 | 91,188 | |||||||||||||||
|
|
|
|
|
|
|
|
|
|
|
|||||||||||
| Total assets |
$ | 1,741,669 | $ | 1,688,221 | $ | 918,042 | $ | 925,532 | $ | 916,837 | ||||||||||
|
|
|
|
|
|
|
|
|
|
|
|||||||||||
| Deposits |
$ | 1,425,558 | $ | 1,379,507 | $ | 721,948 | $ | 720,518 | $ | 691,032 | ||||||||||
| Short-term borrowings |
19,557 | 22,052 | 8,019 | 9,981 | 28,082 | |||||||||||||||
| Long-term debt |
33,140 | 36,743 | 45,397 | 58,220 | 68,835 | |||||||||||||||
| Other liabilities |
16,635 | 11,127 | 10,232 | 9,480 | 8,422 | |||||||||||||||
| Stockholders’ equity |
246,779 | 238,792 | 132,446 | 127,333 | 120,466 | |||||||||||||||
|
|
|
|
|
|
|
|
|
|
|
|||||||||||
| Total liabilities and stockholders’ equity |
$ | 1,741,669 | $ | 1,688,221 | $ | 918,042 | $ | 925,532 | $ | 916,837 | ||||||||||
|
|
|
|
|
|
|
|
|
|
|
|||||||||||
| Per share data: |
||||||||||||||||||||
| Net income |
$ | 2.34 | $ | 1.21 | $ | 2.37 | $ | 2.36 | $ | 2.59 | ||||||||||
| Cash dividends declared |
1.24 | 1.23 | 1.23 | 1.23 | 1.23 | |||||||||||||||
| Stockholders’ equity |
$ | 32.69 | $ | 31.62 | $ | 29.65 | $ | 28.51 | $ | 26.97 | ||||||||||
| Cash dividends declared as a percentage of net income |
53.03 | % | 96.33 | % | 51.98 | % | 52.26 | % | 47.59 | % | ||||||||||
| Average common shares outstanding |
7,548,825 | 4,733,059 | 4,467,261 | 4,467,261 | 4,467,261 | |||||||||||||||
| Selected ratios (based on average balances): |
||||||||||||||||||||
| Net income as a percentage of total assets |
1.03 | % | 0.58 | % | 1.14 | % | 1.13 | % | 1.30 | % | ||||||||||
| Net income as a percentage of stockholders’ equity |
7.29 | 4.01 | 8.07 | 8.45 | 9.73 | |||||||||||||||
| Stockholders’ equity as a percentage of total assets |
14.12 | 14.43 | 14.18 | 13.37 | 13.38 | |||||||||||||||
| Tier I capital as a percentage of adjusted total assets |
10.76 | 10.12 | 11.50 | 10.82 | 10.68 | |||||||||||||||
| Net interest income as a percentage of earning assets |
3.86 | 3.91 | 4.08 | 4.04 | 4.39 | |||||||||||||||
| Loans, net, as a percentage of deposits |
84.13 | % | 87.72 | % | 88.69 | % | 87.04 | % | 89.17 | % | ||||||||||
| Selected ratios and data (based on period end balances): |
||||||||||||||||||||
| Tier I capital as a percentage of risk-weighted assets |
14.75 | % | 13.62 | % | 16.80 | % | 15.77 | % | 15.30 | % | ||||||||||
| Total capital as a percentage of risk-weighted assets |
15.61 | 14.29 | 17.96 | 16.87 | 16.42 | |||||||||||||||
| Allowance for loan losses as a percentage of loans, net |
0.85 | 0.74 | 1.11 | 1.06 | 1.06 | |||||||||||||||
| Nonperforming loans as a percentage of loans, net |
0.85 | % | 1.60 | % | 0.50 | % | 0.68 | % | 0.99 | % | ||||||||||
Note: Average balances were calculated using average daily balances. Average balances for loans include nonaccrual loans. Tax-equivalent adjustments were calculated using the prevailing statutory tax rate of 35.0% for the year ended December 31, 2014 and 34.0% for each of the years in the four-year period ended December 31, 2013.
-30-
Table of Contents
| Item 7. | Management’s Discussion and Analysis of Financial Condition and Results of Operations. |
Management’s Discussion and Analysis 2014 versus 2013
(Dollars in thousands, except per share data)
Management’s Discussion and Analysis appearing on the following pages should be read in conjunction with the Consolidated Financial Statements and Management’s Discussion and Analysis 2013 versus 2012 contained in this Annual Report on Form 10-K.
Forward-Looking Discussion:
In addition to the historical information contained in this document, the discussion presented may contain and, from time to time, may make, certain statements that constitute forward-looking statements. Words such as “expects,” “anticipates,” “believes,” “estimates” and other similar expressions or future or conditional verbs such as “will,” “should,” “would” and “could” are intended to identify such forward-looking statements. These statements are not historical facts, but instead represent the current expectations, plans or forecasts of Peoples Financial Services Corp. and its subsidiaries regarding its future operating results, financial position, asset quality, credit reserves, credit losses, capital levels, dividends, liquidity, service charges, cost savings, effective tax rate, impact of changes in fair value of financial assets and liabilities, impact of new accounting and regulatory guidance, legal proceedings and other matters relating to us and the securities that we may offer from time to time. These statements are not guarantees of future results or performance and involve certain risks, uncertainties and assumptions that are difficult to predict, change over time and are often beyond our control. Actual outcomes and results may differ materially from those expressed in, or implied by, forward-looking statements.
You should not place undue reliance on any forward-looking statement and should consider the uncertainties and risks discussed in the “Risk Factors” in Part I, Item 1A of this Annual Report, among others, and in any of our subsequent Securities and Exchange Commission (“SEC”) filings. Forward-looking statements speak only as of the date they are made, and we undertake no obligation to update any forward-looking statement to reflect the impact of circumstances or events that arise after the date the forward-looking statement was made. Notes to the Consolidated Financial Statements referred to in the Management’s Discussion and Analysis of Financial Condition and Results of Operations (“MD&A”) are incorporated by reference into the MD&A. Certain prior period amounts have been reclassified to conform with the current year’s presentation.
Critical Accounting Policies:
Our consolidated financial statements are prepared in accordance with accounting principles generally accepted in the United States of America (“GAAP”). The preparation of consolidated financial statements in conformity with GAAP requires us to establish critical accounting policies and make accounting estimates and assumptions that affect the reported amounts of assets and liabilities at the date of the consolidated financial statements, as well as the reported amounts of revenues and expenses during those reporting periods.
For a discussion of the recent Accounting Standards Updates (“ASU”) issued by the Financial Accounting Standards Board (“FASB”) refer to Note 1 entitled “Summary of significant accounting policies — Recent accounting standards,” in the Notes to Consolidated Financial Statements included in Part II, Item 8 of this Annual Report.
An accounting estimate requires assumptions about uncertain matters that could have a material effect on the consolidated financial statements if a different amount within a range of estimates were used or if estimates changed from period to period. Readers of this report should understand that estimates are made considering facts and circumstances at a point in time, and changes in those facts and circumstances could produce results that differ from when those estimates were made. Significant estimates that are particularly susceptible to material change within the near term relate to the determination of allowance for loan losses, determination of
-31-
Table of Contents
other-than-temporary impairment of investment securities, fair value of financial instruments, the valuation of real estate acquired in connection with foreclosures or satisfaction of loans, the valuation of deferred tax assets, the valuation of acquired assets and liabilities assumed in business combinations, and the impairment of goodwill. Actual amounts could differ from those estimates.
We maintain the allowance for loan losses at a level we believe adequate to absorb probable credit losses related to individually evaluated loans, as well as probable incurred losses inherent in the remainder of the loan portfolio as of the balance sheet date. The balance in the allowance for loan losses account is based on past events and current economic conditions.
The allowance for loan losses account consists of an allocated element and an unallocated element. The allocated element consists of a specific portion for the impairment of loans individually evaluated and a formula portion for loss contingencies on those loans collectively evaluated. The unallocated element, if any, is used to cover inherent losses that exist as of the evaluation date, but which have not been identified as part of the allocated allowance using our impairment evaluation methodology due to limitations in the process.
We monitor the adequacy of the allocated portion of the allowance quarterly and adjust the allowance as necessary through normal operations. This ongoing evaluation reduces potential differences between estimates and actual observed losses. The determination of the level of the allowance for loan losses is inherently subjective as it requires estimates that are susceptible to significant revision as more information becomes available. Accordingly, management cannot ensure that charge-offs in future periods will not exceed the allowance for loan losses or that additional increases in the allowance for loan losses will not be required, resulting in an adverse impact on operating results.
In determining the requirement to record an other-than-temporary impairment on securities owned by us, four main characteristics are considered including: (i) the length of time and the extent to which the fair value has been less than amortized cost; (ii) the financial condition and near-term prospects of the issuer; (iii) whether the market decline was affected by macroeconomic conditions and (iv) whether the Company has the intent to sell the debt security or more likely than not will be required to sell the debt security before its anticipated recovery. The assessment of whether an other-than-temporary impairment exists involves a high degree of subjectivity and judgment and is based on information available to us at a point in time.
Fair values of financial instruments, in cases where quoted market prices are not available, are based on estimates using present value or other valuation techniques which are subject to change.
Real estate acquired in connection with foreclosures or in satisfaction of loans is adjusted to fair value based upon current estimates derived through independent appraisals less cost to sell. However, proceeds realized from sales may ultimately be higher or lower than those estimates.
Deferred tax assets and liabilities are recognized for the estimated future tax effects of temporary differences by applying enacted statutory tax rates to differences between the financial statement carrying amounts and the tax bases of existing assets and liabilities. The amount of deferred tax assets is reduced, if necessary, to the amount that, based on available evidence, will more likely than not be realized. As changes in tax laws or rates are enacted, deferred tax assets and liabilities are adjusted through the provision for income taxes.
The acquired assets and liabilities assumed in business combinations are measured at fair value as of the acquisition date. In many cases, determining the fair value of the acquired assets and assumed liabilities requires the Company to estimate cash flows expected to result from those assets and liabilities and to discount those cash flows at appropriate rates of interest, which required the utilization of significant estimates and judgment in accounting for the acquisition.
-32-
Table of Contents
Goodwill is evaluated at least annually for impairment or more frequently if conditions indicate potential impairment exist. Any impairment losses arising from such testing are reported in the income statement in the current period as a separate line item within operations.
For a further discussion of our critical accounting policies, refer to Note 1 entitled, “Summary of significant accounting policies,” in the Notes to Consolidated Financial Statements to this Annual Report. This note lists the significant accounting policies used by us in the development and presentation of the consolidated financial statements. This MD&A, the Notes to Consolidated Financial Statements and other financial statement disclosures identify and address key variables and other qualitative and quantitative factors that are necessary for the understanding and evaluation of our financial position, results of operations and cash flows.
Operating Environment:
The United States economy continued to expand moderately in 2014, as the gross domestic product (“GDP”), the value of all goods and services produced in the Nation, increased at an annual rate of 2.4 percent, compared to 2.2 percent in 2013. The Federal Open Market Committee (“FOMC”) maintained the federal funds target range of 0 to 25 basis points throughout 2014 and further signaled that they intend to keep short-term rates at extraordinarily low levels through at least late 2015. Despite experiencing an improvement in 2014, many areas of the economy remain weaker compared to historical standards. Given these circumstances, the FOMC decided that this extraordinary monetary policy stance was necessary to support the recovery. During the recent testimony of the Chair of the FOMC before the Senate Banking Committee, she discussed the FOMC’s plans for raising interest rates. After years of accommodative monetary policy, she said that current economic conditions do not warrant an increase to interest rates for at least the next couple of FOMC meetings.
Inflationary concerns continue to be relatively tame, as the consumer price index (“CPI”) at 0.8 percent for 2014 continued to be below the FOMC’s benchmark of 2.0 percent. The CPI was 1.3 percent in 2013. Moreover, the core personal consumption expenditure price index, which ignores food and energy, averaged 1.6 percent in 2014.
Employment conditions improved in 2014. The civilian labor force increased 1.1 million, while the number of people employed increased 2.8 million in 2014. As a result, the annual unemployment rate for the U.S. fell to 6.2 percent in 2014 from 7.4 percent in 2013. All sectors of employment, with the exception of the government sector, reported employment gains from the end of 2013
National, Pennsylvania, New York and our market area’s non-seasonally-adjusted annual unemployment rates in 2014 and 2013, are summarized as follows:
| 2014 | 2013 | |||||||
| United States |
6.2 | % | 7.4 | % | ||||
| New York |
6.4 | 8.3 | ||||||
| Pennsylvania |
5.6 | 8.0 | ||||||
| Broome County |
6.7 | 8.0 | ||||||
| Lackawanna County |
6.6 | 7.9 | ||||||
| Lehigh County |
5.8 | 7.8 | ||||||
| Luzerne County |
7.1 | 9.5 | ||||||
| Monroe County |
7.1 | 9.4 | ||||||
| Susquehanna County |
5.0 | 7.0 | ||||||
| Wayne County |
5.6 | 7.2 | ||||||
| Wyoming County |
6.8 | % | 9.4 | % | ||||
Employment conditions in 2014 improved for the Commonwealth of Pennsylvania as evidenced by a reduction in the unemployment rate to 5.6 percent in 2014 from 8.0 percent in 2013. Similarly, the unemployment rate for
-33-
Table of Contents
New York State dropped to 6.4 percent in 2014, from 8.3 percent in 2013. With respect to the markets we serve, the unemployment rate decreased in all of the eight counties in which we have branches or ATM locations. Wyoming County experienced the most significant improvement declining to 6.8 percent in 2014 from 9.4 percent in 2013. The lowest unemployment rate in 2014, for all of the counties we serve, was Susquehanna County at 5.0 percent as a result of increased activity related to the extraction of natural gas. The marked improvements in unemployment rates could impact the rate of economic growth and may cause interest rates to rise in the near term.
With respect to the banking industry, net income for all Federal Deposit Insurance Corporation (“FDIC”)-insured banks in 2014 totaled $153.6 billion, a decrease of $1.1 billion or 0.7 percent from 2013. This is the first year that earnings have not risen in the last five years. Approximately 63.9 percent of all institutions reported higher net income in 2014, while only 6.1 percent reported net losses. This is the lowest annual proportion of unprofitable institutions for the industry since 2004. Loan loss provisions of $29.7 billion in 2014 were $2.7 billion or 8.4 percent less than banks set aside in 2013. This is the fifth year in a row that loan loss provisions have been lower, and the total allocation for 2014 was the smallest amount since 2006. Net interest income increased for the first time in four years, by $5.5 billion or 1.3 percent, as interest expense fell more rapidly than interest income. Noninterest income was $5.5 billion or 2.2 percent below the level of 2013, as servicing fee income declined by $8.9 billion or 49.6 percent. Realized gains on securities were $1.3 billion or 8.4 percent lower than a year ago. Total noninterest expense increased $5.2 billion or 1.2 percent comparing 2014 and 2013. The average return on average assets for 2014 was 1.02 percent, down from an eight year high of 1.07 percent set in 2013.
The United States economy is on a more self-sustaining path as we move into 2015. This could affect interest rates which may adversely impact bank earnings as net interest margins compress from the inability of management to keep fund costs low. Continuous expense control, sound balance sheet management and lower loan loss provisions could offset some of the negative impact of the reduction in net interest margins.
Review of Financial Position:
Peoples Financial Services Corp., a bank holding company incorporated under the laws of Pennsylvania, provides a full range of financial services through its wholly-owned subsidiary, Peoples Security Bank and Trust Company (“Peoples Bank”), including its subsidiaries, Peoples Advisors, LLC and Penseco Realty, Inc. (collectively, the “Company” or “Peoples”). On November 30, 2013, Penseco Financial Services Corporation, a financial holding company incorporated under the laws of Pennsylvania (“Penseco”), merged with and into Peoples Financial Services Corp., with Peoples Financial Services Corp. being the surviving corporation (the “Merger”), pursuant to an Agreement and Plan of Merger dated June 28, 2013 (the “Merger Agreement”). In connection with the Merger, on December 1, 2013, Penseco’s former banking subsidiary, Penn Security Bank and Trust Company, merged with and into Peoples Neighborhood Bank (the “Bank Merger”), and the resulting institution adopted the name, “Peoples Security Bank and Trust Company.” The Company services its retail and commercial customers through twenty-six full-service community banking offices located within the Lackawanna, Lehigh, Luzerne, Monroe, Susquehanna, Wayne and Wyoming Counties of Northeastern Pennsylvania and Broome County of New York.
Peoples Bank is a state-chartered bank and trust company under the jurisdiction of the Pennsylvania Department of Banking and Securities and the Federal Deposit Insurance Corporation. Peoples Bank’s primary product is loans to small- and medium-sized businesses. Other lending products include one-to-four family residential mortgages and consumer loans. Peoples Bank primarily funds its loans by offering open time deposits to commercial enterprises and individuals. Other deposit product offerings include certificates of deposits and various demand deposit accounts.
Peoples Advisors, LLC, a member-managed limited liability company, provides investment advisory services through a third party to individuals and small businesses. Penseco Realty, Inc. holds and manages real estate assets on behalf of Peoples Bank.
-34-
Table of Contents
Peoples Advisors, LLC and Penseco Realty, Inc. did not meet the quantitative thresholds for required segment disclosure in conformity with accounting principles generally accepted in the United States of America (“GAAP”). Peoples Bank’s twenty-six community banking offices, all similar with respect to economic characteristics, share a majority of the following aggregation criteria: (i) products and services; (ii) operating processes; (iii) customer bases; (iv) delivery systems; and (v) regulatory oversight. Accordingly, they were aggregated into a single operating segment.
The Company faces competition primarily from commercial banks, thrift institutions and credit unions within the Northeastern Pennsylvania market, many of which are substantially larger in terms of assets and capital. In addition, mutual funds and security brokers compete for various types of deposits, and consumer, mortgage, leasing and insurance companies compete for various types of loans and leases. Principal methods of competing for banking and permitted nonbanking services include price, nature of product, quality of service and convenience of location.
The Company and Peoples Bank are subject to regulations of certain federal and state regulatory agencies and undergo periodic examinations.
The aforementioned merger between the Company and Penseco was considered a “merger of equals” and is accounted for as a reverse merger using the acquisition method of accounting. As a result of the reverse merger, Peoples is the legal acquirer and Penseco is the accounting acquirer. In a reverse merger the historical consolidated financial statements are those of the accounting acquirer, Penseco and, consequently, comparisons may not be particularly meaningful. The results for the year ended December 31, 2013, include the operating results of Penseco for the entire year and the operating results of Peoples since November 30, 2013. The merger with Penseco had a significant impact on the results of operations for the year ended December 31, 2013.
Readers of this Management Discussion and Analysis are encouraged to refer to the note entitled “Merger accounting,” in the Notes to the Consolidated Financial Statements to more fully understand the impact that the merger had on the Company’s financial position and results of operations.
Total assets, loans and deposits were $1.7 billion, $1.2 billion and $1.4 billion, respectively, at December 31, 2014. Total assets, loans and deposits grew 3.2 percent, 2.8 percent and 3.3 percent, respectively, compared to 2013 year-end balances.
The loan portfolio consisted of $813.1 million of business loans, including commercial and commercial real estate loans, and $396.8 million in retail loans, including residential mortgage and consumer loans at December 31, 2014. Total investment securities were $354.3 million at December 31, 2014, including $339.6 million of investment securities classified as available-for sale and $14.7 million classified as held-to-maturity. Total deposits consisted of $313.5 million in noninterest-bearing deposits and $1.1 billion in interest-bearing deposits at December 31, 2014.
Stockholders’ equity equaled $246.8 million, or $32.69 per share, at December 31, 2014, and $238.8 million, or $31.62 per share, at December 31, 2013. Dividends declared for the 2014 amounted to $1.24 per share representing 53.0 percent of net income.
Nonperforming assets equaled $10.9 million or 0.90 percent of loans, net and foreclosed assets at December 31, 2014, an improvement from $19.5 million or 1.65 percent at December 31, 2013. The allowance for loan losses equaled $10.3 million or 0.85 percent of loans, net, at December 31, 2014, compared to $8.7 million or 0.74 percent at year-end 2013. Loans charged-off, net of recoveries equaled $1.8 million or 0.15 percent of average loans in 2014, compared to $660.0 thousand or 0.10 percent of average loans in 2013.
-35-
Table of Contents
Investment Portfolio:
Primarily, our investment portfolio provides a source of liquidity needed to meet expected loan demand and generates a reasonable return in order to increase our profitability. Additionally, we utilize the investment portfolio to meet pledging requirements and reduce income taxes. At December 31, 2014, our portfolio consisted primarily of short-term U.S. Treasury and Government agency securities, which provide a source of liquidity and intermediate-term, tax-exempt state and municipal obligations, which mitigate our tax burden.
Our investment portfolio is subject to various risk elements that may negatively impact our liquidity and profitability. The greatest risk element affecting our portfolio is market risk or interest rate risk (“IRR”). Understanding IRR, along with other inherent risks and their potential effects, is essential in effectively managing the investment portfolio.
Market risk or IRR relates to the inverse relationship between bond prices and market yields. It is defined as the risk that increases in general market interest rates will result in market value depreciation. A marked reduction in the value of the investment portfolio could subject us to liquidity strains and reduced earnings if we are unable or unwilling to sell these investments at a loss. Moreover, the inability to liquidate these assets could require us to seek alternative funding, which may further reduce profitability and expose us to greater risk in the future. In addition, since the majority of our investment portfolio is designated as available-for-sale and carried at estimated fair value, with net unrealized gains and losses reported as a separate component of stockholders’ equity, market value depreciation could negatively impact our capital position.
During 2014, the FOMC held the target federal funds rate at the historically low range of 0 to 25 basis points. As the result of the U.S. economy expanding at the highest level in four years and a continuation of improving employment conditions, the market is expecting the FOMC to raise short-term rates sometime in 2015. This expectation has caused a flattening effect on the yield curve in 2014 as short-term rates increased from year-end 2013. Our investment portfolio consists primarily of fixed-rate bonds. As a result, changes in general market interest rates have a significant influence on the fair value of our portfolio. Specifically, the parts of the yield curve most closely related to our investments include the 2-year and 10-year U.S. Treasury securities. The yield on the 2-year U.S. Treasury note affects the values of our U.S. Treasury and Government agency securities, whereas the 10-year U.S. Treasury note influences the value of tax-exempt state and municipal obligations. The yield on the 2-year U.S. Treasury increased from 0.38 percent at year-end 2013 to 0.67 percent at year-end 2014. Conversely, the yield on the 10-year U.S. Treasury decreased 87 basis points from 3.04 percent at December 31, 2013, to 2.17 percent at December 31, 2014. Since bond prices move inversely to yields, we experienced an improvement in the aggregate fair value of our investment portfolio as an increase in the fair value of our tax-exempt state and municipal obligations caused by the reduction in long-term rates exceeded the decline in fair value of our U.S. Treasury and Government agency securities due to an increase in short-term rates. We reported net unrealized holding gains, included as a separate component of stockholders’ equity of $4.1 million, net of income taxes of $2.2 million, at December 31, 2014, and $1.8 million, net of income taxes of $1.0 million, at December 31, 2013. An increase in interest rates could negatively impact the market value of our investments and our capital position. In order to monitor the potential effects a rise in interest rates could have on the value of our investments, we perform stress test modeling on the portfolio. Stress tests conducted on our portfolio at December 31, 2014, indicated that should general market rates increase by 100, 200 and 300 basis points, we would anticipate declines of 3.1 percent, 6.3 percent and 9.6 percent in the market value of our portfolio.
-36-
Table of Contents
The carrying values of the major classifications of investment securities and their respective percentages of total investment securities for the past three years are summarized as follows:
Distribution of investment securities
| 2014 | 2013 | 2012 | ||||||||||||||||||||||
| December 31 |
Amount | % | Amount | % | Amount | % | ||||||||||||||||||
| U.S. Treasury securities |
$ | 48,550 | 13.70 | % | ||||||||||||||||||||
| U.S. Government-sponsored enterprises |
96,245 | 27.17 | $ | 113,045 | 35.66 | % | $ | 84,682 | 47.76 | % | ||||||||||||||
| State and municipals: |
||||||||||||||||||||||||
| Taxable |
17,407 | 4.91 | 16,698 | 5.27 | ||||||||||||||||||||
| Tax-exempt |
100,271 | 28.31 | 105,453 | 33.26 | 59,920 | 33.80 | ||||||||||||||||||
| Corporate debt securities |
4,387 | 1.38 | ||||||||||||||||||||||
| Mortgage-backed securities: |
||||||||||||||||||||||||
| U.S. Government agencies |
37,576 | 10.61 | 20,550 | 6.48 | 136 | 0.08 | ||||||||||||||||||
| U.S. Government-sponsored enterprises |
54,202 | 15.30 | 55,780 | 17.60 | 31,484 | 17.76 | ||||||||||||||||||
| Common equity securities |
1,097 | 0.35 | 1,071 | 0.60 | ||||||||||||||||||||
|
|
|
|
|
|
|
|
|
|
|
|
|
|||||||||||||
| Total |
$ | 354,251 | 100.00 | % | $ | 317,010 | 100.00 | % | $ | 177,293 | 100.00 | % | ||||||||||||
|
|
|
|
|
|
|
|
|
|
|
|
|
|||||||||||||
Investment securities increased $37.3 million, to $354.3 million at December 31, 2014, from $317.0 million at December 31, 2013. At December 31, 2014, the investment portfolio consisted of $339.6 million of investment securities classified as available-for-sale and $14.7 million classified as held-to-maturity. Loan demand was sluggish throughout most of 2014 until the fourth quarter of 2014, when loans grew $30.0 million. As a result, excess deposited funds not used to fund loans were directed into the investment portfolio. Security purchases totaled $102.3 million in 2014, with the majority of the purchases consisting of short-term U.S. Treasury and U.S. Government agency and U.S. Government-sponsored enterprise mortgage-backed securities for the purpose of supporting future loan demand and as a result of the reduction in long-term yields. Investment purchases in 2013 amounted to $22.1 million.
Repayments of investment securities totaled $49.7 million in 2014 and $29.6 million in 2013. We received proceeds of $15.4 million from the sale of investment securities in 2014 and $4.6 million in 2013. Net gains recognized on the sale of investment securities available-for-sale totaled $861 in 2014 and $163 in 2013. The 2014 sales consisted of $4.4 million of corporate bonds, $9.9 million of U.S. Government-sponsored enterprise adjustable rate mortgage-backed securities and $1.1 million of common equity securities. We continually analyze the investment portfolio with respect to its exposure to various risk elements. As a result of such analysis, we sold the corporate bonds and common equity securities due to credit risk while the adjustable rate securities were sold due to interest rate risk.
The composition of our investment portfolio changed during 2014 as a result of the aforementioned transactions. Short-term bullet U.S. Treasury and U.S. Government agency and U.S. Government-sponsored enterprise securities comprised 40.9 percent of our total portfolio at year-end 2014 compared to 35.7 percent at the end of 2013 as tax-exempt municipal obligations decreased as a percentage of the total portfolio to 28.3 percent at year-end 2014 from 33.3 percent at the end of 2013. The weighted average life and the effective duration of the investment portfolio were constant at 3.1 years and 3.0 years at December 31, 2014 and 2013.
There were no other-than-temporary impairments (“OTTI”) recognized for the years ended December 31, 2014, 2013 and 2012. For additional information related to OTTI refer to Note 4 entitled “Investment securities” in the Notes to Consolidated Financial Statements to this Annual Report.
Investment securities averaged $338.5 million and equaled 21.7 percent of average earning assets in 2014, compared to $185.0 million and equaled 20.4 percent of average earning assets in 2013. The tax-equivalent yield on the investment portfolio decreased 50 basis points to 2.67 percent in 2014 from 3.17 percent in 2013.
-37-
Table of Contents
At December 31, 2014 and 2013, there were no securities of any individual issuer, except for U.S. Government agency mortgage-backed securities, that exceeded 10.0 percent of stockholders’ equity.
The maturity distribution based on the carrying value and weighted-average, tax-equivalent yield of the investment portfolio at December 31, 2014, is summarized as follows. The weighted-average yield, based on amortized cost, has been computed for tax-exempt state and municipals on a tax-equivalent basis using the prevailing federal statutory tax rate of 35.0 percent. The distributions are based on contractual maturity with the exception of equity securities. Equity securities with no stated contractual maturities are included in the “After ten years” maturity distribution. Expected maturities may differ from contractual maturities because borrowers have the right to call or prepay obligations with or without call or prepayment penalties.
Maturity distribution of investment securities
| Within one year | After one but within five years |
After five but within ten years |
After ten years | Total | ||||||||||||||||||||||||||||||||||||
| December 31, 2014 |
Amount | Yield | Amount | Yield | Amount | Yield | Amount | Yield | Amount | Yield | ||||||||||||||||||||||||||||||
| U.S. Treasury securities |
$ | 48,550 | 1.55 | % | $ | 48,550 | 1.55 | % | ||||||||||||||||||||||||||||||||
| U.S. Government-sponsored enterprises |
$ | 26,139 | 0.93 | % | 65,379 | 0.97 | $ | 4,727 | 2.77 | % | 96,245 | 1.05 | ||||||||||||||||||||||||||||
| State and municipals: |
||||||||||||||||||||||||||||||||||||||||
| Taxable |
2,815 | 2.71 | 9,774 | 4.36 | $ | 4,818 | 4.66 | % | 17,407 | 4.17 | ||||||||||||||||||||||||||||||
| Tax-exempt |
3,156 | 2.88 | 13,448 | 1.78 | 15,479 | 4.78 | 68,188 | 6.29 | 100,271 | 5.34 | ||||||||||||||||||||||||||||||
| Mortgage-backed securities: |
||||||||||||||||||||||||||||||||||||||||
| U.S. Government agencies |
3,123 | 1.03 | 31,751 | 1.79 | 2,702 | 1.85 | 37,576 | 1.73 | ||||||||||||||||||||||||||||||||
| U.S. Government-sponsored enterprises |
8,463 | 1.46 | 36,127 | 2.47 | 9,612 | 1.82 | 54,202 | 2.20 | ||||||||||||||||||||||||||||||||
|
|
|
|
|
|
|
|
|
|
|
|||||||||||||||||||||||||||||||
| Total |
$ | 29,295 | 1.14 | % | $ | 141,778 | 1.31 | % | $ | 97,858 | 2.82 | % | $ | 85,320 | 5.55 | % | $ | 354,251 | 2.73 | % | ||||||||||||||||||||
|
|
|
|
|
|
|
|
|
|
|
|||||||||||||||||||||||||||||||
Loan Portfolio:
Economic factors and how they affect loan demand are of extreme importance to us and the overall banking industry, as lending is a primary business activity. Loans are the most significant component of earning assets and they generate the greatest amount of revenue for us. Similar to the investment portfolio, there are risks inherent in the loan portfolio that must be understood and considered in managing the lending function. These risks include IRR, credit concentrations and fluctuations in demand. Changes in economic conditions and interest rates affect these risks which influence loan demand, the composition of the loan portfolio and profitability of the lending function.
The composition of the loan portfolio at year-end for the past five years is summarized as follows:
Distribution of loan portfolio
| 2014 | 2013 | 2012 | 2011 | 2010 | ||||||||||||||||||||||||||||||||||||
| December 31 |
Amount | % | Amount | % | Amount | % | Amount | % | Amount | % | ||||||||||||||||||||||||||||||
| Commercial |
$ | 319,590 | 26.41 | % | $ | 350,680 | 29.80 | % | $ | 91,724 | 14.71 | % | $ | 88,188 | 13.96 | % | $ | 55,978 | 9.10 | % | ||||||||||||||||||||
| Real estate: |
||||||||||||||||||||||||||||||||||||||||
| Commercial |
493,481 | 40.79 | 413,058 | 35.11 | 217,496 | 34.88 | 208,875 | 33.07 | 207,964 | 33.81 | ||||||||||||||||||||||||||||||
| Residential |
310,667 | 25.68 | 322,062 | 27.37 | 261,912 | 42.00 | 281,643 | 44.60 | 295,301 | 48.01 | ||||||||||||||||||||||||||||||
| Consumer |
86,156 | 7.12 | 90,817 | 7.72 | 52,398 | 8.40 | 52,816 | 8.36 | 55,862 | 9.08 | ||||||||||||||||||||||||||||||
|
|
|
|
|
|
|
|
|
|
|
|
|
|
|
|
|
|
|
|
|
|||||||||||||||||||||
| Loans, net |
1,209,894 | 100.00 | % | 1,176,617 | 100.00 | % | 623,530 | 100.00 | % | 631,522 | 100.00 | % | 615,105 | 100.00 | % | |||||||||||||||||||||||||
|
|
|
|
|
|
|
|
|
|
|
|||||||||||||||||||||||||||||||
| Less: allowance for loan loss |
10,338 | 8,651 | 6,950 | 6,711 | 6,500 | |||||||||||||||||||||||||||||||||||
|
|
|
|
|
|
|
|
|
|
|
|||||||||||||||||||||||||||||||
| Net loans |
$ | 1,199,556 | $ | 1,167,966 | $ | 616,580 | $ | 624,811 | $ | 608,605 | ||||||||||||||||||||||||||||||
|
|
|
|
|
|
|
|
|
|
|
|||||||||||||||||||||||||||||||
-38-
Table of Contents
Loans, net increased $33.3 million or 2.8 percent in 2014 to $1.2 billion at December 31, 2014. Business loans, including commercial loans and commercial real estate loans, were $813.1 million or 67.2 percent of loans, net at December 31, 2014, and $763.7 million or 64.9 percent at year-end 2013. Residential mortgages and consumer loans totaled $396.8 million or 32.8 percent of loans, net at year-end 2014 and $412.9 million or 35.1 percent at year-end 2013. Loan demand was stagnant until the end of the third quarter of 2014, increasing at an annualized growth rate of less than 1.0 percent. However, we experienced strong loan demand in the final quarter of 2014 as loans, net increased $30.0 million or 10.1% on an annualized basis. Approximately half of the increase was attributable to growth fostered by our entrance into the Lehigh Valley market in the fourth quarter by establishing a community banking office with a dedicated team of commercial and retail lenders. The remainder of such growth was generated from improved demand for business lending in existing markets. Based on the customer service oriented philosophy of our organization along with the commitment of these employees, we expect to be as well received in this new market as we are in our existing markets.
Loans averaged $1.2 billion in 2014, compared to $689.4 million in 2013. Taxable loans averaged $1.1 billion, while tax-exempt loans averaged $68.2 million at December 31, 2014. Due to improving loan demand, the loan portfolio continues to play a prominent role in our earning asset mix. As a percentage of earning assets, average loans equaled 76.0 percent in 2014 and 2013.
The prime rate was unchanged at 3.25 percent for 2014. The tax-equivalent yield on our loan portfolio was relatively unchanged, decreasing only 1 basis point to 4.87 percent in 2014 from 4.88 percent in 2013. Included in loan interest income in 2014 was credit fair value accretion of $2.1 million related to loans acquired in the fourth quarter of 2013 which helped to offset the impact of the continuation of low interest rates on the overall yield on our loan portfolio. The effect of low market rates on our loan portfolio’s yield can be further evidenced by evaluating quarterly loan yields, which continued to decline during 2014. After increasing during the first quarter at 5.14 percent, the tax-equivalent yield on the loan portfolio fell 43 basis points to 4.71 percent in the second quarter. Loan yields rebounded in the third quarter, increasing 18 basis points. The yield on the loan portfolio decreased 15 basis points during the final quarter of 2014. With no anticipated date for change in general market rates in the near term, the yield on the loan portfolio may continue to decline as there are adjustable-rate loans in the portfolio that will reprice downward throughout the year. Moreover, increased competition will prompt more aggressive pricing for fixed rate intermediate term loans and lower yields further.
The maturity distribution and sensitivity information of the loan portfolio by major classification at December 31, 2014, is summarized as follows:
Maturity distribution and interest sensitivity of loan portfolio
| December 31, 2014 |
Within one year |
After one but within five years |
After five years |
Total | ||||||||||||
| Maturity schedule: |
||||||||||||||||
| Commercial |
$ | 105,494 | $ | 114,266 | $ | 99,830 | $ | 319,590 | ||||||||
| Real estate: |
||||||||||||||||
| Commercial |
92,537 | 240,353 | 160,591 | 493,481 | ||||||||||||
| Residential |
94,311 | 159,965 | 56,391 | 310,667 | ||||||||||||
| Consumer |
31,128 | 41,979 | 13,049 | 86,156 | ||||||||||||
|
|
|
|
|
|
|
|
|
|||||||||
| Total |
$ | 323,470 | $ | 556,563 | $ | 329,861 | $ | 1,209,894 | ||||||||
|
|
|
|
|
|
|
|
|
|||||||||
| Predetermined interest rates |
$ | 124,075 | $ | 206,436 | $ | 74,380 | $ | 404,891 | ||||||||
| Floating or adjustable interest rates |
199,395 | 350,127 | 255,481 | 805,003 | ||||||||||||
|
|
|
|
|
|
|
|
|
|||||||||
| Total |
$ | 323,470 | $ | 556,563 | $ | 329,861 | $ | 1,209,894 | ||||||||
|
|
|
|
|
|
|
|
|
|||||||||
-39-
Table of Contents
As previously mentioned, there are numerous risks inherent in the loan portfolio. We manage the portfolio by employing sound credit policies and utilizing various modeling techniques in order to limit the effects of such risks. In addition, we utilize private mortgage insurance (“PMI”) and guaranteed Small Business Administration and Federal Home Loan Bank of Pittsburgh (“FHLB-Pgh”) loan programs to mitigate credit risk in the loan portfolio.
In an attempt to limit IRR and liquidity strains, we continually examine the maturity distribution and interest rate sensitivity of the loan portfolio. For 2014, market interest rates remained at historically low levels. Given the potential for rates to rise in the future, we continued to place emphasis on originating short term fixed-rate and adjustable-rate loans. Fixed-rate loans represented 33.5 percent of the loan portfolio at December 31, 2014, compared to floating or adjustable-rate loans at 66.5 percent. Approximately 50.4 percent of the loan portfolio is expected to reprice within the next 12 months.
Additionally, our secondary market mortgage banking program provides us with an additional source of liquidity and a means to limit our exposure to IRR. Through this program, we are able to competitively price conforming one-to-four family residential mortgage loans without taking on IRR which would result from retaining these long-term, low fixed-rate loans on our books. The loans originated are subsequently sold in the secondary market, with the sales price locked in at the time of commitment, thereby greatly reducing our exposure to IRR.
Loan concentrations are considered to exist when the total amount of loans to any one borrower, or a multiple number of borrowers engaged in similar business activities or having similar characteristics, exceeds 25.0 percent of loans outstanding in any one category. We provide deposit and loan products and other financial services to individual and corporate customers in our eight-county market area. There are no significant concentrations of credit risk from any individual counterparty or groups of counterparties, except for geographic concentrations.
In addition to the risks inherent in our loan portfolio, in the normal course of business, we are also a party to financial instruments with off-balance sheet risk to meet the financing needs of our customers. These instruments include legally binding commitments to extend credit, unused portions of lines of credit and commercial letters of credit, and may involve, to varying degrees, elements of credit risk and IRR in excess of the amount recognized in the consolidated financial statements.
Credit risk is the principal risk associated with these instruments. Our involvement and exposure to credit loss in the event that the instruments are fully drawn upon and the customer defaults is represented by the contractual amounts of these instruments. In order to control credit risk associated with entering into commitments and issuing letters of credit, we employ the same credit quality and collateral policies in making commitments that we use in other lending activities. We evaluate each customer’s creditworthiness on a case-by-case basis, and if deemed necessary, obtain collateral. The amount and nature of the collateral obtained is based on our credit evaluation.
The contractual amounts of off-balance sheet commitments at year-end for the past three years are summarized as follows:
Distribution of off-balance sheet commitments
| December 31 |
2014 | 2013 | 2012 | |||||||||
| Commitments to extend credit |
$ | 187,351 | $ | 221,138 | $ | 128,540 | ||||||
| Unused portions of lines of credit |
48,610 | 52,257 | 46,377 | |||||||||
| Commercial letters of credit |
30,609 | 29,914 | 14,440 | |||||||||
|
|
|
|
|
|
|
|||||||
| Total |
$ | 266,570 | $ | 303,309 | $ | 189,357 | ||||||
|
|
|
|
|
|
|
|||||||
-40-
Table of Contents
We record a valuation allowance for off-balance sheet credit losses, if deemed necessary, separately as a liability. An allowance of $58.0 was recorded as of December 31, 2014 while no allowance was deemed necessary at December 31, 2013. We do not anticipate that losses, if any, that may occur as a result of funding off-balance sheet commitments, would have a material adverse effect on our operating results or financial position.
Asset Quality:
We are committed to developing and maintaining sound, quality assets through our credit risk management policies and procedures. Credit risk is the risk to earnings or capital which arises from a borrower’s failure to meet the terms of their loan agreement. We manage credit risk by diversifying the loan portfolio and applying policies and procedures designed to foster sound lending practices. These policies include certain standards that assist lenders in making judgments regarding the character, capacity, cash flow, capital structure and collateral of the borrower.
With regard to managing our exposure to credit risk in light of general devaluations in real estate values, we have established maximum loan-to-value ratios for commercial mortgage loans not to exceed 75.0 percent of the lower of cost or appraised value. With regard to residential mortgages, customers with loan-to-value ratios between 80.0 percent and 100.0 percent are generally required to obtain PMI. The 80.0 percent loan-to-value threshold provides a cushion in the event the property is devalued. PMI is used to protect us from loss in the event loan-to-value ratios exceed 80.0 percent and the customer defaults on the loan. Appraisals are performed by an independent appraiser engaged by us, not the customer, who is either state certified or state licensed depending upon collateral type and loan amount.
With respect to lending procedures, lenders must determine the borrower’s ability to repay the credit based on prevailing and expected market conditions prior to requesting approval for the loan. The Board of Directors establishes and reviews, at least annually, the lending authority for all loan officers and branch managers. Credits beyond the scope of the loan officers and branch managers are forwarded to the Loan Committee. This Committee, comprised of senior management, attempts to assure the quality of the loan portfolio through careful analysis of credit applications, adherence to credit policies and the examination of outstanding loans and delinquencies. These procedures assist in the early detection and timely follow-up of problem loans. Credits having an aggregated relationship of $5.0 million are subject to approval by our Board of Directors.
Credit risk is also managed by monthly internal reviews of our loan portfolio by the asset quality committee. These reviews aid us in identifying deteriorating financial conditions of borrowers, allowing us to assist customers in remedying these situations.
Nonperforming assets consist of nonperforming loans and foreclosed assets. Nonperforming loans include nonaccrual loans, troubled debt restructured loans and accruing loans past due 90 days or more. For a discussion of our policy regarding nonperforming assets and the recognition of interest income on impaired loans, refer to the notes entitled, “Summary of significant accounting policies — Nonperforming assets,” and “Loans, net and allowance for loan losses” in the Notes to Consolidated Financial Statements to this Annual Report.
Information concerning nonperforming assets for the past five years is summarized as follows. The table includes credits classified for regulatory purposes and all material credits that cause us to have serious doubts as to the borrower’s ability to comply with present loan repayment terms.
-41-
Table of Contents
Distribution of nonperforming assets
| December 31 |
2014 | 2013 | 2012 | 2011 | 2010 | |||||||||||||||
| Nonaccrual loans: |
||||||||||||||||||||
| Commercial |
$ | 1,322 | $ | 2,035 | $ | 304 | $ | 477 | $ | 977 | ||||||||||
| Real estate: |
||||||||||||||||||||
| Commercial |
1,275 | 9,172 | 145 | 591 | 1,385 | |||||||||||||||
| Residential |
3,047 | 3,569 | 1,800 | 2,006 | 1,579 | |||||||||||||||
| Consumer |
122 | 90 | 31 | 92 | 93 | |||||||||||||||
|
|
|
|
|
|
|
|
|
|
|
|||||||||||
| Total nonaccrual loans |
5,766 | 14,866 | 2,280 | 3,166 | 4,034 | |||||||||||||||
|
|
|
|
|
|
|
|
|
|
|
|||||||||||
| Troubled debt restructured loans: |
||||||||||||||||||||
| Commercial |
2,487 | 351 | 368 | 401 | ||||||||||||||||
| Real estate: |
||||||||||||||||||||
| Commercial |
2,457 | |||||||||||||||||||
| Residential |
476 | |||||||||||||||||||
| Consumer |
||||||||||||||||||||
|
|
|
|
|
|
|
|
|
|
|
|||||||||||
| Total troubled debt restructured loans |
2,933 | 2,487 | 351 | 368 | 401 | |||||||||||||||
|
|
|
|
|
|
|
|
|
|
|
|||||||||||
| Accruing loans past due 90 days or more: |
||||||||||||||||||||
| Commercial |
6 | 100 | ||||||||||||||||||
| Real estate: |
||||||||||||||||||||
| Commercial |
136 | 200 | 11 | |||||||||||||||||
| Residential |
1,062 | 678 | 243 | 641 | 1,236 | |||||||||||||||
| Consumer |
425 | 571 | 214 | 122 | 294 | |||||||||||||||
|
|
|
|
|
|
|
|
|
|
|
|||||||||||
| Total accruing loans past due 90 days or more |
1,623 | 1,455 | 457 | 774 | 1,630 | |||||||||||||||
|
|
|
|
|
|
|
|
|
|
|
|||||||||||
| Total nonperforming loans |
10,322 | 18,808 | 3,088 | 4,308 | 6,065 | |||||||||||||||
|
|
|
|
|
|
|
|
|
|
|
|||||||||||
| Foreclosed assets |
561 | 648 | 656 | 1,571 | 803 | |||||||||||||||
|
|
|
|
|
|
|
|
|
|
|
|||||||||||
| Total nonperforming assets |
$ | 10,883 | $ | 19,456 | $ | 3,744 | $ | 5,879 | $ | 6,868 | ||||||||||
|
|
|
|
|
|
|
|
|
|
|
|||||||||||
| Nonperforming loans as a percentage of loans, net |
0.85 | % | 1.60 | % | 0.50 | % | 0.68 | % | 0.99 | % | ||||||||||
| Nonperforming assets as a percentage of loans, net and foreclosed assets |
0.90 | % | 1.65 | % | 0.60 | % | 0.93 | % | 1.12 | % | ||||||||||
More effective special asset management and repayments over the past year has led to prompt resolution of troubled loans and liquidation of foreclosed properties. As a result, we experienced a marked improvement in our asset quality as evidenced by a significant decrease in nonperforming assets of $8.5 million or 44.1 percent to $10.9 million or 0.90 percent of loans, net of unearned income, and foreclosed assets at December 31, 2014, from $19.5 million or 1.65 percent of loans, net of unearned income, and foreclosed assets at the end of 2013. The improvement resulted from a $9.1 million decrease in nonaccrual loans, coupled with a $87 decline in foreclosed assets and offset partially by increases of $168 in accruing loans past due 90 days or more and $446 in troubled debt restructured loans. For a further discussion of assets classified as nonperforming assets, refer to the note entitled, “Loans, net and the allowance for loan losses,” in the Notes to Consolidated Financial Statements to this Annual Report.
We maintain the allowance for loan losses at a level we believe adequate to absorb probable credit losses related to individually evaluated loans, as well as probable incurred losses inherent in the remainder of the loan portfolio as of the balance sheet date. The balance in the allowance for loan losses account is based on past events and current economic conditions. We employ the FFIEC Interagency Policy Statement, as amended, and GAAP in assessing the adequacy of the allowance account. Under GAAP, the adequacy of the allowance account is determined based on the provisions of FASB Accounting Standards Codification (“ASC”) 310 for loans specifically identified to be individually evaluated for impairment and the requirements of FASB ASC 450, for large groups of smaller-balance homogeneous loans to be collectively evaluated for impairment.
-42-
Table of Contents
We follow our systematic methodology in accordance with procedural discipline by applying it in the same manner regardless of whether the allowance is being determined at a high point or a low point in the economic cycle. Each quarter, our loan review division identifies those loans to be individually evaluated for impairment and those to be collectively evaluated for impairment utilizing a standard criteria. Internal loan review grades are assigned quarterly to loans identified to be individually evaluated. A loan’s grade may differ from period to period based on current conditions and events, however, we consistently utilize the same grading system each quarter. We consistently use loss experience from the latest twelve quarters in determining the historical loss factor for each pool collectively evaluated for impairment. Qualitative factors are evaluated in the same manner each quarter and are adjusted within a relevant range of values based on current conditions to assure directional consistency of the allowance for loan loss account. Regulators, in reviewing the loan portfolio as part of the scope of a regulatory examination, may require us to increase our allowance for loan losses or take other actions that would require increases to our allowance for loan losses.
For a further discussion of our accounting policies for determining the amount of the allowance and a description of the systematic analysis and procedural discipline applied, refer to the note entitled, “Summary of significant accounting policies — Allowance for loan losses,” in the Notes to Consolidated Financial Statements to this Annual Report.
A reconciliation of the allowance for loan losses and an illustration of charge-offs and recoveries by major loan category for the past five years are summarized as follows:
Reconciliation of allowance for loan losses
| December 31 |
2014 | 2013 | 2012 | 2011 | 2010 | |||||||||||||||
| Allowance for loan losses at beginning of period |
$ | 8,651 | $ | 6,950 | $ | 6,711 | $ | 6,500 | $ | 6,300 | ||||||||||
| Loans charged-off: |
||||||||||||||||||||
| Commercial |
601 | 5 | 78 | 100 | 1,138 | |||||||||||||||
| Real estate: |
||||||||||||||||||||
| Commercial |
500 | 15 | 33 | 663 | ||||||||||||||||
| Residential |
804 | 508 | 431 | 1,275 | 213 | |||||||||||||||
| Consumer |
386 | 313 | 275 | 262 | 487 | |||||||||||||||
|
|
|
|
|
|
|
|
|
|
|
|||||||||||
| Total |
2,291 | 841 | 817 | 2,300 | 1,838 | |||||||||||||||
|
|
|
|
|
|
|
|
|
|
|
|||||||||||
| Loans recovered: |
||||||||||||||||||||
| Commercial |
9 | 1 | 1 | 3 | ||||||||||||||||
| Real estate: |
||||||||||||||||||||
| Commercial |
292 | 20 | 6 | 18 | 1 | |||||||||||||||
| Residential |
38 | 111 | 67 | 58 | 19 | |||||||||||||||
| Consumer |
115 | 49 | 58 | 51 | 19 | |||||||||||||||
|
|
|
|
|
|
|
|
|
|
|
|||||||||||
| Total |
454 | 181 | 132 | 130 | 39 | |||||||||||||||
|
|
|
|
|
|
|
|
|
|
|
|||||||||||
| Net loans charged-off |
1,837 | 660 | 685 | 2,170 | 1,799 | |||||||||||||||
|
|
|
|
|
|
|
|
|
|
|
|||||||||||
| Provision for loan losses |
3,524 | 2,361 | 924 | 2,381 | 1,999 | |||||||||||||||
|
|
|
|
|
|
|
|
|
|
|
|||||||||||
| Allowance for loan losses at end of period |
$ | 10,338 | $ | 8,651 | $ | 6,950 | $ | 6,711 | $ | 6,500 | ||||||||||
|
|
|
|
|
|
|
|
|
|
|
|||||||||||
| Ratios: |
||||||||||||||||||||
| Net loans charged-off as a percentage of average loans outstanding |
0.15 | % | 0.10 | % | 0.11 | % | 0.35 | % | 0.30 | % | ||||||||||
| Allowance for loan losses as a percentage of period end loans |
0.85 | % | 0.74 | % | 1.11 | % | 1.06 | % | 1.06 | % | ||||||||||
The allowance for loan losses increased $1.6 million to $10.3 million at December 31, 2014, from $8.7 million at the end of 2013. The increase resulted from a provision for loan losses of $3.5 million exceeding net loans charged-off of $1.9 million. The allowance for loan losses, as a percentage of loans, net of unearned income, was
-43-
Table of Contents
0.85 percent at the end of 2014, compared to 0.74 percent at the end of 2013. The reduction in this ratio compared to that of years prior to the merger date, was a result of applying the accounting guidance for loans that we acquired in connection with the merger which provides that there is no carryover of the related allowance for credit losses attributable to those loans. However, the guidance does require a credit quality adjustment be established as of the merger date. For a further discussion of the credit quality adjustment for loans acquired in the merger, refer to the Notes to the Consolidated Financial Statements to this Annual Report.
Past due loans not satisfied through repossession, foreclosure or related actions are evaluated individually to determine if all or part of the outstanding balance should be charged against the allowance for loan losses account. Any subsequent recoveries are credited to the allowance account. Net loans charged-off increased $1,177 to $1,837 in 2014 from $660 in 2013. Net charge-offs, as a percentage of average loans outstanding, equaled 0.15 percent in 2014 and 0.10 percent in 2013.
Allocation of the allowance for loan losses
The allocation of the allowance for loan losses for the past five years is summarized as follows:
| 2014 | 2013 | 2012 | 2011 | 2010 | ||||||||||||||||||||||||||||||||||||
| December 31 |
Amount | % | Amount | % | Amount | % | Amount | % | Amount | % | ||||||||||||||||||||||||||||||
| Allocated allowance: |
||||||||||||||||||||||||||||||||||||||||
| Specific: |
||||||||||||||||||||||||||||||||||||||||
| Commercial |
$ | 1,240 | 0.33 | % | $ | 1,500 | 0.61 | % | $ | 351 | 0.10 | % | $ | 443 | 0.13 | % | $ | 921 | 0.19 | % | ||||||||||||||||||||
| Real Estate: |
||||||||||||||||||||||||||||||||||||||||
| Commercial |
912 | 0.53 | 300 | 1.01 | 550 | 0.35 | 0.09 | 225 | 0.22 | |||||||||||||||||||||||||||||||
| Residential |
769 | 0.34 | 224 | 0.32 | 325 | 0.39 | 215 | 0.32 | 269 | 0.30 | ||||||||||||||||||||||||||||||
| Consumer |
38 | 0.01 | 0.01 | 0.01 | 0.02 | 0.02 | ||||||||||||||||||||||||||||||||||
|
|
|
|
|
|
|
|
|
|
|
|
|
|
|
|
|
|
|
|
|
|||||||||||||||||||||
| Total specific |
2,959 | 1.21 | 2,024 | 1.95 | 1,226 | 0.85 | 658 | 0.56 | 1,415 | 0.73 | ||||||||||||||||||||||||||||||
|
|
|
|
|
|
|
|
|
|
|
|
|
|
|
|
|
|
|
|
|
|||||||||||||||||||||
| Formula: |
||||||||||||||||||||||||||||||||||||||||
| Commercial |
1,081 | 26.09 | 508 | 29.19 | 448 | 14.60 | 350 | 13.83 | 1,036 | 8.91 | ||||||||||||||||||||||||||||||
| Real Estate: |
||||||||||||||||||||||||||||||||||||||||
| Commercial |
2,125 | 40.25 | 2,094 | 34.10 | 1,754 | 34.53 | 2,294 | 32.98 | 1,842 | 33.58 | ||||||||||||||||||||||||||||||
| Residential |
2,921 | 25.34 | 2,911 | 27.05 | 2,656 | 41.62 | 2,640 | 44.28 | 484 | 47.71 | ||||||||||||||||||||||||||||||
| Consumer |
1,252 | 7.11 | 1,114 | 7.71 | 866 | 8.40 | 769 | 8.35 | 1,723 | 9.07 | ||||||||||||||||||||||||||||||
|
|
|
|
|
|
|
|
|
|
|
|
|
|
|
|
|
|
|
|
|
|||||||||||||||||||||
| Total formula |
7,379 | 98.79 | 6,627 | 98.05 | 5,724 | 99.15 | 6,053 | 99.44 | 5,085 | 99.27 | ||||||||||||||||||||||||||||||
|
|
|
|
|
|
|
|
|
|
|
|
|
|
|
|
|
|
|
|
|
|||||||||||||||||||||
| Total allocated allowance |
10,338 | 100.00 | % | 8,651 | 100.00 | % | 6,950 | 100.00 | % | 6,711 | 100.00 | % | 6,500 | 100.00 | % | |||||||||||||||||||||||||
|
|
|
|
|
|
|
|
|
|
|
|||||||||||||||||||||||||||||||
| Unallocated allowance |
||||||||||||||||||||||||||||||||||||||||
|
|
|
|
|
|
|
|
|
|
|
|||||||||||||||||||||||||||||||
| Total |
$ | 10,338 | $ | 8,651 | $ | 6,950 | $ | 6,711 | $ | 6,500 | ||||||||||||||||||||||||||||||
|
|
|
|
|
|
|
|
|
|
|
|||||||||||||||||||||||||||||||
The allocated element of the allowance for loan losses account increased $1,687 to $10,338 at December 31, 2014, compared to $8,651 at December 31, 2013. Both the specific and formula portions of the allowance for loan losses increased from the end of 2013. The specific portion of the allowance for impairment of loans individually evaluated under FASB ASC 310, increased $935 to $2,959 at December 31, 2014, from $2,024 at December 31, 2013. In addition, the formula portion of the allowance for loans collectively evaluated for impairment under FASB ASC 450, increased $752 to $7,379 at December 31, 2014, from $6,627 at December 31, 2013. The increase in the specific portion of the allowance was a result of an increase in the amount of impaired loans designated with a related allowance to $6,525 at December 31, 2014 from $4,378 at year-end 2013. The total loss factor for collectively evaluated loans increased from year-end 2013 due to an increase in both the historical loss factor along with increases in certain qualitative factors. The increase in the historical factor was a function of the increase in net charge-offs. Commercial and commercial real estate loans experienced increases in qualitative factors related to
-44-
Table of Contents
changes in the volume and concentrations of these loans. Increases in qualitative factors for residential mortgage and consumers loans were related to changes in the volume and severity of classified loans, including past due, nonaccrual, troubled debt restructures and other loan modifications; changes in the levels of, and trends in, charge-offs and recoveries; and changes in national, regional, local and industry economic conditions, including the effects of such changes on the value of underlying collateral for collateral-dependent loans.
The coverage ratio, the allowance for loan losses account, as a percentage of nonperforming loans, is an industry ratio used to test the ability of the allowance account to absorb potential losses arising from nonperforming loans. The coverage ratio was 95.0 percent at December 31, 2014 and 46.0 percent at December 31, 2013. We believe that our allowance was adequate to absorb probable credit losses at December 31, 2014.
Deposits:
Our deposit base is the primary source of funds to support our operations. We offer a variety of deposit products to meet the needs of our individual and commercial customers. Total deposits grew $46.1 million or 3.4 percent to $1.4 billion at the end of 2014. Noninterest-bearing deposits grew $33.6 million or 12.0% while interest-bearing deposits increased $12.5 million or 1.1% in 2014. Noninterest-bearing deposits represented 22.0 percent of total deposits while interest-bearing deposits accounted for 88.0 percent of total deposits at December 31, 2014. Comparatively, noninterest-bearing deposits and interest-bearing deposits represented 20.2 percent and 79.8 percent of total deposits at year end 2013. With regard to noninterest-bearing deposits, commercial checking accounts increased $16.6 million or 11.6 percent, while personal checking accounts grew $16.9 million or 12.3 percent. The increase in noninterest-bearing deposits is essential in attempting to keep our overall cost of funds low given the pressure on our net interest margin from the continuation of the low interest rate environment.
With regard to interest-bearing deposits, interest-bearing transaction accounts, which include money market accounts, NOW accounts, and savings accounts, increased $47.7 million in 2014. Commercial interest-bearing transaction accounts decreased $5.8 million, while personal interest-bearing transaction accounts increased $53.5 million. The increase in personal accounts was primarily due to increases in certificates of savings accounts of $25.3 million along with an increase in NOW accounts of $22.2 million. We continued to experience strong growth in these account types, as customers continued to receive lease payments and royalties from gas companies for drilling rights to their properties and are opting to retain funds readily available given the low interest rate environment. Total time deposits decreased $35.2 million to $267.7 million at December 31, 2014 from $302.9 million at December 31, 2013. The decrease was primarily due to reductions in time deposits with maturities of one year or shorter.
The average amount of, and the rate paid on, the major classifications of deposits for the past three years are summarized as follows:
Deposit distribution
| 2014 | 2013 | 2012 | ||||||||||||||||||||||
| Year Ended December 31 |
Average Balance |
Average Rate |
Average Balance |
Average Rate |
Average Balance |
Average Rate |
||||||||||||||||||
| Interest-bearing: |
||||||||||||||||||||||||
| Money market accounts |
$ | 211,441 | 0.38 | % | $ | 175,675 | 0.25 | % | $ | 162,775 | 0.33 | % | ||||||||||||
| NOW accounts |
233,289 | 0.35 | 116,242 | 0.23 | 93,151 | 0.25 | ||||||||||||||||||
| Savings accounts |
378,272 | 0.27 | 150,083 | 0.11 | 124,692 | 0.13 | ||||||||||||||||||
| Time deposits less than $100 |
207,866 | 0.98 | 97,826 | 0.97 | 114,050 | 1.13 | ||||||||||||||||||
| Time deposits $100 or more |
88,897 | 0.85 | 87,277 | 1.22 | 82,196 | 1.44 | ||||||||||||||||||
|
|
|
|
|
|
|
|||||||||||||||||||
| Total interest-bearing |
1,119,765 | 0.49 | % | 627,103 | 0.46 | % | 576,864 | 0.59 | % | |||||||||||||||
| Noninterest-bearing |
291,685 | 158,790 | 140,001 | |||||||||||||||||||||
|
|
|
|
|
|
|
|||||||||||||||||||
| Total deposits |
$ | 1,411,450 | $ | 785,893 | $ | 716,865 | ||||||||||||||||||
|
|
|
|
|
|
|
|||||||||||||||||||
-45-
Table of Contents
Total deposits averaged $1.4 billion in 2014, an increase of $625.6 million or 79.6 percent, compared to $785.9 million in 2013. The significant increases in the 2014 versus 2013 year-over-year comparison resulted primarily from the application of purchase accounting whereby those financial statement components of the legal acquirer for periods prior to the merger were excluded from Peoples 2013 financial statements. Average noninterest-bearing deposits increased $132.9 million, while average interest-bearing accounts grew $492.7 million. Average interest-bearing transaction deposits, including money market, NOW and savings accounts, increased $381.0 million while average total time deposits decreased $111.7 million comparing 2014 and 2013.
Our cost of interest-bearing deposits increased 3 basis points to 0.49 percent in 2014 from 0.46 percent in 2013. Specifically, the cost of interest-bearing transaction accounts increased 13 basis points to 0.32 percent while the cost of time deposits decreased 15 basis points to 0.94 percent comparing 2014 and 2013. Interest-bearing deposit costs declined 3 basis points in the third quarter of 2014 and an additional 2 basis points to 0.46 percent in the fourth quarter of 2014 from 0.51 percent in the first half of 2014. The decline was a result of more customers moving funds from higher costs time deposits to lower costs interest-bearing transaction accounts.
Volatile deposits, time deposits $100 or more, were $75.9 million at December 31, 2014 compared to $98.4 million at the end of 2013. Large denomination time deposits averaged $88.9 million in 2014, an increase of $1.6 million or 1.8 percent from $87.3 million in 2013. Our average cost of these funds decreased 37 basis points to 0.85 percent in 2014, from 1.22 percent in 2013. This type of funding is susceptible to withdrawal by the depositor as they are particularly price sensitive and are therefore not considered to be a strong source of liquidity.
Maturities of time deposits $100 or more for the past three years are summarized as follows:
Maturity distribution of time deposits $100 or more
| December 31 |
2014 | 2013 | 2012 | |||||||||
| Within three months |
$ | 16,097 | $ | 24,350 | $ | 15,402 | ||||||
| After three months but within six months |
9,815 | 19,202 | 26,518 | |||||||||
| After six months but within twelve months |
17,712 | 18,969 | 10,693 | |||||||||
| After twelve months |
32,228 | 35,840 | 29,242 | |||||||||
|
|
|
|
|
|
|
|||||||
| Total |
$ | 75,852 | $ | 98,361 | $ | 81,855 | ||||||
|
|
|
|
|
|
|
|||||||
We recorded a core deposit intangible related to a value ascribed to demand, interest checking, money market and saving accounts as well as a fair value adjustment for time deposits assumed in applying the purchase accounting guidance for the merger. For a further discussion of the fair value adjustments related to deposits assumed in the merger, refer to the Notes to the Consolidated Financial Statements to this Annual Report.
In addition to deposit gathering, we have in place a secondary source of liquidity to fund operations through exercising existing credit arrangements with the FHLB-Pgh. We had only minimal reliance on this type of funding in 2014 and 2013. For a further discussion of our borrowings and their terms, refer to the notes entitled, “Short-term borrowings” and “Long-term debt,” in the Notes to Consolidated Financial Statements included in Part II, Item 8 of this Annual Report.
Market Risk Sensitivity:
Market risk is the risk to our earnings and/or financial position resulting from adverse changes in market rates or prices, such as interest rates, foreign exchange rates or equity prices. Our exposure to market risk is primarily IRR associated with our lending, investing and deposit gathering activities. During the normal course of business,
-46-
Table of Contents
we are not exposed to foreign exchange risk or commodity price risk. Our exposure to IRR can be explained as the potential for change in our reported earnings and/or the market value of our net worth. Variations in interest rates affect the underlying economic value of our assets, liabilities and off-balance sheet items. These changes arise because the present value of future cash flows, and often the cash flows themselves, change with interest rates. The effects of the changes in these present values reflect the change in our underlying economic value, and provide a basis for the expected change in future earnings related to interest rates. Interest rate changes affect earnings by changing net interest income and the level of other interest-sensitive income and operating expenses. IRR is inherent in the role of banks as financial intermediaries. However, a bank with a high degree of IRR may experience lower earnings, impaired liquidity and capital positions, and most likely, a greater risk of insolvency. Therefore, banks must carefully evaluate IRR to promote safety and soundness in their activities.
The FOMC has maintained the target range for the federal funds rate at 0 to 25 basis points since year-end 2008. Although economic conditions continue to improve the timing and the magnitude of monetary policy actions that will impact the current exceptionally low interest rate environment are uncertain. Given these conditions, IRR and the ability to effectively manage it, are extremely critical to both bank management and regulators. The FFIEC through its advisory guidance reiterates the importance of effective corporate governance, policies and procedures, risk measuring and monitoring systems, stress testing and internal controls related to the IRR exposure of depository institutions. According to the advisory, the bank regulators believe that the current financial market and economic conditions present significant risk management challenges to all financial institutions. Although the bank regulators recognize that some degree of IRR is inherent in banking, they expect institutions to have sound risk management practices in place to measure, monitor and control IRR exposure. The advisory states that the adequacy and effectiveness of an institution’s IRR management process and the level of IRR exposure are critical factors in the bank regulators’ evaluation of an institution’s sensitivity to changes in interest rates and capital adequacy. Material weaknesses in risk management processes or high levels of IRR exposure relative to capital will require corrective action. We believe our risk management practices with regard to IRR were sound, suitable and adequate given the level of IRR exposure at December 31, 2014.
The Asset/Liability Committee (“ALCO”), comprised of members of our Board of Directors, senior management and other appropriate officers, oversees our IRR management program. Specifically, ALCO analyzes economic data and market interest rate trends, as well as competitive pressures, and utilizes several computerized modeling techniques to reveal potential exposure to IRR. This allows us to monitor and attempt to control the influence these factors may have on our rate sensitive assets (“RSA”), rate sensitive liabilities (“RSL”) and overall operating results and financial position.
With respect to evaluating our exposure to IRR on earnings, we utilize a gap analysis model that considers repricing frequencies of RSA and RSL. Gap analysis attempts to measure our interest rate exposure by calculating the net amount of RSA and RSL that reprice within specific time intervals. A positive gap occurs when the amount of RSA repricing in a specific period is greater than the amount of RSL repricing within that same time frame and is indicated by a RSA/RSL ratio greater than 1.0. A negative gap occurs when the amount of RSL repricing is greater than the amount of RSA and is indicated by a RSA/RSL ratio less than 1.0. A positive gap implies that earnings will be impacted favorably if interest rates rise and adversely if interest rates fall during the period. A negative gap tends to indicate that earnings will be affected inversely to interest rate changes.
Our interest rate sensitivity gap position, illustrating RSA and RSL at their related carrying values, is summarized as follows. The distributions in the table are based on a combination of maturities, call provisions, repricing frequencies and prepayment patterns. Adjustable-rate assets and liabilities are distributed based on the repricing frequency of the instrument. Mortgage instruments are distributed in accordance with estimated cash flows, assuming there is no change in the current interest rate environment.
-47-
Table of Contents
Interest rate sensitivity
| December 31, 2014 |
Due within three months |
Due after three months but within twelve months |
Due after one year but within five years |
Due after five years |
Total | |||||||||||||||
| Rate-sensitive assets: |
||||||||||||||||||||
| Interest-bearing deposits in other banks |
$ | 4,290 | $ | 1,984 | $ | 496 | $ | 6,770 | ||||||||||||
| Federal funds sold |
||||||||||||||||||||
| Investment securities |
13,351 | 54,055 | 243,878 | $ | 42,967 | 354,251 | ||||||||||||||
| Loans held for sale |
3,486 | 3,486 | ||||||||||||||||||
| Loans, net |
381,971 | 228,346 | 494,531 | 105,046 | 1,209,894 | |||||||||||||||
|
|
|
|
|
|
|
|
|
|
|
|||||||||||
| Total rate-sensitive assets |
$ | 403,098 | $ | 284,385 | $ | 738,905 | $ | 148,013 | $ | 1,574,401 | ||||||||||
|
|
|
|
|
|
|
|
|
|
|
|||||||||||
| Rate-sensitive liabilities: |
||||||||||||||||||||
| Money market accounts |
$ | 197,442 | $ | 197,442 | ||||||||||||||||
| NOW accounts |
69,582 | $ | 185,342 | 254,924 | ||||||||||||||||
| Savings accounts |
391,952 | 391,952 | ||||||||||||||||||
| Time deposits less than $100 |
37,775 | $ | 59,679 | 80,367 | $ | 14,069 | 191,890 | |||||||||||||
| Time deposits $100 or more |
16,097 | 27,527 | 26,069 | 6,159 | 75,852 | |||||||||||||||
| Short-term borrowings |
19,557 | 19,557 | ||||||||||||||||||
| Long-term debt |
10,130 | 1,964 | 14,328 | 6,718 | 33,140 | |||||||||||||||
|
|
|
|
|
|
|
|
|
|
|
|||||||||||
| Total rate-sensitive liabilities |
$ | 350,583 | $ | 89,170 | $ | 698,058 | $ | 26,946 | $ | 1,164,757 | ||||||||||
|
|
|
|
|
|
|
|
|
|
|
|||||||||||
| Rate-sensitivity gap: |
||||||||||||||||||||
| Period |
$ | 52,515 | $ | 195,215 | $ | 40,847 | $ | 121,067 | ||||||||||||
| Cumulative |
$ | 52,515 | $ | 247,730 | $ | 288,577 | $ | 409,644 | ||||||||||||
| RSA/RSL ratio: |
||||||||||||||||||||
| Period |
1.15 | 3.19 | 1.06 | 5.49 | ||||||||||||||||
| Cumulative |
1.15 | 1.56 | 1.25 | 1.35 | 1.35 | |||||||||||||||
At December 31, 2014 and 2013, we had cumulative one-year RSA/RSL ratios of 1.56 and 1.34. As previously mentioned, this indicated that if interest rates increase, our earnings would likely be favorably impacted. Given current improvement in economic conditions and the recent announcement of the FOMC that it will consider raising short-term rates in the latter part of 2015, the focus of ALCO has been to maintain the positive gap position in order to safeguard future earning from the potential risk of rising interest rates. However, ALCO recently took steps to reduce the magnitude of our positive gap position and guard against rates unchanged through the origination of five- to seven-year fixed rate loans and utilizing any excess funds not used for lending through purchasing six- to eight-year tax-exempt state and municipal obligations. ALCO will continue to focus efforts on strategies in 2015 in an attempt to maintain a positive gap position between RSA and RSL. However, these forward-looking statements are qualified in the aforementioned section entitled “Forward-Looking Discussion” in this Management’s Discussion and Analysis.
The change in our cumulative one-year ratio from the previous year-end resulted from a $67.4 million or 13.3 percent decrease in RSL coupled with a $7.7 million or 1.1 percent increase in RSA maturing or repricing within one year. The increase in RSL resulted primarily from a $33.3 million decrease in total time deposits maturing or repricing within this time frame, coupled with a decrease of $30.8 million in interest-bearing transaction accounts. The majority of the growth in money market and NOW accounts resulted from an increase in the deposit balances of local school districts and certain commercial customer. Due to the somewhat cyclical nature associated with these deposits, we classified money market and NOW accounts in the “due within twelve months” category.
-48-
Table of Contents
With respect to the increase in RSA maturing or repricing within a twelve month time horizon, investment securities increased $10.7 million and loans, net of unearned income, rose $7.9 million. Although short-term interest rates began to increase during 2014, long-term interest rates fell causing a flattening in the yield curve. In an effort to mitigate IRR in the investment portfolio and provide a source of liquidity, we chose to invest in fixed-rate, short-term U.S. Government-sponsored agency securities. The increase in loans, net of unearned income, resulted from an increase in commercial lending, which primarily involves loans with adjustable-rate terms that reprice in the near term. Partially offsetting these increases were reductions of $3.1 million in interest-bearing deposits in other banks and $9.5 million in federal funds sold.
Static gap analysis, although a credible measuring tool, does not fully illustrate the impact of interest rate changes on future earnings. First, market rate changes normally do not equally or simultaneously affect all categories of assets and liabilities. Second, assets and liabilities that can contractually reprice within the same period may not do so at the same time or to the same magnitude. Third, the interest rate sensitivity table presents a one-day position and variations occur daily as we adjust our rate sensitivity throughout the year. Finally, assumptions must be made in constructing such a table. For example, the conservative nature of our Asset/Liability Management Policy assigns personal NOW accounts to the “Due after three months but within twelve months” repricing interval. In reality, these accounts may reprice less frequently and in different magnitudes than changes in general market interest rate levels.
We utilize a simulation model to address the failure of the static gap model to address the dynamic changes in the balance sheet composition or prevailing interest rates and to enhance our asset/liability management. This model creates pro forma net interest income scenarios under various interest rate shocks. Given instantaneous and parallel shifts in general market rates of plus 100 basis points, our projected net interest income for the 12 months ending December 31, 2015, would increase slightly at 1.9 percent from model results using current interest rates.
We will continue to monitor our IRR position in 2015 and employ deposit and loan pricing strategies and direct the reinvestment of loan and investment payments and prepayments in order to maintain a favorable IRR position.
Financial institutions are affected differently by inflation than commercial and industrial companies that have significant investments in fixed assets and inventories. Most of our assets are monetary in nature and change correspondingly with variations in the inflation rate. It is difficult to precisely measure the impact inflation has on us, however, we believe that our exposure to inflation can be mitigated through our asset/liability management program.
Liquidity:
Liquidity management is essential to our continuing operations as it gives us the ability to meet our financial obligations as they come due, as well as to take advantage of new business opportunities as they arise. Our financial obligations include, but are not limited to, the following:
| • | Funding new and existing loan commitments; |
| • | Payment of deposits on demand or at their contractual maturity; |
| • | Repayment of borrowings as they mature; |
| • | Payment of lease obligations; and |
| • | Payment of operating expenses. |
Our liquidity position is impacted by several factors which include, among others, loan origination volumes, loan and investment maturity structure and cash flows, demand for core deposits and certificate of deposit maturity structure and retention. We manage these liquidity risks daily, thus enabling us to effectively monitor fluctuations in
-49-
Table of Contents
our position and to adapt our position according to market influence and balance sheet trends. We also forecast future liquidity needs and develop strategies to ensure adequate liquidity at all times.
Historically, core deposits have been our primary source of liquidity because of their stability and lower cost, in general, than other types of funding. Providing additional sources of funds are loan and investment payments and prepayments and the ability to sell both available-for-sale securities and mortgage loans held for sale. As a final source of liquidity, we have available borrowing arrangements with various financial intermediaries, including the FHLB-Pgh. At December 31, 2014, our maximum borrowing capacity with the FHLB-Pgh was $544.3 million of which $52.0 million was outstanding in borrowings. We believe our liquidity is adequate to meet both present and future financial obligations and commitments on a timely basis.
We maintain a Contingency Funding Plan to address liquidity in the event of a funding crisis. Examples of some of the causes of a liquidity crisis include, among others, natural disasters, war, events causing reputational harm and severe and prolonged asset quality problems. The Plan recognizes the need to provide alternative funding sources in times of crisis that go beyond our core deposit base. As a result, we have created a funding program that ensures the availability of various alternative wholesale funding sources that can be used whenever appropriate. Identified alternative funding sources include:
| • | FHLB-Pgh liquidity contingency line of credit; |
| • | Federal Reserve Bank discount window; |
| • | Internet certificates of deposit; |
| • | Brokered deposits; |
| • | Institutional Deposit Corporation deposits; |
| • | Repurchase agreements; and |
| • | Federal funds purchased. |
Based on our liquidity position at December 31, 2014, we do not anticipate the need to utilize any of these sources in the near term.
We employ a number of analytical techniques in assessing the adequacy of our liquidity position. One such technique is the use of ratio analysis to illustrate our reliance on noncore funds to fund our investments and loans maturing after 2014. At December 31, 2014, our noncore funds consisted of time deposits in denominations of $100 or more, repurchase agreements, short-term borrowings and long-term debt. Large denomination time deposits are particularly not considered to be a strong source of liquidity since they are very interest rate sensitive and are considered to be highly volatile. At December 31, 2014, our net noncore funding dependence ratio, the difference between noncore funds and short-term investments to long-term assets, was 8.5 percent. Our net short-term noncore funding dependence ratio, noncore funds maturing within one year, less short-term investments to long-term assets equaled 3.0 percent. Comparatively, our ratios equaled 10.0 percent and 4.1 percent at the end of 2013, which indicated a decrease in our reliance on noncore funds. Moreover, our Basis Liquidity Surplus ratio, defined as liquid assets less short-term potentially volatile liabilities as a percentage of total assets, improved slightly to 4.8 percent at December 31, 2014, from 4.7 percent at December 31, 2013. We believe that by supplying adequate volumes of short-term investments and implementing competitive pricing strategies on deposits, we can ensure adequate liquidity to support future growth.
The Consolidated Statements of Cash Flows present the change in cash and cash equivalents from operating, investing and financing activities. Cash and cash equivalents consist of cash on hand, cash items in the process of collection, noninterest-bearing and interest-bearing deposits with other banks and federal funds sold. Cash and cash equivalents decreased $19.9 million for the year ended December 31, 2014. Conversely, for the year ended December 31, 2013, cash and cash equivalents increased $3.5 million. During 2014, cash provided by operating and financing activities were more than offset by cash used in investing activities.
-50-
Table of Contents
Operating activities provided net cash of $21.0 million in 2014 and $9.8 million in 2013. Net income, adjusted for the effects of noncash expenses such as depreciation, amortization (accretion) of tangible and intangible assets and investment securities, and the provision for loan losses is the primary source of funds from operations.
Net cash provided by financing activities equaled $31.5 million in 2014. Net cash provided by financing activities was $8.6 million in 2013. Deposit gathering, which is our predominant financing activity, increased in both 2014 and 2013. Deposit gathering provided a net cash inflow in 2014 of $47.1 million and $28.9 million in 2013. Partially offsetting the cash provided by deposit gathering in 2014 was a $2.5 million net decrease in short-term borrowings, and a $3.5 million repayment of long-term debt and cash dividends paid of $9.4 million.
Our primary investing activities involve transactions related to our investment and loan portfolios. Net cash used in investing activities totaled $72.3 million in 2014. Net cash used in investing activities was $14.9 million in 2013. Net cash used in lending activities was $34.7 million in 2014, a decrease from $50.7 million in 2013. Activities related to our investment portfolio used net cash of $37.2 million in 2014 and provided net cash of $12.1 million in 2013.
We anticipate our liquidity position to be stable in 2015. Based on the acceleration of loan demand in existing markets in the fourth quarter of 2014 and as a result of our recent entrance into the Lehigh Valley market through establishing a community banking office with a dedicated team of commercial and retail lenders, we are expecting loan demand to continue to be strong throughout 2015. We expect to fund such demand through deposit gathering and payments and prepayments on loans and investments. As the infrastructure for natural gas drilling grows, we anticipate deposit receipts from royalties to increase. Moreover, if economic conditions were to weaken it may result in increased interest in bank deposits, as consumers continue to save rather than spend. However, we cannot predict the economic climate or the savings habits of consumers. Should economic conditions continue to improve, deposit gathering may be negatively impacted as depositors seek alternative investments in the market. Regardless of economic conditions and stock market fluctuations, we believe that through constant monitoring and adherence to our liquidity plan, we will have the means to provide adequate cash to fund our normal operations in 2015.
Capital Adequacy:
We believe a strong capital position is essential to our continued growth and profitability. We strive to maintain a relatively high level of capital to provide our depositors and stockholders with a margin of safety. In addition, a strong capital base allows us to take advantage of profitable opportunities, support future growth and provide protection against any unforeseen losses.
Our ALCO continually reviews our capital position. As part of its review, the ALCO considers: (i) the current and expected capital requirements, including the maintenance of capital ratios in excess of minimum regulatory guidelines; (ii) potential changes in the market value of our securities due to interest rates changes and effect on capital; (iii) projected organic and inorganic asset growth; (iv) the anticipated level of net earnings and capital position, taking into account the projected asset/liability position and exposure to changes in interest rates; (v) significant deteriorations in asset quality; and (vi) the source and timing of additional funds to fulfill future capital requirements.
Based on the recent regulatory emphasis placed on banks to assure capital adequacy, our Board of Directors annually reviews and approves a Capital Plan. Among other specific objectives, this comprehensive plan: (i) attempts to ensure that we and Peoples Bank remain well capitalized under the regulatory framework for prompt corrective action; (ii) evaluates our capital adequacy exposure through a comprehensive risk assessment; (iii) incorporates periodic stress testing in accordance with the Federal Reserve Board’s Supervisory Capital Assessment Program (“SCAP”); (iv) establishes event triggers and action plans to ensure capital adequacy; and (v) identifies realistic and readily available alternative sources for augmenting capital if higher capital levels are required.
-51-
Table of Contents
Bank regulatory agencies consider capital to be a significant factor in ensuring the safety of a depositor’s accounts. These agencies have adopted minimum capital adequacy requirements that include mandatory and discretionary supervisory actions for noncompliance. Our and Peoples Bank’s risk-based capital ratios are strong and have consistently exceeded the minimum regulatory capital ratios of 4.0 percent and 8.0 percent required for adequately capitalized institutions. Our ratio of Tier 1 capital to risk-weighted assets and off-balance sheet items was 14.8 percent at December 31, 2014, and 13.6 percent at December 31, 2013. Our Total capital ratio was 15.6 percent at December 31, 2014 and 14.3 percent at December 31, 2013. Similarly, our Leverage ratio, which equaled 10.8 percent at December 31, 2014, and 10.1 percent at December 31, 2013, exceeded the minimum of 4.0 percent for capital adequacy purposes. Peoples Bank reported Tier 1 capital, Total capital and Leverage ratios of 14.3 percent, 15.2 percent and 10.4 percent at December 31, 2014, and 13.1 percent, 13.8 percent and 9.8 percent at December 31, 2013. Based on the most recent notification from the FDIC, Peoples Bank was categorized as well capitalized at December 31, 2014 and 2013. There are no conditions or events since this notification that we believe have changed Peoples Bank’s category. For a further discussion of these risk-based capital standards and supervisory actions for noncompliance, refer to the note entitled, “Regulatory matters,” in the Notes to Consolidated Financial Statements to this Annual Report.
In July 2013, the federal banking agencies issued final rules to implement the Basel III regulatory capital reforms and changes required by the Dodd-Frank Act. The phase-in period for community banking organizations such as ours begins January 1, 2015. For a further discussion of the incorporation of the revised regulatory requirements into the prompt corrective action framework, refer to the section entitled, “Supervision and Regulatory - Regulatory Capital Changes,” in Part I of this Annual Report.
Stockholders’ equity was $246.8 million or $32.69 per share at December 31, 2014, and $238.8 million or $31.62 per share at December 31, 2013. Stockholders’ equity grew $8.0 million in 2014 as net income was partially offset by an increase in accumulated other comprehensive loss, dividends and the retirement of common shares held as treasury stock.
We declared dividends of $1.24 per share in 2014 and $1.23 per share in 2013. The dividend payout ratio, dividends declared as a percent of net income, equaled 53.0 percent in 2014 and 96.3 percent in 2013. Our board of directors intends to continue paying cash dividends in the future. The Penseco merger agreement contemplates that, unless 80 percent of our board of directors determines otherwise, we will pay a quarterly cash dividend in an amount no less than $0.31 per share through 2018, provided that sufficient funds are legally available, and that Peoples and Peoples Bank remain “well-capitalized” in accordance with applicable regulatory guidelines. Our ability to declare and pay dividends in the future, however, is based on our operating results, financial and economic conditions, capital and growth objectives, appropriate dividend restrictions and other relevant factors. We rely on dividends received from our subsidiary, Peoples Bank, for payment of dividends to stockholders. Peoples Bank’s ability to pay dividends is subject to federal and state regulations. For a further discussion on our ability to declare and pay dividends in the future and dividend restrictions, refer to the note entitled, “Regulatory matters,” in the Notes to Consolidated Financial Statements included in Part II, Item 8 of this Annual Report.
On January 31, 2014, our board of directors adopted a common stock repurchase plan whereby we are authorized to repurchase up to 370,000 shares of our outstanding shares through open market purchases. Under this plan, we repurchased and retired 1,800 shares for $70 in 2014. On January 30, 2015, our Board of Directors reapproved this plan.
Review of Financial Performance:
Net income was $17.6 million or $2.34 per share in 2014 and $5.7 million or $1.21 per share in 2013. The significant increases in the 2014 versus 2013 year-over-year income statement components primarily resulted from the application of purchase accounting whereby those components of the legal acquirer for periods prior to the merger were excluded from Peoples 2013 income statement. Moreover as a result of the merger, our financial performance was impacted by recognizing acquisition related expenses totaling $1.7 million in 2014 and
-52-
Table of Contents
$4.6 million in 2013. Return on average assets (“ROAA”) and return on average equity (“ROAE”) were 1.03 percent and 7.29 percent for the year ended December 31, 2014. ROAA was 0.58 percent and ROAE was 4.01 percent for the year ended December 31, 2013.
Tax-equivalent net interest income was $60.3 million in 2014 and $35.4 million in 2013. Our net interest margin equaled 3.86 percent in 2014 and 3.91 percent in 2013. Noninterest income totaled $15.3 million in 2014 and $11.8 million in 2013. Noninterest expense was $45.9 million for the year ended December 31, 2014 compared to $36.4 million for the year ended December 31, 2013. Our productivity is measured by the operating efficiency ratio, defined as noninterest expense less amortization of intangible assets divided by the total of net interest income and noninterest income. Our operating efficiency ratio was 61.5 percent in 2014.
Net Interest Income:
Net interest income is the fundamental source of earnings for commercial banks. Moreover, fluctuations in the level of net interest income can have the greatest impact on net profits. Net interest income is defined as the difference between interest revenue, interest and fees earned on interest-earning assets, and interest expense, the cost of interest-bearing liabilities supporting those assets. The primary sources of earning assets are loans and investment securities, while interest-bearing deposits and borrowings comprise interest-bearing liabilities. Net interest income is impacted by:
| • | Variations in the volume, rate and composition of earning assets and interest-bearing liabilities; |
| • | Changes in general market interest rates; and |
| • | The level of nonperforming assets. |
Changes in net interest income are measured by the net interest spread and net interest margin. Net interest spread, the difference between the average yield earned on earning assets and the average rate incurred on interest-bearing liabilities, illustrates the effects changing interest rates have on profitability. Net interest margin, net interest income as a percentage of average earning assets, is a more comprehensive ratio, as it reflects not only the spread, but also the change in the composition of interest-earning assets and interest-bearing liabilities. Tax-exempt loans and investments carry pretax yields lower than their taxable counterparts. Therefore, in order to make the analysis of net interest income more comparable, tax-exempt income and yields are reported in this analysis on a tax-equivalent basis using the prevailing federal statutory tax rate.
Similar to all banks, we consider the maintenance of an adequate net interest margin to be of primary concern. The current economic environment has been very challenging for the banking industry. In addition to market rates and competition, nonperforming asset levels are of particular concern for the banking industry and may place additional pressure on net interest margins. Nonperforming assets may stabilize or decrease given the improvements in the economy, particularly the labor markets. No assurance can be given as to how general market conditions will change or how such changes will affect net interest income. Therefore, we believe through prudent deposit and loan pricing practices, careful investing, and constant monitoring of nonperforming assets, our net interest margin will remain strong.
We analyze interest income and interest expense by segregating rate and volume components of earning assets and interest-bearing liabilities. The impact changes in the interest rates earned and paid on assets and liabilities, along with changes in the volumes of earning assets and interest-bearing liabilities, have on net interest income are summarized as follows. The net change or mix component, attributable to the combined impact of rate and volume changes within earning assets and interest-bearing liabilities’ categories, has been allocated proportionately to the change due to rate and the change due to volume.
-53-
Table of Contents
Net interest income changes due to rate and volume
| 2014 vs 2013 Increase (decrease) attributable to |
2013 vs 2012 Increase (decrease) attributable to |
|||||||||||||||||||||||
| Total | Rate | Volume | Total | Rate | Volume | |||||||||||||||||||
| Interest income: |
||||||||||||||||||||||||
| Loans: |
||||||||||||||||||||||||
| Taxable |
$ | 23,214 | $ | (183 | ) | $ | 23,397 | $ | 250 | $ | (2,609 | ) | $ | 2,859 | ||||||||||
| Tax-exempt |
949 | 142 | 807 | (18 | ) | 111 | (129 | ) | ||||||||||||||||
| Investments: |
||||||||||||||||||||||||
| Taxable |
2,115 | 122 | 1,993 | (464 | ) | (376 | ) | (88 | ) | |||||||||||||||
| Tax-exempt |
1,055 | (734 | ) | 1,789 | (55 | ) | (232 | ) | 177 | |||||||||||||||
| Interest-bearing deposits |
(48 | ) | 48 | (96 | ) | 39 | 17 | 22 | ||||||||||||||||
| Federal funds sold |
68 | 68 | 2 | 2 | ||||||||||||||||||||
|
|
|
|
|
|
|
|
|
|
|
|
|
|||||||||||||
| Total interest income |
27,353 | (605 | ) | 27,958 | (246 | ) | (3,089 | ) | 2,843 | |||||||||||||||
|
|
|
|
|
|
|
|
|
|
|
|
|
|||||||||||||
| Interest expense: |
||||||||||||||||||||||||
| Money market accounts |
365 | 264 | 101 | (113 | ) | (153 | ) | 40 | ||||||||||||||||
| NOW accounts |
557 | 197 | 360 | 27 | (27 | ) | 54 | |||||||||||||||||
| Savings accounts |
856 | 422 | 434 | (3 | ) | (34 | ) | 31 | ||||||||||||||||
| Time deposits less than $100 |
1,093 | 12 | 1,081 | (345 | ) | (174 | ) | (171 | ) | |||||||||||||||
| Time deposits $100 or more |
(316 | ) | (336 | ) | 20 | (114 | ) | (184 | ) | 70 | ||||||||||||||
| Short-term borrowings |
37 | 17 | 20 | (4 | ) | (4 | ) | |||||||||||||||||
| Long-term debt |
(119 | ) | (47 | ) | (72 | ) | (641 | ) | (131 | ) | (510 | ) | ||||||||||||
|
|
|
|
|
|
|
|
|
|
|
|
|
|||||||||||||
| Total interest expense |
2,473 | 529 | 1,944 | (1,193 | ) | (703 | ) | (490 | ) | |||||||||||||||
|
|
|
|
|
|
|
|
|
|
|
|
|
|||||||||||||
| Net interest income |
$ | 24,880 | $ | (1,134 | ) | $ | 26,014 | $ | 947 | $ | (2,386 | ) | $ | 3,333 | ||||||||||
|
|
|
|
|
|
|
|
|
|
|
|
|
|||||||||||||
For the year ended December 31, tax-equivalent net interest income was $60.3 million in 2014 and $35.4 million in 2013. There was a positive volume variance offset partially by a negative rate variance. The growth in average earning assets exceeded that of interest-bearing liabilities, and resulted in additional tax-equivalent net interest income of $26.0 million. A reduction in our net interest margin resulted in a decrease in net interest income of $1.1 million.
Average earning assets increased $655.7 million to $1,562.6 million in 2014 from $906.9 million in 2013 and accounted for a $27,958 increase in interest income. Average loans, net increased $498.0 million, which caused interest income to increase $24,204. Average taxable investments increased $120.1 million comparing 2014 and 2013, which resulted in increased interest income of $1,993 while average tax-exempt investments increased $33.5 million which resulted in an increase to interest income of $1,789.
Average interest-bearing liabilities rose $495.2 million to $1,169.6 million in 2014 from $674.4 million in 2013. The growth resulted in a net increase in interest expense of $1,944. Large denomination time deposits averaged $1.6 million more in 2014 and caused interest expense to increase $20. An increase of $110.0 million in average time deposits less than $100 added $1,081 to interest expense. In addition, interest-bearing transaction accounts, including money market, NOW and savings accounts grew $381.0 million, which in aggregate caused a $895 increase in interest expense. Short-term borrowings averaged $4.7 million more and increased interest expense $20 while long-term debt averaged $2.2 million less and reduced interest expense by $72 comparing 2014 and 2013.
An unfavorable rate variance occurred as the decrease in the tax-equivalent yield on earning assets more than offset the reduction in the cost of funds. As a result, tax-equivalent net interest income decreased $1,134
-54-
Table of Contents
comparing 2014 and 2013. The tax-equivalent yield on earning assets decreased 8 basis points to 4.28 percent in 2014 from 4.36 percent in 2013, resulting in a reduction in interest income of $605. The tax-equivalent yield on the investment portfolio decreased 50 basis points to 2.67 percent in 2014 from 3.17 percent in 2013 and caused a reduction in interest income of $612. Similarly, the tax-equivalent yield on the loan portfolio decreased 1basis point to 4.87 percent in 2014 from 4.88 percent in 2013 and resulted in a reduction in interest income of $41. The decline in the yield on the investment portfolio was a reflection of lower reinvestment rates available in the market due to the prolonged low interest rate environment. The impact that lower reinvestment rates had on the tax-equivalent yield on the loan portfolio was mitigated by the recognition of loan fair value accretion resulting in an increase in the tax-equivalent net interest margin of 14 basis points in 2014.
The unfavorable rate variance caused by changes in the earning asset yields was impacted further by an increase of $529 in interest expense, which primarily resulted from an increase in the cost of interest-bearing transaction accounts, including money market, NOW and savings accounts. We experienced increases in the rates paid on all major categories of interest-bearing liabilities with the exception of time deposits $100 or more and long-term debt. Specifically, the cost of money market, NOW and savings accounts increased 13 basis points, 12 basis points and 16 basis points comparing 2014 and 2013. These increases resulted in an increase in interest expense of $883. With regard to time deposits, the average rate paid for time deposits less than $100 increased 1 basis point while time deposits $100 or more decreased 37 basis points, which together resulted in a $324 decrease in interest expense. The average rate paid on short-term borrowings increased 15 basis points for 2014 when compared to 2013, causing a $17 increase in interest expense. Interest expense was reduced $47 from a 13 basis point decline in the average rate paid on long-term debt.
The average balances of assets and liabilities, corresponding interest income and expense and resulting average yields or rates paid are summarized as follows. Averages for earning assets include nonaccrual loans. Investment averages include available-for-sale securities at amortized cost. Income on investment securities and loans is adjusted to a tax-equivalent basis using the prevailing federal statutory tax rate of 35.0 percent in 2014 and 34.0 percent in 2013 and 2012.
-55-
Table of Contents
Summary of net interest income
| 2014 | 2013 | |||||||||||||||||||||||
| Average Balance |
Interest Income/ Expense |
Average Interest Rate |
Average Balance |
Interest Income/ Expense |
Average Interest Rate |
|||||||||||||||||||
| Assets: |
||||||||||||||||||||||||
| Earning assets: |
||||||||||||||||||||||||
| Loans: |
||||||||||||||||||||||||
| Taxable |
$ | 1,119,277 | $ | 54,316 | 4.85 | % | $ | 637,153 | $ | 31,102 | 4.88 | % | ||||||||||||
| Tax-exempt |
68,155 | 3,485 | 5.11 | 52,259 | 2,536 | 4.85 | ||||||||||||||||||
| Investments: |
||||||||||||||||||||||||
| Taxable |
239,945 | 3,996 | 1.67 | 119,866 | 1,881 | 1.57 | ||||||||||||||||||
| Tax-exempt |
98,523 | 5,032 | 5.11 | 65,073 | 3,977 | 6.11 | ||||||||||||||||||
| Interest-bearing deposits |
7,047 | 38 | 0.54 | 31,659 | 86 | 0.27 | ||||||||||||||||||
| Federal funds sold |
29,666 | 70 | 0.24 | 902 | 2 | 0.22 | ||||||||||||||||||
|
|
|
|
|
|
|
|
|
|||||||||||||||||
| Total earning assets |
1,562,613 | 66,937 | 4.28 | % | 906,912 | 39,584 | 4.36 | % | ||||||||||||||||
| Less: allowance for loan losses |
9,397 | 7,311 | ||||||||||||||||||||||
| Other assets |
161,066 | 89,513 | ||||||||||||||||||||||
|
|
|
|
|
|||||||||||||||||||||
| Total assets |
$ | 1,714,282 | $ | 989,114 | ||||||||||||||||||||
|
|
|
|
|
|||||||||||||||||||||
| Liabilities and Stockholders’ Equity: |
||||||||||||||||||||||||
| Interest-bearing liabilities: |
||||||||||||||||||||||||
| Money market accounts |
$ | 211,441 | 796 | 0.38 | % | $ | 175,675 | 431 | 0.25 | % | ||||||||||||||
| NOW accounts |
233,289 | 821 | 0.35 | 116,242 | 264 | 0.23 | ||||||||||||||||||
| Savings accounts |
378,272 | 1,019 | 0.27 | 150,083 | 163 | 0.11 | ||||||||||||||||||
| Time deposits less than $100 |
207,866 | 2,042 | 0.98 | 97,826 | 949 | 0.97 | ||||||||||||||||||
| Time deposits $100 or more |
88,897 | 753 | 0.85 | 87,277 | 1,069 | 1.22 | ||||||||||||||||||
| Short-term borrowings |
14,871 | 71 | 0.48 | 10,158 | 34 | 0.33 | ||||||||||||||||||
| Long-term debt |
34,959 | 1,140 | 3.26 | 37,151 | 1,259 | 3.39 | ||||||||||||||||||
|
|
|
|
|
|
|
|
|
|||||||||||||||||
| Total interest-bearing liabilities |
1,169,595 | 6,642 | 0.57 | % | 674,412 | 4,169 | 0.62 | % | ||||||||||||||||
| Noninterest-bearing deposits |
291,685 | 158,790 | ||||||||||||||||||||||
| Other liabilities |
11,021 | 13,159 | ||||||||||||||||||||||
| Stockholders’ equity |
241,981 | 142,753 | ||||||||||||||||||||||
|
|
|
|
|
|||||||||||||||||||||
| Total liabilities and stockholders’ equity |
$ | 1,714,282 | $ | 989,114 | ||||||||||||||||||||
|
|
|
|
|
|
|
|
|
|||||||||||||||||
| Net interest income/spread |
$ | 60,295 | 3.71 | % | $ | 35,415 | 3.74 | % | ||||||||||||||||
|
|
|
|
|
|||||||||||||||||||||
| Net interest margin |
3.86 | % | 3.91 | % | ||||||||||||||||||||
| Tax-equivalent adjustments: |
||||||||||||||||||||||||
| Loans |
$ | 1,220 | $ | 862 | ||||||||||||||||||||
| Investments |
1,761 | 1,352 | ||||||||||||||||||||||
|
|
|
|
|
|||||||||||||||||||||
| Total adjustments |
$ | 2,981 | $ | 2,214 | ||||||||||||||||||||
|
|
|
|
|
|||||||||||||||||||||
Note: Average balances were calculated using average daily balances. Interest income on loans includes fees of $1,332 in 2014, $1,125 in 2013, $937 in 2012.
-56-
Table of Contents
| 2012 | ||||||||||||
| Average Balance |
Interest Income/ Expense |
Average Interest Rate |
||||||||||
| Assets: |
||||||||||||
| Earning assets: |
||||||||||||
| Loans: |
||||||||||||
| Taxable |
$ | 580,835 | $ | 30,852 | 5.31 | % | ||||||
| Tax-exempt |
54,975 | 2,554 | 4.65 | |||||||||
| Investments: |
||||||||||||
| Taxable |
124,695 | 2,345 | 1.88 | |||||||||
| Tax-exempt |
62,278 | 4,032 | 6.47 | |||||||||
| Interest-bearing deposits |
22,518 | 47 | 0.21 | |||||||||
| Federal funds sold |
||||||||||||
|
|
|
|
|
|||||||||
| Total earning assets |
845,301 | 39,830 | 4.71 | % | ||||||||
| Less: allowance for loan losses |
6,776 | |||||||||||
| Other assets |
86,289 | |||||||||||
|
|
|
|||||||||||
| Total assets |
$ | 924,814 | ||||||||||
|
|
|
|||||||||||
| Liabilities and Stockholders’ Equity: |
||||||||||||
| Interest-bearing liabilities: |
||||||||||||
| Money market accounts |
$ | 162,775 | 544 | 0.33 | % | |||||||
| NOW accounts |
93,151 | 237 | 0.25 | |||||||||
| Savings accounts |
124,692 | 166 | 0.13 | |||||||||
| Time deposits less than $100 |
114,050 | 1,294 | 1.13 | |||||||||
| Time deposits $100 or more |
82,196 | 1,183 | 1.44 | |||||||||
| Short-term borrowings |
11,484 | 38 | 0.33 | |||||||||
| Long-term debt |
51,964 | 1,900 | 3.66 | |||||||||
|
|
|
|
|
|||||||||
| Total interest-bearing liabilities |
640,312 | 5,362 | 0.84 | |||||||||
| Noninterest-bearing deposits |
140,001 | |||||||||||
| Other liabilities |
13,327 | |||||||||||
| Stockholders’ equity |
131,174 | |||||||||||
|
|
|
|||||||||||
| Total liabilities and stockholders’ equity |
$ | 924,814 | ||||||||||
|
|
|
|
|
|||||||||
| Net interest income/spread |
$ | 34,468 | 3.87 | % | ||||||||
|
|
|
|||||||||||
| Net interest margin |
4.08 | % | ||||||||||
| Tax-equivalent adjustments: |
||||||||||||
| Loans |
$ | 867 | ||||||||||
| Investments |
1,372 | |||||||||||
|
|
|
|||||||||||
| Total adjustments |
$ | 2,239 | ||||||||||
|
|
|
|||||||||||
Provision for Loan Losses:
We evaluate the adequacy of the allowance for loan losses account on a quarterly basis utilizing our systematic analysis in accordance with procedural discipline. We take into consideration certain factors such as composition of the loan portfolio, volumes of nonperforming loans, volumes of net charge-offs, prevailing economic conditions and other relevant factors when determining the adequacy of the allowance for loan losses account. We make monthly provisions to the allowance for loan losses account in order to maintain the allowance at an appropriate level. The provision for loan losses equaled $3,524 in 2014 and $2,361 in 2013. The primary cause for the increase in the provision was an increase in the volume of loans originated that were subject to the allowance for loan losses. In addition, the total loss factor applied to collectively evaluated loans increased from
-57-
Table of Contents
year-end 2013 due to an increase in both the historical loss factor along with increases in certain qualitative factors. The increase in the historical factor was a function of the increase in net charge-offs. Commercial and commercial real estate loans experienced increases in qualitative factors related to changes in the volume and concentrations of these loans. Increases in qualitative factors for residential mortgage and consumers loans were related to changes in the volume and severity of classified loans, including past due, nonaccrual, troubled debt restructures and other loan modifications; changes in the levels of, and trends in, charge-offs and recoveries; and changes in national, regional, local and industry economic conditions, including the effects of such changes on the value of underlying collateral for collateral-dependent loans. Based on our most recent evaluation at December 31, 2014, we believe that the allowance was adequate to absorb any known or potential losses in our portfolio.
Noninterest Income:
Our noninterest income increased $3.5 million or 29.7 percent to $15.3 million in 2014 from $11.8 million in 2013. In general, increases in year-to-date 2014 noninterest income primarily resulted from the application of purchase accounting guidance. Revenue received from service charges, fees and commissions increased $2.4 million or 58.5 percent comparing 2014 and 2013. Commissions and fees on fiduciary activities increased $444 or 25.6 percent while wealth management income increased $247 or 48.9 percent comparing 2014 and 2013. Mortgage banking income increased $285 or 78.5 percent in 2014 compared to 2013. Merchant services income decreased $387 or 9.8 percent to $3,549 in 2014 from $3,936 in 2013 as a result of a decrease in the volume of transactions processed and the number of merchant accounts serviced. Income from investment in life insurance decreased $190 or 19.6 percent to $778 in 2014 from $968 in 2013 due to the inclusion of mortality factors netted against income in the current period compared to a gross income figure in the prior period.
Subsequent to year-end 2014, we hired a seasoned professional with significant experience to manage our trust and wealth management divisions in order to increase the volume of assets under management and the amount of noninterest income. This individual has a comprehensive plan to accelerate growth in the near term through employing a network of representatives and affiliated companies.
Noninterest Expense:
In general, our noninterest expense is categorized into three main groups, including employee-related expense, occupancy and equipment expense and other expenses. Employee-related expenses are costs associated with providing salaries, including payroll taxes and benefits to our employees. Occupancy and equipment expenses, the costs related to the maintenance of facilities and equipment, include depreciation, general maintenance and repairs, real estate taxes, rental expense offset by any rental income and utility costs. Other expenses include general operating expenses such as marketing, other taxes, stationery and supplies, contractual services, insurance, including FDIC assessment and loan collection costs. Several of these costs and expenses are variable while the remainder is fixed. We utilize budgets and other related strategies in an effort to control the variable expenses.
-58-
Table of Contents
The major components of noninterest expense for the past three years are summarized as follows:
Noninterest expense
| Year Ended December 31 |
2014 | 2013 | 2012 | |||||||||
| Salaries and employee benefits expense: |
||||||||||||
| Salaries and payroll taxes |
$ | 16,358 | $ | 13,276 | $ | 11,980 | ||||||
| Employee benefits |
4,294 | 2,707 | 2,141 | |||||||||
|
|
|
|
|
|
|
|||||||
| Salaries and employee benefits expense |
20,652 | 15,983 | 14,121 | |||||||||
|
|
|
|
|
|
|
|||||||
| Occupancy and equipment expenses: |
||||||||||||
| Occupancy expense |
5,572 | 3,354 | 2,376 | |||||||||
| Equipment expense |
2,530 | 634 | 570 | |||||||||
|
|
|
|
|
|
|
|||||||
| Occupancy and equipment expenses |
8,102 | 3,988 | 2,946 | |||||||||
|
|
|
|
|
|
|
|||||||
| Other expenses: |
||||||||||||
| Merchant transaction expense |
2,236 | 2,490 | 2,742 | |||||||||
| FDIC insurance and assessments |
1,310 | 400 | 458 | |||||||||
| Professional fees and outside services |
2,345 | 2,104 | 2,077 | |||||||||
| Other taxes |
1,037 | 1,268 | 1,708 | |||||||||
| Stationery and supplies |
774 | 359 | 339 | |||||||||
| Advertising |
450 | 350 | 287 | |||||||||
| Amortization of intangible assets |
1,334 | 326 | 267 | |||||||||
| Acquisition related expenses |
1,725 | 4,609 | ||||||||||
| Other |
5,968 | 4,519 | 4,154 | |||||||||
|
|
|
|
|
|
|
|||||||
| Other expenses |
17,179 | 16,425 | 12,032 | |||||||||
|
|
|
|
|
|
|
|||||||
| Total noninterest expense |
$ | 45,933 | $ | 36,396 | $ | 29,099 | ||||||
|
|
|
|
|
|
|
|||||||
Noninterest expense was $45.9 million for the year ended December 31, 2014 compared to $36.4 million for the year ended December 31, 2013. The increase in year-to-date 2014 noninterest expense primarily resulting from the application of purchase accounting guidance was partially offset by the recognition of merger related cost savings as a result of achieving operational synergies in the second half of 2014.
Salaries and employee benefits expense constitute the majority of our noninterest expenses accounting for 45.0 percent of the total. Salaries and employee benefits expense increased $4.7 million or 29.2 percent to $20.7 million in 2014 from $16.0 million in 2013. Salaries and payroll taxes increased $3,082 or 23.2 percent, while employee benefits expense increased $1,587 or 58.6 percent. The reduction in 2013 salaries and benefits expense caused by applying purchase accounting, whereby 11 months of Peoples Neighborhood Bank was excluded from those expenses, was partially offset by increases in salaries and benefits from the recent expansion into the Lehigh Valley market and not being able to take advantage of associated costs saves until such time when the conversion was completed.
Occupancy and equipment expense increased $4.1 million or 103.2 percent to $8.1 million in 2014 from $4.0 million in 2013. Specifically, building-related costs increased $2.2 million while equipment-related costs increased $1.9 million. The increase in occupancy expense resulted from incurring additional maintenance and leasing expenses associated with our facilities. The timing of the conversion of the core system required us to maintain two systems for part of 2014 and caused an increase in the equipment expense. We anticipate the reduction in occupancy and equipment expenses in 2015 as a result of cost saves related to the merger will be partially offset by the introduction of mobile banking during the first half of 2015 and costs associated with the anticipate opening our 27th community banking office in Kingston, Pennsylvania by year end 2015.
-59-
Table of Contents
Other expenses, which consist of merchant transaction expense, FDIC insurance and assessments, professional fees and outside services, other taxes, stationary and supplies, advertising, amortization of intangible assets, acquisition related expenses and all other expenses were $17.2 million in 2014 and $16.4 million in 2013. Merchant transaction expenses decreased $254 or 10.2 percent to $2,236 in 2014 compared to $2,490 in 2013 due to a decrease in the volume of transactions processed and the number of merchant accounts serviced. This is consistent with the decrease in income generated from merchant services. Other expenses increased $1,450 or 32.1 percent to $5,969 in 2014 from $4,519 in 2013. All other expenses, including FDIC insurance and assessments, professional fees and outside services, other taxes, stationery and supplies, advertising and amortization of intangible assets totaled $7,249 in 2014, an increase of $2,442 or 50.8 percent, compared to $4,807 in 2013. We recognized $1,725 of acquisition related expenses in 2014 compared to $4,609 in 2013.
Income Taxes:
Our income tax expense was $5.5 million in 2014 and $485 in 2013. The increase resulted from higher net income, coupled with a lower amount of tax-exempt interest revenue as a percentage of total interest revenue in 2014. We utilize loans and investments of tax-exempt organizations to mitigate our tax burden, as interest revenue from these sources is not taxable by the federal government. Our effective tax rate increased to 23.6 percent in 2014, compared to 7.8 percent in 2013. The effective tax rate in 2013 is relatively low due to the fact that tax-exempt income represents a relatively high percentage of income before income taxes. The effect of tax-exempt income was partially offset by nondeductible merger related expenses in 2013.
In addition to income on tax-exempt loans and investments, we utilize investment tax credits available through our limited partnership investments in elderly and low- to moderate-income residential housing programs to mitigate our tax burden. By utilizing these credits, we reduced our income tax expense by $439 in 2014. We anticipate investment tax credits from these investments of $1.1 million in 2015. Over the next ten years, we will recognize aggregate tax credits from our investments in these projects of $10.0 million.
-60-
Table of Contents
Management’s Discussion and Analysis 2013 versus 2012
(Dollars in thousands, except per share data)
Operating Environment:
The United States economy continued to expand moderately in 2013, as the gross domestic product (“GDP”), the value of all goods and services produced in the U.S., increased at an annual rate of 2.2 percent, compared to 2.8 percent in 2012. As a result of the tepid economic growth in 2013, the Federal Open Market Committee (“FOMC”) maintained the federal funds target range of 0 to 25 basis points throughout the year and further signaled that they intend to keep short-term rates at extraordinarily low levels through at least late 2014. Despite experiencing an improvement in 2013, many areas of the economy such as employment conditions and the housing market remained weak compared to historical standards. Given these weaknesses, the FOMC decided that this extraordinary monetary policy stance was necessary to support the recovery. At their most recent meeting, the FOMC indicated that economic conditions will continue to warrant policy accommodation for an extended period.
Inflationary concerns continue to be relatively tame, as the consumer price index (“CPI”) at 1.3 percent for 2013 continued to be below the FOMC’s benchmark of 2.0 percent. The CPI was 1.5 percent in 2012. Moreover, the core personal consumption expenditure price index, which ignores food and energy, ranged from -0.50 percent to 2.4 percent and averaged 1.0 percent in 2013.
Employment conditions improved moderately in 2013. The civilian labor force decreased 548 thousand, while the number of people employed increased 1.4 million in 2013. As a result, the annual unemployment rate for the U.S. fell to 7.4 percent in 2013 from 8.1 percent in 2012. All sectors of employment, with the exception of the government sector, reported employment gains from the end of 2012.
National, Pennsylvania, New York and our market area’s non-seasonally-adjusted annual unemployment rates in 2013 and 2012, are summarized as follows:
| 2013 | 2012 | |||||||
| United States |
7.4 | % | 8.1 | % | ||||
| New York |
8.3 | 8.5 | ||||||
| Pennsylvania |
8.0 | 7.9 | ||||||
| Broome County |
8.0 | 8.8 | ||||||
| Lackawanna County |
7.9 | 9.0 | ||||||
| Luzerne County |
9.5 | 9.7 | ||||||
| Monroe County |
9.4 | 9.8 | ||||||
| Susquehanna County |
7.0 | 7.5 | ||||||
| Wayne County |
7.2 | 7.6 | ||||||
| Wyoming County |
9.4 | % | 9.6 | % | ||||
Employment conditions in 2013 were relatively unchanged at 8.0 percent for the Commonwealth of Pennsylvania. The unemployment rate for New York State dropped to 8.3 percent in 2013, from 8.5 percent in 2012. With respect to the markets we serve, the unemployment rate decreased in all of the eight counties in which we have branches or ATM locations. Lackawanna County experienced the most significant improvement declining from 9.0 percent in 2012 to 7.9 percent in 2013. The lowest unemployment rate in 2013, for all of counties we serve, was Susquehanna County at 7.0 percent. The marked improvements in unemployment rates could impact the rate of economic growth and may cause interest rates to rise in the near term.
With respect to the banking industry, net income for all Federal Deposit Insurance Corporation (“FDIC”)-insured banks in 2013 totaled $154.7 billion, an increase of $13.6 billion or 9.6 percent over 2012. This is the fourth consecutive year that earnings have risen. Approximately 54.2 percent of all institutions reported higher net income in 2013, while only 7.8 percent reported net losses. This is the lowest annual proportion of unprofitable
-61-
Table of Contents
institutions for the industry since 2005. Loan loss provisions of $32.1 billion in 2013 were $25.7 billion or 44.4 percent less than banks set aside in 2012. This is the fourth year in a row that loan loss provisions have been lower, and the total allocation for 2013 was the smallest amount since 2006. Net interest income declined for a third consecutive year, falling by $3.7 billion or 0.9 percent, as interest income fell more rapidly than interest expense. Noninterest income was $3.2 billion or 1.3 percent above the level of 2012, as trading revenue increased by $4.3 billion or 23.7 percent, and servicing fee income rose by $3.9 billion or 27.5 percent. Realized gains on securities were $5.2 billion or 53.7 percent lower than a year ago. Total noninterest expense declined $4.5 billion or 1.1 percent comparing 2013 and 2012. The average return on average assets for 2013 was 1.07 percent, the highest annual average for the industry since 2006.
The United States economy is expected to grow at a faster pace in 2014 as compared to the past few years. This rate of growth could change interest rates which may adversely impact bank earnings as net interest margins compress from the inability of management to further reduce fund costs. Continuous expense control, sound balance sheet management and lower loan loss provisions could offset some of the negative impact of the reduction in net interest margins.
Review of Financial Position:
Total assets, loans and deposits were $1.7 billion, $1.2 billion and $1.4 billion, respectively, at December 31, 2013. Although loans, net and deposits increased 6.7 percent and 2.7 percent, respectively, considering only historical Penseco information, the majority of the total 2013 increases over the 2012 year-end balances were the result of the merger. In accordance with the acquisition accounting for the merger, the historical assets and liabilities of Peoples have been recorded at their respective estimated fair values on the date of the merger. The estimated fair values are subject to change for up to one year after the date of the merger if information unknown relative to closing date fair values becomes available.
Total investment securities were $317.0 million at December 31, 2013, including $299.7 million of investment securities classified as available-for sale and $17.3 million classified as held-to-maturity. Total deposits consisted of $279.9 million in noninterest-bearing and $1.1 billion in interest-bearing deposits at December 31, 2013.
Stockholders’ equity equaled $238.8 million or $31.62 per share at December 31, 2013, and $132.5 million or $29.65 per share at December 31, 2012. Dividends declared for the 2013 amounted to $1.23 per share, as adjusted for the merger exchange ratio of 1.3636.
Nonperforming assets equaled $19.5 million or 1.65 percent of loans, net and foreclosed assets at December 31, 2013. The allowance for loan losses equaled $8.7 million or 0.74 percent of loans, net, at December 31, 2013, compared to $7.0 million or 1.11 percent at year-end 2012. The decrease in the ratio of the allowance for loan losses as a percentage of loans, net, is primarily a function of acquisition accounting, whereby the historical loan portfolio of Peoples was recorded at its estimated fair value, including a discount to reflect credit risk, and the Peoples historical allowance for loan losses was eliminated. Loans charged-off, net of recoveries, for the twelve months ended December 31, 2013, equaled $660.0 thousand or 0.10 percent of average loans, compared to $685.0 thousand or 0.11 percent of average loans in 2012.
Investment Portfolio:
Primarily, our investment portfolio provides a source of liquidity needed to meet expected loan demand and generates a reasonable return in order to increase our profitability. Additionally, we utilize the investment portfolio to meet pledging requirements and reduce income taxes. At December 31, 2013, our portfolio consisted primarily of short-term U.S. Government agency and mortgage-backed securities, which provide a source of liquidity and intermediate-term, tax-exempt state and municipal obligations, which mitigate our tax burden.
-62-
Table of Contents
Investment securities totaled $317.0 million at December 31, 2013 and $177.3 million at December 31, 2012. At December 31, 2013, the investment portfolio consisted of $299.7 million of investment securities classified as available-for-sale and $17.3 million classified as held-to-maturity. Excess deposited funds not used to fund loans were directed into the investment portfolio. Security purchases totaled $22.1 million in 2013, with the majority of the purchases consisted of U.S. Government agency and U.S. Government-sponsored enterprise mortgage-backed securities and tax-exempt state and municipal obligations. Investment purchases in 2012 amounted to $46.3 million.
Repayments of investment securities totaled $29.6 million in 2013 and $55.2 million in 2012. We received proceeds of $4.6 million from the sale of investment securities in 2013 and $5.8 million in 2012. Net gains recognized on the sale of investment securities available-for-sale totaled $163 in 2013 and $317 in 2012. We reported net unrealized holding gains, included as a separate component of stockholders’ equity of $1.8 million, net of income taxes of $1.0 million, at December 31, 2013, and $4.5 million, net of income taxes of $2.3 million, at December 31, 2012. There were no OTTI recognized for the years ended December 31, 2013 and 2012.
Investment securities averaged $185.0 million and equaled 20.4 percent of average earning assets in 2013, compared to $187.0 million and 22.1 percent in 2012. The tax-equivalent yield on the investment portfolio decreased 24 basis points to 3.17 percent in 2013 from 3.41 percent in 2012.
Loan Portfolio:
Loans, net totaled $1.2 billion at December 31, 2013 and $623.5 million at the end of 2012. Business loans, including commercial loans and commercial mortgages, were $763.7 million at December 31, 2013, and $309.2 million at year-end 2012. Residential mortgages and consumer loans were $322.1 million and $90.8 million at year end 2013 and $261.9 million and $52.4 million at year end 2012.
Loans averaged $689.4 million in 2013, compared to $635.8 million in 2012. Taxable loans averaged $637.2 million, while tax-exempt loans averaged $52.2 million at December 31, 2013. Due to the increase in loan demand, the loan portfolio played a more prominent role in our earning asset mix. As a percentage of earning assets, average loans equaled 76.0 percent in 2013 compared to 75.2 percent in 2012. The continuation of low interest rates caused the tax-equivalent yield on our loan portfolio to decrease 37 basis points to 4.88 percent in 2013 from 5.25 percent in 2012
Fixed rate loans represented 34.6 percent of the loan portfolio at December 31, 2013, compared to 41.0 percent at the end of 2012. Conversely, floating or adjustable rate loans as a percent of total loans amounted to 65.4 percent at year end 2013 and 59.0 percent at year end 2012.
Asset Quality:
Nonperforming assets increased to 1.65 percent of loans, net and foreclosed assets at December 31, 2013, from 0.60 percent at the end of 2012. All major categories of nonperforming assets increased, except for foreclosed assets, as a result of the business combination.
We maintain the allowance for loan losses at a level we believe adequate to absorb probable credit losses related to individually evaluated loans, as well as probable incurred losses inherent in the remainder of the loan portfolio as of the balance sheet date. The balance in the allowance for loan losses account is based on past events and current economic conditions. We employ the FFIEC Interagency Policy Statement, as amended, and GAAP in assessing the adequacy of the allowance account.
The allowance for loan losses increased $1.7 million to $8.7 million at December 31, 2013, from $7.0 million at the end of 2012. The increase resulted from a provision for loan losses of $2,361 exceeding net loans charged-off of $660. The allowance for loan losses, as a percentage of loans, net of unearned income, was 0.74 percent at the
-63-
Table of Contents
end of 2013, compared to 1.11 percent at the end of 2012. The reduction in this ratio was a result of following the accounting guidance for loans that we acquired in connection with the merger whereby there is no carryover of the related allowance for credit losses attributable to those loans.
Past due loans not satisfied through repossession, foreclosure or related actions are evaluated individually to determine if all or part of the outstanding balance should be charged against the allowance for loan losses account. Any subsequent recoveries are credited to the allowance account. Net loans charged-off decreased $25 to $660 in 2013 from $685 in 2012. Net charge-offs, as a percentage of average loans outstanding, equaled 0.10 percent in 2013 and 0.11 percent in 2012.
The allocated element of the allowance for loan losses account increased $1,701 to $8,651 at December 31, 2013, compared to $6,950 at December 31, 2012. Both the specific and formula portions of the allowance for loan losses increased from the end of 2012. The specific portion of the allowance for impairment of loans individually evaluated under FASB ASC 310, increased $798 to $2,024 at December 31, 2013, from $1,226 at year-end 2012. In addition, the formula portion of the allowance for loans collectively evaluated for impairment under FASB ASC 450, increased $903 to $6,627 at December 31, 2013, from $5,724 at December 31, 2012. The total loss factor for collectively evaluated loans increased from year-end 2012 due to an increase in the qualitative factors related to the continued unrest in the economic climate.
The coverage ratio, the allowance for loan losses account, as a percentage of nonperforming loans, is an industry ratio used to test the ability of the allowance account to absorb potential losses arising from nonperforming loans. The coverage ratio was 46.0 percent at December 31, 2013 and 185.6 percent at December 31, 2012.
Deposits:
Deposits totaled $1.4 billion at December 31, 2013 and $721.9 million at December 31, 2012. Noninterest-bearing deposits represented 20.2 percent of total deposits at December 31, 2013, compared to interest-bearing deposits at 79.8 percent. Comparatively, noninterest-bearing deposits and interest-bearing deposits represented 20.9 percent and 79.1 percent of total deposits at year end 2012.
Total deposits averaged $785.9 million in 2013, an increase of $69.0 million or 9.6 percent, compared to $716.9 million in 2012. Average noninterest-bearing deposits increased $18.8 million or 13.4 percent, while average interest-bearing accounts grew $50.2 million or 8.7 percent. Average interest-bearing transaction deposits, including money market, NOW and savings accounts, increased $61.4 million while average total time deposits decreased $11.2 million comparing 2013 and 2012.
Our cost of deposits decreased 13 basis points from 0.59 percent in 2012 to 0.46 percent in 2013. Deposit costs declined 6 basis points in the first quarter of 2013 but remained relatively constant throughout the rest of the year ending the final quarter of 2013 at 0.48 percent.
Volatile deposits, time deposits $100 or more, were $98.4 million at December 31, 2013, compared to $81.9 million at the end of 2012. Large denomination time deposits averaged $87.3 million in 2013, an increase of $5.1 million or 6.2 percent from $82.2 million in 2012. Our average cost of these funds decreased 22 basis points to 1.22 percent in 2013, from 1.44 percent in 2012.
Market Risk Sensitivity:
With respect to evaluating our exposure to IRR on earnings, we utilize a gap analysis model that considers repricing frequencies of RSA and RSL. Gap analysis attempts to measure our interest rate exposure by calculating the net amount of RSA and RSL that reprice within specific time intervals. A positive gap occurs when the amount of RSA repricing in a specific period is greater than the amount of RSL repricing within that same time frame and is indicated by a RSA/RSL ratio greater than 1.0. A negative gap occurs when the amount
-64-
Table of Contents
of RSL repricing is greater than the amount of RSA and is indicated by a RSA/RSL ratio less than 1.0. A positive gap implies that earnings will be impacted favorably if interest rates rise and adversely if interest rates fall during the period. A negative gap tends to indicate that earnings will be affected inversely to interest rate changes.
At December 31, 2013, we were in a positive gap position with a cumulative one-year RSA/RSL ratio of 1.34. Similarly, at December 31, 2012, our cumulative one-year RSA/RSL ratio was 1.26. Given the economic conditions, which included an exceptionally low short-term interest rate environment, the focus of ALCO during 2013 was to maintain the positive gap position in order to safeguard future earning from the potential risk of rising interest rates. Specifically throughout 2013, we attempted to increase the volume of loans with short repricing terms in order to maintain over IRR position. In addition, we continued offering preferential rates on longer-term certificates of deposit, including 72- and 84-month maturities. The positive impact on our gap position from implementing these strategic initiatives was partially negated as customer interest in transaction type accounts became more popular as a means of storing funds obtained from natural gas drilling activities.
Liquidity:
We employ a number of analytical techniques in assessing the adequacy of our liquidity position. One such technique is the use of ratio analysis to illustrate our reliance on noncore funds to fund our investments and loans maturing after 2013. At December 31, 2013, our noncore funds consisted of time deposits in denominations of $100 or more, repurchase agreements, short-term borrowings and long-term debt. Large denomination time deposits are particularly not considered to be a strong source of liquidity since they are very interest rate sensitive and are considered to be highly volatile. At December 31, 2013, our net noncore funding dependence ratio, the difference between noncore funds and short-term investments to long-term assets, was 10.0 percent. Our net short-term noncore funding dependence ratio, noncore funds maturing within one year, less short-term investments to long-term assets equaled 4.1 percent. Comparatively, our ratios equaled 6.5 percent and 5.0 percent at the end of 2012, which indicated an increase in our reliance on noncore funds.
The Consolidated Statements of Cash Flows present the change in cash and cash equivalents from operating, investing and financing activities. Cash and cash equivalents consist of cash on hand, cash items in the process of collection, noninterest-bearing and interest-bearing deposits with other banks and federal funds sold. Cash and cash equivalents increased $3.5 million for the year ended December 31, 2013. Conversely, for the year ended December 31, 2012, cash and cash equivalents increased $13.4 million. During 2013, cash provided by operating and financing activities more than offset cash used in investing activities.
Operating activities provided net cash of $9.8 million in 2013 and $12.6 million in 2012. Net income, adjusted for the effects of noncash expenses such as depreciation and the provision for loan losses is the primary source of funds from operations.
Net cash provided by financing activities equaled $8.6 million in 2013. Net cash used in financing activities was $18.9 million in 2012. Deposit gathering, which is our predominant financing activity, increased in both 2013 and 2012. Deposit gathering provided a net cash inflow in 2013 of $28.9 million and $1.4 million in 2012. Partially offsetting the cash provided by deposit gathering in 2013 was a $3.7 million net decrease in short-term borrowings, an $11.1 million repayment of long-term debt and cash dividends paid of $5.5 million.
Our primary investing activities involve transactions related to our investment and loan portfolios. Net cash used in investing activities totaled $14.9 million in 2013. Net cash provided by investing activities was $19.7 million in 2012. Net cash used in lending activities was $50.7 million in 2013. Loan repayments outpaced loan origination in 2012 resulting in net cash provided of $7.3 million. Activities related to our investment portfolio provided net cash of $12.1 million in 2013 and $14.8 million in 2012.
-65-
Table of Contents
Capital Adequacy:
Our and Peoples Bank’s risk-based capital ratios are strong and have consistently exceeded the minimum regulatory capital ratios of 4.0 percent and 8.0 percent required for adequately capitalized institutions. Our ratio of Tier 1 capital to risk-weighted assets and off-balance sheet items was 13.6 percent at December 31, 2013, and 16.8 percent at December 31, 2012. Our Total capital ratio was 14.3 percent at December 31, 2013 and 18.0 percent at December 31, 2012. Similarly, our Leverage ratio, which equaled 10.1 percent at December 31, 2013, and 11.5 percent at December 31, 2012, exceeded the minimum of 4.0 percent for capital adequacy purposes. Peoples Bank reported Tier 1 capital, Total capital and Leverage ratios of 13.1 percent, 13.8 percent and 9.8 percent at December 31, 2013, and 16.2 percent, 17.4 percent and 11.1 percent at December 31, 2012.
Stockholders’ equity was $238.8 million or $31.62 per share at December 31, 2013, and $132.5 million or $29.65 per share at December 31, 2012. Stockholders’ equity was primarily impacted by recording the fair value of consideration exchanged of $106.5 million as a result of the merger. In addition, net income of $5.7 million was offset by net cash dividends declared of $5.5 million. We declared dividends of $1.23 per share in 2013 and 2012. The dividend payout ratio, dividends declared as a percent of net income, equaled 96.3 percent in 2013 and 52.0 percent in 2012.
Review of Financial Performance:
Net income was $5,721 or $1.21 per share in 2013 and $10,589 or $2.37 per share in 2012. Return on average assets (“ROAA”) and return on average equity (“ROAE”) were 0.58 percent and 4.01 percent for the year ended December 31, 2013. ROAA was 1.14 percent and ROAE was 8.07 percent for the year ended December 31, 2012.
Tax-equivalent net interest income was $35,415 in 2013 and $34,468 in 2012. Our net interest margin equaled 3.91 percent in 2013 and 4.08 percent in 2012. Noninterest income totaled $11,762 in 2013 and $11,441 in 2012. Noninterest expense was $36,396 for the year ended December 31, 2013 compared to $29,099 for the year ended December 31 2012.
Net Interest Income:
For the year ended December 31, tax-equivalent net interest income was $35,415 in 2013 and $34,468 in 2012. There was a positive volume variance offset partially by a negative rate variance. Changes in the volumes of earning assets and interest-bearing liabilities contributed to an increase of $947 in net interest income. Average earning assets increased $61.6 million to $906.9 million in 2013 from $845.3 million in 2012 and accounted for a $2,843 increase in interest income. Average loans, net increased $53.6 million or 8.4 percent, which caused interest income to increase $2,730. Average taxable investments decreased $4.8 million or 3.8 percent comparing 2013 and 2012, which resulted in decreased interest income of $88 while average tax-exempt investments increased $2.8 million or 4.5 percent which resulted in an increase to interest income of $177.
Average interest-bearing liabilities rose $34.1 million or 5.3 percent to $674.4 million in 2013 from $640.3 million in 2012. The growth resulted in a net increase in interest expense of $490. Large denomination time deposits averaged $5.1 million more in 2013 and caused interest expense to increase $70. A decrease of $16.2 million in average time deposits less than $100 deducted $171 from interest expense. In addition, interest-bearing transaction accounts, including money market, NOW and savings accounts grew $61.4 million, which in aggregate caused a $125 increase in interest expense. Short-term borrowings averaged $1.3 million less and reduced interest expense $4 while long-term debt averaged $14.9 million less and reduced interest expense by $510 comparing 2013 and 2012.
An unfavorable rate variance occurred as the decrease in the tax-equivalent yield on earning assets was more than the reduction in the cost of funds. As a result, tax-equivalent net interest income decreased $2,386. The tax-equivalent
-66-
Table of Contents
yield on earning assets decreased 35 basis points to 4.36 percent in 2013 from 4.71 percent in 2012, resulting in a reduction in interest income of $3,089. Specifically, the yield on the taxable loan portfolio decreased 43 basis points to 4.88 percent in 2013 from 5.31 percent in 2012. The decline in the yield on the taxable loan portfolio was a reflection of the condition of general market rates. Taxable loan yield reductions caused interest income to decrease $2,609, representing 84.5 percent of the entire reduction in interest income due to changes in rates.
The reduction in interest income was mitigated by a decrease of $703 in interest expense, which resulted from a 22 basis point decrease in the cost of funds to 0.62 percent in 2013 from 0.84 percent in 2012. We experienced reductions in the rates paid on all major categories of interest-bearing liabilities with the exception of short-term borrowings. Specifically, the cost of money market, NOW and savings accounts decreased 8 basis points, 2 basis points and 2 basis points comparing 2013 and 2012. These decreases resulted in a reduction in interest expense of $214. With regard to time deposits, the average rate paid for time deposits less than $100 decreased 16 basis points while time deposits $100 or more decreased 22 basis points, which together resulted in a $358 decrease in interest expense. The average rate paid on short-term borrowings was 33 basis points for 2013 and 2012. Interest expense was reduced $131 from a 27 basis point decline in the average rate paid on long-term debt.
Provision for Loan Losses:
We evaluate the adequacy of the allowance for loan losses account on a quarterly basis utilizing our systematic analysis in accordance with procedural discipline. We take into consideration certain factors such as composition of the loan portfolio, volumes of nonperforming loans, volumes of net charge-offs, prevailing economic conditions and other relevant factors when determining the adequacy of the allowance for loan losses account. We make monthly provisions to the allowance for loan losses account in order to maintain the allowance at an appropriate level. The provision for loan losses equaled $2,361 in 2013 and $924 in 2012.
Noninterest Income:
Our noninterest income increased $321 or 2.8 percent to $11,762 in 2013 from $11,441 in 2012. Revenue received from Service charges, fees and commissions increased $412 or 11.2 percent comparing 2013 and 2012. Commissions and fees on fiduciary activities increased $254 or 17.2 percent while wealth management income increased $241 or 91.3 percent comparing 2013 and 2012 as investing activity increased. Income from investment in life insurance increased $464 or 92.1 percent to $968 in 2013 from $504 in 2012. Merchant services income decreased $354 or 8.3 percent to $3,936 in 2013 from $4,290 in 2012 from a decrease in the volume of transactions processed. Mortgage banking income decreased $542 or 59.9 percent in 2013 compared to 2012 as mortgage rates increased and fewer customers refinanced through secondary markets.
Noninterest Expense:
Salaries and employee benefits expense was the largest component of other expenses at $15,983. Salaries and payroll taxes was the largest component of other expenses at $13,276 or 36.5 percent of total noninterest expenses in 2013 with employee benefits adding $2,707 or 7.4 percent.
Salaries and employee benefits expense increased $1,862 or 13.2 percent to $15,983 in 2013 from $14,121 in 2012. Salaries and payroll taxes increased $1,296 or 10.8 percent, while employee benefits expense increased $566 or 26.4 percent. The increase in the salaries and payroll taxes component was directly related to costs associated with the merger and annual merit increases. The increase in employee benefits expense resulted primarily from an increases in health care costs.
Occupancy and equipment expense increased $1,042 or 35.4 percent to $3,988 in 2013 from $2,946 in 2012. Specifically, building-related costs increased $978 while equipment-related costs increased only $64. The increase in occupancy expense resulted from incurring additional maintenance and leasing expenses associated with our facilities.
-67-
Table of Contents
Other expenses increased $365 or 8.8 percent to $4,519 in 2013 from $4,154 in 2012. We recognized $4,609 of acquisition related expenses in 2013. Merchant transaction expenses decreased $252 or 9.2 percent to $2,490 in 2013 compared to $2,742 in 2012 due to a decrease in the volume of transactions processed. This is consistent with the decrease to income generated from merchant services.
Income Taxes:
Our income tax expense was $485 or 7.8 percent of income before income taxes in 2013 and $3,058 or 22.4 percent in 2012. The effective tax rate in 2013 is relatively low due to the fact that tax-exempt income represents a relatively high percentage of income before income taxes. The effect of tax-exempt income was partially offset by nondeductible merger related expenses.
-68-
Table of Contents
| Item 7A. | Quantitative and Qualitative Disclosures About Market Risk. |
Market risk is the risk to our earnings and/or financial position resulting from adverse changes in market rates or prices, such as interest rates, foreign exchange rates or equity prices. Our exposure to market risk is primarily interest rate risk (“IRR”), which arises from our lending, investing and deposit gathering activities. Our market risk sensitive instruments consist of non-derivative financial instruments, none of which are entered into for trading purposes. During the normal course of business, we are not exposed to foreign exchange risk or commodity price risk. Our exposure to IRR can be explained as the potential for change in reported earnings and/or the market value of net worth. Variations in interest rates affect the underlying economic value of assets, liabilities and off-balance sheet items. These changes arise because the present value of future cash flows, and often the cash flows themselves, change with interest rates. The effects of the changes in these present values reflect the change in our underlying economic value, and provide a basis for the expected change in future earnings related to interest rates. Interest rate changes affect earnings by changing net interest income and the level of other interest-sensitive income and operating expenses. IRR is inherent in the role of banks as financial intermediaries.
A bank with a high degree of IRR may experience lower earnings, impaired liquidity and capital positions, and most likely, a greater risk of insolvency. Therefore, banks must carefully evaluate IRR to promote safety and soundness in their activities.
The overnight borrowing rate has been subject to a range of 0% to 0.25% since the Federal Open Market Committee (“FOMC”) adopted their accommodative monetary policy. The FOMC has acted to drive longer term rates to historic lows and operate as a backstop to the financial industry through direct infusions of capital by implementing their quantitative easing policies.
The projected impact of instantaneous changes in interest rates on our net interest income and economic value of equity at December 31, 2014, based on our simulation model, is summarized as follows:
| December 31, 2014 % Change in |
||||||||||||||||
| Changes in Interest Rates (basis points) | Net Interest Income | Economic Value of Equity | ||||||||||||||
| Metric | Policy | Metric | Policy | |||||||||||||
| +400 |
5.8 | (20.0 | ) | 5.0 | (45.0 | ) | ||||||||||
| +300 |
5.0 | (20.0 | ) | 5.3 | (35.0 | ) | ||||||||||
| +200 |
3.6 | (10.0 | ) | 4.4 | (25.0 | ) | ||||||||||
| +100 |
1.9 | (10.0 | ) | 3.1 | (15.0 | ) | ||||||||||
| Static |
||||||||||||||||
| -100 |
(2.4 | ) | (10.0 | ) | (11.6 | ) | (15.0 | ) | ||||||||
Our simulation model creates pro forma net interest income scenarios under various interest rate shocks. Given instantaneous and parallel shifts in general market rates of plus 100 basis points, our projected net interest income for the 12 months ending December 31, 2014, would increase slightly at 1.9 percent from model results using current interest rates. Additional disclosures about market risk are included in Part II, Item 7 of this Annual Report, under the heading “Market Risk Sensitivity,” and are incorporated into this Item 7A by reference.
-69-
Table of Contents
| Item 8. | Financial Statements. |
REPORT OF INDEPENDENT REGISTERED PUBLIC ACCOUNTING FIRM
Board of Directors and Stockholders
Peoples Financial Services Corp.
Scranton, Pennsylvania
We have audited the accompanying consolidated balance sheets of Peoples Financial Services Corp. and subsidiaries (the “Corporation”) as of December 31, 2014 and 2013 and the related consolidated statements of income and comprehensive income, changes in stockholders’ equity and cash flows for the years then ended. These financial statements are the responsibility of the Corporation’s management. Our responsibility is to express an opinion on these financial statements based on our audits.
We conducted our audits in accordance with the standards of the Public Company Accounting Oversight Board (United States). Those standards require that we plan and perform the audit to obtain reasonable assurance about whether the financial statements are free of material misstatement. An audit includes examining, on a test basis, evidence supporting the amounts and disclosures in the financial statements, assessing the accounting principles used and significant estimates made by management, as well as evaluating the overall financial statement presentation. We believe that our audits provide a reasonable basis for our opinion.
In our opinion, the consolidated financial statements referred to above present fairly, in all material respects, the financial position of Peoples Financial Services Corp. and subsidiaries at December 31, 2014 and 2013, and the results of their operations and their cash flows for the years then ended, in conformity with accounting principles generally accepted in the United States of America.
We also have audited, in accordance with the standards of the Public Company Accounting Oversight Board (United States), Peoples Financial Services Corp. and subsidiaries’ internal control over financial reporting as of December 31, 2014, based on criteria established in Internal Control – Integrated Framework (2013) issued by the Committee of Sponsoring Organizations of the Treadway Commission (COSO) and our report dated March 16, 2015 expressed an unqualified opinion thereon.
/s/ BDO USA, LLP
Harrisburg, Pennsylvania
March 16, 2015
-70-
Table of Contents
REPORT OF INDEPENDENT REGISTERED PUBLIC ACCOUNTING FIRM
To the Board of Directors and Stockholders
Penseco Financial Services Corporation
We have audited the accompanying consolidated statements of income, comprehensive income, stockholders’ equity, and cash flows of Penseco Financial Services Corporation and subsidiary (“Penseco” as defined in Note 1) for the year ended December 31, 2012. These financial statements are the responsibility of the Company’s management. Our responsibility is to express an opinion on these financial statements based on our audit.
We conducted our audit in accordance with the standards of the Public Company Accounting Oversight Board (United States). Those standards require that we plan and perform the audit to obtain reasonable assurance about whether the financial statements are free of material misstatement. An audit includes examining, on a test basis, evidence supporting the amounts and disclosures in the financial statements. An audit also includes assessing the accounting principles used and significant estimates made by management, as well as evaluating the overall financial statement presentation. We believe that our audit provides a reasonable basis for our opinion.
In our opinion, the consolidated financial statements referred to above present fairly, in all material respects, the financial position of Penseco Financial Services Corporation and subsidiary, the results of their operations and their cash flows for the year ended December 31, 2012, in conformity with U.S. generally accepted accounting principles.
/s/ McGrail Merkel Quinn & Associate, P.C.
Scranton, Pennsylvania
March 14, 2013
-71-
Table of Contents
Peoples Financial Services Corp.
CONSOLIDATED BALANCE SHEETS
(Dollars in thousands, except share data)
| December 31 |
2014 | 2013 | ||||||
| Assets: |
||||||||
| Cash and due from banks |
$ | 24,656 | $ | 30,004 | ||||
| Interest-bearing deposits in other banks |
6,770 | 11,846 | ||||||
| Federal funds sold |
9,460 | |||||||
| Investment securities: |
||||||||
| Available-for-sale |
339,586 | 299,715 | ||||||
| Held-to-maturity: Fair value 2014, $15,215; 2013, $17,175 |
14,665 | 17,295 | ||||||
|
|
|
|
|
|||||
| Total investment securities |
354,251 | 317,010 | ||||||
| Loans held for sale |
3,486 | 1,757 | ||||||
| Loans, net |
1,209,894 | 1,176,617 | ||||||
| Less: allowance for loan losses |
10,338 | 8,651 | ||||||
|
|
|
|
|
|||||
| Net loans |
1,199,556 | 1,167,966 | ||||||
| Premises and equipment, net |
25,433 | 26,119 | ||||||
| Accrued interest receivable |
5,580 | 5,866 | ||||||
| Goodwill |
63,370 | 63,370 | ||||||
| Intangible assets |
5,501 | 6,835 | ||||||
| Other assets |
53,066 | 47,988 | ||||||
|
|
|
|
|
|||||
| Total assets |
$ | 1,741,669 | $ | 1,688,221 | ||||
|
|
|
|
|
|||||
| Liabilities: |
||||||||
| Deposits: |
||||||||
| Noninterest-bearing |
$ | 313,498 | $ | 279,942 | ||||
| Interest-bearing |
1,112,060 | 1,099,565 | ||||||
|
|
|
|
|
|||||
| Total deposits |
1,425,558 | 1,379,507 | ||||||
| Short-term borrowings |
19,557 | 22,052 | ||||||
| Long-term debt |
33,140 | 36,743 | ||||||
| Accrued interest payable |
574 | 723 | ||||||
| Other liabilities |
16,061 | 10,404 | ||||||
|
|
|
|
|
|||||
| Total liabilities |
1,494,890 | 1,449,429 | ||||||
|
|
|
|
|
|||||
| Stockholders’ equity: |
||||||||
| Common stock, par value $2.00, authorized 25,000,000 shares, issued: 2014, 7,548,358 shares; 2013, 7,806,789 shares |
15,097 | 15,614 | ||||||
| Capital surplus |
140,214 | 146,109 | ||||||
| Retained earnings |
92,297 | 84,008 | ||||||
| Accumulated other comprehensive loss |
(829 | ) | (698 | ) | ||||
| Less: treasury stock, at cost: 2013, 253,845 shares |
6,241 | |||||||
|
|
|
|
|
|||||
| Total stockholders’ equity |
246,779 | 238,792 | ||||||
|
|
|
|
|
|||||
| Total liabilities and stockholders’ equity |
$ | 1,741,669 | $ | 1,688,221 | ||||
|
|
|
|
|
|||||
-72-
Table of Contents
Peoples Financial Services Corp.
CONSOLIDATED STATEMENTS OF INCOME AND COMPREHENSIVE INCOME
(Dollars in thousands, except per share data)
| Year Ended December 31 |
2014 | 2013 | 2012 | |||||||||
| Interest income: |
||||||||||||
| Interest and fees on loans: |
||||||||||||
| Taxable |
$ | 54,316 | $ | 31,102 | $ | 30,852 | ||||||
| Tax-exempt |
2,265 | 1,674 | 1,687 | |||||||||
| Interest and dividends on investment securities: |
||||||||||||
| Taxable |
3,946 | 1,793 | 2,282 | |||||||||
| Tax-exempt |
3,271 | 2,625 | 2,660 | |||||||||
| Dividends |
50 | 88 | 63 | |||||||||
| Interest on interest-bearing deposits in other banks |
38 | 86 | 47 | |||||||||
| Interest on federal funds sold |
70 | 2 | ||||||||||
|
|
|
|
|
|
|
|||||||
| Total interest income |
63,956 | 37,370 | 37,591 | |||||||||
|
|
|
|
|
|
|
|||||||
| Interest expense: |
||||||||||||
| Interest on deposits |
5,431 | 2,876 | 3,424 | |||||||||
| Interest on short-term borrowings |
71 | 34 | 38 | |||||||||
| Interest on long-term debt |
1,140 | 1,259 | 1,900 | |||||||||
|
|
|
|
|
|
|
|||||||
| Total interest expense |
6,642 | 4,169 | 5,362 | |||||||||
|
|
|
|
|
|
|
|||||||
| Net interest income |
57,314 | 33,201 | 32,229 | |||||||||
| Provision for loan losses |
3,524 | 2,361 | 924 | |||||||||
|
|
|
|
|
|
|
|||||||
| Net interest income after provision for loan losses |
53,790 | 30,840 | 31,305 | |||||||||
|
|
|
|
|
|
|
|||||||
| Noninterest income: |
||||||||||||
| Service charges, fees and commissions |
6,484 | 4,092 | 3,680 | |||||||||
| Merchant services income |
3,549 | 3,936 | 4,290 | |||||||||
| Commission and fees on fiduciary activities |
2,179 | 1,735 | 1,481 | |||||||||
| Wealth management income |
752 | 505 | 264 | |||||||||
| Mortgage banking income |
648 | 363 | 905 | |||||||||
| Life insurance investment income |
778 | 968 | 504 | |||||||||
| Net gain on sale of investment securities available-for-sale |
861 | 163 | 317 | |||||||||
|
|
|
|
|
|
|
|||||||
| Total noninterest income |
15,251 | 11,762 | 11,441 | |||||||||
|
|
|
|
|
|
|
|||||||
| Noninterest expense: |
||||||||||||
| Salaries and employee benefits expense |
20,652 | 15,983 | 14,121 | |||||||||
| Net occupancy and equipment expense |
8,102 | 3,988 | 2,946 | |||||||||
| Merchant services expense |
2,236 | 2,490 | 2,742 | |||||||||
| Amortization of intangible assets |
1,334 | 326 | 267 | |||||||||
| Acquisition related expense |
1,725 | 4,609 | ||||||||||
| Other expenses |
11,884 | 9,000 | 9,023 | |||||||||
|
|
|
|
|
|
|
|||||||
| Total noninterest expense |
45,933 | 36,396 | 29,099 | |||||||||
|
|
|
|
|
|
|
|||||||
| Income before income taxes |
23,108 | 6,206 | 13,647 | |||||||||
| Income tax expense |
5,459 | 485 | 3,058 | |||||||||
|
|
|
|
|
|
|
|||||||
| Net income |
17,649 | 5,721 | 10,589 | |||||||||
|
|
|
|
|
|
|
|||||||
| Other comprehensive income (loss): |
||||||||||||
| Unrealized gain (loss) on investment securities available-for-sale |
4,343 | (3,882 | ) | 1,223 | ||||||||
| Reclassification adjustment for net gain on sales included in net income |
(861 | ) | (163 | ) | (317 | ) | ||||||
| Change in benefit plan liabilities |
(3,684 | ) | 3,642 | (924 | ) | |||||||
|
|
|
|
|
|
|
|||||||
| Other comprehensive loss |
(202 | ) | (403 | ) | (18 | ) | ||||||
| Income tax expense (benefit) related to other comprehensive loss |
(71 | ) | 5 | (6 | ) | |||||||
|
|
|
|
|
|
|
|||||||
| Other comprehensive loss, net of income taxes |
(131 | ) | (408 | ) | (12 | ) | ||||||
|
|
|
|
|
|
|
|||||||
| Comprehensive income |
$ | 17,518 | $ | 5,313 | $ | 10,577 | ||||||
|
|
|
|
|
|
|
|||||||
| Per share data: |
||||||||||||
| Net income: |
||||||||||||
| Basic |
$ | 2.34 | $ | 1.21 | $ | 2.37 | ||||||
| Diluted |
$ | 2.34 | $ | 1.21 | $ | 2.37 | ||||||
| Average common shares outstanding: |
||||||||||||
| Basic |
7,548,825 | 4,733,059 | 4,467,261 | |||||||||
| Diluted |
7,561,982 | 4,733,059 | 4,467,714 | |||||||||
| Dividends declared |
$ | 1.24 | $ | 1.23 | $ | 1.23 | ||||||
See notes to consolidated financial statements
-73-
Table of Contents
Peoples Financial Services Corp.
CONSOLIDATED STATEMENTS OF CHANGES IN STOCKHOLDERS’ EQUITY
(Dollars in thousands, except per share data)
| For the Three Years Ended December 31, 2014 |
Common Stock |
Capital Surplus |
Retained Earnings |
Accumulated Other Comprehensive Loss |
Treasury Stock |
Total | ||||||||||||||||||
| Balance, January 1, 2012 |
$ | 8,935 | $ | 39,963 | $ | 78,713 | $ | (278 | ) | $ | $ | 127,333 | ||||||||||||
| Net income |
10,589 | 10,589 | ||||||||||||||||||||||
| Other comprehensive loss, net of income taxes |
(12 | ) | (12 | ) | ||||||||||||||||||||
| Dividends declared: $1.23 per share |
(5,504 | ) | (5,504 | ) | ||||||||||||||||||||
| Stock based compensation |
40 | 40 | ||||||||||||||||||||||
|
|
|
|
|
|
|
|
|
|
|
|
|
|||||||||||||
| Balance, December 31, 2012 |
8,935 | 40,003 | 83,798 | (290 | ) | 132,446 | ||||||||||||||||||
| Net income |
5,721 | 5,721 | ||||||||||||||||||||||
| Other comprehensive loss, net of income taxes |
(408 | ) | (408 | ) | ||||||||||||||||||||
| Dividends declared: $1.23 per share |
(5,511 | ) | (5,511 | ) | ||||||||||||||||||||
| Stock based compensation |
25 | 25 | ||||||||||||||||||||||
| Retirement of treasury stock |
(28 | ) | (384 | ) | 412 | |||||||||||||||||||
| Fair value of consideration exchanged |
6,707 | 106,465 | (6,653 | ) | 106,519 | |||||||||||||||||||
|
|
|
|
|
|
|
|
|
|
|
|
|
|||||||||||||
| Balance, December 31, 2013 |
15,614 | 146,109 | 84,008 | (698 | ) | (6,241 | ) | 238,792 | ||||||||||||||||
| Net income |
17,649 | 17,649 | ||||||||||||||||||||||
| Other comprehensive loss, net of income taxes |
(131 | ) | (131 | ) | ||||||||||||||||||||
| Dividends declared: $1.24 per share |
(9,360 | ) | (9,360 | ) | ||||||||||||||||||||
| Stock based compensation |
70 | 70 | ||||||||||||||||||||||
| Share retirement: 3,386 shares |
(7 | ) | (102 | ) | (109 | ) | ||||||||||||||||||
| Reissuance under option plan: 600 shares |
10 | 11 | 21 | |||||||||||||||||||||
| Repurchase and retirement: 1,800 shares |
(70 | ) | (70 | ) | ||||||||||||||||||||
| Settlement of stock options |
(83 | ) | (83 | ) | ||||||||||||||||||||
| Retirement of treasury stock |
(510 | ) | (5,790 | ) | 6,300 | |||||||||||||||||||
|
|
|
|
|
|
|
|
|
|
|
|
|
|||||||||||||
| Balance, December 31, 2014 |
$ | 15,097 | $ | 140,214 | $ | 92,297 | $ | (829 | ) | $ | $ | 246,779 | ||||||||||||
|
|
|
|
|
|
|
|
|
|
|
|
|
|||||||||||||
See notes to consolidated financial statements
-74-
Table of Contents
Peoples Financial Services Corp.
CONSOLIDATED STATEMENTS OF CASH FLOWS
(Dollars in thousands, except per share data)
| Year Ended December 31, |
2014 | 2013 | 2012 | |||||||||
| Cash flows from operating activities: |
||||||||||||
| Net income |
$ | 17,649 | $ | 5,721 | $ | 10,589 | ||||||
| Adjustments to reconcile net income to net cash provided by operating activities: |
||||||||||||
| Depreciation of premises and equipment |
1,671 | 924 | 855 | |||||||||
| Amortization of deferred loan costs |
289 | |||||||||||
| Amortization (accretion) of intangibles |
1,334 | 326 | 267 | |||||||||
| Net accretion of purchase accounting adjustments on tangible assets |
(2,271 | ) | (722 | ) | (819 | ) | ||||||
| Provision for loan losses |
3,524 | 2,361 | 924 | |||||||||
| Net loss (gain) on sale of other real estate owned |
(70 | ) | 91 | 5 | ||||||||
| Net loss on disposal of equipment |
63 | 438 | ||||||||||
| Loans originated for sale |
(11,376 | ) | ||||||||||
| Proceeds from sale of loans originated for sale |
10,295 | |||||||||||
| Net loss (gain) on sale of loans originated for sale |
(648 | ) | ||||||||||
| Net amortization of investment securities |
4,292 | 737 | 383 | |||||||||
| Net gain on sale of investment securities |
(861 | ) | (163 | ) | (317 | ) | ||||||
| Life insurance investment income |
(778 | ) | (968 | ) | (504 | ) | ||||||
| Deferred income tax expense (benefit) |
1,146 | (1,143 | ) | 353 | ||||||||
| Stock based compensation |
70 | 25 | 40 | |||||||||
| Net change in: |
||||||||||||
| Accrued interest receivable |
286 | 621 | 390 | |||||||||
| Other assets |
(5,978 | ) | 875 | (449 | ) | |||||||
| Accrued interest payable |
(149 | ) | (466 | ) | (294 | ) | ||||||
| Other liabilities |
2,074 | 1,048 | 123 | |||||||||
|
|
|
|
|
|
|
|||||||
| Net cash provided by operating activities |
20,562 | 9,705 | 11,546 | |||||||||
|
|
|
|
|
|
|
|||||||
| Cash flows from investing activities: |
||||||||||||
| Proceeds from sales of investment securities available-for-sale |
15,389 | 4,573 | 5,821 | |||||||||
| Proceeds from repayments of investment securities: |
||||||||||||
| Available-for-sale |
47,149 | 24,221 | 47,500 | |||||||||
| Held-to-maturity |
2,576 | 5,405 | 7,730 | |||||||||
| Purchases of investment securities: |
||||||||||||
| Available-for-sale |
(102,304 | ) | (15,262 | ) | (46,297 | ) | ||||||
| Held-to-maturity |
(6,873 | ) | ||||||||||
| Net redemption (purchase) of restricted equity securities |
415 | 110 | 1,056 | |||||||||
| Net decrease (increase) in lending activities |
(34,735 | ) | (50,746 | ) | 7,268 | |||||||
| Purchases of premises and equipment |
(1,174 | ) | (614 | ) | (2,897 | ) | ||||||
| Proceeds from the sale of premises and equipment |
25 | |||||||||||
| Proceeds from investment in life insurance |
1,226 | |||||||||||
| Purchases of investment in life insurance |
(1,242 | ) | ||||||||||
| Proceeds from sale of other real estate owned |
750 | 761 | 1,778 | |||||||||
| Net cash received from acquisition |
22,392 | |||||||||||
|
|
|
|
|
|
|
|||||||
| Net cash provided by (used in) investing activities |
(71,909 | ) | (14,807 | ) | 20,717 | |||||||
|
|
|
|
|
|
|
|||||||
| Cash flows from financing activities: |
||||||||||||
| Net increase in deposits |
47,107 | 28,949 | 1,390 | |||||||||
| Repayment of long-term debt |
(3,548 | ) | (11,166 | ) | (12,823 | ) | ||||||
| Net decrease in short-term borrowings |
(2,495 | ) | (3,704 | ) | (1,962 | ) | ||||||
| Redemption of common stock |
(109 | ) | ||||||||||
| Settlement of stock options |
(83 | ) | ||||||||||
| Reissuance of treasury stock |
21 | |||||||||||
| Purchase of treasury stock |
(70 | ) | ||||||||||
| Cash dividends paid |
(9,360 | ) | (5,511 | ) | (5,504 | ) | ||||||
|
|
|
|
|
|
|
|||||||
| Net cash provided by (used in) financing activities |
31,463 | 8,568 | (18,899 | ) | ||||||||
|
|
|
|
|
|
|
|||||||
| Net increase (decrease) in cash and cash equivalents |
(19,884 | ) | 3,466 | 13,364 | ||||||||
| Cash and cash equivalents at beginning of year |
51,310 | 47,844 | 34,480 | |||||||||
|
|
|
|
|
|
|
|||||||
| Cash and cash equivalents at end of year |
$ | 31,426 | $ | 51,310 | $ | 47,844 | ||||||
|
|
|
|
|
|
|
|||||||
-75-
Table of Contents
Peoples Financial Services Corp.
CONSOLIDATED STATEMENTS OF CASH FLOWS
(Dollars in thousands, except per share data)
| Year Ended December 31, |
2014 | 2013 | 2012 | |||||||||
| Supplemental disclosures: |
||||||||||||
| Cash paid during the period for: |
||||||||||||
| Interest |
$ | 6,791 | $ | 4,635 | $ | 5,656 | ||||||
| Income taxes |
5,000 | 2,700 | 2,260 | |||||||||
| Noncash items: |
||||||||||||
| Transfers of loans to other real estate |
593 | $ | 273 | $ | 867 | |||||||
| Retirement of treasury shares |
$ | 6,300 | ||||||||||
| Acquisition: |
||||||||||||
| Fair value of assets acquired: |
||||||||||||
| Investment securities available-for-sale |
$ | 156,435 | $ | |||||||||
| Restricted equity securities |
997 | |||||||||||
| Loans, net |
$ | 1,261 | 504,002 | |||||||||
| Accrued interest receivable |
3,625 | |||||||||||
| Premises and equipment |
(101 | ) | 11,737 | |||||||||
| Core deposit and other intangible assets |
(1,334 | ) | 6,323 | |||||||||
| Other assets |
18,647 | |||||||||||
|
|
|
|
|
|
|
|||||||
| $ | (174 | ) | $ | 701,766 | $ | |||||||
|
|
|
|
|
|
|
|||||||
| Fair value of liabilities assumed: |
||||||||||||
| Deposits |
$ | 1,056 | $ | 628,304 | $ | |||||||
| Short-term borrowings |
17,737 | |||||||||||
| Long-term debt |
55 | 2,516 | ||||||||||
| Accrued interest payable |
473 | |||||||||||
| Other liabilities |
5,976 | |||||||||||
|
|
|
|
|
|
|
|||||||
| $ | 1,111 | $ | 655,006 | $ | ||||||||
|
|
|
|
|
|
|
|||||||
See notes to consolidated financial statements
-76-
Table of Contents
Peoples Financial Services Corp.
NOTES TO CONSOLIDATED FINANCIAL STATEMENTS
(Dollars in thousands, except per share data)
1. Summary of significant accounting policies:
Nature of operations:
Peoples Financial Services Corp., a bank holding company incorporated under the laws of Pennsylvania, provides a full range of financial services through its wholly-owned subsidiary, Peoples Security Bank and Trust Company (“Peoples Bank”), including its subsidiaries, Peoples Advisors, LLC and Penseco Realty, Inc. (collectively, the “Company” or “Peoples”). On November 30, 2013, Penseco Financial Services Corporation, a financial holding company incorporated under the laws of Pennsylvania (“Penseco”), merged with and into Peoples Financial Services Corp., with Peoples Financial Services Corp. being the surviving corporation (the “Merger”), pursuant to an Agreement and Plan of Merger dated June 28, 2013 (the “Merger Agreement”). In connection with the Merger, on December 1, 2013, Penseco’s former banking subsidiary, Penn Security Bank and Trust Company, merged with and into Peoples Neighborhood Bank (the “Bank Merger”), and the resulting institution adopted the name Peoples Security Bank and Trust Company. The Company services its retail and commercial customers through twenty-six full-service community banking offices located within the Lackawanna, Lehigh, Luzerne, Monroe, Susquehanna, Wayne and Wyoming Counties of Northeastern Pennsylvania and Broome County of New York.
Peoples Bank is a state-chartered bank and trust company under the jurisdiction of the Pennsylvania Department of Banking and Securities and the Federal Deposit Insurance Corporation. Peoples Bank’s primary product is loans to small- and medium-sized businesses. Other lending products include one-to-four family residential mortgages and consumer loans. Peoples Bank primarily funds its loans by offering open time deposits to commercial enterprises and individuals. Other deposit product offerings include certificates of deposits and various demand deposit accounts.
Peoples Advisors, LLC, a member-managed limited liability company, provides investment advisory services through a third party to individuals and small businesses. Penseco Realty, Inc. holds and manages real estate assets on behalf of Peoples Bank.
Peoples Advisors, LLC and Penseco Realty, Inc. did not meet the quantitative thresholds for required segment disclosure in conformity with accounting principles generally accepted in the United States of America (“GAAP”). Peoples Bank’s twenty-six community banking offices, all similar with respect to economic characteristics, share a majority of the following aggregation criteria: (i) products and services; (ii) operating processes; (iii) customer bases; (iv) delivery systems; and (v) regulatory oversight. Accordingly, they were aggregated into a single operating segment.
The Company faces competition primarily from commercial banks, thrift institutions and credit unions within the Northeastern Pennsylvania market, many of which are substantially larger in terms of assets and capital. In addition, mutual funds and security brokers compete for various types of deposits, and consumer, mortgage, leasing and insurance companies compete for various types of loans and leases. Principal methods of competing for banking and permitted nonbanking services include price, nature of product, quality of service and convenience of location.
The Company and Peoples Bank are subject to regulations of certain federal and state regulatory agencies and undergo periodic examinations.
-77-
Table of Contents
Basis of presentation:
Under the acquisition method of accounting, in a business combination effected through an exchange of equity interests, consideration of the facts and circumstances surrounding a business combination that generally involve the relative ownership and control of the entity by each of the parties subsequent to the merger must be made in determining the acquirer for financial reporting purposes. Based on a review of these factors, the aforementioned merger between the Company and Penseco was accounted for as a reverse acquisition whereby Penseco was treated as the acquirer for accounting and reporting purposes. As a result, the historical financial information included in the Company’s consolidated financial statements and related notes as reported in this Form 10-K is that of Penseco for periods prior to the merger date.
The consolidated financial statements of the Company have been prepared in conformity with GAAP, Regulation S-X and reporting practices applied in the banking industry. All significant intercompany balances and transactions have been eliminated in consolidation. The Company also presents herein condensed parent company only financial information regarding Peoples Financial Services Corp. (“Parent Company”). Prior period amounts are reclassified when necessary to conform with the current year’s presentation. Such reclassifications had no effect on financial position or results of operations. Certain disclosures related to impaired and nonaccrual loans as well as regulatory capital ratios have been revised for December 31, 2013. Such revisions were not material and had no effect on the operating results, financial position or regulatory capital classification of the Company.
The Company has evaluated events and transactions occurring subsequent to the balance sheet date of December 31, 2014, for items that should potentially be recognized or disclosed in these consolidated financial statements. The evaluation was conducted through the date these consolidated financial statements were issued.
Estimates:
The preparation of consolidated financial statements in conformity with GAAP requires management to make estimates and assumptions that affect the reported amounts of assets and liabilities and disclosure of contingent assets and liabilities at the date of the consolidated financial statements and the reported amounts of revenues and expenses during the reporting period. Significant estimates that are particularly susceptible to material change in the near term relate to the determination of the allowance for loan losses, fair value of financial instruments, the valuation of real estate acquired in connection with foreclosures or in satisfaction of loans, the valuation of deferred tax assets, determination of other-than-temporary impairment losses on securities, impairment of goodwill and fair value of assets acquired and liabilities assumed in business combinations. Actual results could differ from those estimates.
Investment securities:
Investments securities are classified and accounted for as either held-to-maturity, available-for-sale, or trading account securities based on management’s intent at the time of acquisition. Management is required to reassess the appropriateness of such classifications at each reporting date. The Company classifies debt securities as held-to maturity when management has the positive intent and ability to hold such securities to maturity. Held-to-maturity securities are stated at cost, adjusted for amortization of premium and accretion of discount. Investment securities are designated as available-for-sale when they are to be held for indefinite periods of time as management intends to use such securities to implement asset/liability strategies or to sell them in response to changes in interest rates, prepayment risk, liquidity requirements, or other circumstances identified by management. Available-for-sale securities are reported at fair value, with unrealized gains and losses, net of income taxes, excluded from earnings and reported in a separate component of stockholders’ equity. All marketable equity securities are accounted for at fair value. Estimated fair values for investment securities are based on quoted market prices from a national pricing service. Realized gains and losses are computed using the specific identification method and are included in noninterest income. Premiums are amortized and discounts are
-78-
Table of Contents
accreted using the interest method over the contractual lives of investment securities. Investment securities that are bought and held principally for the purpose of selling them in the near term, in order to generate profits from market appreciation, are classified as trading account securities. Trading account securities are carried at market value. Interest on trading account securities is included in interest income. Profits or losses on trading account securities are included in noninterest income. Transfers of securities between categories are recorded at fair value at the date of the transfer, with the accounting treatment of unrealized gains or losses determined by the category into which the security is transferred.
Management evaluates each investment security to determine if a decline in fair value below its amortized cost is an other-than-temporary impairment (“OTTI”) at least quarterly, and more frequently when economic or market concerns warrant an evaluation. Factors considered in determining whether an other-than-temporary impairment was incurred include: (i) the length of time and the extent to which the fair value has been less than amortized cost; (ii) the financial condition and near-term prospects of the issuer; (iii) whether a decline in fair value is attributable to adverse conditions specifically related to the security or specific conditions in an industry or geographic area; (iv) the credit-worthiness of the issuer of the security; (v) whether dividend or interest payments have been reduced or have not been made; (vi) an adverse change in the remaining expected cash flows from the security such that the Company will not recover the amortized cost of the security; (vii) whether management intends to sell the security; and (viii) if it is more likely than not that management will be required to sell the security before recovery. If a decline is judged to be other-than-temporary, the individual security is written-down to fair value with the credit related component of the write-down included in earnings and the non-credit related component included in other comprehensive income or loss. The assessment of whether an other-than-temporary impairment exists involves a high degree of subjectivity and judgment and is based on information available to management at a point in time.
Loans held for sale:
Loans held for sale consist of one-to-four family residential mortgages originated and intended for sale in the secondary market. The loans are carried in aggregate at the lower of cost or estimated market value, based upon current delivery prices in the secondary mortgage market. Net unrealized losses are recognized through a valuation allowance by corresponding charges to income. Gains or losses on the sale of these loans are recognized in noninterest income at the time of sale using the specific identification method. Loan origination fees, net of certain direct loan origination costs, are included in net gains or losses upon the sale of the related mortgage loan. All loans are sold without recourse. The aggregate cost of these loans was lower than their estimated market value at December 31, 2014 accordingly, no valuation allowance was deemed necessary.
Loans, net:
Loans that management has the intent and ability to hold for the foreseeable future or until maturity or payoff are stated at their outstanding unpaid principal balances, net of deferred fees or costs. Interest income is accrued on the principal amount outstanding. Loan origination fees, net of certain direct origination costs, are deferred and recognized over the contractual life of the related loan as an adjustment to yield using the effective interest method. Premiums and discounts on purchased loans are amortized as adjustments to interest income using the effective interest method. Delinquency fees are recognized in income when chargeable, assuming collectability is reasonably assured.
Transfers of financial assets, which include loan participation sales, are accounted for as sales, when control over the assets has been surrendered. Control over transferred assets is deemed to be surrendered when: (i) the assets have been isolated from the Company; (ii) the transferee obtains the right, free of conditions that constrain it from taking advantage of that right, to pledge or exchange the transferred assets and (iii) the Company does not maintain effective control over the transferred assets through an agreement to repurchase them before their maturity.
-79-
Table of Contents
The loan portfolio is segmented into commercial and retail loans. Commercial loans consist of commercial and commercial real estate loans. Retail loans consist of residential real estate and other consumer loans.
The Company makes commercial loans for real estate development and other business purposes required by the customer base. The Company’s credit policies determine advance rates against the different forms of collateral that can be pledged against commercial loans. Typically, the majority of loans will be limited to a percentage of their underlying collateral values such as real estate values, equipment, eligible accounts receivable and inventory. Individual loan advance rates may be higher or lower depending upon the financial strength of the borrower and/or term of the loan. The assets financed through commercial loans are used within the business for its ongoing operation. Repayment of these kinds of loans generally comes from the cash flow of the business or the ongoing conversion of assets. Commercial real estate loans include long-term loans financing commercial properties. Repayment of these loans are dependent upon either the ongoing cash flow of the borrowing entity or the resale of or lease of the subject property. Commercial real estate loans typically require a loan to value of not greater than 75% and vary in terms. Commercial and commercial real estate loans generally have higher credit risk compared to residential mortgage loans and consumer loans, as they typically involve larger loan balances concentrated with single borrowers or groups of borrowers. In addition, the payment expectations on loans secured by income-producing properties typically depend on the successful operations of the related business and thus may be subject to a greater extent to adverse conditions in the real estate market and in the general economy.
Loans secured by commercial real estate generally have larger balances and involve a greater degree of risk than one-to-four family residential mortgage loans. Of primary concern in commercial real estate lending is the borrower’s and any guarantor’s creditworthiness and the feasibility and cash flow potential of the financed project. Additional considerations include: location, market and geographic concentrations, loan to value, strength of guarantors and quality of tenants. Payments on loans secured by income properties often depend on successful operation and management of the properties. As a result, repayment of such loans may be subject to a greater extent than residential real estate loans, to adverse conditions in the real estate market or the economy. To monitor cash flows on income properties, we require borrowers and loan guarantors, if any, to provide annual consolidated financial statements on commercial real estate loans and rent rolls where applicable. In reaching a decision on whether to make a commercial real estate loan, we consider and review a cash flow analysis of the borrower and guarantor, when applicable, and considers the net operating income of the property, the borrower’s expertise, credit history and profitability and the value of the underlying property. We have generally required that the properties securing these real estate loans have debt service coverage ratios , the ratio of earnings before debt service to debt service, of at least 1.2 times. An environmental report is obtained when the possibility exists that hazardous materials may have existed on the site, or the site may have been impacted by adjoining properties that handled hazardous materials.
Commercial loans are generally made on the basis of the borrower’s ability to make repayment from his or her employment or other income, and which are secured by real property, the value of which tends to be more easily ascertainable, commercial business loans are of higher risk and typically are made on the basis of the borrower’s ability to make repayment from the cash flow of the borrower’s business. As a result, the availability of funds for the repayment of commercial business loans may depend substantially on the success of the business itself. Further, any collateral securing such loans may depreciate over time, may be difficult to appraise and may fluctuate in value.
Residential mortgages, including home equity loans, are secured by the borrower’s residential real estate in either a first or second lien position. Residential mortgages have varying loan rates depending on the financial condition of the borrower and the loan to value ratio. Residential mortgages may have amortizations up to 30 years.
Consumer loans include installment loans, car loans, and overdraft lines of credit. The majority of these loans are secured. Consumer loans may entail greater risk than do residential mortgage loans, particularly in the case of consumer loans that are unsecured or secured by assets that depreciate rapidly, such as motor vehicles. In the
-80-
Table of Contents
latter case, repossessed collateral for a defaulted consumer loan may not provide an adequate source of repayment for the outstanding loan and a small remaining deficiency often does not warrant further substantial collection efforts against the borrower. Consumer loan collections depend on the borrower’s continuing financial stability, and therefore are likely to be adversely affected by various factors, including job loss, divorce, illness or personal bankruptcy. Furthermore, the application of various federal and state laws, including federal and state insolvency laws, may limit the amount that can be recovered on such loans.
Off-balance sheet financial instruments:
In the ordinary course of business, the Company has entered into off-balance sheet financial instruments consisting of commitments to extend credit, unused portions of lines of credit and standby letters of credit. These financial instruments are recorded in the consolidated financial statements when they are funded. Fees on commercial letters of credit and on unused available lines of credit are recorded as service charges, fees and commissions and are included in noninterest income when earned. The Company records an allowance for off-balance sheet credit losses, if deemed necessary, separately as a liability.
Nonperforming assets:
Nonperforming assets consist of nonperforming loans and other real estate owned. Nonperforming loans include nonaccrual loans, troubled debt restructured loans and accruing loans past due 90 days or more. Past due status is based on contractual terms of the loan. Generally, a loan is classified as nonaccrual when it is determined that the collection of all or a portion of interest or principal is doubtful or when a default of interest or principal has existed for 90 days or more, unless the loan is well secured and in the process of collection. When a loan is placed on nonaccrual, interest accruals discontinue and uncollected accrued interest is reversed against income in the current period. Interest collections after a loan has been placed on nonaccrual status are credited to a suspense account until either the loan is returned to performing status or charged-off. The interest accumulated in the suspense account is credited to income over the remaining life of the loan using the effective yield method if the nonaccrual loan is returned to performing status. However, if the nonaccrual loan is charged-off, the accumulated interest is applied as a reduction to principal at the time the loan is charged-off. A nonaccrual loan is returned to performing status when the loan is current as to principal and interest and has performed according to the contractual terms for a minimum of six months.
Troubled debt restructured loans are loans with original terms, interest rate, or both, that have been modified as a result of a deterioration in the borrower’s financial condition and a concession has been granted that the Company would not otherwise consider. Unless on nonaccrual, interest income on these loans is recognized when earned, using the interest method. The Company offers a variety of modifications to borrowers that would be considered concessions. The modification categories offered can generally fall within the following categories:
| • | Rate Modification — A modification in which the interest rate is changed to a below market rate. |
| • | Term Modification — A modification in which the maturity date, timing of payments or frequency of payments is changed. |
| • | Interest Only Modification — A modification in which the loan is converted to interest only payments for a period of time. |
| • | Payment Modification — A modification in which the dollar amount of the payment is changed, other than an interest only modification described above. |
| • | Combination Modification — Any other type of modification, including the use of multiple categories above. |
-81-
Table of Contents
The Company segments loans into risk categories based on relevant information about the ability of borrowers to service their debt such as current financial information, historical payment experience, credit documentation, public information, and current economic trends, among other factors. Loans are individually analyzed for credit risk by classifying them within the Company’s internal risk rating system. The Company’s risk rating classifications are defined as follows:
| • | Pass — A loan to borrowers with acceptable credit quality and risk that is not adversely classified as Substandard, Doubtful, Loss nor designated as Special Mention. |
| • | Special Mention — A loan that has potential weaknesses that deserves management’s close attention. If left uncorrected, these potential weaknesses may result in deterioration of the repayment prospects for the loan or in the institution’s credit position at some future date. Special Mention loans are not adversely classified since they do not expose the Company to sufficient risk to warrant adverse classification. |
| • | Substandard — A loan that is inadequately protected by the current sound worth and paying capacity of the obligor or of the collateral pledged, if any. Loans so classified must have a well-defined weakness or weaknesses that jeopardize the liquidation of the debt. They are characterized by the distinct possibility that the bank will sustain some loss if the deficiencies are not corrected. |
| • | Doubtful — A loan classified as Doubtful has all the weaknesses inherent in one classified Substandard with the added characteristic that the weaknesses make the collection or liquidation in full, on the basis of currently existing facts, conditions, and values, highly questionable and improbable. |
| • | Loss — A loan classified as Loss is considered uncollectible and of such little value that its continuance as bankable loans is not warranted. This classification does not mean that the loan has absolutely no recovery or salvage value, but rather it is not practical or desirable to defer writing off this basically worthless asset even though partial recovery may be effected in the future. |
Other real estate owned is comprised of properties acquired through foreclosure proceedings or in-substance foreclosures. A loan is classified as in-substance foreclosure when the Company has taken possession of the collateral regardless of whether formal foreclosure proceedings take place. Other real estate owned is included in other assets and recorded at fair value less cost to sell at the time of acquisition, establishing a new cost basis. Any excess of the loan balance over the recorded value is charged to the allowance for loan losses. Subsequent declines in the recorded values of the properties prior to their disposal and costs to maintain the assets are included in other expenses. Any gain or loss realized upon disposal of other real estate owned is included in noninterest expense.
Allowance for loan losses:
The allowance for loan losses represents management’s estimate of losses inherent in the loan portfolio as of the balance sheet date. The allowance for loan losses account is maintained through a provision for loan losses charged to earnings. Loans, or portions of loans, determined to be confirmed losses are charged against the allowance account and subsequent recoveries, if any, are credited to the account. A loss is considered confirmed when information available at the financial statement date indicates the loan, or a portion thereof, is uncollectible. Nonaccrual, troubled debt restructured and large delinquent commercial and real estate loans are reviewed monthly to determine if carrying value reductions are warranted or if these classifications should be changed. Consumer loans are considered losses and charged-off when they are 120 days past due.
Management evaluates the adequacy of the allowance for loan losses account quarterly. This assessment is based on past charge-off experience, known and inherent risks in the portfolio, adverse situations that may affect the borrower’s ability to repay, the estimated value of underlying collateral, composition of the loan portfolio, current economic conditions and other relevant factors. This evaluation is inherently subjective as it requires material estimates that may be susceptible to significant revision as more information becomes available.
-82-
Table of Contents
Regulators, in reviewing the loan portfolio as part of the scope of a regulatory examination, may require the Company to increase its allowance for loan losses or take other actions that would require the Company to increase its allowance for loan losses.
The allowance for loan losses is maintained at a level believed to be adequate to absorb probable credit losses related to specifically identified loans, as well as probable incurred losses inherent in the remainder of the loan portfolio as of the balance sheet date. The allowance for loan losses consists of an allocated element and an unallocated element. The allocated element consists of a specific allowance for impaired loans individually evaluated under Financial Accounting Standards Board (“FASB”) Accounting Standards Codification (“ASC”) 310, “Receivables,” and a formula portion for loss contingencies on those loans collectively evaluated under FASB ASC 450, “Contingencies.”
A loan is considered impaired when, based on current information and events, it is probable that the Company will be unable to collect all amounts due according to the contractual terms of the loan agreement. All amounts due according to the contractual terms means that both the contractual interest and principal payments of a loan will be collected as scheduled in the loan agreement. Factors considered by management in determining impairment include payment status, ability to pay and the probability of collecting scheduled principal and interest payments when due. Loans that experience insignificant payment delays and payment shortfalls generally are not classified as impaired. Management determines the significance of payment delays and payment shortfalls on a case-by-case basis, taking into consideration all of the circumstances surrounding the loan and the borrower, including the length of the delay, the reasons for the delay, the borrower’s prior payment record, and the amount of the shortfall in relation to the principal and interest owed. The Company recognizes interest income on impaired loans, including the recording of cash receipts, for nonaccrual, restructured loans or accruing loans depending on the status of the impaired loan. Loans considered impaired under FASB ASC 310 are measured for impairment based on the present value of expected future cash flows discounted at the loan’s effective interest rate or the fair value of the collateral if the loan is collateral dependent. If the present value of expected future cash flows discounted at the loan’s effective interest rate or the fair value of the collateral, if the loan is collateral dependent, is less than the recorded investment in the loan, a specific allowance for the loan will be established.
The formula portion of the allowance for loan losses relates to large pools of smaller-balance homogeneous loans and those identified loans considered not individually impaired having similar characteristics as these loan pools. Loss contingencies for each of the major loan pools are determined by applying a total loss factor to the current balance outstanding for each individual pool. The total loss factor is comprised of a historical loss factor using a loss migration method plus qualitative factors, which adjusts the historical loss factor for changes in trends, conditions and other relevant factors that may affect repayment of the loans in these pools as of the evaluation date. Loss migration involves determining the percentage of each pool that is expected to ultimately result in loss based on historical loss experience. Historical loss factors are based on the ratio of net loans charged-off to loans, net, for each of the major groups of loans evaluated and measured for impairment under FASB ASC 450. The historical loss factor for each pool is a weighted average of the Company’s historical net charge-off ratio for the most recent rolling twelve quarters. Management adjusts these historical loss factors by qualitative factors that represents a number of environmental risks that may cause estimated credit losses associated with the current portfolio to differ from historical loss experience. These environmental risks include: (i) changes in lending policies and procedures including underwriting standards and collection, charge-off and recovery practices; (ii) changes in the composition and volume of the portfolio; (iii) changes in national, local and industry conditions, including the effects of such changes on the value of underlying collateral for collateral-dependent loans; (iv) changes in the volume and severity of classified loans, including past due, nonaccrual, troubled debt restructures and other loan modifications; (v) changes in the levels of, and trends in, charge-offs and recoveries; (vi) the existence and effect of any concentrations of credit and changes in the level of such concentrations; (vii) changes in the experience, ability and depth of lending management and other relevant staff; (viii) changes in the quality of the loan review system and the degree of oversight by the board of directors; and (ix) the effect of external factors such as competition and legal and regulatory requirements on the level of estimated credit
-83-
Table of Contents
losses in the current loan portfolio. Each environmental risk factor is assigned a value to reflect improving, stable or declining conditions based on management’s best judgment using relevant information available at the time of the evaluation. Adjustments to the factors are supported through documentation of changes in conditions in a narrative accompanying the allowance for loan loss calculation.
The unallocated element is used to cover inherent losses that exist as of the evaluation date, but which have not been identified as part of the allocated allowance using the above impairment evaluation methodology due to limitations in the process. One such limitation is the imprecision of accurately estimating the impact current economic conditions will have on historical loss rates. Variations in the magnitude of impact may cause estimated credit losses associated with the current portfolio to differ from historical loss experience, resulting in an allowance that is higher or lower than the anticipated level. Management establishes the unallocated element of the allowance by considering a number of environmental risks similar to the ones used for determining the qualitative factors. Management continually monitors trends in historical and qualitative factors, including trends in the volume, composition and credit quality of the portfolio. The reasonableness of the unallocated element is evaluated through monitoring trends in its level to determine if changes from period to period are directionally consistent with changes in the loan portfolio.
Management believes the level of the allowance for loan losses was adequate to absorb probable credit losses as of December 31, 2014.
Premises and equipment, net:
Land is stated at cost. Premises, equipment and leasehold improvements are stated at cost less accumulated depreciation and amortization. The cost of routine maintenance and repairs is expensed as incurred. The cost of major replacements, renewals and betterments is capitalized. When assets are retired or otherwise disposed of, the cost and related accumulated depreciation and amortization are eliminated and any resulting gain or loss is reflected in noninterest income. Depreciation and amortization are computed principally using the straight-line method based on the following estimated useful lives of the related assets, or in the case of leasehold improvements, to the expected terms of the leases, if shorter:
| Premises and leasehold improvements |
7 – 40 years | |||
| Furniture, fixtures and equipment |
3 – 10 years |
Business combinations, goodwill and other intangible assets, net:
The Company accounts for its acquisitions using the purchase accounting method. Purchase accounting requires the total purchase price to be allocated to the estimated fair values of assets acquired and liabilities assumed, including certain intangible assets that must be recognized. Typically, this allocation results in the purchase price exceeding the fair value of net assets acquired, which is recorded as goodwill. Core deposit intangibles are a measure of the value of checking, money market and savings deposits acquired in business combinations accounted for under the purchase method. Core deposit intangibles and other identified intangibles with finite useful lives are amortized using the sum of the year’s digits over their estimated useful lives of up to ten years.
Loans that the Company acquires in connection with acquisitions are recorded at fair value with no carryover of the related allowance for credit losses. Fair value of the loans involves estimating the amount and timing of principal and interest cash flows expected to be collected on the loans and discounting those cash flows at a market rate of interest. The excess of cash flows expected at acquisition over the estimated fair value is referred to as the accretable discount and is recognized into interest income over the remaining life of the loan. The difference between contractually required payments at acquisition and the cash flows expected to be collected at acquisition is referred to as the nonaccretable discount. The nonaccretable discount includes estimated future credit losses expected to be incurred over the life of the loan. Subsequent decreases to the expected cash flows will require the Company to evaluate the need for an additional allowance for credit losses. Subsequent
-84-
Table of Contents
improvement in expected cash flows will result in the reversal of a corresponding amount of the nonaccretable discount which the Company will then reclassify as accretable discount that will be recognized into interest income over the remaining life of the loan. Acquired loans that met the criteria for nonaccrual of interest prior to the acquisition may be considered performing upon acquisition, regardless of whether the customer is contractually delinquent. As such, the Company may no longer consider the loan to be nonaccrual or nonperforming and may accrue interest on these loans, including the impact of any accretable discount. In addition, charge-offs on such loans would be first applied to the nonaccretable difference portion of the fair value adjustment.
Goodwill and other intangible assets are tested for impairment annually or when circumstances arise indicating impairment may have occurred. In making this assessment that impairment has occurred, management considers a number of factors including, but not limited to, operating results, business plans, economic projections, anticipated future cash flows, and current market data. There are inherent uncertainties related to these factors and management’s judgment in applying them to the analysis of impairment. Changes in economic and operating conditions, as well as other factors, could result in impairment in future periods. Any impairment losses arising from such testing would be reported in the Consolidated Statements of Income and Comprehensive Income as a separate line item within operations. There were no impairment losses recognized as a result of periodic impairment testing in each of the three-years ended December 31, 2014.
Mortgage servicing rights:
Mortgage servicing rights are recognized as a separate asset when acquired through sales of loan originations. The Company determines a mortgage servicing right by allocating the total costs incurred between the loan sold and the servicing right, based on their relative fair values at the date of the sale. Mortgage servicing rights are included in other assets and are amortized into noninterest income in proportion to, and over the period of, the estimated future net servicing income of the underlying mortgage loans. In addition, mortgage servicing rights are evaluated for impairment at each reporting date based on the fair value of those rights. For purposes of measuring impairment, the rights are stratified by loan type, term and interest rate. The amount of impairment recognized, through a valuation allowance, is the amount by which the mortgage servicing rights for a stratum exceed their fair value.
Restricted equity securities:
As a member of the Federal Home Loan Bank of Pittsburgh (“FHLB”), the Company is required to purchase and hold stock in the FHLB to satisfy membership and borrowing requirements. This stock is restricted in that it can only be redeemed by the FHLB or to another member institution, and all redemptions of FHLB stock must be at par. As a result of these restrictions, FHLB stock is unlike other investment securities as there is no trading market for FHLB stock and the transfer price is determined by FHLB membership rules and not by market participants. The carrying value of restricted stock is included in other assets.
Bank owned life insurance:
The Company invests in bank owned life insurance (“BOLI”) as a source of funding for employee benefit expenses. BOLI involves the purchasing of life insurance by Peoples Bank on certain of its employees. The Company is the owner and beneficiary of the policies. This life insurance investment is carried at the cash surrender value of the underlying policies and is included in other assets. Income from increases in cash surrender value of the policies is included in noninterest income.
Pension and post-retirement benefit plans:
The Company sponsors various pension plans covering substantially all employees. The Company also provides post-retirement benefit plans other than pensions, consisting principally of life insurance benefits, to eligible retirees. The liabilities and annual income or expense of the Company’s pension and other post-retirement benefit
-85-
Table of Contents
plans are determined using methodologies that involve several actuarial assumptions, the most significant of which are the discount rate and the long-term rate of asset return, based on the market-related value of assets. The fair values of plan assets are determined based on prevailing market prices or estimated fair value for investments with no available quoted prices.
Statements of Cash Flows:
The Consolidated Statements of Cash Flows are presented using the indirect method. For purposes of cash flow, cash and cash equivalents include cash on hand, cash items in the process of collection, noninterest-bearing and interest-bearing deposits in other banks and federal funds sold.
Fair value of financial instruments:
The Company uses fair value measurements to record fair value adjustments to certain assets and liabilities and to determine fair value disclosure under GAAP. Fair value estimates are calculated without attempting to estimate the value of anticipated future business and the value of certain assets and liabilities that are not considered financial. Accordingly, such assets and liabilities are excluded from disclosure requirements.
In accordance with FASB ASC 820, “Fair Value Measurements and Disclosures,” fair value is the price that would be received to sell an asset or transfer a liability in an orderly transaction between market participants at the measurement date. Fair value is best determined based upon quoted market prices. In cases where quoted market prices are not available, fair values are based on estimates using present value or other valuation techniques. Those techniques are significantly affected by the assumptions used, including the discount rate and estimates of future cash flows. In that regard, the derived fair value estimates cannot be substantiated by comparison to independent markets. In many cases, these values cannot be realized in immediate settlement of the instrument.
Current fair value guidance provides a consistent definition of fair value, which focuses on exit price in an orderly transaction that is not a forced liquidation or distressed sale between participants at the measurement date under current market conditions. If there has been a significant decrease in the volume and level of activity for the asset or liability, a change in valuation technique or the use of multiple valuation techniques may be appropriate. In such instances, determining the price at which willing market participants would transact at the measurement date under current market conditions depends on the facts and circumstances and requires the use of significant judgment. The fair value is a reasonable point within the range that is most representative of fair value under current market conditions.
In accordance with GAAP, the Company groups its assets and liabilities generally measured at fair value into three levels based on market information or other fair value estimates in which the assets and liabilities are traded or valued and the reliability of the assumptions used to determine fair value. These levels include:
| • | Level 1: Unadjusted quoted prices of identical assets or liabilities in active markets that the entity has the ability to access as of the measurement date. |
| • | Level 2: Significant other observable inputs other than Level 1 prices such as quoted prices for similar assets or liabilities; quoted prices in markets that are not active; or other inputs that are observable or can be corroborated by observable market data. |
| • | Level 3: Significant unobservable inputs that reflect a reporting entity’s own assumptions about the assumptions that market participants would use in pricing an asset or liability. |
The following methods and assumptions were used by the Company to construct the summary table in Note 13 containing the fair values and related carrying amounts of financial instruments:
Cash and cash equivalents: The carrying values of cash and cash equivalents as reported on the balance sheet approximate fair value.
-86-
Table of Contents
Investment securities: The fair values of marketable equity securities are based on quoted market prices from active exchange markets. The fair values of debt securities are based on pricing from a matrix pricing model.
Loans held for sale: The fair values of loans held for sale are based upon current delivery prices in the secondary mortgage market.
Net loans: For adjustable-rate loans that reprice frequently and with no significant credit risk, fair values are based on carrying values. The fair values of other nonimpaired loans are estimated using discounted cash flow analysis, using interest rates currently offered in the market for loans with similar terms to borrowers of similar credit risk. Fair values for impaired loans are estimated using discounted cash flow analysis determined by the loan review function or underlying collateral values, where applicable.
In conjunction with the Merger, the loans purchased were recorded at their acquisition date fair value. In order to record the loans at fair value, management made three different types of fair value adjustments. A market rate adjustment was made to adjust for the movement in market interest rates, irrespective of credit adjustments, compared to the stated rates of the acquired loans. A credit adjustment was made on pools of homogeneous loans representing the changes in credit quality of the underlying borrowers from the loan inception to the acquisition date. The credit adjustment on distressed loans represents the portion of the loan balance that has been deemed uncollectible based on the management’s expectations of future cash flows for each respective loan.
Mortgage servicing rights: To determine the fair value, the Company estimates the present value of future cash flows incorporating assumptions such as cost of servicing, discount rates, prepayment speeds and default rates.
Accrued interest receivable: The carrying value of accrued interest receivable as reported on the balance sheet approximates fair value.
Restricted equity securities: The carrying values of restricted equity securities approximate fair value, due to the lack of marketability for these securities.
Deposits: The fair values of noninterest-bearing deposits and savings, NOW and money market accounts are the amounts payable on demand at the reporting date. The fair value estimates do not include the benefit that results from such low-cost funding provided by the deposit liabilities compared to the cost of borrowing funds in the market. The carrying values of adjustable-rate, fixed-term time deposits approximate their fair values at the reporting date. For fixed-rate time deposits, the present value of future cash flows is used to estimate fair values. The discount rates used are the current rates offered for time deposits with similar maturities.
The fair value assigned to the core deposit intangible asset represents the future economic benefit of the potential cost savings from acquiring core deposits in the Merger compared to the cost of obtaining alternative funding such as brokered deposits from market sources. Management utilized an income valuation approach to present value the estimated future cash savings in order to determine the fair value of the intangible asset.
Short-term borrowings: The carrying values of short-term borrowings approximate fair value.
Long-term debt: The fair value of fixed-rate long-term debt is based on the present value of future cash flows. The discount rate used is the current rate offered for long-term debt with the same maturity.
Accrued interest payable: The carrying value of accrued interest payable as reported on the balance sheet approximates fair value.
-87-
Table of Contents
Off-balance sheet financial instruments:
The majority of commitments to extend credit, unused portions of lines of credit and standby letters of credit carry current market interest rates if converted to loans. Because such commitments are generally unassignable of either the Company or the borrower, they only have value to the Company and the borrower. None of the commitments are subject to undue credit risk. The estimated fair values of off-balance sheet financial instruments are based on fees currently charged to enter into similar agreements, taking into account the remaining terms of the agreements and the counterparties’ credit standing. The fair value of off-balance sheet financial instruments was not material at December 31, 2014 and December 31, 2013.
Advertising:
The Company follows the policy of charging marketing and advertising costs to expense as incurred. Advertising expense for the years ended December 31, 2014, 2013 and 2012 was $450, $350 and $287, respectively.
Income taxes:
The Company accounts for income taxes in accordance with the income tax accounting guidance set forth in FASB ASC Topic 740, “Income Taxes”. ASC Topic 740 sets out a consistent framework to determine the appropriate level of tax reserves to maintain for uncertain tax positions.
Deferred income taxes are provided on the balance sheet method whereby deferred tax assets are recognized for deductible temporary differences and deferred tax liabilities are recognized for taxable temporary differences. Temporary differences are the differences between the reported amounts of assets and liabilities and their tax basis. Deferred tax assets are reduced by a valuation allowance when, in the opinion of management, it is more likely than not that some portion of the deferred tax assets will not be realized. Deferred tax assets and liabilities are adjusted for the effects of changes in tax laws and rates on the effective date. A tax position is recognized as a benefit only if it is more likely than not that the tax position would be sustained in a tax examination, with a tax examination being presumed to occur. The amount recognized is the largest amount of tax benefit that has a likelihood of being realized on examination of more than 50 percent. For tax positions not meeting the more likely than not threshold, no tax benefit is recorded. Under the more likely than not threshold guidelines, the Company believes no significant uncertain tax positions exist, either individually or in the aggregate, that would give rise to the non-recognition of an existing tax benefit. The Company had no material unrecognized tax benefits or accrued interest and penalties for any year in the three-year period ended December 31, 2014.
As applicable, the Company recognizes accrued interest and penalties assessed as a result of a taxing authority examination through income tax expense. The Company files consolidated income tax returns in the United States of America and various states’ jurisdictions. With limited exception, the Company is no longer subject to federal and state income tax examinations by taxing authorities for years before 2011.
Other comprehensive income (loss):
The components of other comprehensive income (loss) and their related tax effects are reported in the Consolidated Statements of Income and Comprehensive Income. The accumulated other comprehensive loss included in the Consolidated Balance Sheets relates to net unrealized gains and losses on investment securities available-for-sale and the unfunded benefit plan amounts which include prior service costs and unrealized net losses.
Earnings per share:
Basic earnings per share represent income available to common stockholders divided by the weighted-average number of common shares outstanding during the period. Diluted earnings per share reflect additional common
-88-
Table of Contents
shares that would have been outstanding if dilutive potential common shares had been issued, as well as any adjustment to income that would result from the assumed issuance. Potential common shares that may be issued by the Company relate solely to outstanding stock options, and are determined using the treasury stock method.
Stock options for 13,636 shares of common stock were not considered in computing diluted earnings per share for the year ended December 31, 2012, because they were anti-dilutive.
| 2014 | 2013 | 2012 | ||||||||||||||||||||||
| Year ended December 31 |
Basic | Diluted | Basic | Diluted | Basic | Diluted | ||||||||||||||||||
| Net Income (Numerator) |
$ | 17,649 | $ | 17,649 | $ | 5,721 | $ | 5,721 | $ | 10,589 | $ | 10,589 | ||||||||||||
| Average common shares outstanding (Denominator) |
7,548,825 | 7,561,982 | 4,733,059 | 4,733,059 | 4,467,261 | 4,467,714 | ||||||||||||||||||
| Earnings per share |
$ | 2.34 | $ | 2.34 | $ | 1.21 | $ | 1.21 | $ | 2.37 | $ | 2.37 | ||||||||||||
Stock-based compensation:
The Company recognizes all share-based payments to employees in the consolidated statement of operations based on their fair values. The fair value of such equity instruments is recognized as an expense in the historical consolidated financial statements as services are performed. The Company uses the Black-Scholes Model to estimate the fair value of each option on the date of grant. The Black-Scholes Model estimates the fair value of employee stock options using a pricing model which takes into consideration the exercise price of the option, the expected life of the option, the current market price and its expected volatility, the expected dividends on the stock and the current risk-free interest rate for the expected life of the option. The Company typically grants stock options to employees with an exercise price equal to the fair value of the shares at the date of grant. The fair value of restricted stock is equivalent to the fair value on the date of grant and is amortized over the vesting period.
As of December 31, 2014 and 2013, all stock options were fully vested and there are no unrecognized compensation costs related to stock options. The Company has not granted stock options after 2005.
Recent accounting standards:
In May 2014, the FASB issues amendments to FASB ASC 606, “Revenue from Contracts with Customers.” These amendments establish a comprehensive revenue recognition standard for virtually all industries under GAAP, including those that previously followed industry-specific guidance such as the real estate, construction and software industries. The revenue standard’s core principle is built on the contract between a vendor and a customer for the provision of goods and services. It attempts to depict the exchange of rights and obligations between the parties in the pattern of revenue recognition based on the consideration to which the vendor is entitled. To accomplish this objective, the standard requires five basic steps: (i) identify the contract with the customer; (ii) identify the performance obligations in the contract; (iii) determine the transaction price; (iv) allocate the transaction price to the performance obligations in the contract; and (v) recognize revenue when, or as, the entity satisfies a performance obligation.
The amendments are effective for public entities for annual periods and interim reporting periods within those interim periods within those annual periods beginning after December 15, 2016. The amendments provide for application under three basic transition methods, including: (i) full retrospective; (ii) retrospective with certain practical expedients and (iii) a cumulative effect approach. Under the third alternative, an entity would apply the new revenue standard only to contracts that are incomplete under legacy GAAP at the date of initial application on January 1, 2017, and recognize the cumulative effect of the new standard as an adjustment to the opening balance of retained earnings. Prior years would not be restated and additional disclosures would be required to enable users of the financial statements to understand the impact of adopting the new standard in the current year compared to prior years that are presented under legacy GAAP. Early adoption is prohibited under GAAP. The
-89-
Table of Contents
adoption of amendments to FASB ASC 606 on January 1, 2017, is not expected to have a material effect on the operating results or financial position of the Company.
2. Merger accounting:
On June 28, 2013, the Company and Penseco announced the execution of an agreement of merger, providing for the merger of Penseco with and into the Company. This merger became effective prior to the start of business on December 1, 2013. Pursuant to the terms of the merger agreement, the merger was effected by the issuance of shares of Peoples stock to Penseco shareholders. Each share of Penseco common stock was converted into the right to receive 1.3636 shares of Peoples common stock, with cash in lieu of fractional shares. The Merger provided an expanded geographic footprint for the Company and increased the size of the balance sheet wherein the combined companies can realize economies of scale and other operating efficiencies.
The Merger has been accounted for as a reverse merger using the acquisition method of accounting. For accounting purposes, Penseco is considered to have acquired Peoples in this transaction with the surviving legal entity operating under Peoples articles of incorporation. Immediately following the holding company merger, Penn Security Bank and Trust Company, merged with and into Peoples Neighborhood Bank, the wholly-owned subsidiary of Peoples, under the name Peoples Security Bank and Trust Company. Peoples Bank is, therefore, the wholly owned subsidiary of Peoples and operates under the prior Peoples Neighborhood Bank charter.
To determine the accounting treatment of the Merger, management utilized the following facts in concluding that the transaction would be treated as a reverse merger, with Penseco as the accounting acquirer:
| • | The role of Chief Executive Officer of the post-combination entity has been assumed by the executive officer of Penseco; |
| • | Upon the effective date of the Merger, the Peoples Board of Directors consists of fourteen members, of which six of the members have been appointed from the historical Peoples Board of Directors with the remaining eight directors having been appointed from the Penseco Board of Directors; |
| • | After the closing of the Merger and as a result of the fixed share exchange ratio of 1.3636 shares of Peoples common stock for each Penseco common share, the former Penseco shareholders, as a group, held approximately 59.1 percent of the outstanding shares of Peoples stock; |
| • | Penseco contributed greater than fifty percent of the total assets and tangible equity to the combined entity. |
As a result of accounting for the Merger as a reverse acquisition, People’s assets and liabilities have been incorporated into Penseco’s historical balance sheet based on the fair values of the net assets acquired as of the closing date, November 30, 2013. Prior to the Merger the balance sheets, statements of income and comprehensive income, and statements of cash flows reflect only the operations of Penseco. Following the Merger, the statements of operations reflect the operations of both Penseco and Peoples. The number of shares issued and outstanding, additional paid-in capital and all references to share quantities of the Company in these notes have been retroactively adjusted to reflect the equivalent number of shares issued by the Company in the Merger.
In a reverse acquisition, the accounting acquirer usually issues no consideration for the acquired entity. Rather, the accounting acquiree issues its equity shares to the owners of the accounting acquirer. Accordingly, the acquisition-date fair value of the consideration transferred by Penseco for its interest in Peoples is based on the number of equity interests Penseco would have to issue, measured on the transaction closing date, to give the owners of Peoples the same percentage equity interest in the combined Peoples entity that results from the reverse acquisition. The Company has utilized the closing price of Peoples’s common stock on November 29, 2013, the last trading day prior to the merger, of $34.50 per share to determine the acquisition date fair value of the consideration transferred.
-90-
Table of Contents
Immediately prior to the merger, Peoples owned 9,928 shares of Penseco which were retired on the acquisition date. The table below illustrates the calculation of the consideration effectively transferred.
| Penseco shares outstanding at November 30, 2013(A) |
3,275,217 | |||||||
| Exchange ratio |
1.3636 | |||||||
| Peoples shares issued to Penseco shareholders(B) |
4,465,538 | |||||||
| Peoples shares outstanding at November 30, 2013 |
3,087,406 | |||||||
| Total Peoples shares outstanding at November 30, 2013 |
7,552,944 | |||||||
| Penseco % ownership |
59.12 | % | ||||||
| Peoples % ownership |
40.88 | % | ||||||
| Theoretical Penseco share to be issued as consideration |
||||||||
| Penseco shares outstanding at November 30, 2013(A) |
3,275,217 | |||||||
| Ownership % held by Penseco shareholders |
59.12 | % | ||||||
| Theoretical Penseco shares after consideration paid |
5,539,653 | |||||||
| Ownership % by legacy Peoples shareholders |
40.88 | % | ||||||
| Theoretical Penseco shares issued as consideration |
2,264,436 | |||||||
| Fair value of Penseco shares at November 30, 2013 ($34.50 multiplied by 1.3636) |
$ | 47.04 | ||||||
| Fair value of theoretical Penseco shares |
$ | 106,519 | ||||||
| Cash paid for fractional shares |
17 | |||||||
|
|
|
|||||||
| $ | 106,536 | |||||||
|
|
|
|||||||
| (A) | Excludes 9,928 shares of Penseco common shares owned by Peoples which were retired. |
| (B) | Excludes payment for fractional shares. |
The acquired assets and assumed liabilities were measured at fair value as of the acquisition date. In many cases, determining the fair value of the acquired assets and assumed liabilities required the Company to estimate cash flows expected to result from those assets and liabilities and to discount those cash flows at appropriate rates of interest, which required the utilization of significant estimates and judgment in accounting for the acquisition. As of November 30, 2013, goodwill totaled $36,972, which is equal to the excess of the consideration transferred over the fair value of the identifiable net assets acquired in connection with the Merger. Goodwill recorded in the Merger resulted from the expected synergies of the combined operations of the newly merged entities as well as intangibles that do not qualify for separate recognition such as the acquired workforce. There is no tax deductible goodwill in the transaction. FASB ASC 805 does allow for adjustments to goodwill for a period of up to one year following the acquisition date should new information come to light that reflects circumstances that existed at the acquisition date. Goodwill was not adjusted in 2014.
| Total Purchase Price |
$ | 106,536 | ||||||
| Net Assets Acquired: |
||||||||
| Cash and due from banks |
$ | 6,982 | ||||||
| Federal funds sold |
15,410 | |||||||
| Investment securities available-for-sale |
156,435 | |||||||
| Restricted equity securities |
997 | |||||||
| Loans, net |
504,002 | |||||||
| Accrued interest receivable |
3,625 | |||||||
| Premises and equipment |
11,737 | |||||||
| Core deposit and other intangible assets |
6,323 | |||||||
| Other assets |
18,647 | |||||||
| Deposits |
(628,304 | ) | ||||||
| Short-term borrowings |
(17,737 | ) | ||||||
| Long-term debt |
(2,516 | ) | ||||||
| Accrued interest payable |
(473 | ) | ||||||
| Other liabilities |
(5,976 | ) | ||||||
|
|
|
|||||||
| Net assets acquired |
69,152 | |||||||
|
|
|
|||||||
| Treasury stock acquired |
412 | |||||||
|
|
|
|||||||
| Goodwill resulting from merger |
$ | 36,972 | ||||||
|
|
|
-91-
Table of Contents
The estimated fair values of cash and due from banks, federal funds sold, other assets and other liabilities approximate their stated value.
The estimated fair values of the investment securities available for sale were calculated primarily using level 2 inputs. The prices for these instruments are obtained through an independent pricing service and are derived from market quotations and matrix pricing. The fair value measurements consider observable data that may include dealer quotes, market spreads, cash flows, the U.S. Treasury yield curve, live trading levels, trade execution data, market consensus prepayment speeds, credit information and the bond’s terms and conditions, among other things. Management reviewed the data and assumptions used in pricing the securities to ensure the highest level of significant inputs are derived from market observable data.
Land and buildings, included in premises and equipment, net, and real estate acquired through foreclosure, included in other assets, were primarily valued based on appraised collateral values.
The most significant fair value determination related to the valuation of acquired loans. Management measured loan fair values based on loan file reviews including borrower financial statements or tax returns, appraised collateral values, expected cash flows and historical loss factors. The business combination resulted in the acquisition of loans with and without evidence of credit quality deterioration.
Peoples Bank’s loans without evidence of credit deterioration were assembled into groupings by characteristics such as loan type, term, collateral and rate and fair valued by discounting both expected principal and interest cash flows using an observable discount rate for similar instruments that a market participant would consider in determining fair value. The discount rate utilized was the average of market rates for similar loans obtained from various external data sources. Additionally, consideration was given to management’s best estimates of default rates and payment speeds in projecting the expected cash flows. A general credit risk fair value adjustment was calculated using a two part general credit fair value analysis: (1) expected lifetime losses, using an average of historical losses of the Company, Penseco and peer banks; and (2) an estimated fair value adjustment for qualitative factors related to general economic conditions and the risk related to lack of familiarity with the originator’s underwriting process. At acquisition, Peoples Bank’s loan portfolio without evidence of credit deterioration was recorded at a current fair value of $496,650.
Peoples’ loans were deemed impaired at the acquisition date if the Company did not expect to receive all contractually required cash flows due to concerns about credit quality. Such loans were fair valued by discounting the expected cash flows at acquisition by an observable discount rate for similar instruments that a market participant would consider in determining fair value. The difference between contractually required payments at the acquisition date and cash flows expected to be collected was recorded as a nonaccretable difference.
The following is a summary of the acquired nonimpaired and impaired loans from the merger with Peoples:
| Acquired Nonimpaired Loans |
Acquired Impaired Loans |
|||||||
| Contractually required principal and interest at acquisition |
$ | 501,423 | $ | 19,353 | ||||
| Contractual cash flows not expected to be collected (nonaccretable discount) |
(10,873 | ) | ||||||
|
|
|
|
|
|||||
| Expected cash flows at acquisition |
501,423 | 8,480 | ||||||
| Interest component of expected cash flows (accretable discount) |
(4,773 | ) | (1,128 | ) | ||||
|
|
|
|
|
|||||
| Fair value of acquired loans |
$ | 496,650 | $ | 7,352 | ||||
|
|
|
|
|
|||||
-92-
Table of Contents
The Company recorded a core deposit intangible asset related to a value ascribed to demand, interest checking, money market and savings account, referred to as core deposits, acquired as part of the acquisition. The value assigned to the acquired core deposits represents the future economic benefit of the potential cost savings from acquiring the core deposits, net of operating expenses and including ancillary fee income, compared to the cost of obtaining alternative funds from available market sources. Management used estimates including the expected attrition rates of depository accounts, future interest rate levels, and the cost of servicing various depository products. The Company also recorded a trade name intangible asset using relief from royalty method. The value assigned to the trade name represents the present value of the potential cost savings of paying a royalty for the use of a trade name. Both the core deposit intangible and trade name intangible are being amortized over an estimated useful life of 10 years.
Time deposits are not considered to be core deposits as they are assumed to have a low expected average life upon acquisition. The fair value of time deposits was calculated as the present value of the certificates’ expected contractual payments discounted by market rates for similar time deposits.
The Company recorded the fair value of borrowings based on prepayment amounts obtained from the Federal Home Loan Bank.
In connection with the acquisition, Peoples incurred merger-related expenses in regards to personnel, professional fees, occupancy and equipment and other costs of integrating and conforming acquired operations. Those expenses consisted largely of costs related to professional and consulting services, employment severance and early retirement charges, termination of Penseco’s core system contractual agreement and conversion of systems and/or integration of operations, initial communication expenses, printing and filing costs of completing the transaction and investment banking charges.
A summary of merger related costs included in the consolidated statements of income for the years ended December 31, 2014 and 2013 is summarized as follows:
| December 31, |
2014 | 2013 | ||||||
| Accounting |
$ | 258 | $ | 65 | ||||
| Legal and consulting |
85 | 1,011 | ||||||
| Salaries and benefits |
459 | 1,851 | ||||||
| Equipment disposition and contract termination |
440 | 709 | ||||||
| System conversion/deconversion costs |
278 | 956 | ||||||
| Other |
205 | 17 | ||||||
|
|
|
|
|
|||||
| Total |
$ | 1,725 | $ | 4,609 | ||||
|
|
|
|
|
|||||
There were no merger related costs incurred for the year ended December 31, 2012.
Pro Forma Condensed Combined Financial Information:
The following table presents unaudited pro forma information as if the merger between Peoples and Penseco had been completed on January 1, 2012. The pro forma information does not necessarily reflect the results of operations that would have occurred had the Company merged with Penseco at the beginning of 2012. Supplemental pro forma earnings for 2013 were adjusted to exclude $4,609 of merger related costs incurred for the year ended December 31, 2013. The expected future amortizations of the various fair value adjustments were included beginning in 2012. Cost savings are not reflected in the unaudited pro forma amounts for the periods presented. The pro forma financial
-93-
Table of Contents
information does not include the impact of possible business model changes, nor does it consider any potential impacts of current market conditions on revenues, expense efficiencies, or other factors.
| Years ended December 31, |
2013 | 2012 | ||||||
| Net interest income after loan loss provision |
$ | 52,734 | $ | 52,917 | ||||
| Noninterest income |
16,080 | 16,287 | ||||||
| Noninterest expense |
52,295 | 49,827 | ||||||
|
|
|
|
|
|||||
| Net income |
$ | 16,519 | $ | 19,377 | ||||
|
|
|
|
|
|||||
| Net income per share |
$ | 2.19 | $ | 2.55 | ||||
The amounts of net interest income after loan loss provision, noninterest income, noninterest expense and net loss attributable to Peoples since the acquisition date included in the consolidated statement of income for the year ended December 31, 2013 were $2,248, $363, $3,115, and $(261), respectively.
3. Cash and due from banks:
The Federal Reserve Act, as amended, imposes reserve requirements on all depository institutions. The Company’s required reserve balances were $15,728 and $6,921 at December 31, 2014 and 2013, respectively.
4. Investment securities:
The amortized cost and fair value of investment securities aggregated by investment category at December 31, 2014 and 2013 are summarized as follows:
| December 31, 2014 |
Amortized Cost |
Gross Unrealized Gains |
Gross Unrealized Losses |
Fair Value |
||||||||||||
| Available-for-sale: |
||||||||||||||||
| U.S. Treasury securities |
$ | 48,393 | $ | 157 | $ | 48,550 | ||||||||||
| U.S. Government-sponsored enterprises |
95,990 | 337 | $ | 82 | 96,245 | |||||||||||
| State and municipals: |
||||||||||||||||
| Taxable |
16,490 | 943 | 26 | 17,407 | ||||||||||||
| Tax-exempt |
87,954 | 4,971 | 24 | 92,901 | ||||||||||||
| Mortgage-backed securities: |
||||||||||||||||
| U.S. Government agencies |
37,511 | 132 | 167 | 37,476 | ||||||||||||
| U.S. Government-sponsored enterprises |
46,956 | 277 | 226 | 47,007 | ||||||||||||
|
|
|
|
|
|
|
|
|
|||||||||
| Total |
$ | 333,294 | $ | 6,817 | $ | 525 | $ | 339,586 | ||||||||
|
|
|
|
|
|
|
|
|
|||||||||
| Held-to-maturity: |
||||||||||||||||
| Tax-exempt state and municipals |
$ | 7,370 | $ | 105 | $ | 38 | $ | 7,437 | ||||||||
| Mortgage-backed securities: |
||||||||||||||||
| U.S. Government agencies |
100 | 2 | 102 | |||||||||||||
| U.S. Government-sponsored enterprises |
7,195 | 481 | 7,676 | |||||||||||||
|
|
|
|
|
|
|
|
|
|||||||||
| Total |
$ | 14,665 | $ | 588 | $ | 38 | $ | 15,215 | ||||||||
|
|
|
|
|
|
|
|
|
|||||||||
-94-
Table of Contents
| December 31, 2013 |
Amortized Cost |
Gross Unrealized Gains |
Gross Unrealized Losses |
Fair Value |
||||||||||||
| Available-for-sale: |
||||||||||||||||
| U.S. Government-sponsored enterprises |
$ | 113,221 | $ | 296 | $ | 472 | $ | 113,045 | ||||||||
| State and municipals: |
||||||||||||||||
| Taxable |
16,664 | 160 | 126 | 16,698 | ||||||||||||
| Tax-exempt |
96,194 | 2,267 | 380 | 98,081 | ||||||||||||
| Corporate debt securities |
4,433 | 32 | 78 | 4,387 | ||||||||||||
| Mortgage-backed securities: |
||||||||||||||||
| U.S. Government agencies |
20,386 | 113 | 66 | 20,433 | ||||||||||||
| U.S. Government-sponsored enterprises |
45,251 | 763 | 40 | 45,974 | ||||||||||||
| Common equity securities |
756 | 351 | 10 | 1,097 | ||||||||||||
|
|
|
|
|
|
|
|
|
|||||||||
| Total |
$ | 296,905 | $ | 3,982 | $ | 1,172 | $ | 299,715 | ||||||||
|
|
|
|
|
|
|
|
|
|||||||||
| Held-to-maturity: |
||||||||||||||||
| Tax-exempt state and municipals |
$ | 7,372 | $ | 11 | $ | 777 | $ | 6,606 | ||||||||
| Mortgage-backed securities: |
||||||||||||||||
| U.S. Government agencies |
117 | 2 | 119 | |||||||||||||
| U.S. Government-sponsored enterprises |
9,806 | 644 | 10,450 | |||||||||||||
|
|
|
|
|
|
|
|
|
|||||||||
| Total |
$ | 17,295 | $ | 657 | $ | 777 | $ | 17,175 | ||||||||
|
|
|
|
|
|
|
|
|
|||||||||
The Company had net unrealized gains of $4,090, net of deferred income taxes of $2,202 at December 31, 2014, and $1,826, net of deferred income taxes of $984, at December 31, 2013. Proceeds from the sale of investment securities available-for-sale amounted to $15,389 in 2014, $4,573 in 2013, and $5,821 in 2012. Gross gains of $919, $163, and $317 were realized on the sale of securities in 2014, 2013, and 2012, respectively. Gross losses of $58 were realized on the sale of securities in 2014. There were no gross losses realized on the sale of securities in 2013 and 2012, respectively. The income tax provision applicable to net realized gains amounted to $301, $55, and $108 in 2014, 2013, 2012, respectively.
The maturity distribution of the fair value, which is the net carrying amount, of the debt securities classified as available-for-sale at December 31, 2014, is summarized as follows:
| December 31, 2014 |
Fair Value |
|||
| Within one year |
$ | 29,295 | ||
| After one but within five years |
129,867 | |||
| After five but within ten years |
29,803 | |||
| After ten years |
66,138 | |||
|
|
|
|||
| 255,103 | ||||
| Mortgage-backed securities |
84,483 | |||
|
|
|
|||
| Total |
$ | 339,586 | ||
|
|
|
|||
-95-
Table of Contents
The maturity distribution of the amortized cost and fair value, of debt securities classified as held-to-maturity at December 31, 2014, is summarized as follows:
| December 31, 2014 |
Amortized Cost |
Fair Value |
||||||
| Within one year |
||||||||
| After one but within five years |
$ | 325 | $ | 330 | ||||
| After five but within ten years |
176 | 180 | ||||||
| After ten years |
6,869 | 6,927 | ||||||
|
|
|
|
|
|||||
| 7,370 | 7,437 | |||||||
| Mortgage-backed securities |
7,295 | 7,778 | ||||||
|
|
|
|
|
|||||
| Total |
$ | 14,665 | $ | 15,215 | ||||
|
|
|
|
|
|||||
Securities with a carrying value of $216,192 and $202,407 at December 31, 2014 and 2013, respectively, were pledged to secure public deposits and repurchase agreements as required or permitted by law.
Securities and short-term investment activities are conducted with a diverse group of government entities, corporations and state and local municipalities. The counterparty’s creditworthiness and type of collateral is evaluated on a case-by-case basis. At December 31, 2014 and 2013, there were no significant concentrations of credit risk from any one issuer, with the exception of U.S. Government agencies and sponsored enterprises that exceeded 10.0 percent of stockholders’ equity.
The fair value and gross unrealized losses of investment securities with unrealized losses for which an OTTI has not been recognized at December 31, 2014 and 2013, aggregated by investment category and length of time that the individual securities have been in a continuous unrealized loss position, are summarized as follows:
| Less Than 12 Months | 12 Months or More | Total | ||||||||||||||||||||||
| December 31, 2014 |
Fair Value |
Unrealized Losses |
Fair Value |
Unrealized Losses |
Fair Value |
Unrealized Losses |
||||||||||||||||||
| U.S. Government-sponsored enterprises |
$ | 21,228 | $ | 33 | $ | 7,954 | $ | 49 | $ | 29,182 | $ | 82 | ||||||||||||
| State and municipals: |
||||||||||||||||||||||||
| Taxable |
544 | 26 | 544 | 26 | ||||||||||||||||||||
| Tax-exempt |
4,702 | 23 | 2,423 | 39 | 7,125 | 62 | ||||||||||||||||||
| Mortgage-backed securities: |
||||||||||||||||||||||||
| U.S. Government agencies |
20,148 | 167 | 20,148 | 167 | ||||||||||||||||||||
| U.S. Government-sponsored enterprises |
22,870 | 226 | 22,870 | 226 | ||||||||||||||||||||
|
|
|
|
|
|
|
|
|
|
|
|
|
|||||||||||||
| Total |
$ | 68,948 | $ | 449 | $ | 10,921 | $ | 114 | $ | 79,869 | $ | 563 | ||||||||||||
|
|
|
|
|
|
|
|
|
|
|
|
|
|||||||||||||
| Less Than 12 Months | 12 Months or More | Total | ||||||||||||||||||||||
| December 31, 2013 |
Fair Value |
Unrealized Losses |
Fair Value |
Unrealized Losses |
Fair Value |
Unrealized Losses |
||||||||||||||||||
| U.S. Government-sponsored enterprises |
$ | 66,391 | $ | 468 | $ | 3,114 | $ | 4 | $ | 69,505 | $ | 472 | ||||||||||||
| State and municipals: |
||||||||||||||||||||||||
| Taxable |
10,621 | 126 | 10,621 | 126 | ||||||||||||||||||||
| Tax-exempt |
36,471 | 1,157 | 36,471 | 1,157 | ||||||||||||||||||||
| Corporate debt securities |
1,095 | 78 | 1,095 | 78 | ||||||||||||||||||||
| Mortgage-backed securities: |
||||||||||||||||||||||||
| U.S. Government agencies |
12,978 | 66 | 12,978 | 66 | ||||||||||||||||||||
| U.S. Government-sponsored enterprises |
5,624 | 40 | 5,624 | 40 | ||||||||||||||||||||
| Common equity securities |
137 | 10 | 137 | 10 | ||||||||||||||||||||
|
|
|
|
|
|
|
|
|
|
|
|
|
|||||||||||||
| Total |
$ | 133,317 | $ | 1,945 | $ | 3,114 | $ | 4 | $ | 136,431 | $ | 1,949 | ||||||||||||
|
|
|
|
|
|
|
|
|
|
|
|
|
|||||||||||||
-96-
Table of Contents
The Company had 52 investment securities, consisting of 16 tax-exempt state and municipal obligations, one taxable state and municipal obligation, nine U.S. Government-sponsored enterprise securities and 26 mortgage-backed securities that were in unrealized loss positions at December 31, 2014. Of these securities, two U.S. Government-sponsored enterprise securities, four tax-exempt state and municipal securities and one taxable state and municipal obligation were in a continuous unrealized loss position for twelve months or more. Management does not consider the unrealized losses on the debt securities, as a result of changes in interest rates, to be OTTI based on historical evidence that indicates the cost of these securities is recoverable within a reasonable period of time in relation to normal cyclical changes in the market rates of interest. Moreover, because there has been no material change in the credit quality of the issuers or other events or circumstances that may cause a significant adverse impact on the fair value of these securities, and management does not intend to sell these securities and it is unlikely that the Company will be required to sell these securities before recovery of their amortized cost basis, which may be maturity, the Company does not consider the unrealized losses to be OTTI at December 31, 2014.
The Company had 153 investment securities, consisting of 79 tax-exempt state and municipal obligations, 16 taxable state and municipal obligations, 39 U.S. Government-sponsored enterprise securities, 16 mortgage-backed securities, one corporate debt security, and two common equity securities that were in unrealized loss positions at December 31, 2013. Of these securities, one U.S. Government-sponsored enterprise security was in continuous unrealized loss positions for 12 months or more. There was no OTTI recognized for each of the years in the three-year period ended December 31, 2014.
5. Loans, net and allowance for loan losses:
The major classifications of loans outstanding, net of deferred loan origination fees and costs at December 31, 2014 and 2013 are summarized as follows. Net deferred loan costs were $651 and $24 in 2014 and 2013, respectively.
| December 31 |
2014 | 2013 | ||||||
| Commercial |
$ | 319,590 | $ | 350,680 | ||||
| Real estate: |
||||||||
| Commercial |
493,481 | 413,058 | ||||||
| Residential |
310,667 | 322,062 | ||||||
| Consumer |
86,156 | 90,817 | ||||||
|
|
|
|
|
|||||
| Total |
$ | 1,209,894 | $ | 1,176,617 | ||||
|
|
|
|
|
|||||
Loans outstanding to directors, executive officers, principal stockholders or to their affiliates totaled $16,484 and $14,205 at December 31, 2014 and 2013, respectively. Advances and repayments during 2014 totaled $2,764 and $485 respectively. These loans are made during the ordinary course of business at the Company’s normal credit terms. There were no related party loans that were classified as nonaccrual, past due, or restructured or considered a potential credit risk at December 31, 2014 and 2013.
At December 31, 2014, the majority of the Company’s loans were at least partially secured by real estate in Northeastern Pennsylvania. Therefore, a primary concentration of credit risk is directly related to the real estate market in this area. Changes in the general economy, local economy or in the real estate market could affect the ultimate collectability of this portion of the loan portfolio. Management does not believe there are any other significant concentrations of credit risk that could affect the loan portfolio.
-97-
Table of Contents
The changes in the allowance for loan losses account by major classification of loan for the year ended December 31, 2014, 2013, and 2012 were as follows:
| Real estate | ||||||||||||||||||||||||
| December 31, 2014 |
Commercial | Commercial | Residential | Consumer | Unallocated | Total | ||||||||||||||||||
| Allowance for loan losses: |
||||||||||||||||||||||||
| Beginning balance |
$ | 2,008 | $ | 2,394 | $ | 3,135 | $ | 1,114 | $ | $ | 8,651 | |||||||||||||
| Charge-offs |
(601 | ) | (500 | ) | (804 | ) | (386 | ) | (2,291 | ) | ||||||||||||||
| Recoveries |
9 | 292 | 38 | 115 | 454 | |||||||||||||||||||
| Provisions |
905 | 851 | 1,321 | 447 | 3,524 | |||||||||||||||||||
|
|
|
|
|
|
|
|
|
|
|
|
|
|||||||||||||
| Ending balance |
$ | 2,321 | $ | 3,037 | $ | 3,690 | $ | 1,290 | $ | $ | 10,338 | |||||||||||||
|
|
|
|
|
|
|
|
|
|
|
|
|
|||||||||||||
| Ending balance: individually evaluated for impairment |
1,072 | 805 | 767 | 38 | 2,682 | |||||||||||||||||||
|
|
|
|
|
|
|
|
|
|
|
|
|
|||||||||||||
| Ending balance: collectively evaluated for impairment |
1,081 | 2,125 | 2,921 | 1,252 | 7,379 | |||||||||||||||||||
|
|
|
|
|
|
|
|
|
|
|
|
|
|||||||||||||
| Ending balance: loans acquired with deteriorated credit quality |
$ | 168 | $ | 107 | $ | 2 | $ | $ | $ | 277 | ||||||||||||||
|
|
|
|
|
|
|
|
|
|
|
|
|
|||||||||||||
| Loans receivable: |
||||||||||||||||||||||||
| Ending balance |
$ | 319,590 | $ | 493,481 | $ | 310,667 | $ | 86,156 | $ | $ | 1,209,894 | |||||||||||||
|
|
|
|
|
|
|
|
|
|
|
|
|
|||||||||||||
| Ending balance: individually evaluated for impairment |
2,595 | 5,084 | 4,001 | 127 | 11,807 | |||||||||||||||||||
|
|
|
|
|
|
|
|
|
|
|
|
|
|||||||||||||
| Ending balance: collectively evaluated for impairment |
315,642 | 487,024 | 306,608 | $ | 86,029 | 1,195,303 | ||||||||||||||||||
|
|
|
|
|
|
|
|
|
|
|
|
|
|||||||||||||
| Ending balance: loans acquired with deteriorated credit quality |
$ | 1,353 | $ | 1,373 | $ | 58 | $ | $ | 2,784 | |||||||||||||||
|
|
|
|
|
|
|
|
|
|
|
|
|
|||||||||||||
| Real estate | ||||||||||||||||||||||||
| December 31, 2013 |
Commercial | Commercial | Residential | Consumer | Unallocated | Total | ||||||||||||||||||
| Allowance for loan losses: |
||||||||||||||||||||||||
| Beginning balance |
$ | 799 | $ | 2,304 | $ | 2,981 | $ | 866 | $ | $ | 6,950 | |||||||||||||
| Charge-offs |
(5 | ) | (15 | ) | (508 | ) | (313 | ) | (841 | ) | ||||||||||||||
| Recoveries |
1 | 20 | 111 | 49 | 181 | |||||||||||||||||||
| Provisions |
1,213 | 85 | 551 | 512 | 2,361 | |||||||||||||||||||
|
|
|
|
|
|
|
|
|
|
|
|
|
|||||||||||||
| Ending balance |
$ | 2,008 | $ | 2,394 | $ | 3,135 | $ | 1,114 | $ | $ | 8,651 | |||||||||||||
|
|
|
|
|
|
|
|
|
|
|
|
|
|||||||||||||
| Ending balance: individually evaluated for impairment |
1,500 | 300 | 224 | 2,024 | ||||||||||||||||||||
|
|
|
|
|
|
|
|
|
|
|
|
|
|||||||||||||
| Ending balance: collectively evaluated for impairment |
508 | 2,094 | 2,911 | 1,114 | 6,627 | |||||||||||||||||||
|
|
|
|
|
|
|
|
|
|
|
|
|
|||||||||||||
| Ending balance: loans acquired with deteriorated credit quality |
$ | $ | $ | $ | $ | $ | ||||||||||||||||||
|
|
|
|
|
|
|
|
|
|
|
|
|
|||||||||||||
| Loans receivable: |
||||||||||||||||||||||||
| Ending balance |
$ | 350,680 | $ | 413,058 | $ | 322,062 | $ | 90,817 | $ | $ | 1,176,617 | |||||||||||||
|
|
|
|
|
|
|
|
|
|
|
|
|
|||||||||||||
| Ending balance: individually evaluated for impairment |
4,504 | 7,711 | 3,321 | 90 | 15,626 | |||||||||||||||||||
|
|
|
|
|
|
|
|
|
|
|
|
|
|||||||||||||
| Ending balance: collectively evaluated for impairment |
343,502 | 401,168 | 318,274 | $ | 90,727 | 1,153,671 | ||||||||||||||||||
|
|
|
|
|
|
|
|
|
|
|
|
|
|||||||||||||
| Ending balance: loans acquired with deteriorated credit quality |
$ | 2,674 | $ | 4,179 | $ | 467 | $ | $ | 7,320 | |||||||||||||||
|
|
|
|
|
|
|
|
|
|
|
|
|
|||||||||||||
-98-
Table of Contents
| Real estate | ||||||||||||||||||||||||
| December 31, 2012 |
Commercial | Commercial | Residential | Consumer | Unallocated | Total | ||||||||||||||||||
| Allowance for loan losses: |
||||||||||||||||||||||||
| Beginning balance |
$ | 793 | $ | 2,294 | $ | 2,855 | $ | 769 | $ | $ | 6,711 | |||||||||||||
| Charge-offs |
(78 | ) | (33 | ) | (431 | ) | (275 | ) | (817 | ) | ||||||||||||||
| Recoveries |
1 | 6 | 67 | 58 | 132 | |||||||||||||||||||
| Provisions |
83 | 37 | 490 | 314 | 924 | |||||||||||||||||||
|
|
|
|
|
|
|
|
|
|
|
|
|
|||||||||||||
| Ending balance |
$ | 799 | $ | 2,304 | $ | 2,981 | $ | 866 | $ | $ | 6,950 | |||||||||||||
|
|
|
|
|
|
|
|
|
|
|
|
|
|||||||||||||
| Ending balance: individually evaluated for impairment |
351 | 550 | 325 | 1,226 | ||||||||||||||||||||
|
|
|
|
|
|
|
|
|
|
|
|
|
|||||||||||||
| Ending balance: collectively evaluated for impairment |
$ | 448 | $ | 1,754 | $ | 2,656 | $ | 866 | $ | $ | 5,724 | |||||||||||||
|
|
|
|
|
|
|
|
|
|
|
|
|
|||||||||||||
| Loans receivable: |
||||||||||||||||||||||||
| Ending balance |
$ | 91,724 | $ | 217,496 | $ | 261,912 | $ | 52,398 | $ | $ | 623,530 | |||||||||||||
|
|
|
|
|
|
|
|
|
|
|
|
|
|||||||||||||
| Ending balance: individually evaluated for impairment |
655 | 2,160 | 2,425 | 31 | 5,271 | |||||||||||||||||||
|
|
|
|
|
|
|
|
|
|
|
|
|
|||||||||||||
| Ending balance: collectively evaluated for impairment |
$ | 91,069 | $ | 215,336 | $ | 259,487 | $ | 52,367 | $ | $ | 618,259 | |||||||||||||
|
|
|
|
|
|
|
|
|
|
|
|
|
|||||||||||||
The following tables present the major classification of loans summarized by the aggregate pass rating and the classified ratings of special mention, substandard and doubtful within the Company’s internal risk rating system at December 31, 2014 and 2013:
| December 31, 2014: |
Pass | Special Mention |
Substandard | Doubtful | Total | |||||||||||||||
| Commercial |
$ | 306,066 | $ | 6,135 | $ | 7,389 | $ | $ | 319,590 | |||||||||||
| Real estate: |
||||||||||||||||||||
| Commercial |
472,270 | 9,858 | 11,353 | 493,481 | ||||||||||||||||
| Residential |
300,299 | 2,123 | 8,245 | 310,667 | ||||||||||||||||
| Consumer |
86,037 | 13 | 106 | 86,156 | ||||||||||||||||
|
|
|
|
|
|
|
|
|
|
|
|||||||||||
| Total |
$ | 1,164,672 | $ | 18,129 | $ | 27,093 | $ | $ | 1,209,894 | |||||||||||
|
|
|
|
|
|
|
|
|
|
|
|||||||||||
| December 31, 2013: |
Pass | Special Mention |
Substandard | Doubtful | Total | |||||||||||||||
| Commercial |
$ | 332,257 | $ | 7,025 | $ | 11,398 | $ | $ | 350,680 | |||||||||||
| Real estate: |
||||||||||||||||||||
| Commercial |
386,825 | 10,701 | 15,532 | 413,058 | ||||||||||||||||
| Residential |
314,544 | 861 | 6,657 | 322,062 | ||||||||||||||||
| Consumer |
90,718 | 9 | 90 | 90,817 | ||||||||||||||||
|
|
|
|
|
|
|
|
|
|
|
|||||||||||
| Total |
$ | 1,124,344 | $ | 18,596 | $ | 33,677 | $ | $ | 1,176,617 | |||||||||||
|
|
|
|
|
|
|
|
|
|
|
|||||||||||
-99-
Table of Contents
Information concerning nonaccrual loans by major loan classification at December 31, 2014 and 2013 is summarized as follows:
| December 31, |
2014 | 2013 | ||||||
| Commercial |
$ | 1,322 | $ | 2,035 | ||||
| Real estate: |
||||||||
| Commercial |
3,732 | 9,172 | ||||||
| Residential |
3,523 | 3,569 | ||||||
| Consumer |
122 | 90 | ||||||
|
|
|
|
|
|||||
| Total |
$ | 8,699 | $ | 14,866 | ||||
|
|
|
|
|
|||||
The major classification of loans by past due status at December 31, 2014 and 2013 are summarized as follows:
| December 31, 2014 |
30-59 Days Past Due |
60-89 Days Past Due |
Greater than 90 Days |
Total Past Due |
Current | Total Loans | Loans > 90 Days and Accruing |
|||||||||||||||||||||
| Commercial |
$ | 898 | $ | 117 | $ | 1,322 | $ | 2,337 | $ | 317,253 | $ | 319,590 | ||||||||||||||||
| Real estate: |
||||||||||||||||||||||||||||
| Commercial |
2,100 | 888 | 3,868 | 6,856 | 486,625 | 493,481 | $ | 136 | ||||||||||||||||||||
| Residential |
3,154 | 1,239 | 4,585 | 8,978 | 301,689 | 310,667 | 1,062 | |||||||||||||||||||||
| Consumer |
848 | 247 | 547 | 1,642 | 84,514 | 86,156 | 425 | |||||||||||||||||||||
|
|
|
|
|
|
|
|
|
|
|
|
|
|
|
|||||||||||||||
| Total |
$ | 7,000 | $ | 2,491 | $ | 10,322 | $ | 19,813 | $ | 1,190,081 | $ | 1,209,894 | $ | 1,623 | ||||||||||||||
|
|
|
|
|
|
|
|
|
|
|
|
|
|
|
|||||||||||||||
| December 31, 2013 |
30-59 Days Past Due |
60-89 Days Past Due |
Greater than 90 Days |
Total Past Due |
Current | Total Loans | Loans > 90 Days and Accruing |
|||||||||||||||||||||
| Commercial |
$ | 1,052 | $ | 105 | $ | 2,041 | $ | 3,198 | $ | 347,482 | $ | 350,680 | $ | 6 | ||||||||||||||
| Real estate: |
||||||||||||||||||||||||||||
| Commercial |
1,641 | 75 | 9,372 | 11,088 | 401,970 | 413,058 | 200 | |||||||||||||||||||||
| Residential |
3,676 | 985 | 4,247 | 8,908 | 313,154 | 322,062 | 678 | |||||||||||||||||||||
| Consumer |
798 | 313 | 661 | 1,772 | 89,045 | 90,817 | 571 | |||||||||||||||||||||
|
|
|
|
|
|
|
|
|
|
|
|
|
|
|
|||||||||||||||
| Total |
$ | 7,167 | $ | 1,478 | $ | 16,321 | $ | 24,966 | $ | 1,151,651 | $ | 1,176,617 | $ | 1,455 | ||||||||||||||
|
|
|
|
|
|
|
|
|
|
|
|
|
|
|
|||||||||||||||
-100-
Table of Contents
The following tables summarize information concerning impaired loans as of and for the years ended December 31, 2014, 2013 and 2012 by major loan classification:
| For the Year Ended | ||||||||||||||||||||
| December 31, 2014 |
Recorded Investment |
Unpaid Principal Balance |
Related Allowance |
Average Recorded Investment |
Interest Income Recognized |
|||||||||||||||
| With no related allowance: |
||||||||||||||||||||
| Commercial |
$ | 2,379 | $ | 4,084 | $ | 2,669 | $ | 141 | ||||||||||||
| Real estate: |
||||||||||||||||||||
| Commercial |
2,932 | 3,690 | 7,944 | 120 | ||||||||||||||||
| Residential |
2,672 | 2,857 | 2,731 | 4 | ||||||||||||||||
| Consumer |
83 | 83 | 94 | |||||||||||||||||
|
|
|
|
|
|
|
|
|
|
|
|||||||||||
| Total |
8,066 | 10,714 | 13,438 | 265 | ||||||||||||||||
|
|
|
|
|
|
|
|
|
|
|
|||||||||||
| With an allowance recorded: |
||||||||||||||||||||
| Commercial |
1,569 | 1,569 | $ | 1,240 | 1,787 | 58 | ||||||||||||||
| Real estate: |
||||||||||||||||||||
| Commercial |
3,525 | 3,525 | 912 | 2,293 | 28 | |||||||||||||||
| Residential |
1,387 | 1,387 | 769 | 590 | 10 | |||||||||||||||
| Consumer |
44 | 44 | 38 | 10 | 1 | |||||||||||||||
|
|
|
|
|
|
|
|
|
|
|
|||||||||||
| Total |
6,525 | 6,525 | 2,959 | 4,680 | 97 | |||||||||||||||
|
|
|
|
|
|
|
|
|
|
|
|||||||||||
| Commercial |
3,948 | 5,653 | 1,240 | 4,456 | 199 | |||||||||||||||
| Real estate: |
||||||||||||||||||||
| Commercial |
6,457 | 7,215 | 912 | 10,237 | 148 | |||||||||||||||
| Residential |
4,059 | 4,244 | 769 | 3,321 | 14 | |||||||||||||||
| Consumer |
127 | 127 | 38 | 104 | 1 | |||||||||||||||
|
|
|
|
|
|
|
|
|
|
|
|||||||||||
| Total |
$ | 14,591 | $ | 17,239 | $ | 2,959 | $ | 18,118 | $ | 362 | ||||||||||
|
|
|
|
|
|
|
|
|
|
|
|||||||||||
| For the Year Ended | ||||||||||||||||||||
| December 31, 2013 |
Recorded Investment |
Unpaid Principal Balance |
Related Allowance |
Average Recorded Investment |
Interest Income Recognized |
|||||||||||||||
| With no related allowance: |
||||||||||||||||||||
| Commercial |
$ | 4,978 | $ | 9,474 | $ | 5,824 | ||||||||||||||
| Real estate: |
||||||||||||||||||||
| Commercial |
10,496 | 13,352 | 10,095 | |||||||||||||||||
| Residential |
3,004 | 3,437 | 2,614 | |||||||||||||||||
| Consumer |
90 | 90 | 95 | |||||||||||||||||
|
|
|
|
|
|
|
|
|
|
|
|||||||||||
| Total |
18,568 | 26,353 | 18,628 | |||||||||||||||||
|
|
|
|
|
|
|
|
|
|
|
|||||||||||
| With an allowance recorded: |
||||||||||||||||||||
| Commercial |
2,200 | 2,200 | $ | 1,500 | 2,182 | $ | 95 | |||||||||||||
| Real estate: |
||||||||||||||||||||
| Commercial |
1,394 | 1,394 | 300 | 1,409 | 76 | |||||||||||||||
| Residential |
784 | 784 | 224 | 672 | 13 | |||||||||||||||
| Consumer |
||||||||||||||||||||
|
|
|
|
|
|
|
|
|
|
|
|||||||||||
| Total |
4,378 | 4,378 | 2,024 | 4,263 | 184 | |||||||||||||||
|
|
|
|
|
|
|
|
|
|
|
|||||||||||
| Commercial |
7,178 | 11,674 | 1,500 | 8,006 | 95 | |||||||||||||||
| Real estate: |
||||||||||||||||||||
| Commercial |
11,890 | 14,746 | 300 | 11,504 | 76 | |||||||||||||||
| Residential |
3,788 | 4,221 | 224 | 3,286 | 13 | |||||||||||||||
| Consumer |
90 | 90 | 95 | |||||||||||||||||
|
|
|
|
|
|
|
|
|
|
|
|||||||||||
| Total |
$ | 22,946 | $ | 30,731 | $ | 2,024 | $ | 22,891 | $ | 184 | ||||||||||
|
|
|
|
|
|
|
|
|
|
|
|||||||||||
-101-
Table of Contents
| For the Year Ended | ||||||||||||||||||||
| December 31, 2012 |
Recorded Investment |
Unpaid Principal Balance |
Related Allowance |
Average Recorded Investment |
Interest Income Recognized |
|||||||||||||||
| With no related allowance: |
||||||||||||||||||||
| Commercial |
$ | 304 | $ | 304 | $ | 152 | ||||||||||||||
| Real estate: |
||||||||||||||||||||
| Commercial |
145 | 145 | 201 | |||||||||||||||||
| Residential |
928 | 928 | 1,152 | |||||||||||||||||
| Consumer |
31 | 31 | 68 | |||||||||||||||||
|
|
|
|
|
|
|
|
|
|
|
|||||||||||
| Total |
1,408 | 1,408 | 1,573 | |||||||||||||||||
|
|
|
|
|
|
|
|
|
|
|
|||||||||||
| With an allowance recorded: |
||||||||||||||||||||
| Commercial |
351 | 351 | $ | 351 | 351 | $ | 17 | |||||||||||||
| Real estate: |
||||||||||||||||||||
| Commercial |
2,015 | 2,015 | 550 | 2,104 | 114 | |||||||||||||||
| Residential |
1,497 | 1,497 | 325 | 1,040 | 44 | |||||||||||||||
| Consumer |
||||||||||||||||||||
|
|
|
|
|
|
|
|
|
|
|
|||||||||||
| Total |
3,863 | 3,863 | 1,226 | 3,495 | 175 | |||||||||||||||
|
|
|
|
|
|
|
|
|
|
|
|||||||||||
| Commercial |
655 | 655 | 351 | 503 | 17 | |||||||||||||||
| Real estate: |
||||||||||||||||||||
| Commercial |
2,160 | 2,160 | 550 | 2,305 | 114 | |||||||||||||||
| Residential |
2,425 | 2,425 | 325 | 2,192 | 44 | |||||||||||||||
| Consumer |
31 | 31 | 68 | |||||||||||||||||
|
|
|
|
|
|
|
|
|
|
|
|||||||||||
| Total |
$ | 5,271 | $ | 5,271 | $ | 1,226 | $ | 5,068 | $ | 175 | ||||||||||
|
|
|
|
|
|
|
|
|
|
|
|||||||||||
There were no amounts of interest income recognized using the cash-basis method on impaired loans for the years ended December 31, 2014, 2013 and 2012.
As a part of the Merger, an adjustment was made to reflect the elimination of the allowance for loan losses related to the Peoples Bank loan portfolio, as required by purchase accounting standards. As a result, the acquired loan portfolio was evaluated based on risk characteristics and other credit and market criteria to determine a credit quality adjustment to the fair value of the loan acquired. The acquired loan balance was reduced by the aggregate amount of the credit quality adjustment in determining the fair value of the loans. The credit quality adjustment does not account for acquired loans deemed to be impaired in accordance with Accounting Standard Codification 310-30-30, previously known as Statement of Position (SOP) 03-3, “Accounting for Certain Loans Acquired in a Transfer.” These impaired loans are accounted for in the credit adjustment on distressed loans, which represents the portion of the loan balance that has been deemed uncollectible based on the management’s expectations of future cash flows for each respective loan. Based on management’s evaluation of the acquired loan portfolio, 29 loans were deemed impaired resulting in a credit adjustment on distressed loans of $6,892. As of December 31, 2014, there were a total of 15 loans remaining with a credit adjustment of $2,588.
At December 31, 2014, the Company had total impaired loans of $14,591. The impaired loan balance includes $2,784 of impaired loans acquired as part of the merger net of a remaining fair value adjustment of $2,648. Management performed an evaluation of expected future cash flows, including the anticipated cash flow from the sale of collateral, and compared that to the carrying amount of the impaired loans. Based on these evaluations, the Company has determined that an additional reserve of $277 was required against the impaired loans at December 31, 2014.
-102-
Table of Contents
The changes in the accretible yield and nonaccretible difference of acquired loans accounted for under ASC310 for the years ended December 31, 2014, 2013 and 2012, were as follows:
| 2014 | 2013 | 2012 | ||||||||||||||||||||||
| Year ended December 31 |
Accretible | Nonaccretible | Accretible | Nonaccretible | Accretible | Nonaccretible | ||||||||||||||||||
| Beginning Balance, January 1 |
$ | 895 | $ | 6,892 | $ | $ | 211 | |||||||||||||||||
| Additions |
$ | 934 | $ | 6,892 | ||||||||||||||||||||
| Accretion |
(280 | ) | (39 | ) | ||||||||||||||||||||
| Charge-offs |
(398 | ) | (2,703 | ) | ||||||||||||||||||||
| Payments |
(157 | ) | (1,601 | ) | (211 | ) | ||||||||||||||||||
|
|
|
|
|
|
|
|
|
|
|
|
|
|||||||||||||
| Ending Balance, December 31 |
$ | 60 | $ | 2,588 | $ | 895 | $ | 6,892 | $ | $ | ||||||||||||||
|
|
|
|
|
|
|
|
|
|
|
|
|
|||||||||||||
Included in the commercial loan and commercial real estate categories are troubled debt restructurings that were classified as impaired. Trouble debt restructurings totaled $2,933, $2,487 and $351 at December 31, 2014, 2013 and 2012, respectively.
There were three loans modified in 2014 and no loans modified in 2013 or 2012 that resulted in troubled debt restructurings. The following table summarizes the loans whose terms have been modified resulting in troubled debt restructurings during the year ended December 31, 2014.
| December 31, 2014 |
Number of Contracts |
Pre-Modification Outstanding Recorded Investment |
Post-Modification Outstanding Recorded Investment |
Recorded Investment |
||||||||||||
| Commercial real estate |
1 | $ | 4,408 | $ | 2,500 | $ | 2,457 | |||||||||
| Residential mortgage |
2 | 479 | 479 | 476 | ||||||||||||
|
|
|
|
|
|
|
|
|
|||||||||
| Total |
3 | $ | 4,887 | $ | 2,979 | $ | 2,933 | |||||||||
|
|
|
|
|
|
|
|
|
|||||||||
There were no payment defaults within 12 months of their modification on loans considered troubled debt restructurings for the years ended December 31, 2014, 2013 and 2012.
6. Off-balance sheet financial instruments:
The Company is a party to financial instruments with off-balance sheet risk in the normal course of business to meet the financing needs of its customers. These financial instruments include commitments to extend credit, unused portions of lines of credit and standby letters of credit. Those instruments involve, to varying degrees, elements of credit risk in excess of the amount recognized in the consolidated balance sheets.
The Company’s exposure to credit loss in the event of nonperformance by the other party to the financial instrument for commitments to extend credit, unused portions of lines of credit and standby letters of credit is represented by the contractual amounts of those instruments. The Company follows the same credit policies in making commitments and conditional obligations as it does for on-balance sheet instruments. We record a valuation allowance for off-balance sheet credit losses, if deemed necessary, separately as a liability. An allowance of $58.0 was recorded as of December 31, 2014 while no allowance was deemed necessary at December 31, 2013.
The contractual amounts of off-balance sheet commitments at December 31, 2014 and 2013 are summarized as follows:
| December 31 |
2014 | 2013 | ||||||
| Commitments to extend credit |
$ | 187,351 | $ | 221,138 | ||||
| Unused portions of lines of credit |
48,610 | 52,257 | ||||||
| Standby letters of credit |
30,609 | 29,914 | ||||||
|
|
|
|
|
|||||
| $ | 266,570 | $ | 303,309 | |||||
|
|
|
|
|
|||||
-103-
Table of Contents
Commitments to extend credit are agreements to lend to a customer as long as there is no violation of any condition established in the contract. Since many of the commitments are expected to expire without being drawn upon, the total commitment amounts do not necessarily represent future cash requirements. Commitments generally have fixed expiration dates or other termination clauses and may require payment of a fee. The Company evaluates each customer’s credit worthiness on a case-by-case basis. The amount of collateral obtained, if deemed necessary by the Company upon extension of credit, is based on management’s credit evaluation. Collateral held varies but may include personal or commercial real estate, accounts receivable, inventory and equipment.
Unused portions of lines of credit, including home equity and overdraft protection agreements, are commitments for possible future extensions of credit to existing customers. Unused portions of home equity lines are collateralized and generally have fixed expiration dates. Overdraft protection agreements are uncollateralized and usually do not carry specific maturity dates. Unused portions of lines of credit ultimately may not be drawn upon to the total extent to which the Company is committed.
Standby letters of credit are conditional commitments issued by the Company to guarantee the performance of a customer to a third party. Generally, all standby letters of credit expire within twelve months. The credit risk involved in issuing standby letters of credit is essentially the same as that involved in extending other loan commitments. The Company requires collateral supporting these standby letters of credit as deemed necessary. Collateral supporting standby letters of credit amounted to $27,666 at December 31, 2014 and $25,756 at December 31, 2013. The carrying value of the liability for the Company’s obligations under guarantees for standby letters of credit was not material at December 31, 2014 and 2013.
7. Premises and equipment, net:
Premises and equipment at December 31, 2014 and 2013 are summarized as follows:
| December 31 |
2014 | 2013 | ||||||
| Land |
$ | 5,309 | $ | 5,309 | ||||
| Premises and leasehold improvements |
30,046 | 34,177 | ||||||
| Furniture, fixtures and equipment |
9,470 | 22,975 | ||||||
|
|
|
|
|
|||||
| 44,825 | 62,461 | |||||||
| Less: accumulated depreciation |
19,392 | 36,342 | ||||||
|
|
|
|
|
|||||
| $ | 25,433 | $ | 26,119 | |||||
|
|
|
|
|
|||||
Depreciation and amortization included to noninterest expense amounted to $1,671, $924, and $855 in 2014, 2013 and 2012, respectively.
Pursuant to the terms of non-cancelable lease agreements in effect at December 31, 2014, pertaining to banking premises and equipment, future minimum annual rent commitments under various operating leases are summarized as follows:
| 2015 |
$ | 312 | ||
| 2016 |
264 | |||
| 2017 |
211 | |||
| 2018 |
129 | |||
| 2019 |
96 | |||
| Thereafter |
388 | |||
|
|
|
|||
| $ | 1,400 | |||
|
|
|
The leases contain options to extend for periods from one to ten years. The cost of such options is not included in the annual rental commitments. Rent expense for the years ended December 31, 2014, 2013 and 2012 amounted to $343, $216 and $103, respectively.
-104-
Table of Contents
8. Intangible assets, net:
The gross carrying amount of core deposit intangible assets totaled $8,146 at December 31, 2014 and 2013. The gross carrying amount of trade name intangible assets totaled $203 at December 31, 2014 and 2013. The accumulated amortization on core deposit intangible assets was $2,808 and $1,512 at December 31, 2014 and 2013, respectively. The accumulated amortization on trade name intangible assets was $40 and $2 at December 31, 2014 and 2013, respectively. Amortization expense amounted to $1,334, $326 and $267 in 2014, 2013 and 2012, respectively.
The estimated amortization expense on intangible assets in years subsequent to December 31, 2014, is as follows:
| 2015 |
$ | 1,182 | ||
| 2016 |
1,030 | |||
| 2017 |
879 | |||
| 2018 |
726 | |||
| 2019 |
574 | |||
| Thereafter |
$ | 1,110 |
9. Other assets:
The major components of other assets at December 31, 2014 and 2013 are summarized as follows:
| December 31 |
2014 | 2013 | ||||||
| Other real estate owned |
$ | 561 | $ | 648 | ||||
| Investment in residential housing program |
4,329 | 3,211 | ||||||
| Mortgage servicing rights |
676 | 880 | ||||||
| Bank owned life insurance |
29,983 | 29,198 | ||||||
| Restricted equity securities |
3,687 | 4,102 | ||||||
| Other assets |
13,830 | 9,949 | ||||||
|
|
|
|
|
|||||
| Total |
$ | 53,066 | $ | 47,988 | ||||
|
|
|
|
|
|||||
The Company originates one-to-four family residential mortgage loans for sale in the secondary market with servicing rights retained. Mortgage loans serviced for other are not included in the accompanying Consolidated Balance Sheets. The unpaid principal balances of mortgage loans serviced for others were $163,822 at December 31, 2014 and $169,450 at December 31, 2013.
10. Deposits:
The major components of interest-bearing and noninterest-bearing deposits at December 31, 2014 and 2013 are summarized as follows:
| December 31 |
2014 | 2013 | ||||||
| Interest-bearing deposits: |
||||||||
| Money market accounts |
$ | 197,442 | $ | 229,626 | ||||
| Now accounts |
254,924 | 194,931 | ||||||
| Savings accounts |
391,952 | 372,101 | ||||||
| Time deposits less than $100 |
191,890 | 204,546 | ||||||
| Time deposits $100 or more |
75,852 | 98,361 | ||||||
|
|
|
|
|
|||||
| Total interest-bearing deposits |
1,112,060 | 1,099,565 | ||||||
| Noninterest-bearing deposits |
313,498 | 279,942 | ||||||
|
|
|
|
|
|||||
| Total deposits |
$ | 1,425,558 | $ | 1,379,507 | ||||
|
|
|
|
|
|||||
-105-
Table of Contents
The aggregate amounts of maturities for all time deposits at December 31, 2014, are summarized as follows:
| 2015 |
$ | 141,078 | ||
| 2016 |
49,212 | |||
| 2017 |
19,430 | |||
| 2018 |
26,146 | |||
| 2019 |
11,648 | |||
| Thereafter |
20,228 | |||
|
|
|
|||
| $ | 267,742 | |||
|
|
|
The aggregate amount of deposits reclassified as loans was $463 at December 31, 2014, and $405 at December 31, 2013. Management evaluates transaction accounts that are overdrawn for collectability as part of its evaluation for credit losses. During 2014 and 2013, no deposits were received on terms other than those available in the normal course of business.
11. Short-term borrowings:
Securities sold under agreements to repurchase and FHLB advances generally represent overnight or less than 30-day borrowings. Short-term borrowings consisted of the following at December 31, 2014 and 2013:
| At and for the year ended December 31, 2014 | ||||||||||||||||||||
| Ending Balance |
Average Balance |
Maximum Month-End Balance |
Weighted Average Rate for the Year |
Weighted Average Rate at End of the Year |
||||||||||||||||
| Repurchase agreements |
$ | 682 | $ | 12,729 | $ | 22,840 | 0.53 | % | 0.38 | % | ||||||||||
| FHLB advances |
18,875 | 2,142 | 18,875 | 0.25 | 0.28 | |||||||||||||||
|
|
|
|
|
|
|
|||||||||||||||
| $ | 19,557 | $ | 14,871 | $ | 41,715 | 0.48 | % | 0.28 | % | |||||||||||
|
|
|
|
|
|
|
|||||||||||||||
| At and for the year ended December 31, 2013 | ||||||||||||||||||||
| Ending Balance |
Average Balance |
Maximum Month-End Balance |
Weighted Average Rate for the Year |
Weighted Average Rate at End of the Year |
||||||||||||||||
| Repurchase agreements |
$ | 22,052 | $ | 10,107 | $ | 25,898 | 0.33 | % | 0.67 | % | ||||||||||
| FHLB advances |
51 | 0.33 | ||||||||||||||||||
|
|
|
|
|
|
|
|||||||||||||||
| $ | 22,052 | $ | 10,158 | $ | 25,898 | 0.33 | % | 0.67 | % | |||||||||||
|
|
|
|
|
|
|
|||||||||||||||
Peoples Bank has an agreement with the FHLB which allows for borrowings up to its maximum borrowing capacity based on a percentage of qualifying collateral assets. At December 31, 2014, Peoples Bank’s maximum borrowing capacity was $544,320 of which $52,015 was outstanding in borrowings. Advances with the FHLB are secured under terms of a blanket collateral agreement by a pledge of FHLB stock and certain other qualifying collateral, such as investments and mortgage-backed securities and mortgage loans. Interest accrues daily on the FHLB advances based on rates of the FHLB discount notes. This rate resets each day.
Securities sold under repurchase agreements are retained under Peoples Bank’s control at its safekeeping agent. The Bank may be required to provide additional collateral based on the fair value of the underlying securities.
-106-
Table of Contents
12. Long-term debt:
Long-term debt consisting of advances from the FHLB at December 31, 2014 and 2013 are as follows:
| Interest Rate | ||||||||||||||||
| Due |
Fixed | Adjustable | 2014 | 2013 | ||||||||||||
| August 2014 |
2.66 | % | $ | 141 | ||||||||||||
| March 2015 |
3.44 | $ | 133 | 919 | ||||||||||||
| March 2015 |
3.48 | 40 | 197 | |||||||||||||
| November 2015 |
4.67 | 257 | 527 | |||||||||||||
| February 2016 |
4.86 | 166 | 301 | |||||||||||||
| February 2016 |
4.86 | 166 | 301 | |||||||||||||
| February 2017 |
4.99 | 918 | 1,311 | |||||||||||||
| September 2017 |
2.36 | 6,500 | 6,500 | |||||||||||||
| April 2018 |
3.83 | 377 | 480 | |||||||||||||
| December 2019 |
1.81 | % | 3,000 | 3,000 | ||||||||||||
| December 2019 |
1.45 | % | 6,300 | 6,300 | ||||||||||||
| March 2023 |
4.69 | % | 15,283 | 16,766 | ||||||||||||
|
|
|
|
|
|||||||||||||
| $ | 33,140 | $ | 36,743 | |||||||||||||
|
|
|
|
|
|||||||||||||
Maturities of long-term debt, by contractual maturity, in years subsequent to December 31, 2014 are as follows:
| 2015 |
$ | 2,785 | ||
| 2016 |
2,220 | |||
| 2017 |
8,400 | |||
| 2018 |
1,828 | |||
| 2019 |
11,174 | |||
| Thereafter |
6,733 | |||
|
|
|
|||
| $ | 33,140 | |||
|
|
|
None of the advances from the FHLB are convertible. Long-term debt consist of $23,840 at fixed rates and $9,300 at adjustable rates which reset quarterly based on three-month Libor plus 1.21% to plus 1.57%.
13. Fair value of financial instruments:
Assets and liabilities measured at fair value on a recurring basis at December 31, 2014 and 2013 are summarized as follows:
| Fair Value Measurement Using | ||||||||||||||||
| December 31, 2014 |
Amount | Quoted Prices in Active Markets for Identical Assets (Level 1) |
Significant Other Observable Inputs (Level 2) |
Significant Unobservable Inputs (Level 3) |
||||||||||||
| U.S. Treasury securities |
$ | 48,550 | $ | 48,550 | $ | |||||||||||
| U.S. Government-sponsored enterprises |
96,245 | $ | 96,245 | |||||||||||||
| State and Municipals: |
||||||||||||||||
| Taxable |
17,407 | 17,407 | ||||||||||||||
| Tax-exempt |
92,901 | 92,901 | ||||||||||||||
| Mortgage-backed securities: |
||||||||||||||||
| U.S. Government agencies |
37,476 | 37,476 | ||||||||||||||
| U.S. Government-sponsored enterprises |
47,007 | 47,007 | ||||||||||||||
|
|
|
|
|
|
|
|
|
|||||||||
| Total |
$ | 339,586 | $ | 48,550 | $ | 291,036 | $ | |||||||||
|
|
|
|
|
|
|
|
|
|||||||||
-107-
Table of Contents
| Fair Value Measurement Using | ||||||||||||||||
| December 31, 2013 |
Amount | Quoted Prices in Active Markets for Identical Assets (Level 1) |
Significant Other Observable Inputs (Level 2) |
Significant Unobservable Inputs (Level 3) |
||||||||||||
| U.S. Government-sponsored enterprises |
$ | 113,045 | $ | 113,045 | $ | |||||||||||
| State and Municipals: |
||||||||||||||||
| Taxable |
16,698 | 16,698 | ||||||||||||||
| Tax-exempt |
98,081 | 98,081 | ||||||||||||||
| Corporate debt securities |
4,387 | 4,387 | ||||||||||||||
| Mortgage-backed securities: |
||||||||||||||||
| U.S. Government agencies |
20,433 | 20,433 | ||||||||||||||
| U.S. Government-sponsored enterprises |
45,974 | 45,974 | ||||||||||||||
| Common equity securities |
1,097 | $ | 1,097 | |||||||||||||
|
|
|
|
|
|
|
|
|
|||||||||
| Total |
$ | 299,715 | $ | 1,097 | $ | 298,618 | $ | |||||||||
|
|
|
|
|
|
|
|
|
|||||||||
Assets and liabilities measured at fair value on a nonrecurring basis at December 31, 2014 and 2013 are summarized as follows:
| Fair Value Measurement Using | ||||||||||||
| December 31, 2014 |
Amount | Quoted Prices in Active Markets for Identical Assets (Level 1) |
Significant Other Observable Inputs (Level 2) |
Significant Unobservable Inputs (Level 3) |
||||||||
| Impaired loans |
$ | 4,414 | $ | 4,414 | ||||||||
| Other real estate owned |
$ | 218 | $ | 218 | ||||||||
| Fair Value Measurement Using | ||||||||||||
| December 31, 2013 |
Amount | Quoted Prices in Active Markets for Identical Assets (Level 1) |
Significant Other Observable Inputs (Level 2) |
Significant Unobservable Inputs (Level 3) |
||||||||
| Impaired loans |
$ | 2,354 | $ | 2,354 | ||||||||
| Other real estate owned |
$ | 437 | $ | 437 | ||||||||
The following table presents additional quantitative information about assets measured at fair value on a nonrecurring basis and for which the Company has utilized Level 3 inputs to determine fair value:
| Quantitative Information about Level 3 Fair Value Measurements | ||||||||||||||||
| December 31, 2014 |
Fair Value Estimate |
Valuation Techniques | Unobservable Input | Range (Weighted Average) |
||||||||||||
| Impaired loans |
$ | 4,414 | Appraisal of collateral | Appraisal adjustments | 2.6% to 61.1% (24.5%) | |||||||||||
| Liquidation expenses | 3.0% to 6.0% (5.5%) | |||||||||||||||
| Other real estate owned |
$ | 218 | Appraisal of collateral | Appraisal adjustments | 19.7% to 47.8% (30.5%) | |||||||||||
| Liquidation expenses | 3.0% to 6.0% (5.0%) | |||||||||||||||
| Quantitative Information about Level 3 Fair Value Measurements | ||||||||||||||||
| December 31, 2013 |
Fair Value Estimate |
Valuation Techniques | Unobservable Input | Range (Weighted Average) |
||||||||||||
| Impaired loans |
$ | 2,354 | Appraisal of collateral | Appraisal adjustments | 11.0% to 33.7% (17.3%) | |||||||||||
| Liquidation expenses | 3.0% to 6.0% (5.0%) | |||||||||||||||
| Other real estate owned |
$ | 437 | Appraisal of collateral | Appraisal adjustments | 11.0% to 33.7% (17.3%) | |||||||||||
| Liquidation expenses | 3.0% to 6.0% (5.0%) | |||||||||||||||
-108-
Table of Contents
Fair value is generally determined through independent appraisals of the underlying collateral, which generally include various Level 3 Inputs which are not identifiable.
Appraisals may be adjusted by management for qualitative factors such as economic conditions and estimated liquidation expenses. The range and weighted average of liquidation expenses and other appraisal adjustments are presented as a percent of the appraisal.
The carrying and fair values of the Company’s financial instruments at December 31, 2014 and 2013 and their placement within the fair value hierarchy are as follows:
| December 31, 2014 |
Carrying Value |
Fair Value |
Fair Value Hierarchy | |||||||||||||||||
| Quoted Prices in Active Markets for Identical Assets (level 1) |
Significant Other Observable Inputs (level 2) |
Significant Unobservable Inputs (Level 3) |
||||||||||||||||||
| Financial assets: |
||||||||||||||||||||
| Cash and cash equivalents |
$ | 31,426 | $ | 31,426 | $ | 31,426 | ||||||||||||||
| Investment securities: |
||||||||||||||||||||
| Available-for-sale |
339,586 | 339,586 | $ | 48,550 | $ | 291,036 | ||||||||||||||
| Held-to-maturity |
14,665 | 15,215 | 15,215 | |||||||||||||||||
| Loans held for sale |
3,486 | 3,492 | 3,492 | |||||||||||||||||
| Net loans |
1,199,556 | 1,210,369 | $ | 1,210,369 | ||||||||||||||||
| Accrued interest receivable |
5,580 | 5,580 | 5,580 | |||||||||||||||||
| Mortgage servicing rights |
676 | 1,466 | 1,466 | |||||||||||||||||
| Restricted equity securities |
3,687 | 3,687 | 3,687 | |||||||||||||||||
|
|
|
|
|
|||||||||||||||||
| Total |
$ | 1,598,662 | $ | 1,610,821 | ||||||||||||||||
|
|
|
|
|
|||||||||||||||||
| Financial liabilities: |
||||||||||||||||||||
| Deposits |
$ | 1,425,558 | $ | 1,427,081 | 1,427,081 | |||||||||||||||
| Short-term borrowings |
19,557 | 19,557 | 19,557 | |||||||||||||||||
| Long-term debt |
33,140 | 34,772 | 34,772 | |||||||||||||||||
| Accrued interest payable |
574 | 574 | $ | 574 | ||||||||||||||||
|
|
|
|
|
|||||||||||||||||
| Total |
$ | 1,478,829 | $ | 1,481,984 | ||||||||||||||||
|
|
|
|
|
|||||||||||||||||
-109-
Table of Contents
| December 31, 2013 |
Carrying Value |
Fair Value |
Fair Value Hierarchy | |||||||||||||||||
| Quoted Prices in Active Markets for Identical Assets (level 1) |
Significant Other Observable Inputs (level 2) |
Significant Unobservable Inputs (Level 3) |
||||||||||||||||||
| Financial assets: |
||||||||||||||||||||
| Cash and cash equivalents |
$ | 51,310 | $ | 51,310 | $ | 51,310 | ||||||||||||||
| Investment securities: |
||||||||||||||||||||
| Available-for-sale |
299,715 | 299,715 | $ | 1,097 | $ | 298,618 | ||||||||||||||
| Held-to-maturity |
17,295 | 17,175 | 17,175 | |||||||||||||||||
| Loans held for sale |
1,757 | 1,757 | 1,757 | |||||||||||||||||
| Net loans |
1,167,966 | 1,180,387 | $ | 1,180,387 | ||||||||||||||||
| Accrued interest receivable |
5,866 | 5,866 | 5,866 | |||||||||||||||||
| Mortgage servicing rights |
880 | 1,440 | 1,440 | |||||||||||||||||
| Restricted equity securities |
4,102 | 4,102 | 4,102 | |||||||||||||||||
|
|
|
|
|
|||||||||||||||||
| Total |
$ | 1,548,891 | $ | 1,561,752 | ||||||||||||||||
|
|
|
|
|
|||||||||||||||||
| Financial liabilities: |
||||||||||||||||||||
| Deposits |
$ | 1,379,507 | $ | 1,381,946 | 1,381,946 | |||||||||||||||
| Short-term borrowings |
22,052 | 22,052 | 22,052 | |||||||||||||||||
| Long-term debt |
36,743 | 37,468 | 37,468 | |||||||||||||||||
| Accrued interest payable |
723 | 723 | $ | 723 | ||||||||||||||||
|
|
|
|
|
|||||||||||||||||
| Total |
$ | 1,439,025 | $ | 1,442,189 | ||||||||||||||||
|
|
|
|
|
|||||||||||||||||
14. Stock plans:
The Company has a stock plan (“Stock Plan”) covering non-employee directors and the 2008 long-term incentive plan (“2008 Plan”) for certain officers and key employees. The plans are administered by a committee of the Board of Directors. The activity for 25,227 stock appreciation rights (“SAR”) and 5,600 options under the Stock Plan for each of the years in the three-year period ended December 31, 2014, is summarized as follows:
| 2014 | 2013 | 2012 | ||||||||||||||||||||||
| December 31 |
Awards | Weighted Average Price |
Awards | Weighted Average Price |
Awards | Weighted Average Price |
||||||||||||||||||
| Outstanding, beginning of year |
30,827 | $ | 30.37 | 25,227 | $ | 29.66 | 25,227 | $ | 29.66 | |||||||||||||||
| Associated with merger |
8,900 | 30.93 | ||||||||||||||||||||||
| Granted |
||||||||||||||||||||||||
| Settled |
(30,827 | ) | $ | 30.37 | (3,150 | ) | 26.38 | |||||||||||||||||
| Forfeited |
(150 | ) | 27.50 | |||||||||||||||||||||
|
|
|
|
|
|
|
|||||||||||||||||||
| Outstanding, end of year |
30,827 | 30.37 | 25,227 | 29.66 | ||||||||||||||||||||
|
|
|
|
|
|
|
|||||||||||||||||||
| Exercisable, end of year |
$ | 30,827 | $ | 30.37 | 25,227 | $ | 29.66 | |||||||||||||||||
|
|
|
|
|
|
|
|||||||||||||||||||
The Company granted 13,636 SAR to an executive on January 3, 2006 at a strike price of $31.53 per share. The rights were fully vested as of January 2, 2011 and were settled in cash when exercised in 2014. The assumptions in calculating the vesting rights fair value used an expected volatility of 26.83%, expected annual dividend yield of 2.42%, a risk-free interest rate of 0.90%, and an expected term of 1.75 years. The Company granted 11,591 SAR to an executive on February 29, 2008 at a strike price of $27.50 per share. The rights vested on a straight-line basis over a five year period and were settled in cash when exercised in 2014. The grant date fair value was
-110-
Table of Contents
computed assuming expected volatility of 22.21%, expected annual dividend yield of 4.00%, a risk-free interest rate of 3.53%, and an expected term of 7.50 years. The Company calculates the value of the vested rights using the Black-Scholes method and recorded an expense of $395 in 2014, $34 in 2013 and $2 in 2012. In addition, the Company settled an additional 5,600 in options under the Stock Plan during 2014 for $83.
The 2008 Plan allows for named executive officers to be granted equity awards, the plan was a legacy plan of Penn Security Bank and Trust Company. Under the 2008 Plan the Compensation Committee of the board of directors has broad authority with respect to awards granted under the 2008 Plan, including, without limitation, the authority to:
| • | Designate the individuals eligible to receive awards under the 2008 Plan. |
| • | Determine the size, type and date of grant for individual awards, provided that awards approved by the Committee are not effective unless and until ratified by the board of directors. |
| • | Interpret the 2008 Plan and award agreements issued with respect to individual participants. |
Persons eligible to receive awards under the 2008 Plan include directors, officers, employees, consultants and other service providers of the Company and its subsidiaries, except that incentive stock option may be granted only to individuals who are employees on the date of grant.
There are 129,207 shares of the Company’s common stock available for grant as awards pursuant to the 2008 Plan.
The 2008 Plan authorizes grants of stock options, stock appreciation rights, dividend equivalents, performance awards, restricted stock and restricted stock units. There were restricted stock grants awarded with a total cost of $50 and $300 during the years ended December 31, 2013 and 2012, respectively. No restricted stock grants were awarded in 2014.
The activity related to restricted stock for each of the years ended December 31, 2014, 2013 and 2012 was as follows:
| Year Ended December 31, |
2014 | 2013 | 2012 | |||||||||
| Nonvested, January 1 |
17,245 | 15,425 | 4,883 | |||||||||
| Granted shares |
1,820 | 10,542 | ||||||||||
| Vested shares |
2,936 | |||||||||||
| Forfeited shares |
||||||||||||
|
|
|
|
|
|
|
|||||||
| Nonvested, December 31 |
14,309 | 17,245 | 15,425 | |||||||||
|
|
|
|
|
|
|
|||||||
The Company expenses the fair value of all-share based compensation over the requisite service period of five years commencing at grant date. The fair value of restricted stock is expensed on a straight-line basis. Restricted stock granted to officers cliff vest after five years. The Company classifies share-based compensation for employees within “salaries and employee benefits expense” on the Consolidated Statements of Income and Comprehensive Income.
The Company recognized $70, $25 and $40 of compensation expense for stock awards granted in the years ended December 31, 2014, 2013 and 2012, respectively. As of December 31, 2014, the Company had $173 of unrecognized compensation expense associated with restricted stock awards.
-111-
Table of Contents
15. Employee benefit plans:
The Company had separate Employee Stock Ownership Plans (“ESOP”) and Retirement Profit Sharing 401 (k) Plans for Penn Security Bank and Trust and Peoples Neighborhood Bank at year end 2013. The plans were merged at year end 2014 into the Peoples Security Bank and Trust Employee Stock Ownership Plan and the Peoples Security Bank and Trust Retirement Profit Sharing Plan. The Company also maintains a Supplemental Executive Retirement Plan (“SERP”), an Employees’ Pension Plan, which is currently frozen, and a Postretirement Plan Life Insurance plan which was curtailed in 2013.
Under the Peoples Security Bank and Trust Company ESOP, amounts voted by the Company’s Board of Directors are paid into the ESOP and each employee is credited with a share in proportion to their annual compensation. All contributions to the ESOP are invested in or will be invested primarily in Company stock. Distribution of a participant’s ESOP account occurs upon retirement, death or termination in accordance with the plan provisions.
Under the Peoples Security Bank and Trust Company Retirement Profit Sharing Plan, amounts approved by the Board of Directors have been paid into a fund and each employee was credited with a share in proportion to their annual compensation. Upon retirement, death or termination, each employee is paid the total amount of their credits in the fund in one of a number of optional ways in accordance with the plan provisions. Eligible employees may elect deferrals of up to the maximum amounts permitted by law.
At December 31, 2013, the Penn Security Bank and Trust Company ESOP held 104,964 shares of the Company’s stock, all of which were allocated to specific participant accounts. These shares were treated the same for dividend purposes and earnings per share calculations as are any other outstanding shares of the Company’s stock. The Company contributed $218 to the ESOP plan during the year ended December 31, 2013 and $105 in 2012.
The Penn Security Bank and Trust Company Retirement Profit Sharing Plan’s contributions included a Safe Harbor contribution of $310 and $306, during the years ended December 31, 2013 and 2012, respectively, and a discretionary match of $234 and $221 during the years ended December 31, 2013 and 2012, respectively, equal to one-half of employee deferrals, up to a maximum match of 3%.
Peoples Neighborhood Bank had an Employee Stock Ownership and Profit-Sharing Plan (“Plan”) with 401(k) provisions. The Plan was for the benefit of all employees who met the eligibility requirements set forth in the Plan. The amount of contributions to the Plan, including 401(k) matching contributions, was at the discretion of the Board of Directors. Company contributions to the employee stock ownership plan were allocated to participant accounts based on their percentage of total compensation for the Plan year. At December 31, 2013, 263,559 shares of the Company’s common stock were held in the Plan. In the event a terminated Plan participant desired to sell his or her shares of the Company’s stock, or for certain employees who elected to diversify their account balances, the Company was required to purchase the shares from the participant at their fair market value. There was no expense associated with the plan during 2014.
The Company contributed $294 to the Peoples Security Bank and Trust Company Employee Stock Ownership Plan in 2014. In addition, the Company contribution $872 to the Peoples Security Bank and Trust Company Retirement Profit Sharing Plan in 2014, comprised of a Safe Harbor contribution of $464 and a discretionary match of $408.
Peoples Security Bank and Trust Company established a Supplemental Executive Defined Contribution Plan to replace 401(k) plan benefits lost due to compensation limits imposed on qualified plans by Federal tax law. The annual benefit is a maximum of 6% of the executive compensation in excess of Federal limits. The total liability associated with this plan was $48 and $43 at December 31, 2014 and 2013, respectively. The expense associated with the plan was $5, $7 and $4 for 2014, 2013 and 2012 respectively.
-112-
Table of Contents
The Company has SERPs for the benefit of certain officers of the Company. At December 31, 2014 and 2013, other liabilities include $ 1,167 and $ 927 accrued under the Plans. Compensation expense includes approximately $ 80, $164 and $77 relating to these SERPS for the years ended December 31, 2014, 2013 and 2012, respectively.
Under the Penn Security Bank and Trust Company Employees’ Pension Plan, currently under curtailment, amounts computed on an actuarial basis were being paid by the Company into a trust fund. The plan provided for fixed benefits payable for life upon retirement at the age of 65, based on length of service and compensation levels as defined in the plan. As of June 22, 2008 no further benefits are being accrued in this plan. Plan assets of the trust fund are invested and administered by the Trust Department of Peoples Security Bank and Trust Company.
The Postretirement Life Insurance Plan was an unfunded, non-vesting defined benefit plan for employees of Penn Security Bank and Trust Company hired after July 1, 1995; which provided postretirement life insurance benefit of $50,000 at retirement, then decreasing to $5,000 at age 75. Employees hired prior to July 1, 1995 were entitled to three times their salary at retirement. During 2013 the company entered into an agreement with an insurance company to transfer all risk and obligation for benefits payable as to the current retiree group in exchange for a one time fixed payment, additionally the company eliminated retiree life insurance for current employees.
Information related to the pension and postretirement life insurance plans is as follows:
| Pension Benefits | Postretirement Life Insurance Benefits |
|||||||||||||
| December 31, |
2014 | 2013 | 2014 | 2013 | ||||||||||
| Change in benefit obligation: |
||||||||||||||
| Benefit obligation, beginning |
$ | 14,211 | $ | 15,506 | $ | 3,193 | ||||||||
| Service cost |
35 | |||||||||||||
| Interest cost |
678 | 646 | 111 | |||||||||||
| Plan curtailment |
(2,764 | ) | ||||||||||||
| Change in experience loss (gain) |
(250 | ) | 99 | |||||||||||
| Change in assumptions loss (gain) |
3,944 | (1,324 | ) | |||||||||||
| Benefits paid |
(714 | ) | (716 | ) | (575 | ) | ||||||||
|
|
|
|
|
|
|
|
||||||||
| Benefit obligation, ending |
17,869 | 14,211 | ||||||||||||
|
|
|
|
|
|
|
|
||||||||
| Change in plan assets: |
||||||||||||||
| Fair value of plan assets, beginning |
12,417 | 11,343 | ||||||||||||
| Actual return on plan assets |
895 | 1,623 | ||||||||||||
| Employer contributions |
241 | 167 | ||||||||||||
| Benefits paid |
(714 | ) | (716 | ) | ||||||||||
|
|
|
|
|
|
|
|
||||||||
| Fair value of plan assets, ending |
12,839 | 12,417 | ||||||||||||
|
|
|
|
|
|
|
|
||||||||
| Funded status at end of year |
$ | (5,030 | ) | $ | (1,794 | ) | $ | |||||||
|
|
|
|
|
|
|
|
||||||||
The Society of Actuaries released new mortality tables in 2014 which the Company utilized in its pension plan remeasurements at December 31, 2014. The change in mortality assumption resulted in an increase to the pension plan’s accumulated benefit obligation of $2,138.
Amounts recognized in the balance sheet are as follows:
| Pension Benefits | Postretirement Life Insurance Benefits |
|||||||||||||||
| December 31, |
2014 | 2013 | 2014 | 2013 | ||||||||||||
| Liabilities |
$ | 5,030 | $ | 1,794 | $ | $ | ||||||||||
| Amounts recognized in the accumulated other comprehensive loss consist of: |
||||||||||||||||
| Net actuarial gain |
(7,567 | ) | (3,883 | ) | ||||||||||||
| Deferred taxes |
2,648 | 1,359 | ||||||||||||||
|
|
|
|
|
|
|
|
|
|||||||||
| Net amount recognized |
$ | (4,919 | ) | $ | (2,524 | ) | $ | $ | ||||||||
|
|
|
|
|
|
|
|
|
|||||||||
-113-
Table of Contents
The accumulated benefit obligation for the defined benefit pension plan was $17,869 and $14,211 at December 31, 2014 and 2013, respectively.
Components of net periodic pension expense (income) and other amounts recognized in other comprehensive income are as follows:
| Pension Benefits | ||||||||||||
| Years Ended December 31, |
2014 | 2013 | 2012 | |||||||||
| Net periodic pension expense (income): |
||||||||||||
| Interest cost |
$ | 678 | $ | 646 | $ | 673 | ||||||
| Expected return on plan assets |
(910 | ) | (825 | ) | (809 | ) | ||||||
| Amortization of unrecognized net loss |
92 | 180 | 136 | |||||||||
|
|
|
|
|
|
|
|||||||
| Net periodic pension expense (income): |
(140 | ) | 1 | |||||||||
|
|
|
|
|
|
|
|||||||
| Other changes in plan assets and benefit obligations recognized in other comprehensive income (loss): |
||||||||||||
| Net loss (gain) |
3,684 | (2,369 | ) | 739 | ||||||||
| Deferred tax |
(1,289 | ) | 805 | (251 | ) | |||||||
|
|
|
|
|
|
|
|||||||
| Total recognized in other comprehensive income |
2,395 | (1,564 | ) | 488 | ||||||||
|
|
|
|
|
|
|
|||||||
| Total recognized in net period pension cost and other comprehensive income |
$ | 2,255 | $ | (1,563 | ) | $ | 488 | |||||
|
|
|
|
|
|
|
|||||||
| Postretirement Life Insurance Benefits |
||||||||||||
| Years Ended December 31, |
2014 | 2013 | 2012 | |||||||||
| Components of net periodic pension cost: |
||||||||||||
| Service cost |
$ | $ | 35 | $ | 48 | |||||||
| Interest cost |
111 | 139 | ||||||||||
| Amortization of unrecognized net gain |
96 | 111 | ||||||||||
|
|
|
|
|
|
|
|||||||
| Net periodic other benefit cost |
242 | 298 | ||||||||||
|
|
|
|
|
|
|
|||||||
| Changes in plan assets and benefit obligations recognized in other comprehensive income: |
||||||||||||
| Net loss (gain) |
(1,273 | ) | 185 | |||||||||
| Deferred tax |
620 | (63 | ) | |||||||||
|
|
|
|
|
|
|
|||||||
| Total recognized in other comprehensive income |
(653 | ) | 122 | |||||||||
|
|
|
|
|
|
|
|||||||
| Total recognized in net period pension cost and other comprehensive income |
$ | $ | (411 | ) | $ | 420 | ||||||
|
|
|
|
|
|
|
|||||||
The estimated net loss for the defined benefit pension plan that will be amortized from accumulated other comprehensive loss into net periodic benefit cost over the next fiscal year is $199.
Weighted-average assumptions used to determine benefit obligations and related expenses were as follows:
| Pension Benefits | Postretirement Life Insurance Benefits | |||||||||||
| December 31, |
2014 | 2013 | 2014 | 2013 | ||||||||
| Discount rate: |
||||||||||||
| Obligation |
4.00 | % | 5.00 | % | ||||||||
| Expense |
5.00 | 4.25 | ||||||||||
| Expected long-term return on plan assets |
7.50 | % | 7.50 | % | ||||||||
-114-
Table of Contents
The expected long-term return on plan assets was determined using average historical returns of the Company’s plan assets.
The Company’s pension plan weighted-average asset allocations at December 31, 2014 and 2013, by asset category are as follows:
| December 31, |
2014 | 2013 | ||||||
| Asset Category: |
||||||||
| Equity securities |
59.3 | % | 59.9 | % | ||||
| Corporate bonds |
14.9 | 16.8 | ||||||
| U.S. Government securities |
23.4 | 20.8 | ||||||
| Cash and cash equivalents |
2.4 | 2.5 | ||||||
|
|
|
|
|
|||||
| 100.0 | % | 100.0 | % | |||||
|
|
|
|
|
|||||
Fair Value Measurement of pension plan assets at December 31, 2014 and 2013 is as follows:
| December 31, 2014 |
Total | Quoted Prices in Active Markets for Identical Assets (Level 1) |
Significant Observable Inputs (Level 2) |
Significant Observable Inputs (Level 3) |
||||||||||||
| Cash |
$ | 308 | $ | 308 | $ | |||||||||||
| Equity securities: |
||||||||||||||||
| U.S. large cap |
7,369 | 7,369 | ||||||||||||||
| International |
241 | 241 | ||||||||||||||
| Fixed income securities: |
||||||||||||||||
| U.S. Treasuries |
1,073 | $ | 1,073 | |||||||||||||
| U.S. Government agencies |
1,931 | 1,931 | ||||||||||||||
| Corporate bonds |
1,917 | 1,917 | ||||||||||||||
|
|
|
|
|
|
|
|
|
|||||||||
| Total |
$ | 12,839 | $ | 7,918 | $ | 4,921 | $ | |||||||||
|
|
|
|
|
|
|
|
|
|||||||||
| December 31, 2013 |
Total | Quoted Prices in Active Markets for Identical Assets (Level 1) |
Significant Observable Inputs (Level 2) |
Significant Observable Inputs (Level 3) |
||||||||||||
| Cash |
$ | 316 | $ | 316 | $ | |||||||||||
| Equity securities: |
||||||||||||||||
| U.S. large cap |
6,993 | 6,993 | ||||||||||||||
| International |
442 | 442 | ||||||||||||||
| Fixed income securities: |
||||||||||||||||
| U.S. Treasuries |
995 | $ | 995 | |||||||||||||
| U.S. Government agencies |
1,579 | 1,579 | ||||||||||||||
| Corporate bonds |
2,092 | 2,092 | ||||||||||||||
|
|
|
|
|
|
|
|
|
|||||||||
| Total |
$ | 12,417 | $ | 7,751 | $ | 4,666 | $ | |||||||||
|
|
|
|
|
|
|
|
|
|||||||||
The Company investment policies and strategies with respect to the pension plan include: (i) the Trust and Investment Division’s equity philosophy is Large-Cap Core with a value bias. We invest in individual high-grade common stocks that are selected from our approved list; (ii) diversification is maintained by having no more than 20% in any industry sector and no individual equity representing more than 10% of the portfolio; and (iii) the fixed income style is conservative but also responsive to the various needs of our individual clients. Fixed income securities consist of U.S. Government Agencies or corporate bonds rated “A” or better. The Company targets the following allocation percentages: (i) cash equivalents 10%; (ii) fixed income 40% ; and (iii) equities 50%.
-115-
Table of Contents
There is no Company stock included in equity securities at December 31, 2014 or 2013. The Company has not determined the amount of the expected contribution to the Employees’ Pension Plan for 2015.
The following benefit payments are expected to be paid in the next five years and in the aggregate for the five years thereafter:
| Pension Benefits | ||||
| 2015 |
$ | 783 | ||
| 2016 |
778 | |||
| 2017 |
802 | |||
| 2018 |
860 | |||
| 2019 |
857 | |||
| Thereafter |
$ | 4,745 | ||
16. Income taxes:
The current and deferred amounts of the provision for income taxes expense (benefit) for each of the years ended December 31, 2014, 2013 and 2012 are summarized as follows:
| Year Ended December 31 |
2014 | 2013 | 2012 | |||||||||
| Current |
$ | 4,313 | $ | 1,628 | $ | 2,705 | ||||||
| Deferred |
1,146 | (1,143 | ) | 353 | ||||||||
|
|
|
|
|
|
|
|||||||
| $ | 5,459 | $ | 485 | $ | 3,058 | |||||||
|
|
|
|
|
|
|
|||||||
The components of the net deferred tax asset at December 31, 2014 and 2013 are summarized as follows:
| December 31 |
2014 | 2013 | ||||||
| Deferred tax assets: |
||||||||
| Allowance for loan losses |
$ | 3,618 | $ | 2,940 | ||||
| Defined benefit plan |
2,648 | 1,359 | ||||||
| Deferred compensation |
529 | 10 | ||||||
| Other-than-temporary impairment on securities |
131 | |||||||
| Merger related accounting |
244 | |||||||
| Capital loss carry forward |
244 | 244 | ||||||
| Other |
259 | 170 | ||||||
|
|
|
|
|
|||||
| Total |
7,298 | 5,098 | ||||||
|
|
|
|
|
|||||
| Deferred tax liabilities: |
||||||||
| Premises and equipment, net |
912 | 976 | ||||||
| Merger related accounting |
2,131 | |||||||
| Investment securities available-for-sale |
2,202 | 959 | ||||||
| Other |
324 | 83 | ||||||
|
|
|
|
|
|||||
| Total |
5,569 | 2,018 | ||||||
|
|
|
|
|
|||||
| Net deferred tax asset |
$ | 1,729 | $ | 3,080 | ||||
|
|
|
|
|
|||||
Management believes that future taxable income will be sufficient to utilize deferred tax assets. Core earnings of the Company have remained strong and will continue to support the recognition of the deferred tax asset based on future growth projections.
-116-
Table of Contents
A reconciliation between the amount of the effective income tax expense and the income tax expense that would have been provided at the federal statutory rate of 35.0 percent for the year ended December 31, 2014 and 34.0 percent in each of the years ended December 31, 2013 and 2012 is summarized as follows:
| Year Ended December 31 |
2014 | 2013 | 2012 | |||||||||
| Federal income tax at statutory rate |
$ | 8,088 | $ | 2,110 | $ | 4,640 | ||||||
| Tax exempt interest |
(1,938 | ) | (1,428 | ) | (1,432 | ) | ||||||
| Bank owned life insurance income |
(272 | ) | (329 | ) | (171 | ) | ||||||
| Disallowed merger costs |
266 | |||||||||||
| Residential housing program tax credits |
(439 | ) | ||||||||||
| Other, net |
20 | (134 | ) | 21 | ||||||||
|
|
|
|
|
|
|
|||||||
| Total |
$ | 5,459 | $ | 485 | $ | 3,058 | ||||||
|
|
|
|
|
|
|
|||||||
17. Parent Company financial statements:
CONDENSED BALANCE SHEETS
| December 31 |
2014 | 2013 | ||||||
| Assets: |
||||||||
| Cash and cash equivalents |
$ | 4,183 | $ | 3,157 | ||||
| Investment in bank subsidiary |
240,225 | 232,825 | ||||||
| Investment in non-bank subsidiary |
||||||||
| Due from subsidiaries |
2,619 | 2,472 | ||||||
| Investment securities available-for-sale |
1,097 | |||||||
|
|
|
|
|
|||||
| Total assets |
$ | 247,027 | $ | 239,551 | ||||
|
|
|
|
|
|||||
| Liabilities and Stockholders’ Equity: |
||||||||
| Other liabilities |
$ | 248 | $ | 759 | ||||
| Stockholders’ equity |
246,779 | 238,792 | ||||||
|
|
|
|
|
|||||
| Total liabilities and stockholders’ equity |
$ | 247,027 | $ | 239,551 | ||||
|
|
|
|
|
|||||
CONDENSED STATEMENTS OF INCOME AND COMPREHENSIVE INCOME
| Years Ended December 31 |
2014 | 2013 | 2012 | |||||||||
| Income: |
||||||||||||
| Dividends from subsidiaries |
$ | 9,360 | $ | 8,350 | $ | 5,504 | ||||||
| Other income |
430 | 169 | 193 | |||||||||
|
|
|
|
|
|
|
|||||||
| Total income |
9,790 | 8,519 | 5,697 | |||||||||
|
|
|
|
|
|
|
|||||||
| Expense: |
||||||||||||
| Other expenses |
251 | 76 | 47 | |||||||||
|
|
|
|
|
|
|
|||||||
| Total expenses |
251 | 76 | 47 | |||||||||
|
|
|
|
|
|
|
|||||||
| Income before taxes and undistributed income |
9,539 | 8,443 | 5,650 | |||||||||
| Income tax expense |
33 | 59 | ||||||||||
|
|
|
|
|
|
|
|||||||
| Income before undistributed income of subsidiaries |
9,539 | 8,410 | 5,591 | |||||||||
| Equity in undistributed net income (loss) of subsidiaries |
8,110 | (2,689 | ) | 4,998 | ||||||||
|
|
|
|
|
|
|
|||||||
| Net income |
$ | 17,649 | $ | 5,721 | $ | 10,589 | ||||||
|
|
|
|
|
|
|
|||||||
| Comprehensive Income |
$ | 17,518 | $ | 5,313 | $ | 10,577 | ||||||
|
|
|
|
|
|
|
|||||||
-117-
Table of Contents
CONDENSED STATEMENTS OF CASH FLOWS
| Years Ended December 31 |
2014 | 2013 | 2012 | |||||||||
| Cash flows from operating activities: |
||||||||||||
| Net income |
$ | 17,649 | $ | 5,721 | $ | 10,589 | ||||||
| Adjustments: |
||||||||||||
| Net realized gains on sales of securities |
(375 | ) | (103 | ) | (136 | ) | ||||||
| Undistributed net income of subsidiaries |
(8,110 | ) | 2,689 | (5,038 | ) | |||||||
| Decrease (increase) in other assets |
1,182 | (1,733 | ) | |||||||||
| Increase (decrease) in other liabilities |
(511 | ) | 641 | (28 | ) | |||||||
| Stock based compensation |
70 | 25 | 40 | |||||||||
| Deferred income tax expense |
1 | 36 | ||||||||||
| Increase in due from subsidiaries |
(1,611 | ) | ||||||||||
|
|
|
|
|
|
|
|||||||
| Net cash provided by operating activities |
9,905 | 5,630 | 5,463 | |||||||||
|
|
|
|
|
|
|
|||||||
| Cash flows from investing activities: |
||||||||||||
| Proceeds from sale of available-for-sale securities |
722 | 253 | 145 | |||||||||
| Purchase of available-for-sale securities |
(103 | ) | ||||||||||
|
|
|
|
|
|
|
|||||||
| Net cash provided by investing activities |
722 | 253 | 42 | |||||||||
|
|
|
|
|
|
|
|||||||
| Cash flows from financing activities: |
||||||||||||
| Redemption of common stock |
(109 | ) | ||||||||||
| Retirement of stock options |
(83 | ) | ||||||||||
| Reissuance of treasury stock |
21 | |||||||||||
| Purchase of treasury stock |
(70 | ) | ||||||||||
| Cash dividends paid |
(9,360 | ) | (5,511 | ) | (5,504 | ) | ||||||
|
|
|
|
|
|
|
|||||||
| Net cash used in financing activities |
(9,601 | ) | (5,511 | ) | (5,504 | ) | ||||||
|
|
|
|
|
|
|
|||||||
| Increase in cash |
1,026 | 372 | 1 | |||||||||
| Cash at beginning of year |
3,157 | 2,785 | 2,784 | |||||||||
|
|
|
|
|
|
|
|||||||
| Cash at end of year |
$ | 4,183 | $ | 3,157 | $ | 2,785 | ||||||
|
|
|
|
|
|
|
|||||||
18. Regulatory matters:
Dividends are paid by the Company from its assets, which are mainly provided by dividends from Peoples Bank. Under the Pennsylvania Business Corporation Law of 1988, as amended, the Company may not pay a dividend if, after payment, either the Company could not pay its debts as they become due in the usual course of business, or the Company’s total assets would be less than its total liabilities. The determination of total assets and liabilities may be based upon: (i) financial statements prepared on the basis of GAAP; (ii) financial statements that are prepared on the basis of other accounting practices and principles that are reasonable under the circumstances; or (iii) a fair valuation or other method that is reasonable under the circumstances. In addition, the Federal Reserve Board has the power to prohibit dividends by bank holding companies if their actions constitute unsafe or unsound practices. The Federal Reserve Board has issued a policy statement on the payment of cash dividends by bank holding companies, which expresses the Federal Reserve Board’s view that a bank holding company should pay cash dividends only to the extent that the company’s net income for the past year is sufficient to cover both the cash dividends and a rate of earnings retention that is consistent with the company’s capital needs, asset quality and overall financial condition. The Federal Reserve Board also indicated that it would be inappropriate for a bank holding company experiencing serious financial problems to borrow funds to pay dividends. Under the prompt corrective action regulations, the Federal Reserve Board may prohibit a bank holding company from paying any dividends if the holding company’s bank subsidiary is classified as “undercapitalized.”
-118-
Table of Contents
In addition, under the Pennsylvania Banking Code of 1965, as amended, Peoples Bank may only declare and pay dividends out of accumulated net earnings, including accumulated net earnings acquired as a result of a merger within seven years. Further, Peoples Bank may not declare or pay any dividend unless Peoples Bank’s surplus would not be reduced by the payment of the dividend. Pennsylvania law requires that each year Peoples Bank set aside as surplus, a sum equal to not less than 10 percent of its net earnings to maintain the surplus funds equal 100 percent of our capital stock. Under federal law and FDIC regulations, an insured bank may not pay dividends if doing so would make it undercapitalized within the meaning of the prompt corrective action law or if in default of its deposit insurance fund assessment.
Although subject to the aforementioned regulatory restrictions, the Company’s consolidated retained earnings at December 31, 2014 and 2013 were not restricted under any borrowing agreement as to payment of dividends or reacquisition of common stock.
The Company has paid cash dividends since its formation as a bank holding company in 1986. It is the present intention of the Board of Directors to continue this dividend payment policy, however, further dividends must necessarily depend upon earnings, financial condition, appropriate legal restrictions and other factors relevant at the time the Board of Directors considers payment of dividends. The Penseco merger agreement contemplates that, unless 80 percent of our Board of Directors determines otherwise, the Company will pay a quarterly cash dividend in an amount no less than $0.31 per share through 2018, provided that sufficient funds are legally available, and that the Company and Peoples Bank remain “well-capitalized” in accordance with applicable regulatory guidelines.
The amount of funds available for transfer from Peoples Bank to the Company in the form of loans and other extensions of credit is also limited. Under Federal Regulation, transfers to any one affiliate are limited to 10.0 percent of capital and surplus. At December 31, 2014, the maximum amount available for transfer from Peoples Bank to the Company in the form of loans amounted to $25,180. At December 31, 2014 and 2013, there were no loans outstanding, nor were any advances made during 2014 and 2013.
The Company and Peoples Bank are subject to certain regulatory capital requirements administered by the federal banking agencies, which are defined in Section 38 of the Federal Deposit Insurance Corporation Improvement Act of 1991 (“FDICIA”). Failure to meet minimum capital requirements can initiate certain mandatory and possibly additional discretionary actions by regulators that, if undertaken, could have a direct material effect on the Company’s and Peoples Bank’s consolidated financial statements. In the event an institution is deemed to be undercapitalized by such standards, FDICIA prescribes an increasing amount of regulatory intervention, including the required institution of a capital restoration plan and restrictions on the growth of assets, branches or lines of business. Further restrictions are applied to the significantly or critically undercapitalized institutions including restrictions on interest payable on accounts, dismissal of management and appointment of a receiver. For well capitalized institutions, FDICIA provides authority for regulatory intervention when the institution is deemed to be engaging in unsafe and unsound practices or receives a less than satisfactory examination report rating. Under capital adequacy guidelines and the regulatory framework for prompt corrective action, the Company and Peoples Bank must meet specific capital guidelines that involve quantitative measures of their assets, liabilities and certain off-balance sheet items as calculated under regulatory accounting practices. The capital amounts and classifications are also subject to qualitative judgments by the regulators about components, risk weightings and other factors. Prompt corrective action provisions are not applicable to bank holding companies.
Peoples Bank was categorized as “well capitalized” under the regulatory framework for prompt corrective action at December 31, 2014 and 2013, based on the most recent notification from the Federal Deposit Insurance Corporation. To be categorized as well capitalized, Peoples Bank must maintain certain minimum Tier I risk-based, total risk-based and Tier I Leverage ratios as set forth in the following tables. The Tier I Leverage ratio is defined as Tier I capital to total average assets less intangible assets. There are no conditions or events since the most recent notification that management believes have changed Peoples Bank’s category.
-119-
Table of Contents
The Company and Peoples Bank’s actual capital ratios at December 31, 2014 and 2013, and the minimum ratios required for capital adequacy purposes and to be well capitalized under the prompt corrective action provisions are as follows:
| Actual | Minimum For Capital Adequacy Purposes |
Minimum to be Well Capitalized under Prompt Corrective Action Provisions |
||||||||||||||||||||||
| December 31, 2014 |
Amount | Ratio | Amount | Ratio | Amount | Ratio | ||||||||||||||||||
| Tier 1 capital to risk-weighted assets: |
||||||||||||||||||||||||
| Consolidated |
$ | 178,061 | 14.75 | % | $ | 48,276 | 4.00 | % | ||||||||||||||||
| Peoples Bank |
171,984 | 14.28 | 48,165 | 4.00 | $ | 72,247 | 6.00 | % | ||||||||||||||||
| Total capital to risk-weighted assets: |
||||||||||||||||||||||||
| Consolidated |
188,457 | 15.61 | 96,552 | 8.00 | ||||||||||||||||||||
| Peoples Bank |
182,380 | 15.15 | 96,330 | 8.00 | 120,412 | 10.00 | ||||||||||||||||||
| Tier 1 capital to average assets: |
||||||||||||||||||||||||
| Consolidated |
178,061 | 10.76 | 66,168 | 4.00 | ||||||||||||||||||||
| Peoples Bank |
$ | 171,984 | 10.42 | % | $ | 65,993 | 4.00 | % | $ | 82,492 | 5.00 | % | ||||||||||||
| Actual | Minimum For Capital Adequacy Purposes |
Minimum to be Well Capitalized under Prompt Corrective Action Provisions |
||||||||||||||||||||||
| December 31, 2013 |
Amount | Ratio | Amount | Ratio | Amount | Ratio | ||||||||||||||||||
| Tier 1 capital to risk-weighted assets: |
||||||||||||||||||||||||
| Consolidated |
$ | 163,609 | 13.62 | % | $ | 48,040 | 4.00 | % | ||||||||||||||||
| Peoples Bank |
157,758 | 13.09 | 48,192 | 4.00 | $ | 72,228 | 6.00 | % | ||||||||||||||||
| Total capital to risk-weighted assets: |
||||||||||||||||||||||||
| Consolidated |
171,677 | 14.29 | 96,080 | 8.00 | ||||||||||||||||||||
| Peoples Bank |
165,836 | 13.76 | 96,384 | 8.00 | 120,480 | 10.00 | ||||||||||||||||||
| Tier 1 capital to average assets: |
||||||||||||||||||||||||
| Consolidated |
163,609 | 10.12 | 64,664 | 4.00 | ||||||||||||||||||||
| Peoples Bank |
$ | 157,758 | 9.79 | % | $ | 64,484 | 4.00 | % | $ | 80,605 | 5.00 | % | ||||||||||||
19. Contingencies:
Neither the Company nor any of its property is subject to any material legal proceedings. Management, after consultation with legal counsel, does not anticipate that the ultimate liability, if any, arising out of pending and threatened lawsuits will have a material effect on the operating results or financial position of the Company.
20. Comprehensive Income:
The components of accumulated other comprehensive income included in stockholders’ equity at December 31, 2014 and 2013 are as follows:
| December 31 |
2014 | 2013 | ||||||
| Net unrealized gain on investment securities available-for-sale |
$ | 6,292 | $ | 2,810 | ||||
| Income tax expense (benefit) |
2,202 | 984 | ||||||
|
|
|
|
|
|||||
| Net of income taxes |
4,090 | 1,826 | ||||||
|
|
|
|
|
|||||
| Benefit plan adjustments |
(7,567 | ) | (3,883 | ) | ||||
| Income tax expense (benefit) |
(2,648 | ) | (1,359 | ) | ||||
|
|
|
|
|
|||||
| Net of income taxes |
(4,919 | ) | (2,524 | ) | ||||
|
|
|
|
|
|||||
| Accumulated other comprehensive loss |
$ | (829 | ) | $ | (698 | ) | ||
|
|
|
|
|
|||||
-120-
Table of Contents
Other comprehensive income (loss) and related tax effects for the years ended December 31, 2014, 2013 and 2012 are as follows:
| Year ended December 31 |
2014 | 2013 | 2012 | |||||||||
| Net gain on the sale of investment securities available-for-sale(1) |
$ | (861 | ) | $ | (163 | ) | $ | (317 | ) | |||
|
|
|
|
|
|
|
|||||||
| Unrealized gain (loss) on investment securities available-for-sale |
4,343 | (3,882 | ) | 1,223 | ||||||||
|
|
|
|
|
|
|
|||||||
| Benefit plans: |
||||||||||||
| Amortization of actuarial loss (gain)(2) |
92 | 276 | 136 | |||||||||
| Actuarial (loss) gain |
(3,776 | ) | 3,366 | (1,060 | ) | |||||||
|
|
|
|
|
|
|
|||||||
| Net change in benefit plan liabilities |
(3,684 | ) | 3,642 | (924 | ) | |||||||
|
|
|
|
|
|
|
|||||||
| Other comprehensive income (loss) gain before taxes |
(202 | ) | (403 | ) | (18 | ) | ||||||
| Income tax expense (benefit) |
(71 | ) | 5 | (6 | ) | |||||||
|
|
|
|
|
|
|
|||||||
| Other comprehensive income (loss) |
$ | (131 | ) | $ | (408 | ) | $ | (12 | ) | |||
|
|
|
|
|
|
|
|||||||
| (1) | Represents amounts reclassified out of accumulated comprehensive income and included in gains on sale of investment securities on the consolidated statements of income. |
| (2) | Represents amounts reclassified out of accumulated comprehensive income and included in the computation of net periodic pension expense. Refer to Note 15 included in these consolidated financial statements. |
21. Summary of quarterly financial information (unaudited):
| 2014 | ||||||||||||||||
| Quarter Ended |
March 31 | June 30 | Sept. 30 | Dec. 31 | ||||||||||||
| Interest income |
$ | 16,432 | $ | 15,482 | $ | 16,192 | $ | 15,850 | ||||||||
| Interest expense |
1,687 | 1,727 | 1,642 | 1,586 | ||||||||||||
|
|
|
|
|
|
|
|
|
|||||||||
| Net interest income |
14,745 | 13,755 | 14,550 | 14,264 | ||||||||||||
| Provision for loan losses |
857 | 1,201 | 666 | 800 | ||||||||||||
|
|
|
|
|
|
|
|
|
|||||||||
| Net interest income after provision for loan losses |
13,888 | 12,554 | 13,884 | 13,464 | ||||||||||||
| Noninterest income |
3,560 | 3,778 | 4,380 | 3,533 | ||||||||||||
| Noninterest expense |
11,287 | 12,239 | 11,084 | 11,323 | ||||||||||||
|
|
|
|
|
|
|
|
|
|||||||||
| Income before income taxes |
6,161 | 4,093 | 7,180 | 5,674 | ||||||||||||
| Income tax expense |
1,463 | 762 | 1,944 | 1,290 | ||||||||||||
|
|
|
|
|
|
|
|
|
|||||||||
| Net income |
$ | 4,698 | $ | 3,331 | $ | 5,236 | $ | 4,384 | ||||||||
|
|
|
|
|
|
|
|
|
|||||||||
| Per share data: |
||||||||||||||||
| Net income |
$ | 0.62 | $ | 0.44 | $ | 0.70 | $ | 0.58 | ||||||||
| Cash dividends declared |
$ | 0.31 | $ | 0.31 | $ | 0.31 | $ | 0.31 | ||||||||
| Average common shares outstanding |
7,550,253 | 7,548,358 | 7,548,358 | 7,548,358 | ||||||||||||
-121-
Table of Contents
| 2013 | ||||||||||||||||
| Quarter Ended |
March 31 | June 30 | Sept. 30 | Dec. 31 | ||||||||||||
| Interest income |
$ | 8,890 | $ | 8,737 | $ | 8,693 | $ | 11,050 | ||||||||
| Interest expense |
1,033 | 961 | 952 | 1,223 | ||||||||||||
|
|
|
|
|
|
|
|
|
|||||||||
| Net interest income |
7,857 | 7,776 | 7,741 | 9,827 | ||||||||||||
| Provision for loan losses |
300 | 500 | 525 | 1,036 | ||||||||||||
|
|
|
|
|
|
|
|
|
|||||||||
| Net interest income after provision for loan losses |
7,557 | 7,276 | 7,216 | 8,791 | ||||||||||||
| Noninterest income |
2,826 | 3,057 | 3,027 | 2,852 | ||||||||||||
| Noninterest expense |
7,125 | 6,856 | 7,365 | 15,050 | ||||||||||||
|
|
|
|
|
|
|
|
|
|||||||||
| Income (loss) before income taxes |
3,258 | 3,477 | 2,878 | (3,407 | ) | |||||||||||
| Income tax expense (benefit) |
737 | 633 | 392 | (1,277 | ) | |||||||||||
|
|
|
|
|
|
|
|
|
|||||||||
| Net income (loss) |
$ | 2,521 | $ | 2,844 | $ | 2,486 | $ | (2,130 | ) | |||||||
|
|
|
|
|
|
|
|
|
|||||||||
| Per share data: |
||||||||||||||||
| Net income (loss) |
$ | 0.56 | $ | 0.64 | $ | 0.56 | $ | (0.39 | ) | |||||||
| Cash dividends declared |
$ | 0.31 | $ | 0.31 | $ | 0.31 | $ | 0.31 | ||||||||
| Average common shares outstanding |
4,467,261 | 4,467,261 | 4,473,846 | 5,515,199 | ||||||||||||
-122-
Table of Contents
| Item 9. | Changes in and Disagreements with Accountants on Accounting and Financial Disclosure. |
None.
| Item 9A. | Controls and Procedures. |
Evaluation of Disclosure Controls and Internal Controls
At December 31, 2014, the end of the period covered by this Annual Report on Form 10-K, the Chief Executive Officer (“CEO”) and Chief Financial Officer (“CFO”) evaluated the effectiveness of the Company’s disclosure controls and procedures as defined in Rule 13a-15(e) under the Exchange Act. Based upon that evaluation, the CEO and CFO concluded that the disclosure controls and procedures, at December 31, 2014, were effective to provide reasonable assurance that information required to be disclosed in the Company’s reports filed under the Exchange Act is recorded, processed, summarized and reported within the time periods specified in the SEC’s rules and forms, and to provide reasonable assurance that information required to be disclosed in such reports is accumulated and communicated to the CEO and CFO to allow timely decisions regarding required disclosure.
MANAGEMENT’S REPORT ON INTERNAL CONTROL OVER FINANCIAL REPORTING
We are responsible for the preparation and fair presentation of the accompanying consolidated balance sheets of Peoples Financial Services Corp. and subsidiaries (the “Company”) as of December 31, 2014 and 2013, and the related consolidated statements of income and comprehensive income, changes in stockholders’ equity and cash flows for each of the years in the three-year period ended December 31, 2014, in accordance with accounting principles generally accepted in the United States. This responsibility includes: establishing, implementing and maintaining adequate internal controls relevant to the preparation and fair presentation of financial statements that are free from material misstatement, whether due to fraud or error; selecting and applying appropriate accounting policies; and making accounting estimates that are reasonable under the circumstances. We are also responsible for compliance with the laws and regulations relating to safety and soundness that are designated by the Federal Deposit Insurance Corporation, Board of Governors of the Federal Reserve System and the Pennsylvania Department of Banking.
Our internal controls are designed to provide reasonable assurance that assets are safeguarded and transactions are initiated, executed, recorded and reported in accordance with our intentions and authorizations and to comply with applicable laws and regulations. The internal control system includes an organizational structure that provides appropriate delegation of authority and segregation of duties, established policies and procedures and comprehensive internal audit and loan review programs. To enhance the reliability of internal controls, we recruit and train highly qualified personnel and maintain sound risk management practices. The internal control system is maintained through a monitoring process that includes a program of internal audits.
Under Section 404 of the Sarbanes-Oxley Act of 2002, we are required to assess the effectiveness of our internal control over financial reporting at the end of each fiscal year and report, based on that assessment, whether the Company’s internal control over financial reporting is effective. Our assessment includes controls over initiating, recording, processing and reconciling account balances, classes of transactions and disclosure and related assertions included in the financial statements. Our assessment also includes controls related to the initiation and processing of non-routine and non-systematic transactions, to the selection and application of appropriate accounting policies and to the prevention, identification and detection of fraud.
There are inherent limitations in any internal control system, including the possibility of human error and the circumvention or overriding of controls. Accordingly, even effective internal controls can provide only reasonable assurance with respect to financial statement preparation.
Furthermore, due to changes in conditions, the effectiveness of internal controls may vary over time. Our internal auditor reviews, evaluates and makes recommendations on policies and procedures, which serves as an integral, but independent, component of our internal control.
-123-
Table of Contents
Our financial reporting and internal controls are under the general oversight of our board of directors, acting through its audit committee. The audit committee is composed entirely of independent directors. The independent registered public accounting firm and the internal auditor have direct and unrestricted access to the audit committee at all times. The audit committee meets periodically with us, the internal auditor and the independent registered public accounting firm to determine that each is fulfilling its responsibilities and to support actions to identify, measure and control risks and augment internal controls.
Our management, including our CEO and CFO, is responsible for establishing and maintaining adequate internal control over financial reporting for the Company. Our management, including our CEO and CFO, assessed the effectiveness of our internal controls over financial reporting as of December 31, 2014 using the criteria established in Internal Control-Integrated Framework (2013) issued by the Committee of Sponsoring Organizations of the Treadway Commission. These criteria are in the areas of control environment, risk assessment, control activities, information and communication, and monitoring. Our management’s assessment included extensive documenting, evaluating and testing the design and operating effectiveness of our internal control over financial reporting.
Based on its assessment, management believes that our internal control over financial reporting was effective as of December 31, 2014.
BDO USA, LLP, the independent registered public accounting firm that audited our consolidated financial statements in accordance with standards of the Public Company Accounting Oversight Board (United States), has issued an attestation report on the effectiveness of our internal control over financial reporting as of December 31, 2014. The report, which expresses an unqualified opinion on the effectiveness of the Company’s internal control over financial reporting as of December 31, 2014, is included in this Item 9A under the heading “Report of Independent Registered Public Accounting Firm”.
| /s/ Craig W. Best |
| Craig W. Best |
| President and Chief Executive Officer |
| (Principal Executive Officer)
|
| /s/ Scott A. Seasock |
| Executive Vice President and Chief Financial Officer |
| (Principal Financial Officer and Principal Accounting Officer) |
March 16, 2015
-124-
Table of Contents
REPORT OF INDEPENDENT REGISTERED PUBLIC ACCOUNTING FIRM
Board of Directors and Stockholders
Peoples Financial Services Corp.
Scranton, Pennsylvania
We have audited Peoples Financial Services Corp. and subsidiaries’ (the “Corporation”) internal control over financial reporting as of December 31, 2014, based on criteria established in Internal Control – Integrated Framework (2013) issued by the Committee of Sponsoring Organizations of the Treadway Commission (the COSO criteria). The Corporation’s management is responsible for maintaining effective internal control over financial reporting and for its assessment of the effectiveness of internal control over financial reporting, included in the accompanying “Management’s Report on Internal Control Over Financial Reporting”. Our responsibility is to express an opinion on the Corporation’s internal control over financial reporting based on our audit.
We conducted our audit in accordance with the standards of the Public Company Accounting Oversight Board (United States). Those standards require that we plan and perform the audit to obtain reasonable assurance about whether effective internal control over financial reporting was maintained in all material respects. Our audit included obtaining an understanding of internal control over financial reporting, assessing the risk that a material weakness exists, and testing and evaluating the design and operating effectiveness of internal control based on the assessed risk. Our audit also included performing such other procedures as we considered necessary in the circumstances. We believe that our audit provides a reasonable basis for our opinion.
A company’s internal control over financial reporting is a process designed to provide reasonable assurance regarding the reliability of financial reporting and the preparation of financial statements for external purposes in accordance with generally accepted accounting principles. A company’s internal control over financial reporting includes those policies and procedures that (1) pertain to the maintenance of records that, in reasonable detail, accurately and fairly reflect the transactions and dispositions of the assets of the company; (2) provide reasonable assurance that transactions are recorded as necessary to permit preparation of financial statements in accordance with generally accepted accounting principles, and that receipts and expenditures of the company are being made only in accordance with authorizations of management and directors of the company; and (3) provide reasonable assurance regarding prevention or timely detection of unauthorized acquisition, use, or disposition of the company’s assets that could have a material effect on the financial statements.
Because of its inherent limitations, internal control over financial reporting may not prevent or detect misstatements. Also, projections of any evaluation of effectiveness to future periods are subject to the risk that controls may become inadequate because of changes in conditions, or that the degree of compliance with the policies or procedures may deteriorate.
In our opinion, Peoples Financial Services Corp. and subsidiaries maintained, in all material respects, effective internal control over financial reporting as of December 31, 2014, based on the COSO criteria.
We also have audited, in accordance with the standards of the Public Company Accounting Oversight Board (United States), the consolidated balance sheets of Peoples Financial Services Corp. and subsidiaries as of December 31, 2014 and 2013, and the related consolidated statements of income and comprehensive income, changes in stockholders’ equity and cash flows for the years then ended and our report dated March 16, 2015 expressed an unqualified opinion thereon.
/s/ BDO USA, LLP
Harrisburg, Pennsylvania
March 16, 2015
-125-
Table of Contents
Changes in Internal Control Over Financial Reporting
There were no changes in our internal control over financial reporting that occurred during the fiscal quarter ended December 31, 2014, that has materially affected, or is reasonably likely to materially affect, our internal control over financial reporting.
| Item 9B. | Other Information. |
None.
| Item 10. | Directors, Executive Officers and Corporate Governance. |
We incorporate the information required by this Item 10 by reference to the definitive proxy statement for our 2015 annual meeting of shareholders, to be filed with the Securities and Exchange Commission.
| Item 11. | Executive Compensation. |
We incorporate the information required by this Item 11 by reference to the definitive proxy statement for our 2015 annual meeting of shareholders, to be filed with the Securities and Exchange Commission.
| Item 12. | Security Ownership of Certain Beneficial Owners and Management and Related Stockholder Matters. |
We incorporate the information required by this Item 12 by reference to the definitive proxy statement for our 2015 annual meeting of shareholders, to be filed with the Securities and Exchange Commission.
| Item 13. | Certain Relationships and Related Transactions, and Director Independence. |
We incorporate the information required by this Item 13 by reference to the definitive proxy statement for our 2015 annual meeting of shareholders, to be filed with the Securities and Exchange Commission.
| Item 14. | Principal Accounting Fees and Services. |
We incorporate the information required by this Item 14 by reference to the definitive proxy statement for our 2015 annual meeting of shareholders, to be filed with the Securities and Exchange Commission.
| Item 15. | Exhibits, Financial Statement Schedules. |
All consolidated financial statements and financial statement schedules required to be filed by Form 10-K or by Regulation S-X that are applicable to us have been presented in the consolidated financial statements and notes thereto in Part II, Item 8, or elsewhere in this annual report, where appropriate. The listing of exhibits is set forth on the Exhibit Index beginning on page E-1 and is incorporated in this Item 15 by reference.
-126-
Table of Contents
Pursuant to the requirements of Section 13 or 15(d) of the Securities Exchange Act of 1934, the registrant has duly caused this report to be signed on its behalf by the undersigned, thereunto duly authorized.
| Peoples Financial Services Corp. | ||
| By: |
/s/ Craig W. Best | |
| Craig W. Best | ||
| President and Chief Executive Officer | ||
| (Principal Executive Officer) | ||
| By: | /s/ Scott A. Seasock | |
| Scott A. Seasock | ||
| Executive Vice President and Chief Financial Officer | ||
| (Principal Financial Officer and Principal Accounting Officer) | ||
POWER OF ATTORNEY
KNOW ALL PERSONS BY THESE PRESENTS, that each person whose signature appears below constitutes and appoints each of Craig W. Best and Scott A. Seasock as his or her attorney-in-fact, with the full power of substitution, for him or her in any and all capacities, to sign any amendments to this report, and to file the same, with exhibits thereto and other documents in connection therewith, with the Securities and Exchange Commission, hereby ratifying and confirming all that said attorney-in-fact, or his substitute or substitutes, may do or cause to be done by virtue hereof.
Pursuant to the requirements of the Securities Exchange Act of 1934, this report has been signed below by the following persons on behalf of the registrant and in the capacities and on the dates indicated.
| Name | Title | Date | ||
| /s/ William E. Aubrey II William E. Aubrey II |
Director and Chairman of the Board | March 16, 2015 | ||
| /s/ Craig W. Best Craig W. Best |
Director, President and Chief Executive Officer (Principal Executive Officer) |
March 16, 2015 | ||
| /s/ Scott A. Seasock Scott A. Seasock |
Executive Vice President and Chief Financial Officer (Principal Financial Officer and Principal Accounting Officer) |
March 16, 2015 | ||
| /s/ Joseph G. Cesare Joseph G. Cesare |
Director | March 16, 2015 | ||
| /s/ James G. Keisling James G. Keisling |
Director | March 16, 2015 | ||
-127-
Table of Contents
| /s/ P. Frank Kozik P. Frank Kozik |
Director | March 16, 2015 | ||
| /s/ Ronald G. Kukuchka Ronald G. Kukuchka |
Director | March 16, 2015 | ||
| /s/ Richard S. Lochen, Jr. Richard S. Lochen, Jr. |
Director | March 16, 2015 | ||
| /s/ Robert Naismith Robert Naismith |
Director | March 16, 2015 | ||
| /s/ James B. Nicholas James B. Nicholas |
Director | March 16, 2015 | ||
| /s/ Emily Perry Emily Perry |
Director | March 16, 2015 | ||
| /s/ George H. Stover, Jr. George H. Stover, Jr. |
Director | March 16, 2015 | ||
| /s/ Steven L. Weinberger Steven L. Weinberger |
Director | March 16, 2015 | ||
| /s/ Earle A. Wootton Earle A. Wootton |
Director | March 16, 2015 | ||
| /s/ Joseph T. Wright, Jr. Joseph T. Wright, Jr. |
Director | March 16, 2015 | ||
-128-
Table of Contents
EXHIBIT INDEX
| Exhibit No. | Description of Exhibit | |
| 2.1 | Agreement and Plan of Merger between Peoples Financial Services Corp. and Penseco Financial Services Corporation dated as of June 28, 2013 (incorporated by reference to Annex A to registrant’s prospectus, dated October 10, 2013, filed on October 10, 2013 pursuant to Rule 424(b) under the Securities Act in connection with registrant’s registration statement on Form S-4 originally filed August 13, 2013, as amended (File No. 333-190587)) Registrant agrees to furnish copies of Schedules to the Securities and Exchange Commission upon request. | |
| 2.2 | Amendment No. 1 to Agreement and Plan of Merger between Peoples Financial Services Corp. and Penseco Financial Services Corporation dated as of September 17, 2013 (incorporated by reference to Annex A to registrant’s prospectus, dated October 10, 2013, filed on October 10, 2013 pursuant to Rule 424(b) under the Securities Act in connection with registrant’s registration statement on Form S-4 originally filed August 13, 2013, as amended (File No. 333-190587)) | |
| 2.3 | Agreement and Plan of Merger by and among Penseco Financial Services Corporation, Penn Security Bank and Trust Company and Old Forge Bank, dated as of December 5, 2008 (incorporated by reference to Exhibit 2.1 to Penseco’s current report on Form 8-K filed with the SEC on December 10, 2008) | |
| 3.1 | Peoples Financial Services Corp. Articles of Incorporation, as amended (incorporated by reference to Exhibit 3.1 to the registrant’s Form 10-K filed with the Commission on March 17, 2014). | |
| 3.2 | Amended and Restated Bylaws of Peoples Financial Services Corp. (incorporated by reference to Exhibit 3.1 to the registrant’s Form 8-K filed with the Commission on December 2, 2013) | |
| 4.1 | The Registrant will furnish to the SEC upon request copies of the instruments defining the rights of the Federal Home Loan Bank of Pittsburgh with respect to the Registrant’s long-term debt. | |
| 10.1 | Peoples Financial Services Corp. 1998 Stock Option Plan (incorporated by reference to Exhibit 10.1 to the registrant’s Form 10-Q filed with the Commission on August 14, 1998)* | |
| 10.2 | Form of Stock Option Agreement (incorporated by reference to Exhibit 10.2 to the registrant’s Form 10-K filed with the Commission on March 17, 2014).** | |
| 10.3 | Penseco Financial Services Corporation 2008 Long Term Incentive Plan (incorporated by reference to Annex A of Penseco’s proxy statement on Schedule 14A filed with the SEC on March 17, 2008)* | |
| 10.4 | Form of Restricted Stock or Restricted Stock Unit Award Agreement (incorporated by reference to Exhibit 10.2 to Penseco’s registration statement on Form S-8 (File No. 333-166886) filed with the SEC on May 17, 2010)* | |
| 10.5 | Form of Stock Option and/or Appreciation Right Award Agreement (incorporated by reference to Exhibit 10.3 to Penseco’s registration statement on Form S-8 (File No. 333-166886) filed with the SEC on May 17, 2010)* | |
| 10.6 | Form of Performance Award Agreement (incorporated by reference to Exhibit 10.4 to Penseco’s registration statement on Form S-8 (File No. 333-166886) filed with the SEC on May 17, 2010)* | |
| 10.7 | Peoples Neighborhood Bank Amended and Restated Employee Stock Ownership Plan (incorporated by reference to Exhibit 10.1 to the registrant’s Form 10-Q filed with the Commission on August 14, 1998)* | |
| 10.8 | Penn Security Bank & Trust Company Employee Stock Ownership Plan, amended and restated as of January 1, 2010 (incorporated by reference to Exhibit 10.8 to Penseco’s annual report on Form 10-K filed with the SEC on March 14, 2011)* | |
E-1
Table of Contents
| Exhibit No. | Description of Exhibit | |
| 10.9 | Peoples Neighborhood Bank’s Executive Cash Bonus Plan (incorporated by reference to Exhibit 10.15 to Amendment No. 1 to registrant’s registration statement on Form S-4 (File No. 333-190587) filed with the SEC on September 20, 2013)* | |
| 10.10 | Penn Security Bank & Trust Company Executive Deferred Compensation Plan (incorporated by reference to Exhibit 10.6 to the Penseco’s annual report on Form 10-K filed with the SEC on March 14, 2011)* | |
| 10.11 | Employment Agreement, dated January 3, 2011, among Penseco Financial Services Corporation, Penn Security Bank & Trust, and Craig W. Best (incorporated by reference to Exhibit 10.1 of Penseco’s current report on Form 8-K filed with the SEC on January 7, 2011)* | |
| 10.12 | Penn Security Bank & Trust Company Deferred Compensation Plan No. 2 (incorporated by reference to Appendix D of Exhibit 10.1 of the Registrant’s current report on Form 8-K filed with the SEC on January 7, 2011)* | |
| 10.13 | Penn Security Bank & Trust Company Excess Benefit Plan, amended and restated December 31, 2008 (incorporated by reference to Exhibit 10.9 to the Registrant’s annual report on Form 10-K filed with the SEC on March 14, 2011)* | |
| 10.14 | Stock Appreciation Rights Agreement by and between Penseco Financial Services Corporation and Craig W. Best dated as of January 3, 2006 (incorporated by reference to Exhibit 10 to Penseco’s annual report on Form 10-K filed with the SEC on March 16, 2006)* | |
| 10.16 | Employment Agreement with Scott A. Seasock (incorporated by reference to Exhibit 10.16 to the registrant’s Form 8-K filed with the Commission on January 18, 2011)* | |
| 10.17 | Supplemental Executive Retirement Plan by and between Scott A. Seasock and Peoples Bank, dated May 8, 2012 (incorporated by reference to Exhibit 10.21 to the registrant’s Form 8-K filed with the Commission on May 11, 2012)* | |
| 10.18 | Termination Agreement with Debra E. Dissinger (incorporated by reference to Exhibit 10.4 to the registrant’s Form 10-25G filed with the Commission on March 4, 1998)* | |
| 10.19 | Supplemental Executive Retirement Plan with Debra E. Dissinger (incorporated by reference to Exhibit 10.6 to the registrant’s Form 10-K filed with the Commission on March 15, 2005)* | |
| 10.20 | Amendment to Supplemental Executive Retirement Plan with Debra E. Dissinger (incorporated by reference to Exhibit 10.9 to the registrant’s Form 10-K filed with the Commission on March 15, 2006)* | |
| 10.22 | Employment Agreement dated as of December 1, 2013, by and among Peoples, Peoples Bank and Joseph M. Ferretti (incorporated by reference to Exhibit 10.2 to the registrant’s current report on Form 8-K filed with the SEC on December 2, 2013)* | |
| 10.24 | Consulting Agreement dated as of December 2, 2013, between Peoples, Peoples Bank and Alan W. Dakey (incorporated by reference to Exhibit 10.1 to the registrant’s current report on Form 8-K filed with the SEC on December 2, 2013)* | |
| 10.25 | Employment Agreement, dated May 30, 2012, among Penseco Financial Services Corporation, Penn Security Bank and Trust Company, and Thomas P. Tulaney (incorporated by reference to Exhibit 10.1 of the Registrant’s quarterly report on Form 10-Q filed with the SEC on August 9, 2012)* | |
| 10.26 | Supplemental Executive Retirement Plan Agreement, dated May 31, 2012, by and among Penn Security Bank and Trust Company, Penseco Financial Services Corporation, and Thomas P. Tulaney (incorporated by reference to Exhibit 10.2 to the Registrant’s quarterly report on Form 10-Q filed with the SEC on August 9, 2012)* | |
E-2
Table of Contents
| Exhibit No. | Description of Exhibit | |
| 10.27 | Supplemental Director Retirement Plan for all Non-employee Directors (incorporated by reference to Exhibit 10.7 to the registrant’s Form 10-K filed with the Commission on March 15, 2005)* | |
| 10.28 | Amendment to Supplemental Director Retirement Plan for all Non-employee Directors (incorporated by reference to Exhibit 10.10 to the registrant’s Form 10-K filed with the Commission on March 15, 2006)* | |
| 10.29 | Life Insurance Plan for all Non-employee Directors (incorporated by reference to Exhibit 10.21 to the registrant’s Form 10-K filed with the Commission on March 15, 2012)* | |
| 10.30 | Amended and Restated Deferred Compensation Plan #2, dated April 22, 2014, by and between Peoples Security Bank and Trust Company and Craig W. Best (incorporated by reference to Exhibit 10.1 to the registrant’s Form 8-K filed with the Commission on April 28, 2014)* | |
| 10.31 | Supplemental Executive Retirement Plan Agreement, dated April 22, 2014, by and among Peoples Security Bank and Trust Company, Peoples Financial Services Corp. and Joseph M. Ferretti (incorporated by reference to Exhibit 10.2 to the registrant’s Form 8-K filed with the Commission on April 28, 2014)* | |
| 10.32 | Employment Agreement dated as of August 27, 2014, by and between Peoples Bank and Neal D. Koplin. | |
| 21.1 | List of Subsidiaries | |
| 24.1 | Power of Attorney (Included as part of signature page) | |
| 31.1 | Rule 13a-14(a)/15d-14(a) Certification of the Principal Executive Officer of Registrant | |
| 31.2 | Rule 13a-14(a)/15d-14(a) Certification of the Principal Financial Officer of Registrant | |
| 32.1 | Section 1350 Certifications of the Principal Executive Officer and Principal Financial Officer of Registrant | |
| 101.INS | XBRL Instance Document | |
| 101.SCH | XBRL Taxonomy Extension Schema | |
| 101.CAL | XBRL Taxonomy Extension Calculation Linkbase | |
| 101.DEF | XBRL Taxonomy Extension Definition Linkbase | |
| 101.LAB | XBRL Taxonomy Extension Label Linkbase | |
| 101.PRE | XBRL Taxonomy Extension Presentation Linkbase | |
| * | - Management contract or compensatory plan or arrangement |
E-3